Questions as text
Q1 · The distribution of molecular kinetic energies within a gas at temperature T1 and T2 are… 9701/11 Oct/Nov 2005
11 The distribution of molecular kinetic energies within a gas at temperature T1 and T2 are shown in the diagram. T2 > T1 fraction of Ea = activation energy total molecules T1 T2 Ea 00 kinetic energy Which statement correctly explains why a small increase in temperature leads to a significant increase in the rate of a gaseous reaction? A The frequency of collisions between molecules is greater at a higher temperature. B The activation energy of the reaction is less when the gases are at a higher temperature. C The frequency of collisions between molecules with kinetic energy greater than the activation energy is greater at higher temperature. D The proportion of molecules with more kinetic energy than the activation energy is lower at a higher temperature.
1 marks
Answer: C
This question in 9701/11 Oct/Nov 2005
Q2 · Which solid-line curve most accurately represents the distribution of molecular speeds in… 9701/11 May/June 2006
12 Which solid-line curve most accurately represents the distribution of molecular speeds in a gas at 500 K if the dotted-line curve represents the corresponding distribution for the same gas at 300 K? A B fraction of fraction of molecules molecules speed speed C D fraction of fraction of molecules molecules speed speed
1 marks
Answer: C
This question in 9701/11 May/June 2006
Q3 · Hydrazine, N2H4, is widely used as a rocket fuel because it reacts with oxygen as shown… 9701/11 May/June 2006
33 Hydrazine, N2H4, is widely used as a rocket fuel because it reacts with oxygen as shown, producing ‘environmentally friendly’ gases. N2H4(l) + O2(g) → N2(g) + 2H2O(g) ∆H = –534 kJ mol–1 Despite its use as a rocket fuel, hydrazine does not spontaneously burn in oxygen. Why does hydrazine not burn spontaneously? 1 The activation energy is too high. 2 The N≡N bond is very strong. 3 Hydrazine is a liquid.
1 marks
Answer: D
This question in 9701/11 May/June 2006
Q4 · How can the rate of reaction between ethanal and aqueous hydrogen cyanide be increased? 9701/11 May/June 2006
39 How can the rate of reaction between ethanal and aqueous hydrogen cyanide be increased? 1 by irradiation with ultraviolet light 2 by a rise in temperature 3 by the addition of a small quantity of aqueous sodium cyanide
1 marks
Answer: C
This question in 9701/11 May/June 2006
Q5 · The diagram shows the Maxwell-Boltzmann energy distribution curves for molecules of a… 9701/11 Oct/Nov 2006
12 The diagram shows the Maxwell-Boltzmann energy distribution curves for molecules of a sample of a gas at two different temperatures. Which letter on the axes represents the most probable energy of the molecules at the lower temperature? A B C D
1 marks
Answer: C
This question in 9701/11 Oct/Nov 2006
Q6 · It is often said that the rate of a typical reaction is roughly doubled by raising the… 9701/11 Oct/Nov 2007
11 It is often said that the rate of a typical reaction is roughly doubled by raising the temperature by 10 °C. What explains this observation? A Raising the temperature by 10 °C doubles the average kinetic energy of each molecule. B Raising the temperature by 10 °C doubles the average velocity of the molecules. C Raising the temperature by 10 °C doubles the number of molecular collisions in a given time. D Raising the temperature by 10 °C doubles the number of molecules having more than a certain minimum energy.
1 marks
Answer: D
This question in 9701/11 Oct/Nov 2007
Q7 · Which statements are correct about the activation energy of a reaction? 9701/11 Oct/Nov 2007
34 Which statements are correct about the activation energy of a reaction? 1 It is different for the forward and back reactions in an exothermic process. 2 It is low for a reaction that takes place slowly. 3 It is unaffected by the presence of a catalyst.
1 marks
Answer: D
This question in 9701/11 Oct/Nov 2007
Q8 · The molecular energy distribution curve represents the variation in energy of the… 9701/11 May/June 2008
12 The molecular energy distribution curve represents the variation in energy of the molecules of a gas at room temperature. proportion of molecules 0 0 energy Which curve applies for the same gas at a lower temperature? A B proportion proportion of of molecules molecules 0 0 0 0 energy energy C D proportion proportion of of molecules molecules 0 0 0 0 energy energy
1 marks
Answer: C
This question in 9701/11 May/June 2008
Q9 · The diagram represents the reaction pathway for the following reaction 9701/11 Oct/Nov 2008
9 The diagram represents the reaction pathway for the following reaction. W(g) + X(g) → Y(g) + Z(g) energy W + X Y + Z reaction pathway What statement can be made about the reverse reaction, Y(g) + Z(g) → W(g) + X(g)? A It will have a larger activation energy and a positive ∆H. B It will have a larger activation energy and a negative ∆H. C It will have a smaller activation energy and a positive ∆H. D It will have a smaller activation energy and a negative ∆H.
1 marks
Answer: A
This question in 9701/11 Oct/Nov 2008
Q10 · A possible mechanism of the exothermic hydrolysis of 2-chloro-2-methylpropane is shown 9701/11 Oct/Nov 2008
24 A possible mechanism of the exothermic hydrolysis of 2-chloro-2-methylpropane is shown. CH3 CH3 slow + _ CH3 C Cl CH3 C + Cl CH3 CH3 CH3 CH3 + _ fast CH3 C + OH CH3 C OH CH3 CH3 Which diagram represents the reaction profile for this mechanism? A B C D energy energy energy energy reaction pathway reaction pathway reaction pathway reaction pathway
1 marks
Answer: C
This question in 9701/11 Oct/Nov 2008
Q11 · Under given conditions, what governs the rate of a forward reaction? 9701/11 Oct/Nov 2008
33 Under given conditions, what governs the rate of a forward reaction? 1 the activation energy of the reaction 2 the enthalpy change of the reaction 3 the equilibrium constant of the reaction
1 marks
Answer: D
This question in 9701/11 Oct/Nov 2008
Q12 · The diagram shows the Maxwell-Boltzmann energy distribution curve for molecules of a… 9701/11 May/June 2009
10 The diagram shows the Maxwell-Boltzmann energy distribution curve for molecules of a mixture of two gases at a given temperature. For a reaction to occur the molecules must collide together with sufficient energy. number of molecules 00 Ea2 Ea1 energy Ea is the activation energy for the reaction between the gases. Of the two values shown, one is for a catalysed reaction, the other for an uncatalysed one. Which pair of statements is correct when a catalyst is used? A Ea1 catalysed reaction Ea2 uncatalysed reaction fewer effective collisions more effective collisions B Ea1 uncatalysed reaction Ea2 catalysed reaction fewer effective collisions more effective collisions C Ea1 catalysed reaction Ea2 uncatalysed reaction more effective collisions fewer effective collisions D Ea1 uncatalysed reaction Ea2 catalysed reaction more effective collisions fewer effective collisions
1 marks
Answer: B
This question in 9701/11 May/June 2009
Q13 · How can the rate of reaction between ethanal and aqueous hydrogen cyanide be increased? 9701/11 May/June 2009
39 How can the rate of reaction between ethanal and aqueous hydrogen cyanide be increased? 1 by irradiation with ultraviolet light 2 by a rise in temperature 3 by the addition of a small quantity of aqueous sodium cyanide
1 marks
Answer: C
This question in 9701/11 May/June 2009
Q14 · Four reactions of the type shown are studied at the same temperature 9701/11 Oct/Nov 2009
10 Four reactions of the type shown are studied at the same temperature. X (g) + Y (g) → Z (g) Which is the correct reaction pathway diagram for the reaction that would proceed most rapidly and with the highest yield? A B energy energy reactant product reactant product C D energy energy reactant product reactant product
1 marks
Answer: C
This question in 9701/11 Oct/Nov 2009
Q15 · Why does a mixture of hydrogen gas and bromine gas react together faster at a temperature… 9701/11 Oct/Nov 2009
34 Why does a mixture of hydrogen gas and bromine gas react together faster at a temperature of 500 K than it does at a temperature of 400 K? 1 A higher proportion of effective collisions occurs at 500 K. 2 Hydrogen molecules and bromine molecules collide more frequently at 500 K. 3 The activation energy of the reaction is lower at 500 K.
1 marks
Answer: B
This question in 9701/11 Oct/Nov 2009
Q16 · The percentage of ammonia obtainable, if equilibrium were established during the Haber… 9701/11 May/June 2010
15 The percentage of ammonia obtainable, if equilibrium were established during the Haber process, is plotted against the operating pressure for two temperatures, 400 °C and 500 °C. Which diagram correctly represents the two graphs? A B 40 400 °C 40 500 °C % NH3 at % NH3 at 20 500 °C 20 400 °C equilibrium equilibrium 0 0 0 0 10 20 10 20 pressure / 103 kPa pressure / 103 kPa C D 40 40 400 °C 500 °C % NH3 at % NH3 at 20 20 equilibrium equilibrium 500 °C 400 °C 0 0 0 0 10 20 10 20 pressure / 103 kPa pressure / 103 kPa
1 marks
Answer: A
This question in 9701/11 May/June 2010
Q17 · The Haber process for the manufacture of ammonia is represented by the following equation 9701/13 May/June 2010
8 The Haber process for the manufacture of ammonia is represented by the following equation. N2(g) + 3H2(g) 2NH3(g) ∆H = –92 kJ mol–1 Which statement is correct about this reaction when the temperature is increased? A Both forward and backward rates increase. B The backward rate only increases. C The forward rate only increases. D There is no effect on the backward or forward rate.
1 marks
Answer: A
This question in 9701/13 May/June 2010
Q18 · The percentage of ammonia obtainable, if equilibrium were established during the Haber… 9701/13 May/June 2010
15 The percentage of ammonia obtainable, if equilibrium were established during the Haber process, is plotted against the operating pressure for two temperatures, 400 °C and 500 °C. Which diagram correctly represents the two graphs? A B 40 400 °C 40 500 °C % NH3 at % NH3 at 20 500 °C 20 400 °C equilibrium equilibrium 0 0 0 0 10 20 10 20 pressure / 103 kPa pressure / 103 kPa C D 40 40 400 °C 500 °C % NH3 at % NH3 at 20 20 equilibrium equilibrium 500 °C 400 °C 0 0 0 0 10 20 10 20 pressure / 103 kPa pressure / 103 kPa
1 marks
Answer: A
This question in 9701/13 May/June 2010
Q19 · The diagram represents the Boltzmann distribution of molecular energies at a given… 9701/11 Oct/Nov 2010
32 The diagram represents the Boltzmann distribution of molecular energies at a given temperature. proportion of molecules energy Which of the factors that affect the rate of a reaction can be explained using such a Boltzmann distribution? 1 increasing the concentration of reactants 2 increasing the temperature 3 the addition of a catalyst
1 marks
Answer: C
This question in 9701/11 Oct/Nov 2010
Q20 · Which diagram correctly represents the Boltzmann distribution of molecular energies at… 9701/12 Oct/Nov 2010
2 Which diagram correctly represents the Boltzmann distribution of molecular energies at two temperatures T1 and T2, where T1 = 300 K and T2 = 310 K? A B T1 T2 T1 proportion proportion T2 of molecules of molecules 0 molecular 0 molecular energy energy C D T2 T1 T2 T1 proportion proportion of molecules of molecules 0 molecular 0 molecular energy energy
1 marks
Answer: B
This question in 9701/12 Oct/Nov 2010
Q21 · The reaction pathway diagram below illustrates the energies of reactants, products and… 9701/12 Oct/Nov 2010
6 The reaction pathway diagram below illustrates the energies of reactants, products and the transition state of a reaction. transition state E1 E2 energy reactants E3 products reaction coordinate Which expression represents the activation energy of the forward reaction? A E1 – E2 B E1 – E3 C E2 – E3 D (E1 – E2) – (E2 – E3)
1 marks
Answer: A
This question in 9701/12 Oct/Nov 2010
Q22 · The diagram represents the Boltzmann distribution of molecular energies at a given… 9701/13 Oct/Nov 2010
33 The diagram represents the Boltzmann distribution of molecular energies at a given temperature. proportion of molecules energy Which of the factors that affect the rate of a reaction can be explained using such a Boltzmann distribution? 1 increasing the concentration of reactants 2 increasing the temperature 3 the addition of a catalyst
1 marks
Answer: C
This question in 9701/13 Oct/Nov 2010
Q23 · Different Boltzmann distributions are shown in the diagrams 9701/11 May/June 2011
4 Different Boltzmann distributions are shown in the diagrams. diagram 1 diagram 2 X P Y number of Q number of molecules molecules 00 00 molecular speed molecular speed In diagram 1, one curve P or Q corresponds to a temperature higher than that of the other curve. In diagram 2, one line X or Y corresponds to the activation energy for a catalysed reaction and the other line corresponds to the activation energy of the same reaction when uncatalysed. Which combination gives the correct curve and line? higher presence of temperature catalyst A P X B P Y C Q X D Q Y
1 marks
Answer: C
This question in 9701/11 May/June 2011
Q24 · Hydrazine, N2H4, is widely used as a rocket fuel because it reacts with oxygen as shown… 9701/11 May/June 2011
12 Hydrazine, N2H4, is widely used as a rocket fuel because it reacts with oxygen as shown, producing ‘environmentally friendly’ gases. N2H4(l) + O2(g) → N2(g) + 2H2O(g) ∆H = –534 kJ mol–1 Despite its use as a rocket fuel, hydrazine does not burn spontaneously in oxygen. Which statement explains why hydrazine does not burn spontaneously? A Hydrazine is a liquid. B The activation energy is too high. C The N N bond is very strong. D The reaction is exothermic.
1 marks
Answer: B
This question in 9701/11 May/June 2011
Q25 · The Boltzmann distribution for a gas at constant temperature is shown below 9701/12 May/June 2011
6 The Boltzmann distribution for a gas at constant temperature is shown below. Y Z X n = number of gas molecules having a given kinetic energy 0 0 kinetic energy If the temperature of the gas is reduced by 10 °C the graph changes shape. What happens to the values of n for the points marked X, Y and Z? X Y Z A higher lower higher B higher lower lower C lower higher lower D lower lower lower
1 marks
Answer: B
This question in 9701/12 May/June 2011
Q26 · Different Boltzmann distributions are shown in the diagrams 9701/13 May/June 2011
7 Different Boltzmann distributions are shown in the diagrams. diagram 1 diagram 2 X P Y number of Q number of molecules molecules 00 00 molecular speed molecular speed In diagram 1, one curve P or Q corresponds to a temperature higher than that of the other curve. In diagram 2, one line X or Y corresponds to the activation energy for a catalysed reaction and the other line corresponds to the activation energy of the same reaction when uncatalysed. Which combination gives the correct curve and line? higher presence of temperature catalyst A P X B P Y C Q X D Q Y
1 marks
Answer: C
This question in 9701/13 May/June 2011
Q27 · Hydrazine, N2H4, is widely used as a rocket fuel because it reacts with oxygen as shown… 9701/13 May/June 2011
11 Hydrazine, N2H4, is widely used as a rocket fuel because it reacts with oxygen as shown, producing ‘environmentally friendly’ gases. N2H4(l) + O2(g) → N2(g) + 2H2O(g) ∆H = –534 kJ mol–1 Despite its use as a rocket fuel, hydrazine does not burn spontaneously in oxygen. Which statement explains why hydrazine does not burn spontaneously? A Hydrazine is a liquid. B The activation energy is too high. C The N N bond is very strong. D The reaction is exothermic.
1 marks
Answer: B
This question in 9701/13 May/June 2011
Q28 · Which solid-line curve most accurately represents the distribution of molecular speeds in… 9701/11 Oct/Nov 2011
11 Which solid-line curve most accurately represents the distribution of molecular speeds in a gas at 500 K if the dotted-line curve represents the corresponding distribution for the same gas at 300 K? A B fraction of fraction of molecules molecules speed speed C D fraction of fraction of molecules molecules speed speed
1 marks
Answer: A
This question in 9701/11 Oct/Nov 2011
Q29 · Butanedioate ions can be dehydrogenated to form trans-butenedioate ions 9701/11 Oct/Nov 2011
12 Butanedioate ions can be dehydrogenated to form trans-butenedioate ions. The enzyme fumarase speeds up this reaction. Why does fumarase speed up this reaction? A Fumarase is a protein. B Fumarase is effective at body temperature. C Fumarase lowers the activation energy of the dehydrogenation reaction. D The enzyme fumarase is specific for this dehydrogenation reaction.
1 marks
Answer: C
This question in 9701/11 Oct/Nov 2011
Q30 · An energy profile diagram is shown 9701/12 Oct/Nov 2011
32 An energy profile diagram is shown. W reactants enthalpy, H Y Z X products progress of reaction What do the labels on the diagram represent? 1 W = ∆H of the forward reaction, Y = Ea of the backward reaction 2 Z = ∆H of the backward reaction, Y = Ea of the backward reaction 3 X = ∆H of the forward reaction, W = Ea of the forward reaction
1 marks
This question in 9701/12 Oct/Nov 2011
Q31 · Which solid-line curve most accurately represents the distribution of molecular speeds in… 9701/13 Oct/Nov 2011
9 Which solid-line curve most accurately represents the distribution of molecular speeds in a gas at 500 K if the dotted-line curve represents the corresponding distribution for the same gas at 300 K? A B fraction of fraction of molecules molecules speed speed C D fraction of fraction of molecules molecules speed speed
1 marks
Answer: A
This question in 9701/13 Oct/Nov 2011
Q32 · Butanedioate ions can be dehydrogenated to form trans-butenedioate ions 9701/13 Oct/Nov 2011
11 Butanedioate ions can be dehydrogenated to form trans-butenedioate ions. The enzyme fumarase speeds up this reaction. Why does fumarase speed up this reaction? A Fumarase is a protein. B Fumarase is effective at body temperature. C Fumarase lowers the activation energy of the dehydrogenation reaction. D The enzyme fumarase is specific for this dehydrogenation reaction.
1 marks
Answer: C
This question in 9701/13 Oct/Nov 2011
Q33 · The molecular energy distribution curve represents the variation in energy of the… 9701/12 May/June 2012
1 The molecular energy distribution curve represents the variation in energy of the molecules of a gas at room temperature. proportion of molecules 0 0 energy Which curve applies for the same gas at a lower temperature? A B proportion proportion of of molecules molecules 0 0 0 0 energy energy C D proportion proportion of of molecules molecules 0 0 0 0 energy energy
1 marks
Answer: C
This question in 9701/12 May/June 2012
Q34 · Methanol is manufactured by reacting carbon dioxide and hydrogen 9701/12 May/June 2012
9 Methanol is manufactured by reacting carbon dioxide and hydrogen. CO2(g) + 3H2(g) CH3OH(g) + H2O(g) ∆H = –49 kJ mol–1 What would increase the equilibrium yield of methanol in this process? A adding a catalyst B adding an excess of steam C increasing the pressure D increasing the temperature
1 marks
Answer: C
This question in 9701/12 May/June 2012
Q35 · Which statements are true about the Haber process for the manufacture of ammonia? 9701/12 May/June 2012
36 Which statements are true about the Haber process for the manufacture of ammonia? 1 At higher temperatures, the yield goes down but the rate of production of ammonia is faster. 2 At higher pressures, the yield goes down but the rate of production of ammonia is faster. 3 In the presence of a catalyst, the yield goes down but the rate of production of ammonia is faster.
1 marks
Answer: D
This question in 9701/12 May/June 2012
Q36 · The gaseous compound Z decomposes on heating 9701/13 Oct/Nov 2012
8 The gaseous compound Z decomposes on heating. In the diagram below, Boltzmann distributions for Z at two different temperatures P and Q are shown. The lines X and Y indicate activation energies for the decomposition of Z with and without a catalyst. X Y P number of molecules Q 0 0 energy Which curve and which line describe the decomposition of Z at a higher temperature and with a catalyst present? higher temperature catalyst present A P X B P Y C Q X D Q Y
1 marks
Answer: C
This question in 9701/13 Oct/Nov 2012
Q37 · The reaction pathway for a reversible reaction is shown below 9701/11 May/June 2013
7 The reaction pathway for a reversible reaction is shown below. 30 energy / kJ mol–1 50 extent of reaction Which statement is correct? A The activation energy of the reverse reaction is +80 kJ mol–1. B The enthalpy change for the forward reaction is +30 kJ mol–1. C The enthalpy change for the forward reaction is +50 kJ mol–1. D The enthalpy change for the reverse reaction is +30 kJ mol–1.
1 marks
Answer: A
This question in 9701/11 May/June 2013
Q38 · Which factor can affect the value of the activation energy of a reaction? 9701/12 May/June 2013
4 Which factor can affect the value of the activation energy of a reaction? A changes in concentration of the reactants B decrease in temperature C increase in temperature D the presence of a catalyst
1 marks
Answer: D
This question in 9701/12 May/June 2013
Q39 · The diagram shows the Maxwell-Boltzmann energy distribution curves for molecules of a… 9701/12 May/June 2013
5 The diagram shows the Maxwell-Boltzmann energy distribution curves for molecules of a sample of a gas at two different temperatures. Which letter on the axes represents the most probable energy of the molecules at the lower temperature? A B C D
1 marks
Answer: C
This question in 9701/12 May/June 2013
Q40 · The diagram represents, for a given temperature, the Boltzmann distribution of the… 9701/13 May/June 2013
4 The diagram represents, for a given temperature, the Boltzmann distribution of the kinetic energies of the molecules in a mixture of two gases that will react together. The activation energy for the reaction, Ea , is marked. number of molecules Ea energy The dotted curves below show the Boltzmann distribution for the same reaction at a higher temperature. On these diagrams, H represents the activation energy at the higher temperature. Which diagram is correct? A B number of number of molecules molecules Ea energy Ea energy H H C D number of number of molecules molecules Ea energy Ea energy H H
1 marks
Answer: C
This question in 9701/13 May/June 2013
Q41 · The reaction pathway for a reversible reaction is shown below 9701/13 May/June 2013
33 The reaction pathway for a reversible reaction is shown below. 50 energy / kJ mol–1 20 extent of reaction Which statements are correct? 1 The enthalpy change for the backward reaction is –20 kJ mol–1. 2 The forward reaction is endothermic. 3 The activation energy for the forward reaction is +70 kJ mol–1.
1 marks
Answer: A
This question in 9701/13 May/June 2013
Q42 · The diagrams below show the Boltzmann distribution for air at two temperatures 9701/11 Oct/Nov 2013
6 The diagrams below show the Boltzmann distribution for air at two temperatures. The solid line represents the distribution at –20 °C. The dotted line represents the distribution at –10 °C. Which diagram is correct? A B number of number of molecules molecules energy energy C D number of number of molecules molecules energy energy
1 marks
Answer: D
This question in 9701/11 Oct/Nov 2013
Q43 · Which stage in the free radical substitution of methane by chlorine will have the lowest… 9701/11 Oct/Nov 2013
7 Which stage in the free radical substitution of methane by chlorine will have the lowest activation energy? A CH3• + Cl 2 → CH3Cl + Cl • B Cl • + Cl • → Cl 2 C Cl • + CH4 → CH3• + HCl D Cl 2 → Cl • + Cl •
1 marks
Answer: B
This question in 9701/11 Oct/Nov 2013
Q44 · If N2O4 gas is placed in a sealed vessel the following equilibrium is established 9701/11 Oct/Nov 2013
34 If N2O4 gas is placed in a sealed vessel the following equilibrium is established. N2O4(g) 2NO2(g) The forward reaction is endothermic. What happens when the temperature is increased? 1 The equilibrium constant increases. 2 The partial pressure of NO2 increases. 3 The activation energy is unchanged.
1 marks
Answer: A
This question in 9701/11 Oct/Nov 2013
Q45 · The diagrams below show the Boltzmann distribution for air at two temperatures 9701/12 Oct/Nov 2013
6 The diagrams below show the Boltzmann distribution for air at two temperatures. The solid line represents the distribution at –20 °C. The dotted line represents the distribution at –10 °C. Which diagram is correct? A B number of number of molecules molecules energy energy C D number of number of molecules molecules energy energy
1 marks
Answer: D
This question in 9701/12 Oct/Nov 2013
Q46 · Which stage in the free radical substitution of methane by chlorine will have the lowest… 9701/12 Oct/Nov 2013
7 Which stage in the free radical substitution of methane by chlorine will have the lowest activation energy? A CH3• + Cl 2 → CH3Cl + Cl • B Cl • + Cl • → Cl 2 C Cl • + CH4 → CH3• + HCl D Cl 2 → Cl • + Cl •
1 marks
Answer: B
This question in 9701/12 Oct/Nov 2013
Q47 · If N2O4 gas is placed in a sealed vessel the following equilibrium is established 9701/12 Oct/Nov 2013
34 If N2O4 gas is placed in a sealed vessel the following equilibrium is established. N2O4(g) 2NO2(g) The forward reaction is endothermic. What happens when the temperature is increased? 1 The equilibrium constant increases. 2 The partial pressure of NO2 increases. 3 The activation energy is unchanged.
1 marks
Answer: A
This question in 9701/12 Oct/Nov 2013
Q48 · Which stage in the free radical substitution of ethane by chlorine will have the lowest… 9701/13 Oct/Nov 2013
6 Which stage in the free radical substitution of ethane by chlorine will have the lowest activation energy? A Cl 2 → 2Cl ● B Cl ● + C2H6 → C2H5● + HCl C C2H5● + Cl 2 → C2H5Cl + Cl ● D Cl ● + C2H5● → C2H5Cl
1 marks
Answer: D
This question in 9701/13 Oct/Nov 2013
Q49 · The diagram represents the Boltzmann distribution of molecular energies at a given… 9701/13 Oct/Nov 2013
32 The diagram represents the Boltzmann distribution of molecular energies at a given temperature. number of molecules energy Which of the factors that affect the rate of a reaction can be explained using such a Boltzmann distribution? 1 increasing the concentration of reactants 2 increasing the temperature 3 the addition of a catalyst
1 marks
Answer: C
This question in 9701/13 Oct/Nov 2013
Q50 · Boltzmann distributions are shown in the diagrams 9701/11 May/June 2014
11 Boltzmann distributions are shown in the diagrams. diagram 1 diagram 2 X Y P number of Q number of molecules molecules 0 0 0 0 molecular energy molecular energy In diagram 1, one curve, P or Q, corresponds to a temperature higher than that of the other curve. In diagram 2, one line, X or Y, corresponds to the activation energy in the presence of a catalyst and the other line corresponds to the activation energy of the same reaction in the absence of a catalyst. Which combination gives the correct curve and line? higher presence of temperature catalyst A P X B P Y C Q X D Q Y
1 marks
Answer: C
This question in 9701/11 May/June 2014
Q51 · R and S react together 9701/11 May/June 2014
33 R and S react together. R + S T Which factors affect the rate of the forward reaction? 1 the activation energy of the reaction 2 the enthalpy change of the reaction 3 the equilibrium constant of the reaction
1 marks
Answer: D
This question in 9701/11 May/June 2014
Q52 · The diagram shows a Boltzmann distribution of molecular energies for a gaseous mixture 9701/12 May/June 2014
1 The diagram shows a Boltzmann distribution of molecular energies for a gaseous mixture. The distribution has a peak, labelled P on the diagram. P activation number of energy molecules 00 molecular energy What happens when the temperature of the mixture increases? A The height of the peak, P, decreases and the activation energy moves to the left. B The height of the peak, P, decreases and the activation energy moves to the right. C The height of the peak, P, decreases and the activation energy does not change. D The height of the peak, P, increases and the activation energy moves to the left.
1 marks
Answer: C
This question in 9701/12 May/June 2014
Q53 · The Boltzmann distribution for a gas at constant temperature is shown below 9701/13 May/June 2014
1 The Boltzmann distribution for a gas at constant temperature is shown below. n = number of molecules 0 0 X Y Z molecular energy If the temperature of the gas is reduced by 10 °C the graph changes shape. What happens to the values of n for the molecular energies X, Y and Z ? X Y Z A higher lower higher B higher lower lower C lower higher lower D lower lower lower
1 marks
Answer: B
This question in 9701/13 May/June 2014
Q54 · Hydrazine, N2H4, is used as a rocket fuel because it reacts with oxygen as shown… 9701/13 May/June 2014
6 Hydrazine, N2H4, is used as a rocket fuel because it reacts with oxygen as shown, producing ‘environmentally friendly’ gases. N2H4(l) + O2(g) → N2(g) + 2H2O(g) ∆H = –534 kJ mol–1 Despite its use as a rocket fuel, hydrazine does not burn spontaneously in oxygen. Which statement explains why hydrazine does not burn spontaneously? A Hydrazine is a liquid. B The activation energy is too high. C The N N bond is very strong. D The reaction is exothermic.
1 marks
Answer: B
This question in 9701/13 May/June 2014
Q55 · Which solid-line curve most accurately represents the distribution of molecular energies… 9701/11 Oct/Nov 2014
1 Which solid-line curve most accurately represents the distribution of molecular energies in a gas at 500 K if the dotted-line curve represents the corresponding distribution for the same gas at 300 K? A B number of number of molecules molecules molecular energy molecular energy C D number of number of molecules molecules molecular energy molecular energy
1 marks
Answer: A
This question in 9701/11 Oct/Nov 2014
Q56 · The reaction pathway diagram below illustrates the energies of the reactants, the… 9701/11 Oct/Nov 2014
8 The reaction pathway diagram below illustrates the energies of the reactants, the products and the transition state of a reaction. transition state E1 E2 energy reactants E3 products extent of reaction Which expression represents the activation energy of the forward reaction? A E1 – E2 B E2 – E1 C E2 – E3 D E3 – E2
1 marks
Answer: A
This question in 9701/11 Oct/Nov 2014
Q57 · On being heated, hydrogen iodide breaks down more quickly than hydrogen chloride 9701/11 Oct/Nov 2014
35 On being heated, hydrogen iodide breaks down more quickly than hydrogen chloride. Which statements explain this faster rate? 1 The HI bond is weaker than the HCl bond. 2 The reaction of the breakdown of HI has a smaller activation energy than that of HCl. 3 The breakdown of HI is more exothermic than that of HCl.
1 marks
Answer: B
This question in 9701/11 Oct/Nov 2014
Q58 · Which solid-line curve most accurately represents the distribution of molecular energies… 9701/12 Oct/Nov 2014
1 Which solid-line curve most accurately represents the distribution of molecular energies in a gas at 500 K if the dotted-line curve represents the corresponding distribution for the same gas at 300 K? A B number of number of molecules molecules molecular energy molecular energy C D number of number of molecules molecules molecular energy molecular energy
1 marks
Answer: A
This question in 9701/12 Oct/Nov 2014
Q59 · The reaction pathway diagram below illustrates the energies of the reactants, the… 9701/12 Oct/Nov 2014
8 The reaction pathway diagram below illustrates the energies of the reactants, the products and the transition state of a reaction. transition state E1 E2 energy reactants E3 products extent of reaction Which expression represents the activation energy of the forward reaction? A E1 – E2 B E2 – E1 C E2 – E3 D E3 – E2
1 marks
Answer: A
This question in 9701/12 Oct/Nov 2014
Q60 · On being heated, hydrogen iodide breaks down more quickly than hydrogen chloride 9701/12 Oct/Nov 2014
35 On being heated, hydrogen iodide breaks down more quickly than hydrogen chloride. Which statements explain this faster rate? 1 The HI bond is weaker than the HCl bond. 2 The reaction of the breakdown of HI has a smaller activation energy than that of HCl. 3 The breakdown of HI is more exothermic than that of HCl.
1 marks
Answer: B
This question in 9701/12 Oct/Nov 2014
Q61 · The diagram below represents, for a given temperature, the Boltzmann distribution of the… 9701/13 Oct/Nov 2014
1 The diagram below represents, for a given temperature, the Boltzmann distribution of the kinetic energy of the molecules in a mixture of two gases that react slowly together. The activation energy for the reaction, Ea, is marked. When the reaction is catalysed, the rate of reaction increases a little. What will be the position of Ea for the catalysed reaction? number of molecules kinetic Ea energy A B C D
1 marks
Answer: B
This question in 9701/13 Oct/Nov 2014
Q62 · Nitrogen monoxide is an atmospheric pollutant that is formed inside car engines by an… 9701/13 Oct/Nov 2014
10 Nitrogen monoxide is an atmospheric pollutant that is formed inside car engines by an endothermic reaction between nitrogen and oxygen. N2(g) + O2(g) → 2NO(g) ∆H = +66 kJ mol–1 Which labelled diagram correctly represents the energy profile for this reaction? A B energy Ea energy Ea ∆H ∆H 00 00 extent of extent of reaction reaction C D Ea Ea energy energy ∆H ∆H 00 00 extent of extent of reaction reaction
1 marks
Answer: A
This question in 9701/13 Oct/Nov 2014
Q63 · The diagram shows a Boltzmann distribution of molecular energies for a gaseous mixture 9701/11 May/June 2015
1 The diagram shows a Boltzmann distribution of molecular energies for a gaseous mixture. The distribution has a peak, labelled P on the diagram. P activation number of energy molecules 00 molecular energy What happens when an effective catalyst is added to the mixture? A The height of the peak decreases and the activation energy moves to the right. B The height of the peak decreases and the activation energy moves to the left. C The height of the peak remains the same and the activation energy moves to the right. D The height of the peak remains the same and the activation energy moves to the left.
1 marks
Answer: D
This question in 9701/11 May/June 2015
Q64 · Why does raising the pressure of a fixed mass of gaseous reactants at a constant… 9701/11 May/June 2015
34 Why does raising the pressure of a fixed mass of gaseous reactants at a constant temperature cause an increase in the rate of reaction? 1 More collisions occur per second when the pressure is increased. 2 More molecules have energy greater than the activation energy at the higher pressure. 3 Raising the pressure lowers the activation energy.
1 marks
Answer: D
This question in 9701/11 May/June 2015
Q65 · The Boltzmann distribution below shows the distribution of molecular energies in a sample… 9701/12 May/June 2015
11 The Boltzmann distribution below shows the distribution of molecular energies in a sample of a gas at a given temperature. number of molecules 00 molecular energy Which statement correctly describes the change in such a distribution if the temperature is increased? A Fewer molecules possess the most probable energy value and this value shifts to the left. B Fewer molecules possess the most probable energy value and this value shifts to the right. C More molecules possess the most probable energy value and this value shifts to the left. D The area under the curve of the distribution increases.
1 marks
Answer: B
This question in 9701/12 May/June 2015
Q66 · Hydrogen can be obtained by reacting methane with steam 9701/12 Oct/Nov 2015
8 Hydrogen can be obtained by reacting methane with steam. CH4(g) + H2O(g) CO(g) + 3H2(g) ΔH o = +210 kJ mol–1 Which conditions of pressure and temperature will give the greatest equilibrium yield of hydrogen? pressure temperature A high high B high low C low high D low low
1 marks
This question in 9701/12 Oct/Nov 2015
Q67 · The decomposition reaction SF6(g) → SF4(g) + F2(g) can be described by the reaction… 9701/12 Oct/Nov 2015
10 The decomposition reaction SF6(g) → SF4(g) + F2(g) can be described by the reaction pathway diagram shown. Y SF4(g) + F2(g) X energy SF6(g) extent of reaction What are the values of ΔH o and Ea for this reaction? ΔH o Ea A X X + Y B X Y C X – Y X D Y – X X
1 marks
This question in 9701/12 Oct/Nov 2015
Q68 · Which row correctly describes what happens when the temperature of a chemical reaction is… 9701/12 Oct/Nov 2015
11 Which row correctly describes what happens when the temperature of a chemical reaction is decreased? activation energy number of (Ea) successful collisions A decreases decreases B decreases increases C remains the same decreases D remains the same increases
1 marks
This question in 9701/12 Oct/Nov 2015
Q69 · Nitric oxide, NO, and bromine vapour react together according to the following equation 9701/12 Feb/March 2016
5 Nitric oxide, NO, and bromine vapour react together according to the following equation. 2NO(g) + Br2(g) → 2NOBr(g) ΔH o= –23 kJ mol–1 The reaction has an activation energy of +5.4 kJ mol–1. What is the correct reaction pathway diagram for this reaction? A B EA enthalpy EA enthalpy ΔH o / kJ mol–1 ΔH o / kJ mol–1 extent of reaction extent of reaction C D EA EA enthalpy enthalpy / kJ mol–1 ΔH o / kJ mol–1 ΔH o extent of reaction extent of reaction
1 marks
Answer: D
This question in 9701/12 Feb/March 2016
Q70 · Which statements about reversible reactions are correct? 9701/12 Feb/March 2016
33 Which statements about reversible reactions are correct? 1 An increase in concentration of a reactant always increases the concentration of the product. 2 An increase in temperature always increases the rate at which the equilibrium is established. 3 An increase in temperature always increases the concentration of the product at equilibrium.
1 marks
Answer: B
This question in 9701/12 Feb/March 2016
Q71 · A chemist puts a sample of dilute aqueous hydrochloric acid into beaker 1 9701/12 Feb/March 2016
34 A chemist puts a sample of dilute aqueous hydrochloric acid into beaker 1. She adds a sample of zinc and measures the rate of production of hydrogen gas. She then puts a different sample of dilute aqueous hydrochloric acid into beaker 2. She adds a different sample of zinc and measures the rate of production of hydrogen gas. The rate of the reaction in beaker 2 is greater than the rate of the reaction in beaker 1. Which factors could help to explain this observation? 1 The reaction in beaker 1 has a higher activation energy than the reaction in beaker 2. 2 The zinc in beaker 1 is in larger pieces than the zinc in beaker 2. 3 The acid in beaker 1 is at a lower concentration than the acid in beaker 2.
1 marks
Answer: C
This question in 9701/12 Feb/March 2016
Q72 · The equation shows a gas phase reaction 9701/11 May/June 2016
37 The equation shows a gas phase reaction. X(g) → 2Y(g) The diagram shows the Boltzmann distribution of a fixed mass of X(g) at temperature T in the absence of a catalyst. The line EA indicates the activation energy. proportion of molecules with a given energy 00 EA molecular energy Which diagrams correctly show the effect of the following changes made separately and independently? 1 adding a catalyst proportion of molecules with a given energy 00 EA molecular energy 2 increasing the pressure of X(g) proportion of molecules with a given energy 00 EA molecular energy 3 increasing the temperature of X(g) proportion of temperature T ' molecules (T ' > T ) with a given temperature T energy 00 EA molecular energy
1 marks
Answer: B
This question in 9701/11 May/June 2016
Q73 · The diagram shows the Boltzmann distribution of energies in 1 mole of a gas 9701/12 May/June 2016
1 The diagram shows the Boltzmann distribution of energies in 1 mole of a gas. The gas can take part in a reaction with an activation energy, Ea. P proportion of molecules with a given energy 0 0 Ea molecular energy Which statement correctly describes the effect of an increase in temperature? A Peak P will be higher and fewer molecules will have energy > Ea. B Peak P will be higher and more molecules will have energy > Ea. C Peak P will be lower and fewer molecules will have energy > Ea. D Peak P will be lower and more molecules will have energy > Ea.
1 marks
Answer: D
This question in 9701/12 May/June 2016
Q74 · The diagram shows the Boltzmann distribution of molecular energies in one mole of a gas… 9701/13 May/June 2016
33 The diagram shows the Boltzmann distribution of molecular energies in one mole of a gas at two temperatures, T1 and T2. T1 T2 proportion of molecules with a given energy E1 E2 molecular energy Which statements are correct? 1 The shaded area represents the proportion of molecules with energies between E1 and E2 at temperature T2. 2 No particles have zero energy at either temperature. 3 T2 is a lower temperature than T1.
1 marks
Answer: B
This question in 9701/13 May/June 2016
Q75 · The diagram represents, for a given temperature, the Boltzmann distribution of the… 9701/11 Oct/Nov 2016
1 The diagram represents, for a given temperature, the Boltzmann distribution of the kinetic energies of the molecules in a mixture of two gases that react together. The activation energy for the reaction, Ea , is marked. proportion of molecules with a given energy 00 Ea molecular energy The dotted curves below show the Boltzmann distribution for the same reaction at a higher temperature. On these diagrams, H represents the activation energy at the higher temperature. Which diagram is correct? A B proportion of proportion of molecules molecules with a with a given energy given energy 00 00 Ea molecular Ea molecular energy H energy H C D proportion of proportion of molecules molecules with a with a given energy given energy 00 00 Ea molecular Ea molecular energy energy H H
1 marks
Answer: C
This question in 9701/11 Oct/Nov 2016
Q76 · The diagram represents, for a given temperature, the Boltzmann distribution of the… 9701/13 Oct/Nov 2016
1 The diagram represents, for a given temperature, the Boltzmann distribution of the kinetic energies of the molecules in a mixture of two gases that react together. The activation energy for the reaction, Ea , is marked. proportion of molecules with a given energy 00 Ea molecular energy The dotted curves below show the Boltzmann distribution for the same reaction at a higher temperature. On these diagrams, H represents the activation energy at the higher temperature. Which diagram is correct? A B proportion of proportion of molecules molecules with a with a given energy given energy 00 00 Ea molecular Ea molecular energy H energy H C D proportion of proportion of molecules molecules with a with a given energy given energy 00 00 Ea molecular Ea molecular energy energy H H
1 marks
Answer: C
This question in 9701/13 Oct/Nov 2016
Q77 · In the high temperatures of car engines, nitrogen reacts with oxygen to give nitrogen… 9701/12 May/June 2017
7 In the high temperatures of car engines, nitrogen reacts with oxygen to give nitrogen monoxide. 1 N2(g) + 2 1 O2(g) → NO(g) ∆H o = +90 kJ mol–1 2 This reaction has activation energy Ea. Which reaction pathway diagram could correctly represent this reaction? A B Ea NO(g) Ea 1 N2(g) + O2(g) 1 1 N2(g) + O2(g) 1 ∆H o energy 2 2 energy 2 2 ∆H o NO(g) extent of reaction extent of reaction C D NO(g) NO(g) Ea Ea 1 N2(g) + O2(g) 1 ∆H o 1 N2(g) + O2(g) 1 ∆H o energy 2 2 energy 2 2 extent of reaction extent of reaction
1 marks
Answer: C
This question in 9701/12 May/June 2017
Q78 · The Boltzmann distribution for the hydrogenation of an alkene at a particular temperature… 9701/12 May/June 2017
11 The Boltzmann distribution for the hydrogenation of an alkene at a particular temperature in the absence of a catalyst is shown. proportion of molecules Ea with energy E 00 molecular energy E Which row correctly describes the effects of adding nickel to the reaction vessel? the shape of the activation energy, Ea Boltzmann distribution A changes decreases B changes increases C does not change decreases D does not change increases
1 marks
Answer: C
This question in 9701/12 May/June 2017
Q79 · Ammonia is produced by the Haber process 9701/13 May/June 2017
9 Ammonia is produced by the Haber process. N2 + 3H2 2NH3 ∆H o = –92 kJ mol–1 A fault in the temperature control during the process resulted in the temperature changing to 600 °C for two hours. What effect did this have on the ammonia production during this time? A Ammonia was formed faster. The equilibrium yield decreased. B Ammonia was formed faster. The equilibrium yield increased. C Ammonia was formed slower. The equilibrium yield decreased. D Ammonia was formed slower. The equilibrium yield increased.
1 marks
Answer: A
This question in 9701/13 May/June 2017
Q80 · The diagram shows the Boltzmann distribution of the energy of gaseous molecules at a… 9701/13 May/June 2017
11 The diagram shows the Boltzmann distribution of the energy of gaseous molecules at a particular temperature. proportion of molecules Y with energy E X 00 molecular energy E Which statement is correct? A If the temperature of the gas is raised, the height of the maximum of the curve increases. B If the temperature of the gas is raised, the maximum of the curve moves to the right. C The length of the line labelled X shows the activation energy for the reaction. D The length of the line labelled Y shows the enthalpy change of the reaction.
1 marks
Answer: B
This question in 9701/13 May/June 2017
Q81 · The diagram shows the distribution of molecular energies in a sample of gas at a… 9701/11 Oct/Nov 2017
10 The diagram shows the distribution of molecular energies in a sample of gas at a temperature T1. The activation energy for an uncatalysed reaction of this gas, Ea(uncat), is shown. T1 proportion Ea(uncat) of molecules with a given energy 0 0 molecular energy E Which diagram correctly shows the new distribution and new activation energy, Ea(cat), when the temperature is increased to T2, and a catalyst is used that increases the rate of the reaction? A B T1 T1 Ea(cat) proportion Ea(uncat) proportion Ea(uncat) T2 T2 of molecules Ea(cat) of molecules with a given with a given energy energy 0 0 0 molecular energy E 0 molecular energy E C D T1 Ea(cat) T1 proportion Ea(uncat) proportion Ea(uncat) of molecules of molecules Ea(cat) with a given with a given energy T2 energy T2 0 0 0 molecular energy E 0 molecular energy E
1 marks
Answer: C
This question in 9701/11 Oct/Nov 2017
Q82 · Nitrogen dioxide, NO2, is a brown gas 9701/12 Oct/Nov 2017
9 Nitrogen dioxide, NO2, is a brown gas. Dinitrogen tetroxide, N2O4, is a colourless gas. An equilibrium is established between NO2 and N2O4 in a closed vessel. 2NO2(g) N2O4(g) ∆H = –57 kJ mol–1 brown colourless Which row describes the effects of changing conditions on the colour of an equilibrium mixture of NO2 and N2O4? increasing the pressure increasing the temperature A colour becomes darker colour becomes darker B colour becomes darker colour becomes lighter C colour becomes lighter colour becomes darker D colour becomes lighter colour becomes lighter
1 marks
Answer: C
This question in 9701/12 Oct/Nov 2017
Q83 · Which change alters the activation energy of a given reaction? 9701/12 Oct/Nov 2017
11 Which change alters the activation energy of a given reaction? A adding a suitable catalyst B changing the particle size of the reactants C changing the pressure at which the reaction is carried out D changing the temperature at which the reaction is carried out
1 marks
Answer: A
This question in 9701/12 Oct/Nov 2017
Q84 · The diagram shows the distribution of molecular energies in a sample of gas at a… 9701/13 Oct/Nov 2017
10 The diagram shows the distribution of molecular energies in a sample of gas at a temperature T1. The activation energy for an uncatalysed reaction of this gas, Ea(uncat), is shown. T1 proportion Ea(uncat) of molecules with a given energy 0 0 molecular energy E Which diagram correctly shows the new distribution and new activation energy, Ea(cat), when the temperature is increased to T2, and a catalyst is used that increases the rate of the reaction? A B T1 T1 Ea(cat) proportion Ea(uncat) proportion Ea(uncat) T2 T2 of molecules Ea(cat) of molecules with a given with a given energy energy 0 0 0 molecular energy E 0 molecular energy E C D T1 Ea(cat) T1 proportion Ea(uncat) proportion Ea(uncat) of molecules of molecules Ea(cat) with a given with a given energy T2 energy T2 0 0 0 molecular energy E 0 molecular energy E
1 marks
Answer: C
This question in 9701/13 Oct/Nov 2017
Q85 · The reaction between sulfur dioxide and oxygen is reversible 9701/12 Feb/March 2018
11 The reaction between sulfur dioxide and oxygen is reversible. 2SO2 + O2 2SO3 ∆H o = –196 kJ mol–1 Which conditions of pressure and temperature favour the reverse reaction? pressure temperature A high high B high low C low high D low low
1 marks
Answer: C
This question in 9701/12 Feb/March 2018
Q86 · The diagram shows the Boltzmann distribution of energies in a gas 9701/11 May/June 2018
4 The diagram shows the Boltzmann distribution of energies in a gas. The gas can take part in a reaction with an activation energy, Ea. The gas is maintained at a constant temperature. P proportion of molecules with a given energy 0 0 Ea molecular energy Which statement is correct? A If a catalyst is added, peak P will be lower and Ea will move to the left. B If a catalyst is added, peak P will be lower and Ea will move to the right. C If a catalyst is added, peak P will be the same and Ea will move to the left. D If a catalyst is added, peak P will be the same and Ea will move to the right.
1 marks
Answer: C
This question in 9701/11 May/June 2018
Q87 · A chemical company used a catalyst in a chemical process 9701/12 May/June 2018
11 A chemical company used a catalyst in a chemical process. The company has now decided not to use the catalyst but to increase the temperature so that the rate of the reaction is the same as it was when the catalyst was used. Which statement about the new conditions compared to the original conditions is correct? A The activation energy has been decreased. B The activation energy has been increased. C There are fewer successful collisions per unit time. D There are more successful collisions per unit time.
1 marks
Answer: B
This question in 9701/12 May/June 2018
Q88 · The temperature of a reversible gas phase reaction is increased 9701/12 May/June 2018
34 The temperature of a reversible gas phase reaction is increased. Which statements are always correct? 1 More product is present at equilibrium. 2 The average speed of the particles increases. 3 There are more successful collisions per unit time.
1 marks
Answer: C
This question in 9701/12 May/June 2018
Q89 · The diagram shows the reaction pathway for a reversible reaction 9701/13 May/June 2018
34 The diagram shows the reaction pathway for a reversible reaction. energy 90 / kJ mol–1 30 extent of reaction Which statements are correct? 1 The forward reaction is exothermic. 2 The enthalpy change for the forward reaction is –30 kJ mol–1. 3 The enthalpy change for the backward reaction is +90 kJ mol–1.
1 marks
Answer: B
This question in 9701/13 May/June 2018
Q90 · In this question, all pressures are measured in atm 9701/12 Oct/Nov 2018
9 In this question, all pressures are measured in atm. The equation represents the equilibrium between three gaseous substances X, Y and Z. X + 3Y 2Z At temperature T1, the numerical value of Kp, the equilibrium constant, is 2. At a higher temperature T2, the partial pressures at equilibrium are as shown. X Y Z 2 3 5 Which row is correct? the numerical the forward value of Kp at T2 reaction is A 54 / 25 endothermic B 54 / 25 exothermic C 25 / 54 endothermic D 25 / 54 exothermic
1 marks
Answer: D
This question in 9701/12 Oct/Nov 2018
Q91 · In a chemical system the particles involved have a range of energies 9701/12 Oct/Nov 2018
10 In a chemical system the particles involved have a range of energies. This can be shown on a graph called the Boltzmann distribution. Which statement correctly explains the effect of a catalyst on the particles in a chemical system? A A catalyst enables particles with a lower energy to collide successfully. B A catalyst increases the number of particles with higher energies. C A catalyst increases the number of particles with the most probable energy value. D A catalyst increases the value of the most probable particle energy.
1 marks
Answer: A
This question in 9701/12 Oct/Nov 2018
Q92 · The Boltzmann distribution is shown for a sample of gas at an initial temperature, T1 9701/12 Feb/March 2019
1 The Boltzmann distribution is shown for a sample of gas at an initial temperature, T1. T1 proportion of molecules with energy, E 0 0 molecular energy, E The sample of gas was heated to temperature, T2. What is the correct distribution for the higher temperature, T2? T2 proportion of molecules with A energy, E 0 0 molecular energy, E proportion of T2 molecules with B energy, E 0 0 molecular energy, E T2 proportion of molecules with C energy, E 0 0 molecular energy, E T2 proportion of molecules with D energy, E 0 0 molecular energy, E
1 marks
Answer: B
This question in 9701/12 Feb/March 2019
Q93 · Some polluting gases are removed from car exhaust fumes using a catalytic converter 9701/12 Feb/March 2019
34 Some polluting gases are removed from car exhaust fumes using a catalytic converter. Platinum or palladium can be used as the catalyst. The reactions are faster when platinum is the catalyst than they are when palladium is the catalyst. Which statements are correct? 1 Platinum acts as a heterogeneous catalyst in these reactions. 2 The palladium-catalysed reactions have higher activation energies than the platinum-catalysed reactions. 3 The platinum-catalysed reactions are more exothermic than the palladium-catalysed reactions.
1 marks
Answer: B
This question in 9701/12 Feb/March 2019
Q94 · The temperature of a sample of an inert gas is increased 9701/11 May/June 2019
1 The temperature of a sample of an inert gas is increased. What effect does this have on the number of molecules with the most probable energy and on the number of molecules with high energy? number of molecules with number of molecules the most probable energy with high energy A decreases decreases B decreases increases C increases decreases D increases increases
1 marks
Answer: B
This question in 9701/11 May/June 2019
Q95 · The Boltzmann distribution of molecular energies in a sample of aqueous hydrogen peroxide… 9701/12 May/June 2019
1 The Boltzmann distribution of molecular energies in a sample of aqueous hydrogen peroxide at room temperature is shown. molecules proportion of with sufficient molecules with energy to react energy, E 0 0 molecular energy, E Which diagram shows the Boltzmann distribution of molecular energies of aqueous hydrogen peroxide maintained at room temperature when a catalyst, manganese(IV) oxide, is added? A B molecules molecules with sufficient proportion of proportion of with sufficient energy to react molecules with molecules with energy to react energy, E energy, E 0 0 0 molecular energy, E 0 molecular energy, E C D molecules molecules with sufficient with sufficient proportion of energy to react proportion of energy to react molecules with molecules with energy, E energy, E 0 0 0 molecular energy, E 0 molecular energy, E
1 marks
Answer: B
This question in 9701/12 May/June 2019
Q96 · A reaction pathway diagram is shown 9701/12 May/June 2019
8 A reaction pathway diagram is shown. M N reactants energy O P K L products progress of reaction Which row is correct? enthalpy change of activation energy of the forward reaction the reverse reaction A K M B K O C L O D P M
1 marks
Answer: B
This question in 9701/12 May/June 2019
Q97 · The reaction pathway diagram for a chemical reaction is shown 9701/13 May/June 2019
6 The reaction pathway diagram for a chemical reaction is shown. energy progress of reaction Which statement is correct? A The activation energy of the forward reaction and the enthalpy change of the backward reaction have the same sign. B The activation energy of the forward reaction is more than twice the enthalpy change of the backward reaction and opposite in sign. C The enthalpy change of the forward reaction and the activation energy of the backward reaction have the same sign. D The enthalpy change of the forward reaction is more than twice the activation energy of the backward reaction.
1 marks
Answer: C
This question in 9701/13 May/June 2019
Q98 · The diagram shows the Boltzmann distribution of molecular energies in one mole of a gas… 9701/13 May/June 2019
34 The diagram shows the Boltzmann distribution of molecular energies in one mole of a gas at two temperatures, T1 and T2. T1 T2 proportion of molecules with energy E 00 E1 E2 molecular energy, E Which statements are correct? 1 The shaded area represents the proportion of molecules with energies between E1 and E2 at temperature T2. 2 No particles have zero energy at either temperature. 3 T2 is a higher temperature than T1.
1 marks
Answer: A
This question in 9701/13 May/June 2019
Q99 · The diagram shows the Boltzmann distribution of energies in a gas 9701/11 Oct/Nov 2019
1 The diagram shows the Boltzmann distribution of energies in a gas. The gas undergoes a reaction with an activation energy, Ea. The peak of the distribution is labelled P. P proportion of molecules with energy E 0 0 Ea molecular energy, E If the same reaction is carried out in the presence of a catalyst, which statement is correct? A The peak P is at a lower height and the position of Ea moves to the left. B The peak P is at a lower height and the position of Ea moves to the right. C The peak P remains at the same height and the position of Ea moves to the left. D The peak P remains at the same height and the position of Ea moves to the right.
1 marks
Answer: C
This question in 9701/11 Oct/Nov 2019
Q100 · The diagram shows a Boltzmann distribution of the energies of gaseous molecules and the… 9701/12 Oct/Nov 2019
1 The diagram shows a Boltzmann distribution of the energies of gaseous molecules and the activation energies, Ea, of a reaction with and without a catalyst. proportion of molecules with energy, E 00 Ea1 Ea2 molecular energy, E Which statement about this distribution curve is correct? A If the temperature of the gas is increased, the maximum of the curve becomes higher. B If the temperature of the gas is increased, the maximum of the curve moves to the left. C The fraction of molecules that react in the presence of a catalyst is shown by . D The fraction of molecules that react in the absence of a catalyst is shown by .
1 marks
Answer: D
This question in 9701/12 Oct/Nov 2019
Q101 · The reaction pathway diagram for a reversible reaction is shown 9701/12 Oct/Nov 2019
34 The reaction pathway diagram for a reversible reaction is shown. 50 energy / kJ mol–1 20 progress of reaction Which statements are correct? 1 The enthalpy change for the backward reaction is –20 kJ mol–1. 2 The forward reaction is endothermic. 3 The activation energy for the forward reaction is +70 kJ mol–1.
1 marks
Answer: A
This question in 9701/12 Oct/Nov 2019
Q102 · The diagram shows the Boltzmann distribution of energies in a gas 9701/13 Oct/Nov 2019
1 The diagram shows the Boltzmann distribution of energies in a gas. The gas undergoes a reaction with an activation energy, Ea. The peak of the distribution is labelled P. P proportion of molecules with energy E 0 0 Ea molecular energy, E If the same reaction is carried out in the presence of a catalyst, which statement is correct? A The peak P is at a lower height and the position of Ea moves to the left. B The peak P is at a lower height and the position of Ea moves to the right. C The peak P remains at the same height and the position of Ea moves to the left. D The peak P remains at the same height and the position of Ea moves to the right.
1 marks
Answer: C
This question in 9701/13 Oct/Nov 2019
Q103 · The diagram shows the Boltzmann energy distribution curves for molecules of a sample of a… 9701/11 May/June 2020
6 The diagram shows the Boltzmann energy distribution curves for molecules of a sample of a gas at two different temperatures. Which letter on the axes represents the most probable energy for molecules of the same sample of gas at the lower temperature? A B C D
1 marks
Answer: C
This question in 9701/11 May/June 2020
Q104 · Which factors can lead to an increase in the rate of a reaction? 9701/12 May/June 2020
33 Which factors can lead to an increase in the rate of a reaction? 1 a lower activation energy 2 an increase in temperature 3 an increase in the concentration of a reactant
1 marks
Answer: A
This question in 9701/12 May/June 2020
Q105 · The Haber process is used in industry to form ammonia from hydrogen and nitrogen 9701/13 May/June 2020
34 The Haber process is used in industry to form ammonia from hydrogen and nitrogen. 3H2 + N2 2NH3 Which statements about the activation energy for this process are correct? 1 The activation energy for the forward reaction is the same as the activation energy for the reverse reaction. 2 The activation energy for the reverse reaction is decreased by the addition of iron. 3 The activation energy is the minimum energy that colliding particles must possess in order to react.
1 marks
Answer: C
This question in 9701/13 May/June 2020
Q106 · Methanol, CH3OH, can be produced industrially by reacting CO with H2 9701/11 Oct/Nov 2020
34 Methanol, CH3OH, can be produced industrially by reacting CO with H2. CO(g) + 2H2(g) CH3OH(g) H = –91 kJ mol–1 The process can be carried out at 4 103 kPa and 1150 K. Which statements about this reaction are correct? 1 Increasing the temperature will increase the rate of reaction because more effective collisions will occur. 2 Lowering the temperature will reduce the rate of reaction because the forward reaction is exothermic. 3 Increasing the pressure will reduce the rate of reaction because there are a larger number of moles on the left-hand side of the equation.
1 marks
Answer: D
This question in 9701/11 Oct/Nov 2020
Q107 · Ammonia is made by the Haber process 9701/12 Oct/Nov 2020
11 Ammonia is made by the Haber process. The reactants are nitrogen and hydrogen. N2(g) + 3H2(g) 2NH3(g) ∆H is negative What will increase the rate of the forward reaction? A adding argon to the mixture but keeping the total volume constant B decreasing the temperature C increasing the total pressure by reducing the total volume at constant temperature D removing ammonia as it is made but keeping the total volume of the mixture the same
1 marks
Answer: C
This question in 9701/12 Oct/Nov 2020
Q108 · Methanol, CH3OH, can be produced industrially by reacting CO with H2 9701/13 Oct/Nov 2020
34 Methanol, CH3OH, can be produced industrially by reacting CO with H2. CO(g) + 2H2(g) CH3OH(g) H = –91 kJ mol–1 The process can be carried out at 4 103 kPa and 1150 K. Which statements about this reaction are correct? 1 Increasing the temperature will increase the rate of reaction because more effective collisions will occur. 2 Lowering the temperature will reduce the rate of reaction because the forward reaction is exothermic. 3 Increasing the pressure will reduce the rate of reaction because there are a larger number of moles on the left-hand side of the equation.
1 marks
Answer: D
This question in 9701/13 Oct/Nov 2020
Q109 · The Boltzmann distribution curve for a gaseous mixture of ethene and hydrogen is shown 9701/12 Feb/March 2021
11 The Boltzmann distribution curve for a gaseous mixture of ethene and hydrogen is shown. Nickel is an effective catalyst for the reaction that occurs. number of particles with energy, E Ea (catalysed) Ea 0 0 energy, E How does the diagram appear if the same reaction mixture is at a higher temperature? A The curve is unchanged. B The values of both Ea (catalysed) and Ea decrease. C The values of both Ea (catalysed) and Ea increase. D The values of both Ea (catalysed) and Ea remain the same.
1 marks
Answer: D
This question in 9701/12 Feb/March 2021
Q110 · The diagram shows the Boltzmann distribution for the same gas at two different… 9701/11 May/June 2021
5 The diagram shows the Boltzmann distribution for the same gas at two different temperatures, T1 and T2. T1 T2 y 0 0 x What is plotted on the y-axis and which line represents the higher temperature? plotted on y-axis higher temperature A number of molecules T1 B number of molecules T2 C molecular energy T1 D molecular energy T2
1 marks
Answer: B
This question in 9701/11 May/June 2021
Q111 · Which statement about catalysts is correct? 9701/11 May/June 2021
11 Which statement about catalysts is correct? A They change the reaction pathway by increasing the activation energy. B They increase the rate of reaction by lowering the enthalpy change of the reaction. C They increase the number of particles that have sufficient energy to react. D Heterogeneous catalysts are in the same state as the reactant.
1 marks
Answer: C
This question in 9701/11 May/June 2021
Q112 · The reaction pathway diagram for the catalysed reaction and the uncatalysed reaction… 9701/12 May/June 2021
7 The reaction pathway diagram for the catalysed reaction and the uncatalysed reaction between N2 and H2 is shown. N2(g) + 3H2(g) 2NH3(g) Which letter represents the activation energy for the first step in the decomposition of NH3 in the presence of a catalyst? A C B energy N2(g) + 3H2(g) D 2NH3(g) reaction pathway
1 marks
Answer: D
This question in 9701/12 May/June 2021
Q113 · Hydrogen chloride gas is formed by the reaction shown 9701/12 May/June 2021
34 Hydrogen chloride gas is formed by the reaction shown. H2(g) + Cl 2(g) 2HCl (g) What will change the average kinetic energy of the reacting gas particles? 1 increasing the temperature and increasing the concentration of hydrogen 2 cooling the reaction mixture and adding a catalyst 3 adding a catalyst and increasing the concentration of chlorine
1 marks
Answer: B
This question in 9701/12 May/June 2021
Q114 · Nitric acid is produced by oxidising ammonia 9701/13 May/June 2021
11 Nitric acid is produced by oxidising ammonia. The first step is to react ammonia with oxygen in the presence of a catalyst to form nitrogen monoxide. 4NH3(g) + 5O2(g) 4NO(g) + 6H2O(g) H = –1636 kJ mol–1 Which set of conditions will produce the greatest yield of nitrogen monoxide at equilibrium? temperature pressure A high high B high low C low high D low low
1 marks
Answer: D
This question in 9701/13 May/June 2021
Q115 · The height of the peak of the curve in a Boltzmann distribution represents the number of… 9701/13 May/June 2021
12 The height of the peak of the curve in a Boltzmann distribution represents the number of molecules that have the most probable energy. A sample of gas has its temperature decreased without changing the number of molecules present. Which statement correctly describes a feature of the Boltzmann distribution for the gas when the temperature decreases? A The value of the most probable energy would stay the same. B The number of molecules with the most probable energy would increase. C The area under the molecular energy distribution curve would decrease. D The number of molecules at the very high energy end of the distribution would stay the same.
1 marks
Answer: B
This question in 9701/13 May/June 2021
Q116 · The diagram shows the Boltzmann distribution of energies for a reactant gas 9701/11 Oct/Nov 2021
11 The diagram shows the Boltzmann distribution of energies for a reactant gas. For a particular reaction, the activation energy is X. number of particles with energy, E 0 0 X energy, E Which change to the diagram occurs if an effective catalyst is added at the same temperature? A More particles will possess higher values of E. B The peak will move to the left. C The peak will move to the right. D The value of the activation energy decreases.
1 marks
Answer: D
This question in 9701/11 Oct/Nov 2021
Q117 · The equation for the formation of ammonium chloride is shown 9701/12 Oct/Nov 2021
9 The equation for the formation of ammonium chloride is shown. NH3(g) + HCl (g) NH4Cl (s) H = –314 kJ mol–1 Which diagram shows the correctly labelled reaction pathway diagram for the decomposition of ammonium chloride? A B EA NH3 + HCl NH3 + HCl energy energy EA ∆H ∆H NH4Cl NH4Cl progress of reaction progress of reaction C D NH4Cl EA NH4Cl energy energy EA ∆H ∆H NH3 + HCl NH3 + HCl progress of reaction progress of reaction
1 marks
Answer: B
This question in 9701/12 Oct/Nov 2021
Q118 · The Boltzmann distribution diagram shows a fixed amount of a gas at two different… 9701/12 Oct/Nov 2021
31 The Boltzmann distribution diagram shows a fixed amount of a gas at two different temperatures, T1 and T2. T1 T2 activation energy number of particles with energy, E 0 0 molecular energy, E Which statements correctly describe the features of this diagram? 1 Temperature T1 is lower than temperature T2. 2 The shaded area indicates the particles that have sufficient energy to react at T2. 3 The total area under each curve is the same for both temperatures.
1 marks
Answer: A
This question in 9701/12 Oct/Nov 2021
Q119 · The diagram shows the Boltzmann distribution of energies for a reactant gas 9701/13 Oct/Nov 2021
11 The diagram shows the Boltzmann distribution of energies for a reactant gas. For a particular reaction, the activation energy is X. number of particles with energy, E 0 0 X energy, E Which change to the diagram occurs if an effective catalyst is added at the same temperature? A More particles will possess higher values of E. B The peak will move to the left. C The peak will move to the right. D The value of the activation energy decreases.
1 marks
Answer: D
This question in 9701/13 Oct/Nov 2021
Q120 · The Boltzmann distribution for a gas at a constant temperature of 50 C is shown 9701/11 May/June 2022
15 The Boltzmann distribution for a gas at a constant temperature of 50 C is shown. number of molecules, n 0 0 X Y Z molecular energy If the temperature of the gas is reduced by 10 C, the graph changes shape. What happens to the values of n for the molecular energies X, Y and Z? X Y Z A higher lower higher B higher lower lower C lower higher lower D lower lower lower
1 marks
Answer: B
This question in 9701/11 May/June 2022
Q121 · A synthesis for methanol is shown 9701/12 May/June 2022
13 A synthesis for methanol is shown. CO2 + 3H2 CH3OH + H2O H = – 49 kJ mol–1 Which conditions would produce the greatest yield of methanol at equilibrium? pressure temperature / C A high 80 B high 20 C low 80 D low 20
1 marks
Answer: B
This question in 9701/12 May/June 2022
Q122 · The Haber process for the manufacture of ammonia is represented by the equation shown 9701/12 May/June 2022
16 The Haber process for the manufacture of ammonia is represented by the equation shown. N2(g) + 3H2(g) 2NH3(g) H = – 92 kJ mol–1 Which statement is correct about this reaction when the temperature is increased? A Both forward and backward rates increase. B The backward rate only increases. C The forward rate only increases. D There is no effect on the backward or forward rates.
1 marks
Answer: A
This question in 9701/12 May/June 2022
Q123 · The Boltzmann distribution of the particles in a mixture of gas X and gas Y is shown in… 9701/13 May/June 2022
15 The Boltzmann distribution of the particles in a mixture of gas X and gas Y is shown in diagram 1. diagram 1 percentage of particles 0 0 energy X and Y react and the reaction causes an increase in gas molecules present. The reaction goes to completion. In experiment 1, the increase in volume is measured every 10 seconds. During the reaction, the temperature and pressure remain constant. The increase in volume is shown in the volume–time graph in diagram 2. diagram 2 increase in volume / cm3 0 0 time / s In experiment 2, the experiment is repeated using identical amounts of X and Y. A different temperature is used compared to experiment 1. The same pressure is used. The Boltzmann distribution of the second mixture of X and Y is shown in diagram 3. During the reaction the temperature and pressure remain constant. diagram 3 percentage of particles 0 0 energy Which curve on the volume–time graph would show the increase in volume against time for experiment 2? (The original line for experiment 1 is redrawn as a solid line.) A B increase in volume / cm3 C D 0 0 time / s
1 marks
Answer: D
This question in 9701/13 May/June 2022
Q124 · When the temperature of a particular reaction is increased by 10 C (e.g 9701/13 May/June 2022
16 When the temperature of a particular reaction is increased by 10 C (e.g. from 20 C to 30 C) the rate of the reaction approximately doubles. What is the most significant reason for this increase? A a different mechanism for the reaction B an increased collision frequency of the reactant molecules C more collisions have energy greater than the activation energy D a reduced activation energy for the reaction
1 marks
Answer: C
This question in 9701/13 May/June 2022
Q125 · Measurements are made to determine the activation energy, Ea, of a reaction 9701/11 Oct/Nov 2022
16 Measurements are made to determine the activation energy, Ea, of a reaction. The diagram shows Ea on the Boltzmann distribution at temperature T1. number of molecules 0 0 Ea energy Measurements are then made at a higher temperature, T2. Which diagram correctly shows the Boltzmann distribution and Ea at T2? A B number of number of molecules molecules 0 0 0 Ea 0 Ea energy energy C D number of number of molecules molecules 0 0 0 Ea 0 Ea energy energy
1 marks
Answer: A
This question in 9701/11 Oct/Nov 2022
Q126 · The reaction pathway for the forward reaction of a reversible reaction is shown 9701/12 Oct/Nov 2022
9 The reaction pathway for the forward reaction of a reversible reaction is shown. 30 energy / kJ mol–1 50 progress of reaction Which statement is correct? A The activation energy of the reverse reaction is +80 kJ mol–1. B The enthalpy change for the forward reaction is +30 kJ mol–1. C The enthalpy change for the forward reaction is +50 kJ mol–1. D The enthalpy change for the reverse reaction is +30 kJ mol–1.
1 marks
Answer: A
This question in 9701/12 Oct/Nov 2022
Q127 · The enthalpy changes for the possible reactions W, X, Y and Z are given 9701/12 Oct/Nov 2022
10 The enthalpy changes for the possible reactions W, X, Y and Z are given. W NaOH(aq) + HCl (aq) NaCl (aq) + H2O(l) H o = –56 kJ mol–1 X NaCl (aq) + H2O(l) NaOH(aq) + HCl (aq) H o = +56 kJ mol–1 Y 2HI(g) H2(g) + I2(g) H o = +11 kJ mol–1 Z H2(g) + I2(g) 2HI(g) H o = –11 kJ mol–1 Which statement about the activation energies of these reactions is correct? A X is greater than W; Z is greater than Y. B X is greater than W; Y is greater than Z. C W is greater than X; Z is greater than Y. D W is greater than X; Y is greater than Z.
1 marks
Answer: B
This question in 9701/12 Oct/Nov 2022
Q128 · The Haber process is carried out with a nitrogen partial pressure of 50 kPa, a hydrogen… 9701/12 Oct/Nov 2022
11 The Haber process is carried out with a nitrogen partial pressure of 50 kPa, a hydrogen partial pressure of 150 kPa, a temperature of 400 C and an iron catalyst. N2(g) + 3H2(g) 2NH3(g) If all other conditions are kept the same, which change will result in a raised activation energy? A Both the nitrogen and hydrogen partial pressures are changed to 100 kPa. B The iron is removed. C The nitrogen partial pressure is increased to 150 kPa. D The temperature is increased to 500 C.
1 marks
Answer: B
This question in 9701/12 Oct/Nov 2022
Q129 · Measurements are made to determine the activation energy, Ea, of a reaction 9701/13 Oct/Nov 2022
16 Measurements are made to determine the activation energy, Ea, of a reaction. The diagram shows Ea on the Boltzmann distribution at temperature T1. number of molecules 0 0 Ea energy Measurements are then made at a higher temperature, T2. Which diagram correctly shows the Boltzmann distribution and Ea at T2? A B number of number of molecules molecules 0 0 0 Ea 0 Ea energy energy C D number of number of molecules molecules 0 0 0 Ea 0 Ea energy energy
1 marks
Answer: A
This question in 9701/13 Oct/Nov 2022
Q130 · The diagram shows the Boltzmann distribution for one mole of a gas 9701/12 Feb/March 2023
2 The diagram shows the Boltzmann distribution for one mole of a gas. The gas takes part in a reaction with an activation energy, Ea. P number of particles with energy, E 0 0 Ea energy, E Which statement correctly describes the effect of an increase in temperature? A Peak P will be higher and fewer molecules will have energy > Ea. B Peak P will be higher and more molecules will have energy > Ea. C Peak P will be lower and fewer molecules will have energy > Ea. D Peak P will be lower and more molecules will have energy > Ea.
1 marks
Answer: D
This question in 9701/12 Feb/March 2023
Q131 · For a particular reversible reaction the backward reaction is endothermic 9701/13 May/June 2023
19 For a particular reversible reaction the backward reaction is endothermic. The activation energy of the backward reaction is 160kJmol−1. It can be assumed that the backward reaction proceeds by a mechanism that is the exact reverse of the mechanism for the forward reaction. Which statement about the activation energy of the forward reaction is correct? A The activation energy of the forward reaction is equal to −160kJmol−1. B The activation energy of the forward reaction is 0 kJ mol−1 but less than +160 kJ mol−1. C The activation energy of the forward reaction is equal to +160kJmol−1. D The activation energy of the forward reaction is greater than +160kJmol−1.
1 marks
Answer: B
This question in 9701/13 May/June 2023
Q132 · The diagram shows the Boltzmann distribution of the energy of gaseous molecules at a… 9701/13 May/June 2023
21 The diagram shows the Boltzmann distribution of the energy of gaseous molecules at a particular temperature. proportion of molecules Y with energy E X 00 molecular energy E Which statement is correct? A If the temperature of the gas is raised, the height of the maximum of the curve increases. B If the temperature of the gas is raised, the maximum of the curve moves to the right. C The length of the line labelled X shows the activation energy for the reaction. D The length of the line labelled Y shows the enthalpy change of the reaction.
1 marks
Answer: B
This question in 9701/13 May/June 2023
Q133 · The forward reaction of a reversible reaction is exothermic and has an activation energy… 9701/11 Oct/Nov 2023
15 The forward reaction of a reversible reaction is exothermic and has an activation energy of +30kJmol–1. The reverse reaction proceeds by a mechanism that is the exact reverse of the mechanism of the forward reaction. Which statement about the activation energy of the reverse reaction is correct? A The activation energy for the reverse reaction is equal to –30kJmol–1. The activation energy for the reverse reaction is greater than 0kJmol–1 but less than B +30kJmol–1. C The activation energy for the reverse reaction is equal to +30kJmol–1. D The activation energy for the reverse reaction is greater than +30kJmol–1.
1 marks
Answer: D
This question in 9701/11 Oct/Nov 2023
Q134 · The forward reaction of a reversible reaction is exothermic and has an activation energy… 9701/13 Oct/Nov 2023
15 The forward reaction of a reversible reaction is exothermic and has an activation energy of +30kJmol–1. The reverse reaction proceeds by a mechanism that is the exact reverse of the mechanism of the forward reaction. Which statement about the activation energy of the reverse reaction is correct? A The activation energy for the reverse reaction is equal to –30kJmol–1. The activation energy for the reverse reaction is greater than 0kJmol–1 but less than B +30kJmol–1. C The activation energy for the reverse reaction is equal to +30kJmol–1. D The activation energy for the reverse reaction is greater than +30kJmol–1.
1 marks
Answer: D
This question in 9701/13 Oct/Nov 2023
Q135 · Two experiments are carried out to study the reaction between zinc and sulfuric acid 9701/12 Feb/March 2024
15 Two experiments are carried out to study the reaction between zinc and sulfuric acid. experiment 1 Small lumps of zinc are added to excess dilute sulfuric acid. experiment 2 The reaction is carried out at a lower temperature and with one other change. Both experiments produce the same total volume of gas and are completed in the same time. What is the second change made in experiment 2? A A catalyst is added. B A greater mass of zinc is added. C A greater volume of sulfuric acid is added. D Larger lumps of zinc are used.
1 marks
Answer: A
This question in 9701/12 Feb/March 2024
Q136 · For a certain endothermic reaction, the activation energy is numerically equal to twice… 9701/11 May/June 2024
10 For a certain endothermic reaction, the activation energy is numerically equal to twice the enthalpy change of reaction. Which reaction pathway diagram is correct for this reaction? A B energy energy progress of reaction progress of reaction C D energy energy progress of reaction progress of reaction
1 marks
Answer: B
This question in 9701/11 May/June 2024
Q137 · The Boltzmann distribution for the hydrogenation of an alkene at a particular temperature… 9701/11 May/June 2024
15 The Boltzmann distribution for the hydrogenation of an alkene at a particular temperature in the absence of a catalyst is shown. proportion of molecules Ea with energy E 0 0 molecular energy E Which row correctly describes the effects of adding a nickel catalyst to the reaction vessel? the shape of the activation energy, Ea Boltzmann distribution A changes decreases B changes increases C does not change decreases D does not change increases
1 marks
Answer: C
This question in 9701/11 May/June 2024
Q138 · The volume of ammonia produced against time is measured in two experiments 9701/12 May/June 2024
13 The volume of ammonia produced against time is measured in two experiments. N2(g) + 3H2(g) 2NH3(g) ∆H = –92 kJ mol–1 In experiment 1, 3 mol of H2(g) and 1 mol of N2(g) react together at 45 C and a pressure of 200 atm. A graph showing the volume of ammonia produced against time is plotted. Experiment 2 is then performed. Experiment 2 differs from experiment 1 in one condition only. experiment 1 experiment 2 volume of NH3 0 0 time How does experiment 2 differ from experiment 1? A An iron catalyst is present in experiment 2. B 2 mol of helium gas is present in the reaction mixture in experiment 2. C A pressure of 250 atm is used in experiment 2. D A temperature of 600 C is used in experiment 2.
1 marks
Answer: D
This question in 9701/12 May/June 2024
Q139 · Gas Q decomposes slowly at room temperature 9701/12 May/June 2024
15 Gas Q decomposes slowly at room temperature. Q(g) X(g) + Z(g) The Boltzmann distribution curve for gas Q at room temperature is shown. number of particles 0 0 Ea energy Which change occurs when a catalyst is added to gas Q? A The peak of the curve moves to the right on the diagram. B The number of particles with enough energy to decompose increases. C The kinetic energy of the unreacted particles increases. D The value of Ea decreases, moving the vertical dotted line to the right on the diagram.
1 marks
Answer: B
This question in 9701/12 May/June 2024
Q140 · In the high temperatures of car engines, nitrogen reacts with oxygen to produce nitrogen… 9701/13 May/June 2024
10 In the high temperatures of car engines, nitrogen reacts with oxygen to produce
nitrogen monoxide.
+No(g) + 40.(g) > NO(g) AH° = +90kJ mol"
2
This reaction has activation energy Ea.
Which reaction pathway diagram correctly represents this reaction?
extent of reaction extent of reaction
energy
extent of reaction extent of reaction
1 marks
Answer: C
This question in 9701/13 May/June 2024
Q141 · In the diagram, X is the Boltzmann distribution for the energies of the particles in a… 9701/13 May/June 2024
15 In the diagram, X is the Boltzmann distribution for the energies of the particles in a reaction and EA1 is the activation energy for that reaction. EA2 EA1 number of molecules Z X Y 0 0 molecular energy Which statement is correct? A EA2 is the activation energy at a higher temperature. B EA2 is the activation energy at a lower temperature. C Y is the Boltzmann distribution at a lower temperature. D Z is the Boltzmann distribution at a higher temperature.
1 marks
Answer: C
This question in 9701/13 May/June 2024
Q142 · The diagram shows a Boltzmann distribution curve 9701/11 Oct/Nov 2024
15 The diagram shows a Boltzmann distribution curve. The axes are not labelled. point Y point X EA Points X and Y are points on the vertical axis. What is represented by both points X and Y? point X point Y A number of molecules largest number of molecules with energy equal to EA with the same energy B number of molecules with largest number of molecules energy equal to or greater than EA with the same energy C number of molecules the amount of energy of the with energy equal to EA greatest number of molecules D number of molecules with the amount of energy of the energy equal to or greater than EA greatest number of molecules
1 marks
Answer: A
This question in 9701/11 Oct/Nov 2024
Q143 · The Boltzmann distribution for a mixture of gases capable of reaction is shown 9701/12 Oct/Nov 2024
16 The Boltzmann distribution for a mixture of gases capable of reaction is shown. The two curves represent the mixture of gases at 25 C and at 35 C. The activation energies for the catalysed and uncatalysed reactions are shown. Ea catalysed number of particles w Ea uncatalysed x y 0 0 z energy Which row is correct? number of particles with number of particles with enough energy to react at 25 C enough energy to react at 35 C in the catalysed reaction in the uncatalysed reaction A w + x + y + z z B w + x + y + z x + z C y + z z D y + z x + z
1 marks
Answer: D
This question in 9701/12 Oct/Nov 2024
Q144 · The diagram shows a Boltzmann distribution curve 9701/13 Oct/Nov 2024
15 The diagram shows a Boltzmann distribution curve. The axes are not labelled. point Y point X EA Points X and Y are points on the vertical axis. What is represented by both points X and Y? point X point Y A number of molecules largest number of molecules with energy equal to EA with the same energy B number of molecules with largest number of molecules energy equal to or greater than EA with the same energy C number of molecules the amount of energy of the with energy equal to EA greatest number of molecules D number of molecules with the amount of energy of the energy equal to or greater than EA greatest number of molecules
1 marks
Answer: A
This question in 9701/13 Oct/Nov 2024
Q145 · A Boltzmann distribution for a sample of a reacting gas at a constant temperature is shown 9701/12 Feb/March 2025
1 A Boltzmann distribution for a sample of a reacting gas at a constant temperature is shown. The activation energy, EA, for the reaction is marked. Point shows the number of particles whose energy is equal to the activation energy. The temperature of the sample of gas is decreased. The shape of the distribution curve changes. Which point could show the number of particles whose energy is the same as the activation energy at the new temperature? number of B particles A C D EA energy
1 marks
Answer: D
This question in 9701/12 Feb/March 2025
Q146 · A possible mechanism for the exothermic hydrolysis of 2-chloro-2-methylpropane is shown 9701/11 May/June 2025
33 A possible mechanism for the exothermic hydrolysis of 2-chloro-2-methylpropane is shown. CH3 C Cl CH3 CH3 CH3 C Cl– CH3 CH3 + CH3 C CH3 CH3 CH3 C CH3 CH3 slow fast OH– + OH + + Which diagram represents the reaction pathway diagram for this mechanism? reaction pathway energy reaction pathway energy reaction pathway energy reaction pathway energy A B C D
1 marks
Answer: B
This question in 9701/11 May/June 2025
Q147 · The diagram shows a Boltzmann distribution of molecular energies for a gaseous reaction… 9701/12 May/June 2025
3 The diagram shows a Boltzmann distribution of molecular energies for a gaseous reaction at two different temperatures and two different activation energies. T1 T2 proportion of molecules EA(1) EA(2) energy / kJ mol–1 Which combination of temperature and activation energy will give the highest reaction rate? A T1 and EA(1) B T1 and EA(2) C T2 and EA(2) D T2 and EA(1)
1 marks
Answer: D
This question in 9701/12 May/June 2025
Q148 · Under certain conditions, CCl 4 and H2O react as shown 9701/12 May/June 2025
13 Under certain conditions, CCl 4 and H2O react as shown. The activation energy for the reaction is +62 kJ mol–1. CCl 4 + 2H2O CO2 + 4HCl H = –61.5 kJ mol–1 Which enthalpy profile diagram best fits this reaction? A B CCl 4 + 2H2O CO2 + 4HCl enthalpy CO2 + 4HCl enthalpy CCl 4 + 2H2O reaction path reaction path C D CO2 + 4HCl CCl 4 + 2H2O enthalpy enthalpy CO2 + 4HCl CCl 4 + 2H2O reaction path reaction path
1 marks
Answer: D
This question in 9701/12 May/June 2025
Q149 · The reaction pathway for a reaction 9701/13 May/June 2025
2 Diagram 1 shows the reaction pathway for a reaction. Diagram 2 shows a graph of concentration of reactant against time for the same reaction. reactants products EA enthalpy reaction progress diagram 1 concentration time diagram 2 Which diagrams, drawn to the same scale, show the effect of increased temperature on this reaction? reactants products EA enthalpy A reaction progress concentration time reactants products EA enthalpy B reaction progress concentration time reactants products EA enthalpy C reaction progress concentration time reactants products EA enthalpy D reaction progress concentration time
1 marks
Answer: C
This question in 9701/13 May/June 2025
Q150 · The gaseous compound Z decomposes on heating 9701/13 May/June 2025
7 The gaseous compound Z decomposes on heating. In the diagram, Boltzmann distributions for Z at two different temperatures, P and Q, are shown. The lines X and Y indicate activation energies for the decomposition of Z with and without a catalyst. 0 0 molecular energy number of molecules X Y P Q Which curve and which line describe the decomposition of Z at a higher temperature and with a catalyst present? higher temperature catalyst present A P X B P Y C Q X D Q Y
1 marks
Answer: C
This question in 9701/13 May/June 2025
Q151 · The distribution of molecular energies in an ideal gas can be represented in a Boltzmann… 9701/14 May/June 2025
8 The distribution of molecular energies in an ideal gas can be represented in a Boltzmann distribution. Which change in conditions leads to a larger value for the number of molecules that have the most probable energy? A keeping the temperature constant but decreasing the pressure B keeping the pressure constant but decreasing the temperature C keeping the temperature constant but increasing the pressure D keeping the pressure constant but increasing the temperature
1 marks
Answer: B
This question in 9701/14 May/June 2025
Q152 · The reversible reaction between methanol and ethanoic acid liquids is catalysed by adding… 9701/11 Oct/Nov 2025
15 The reversible reaction between methanol and ethanoic acid liquids is catalysed by adding a small volume of concentrated sulfuric acid. Two statements about this reaction are listed. 1 The sulfuric acid is a homogeneous catalyst. 2 The sulfuric acid lowers the activation energy of the reverse reaction. Which statements are correct? A both 1 and 2 B 1 only C 2 only D neither 1 nor 2
1 marks
Answer: A
This question in 9701/11 Oct/Nov 2025
Q153 · Which reaction pathway diagram shows an endothermic reaction that occurs in two steps and… 9701/12 Oct/Nov 2025
15 Which reaction pathway diagram shows an endothermic reaction that occurs in two steps and in which the second step of the reaction is likely to be faster than the first? A B energy energy extent of reaction extent of reaction C D energy energy extent of reaction extent of reaction
1 marks
Answer: C
This question in 9701/12 Oct/Nov 2025
Q154 · The reversible reaction between methanol and ethanoic acid liquids is catalysed by adding… 9701/13 Oct/Nov 2025
15 The reversible reaction between methanol and ethanoic acid liquids is catalysed by adding a small volume of concentrated sulfuric acid. Two statements about this reaction are listed. 1 The sulfuric acid is a homogeneous catalyst. 2 The sulfuric acid lowers the activation energy of the reverse reaction. Which statements are correct? A both 1 and 2 B 1 only C 2 only D neither 1 nor 2
1 marks
Answer: A
This question in 9701/13 Oct/Nov 2025
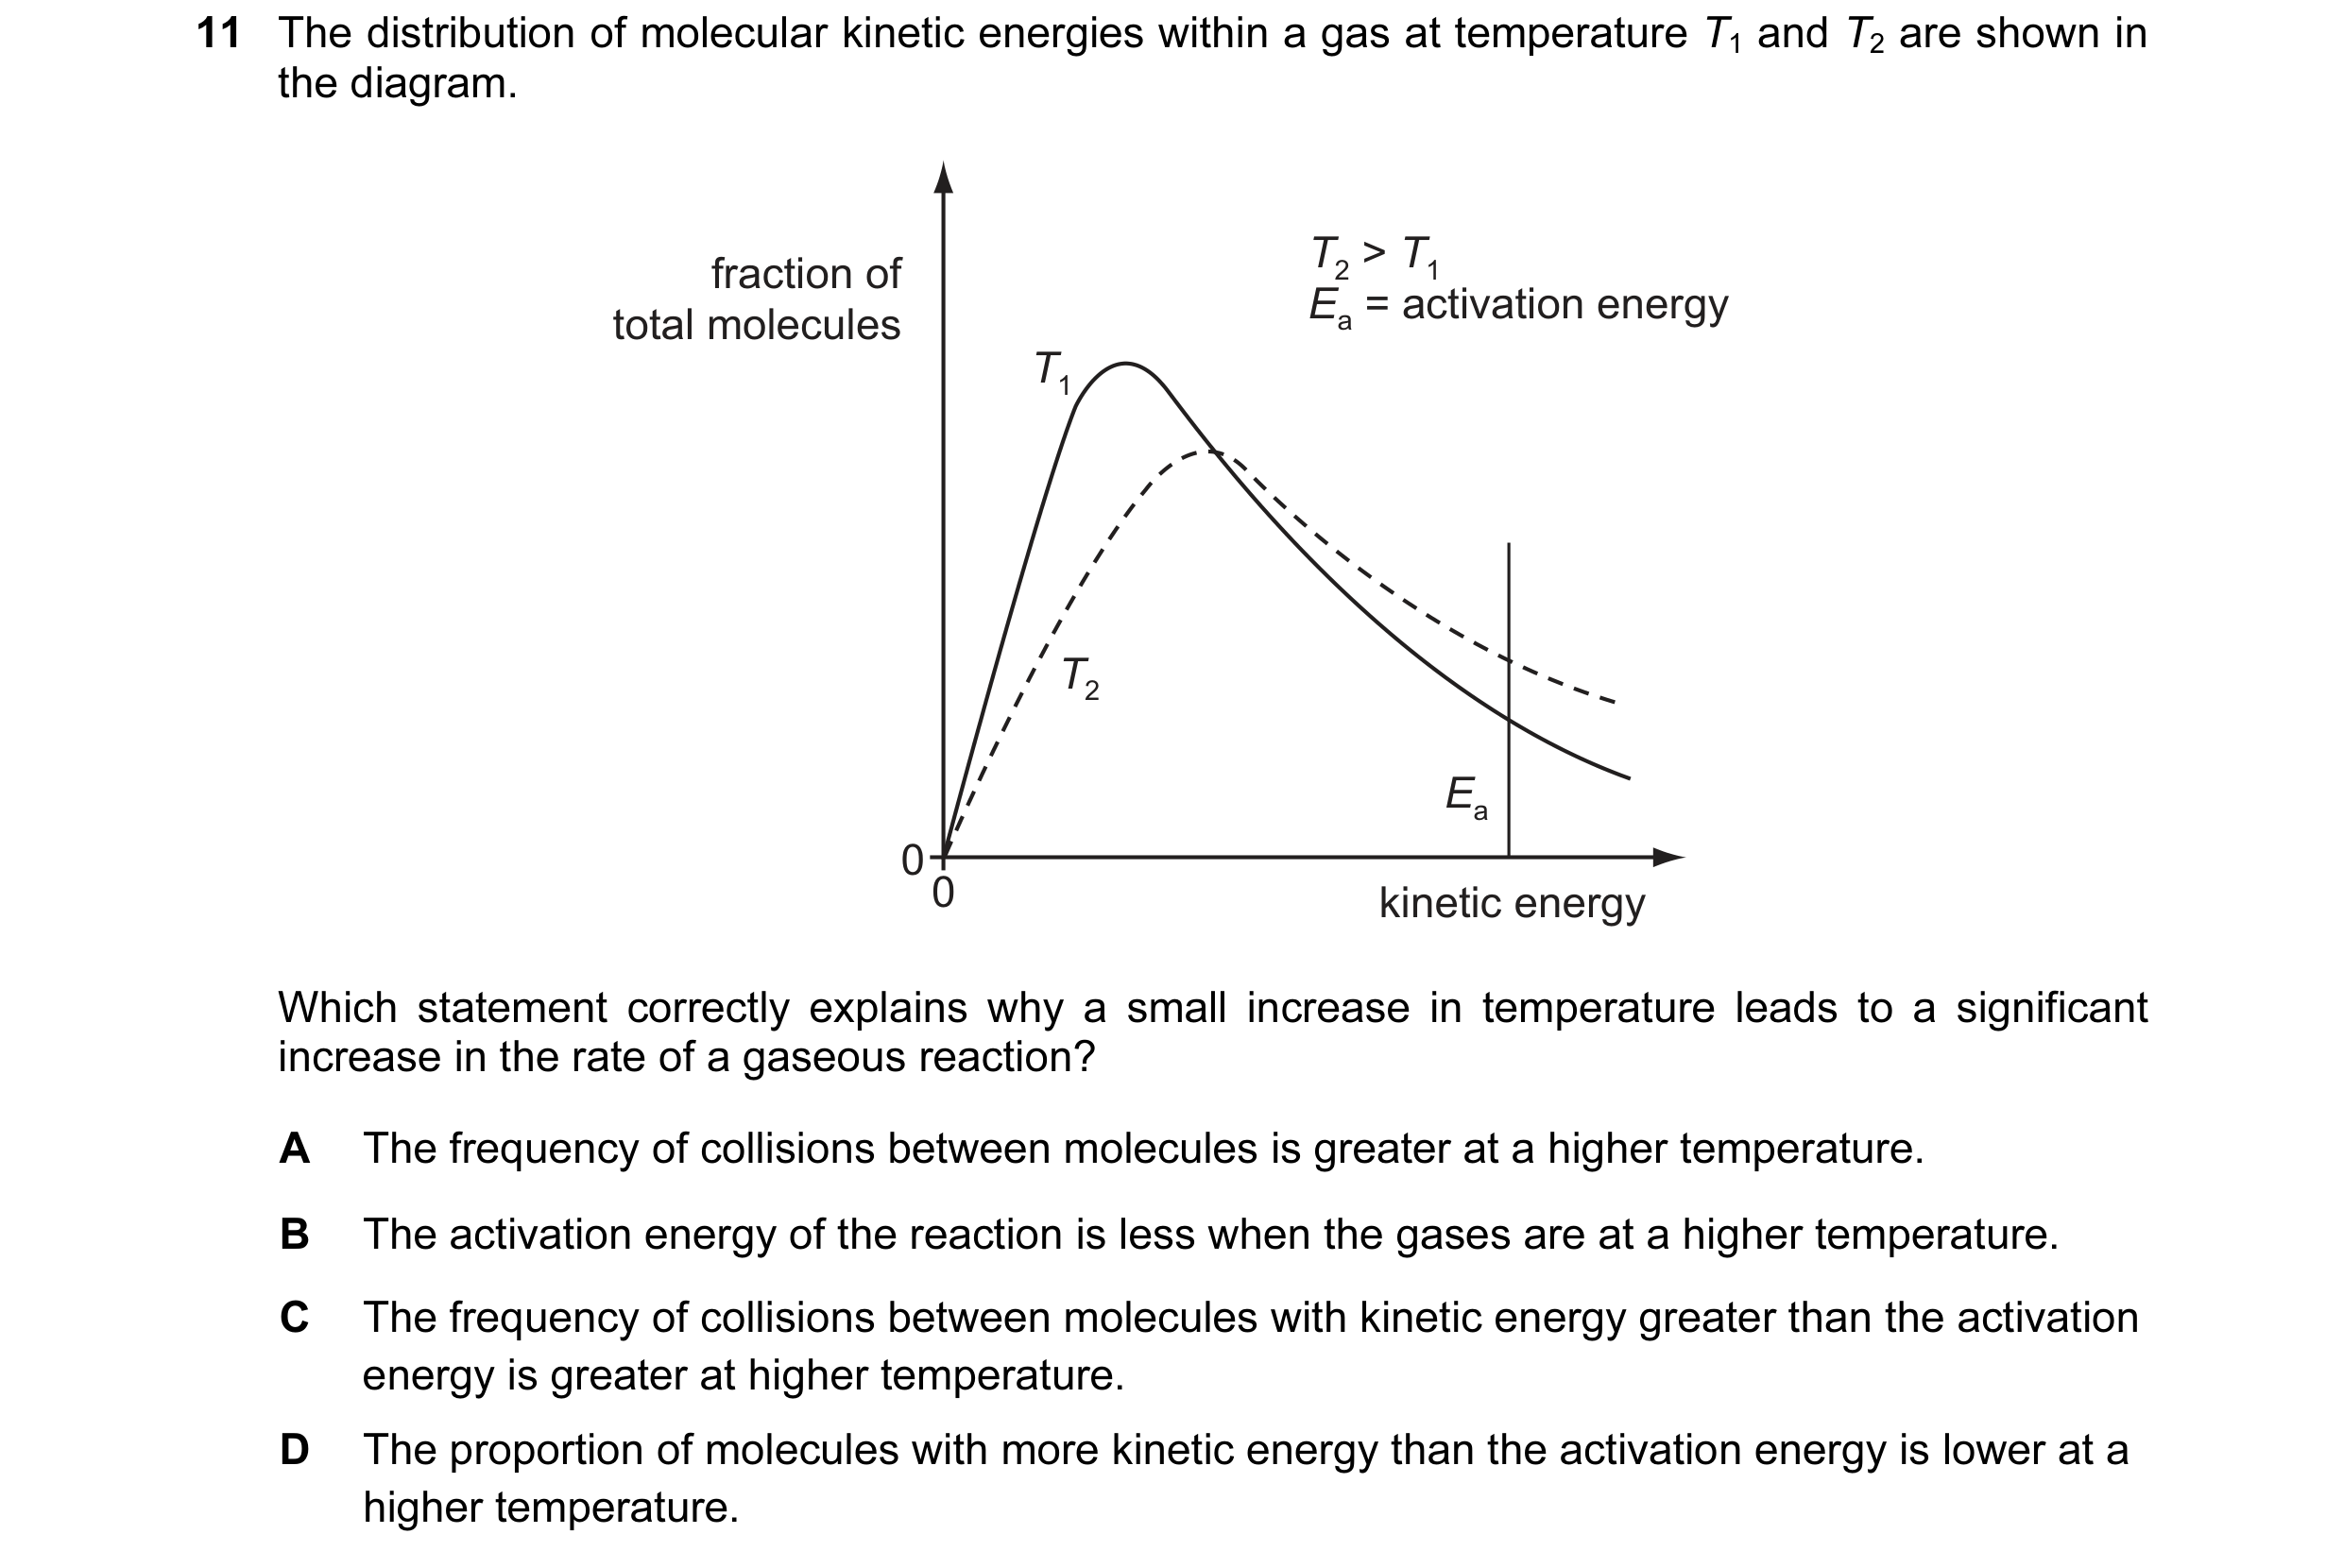
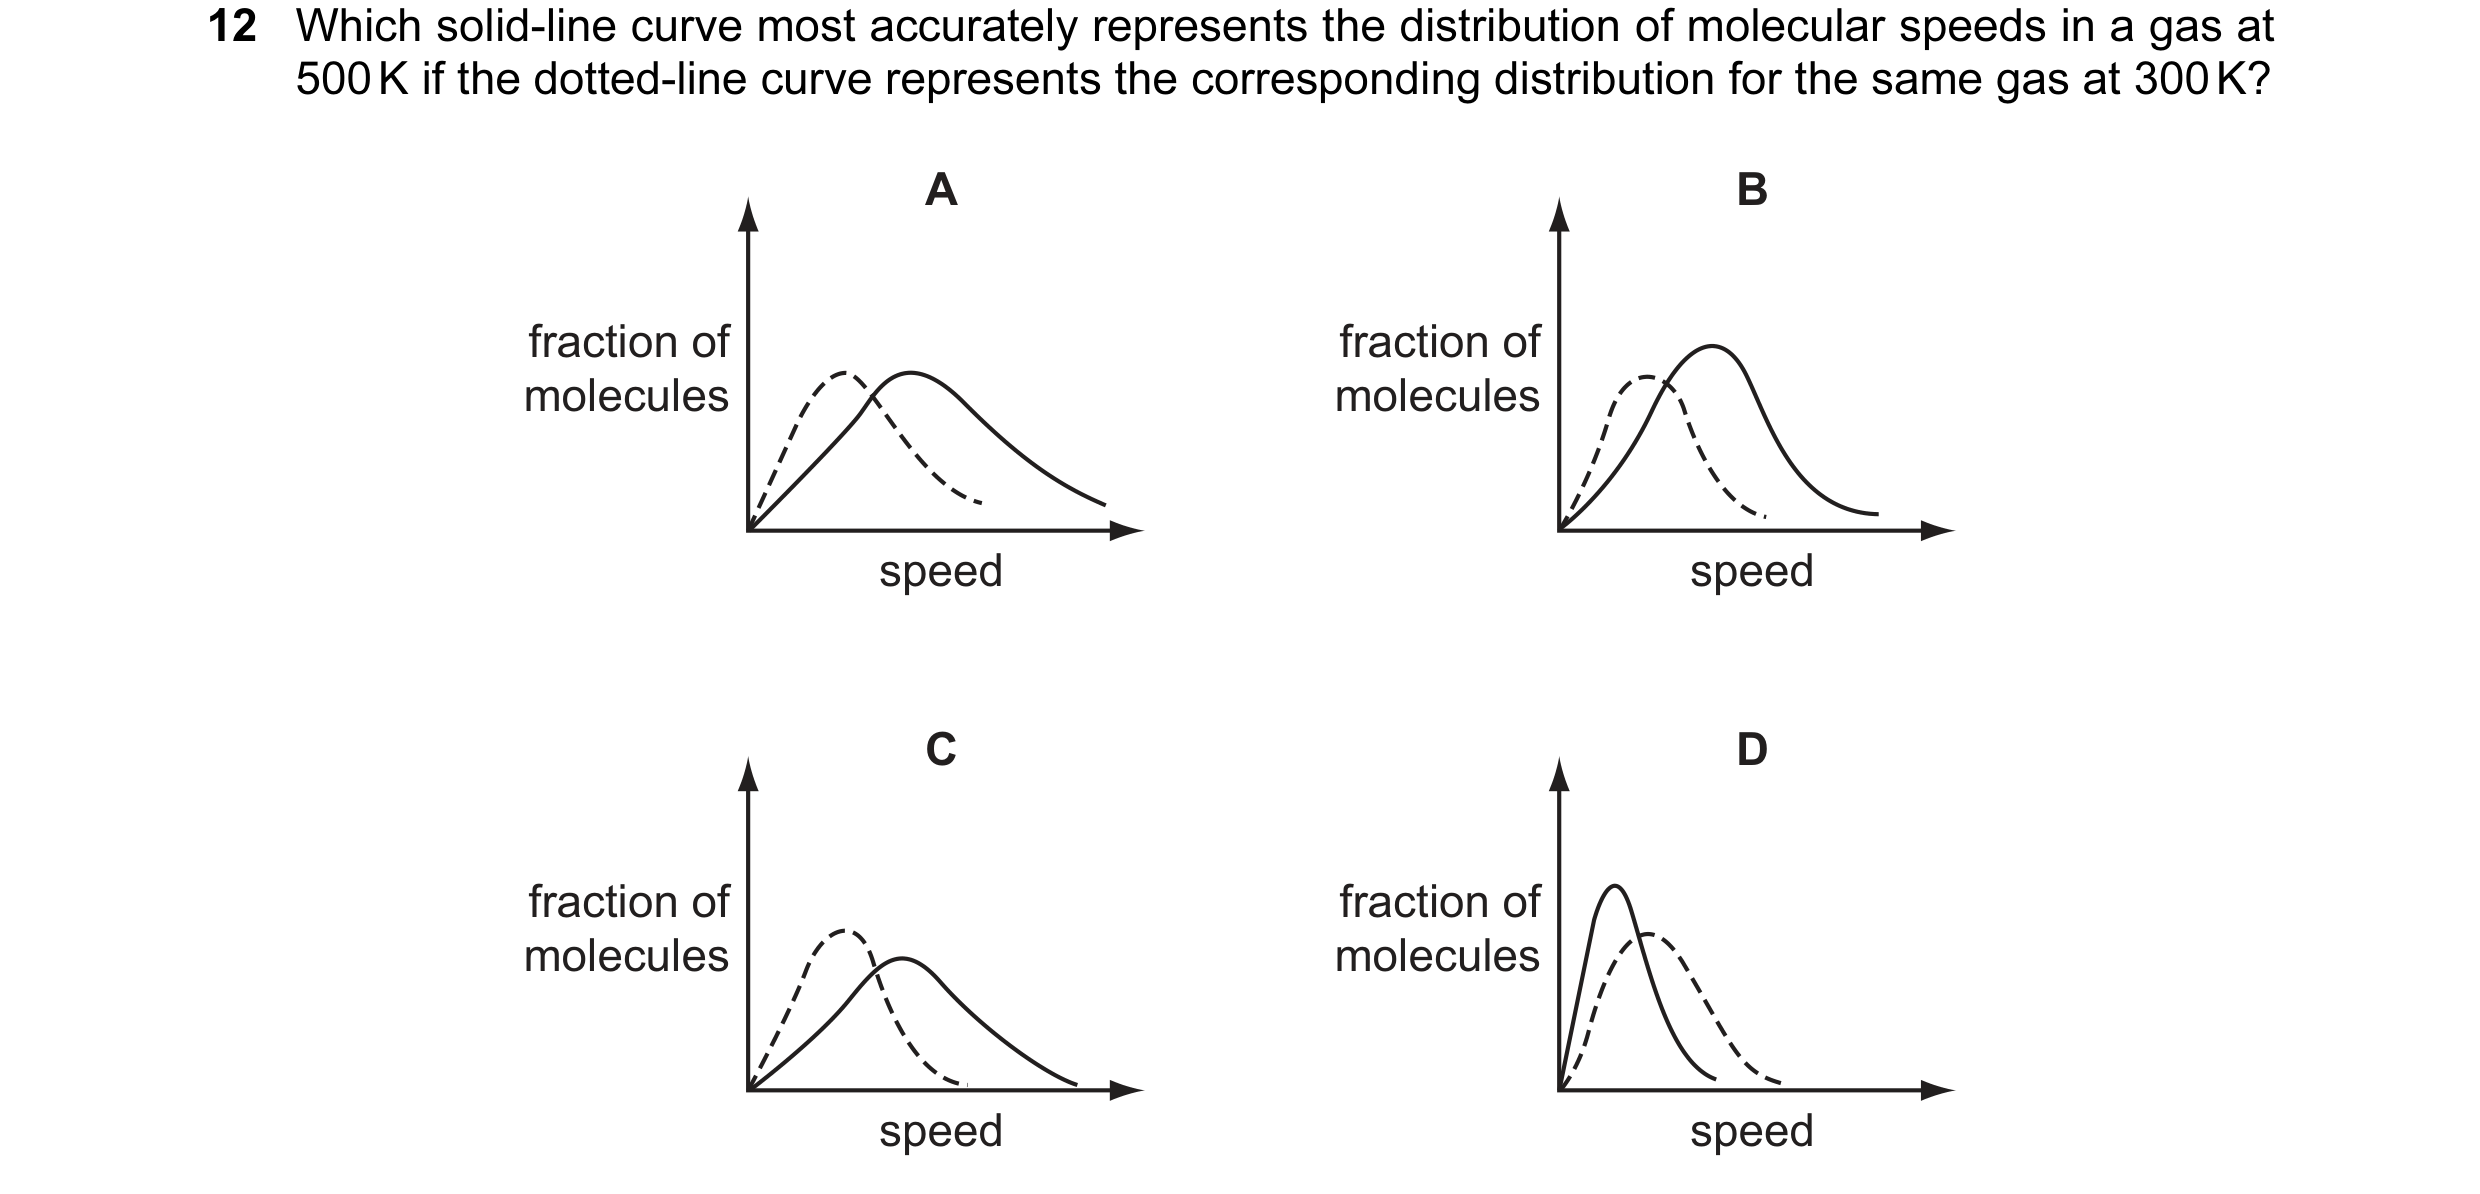 1 / 67

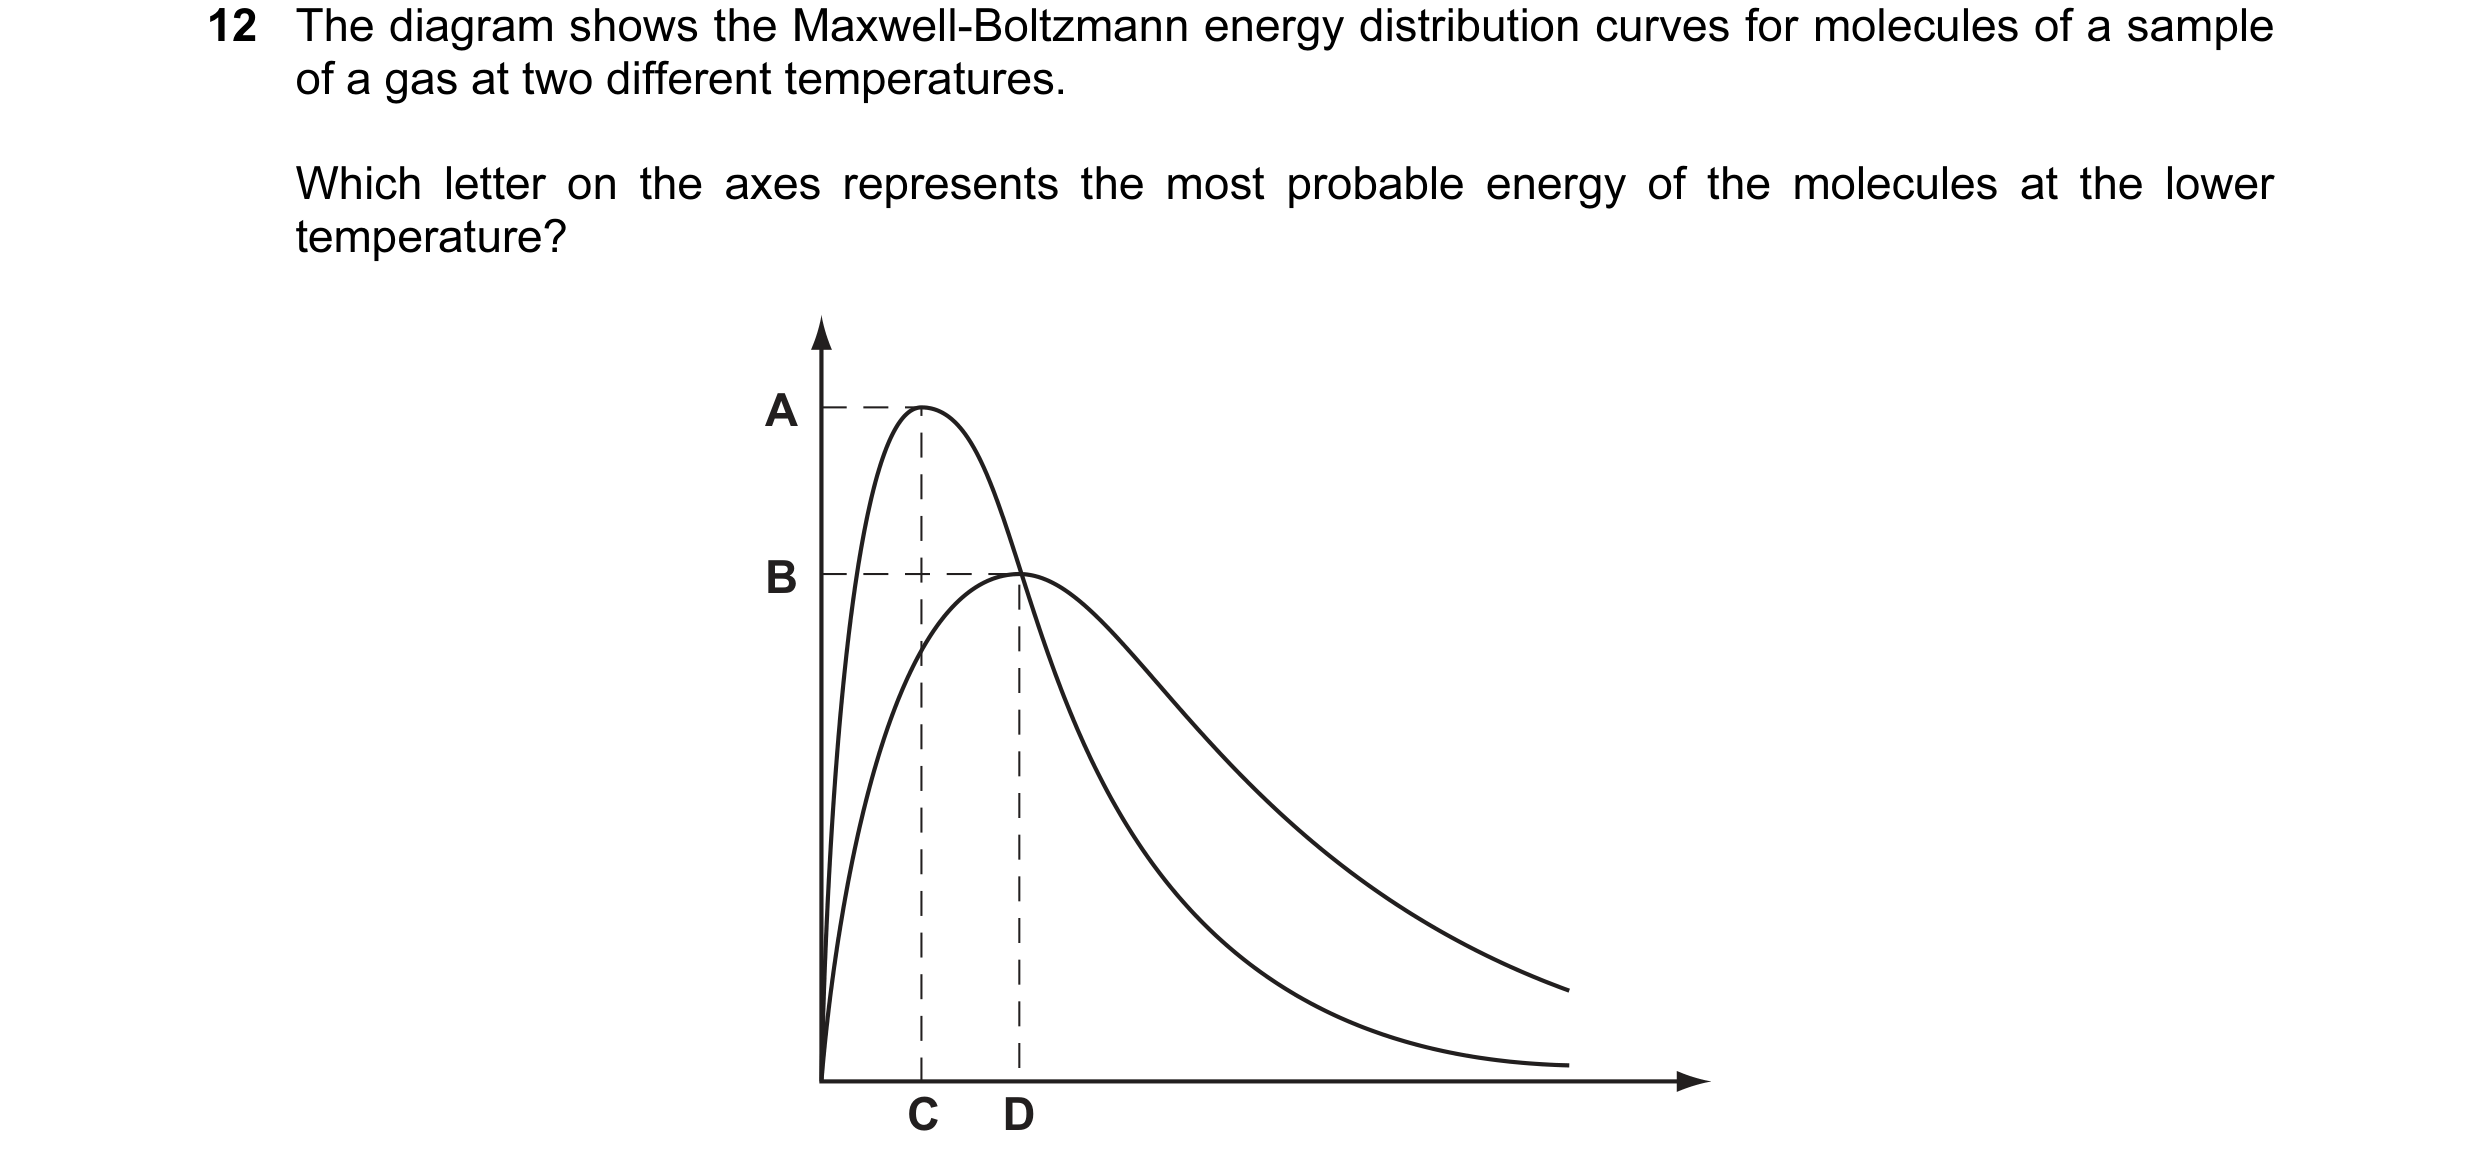
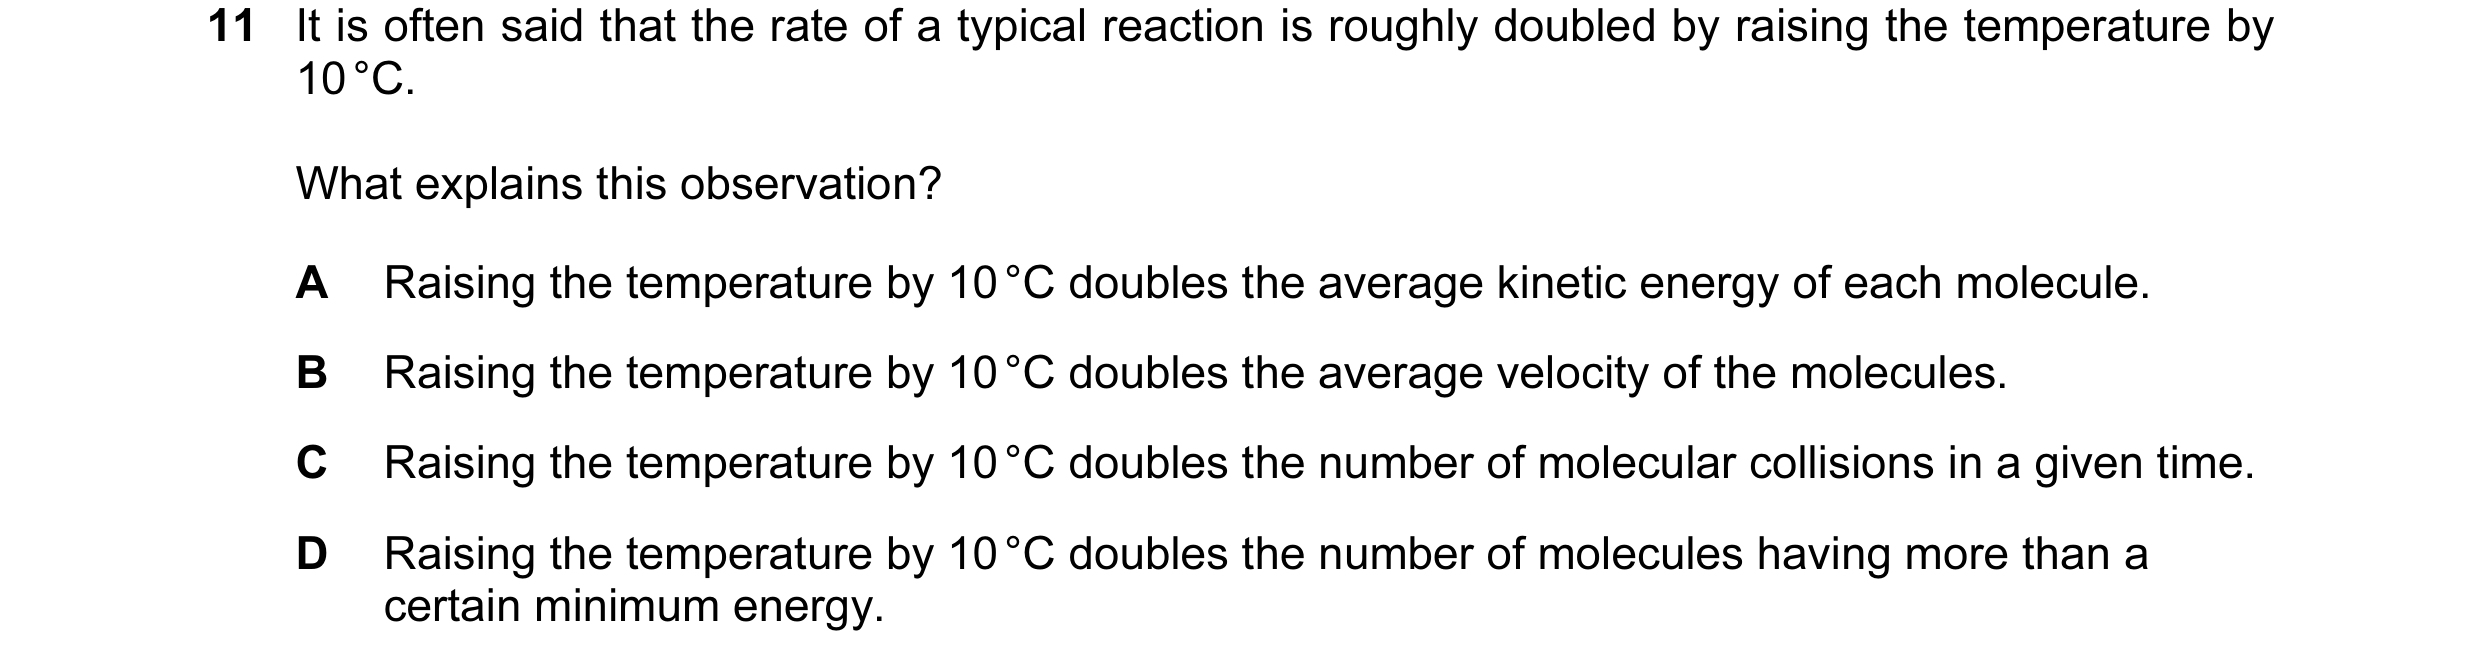 2 / 67
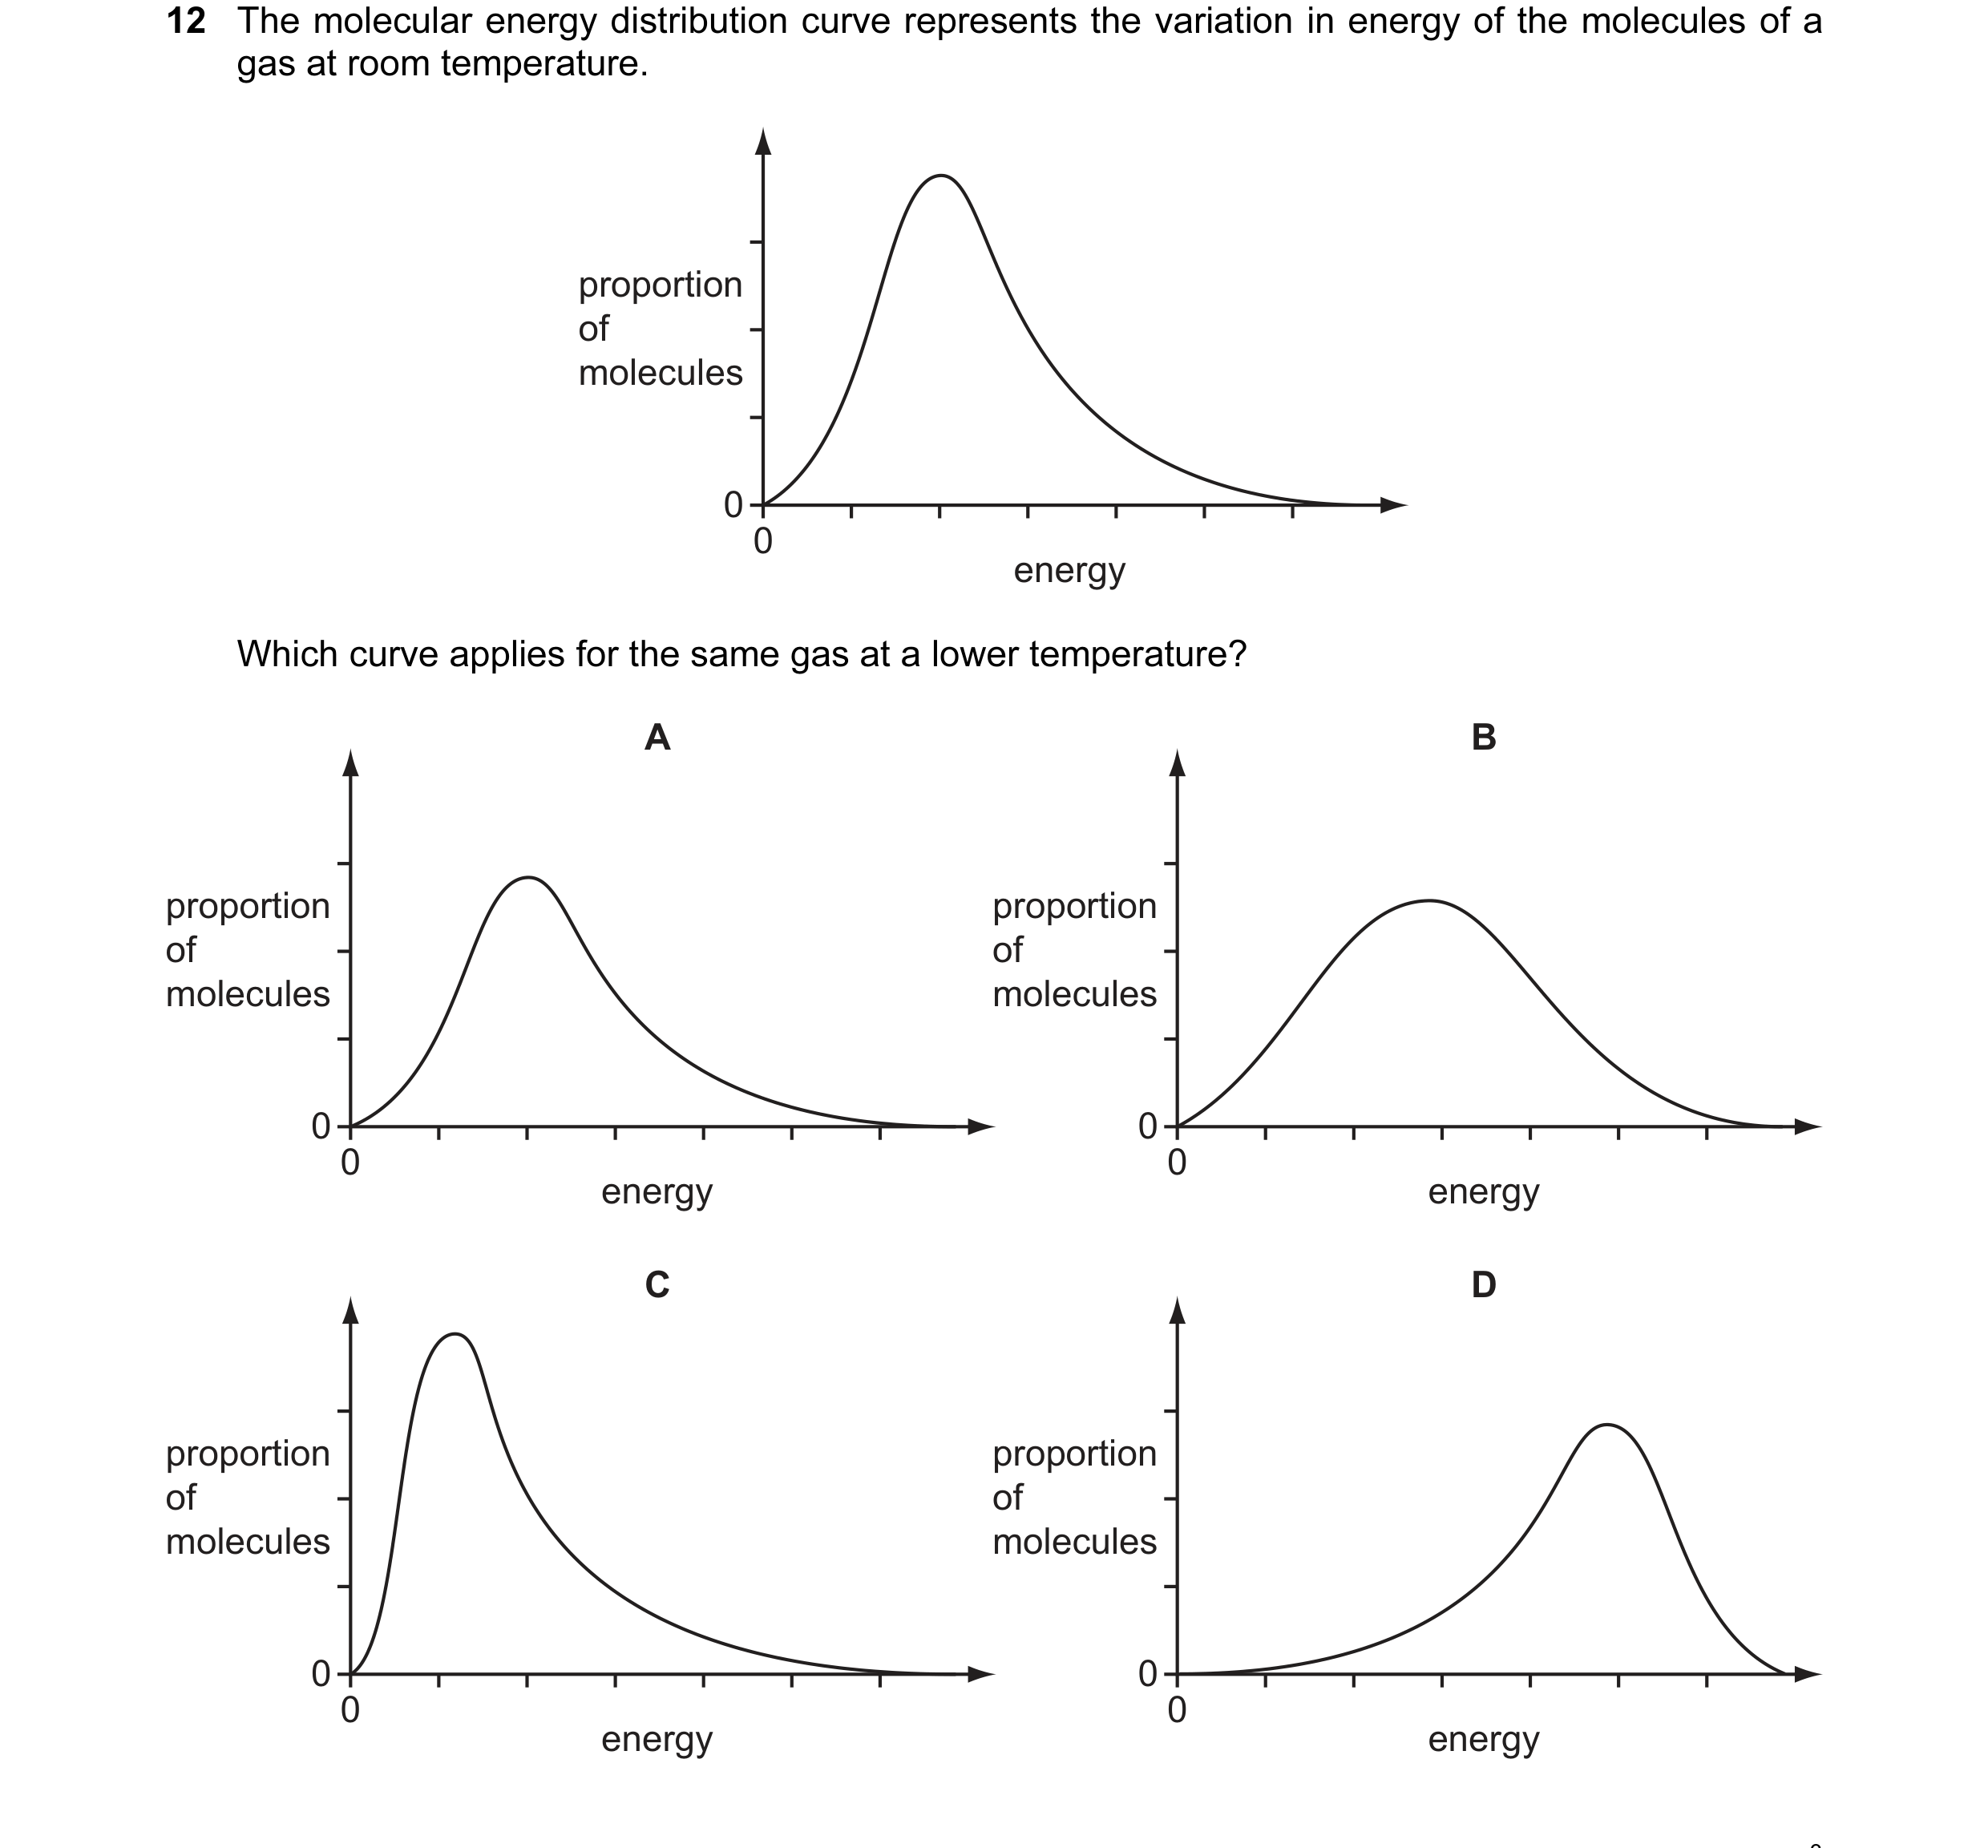 3 / 67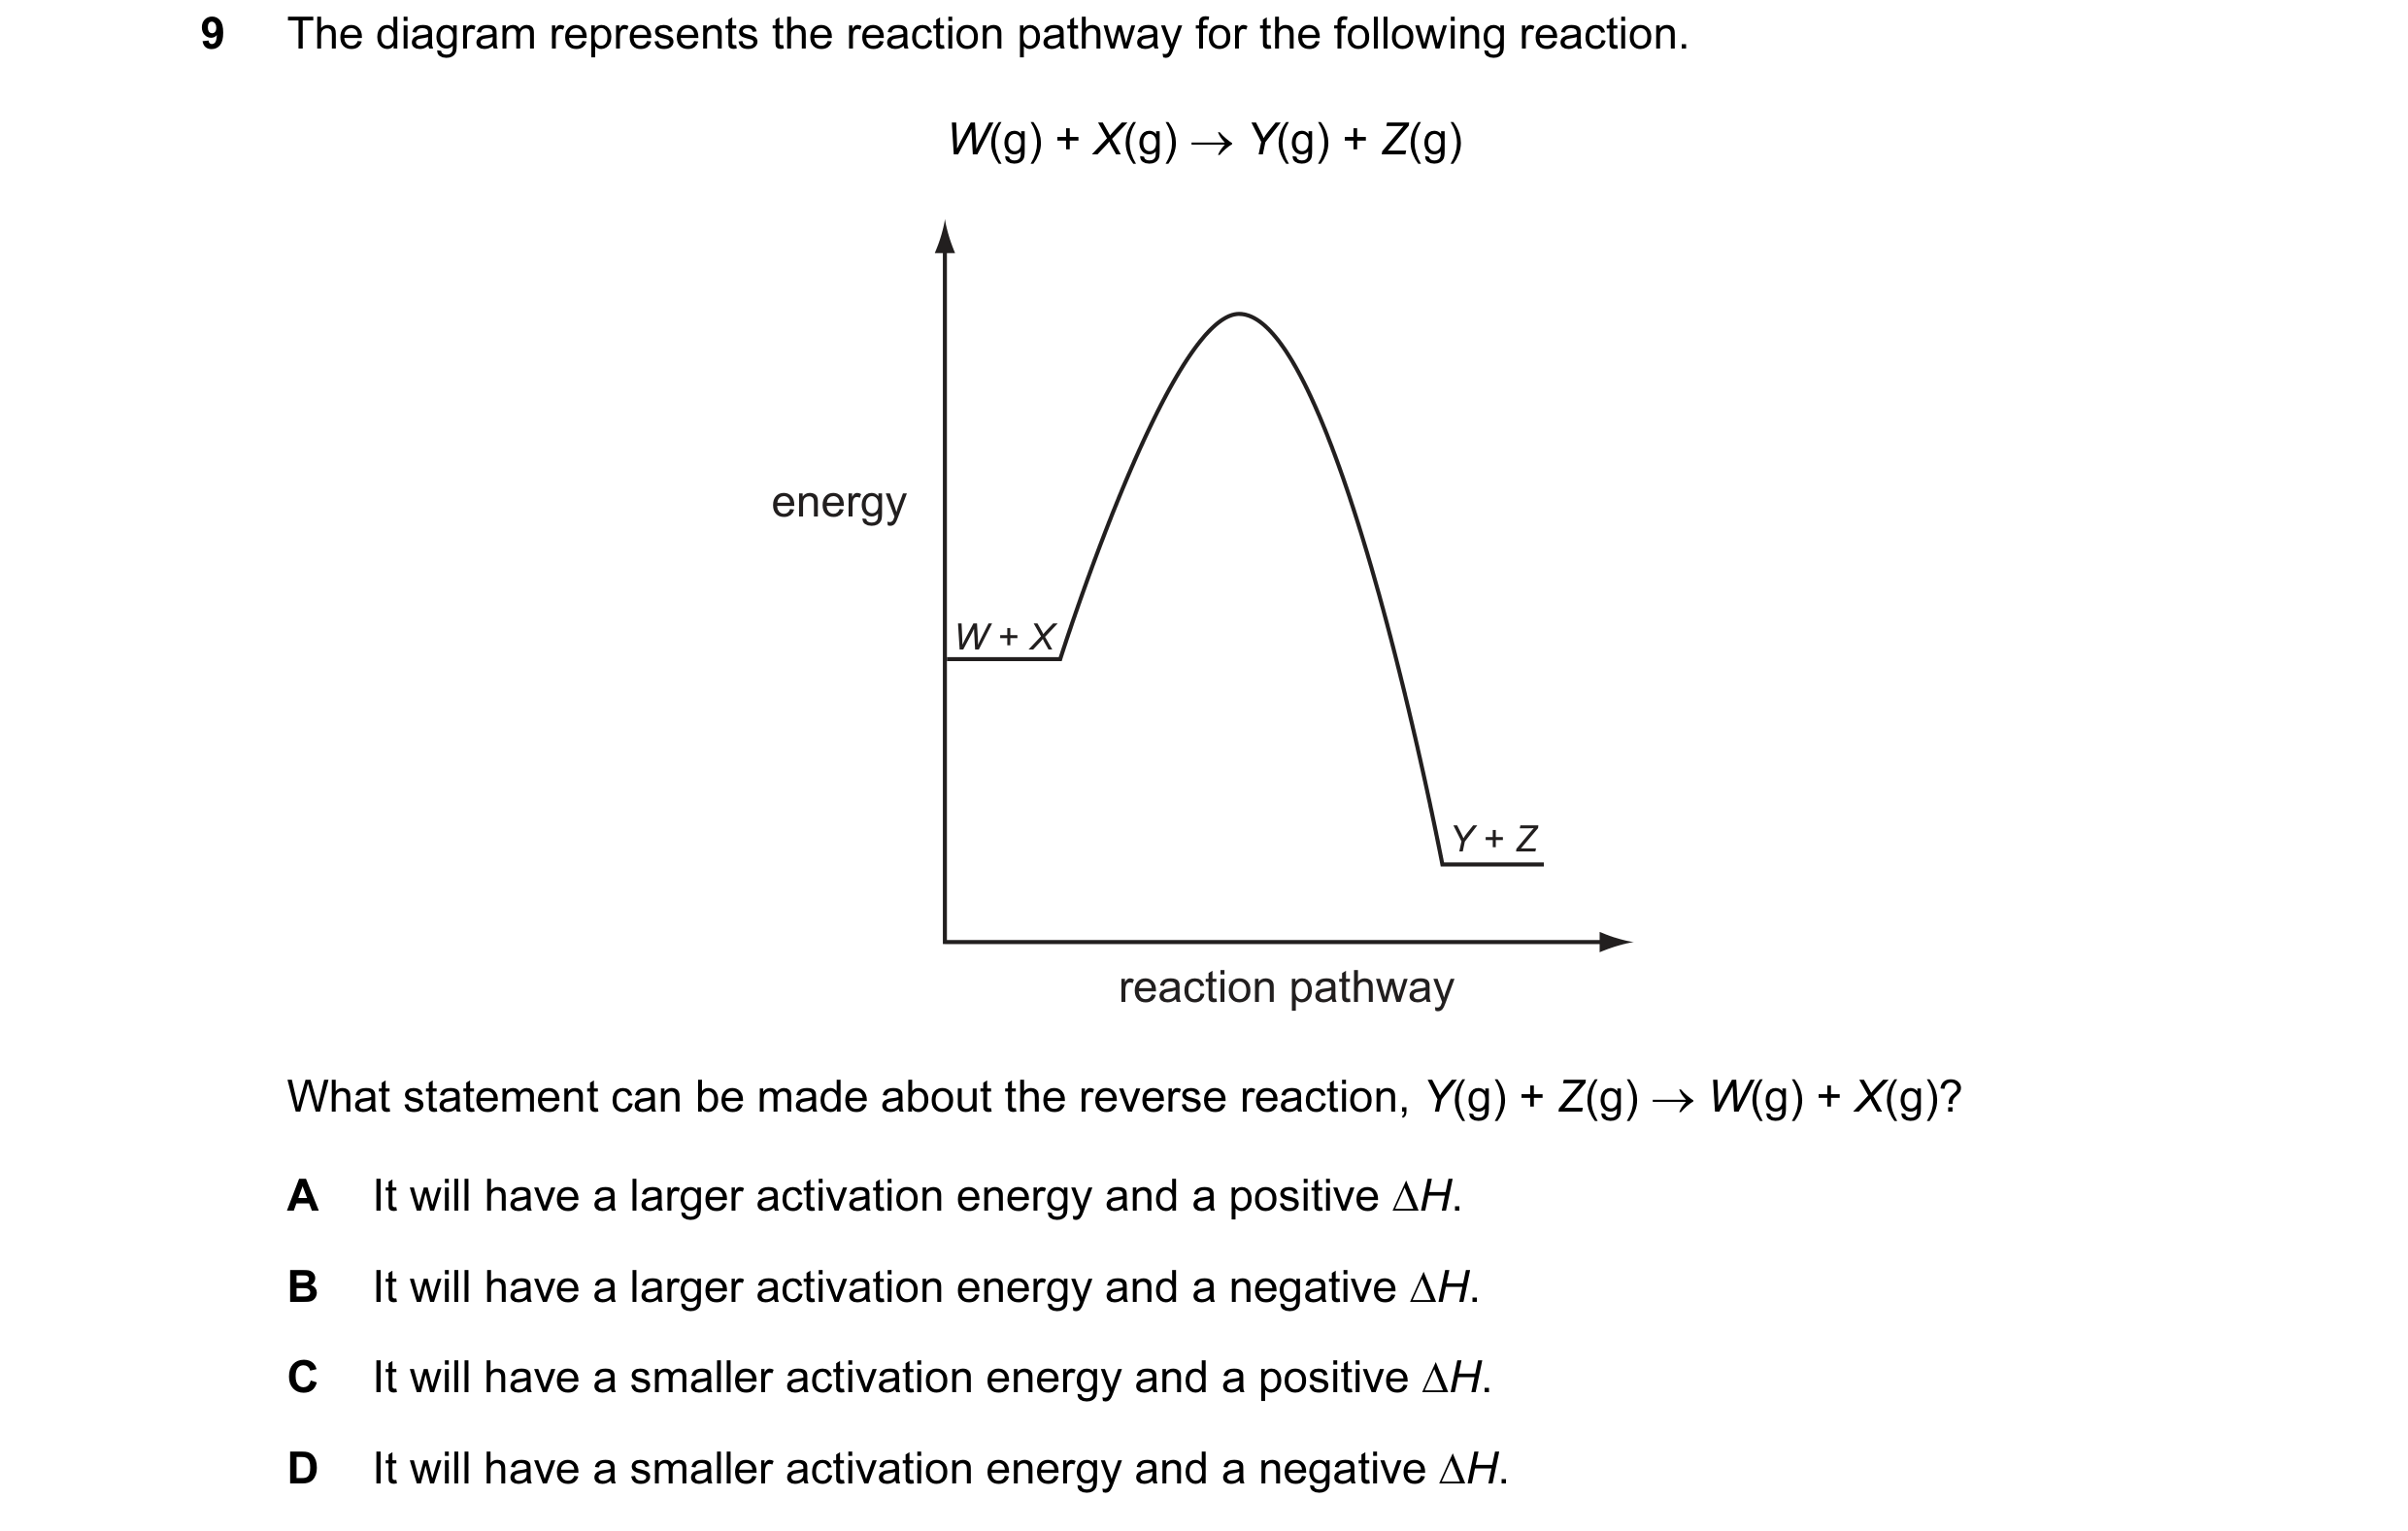
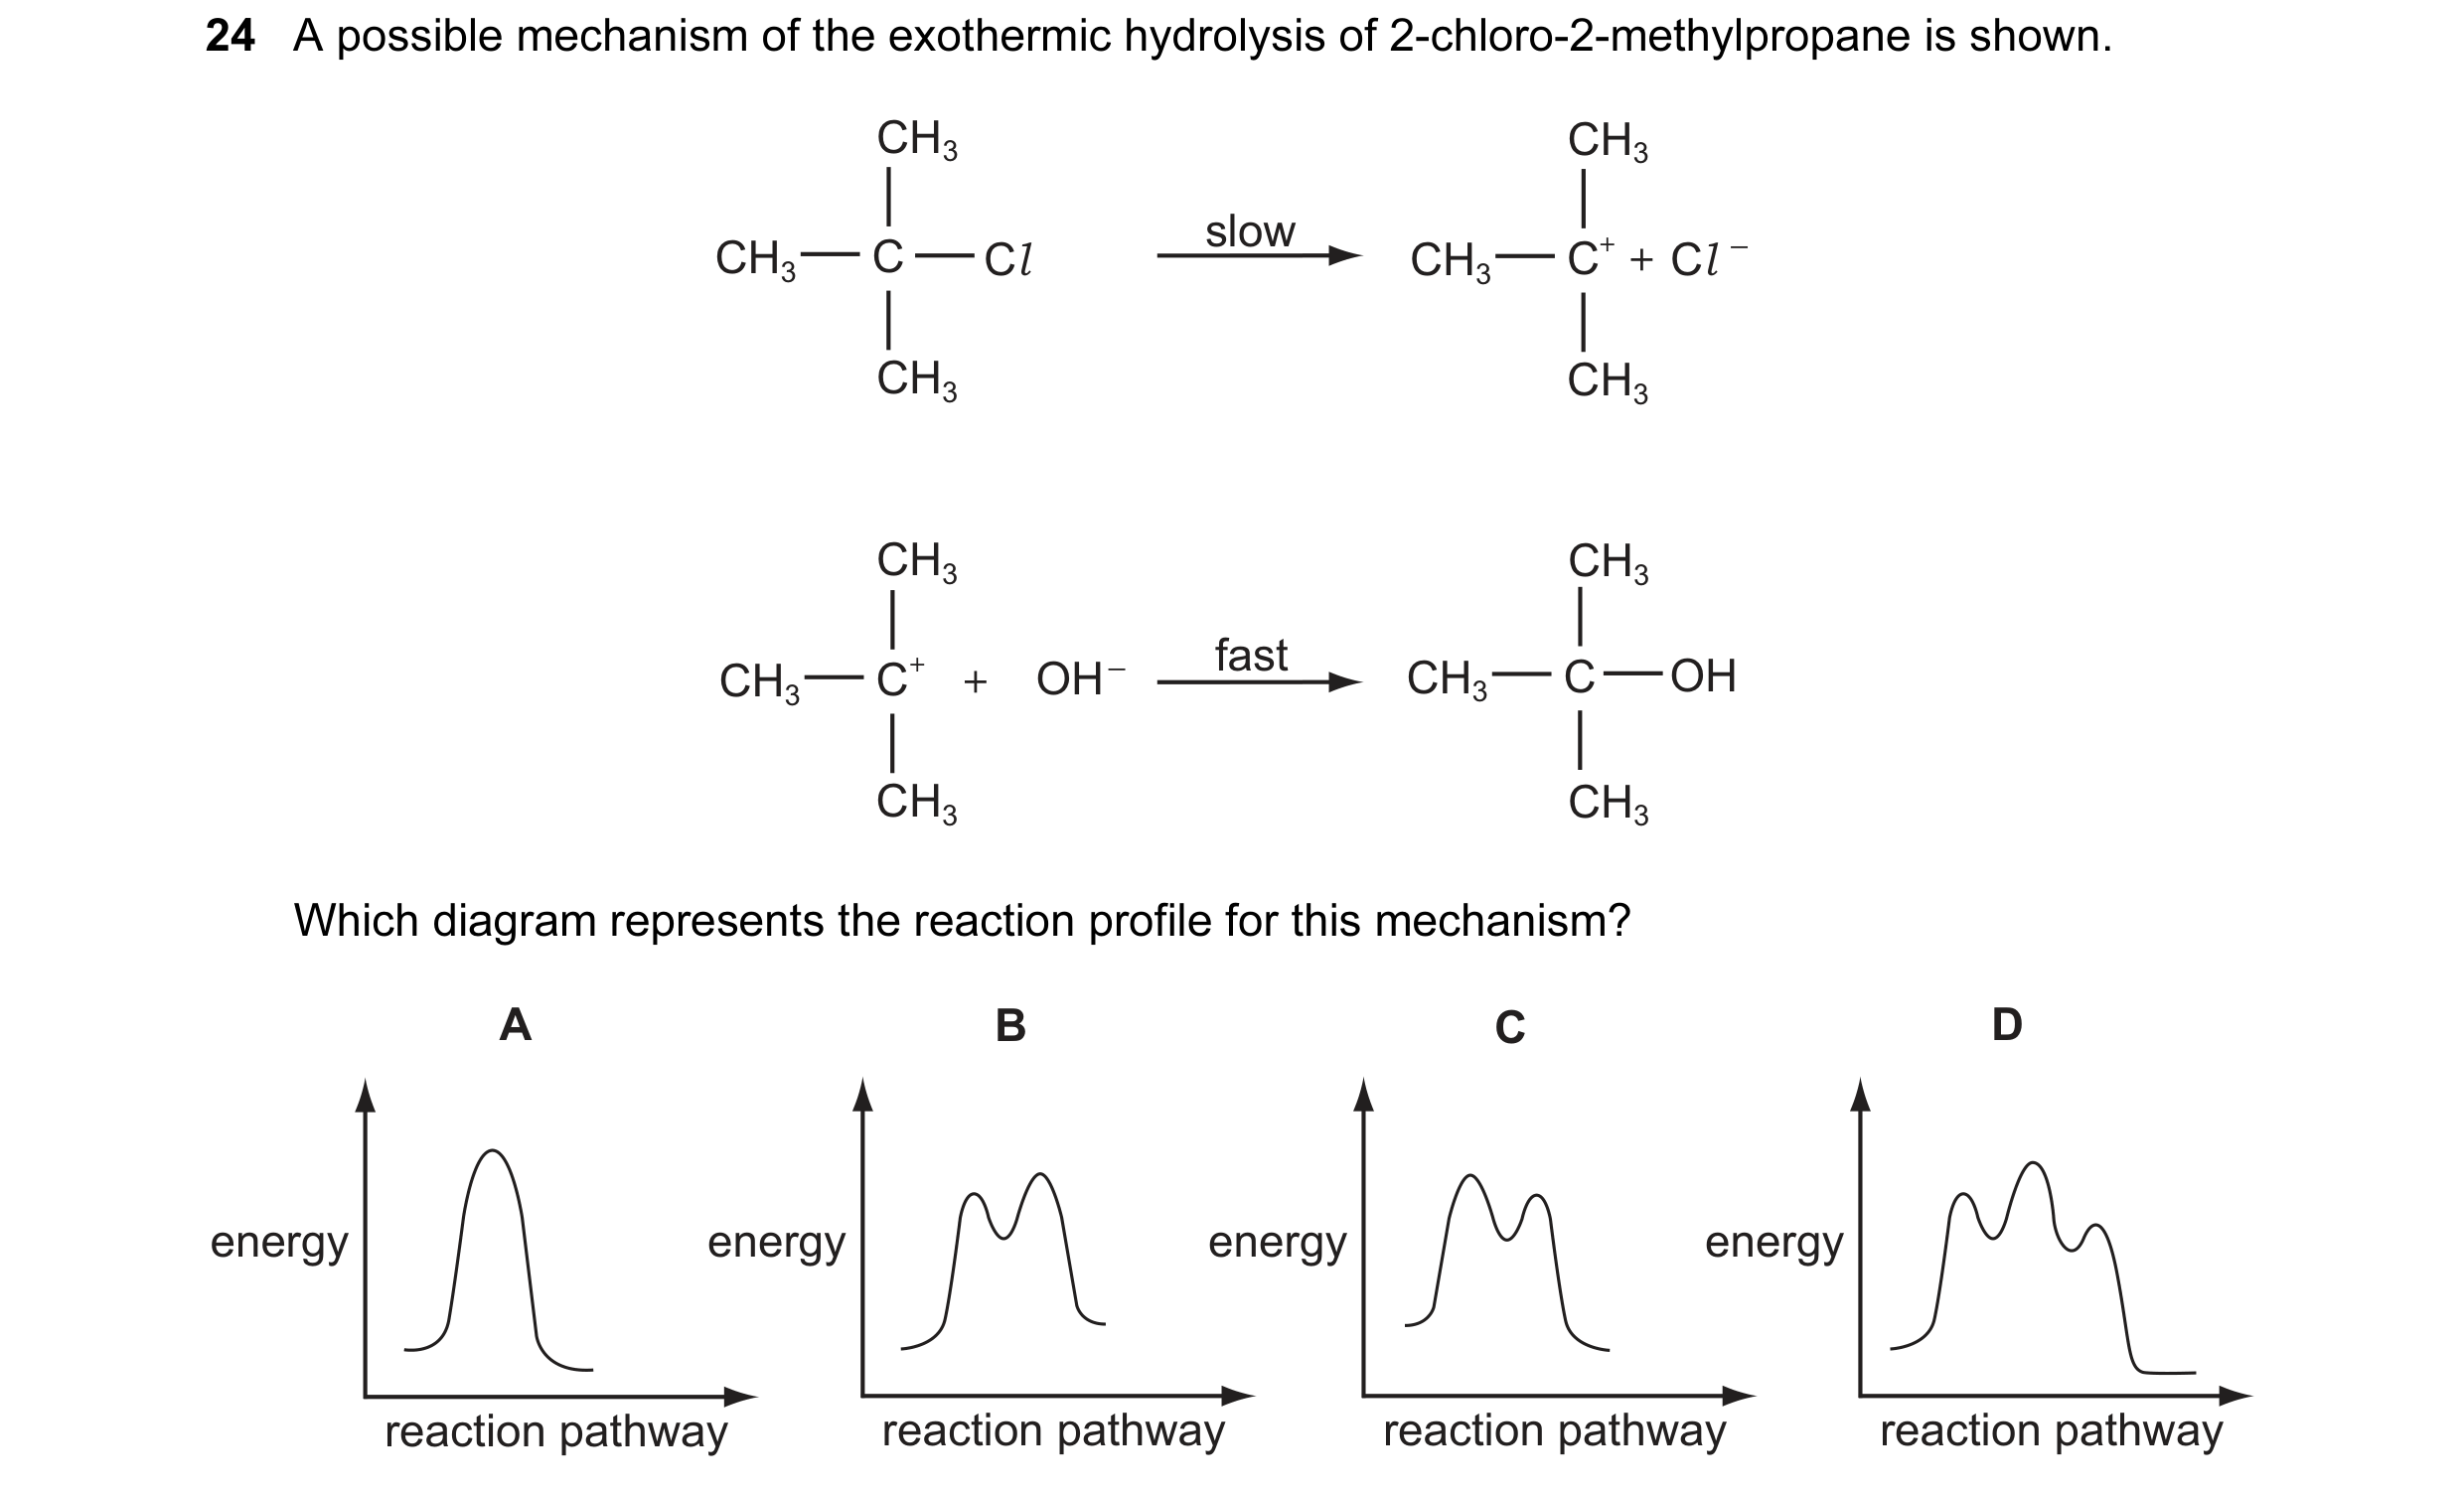 4 / 67
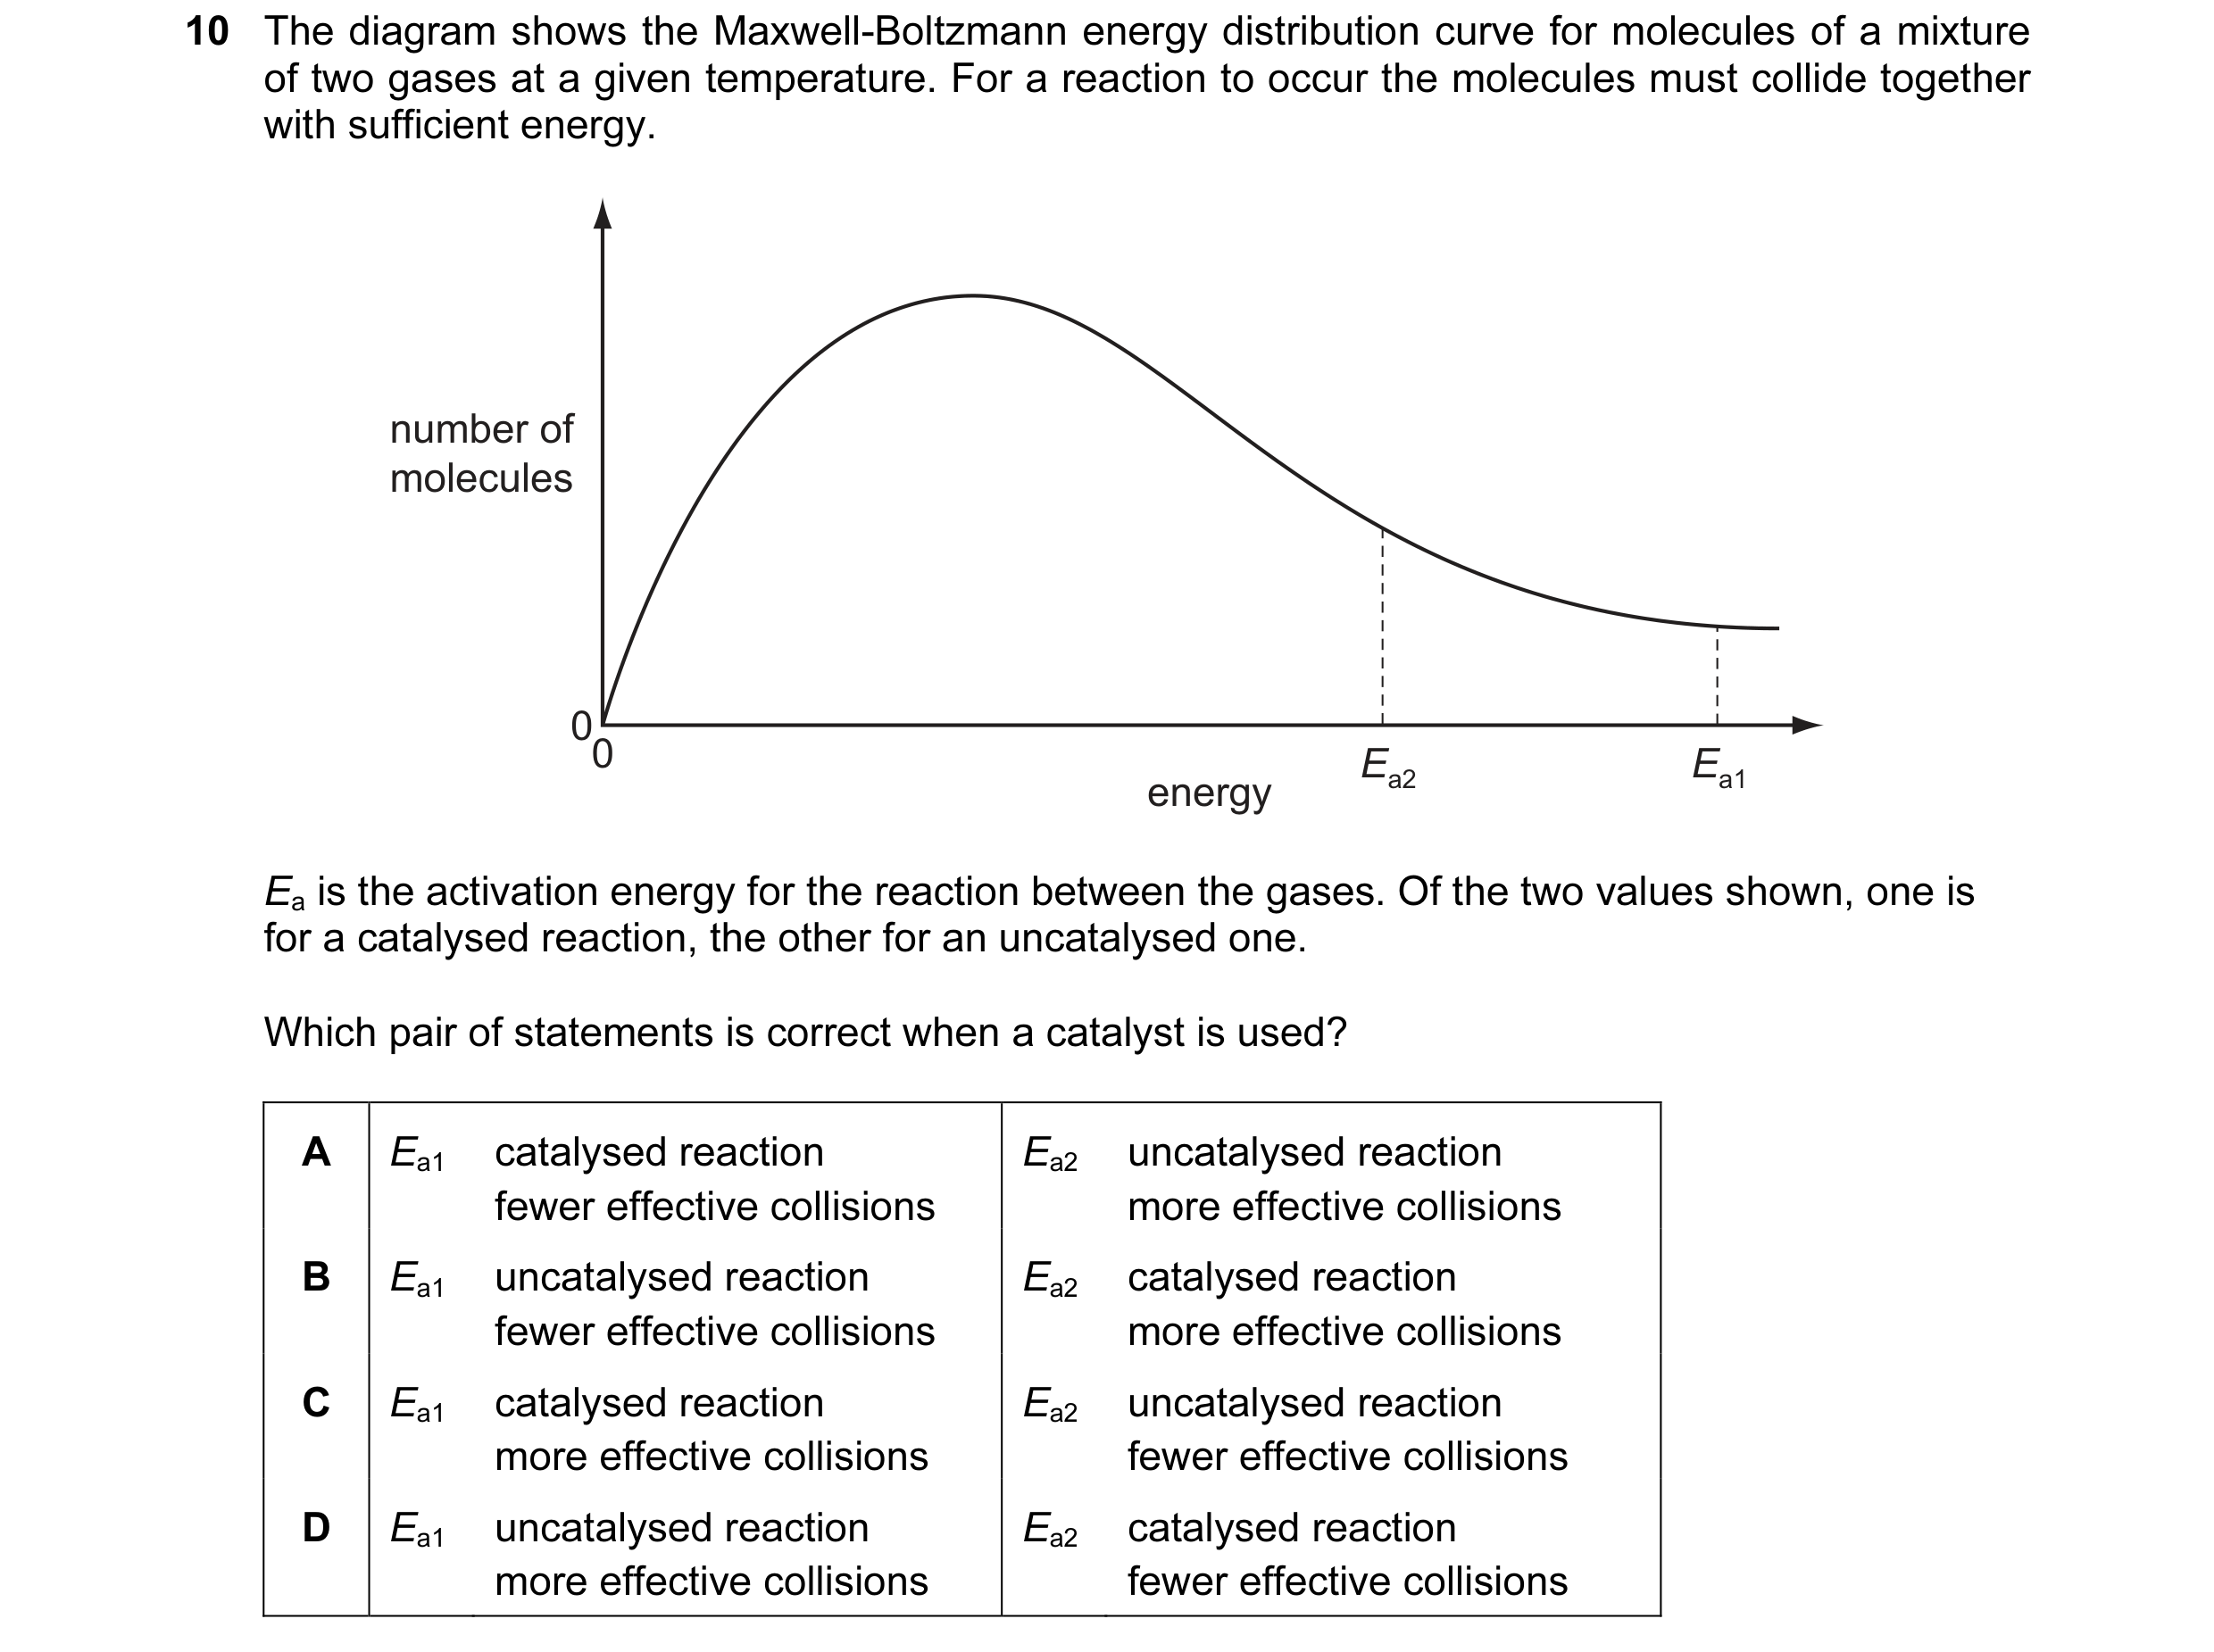
 5 / 67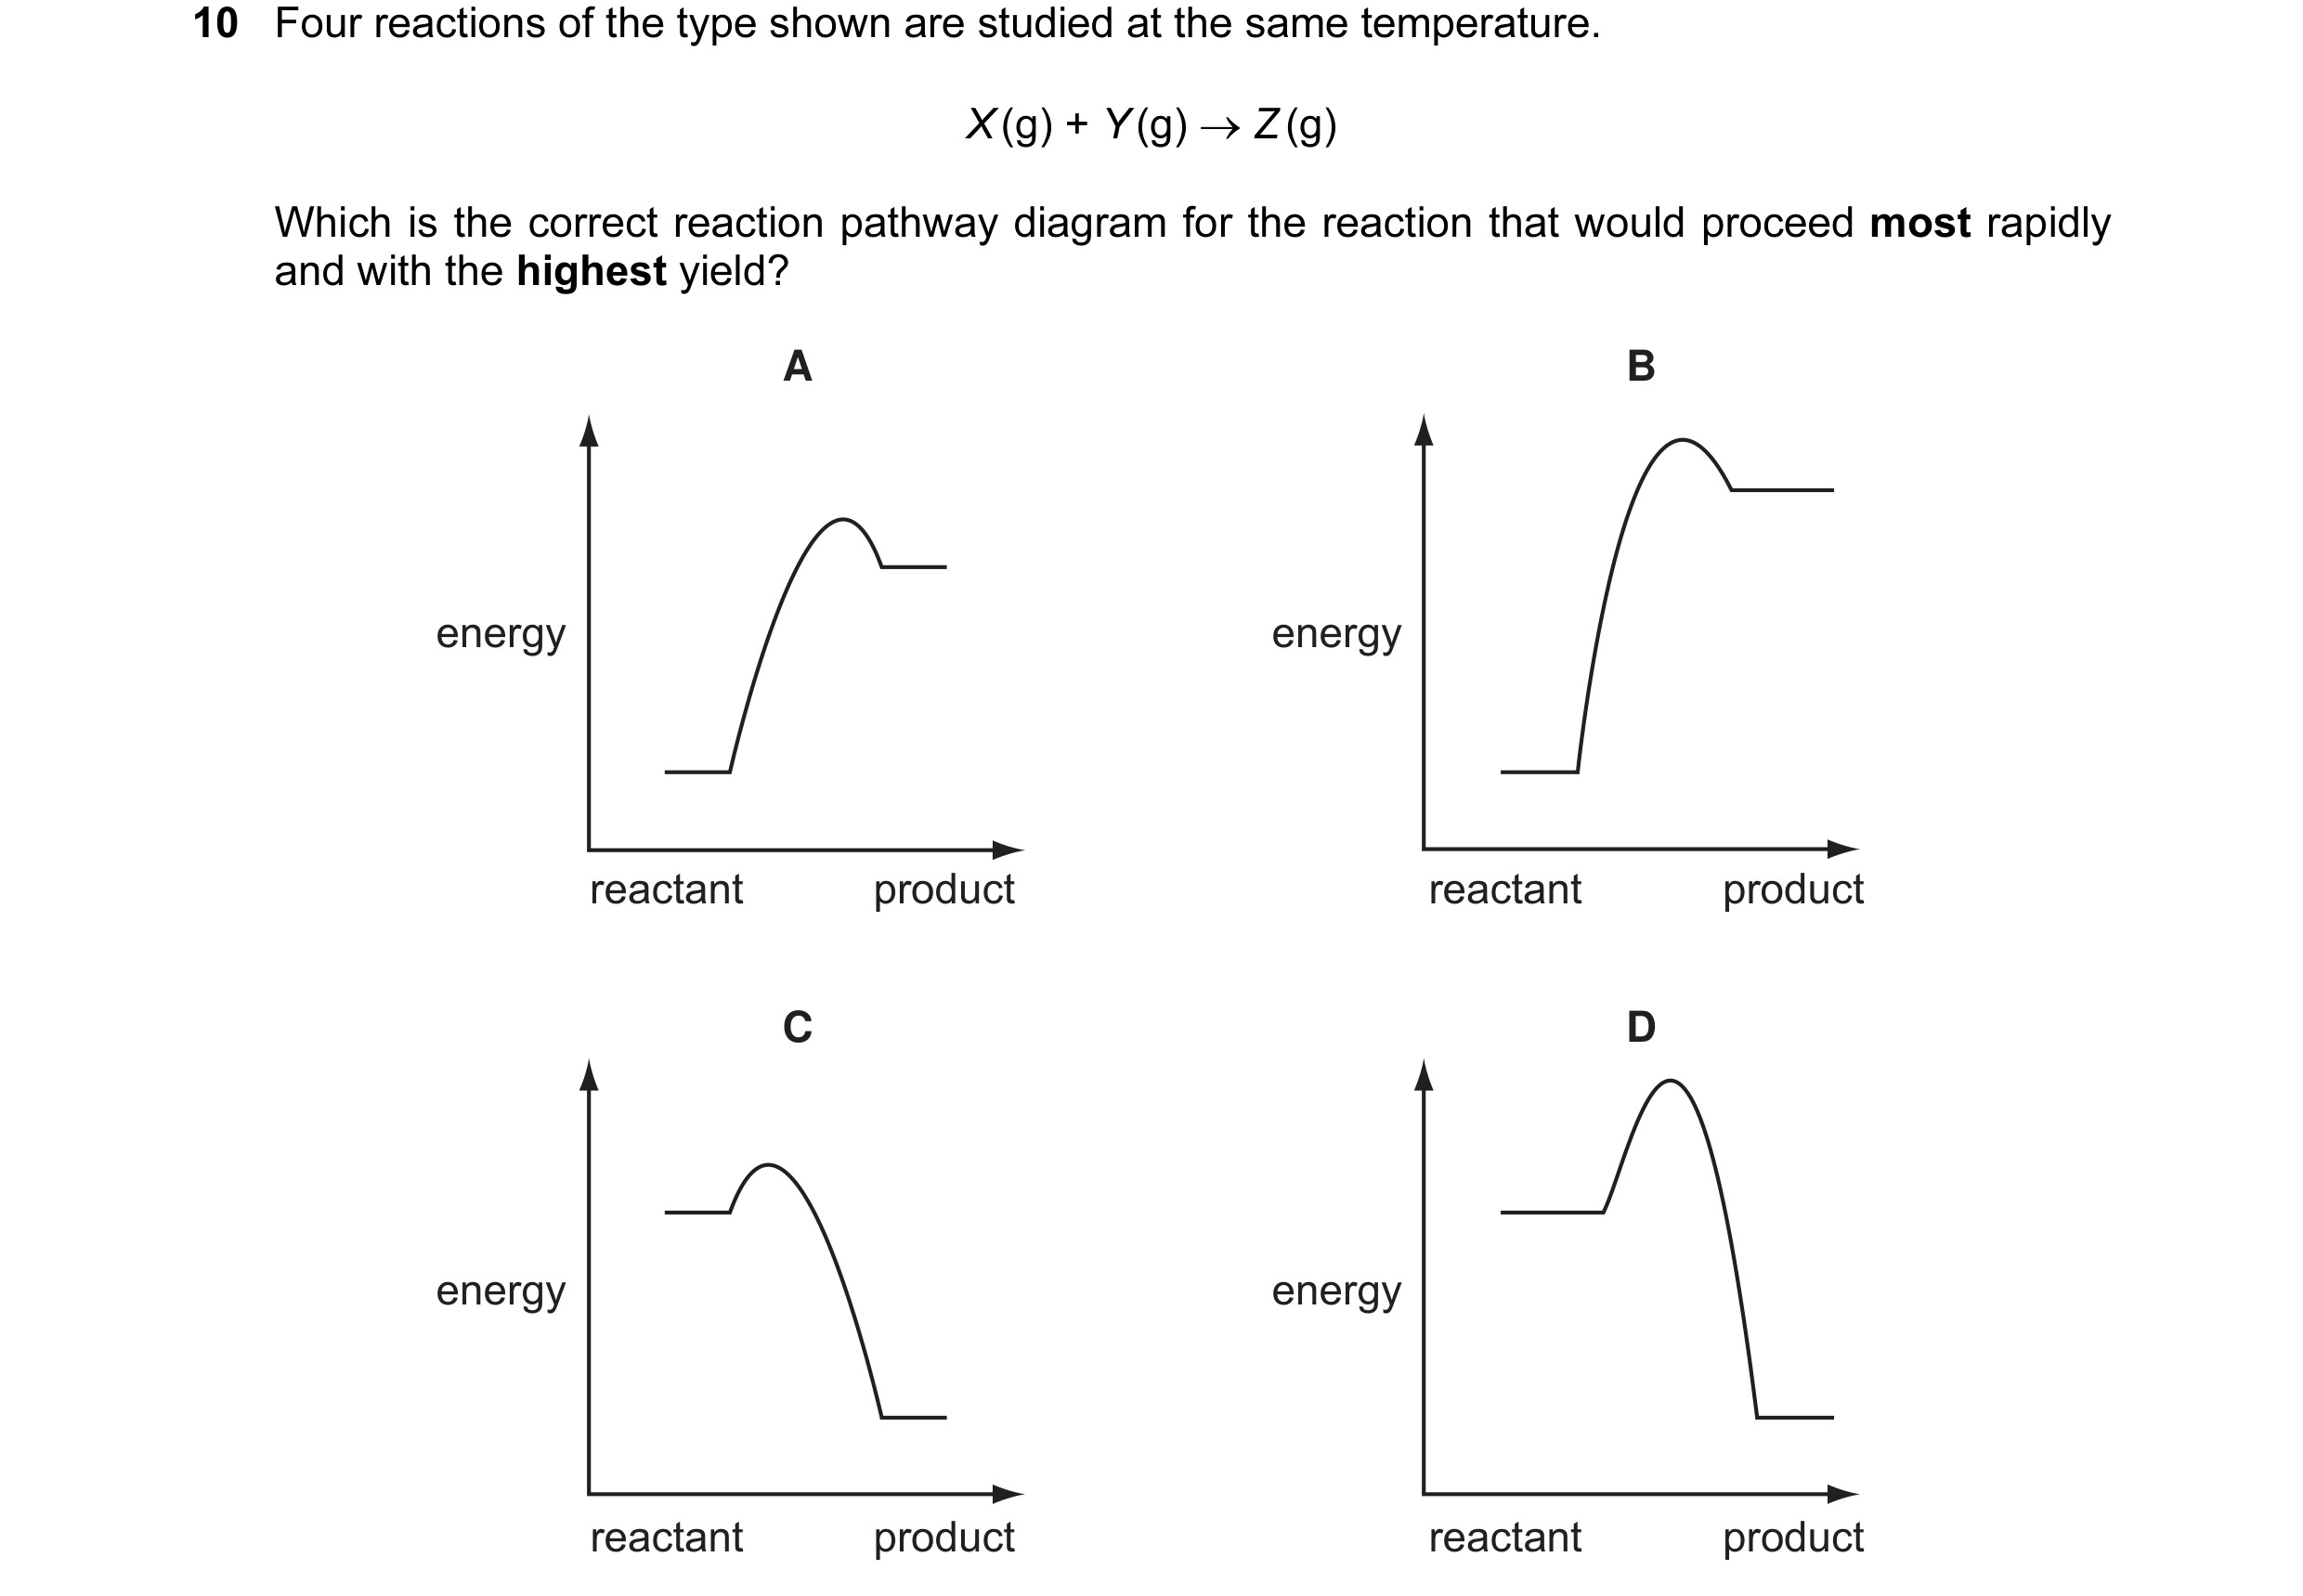
 6 / 67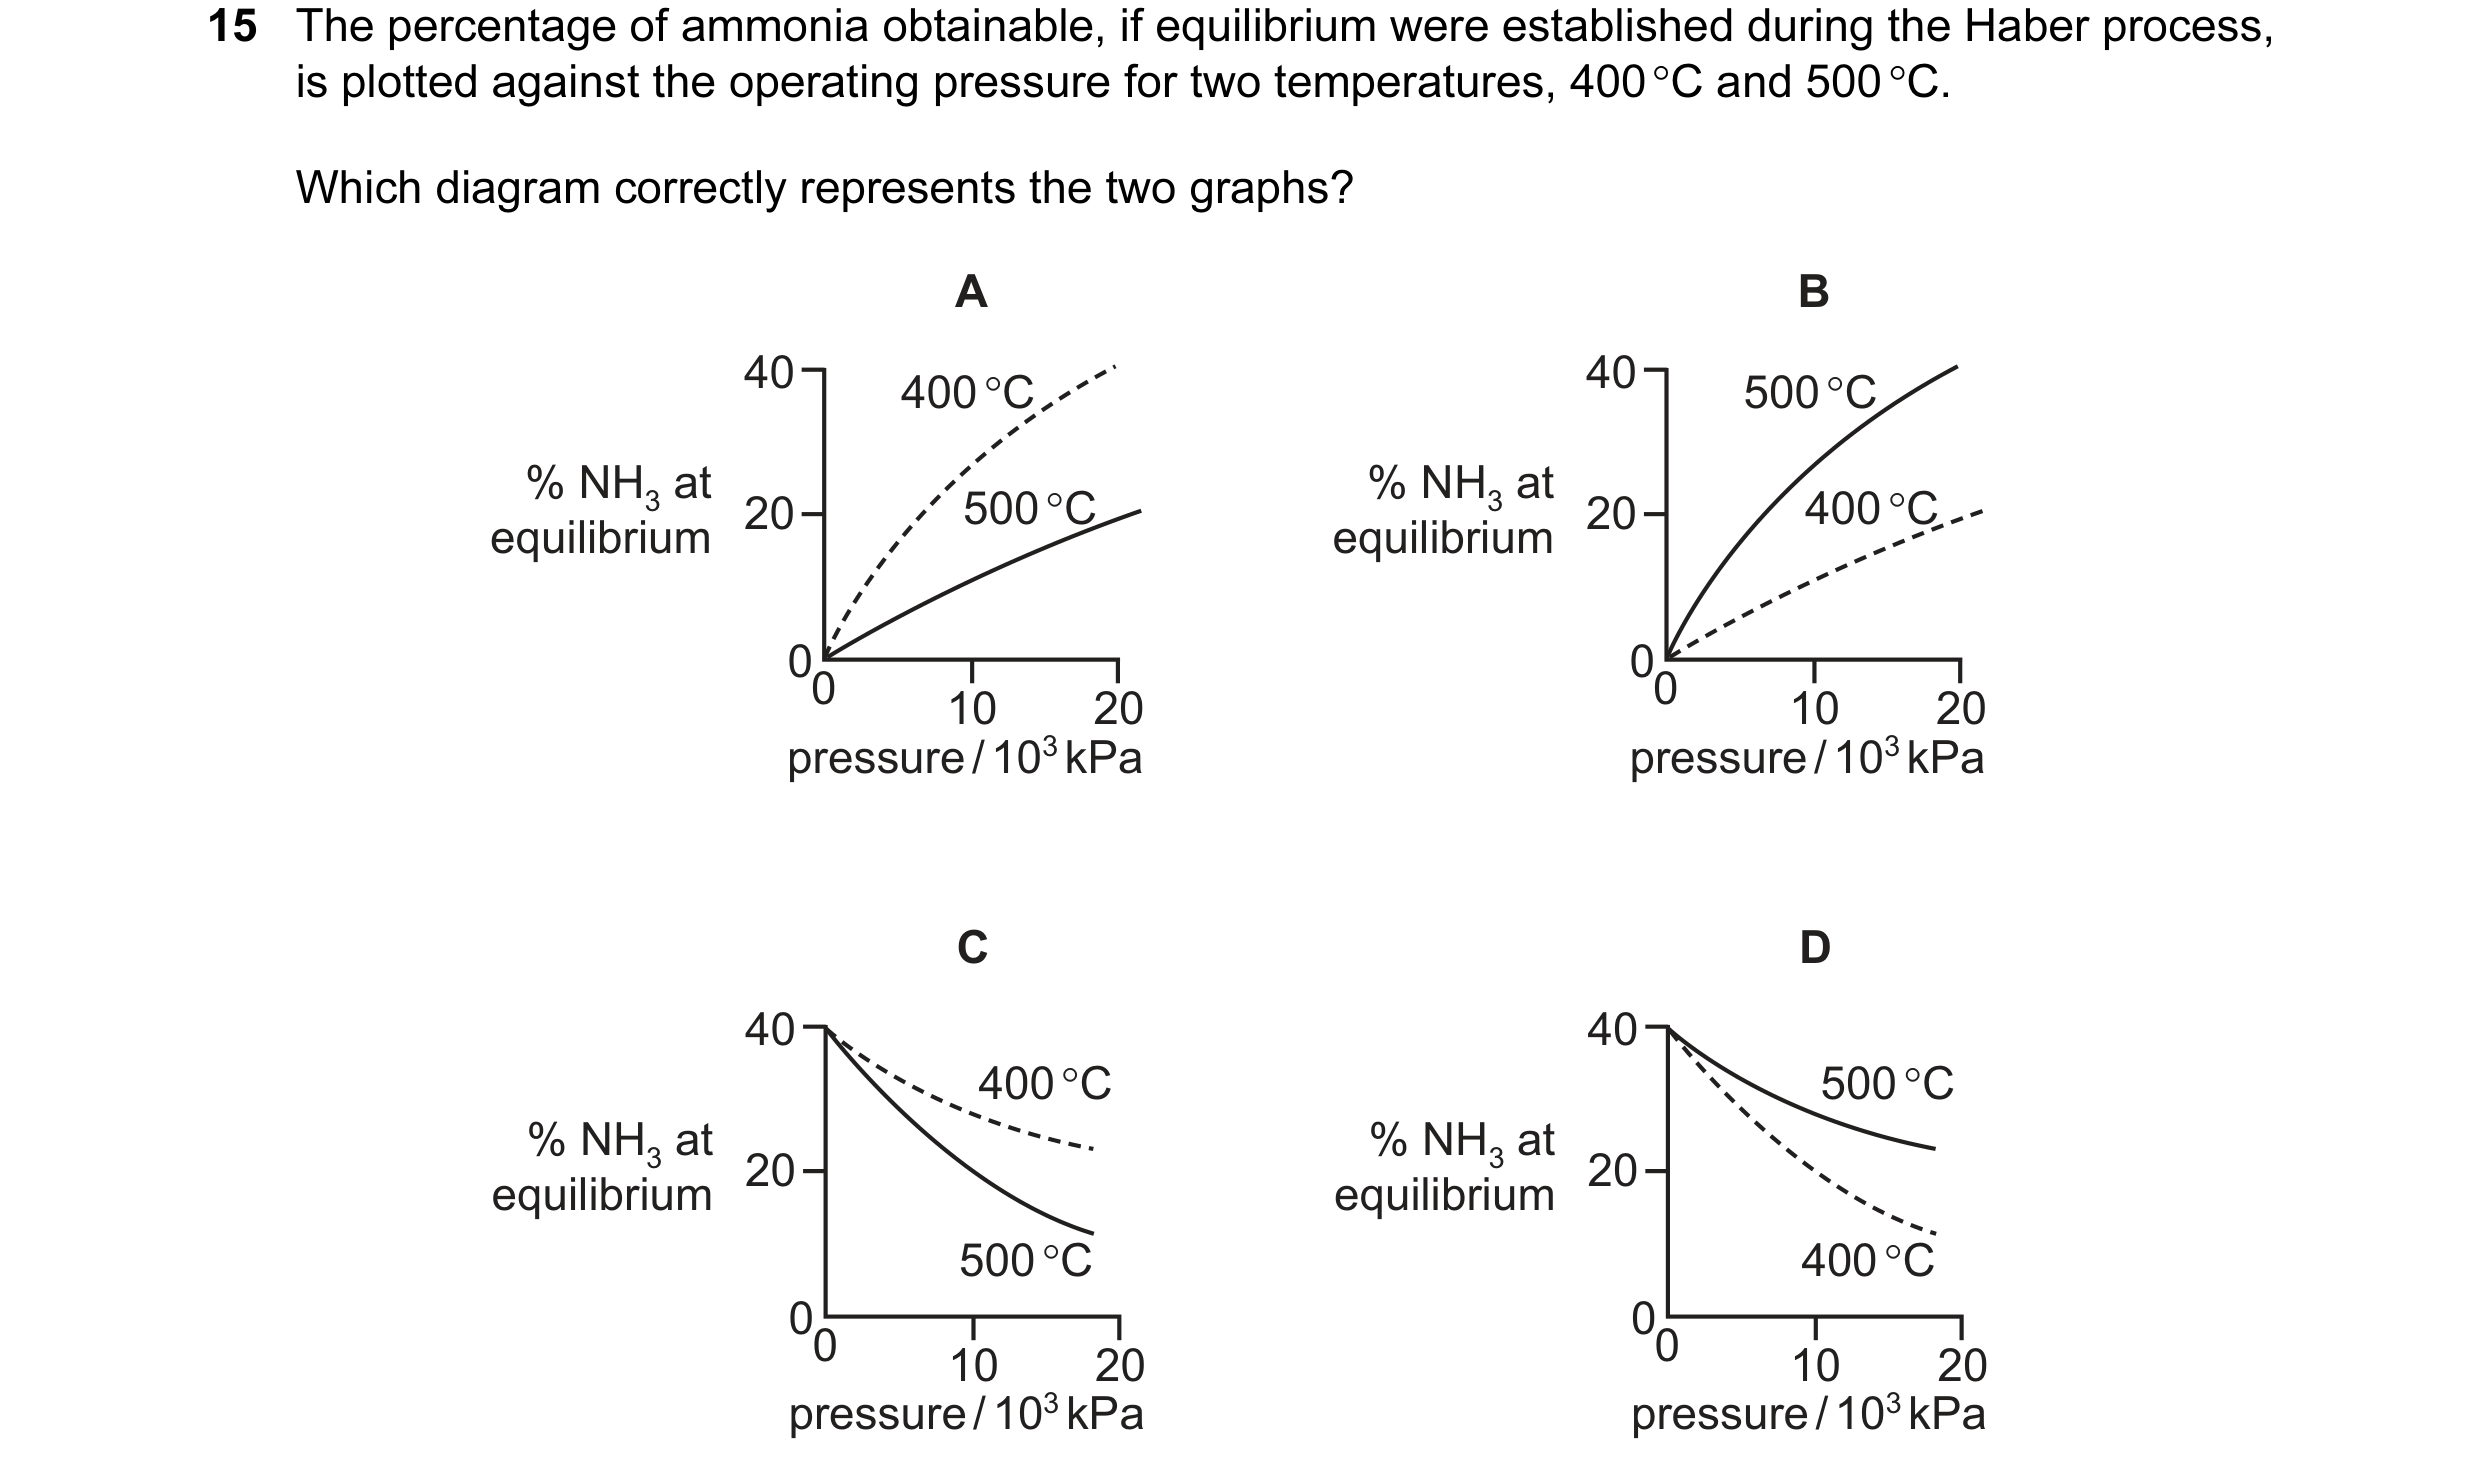
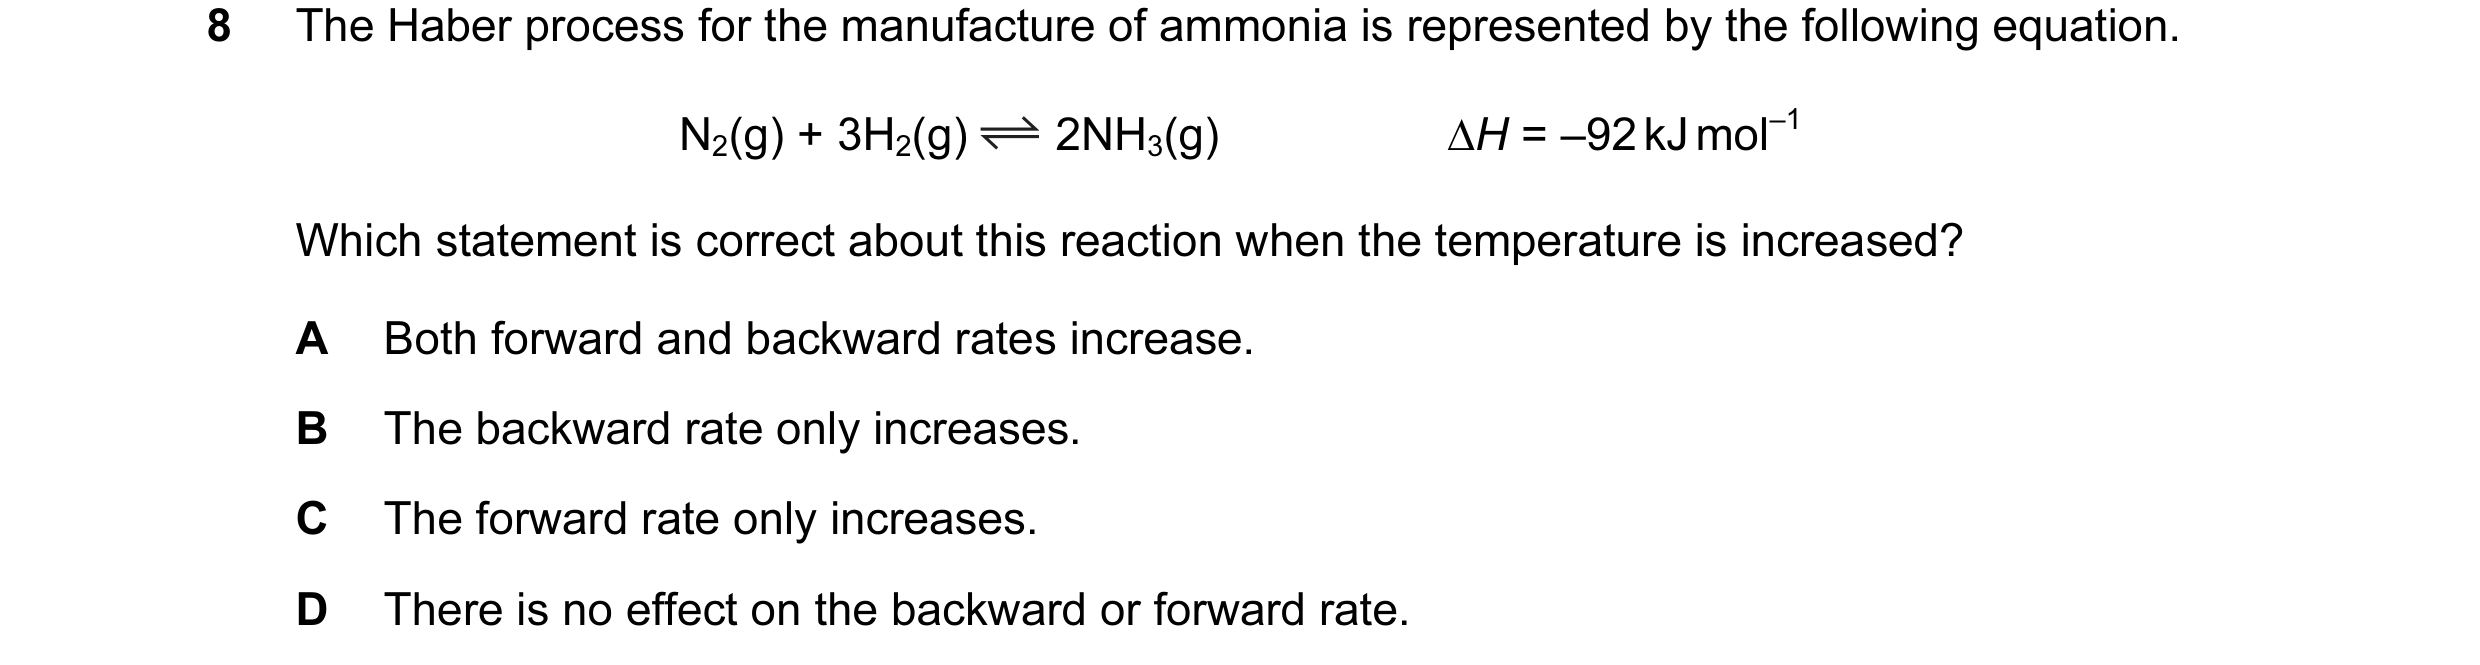 7 / 67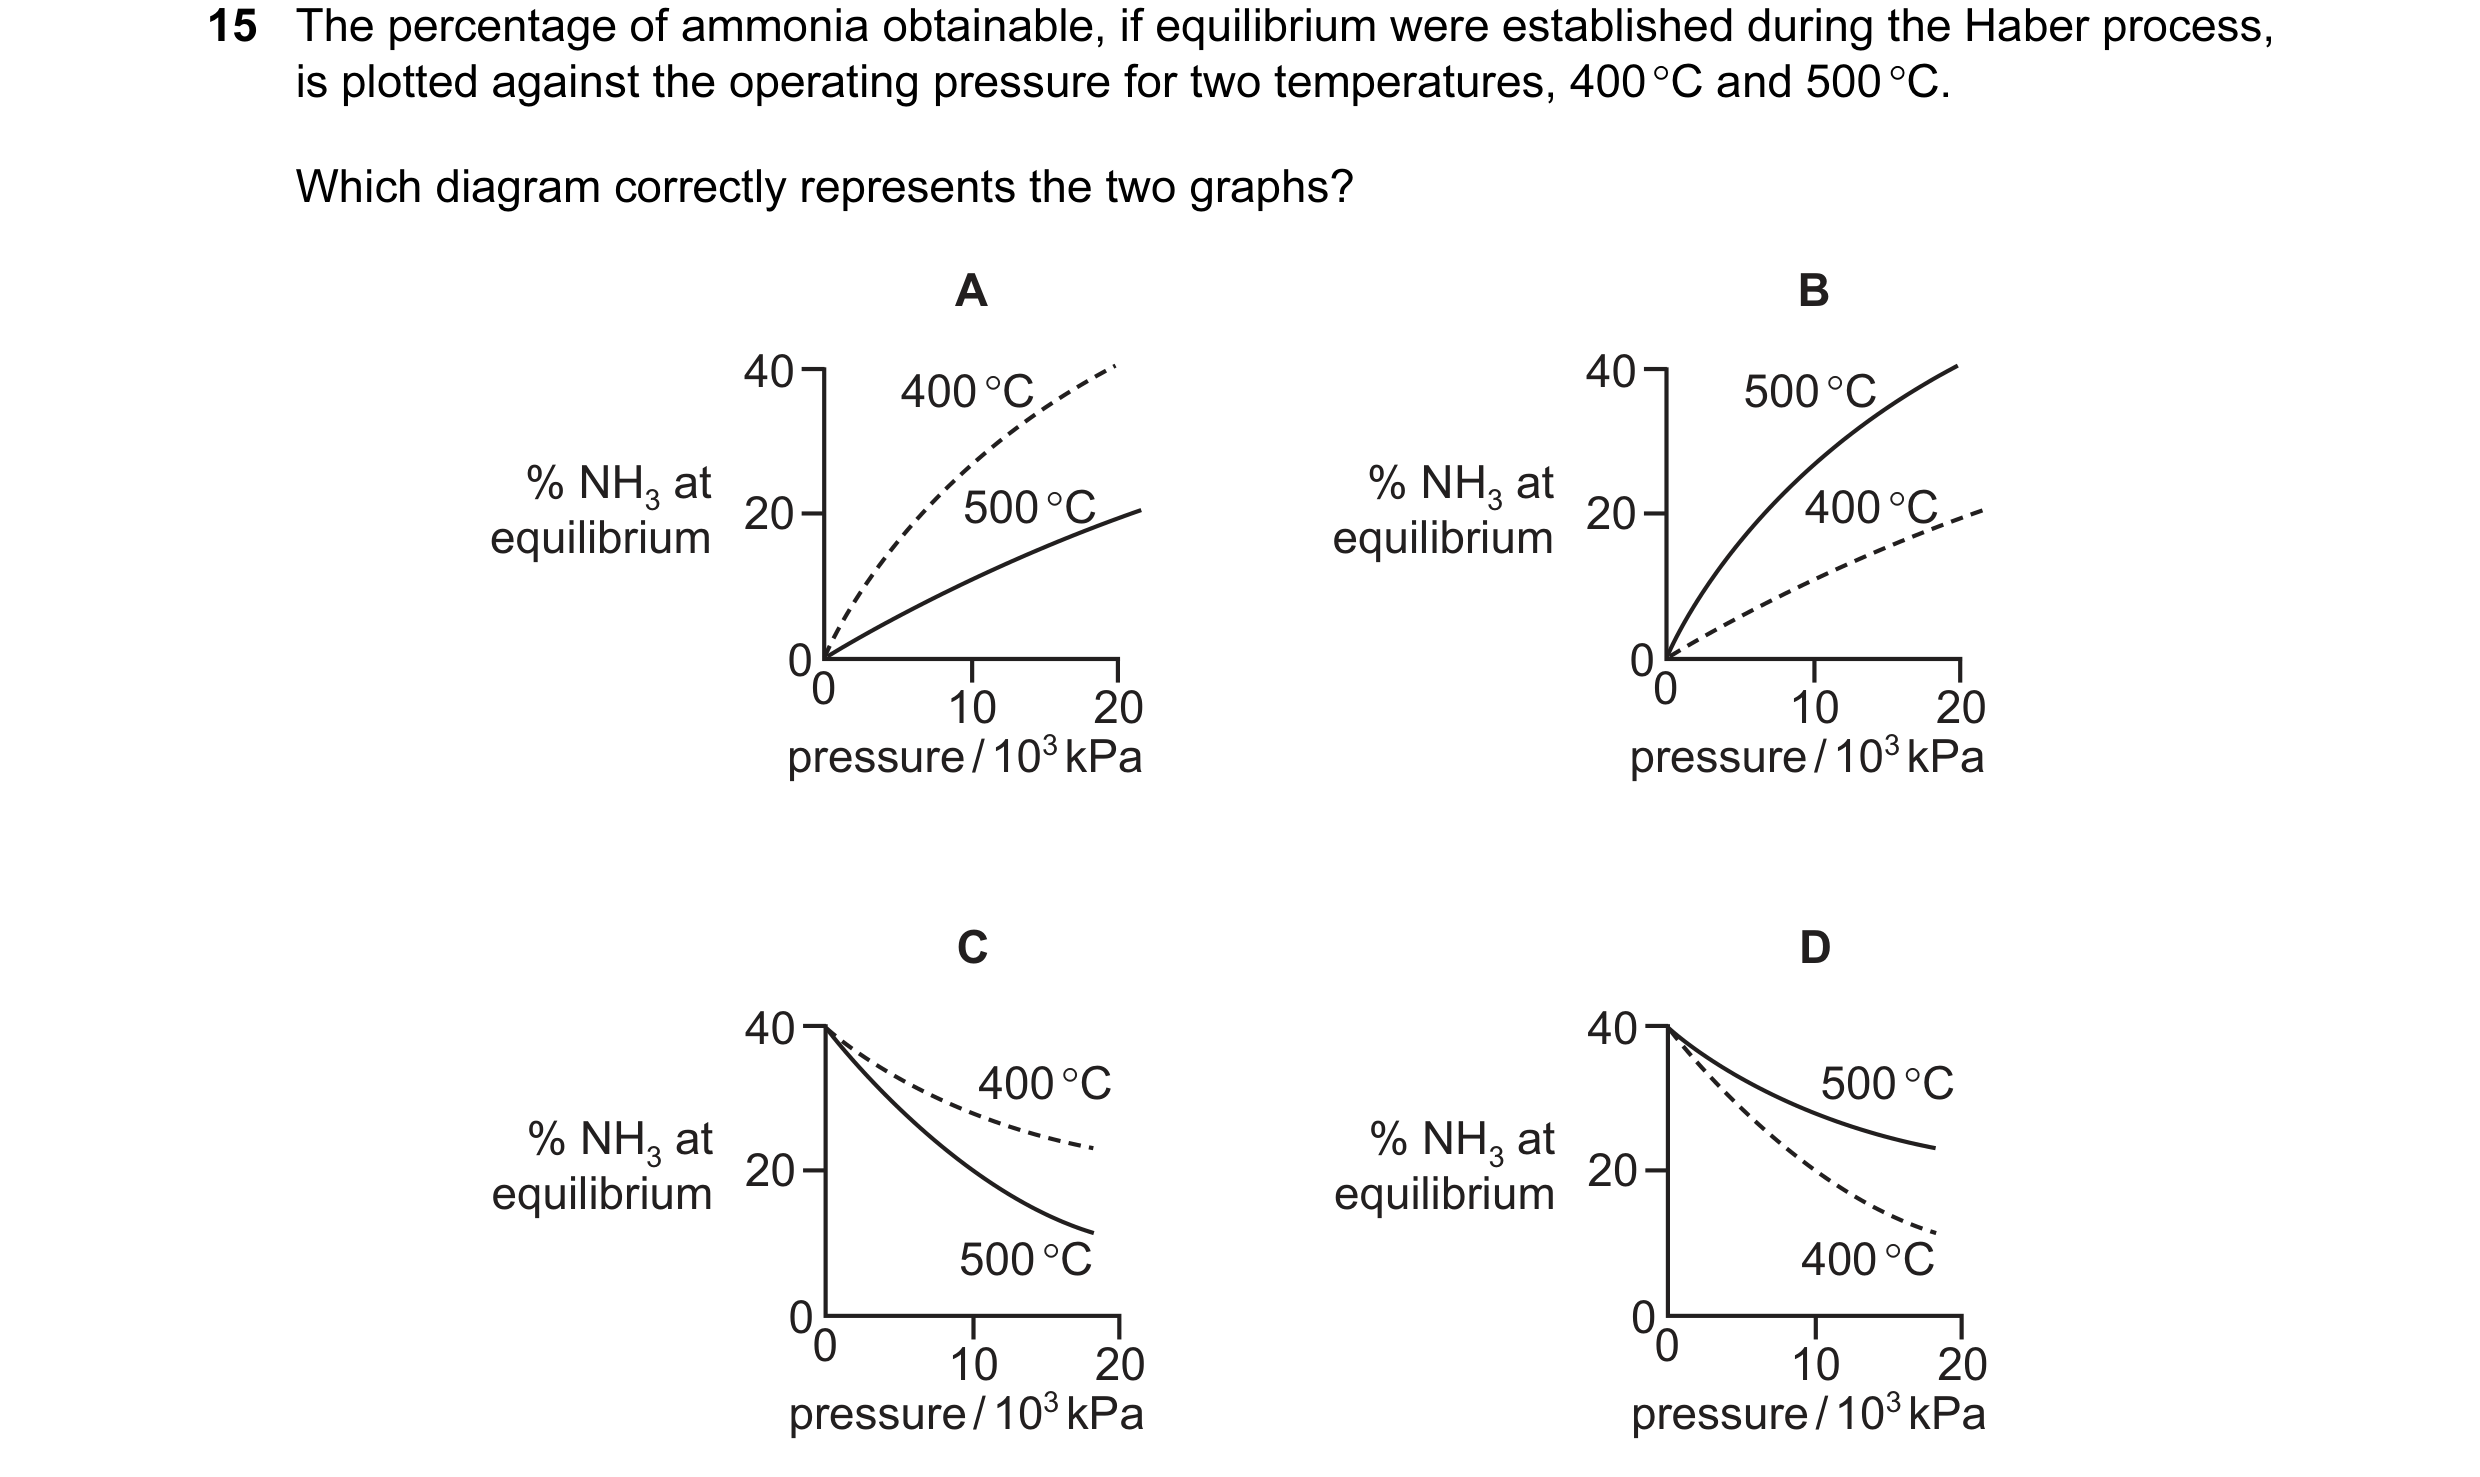
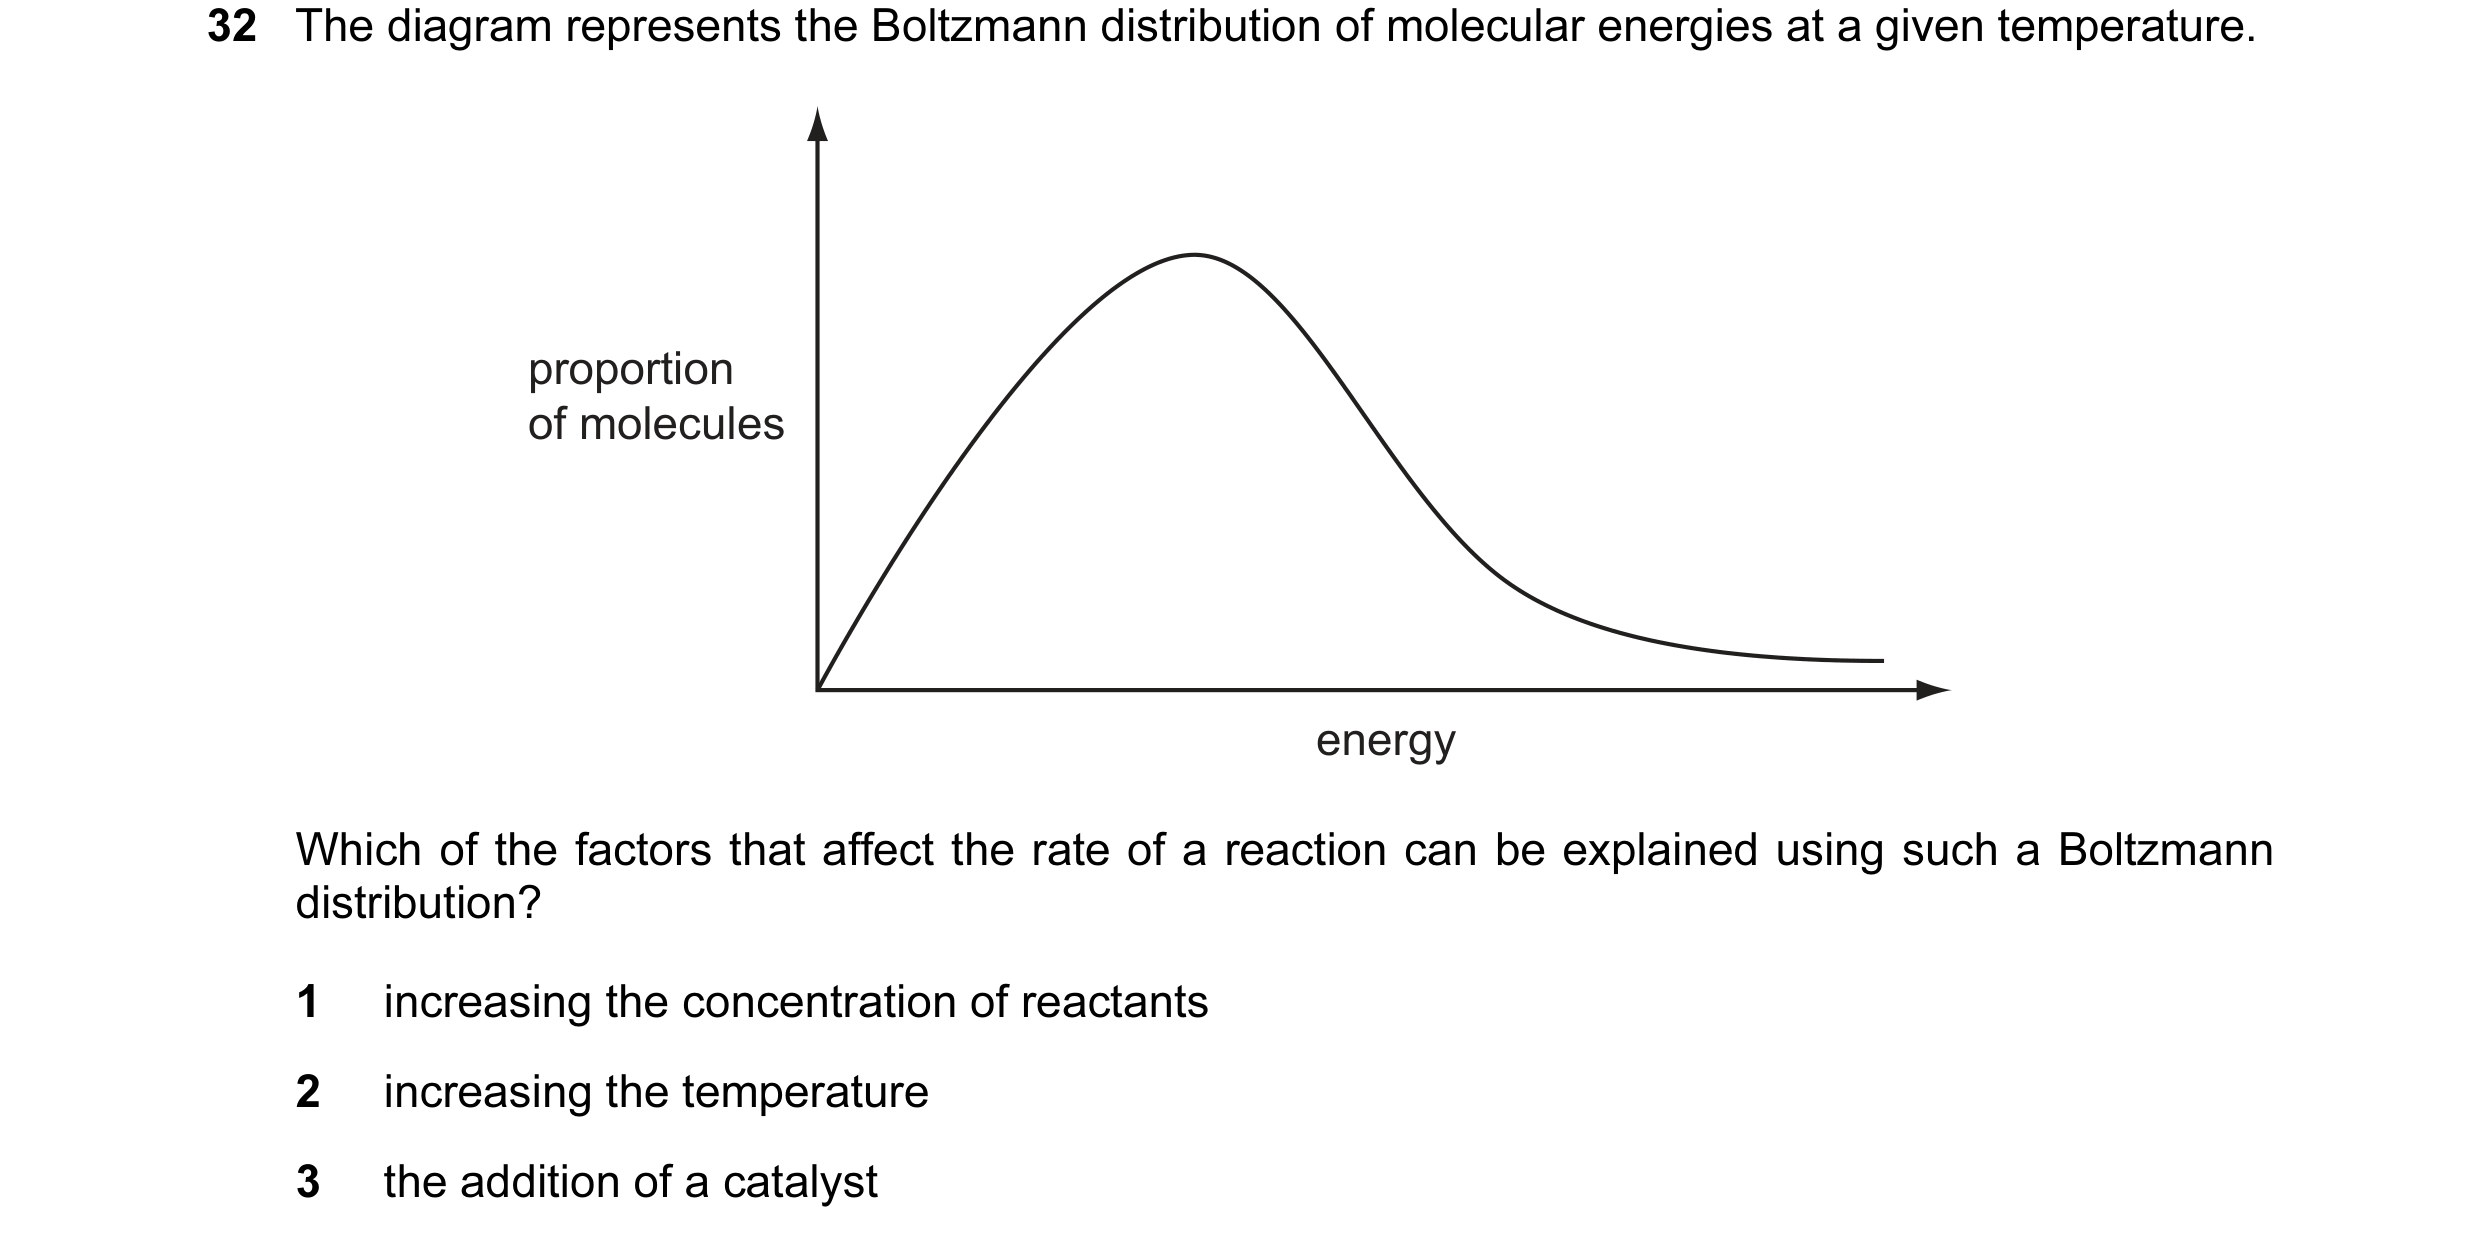 8 / 67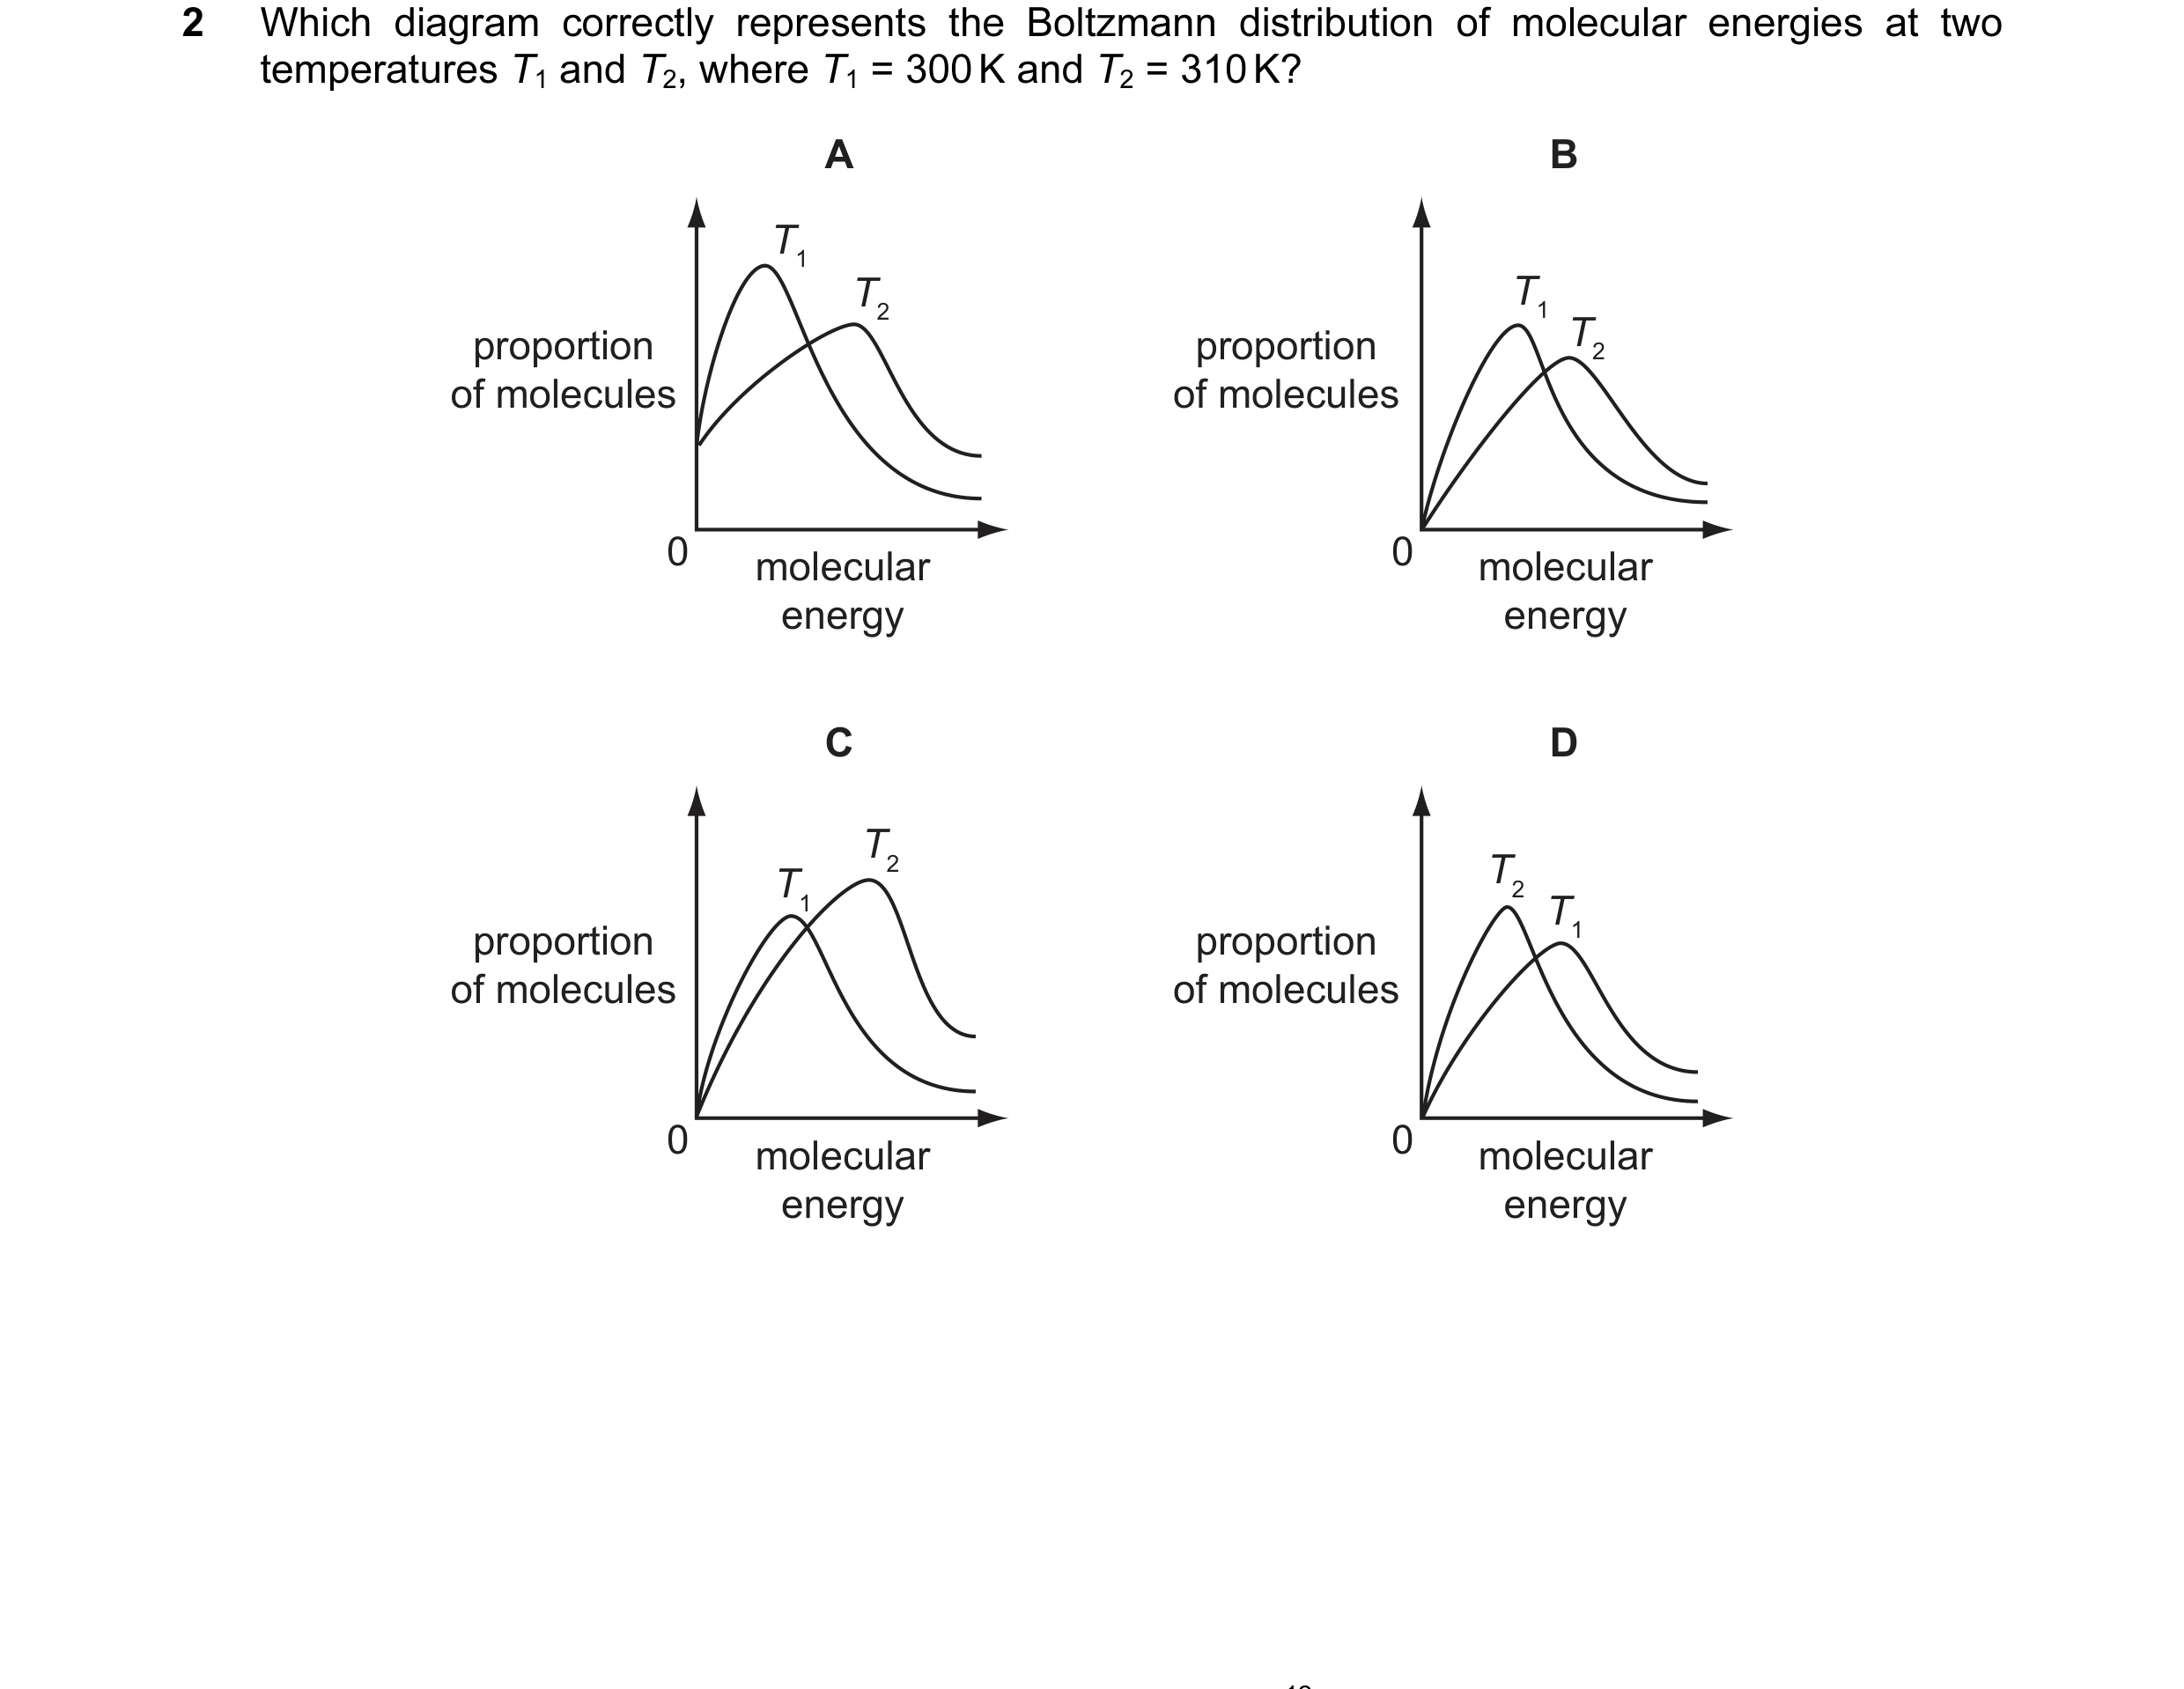
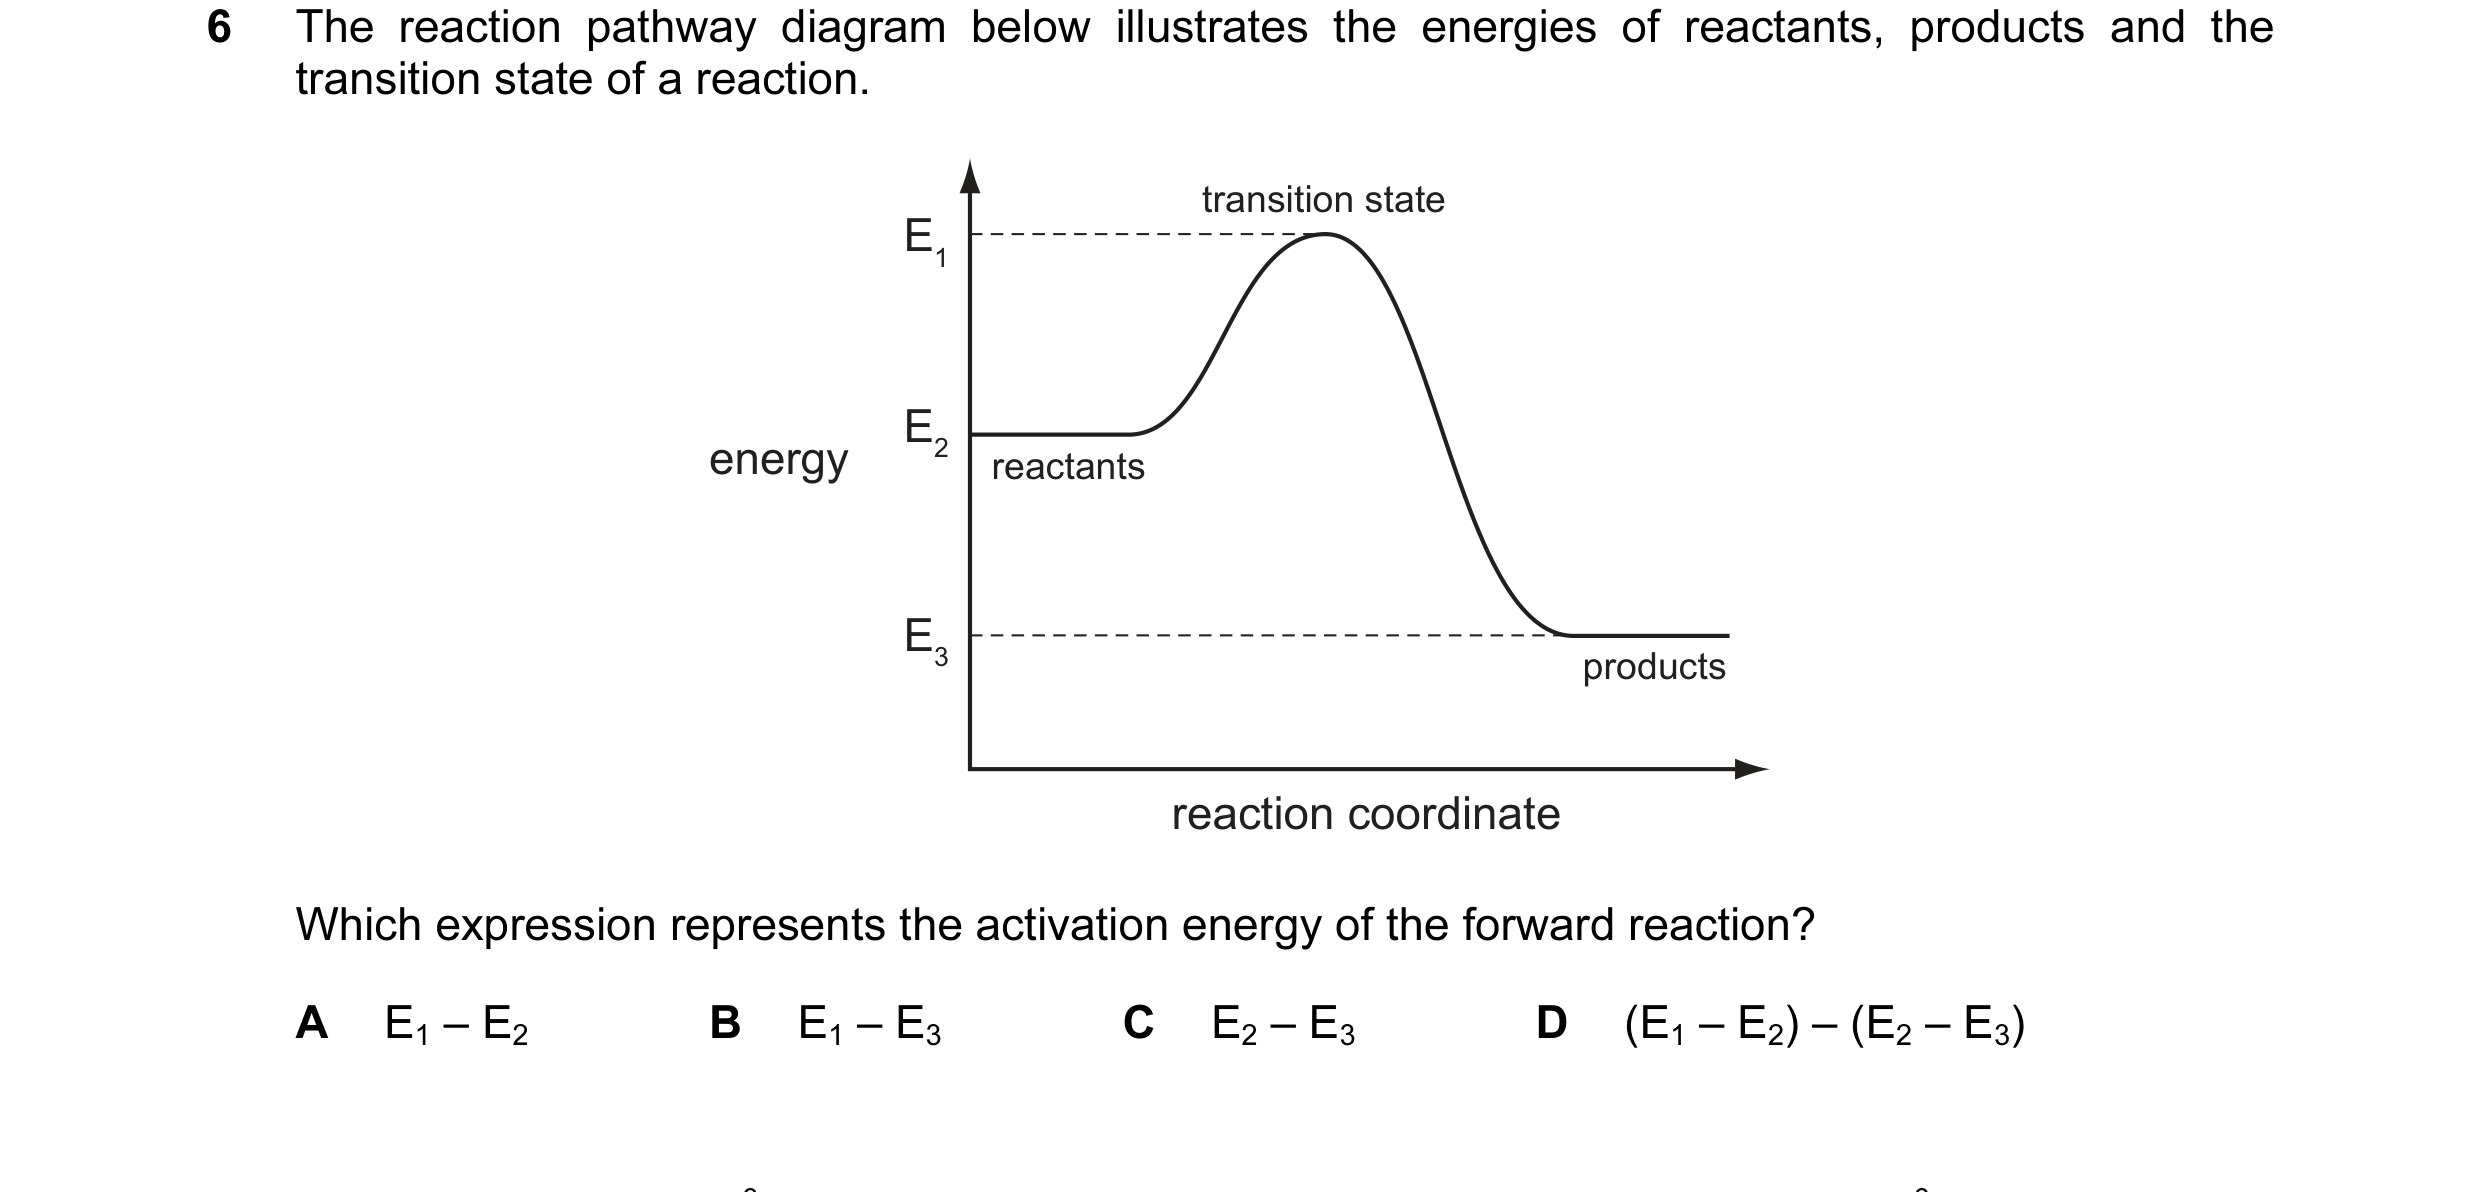 9 / 67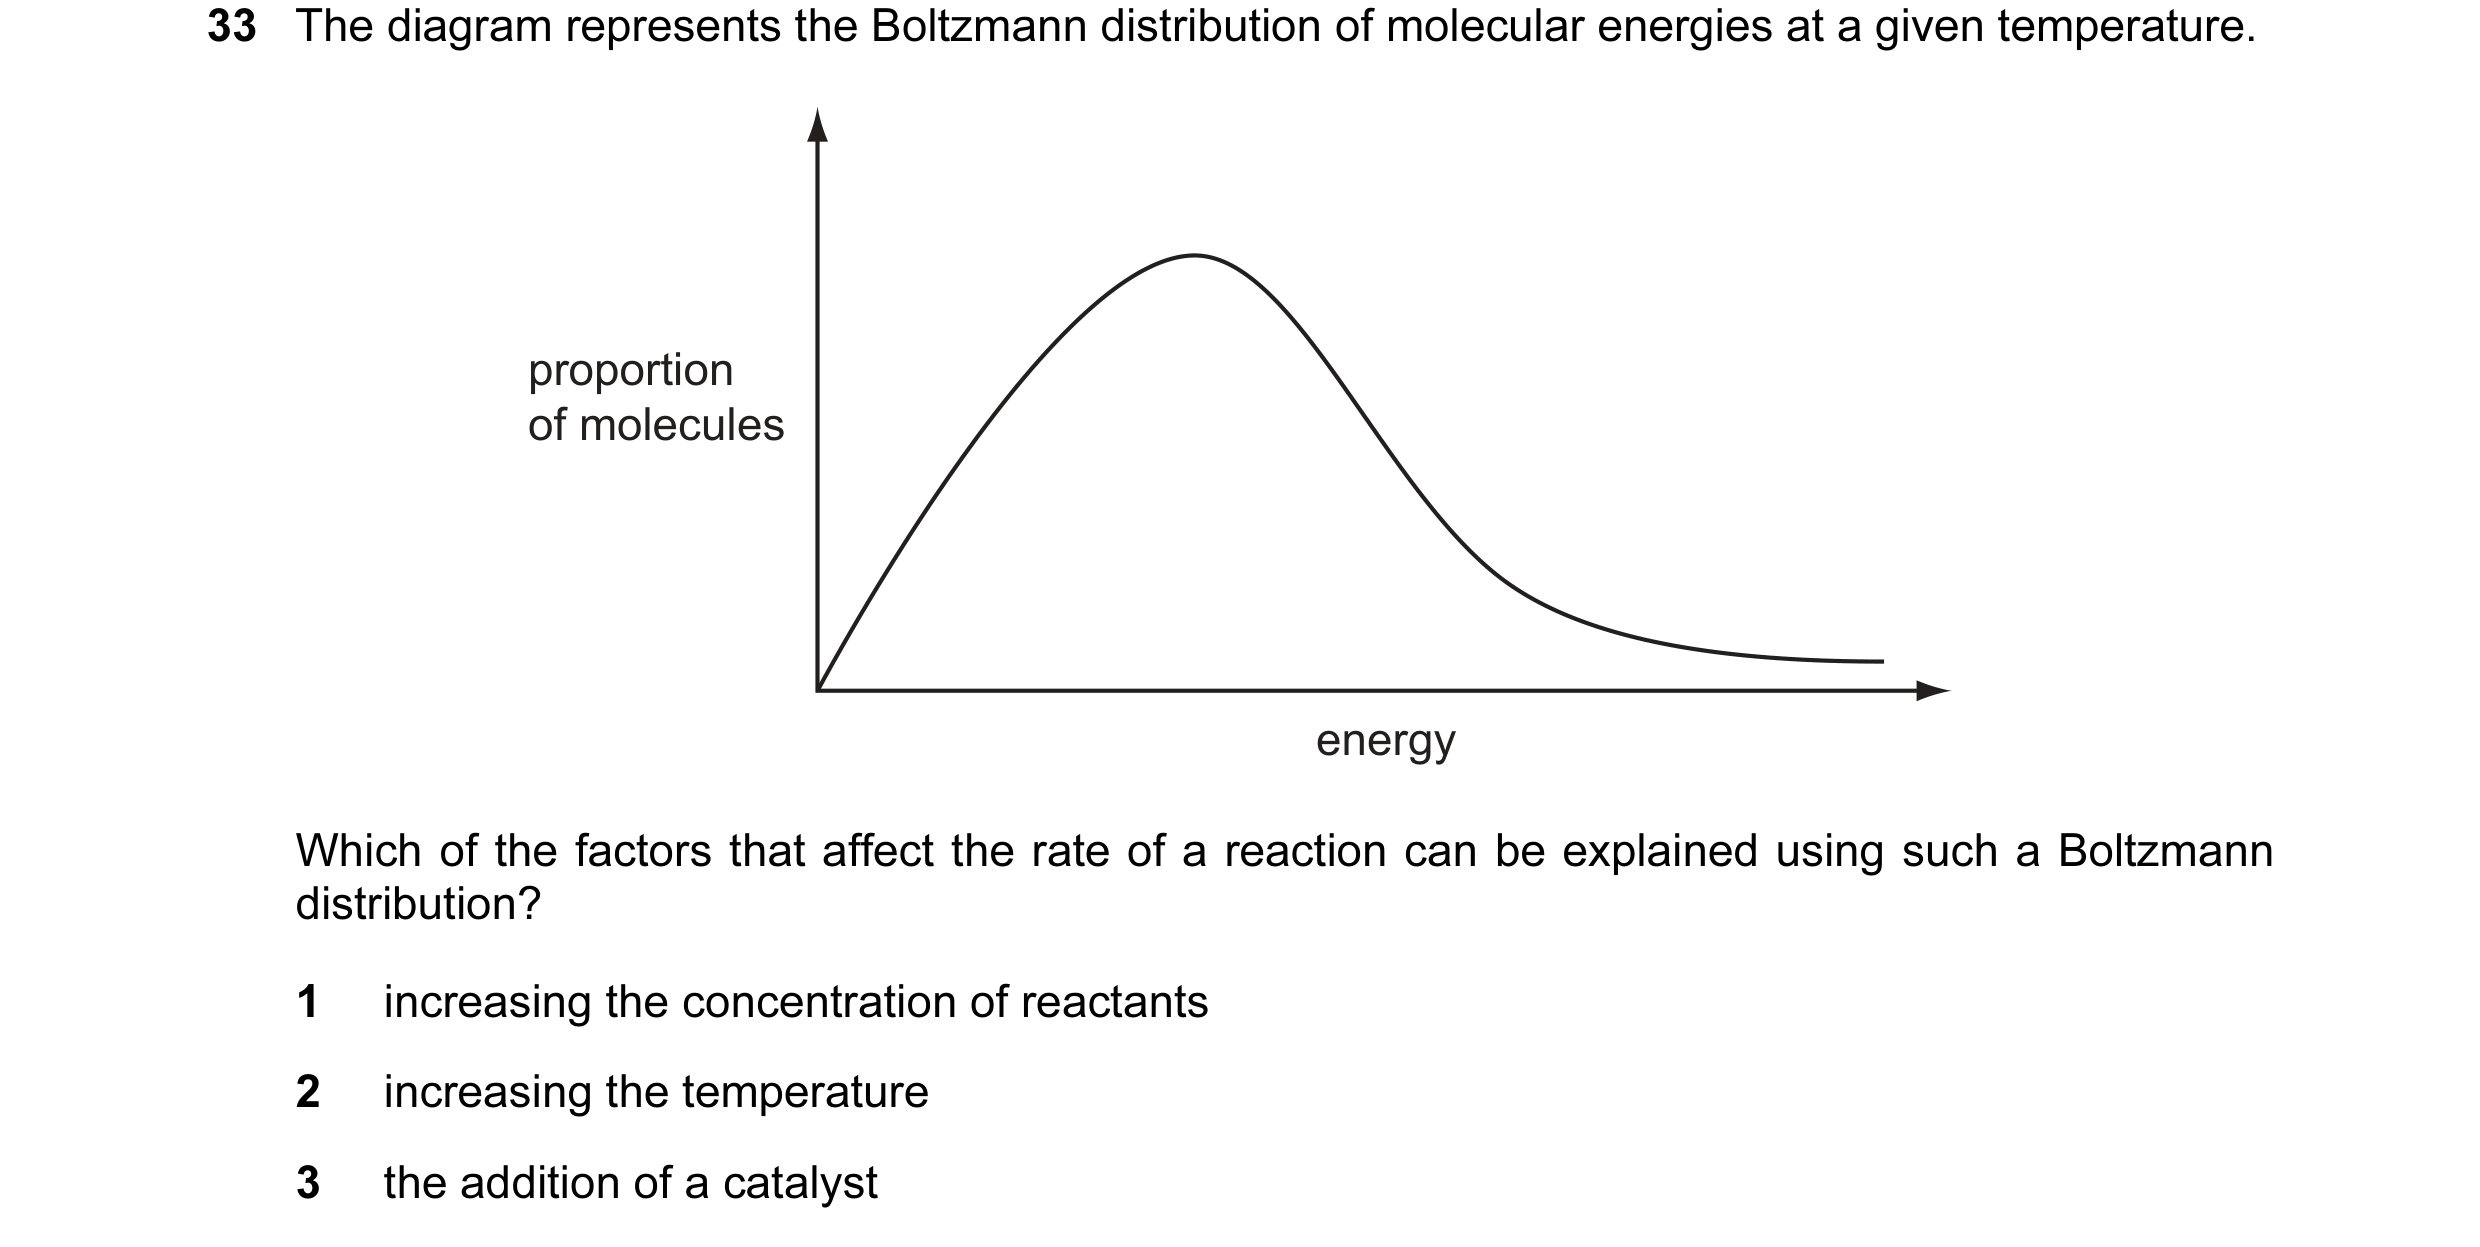
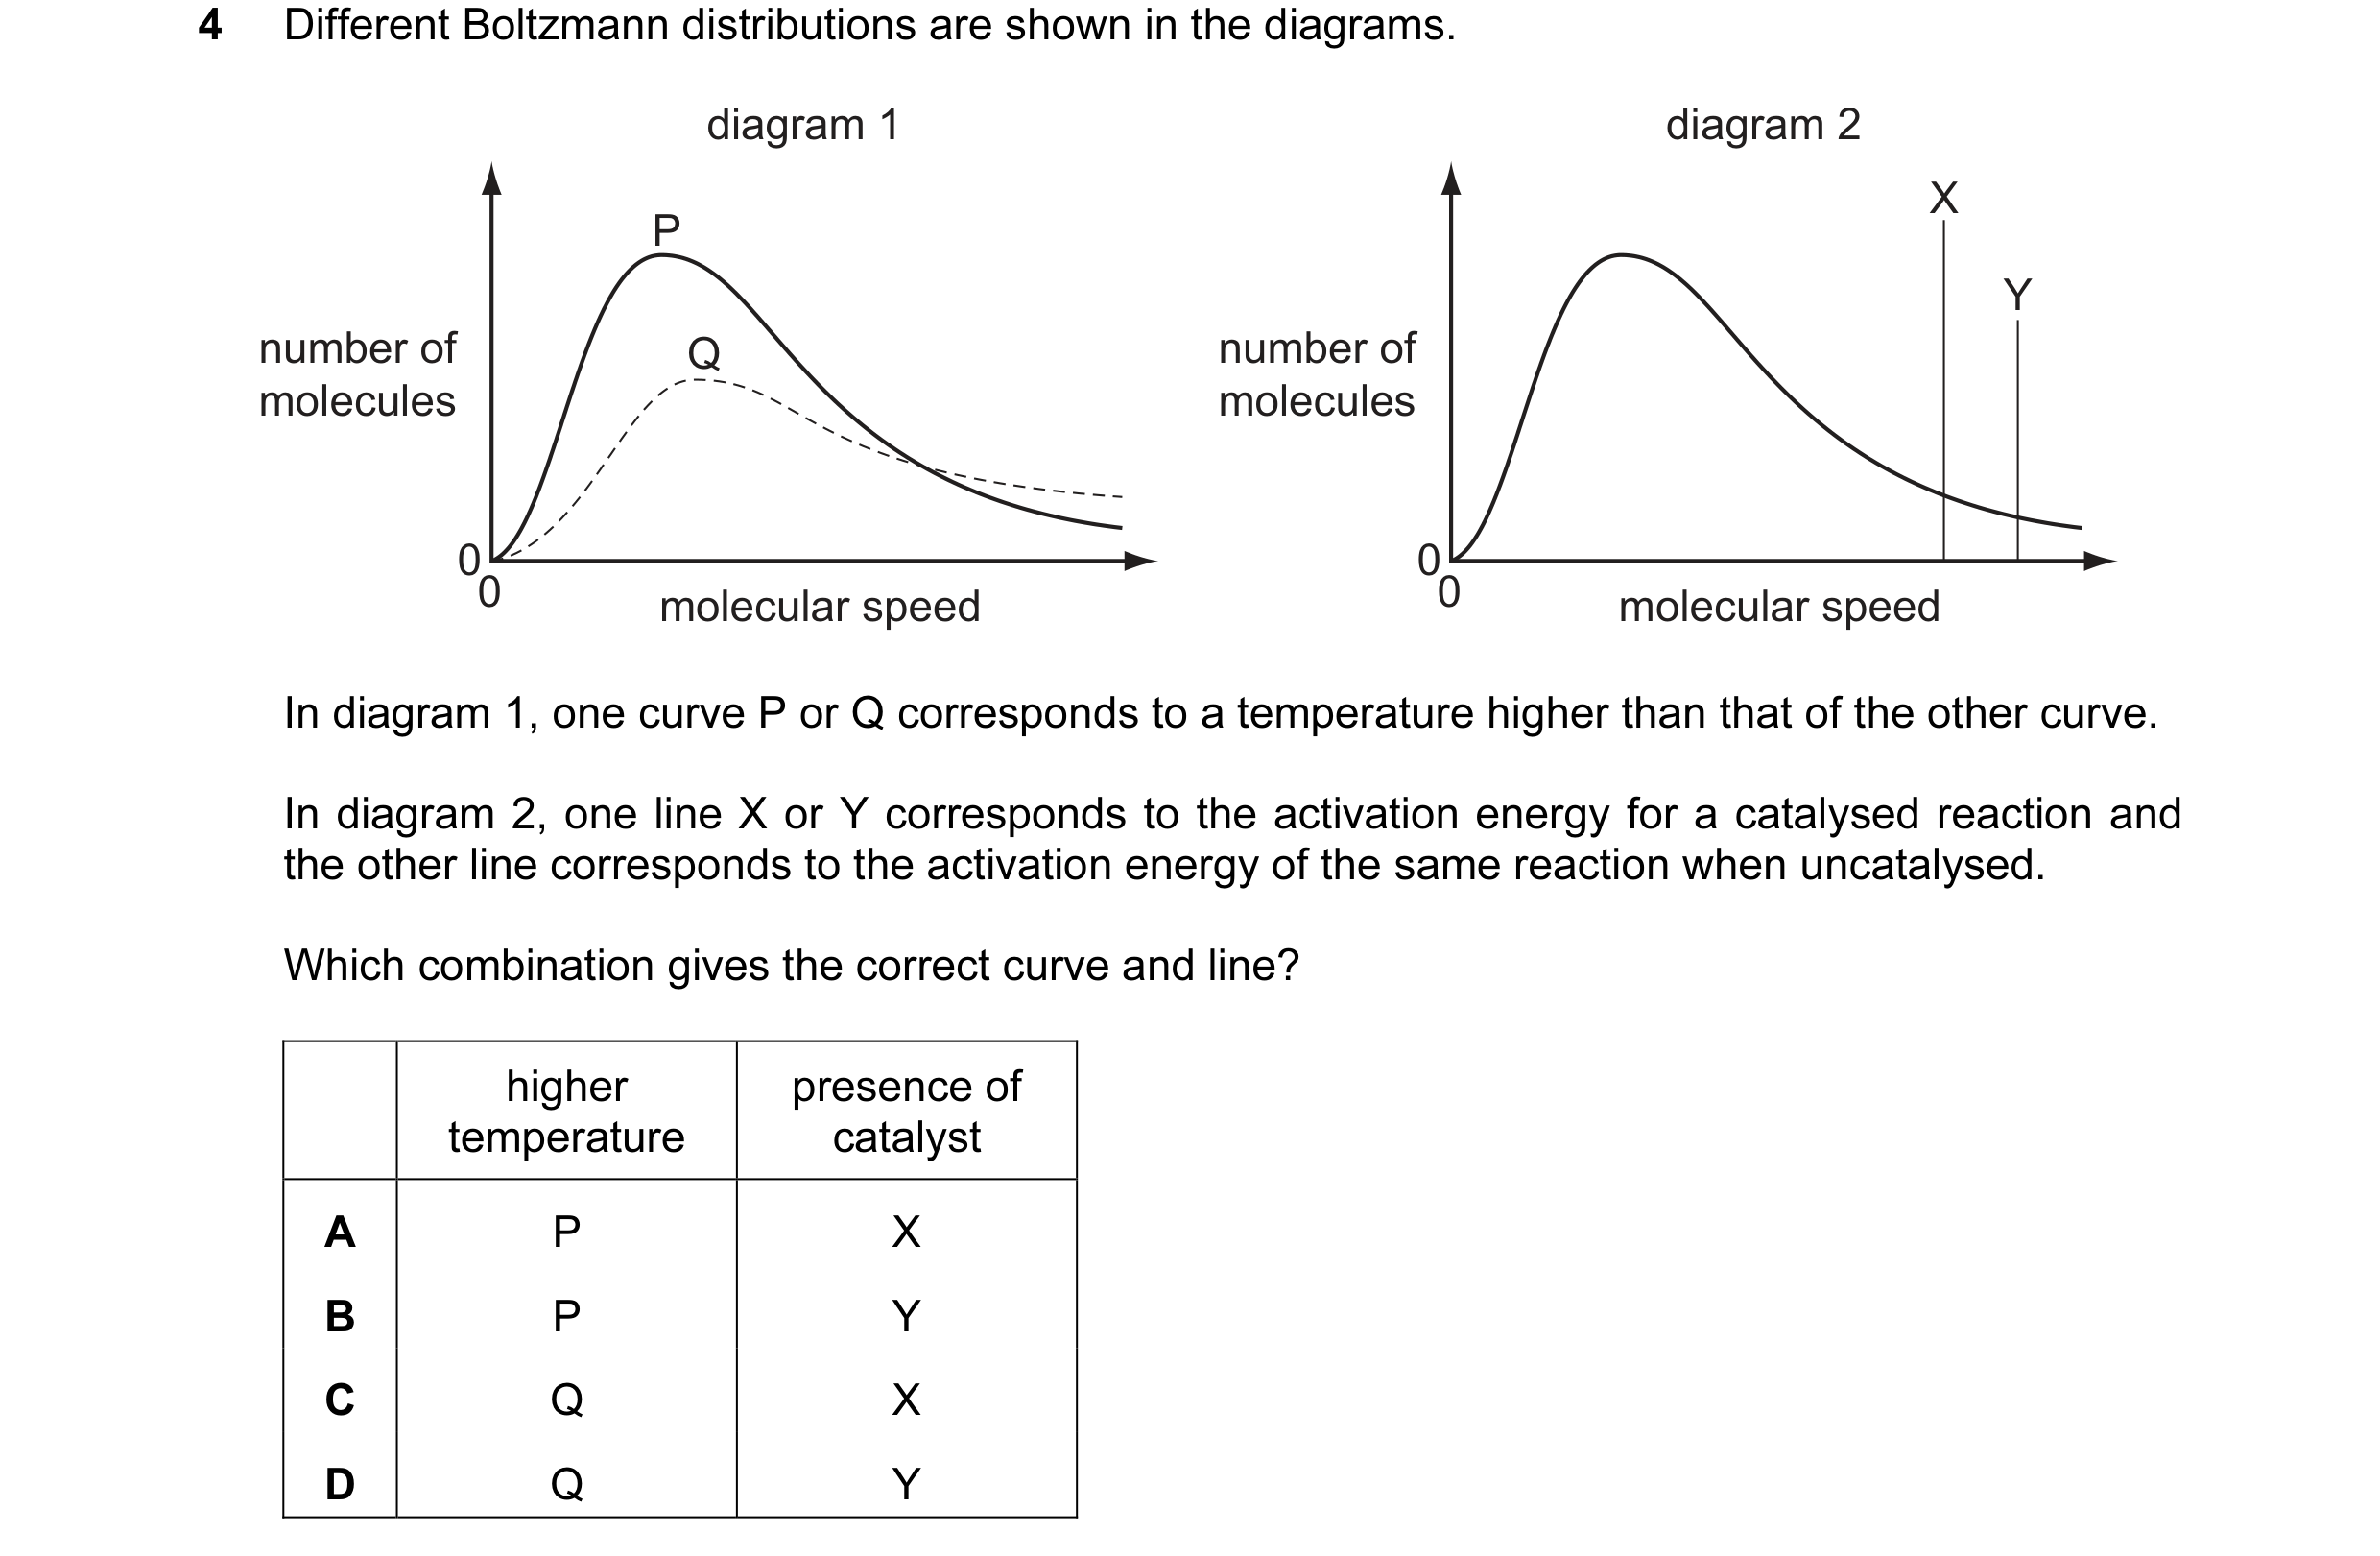 10 / 67
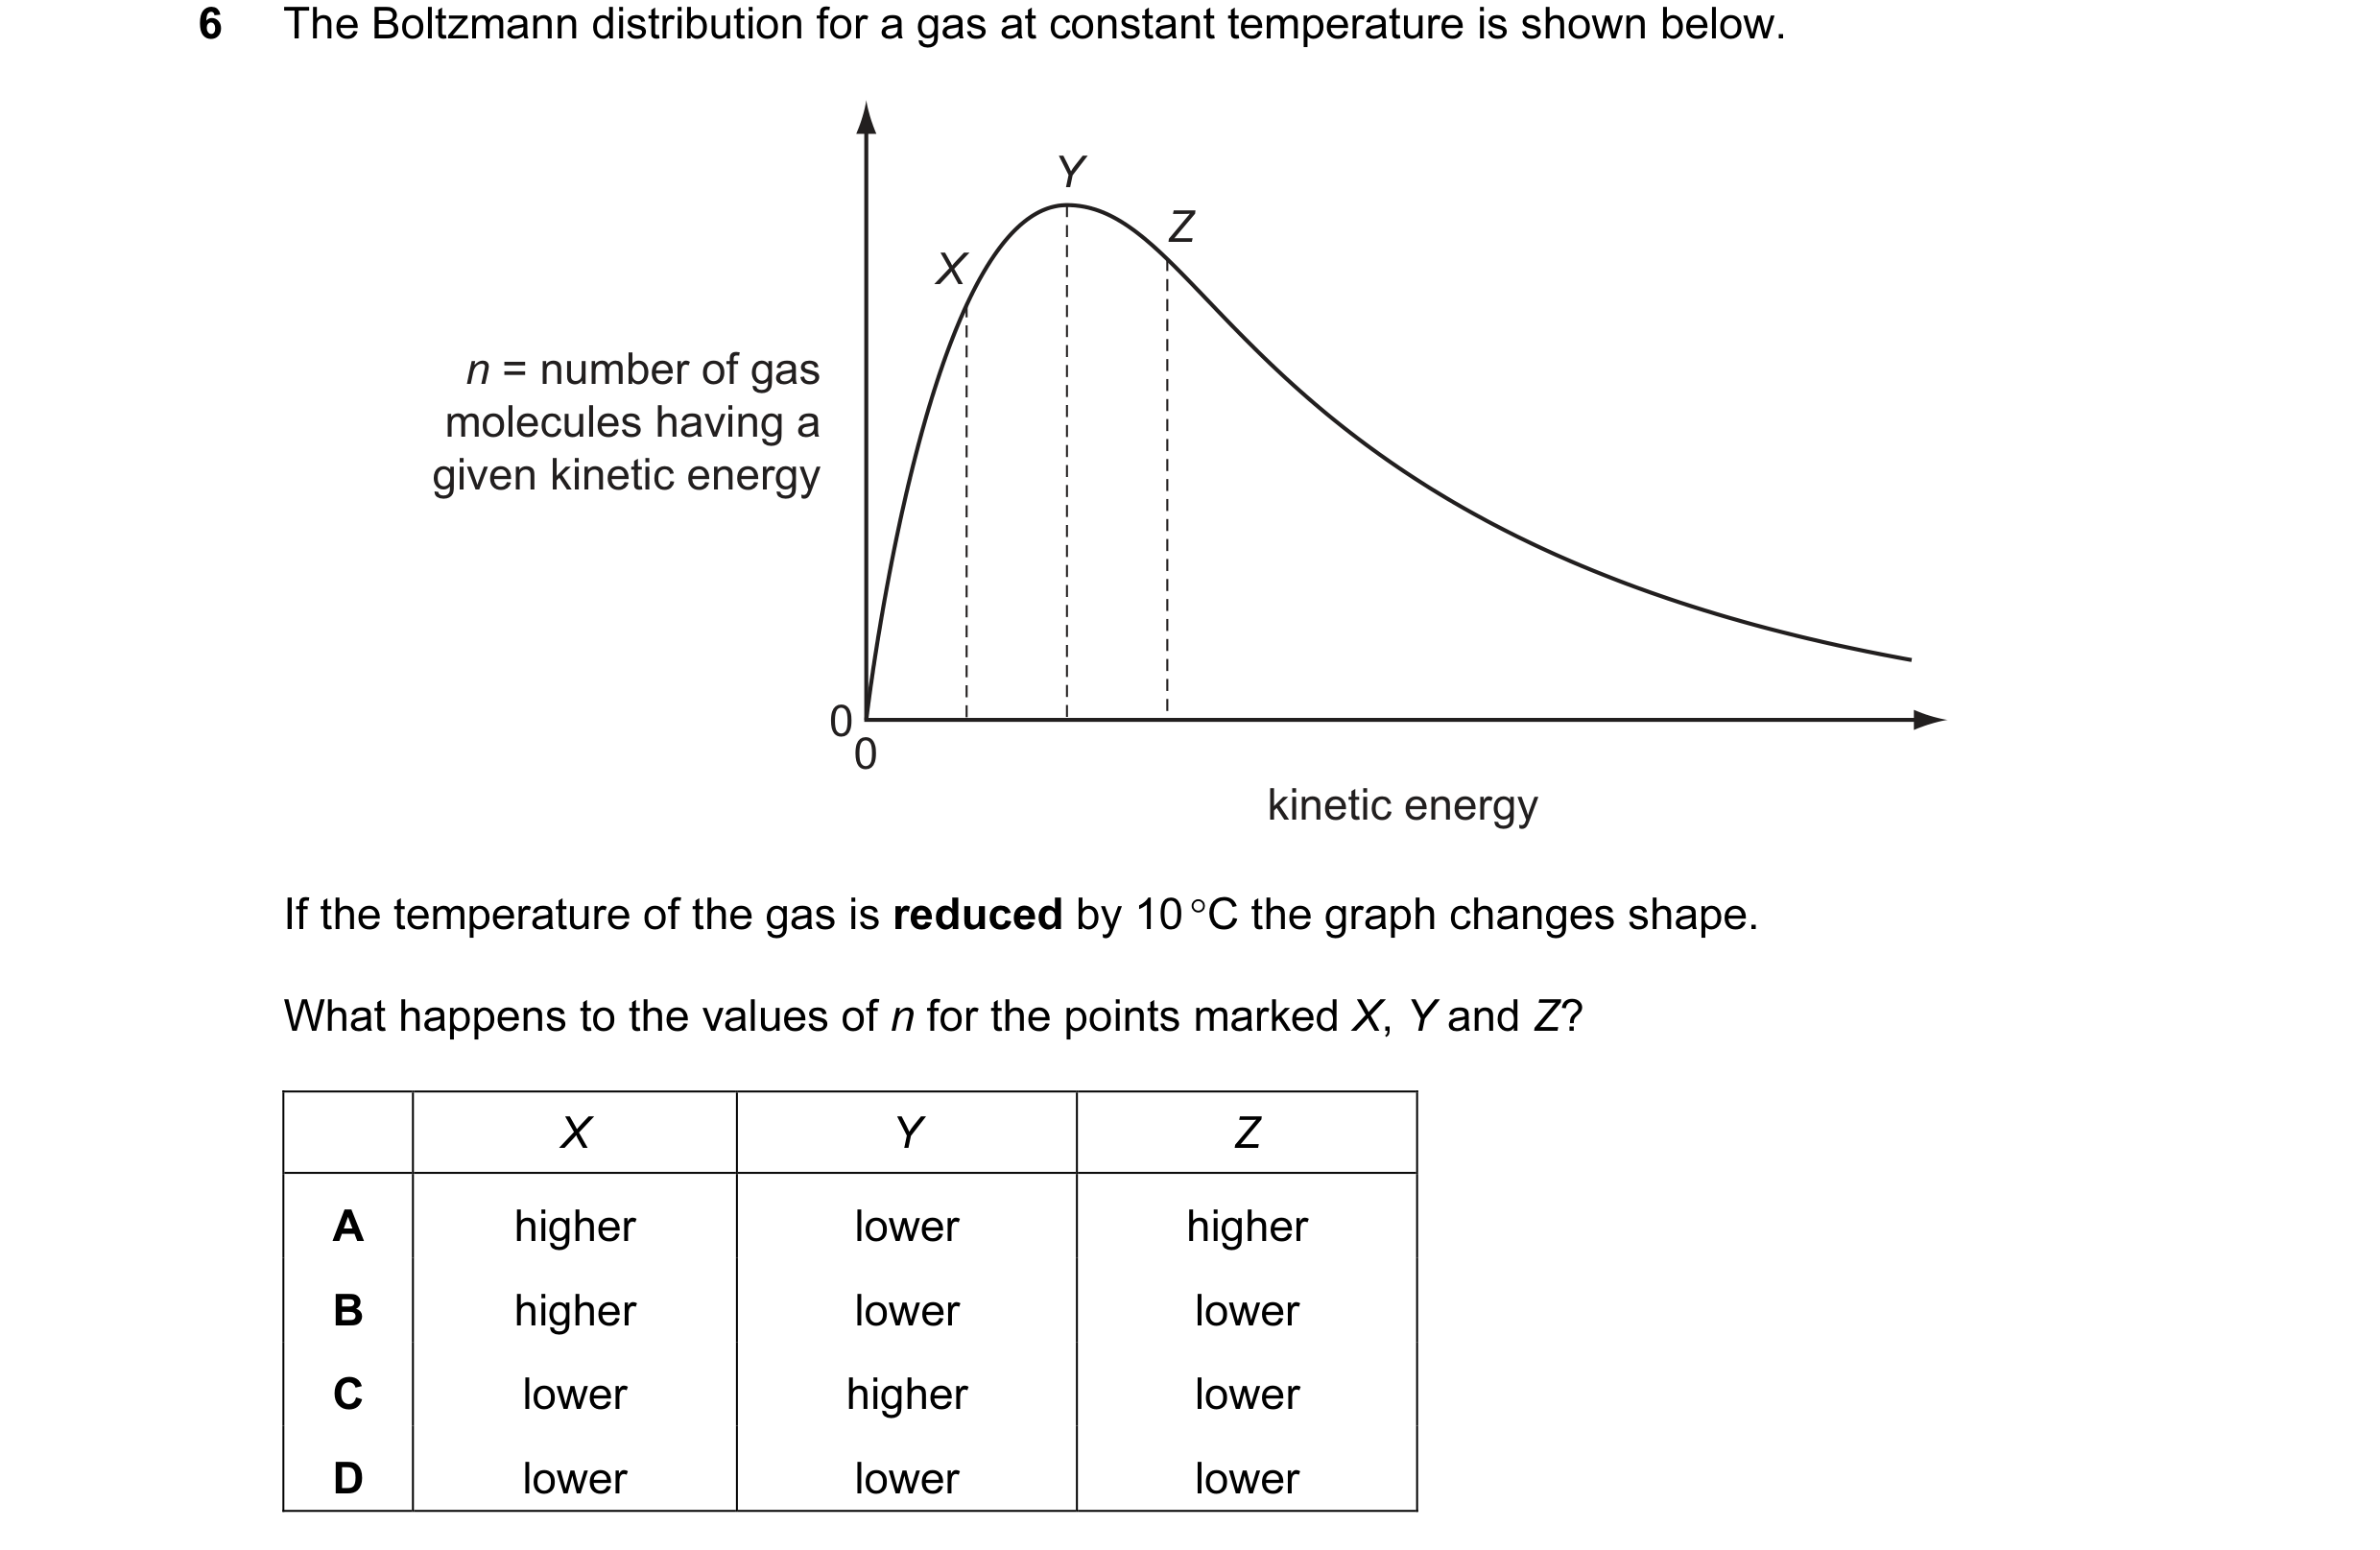 11 / 67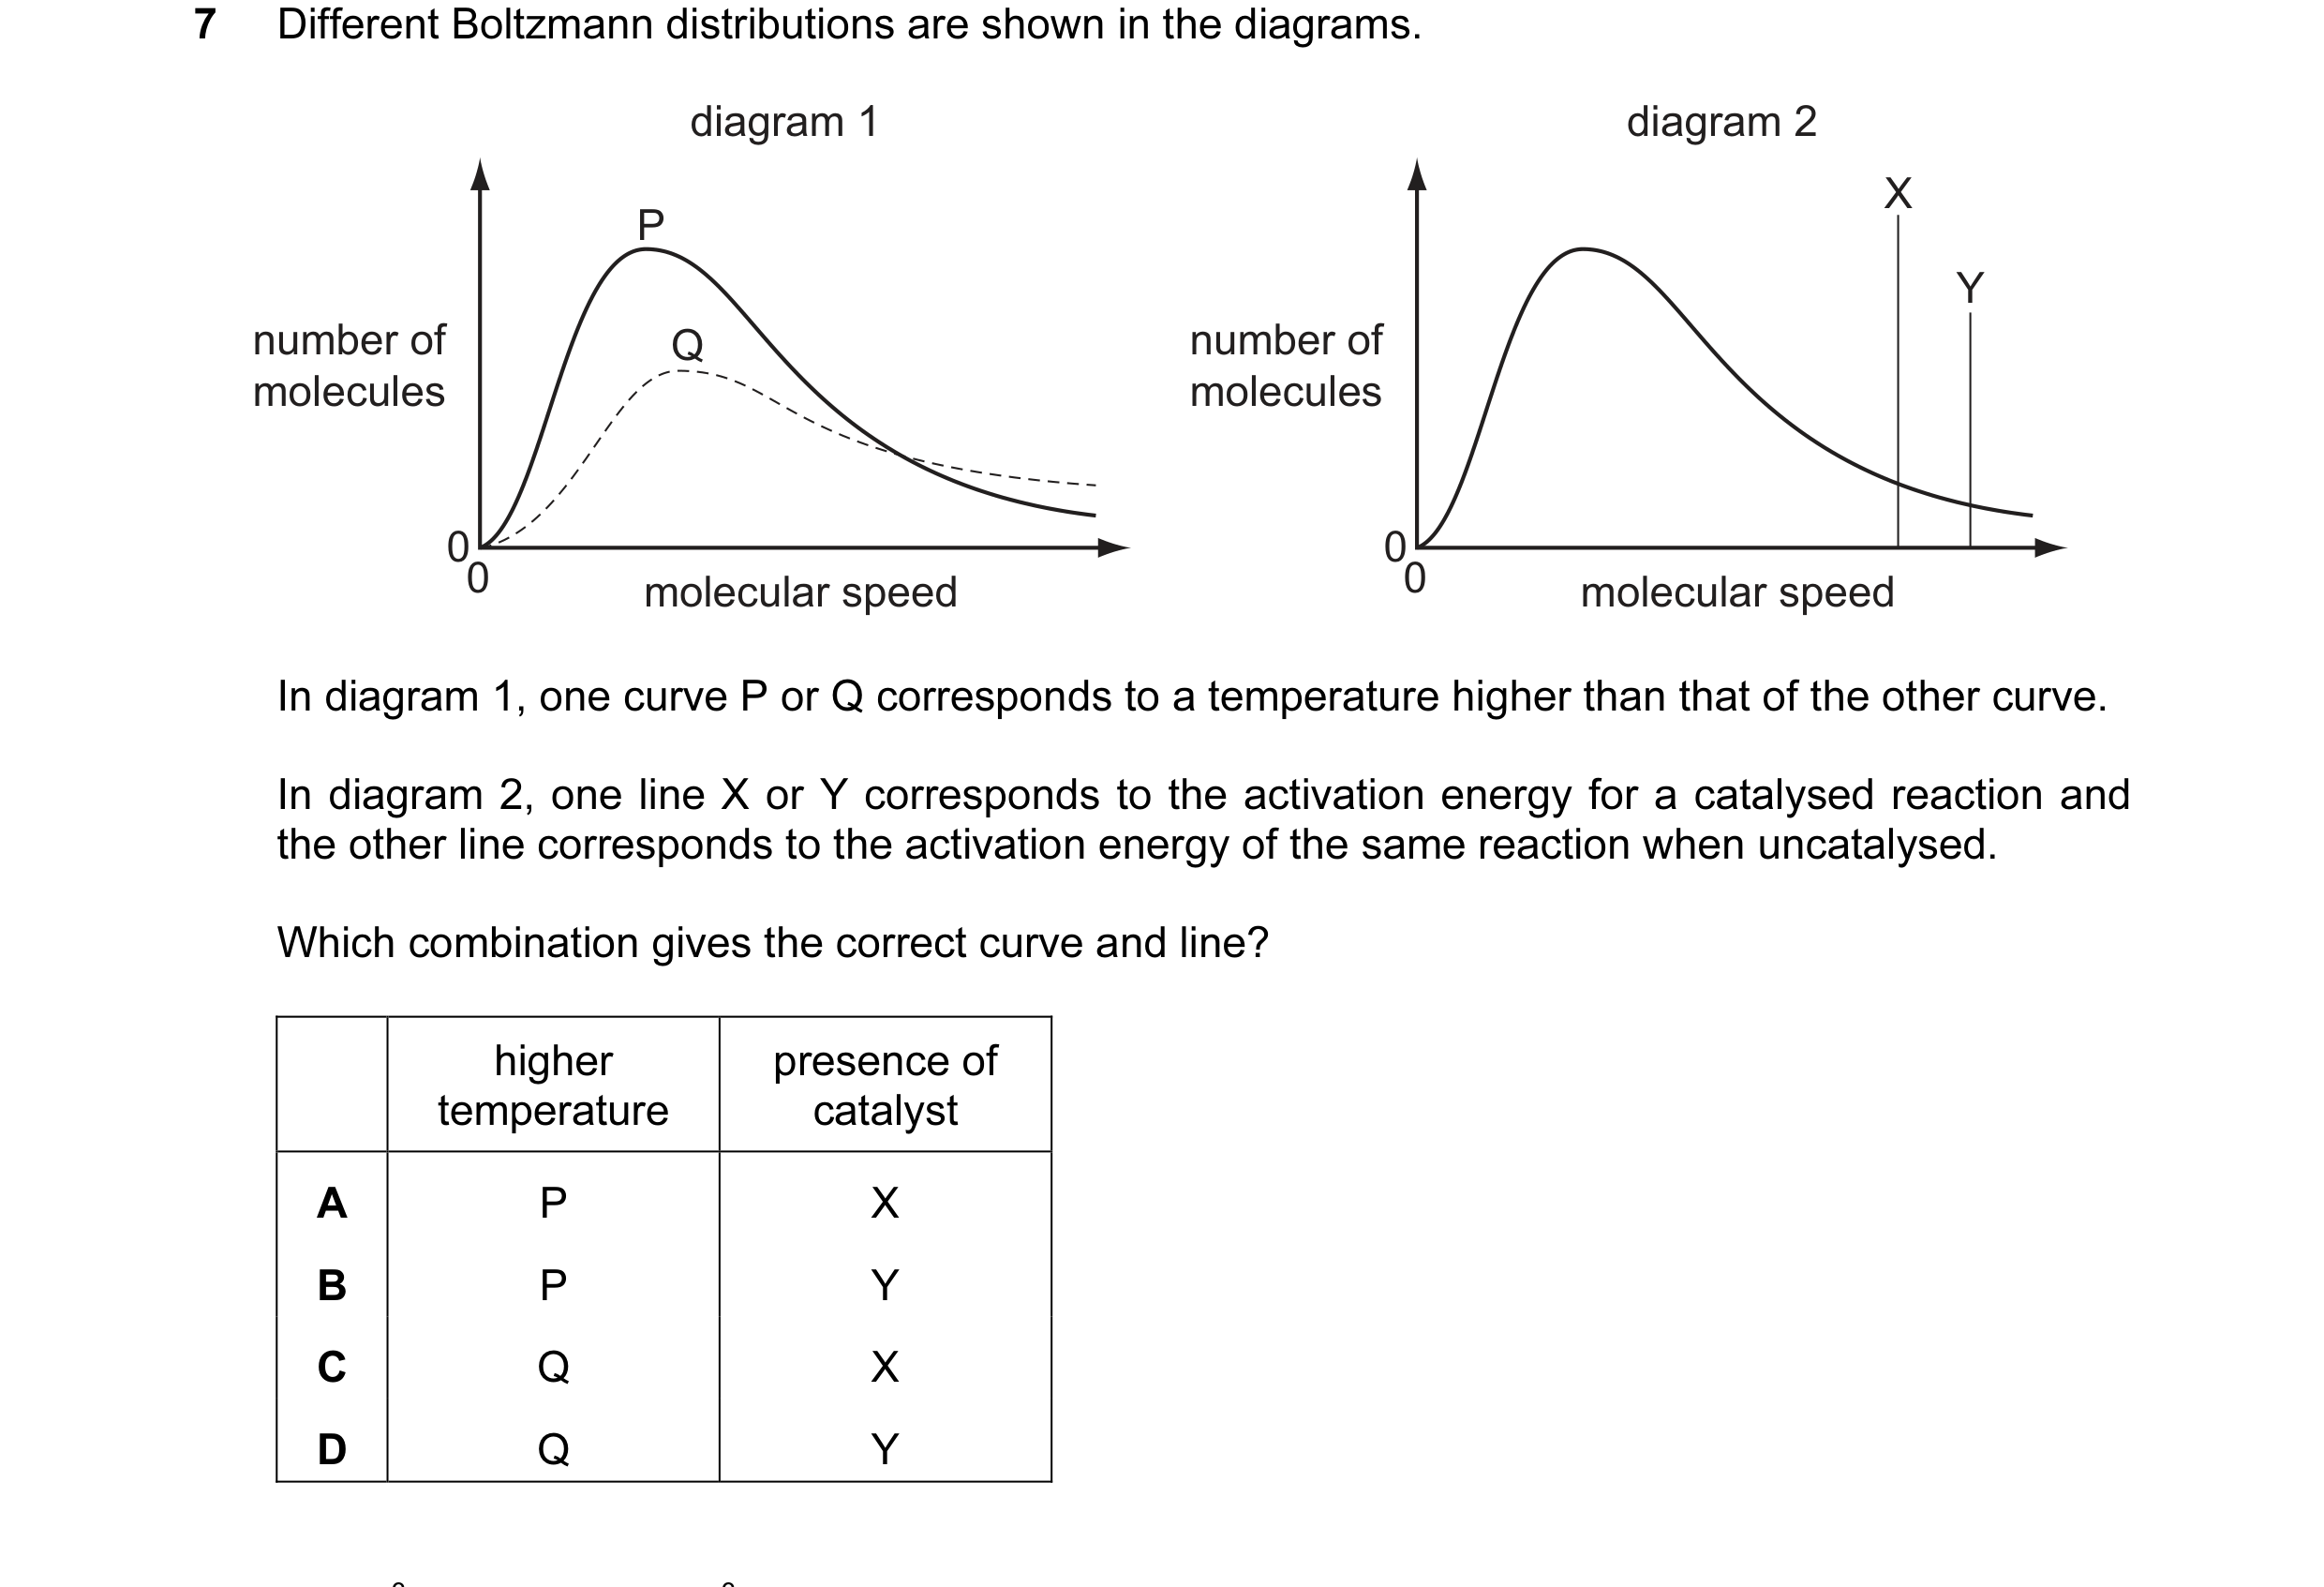
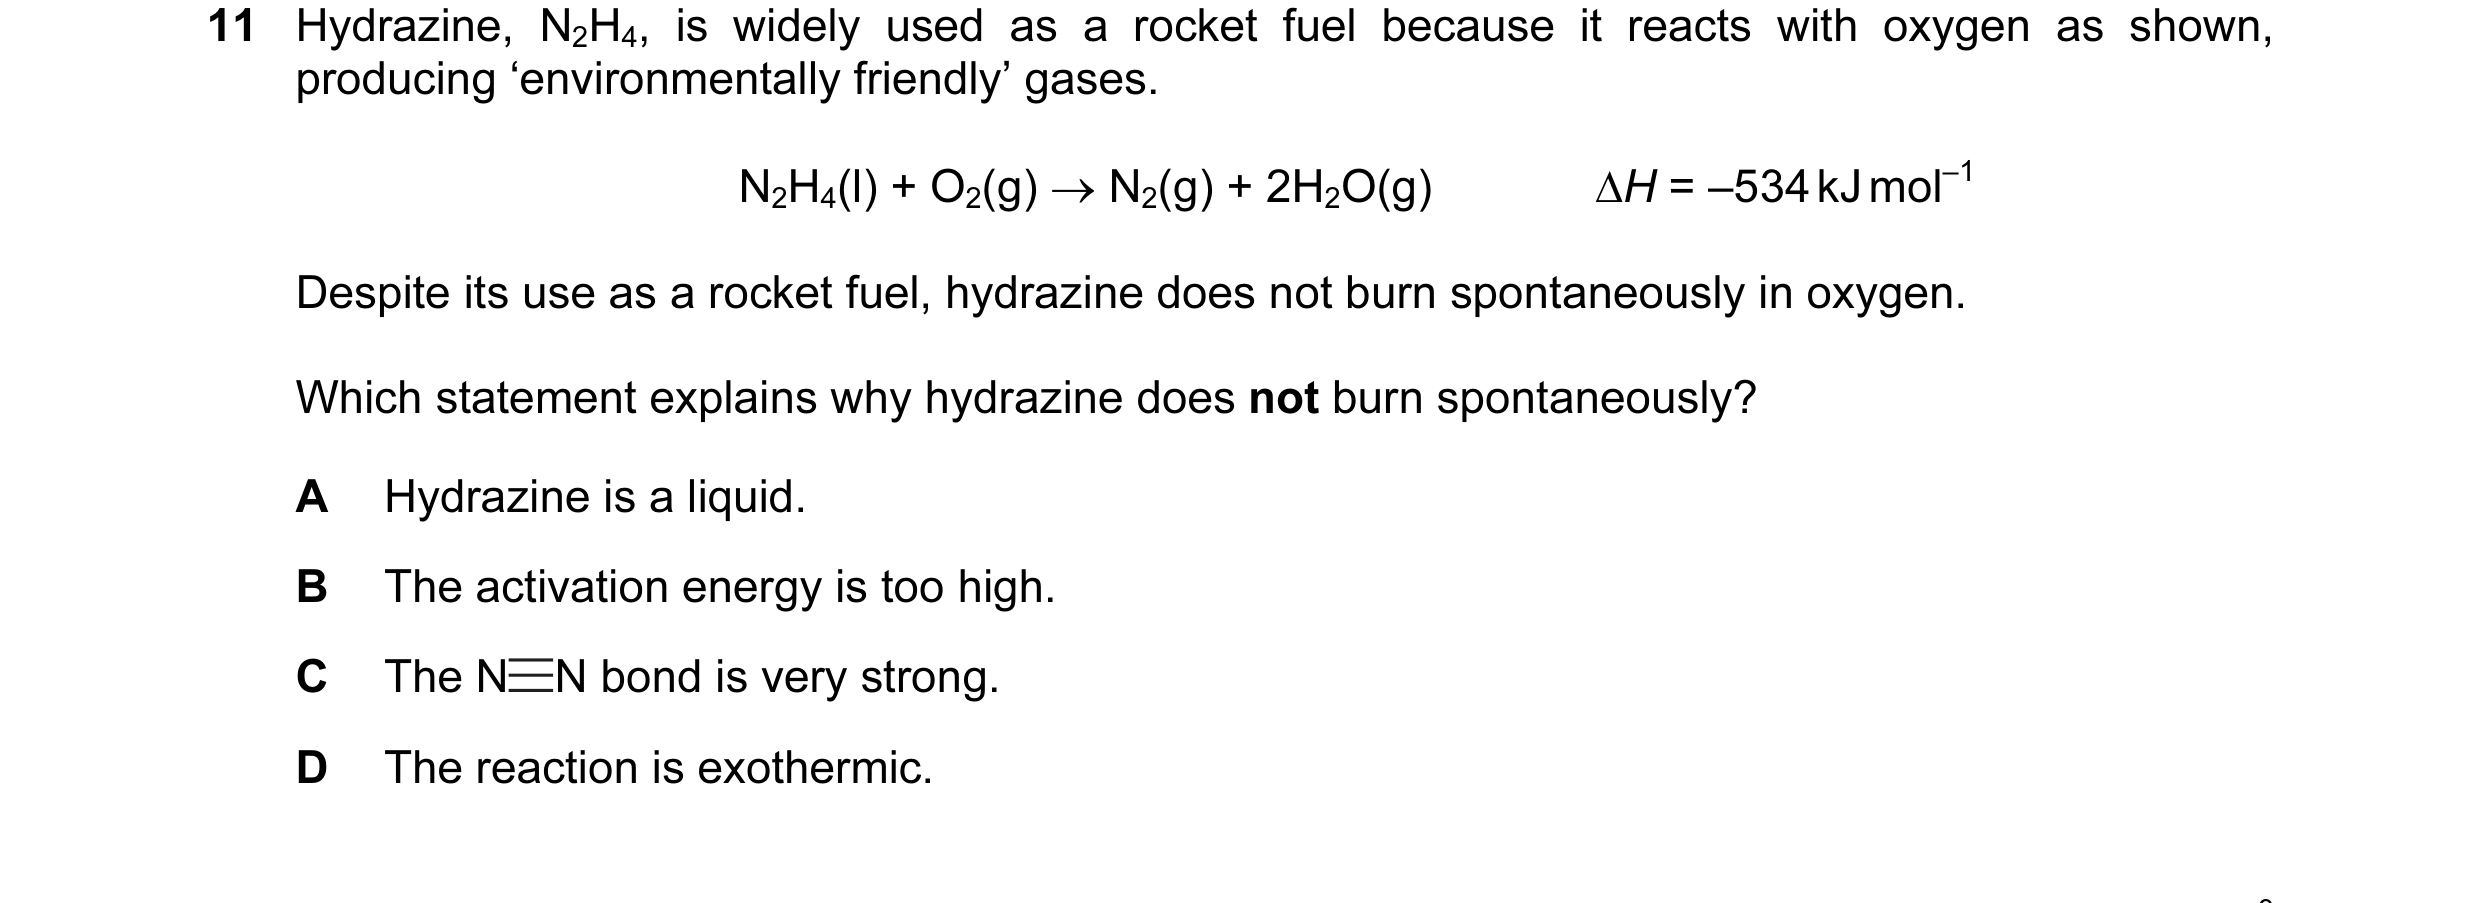 12 / 67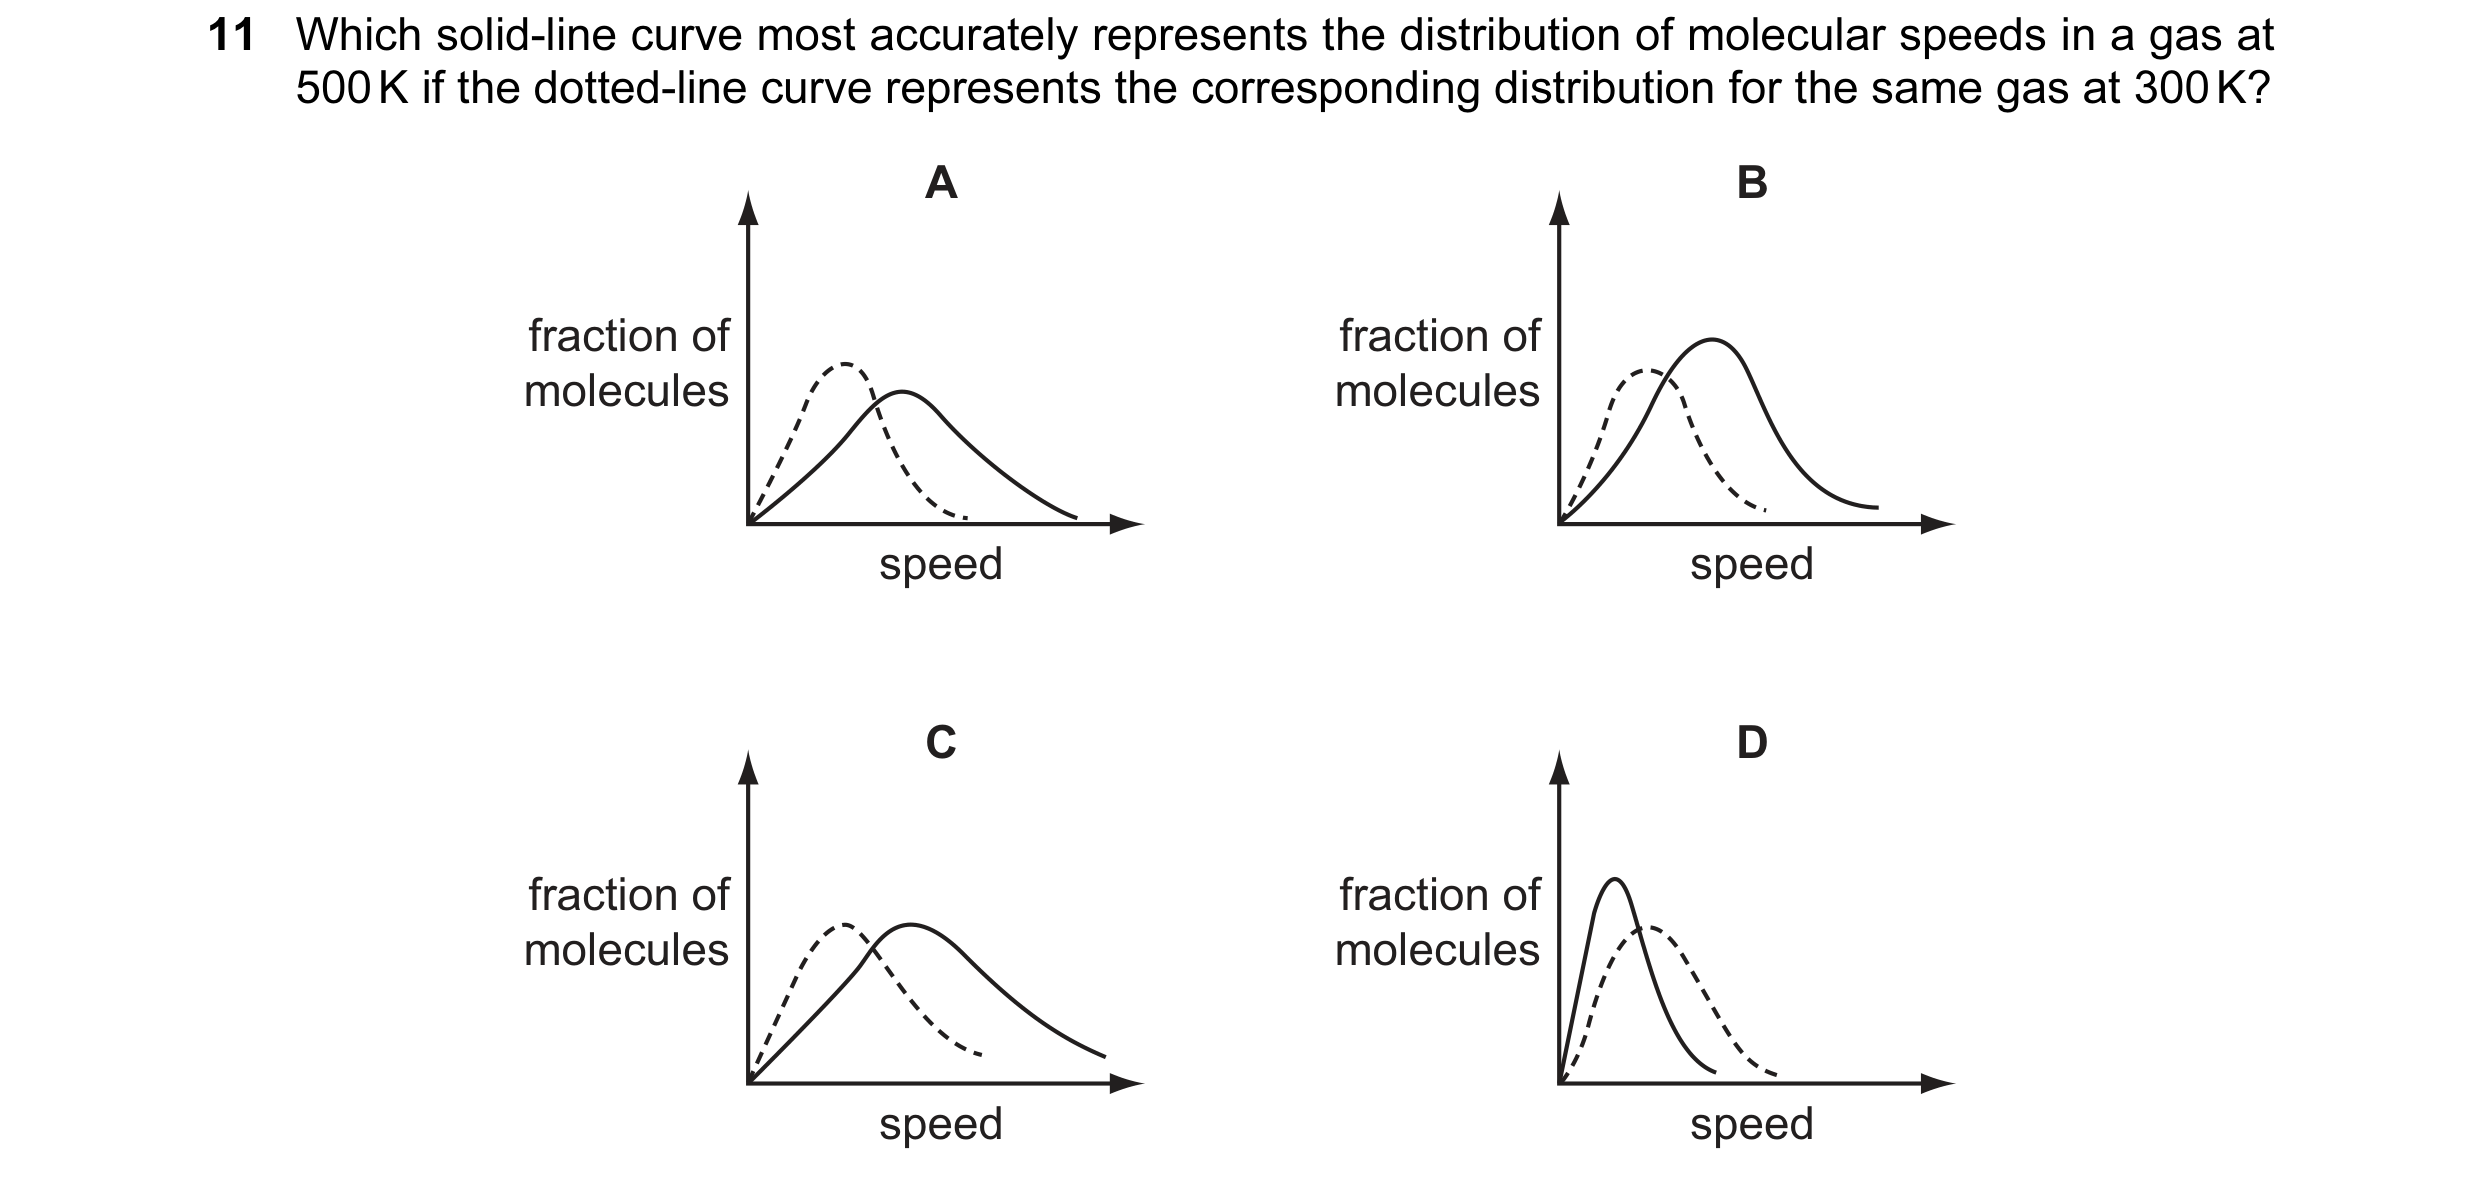
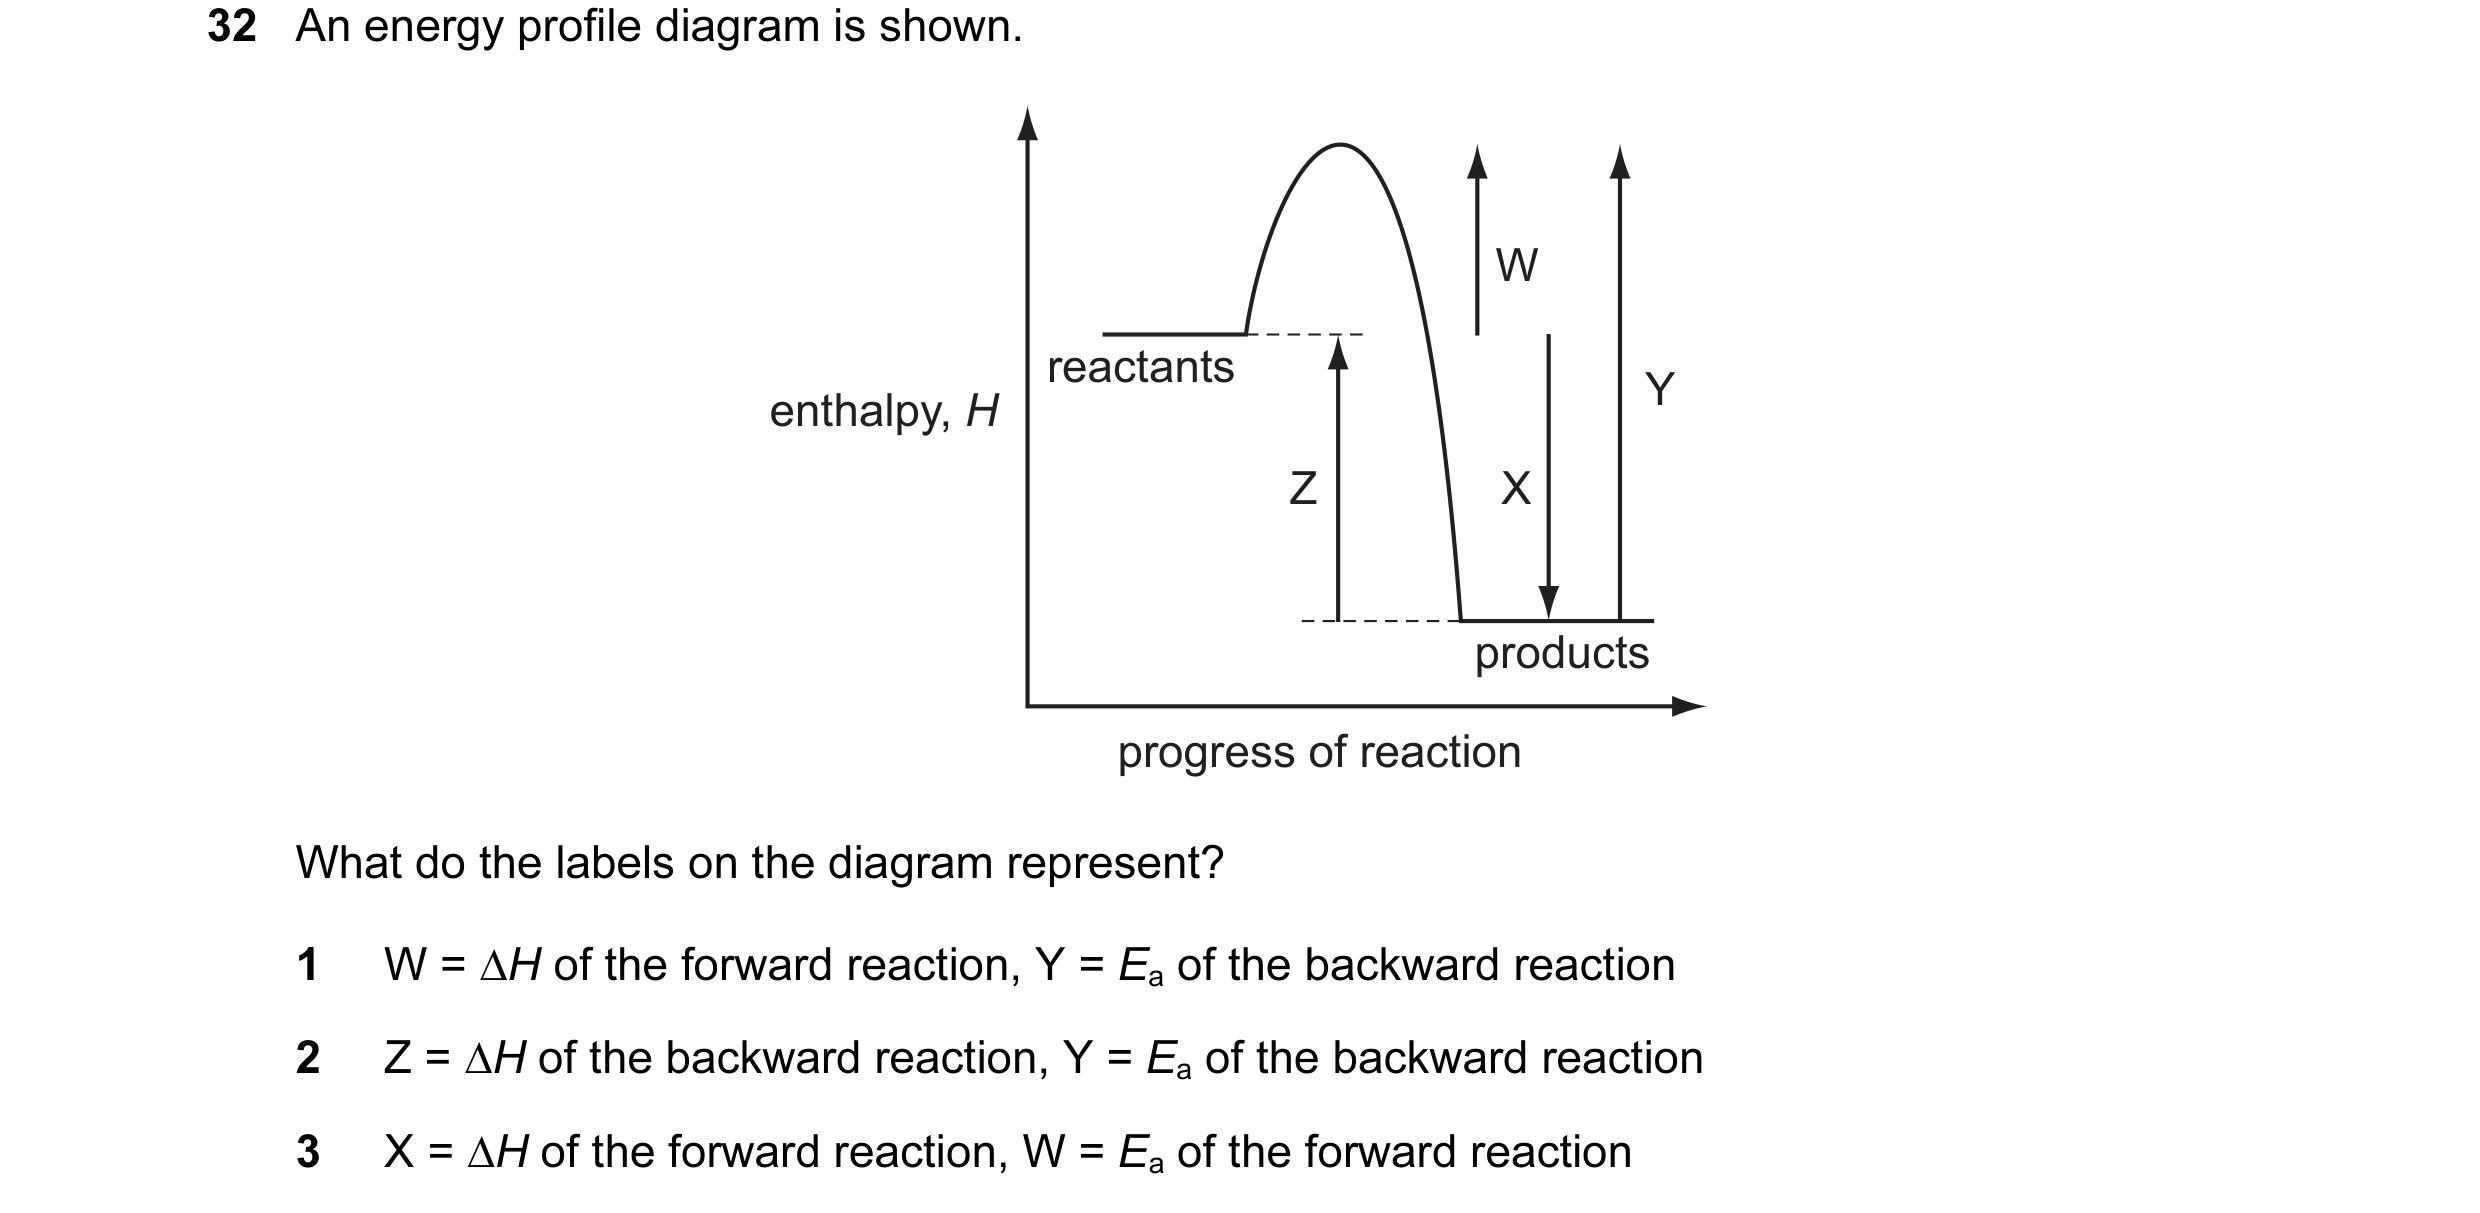 13 / 67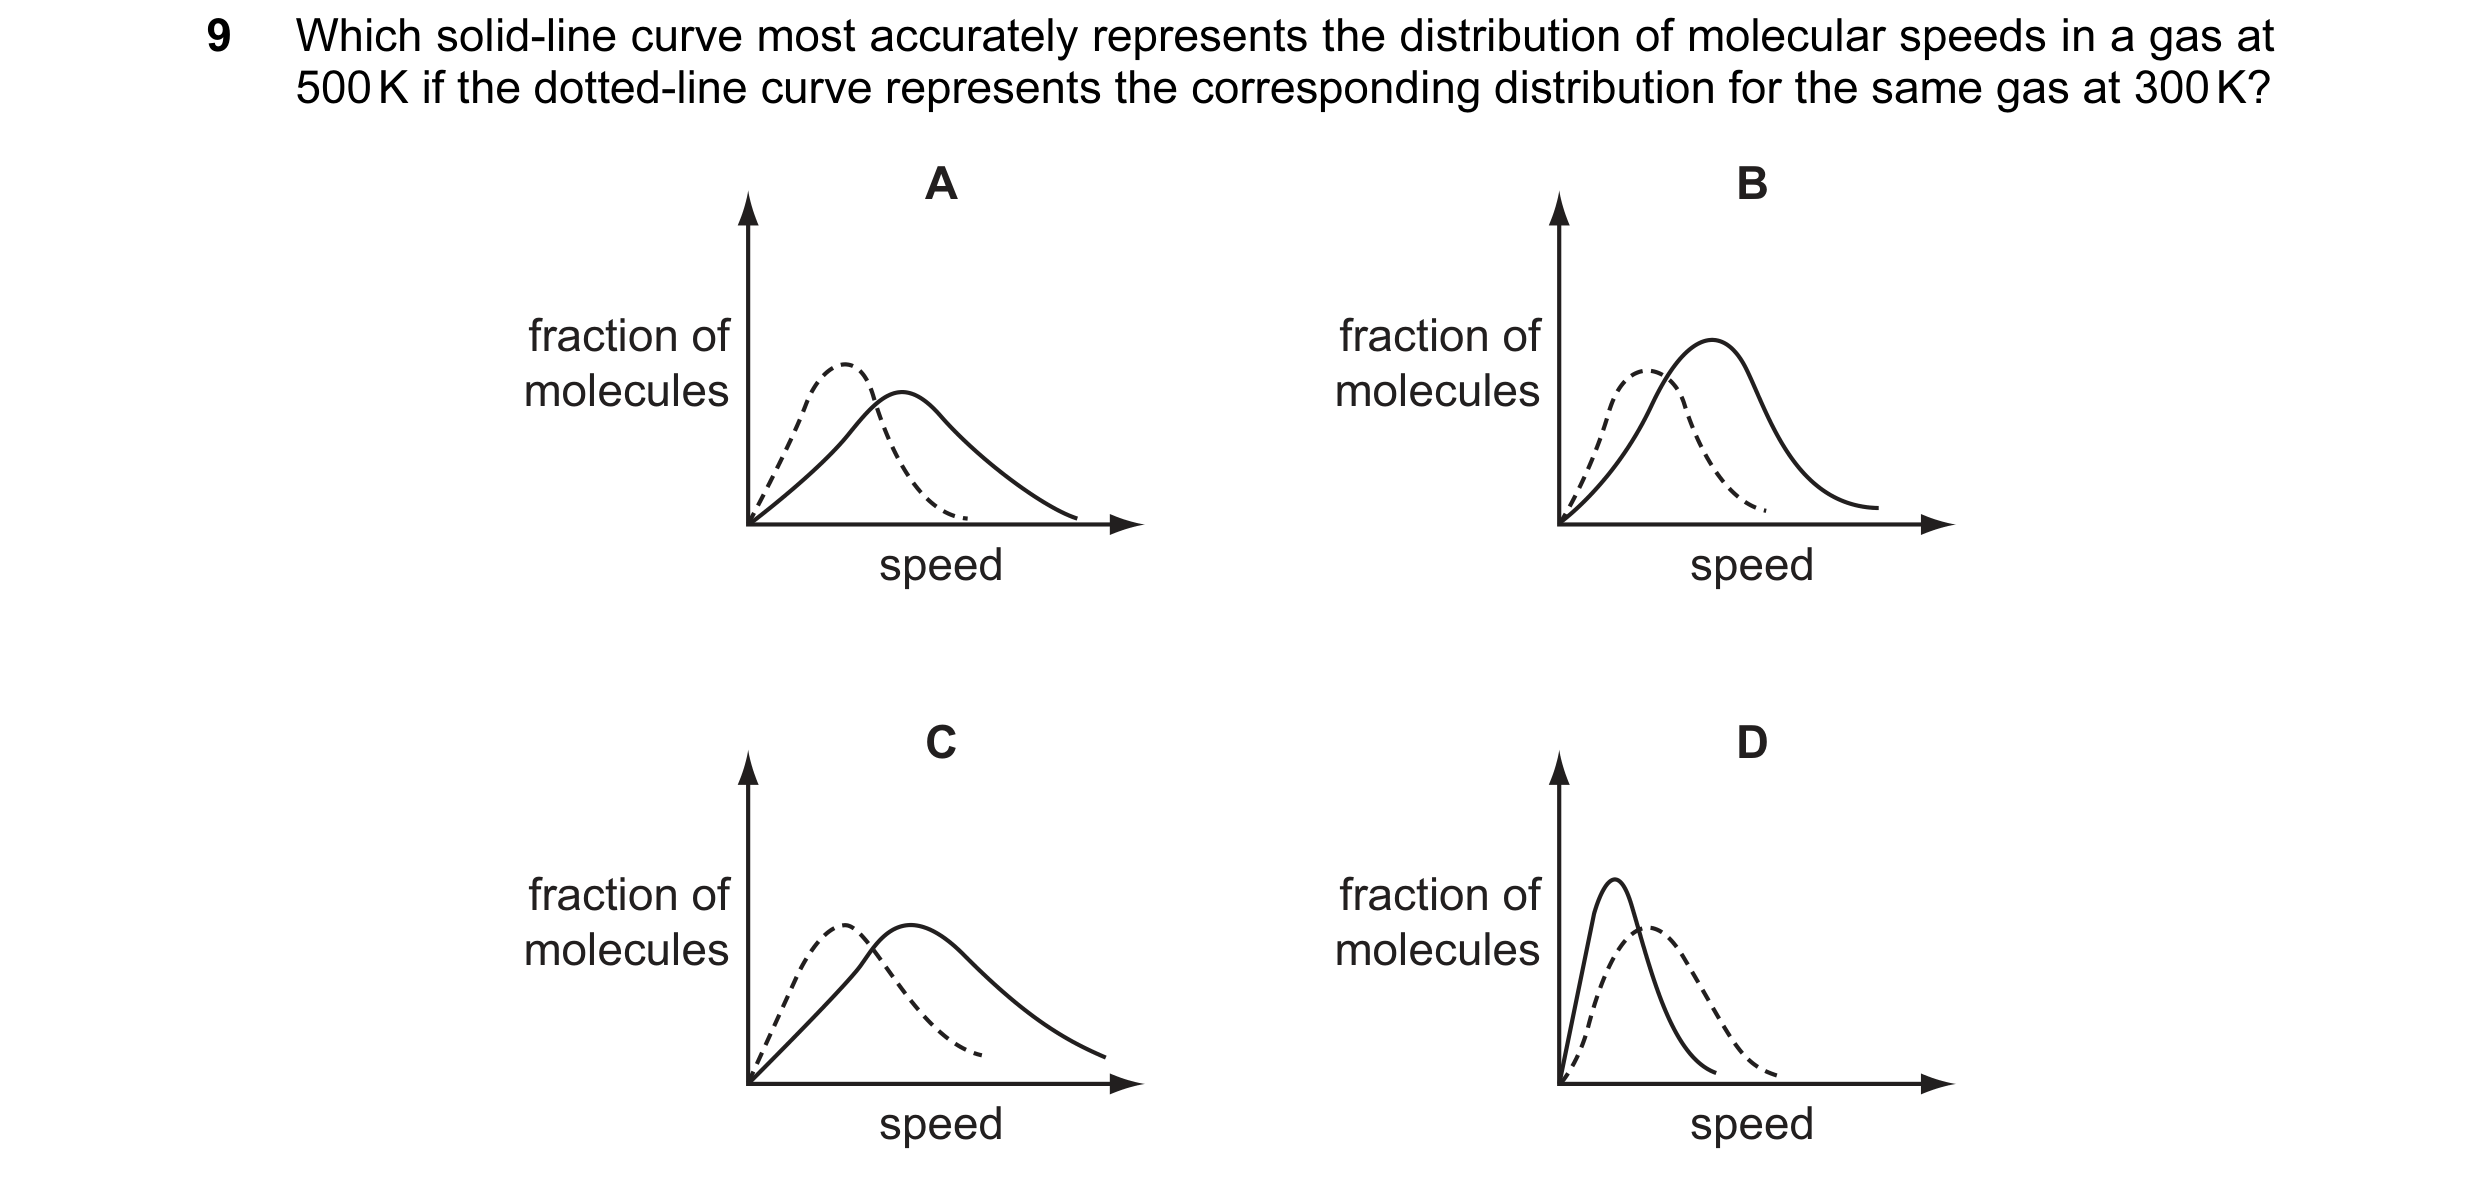
 14 / 67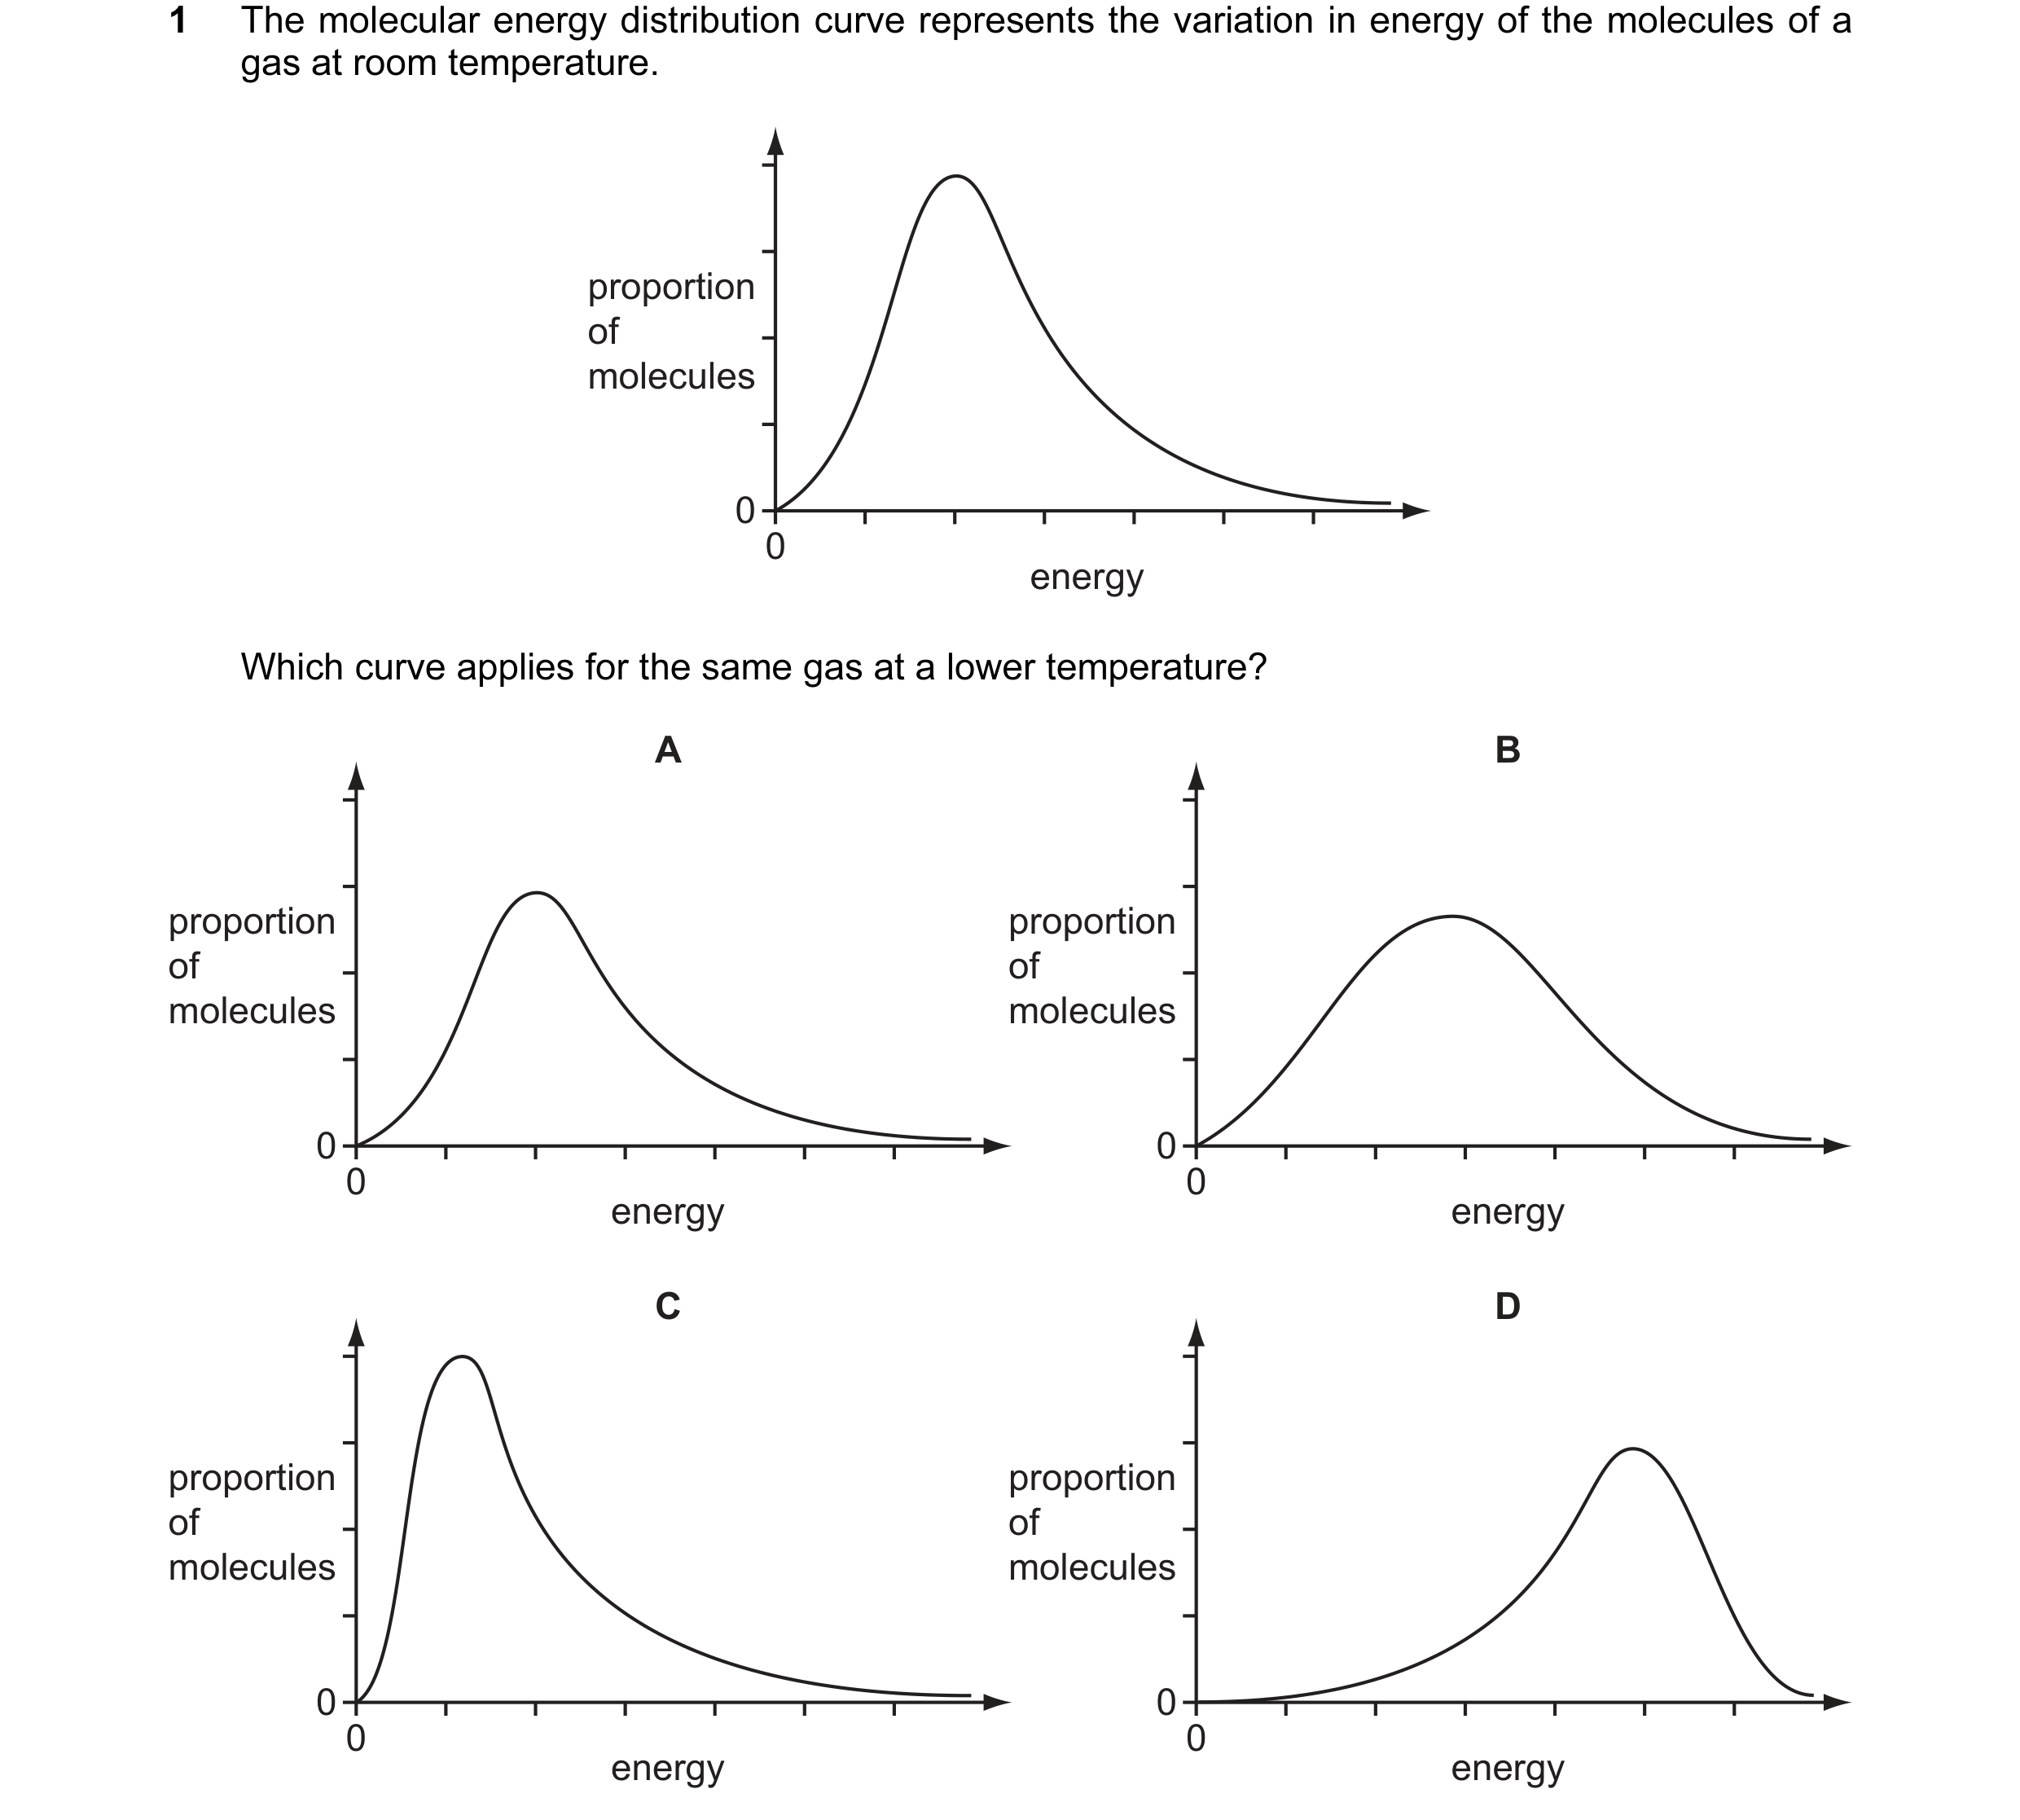
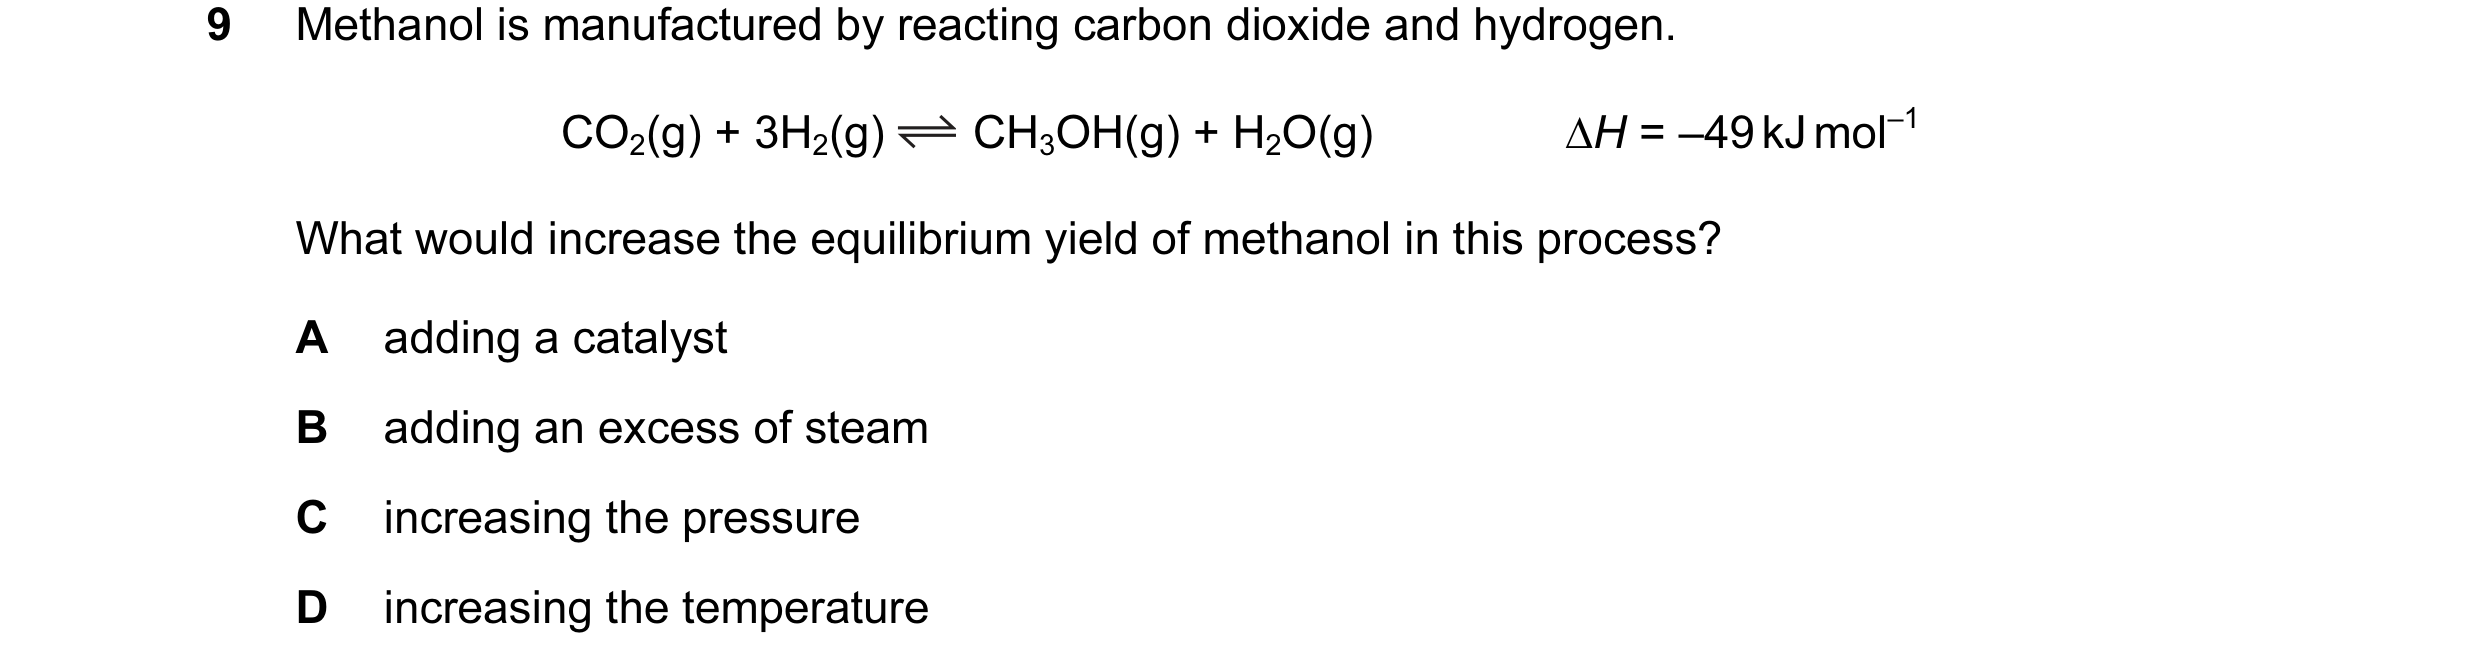
 15 / 67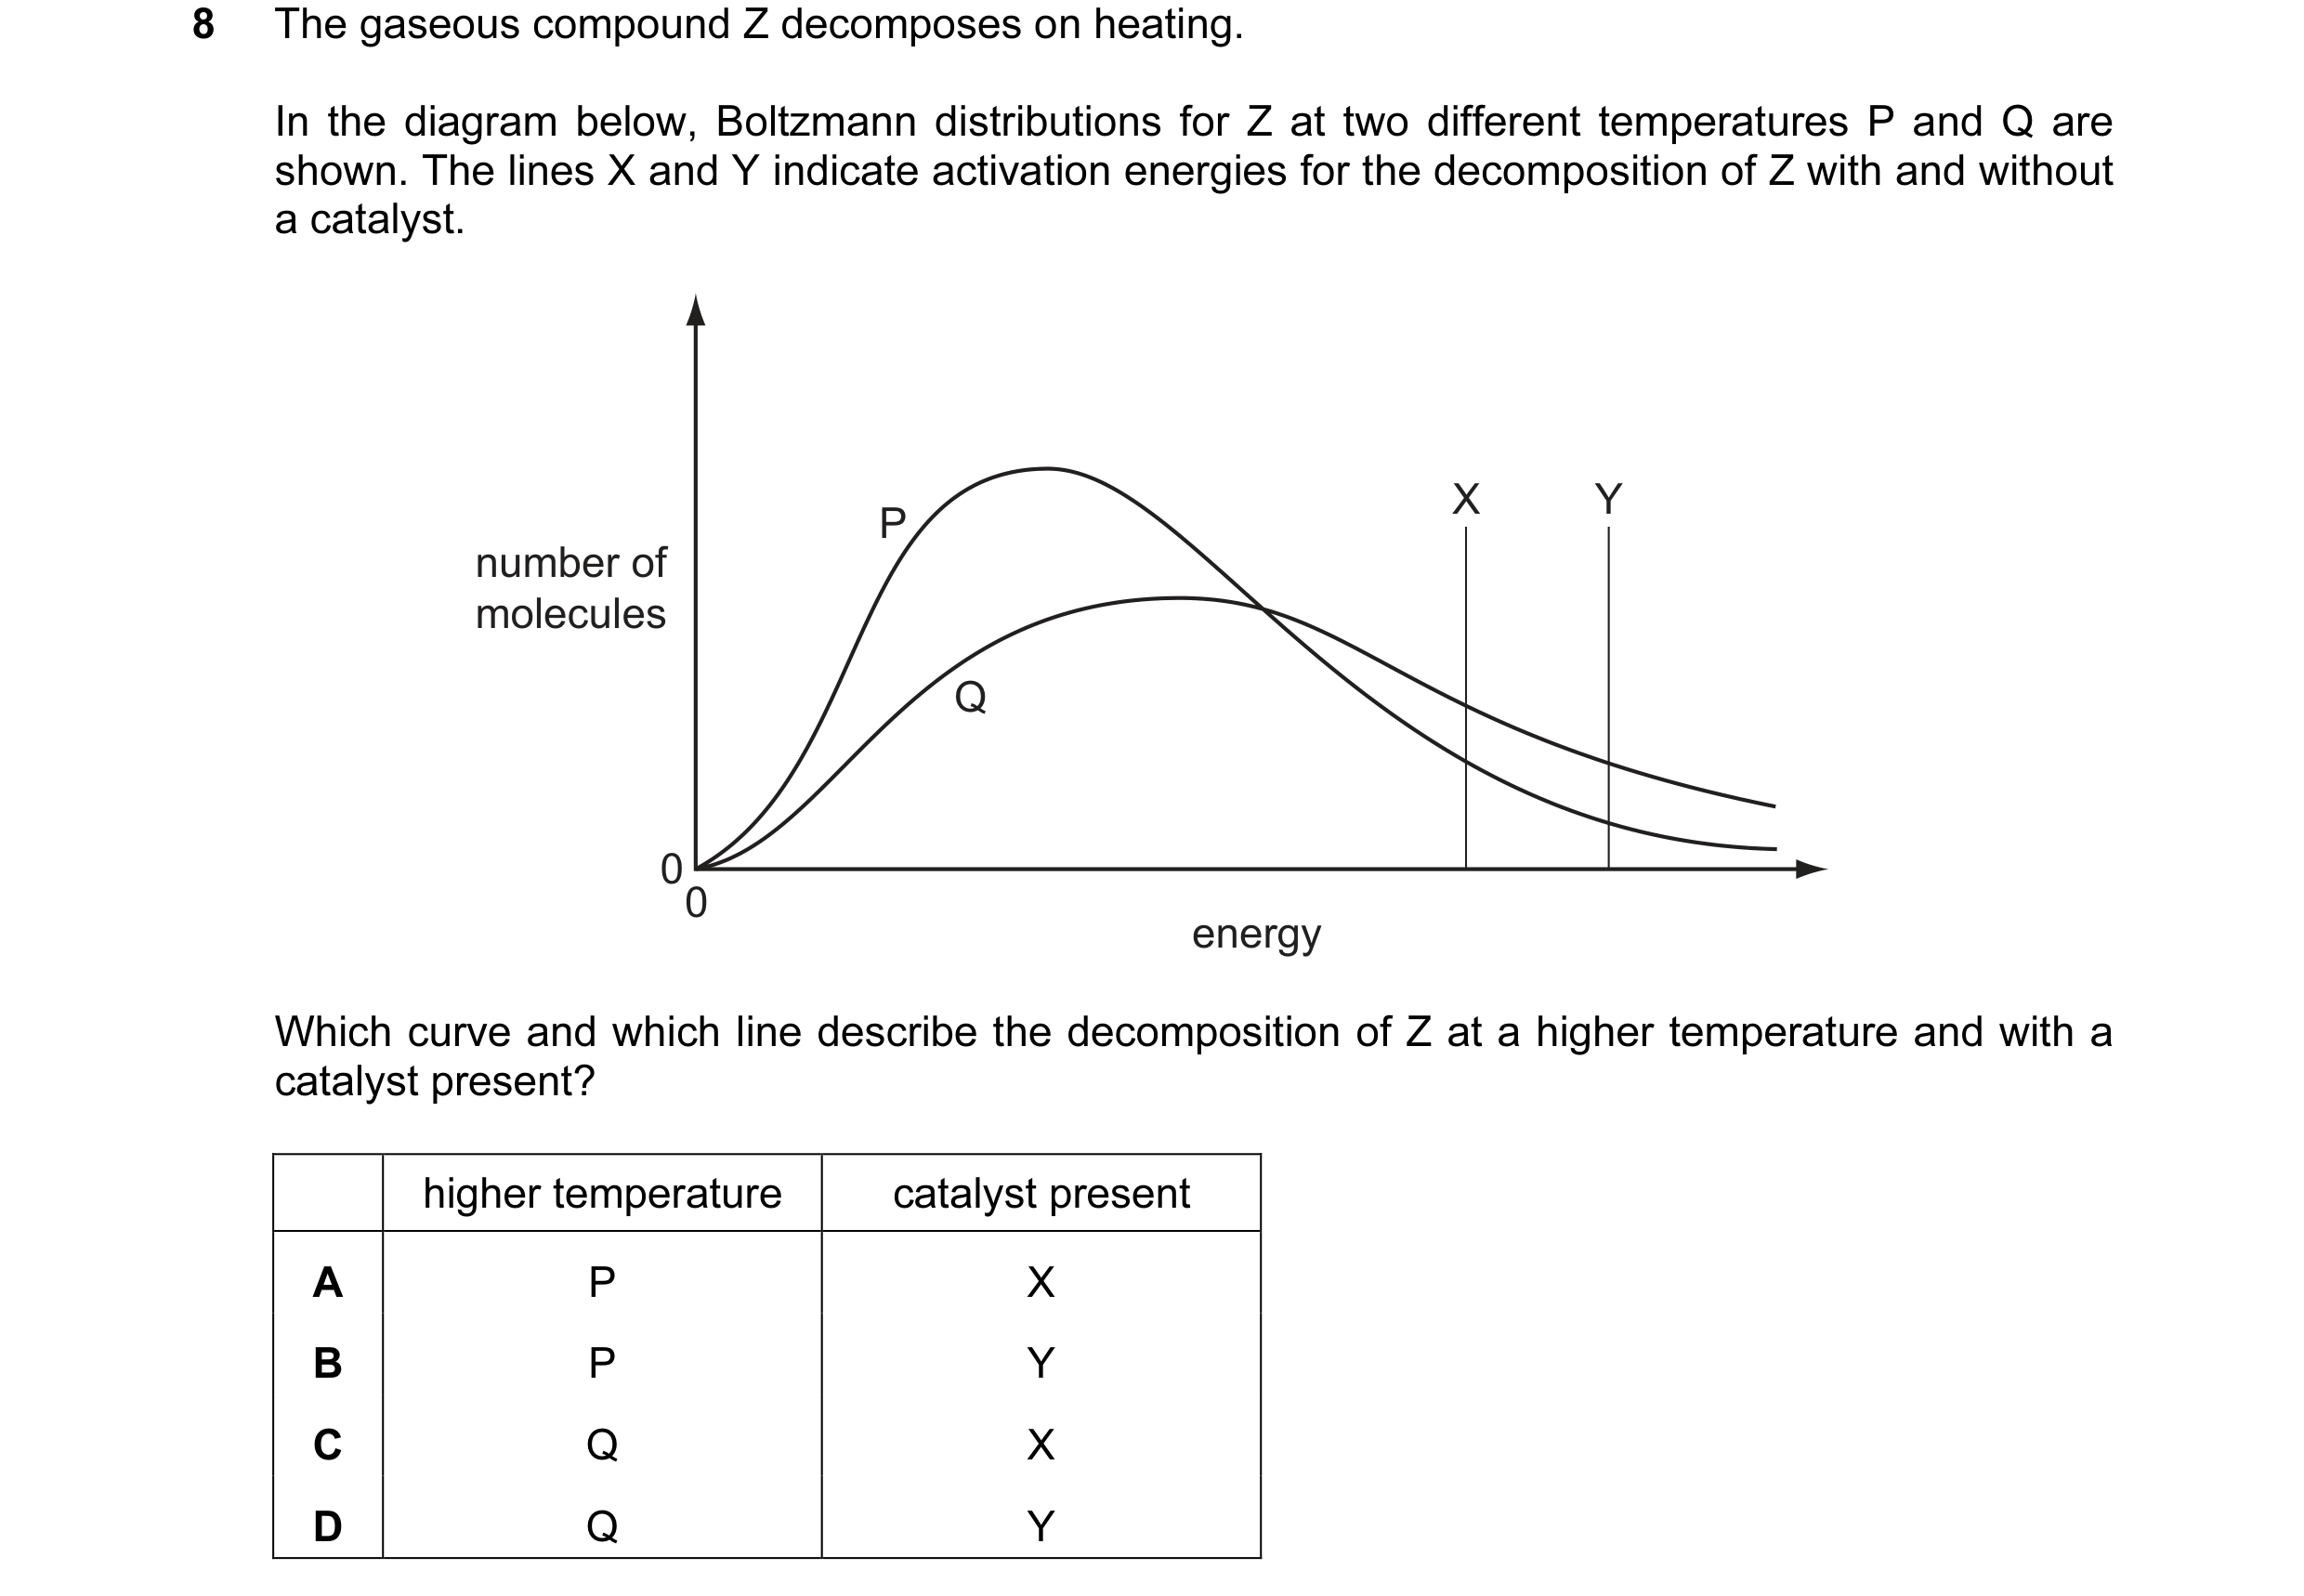
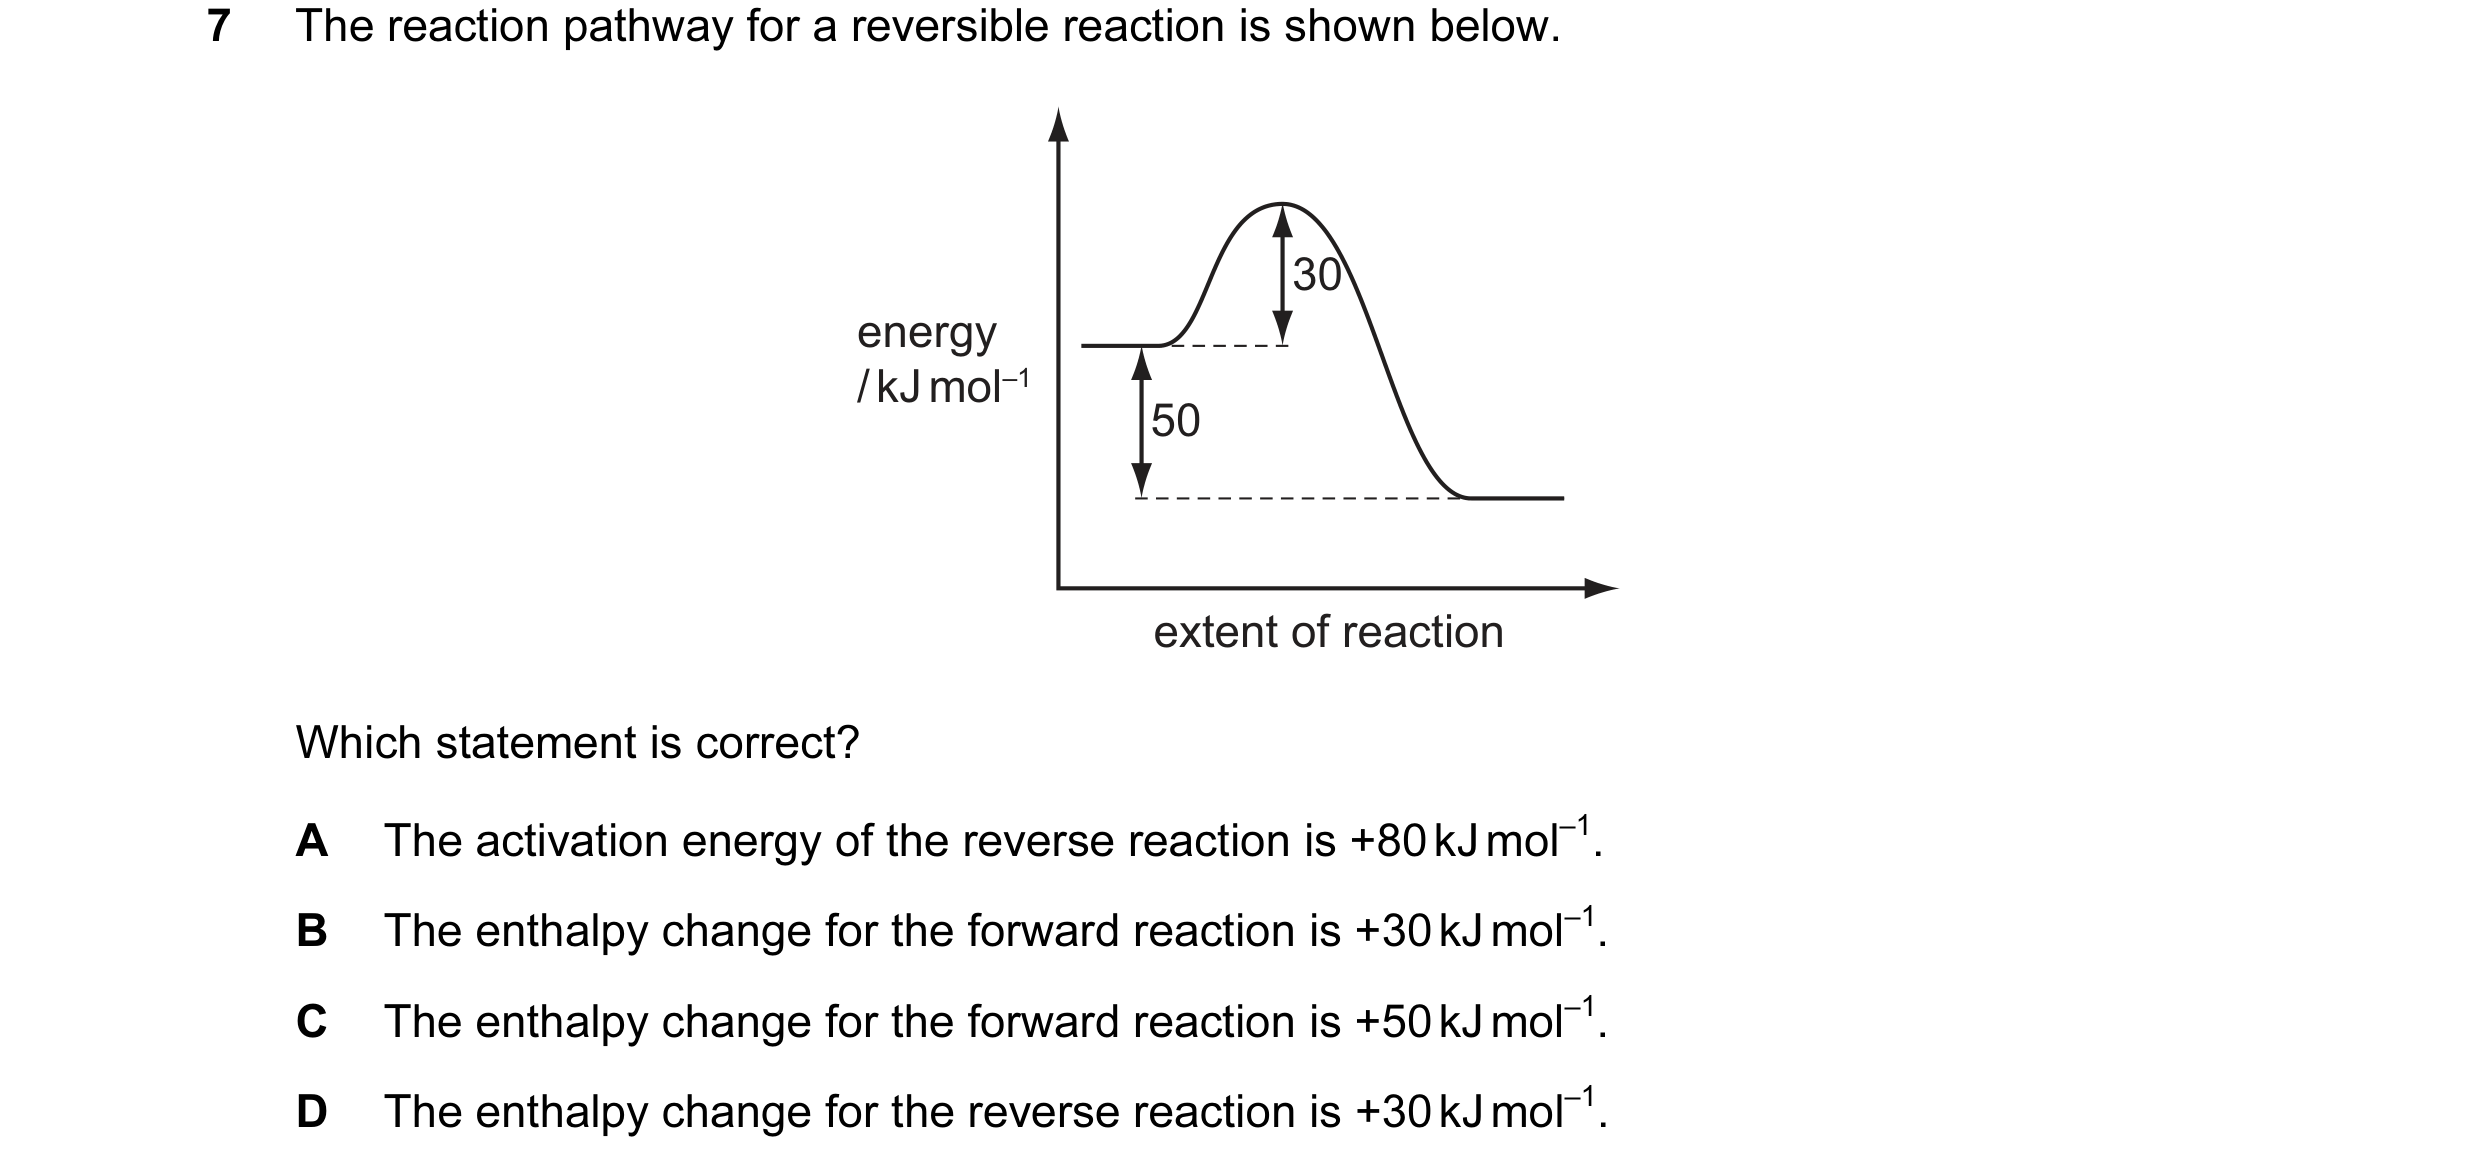
 16 / 67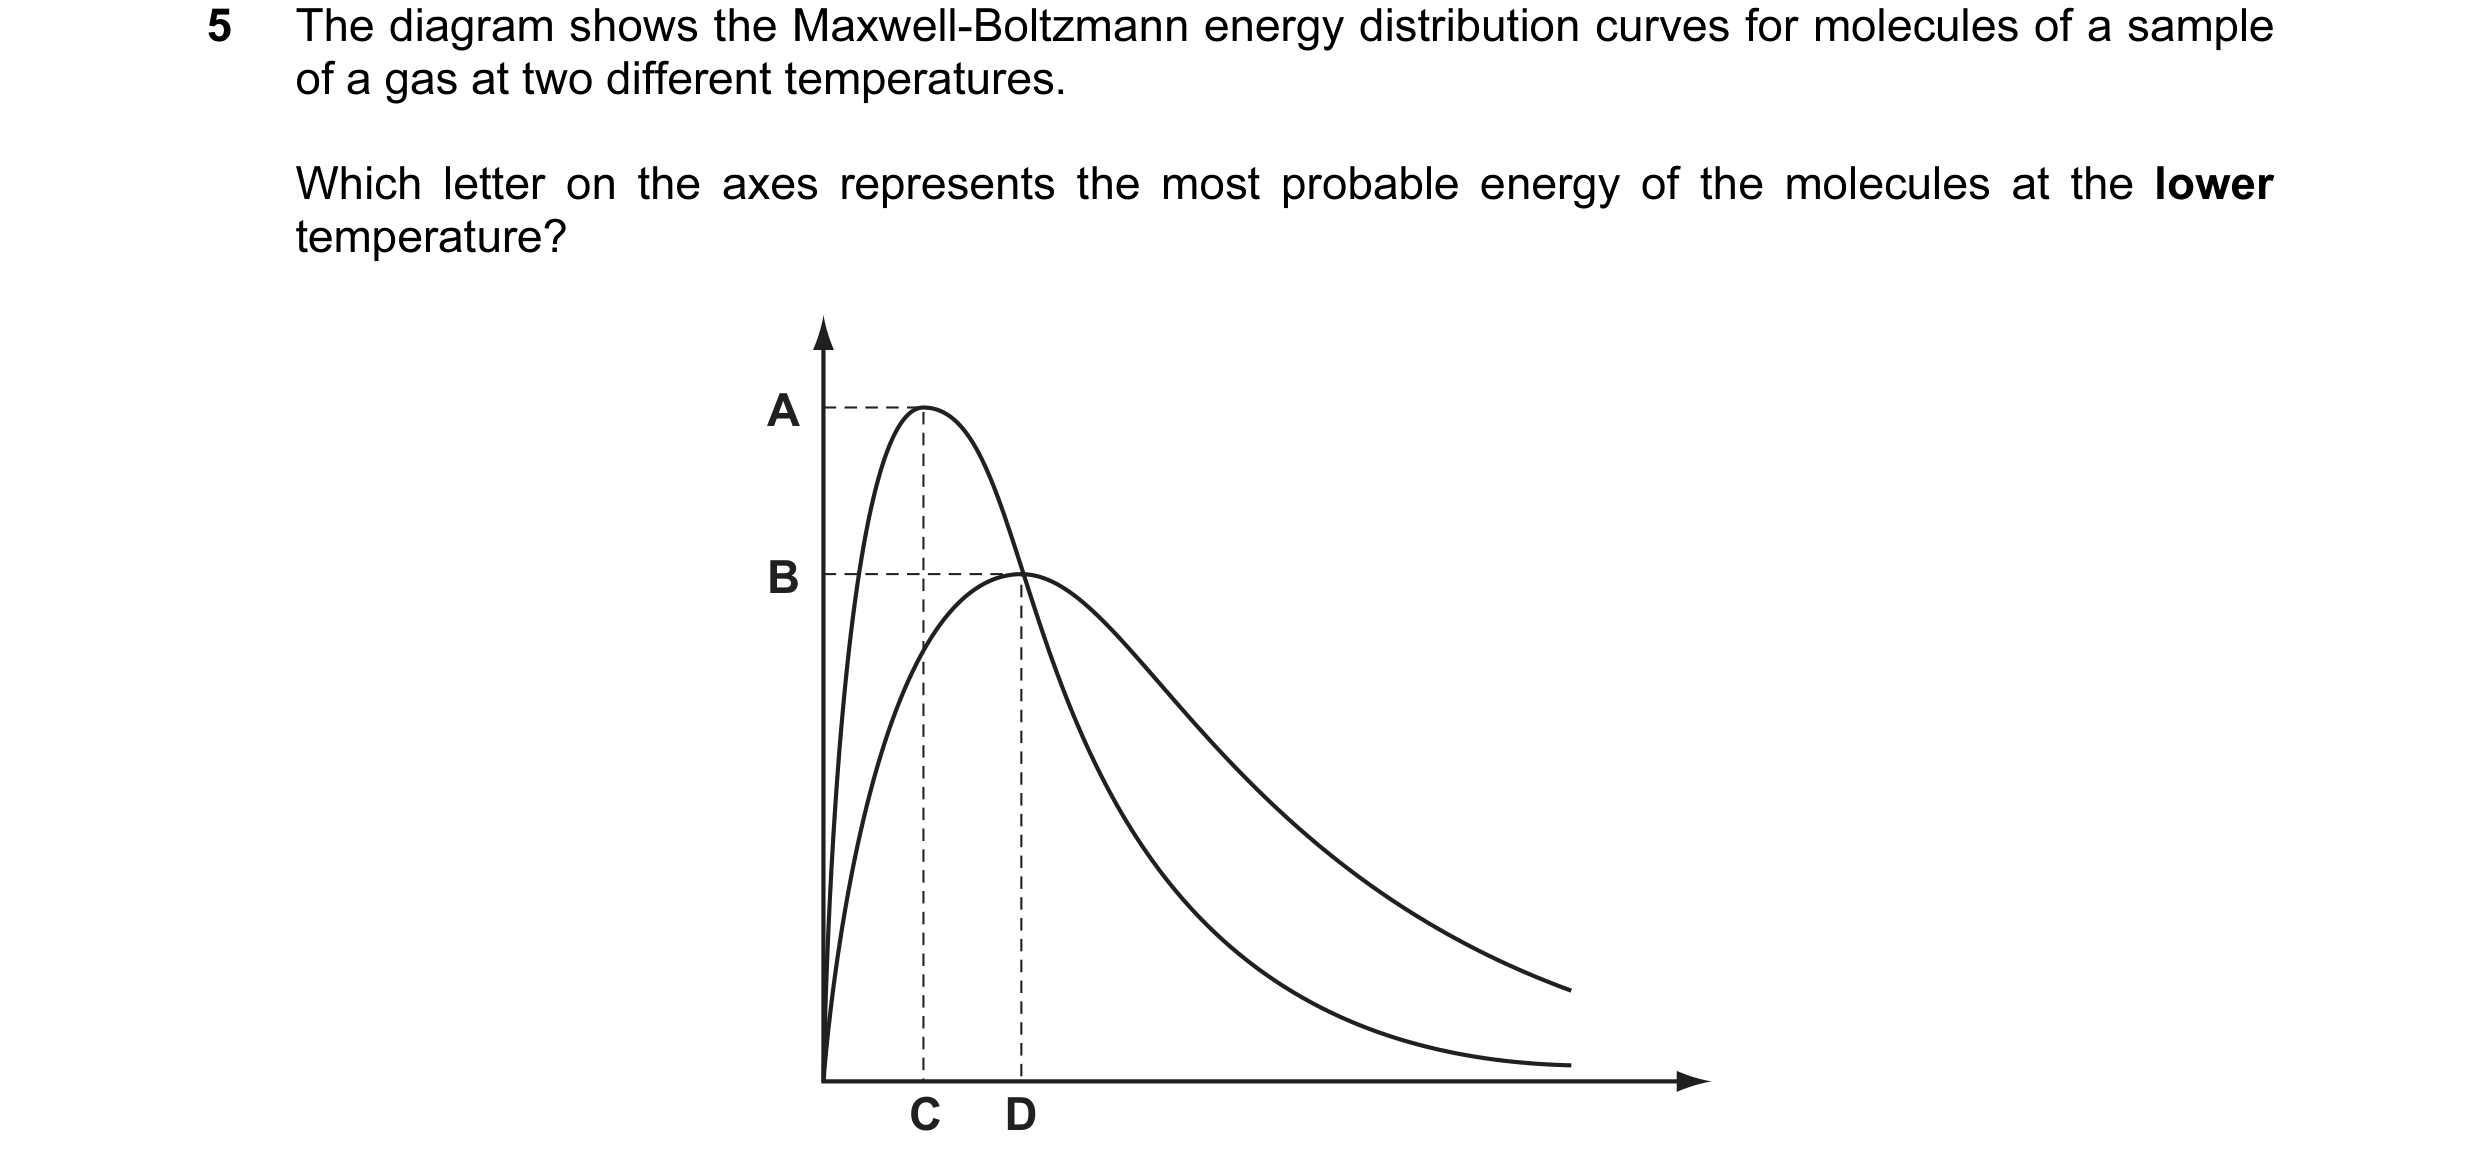
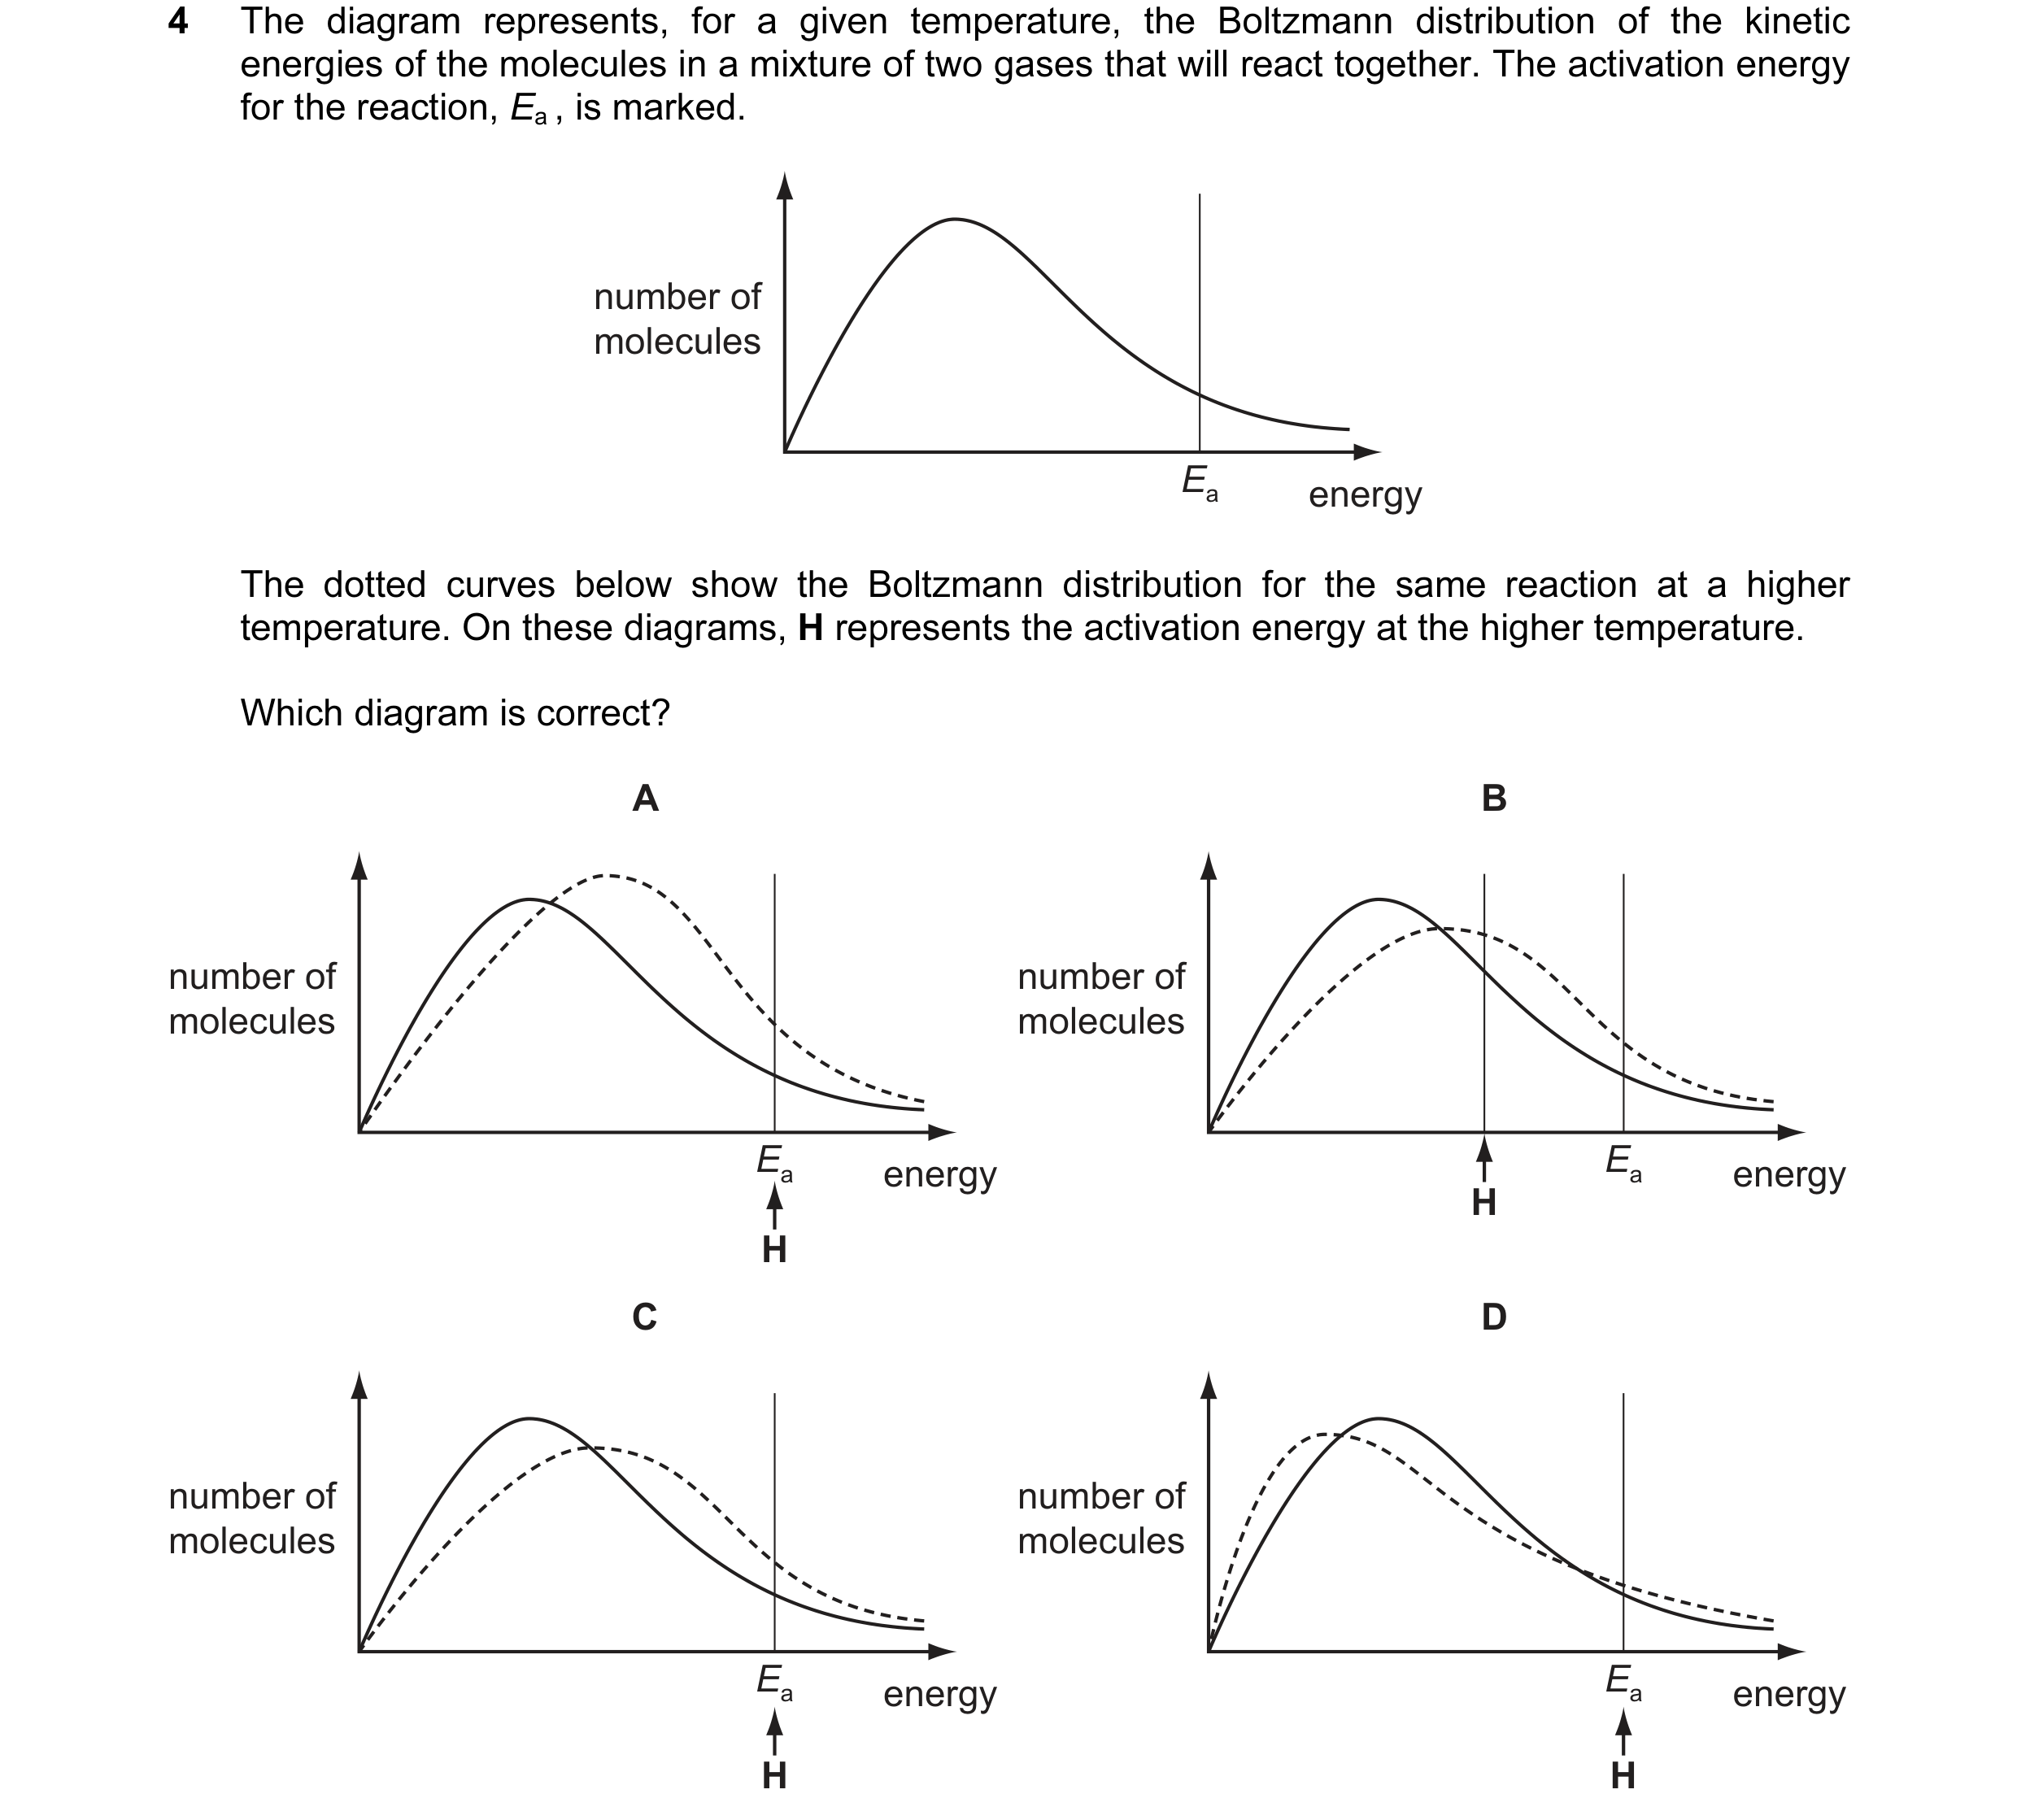 17 / 67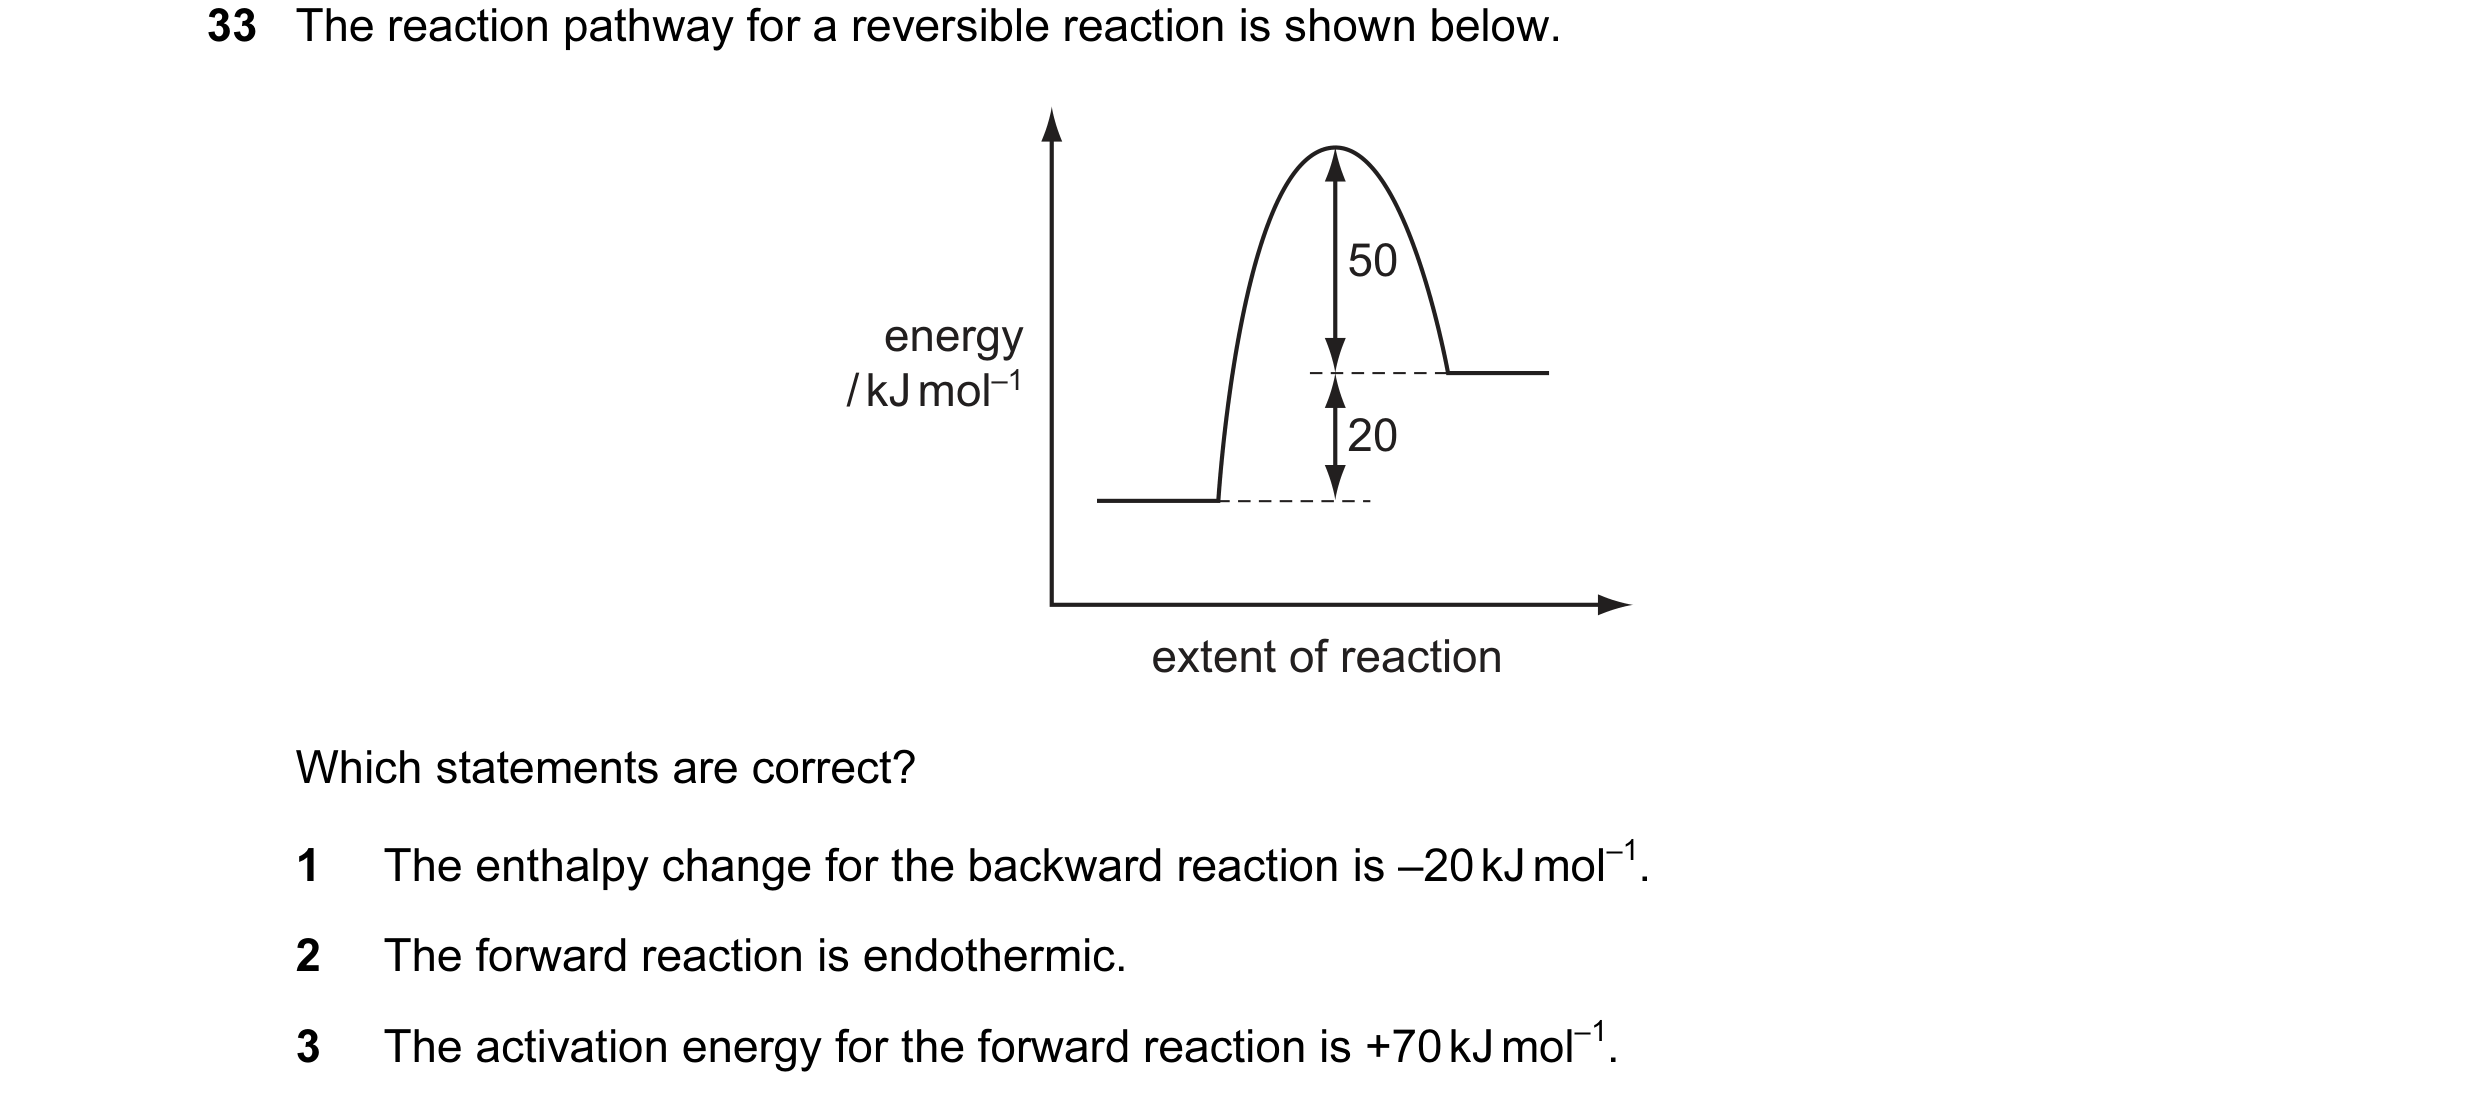
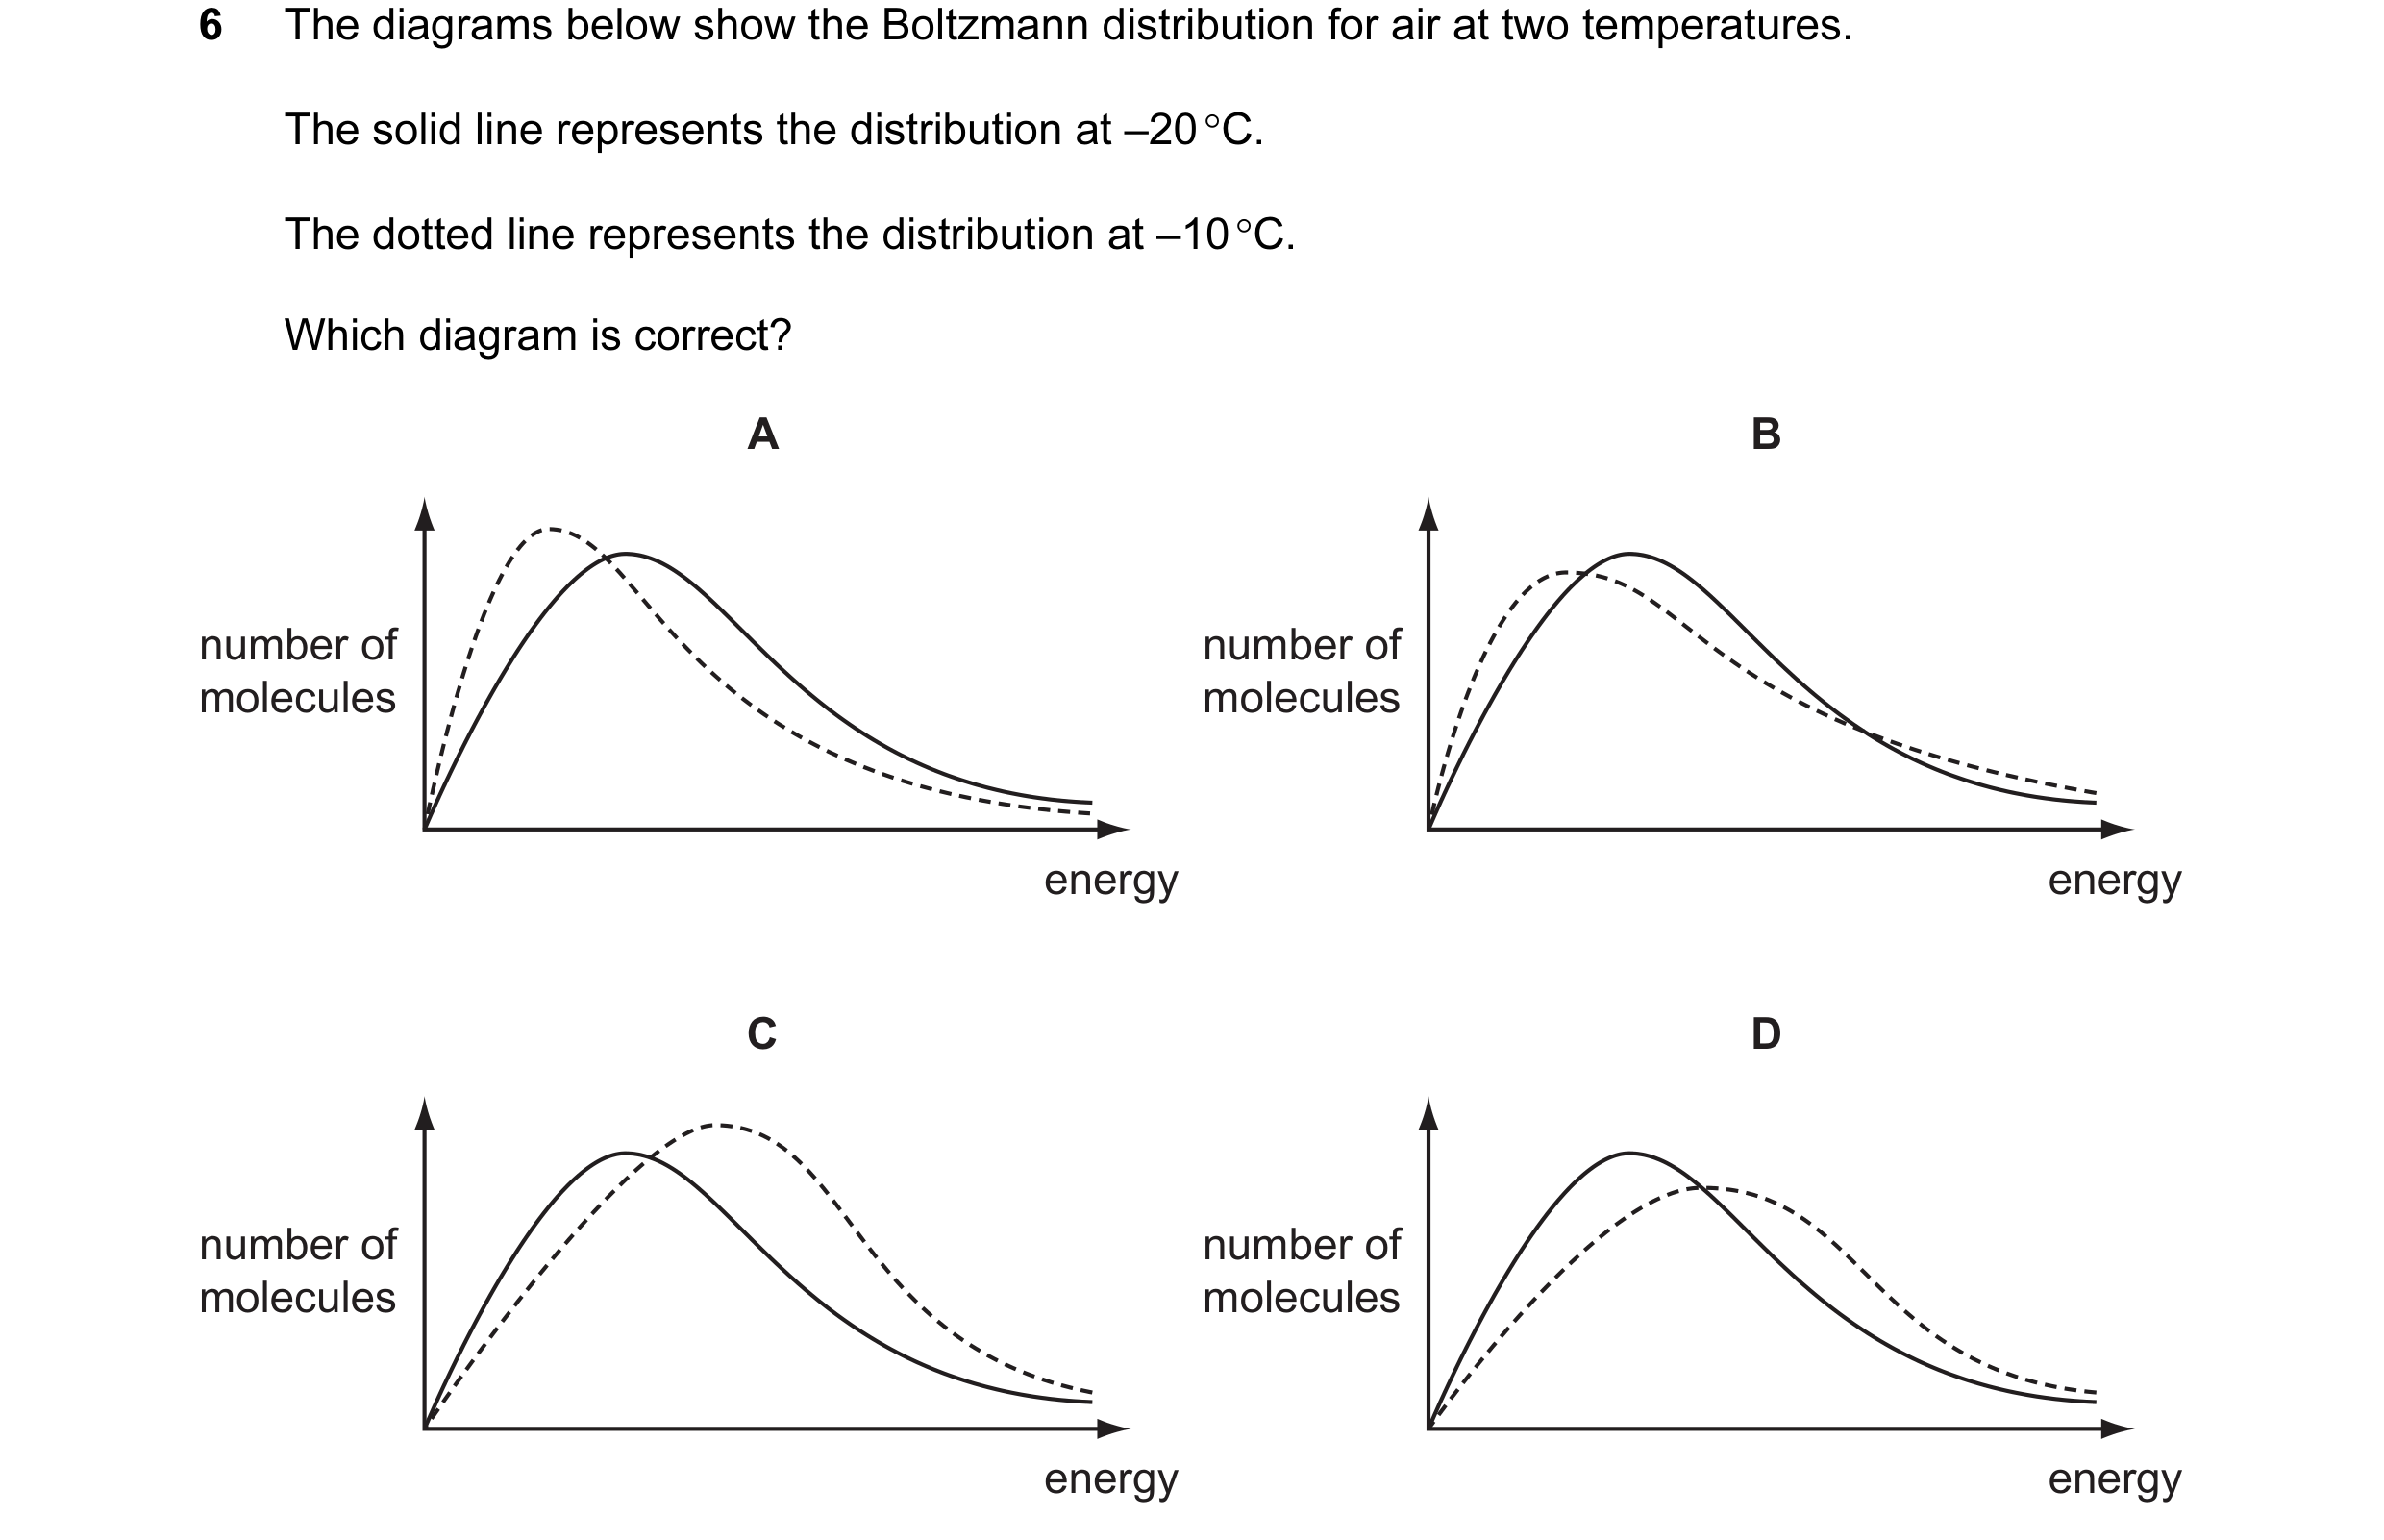
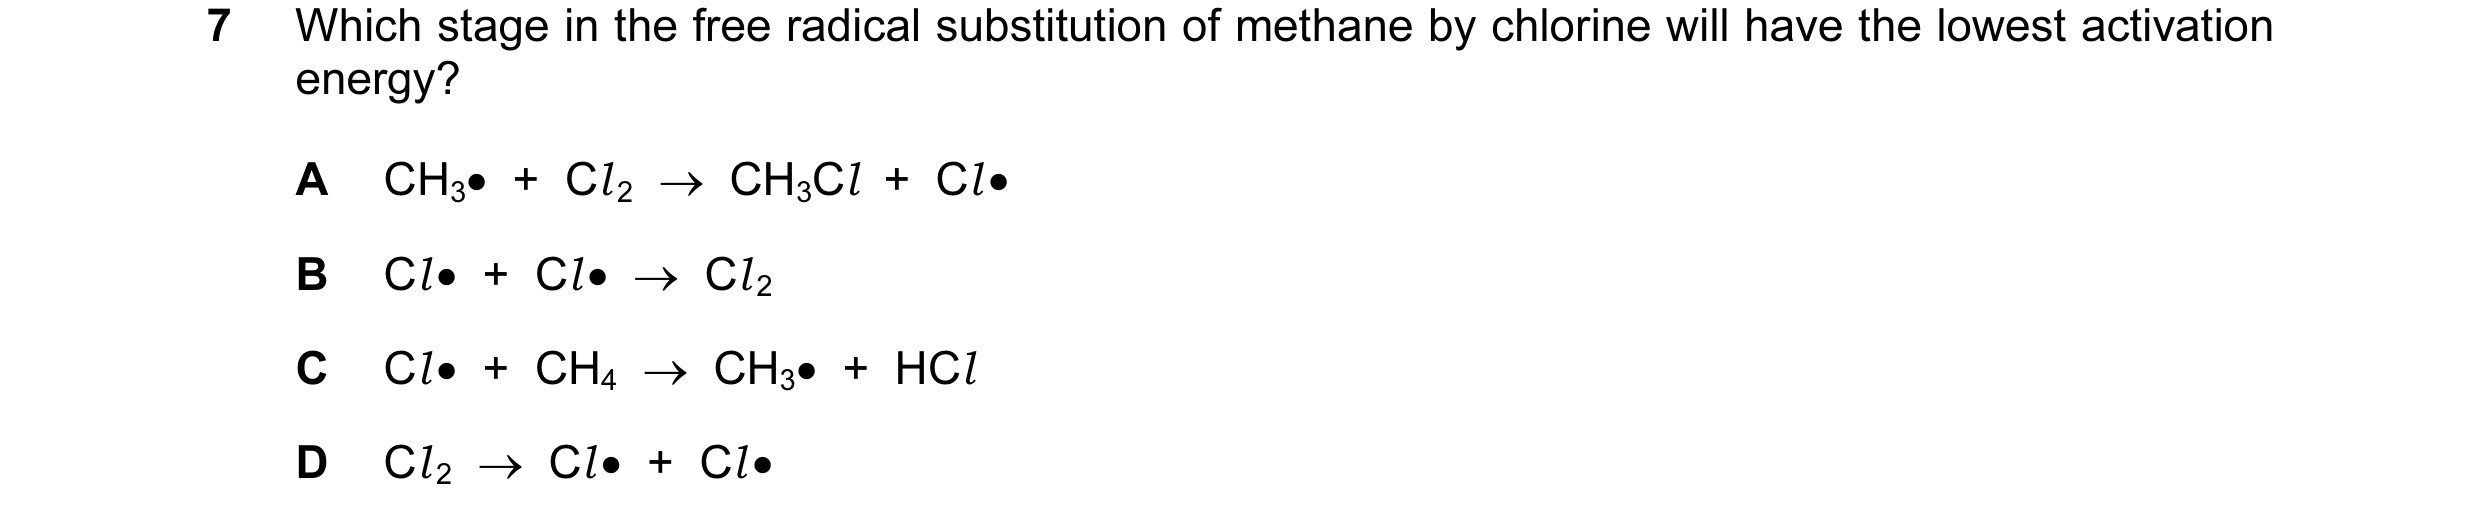 18 / 67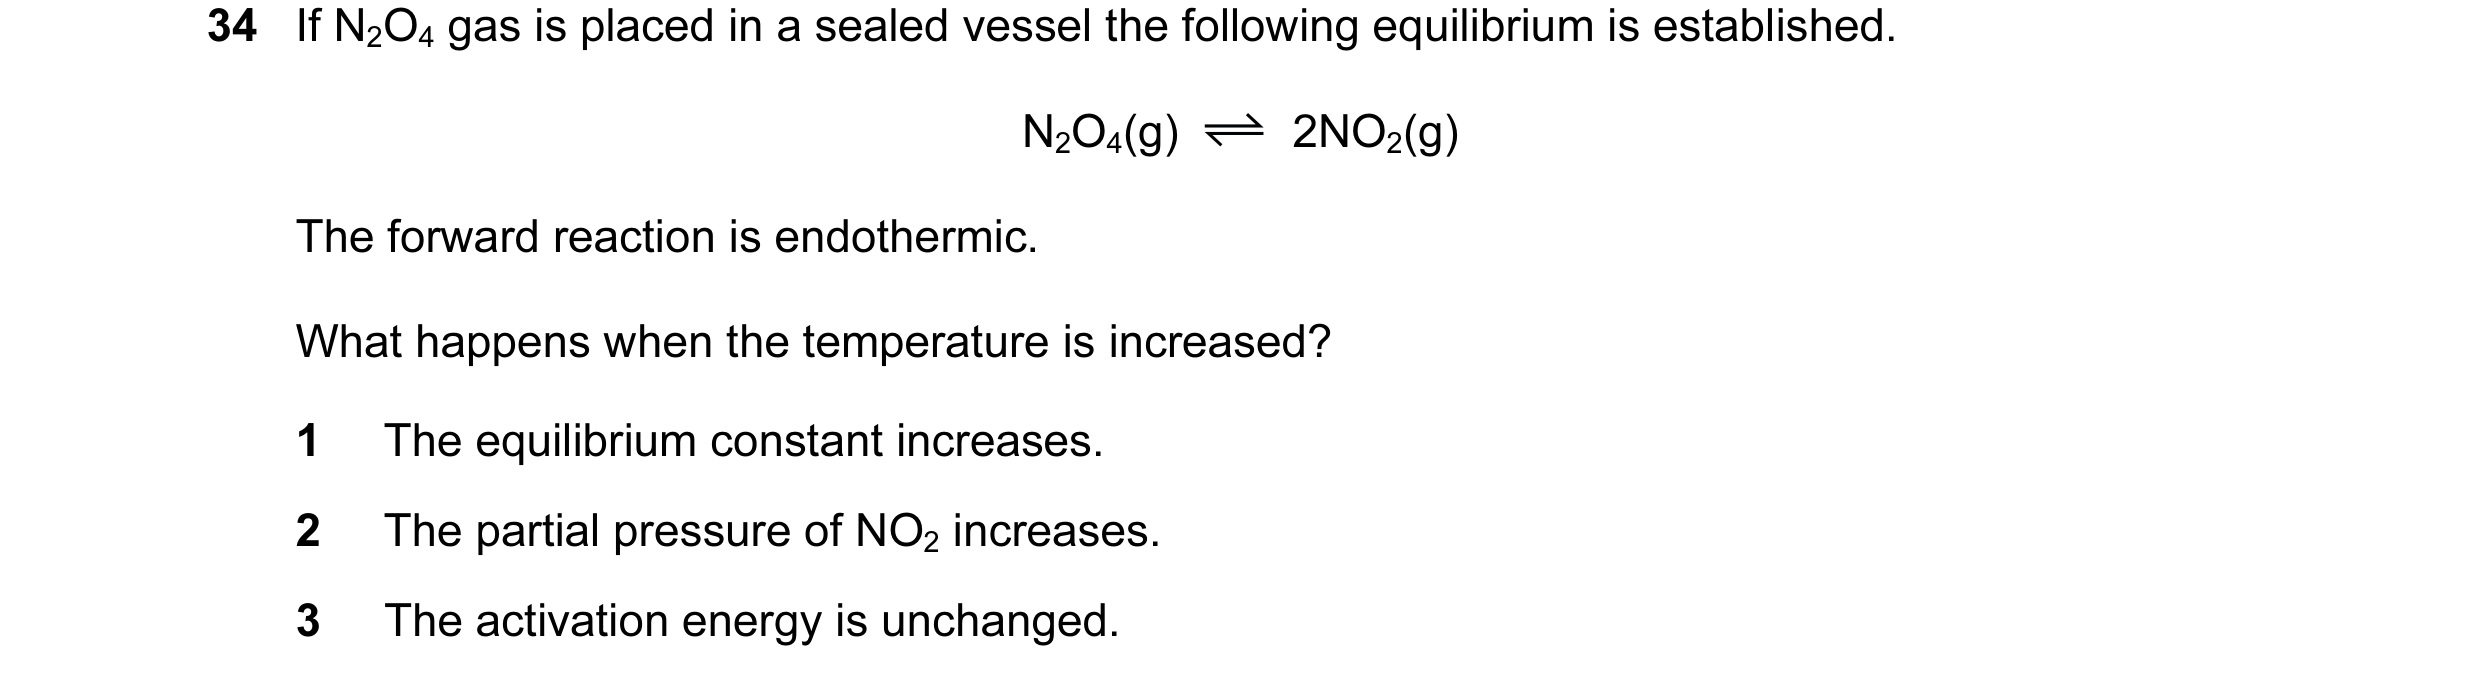
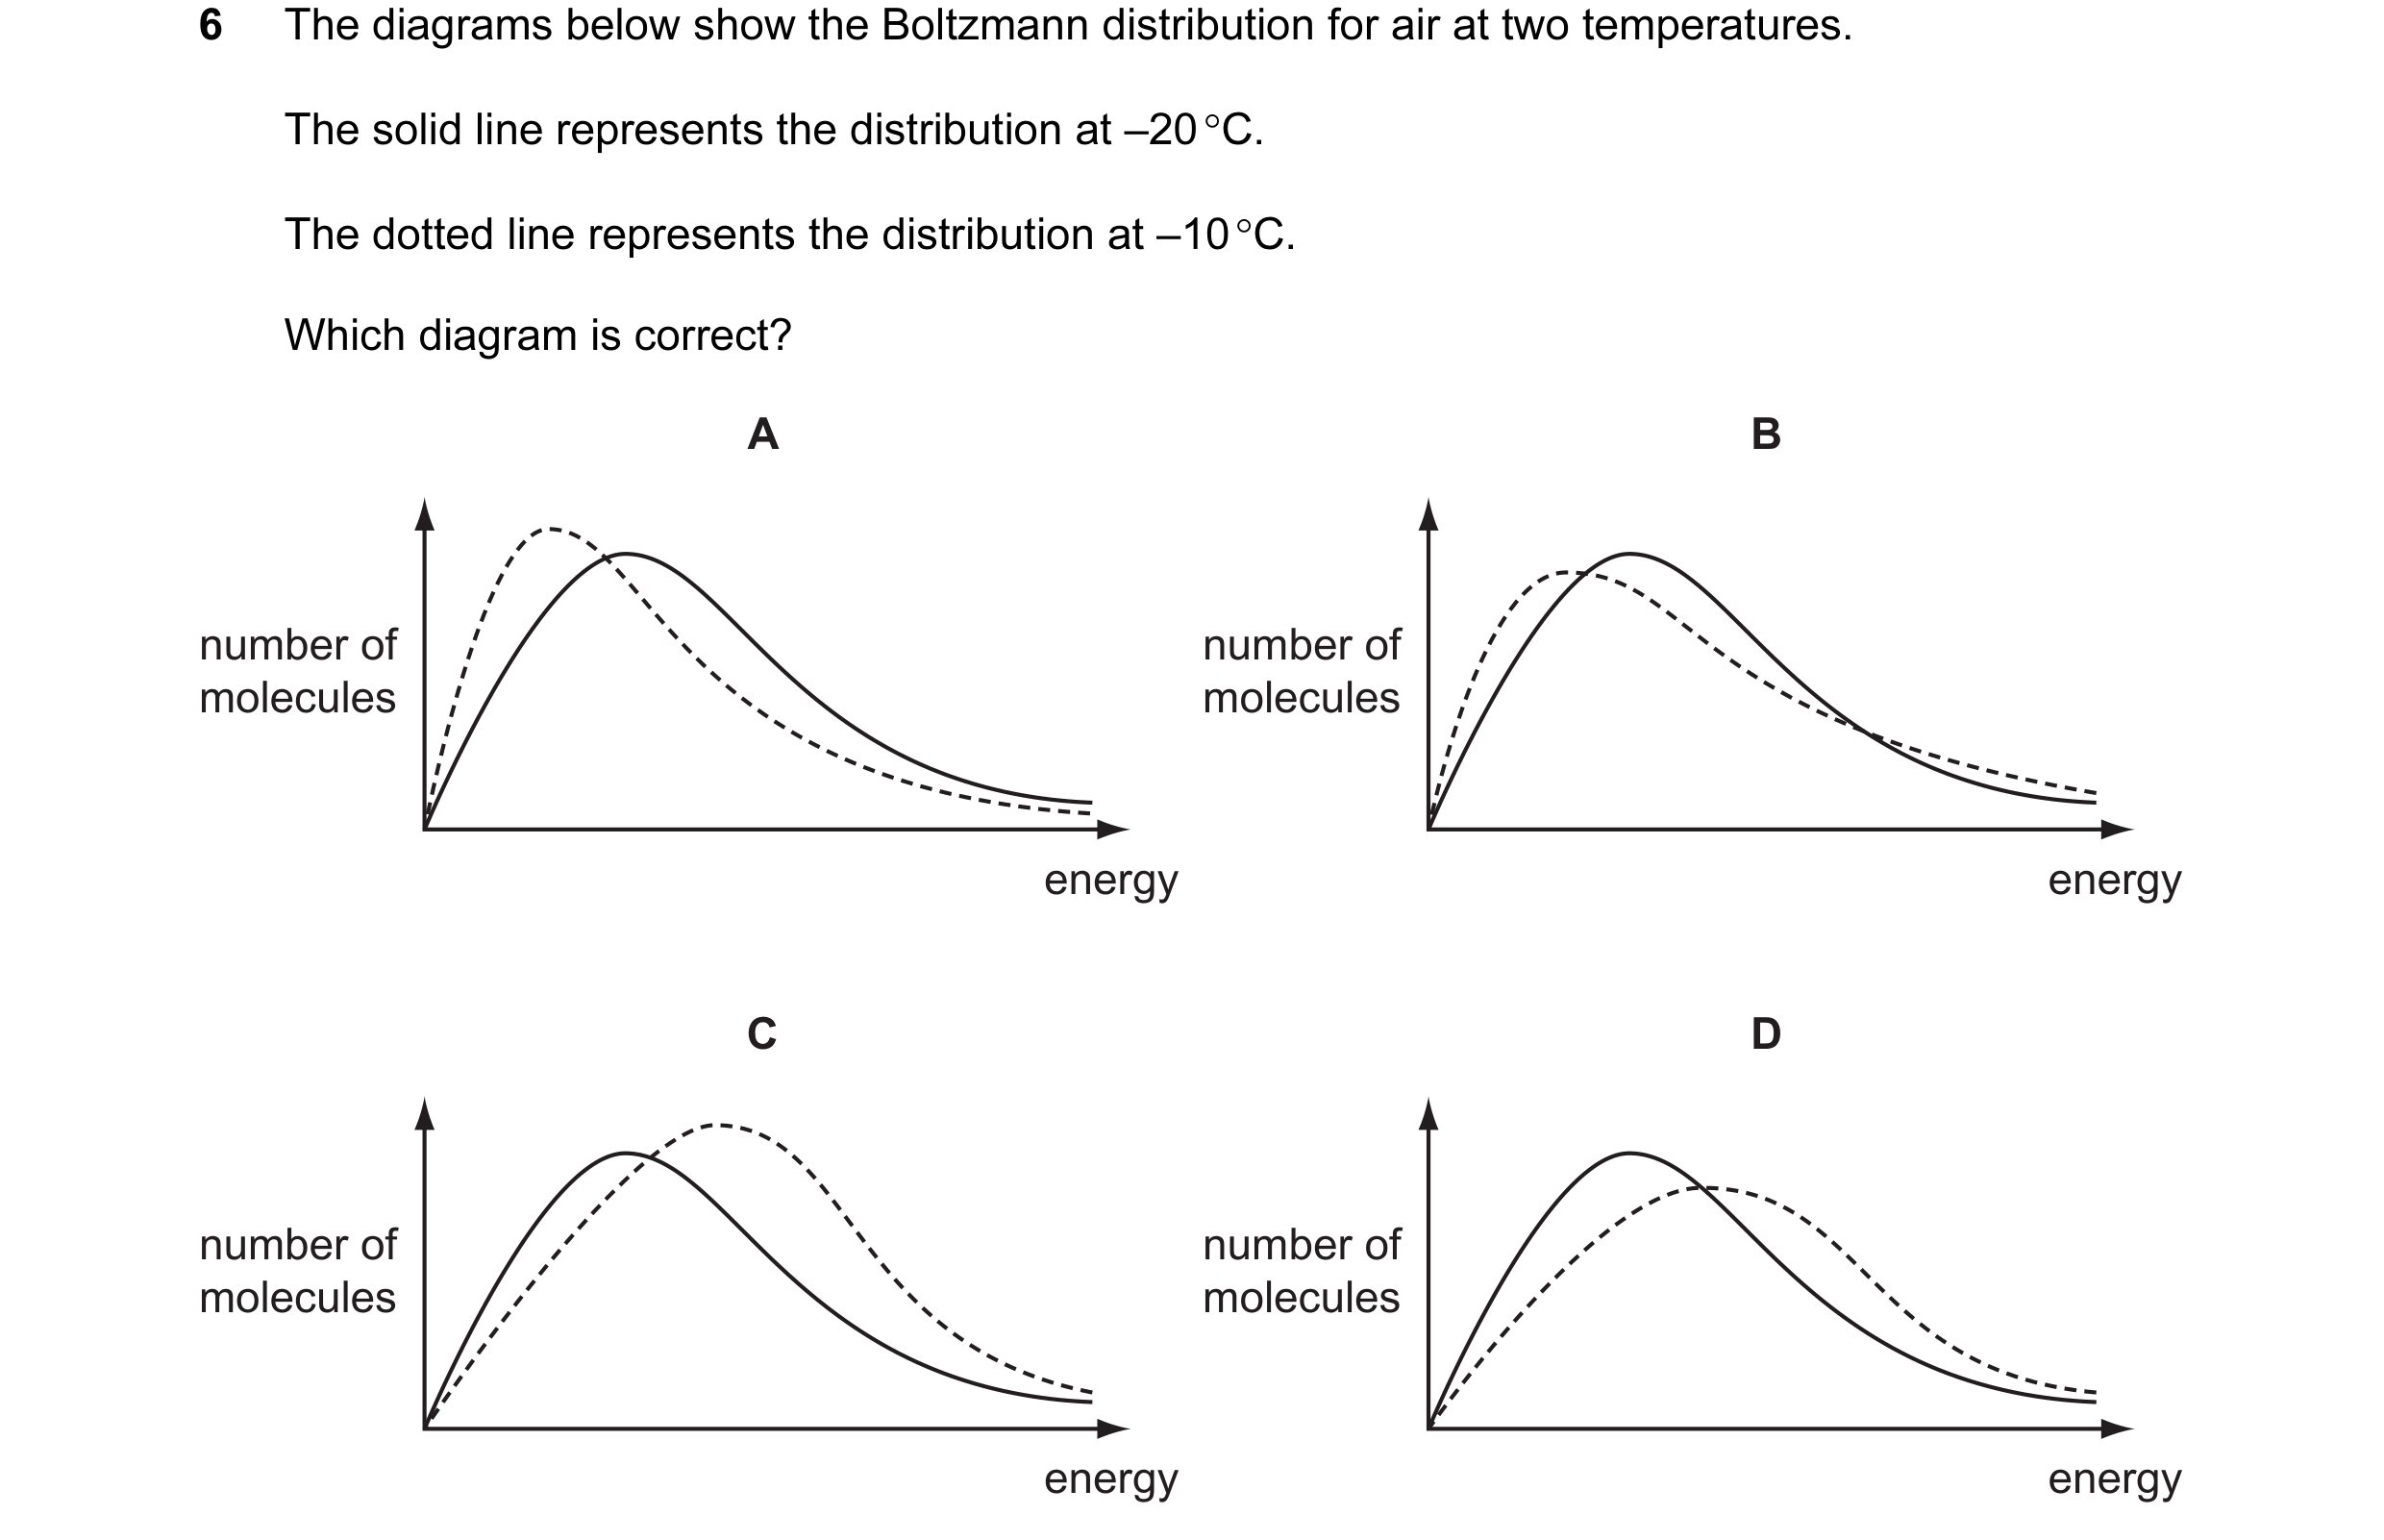
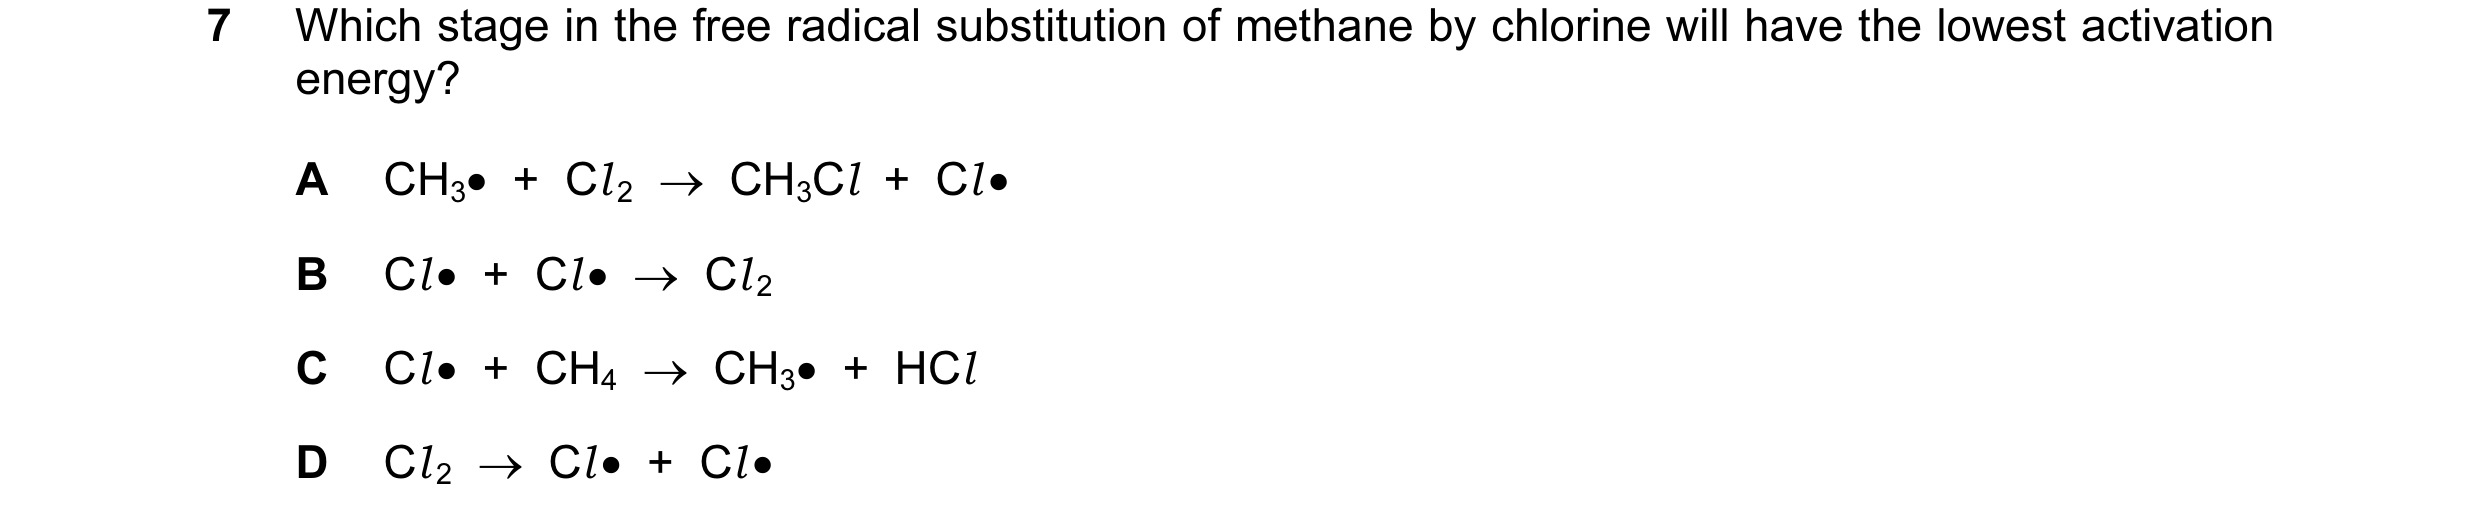 19 / 67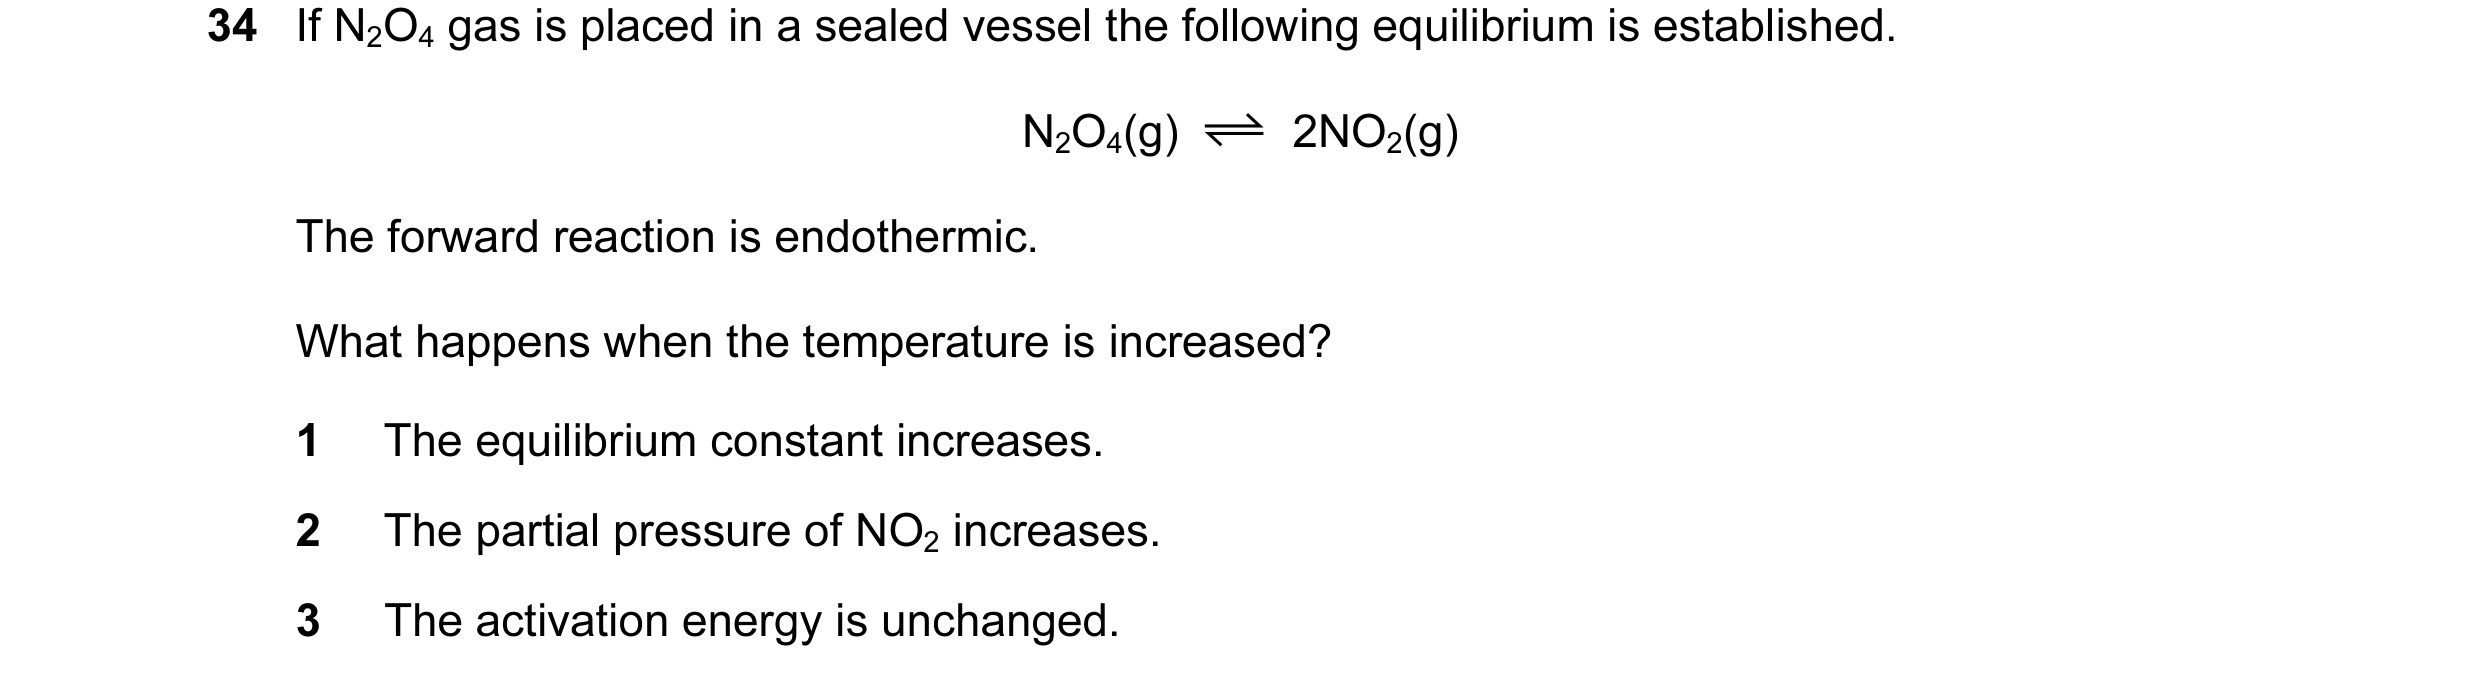
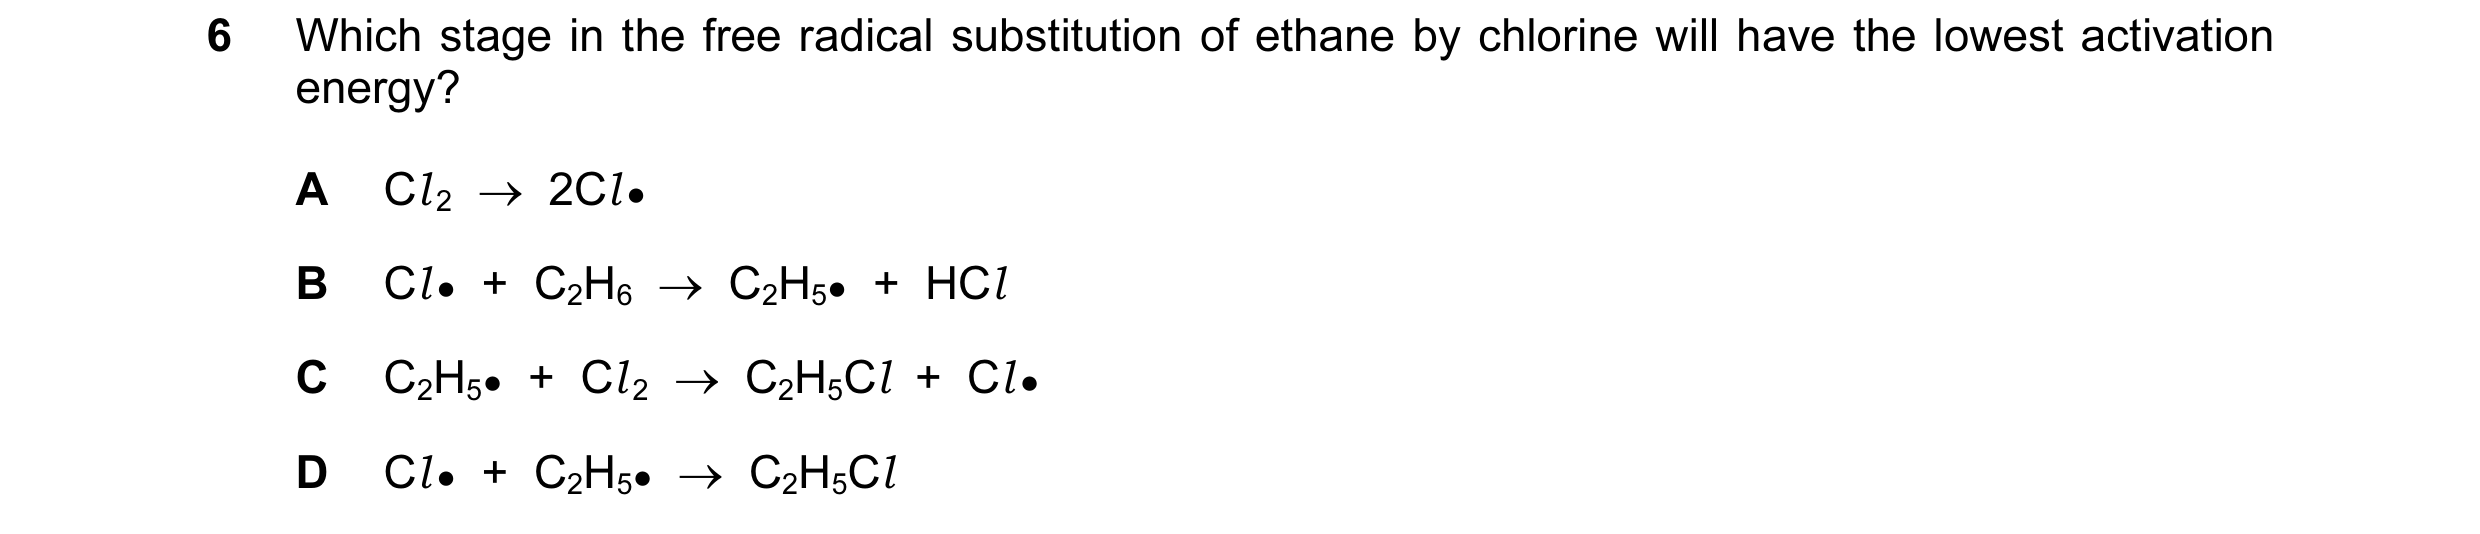
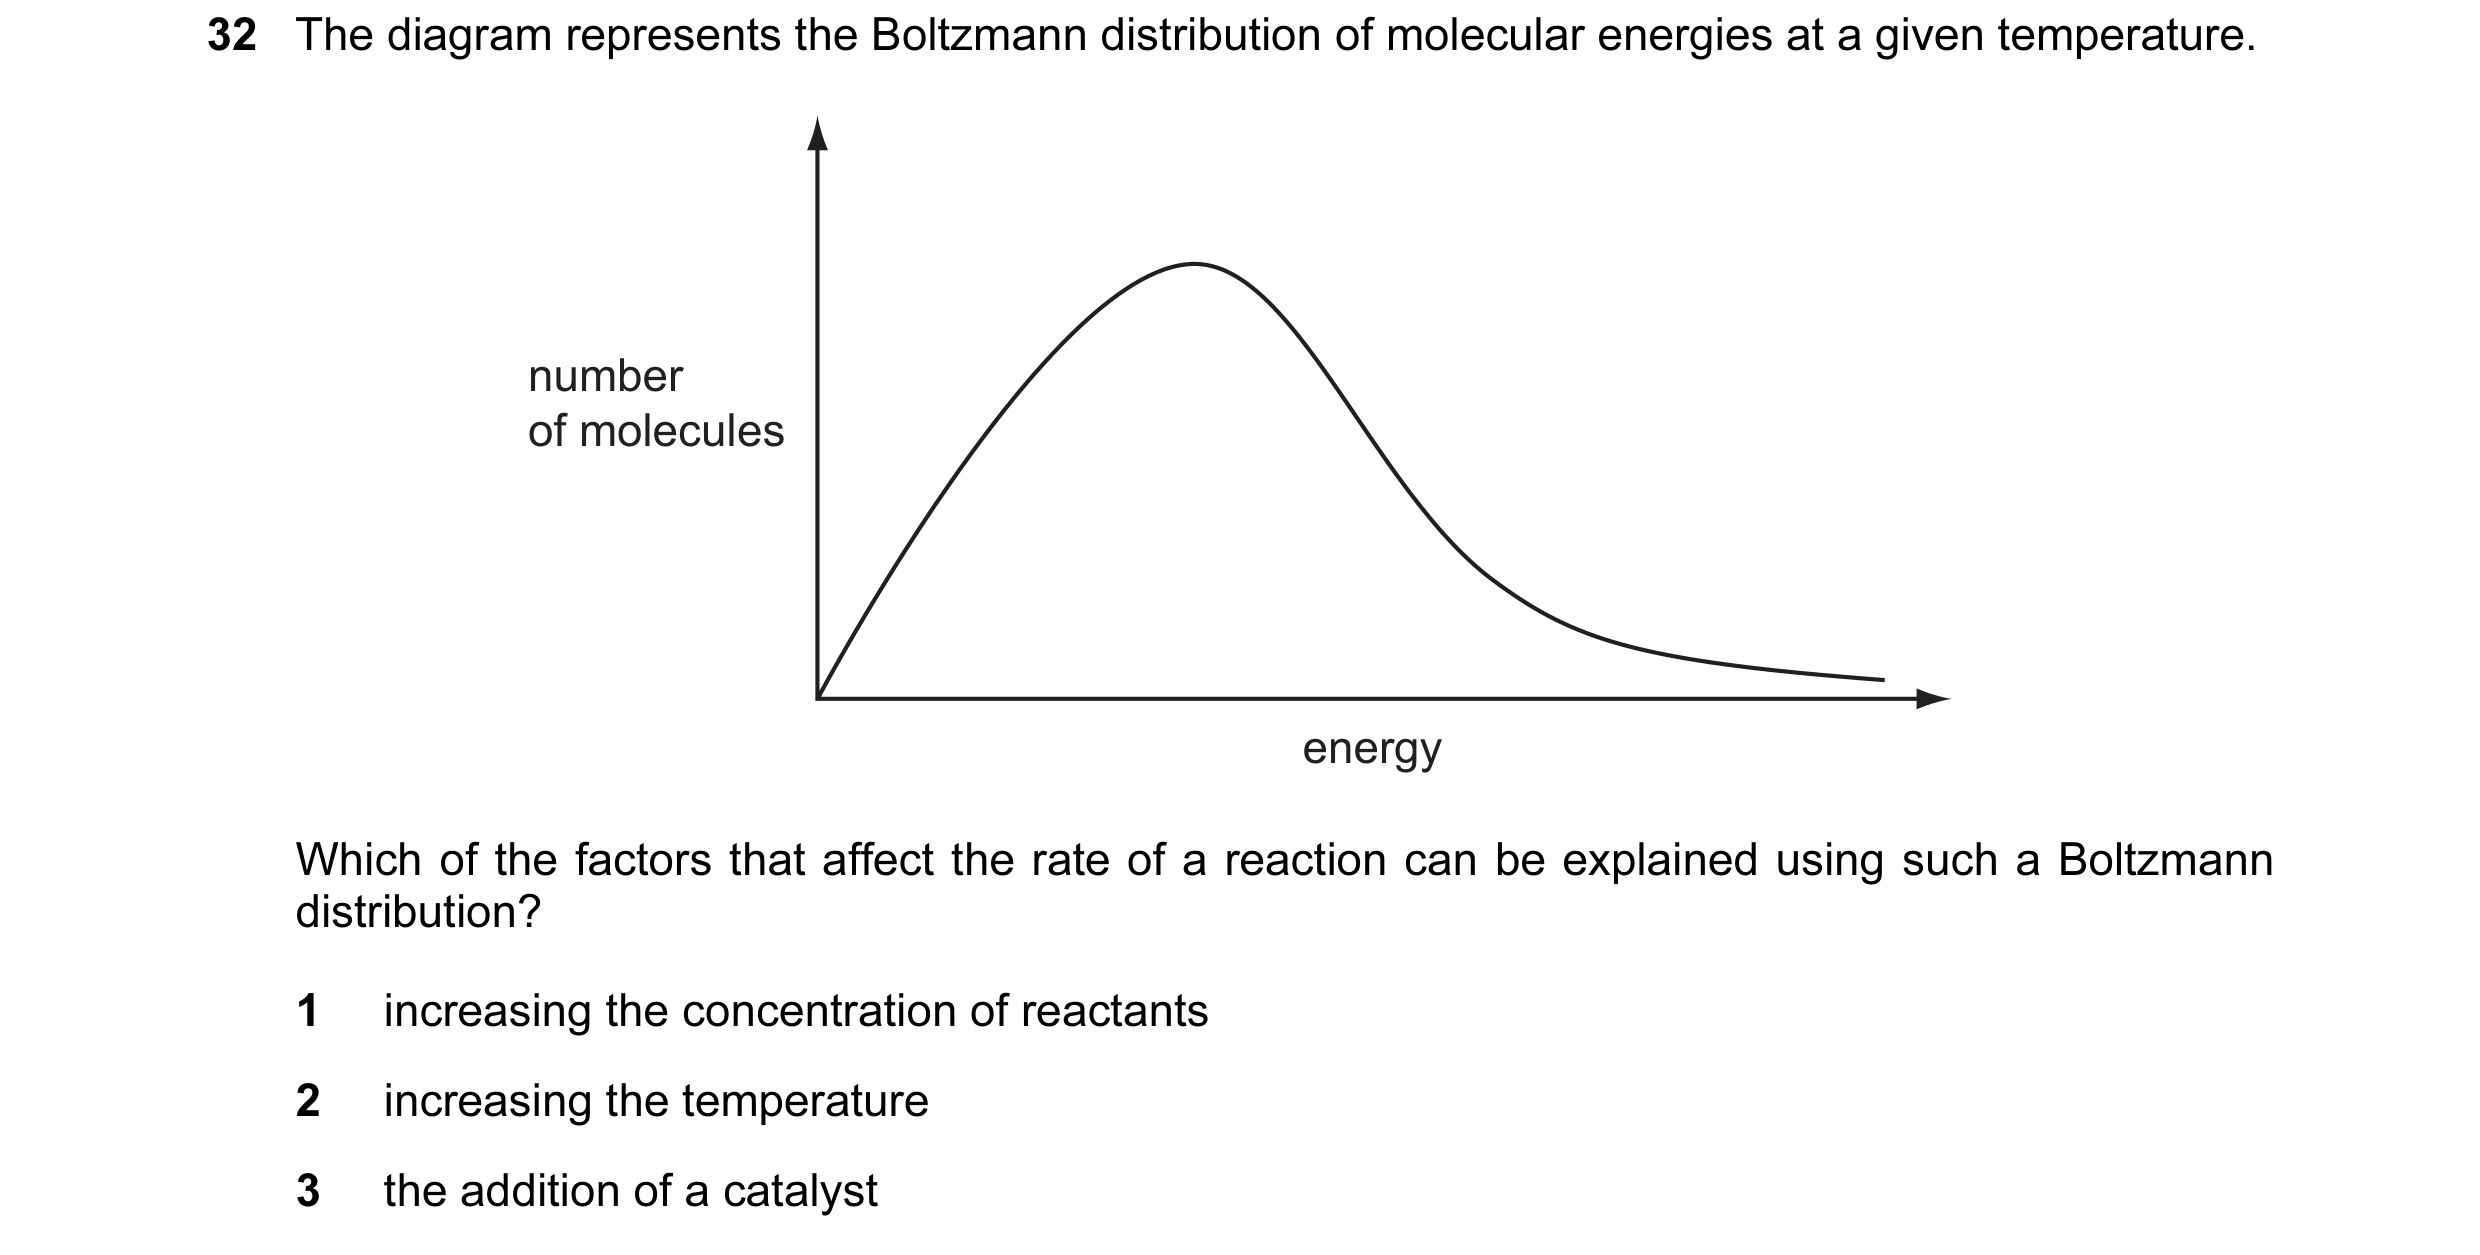 20 / 67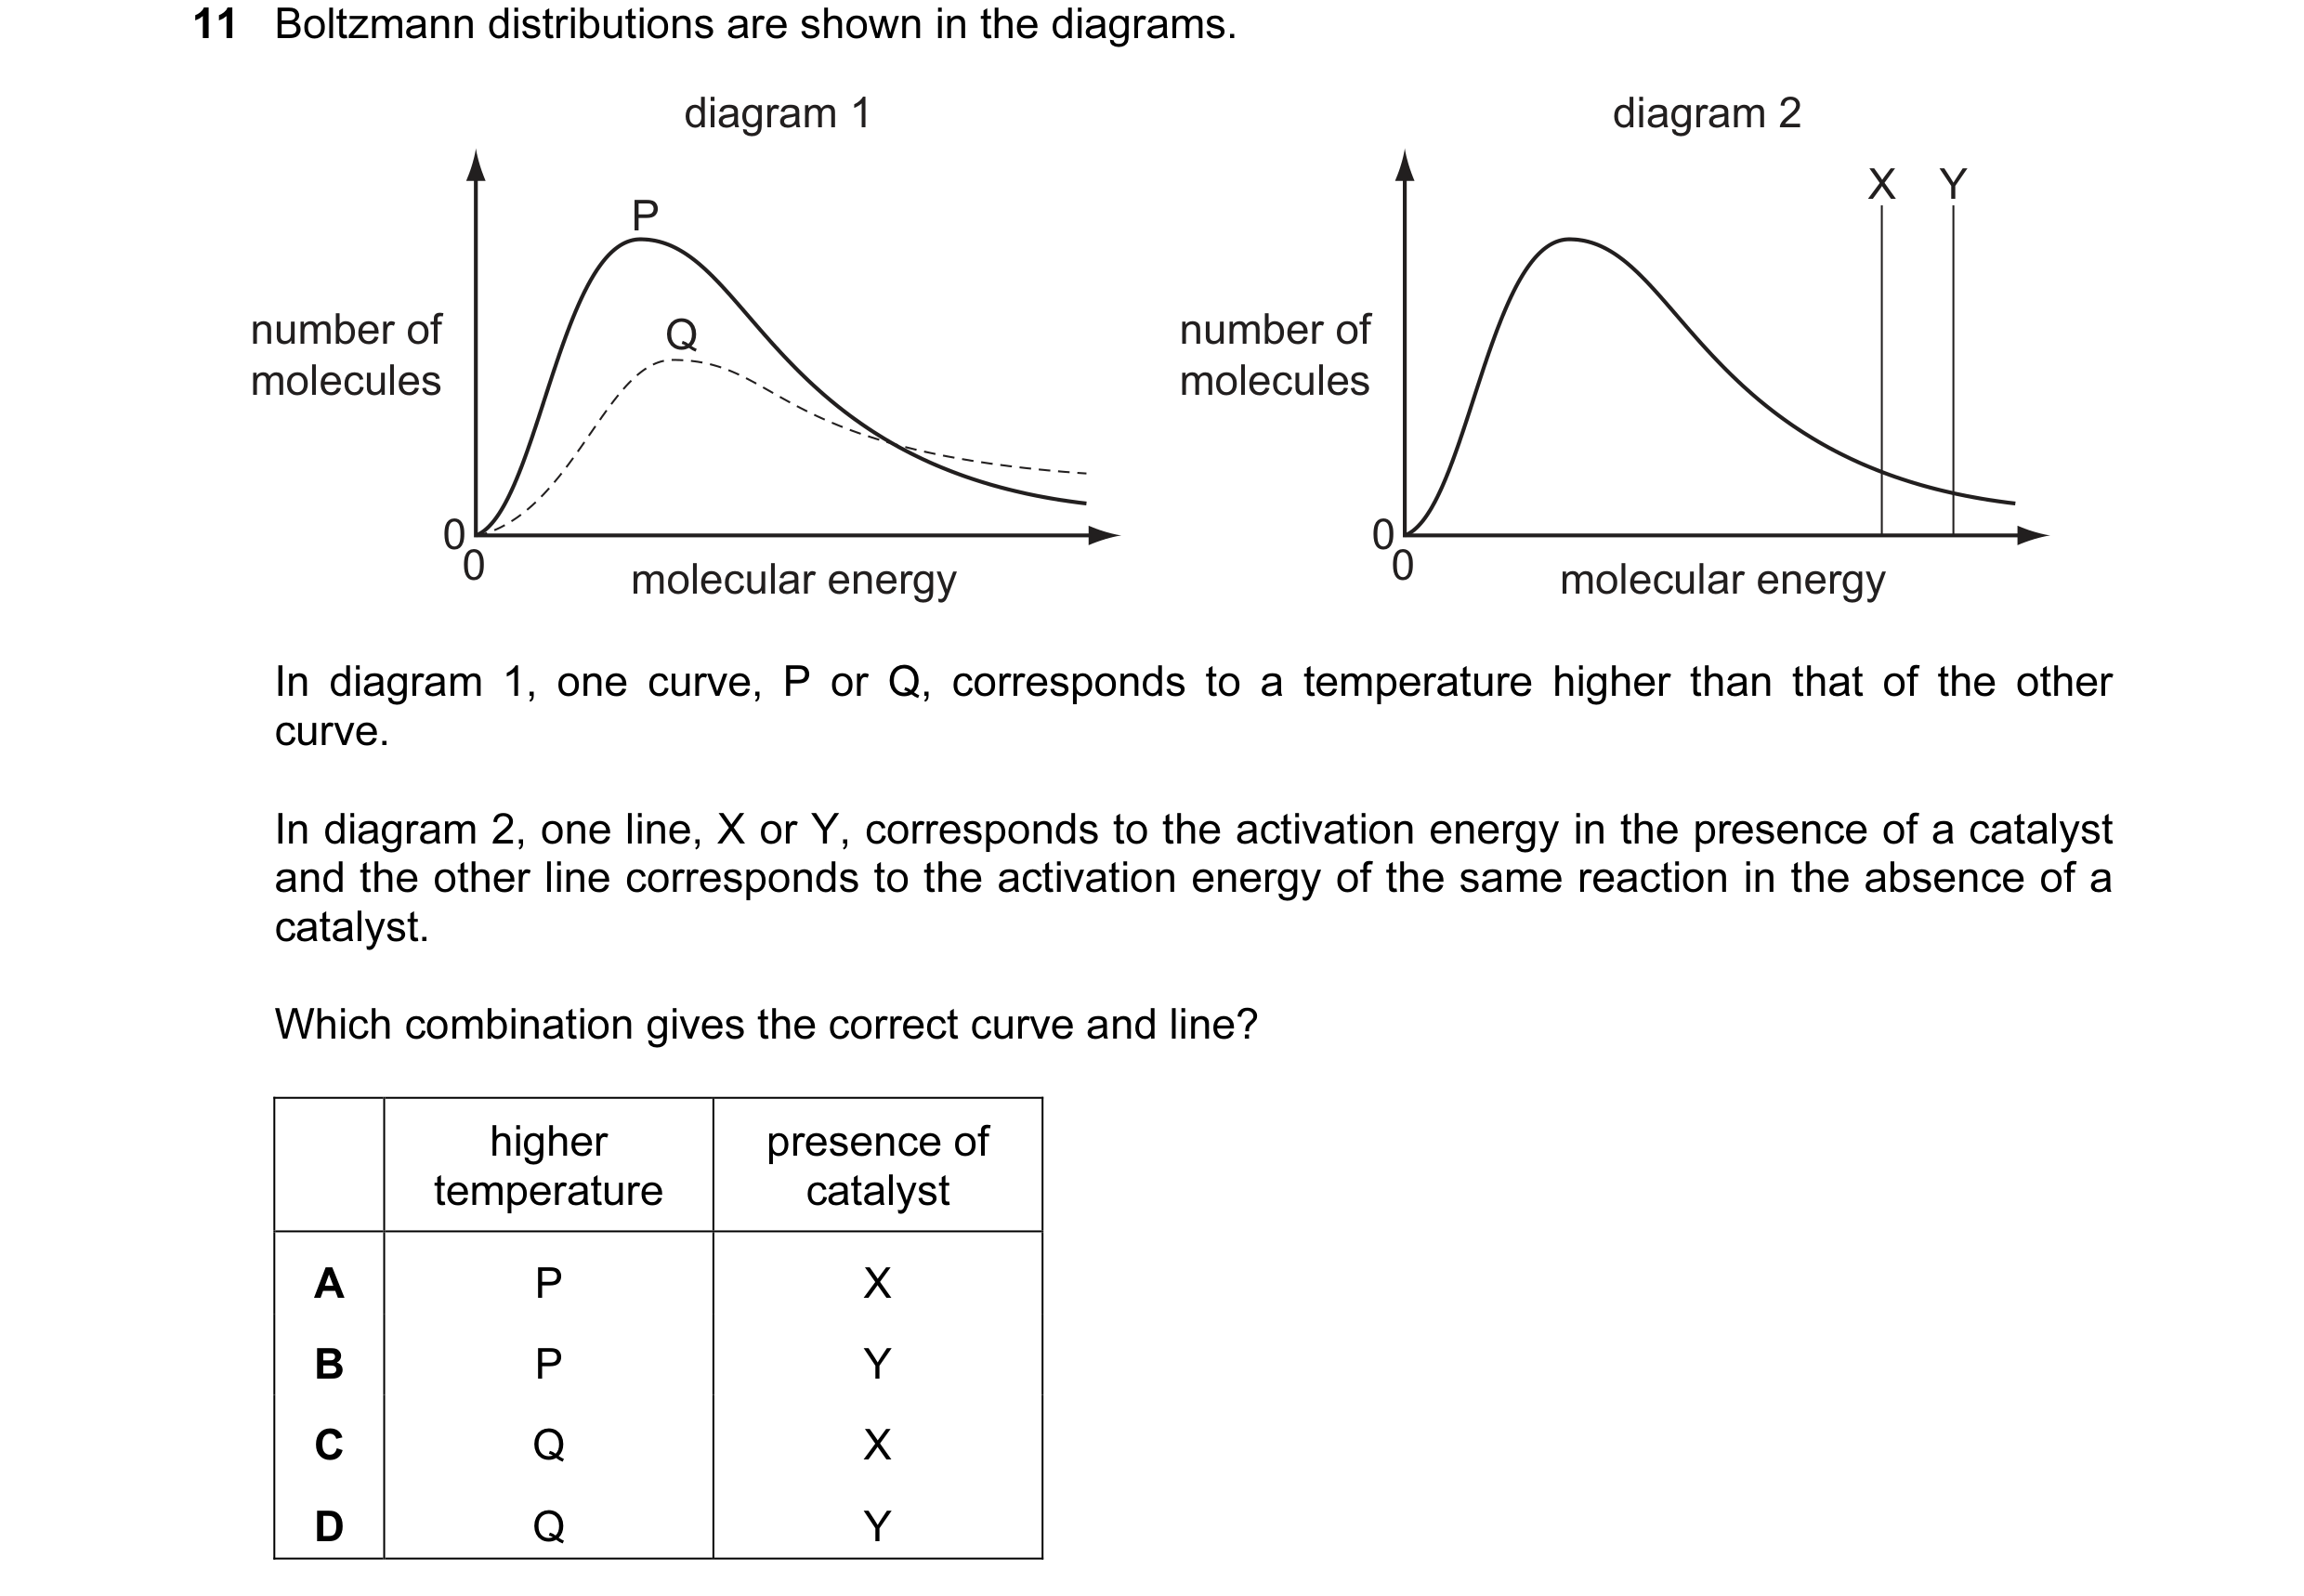
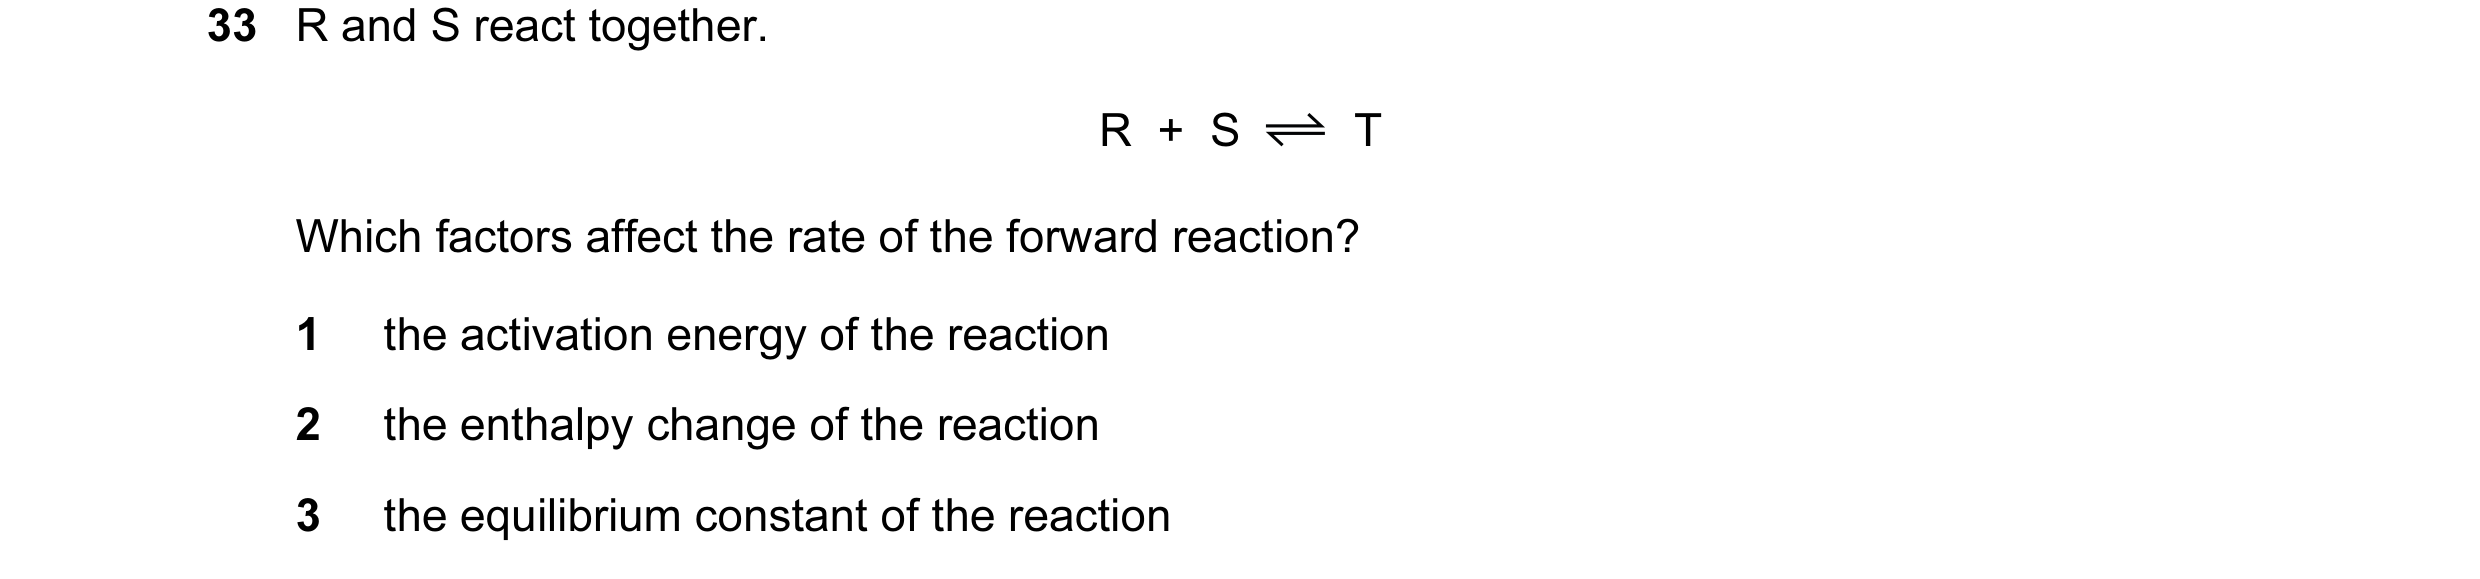 21 / 67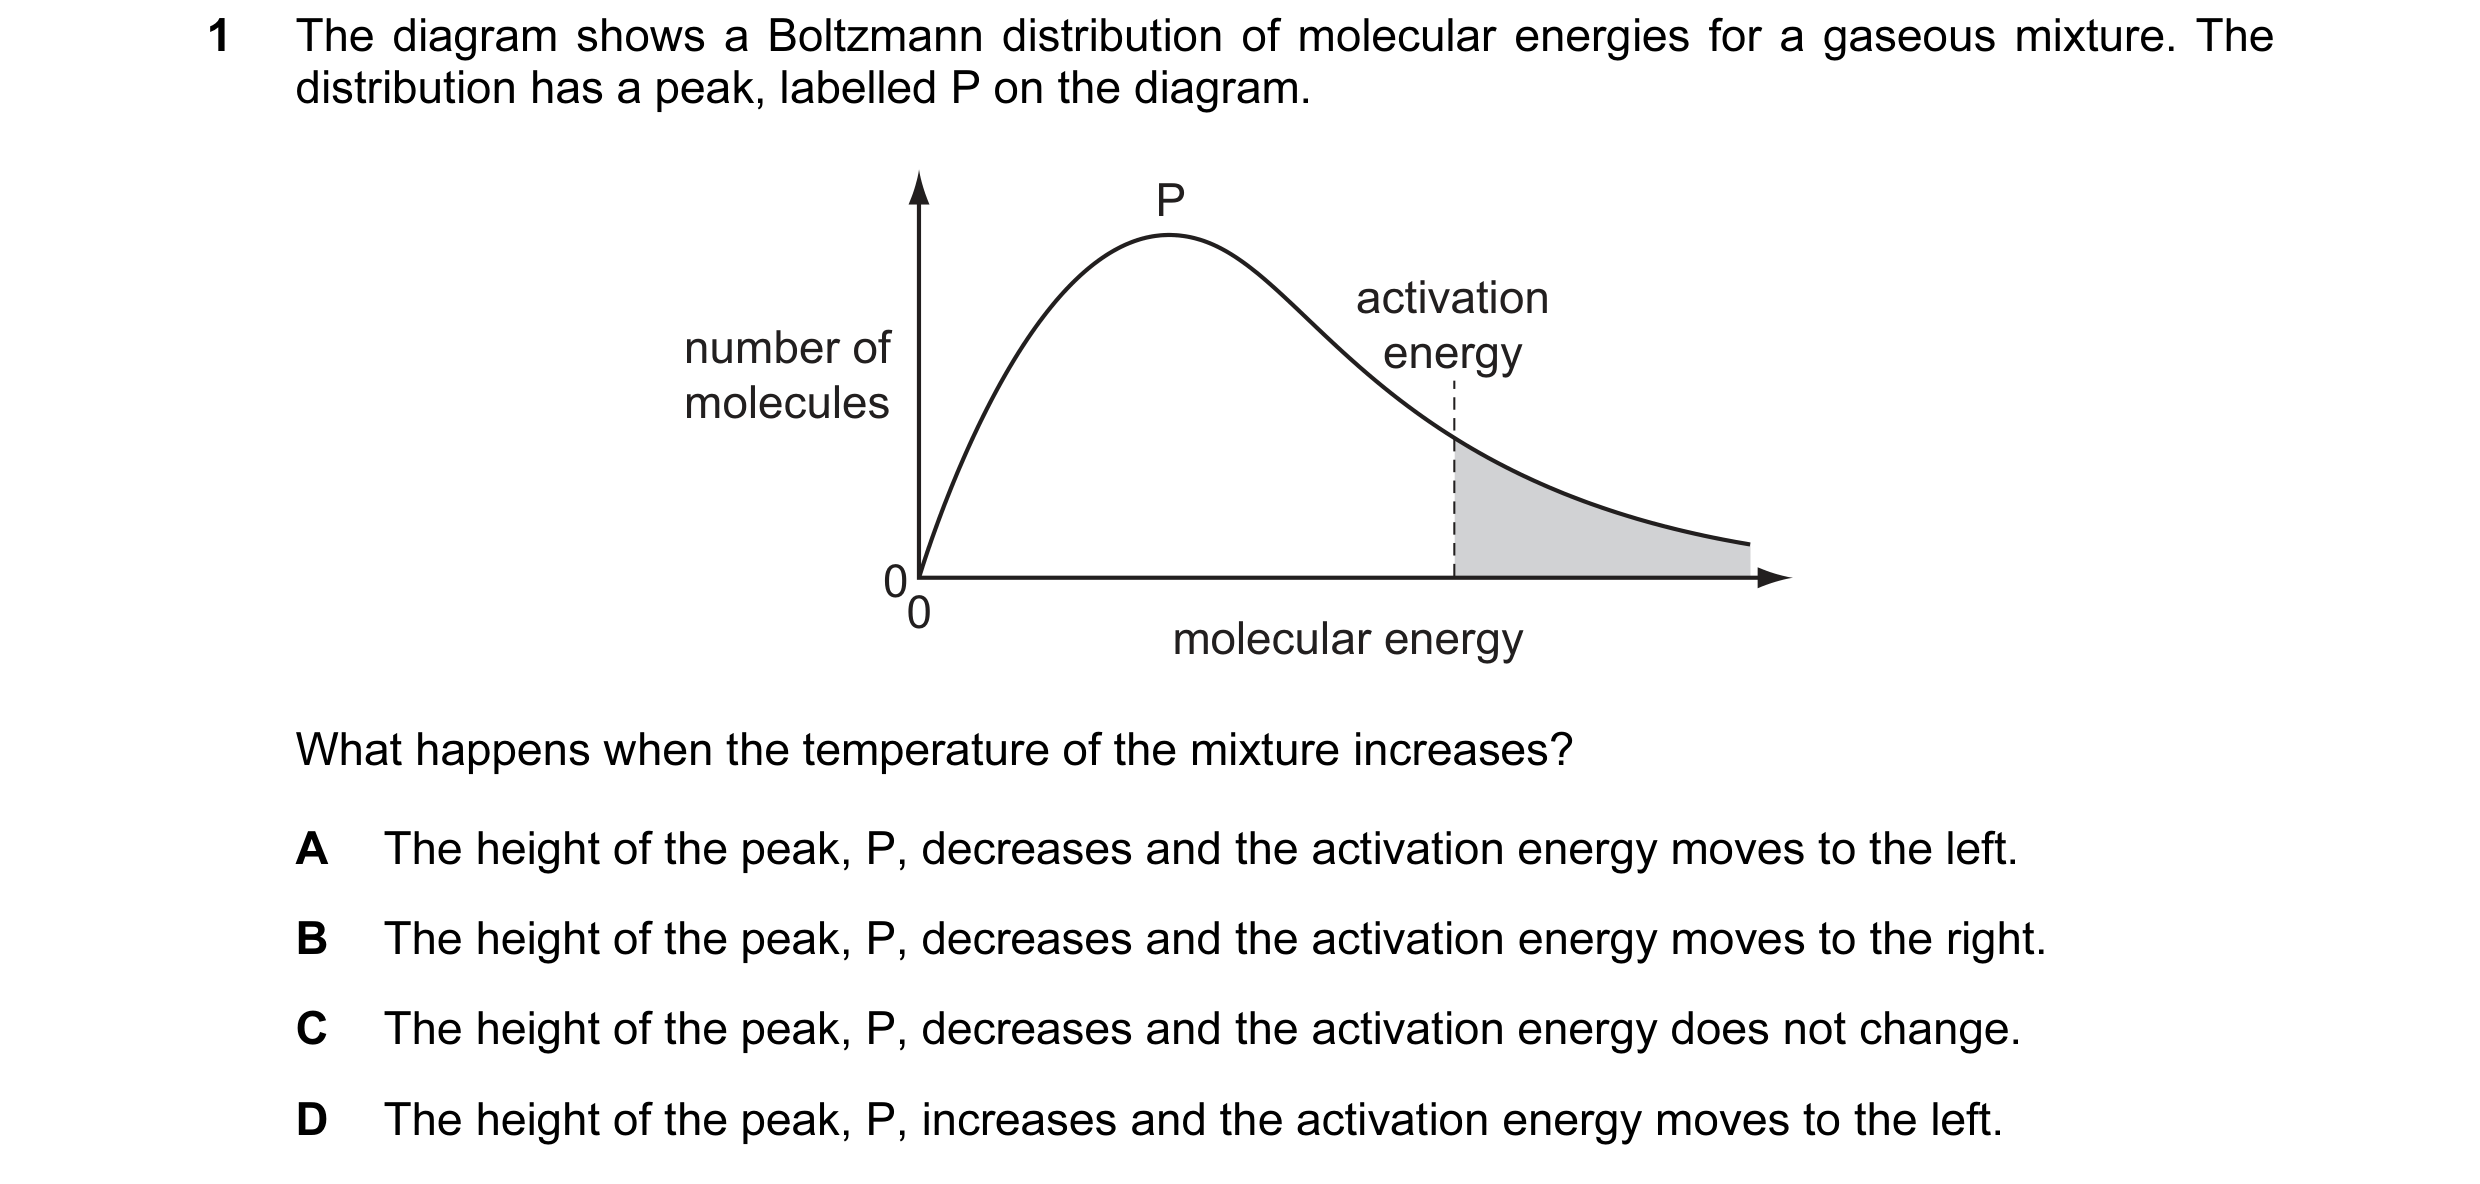
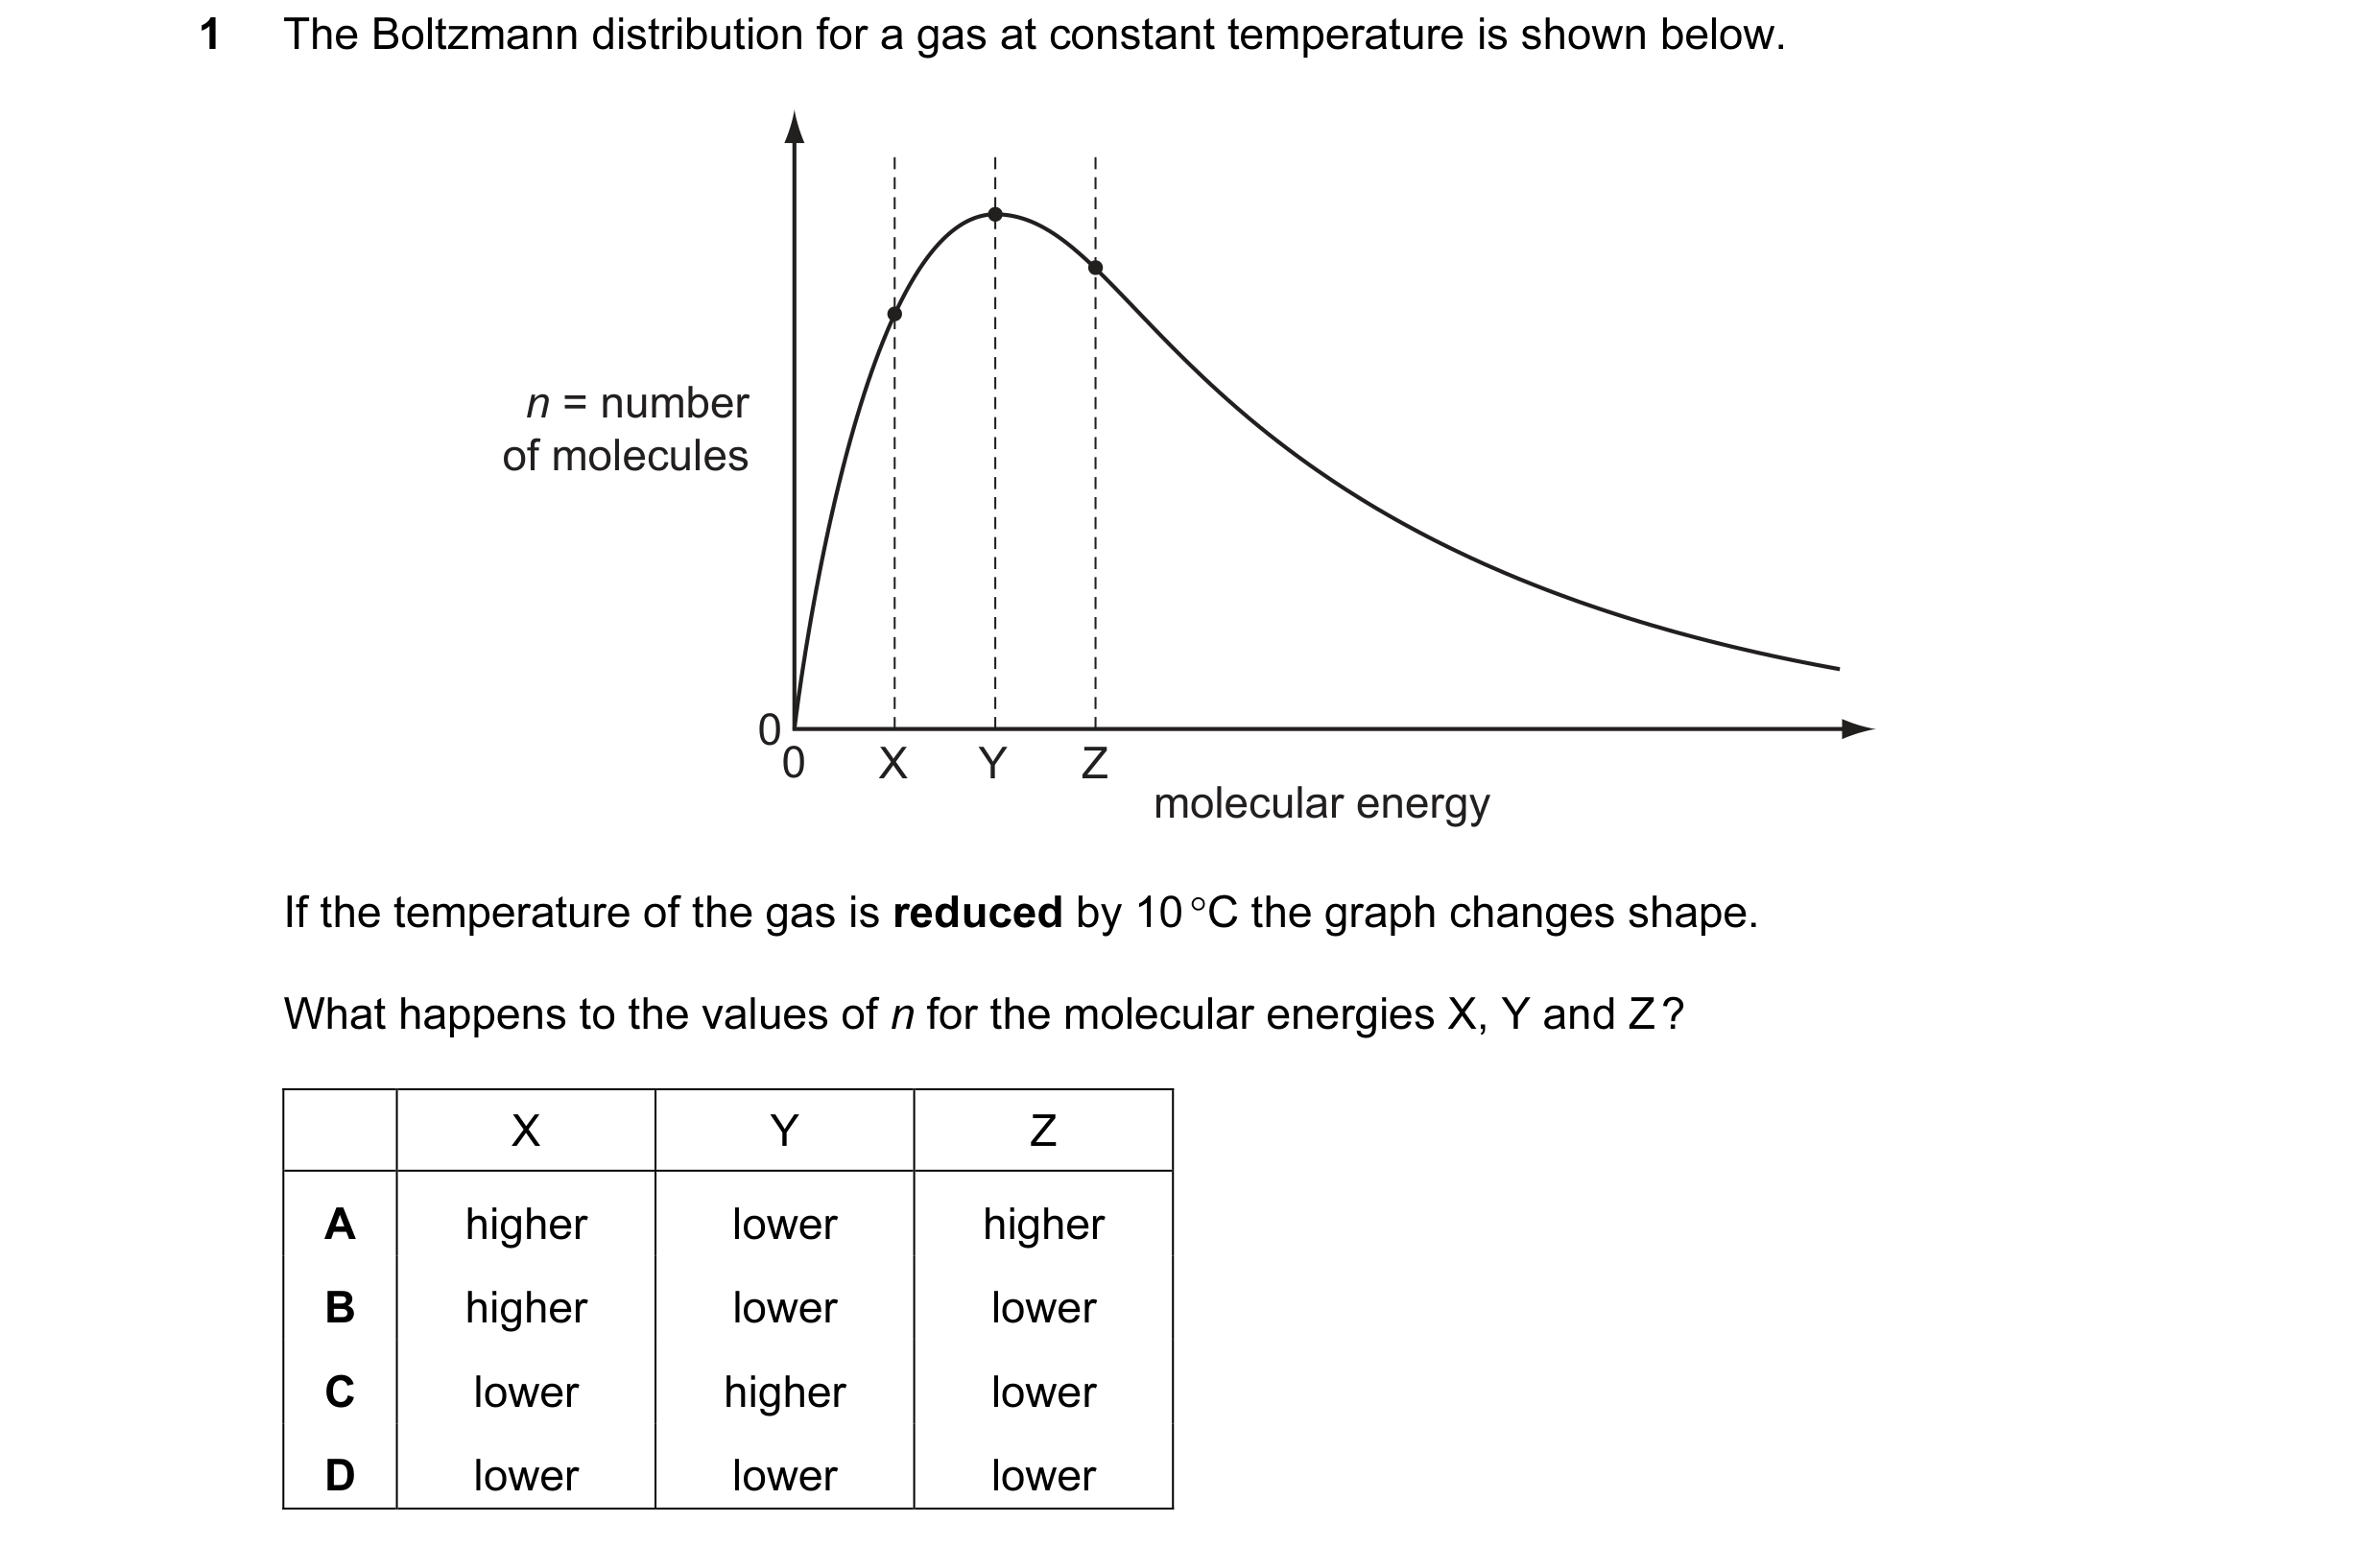 22 / 67
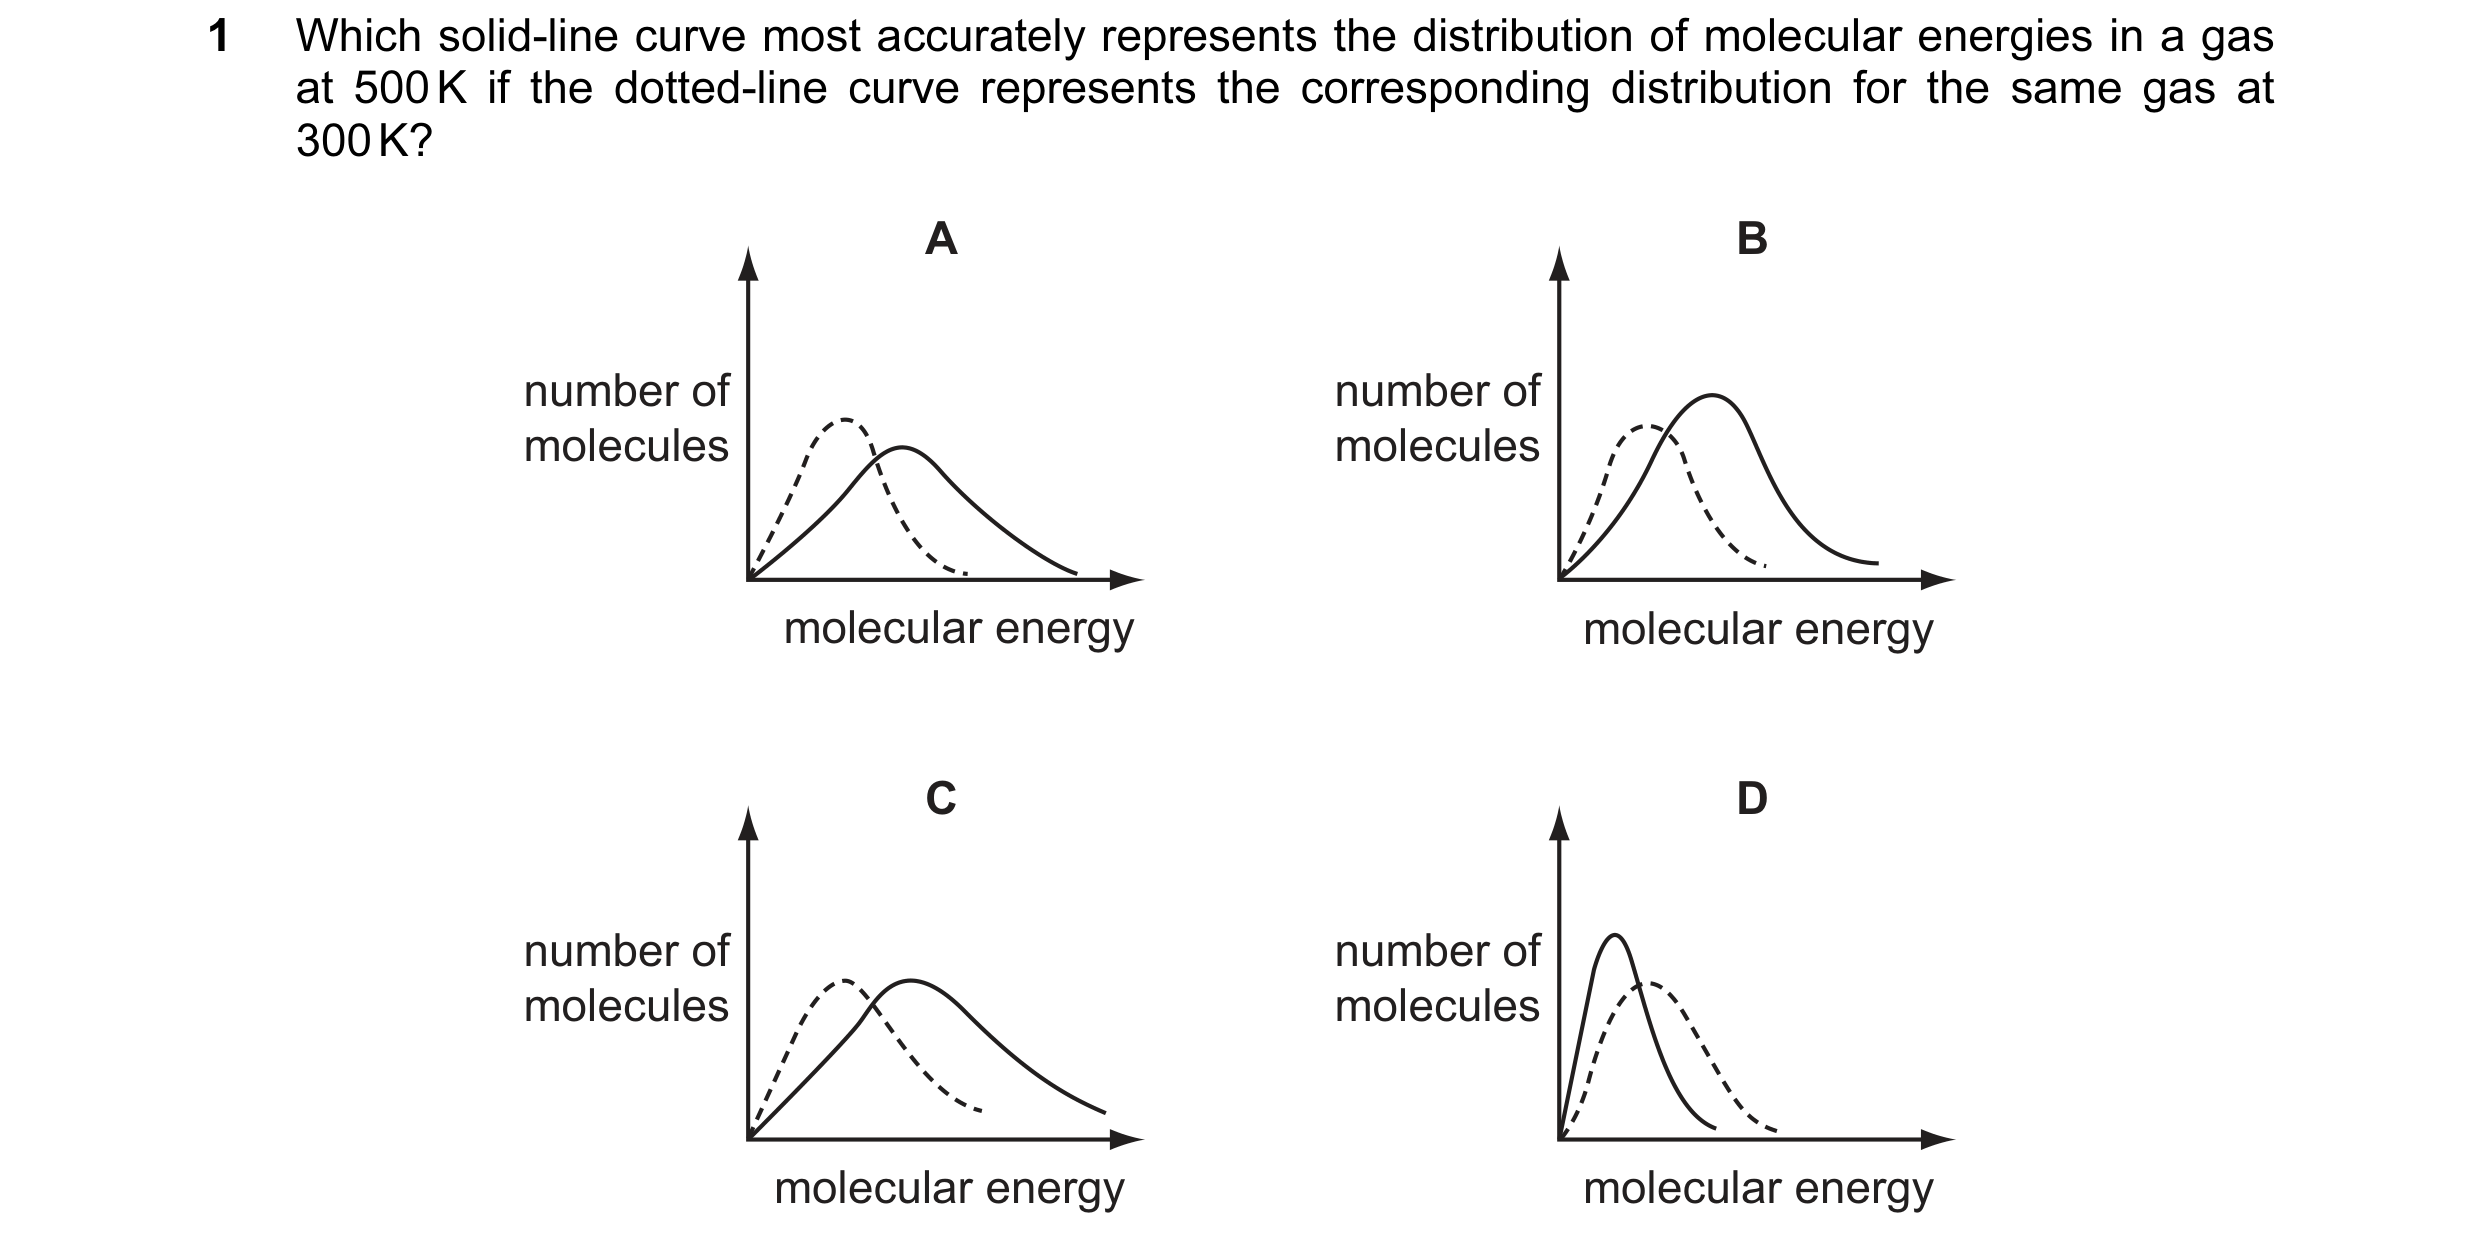
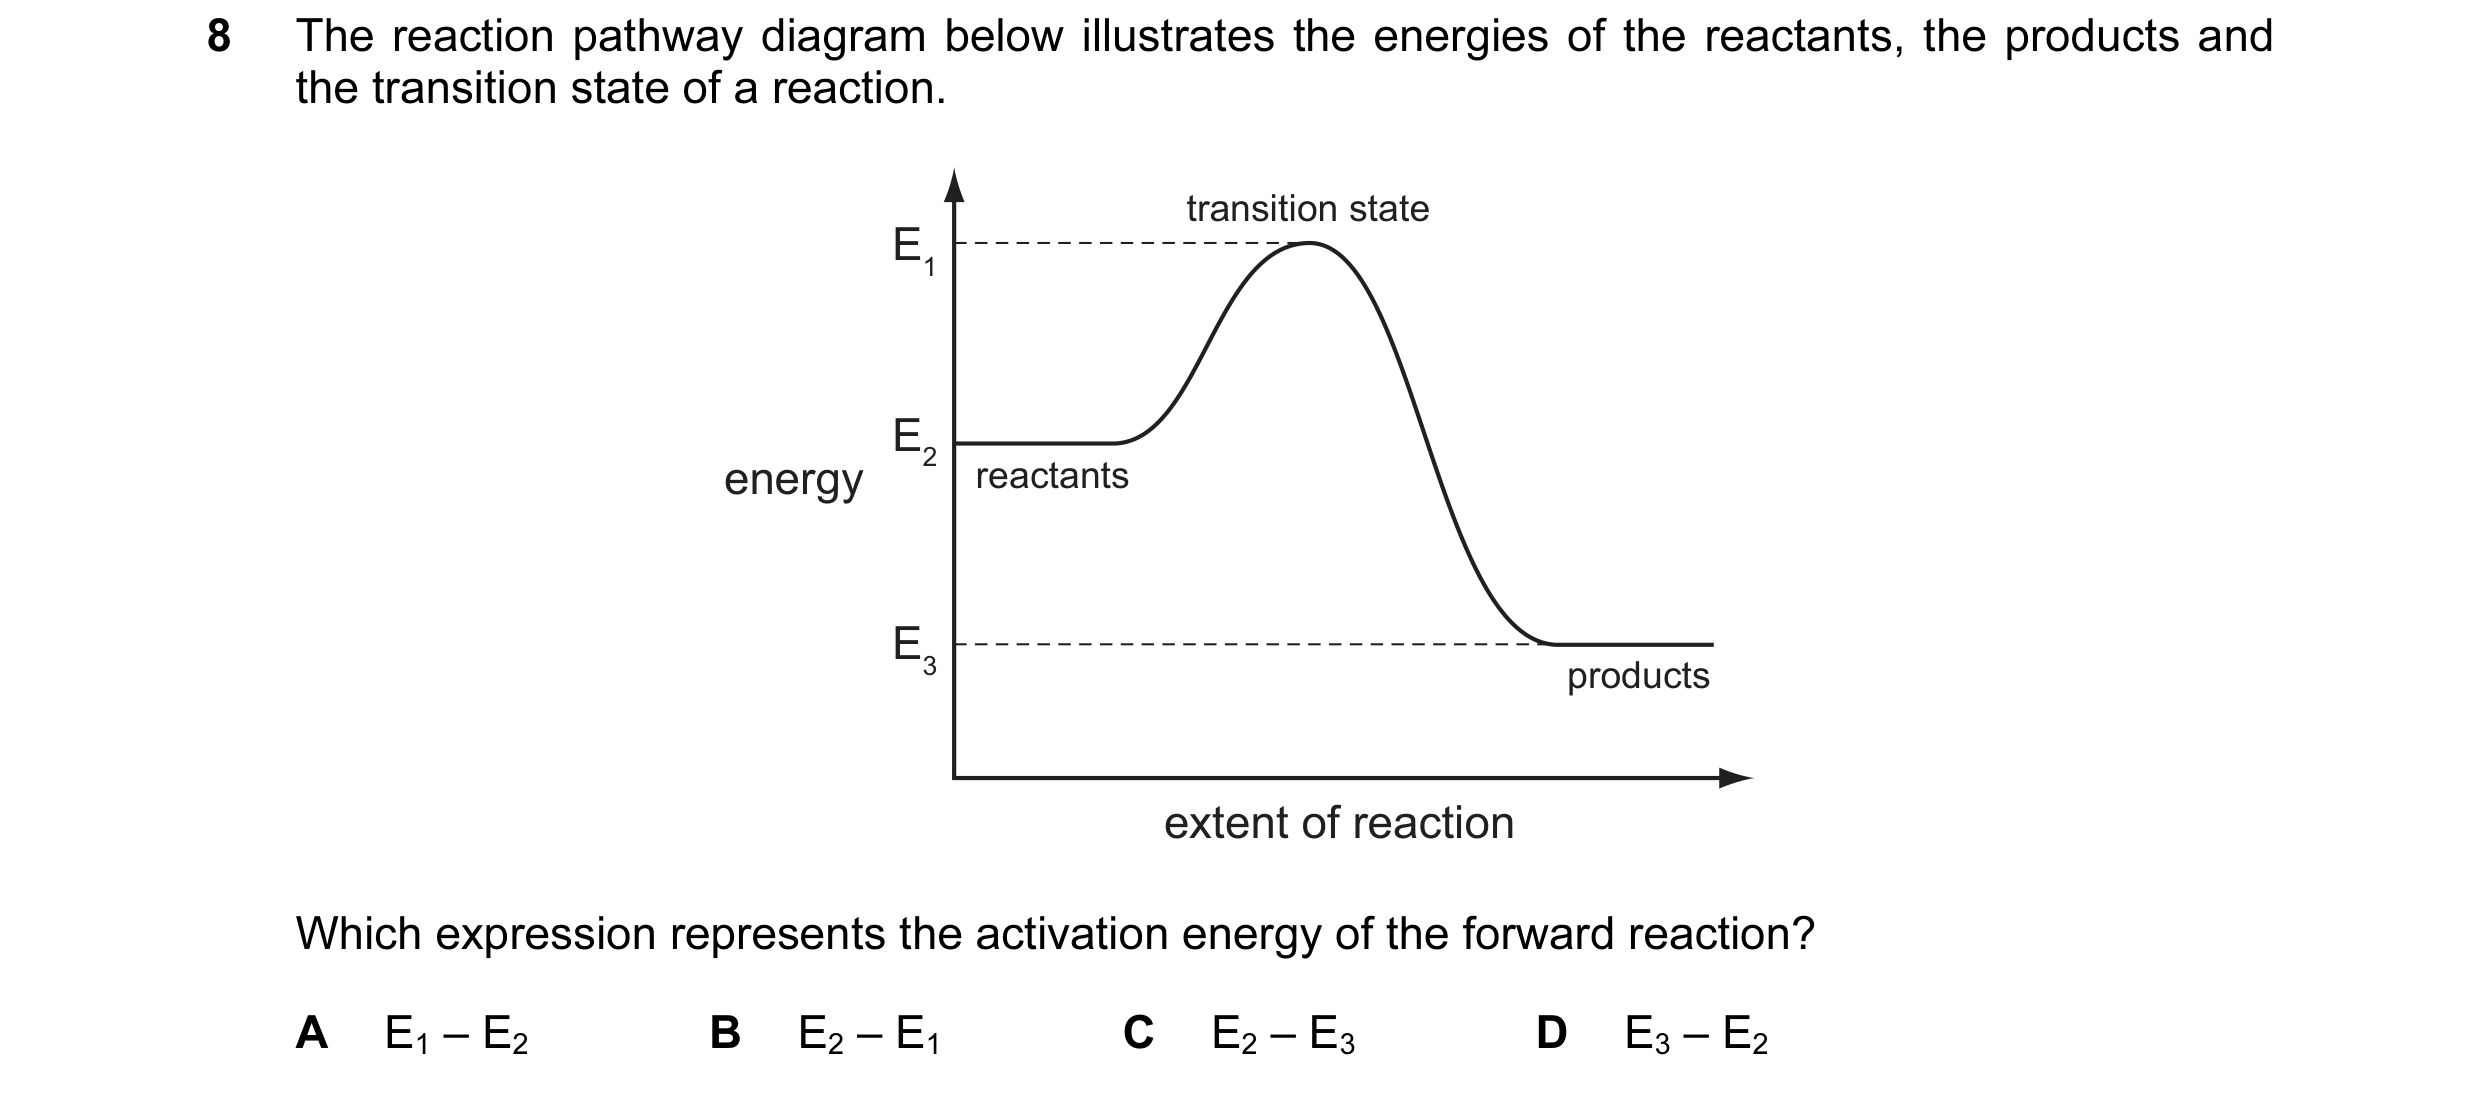 23 / 67
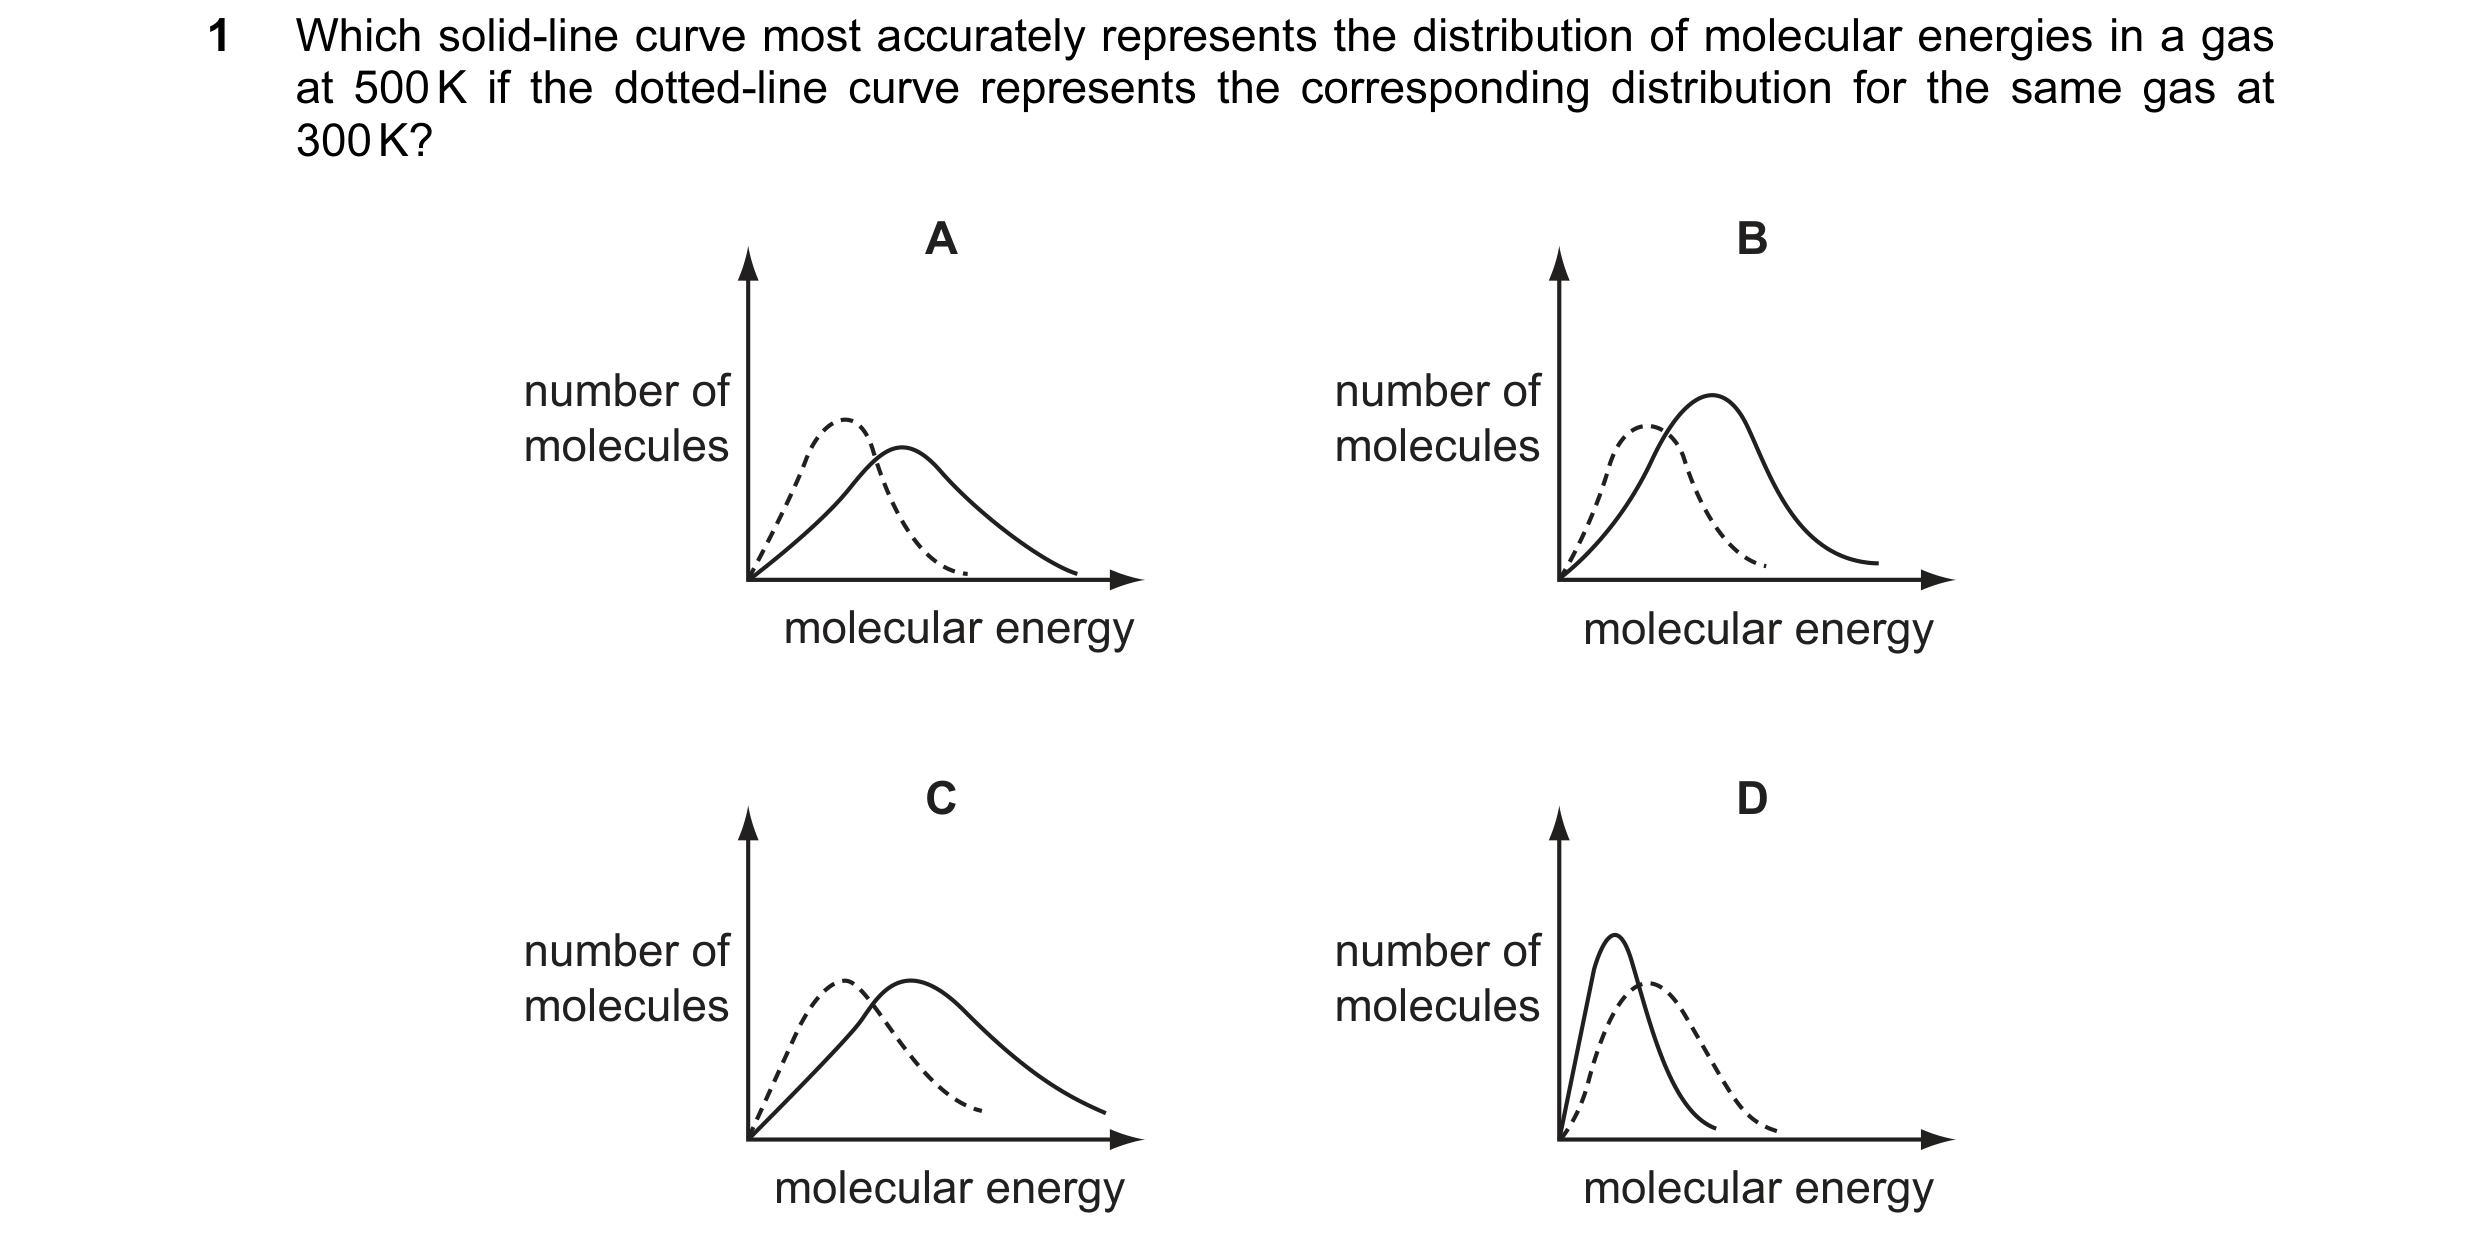
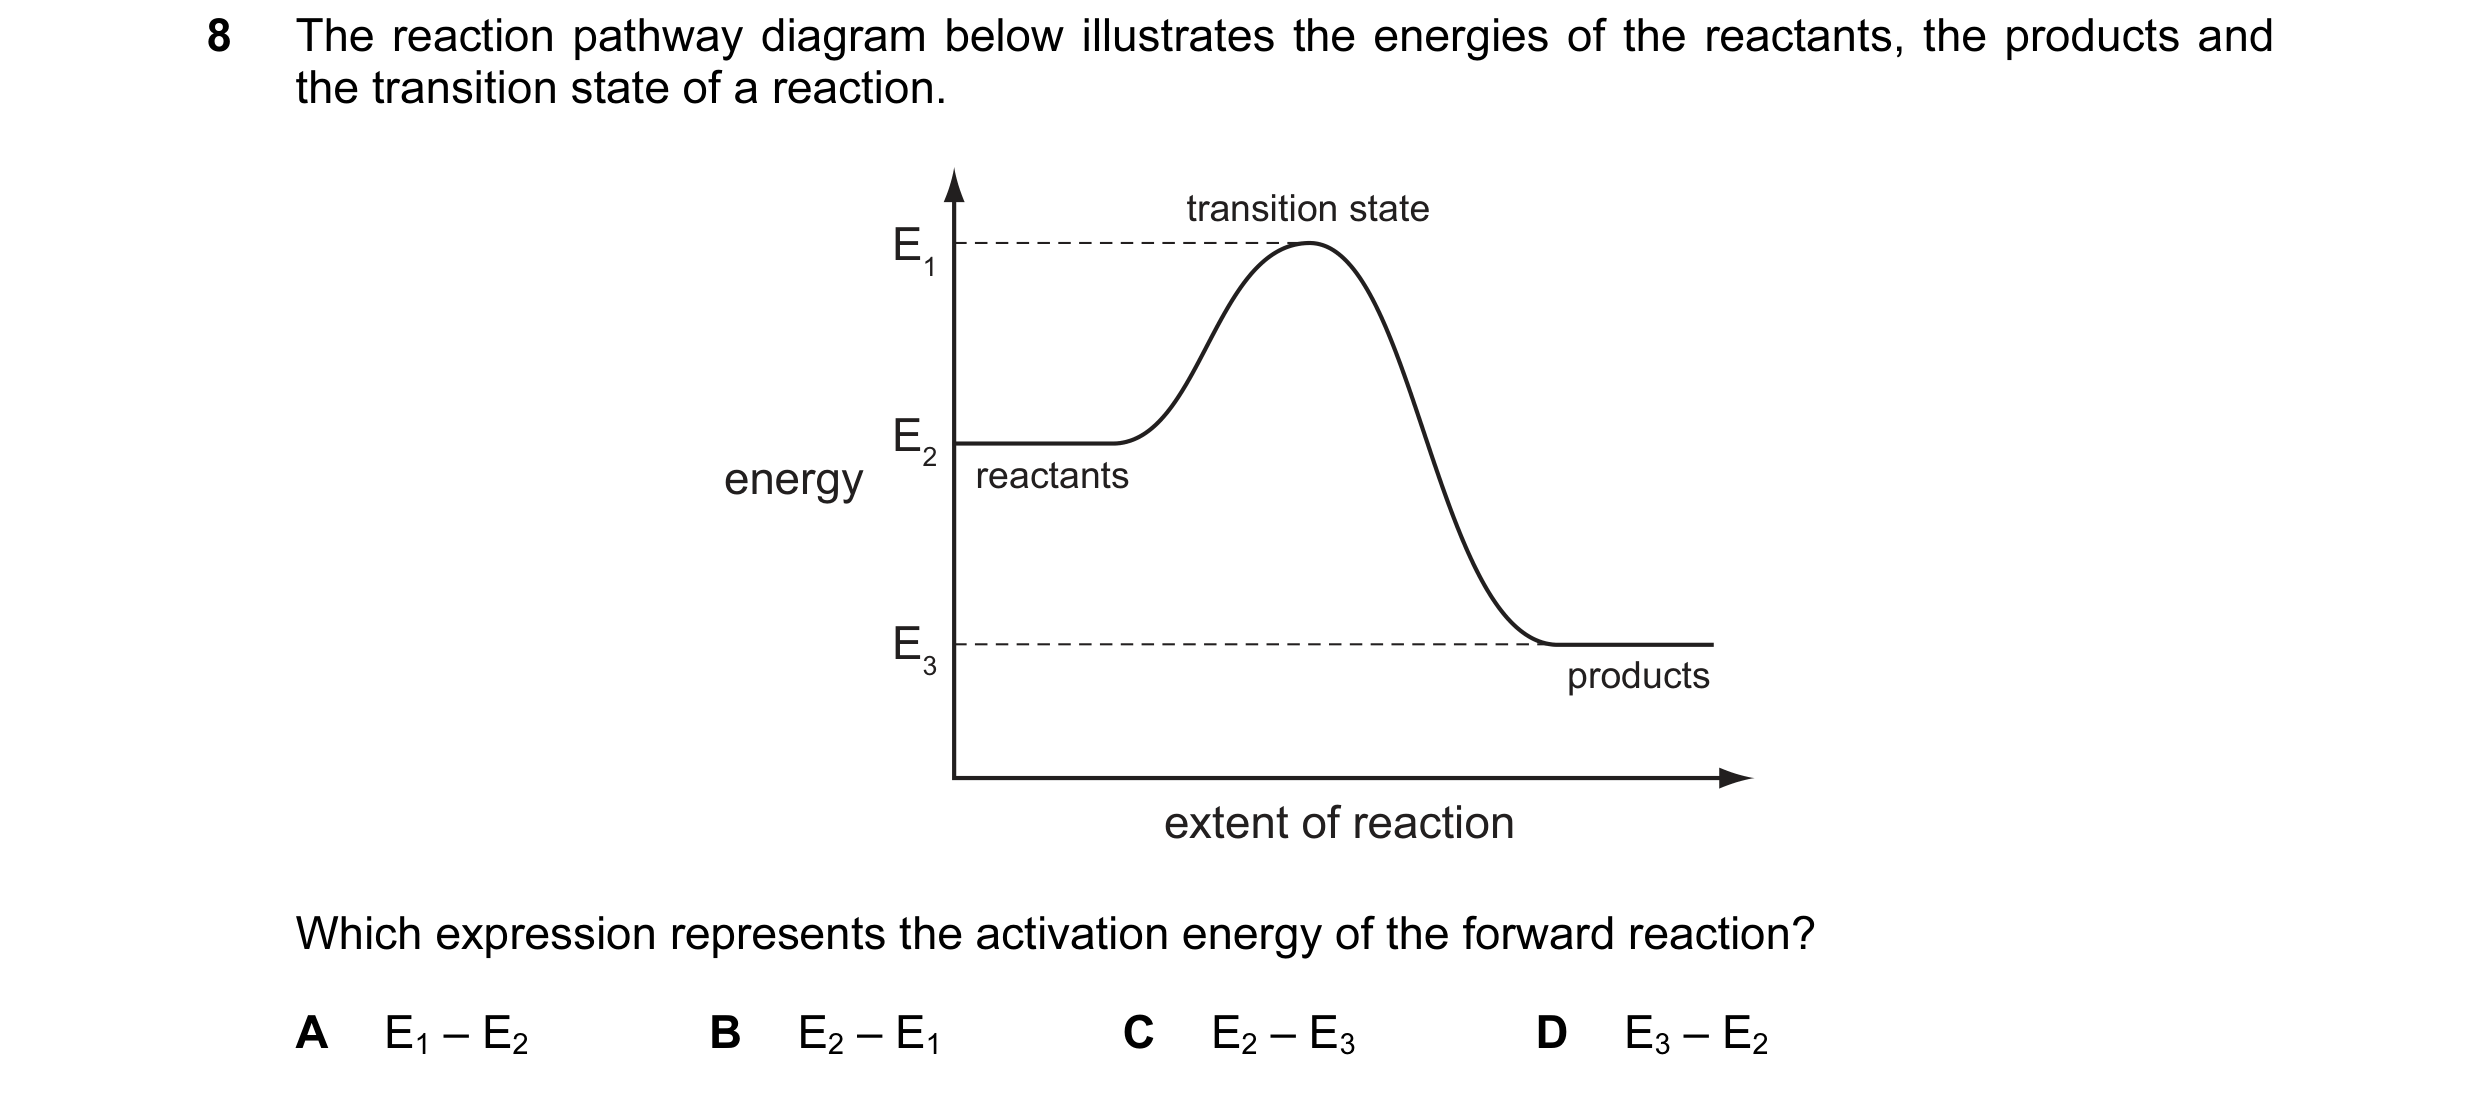
 24 / 67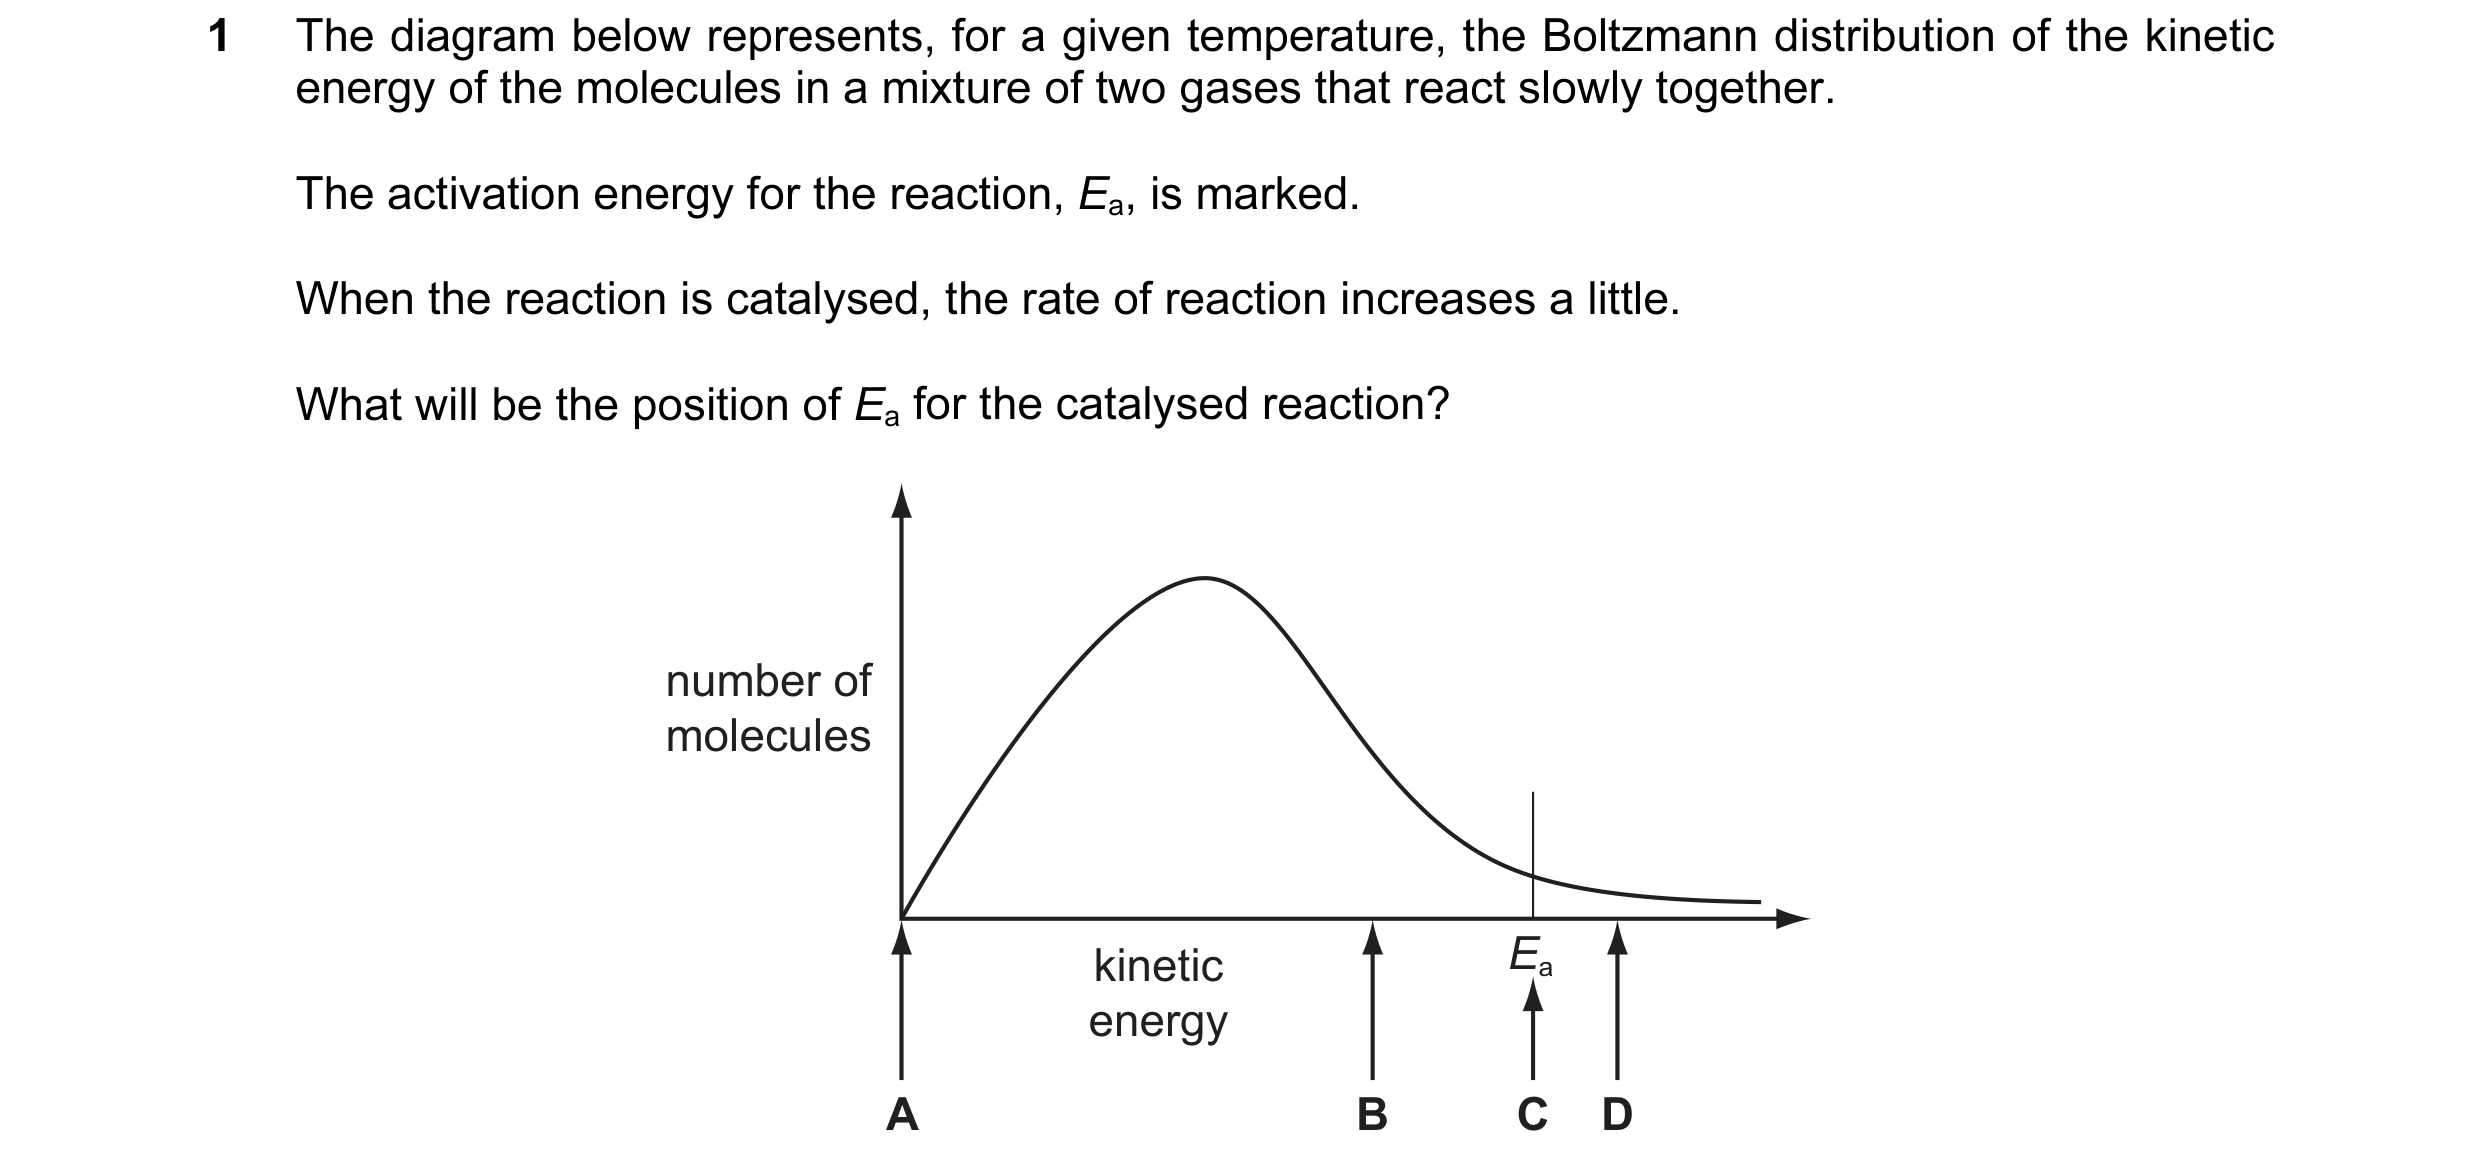
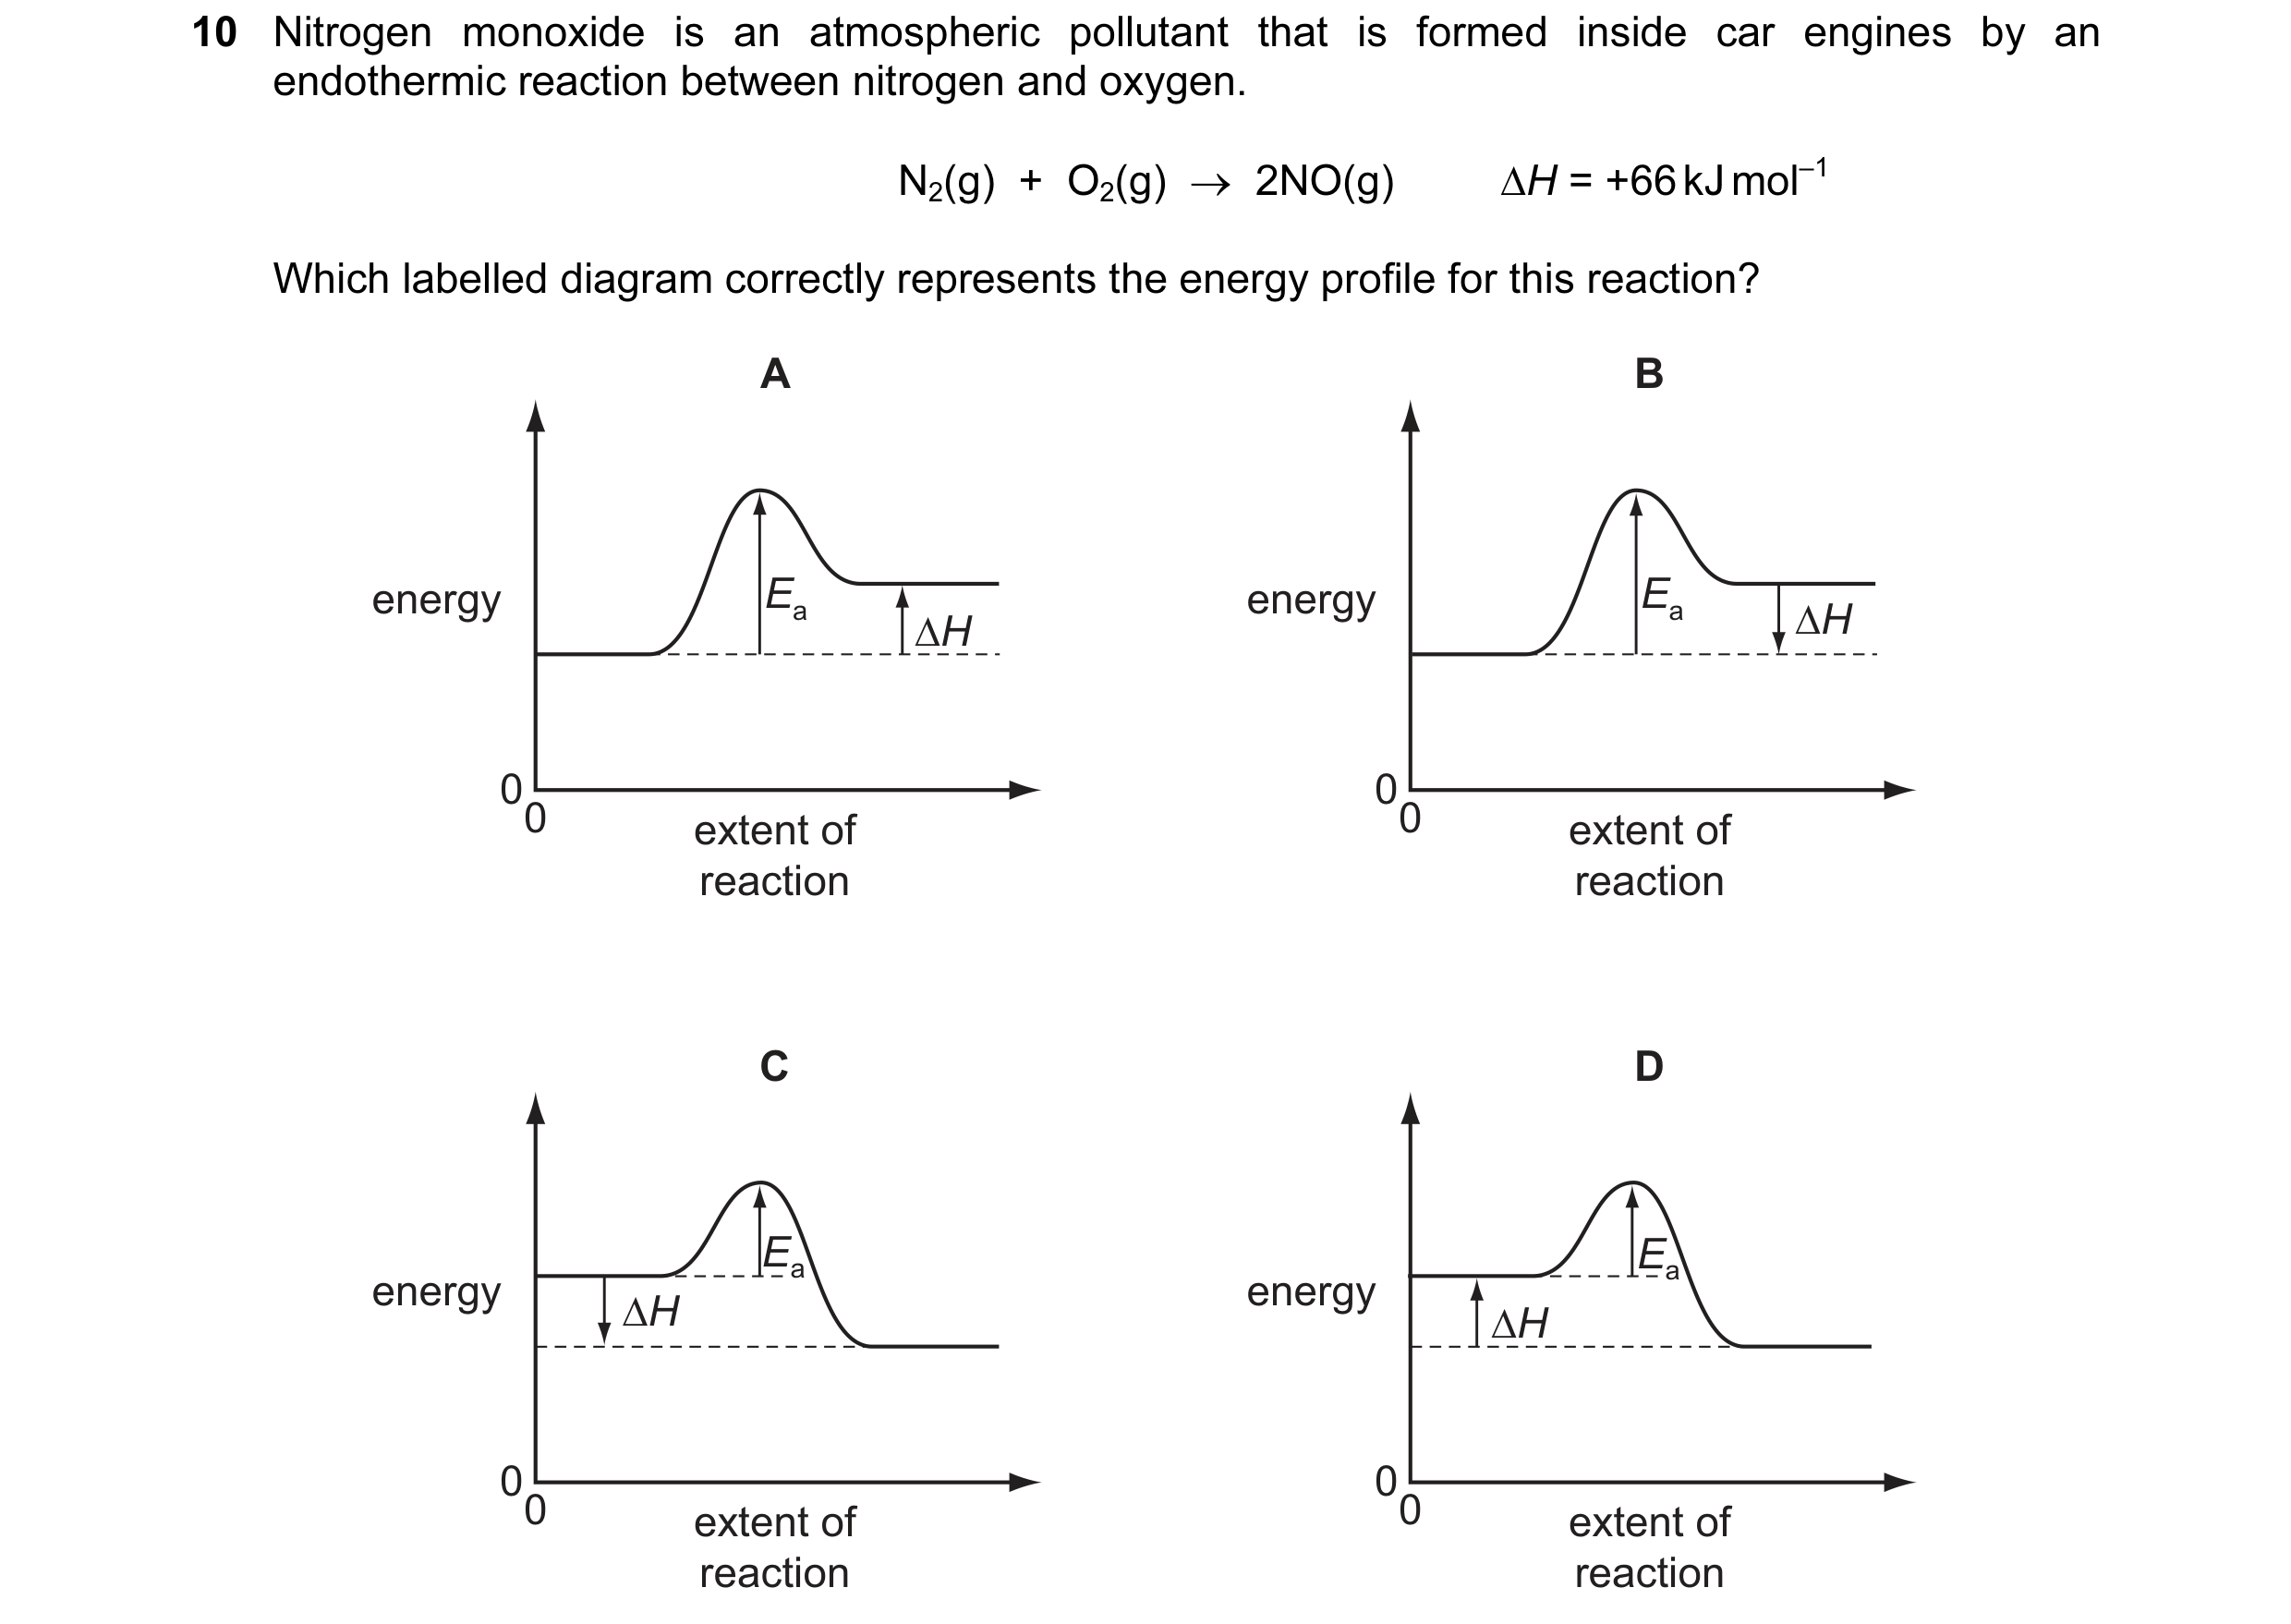 25 / 67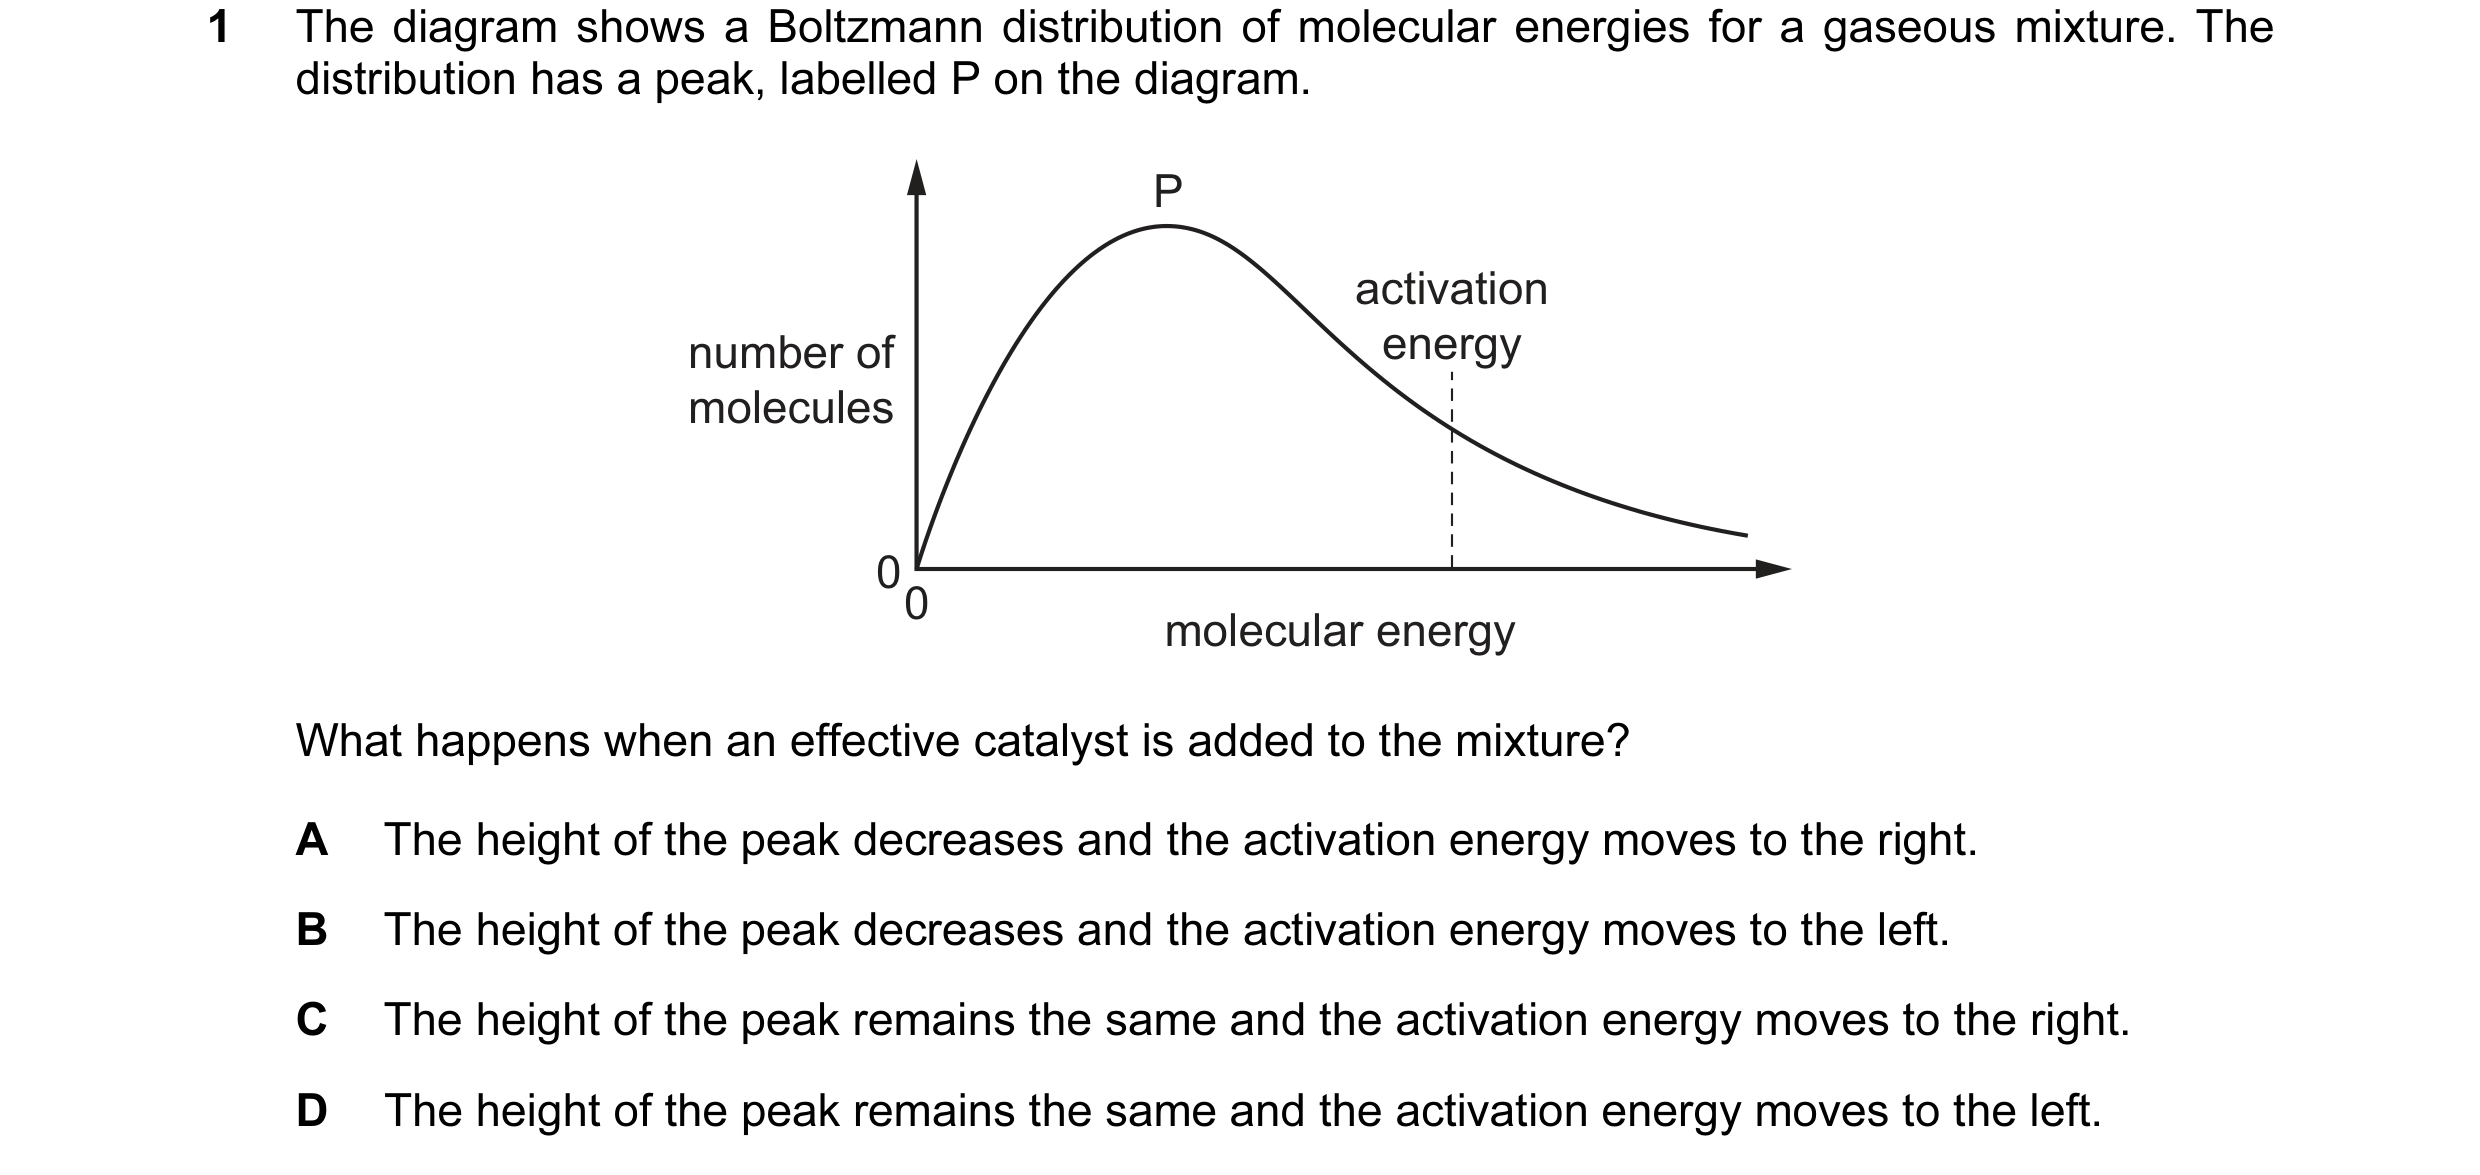

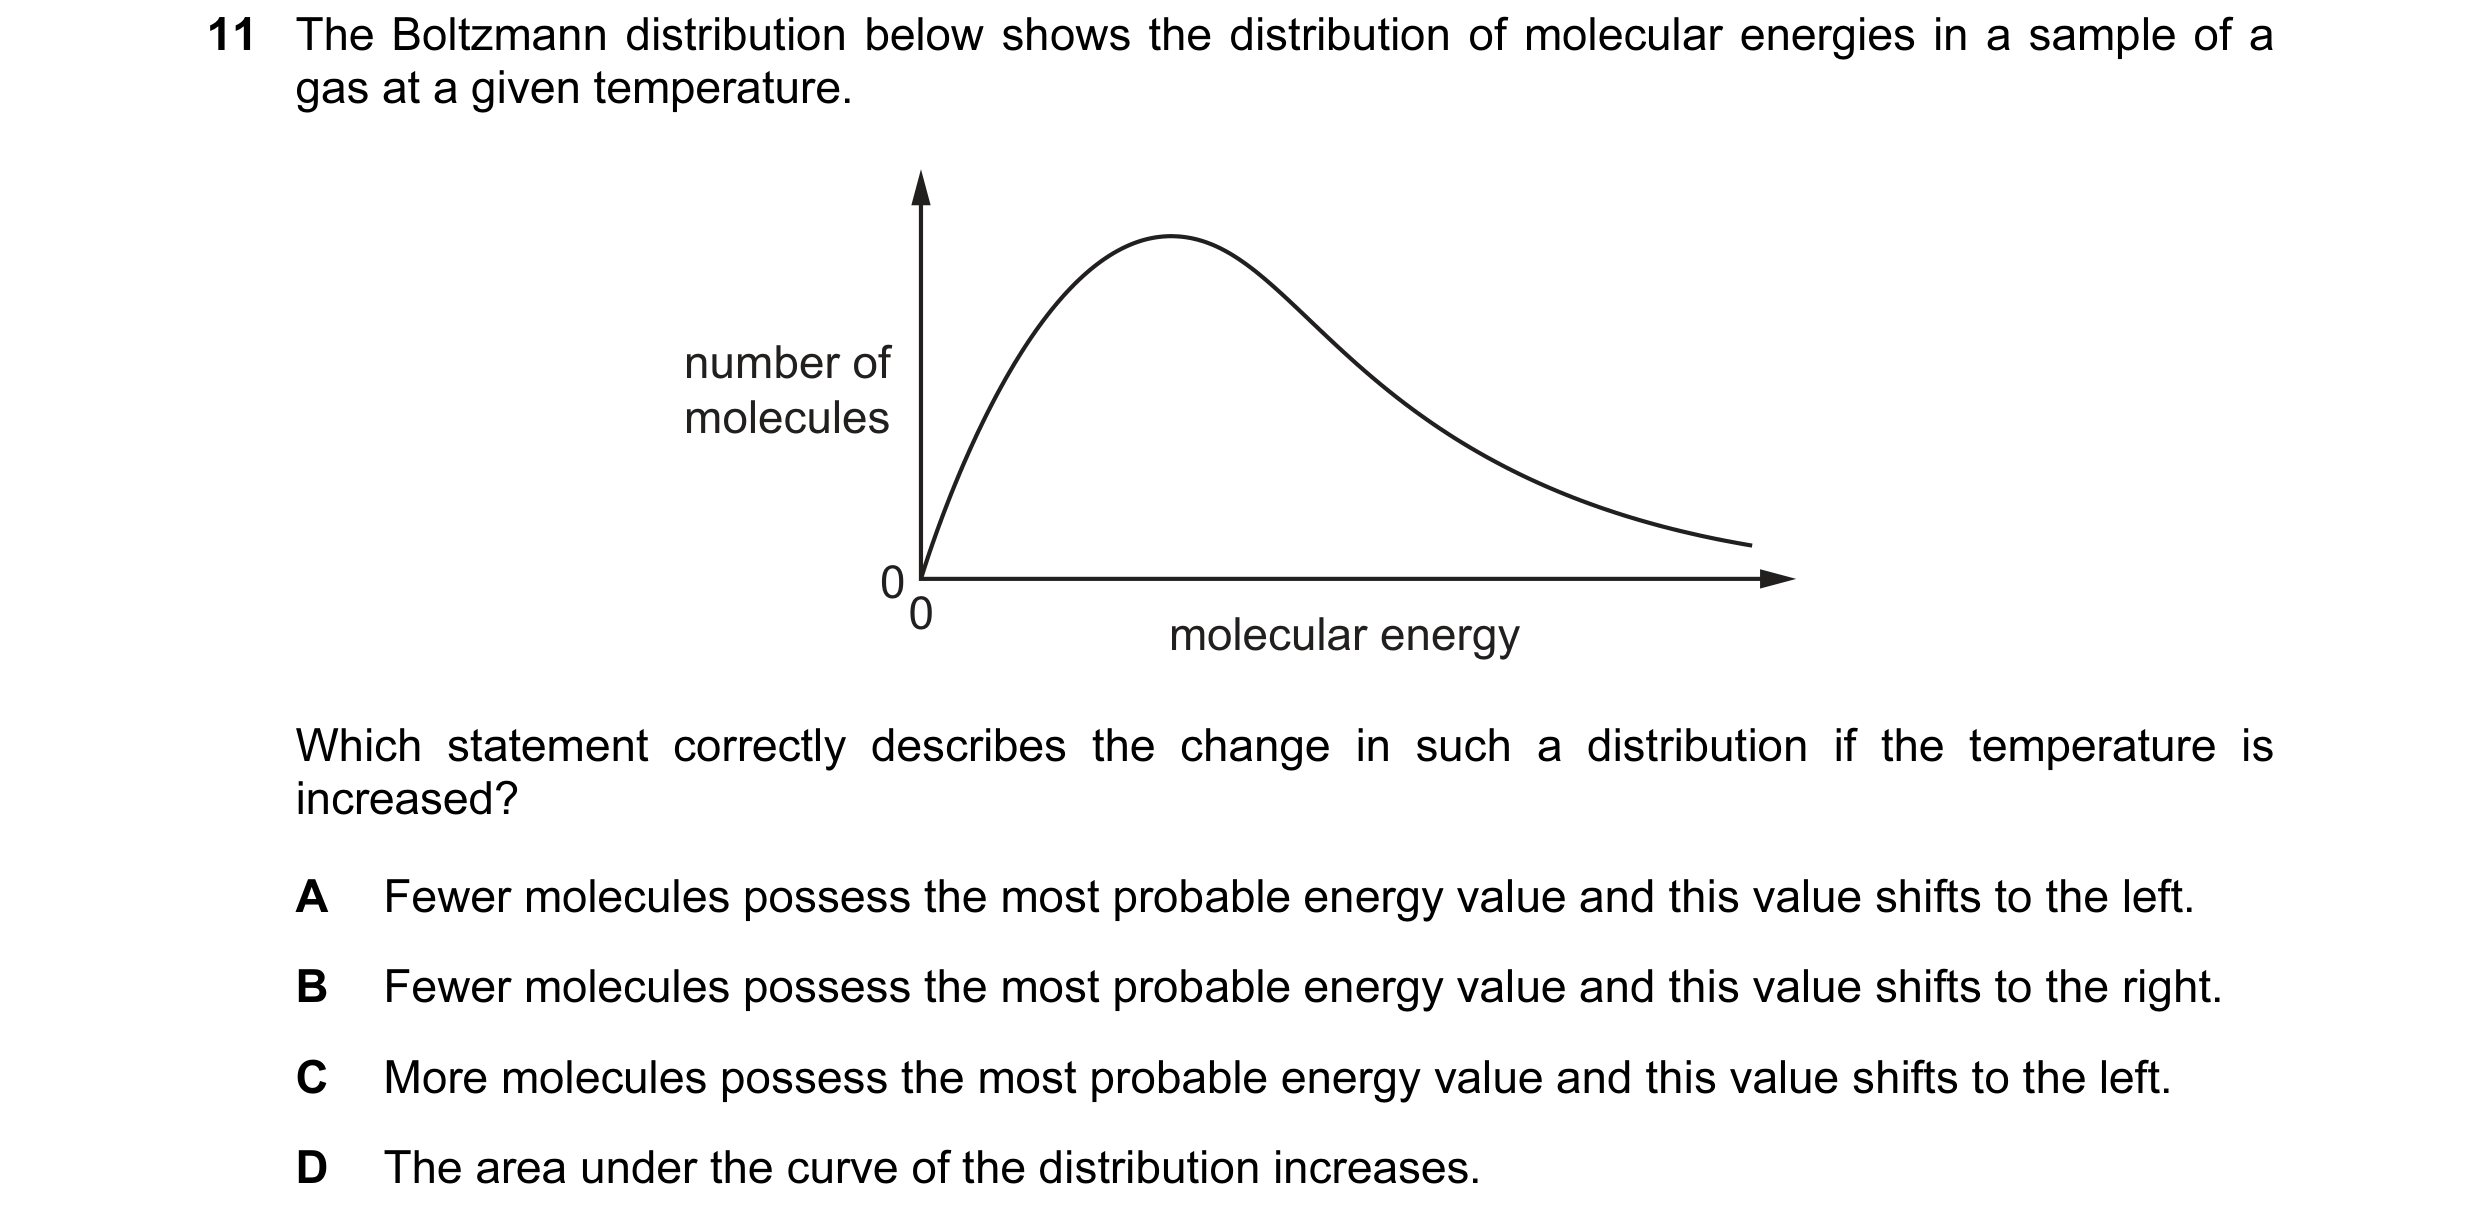 26 / 67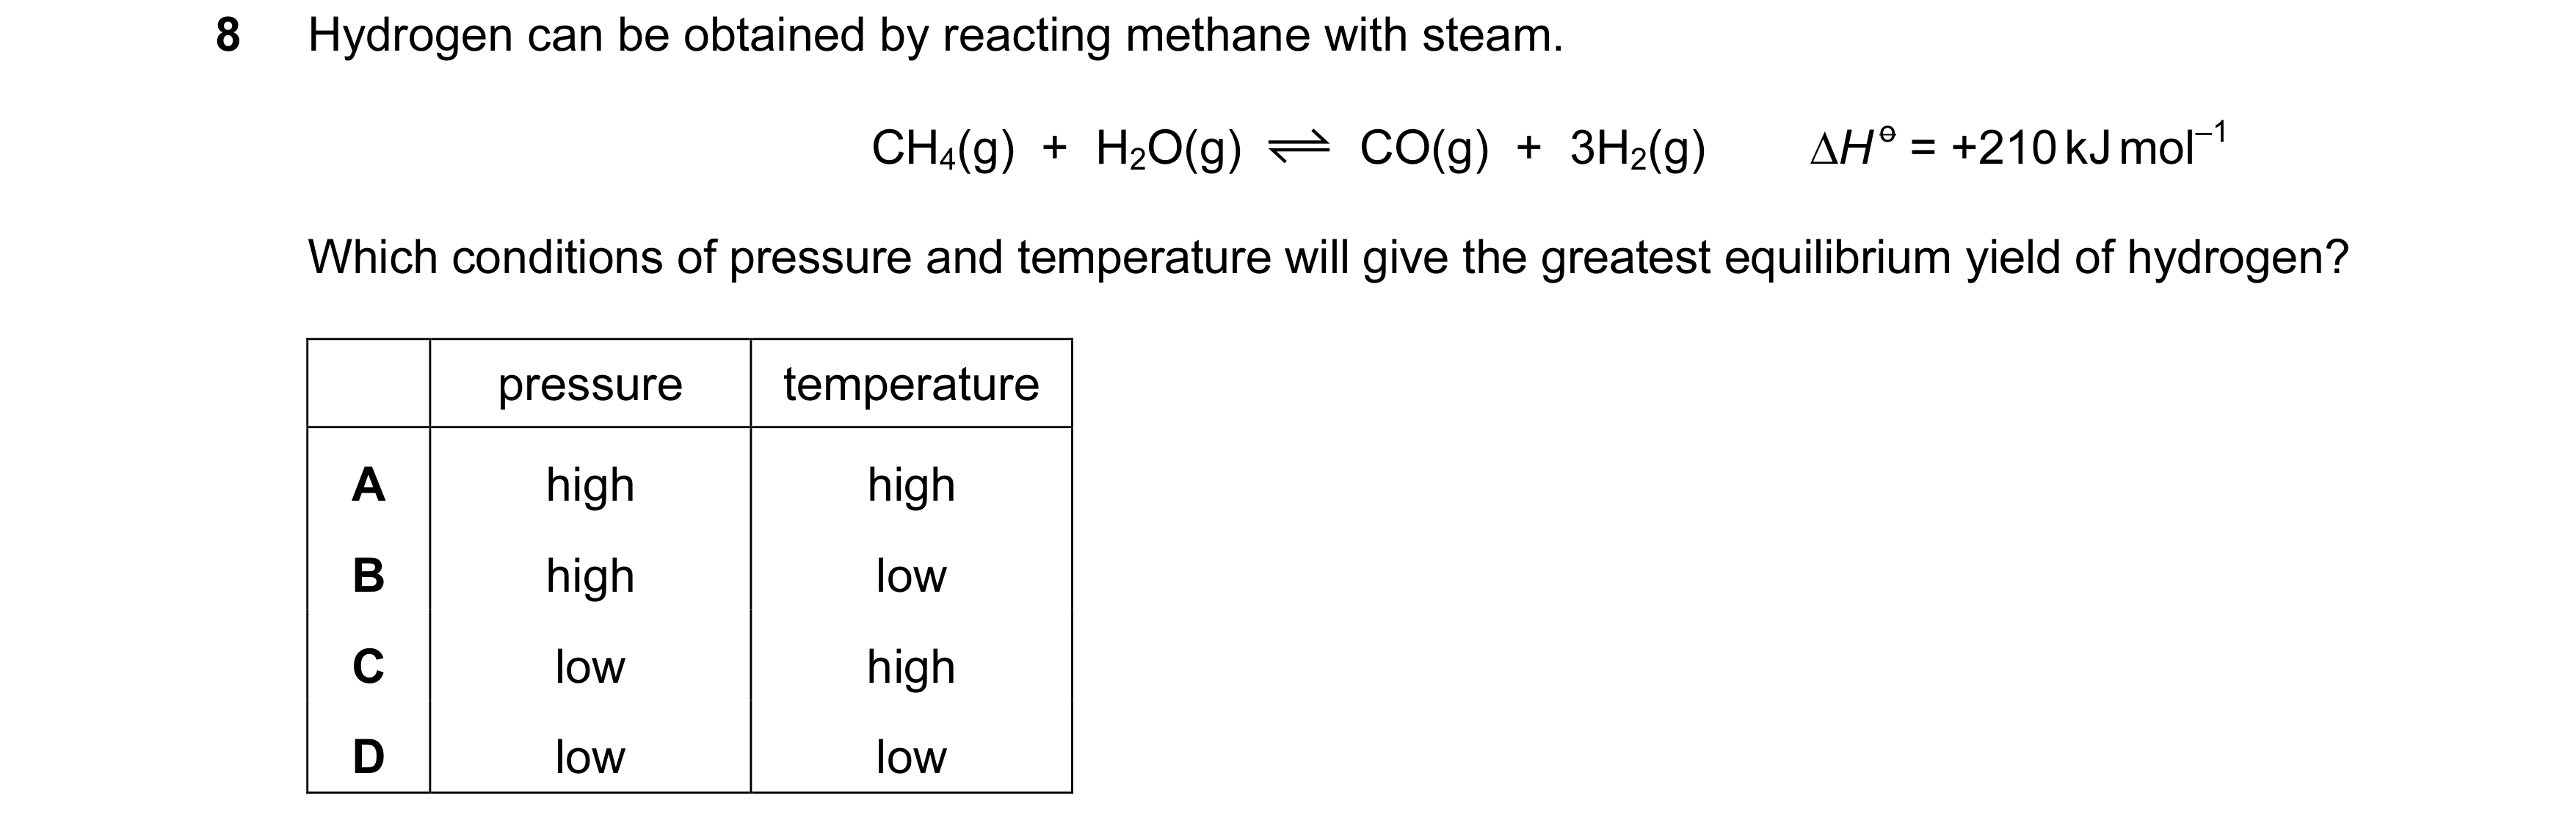
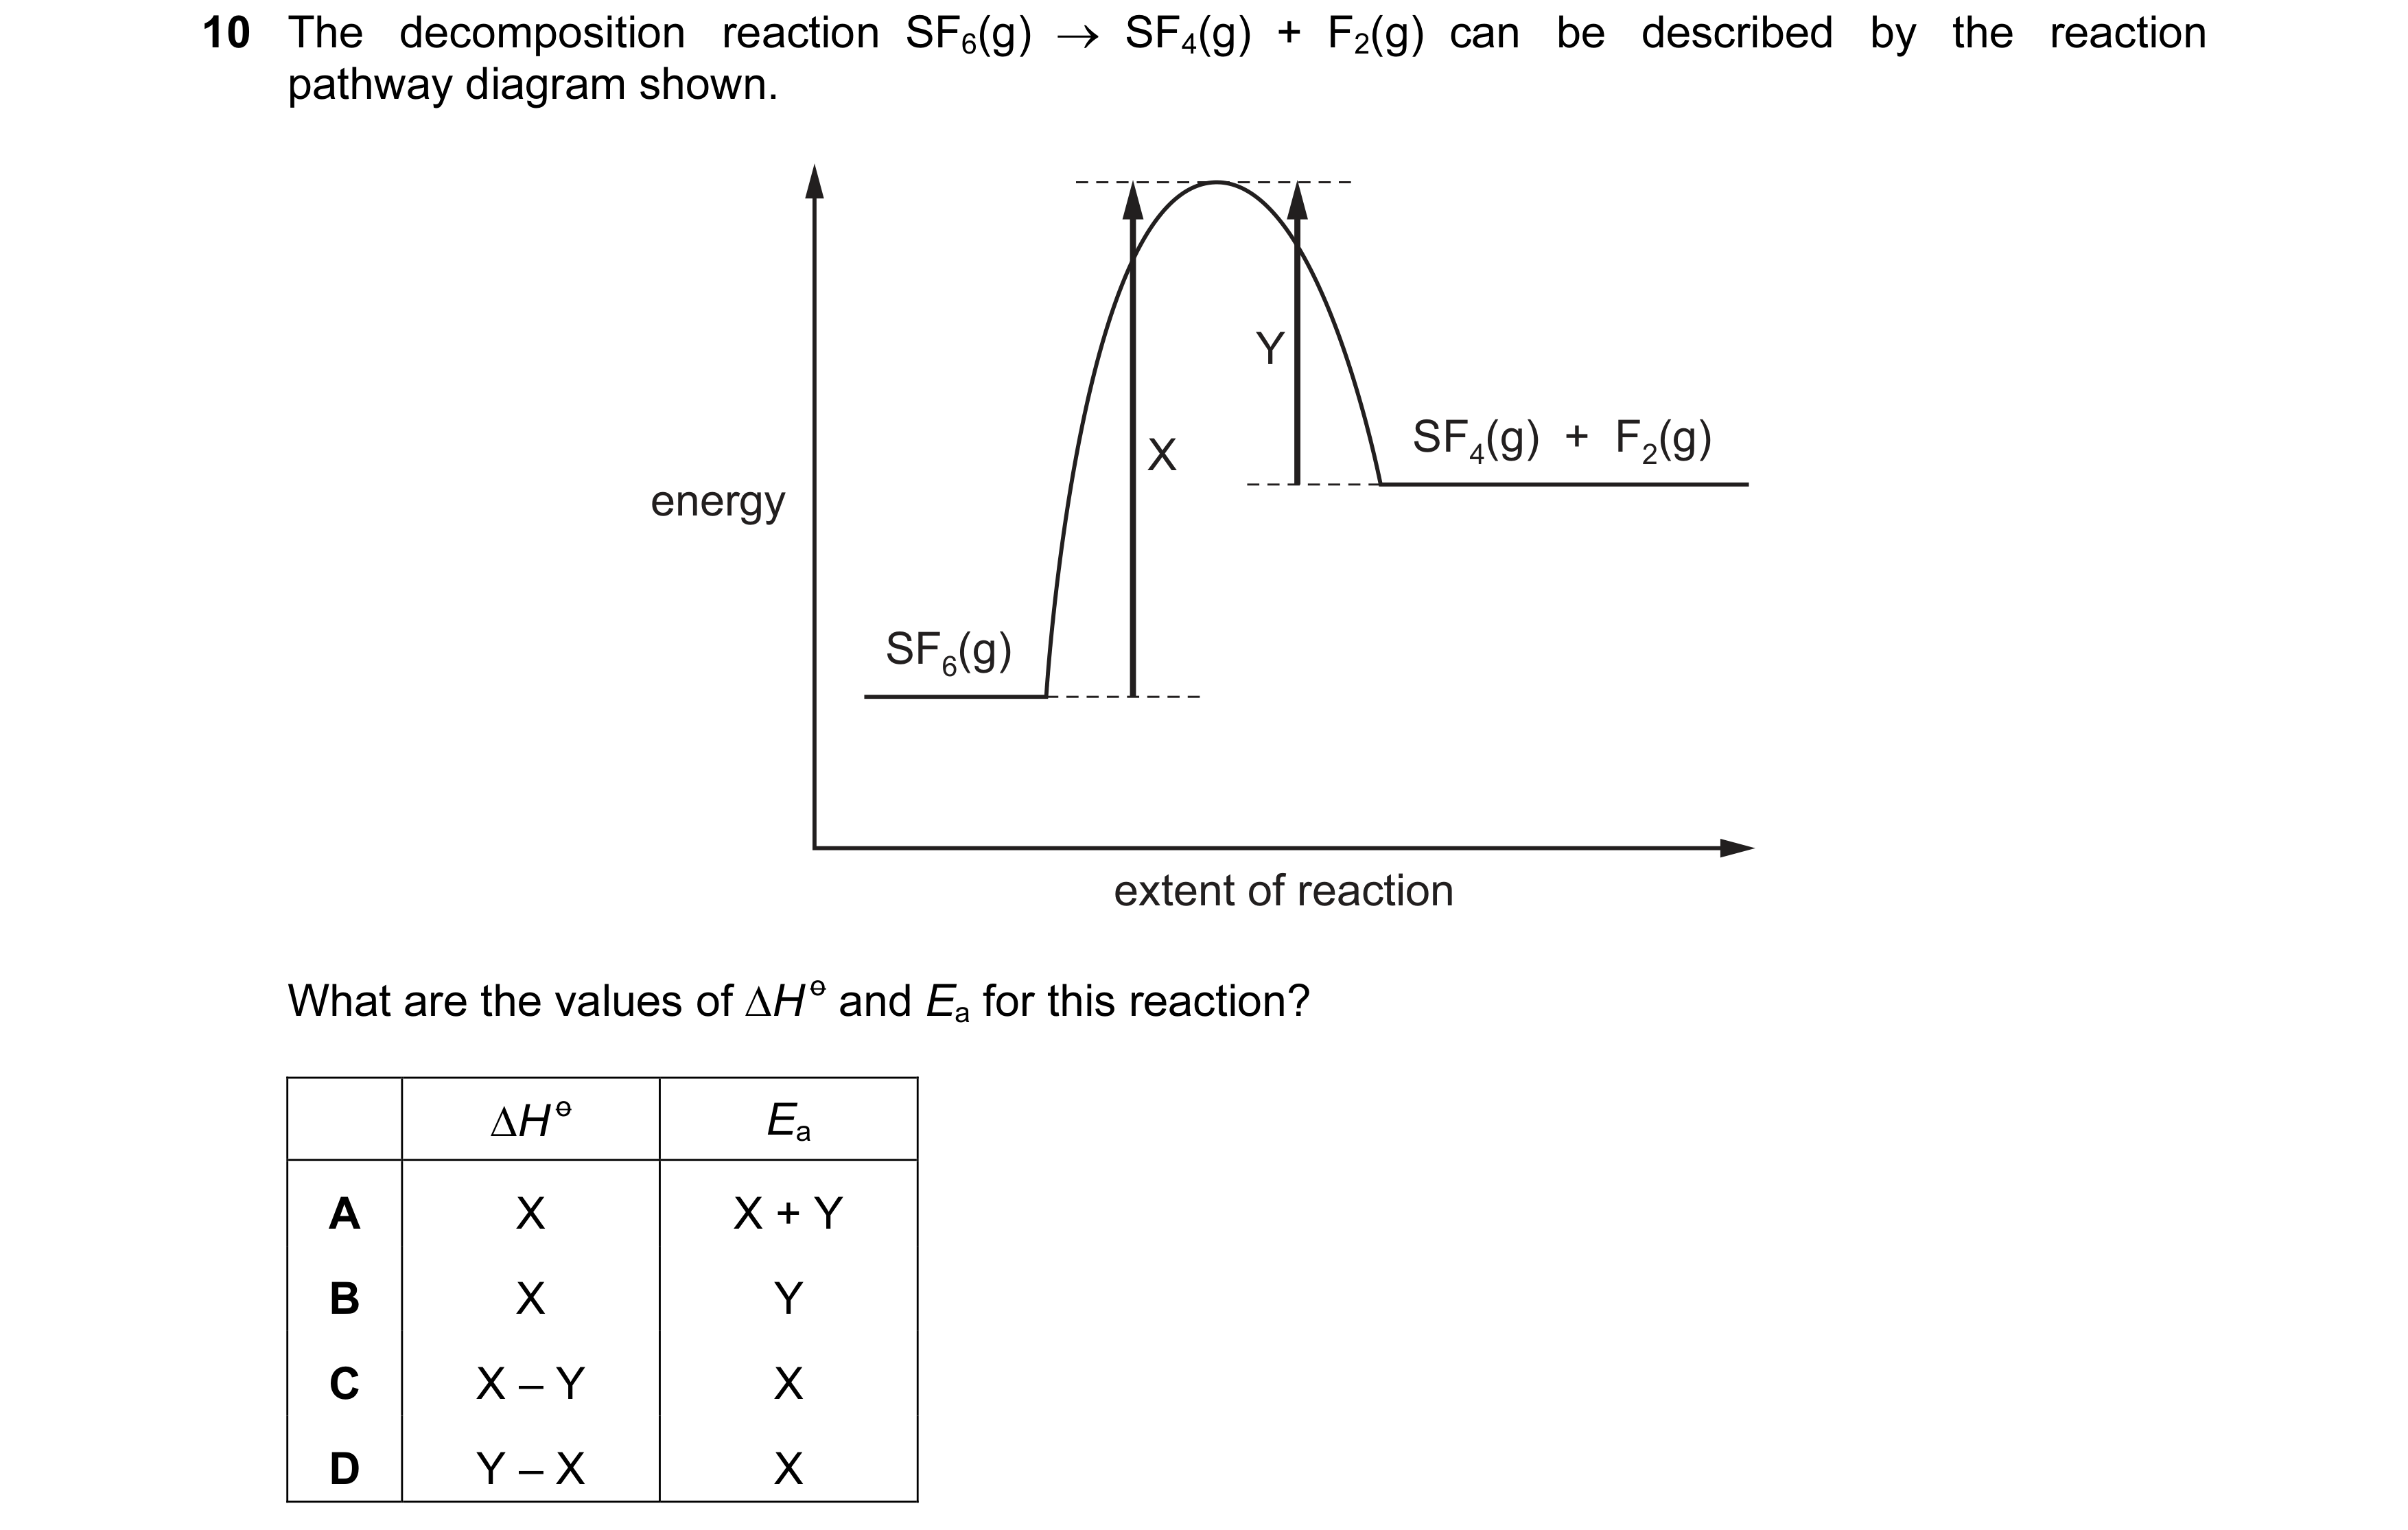
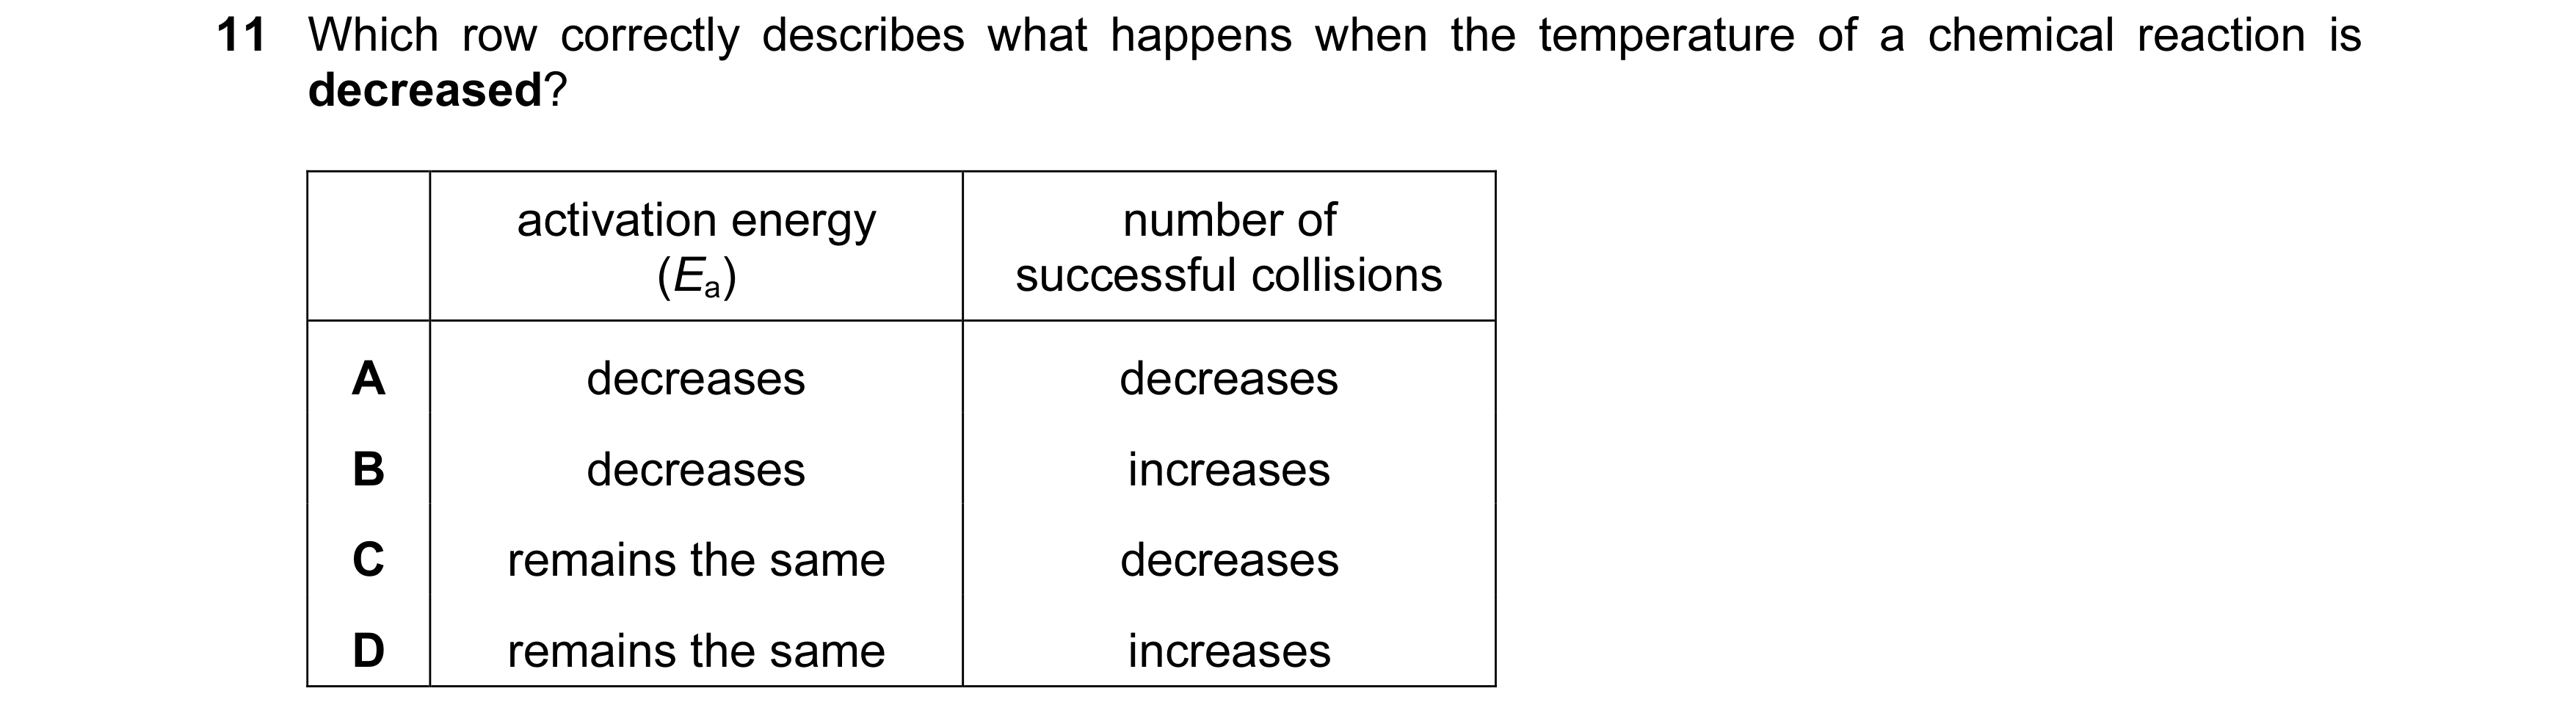 27 / 67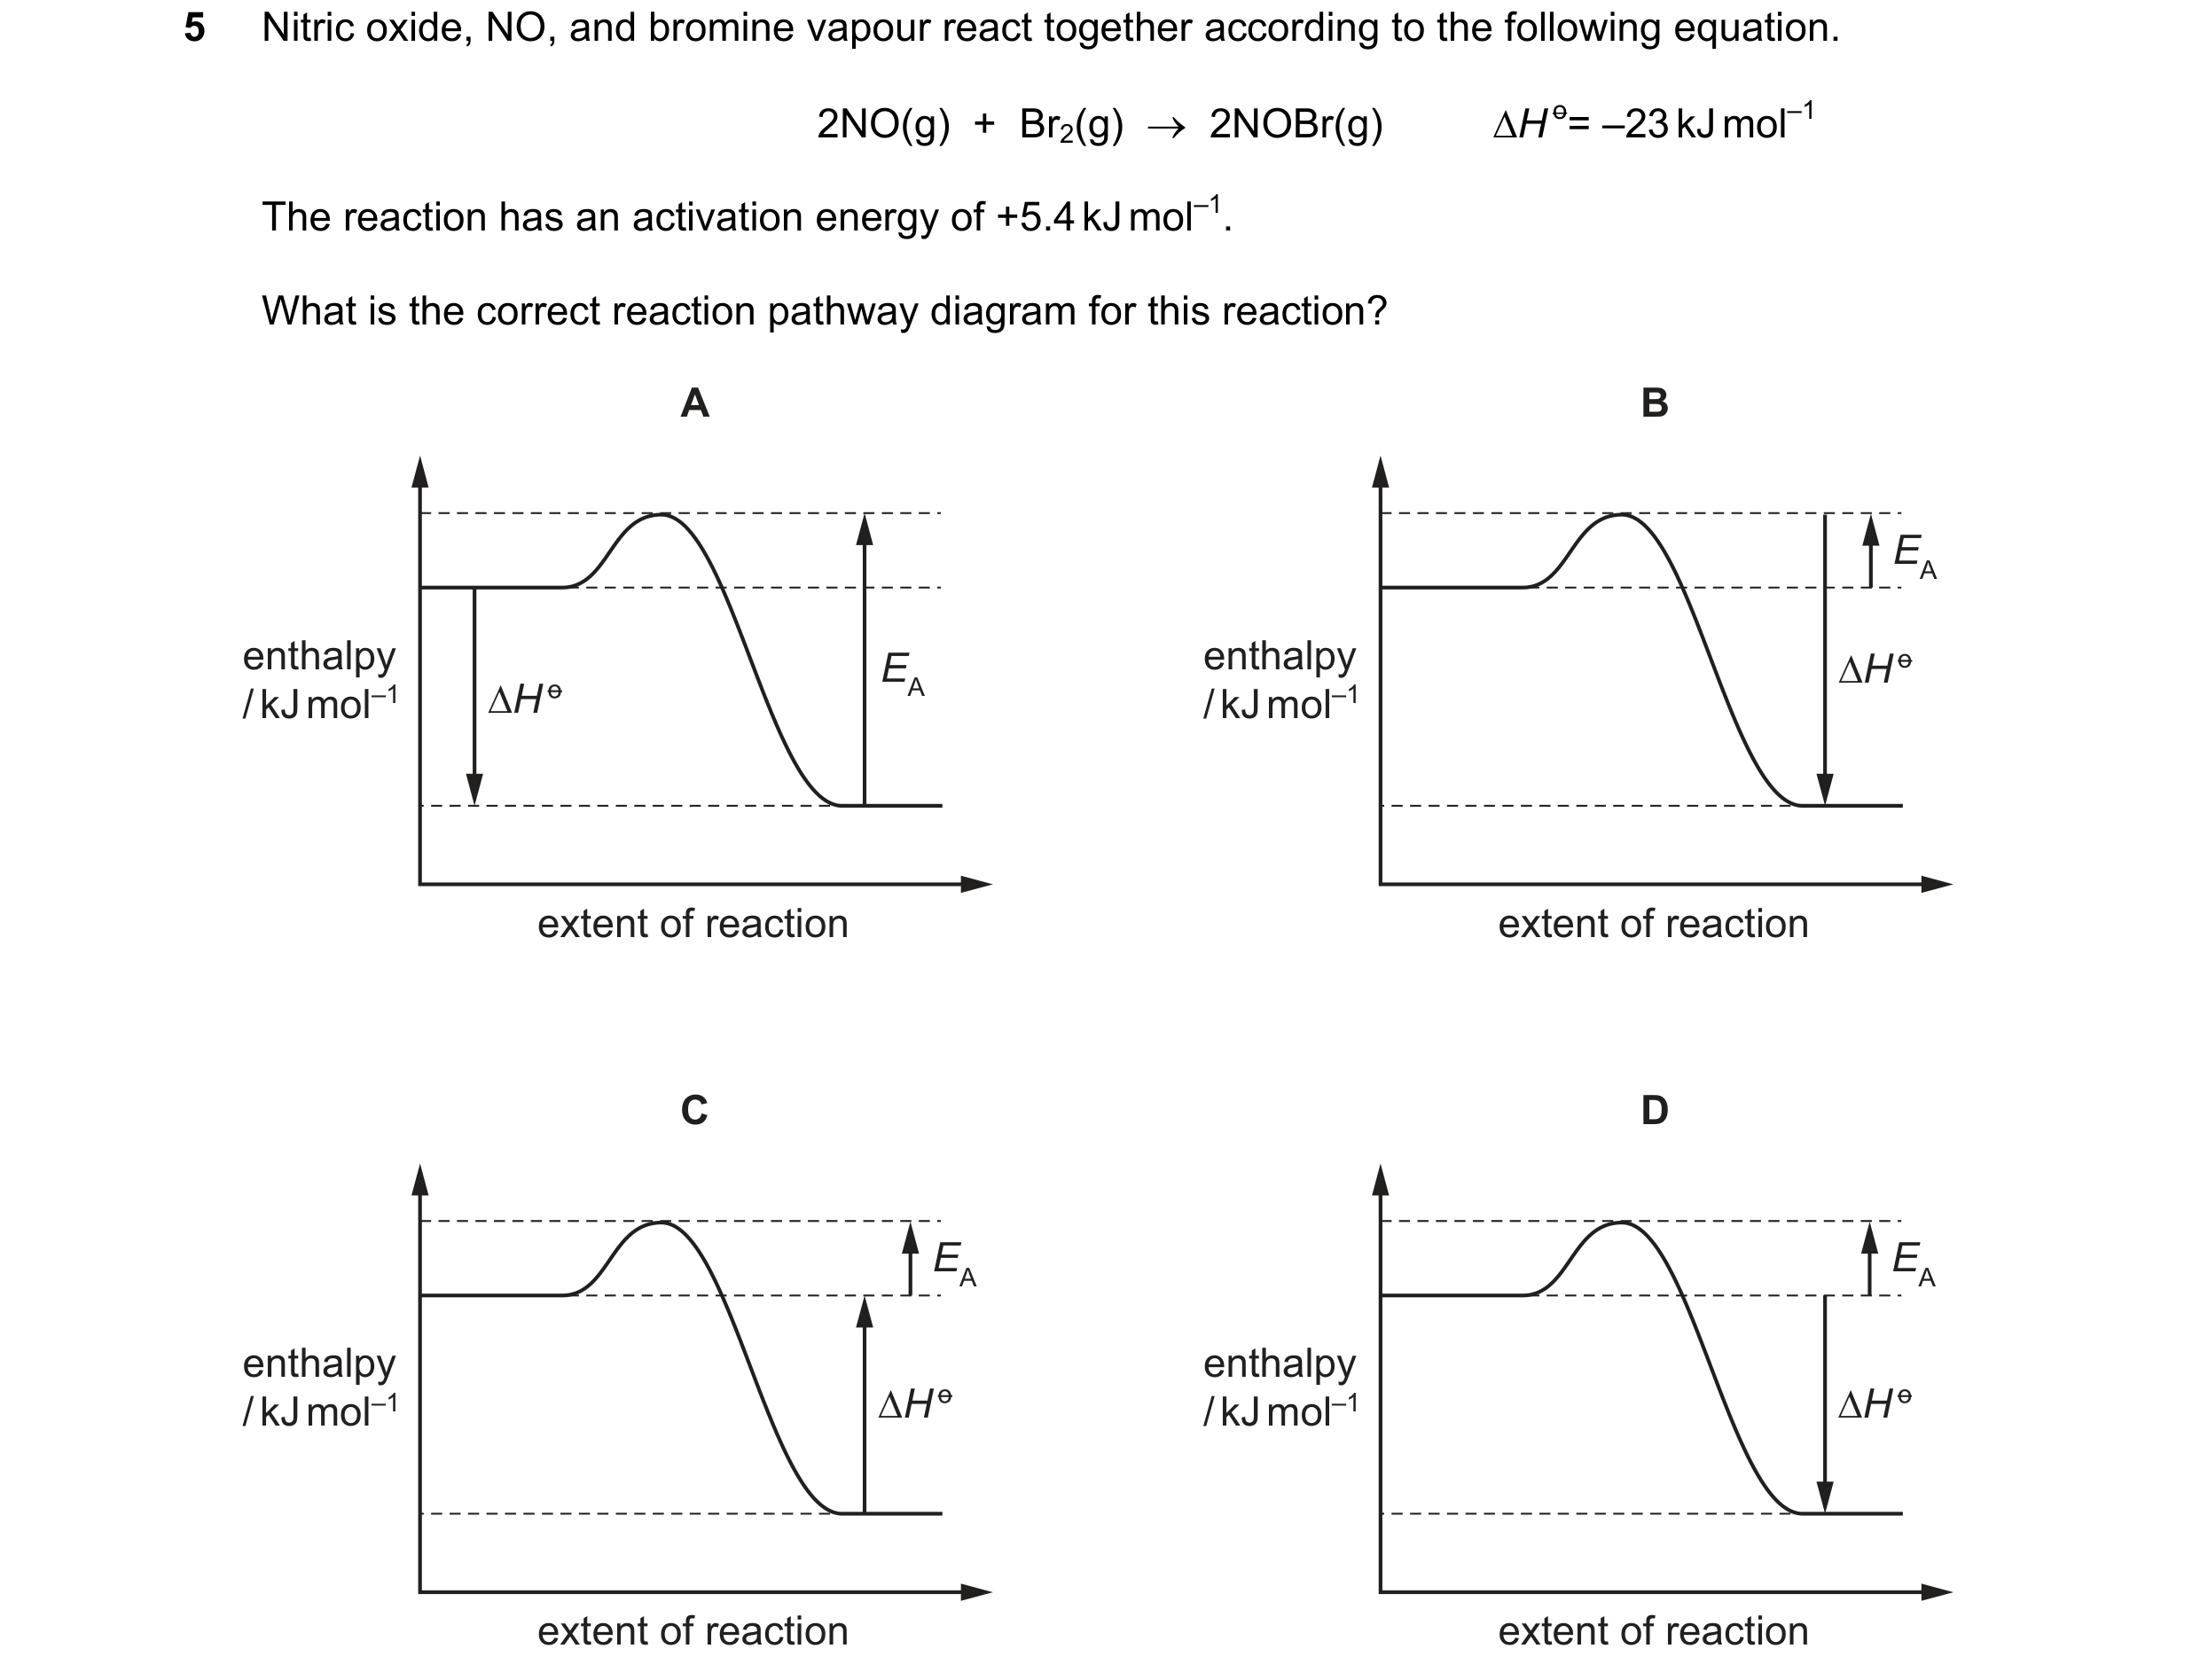

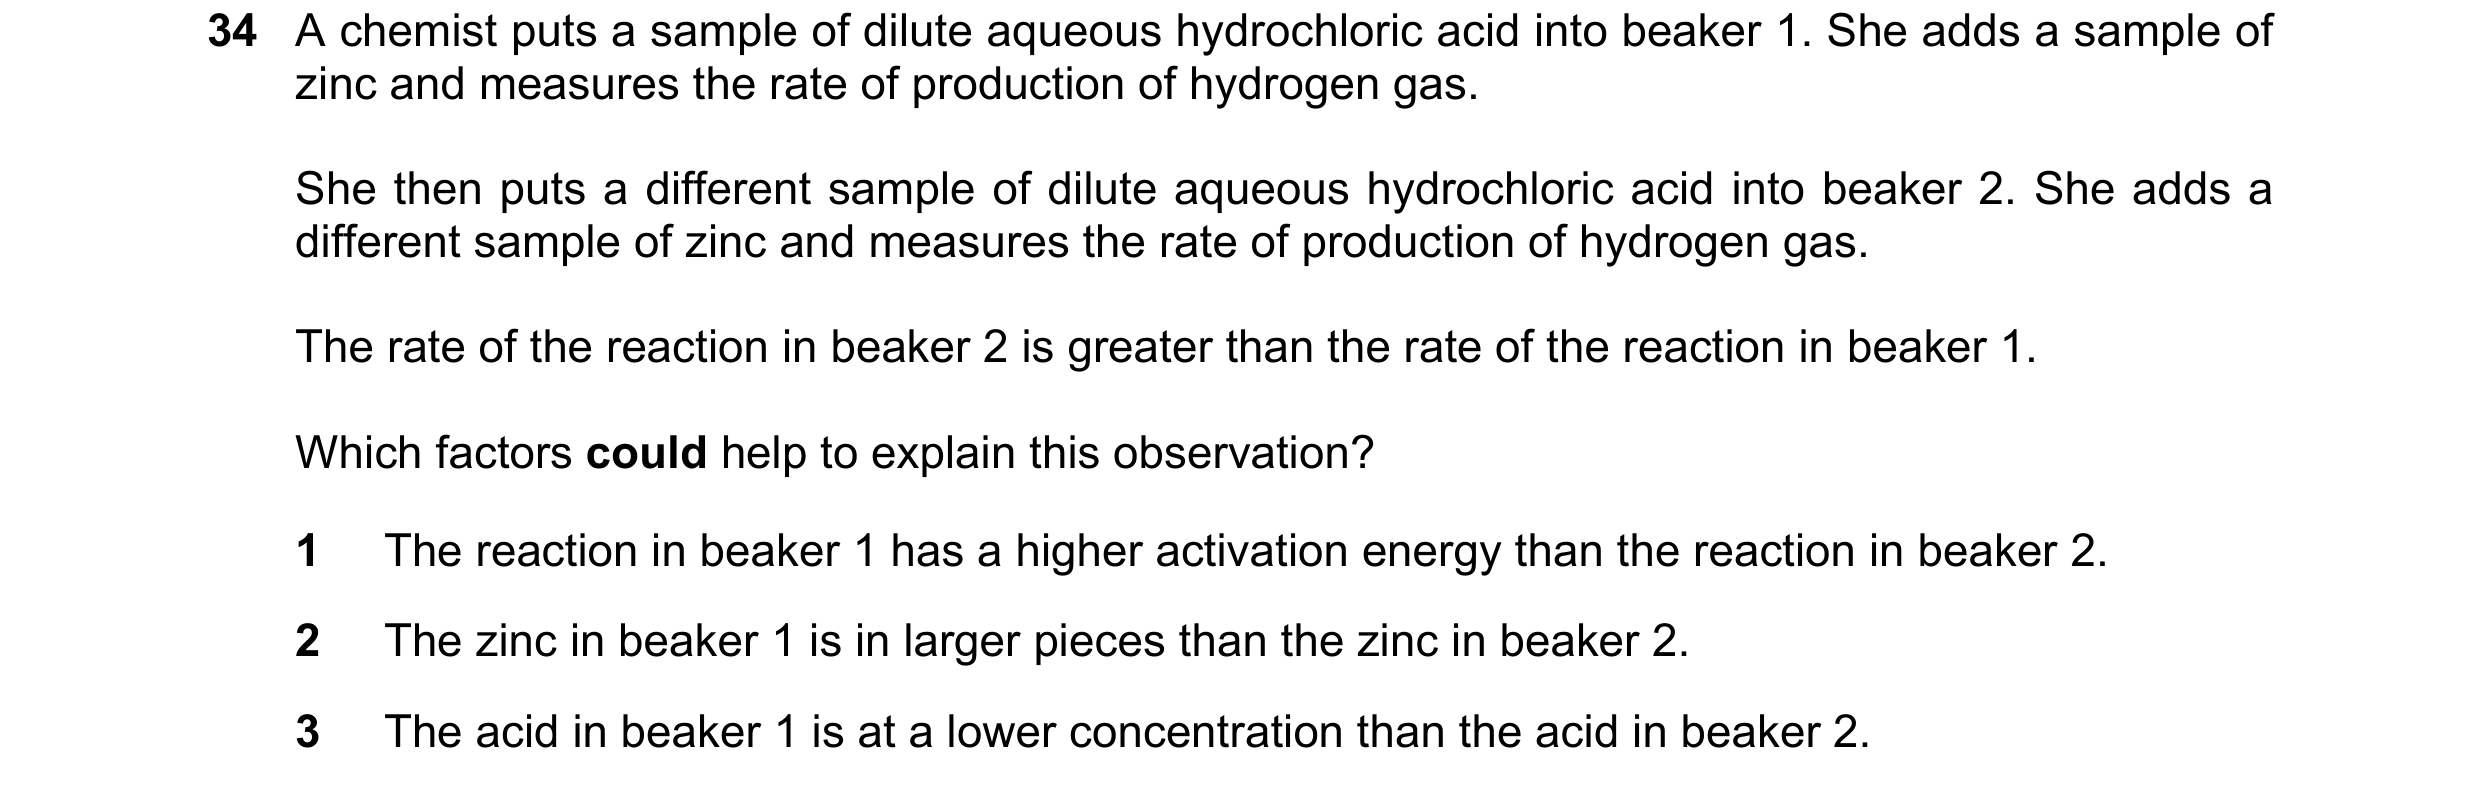 28 / 67
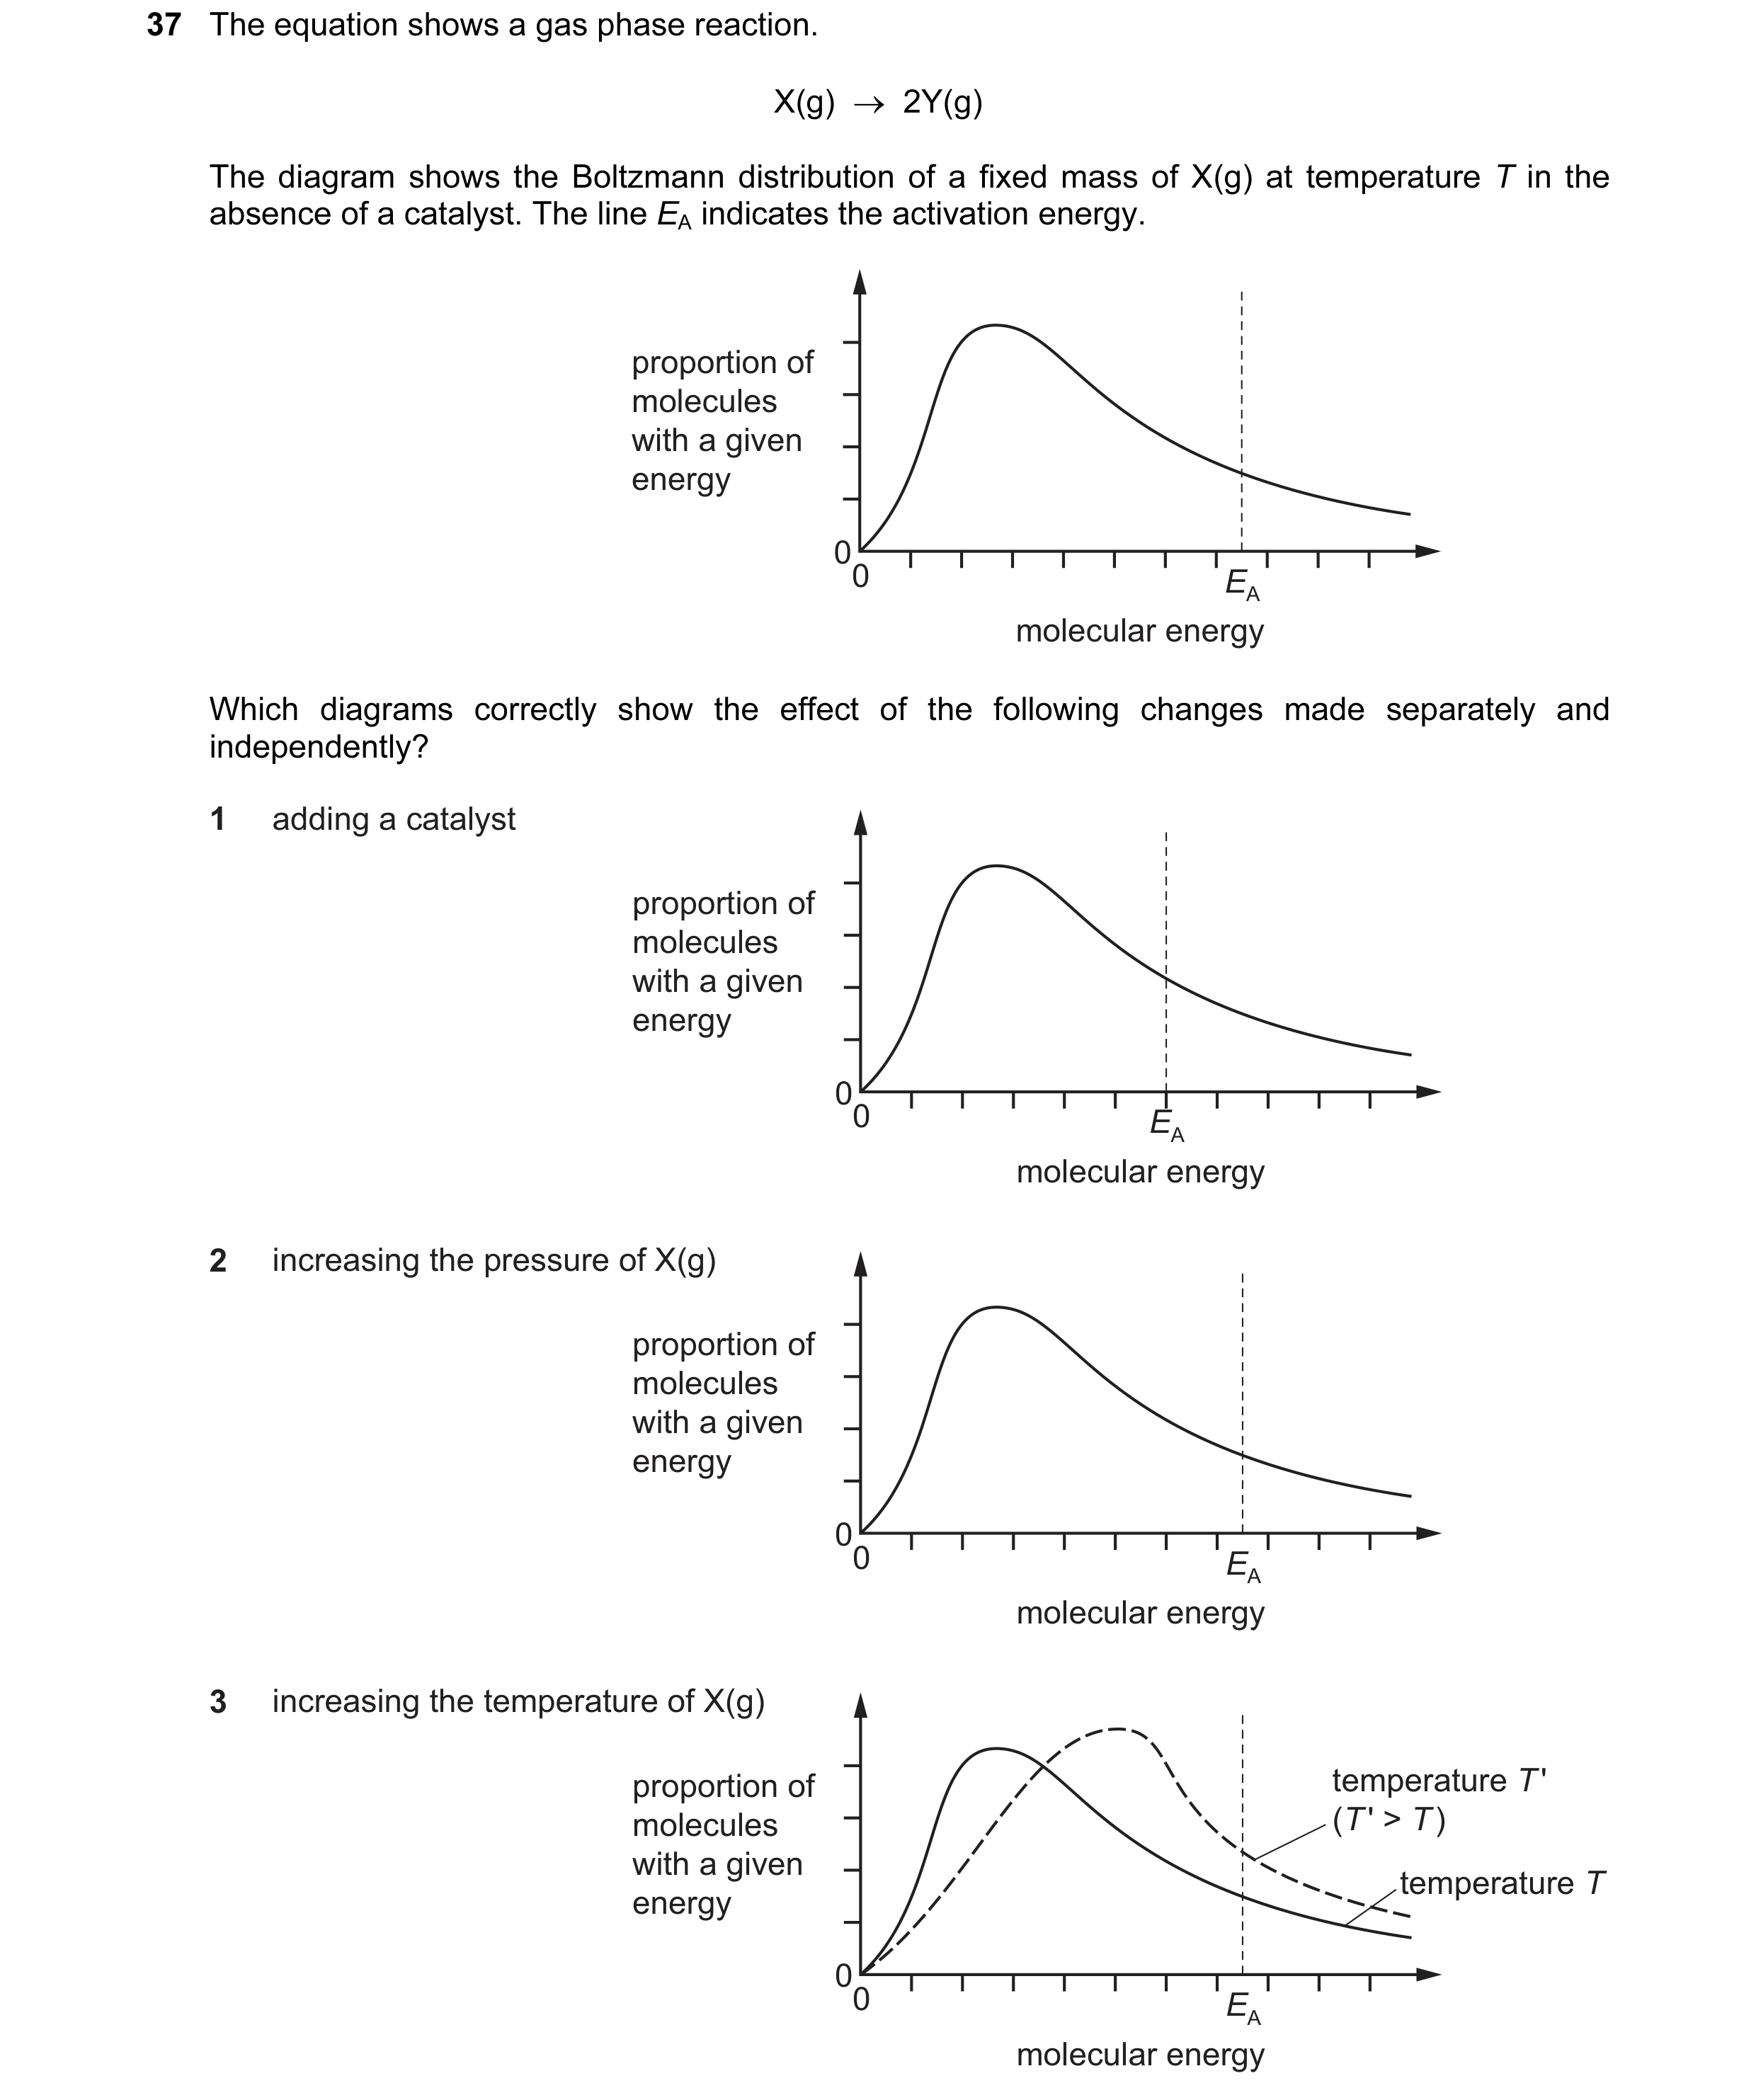 29 / 67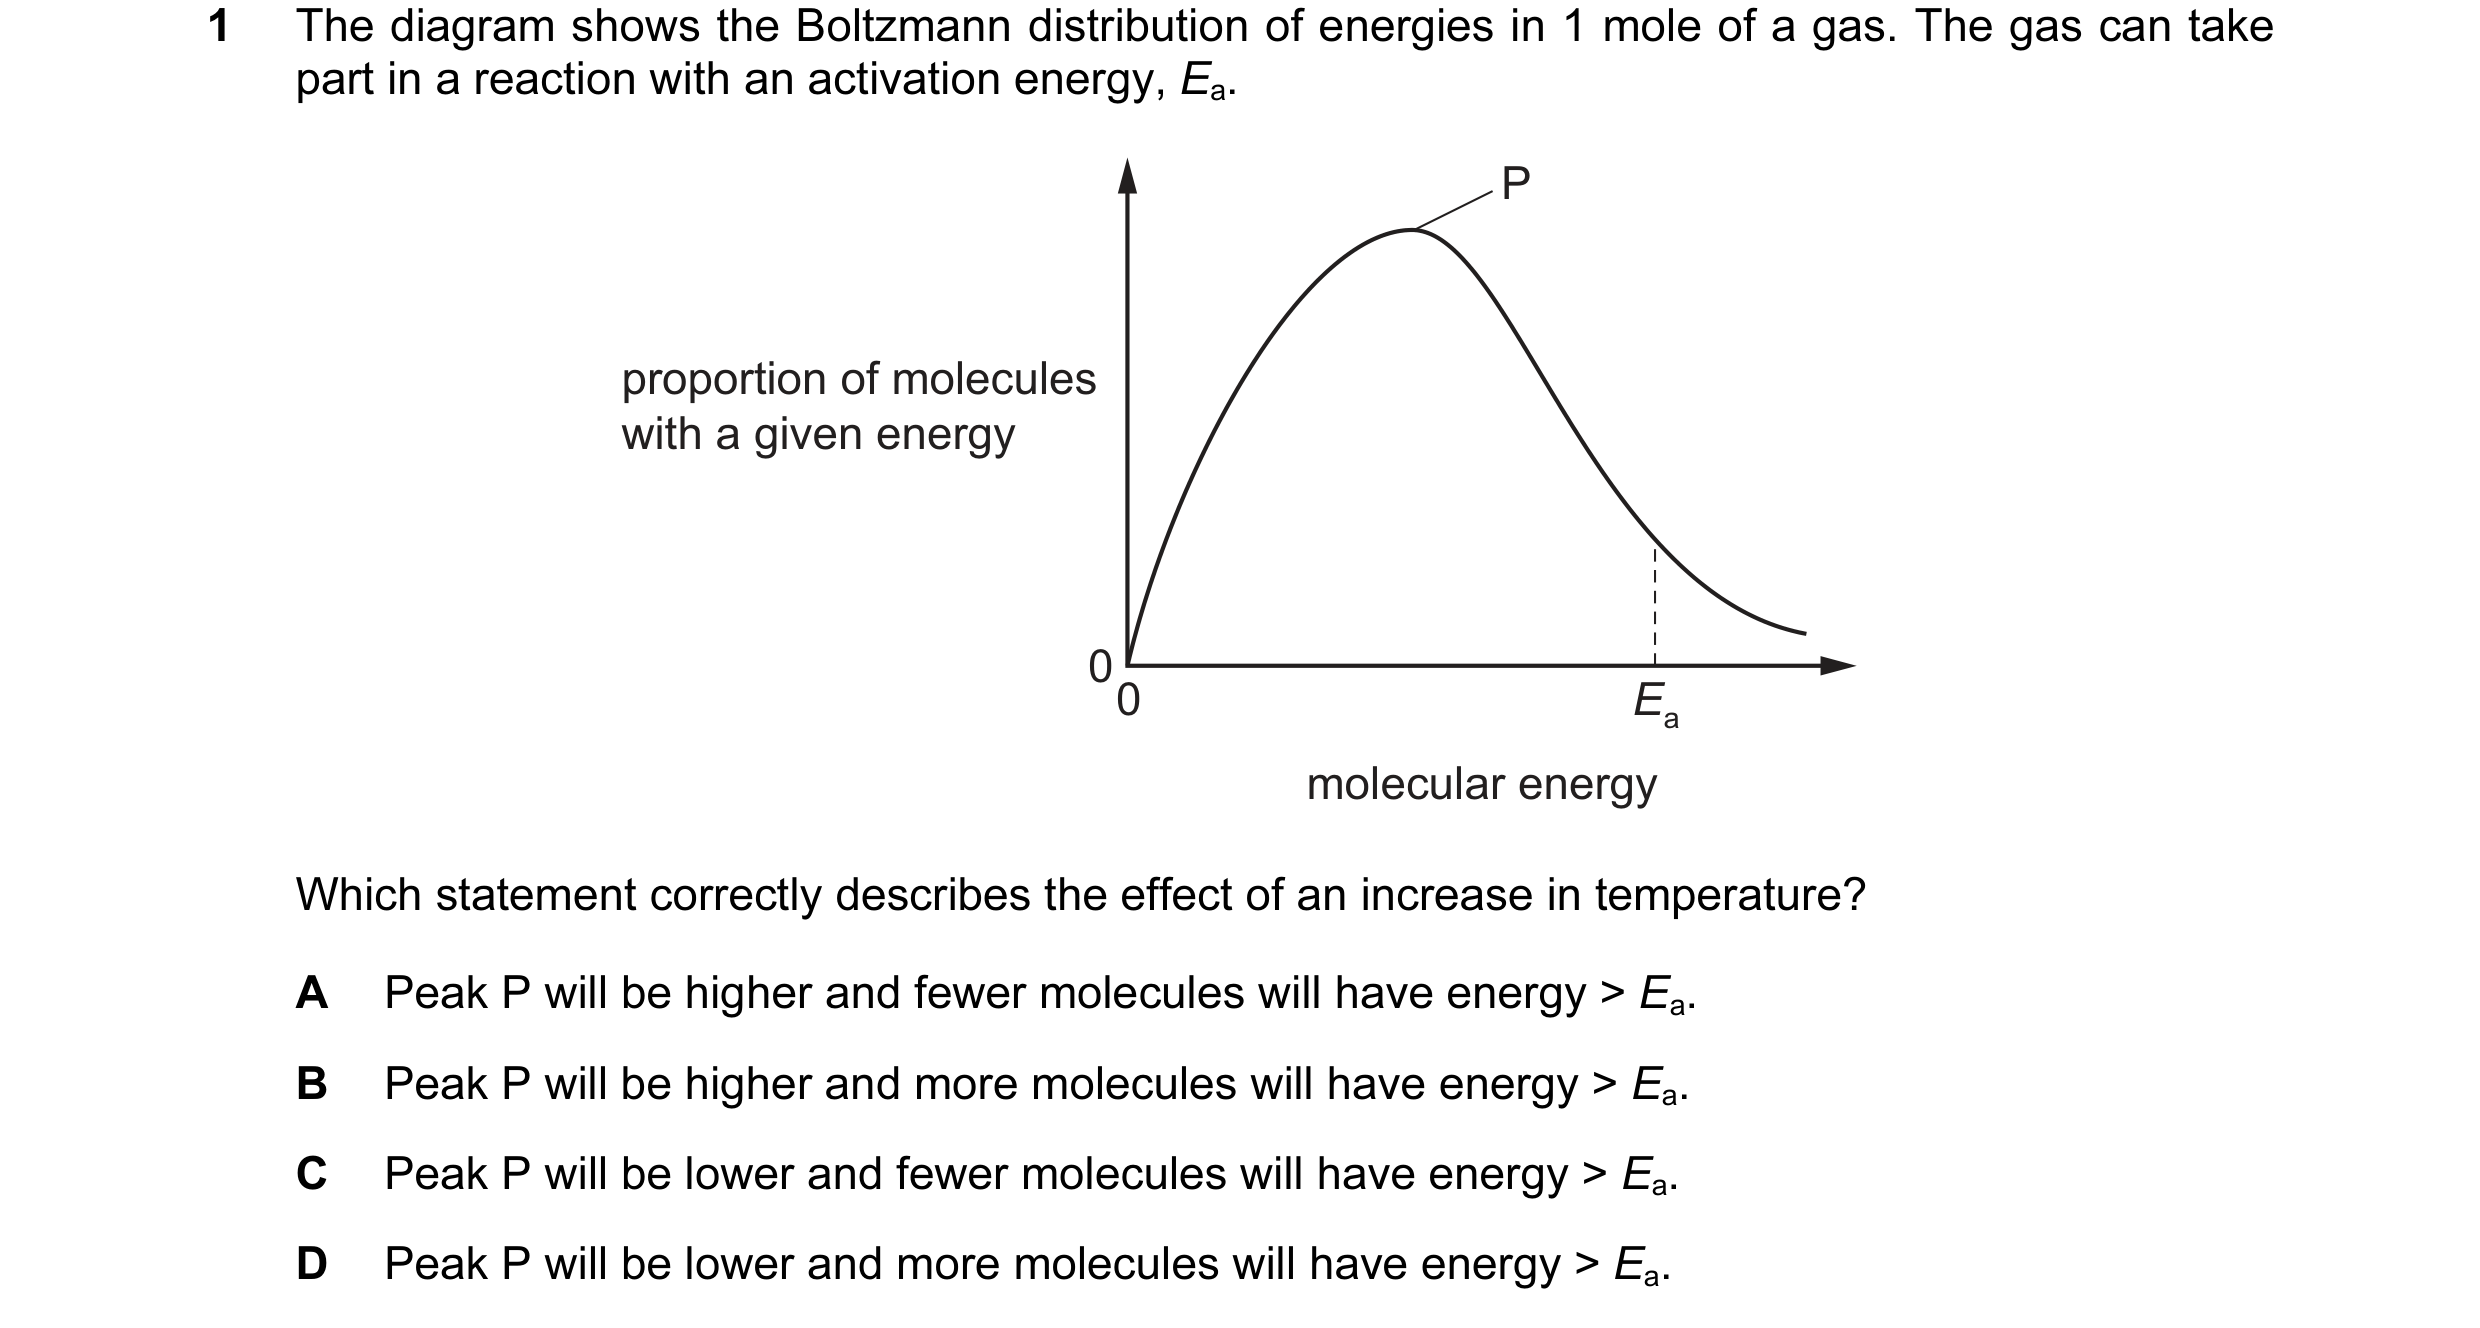
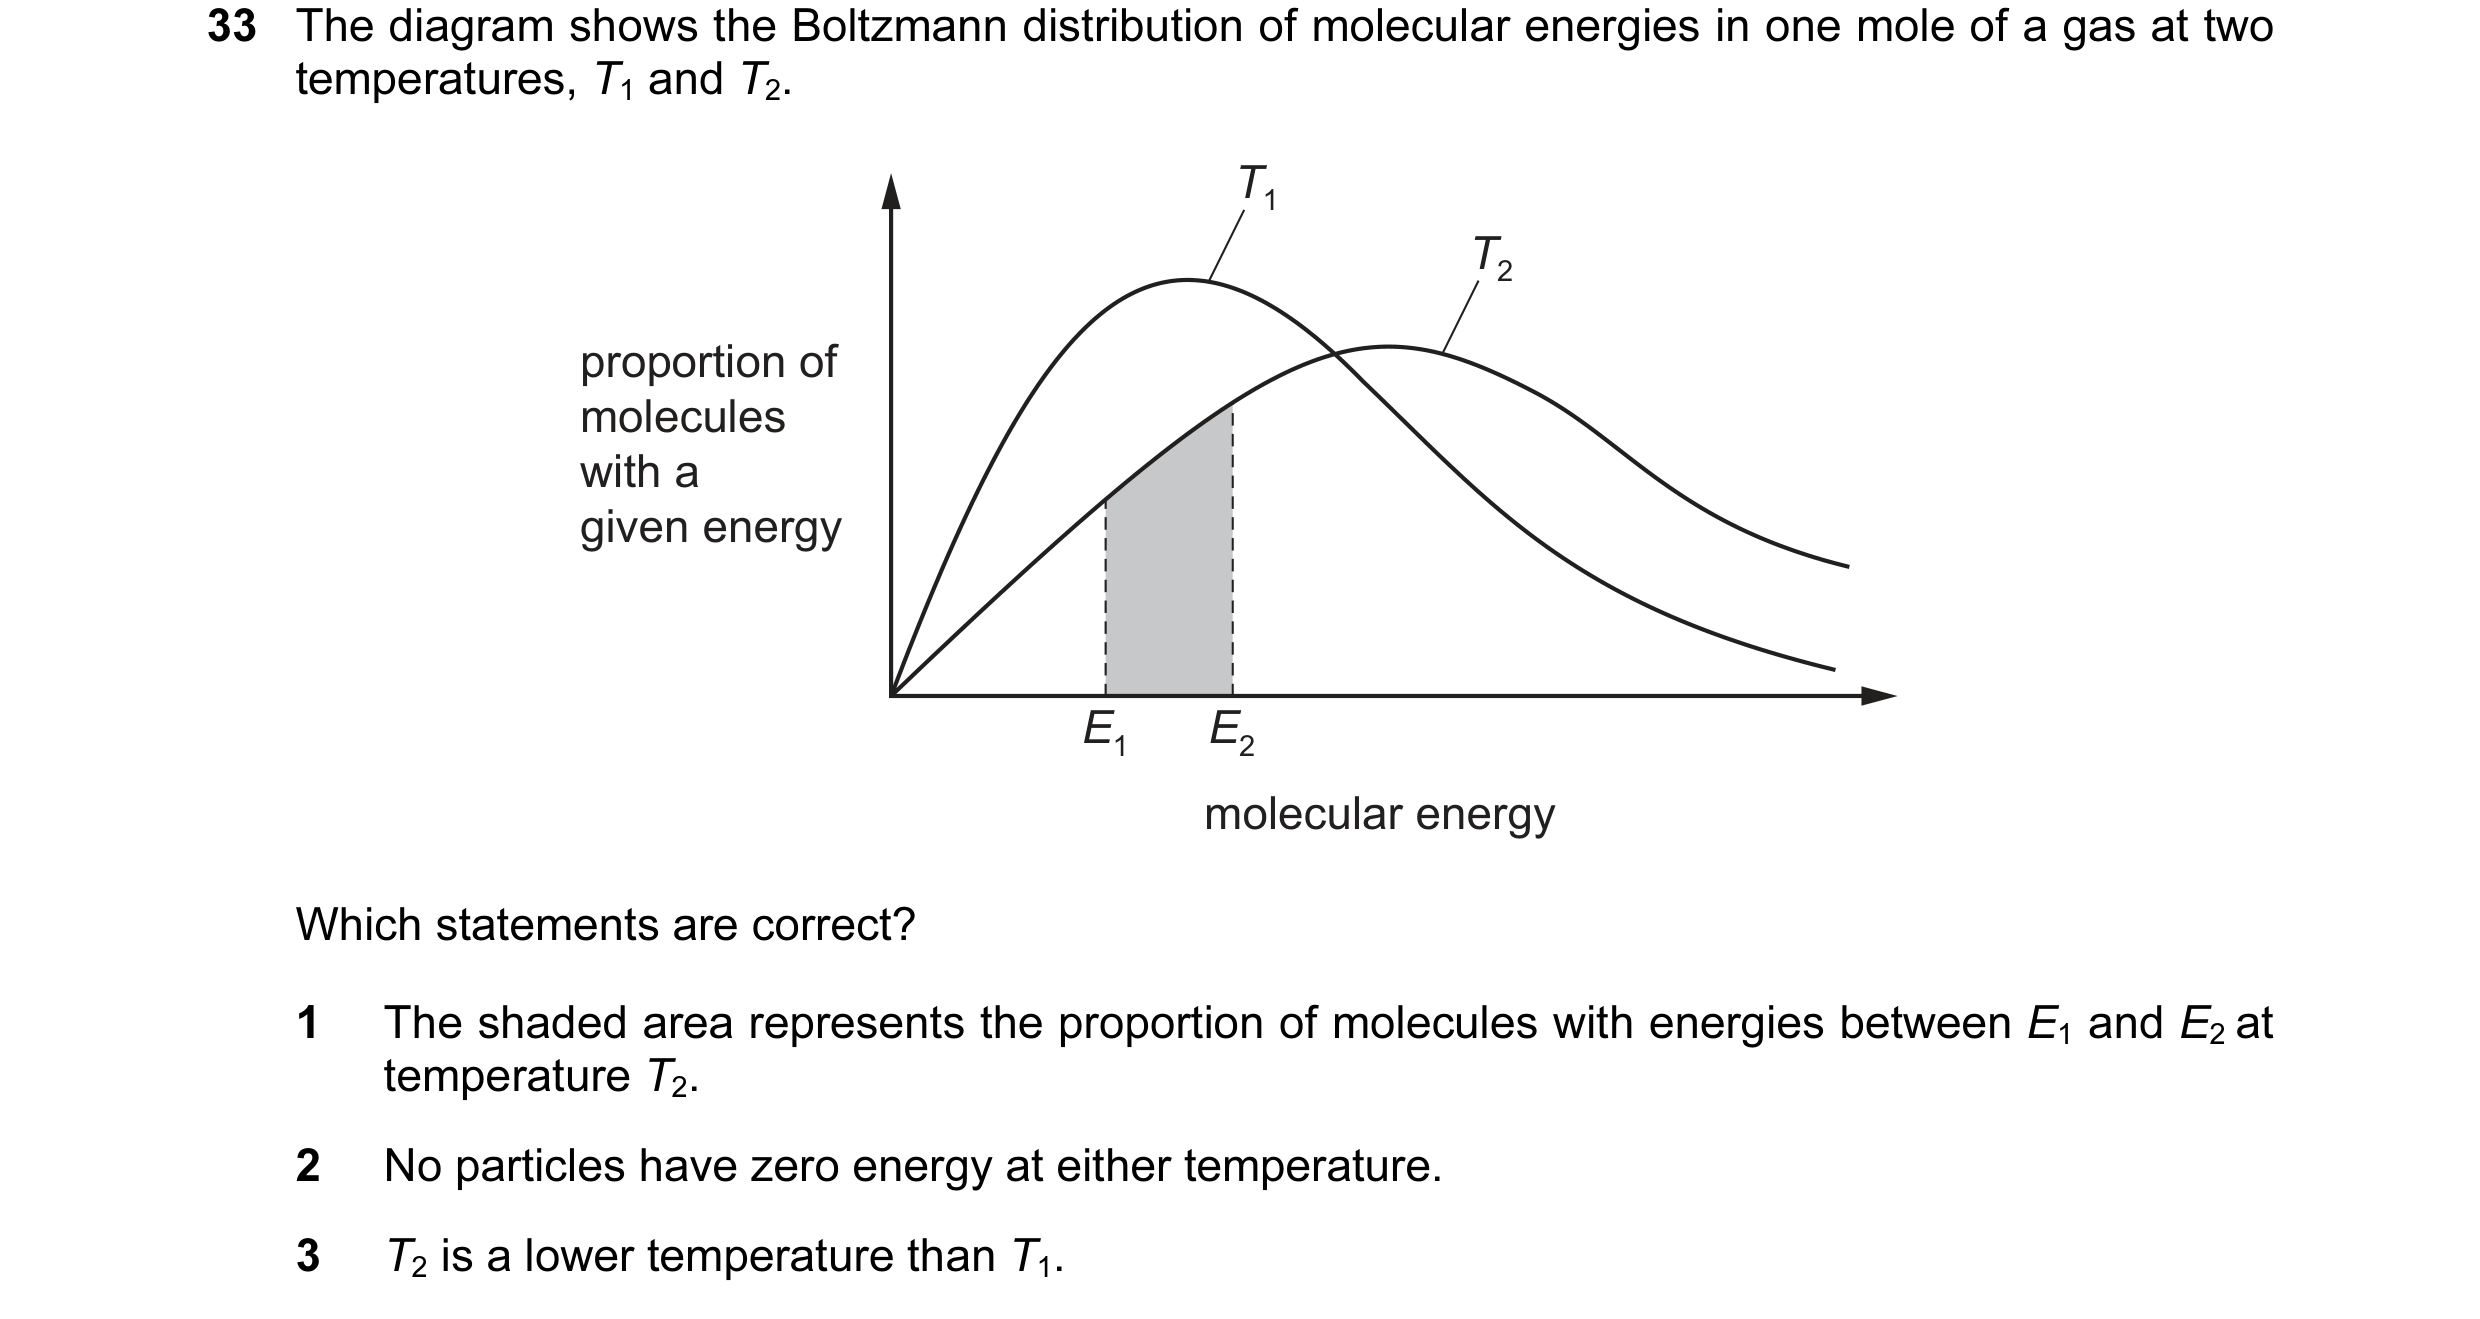 30 / 67
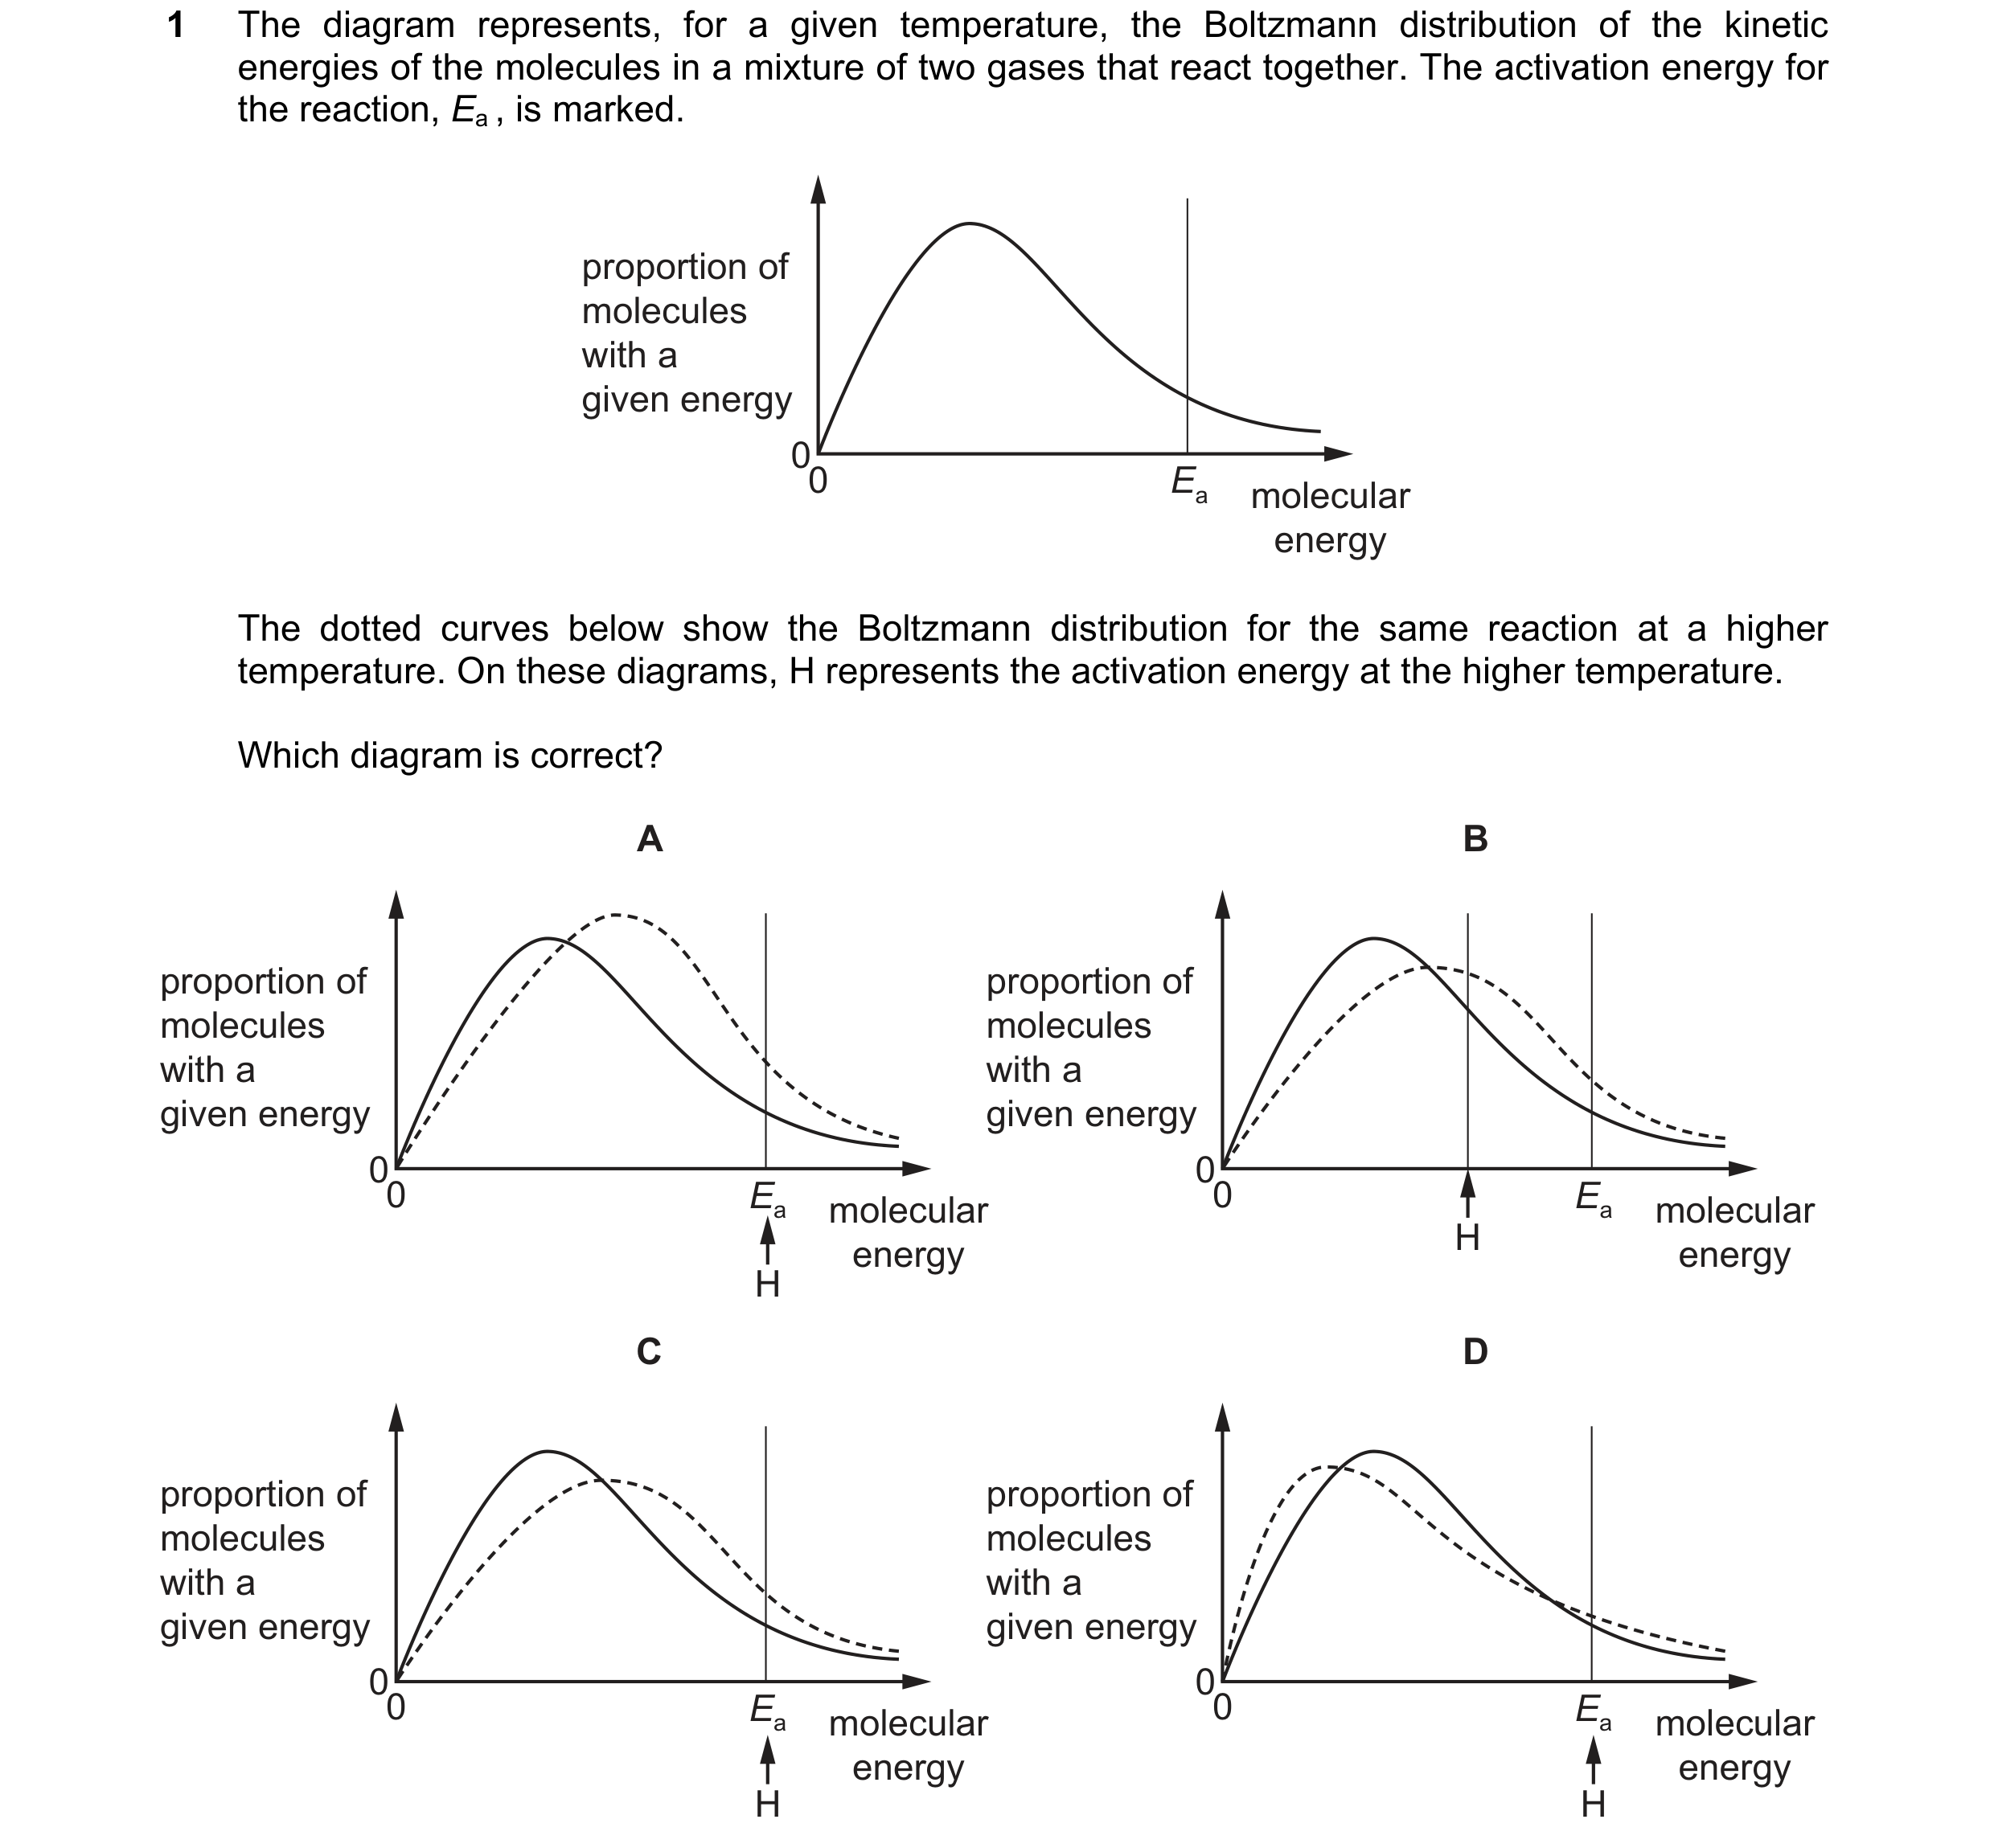 31 / 67
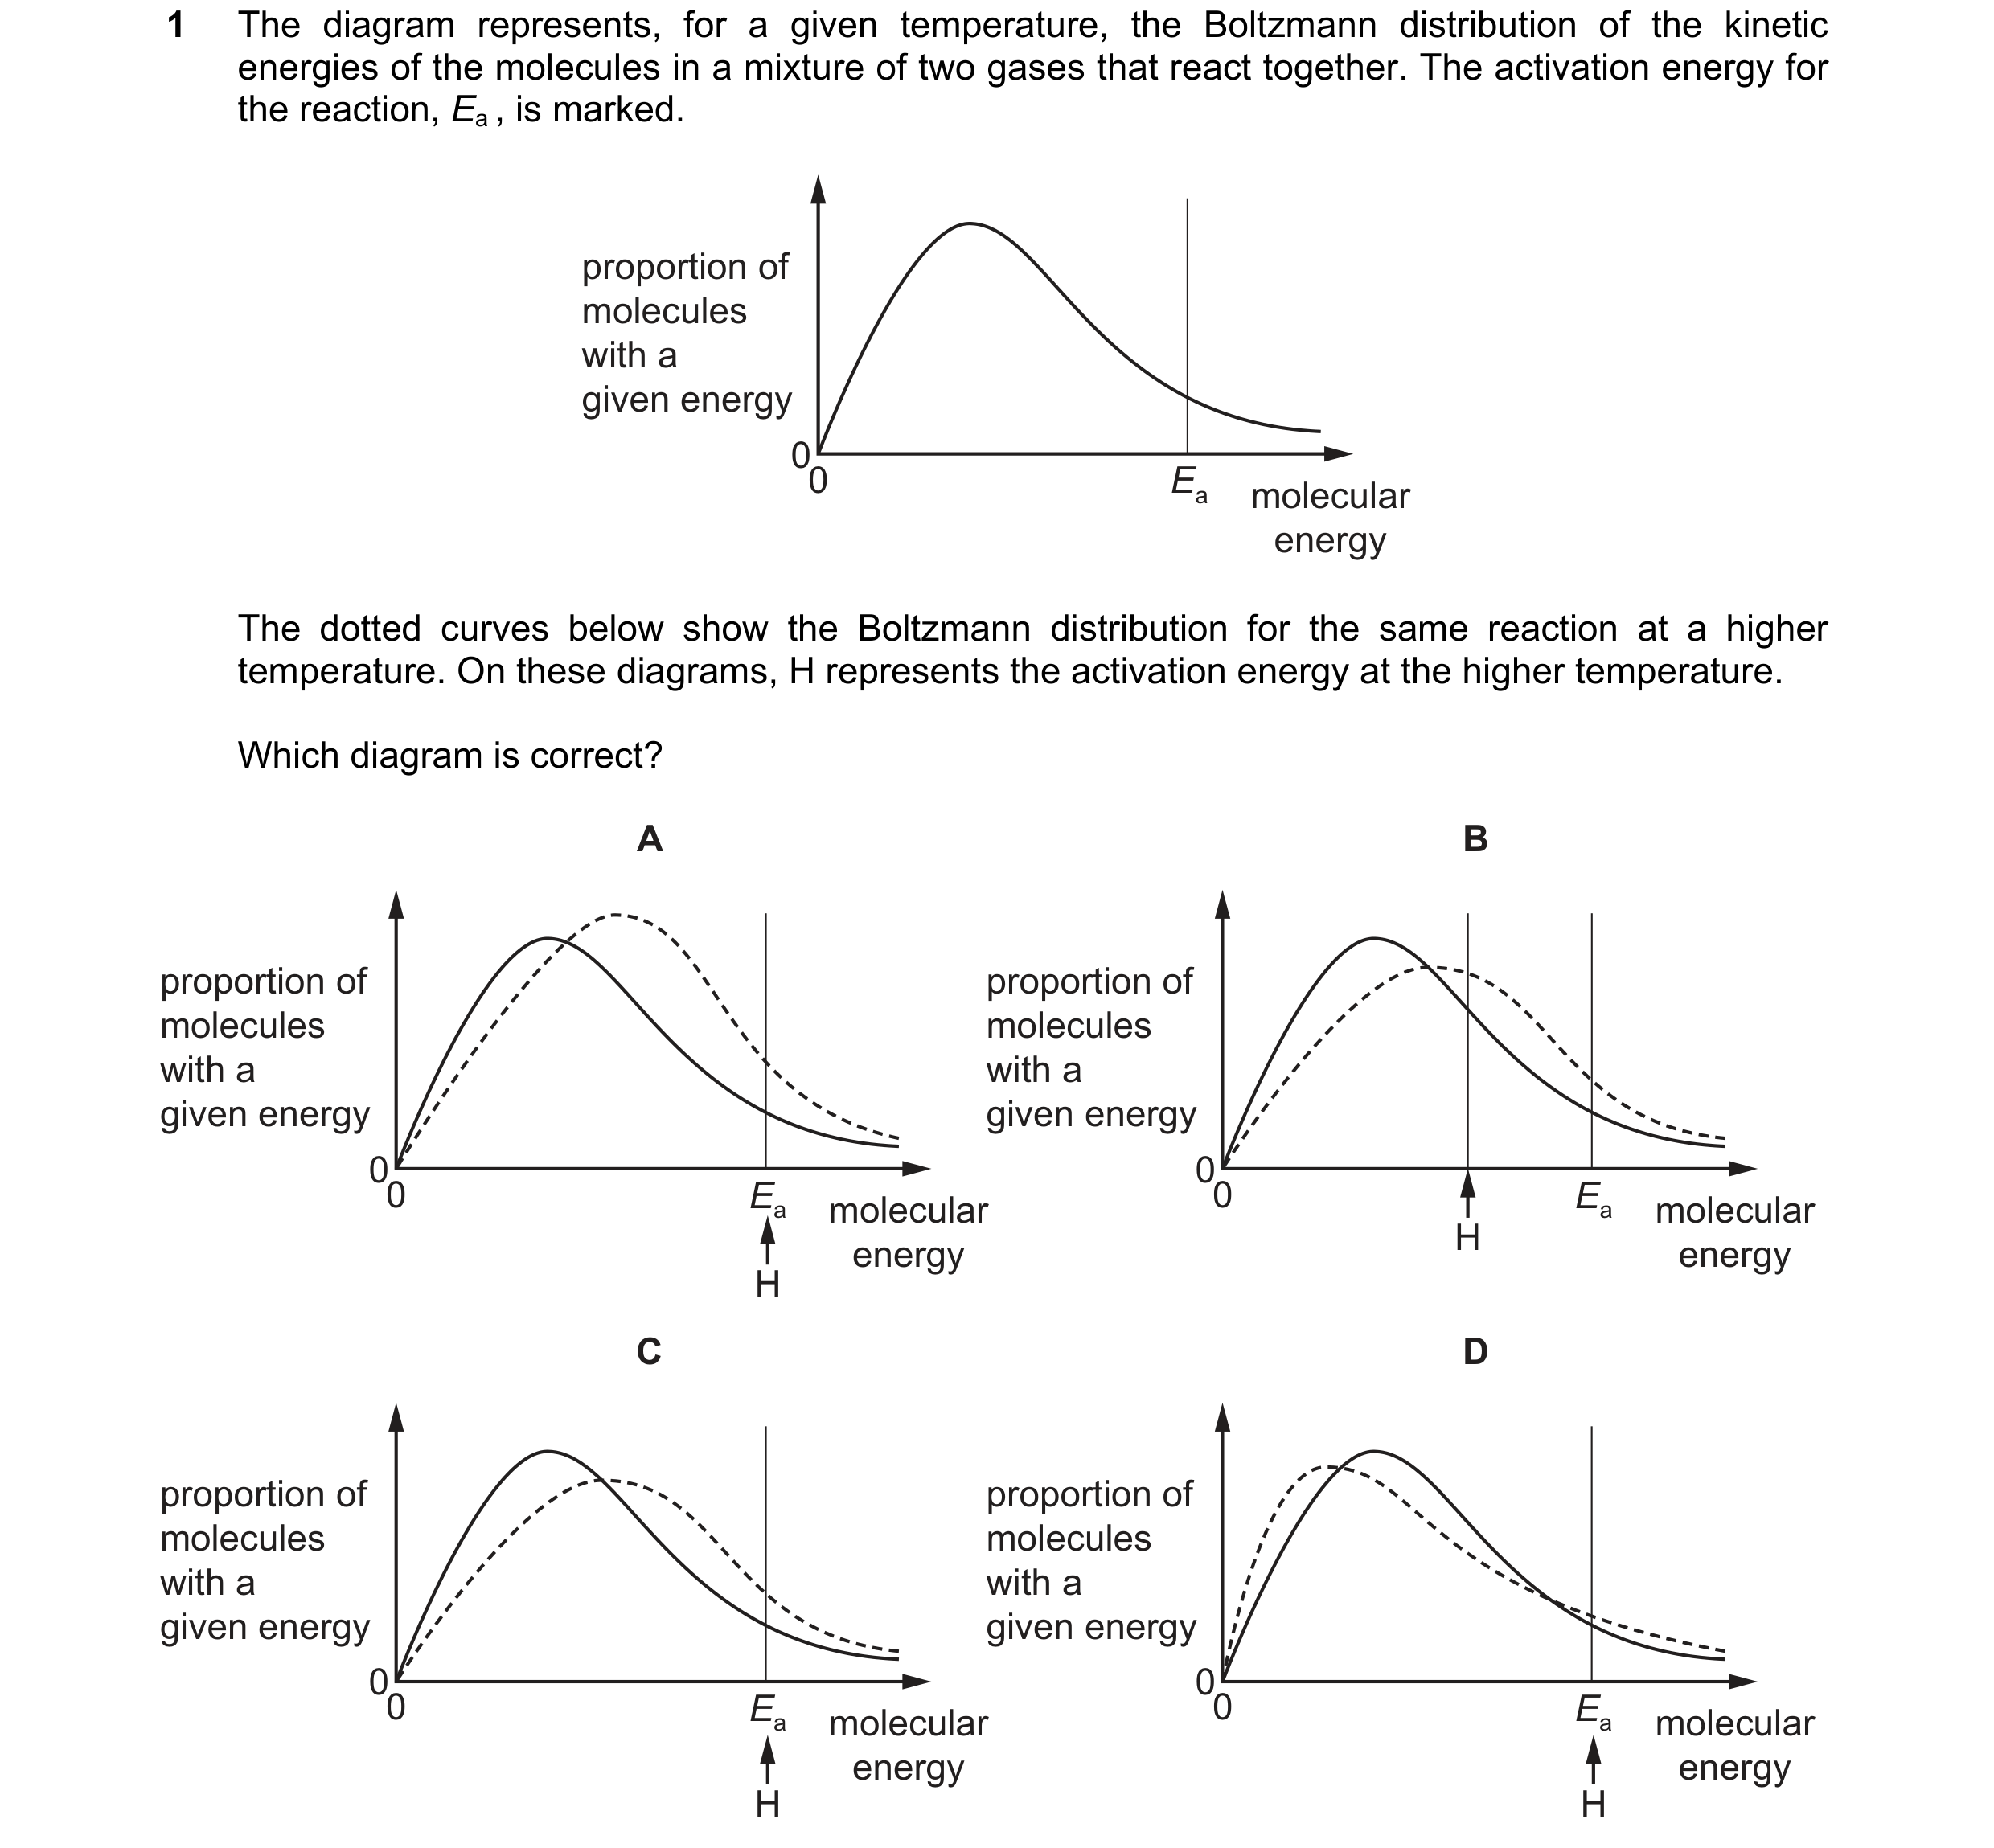 32 / 67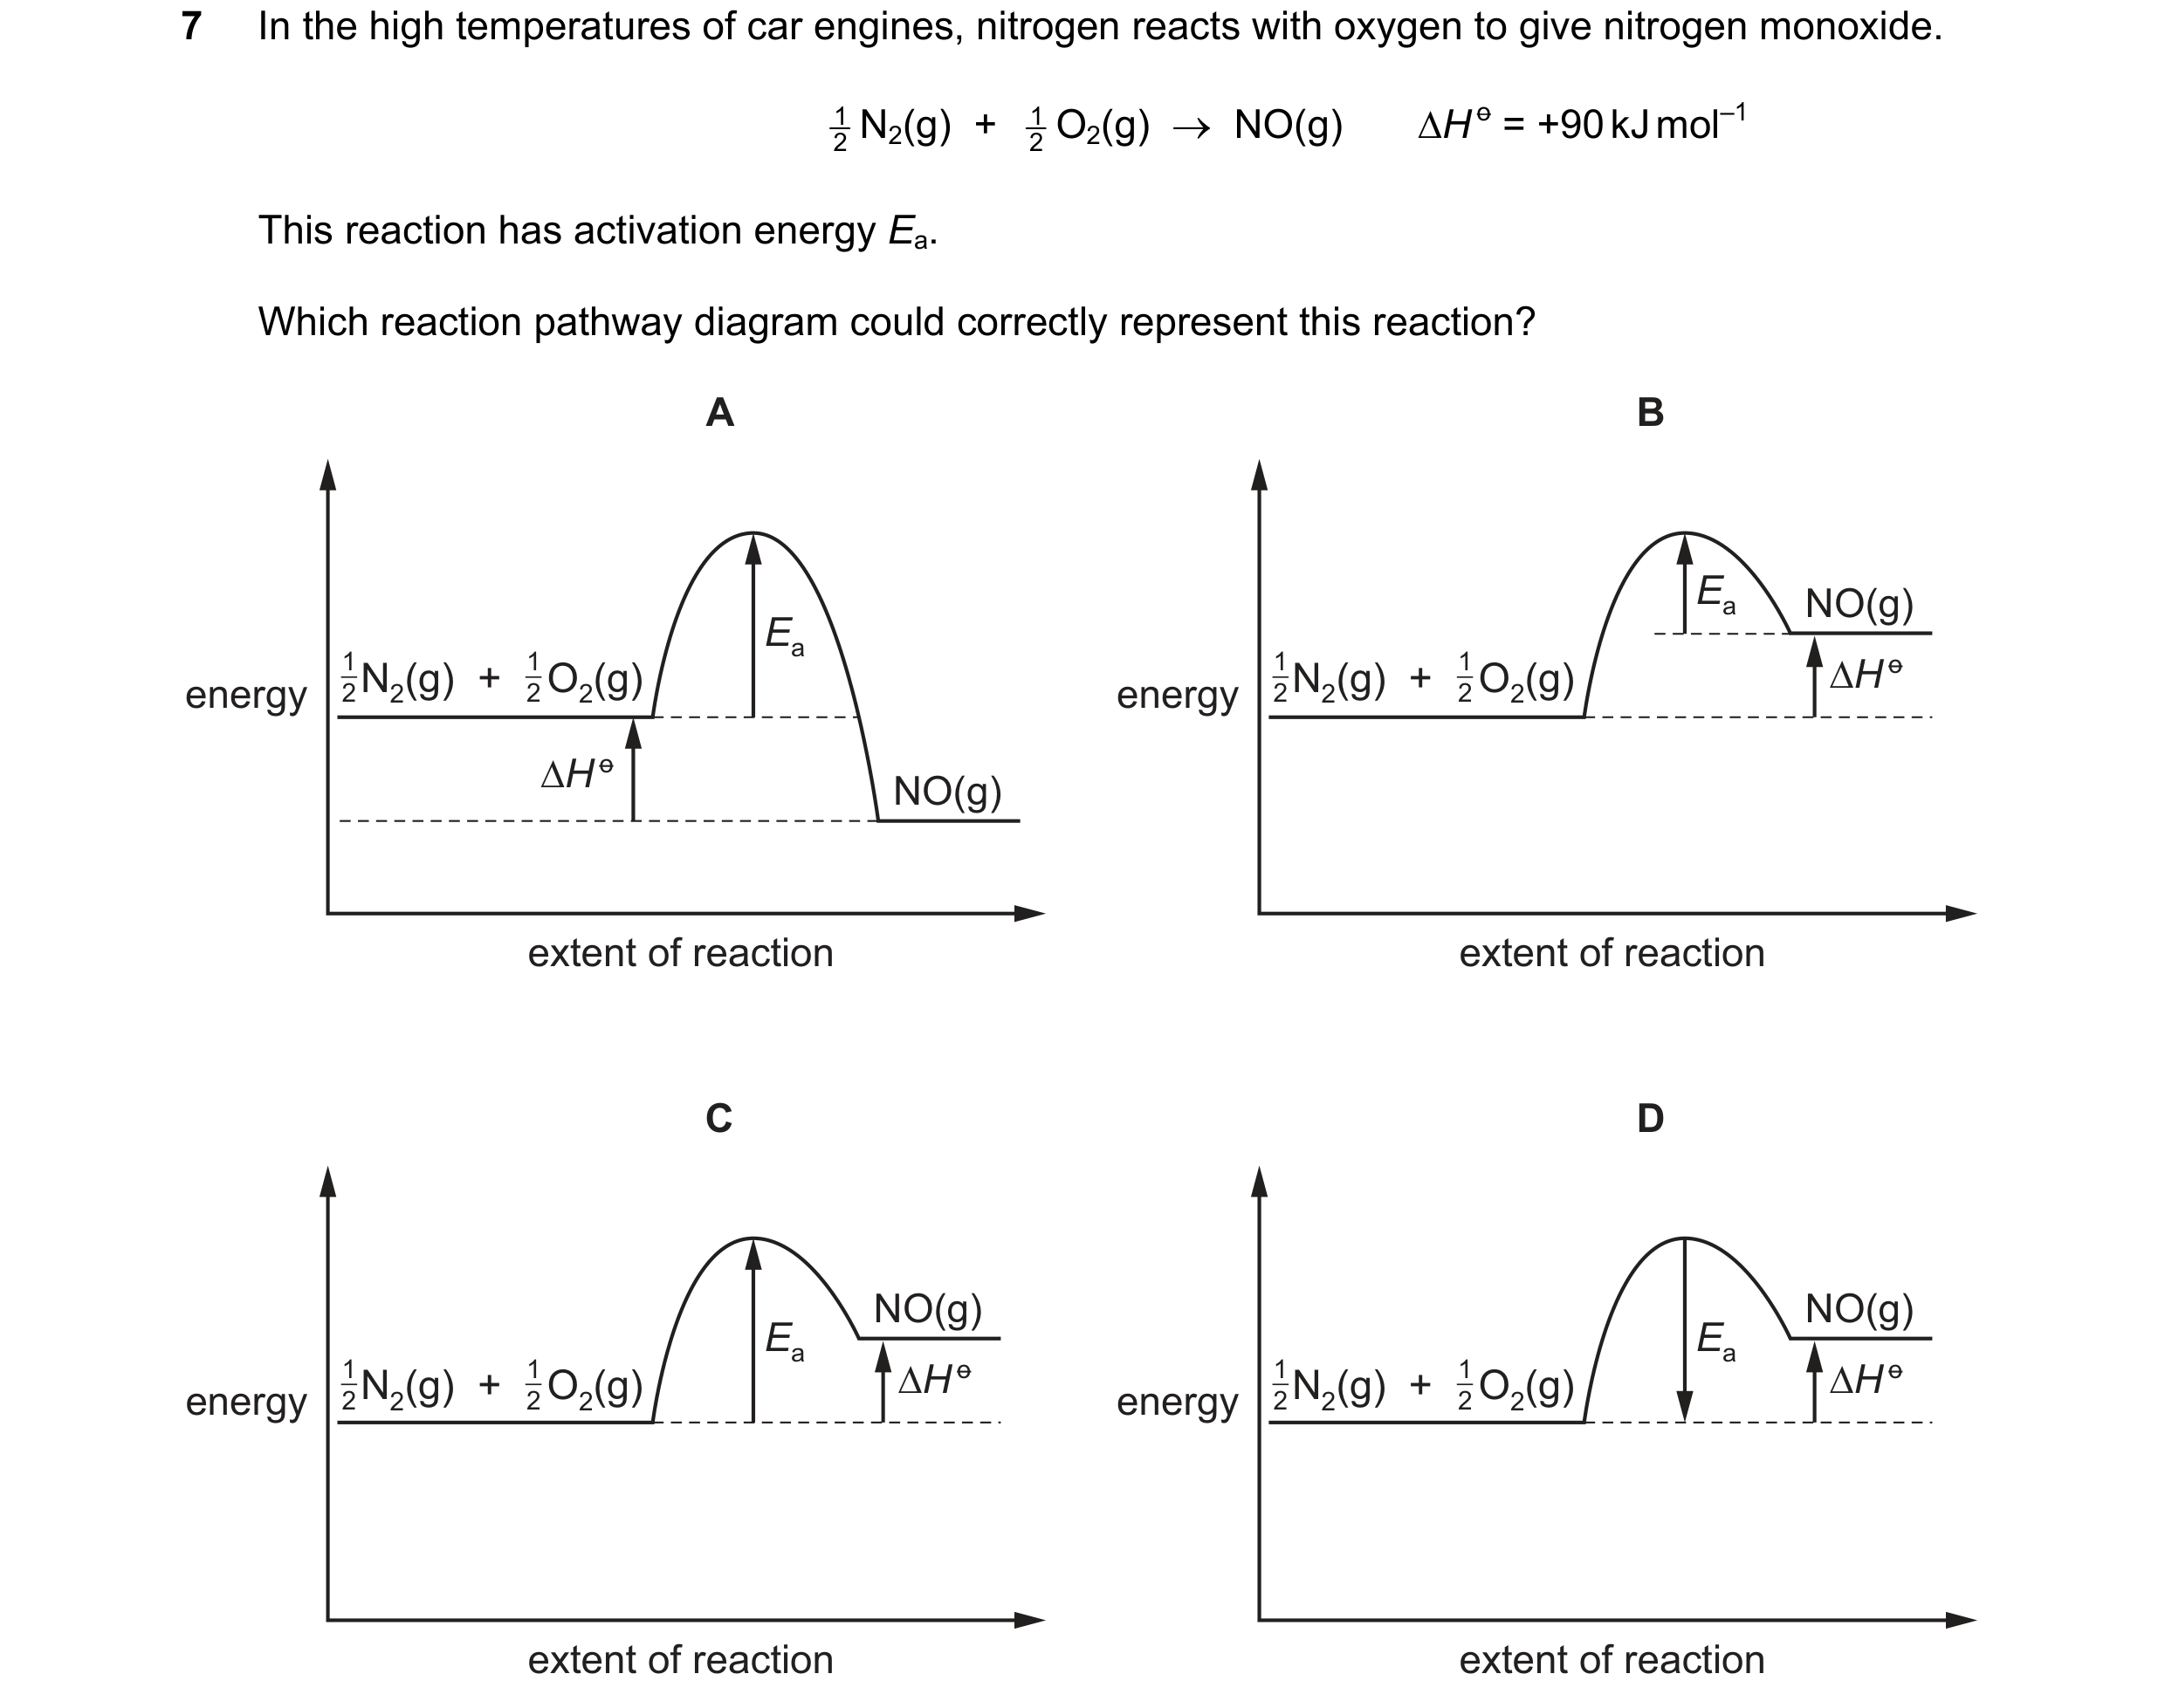
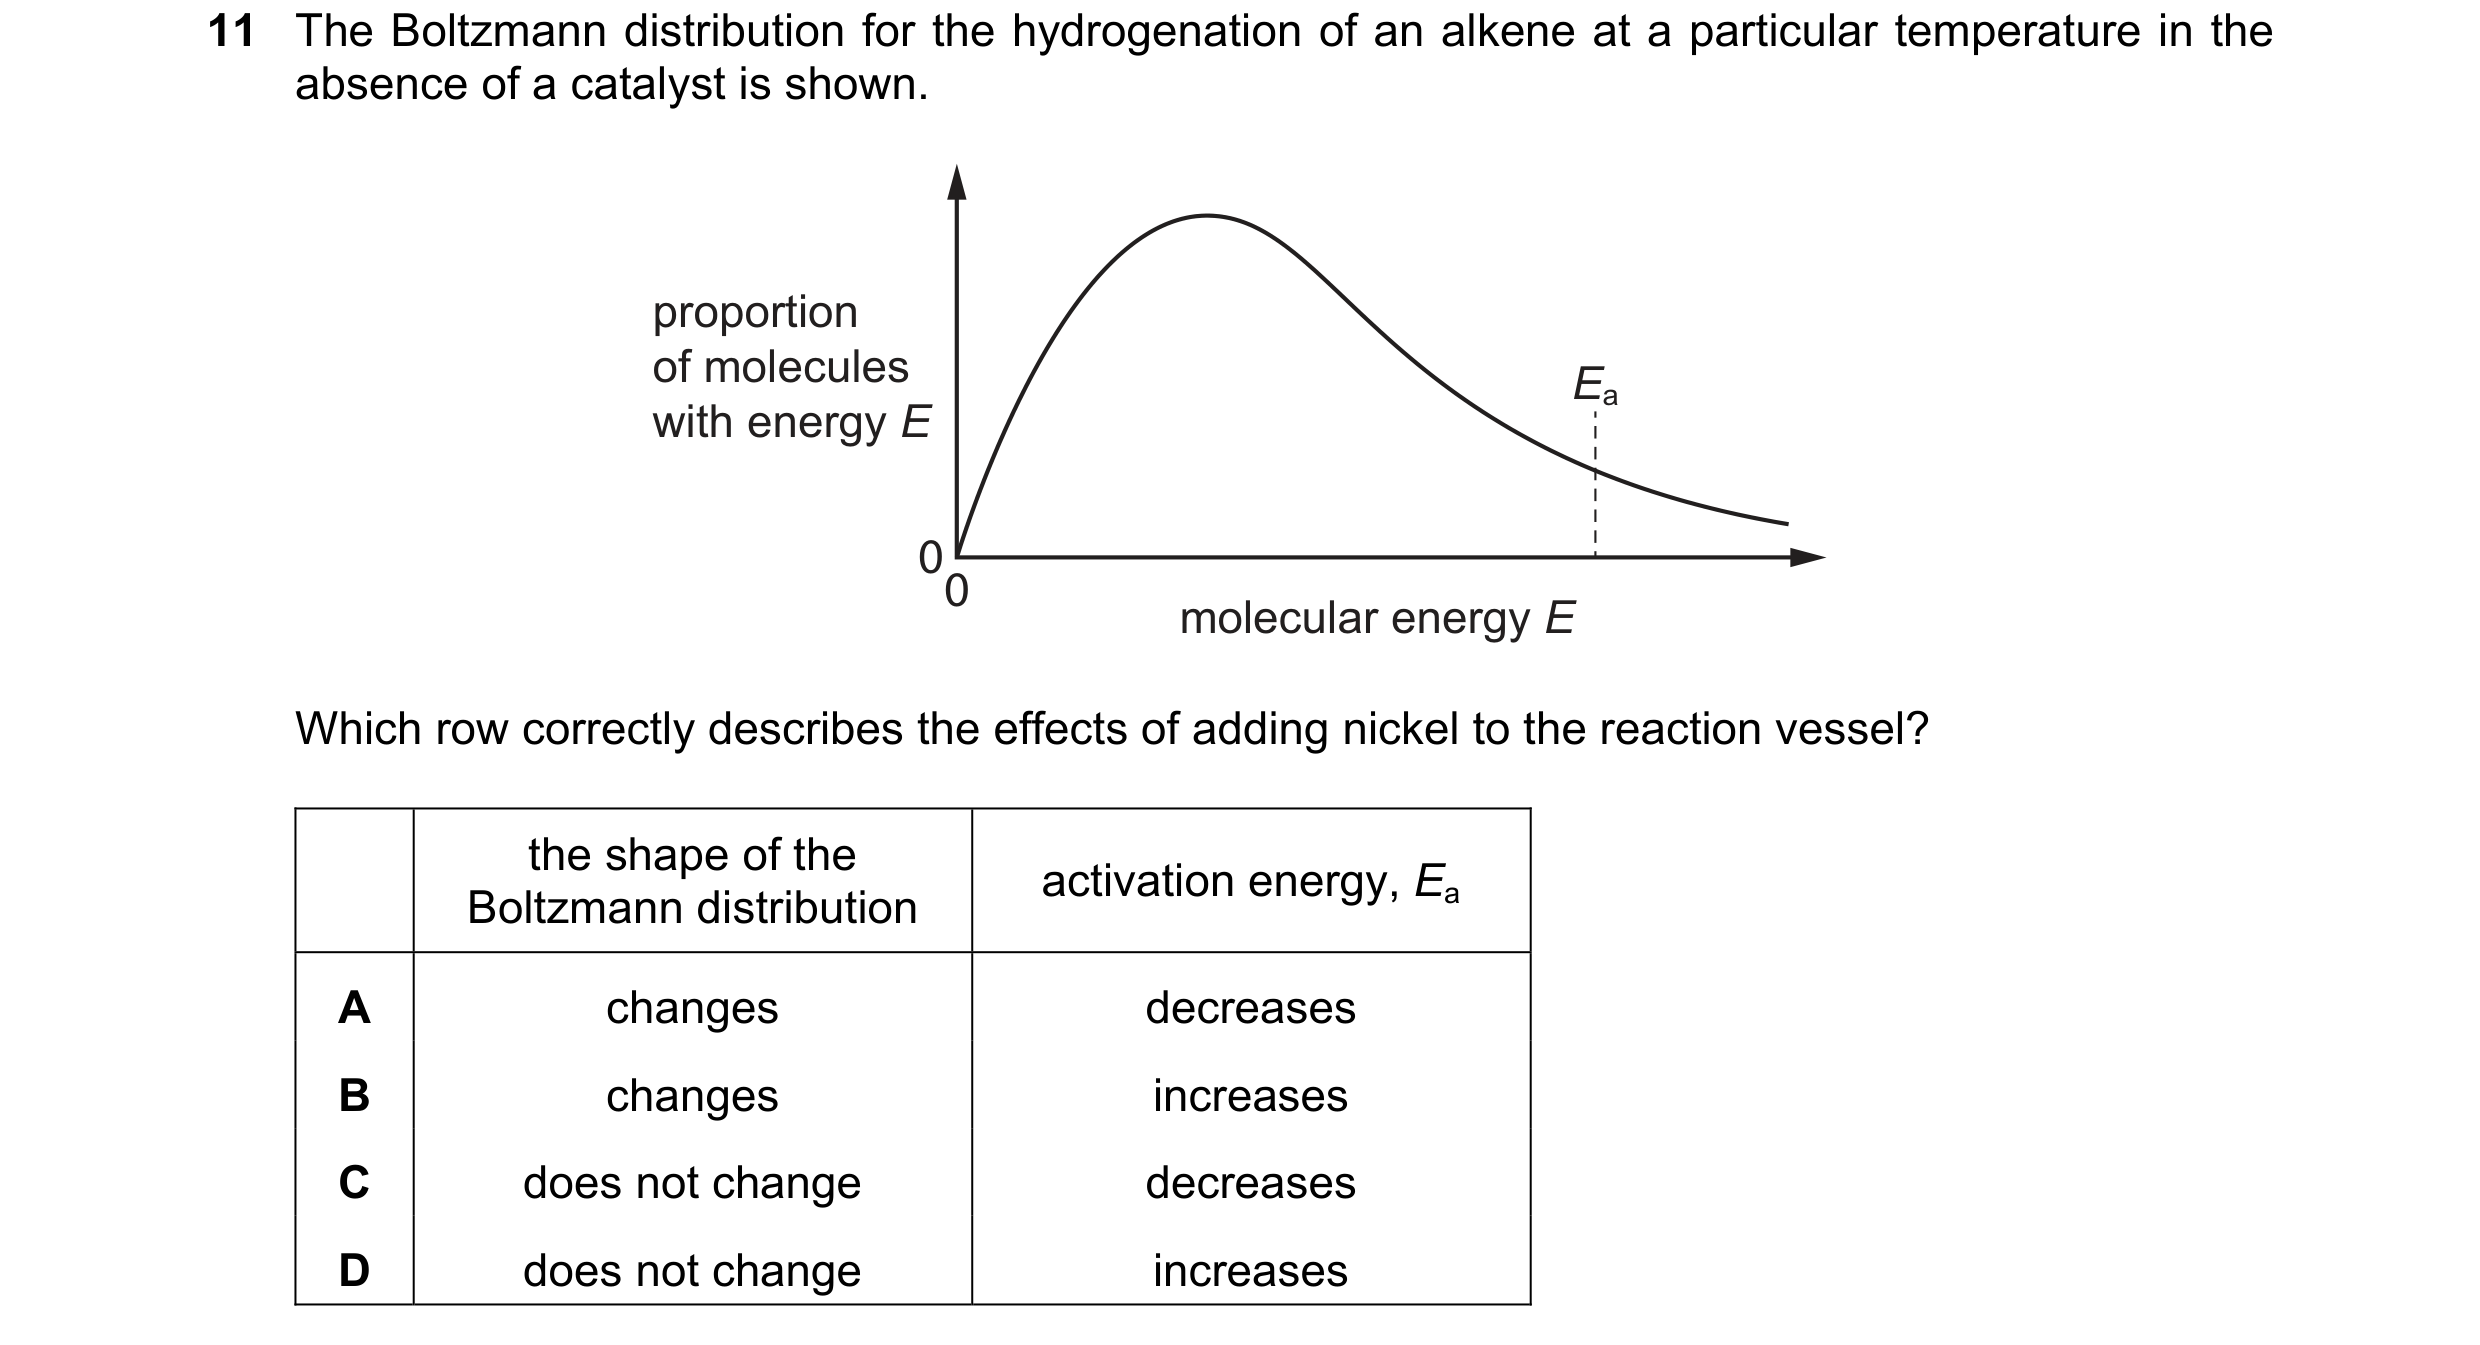 33 / 67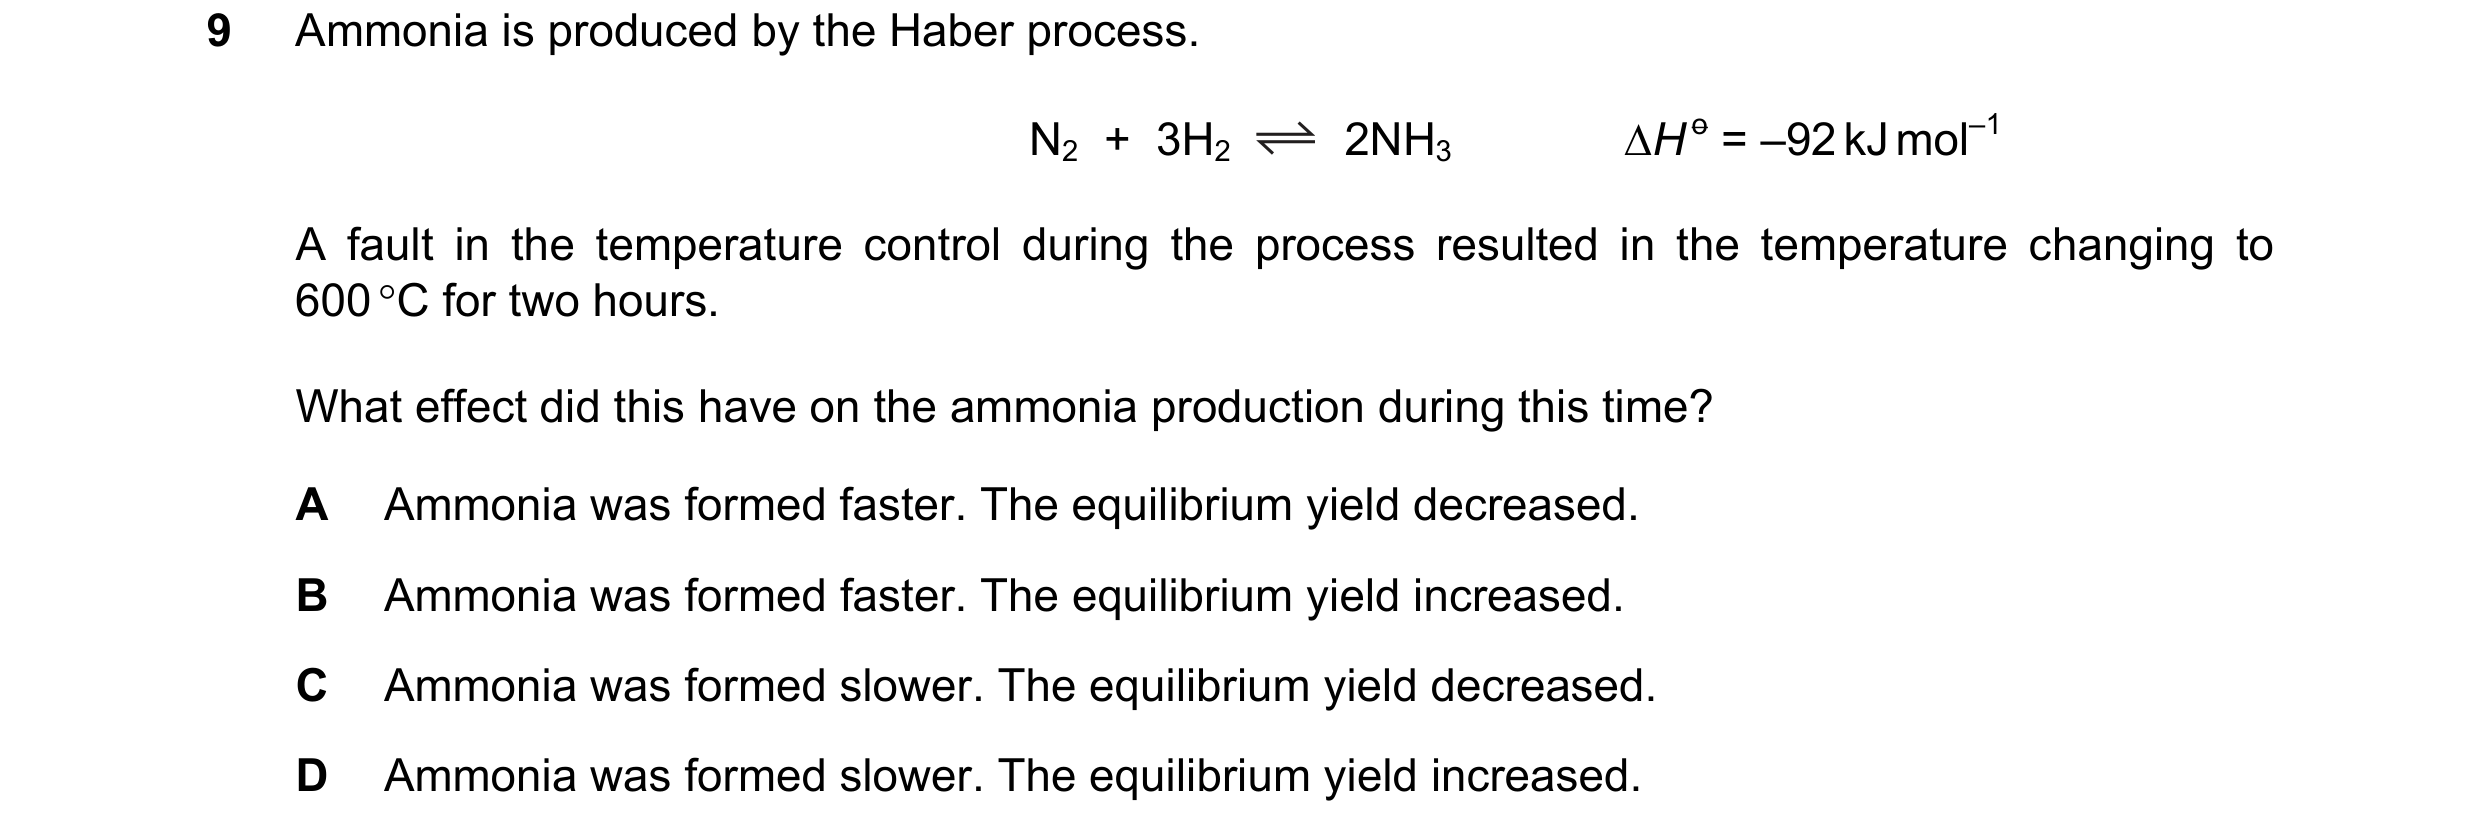
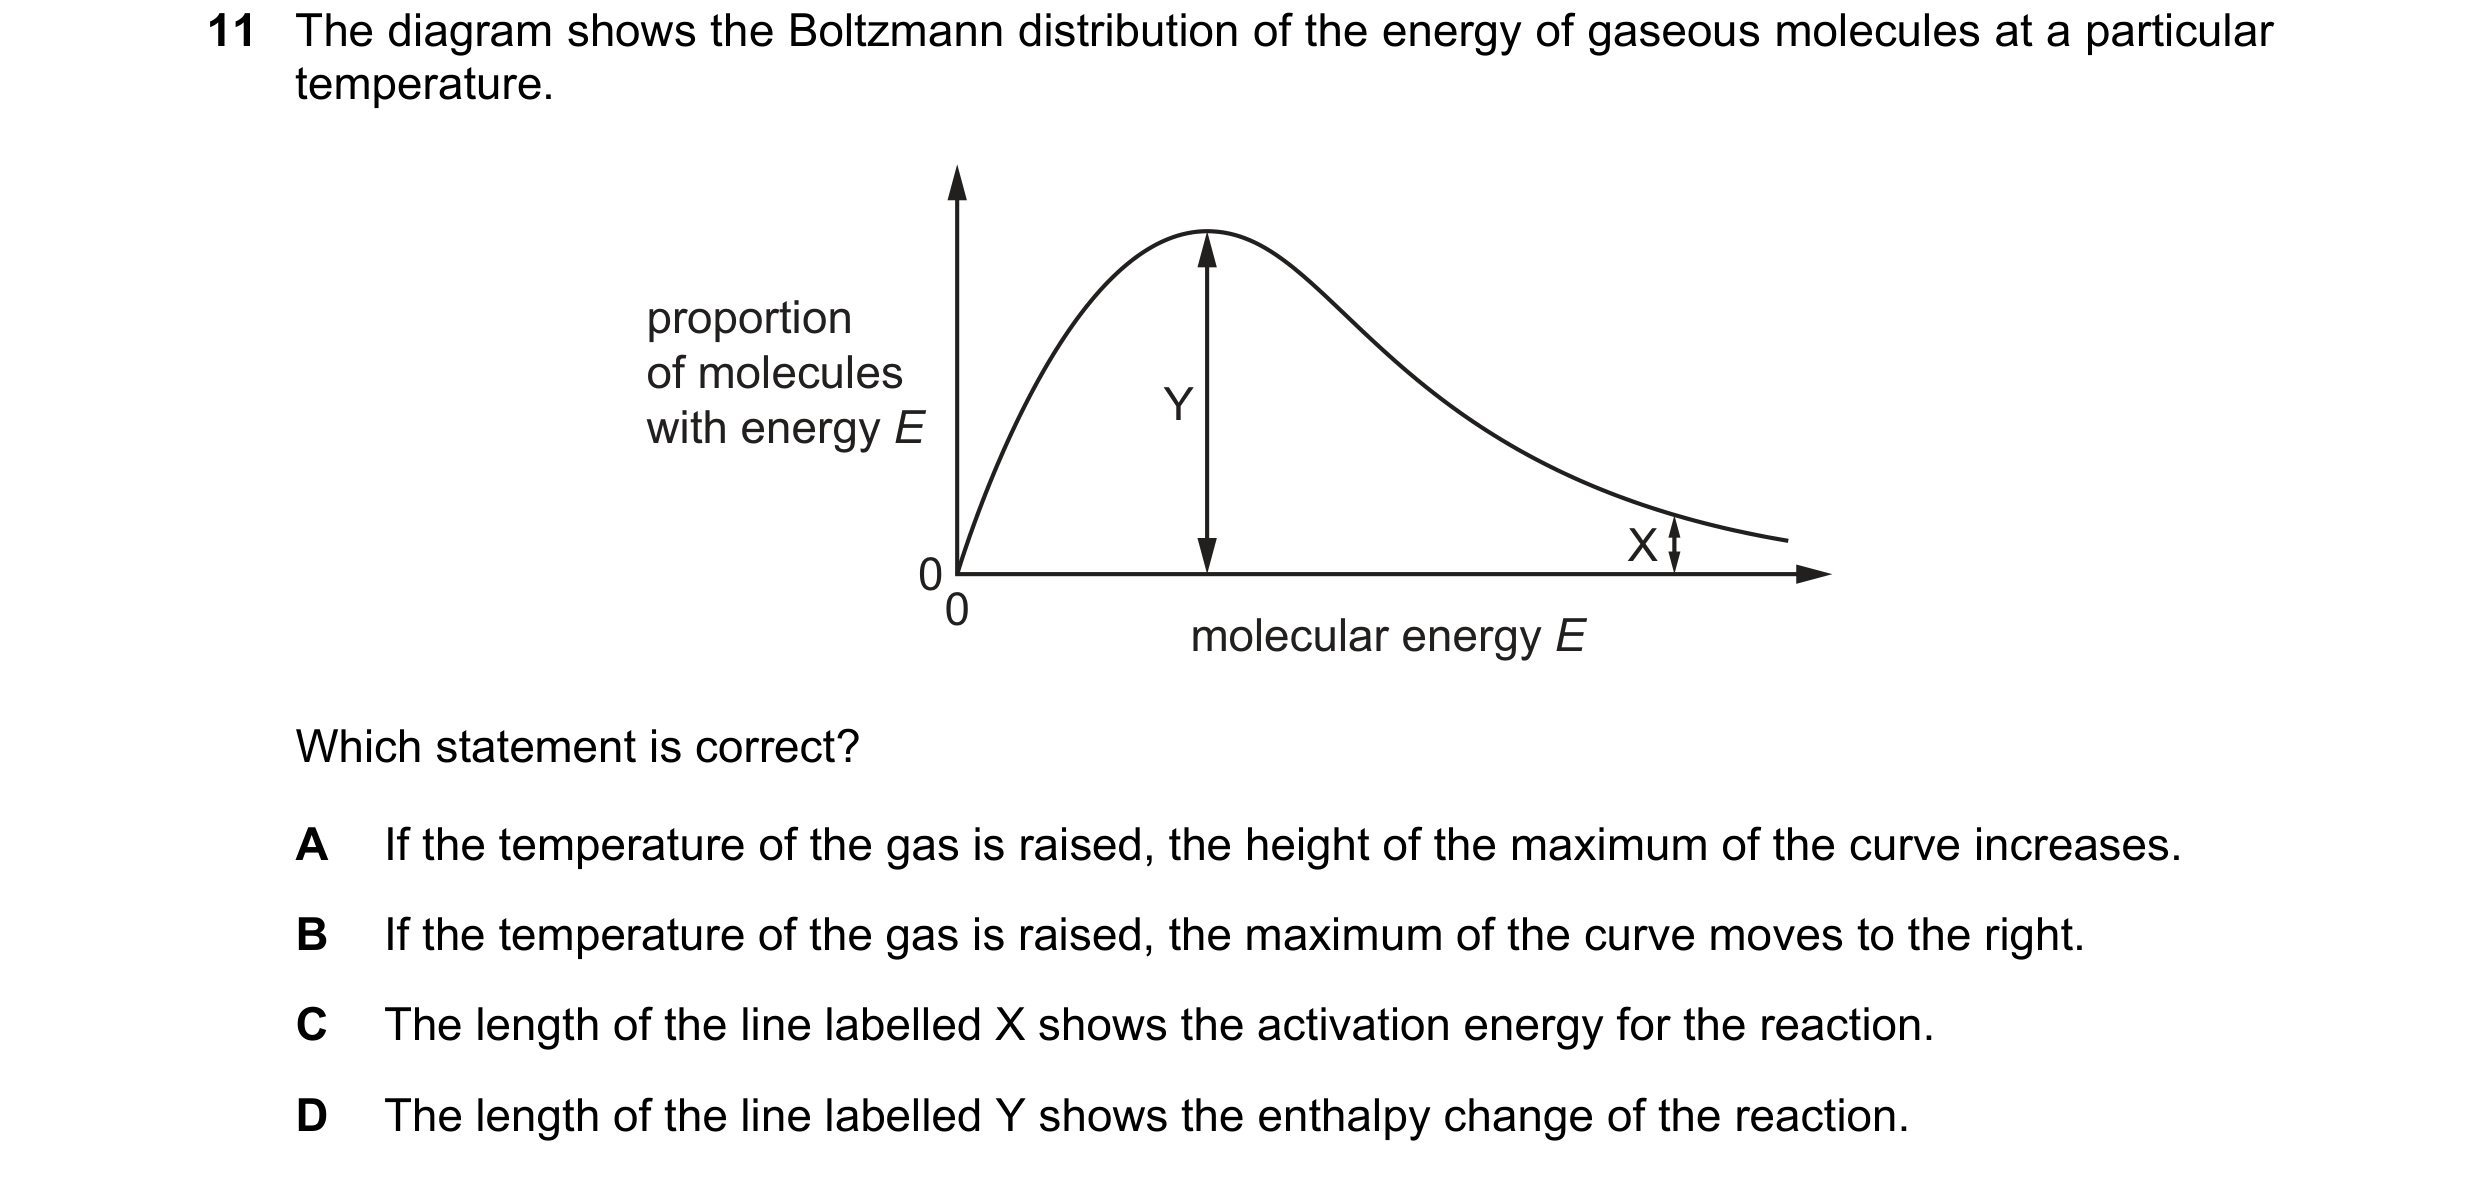 34 / 67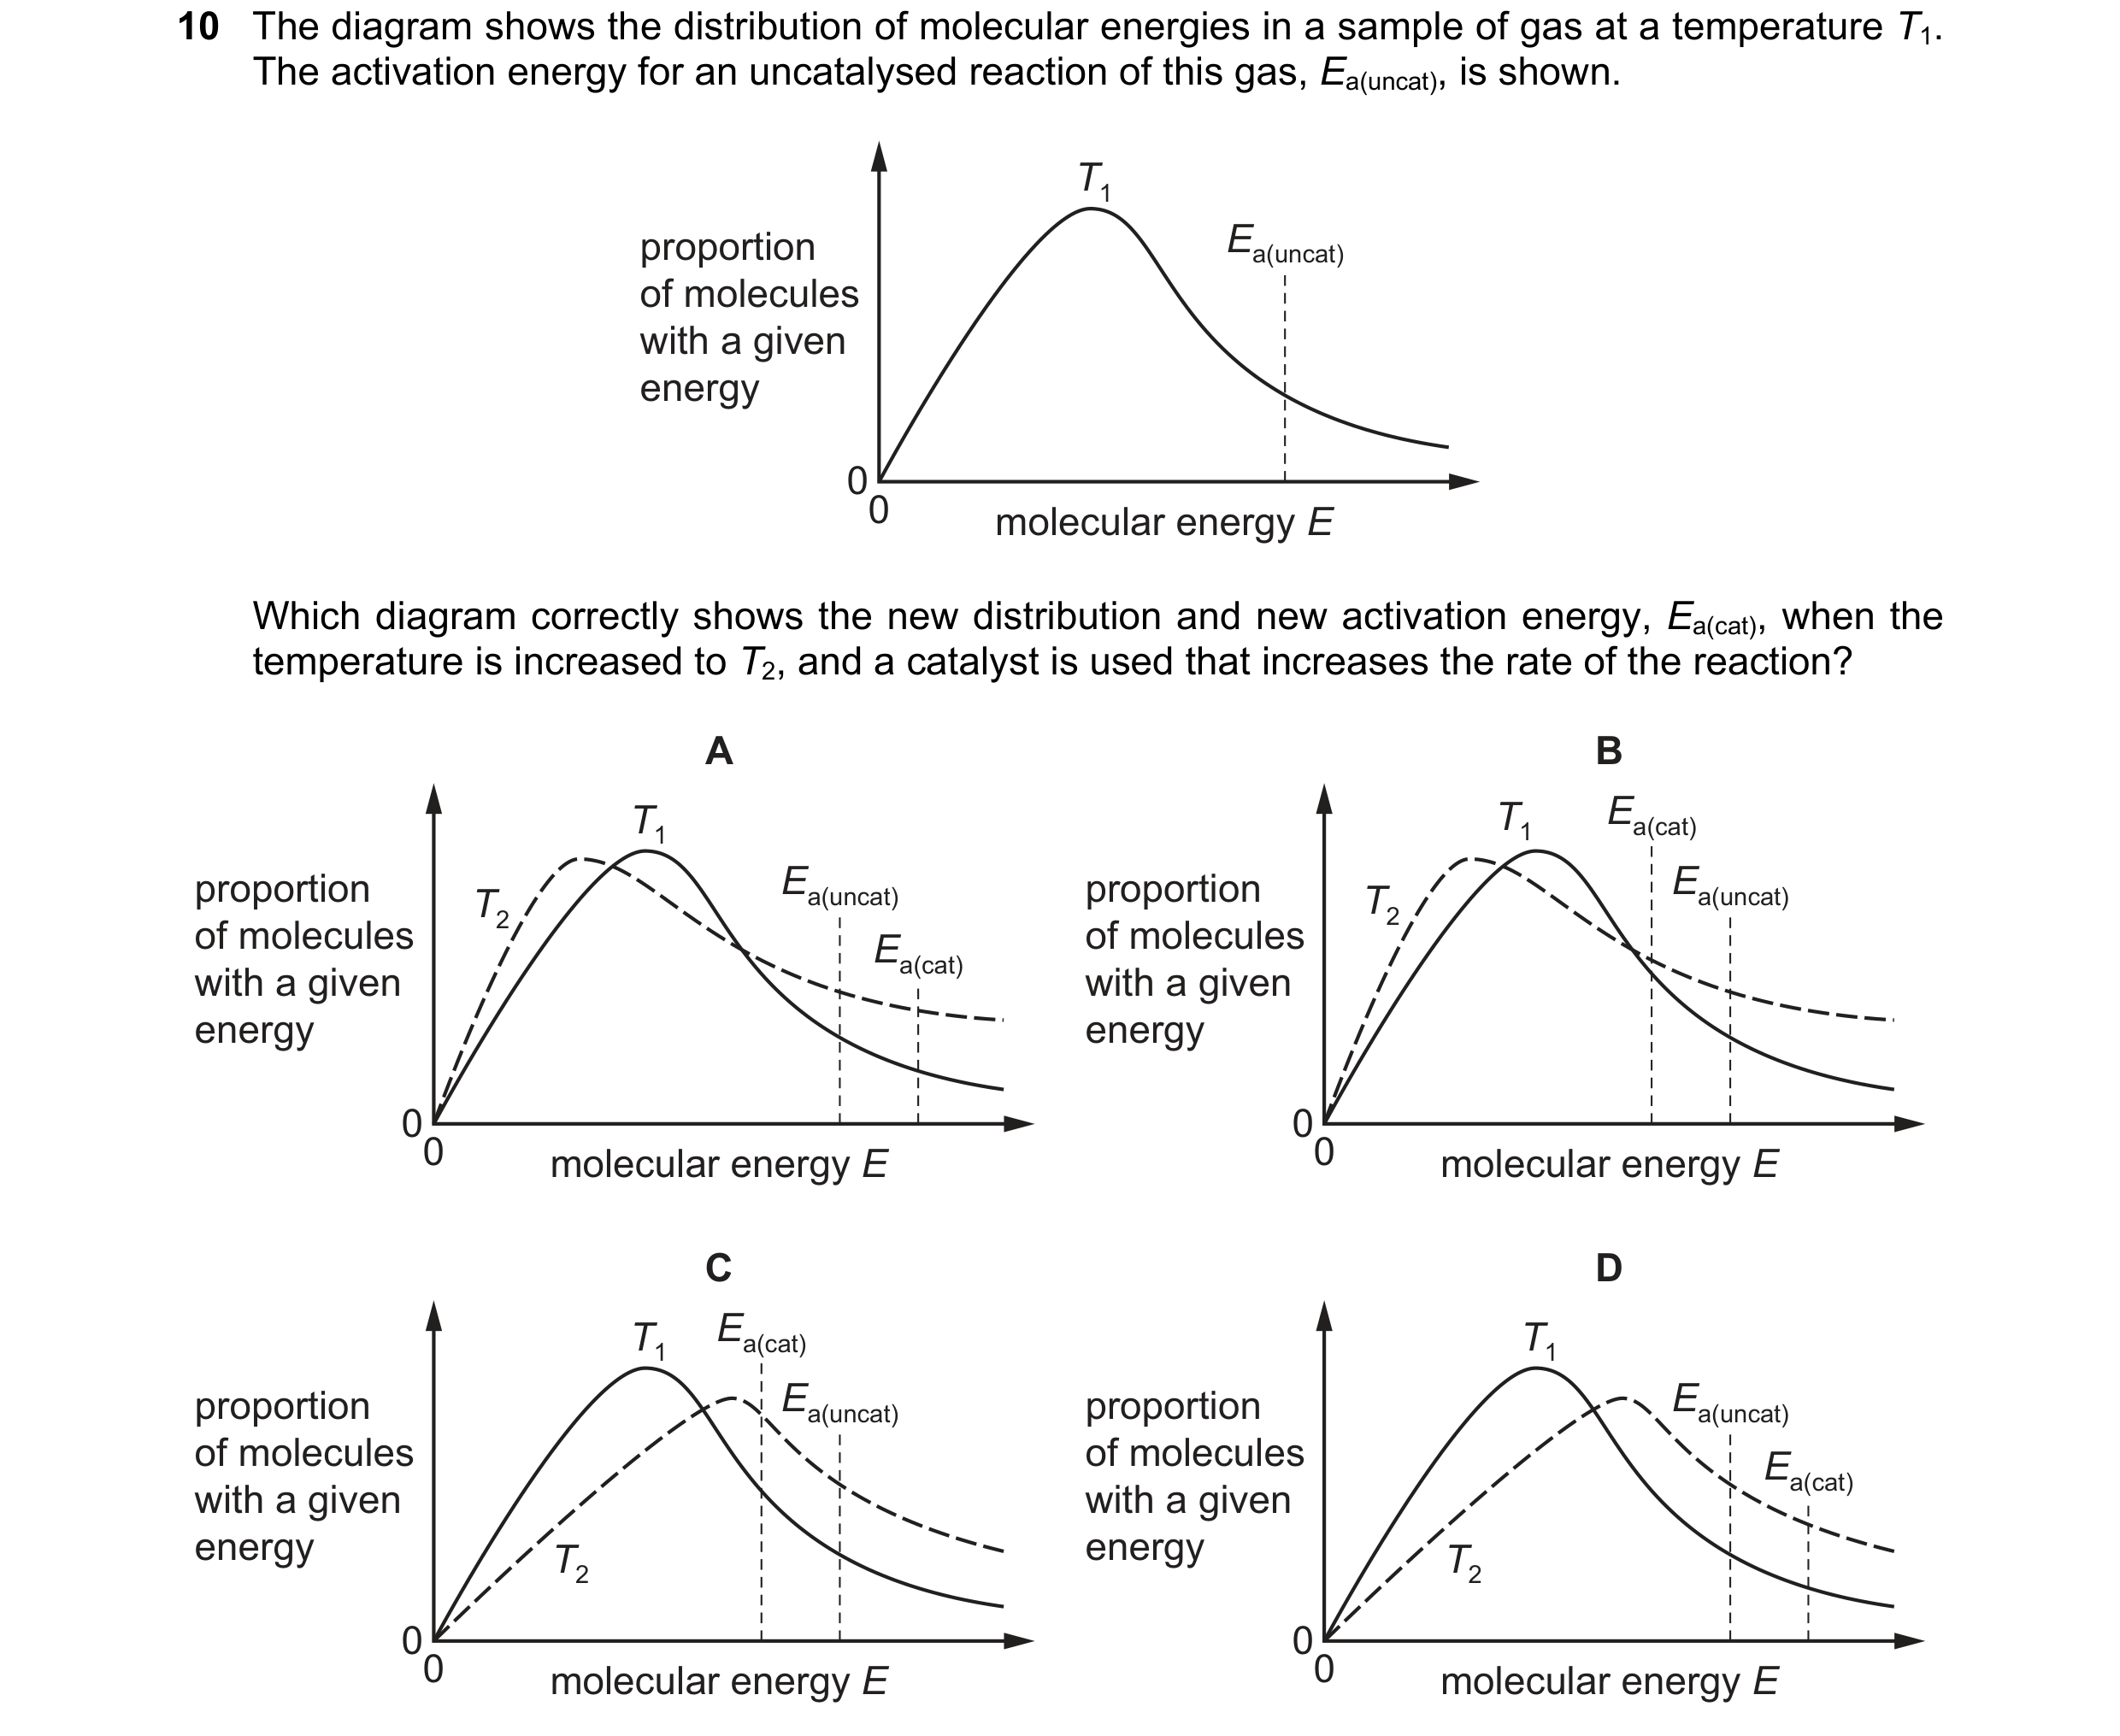
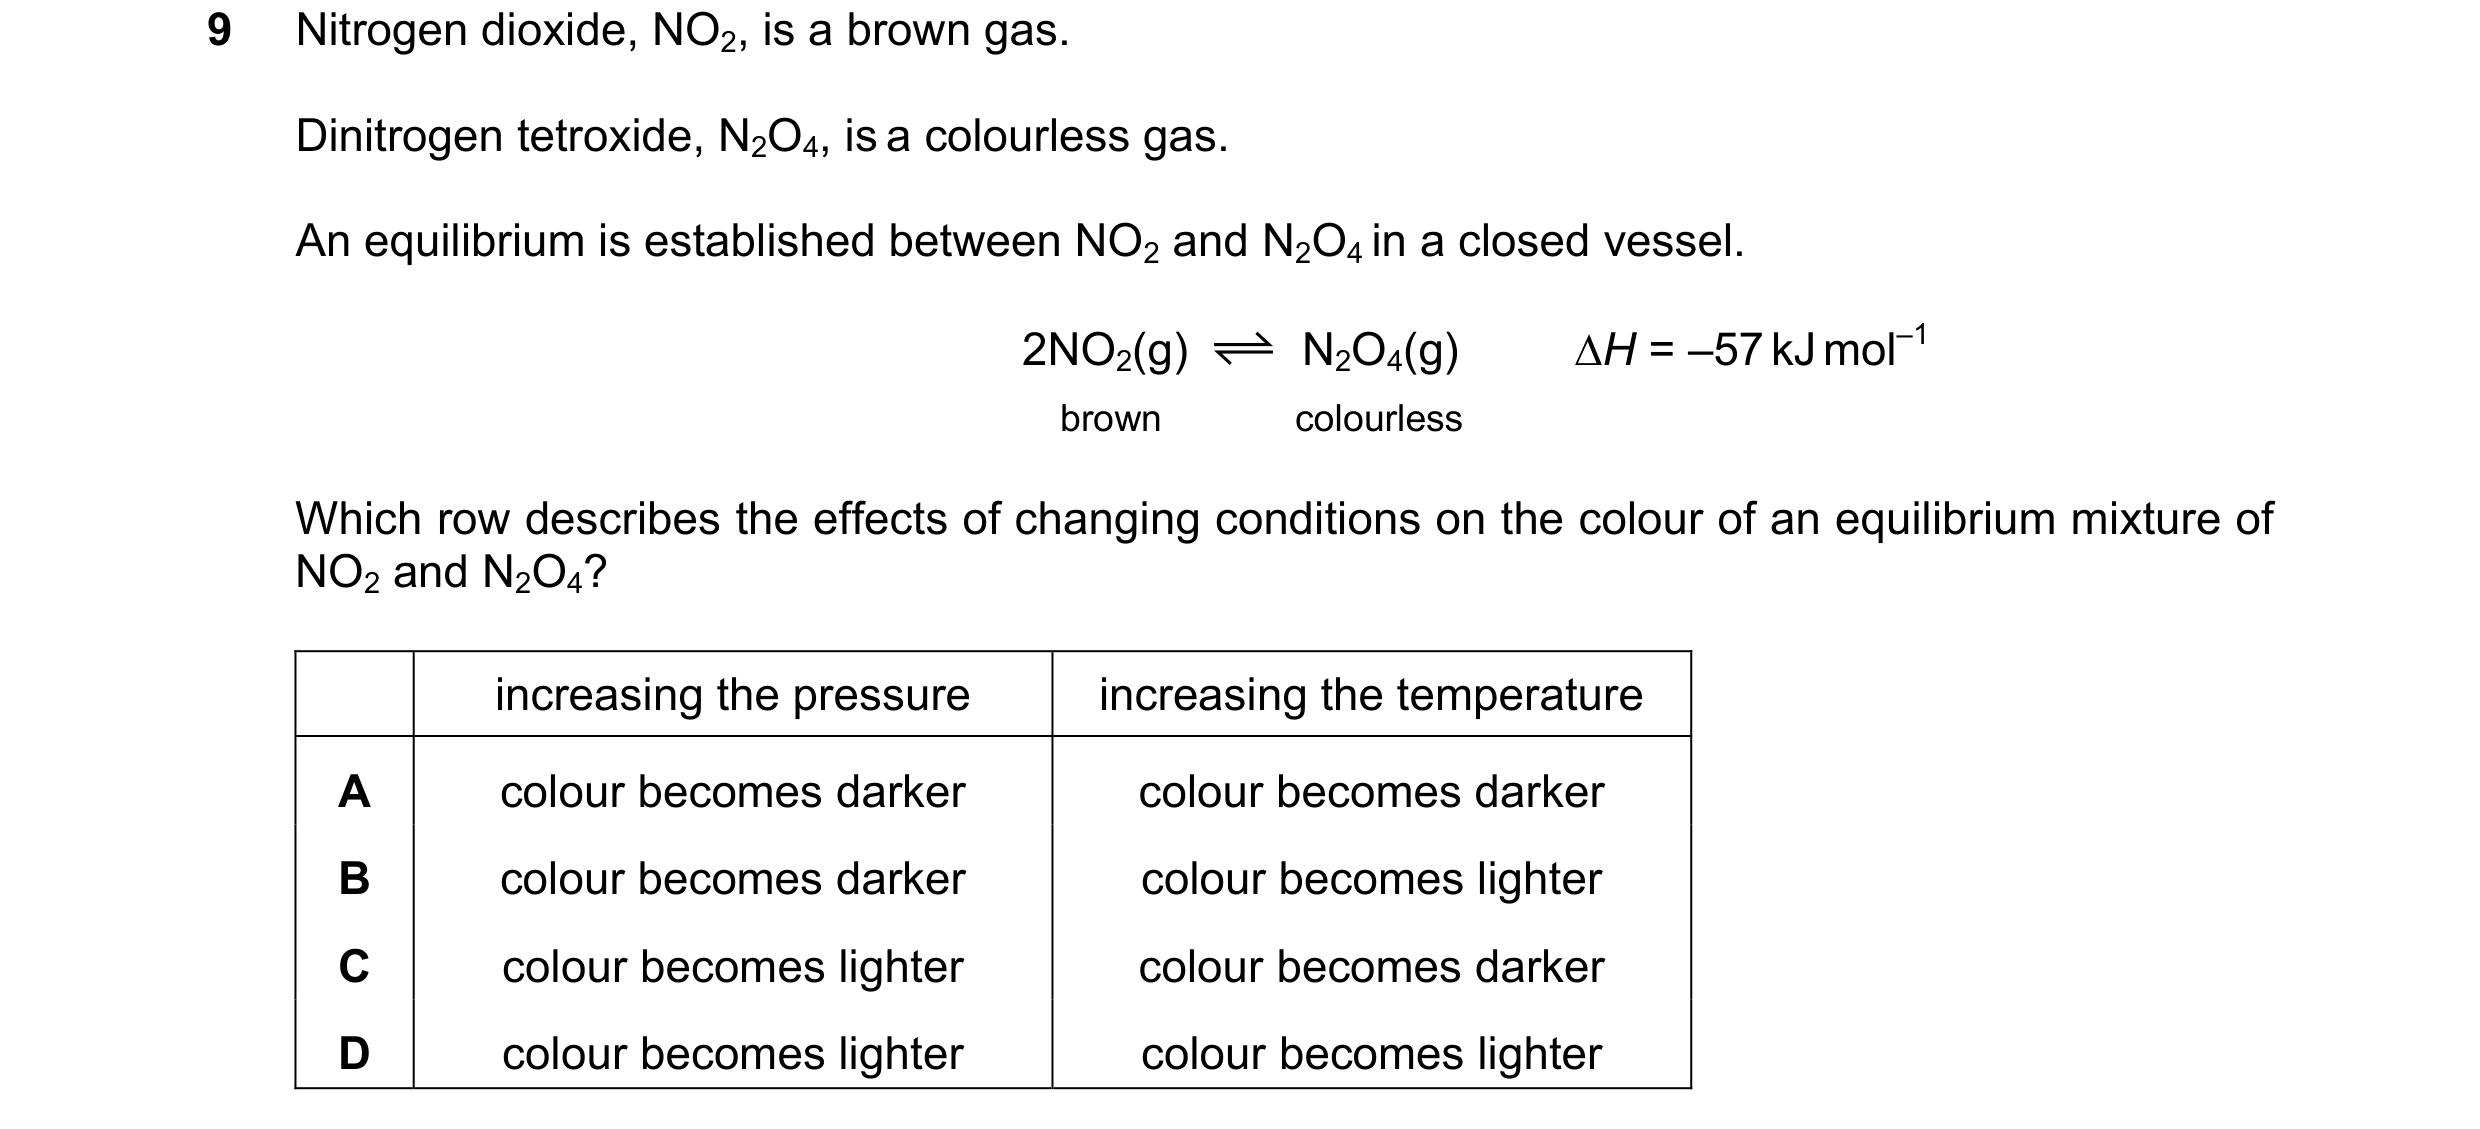 35 / 67
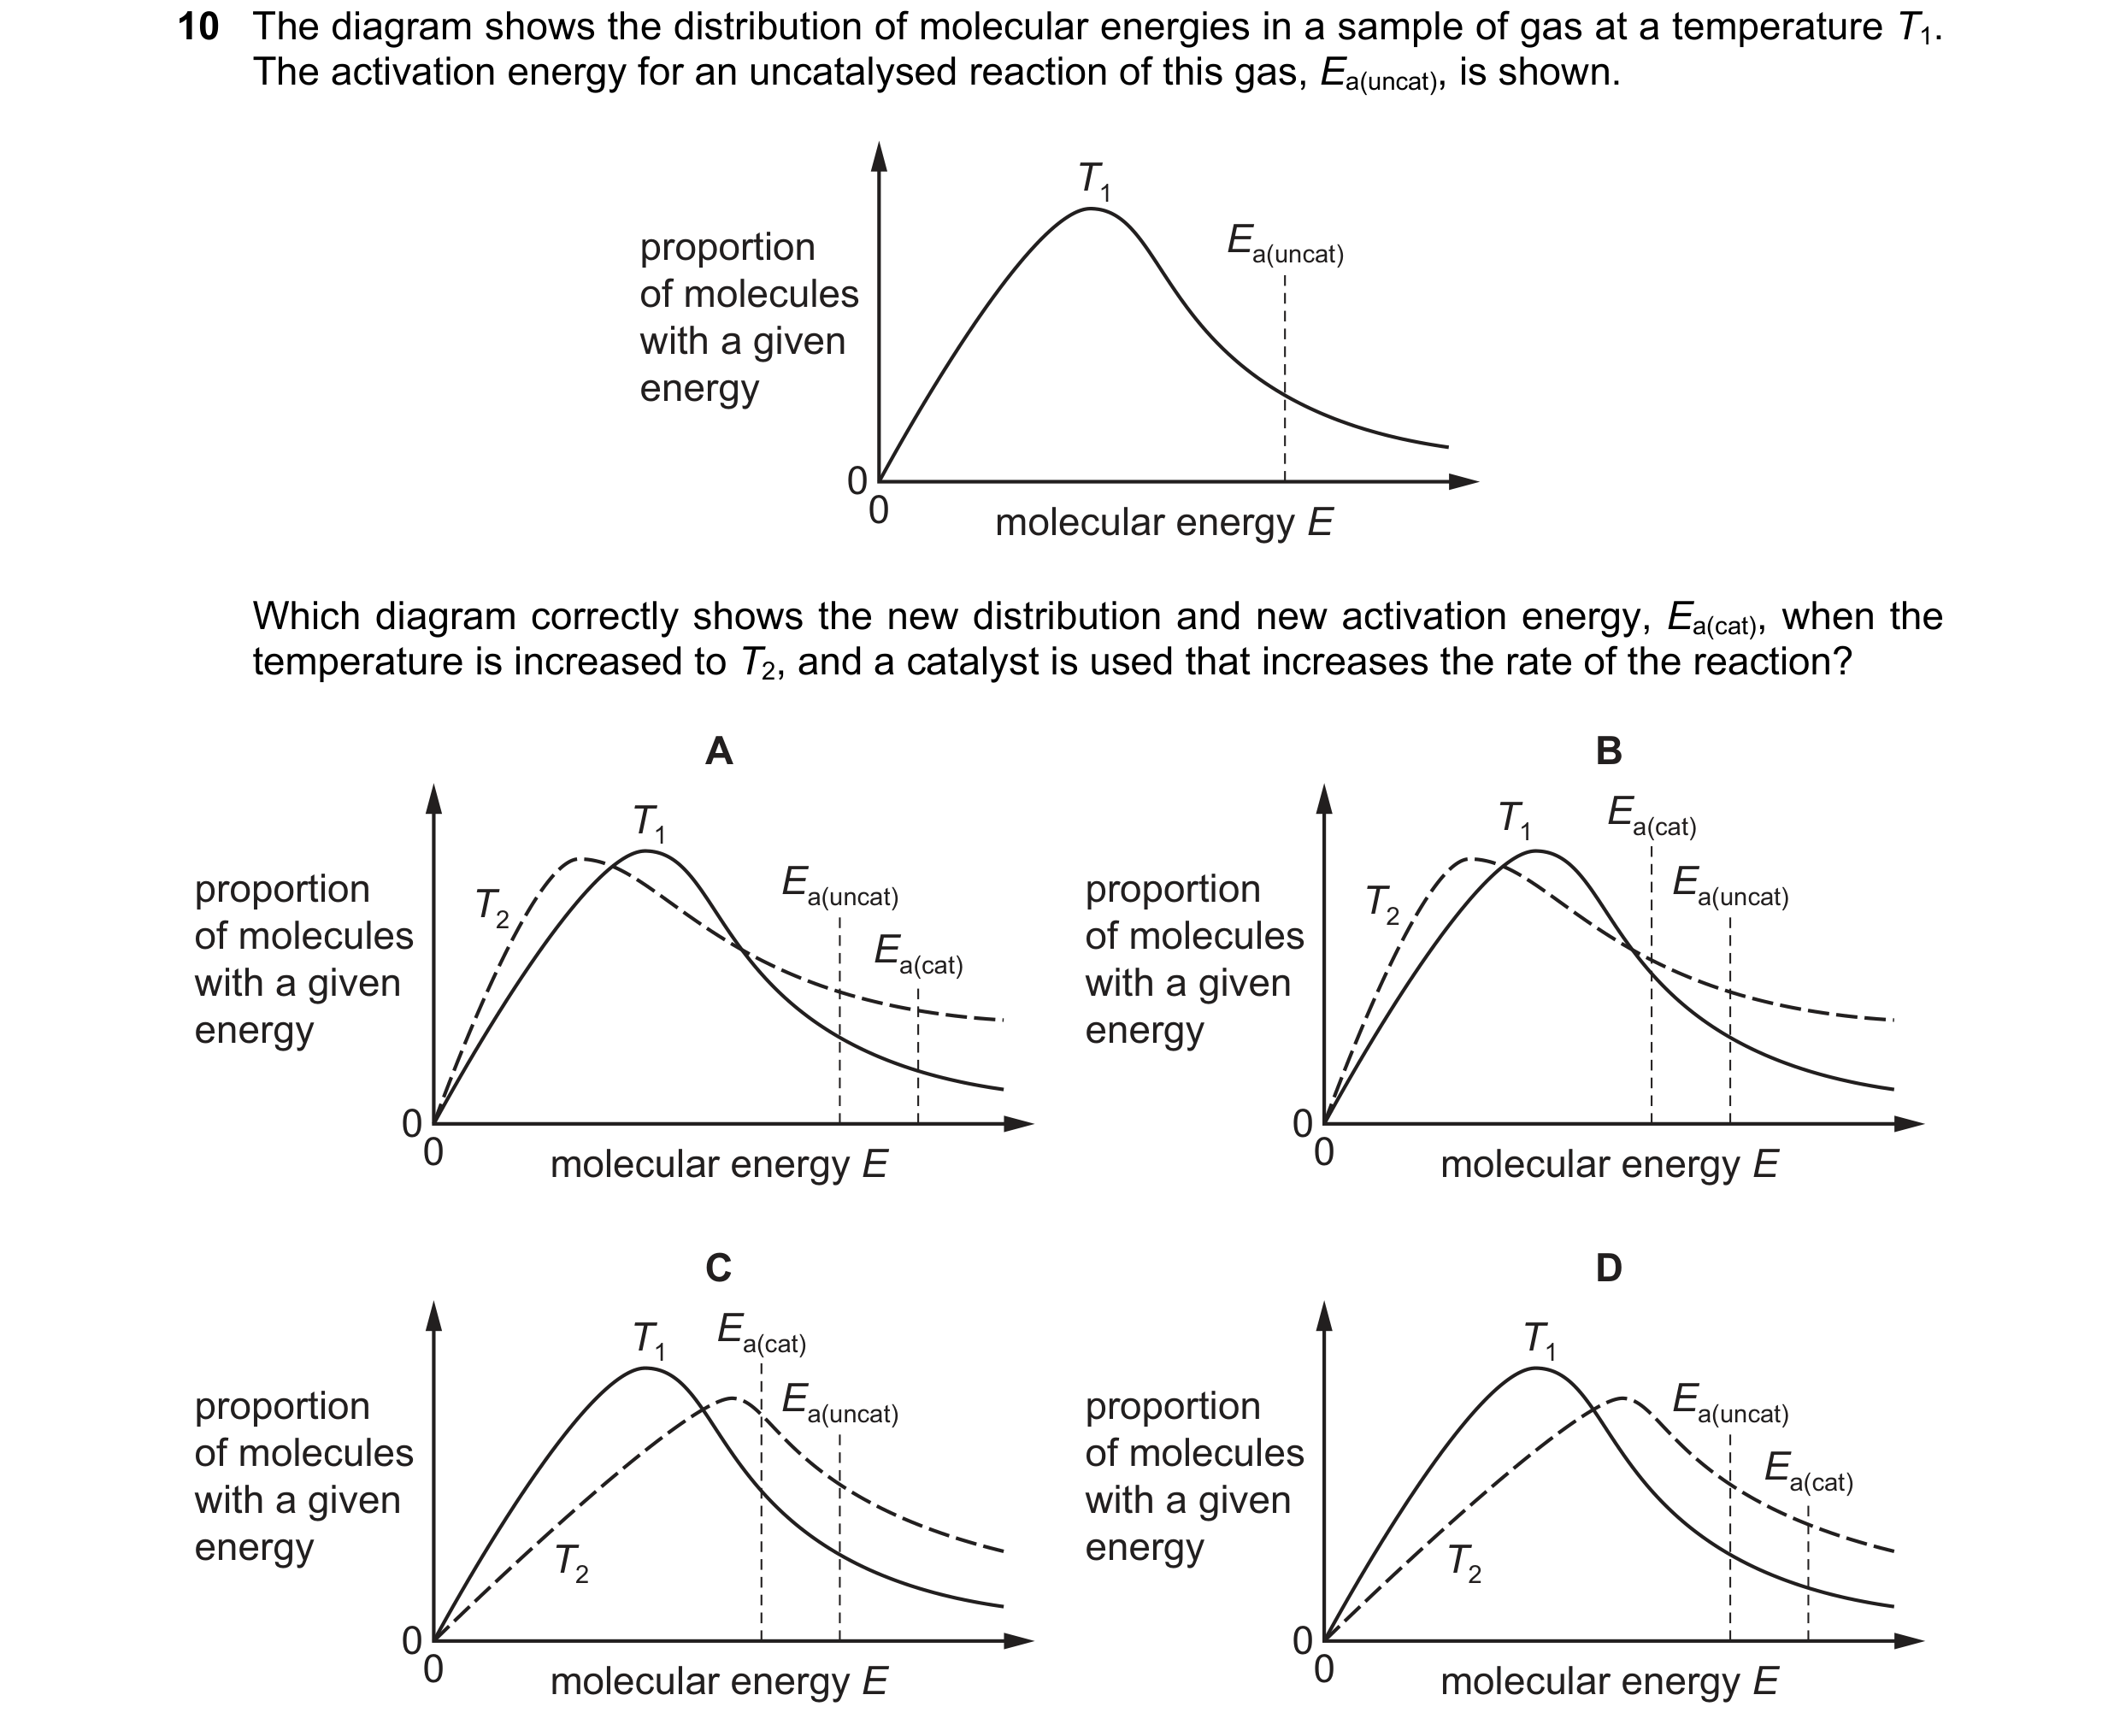
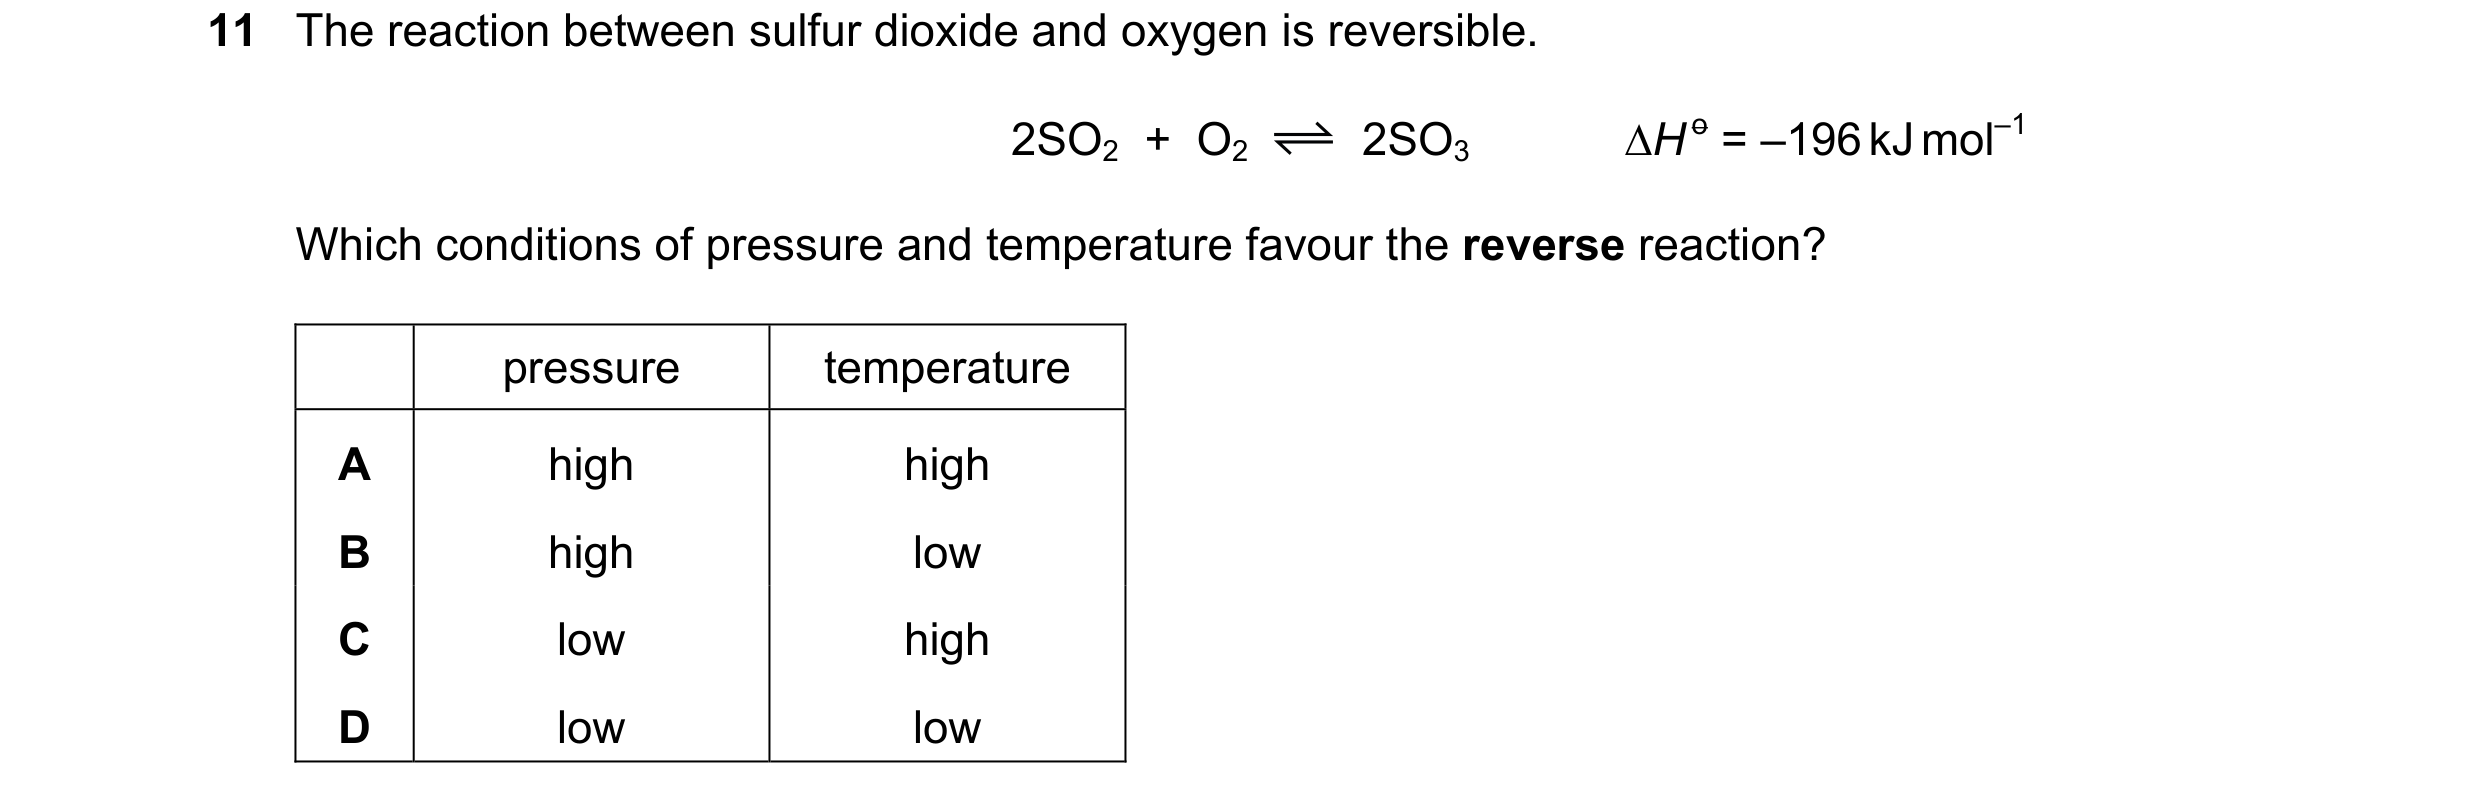 36 / 67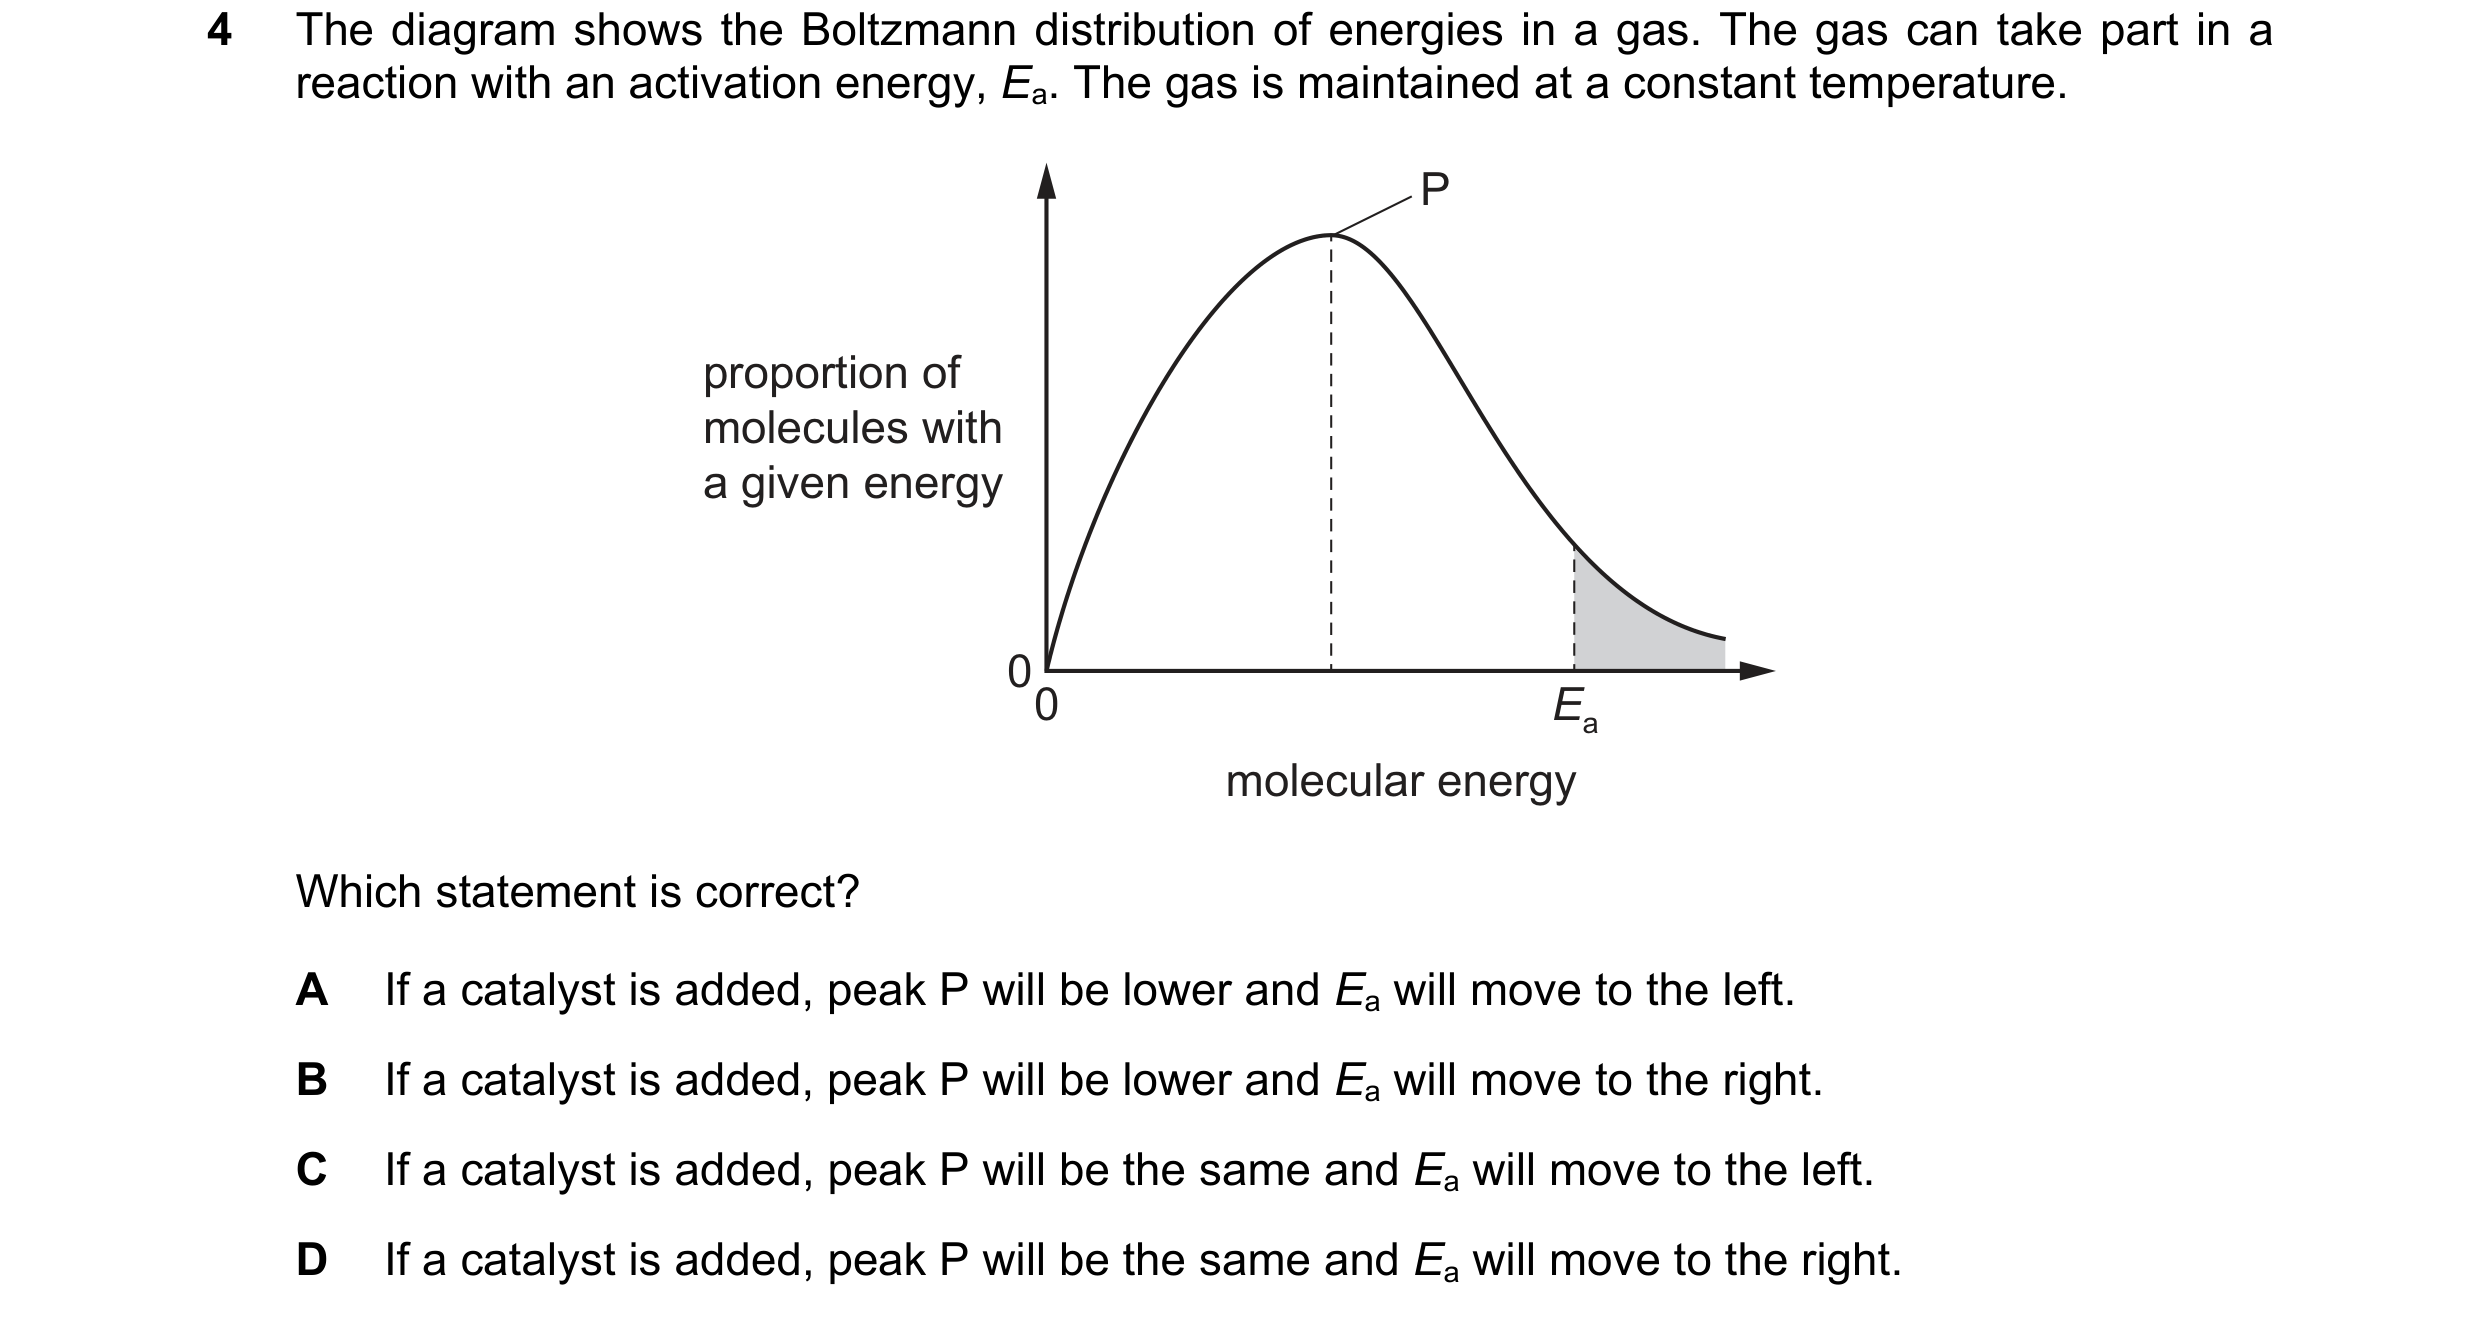
 37 / 67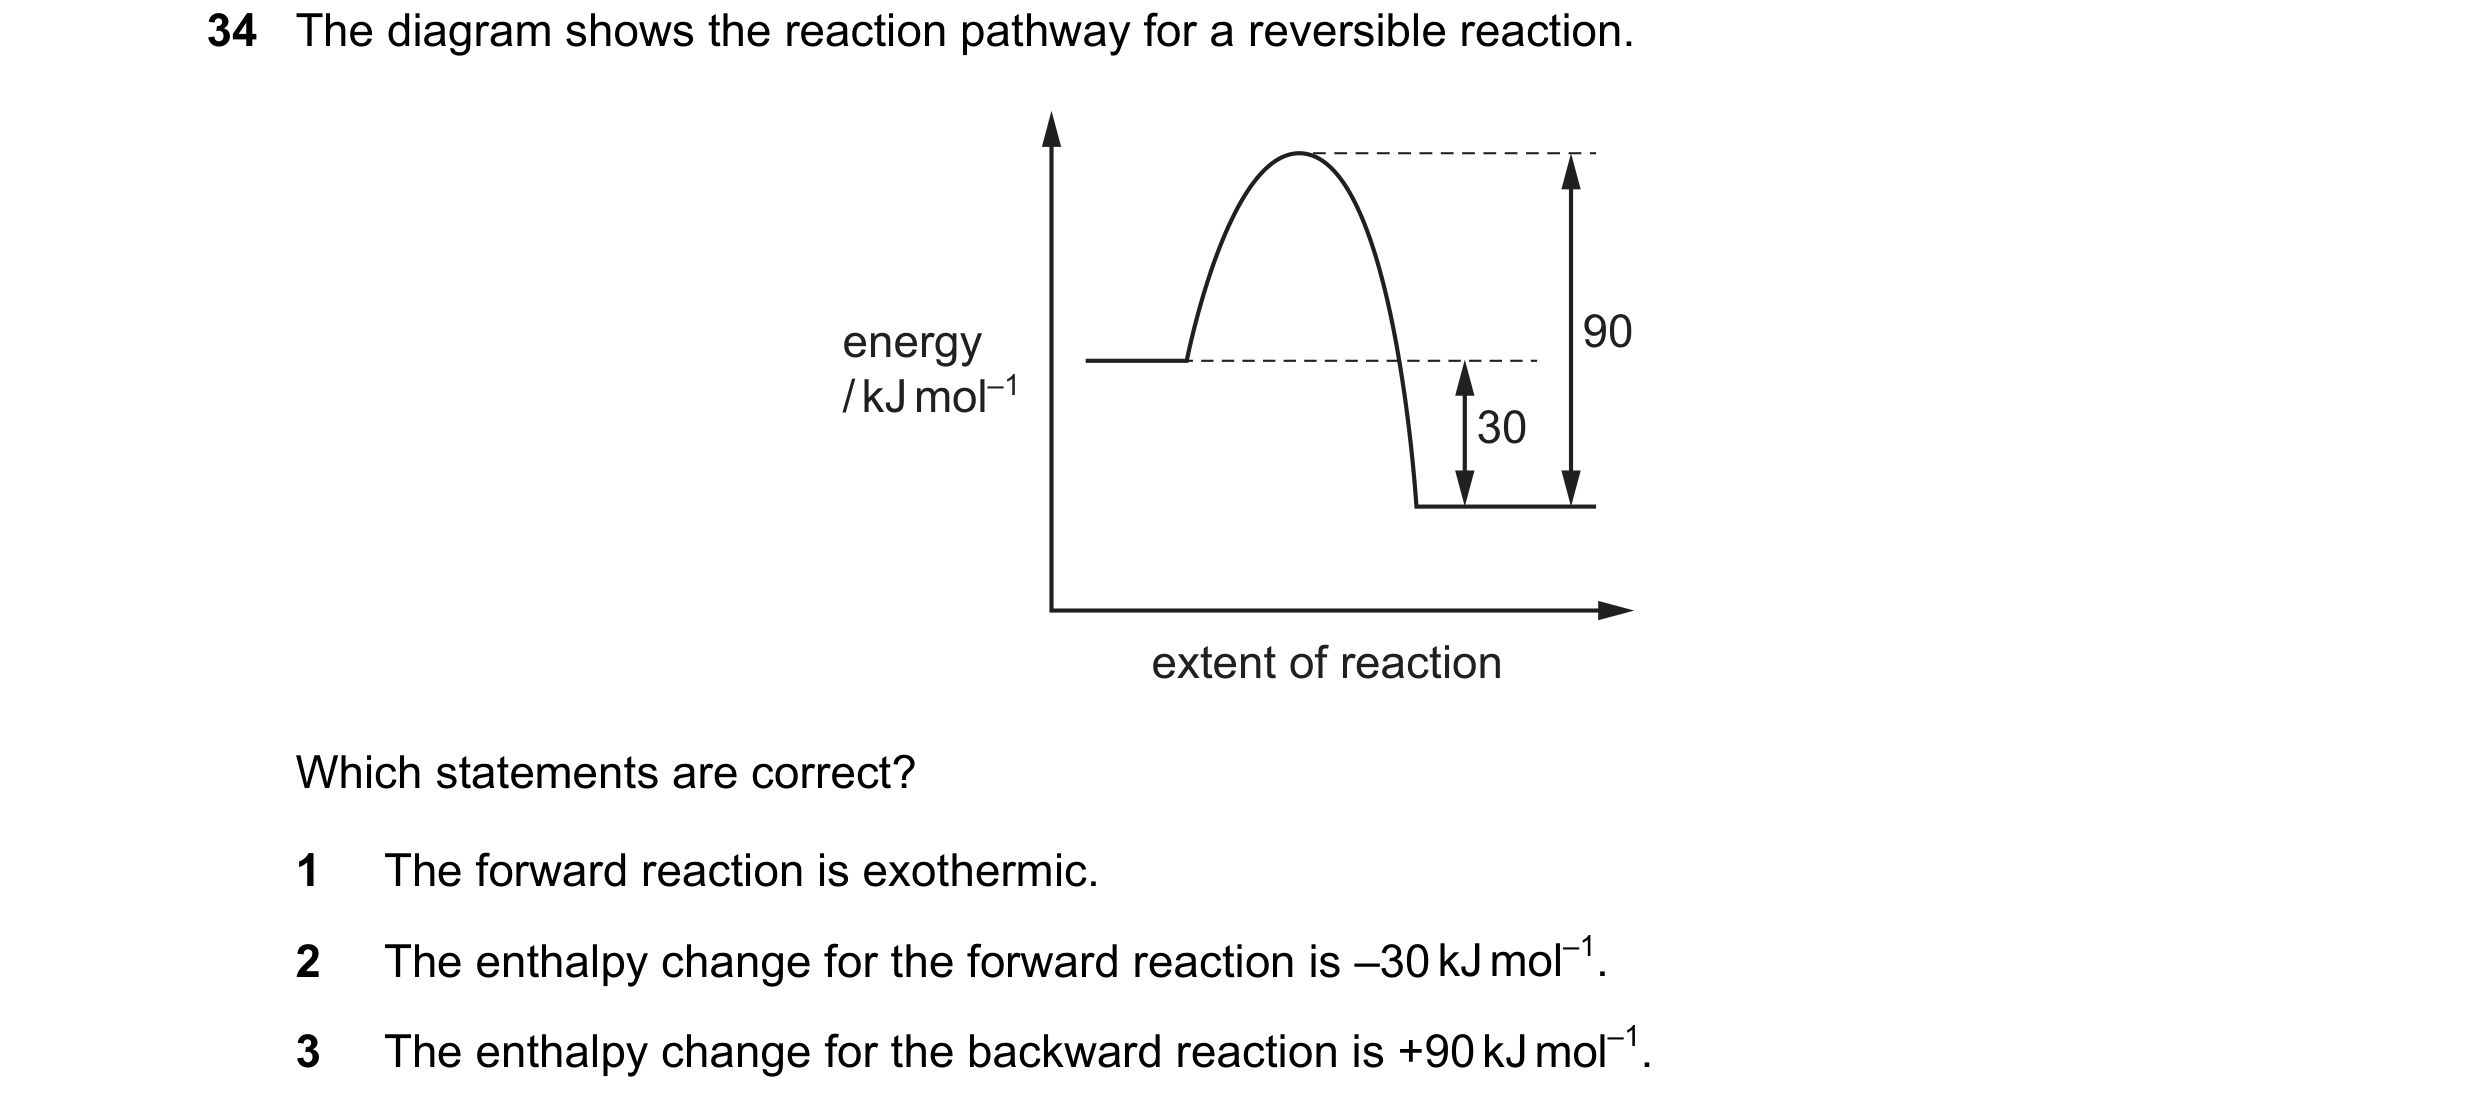
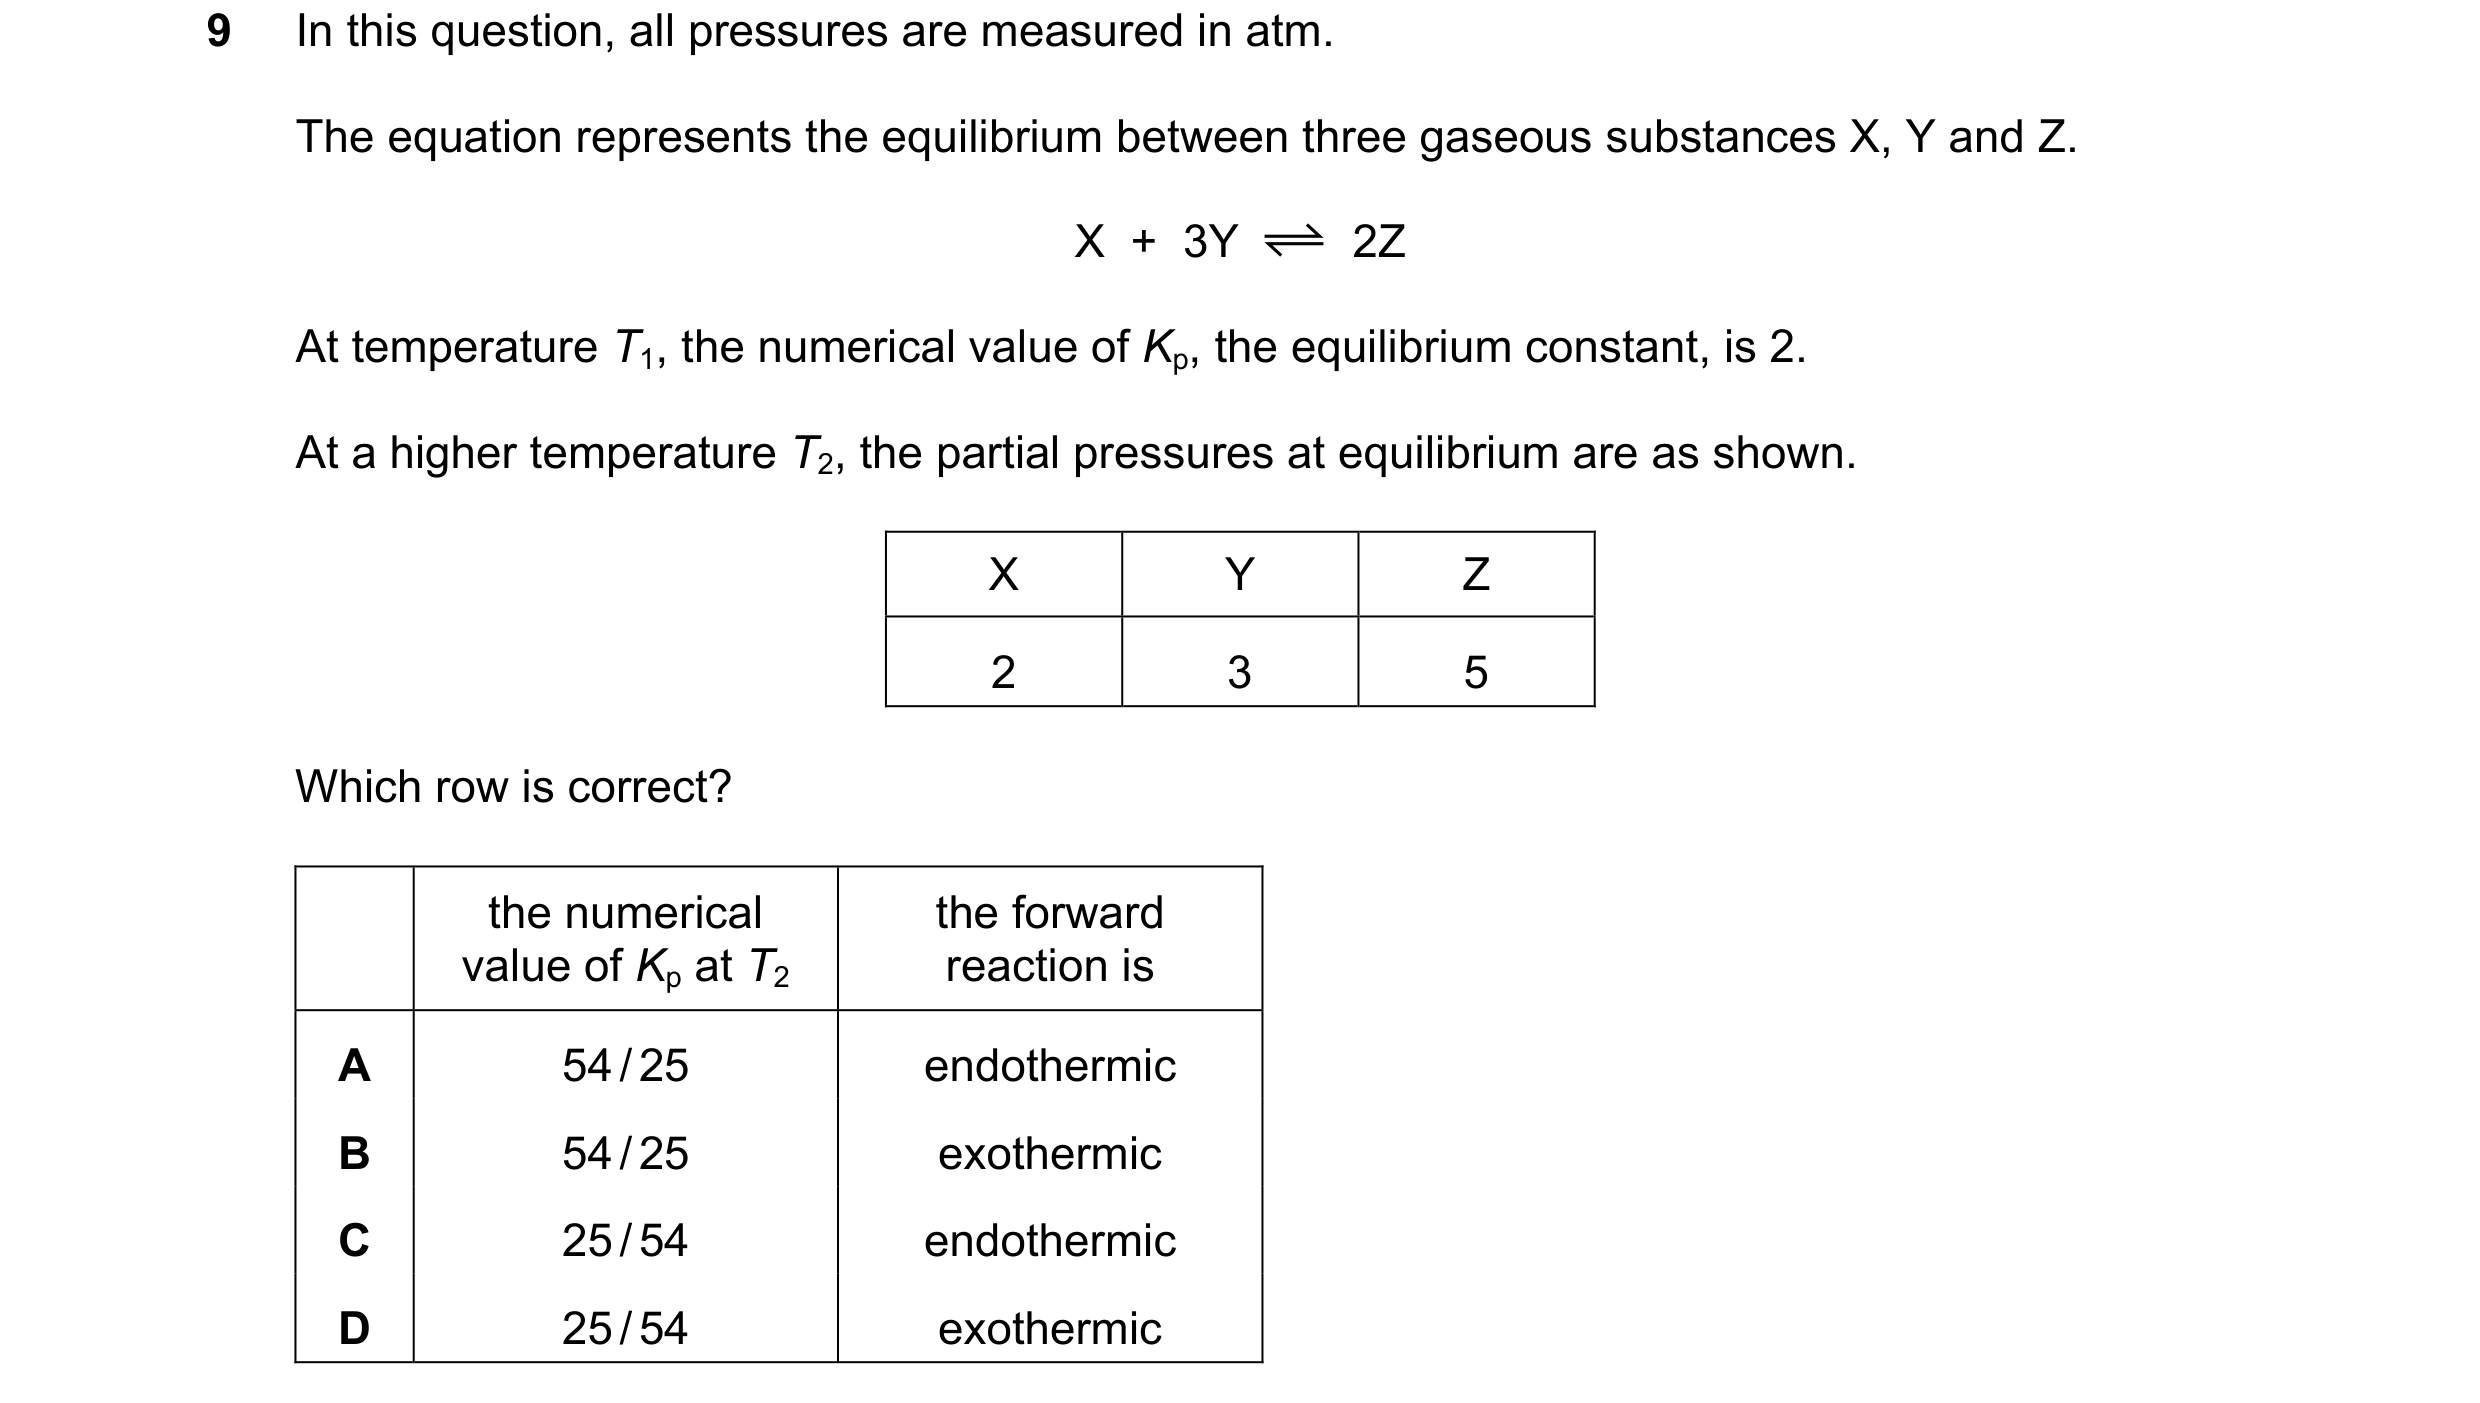
 38 / 67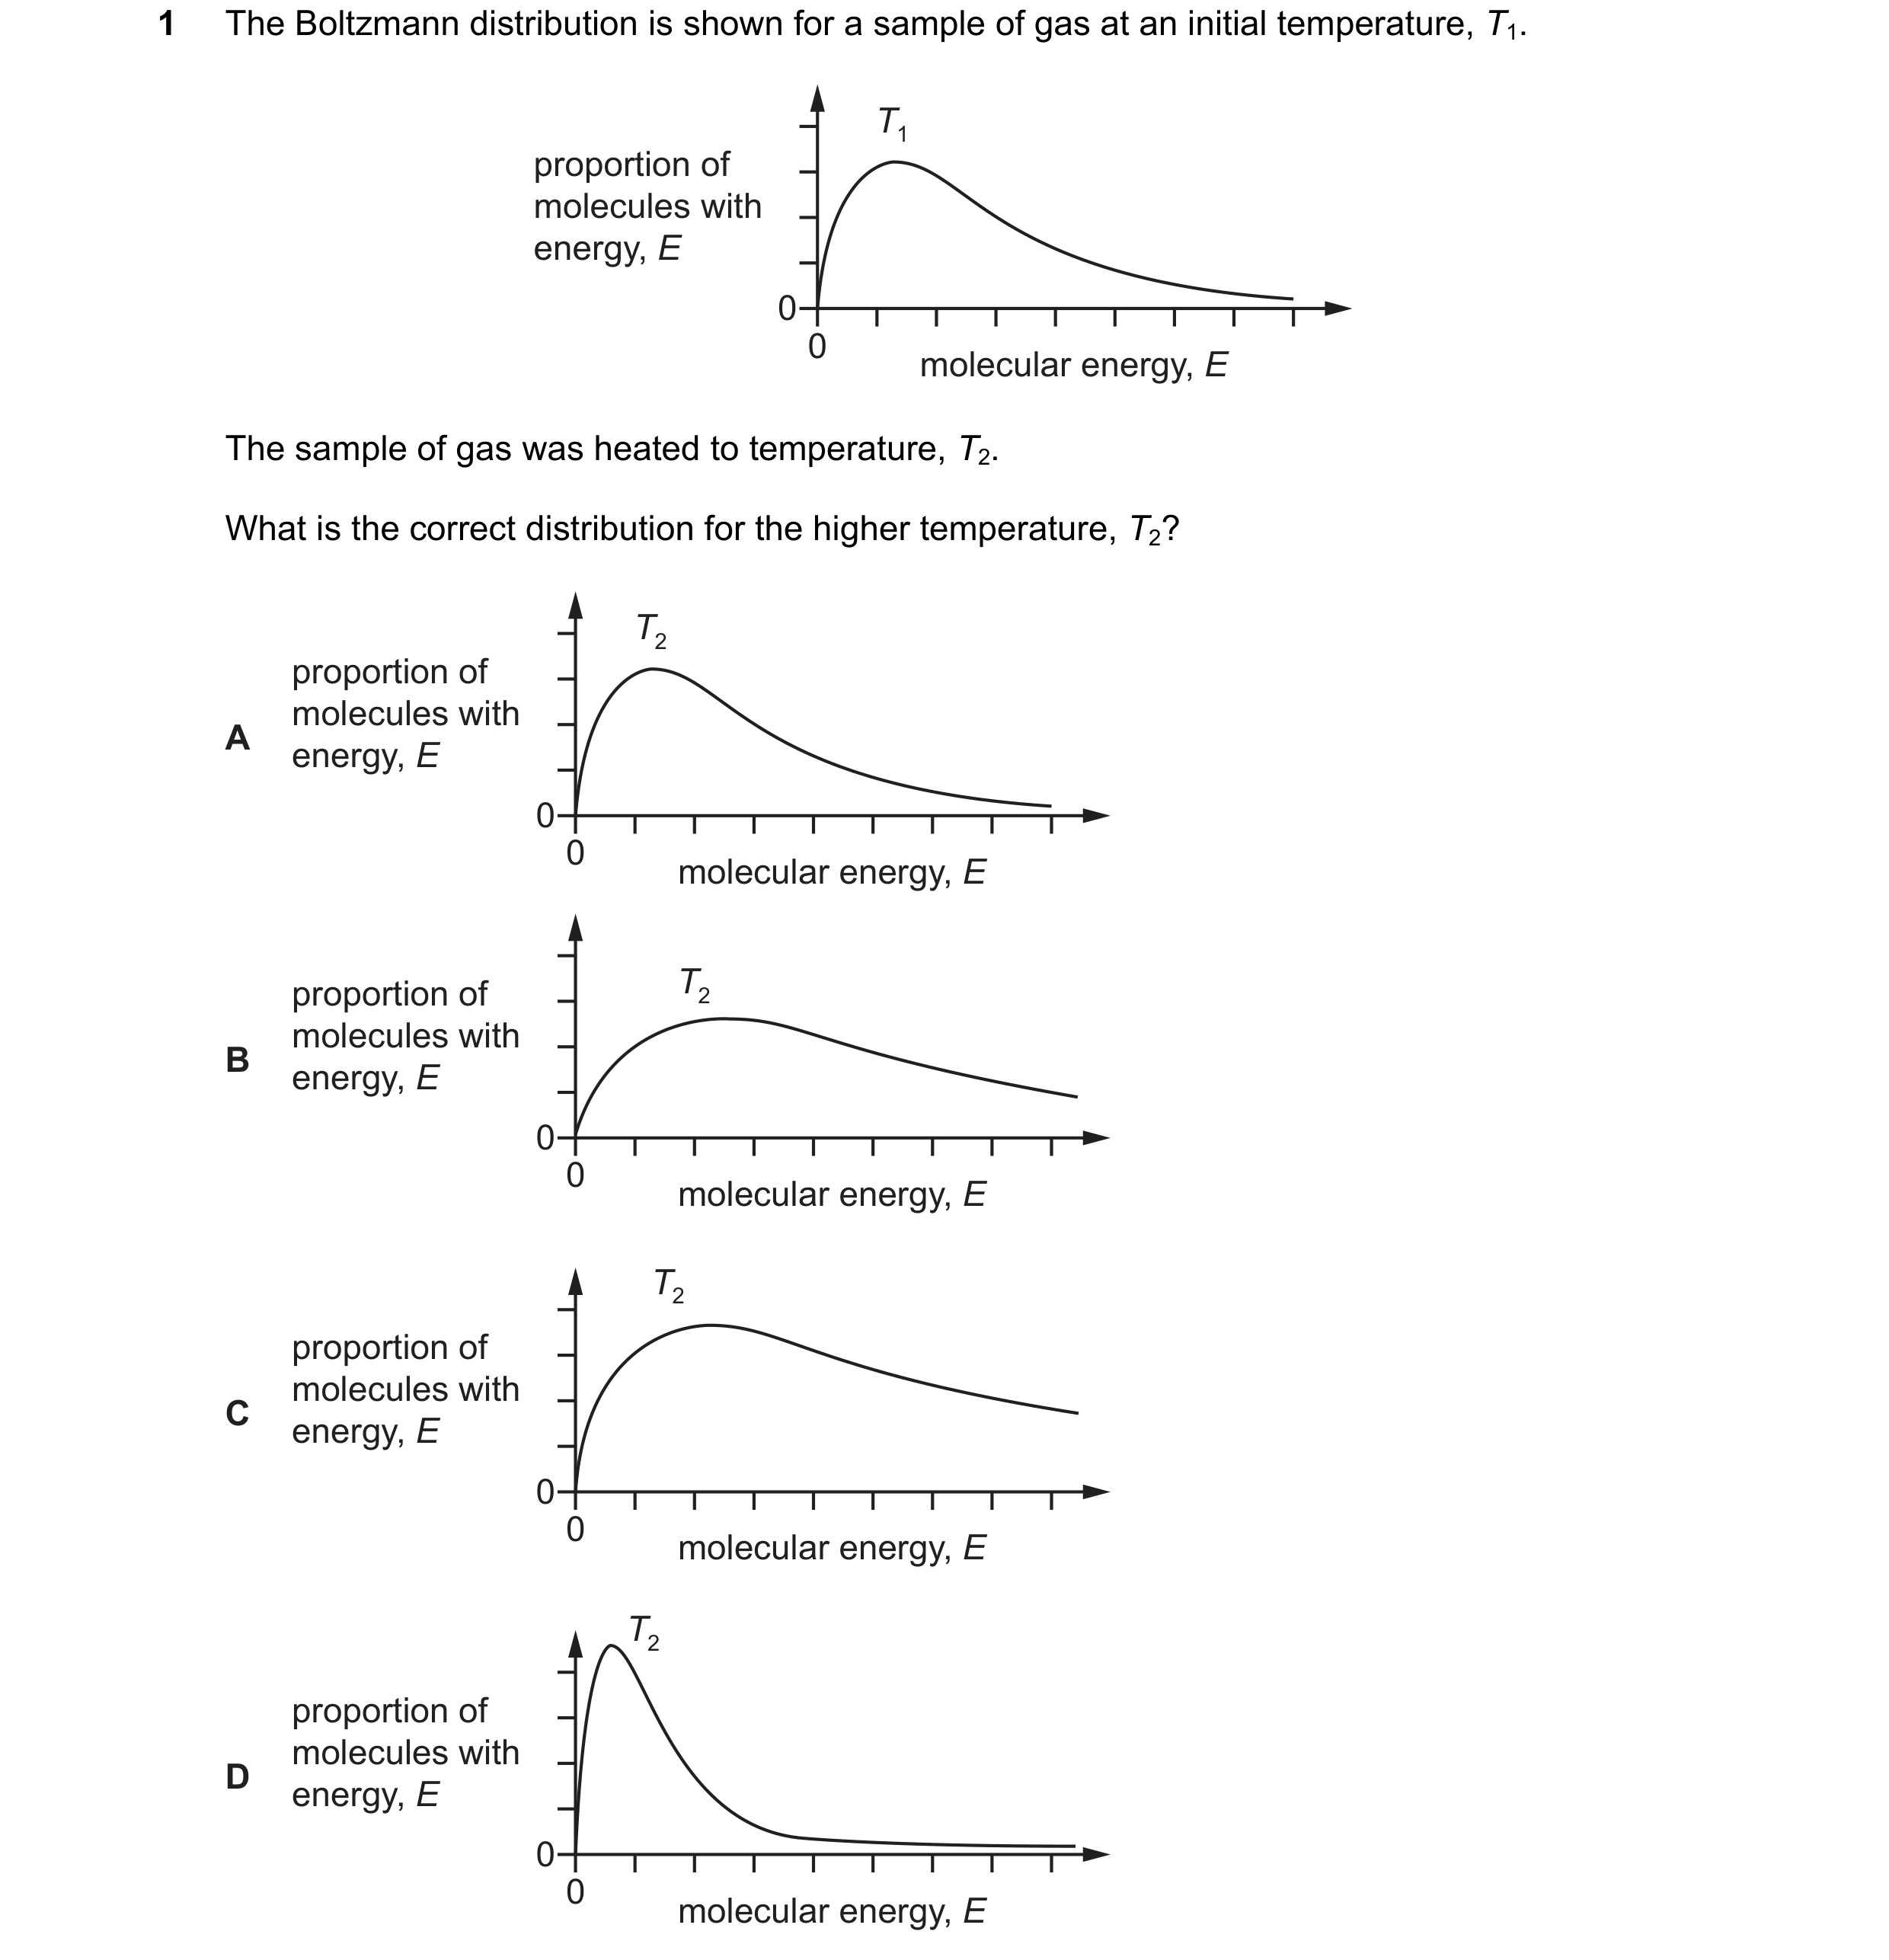
 39 / 67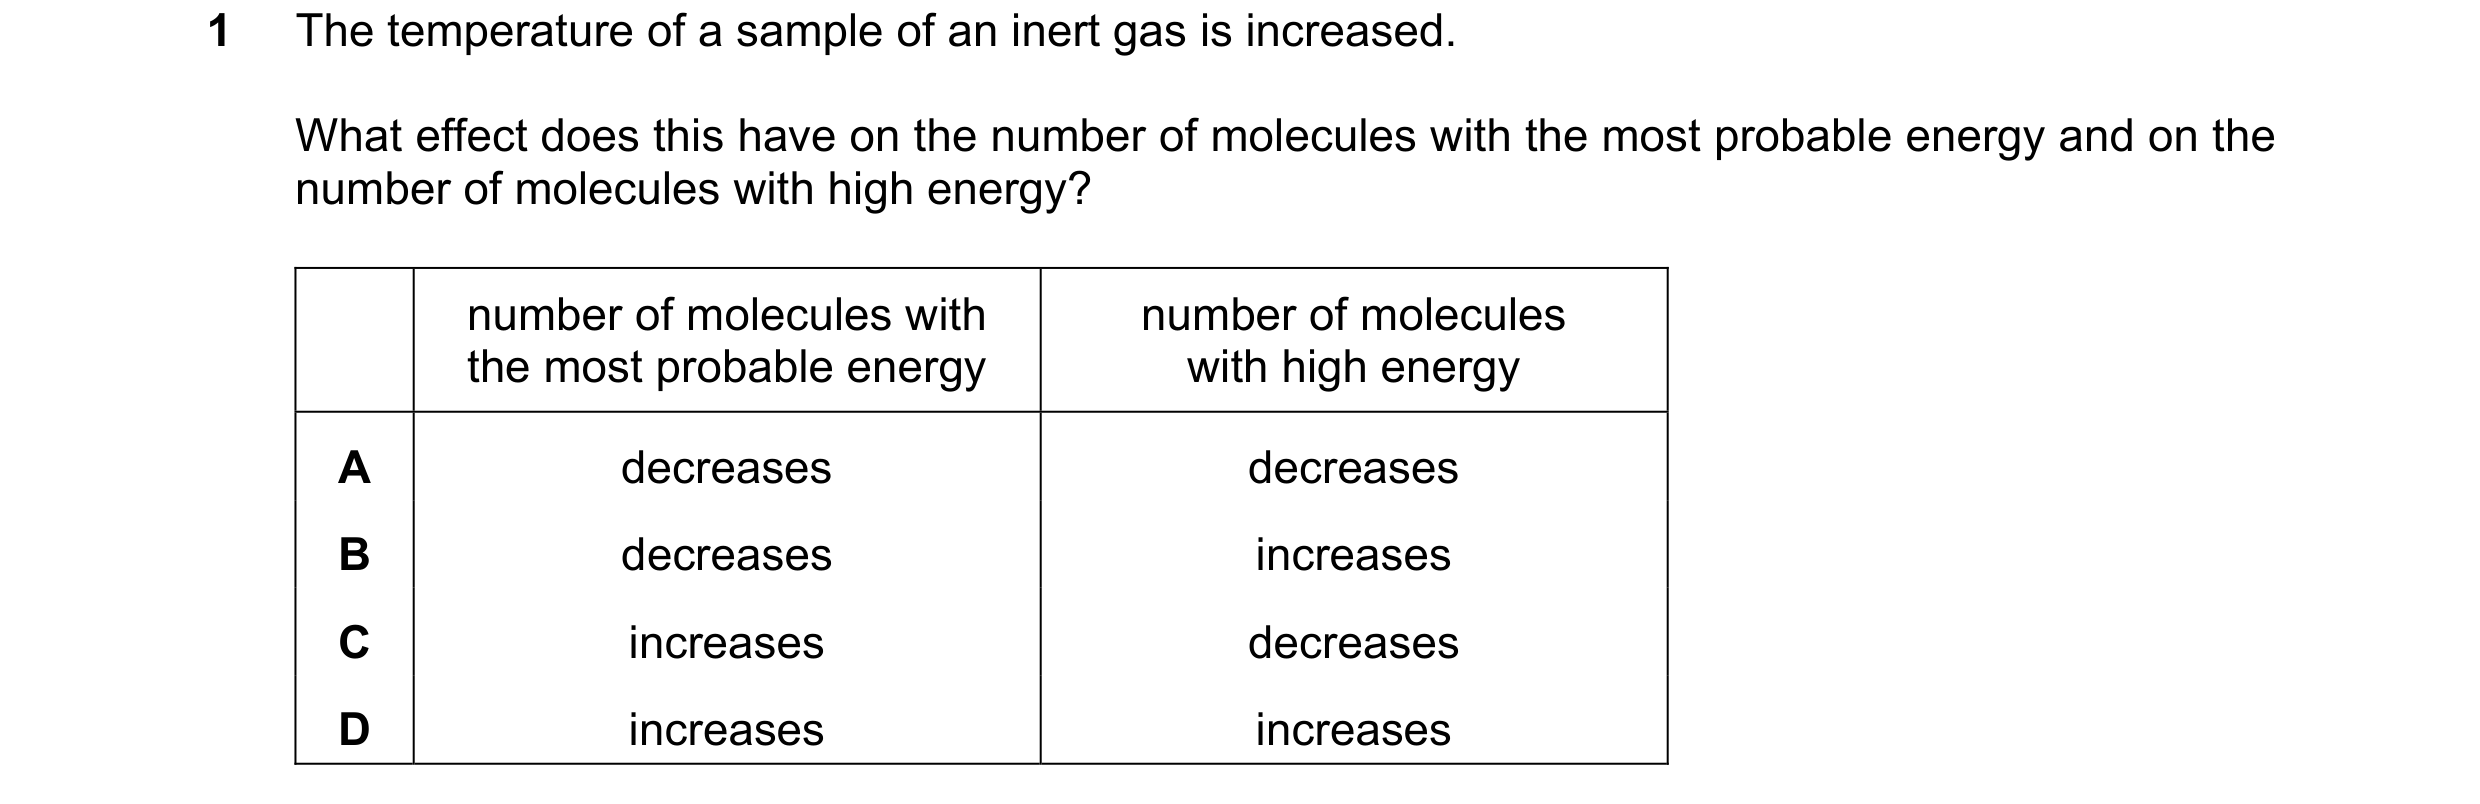
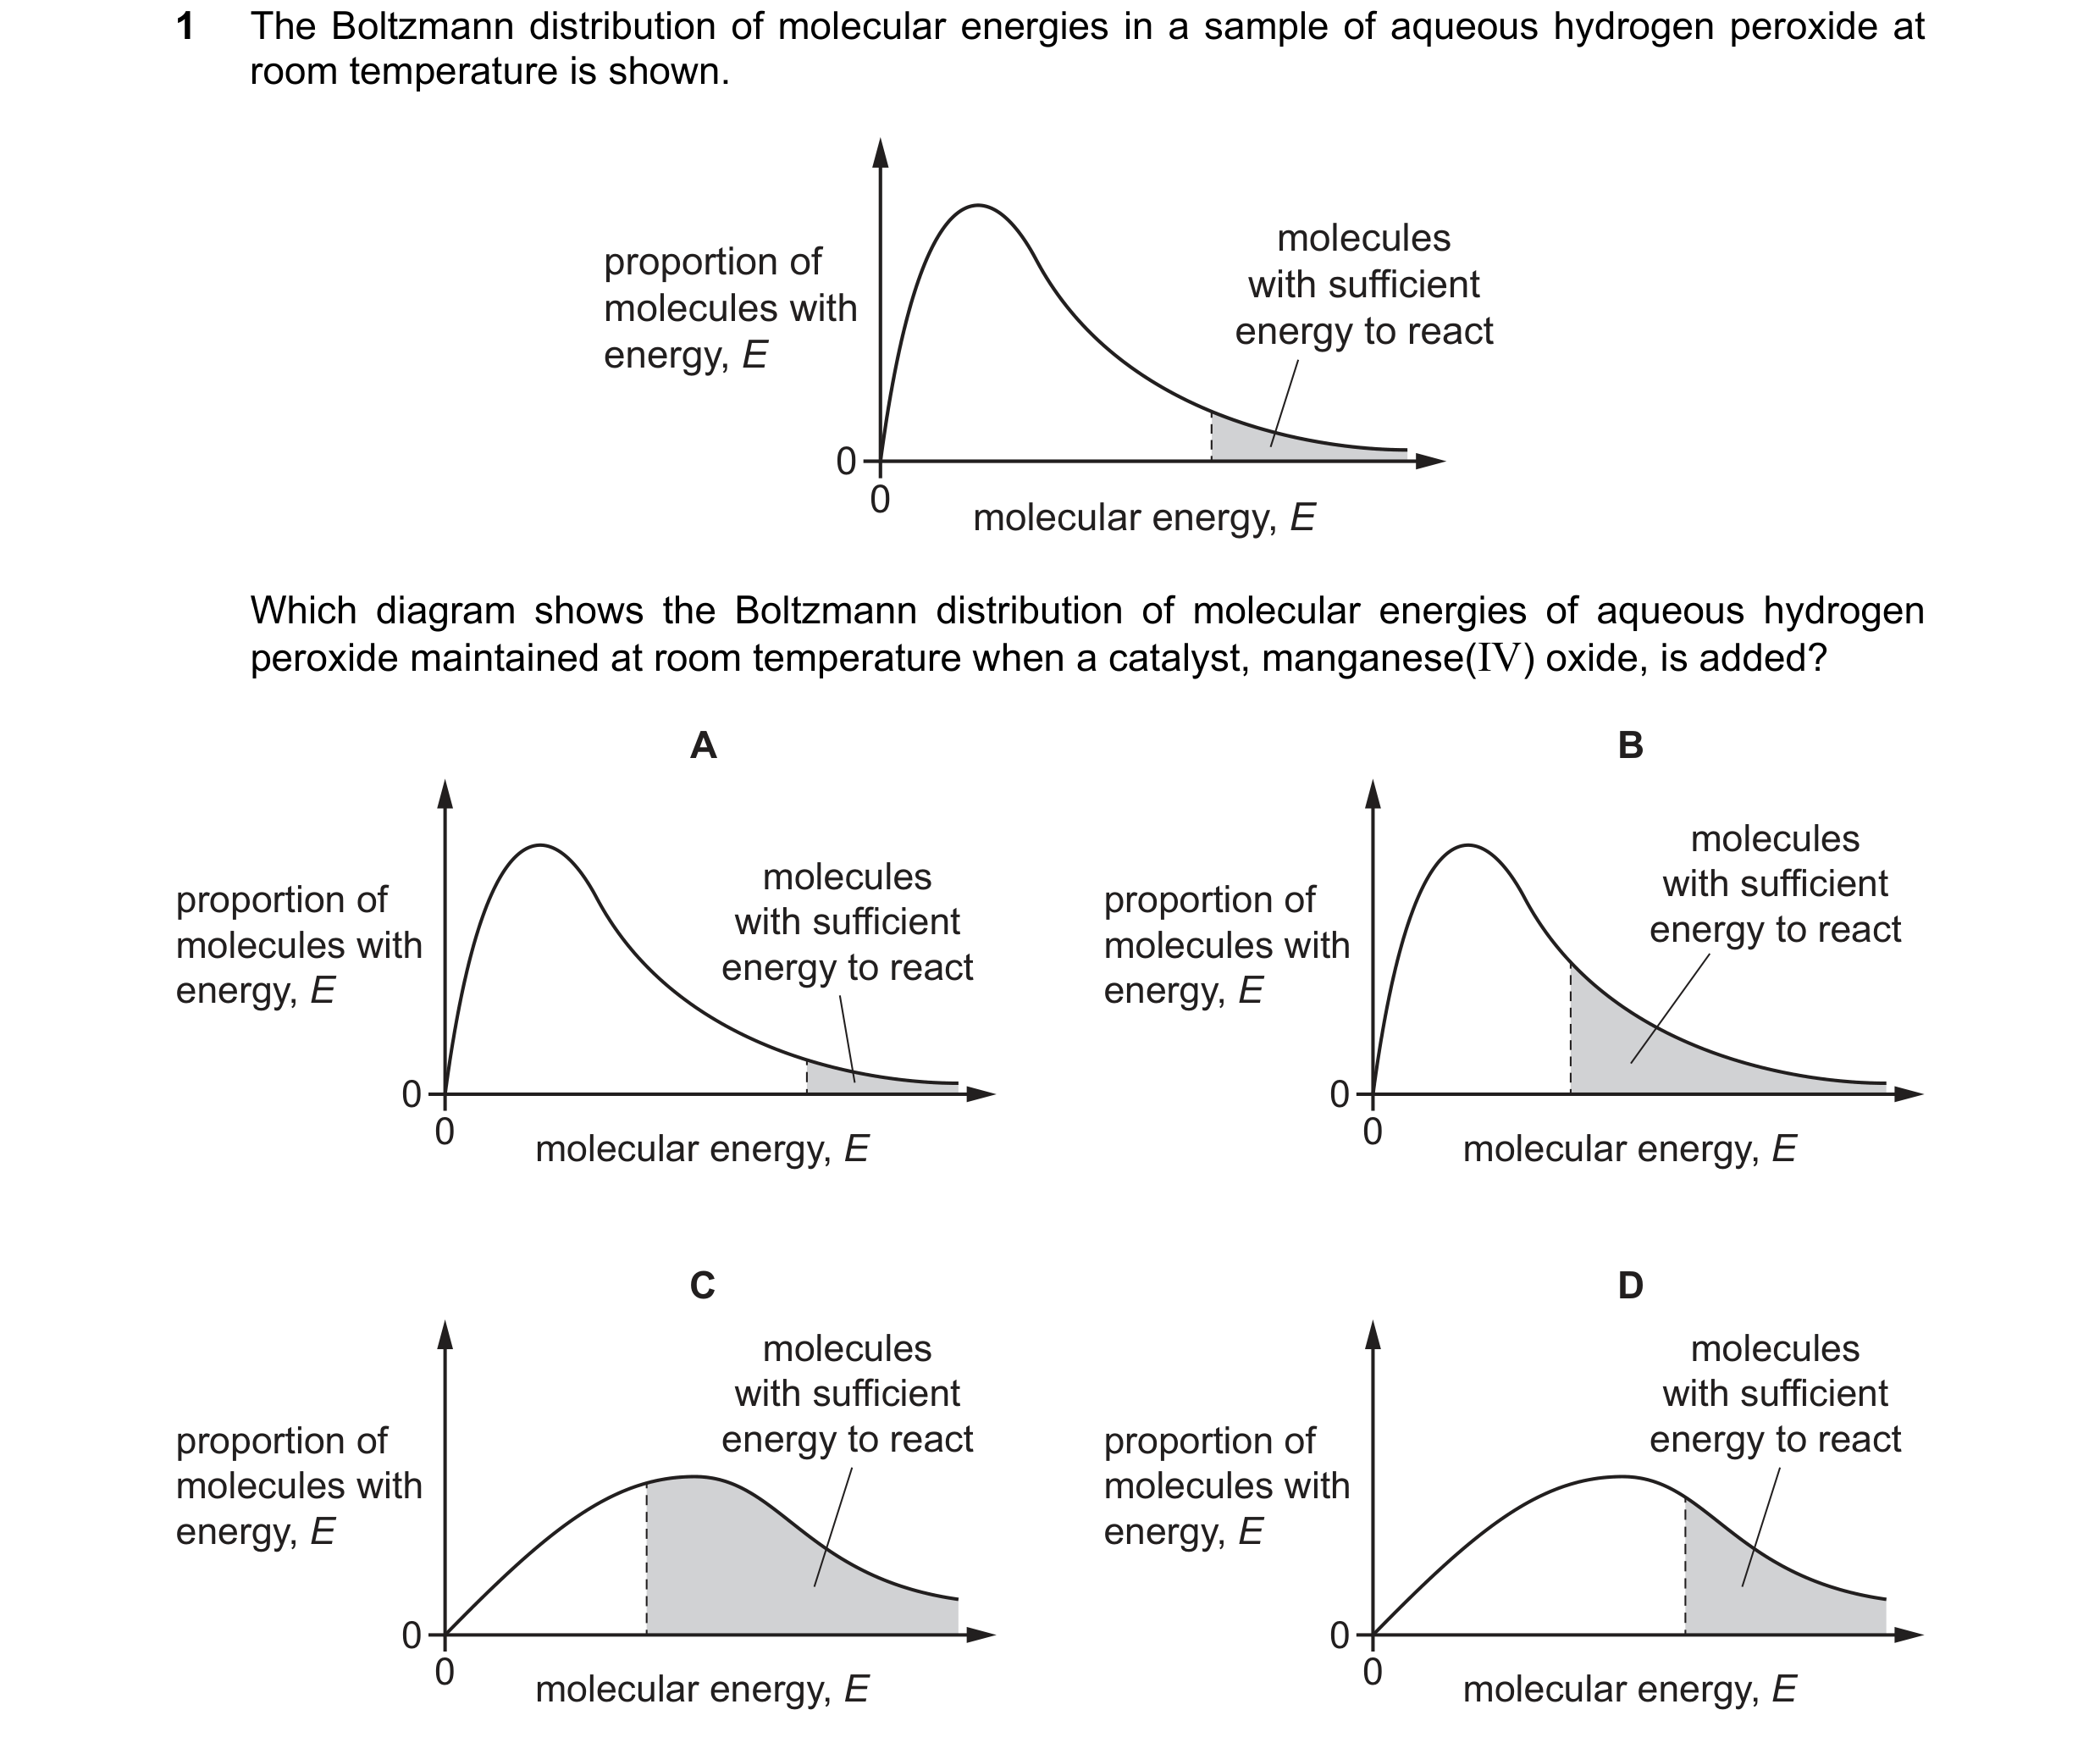 40 / 67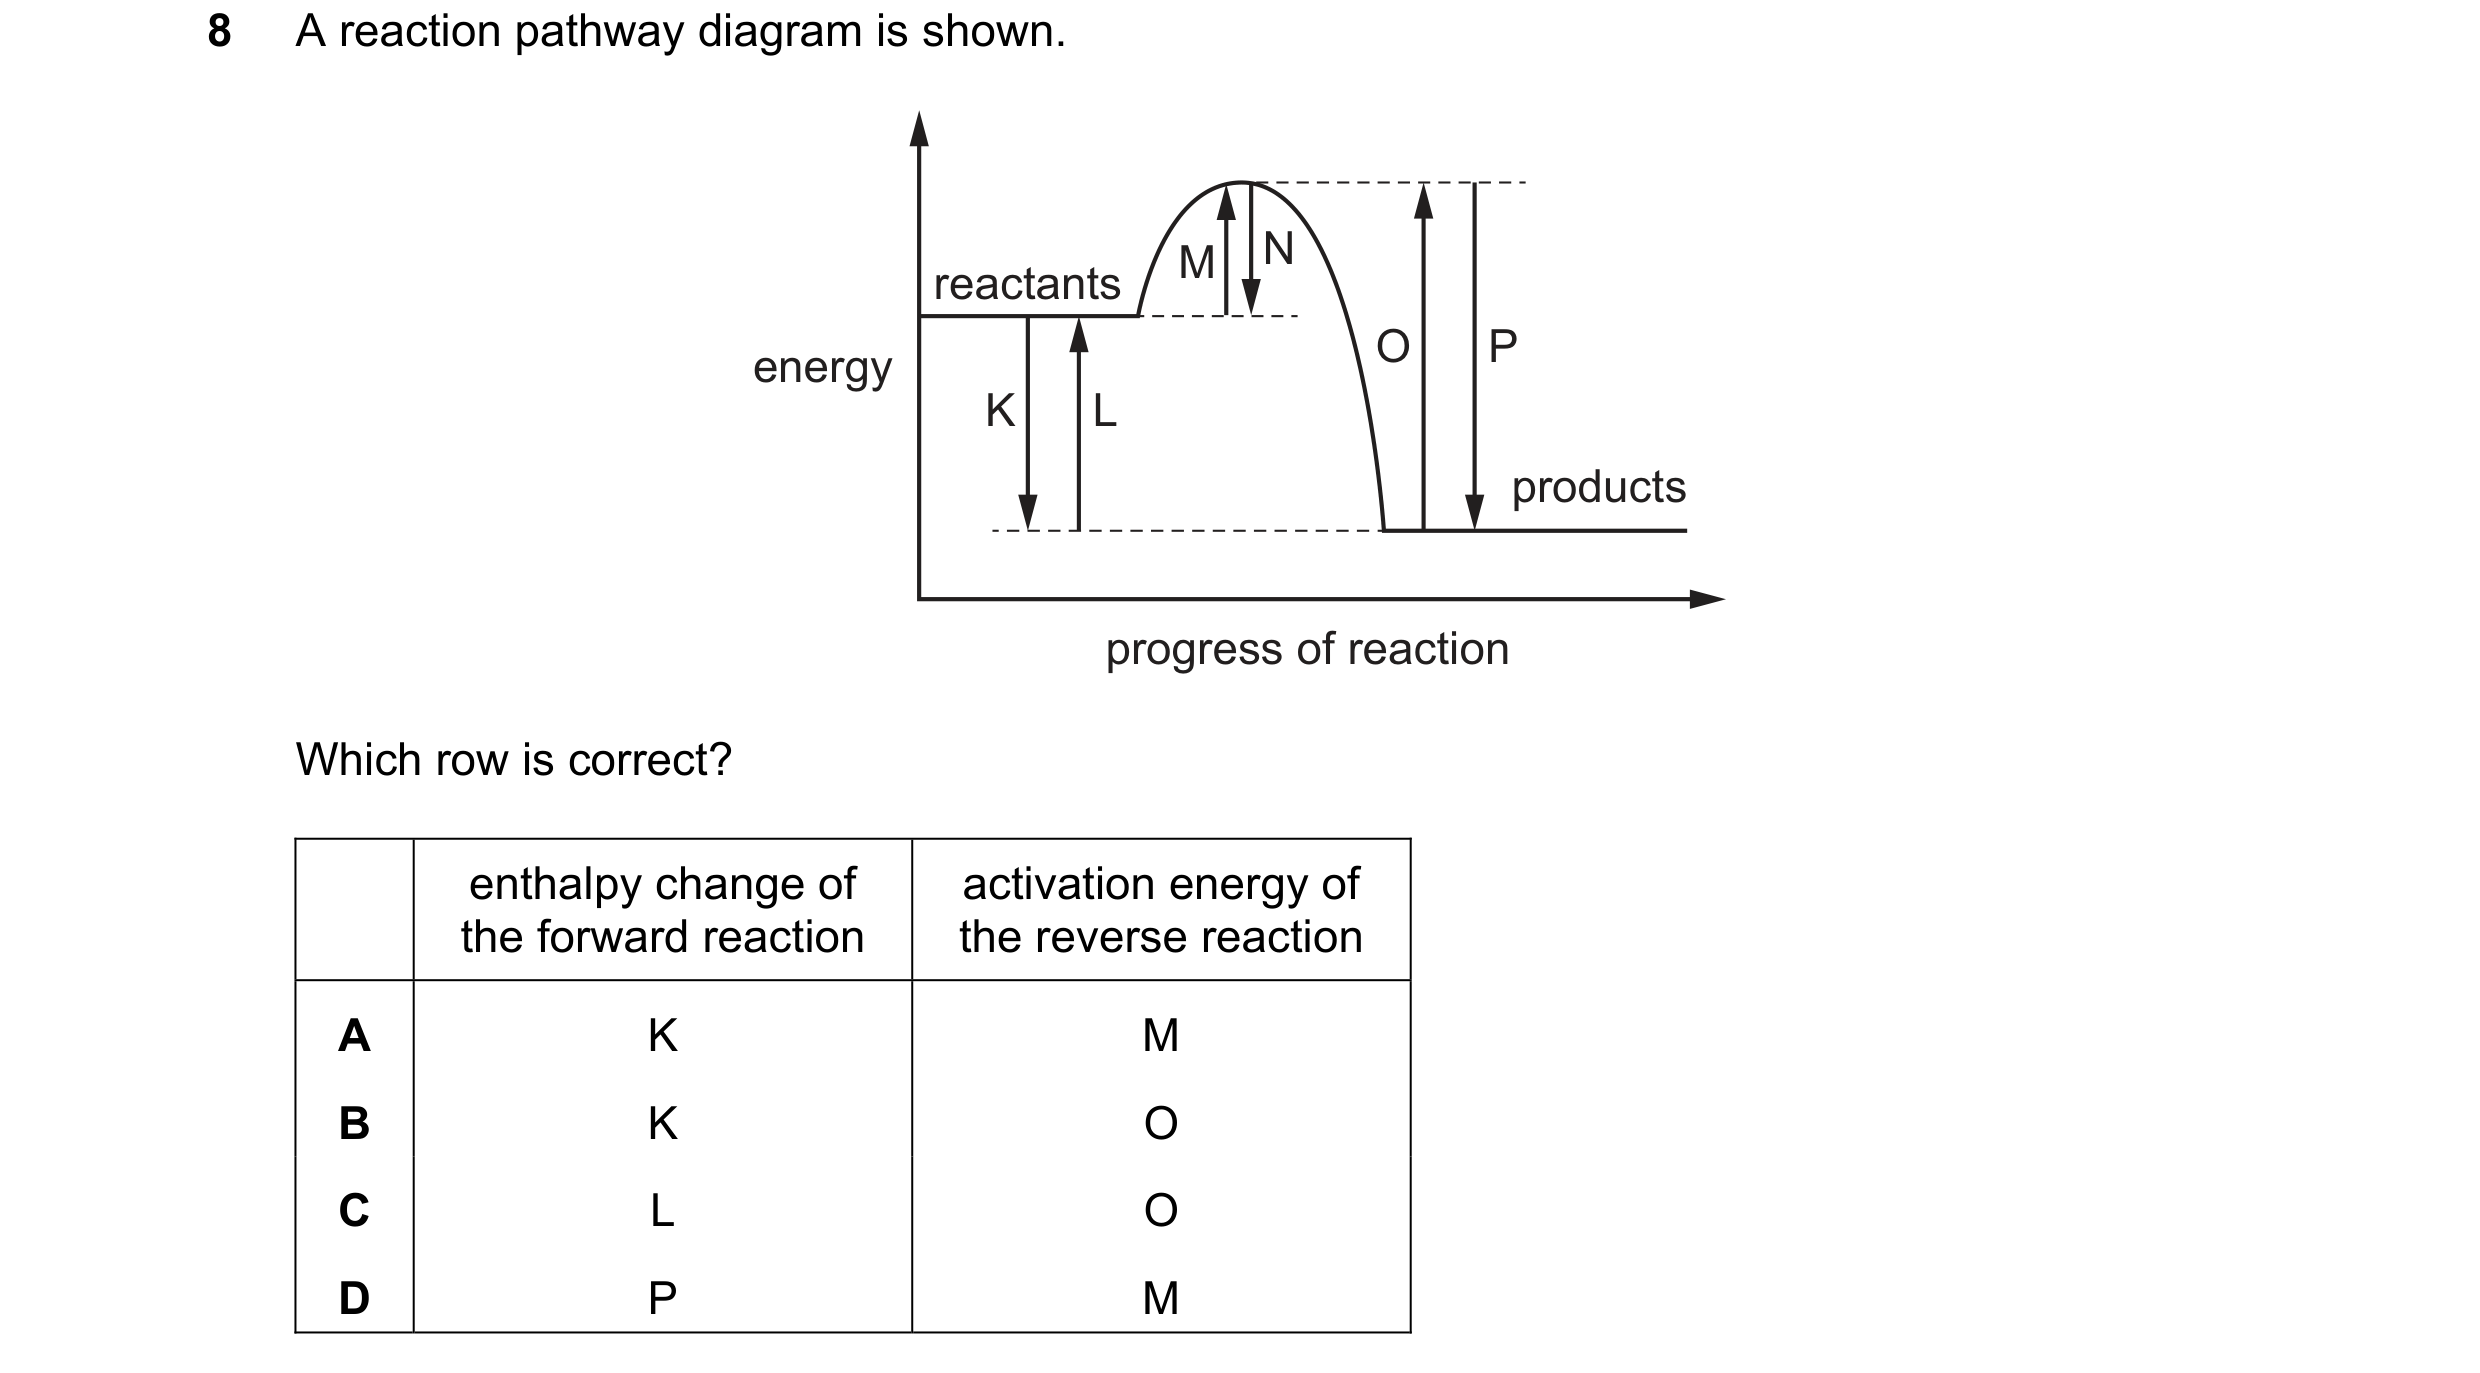
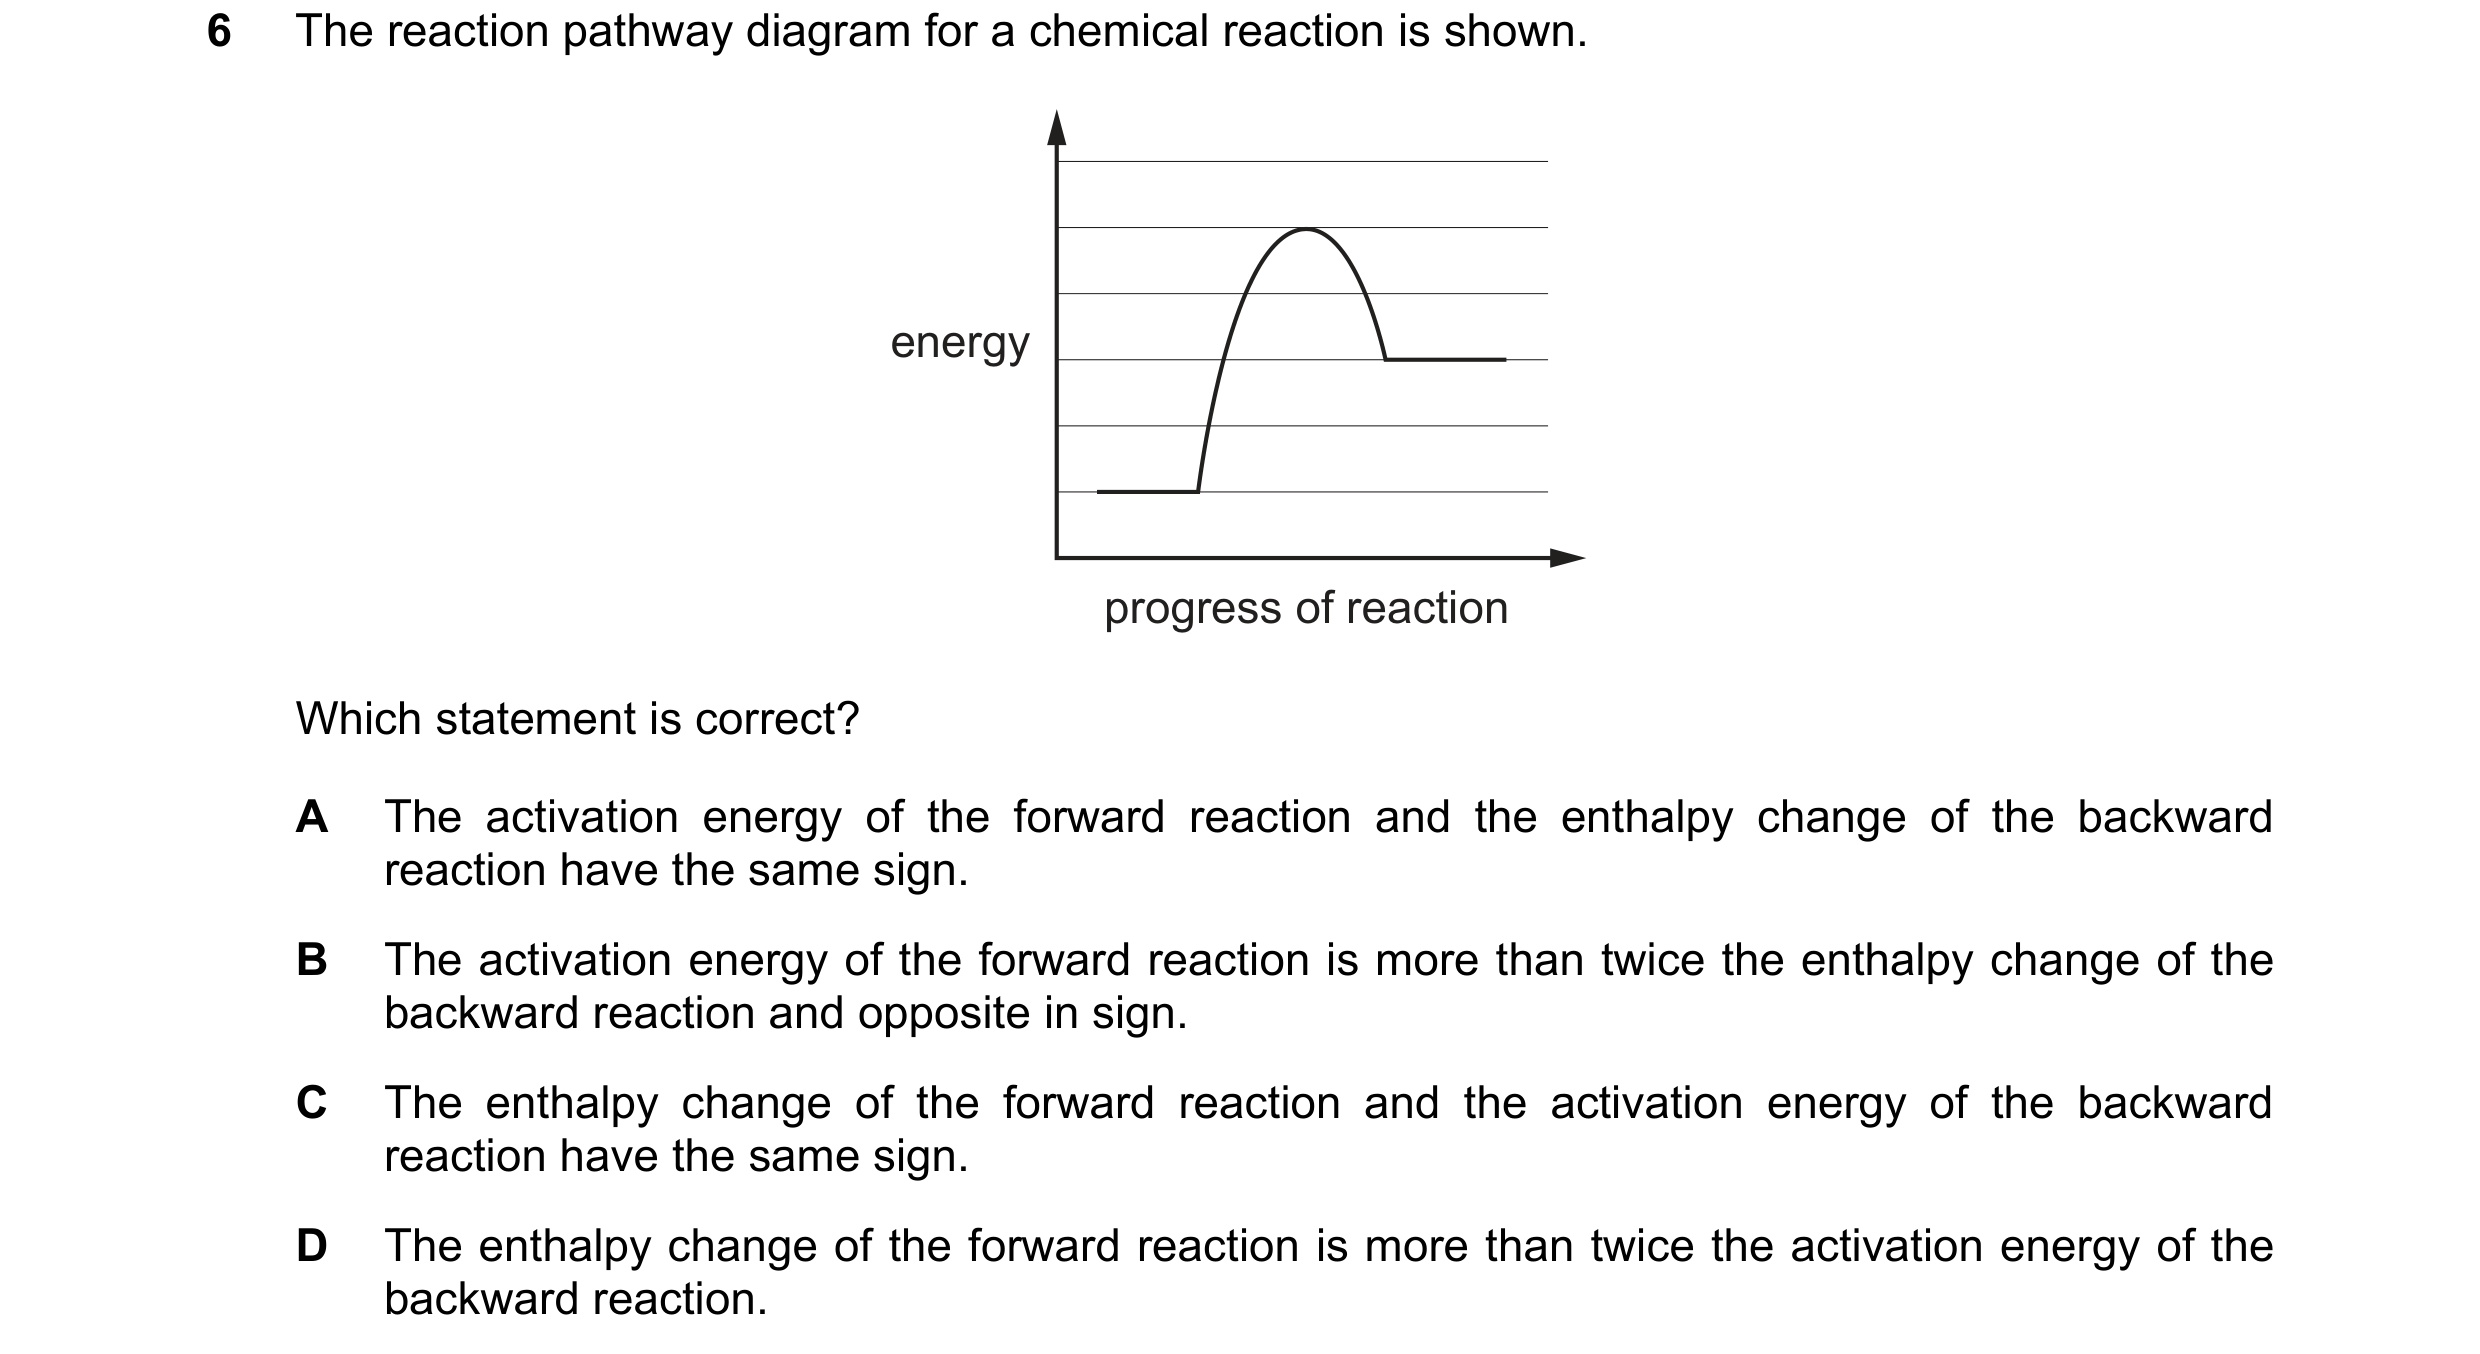 41 / 67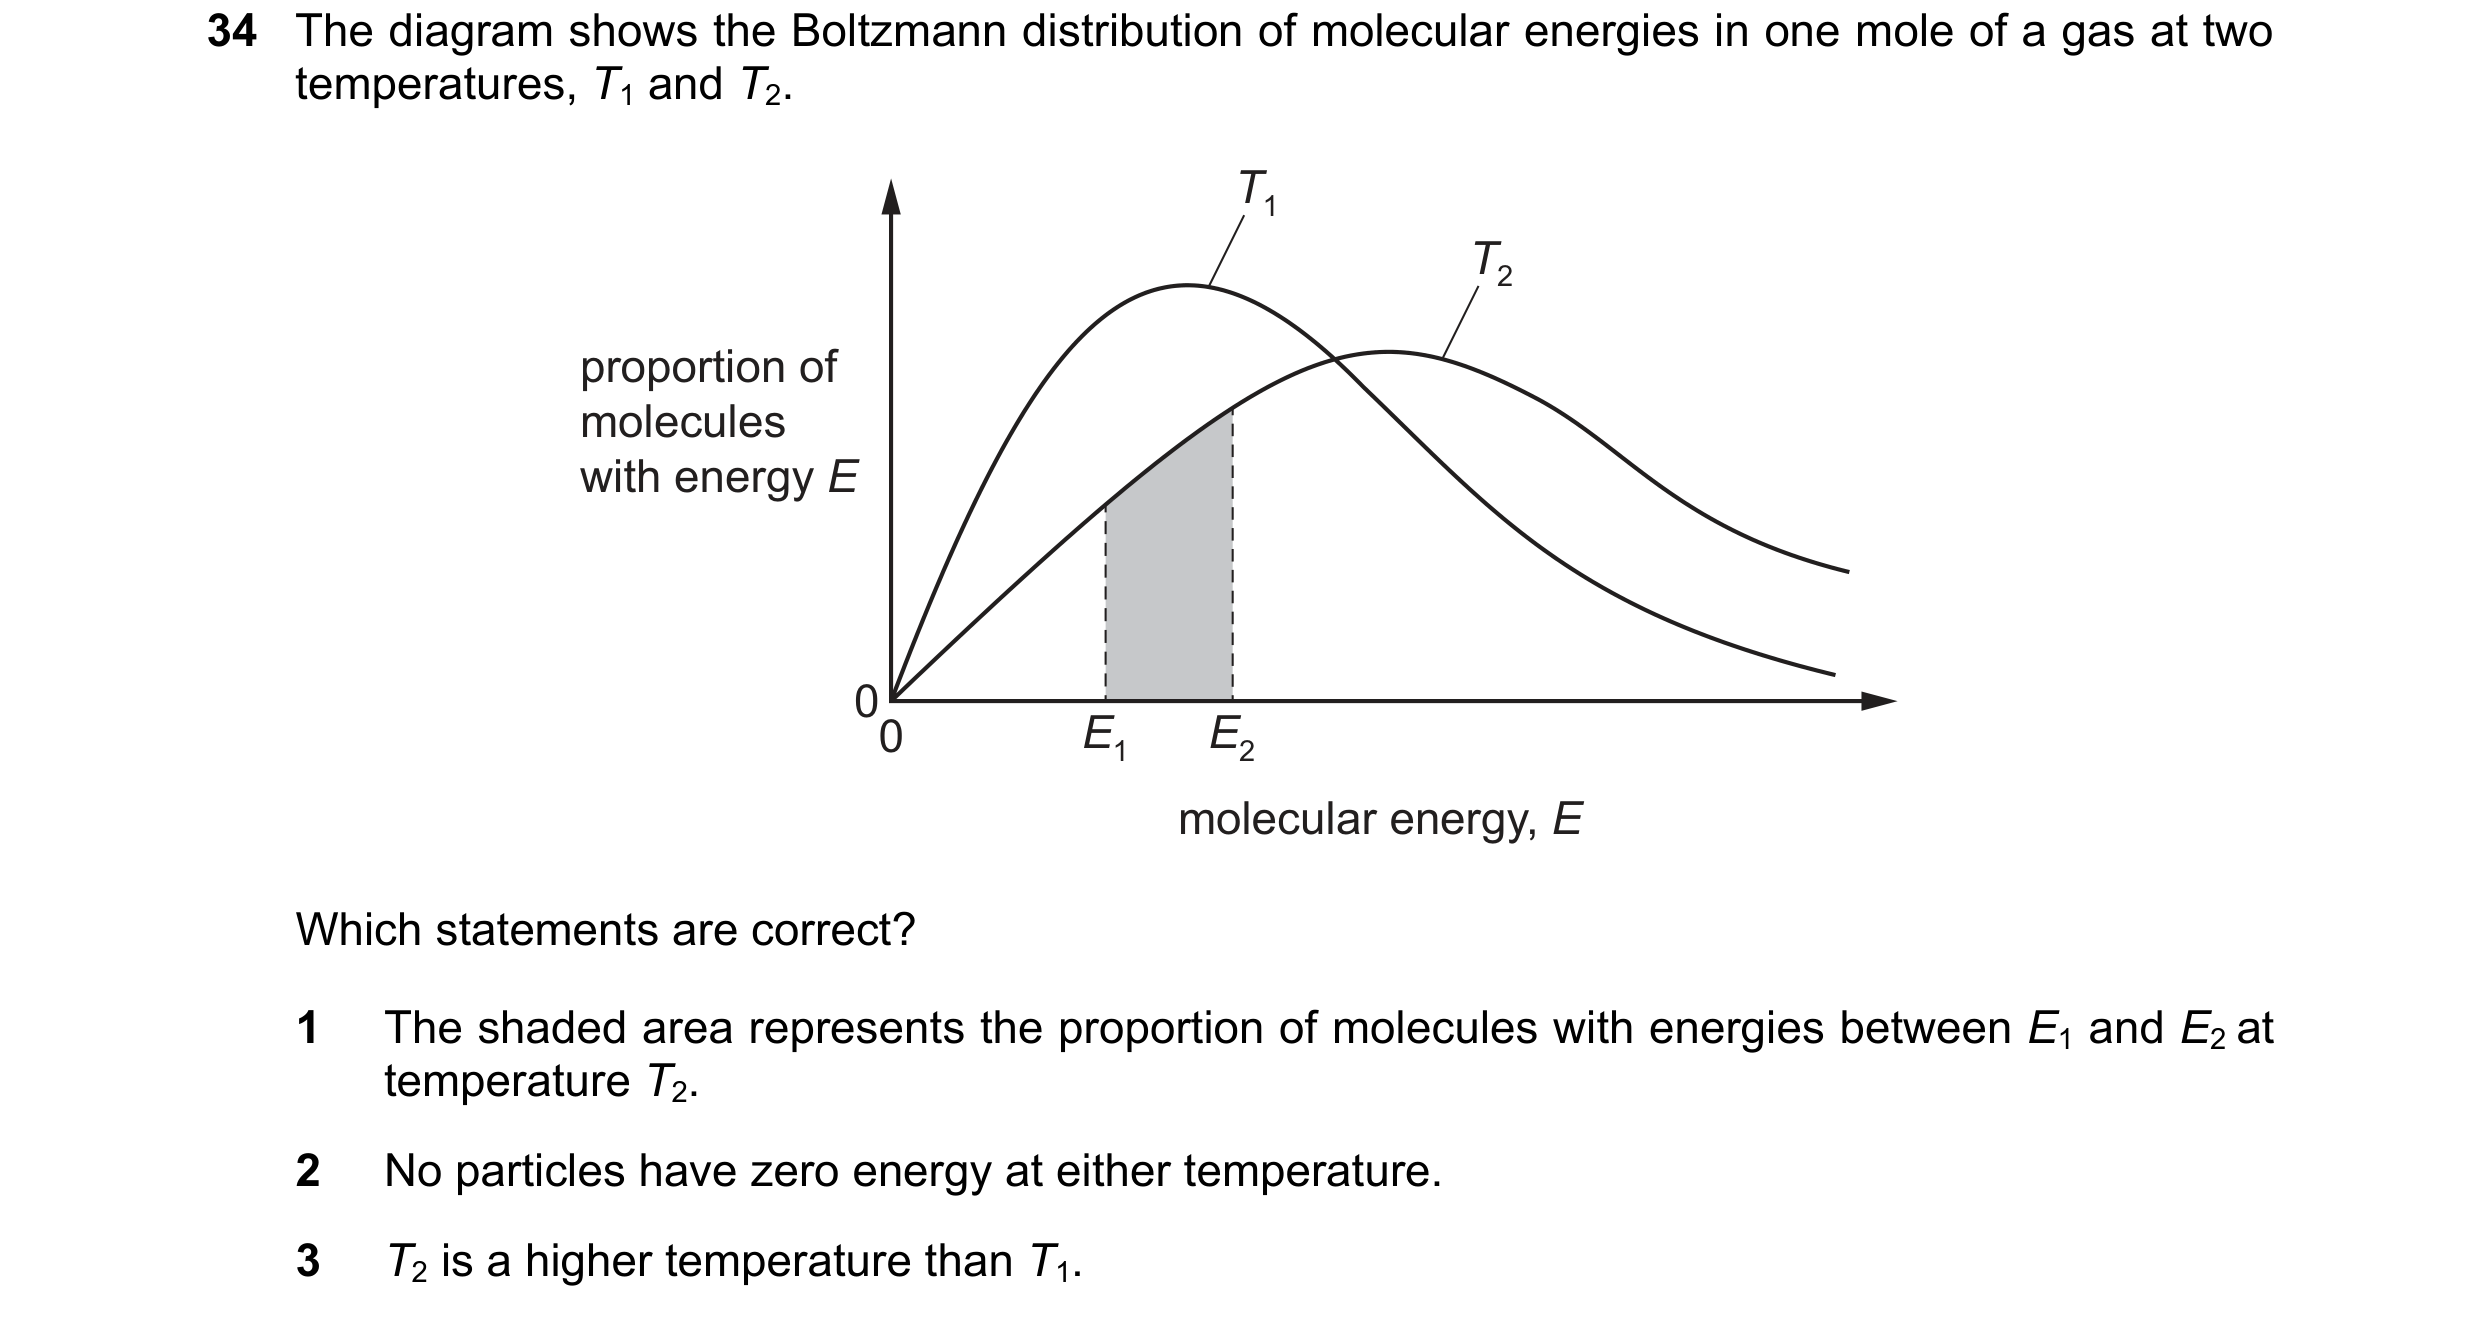
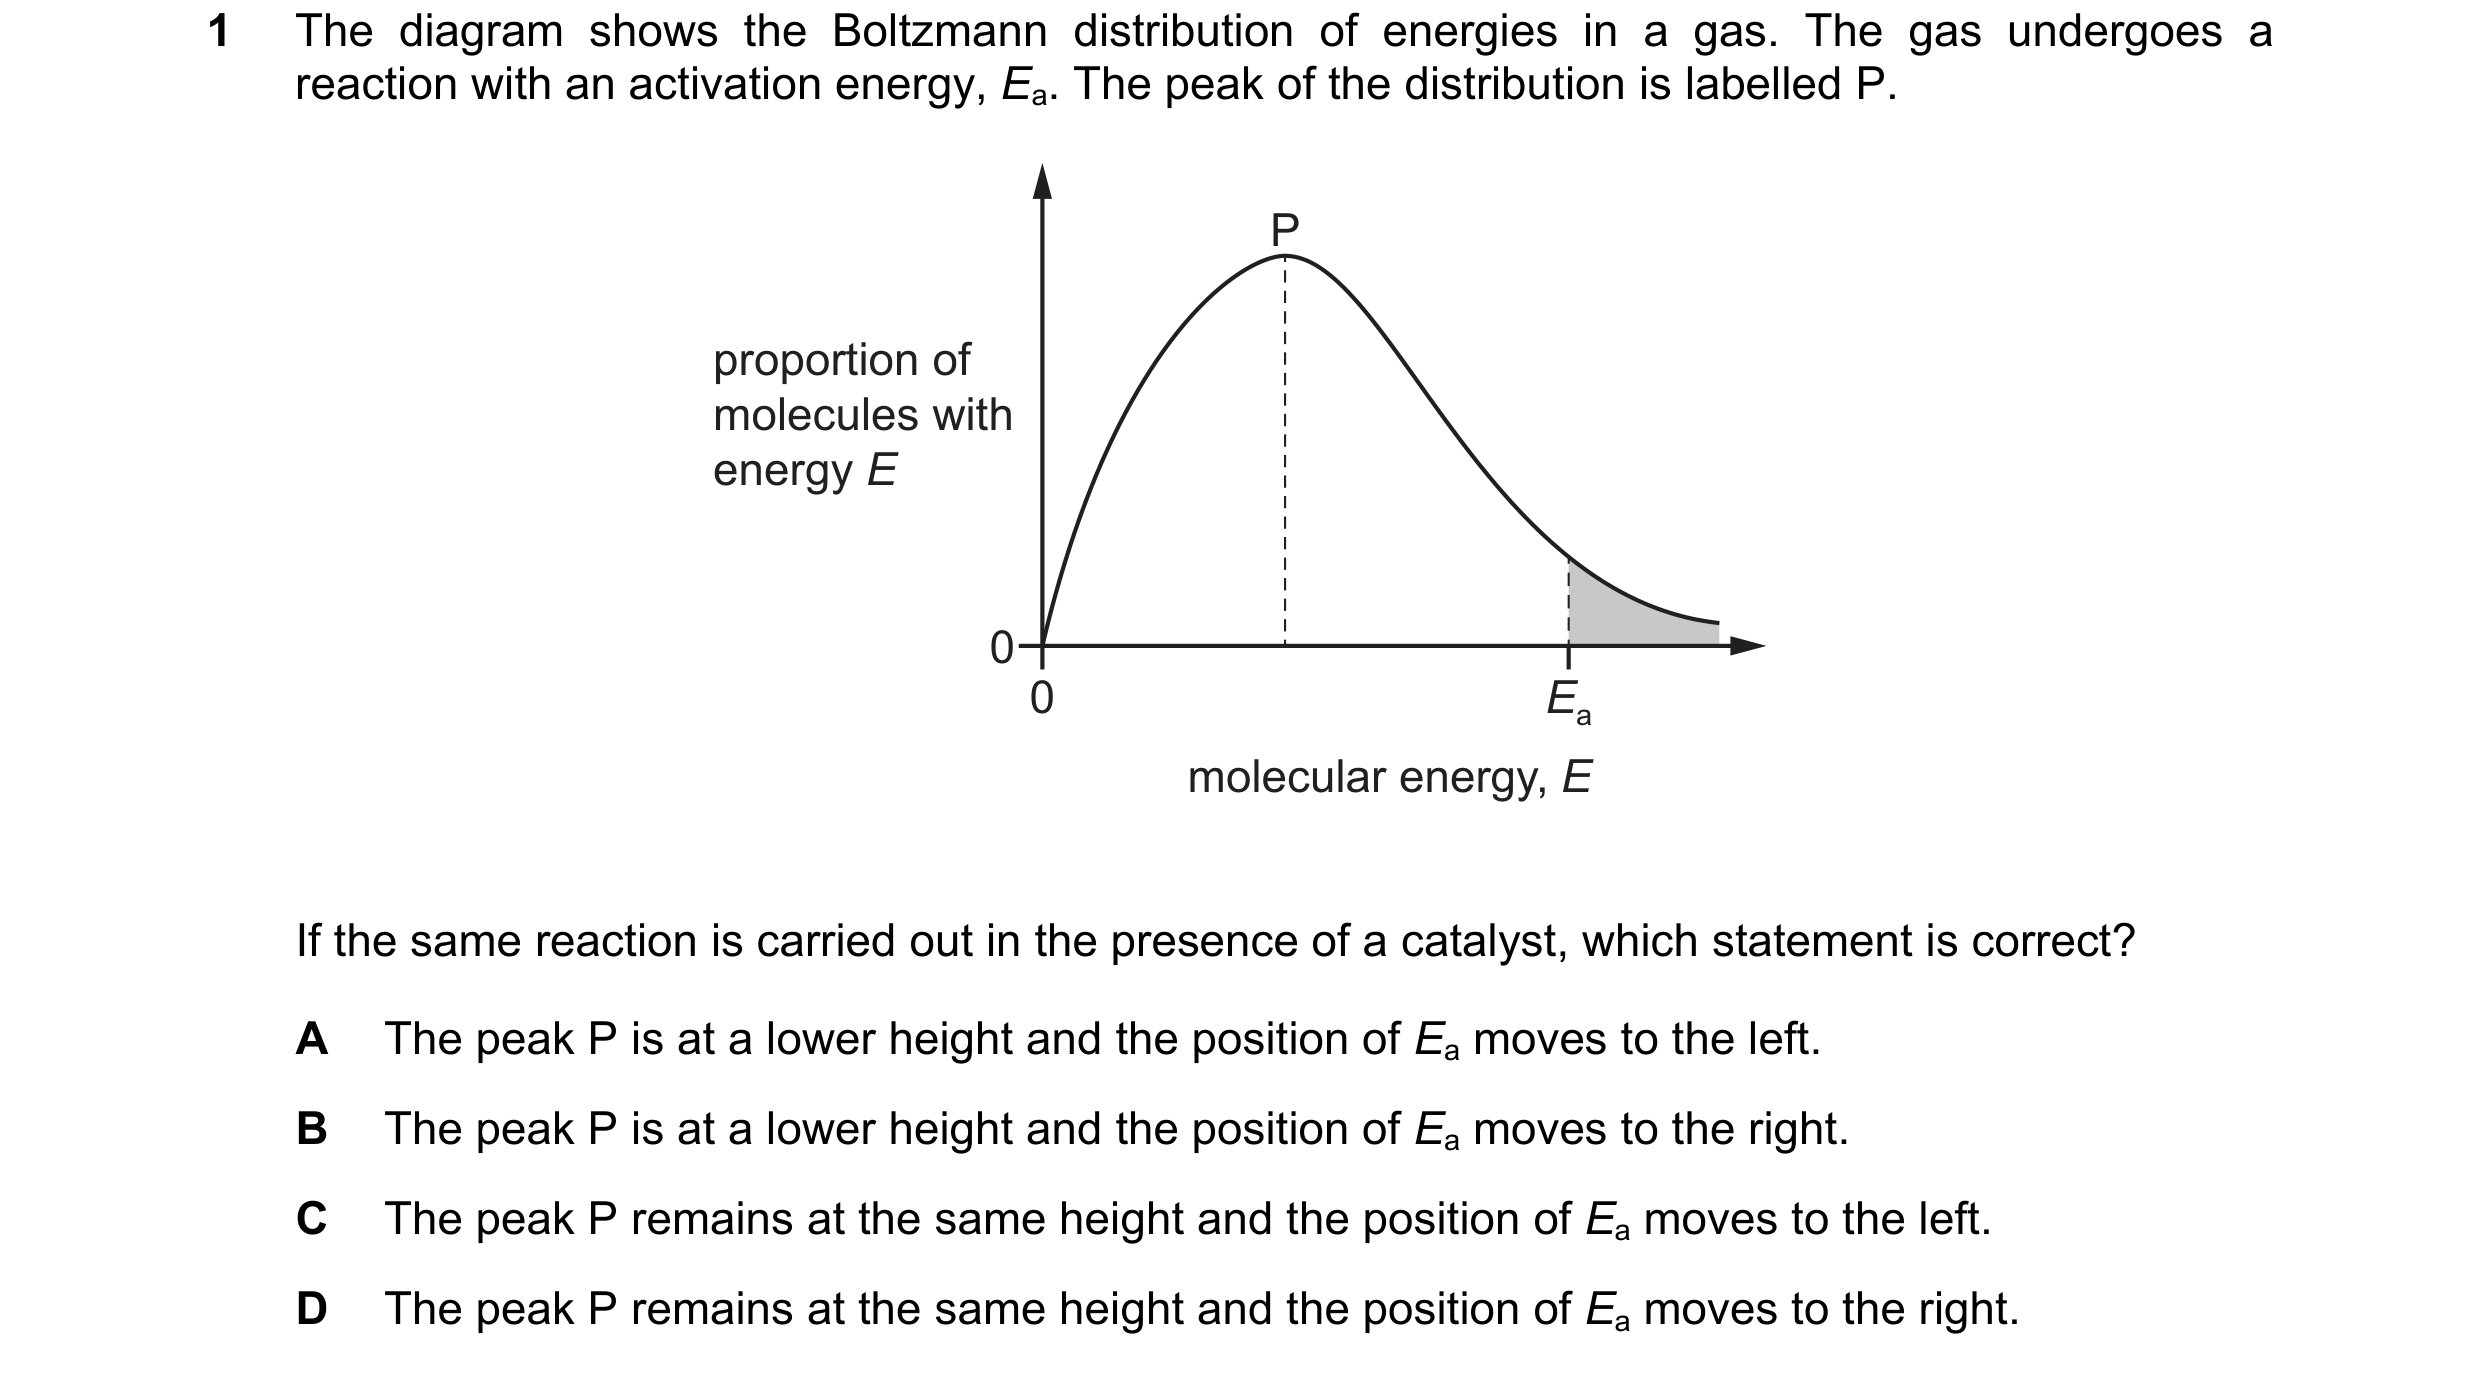 42 / 67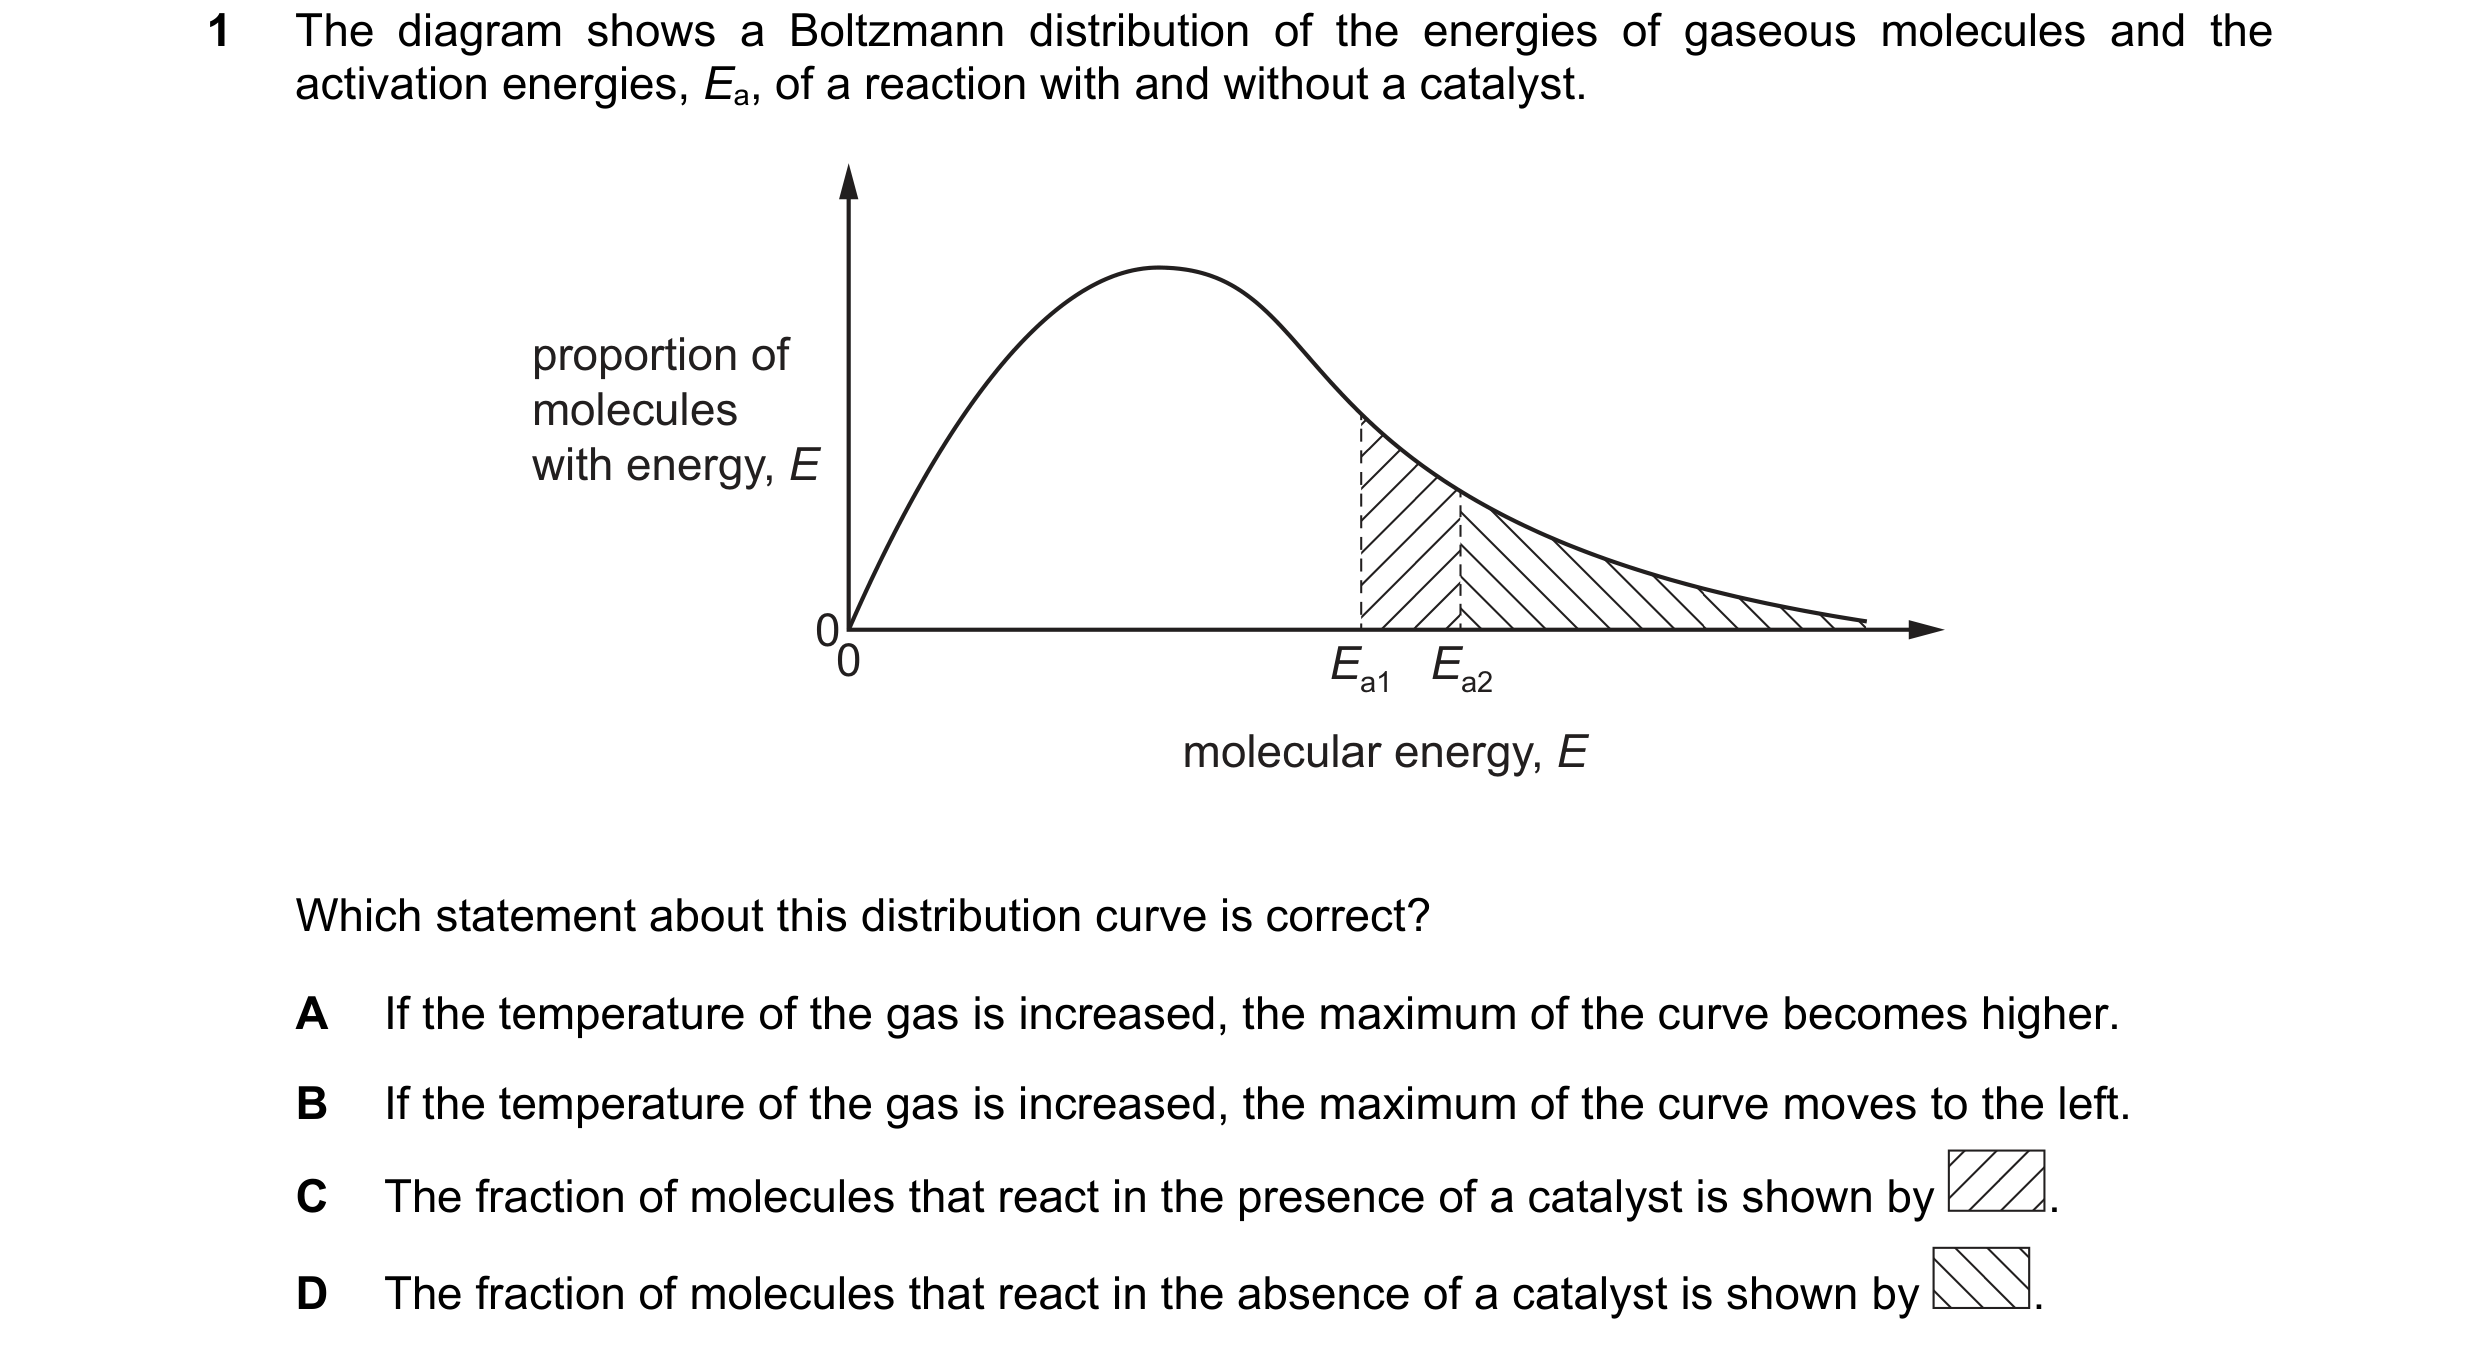
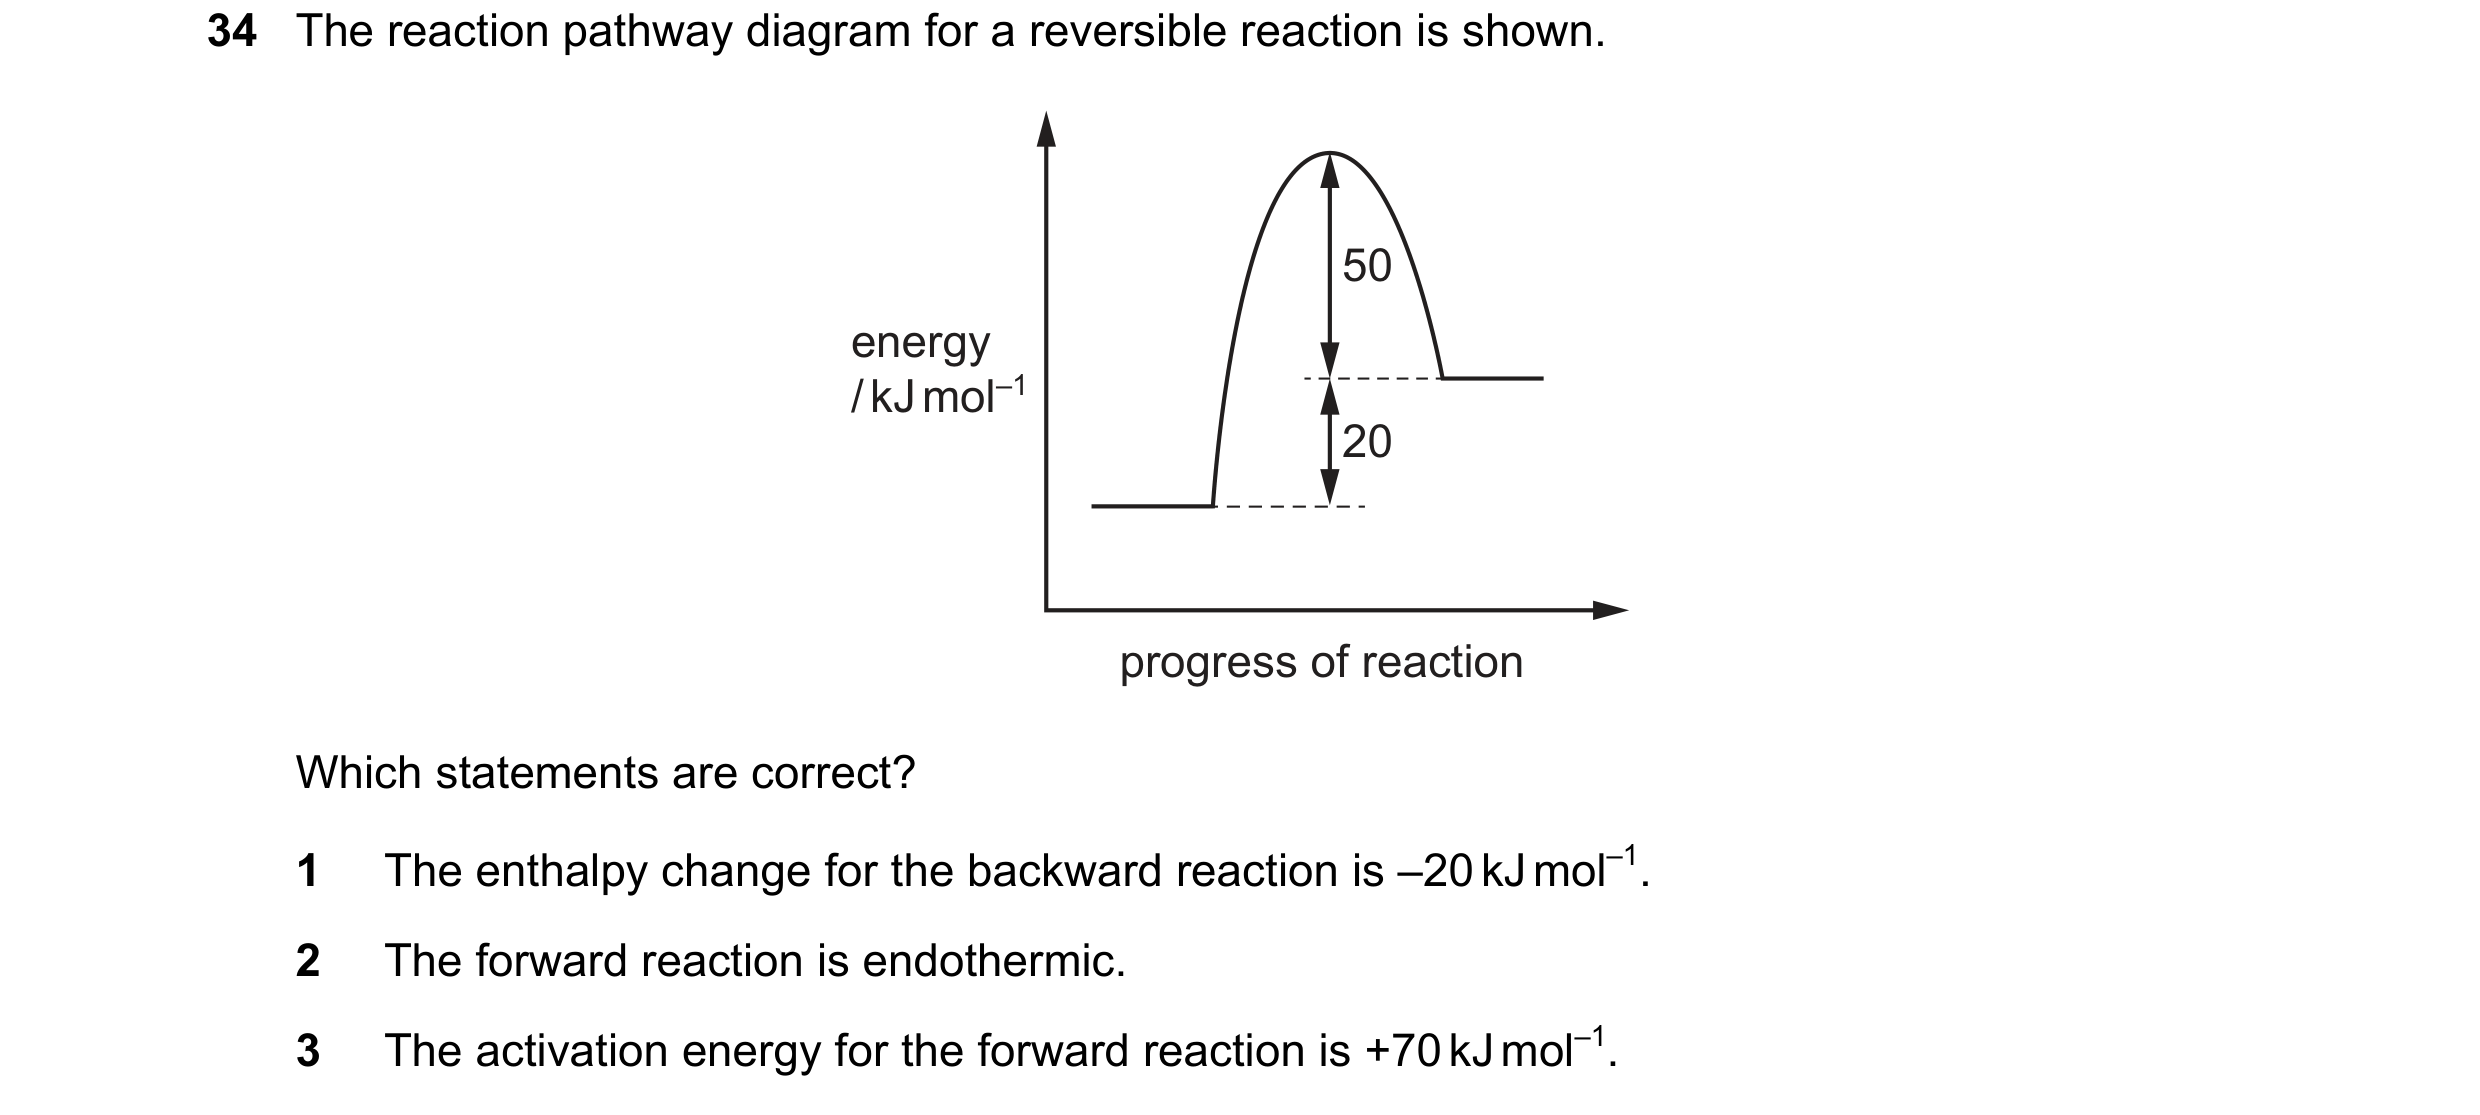 43 / 67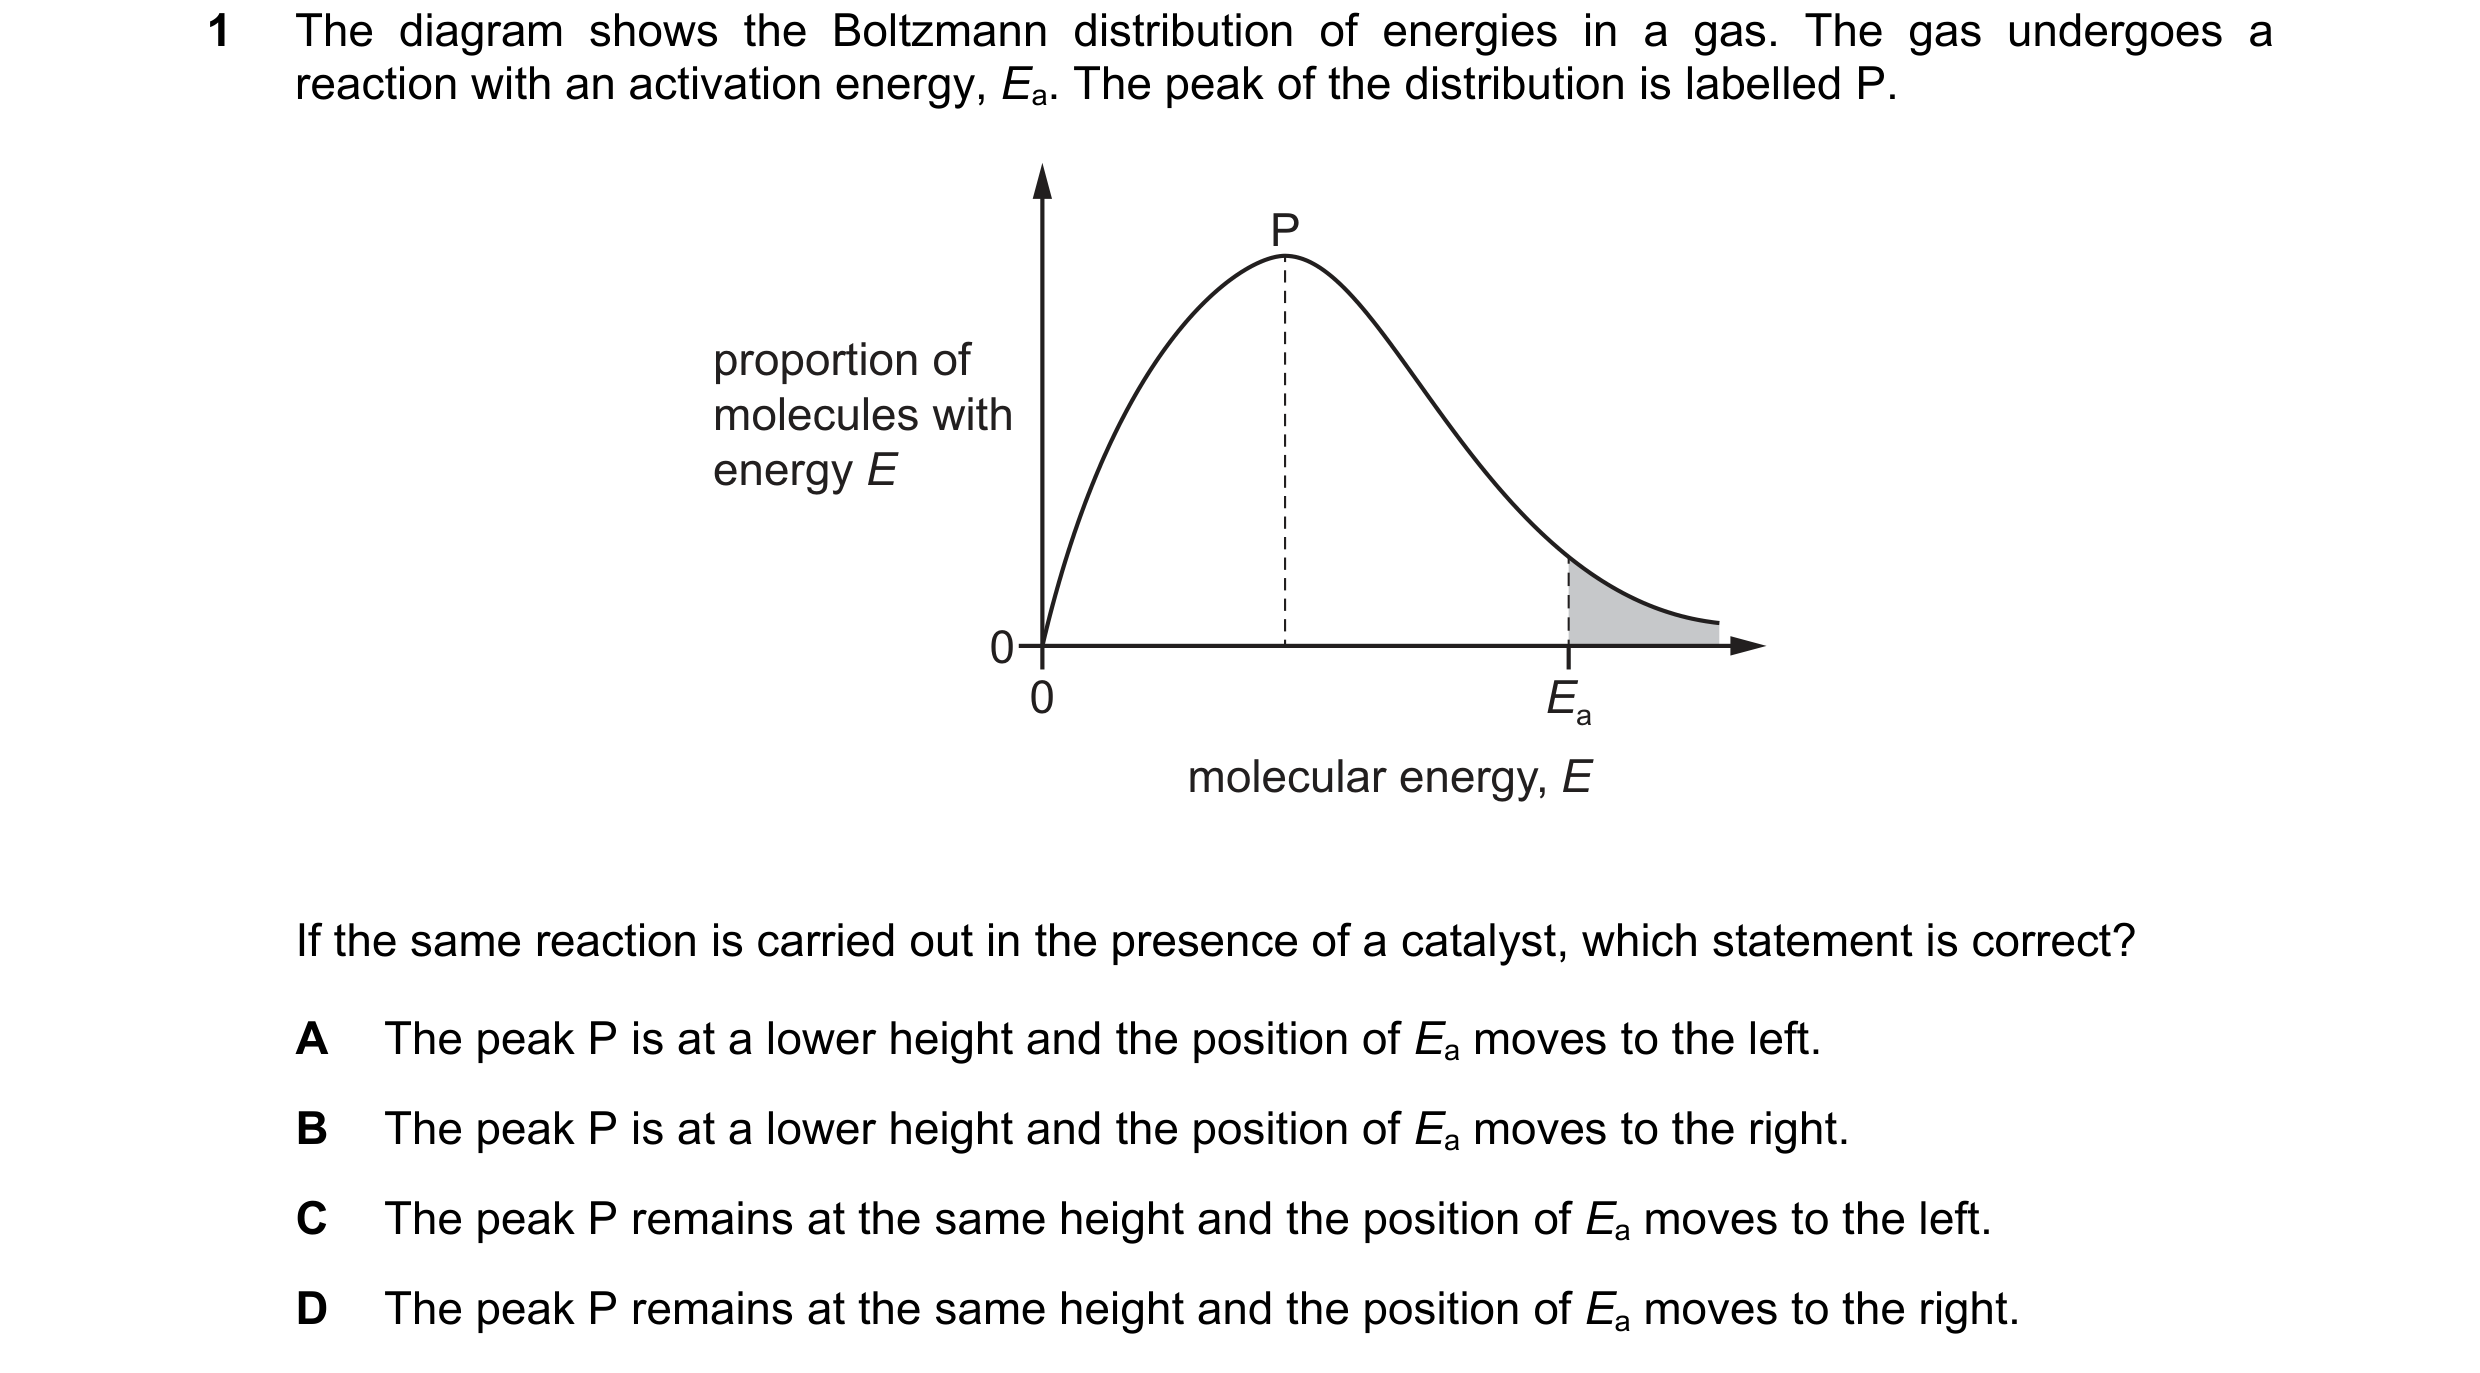
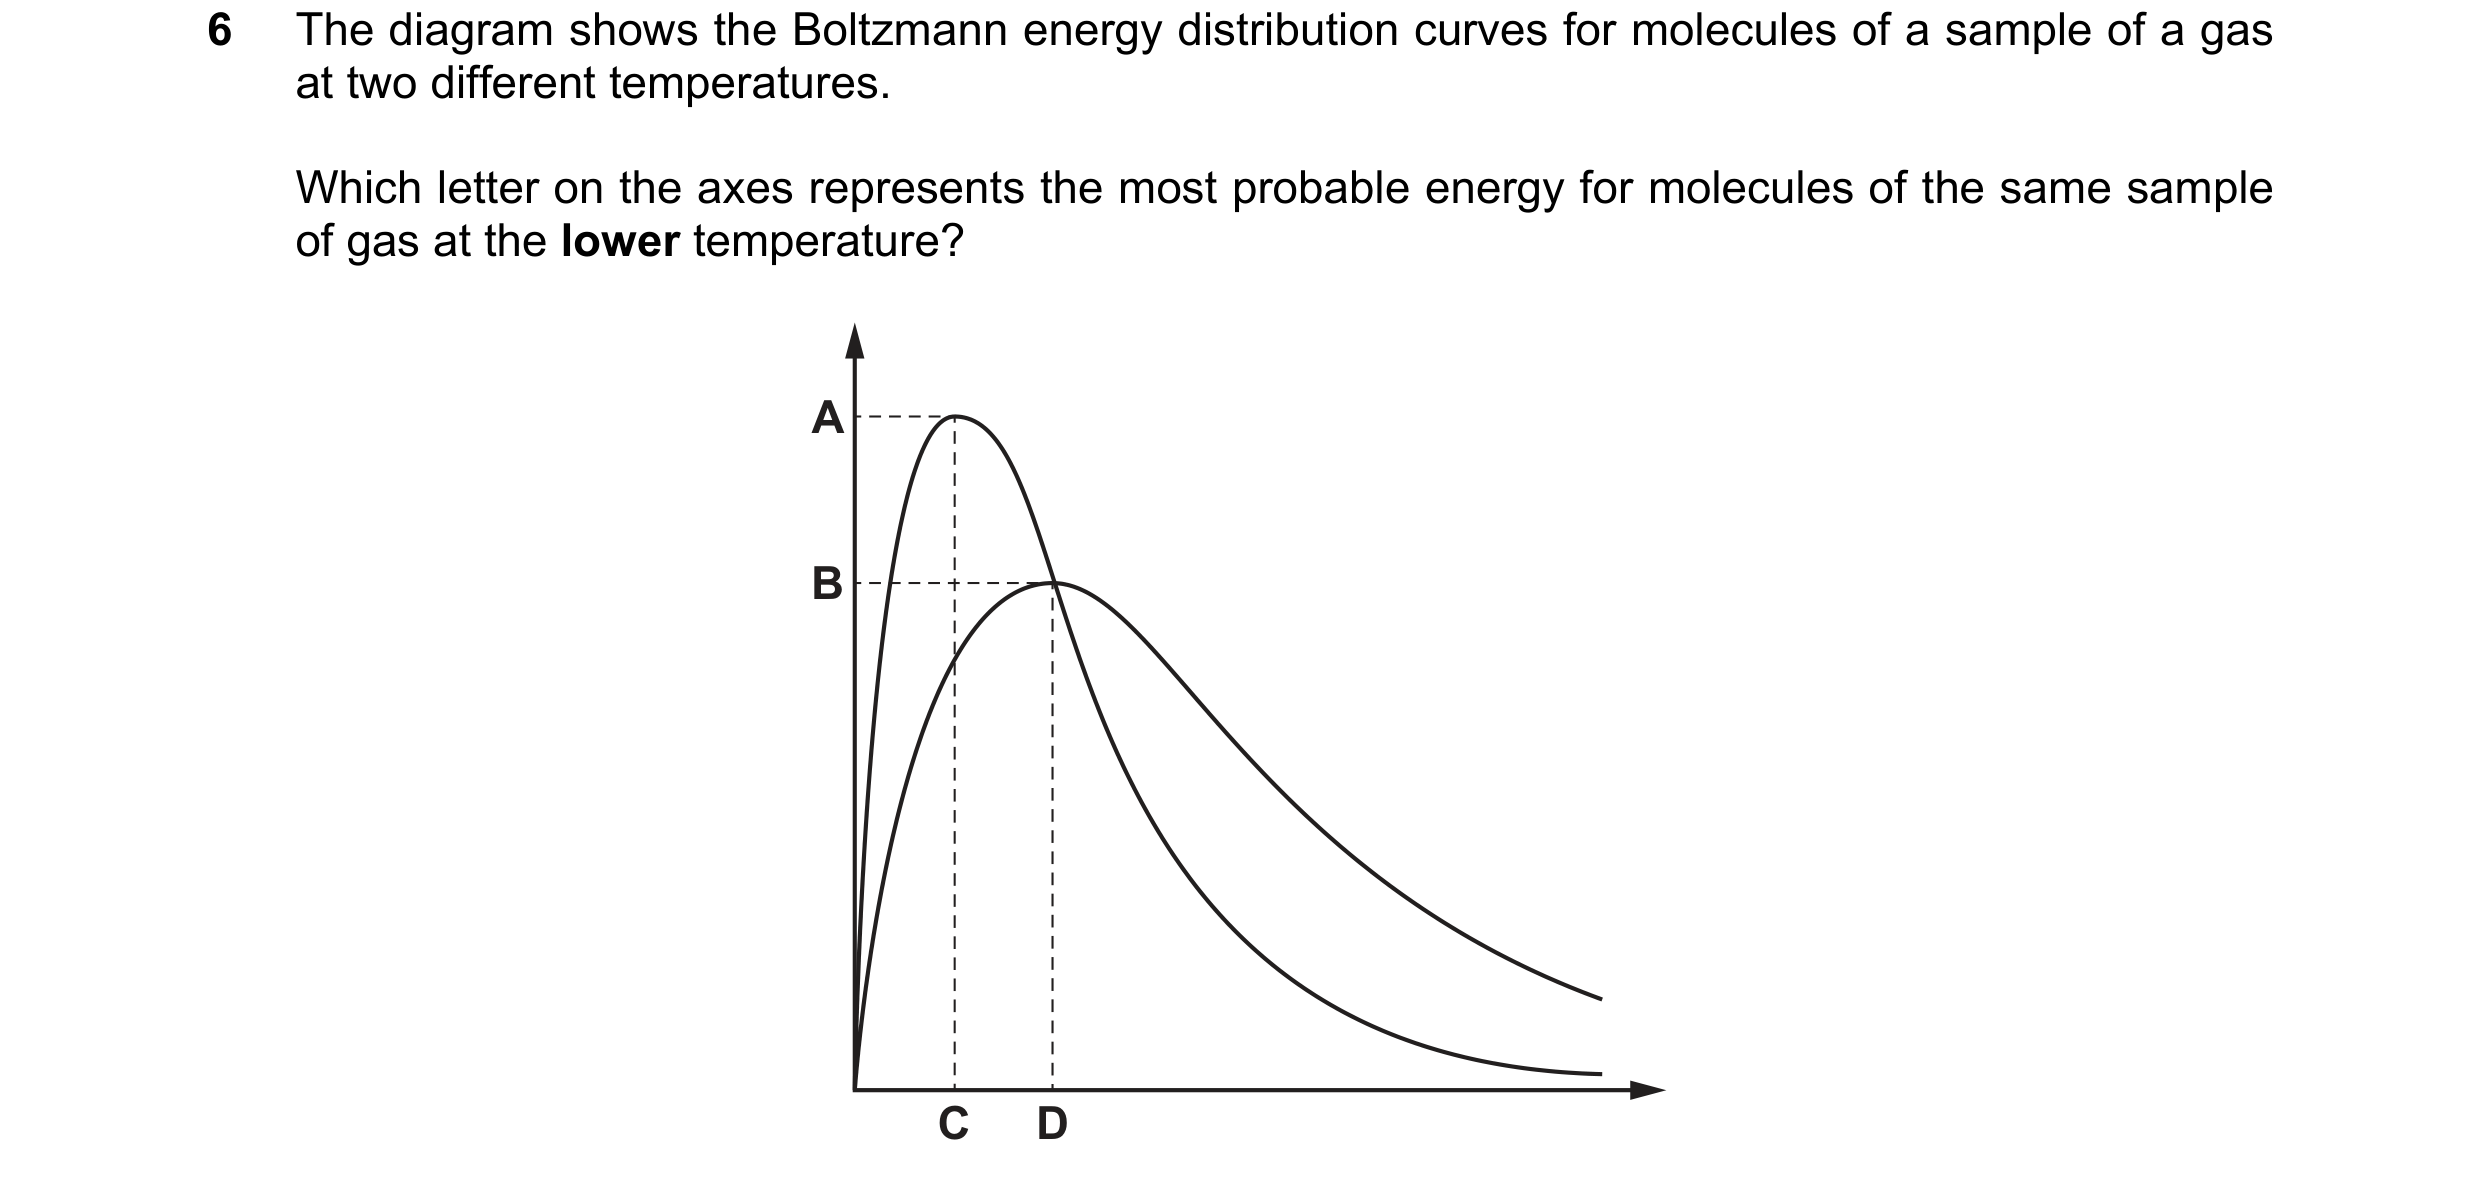
 44 / 67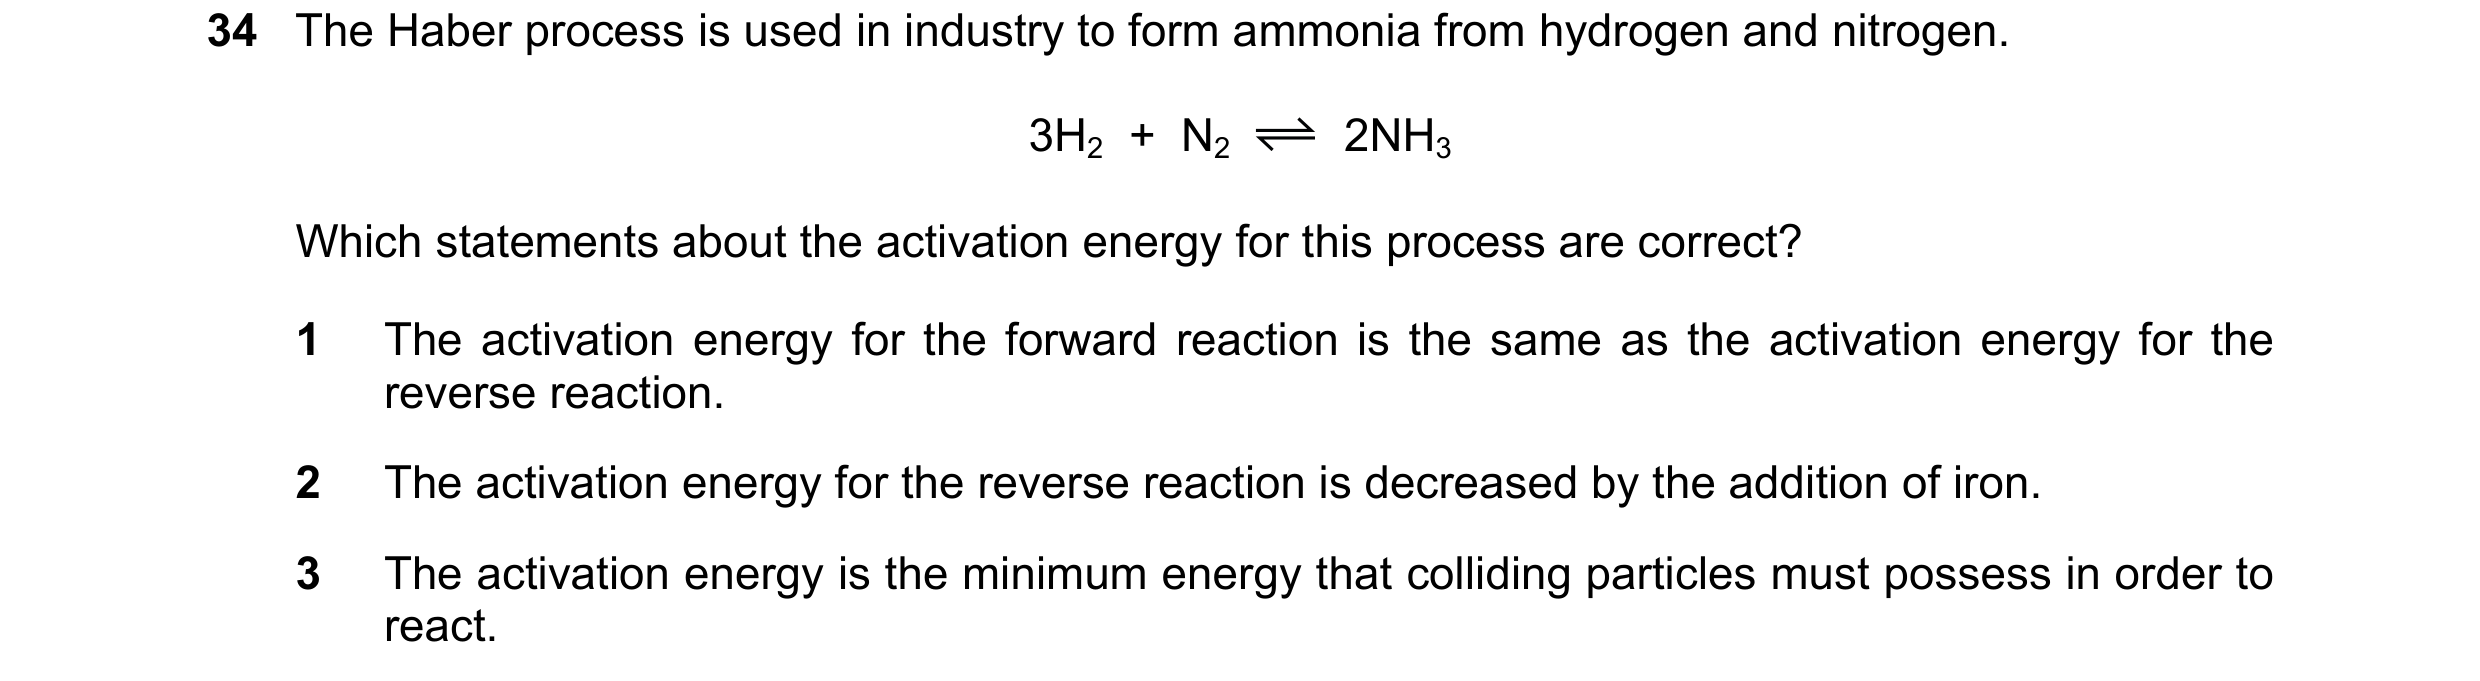
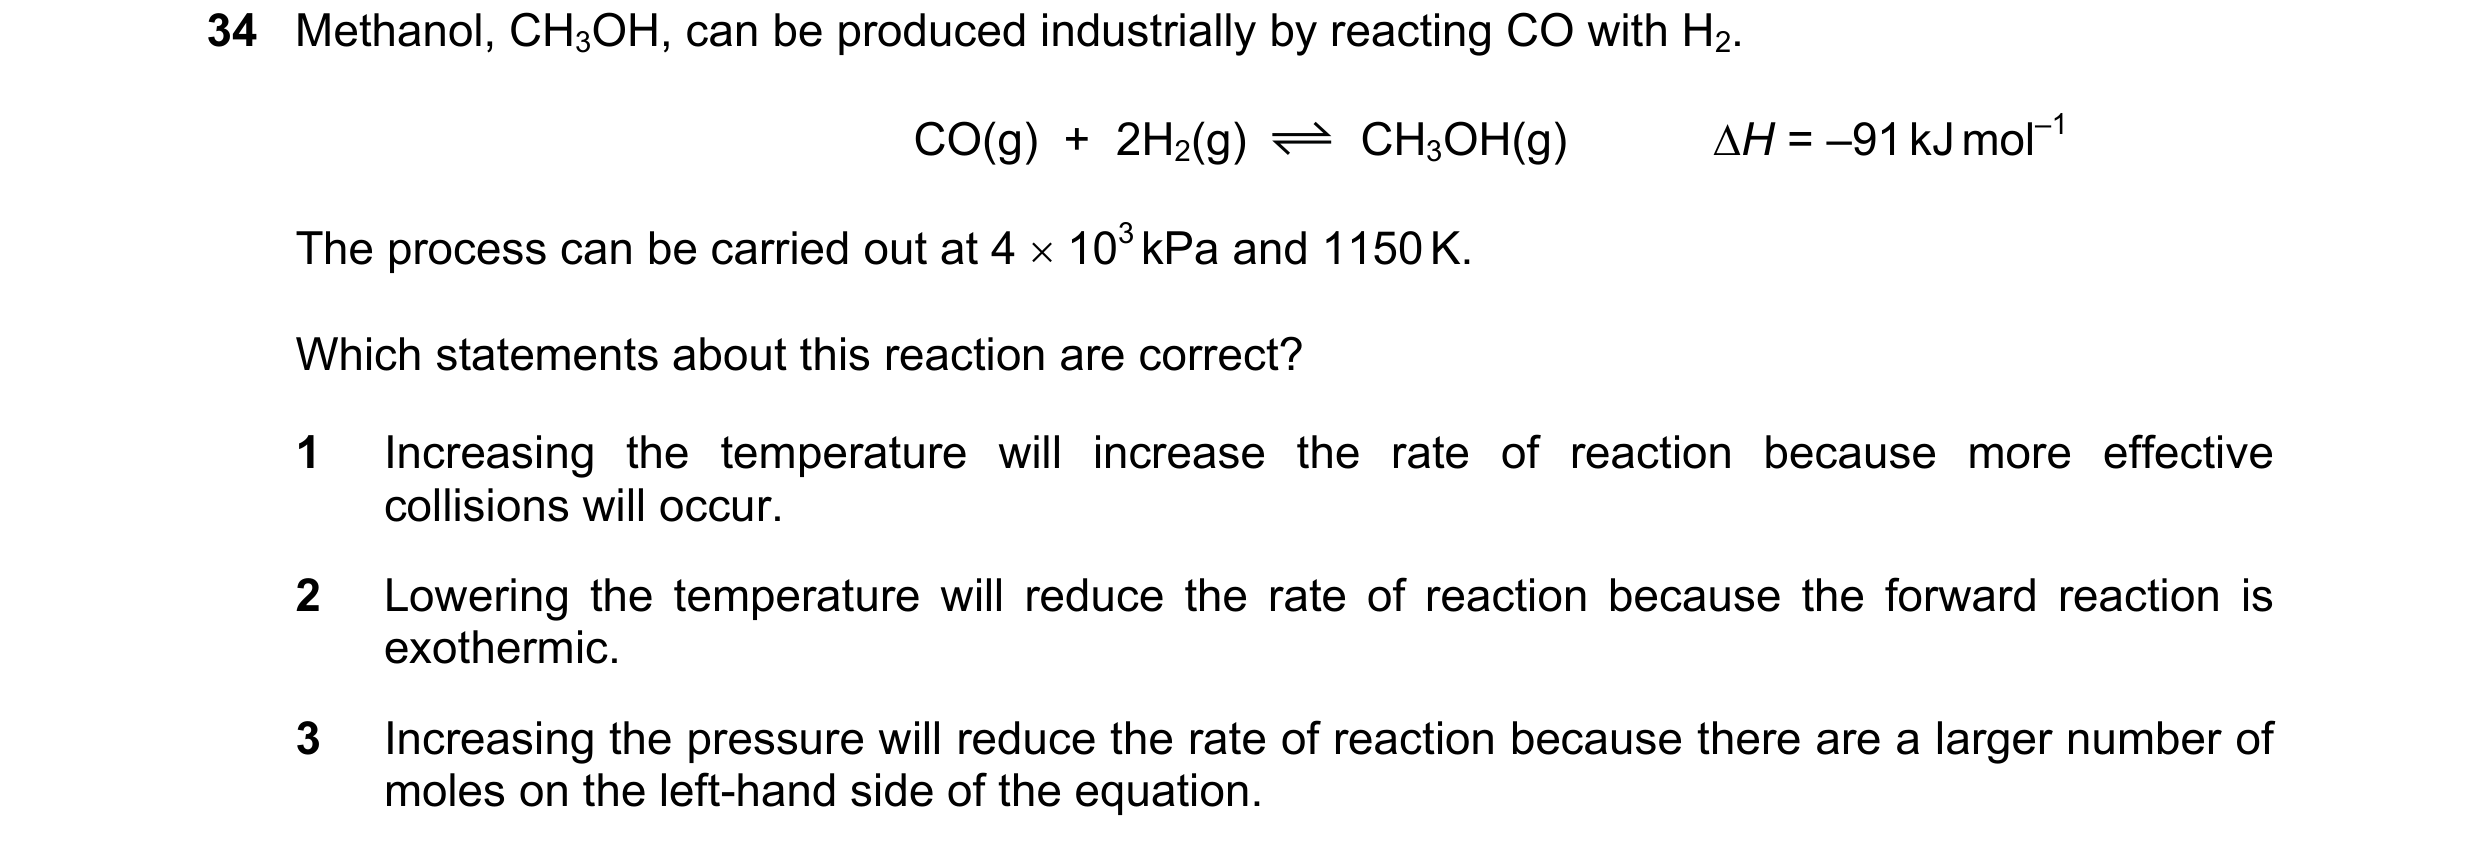
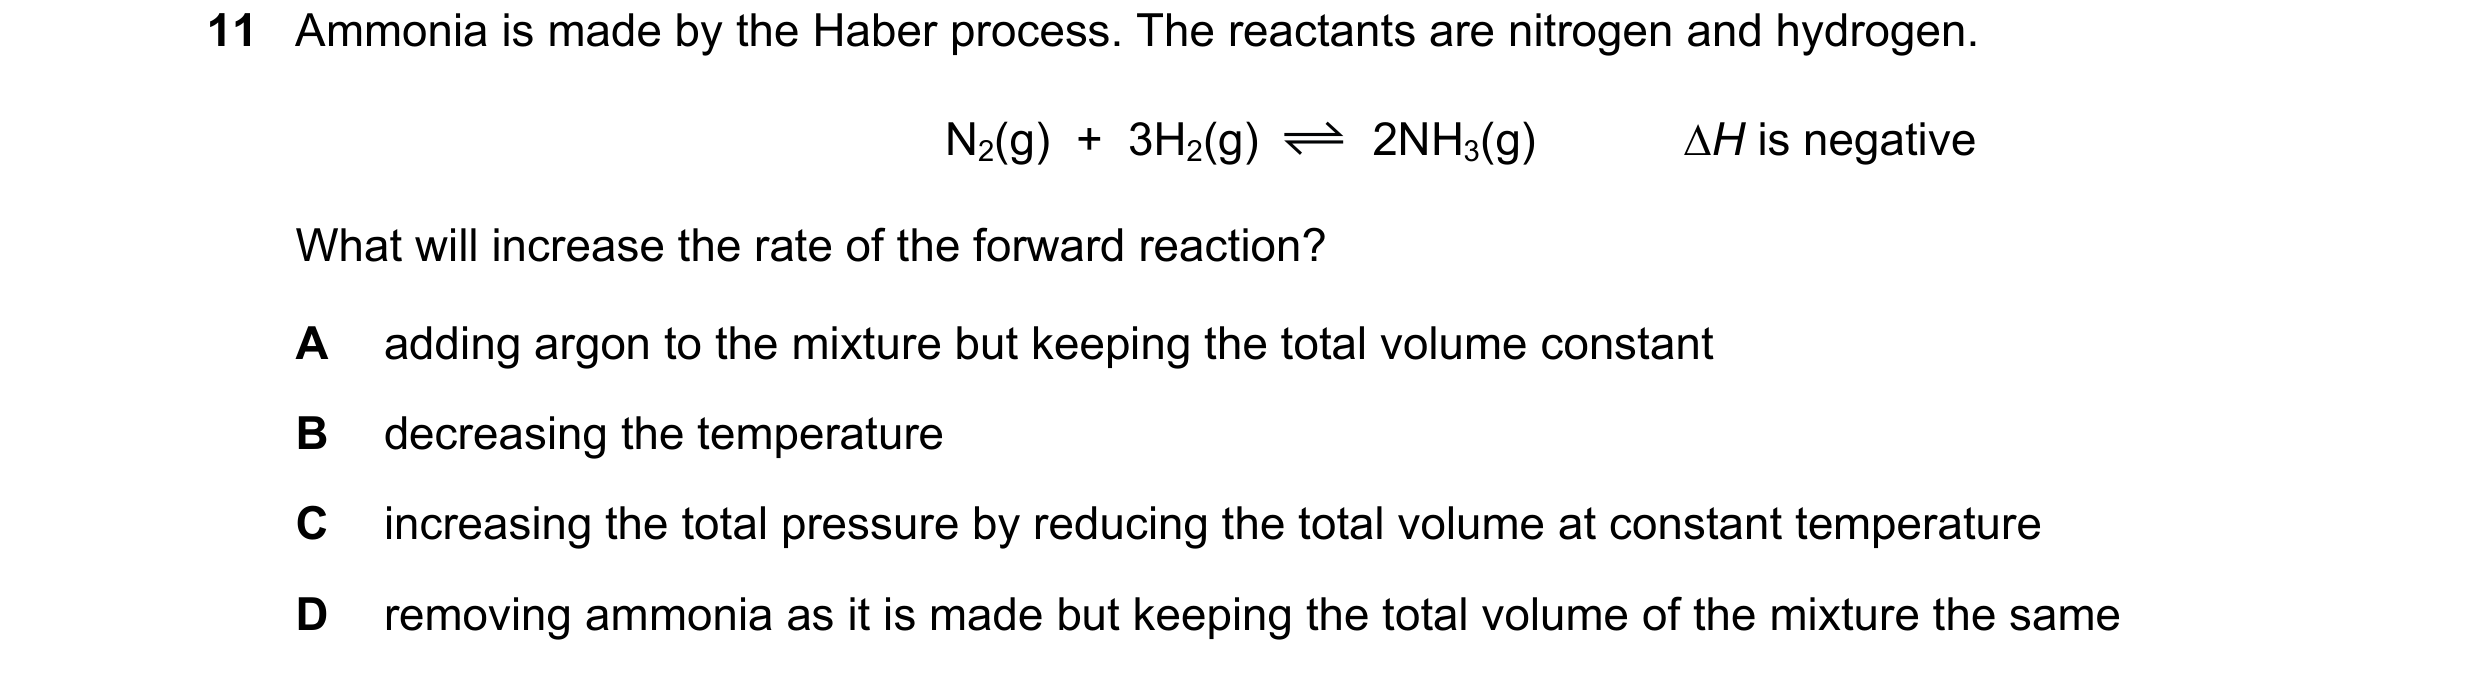
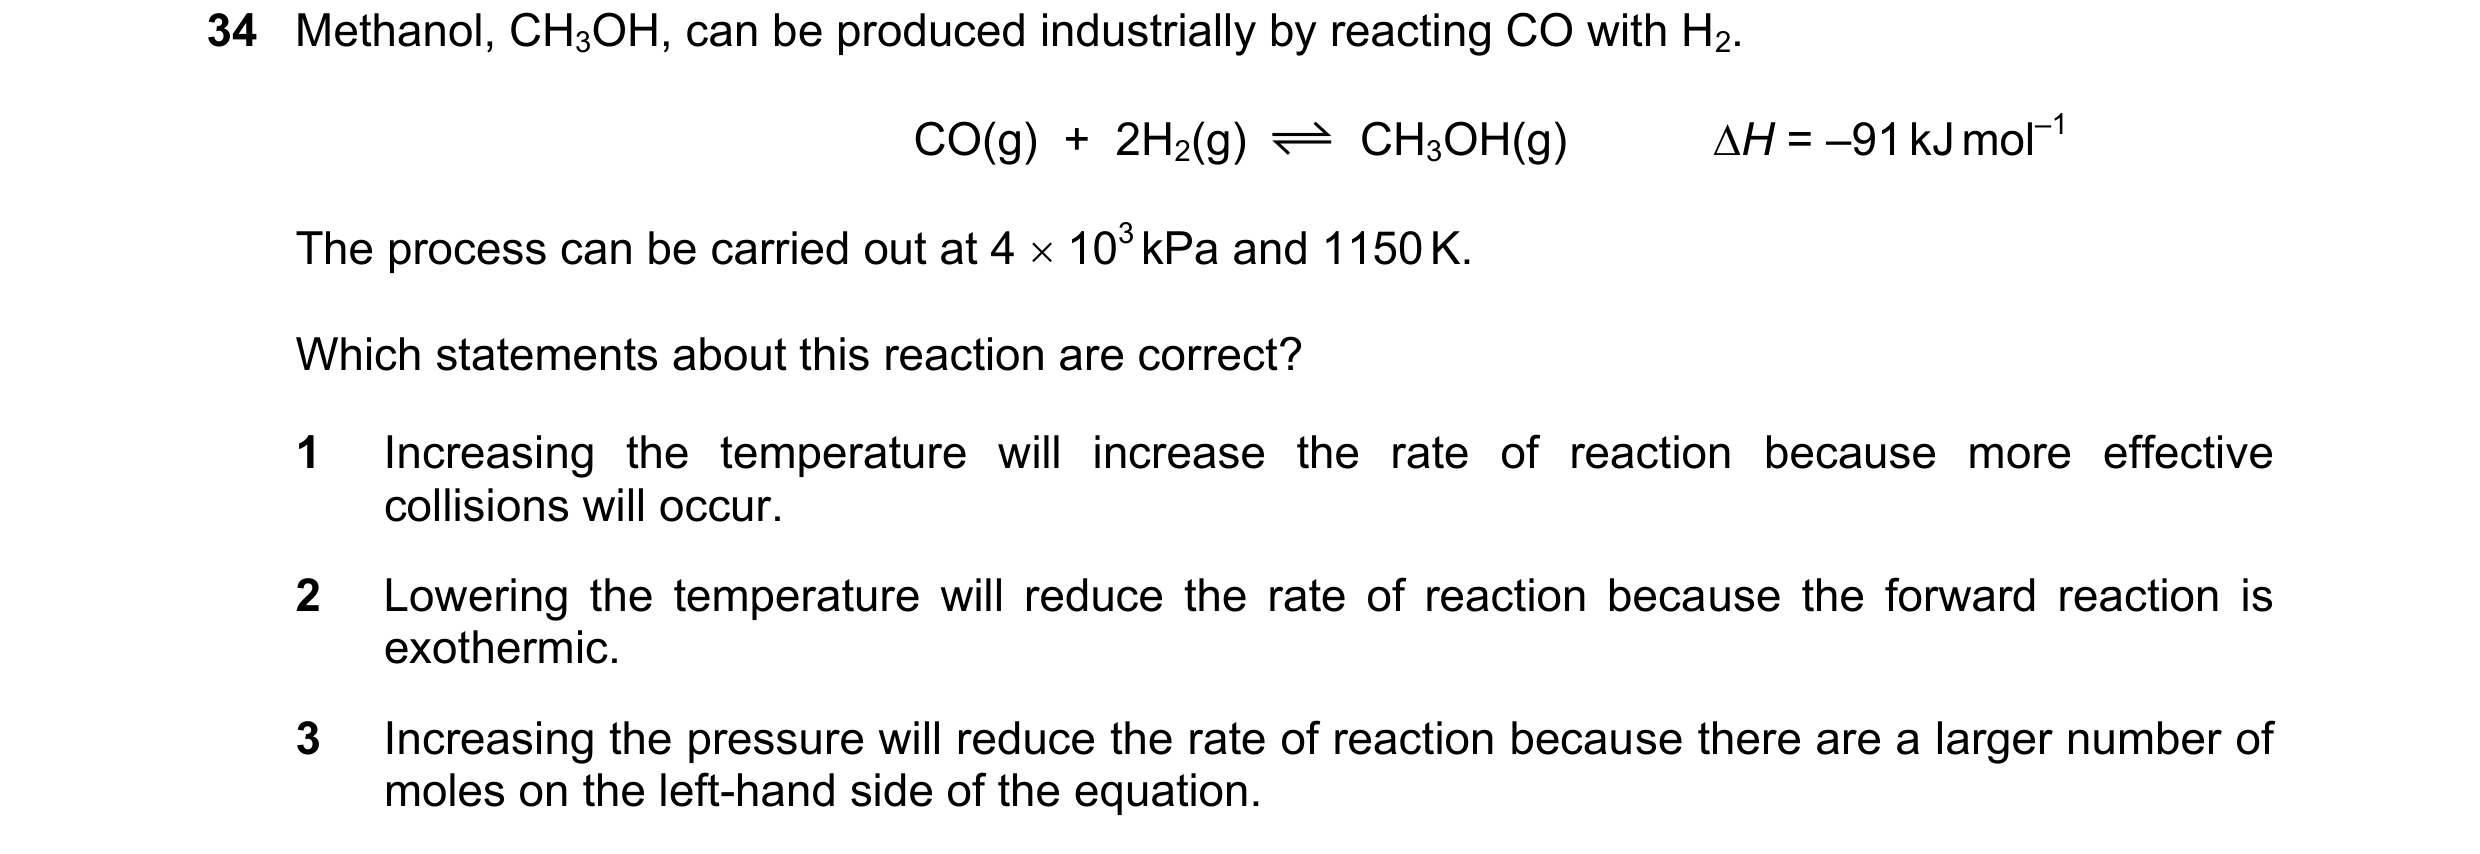 45 / 67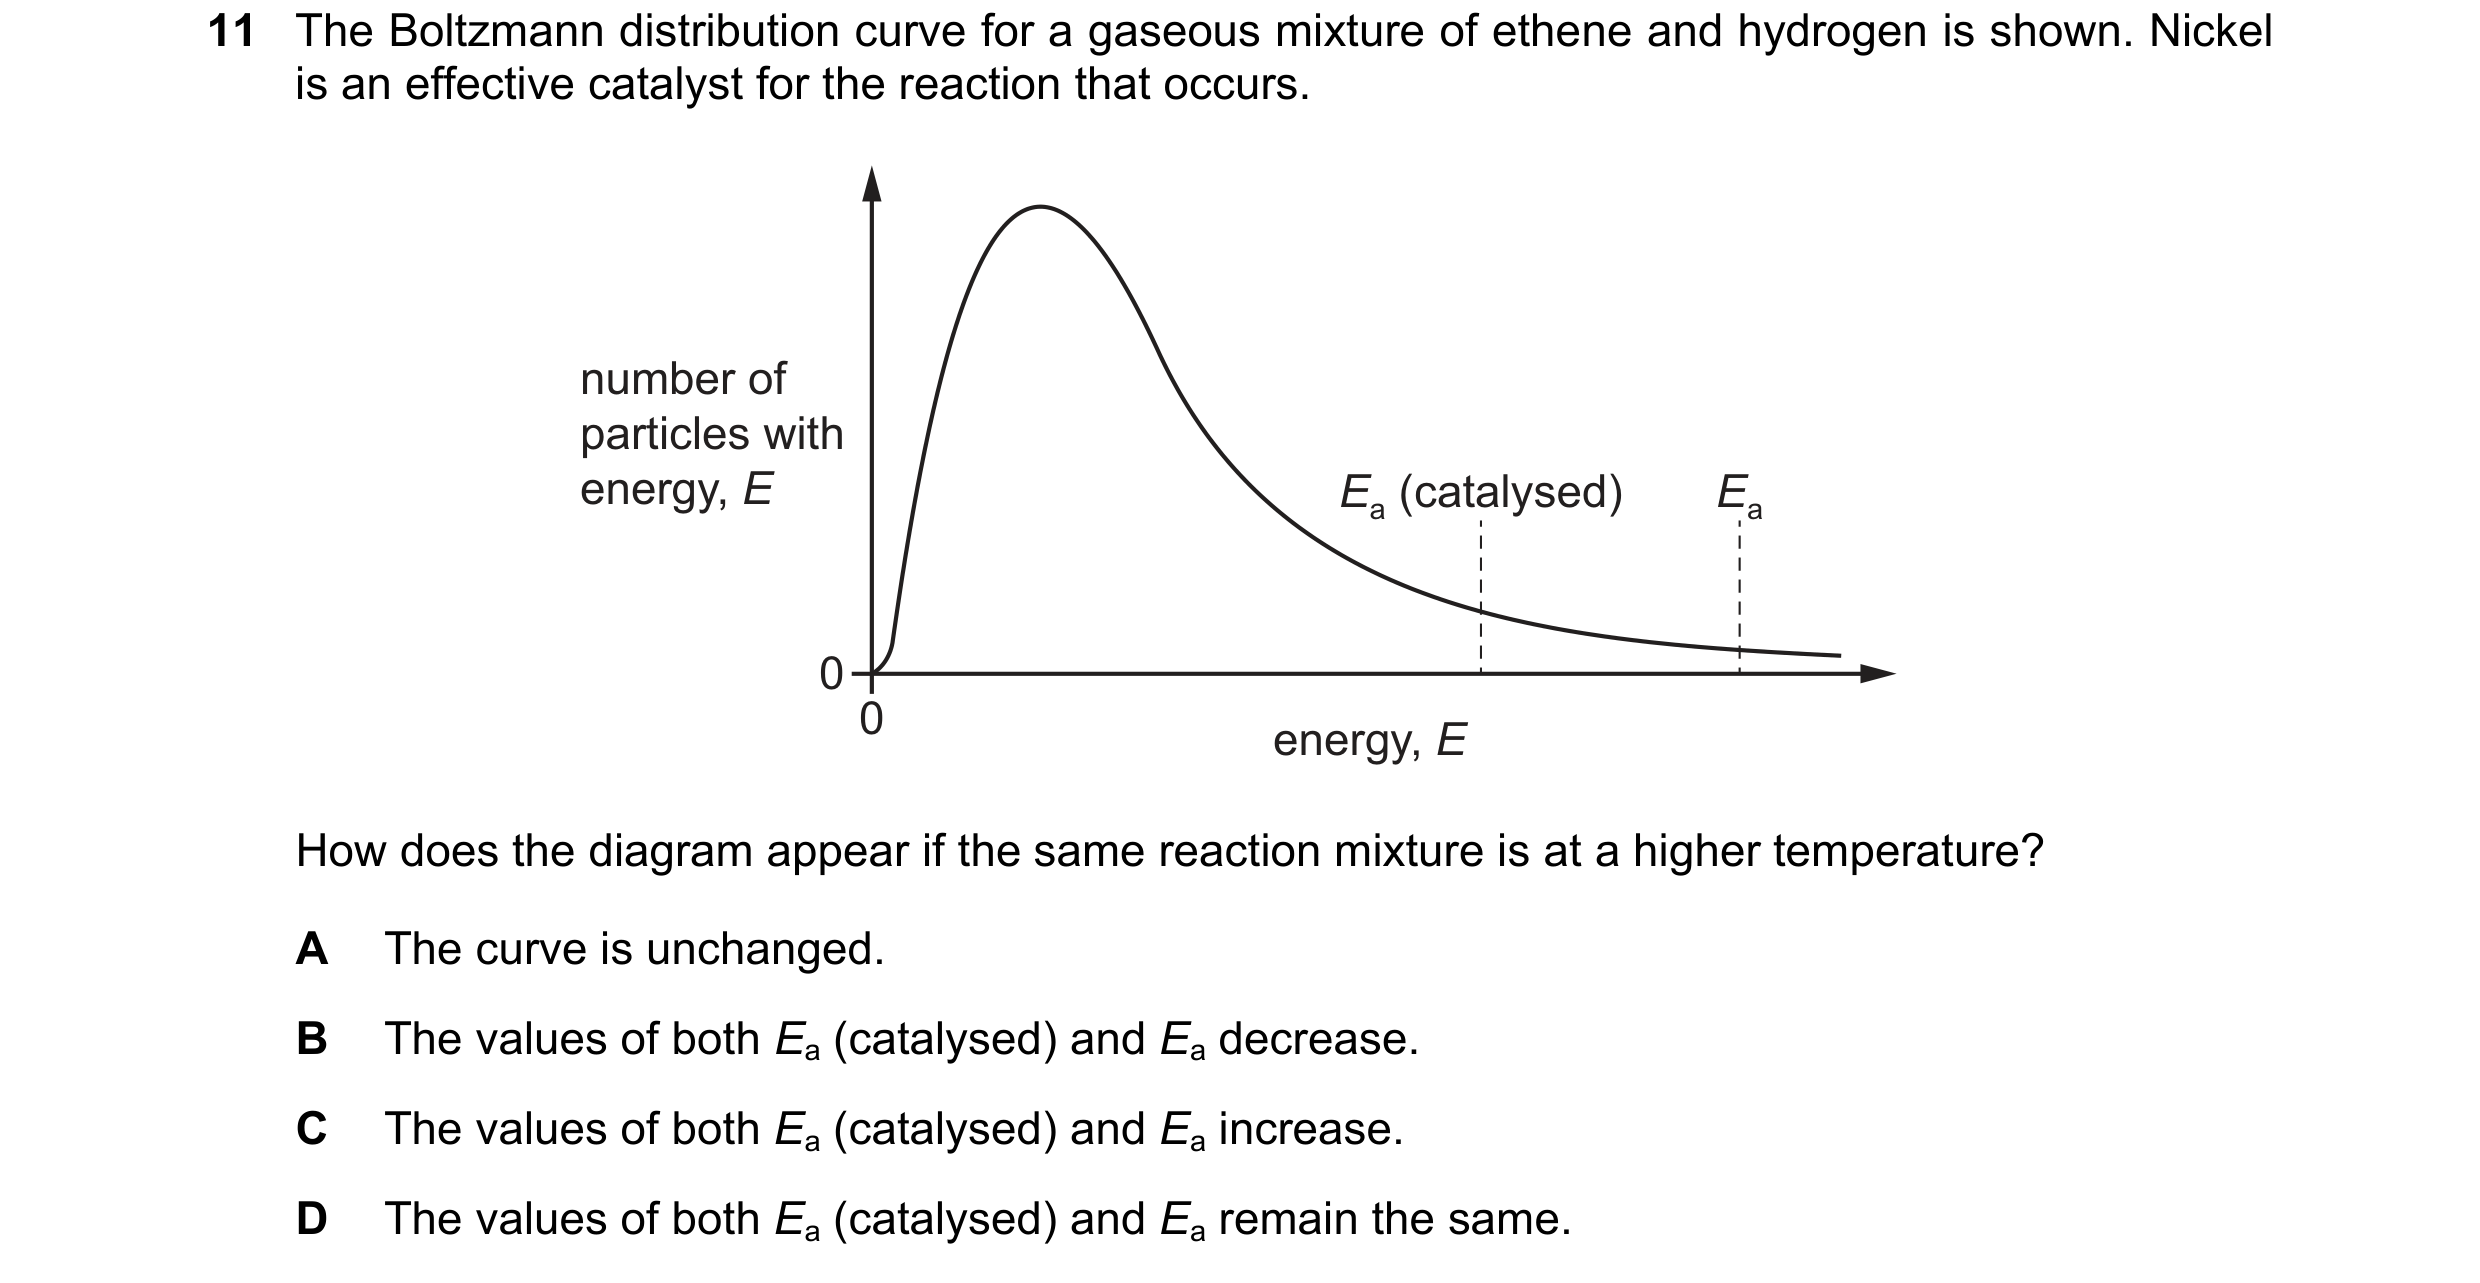
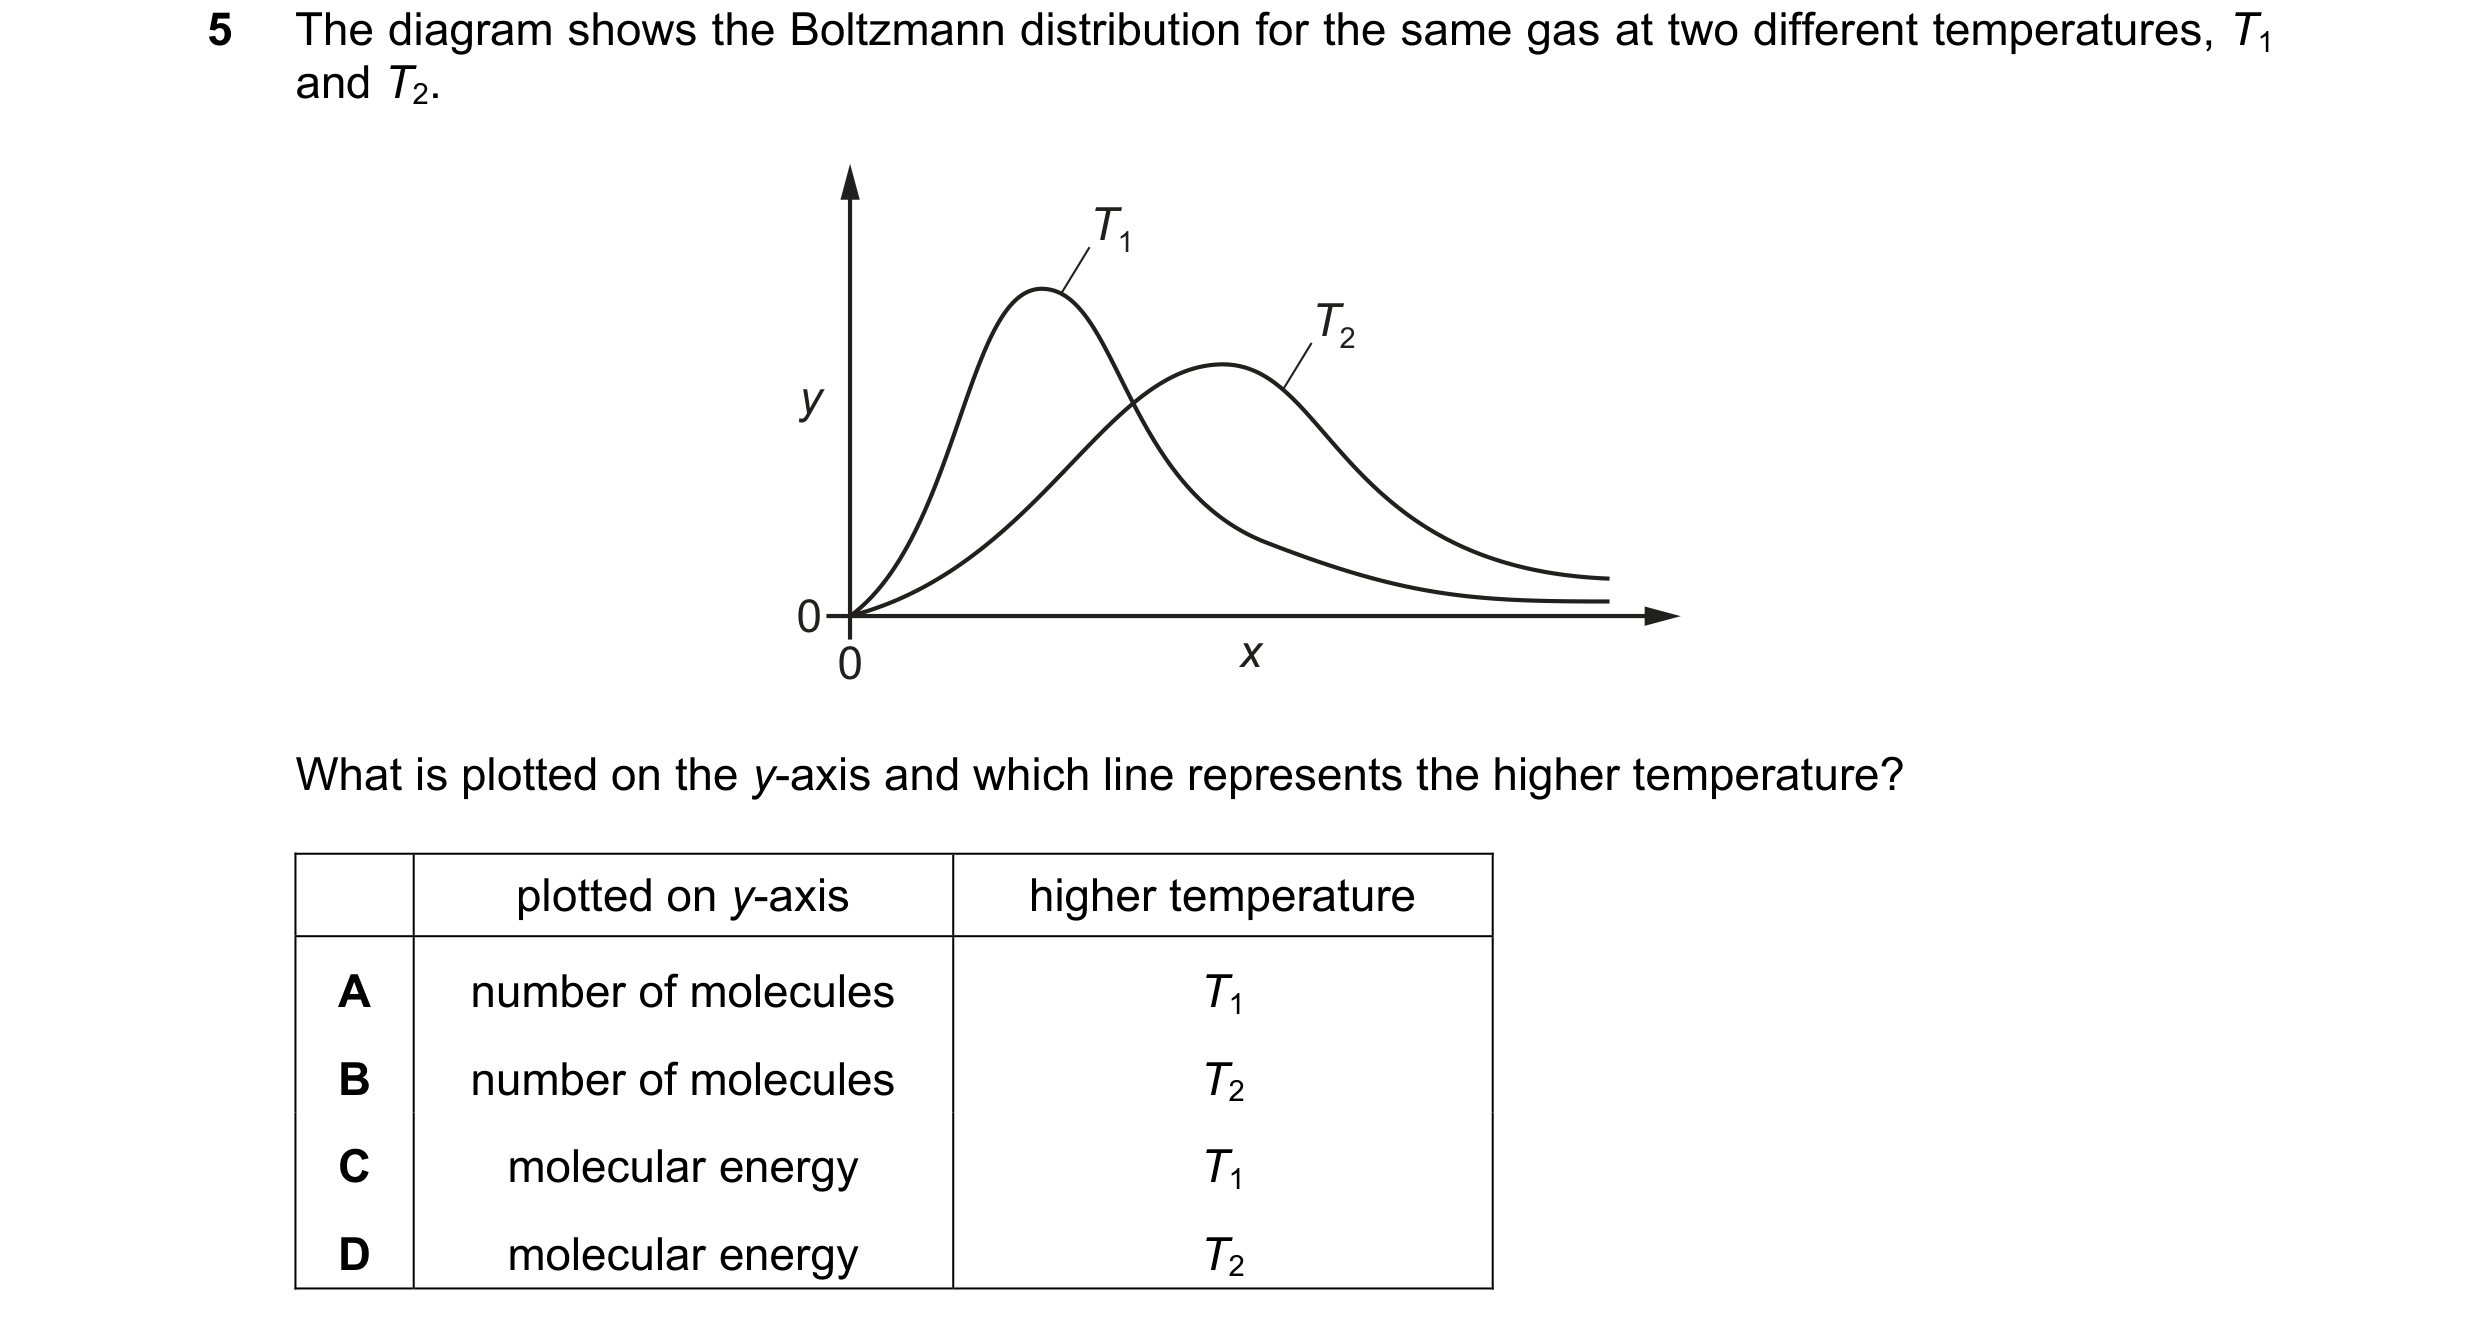
 46 / 67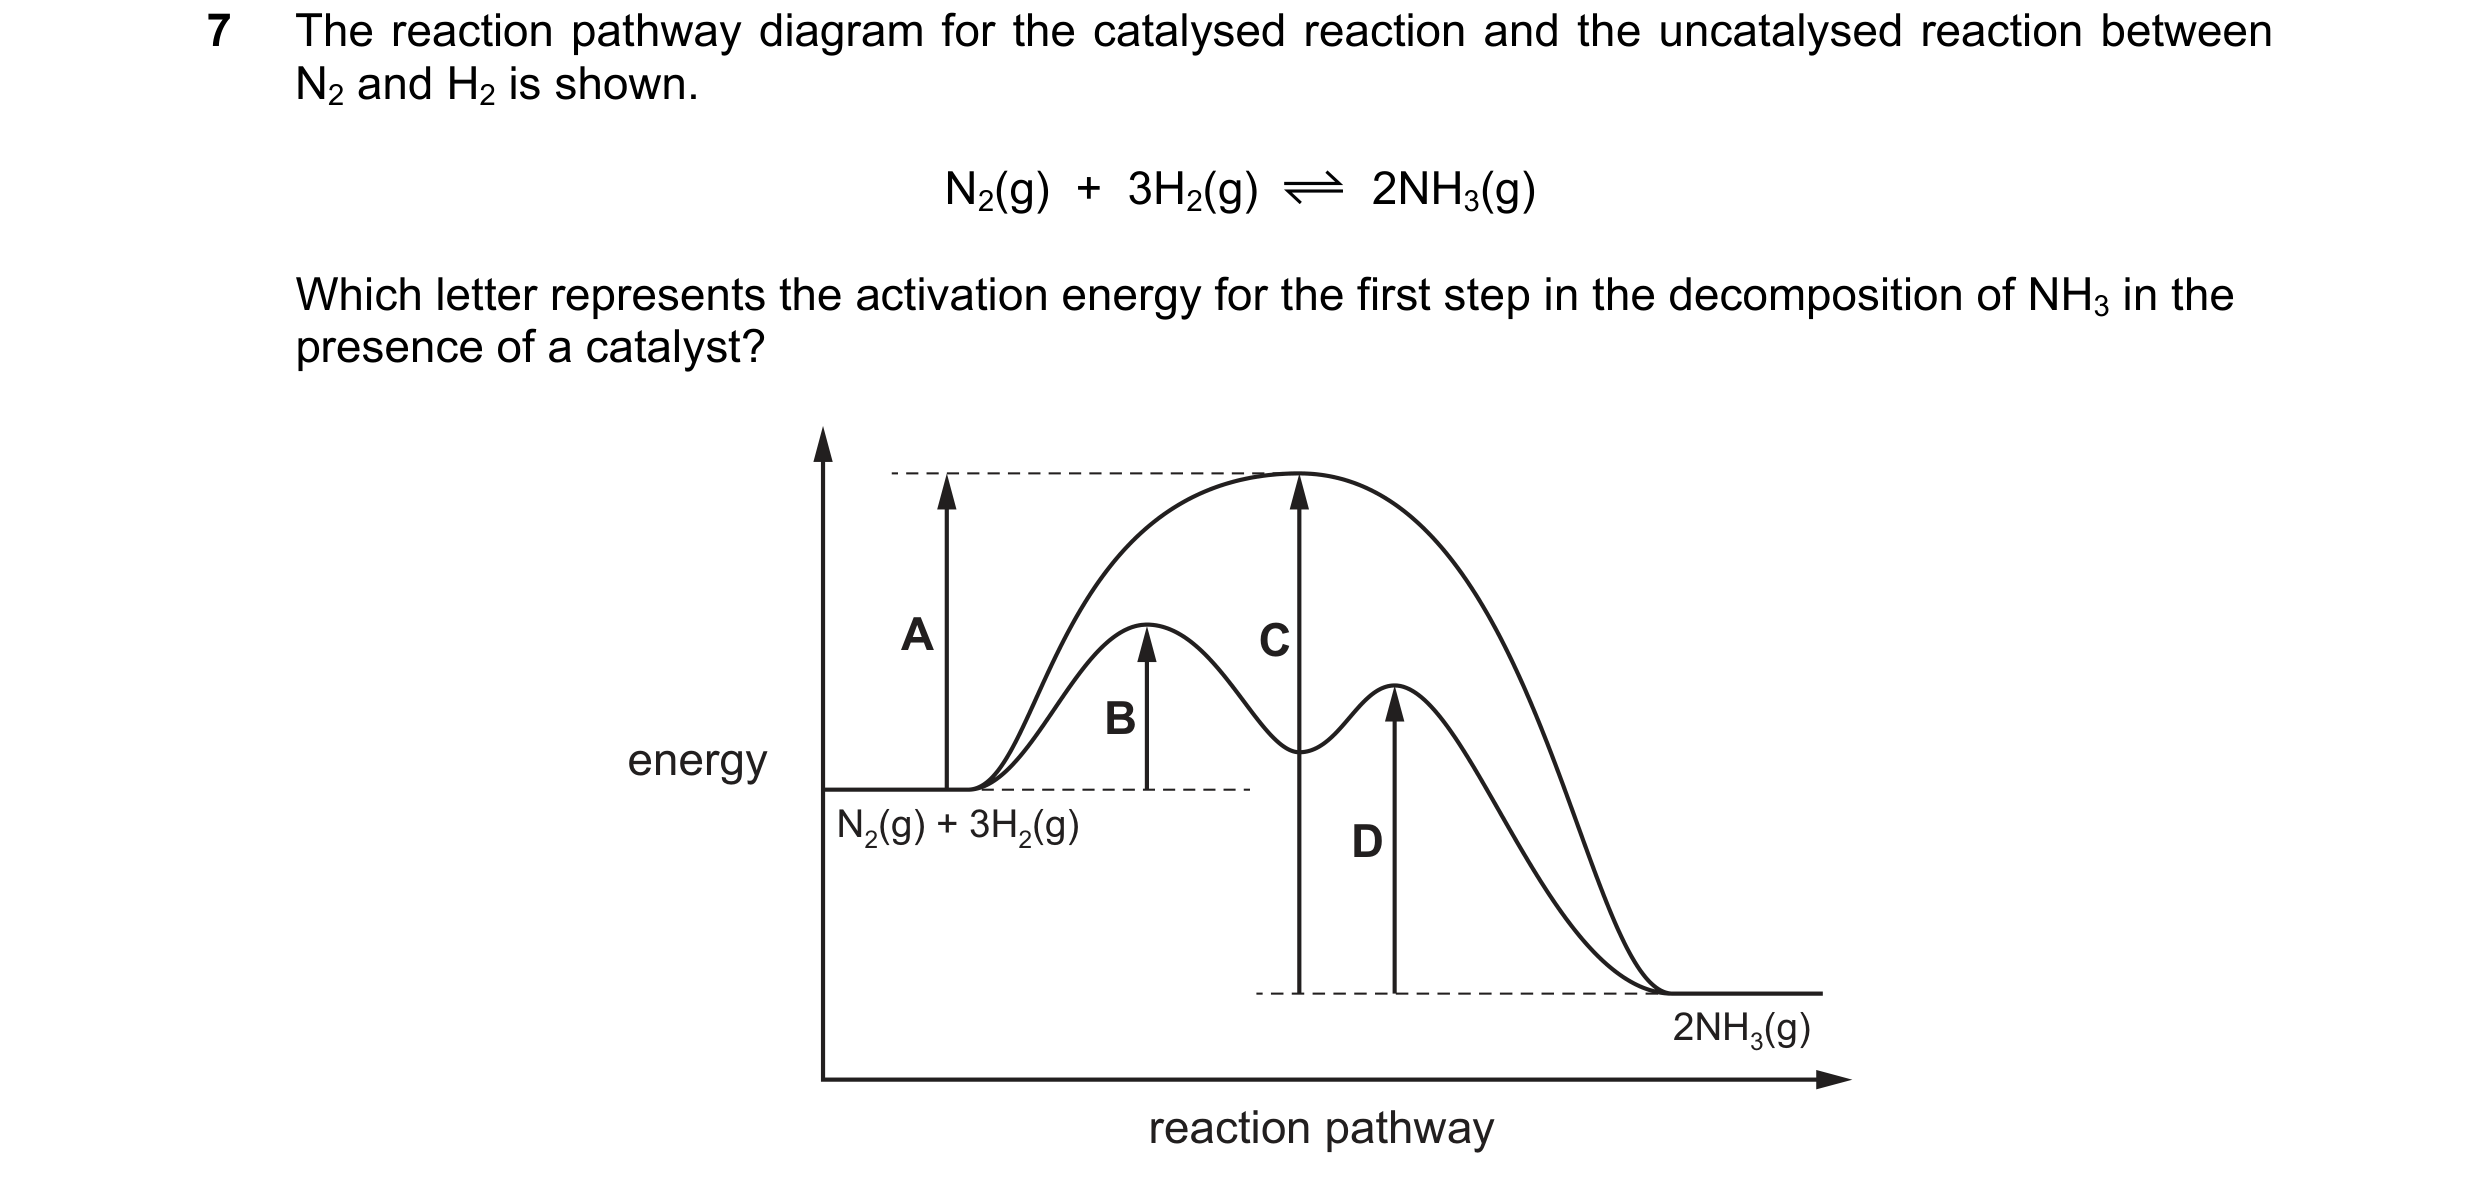
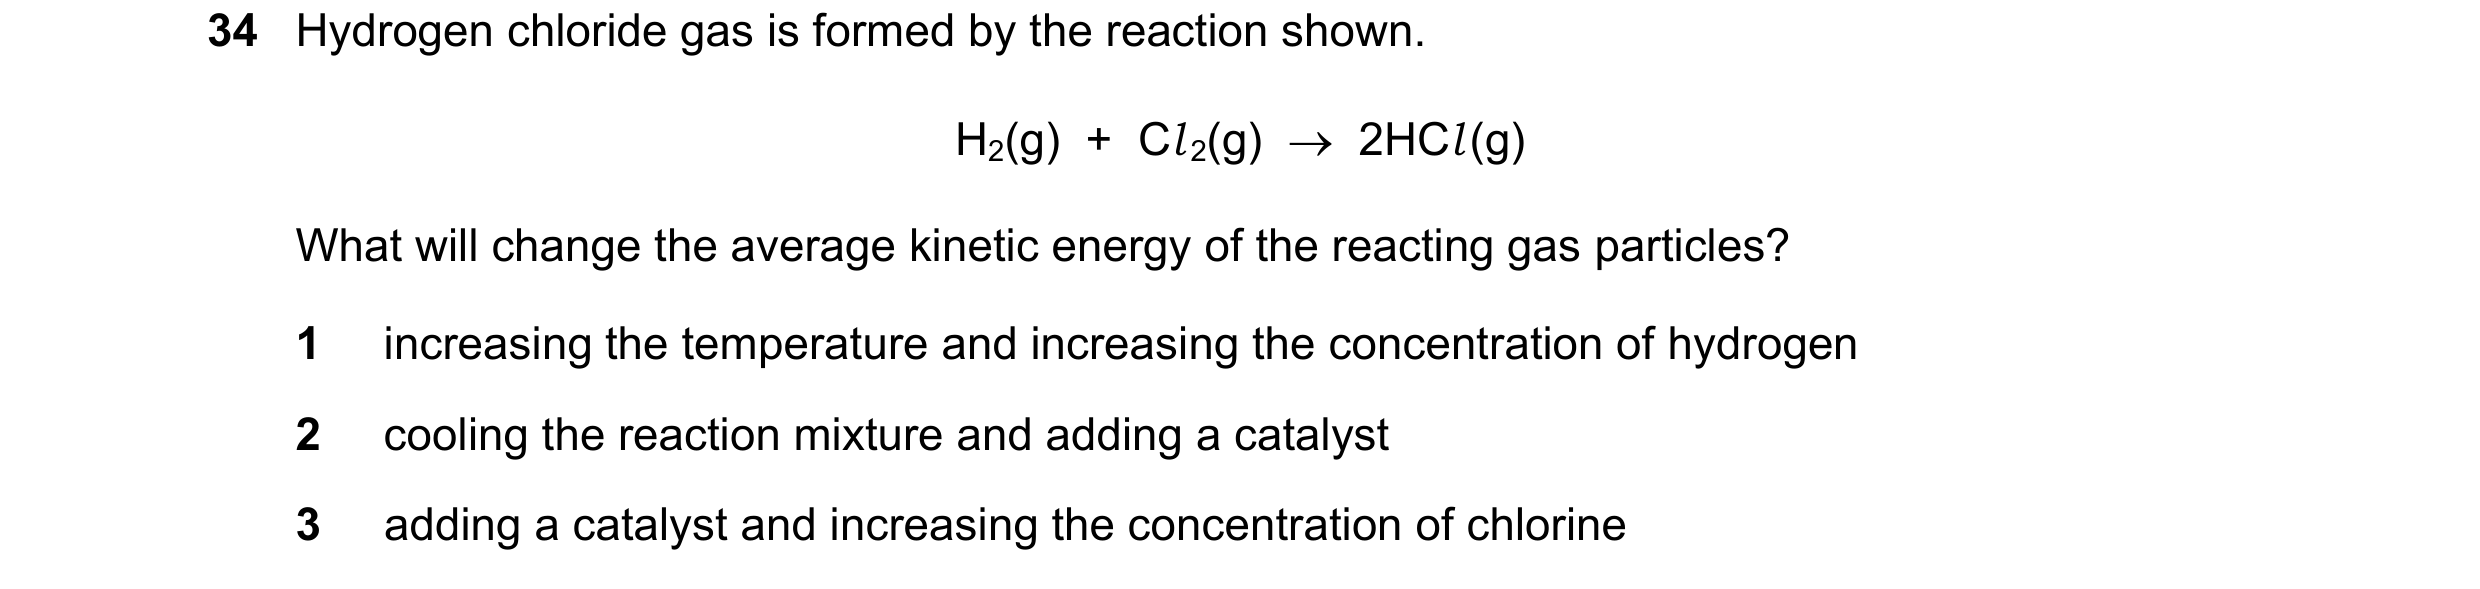
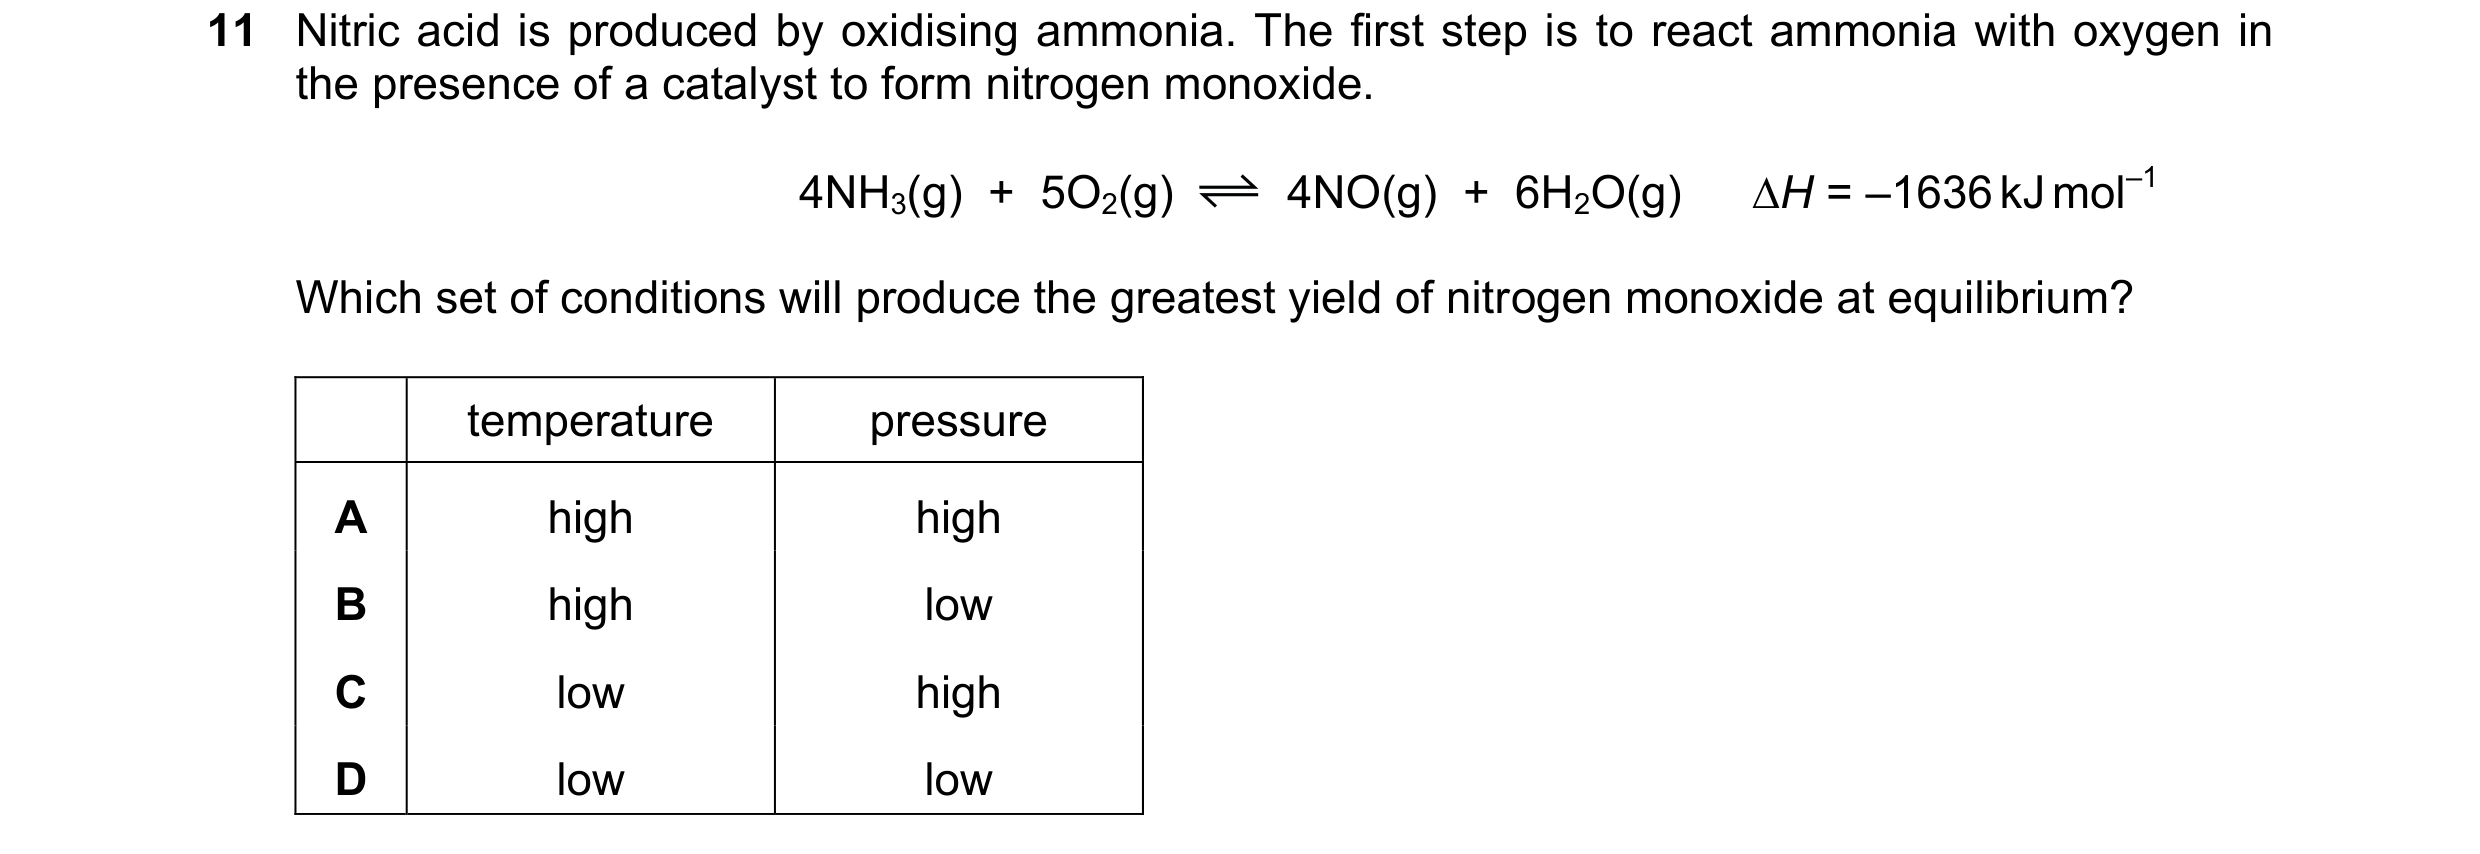 47 / 67
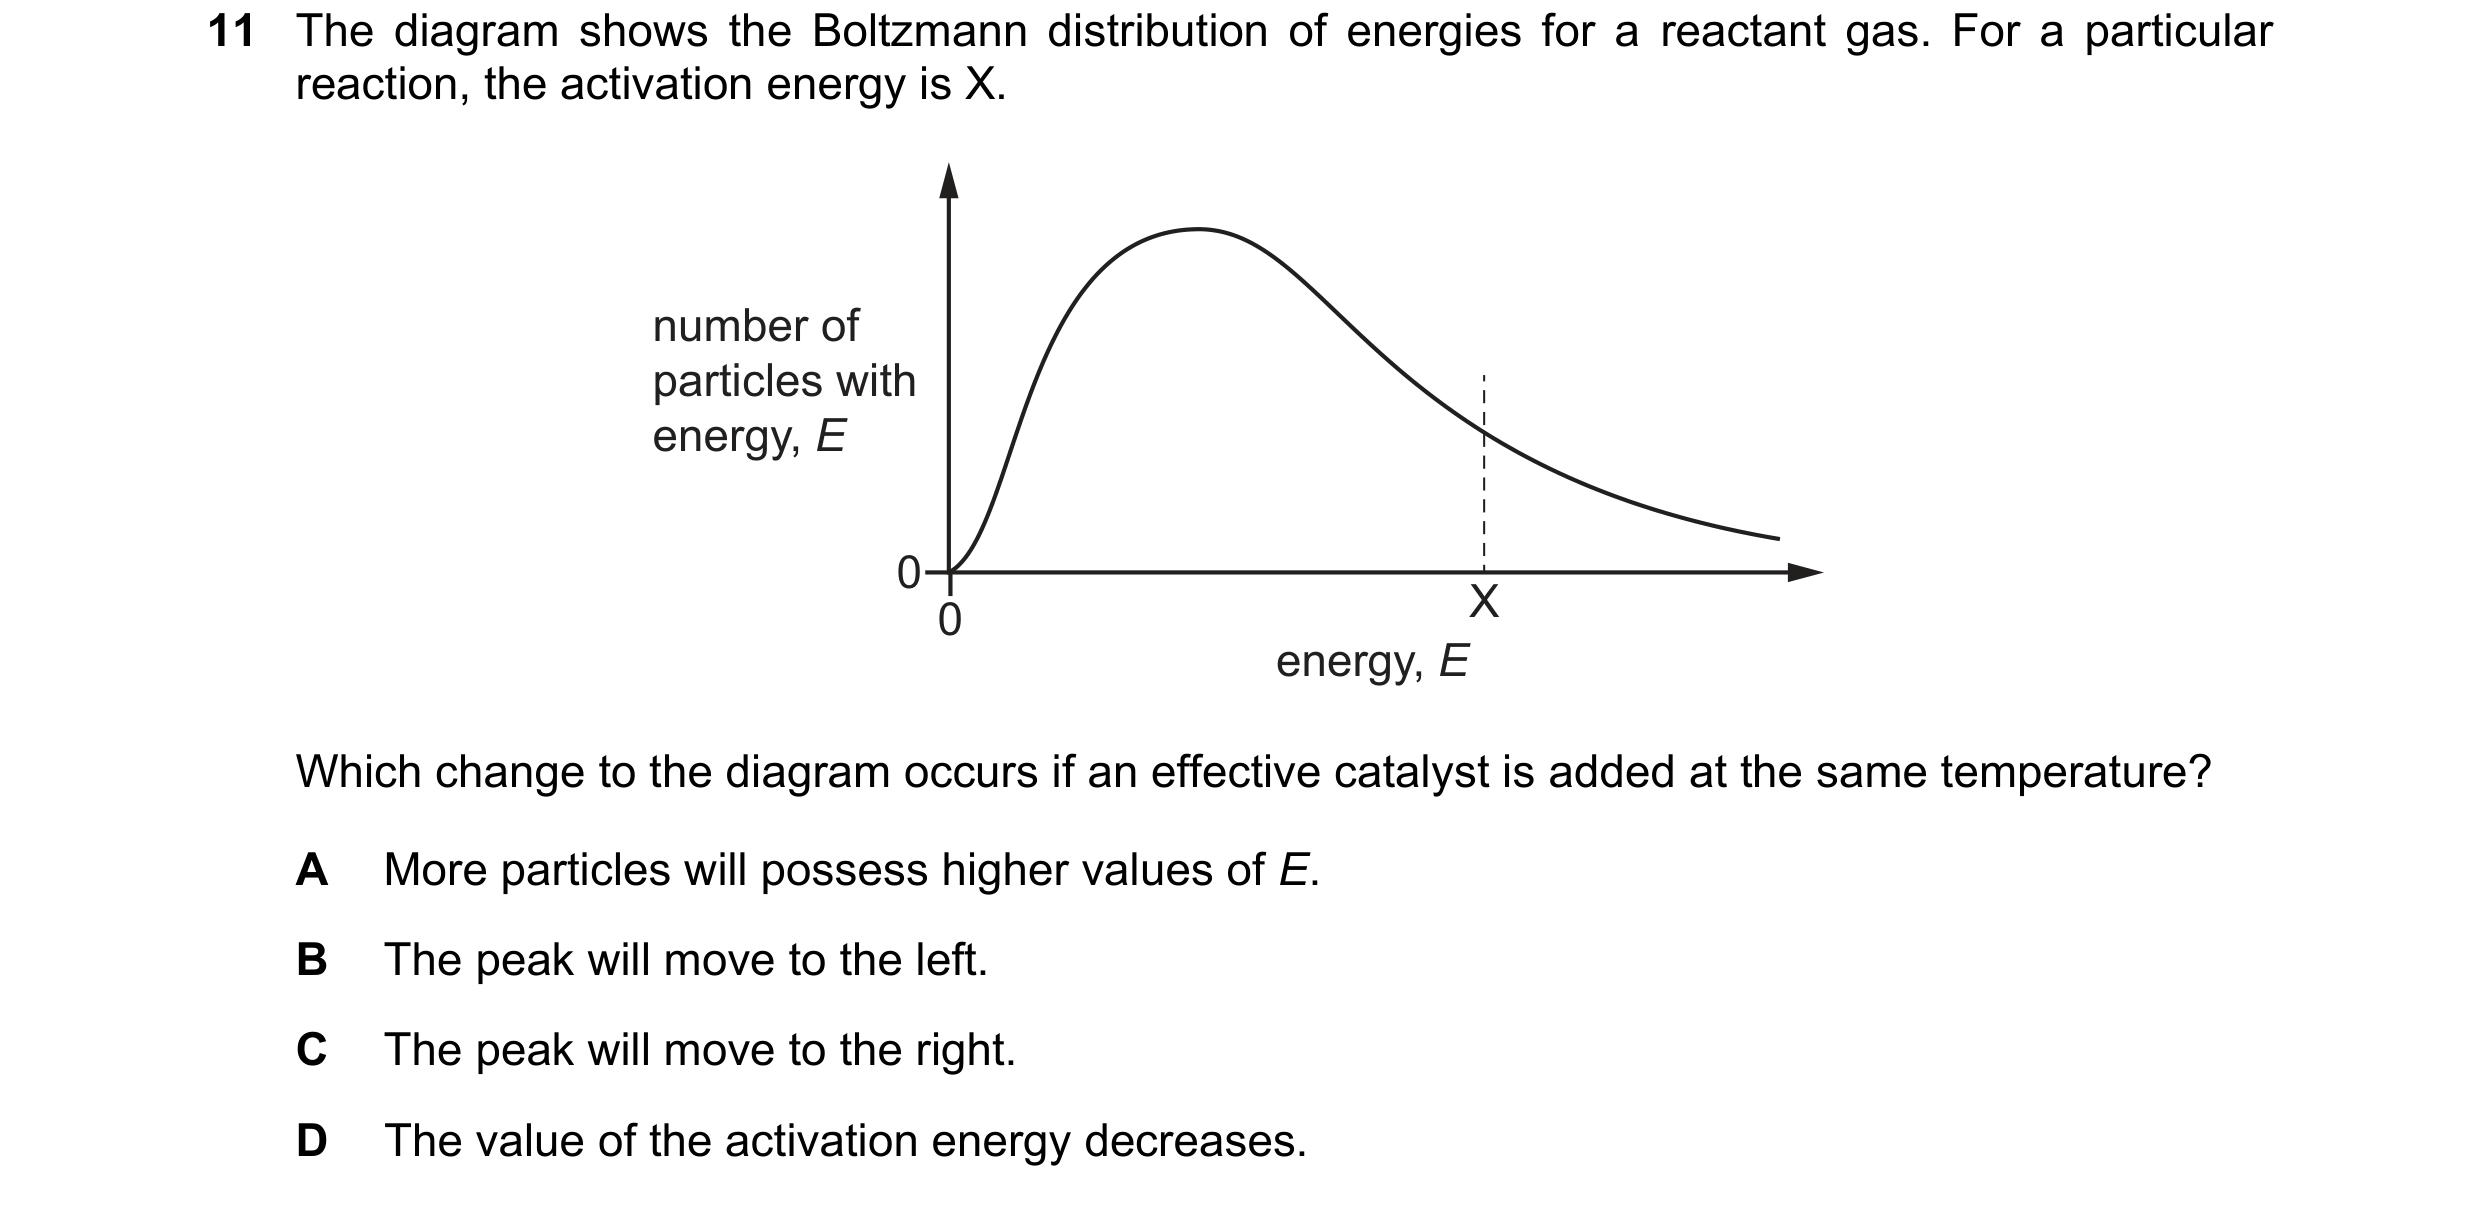 48 / 67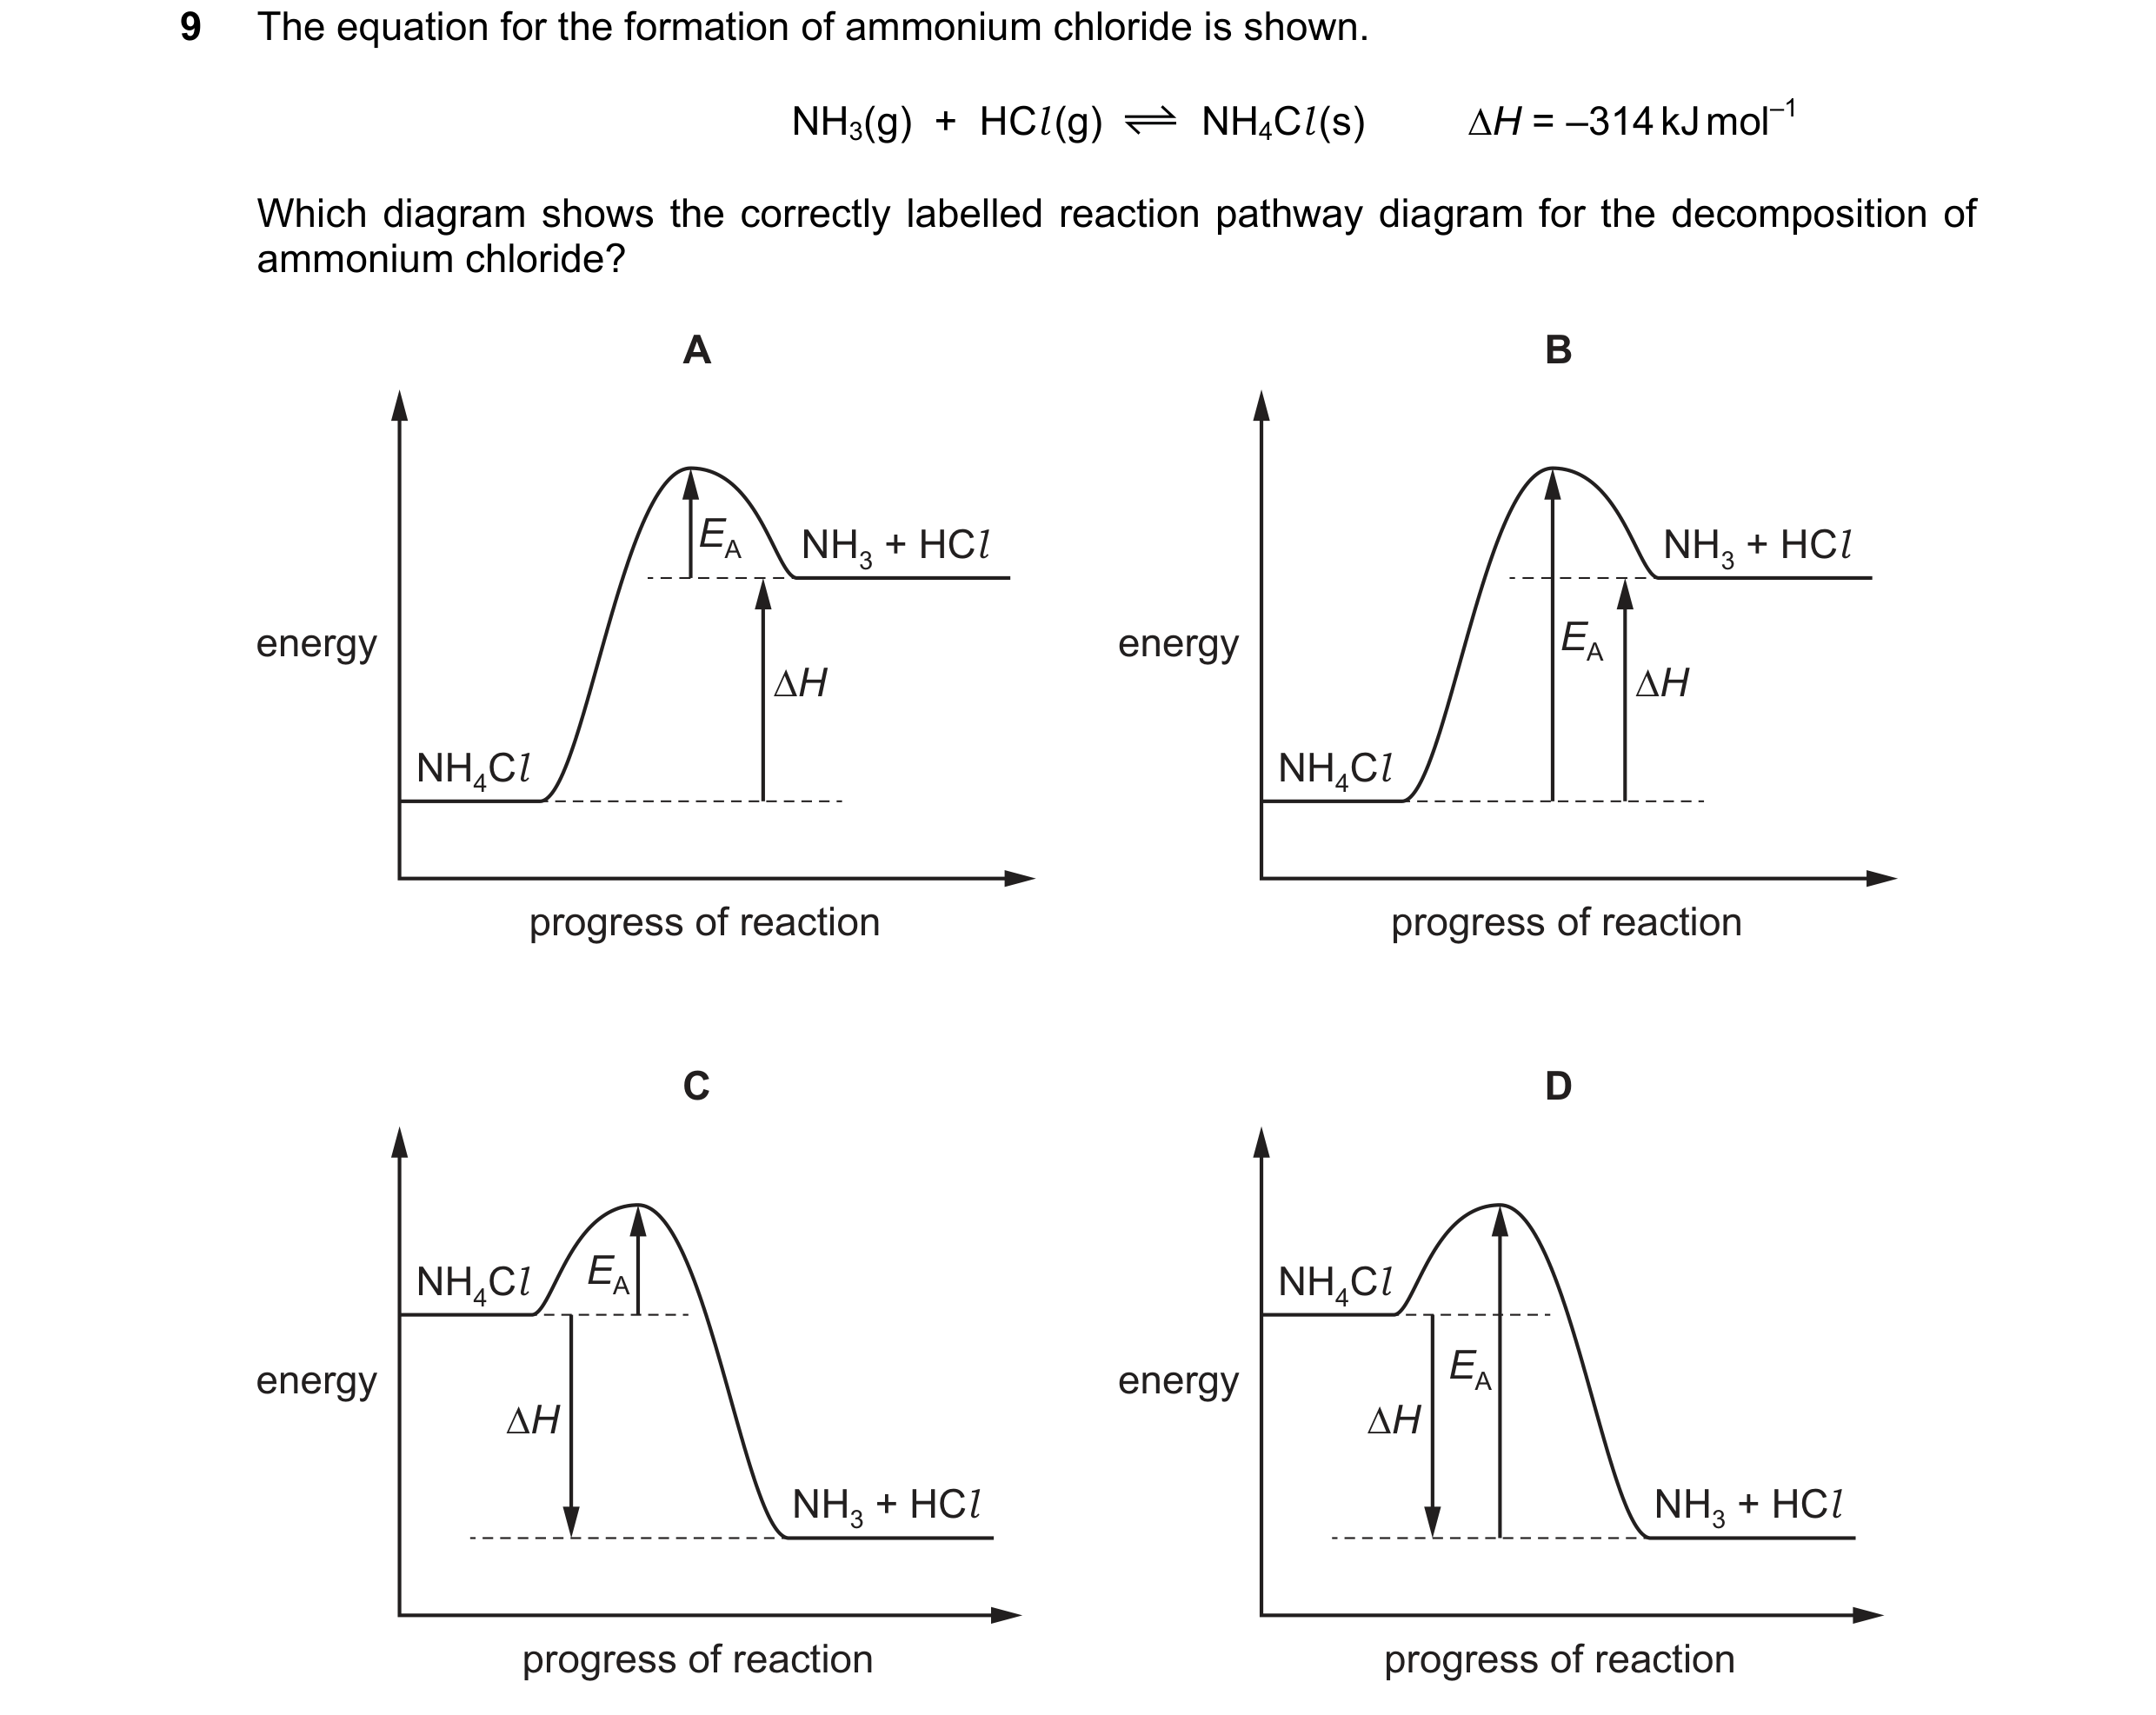
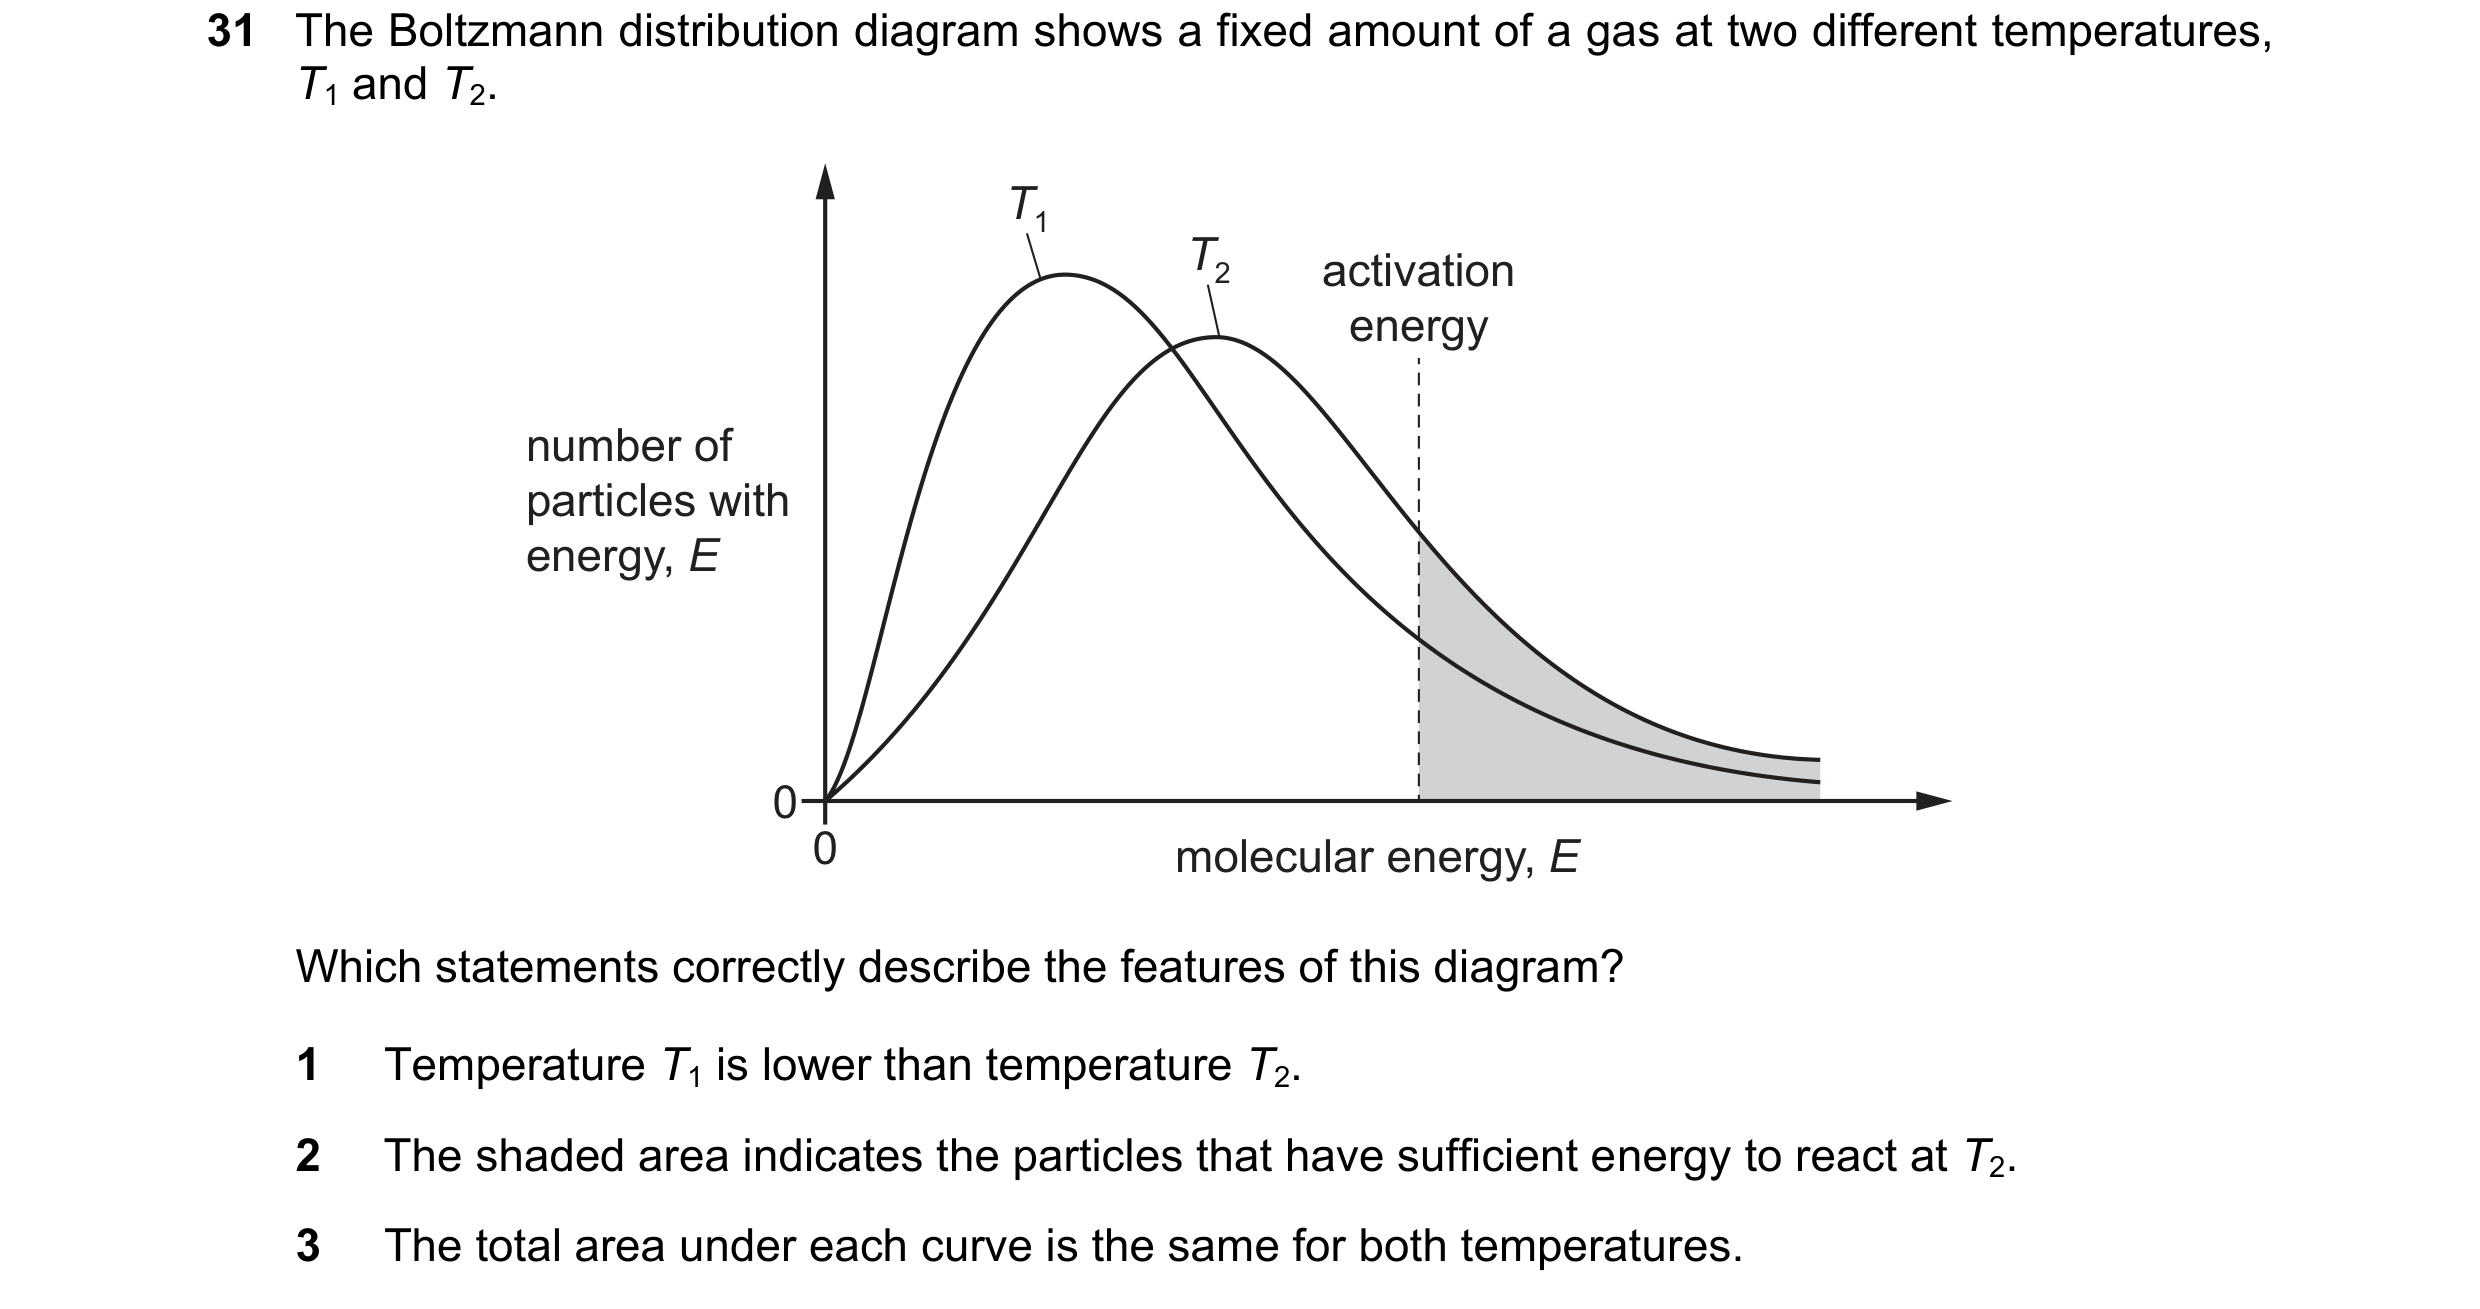 49 / 67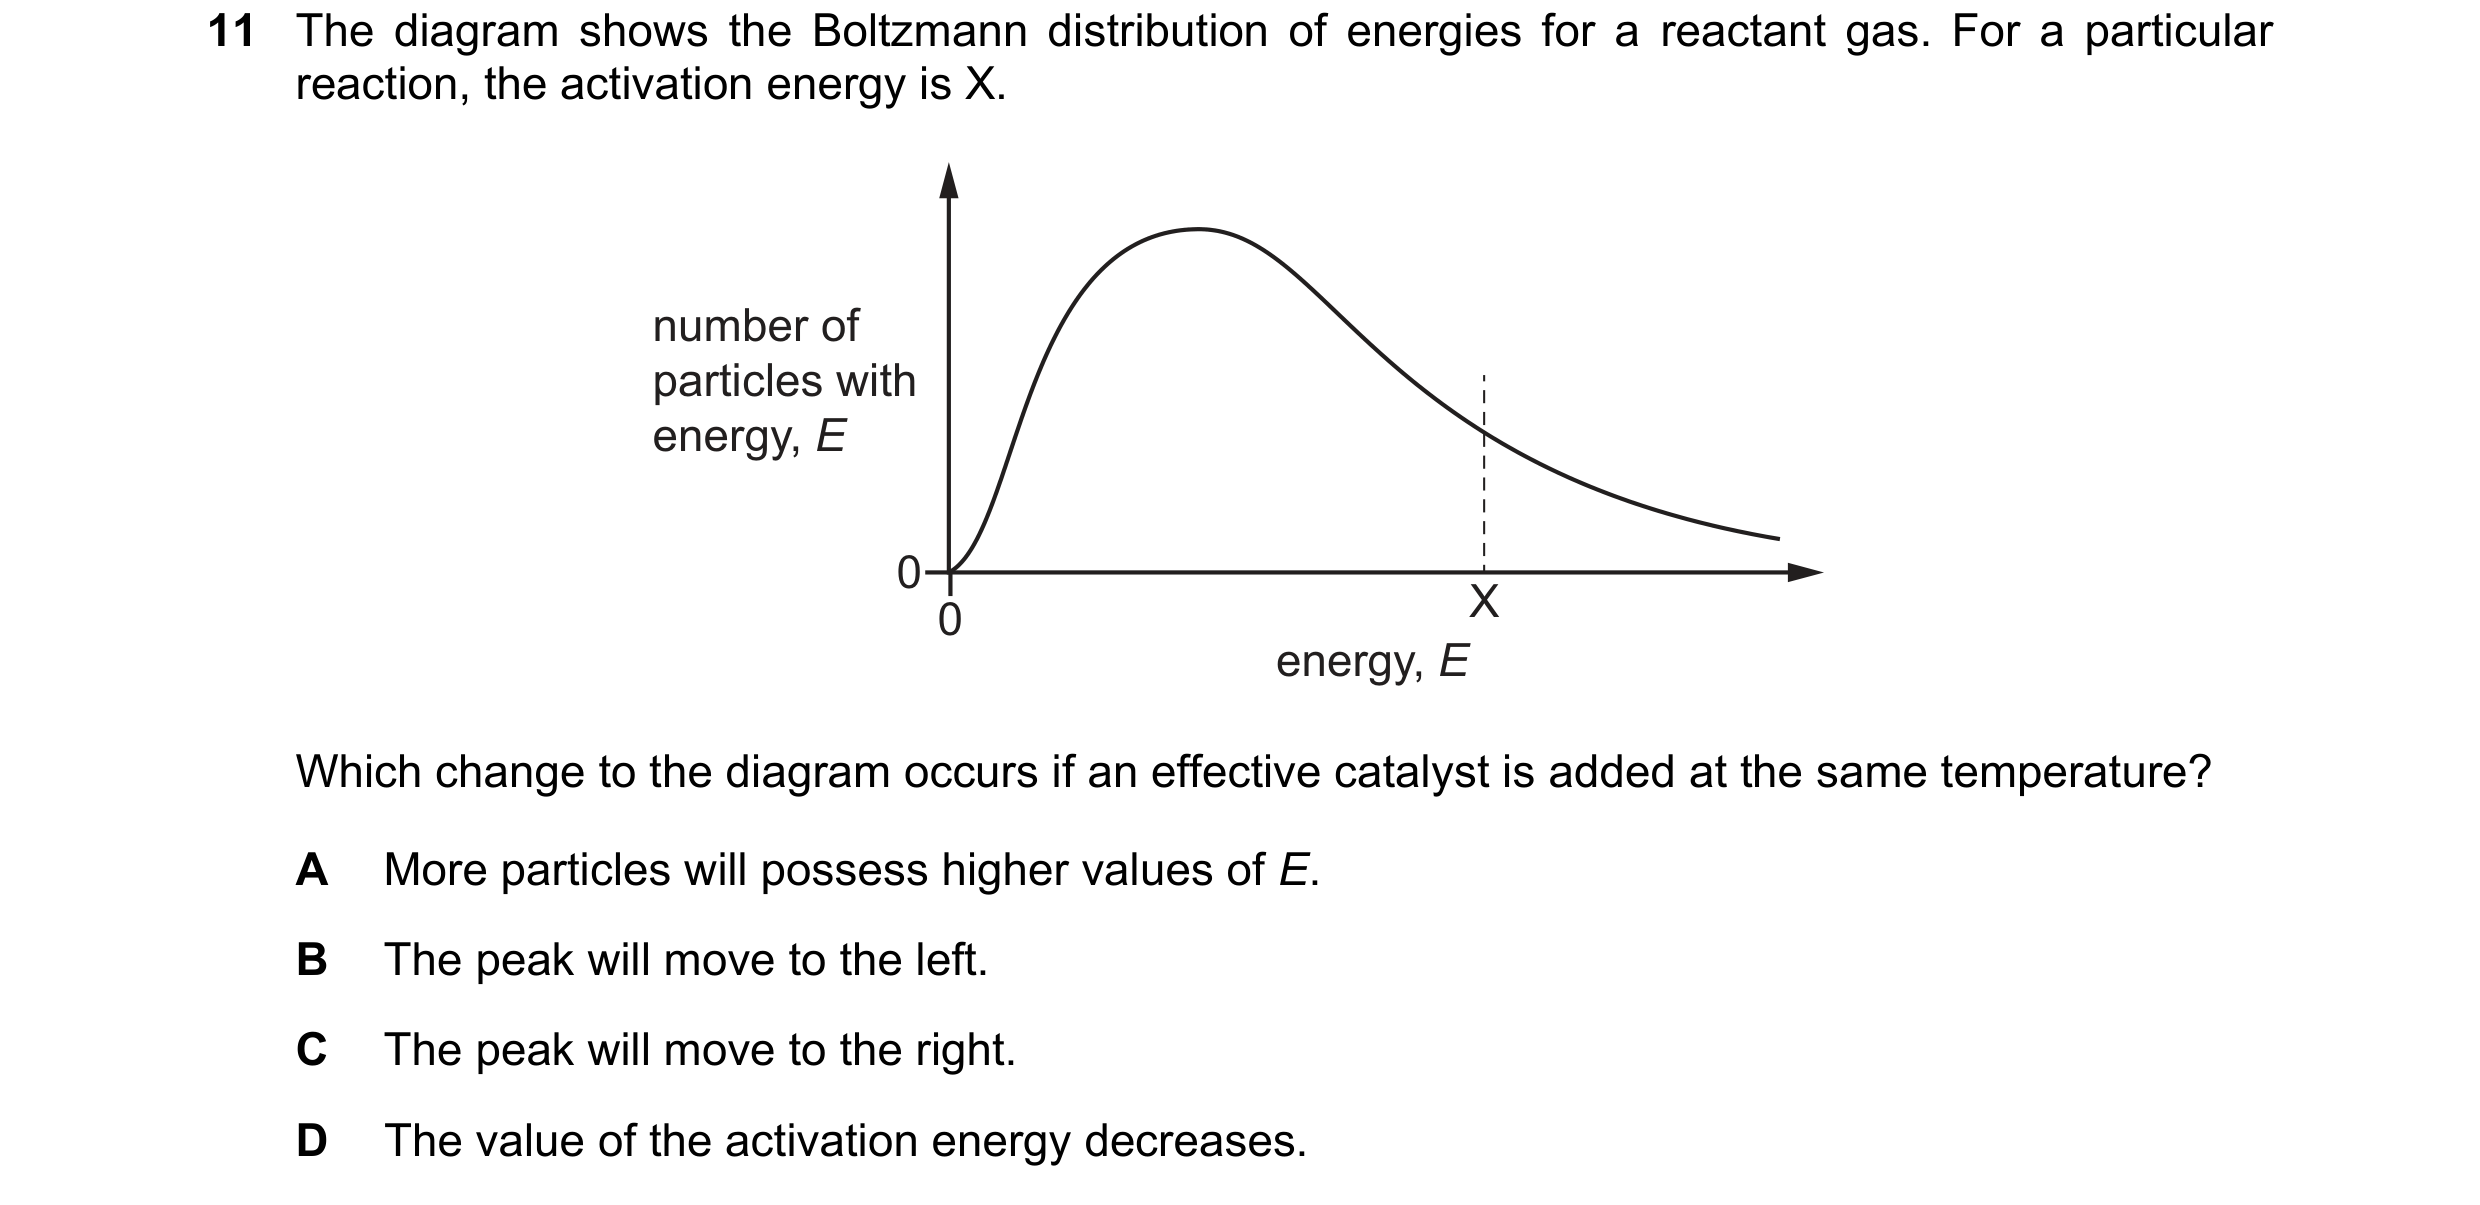
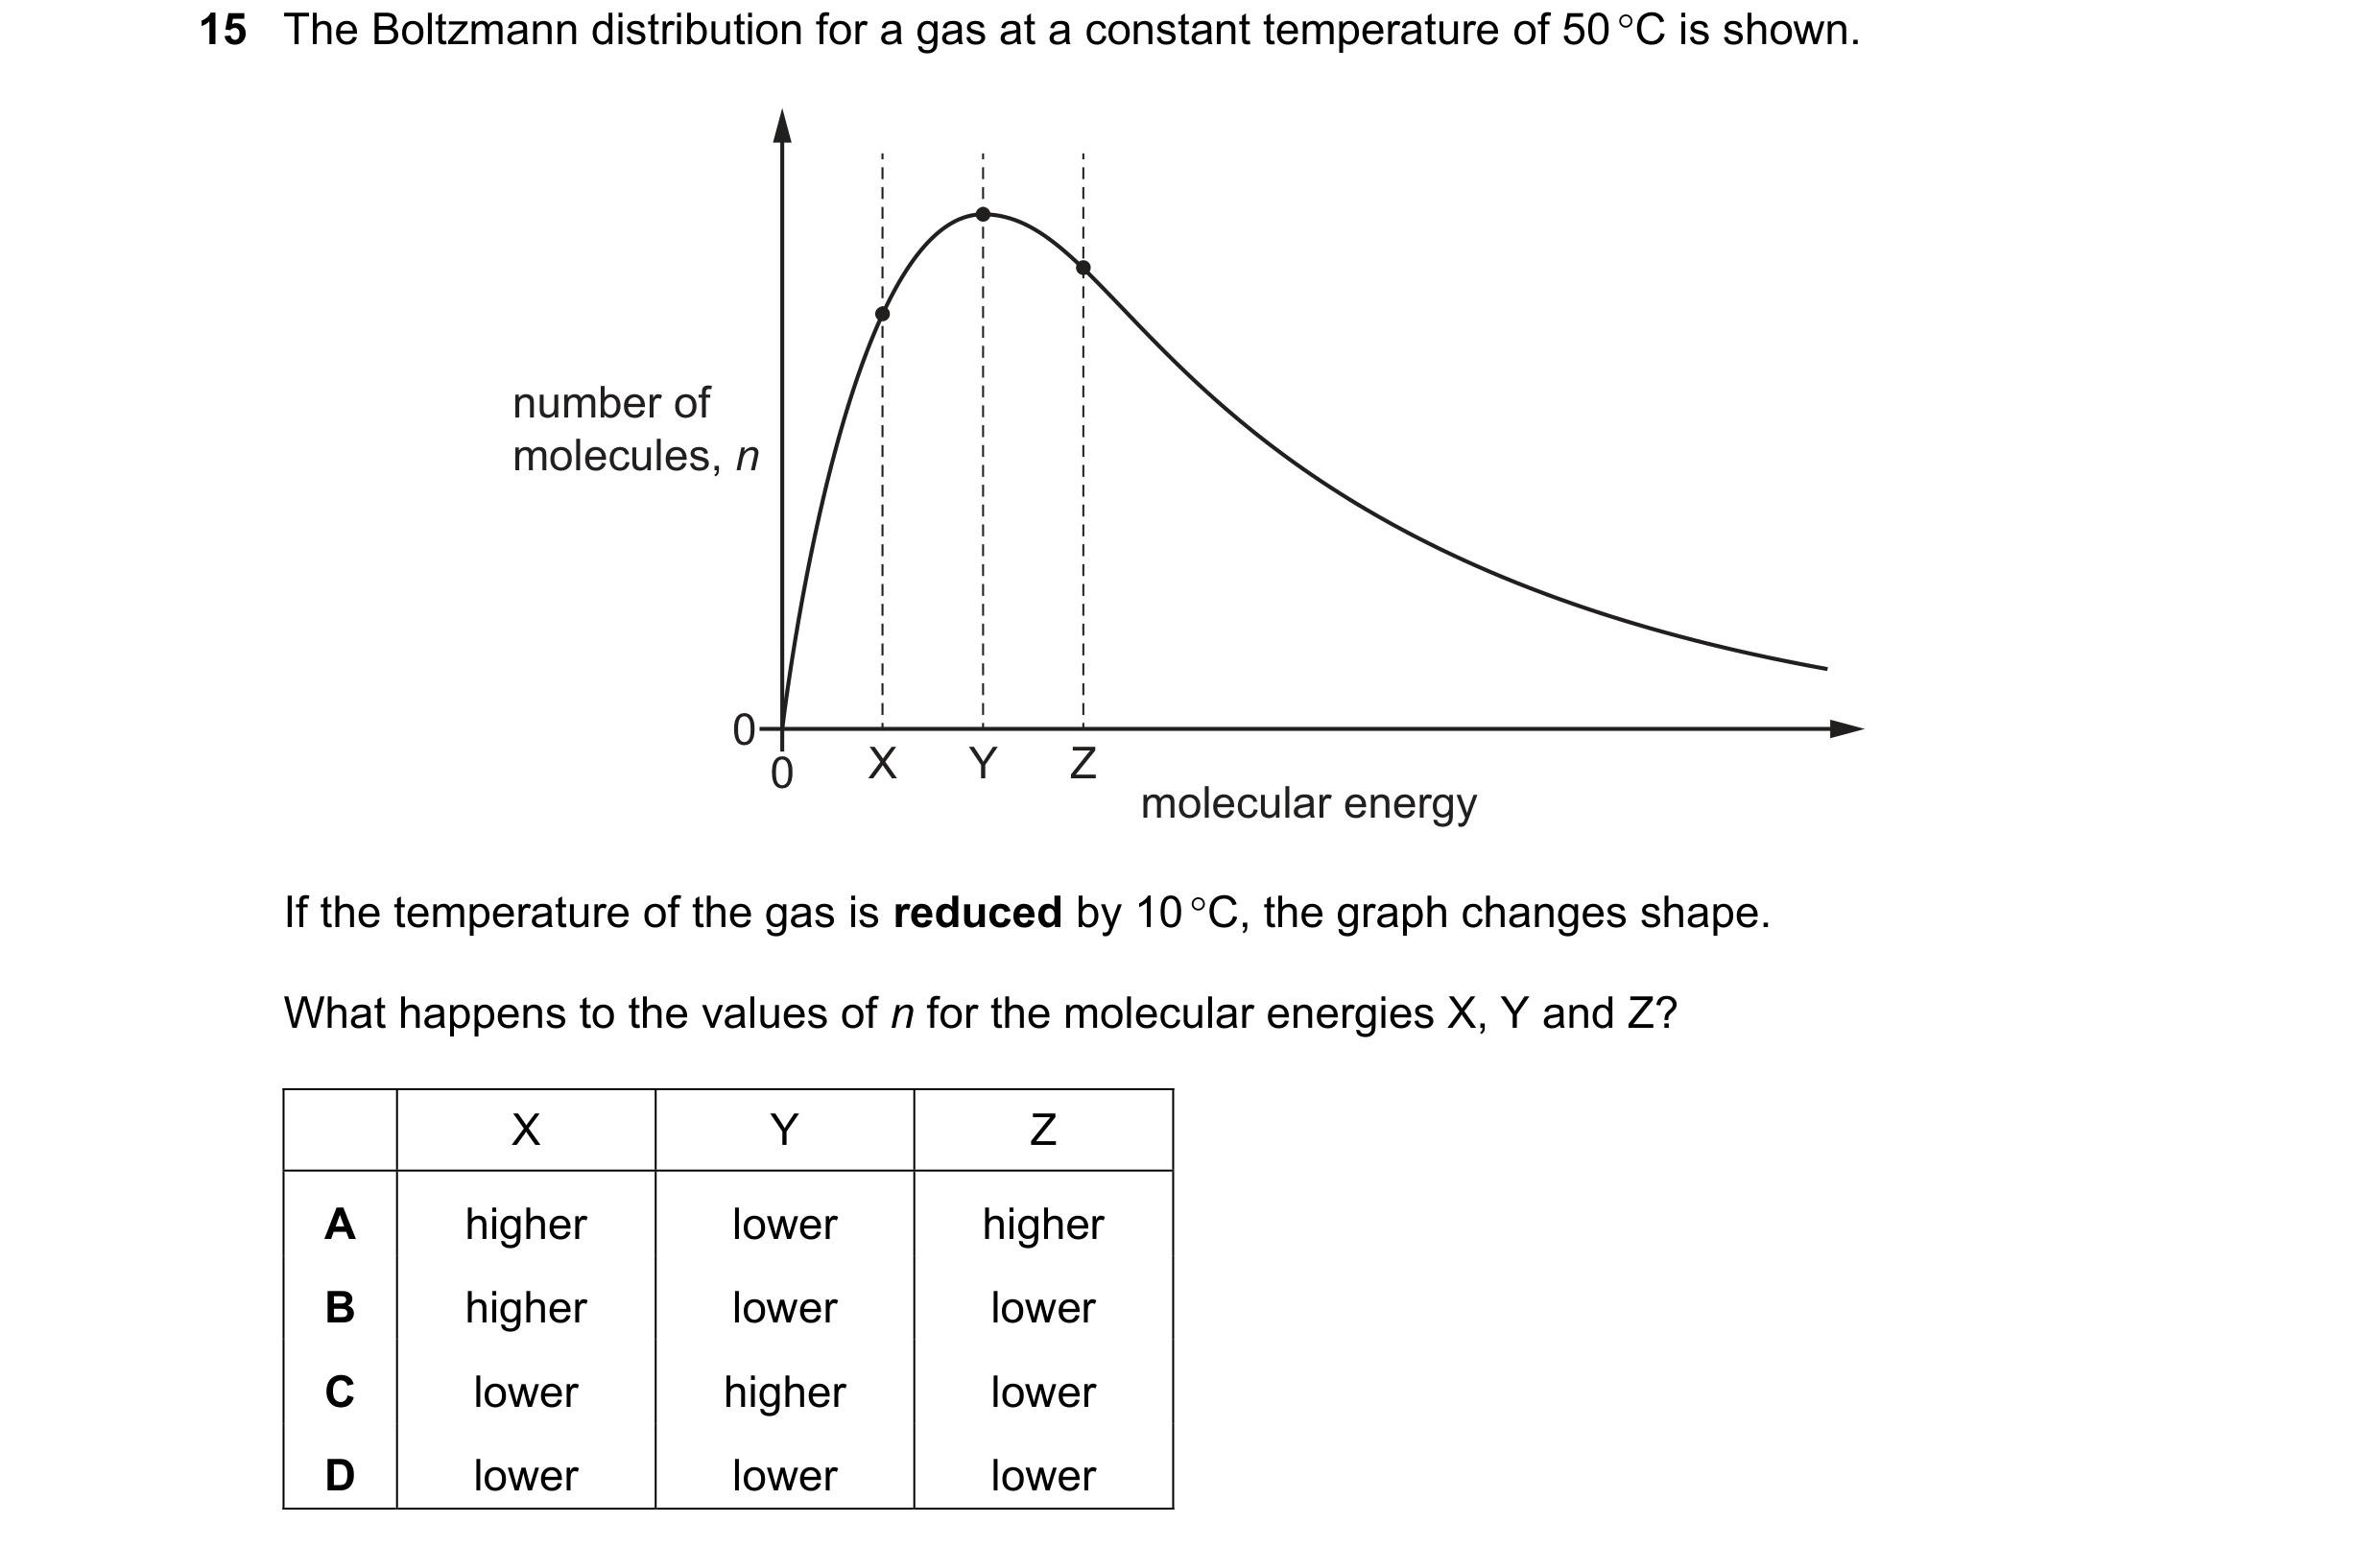 50 / 67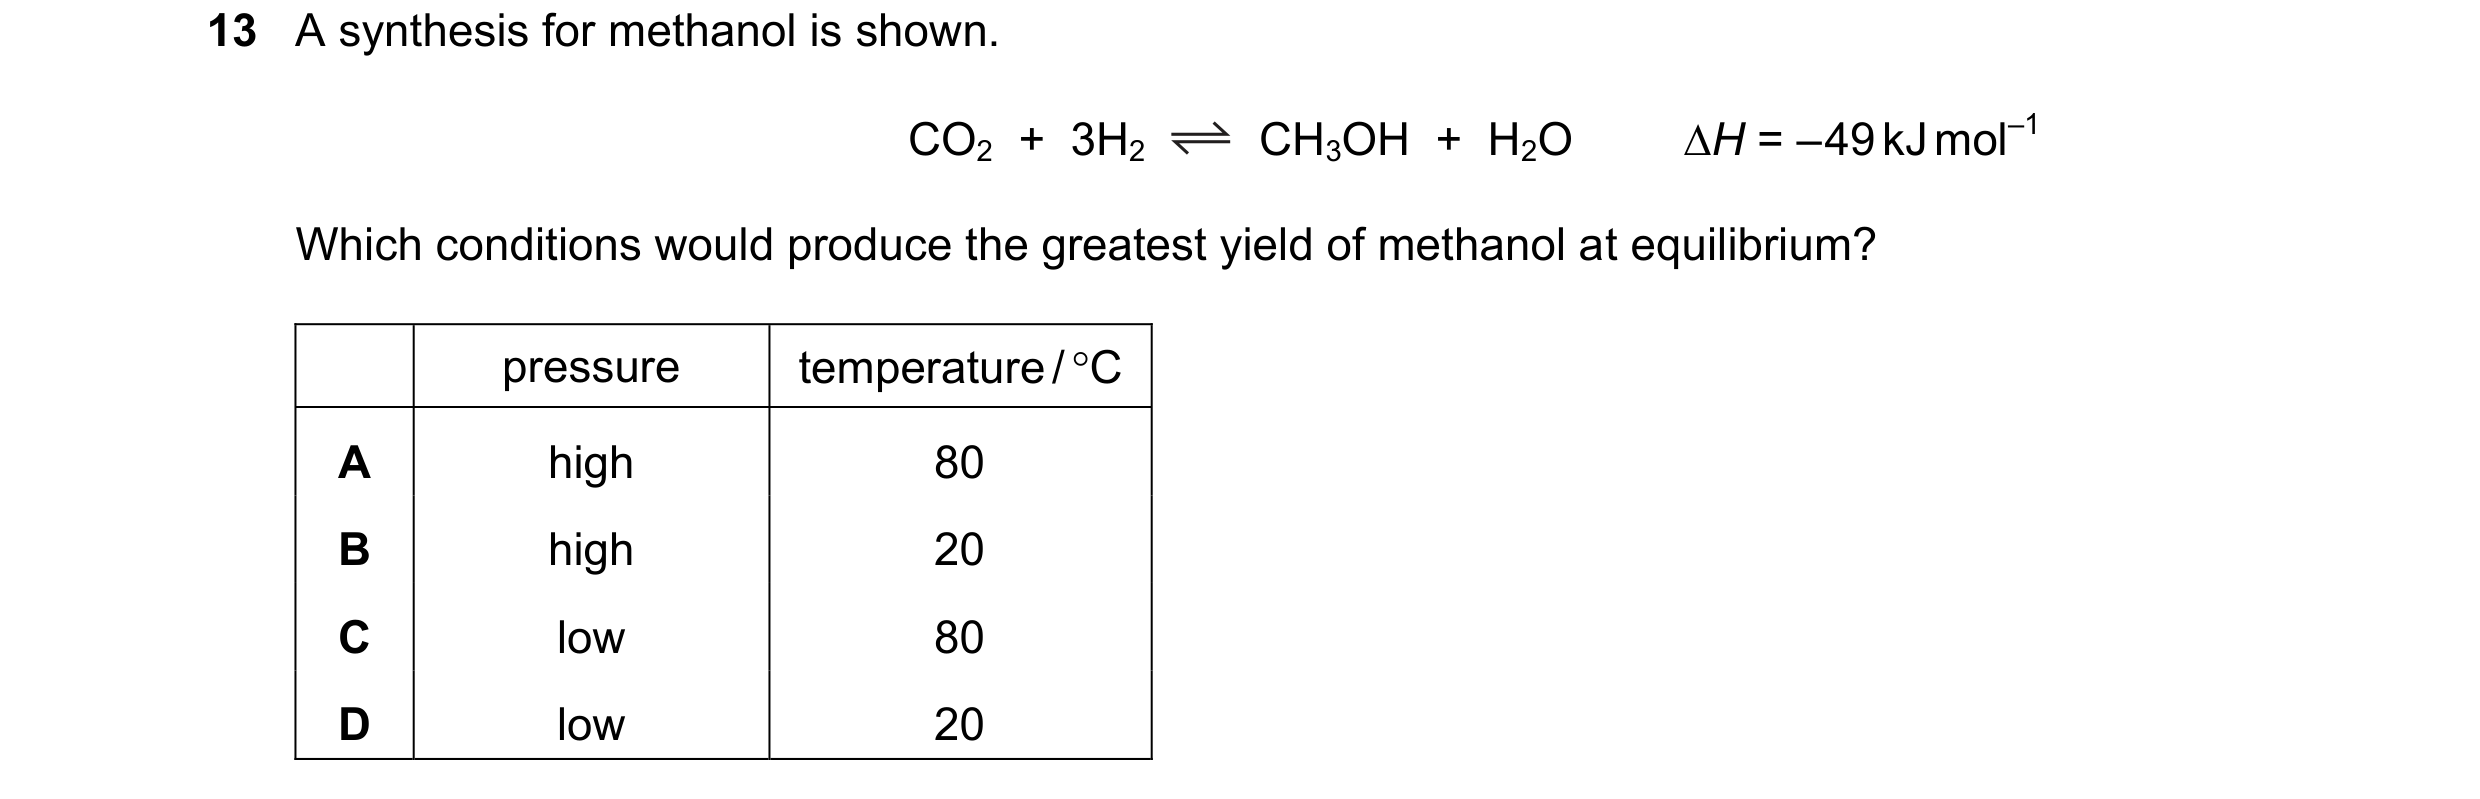
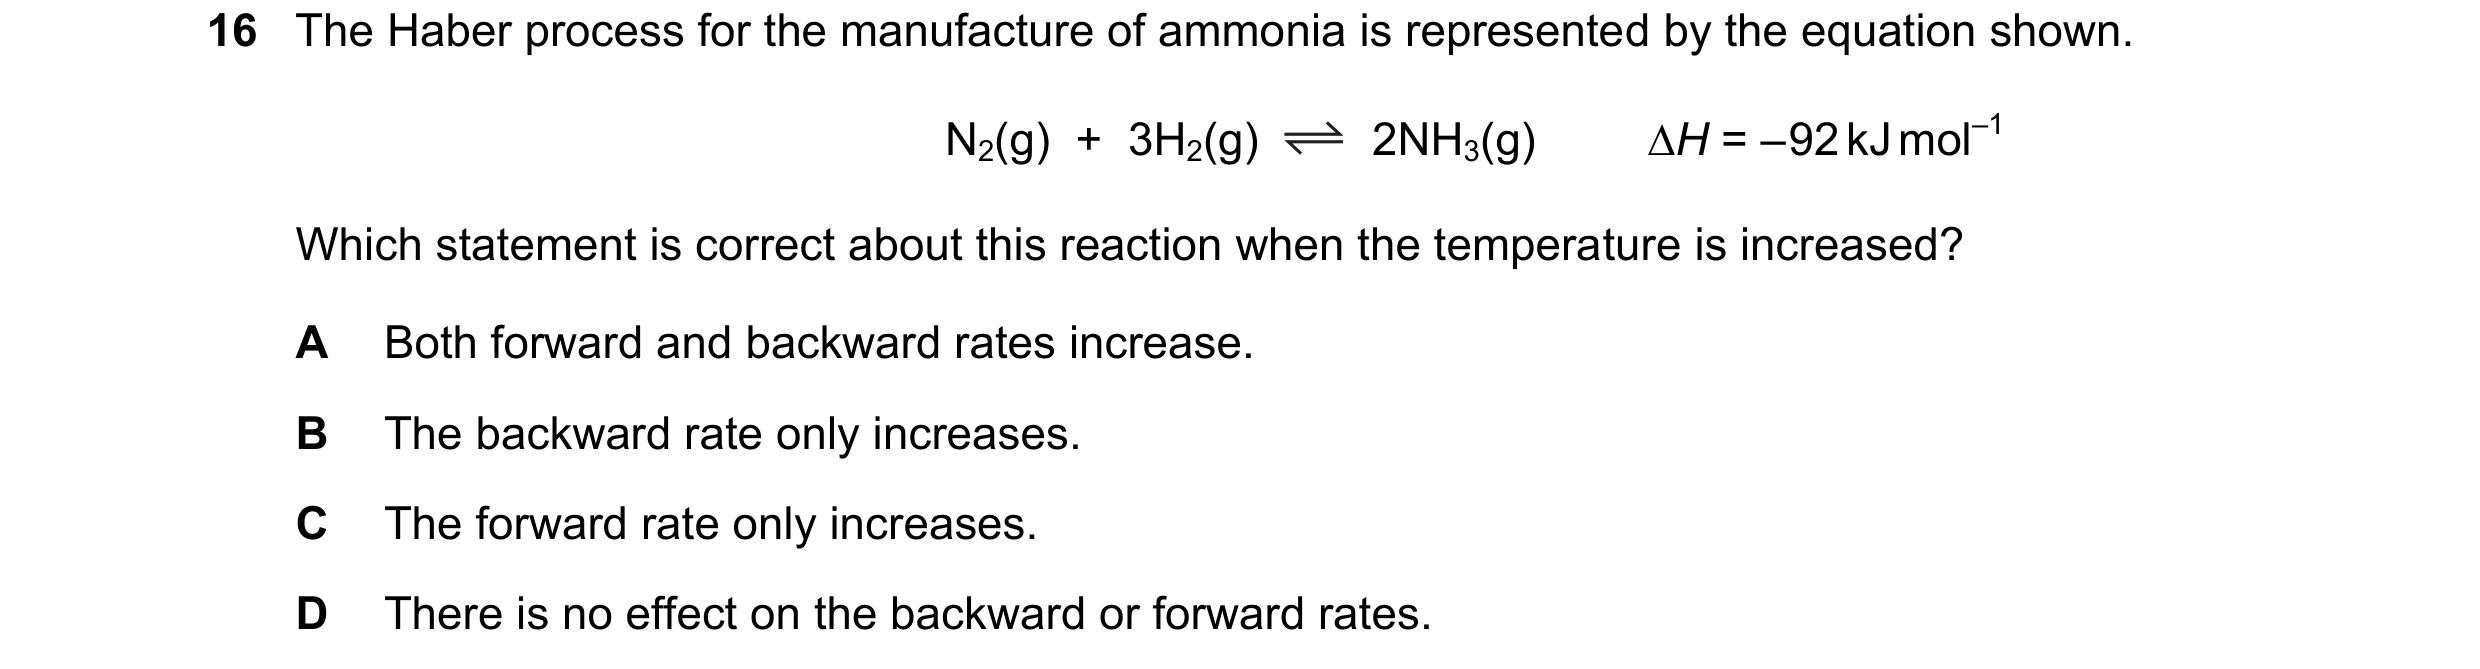 51 / 67
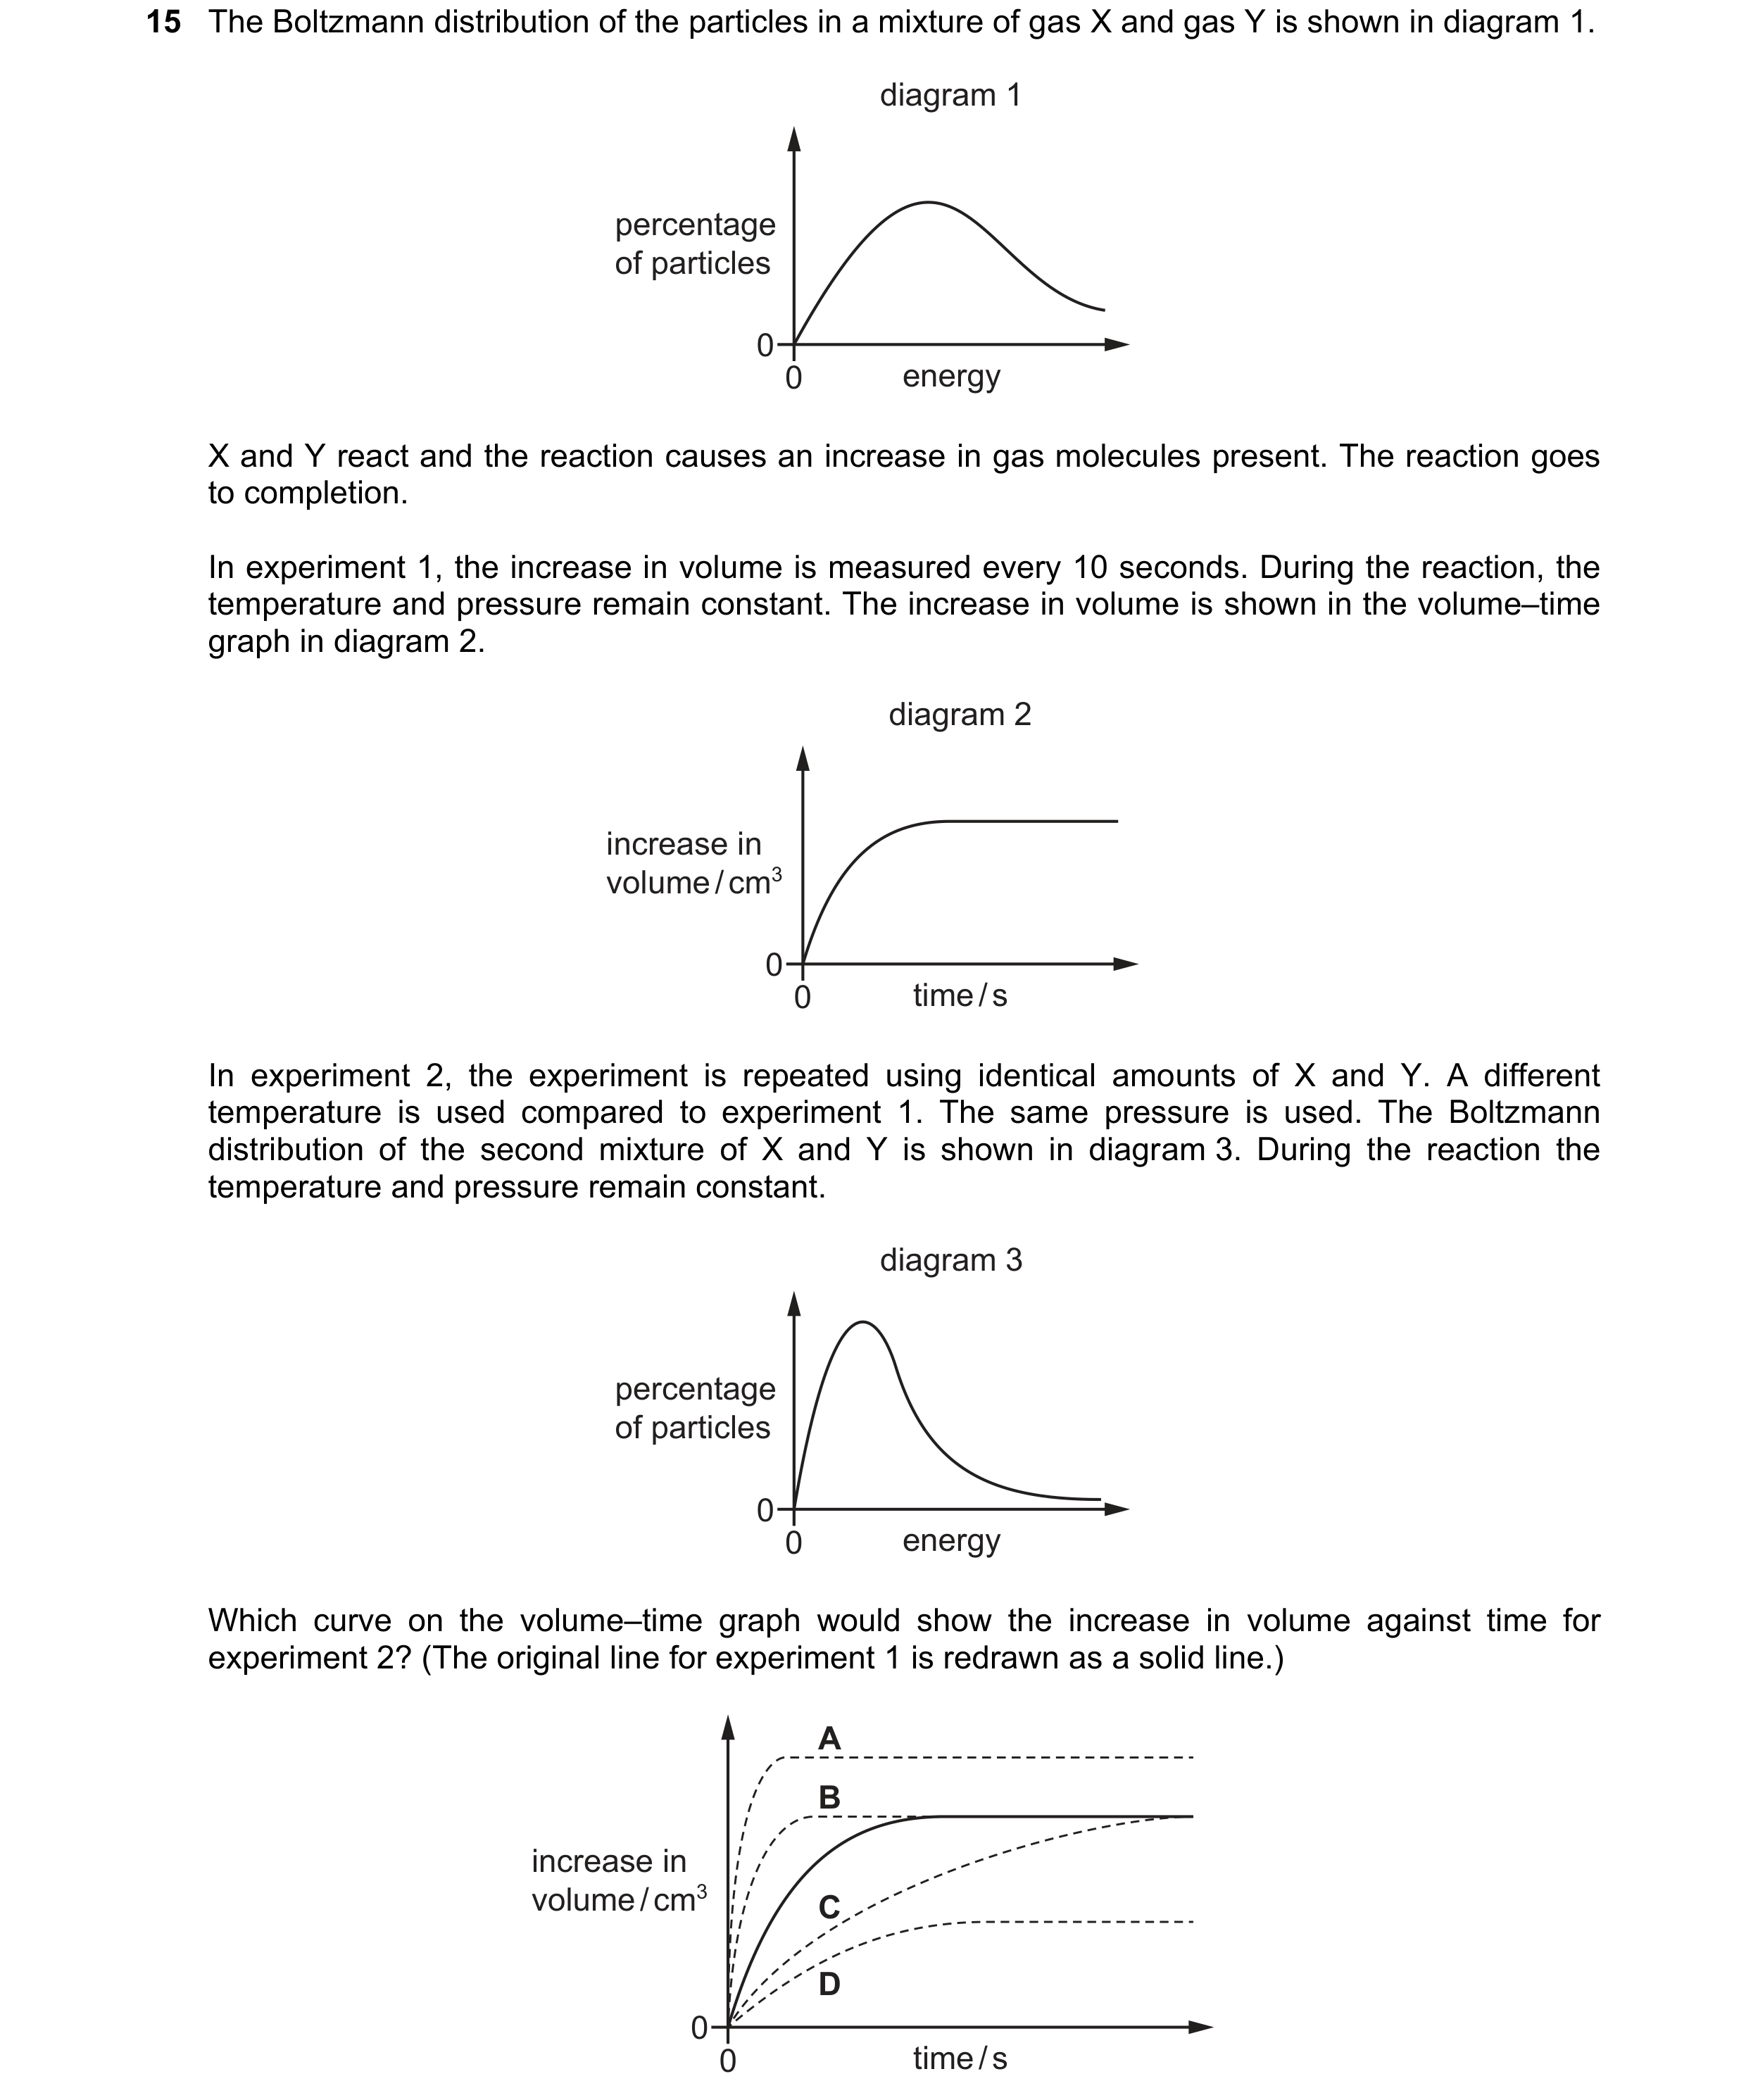 52 / 67
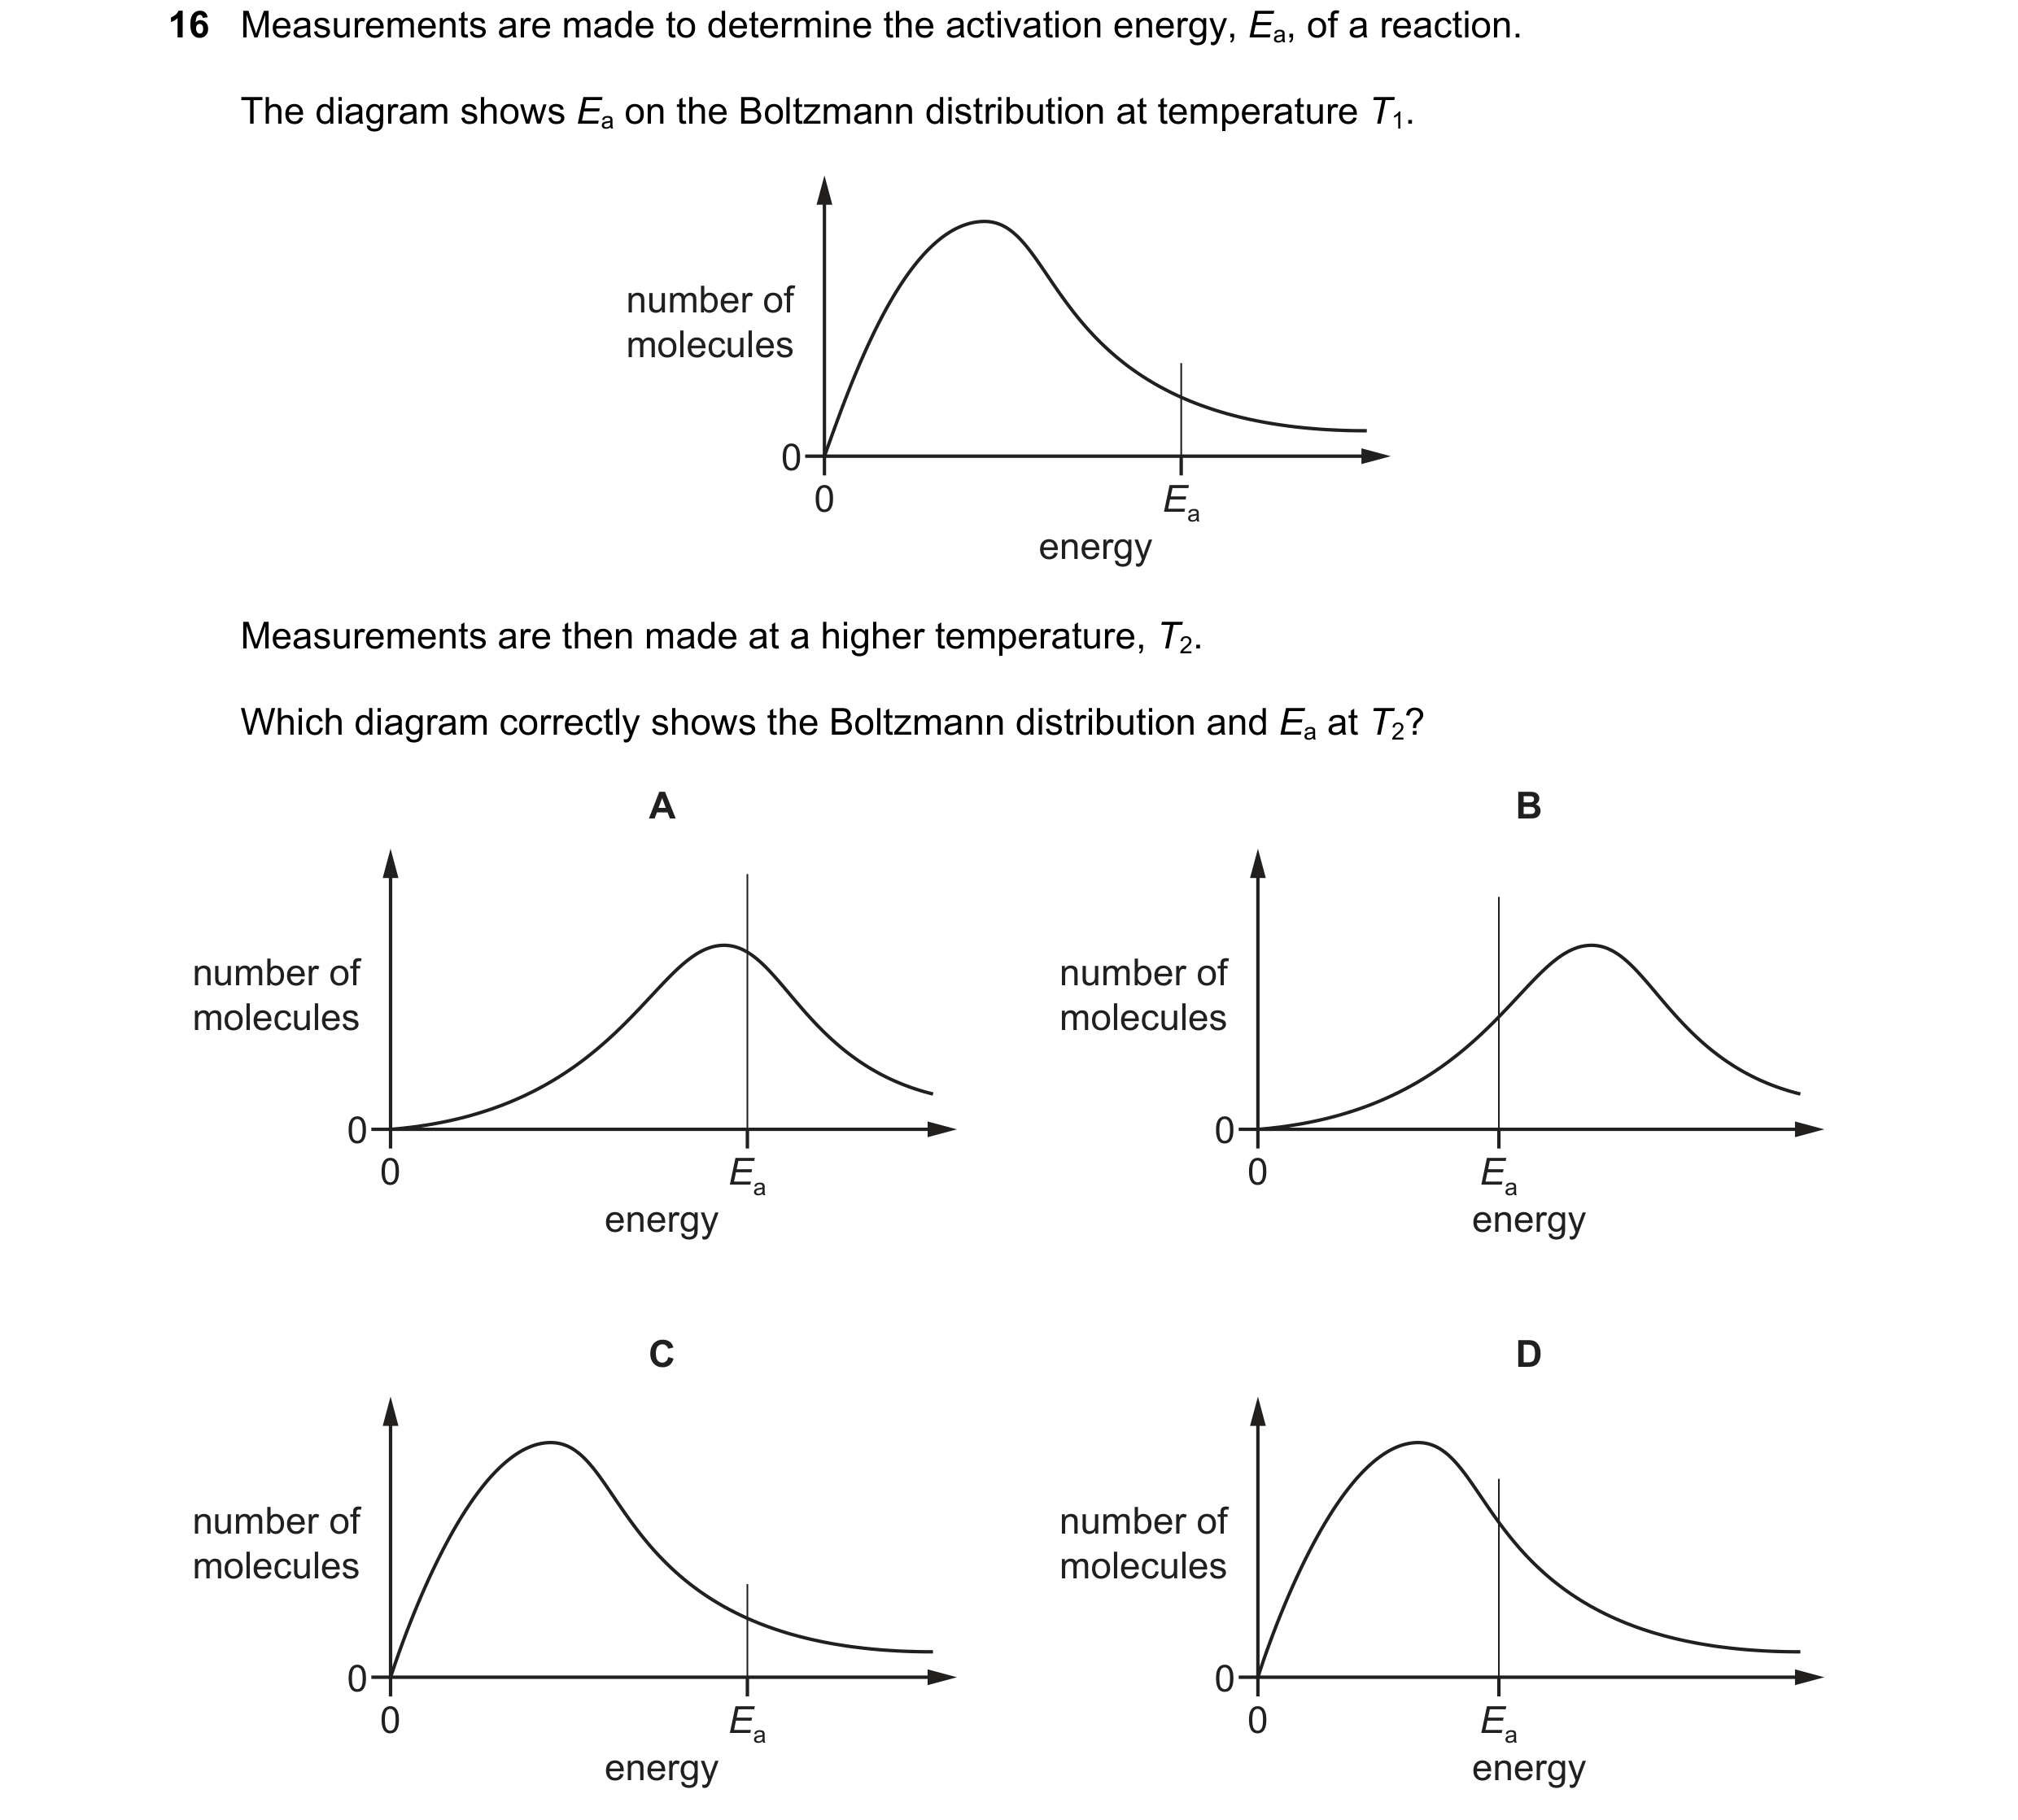 53 / 67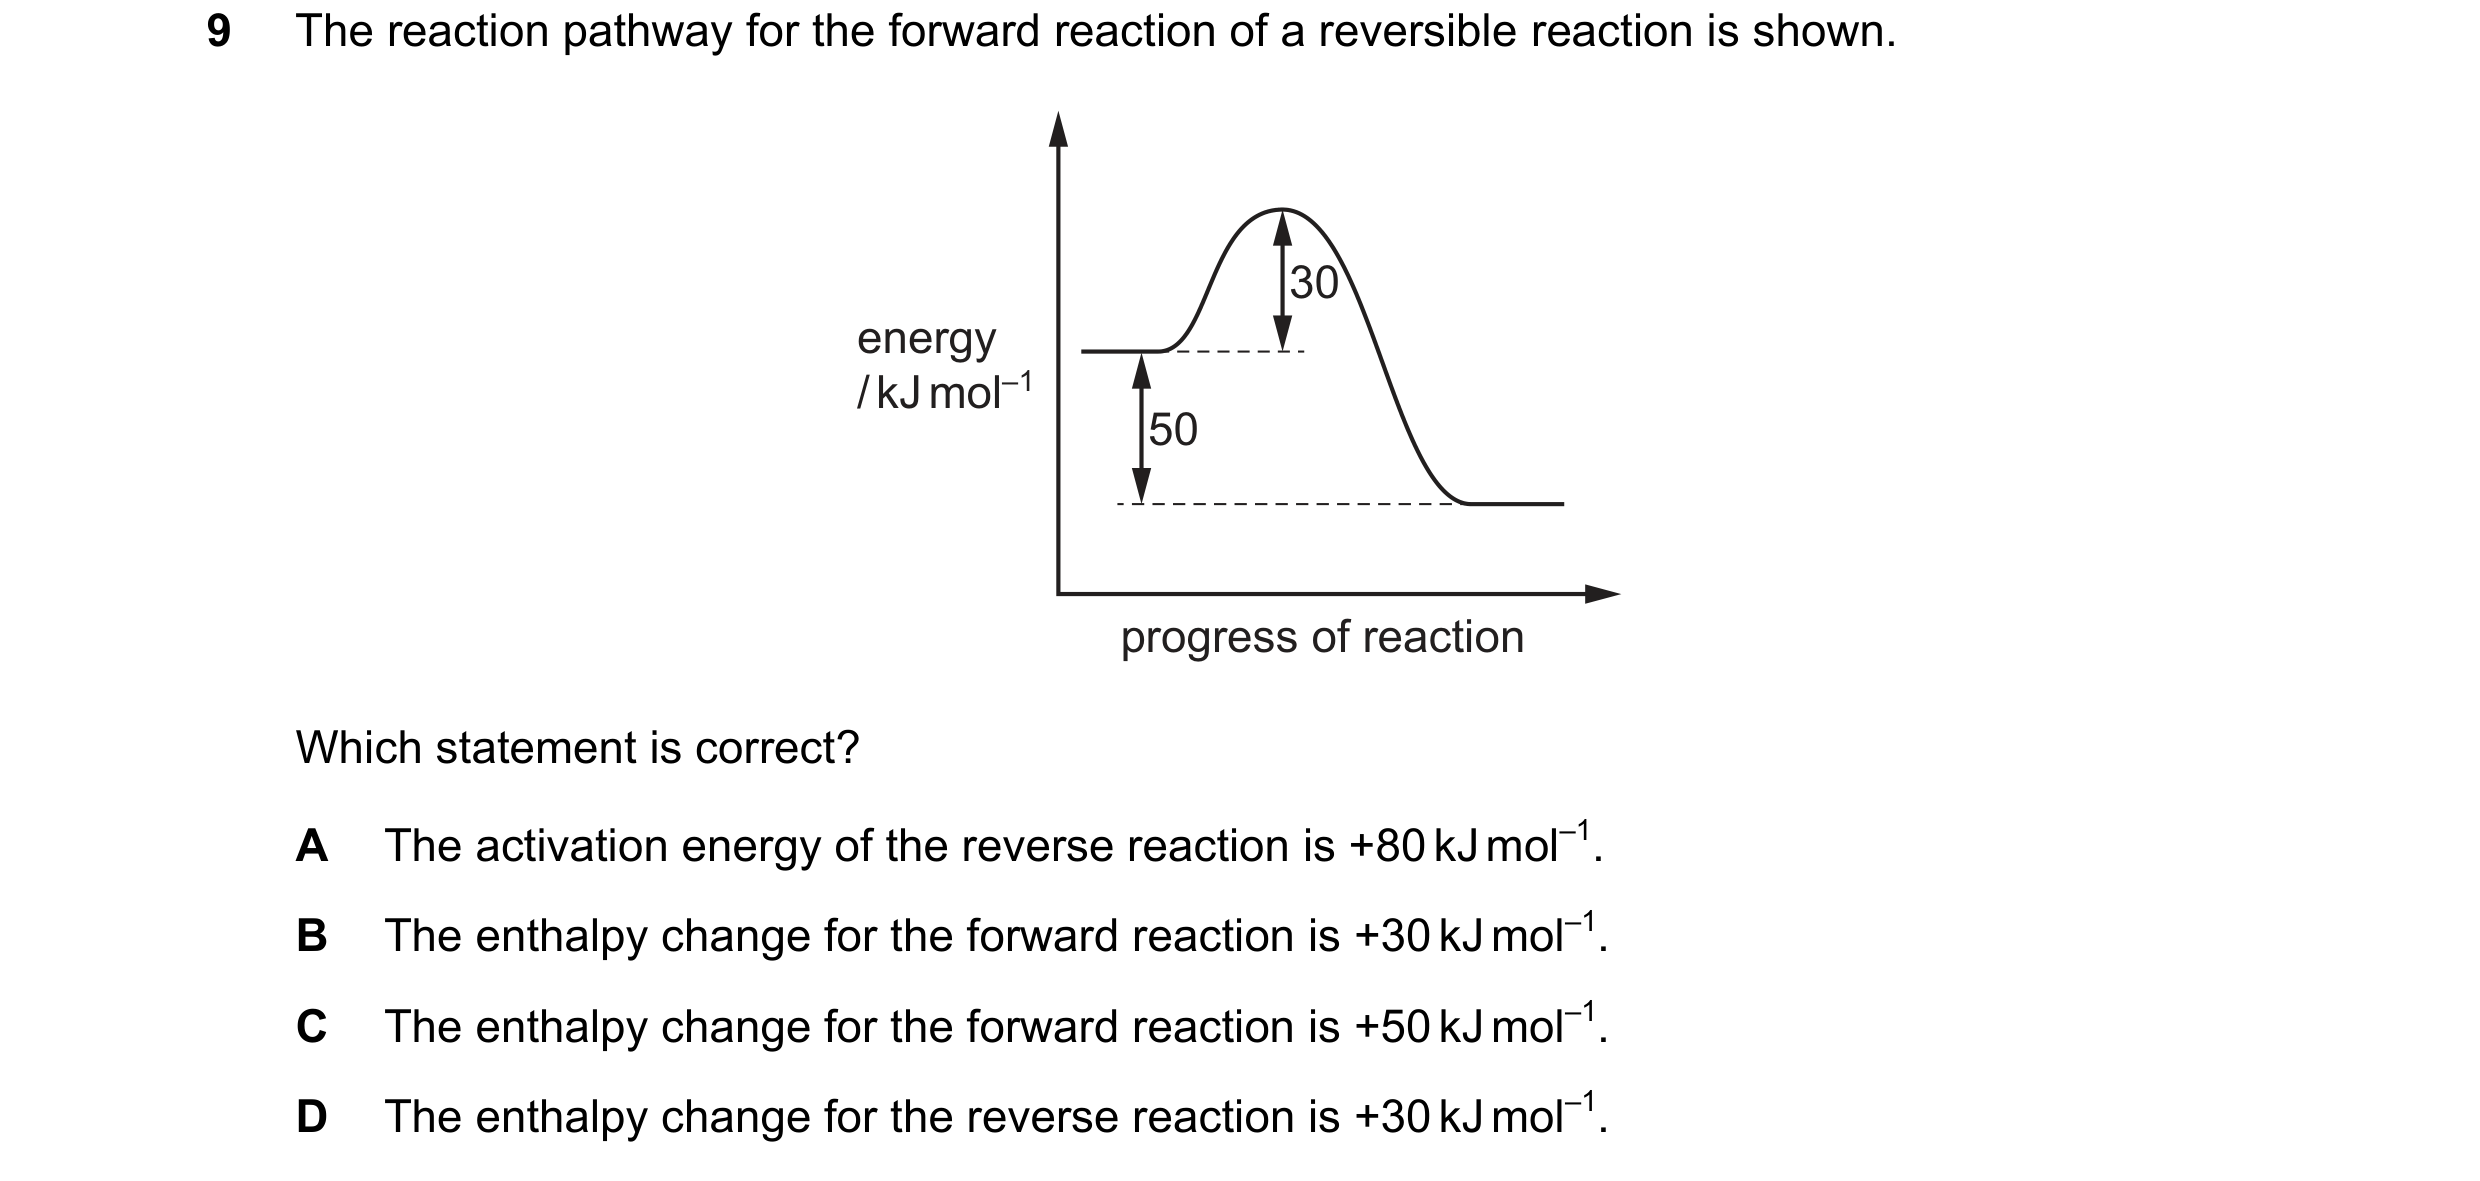
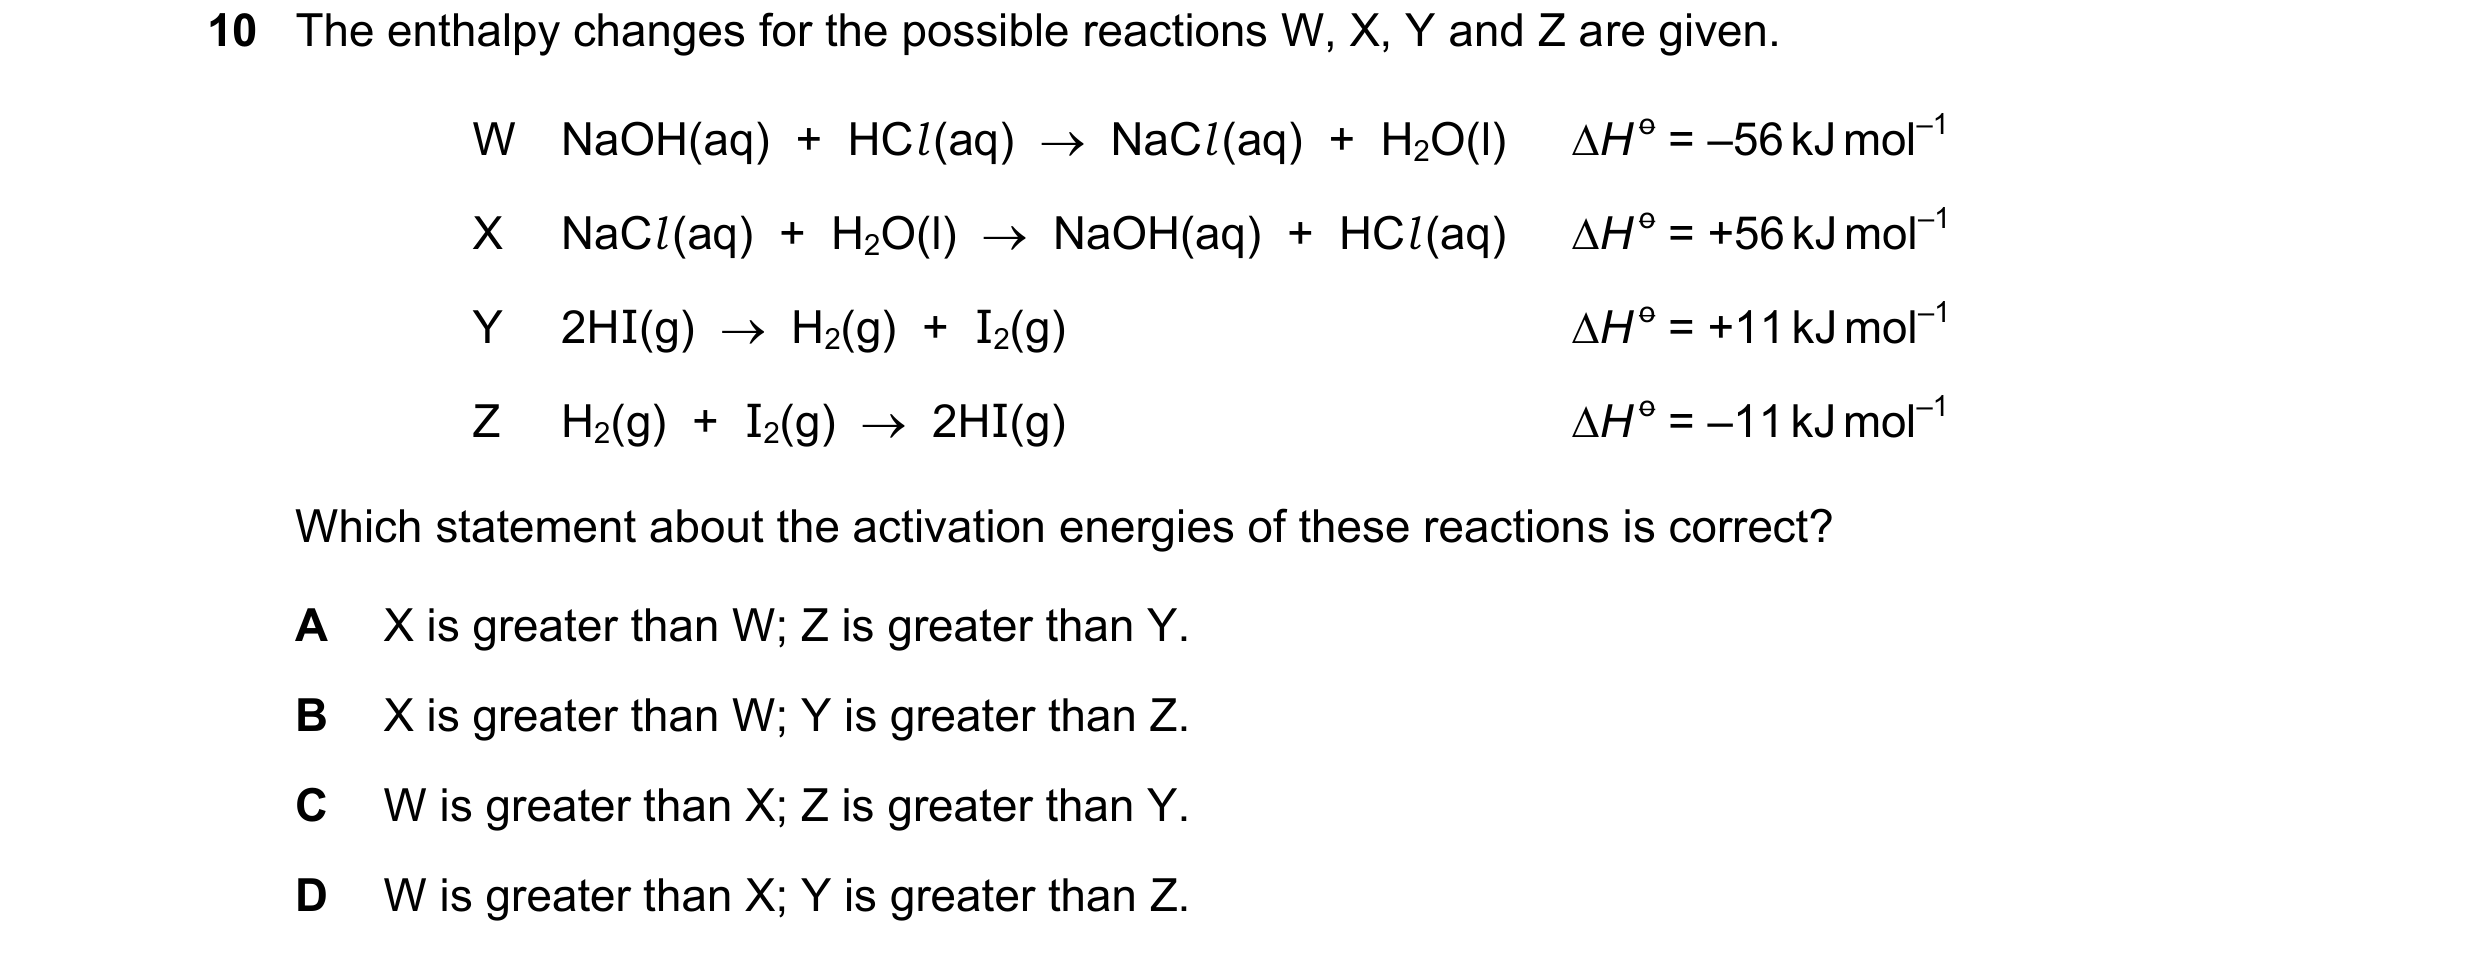
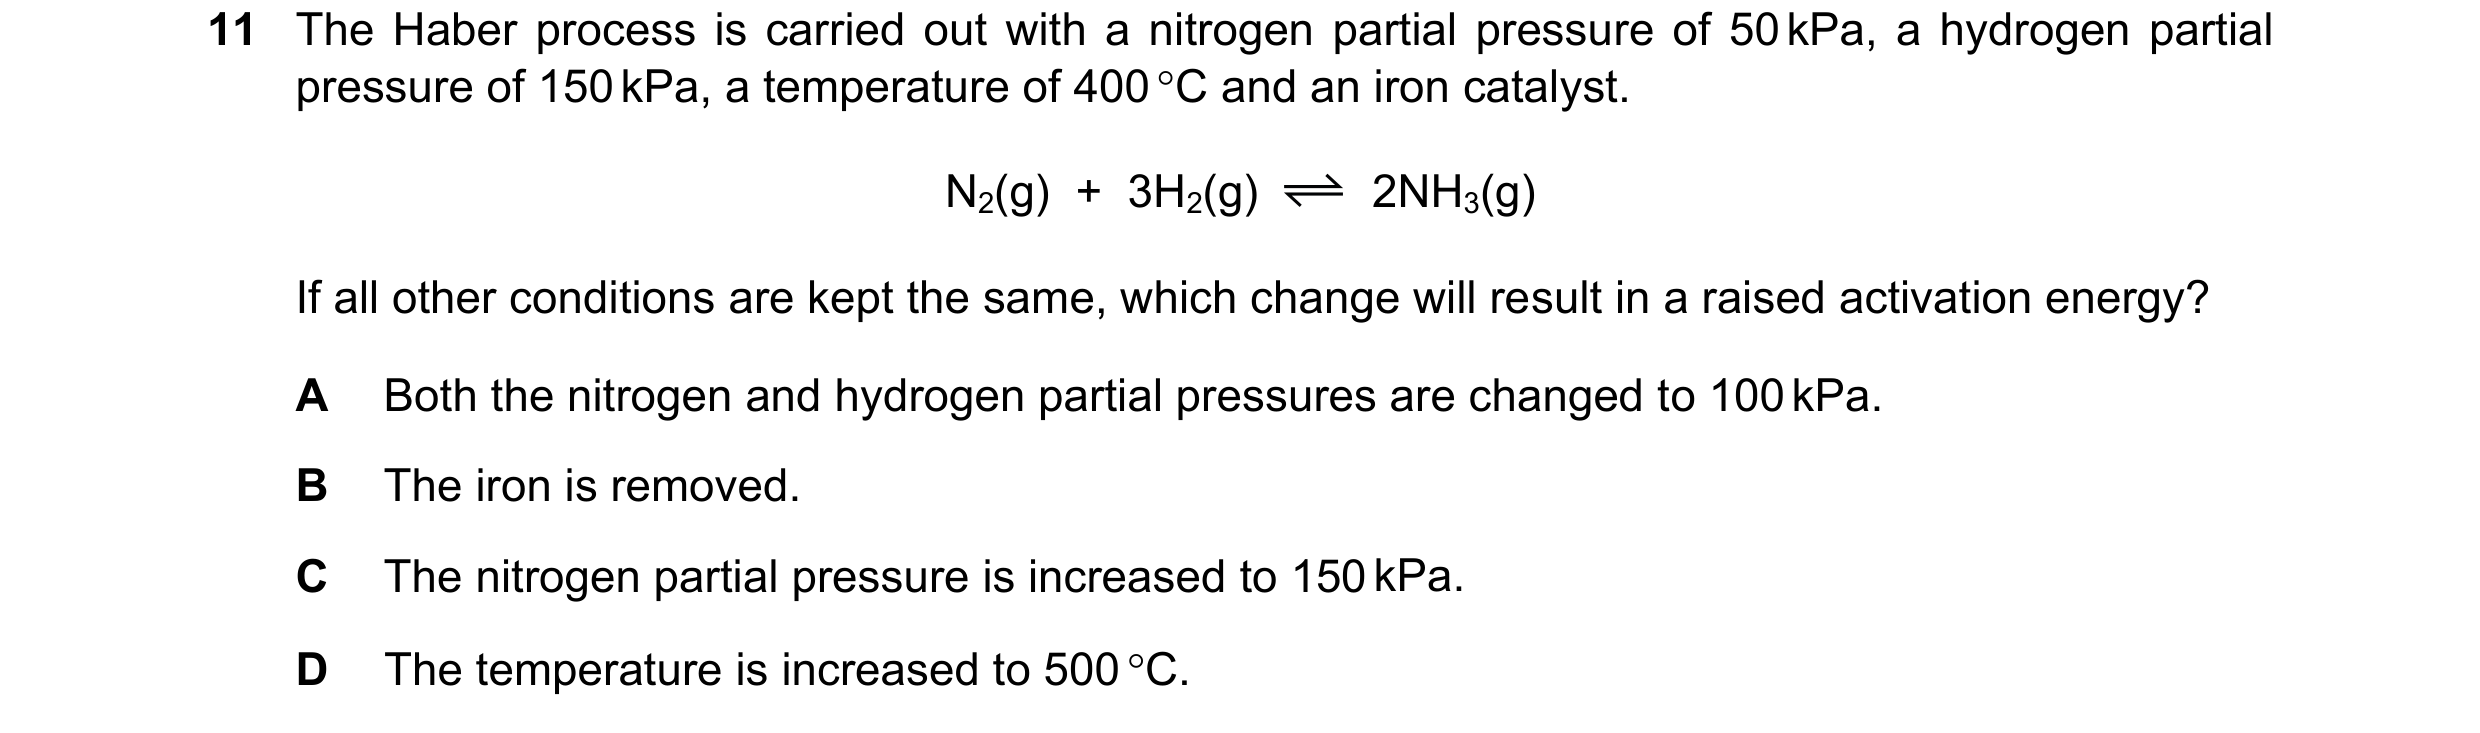 54 / 67
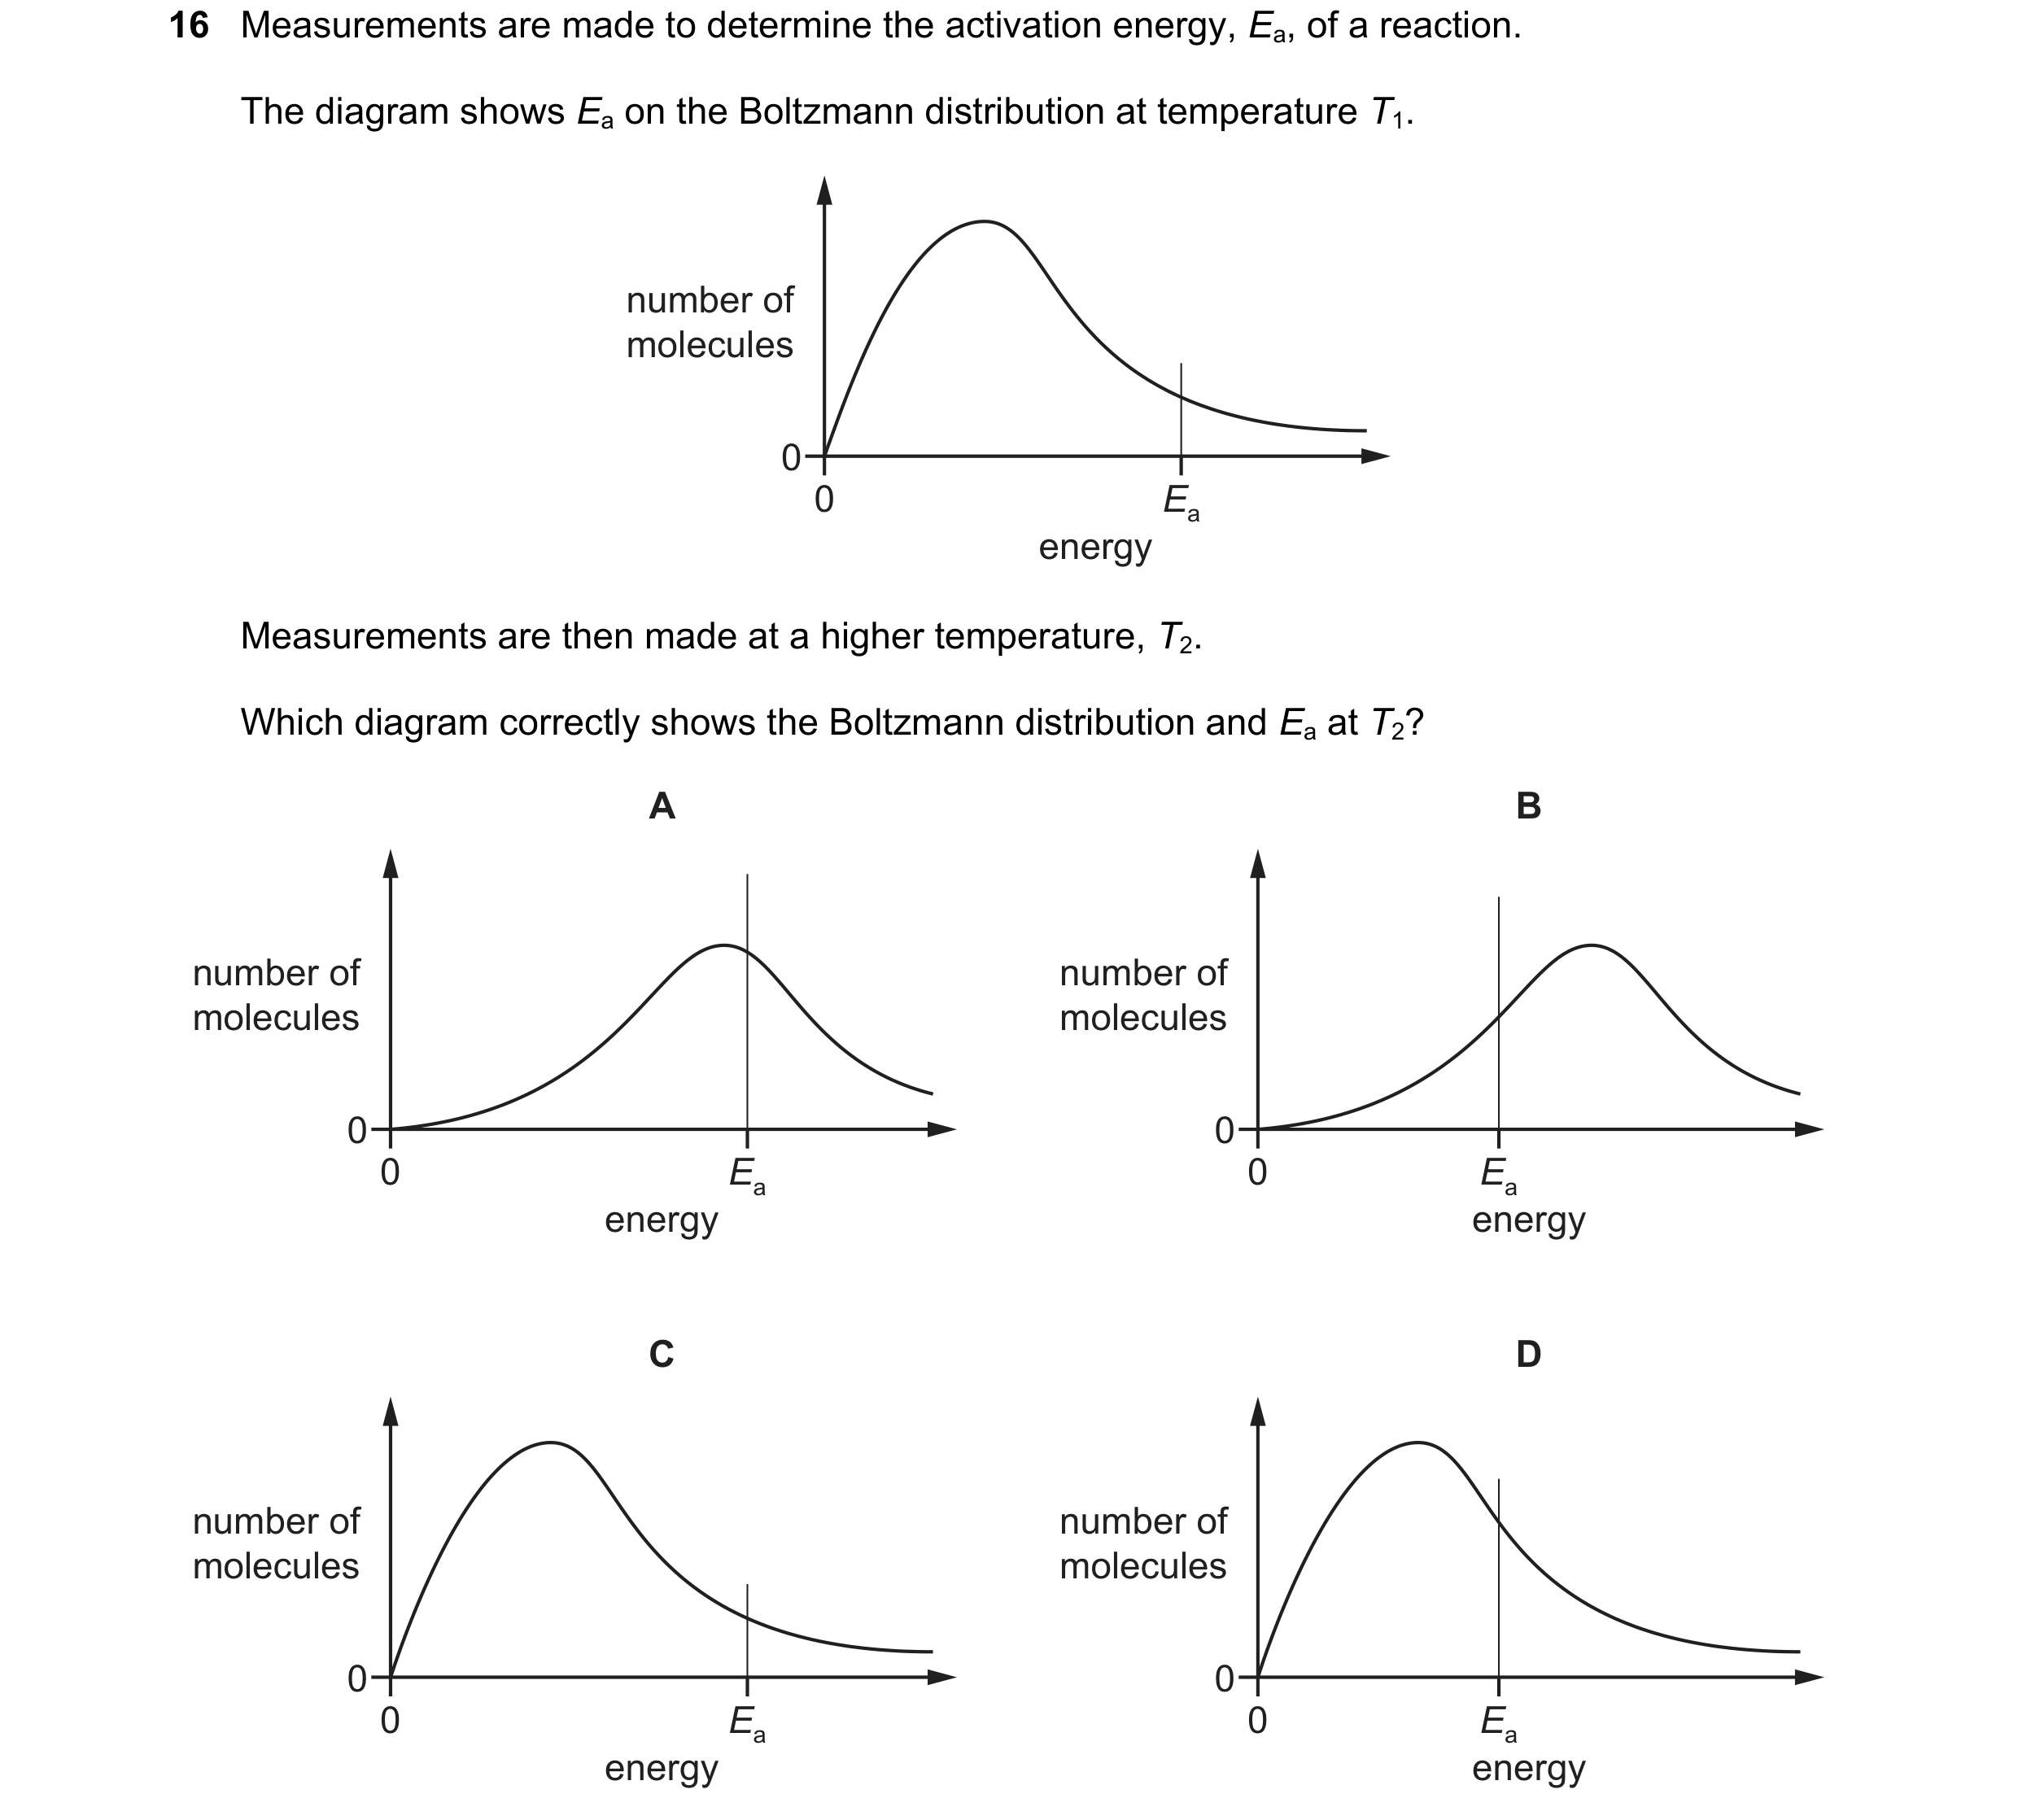 55 / 67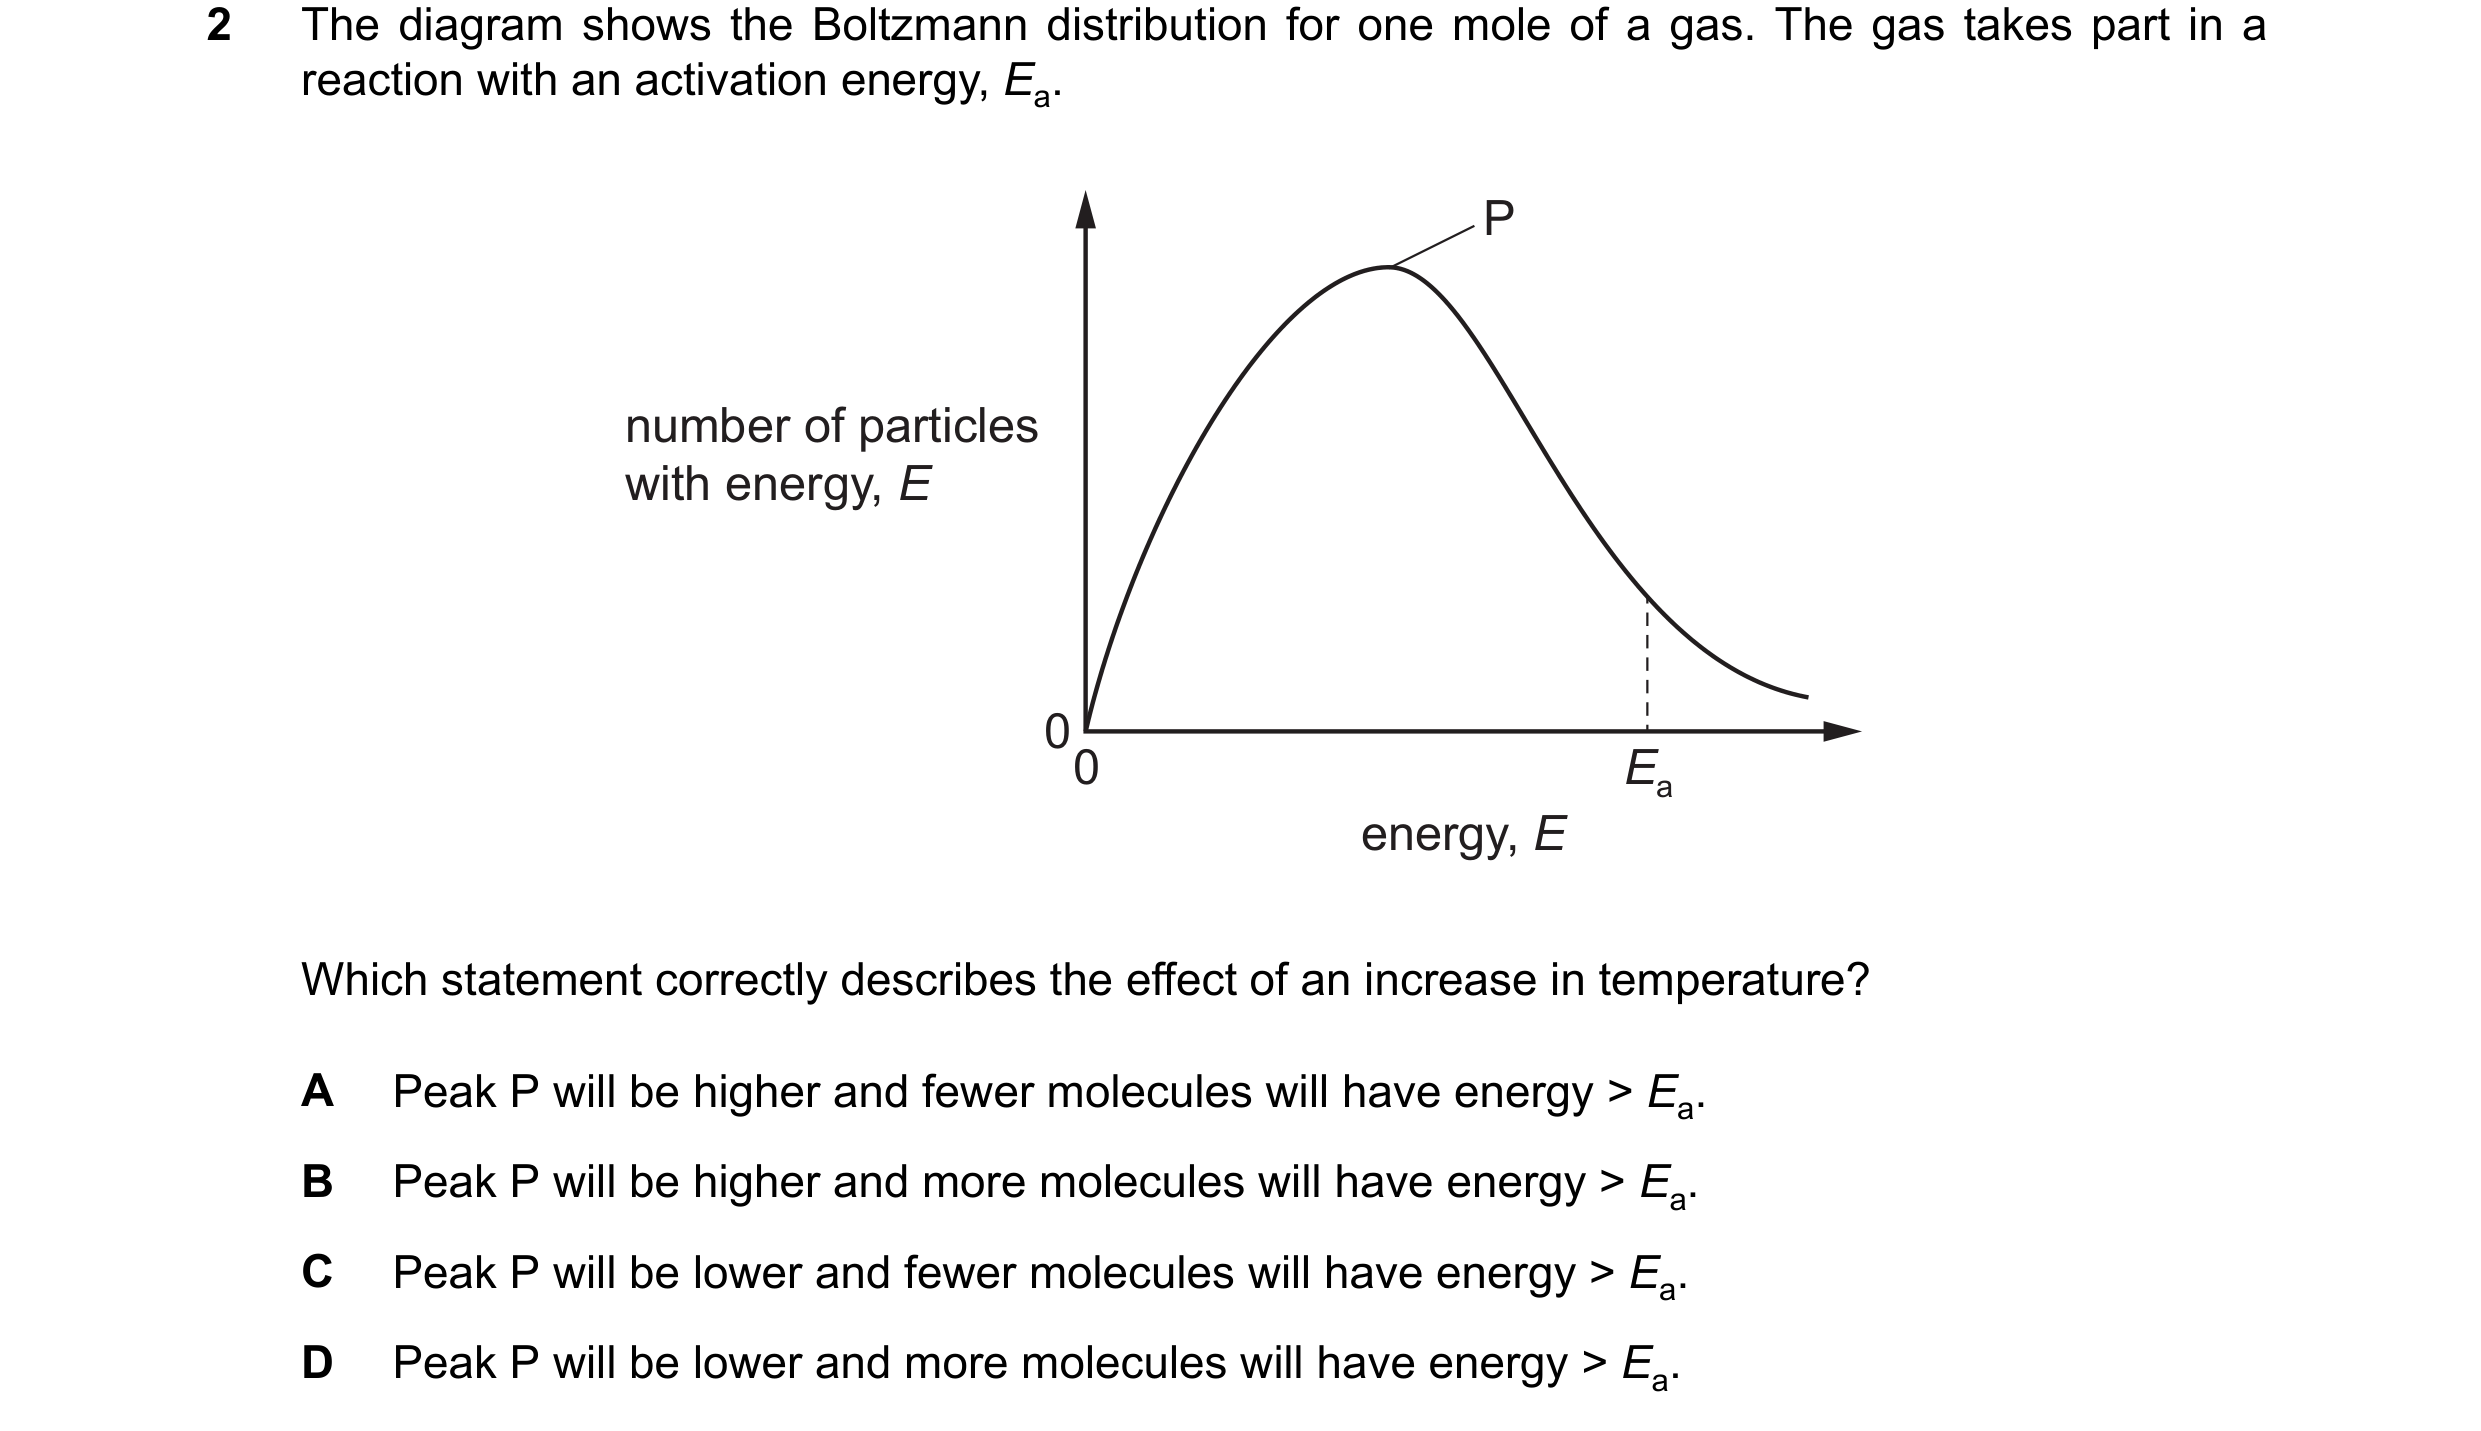
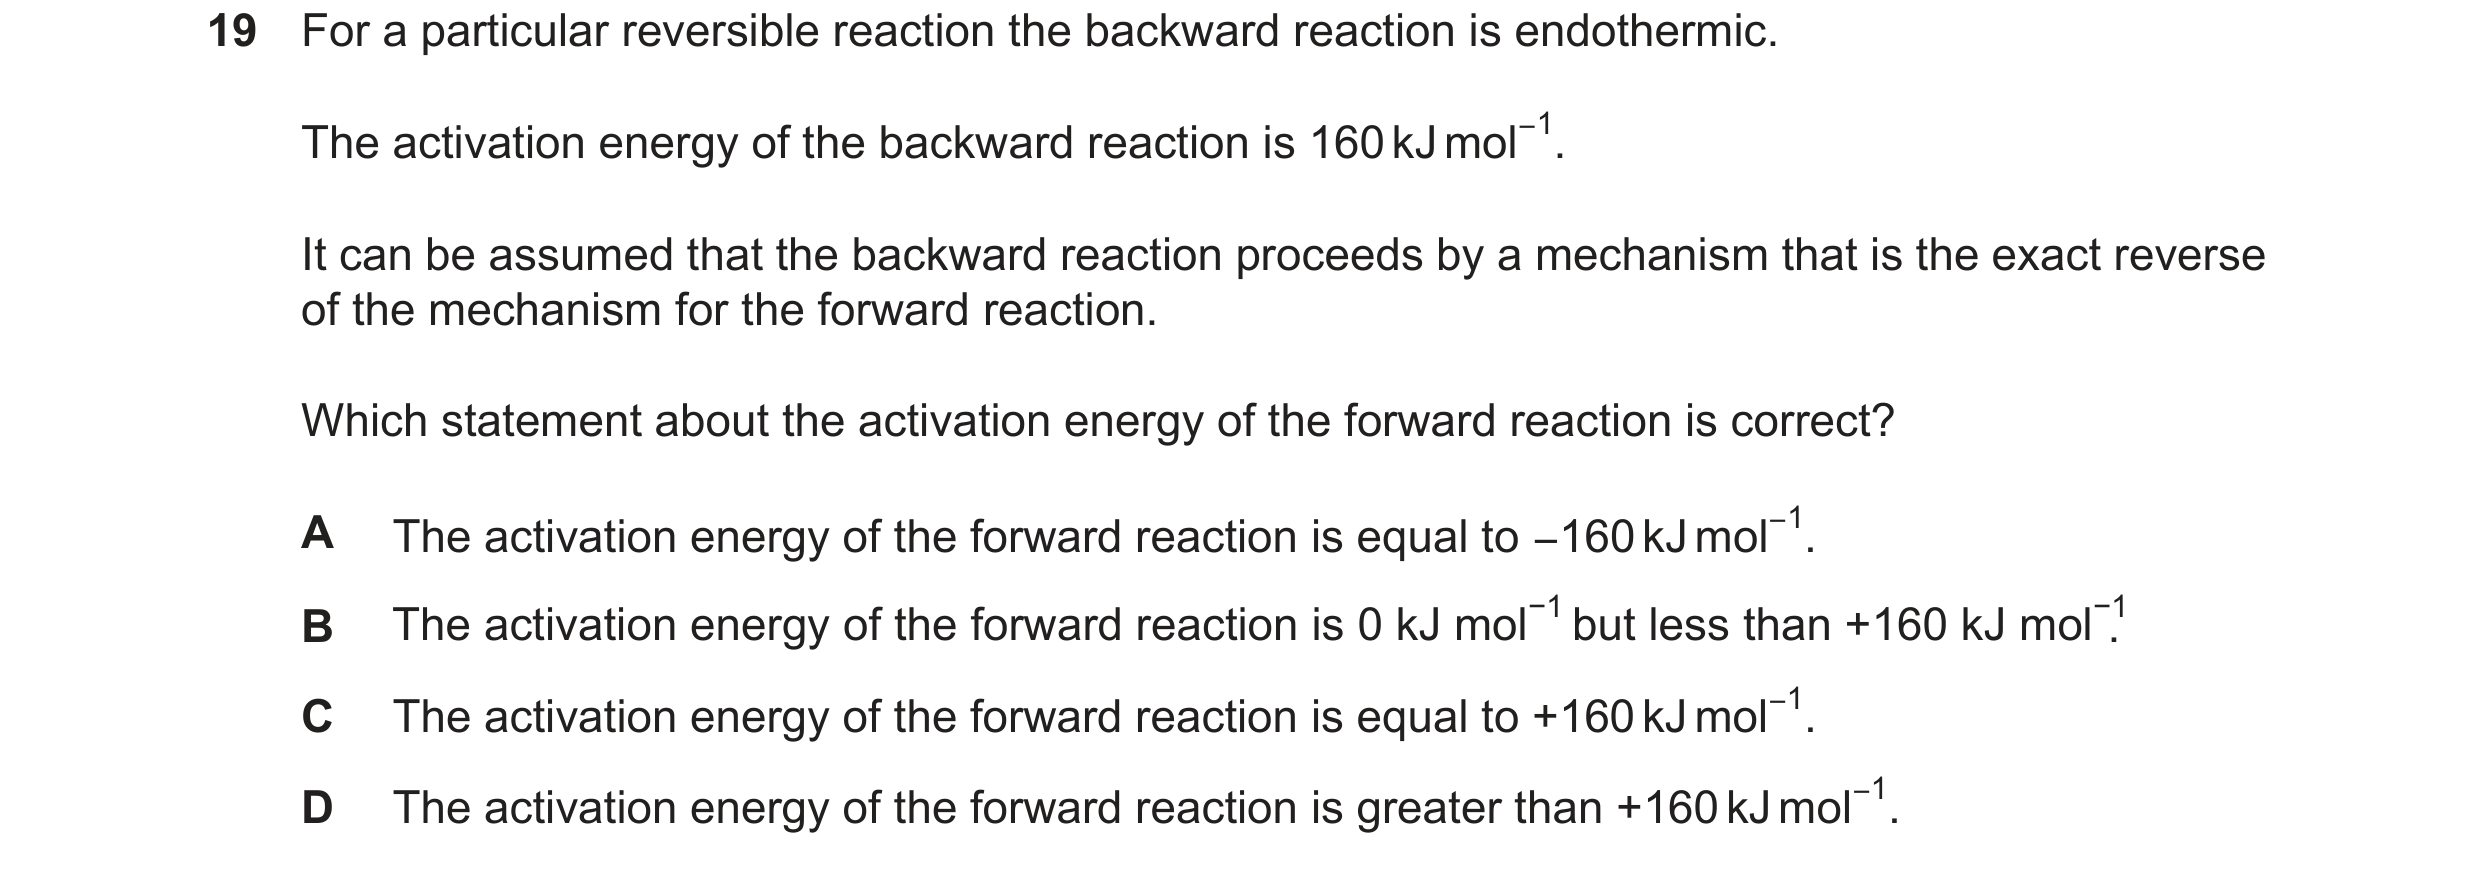 56 / 67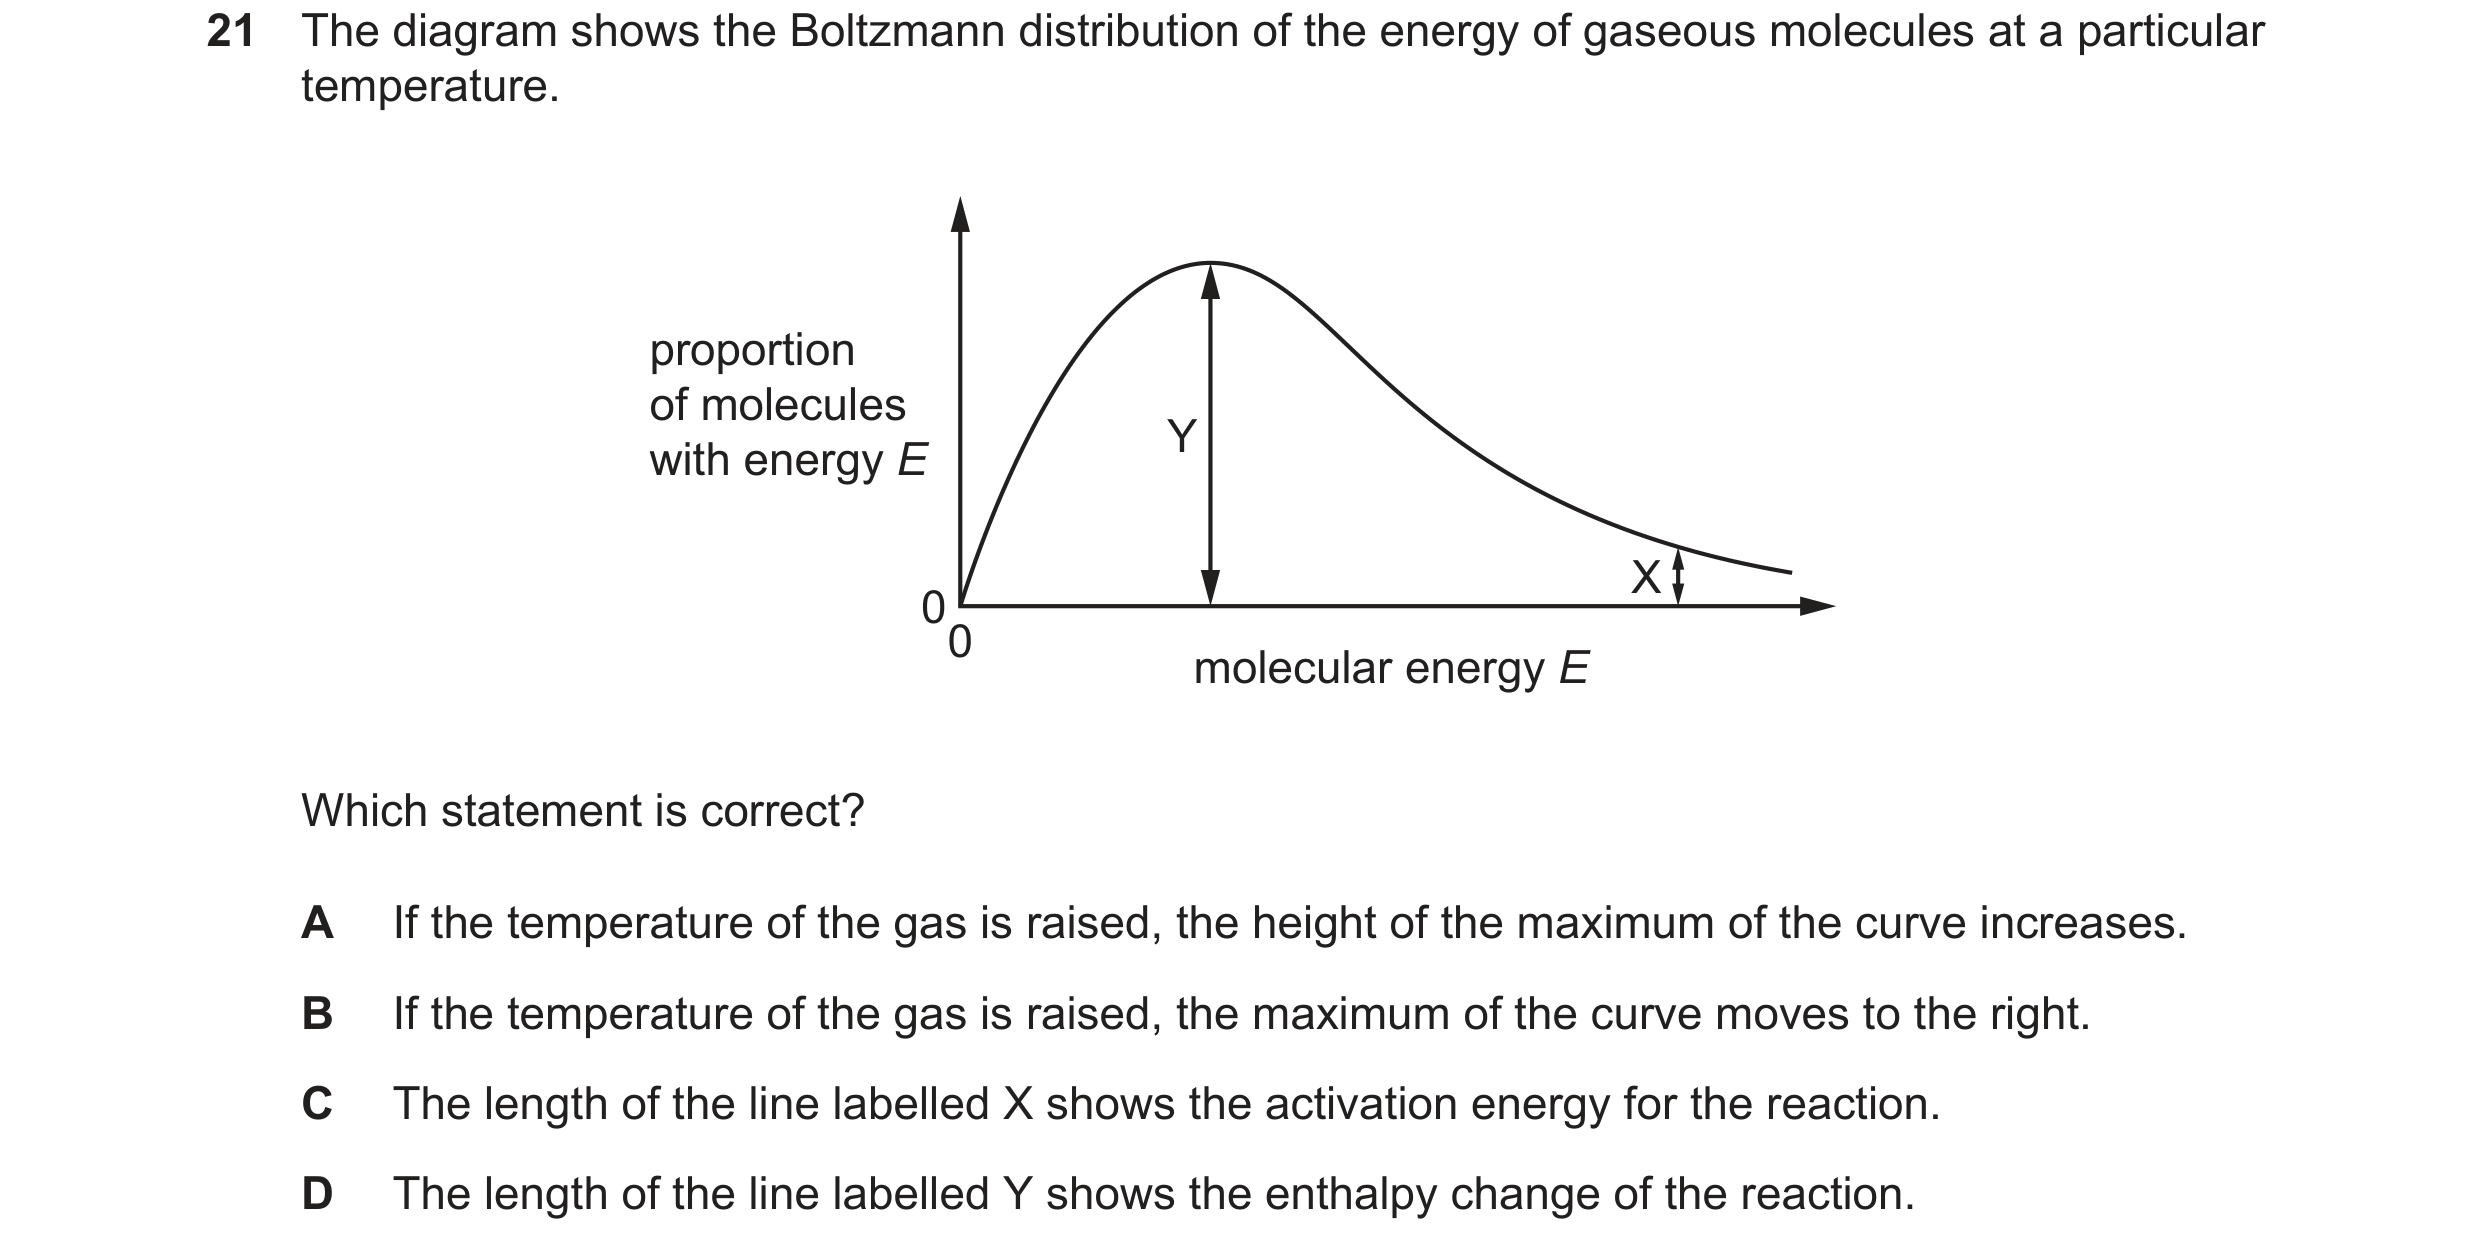
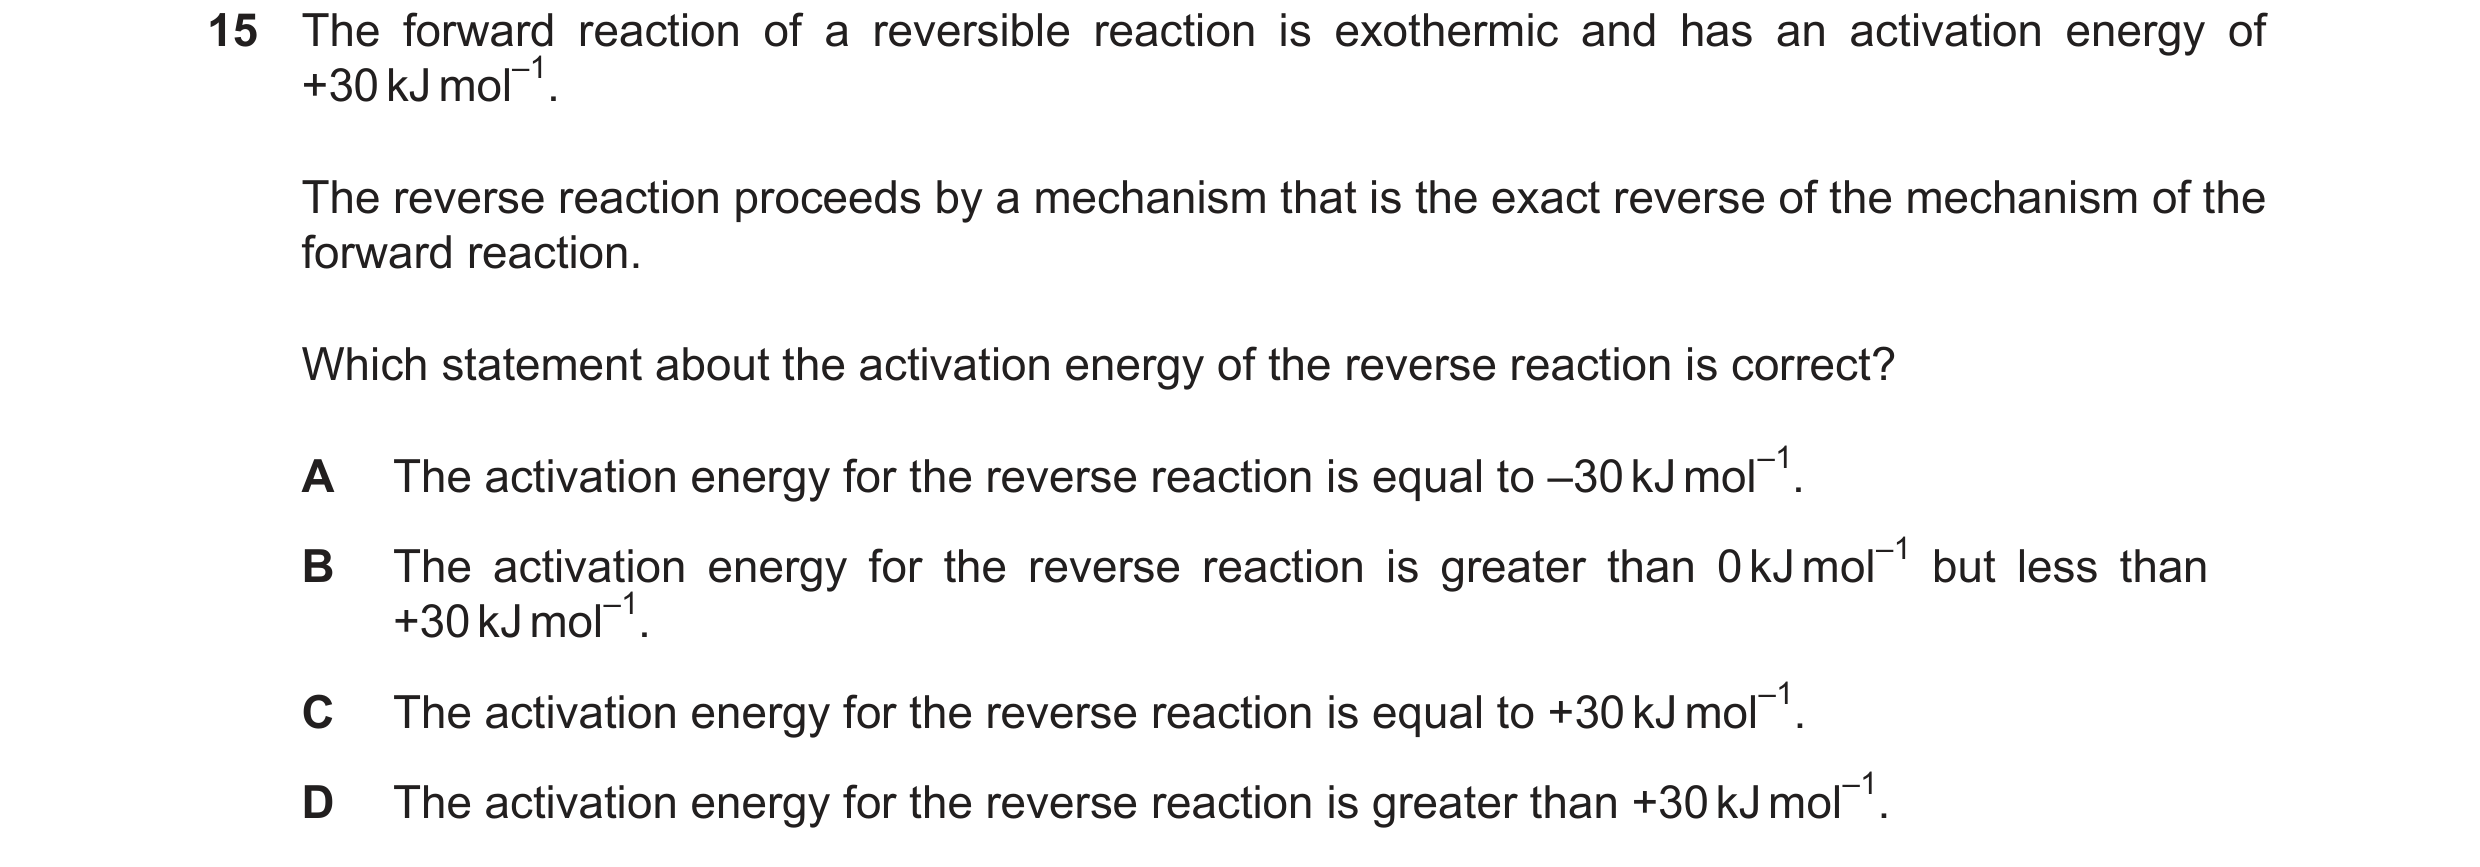
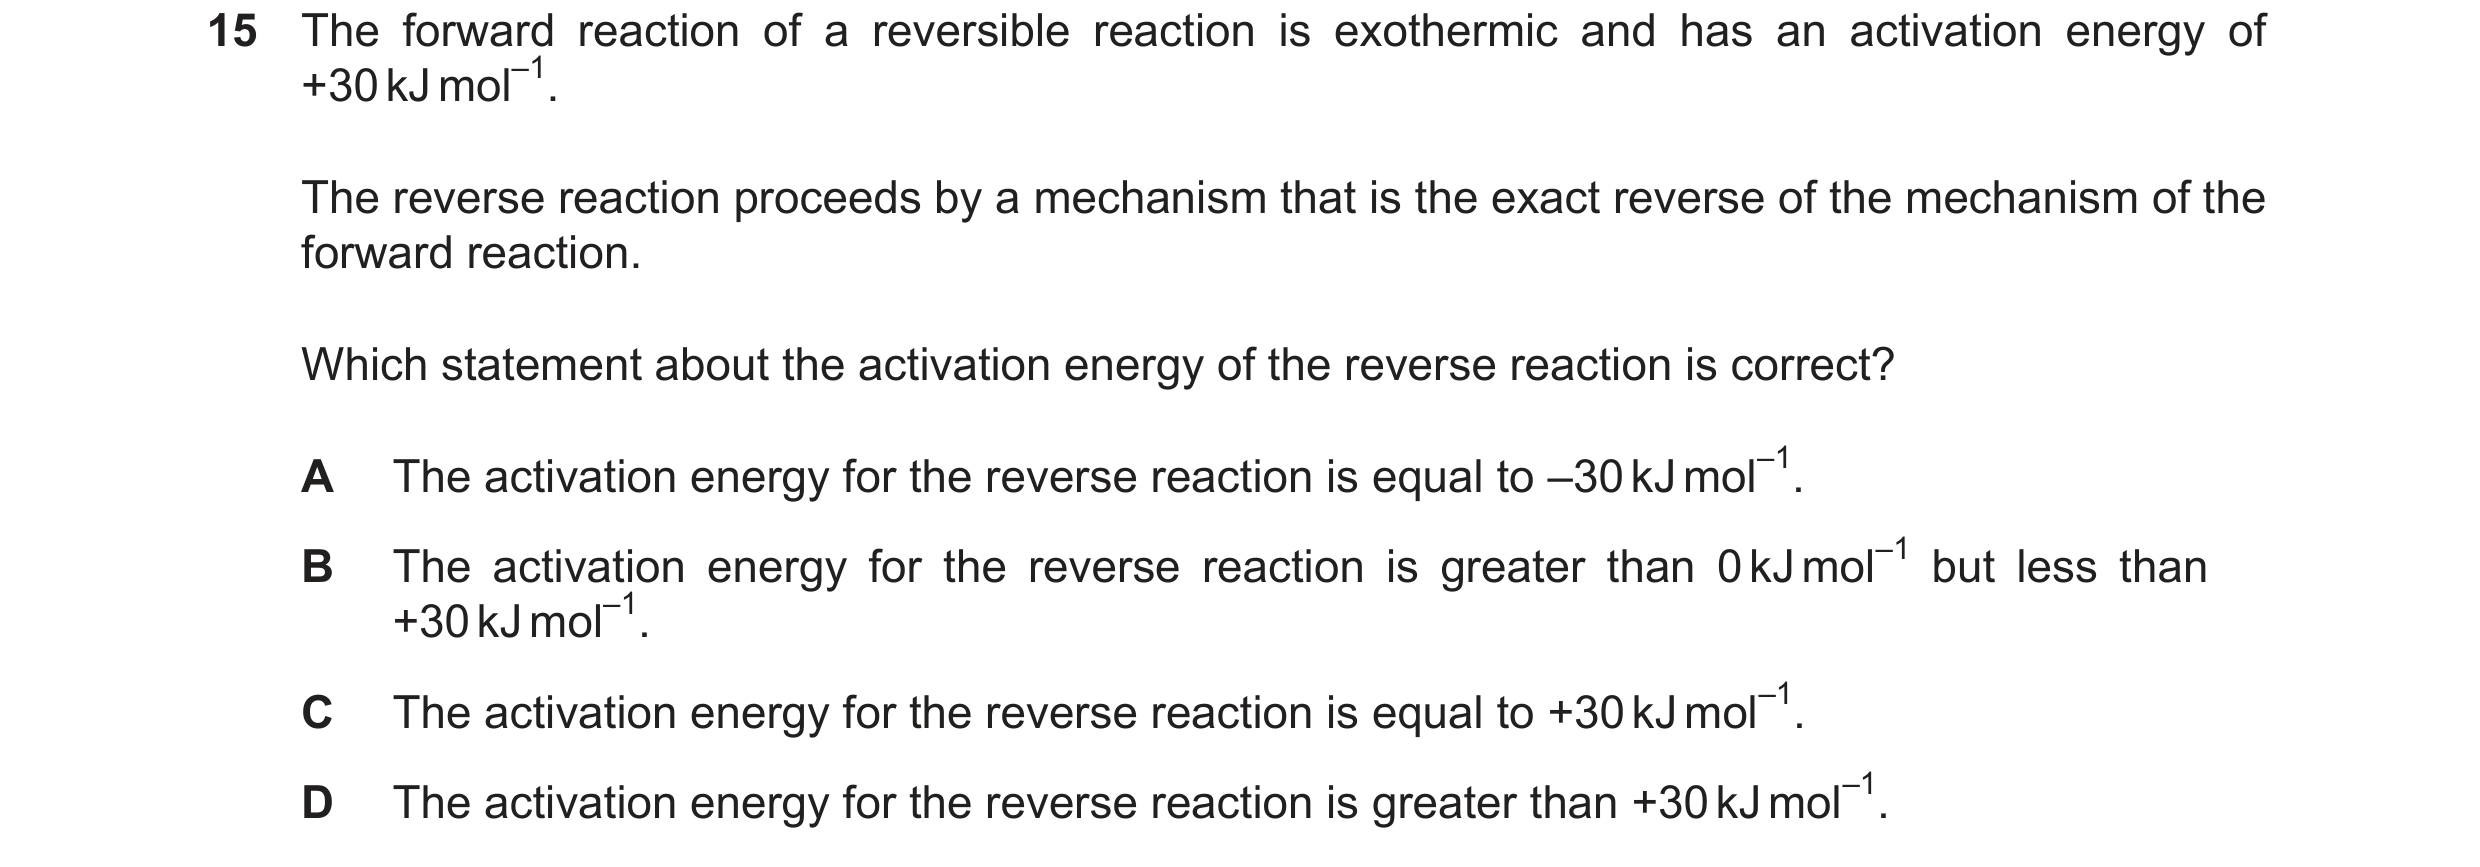 57 / 67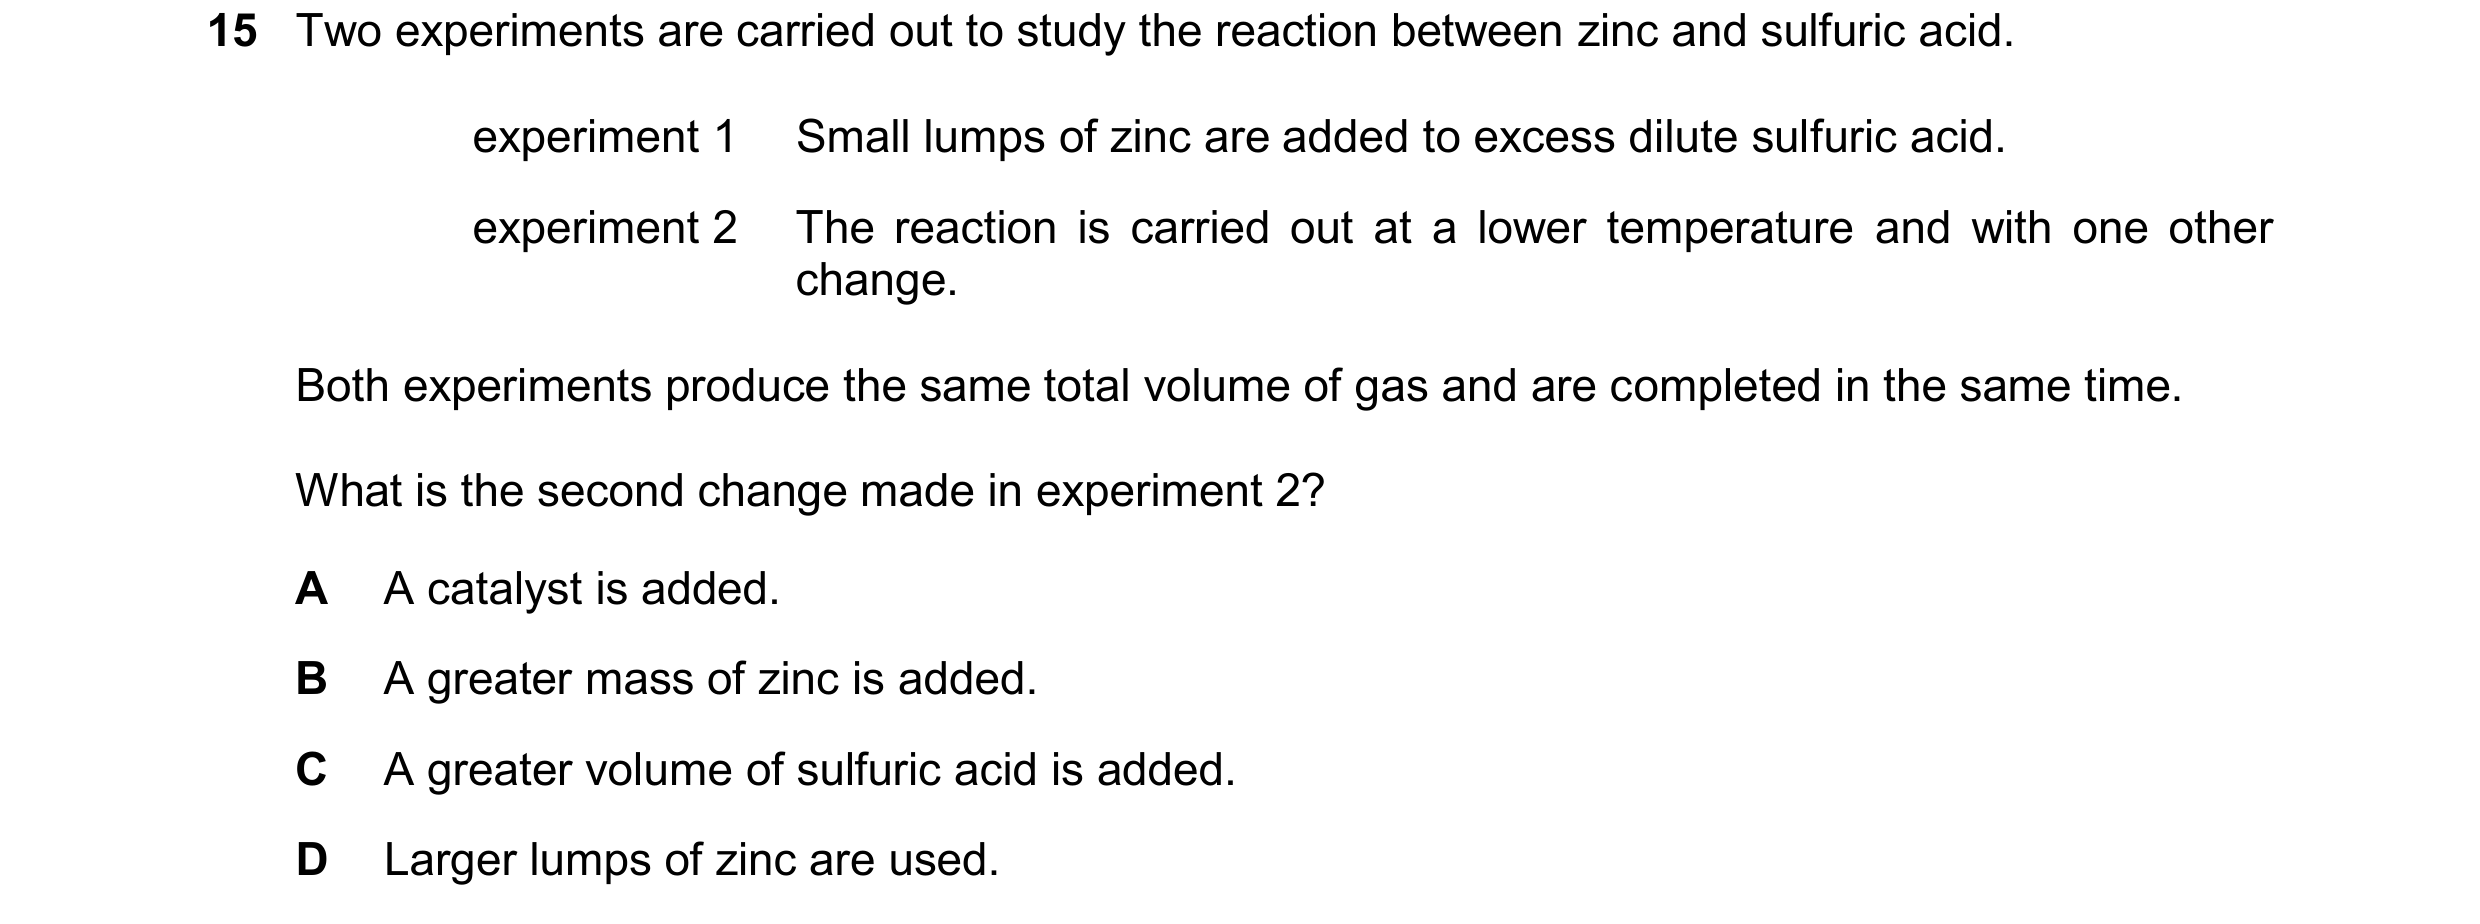
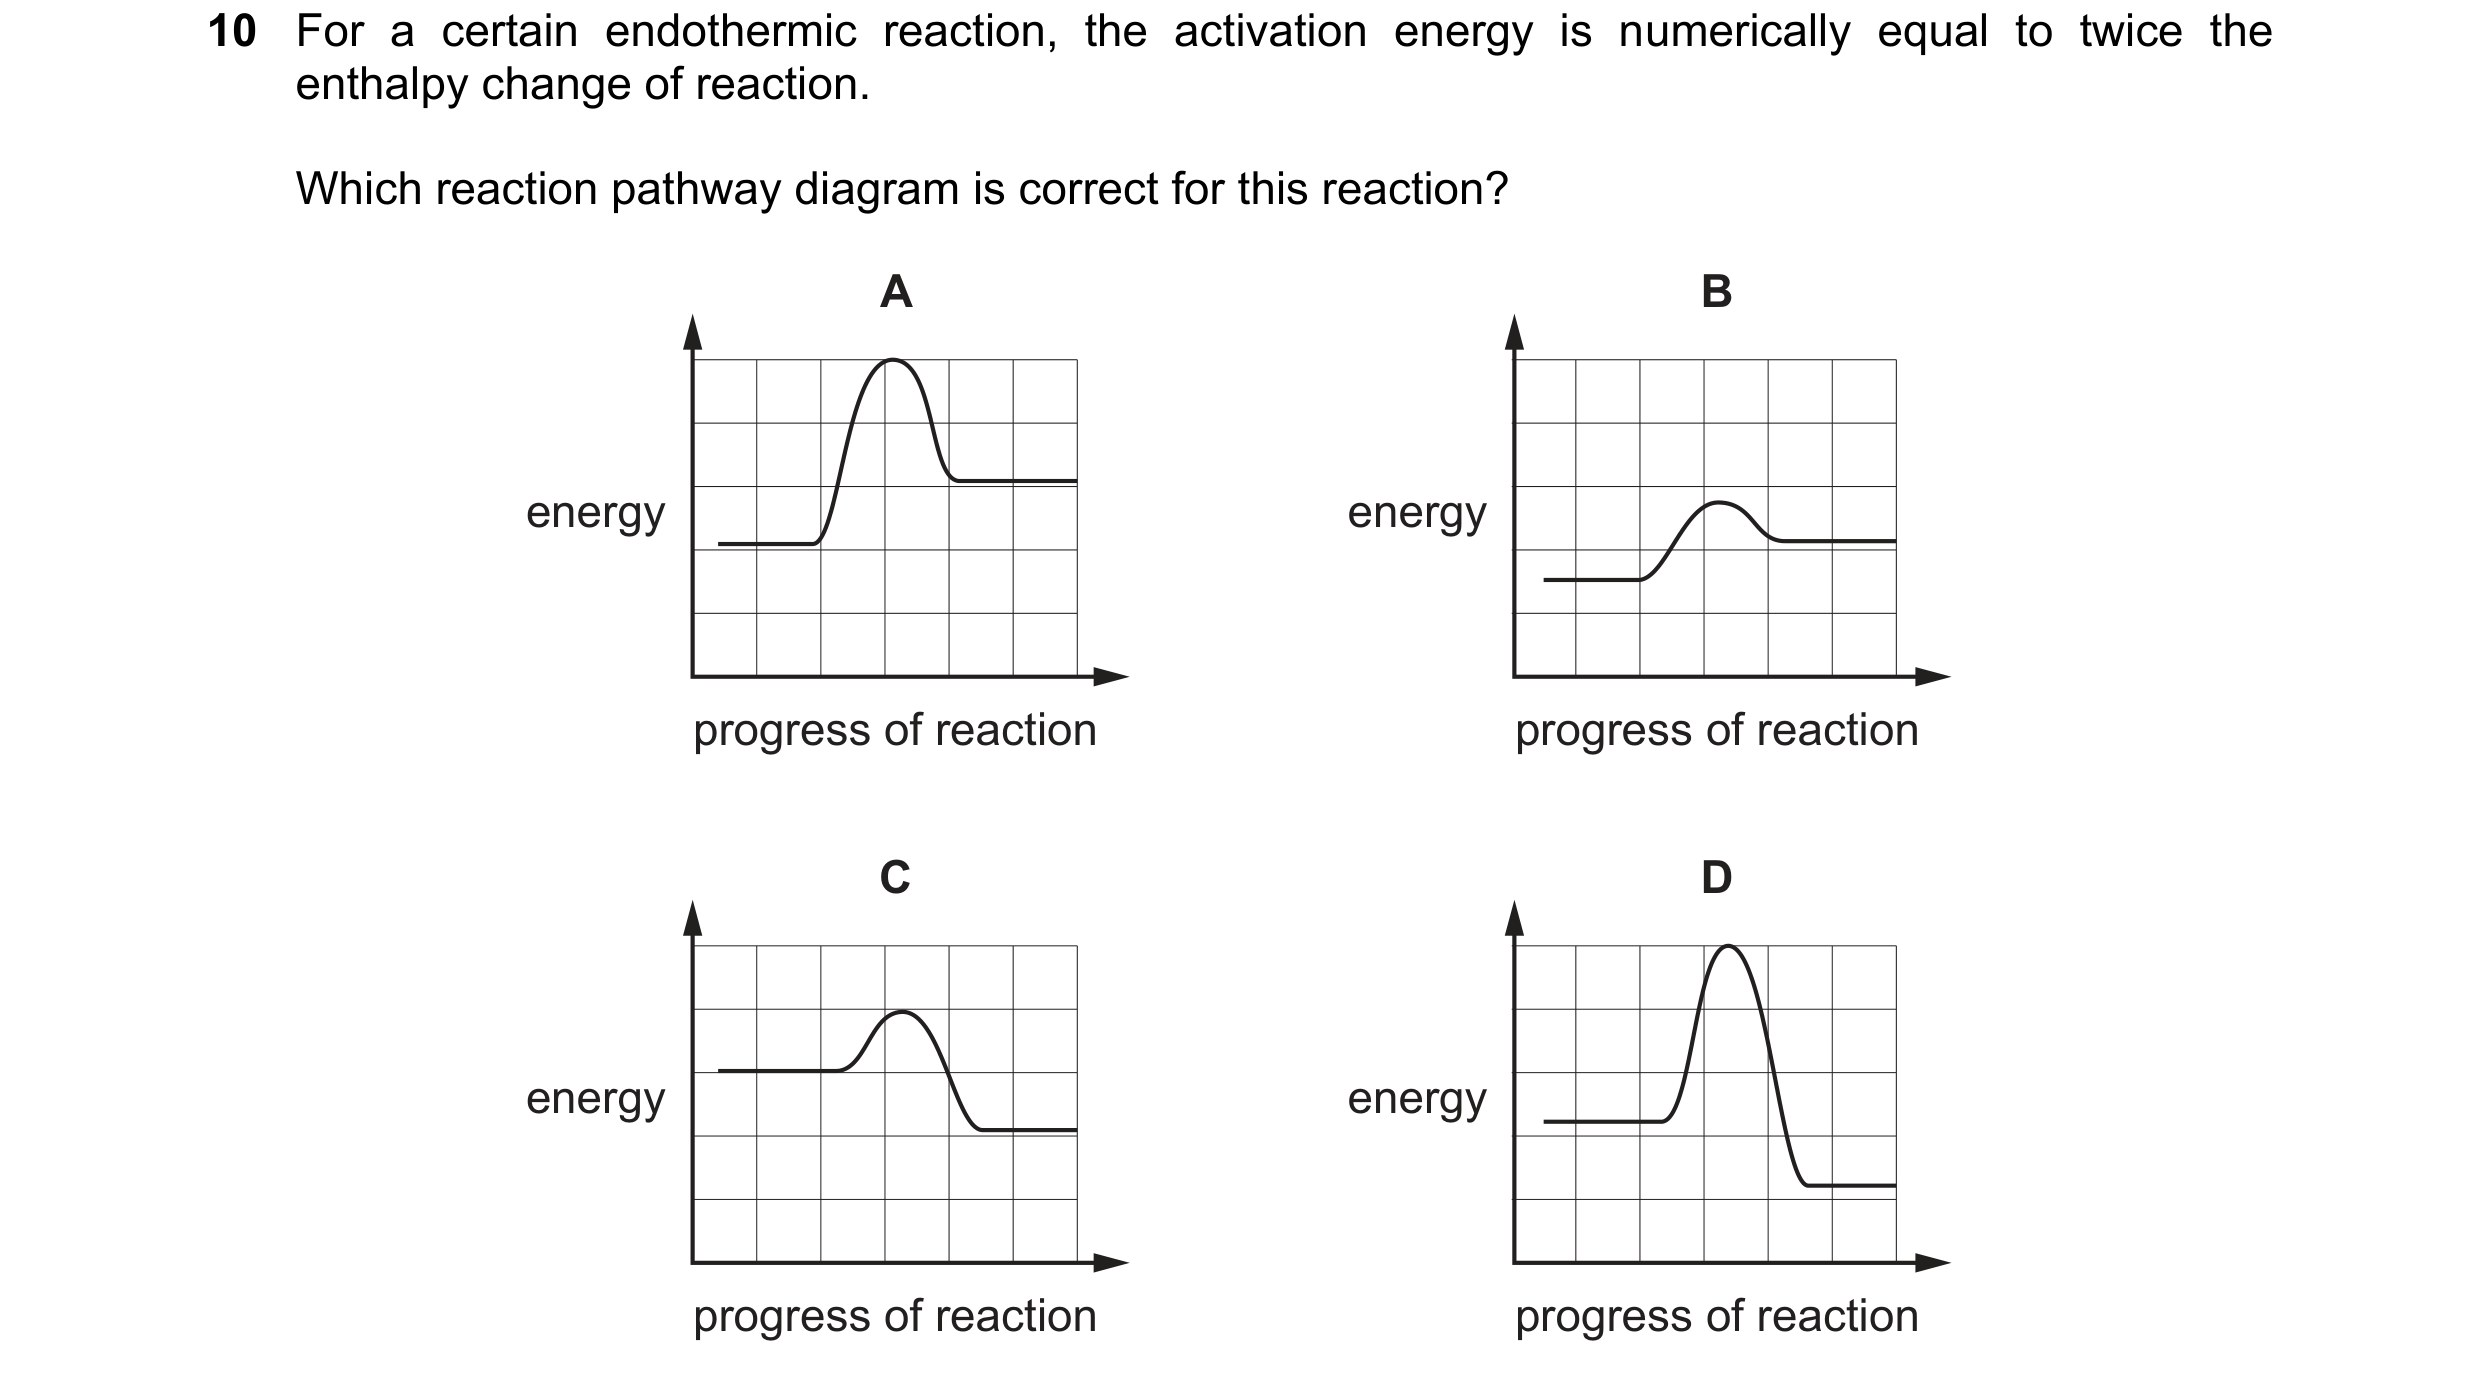 58 / 67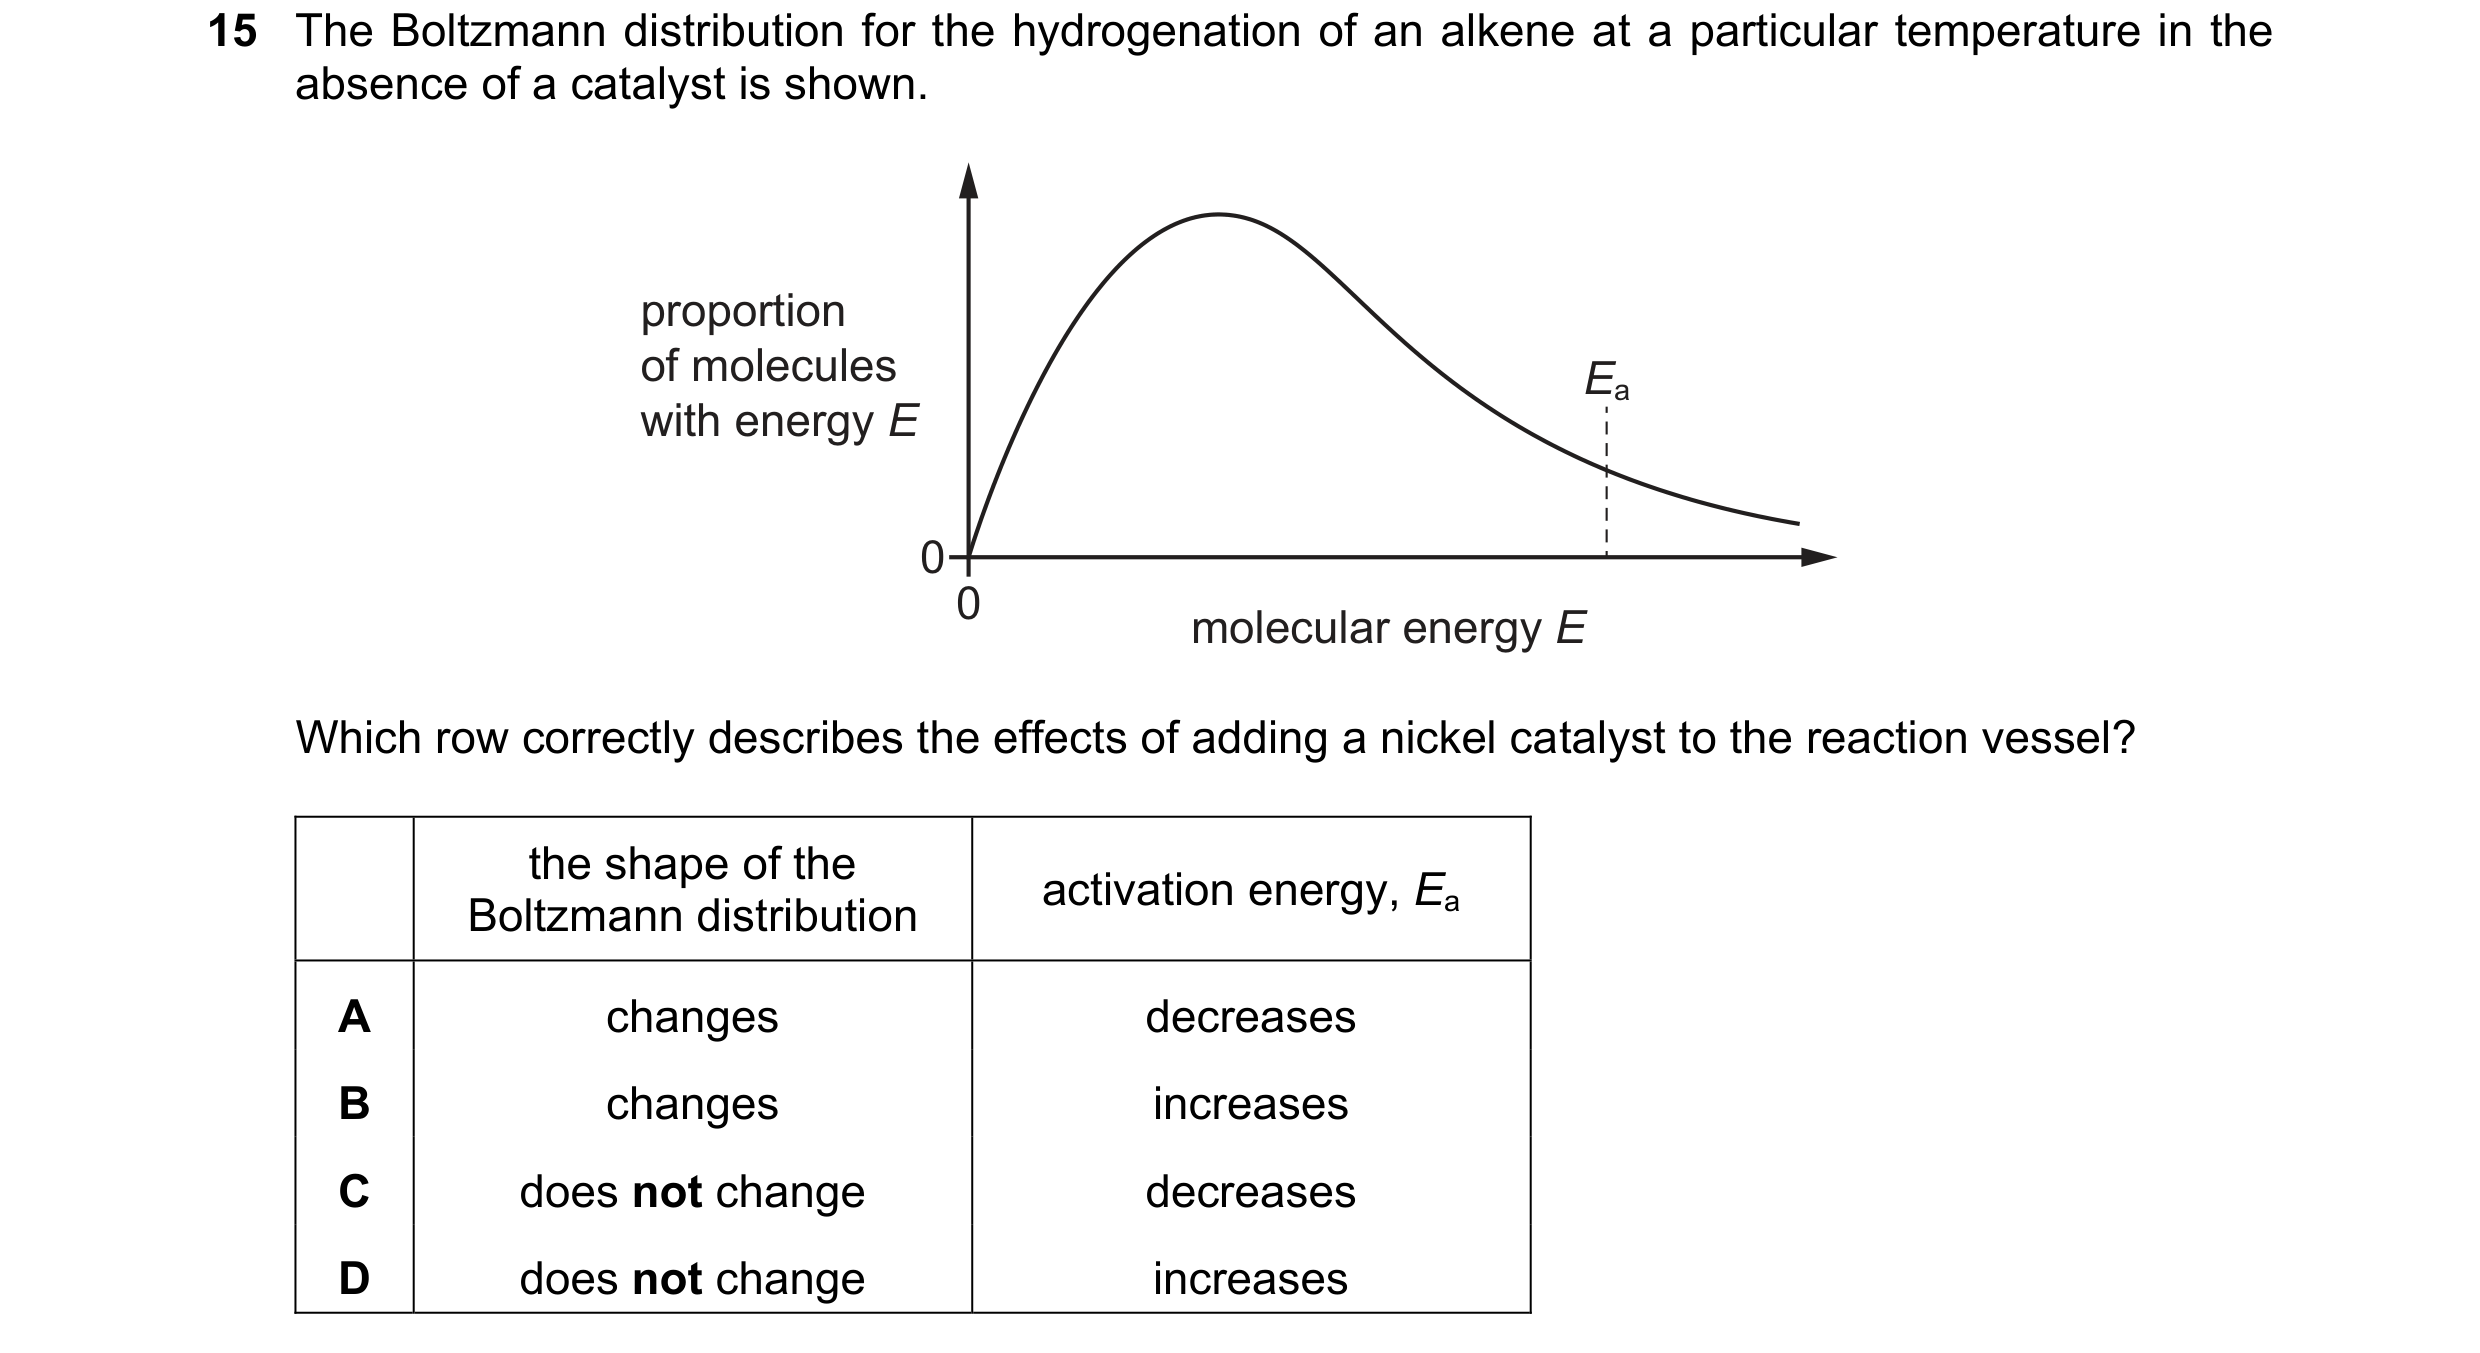
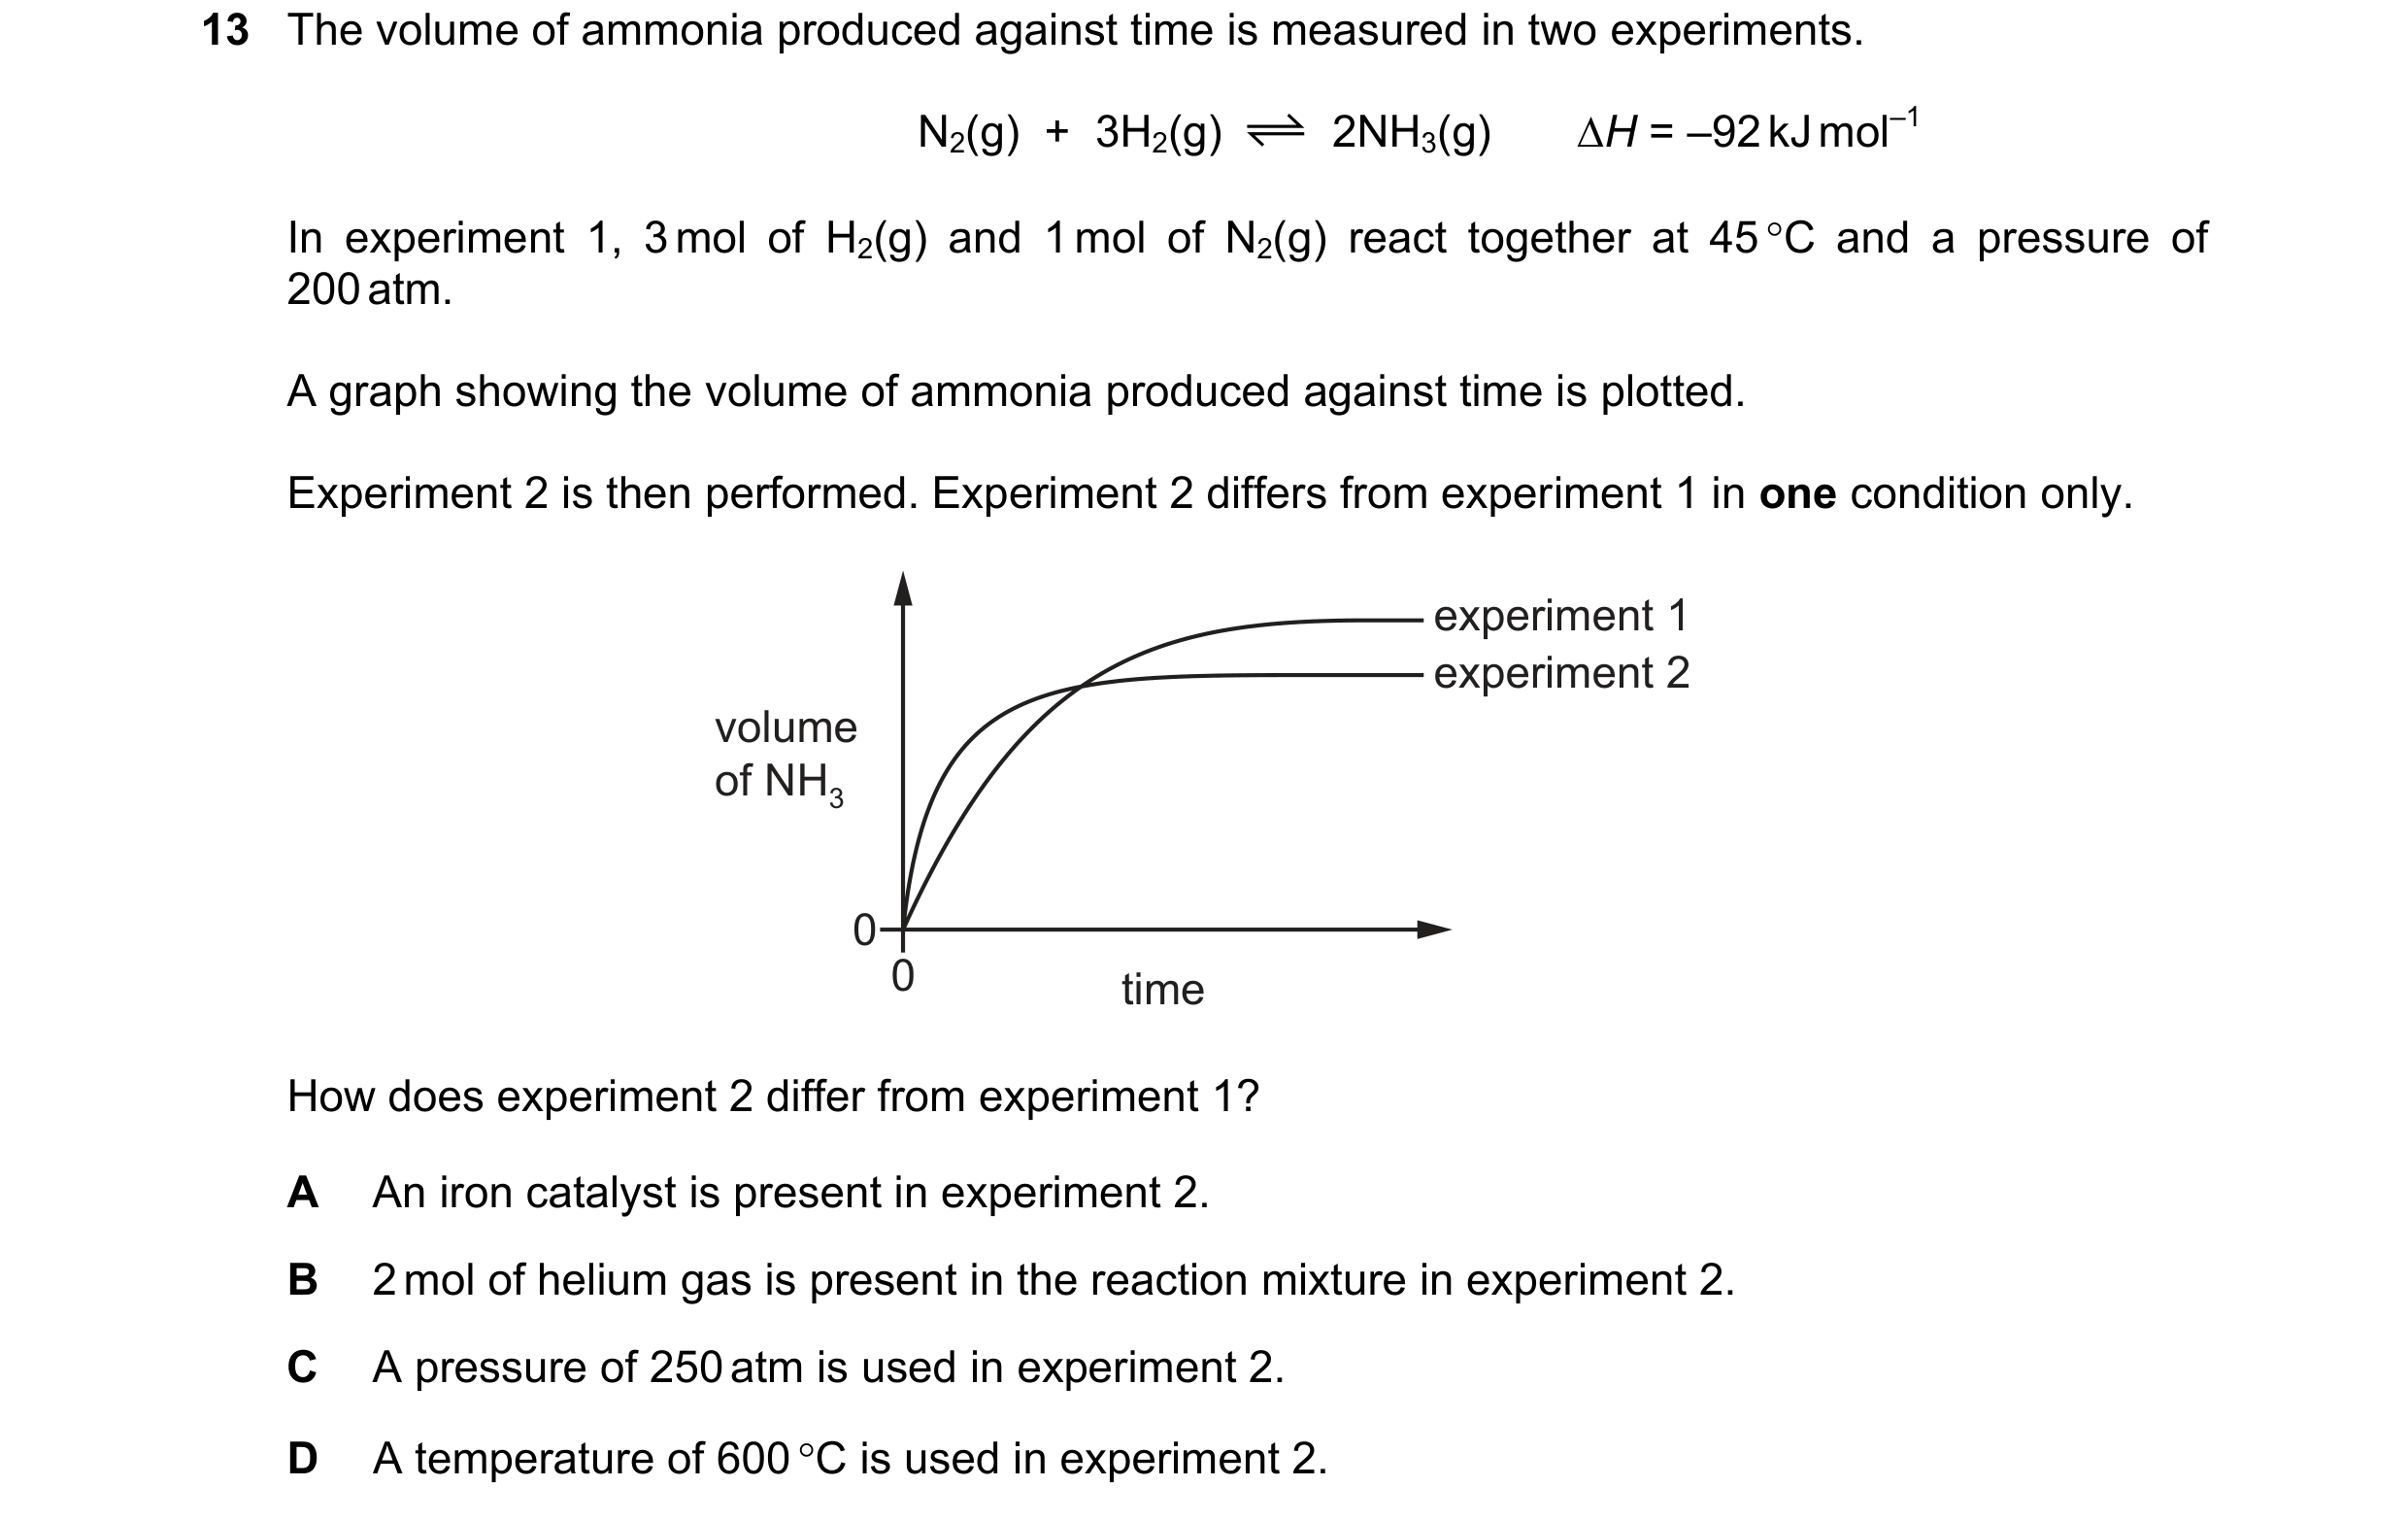 59 / 67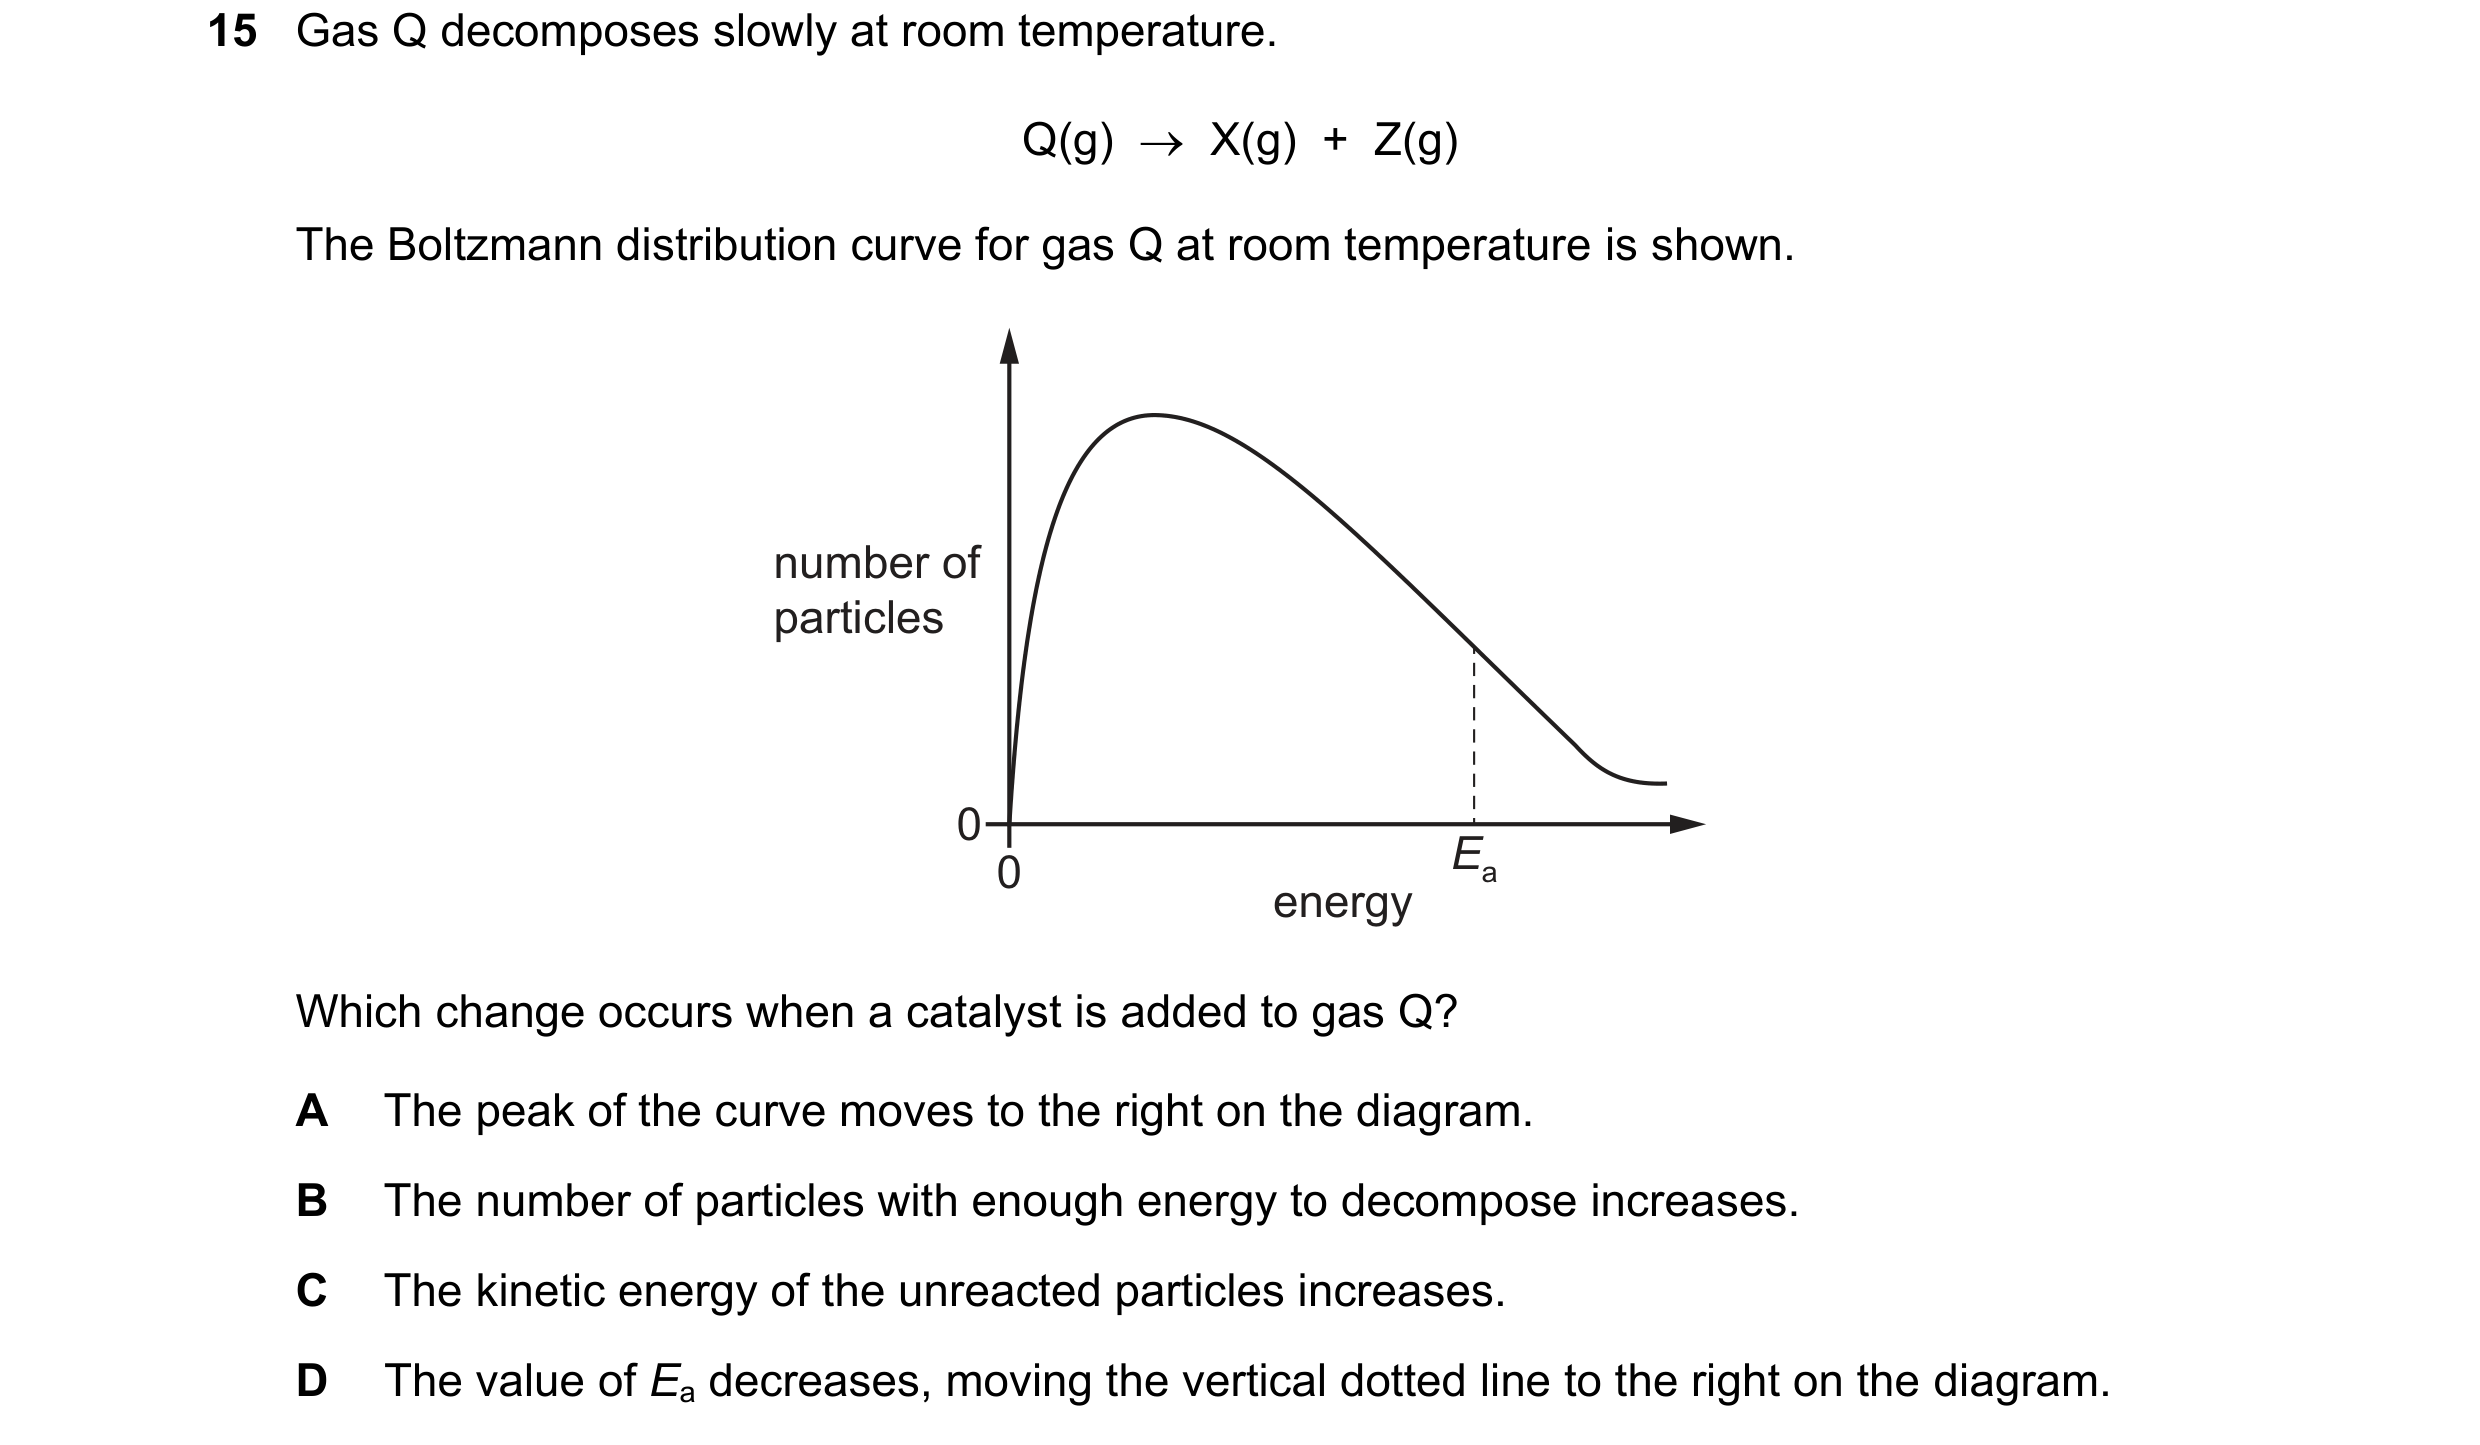
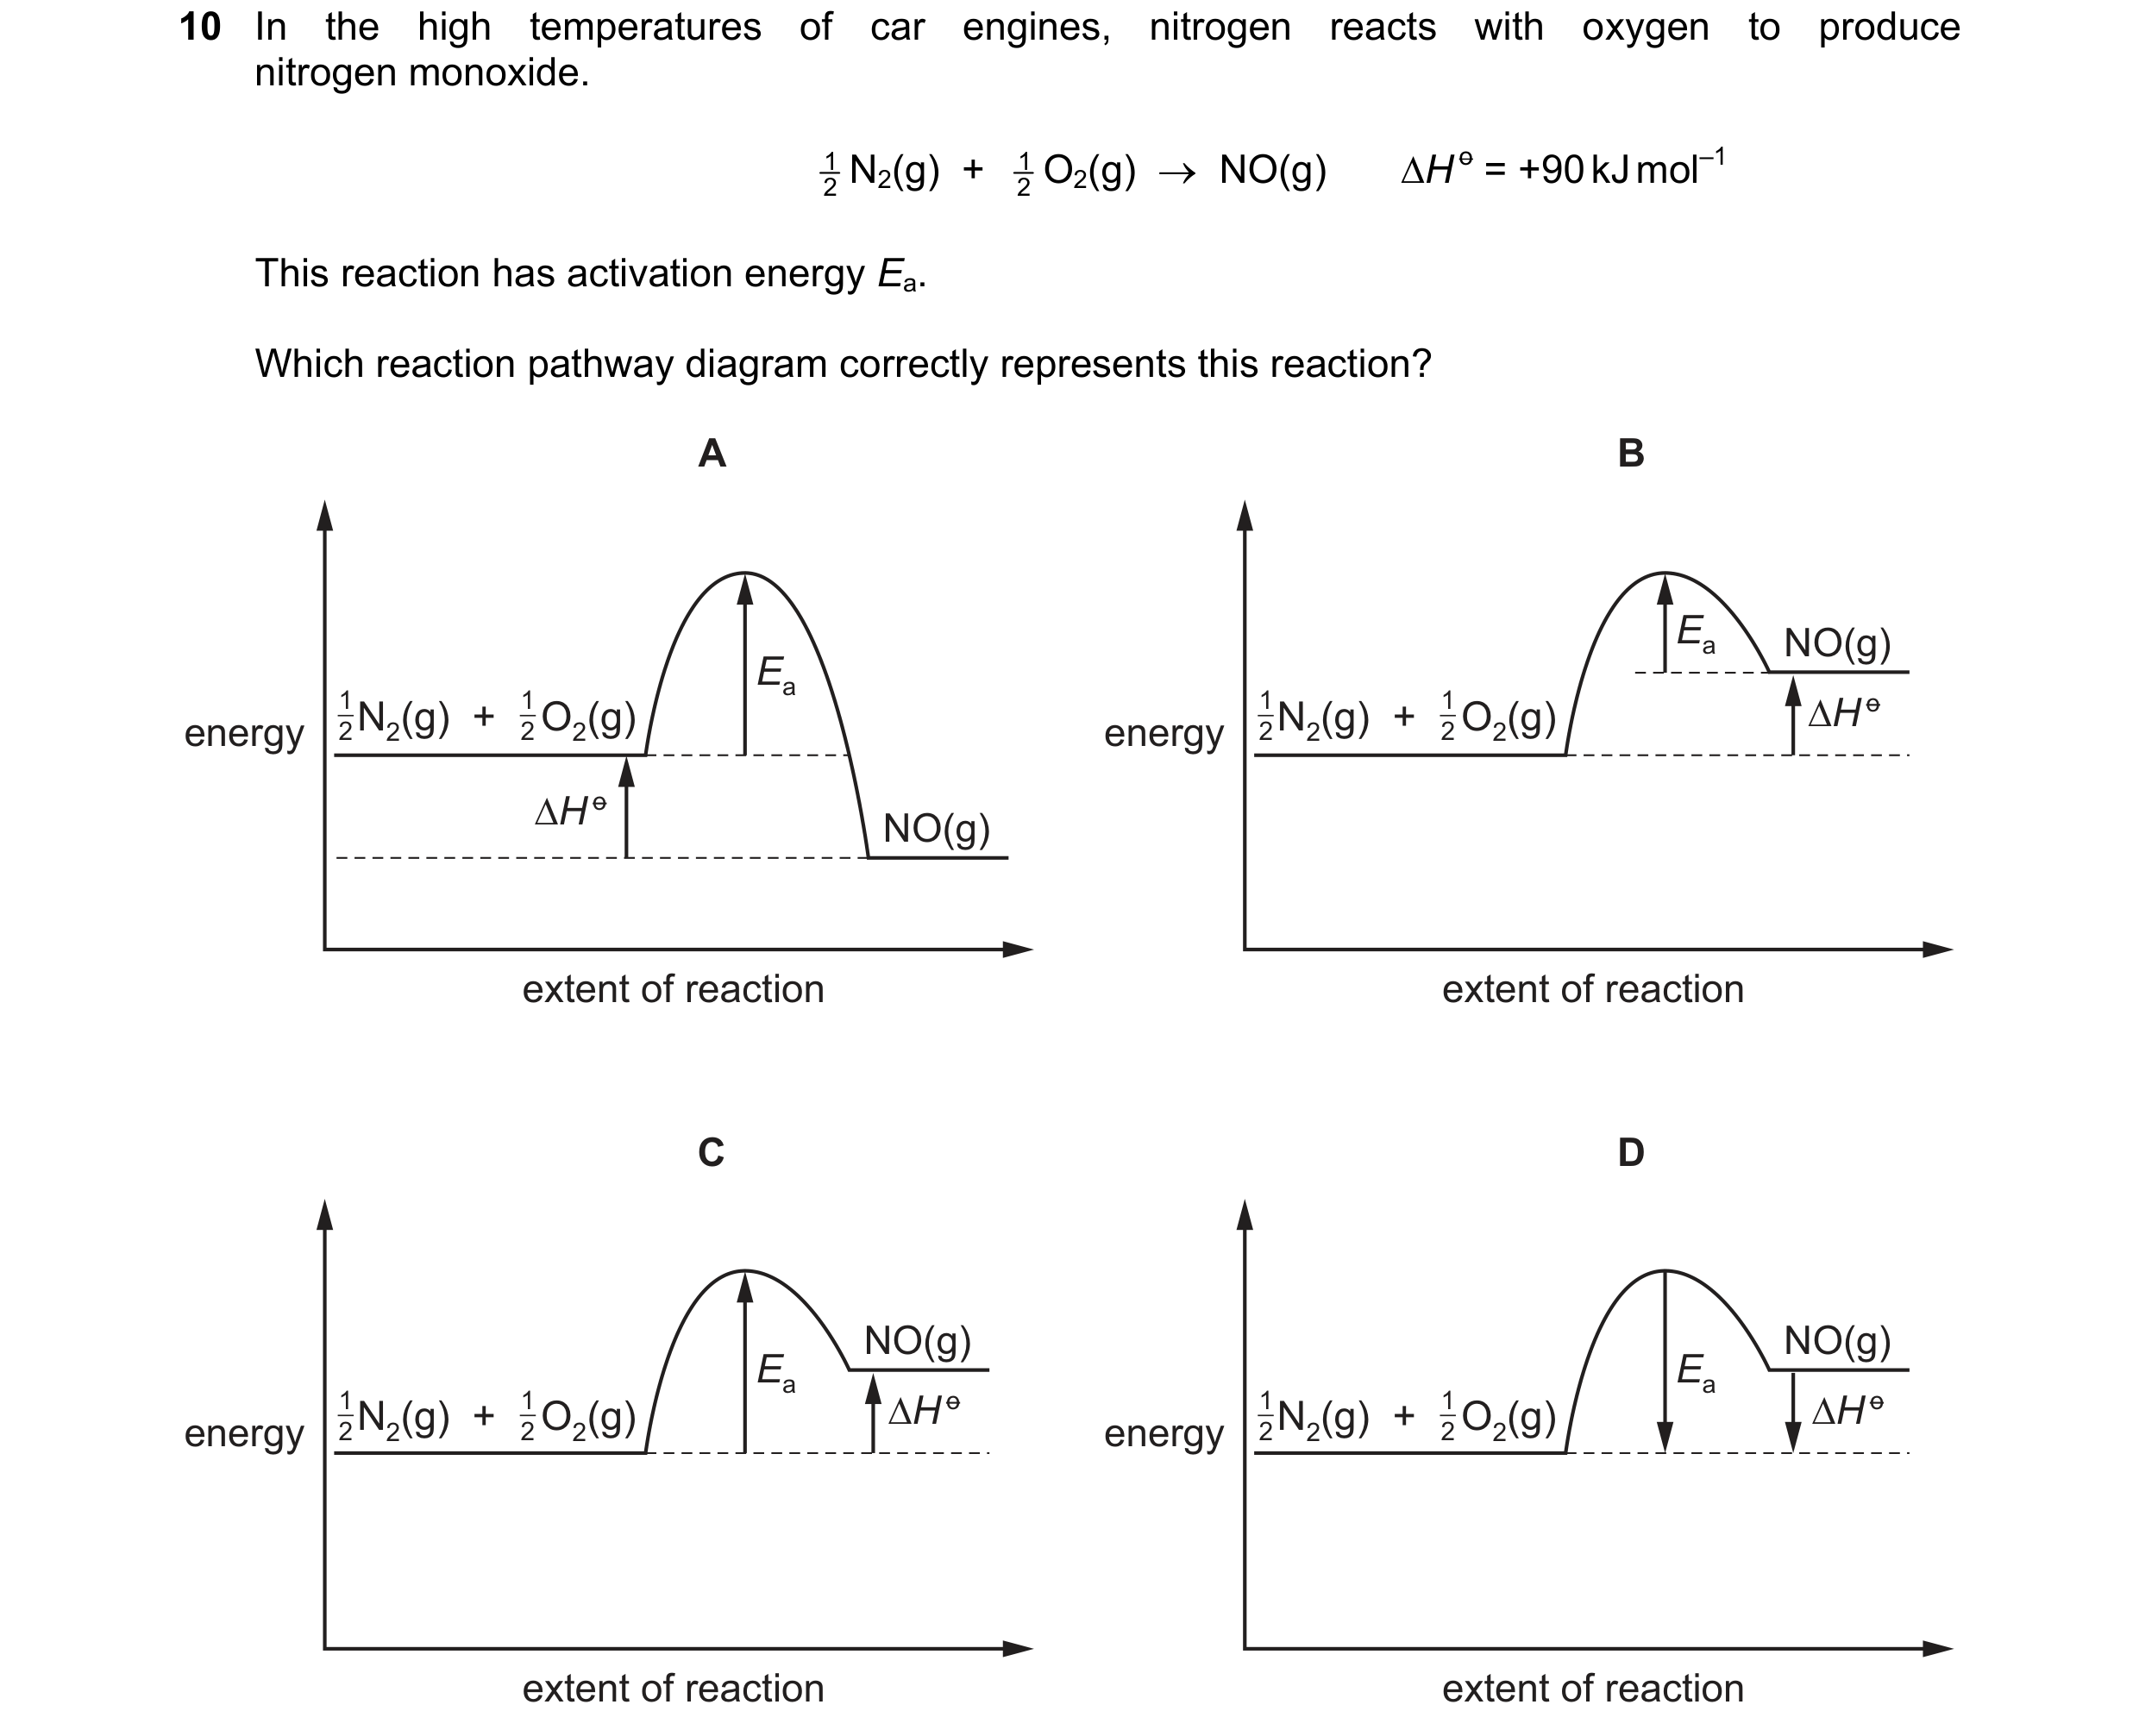 60 / 67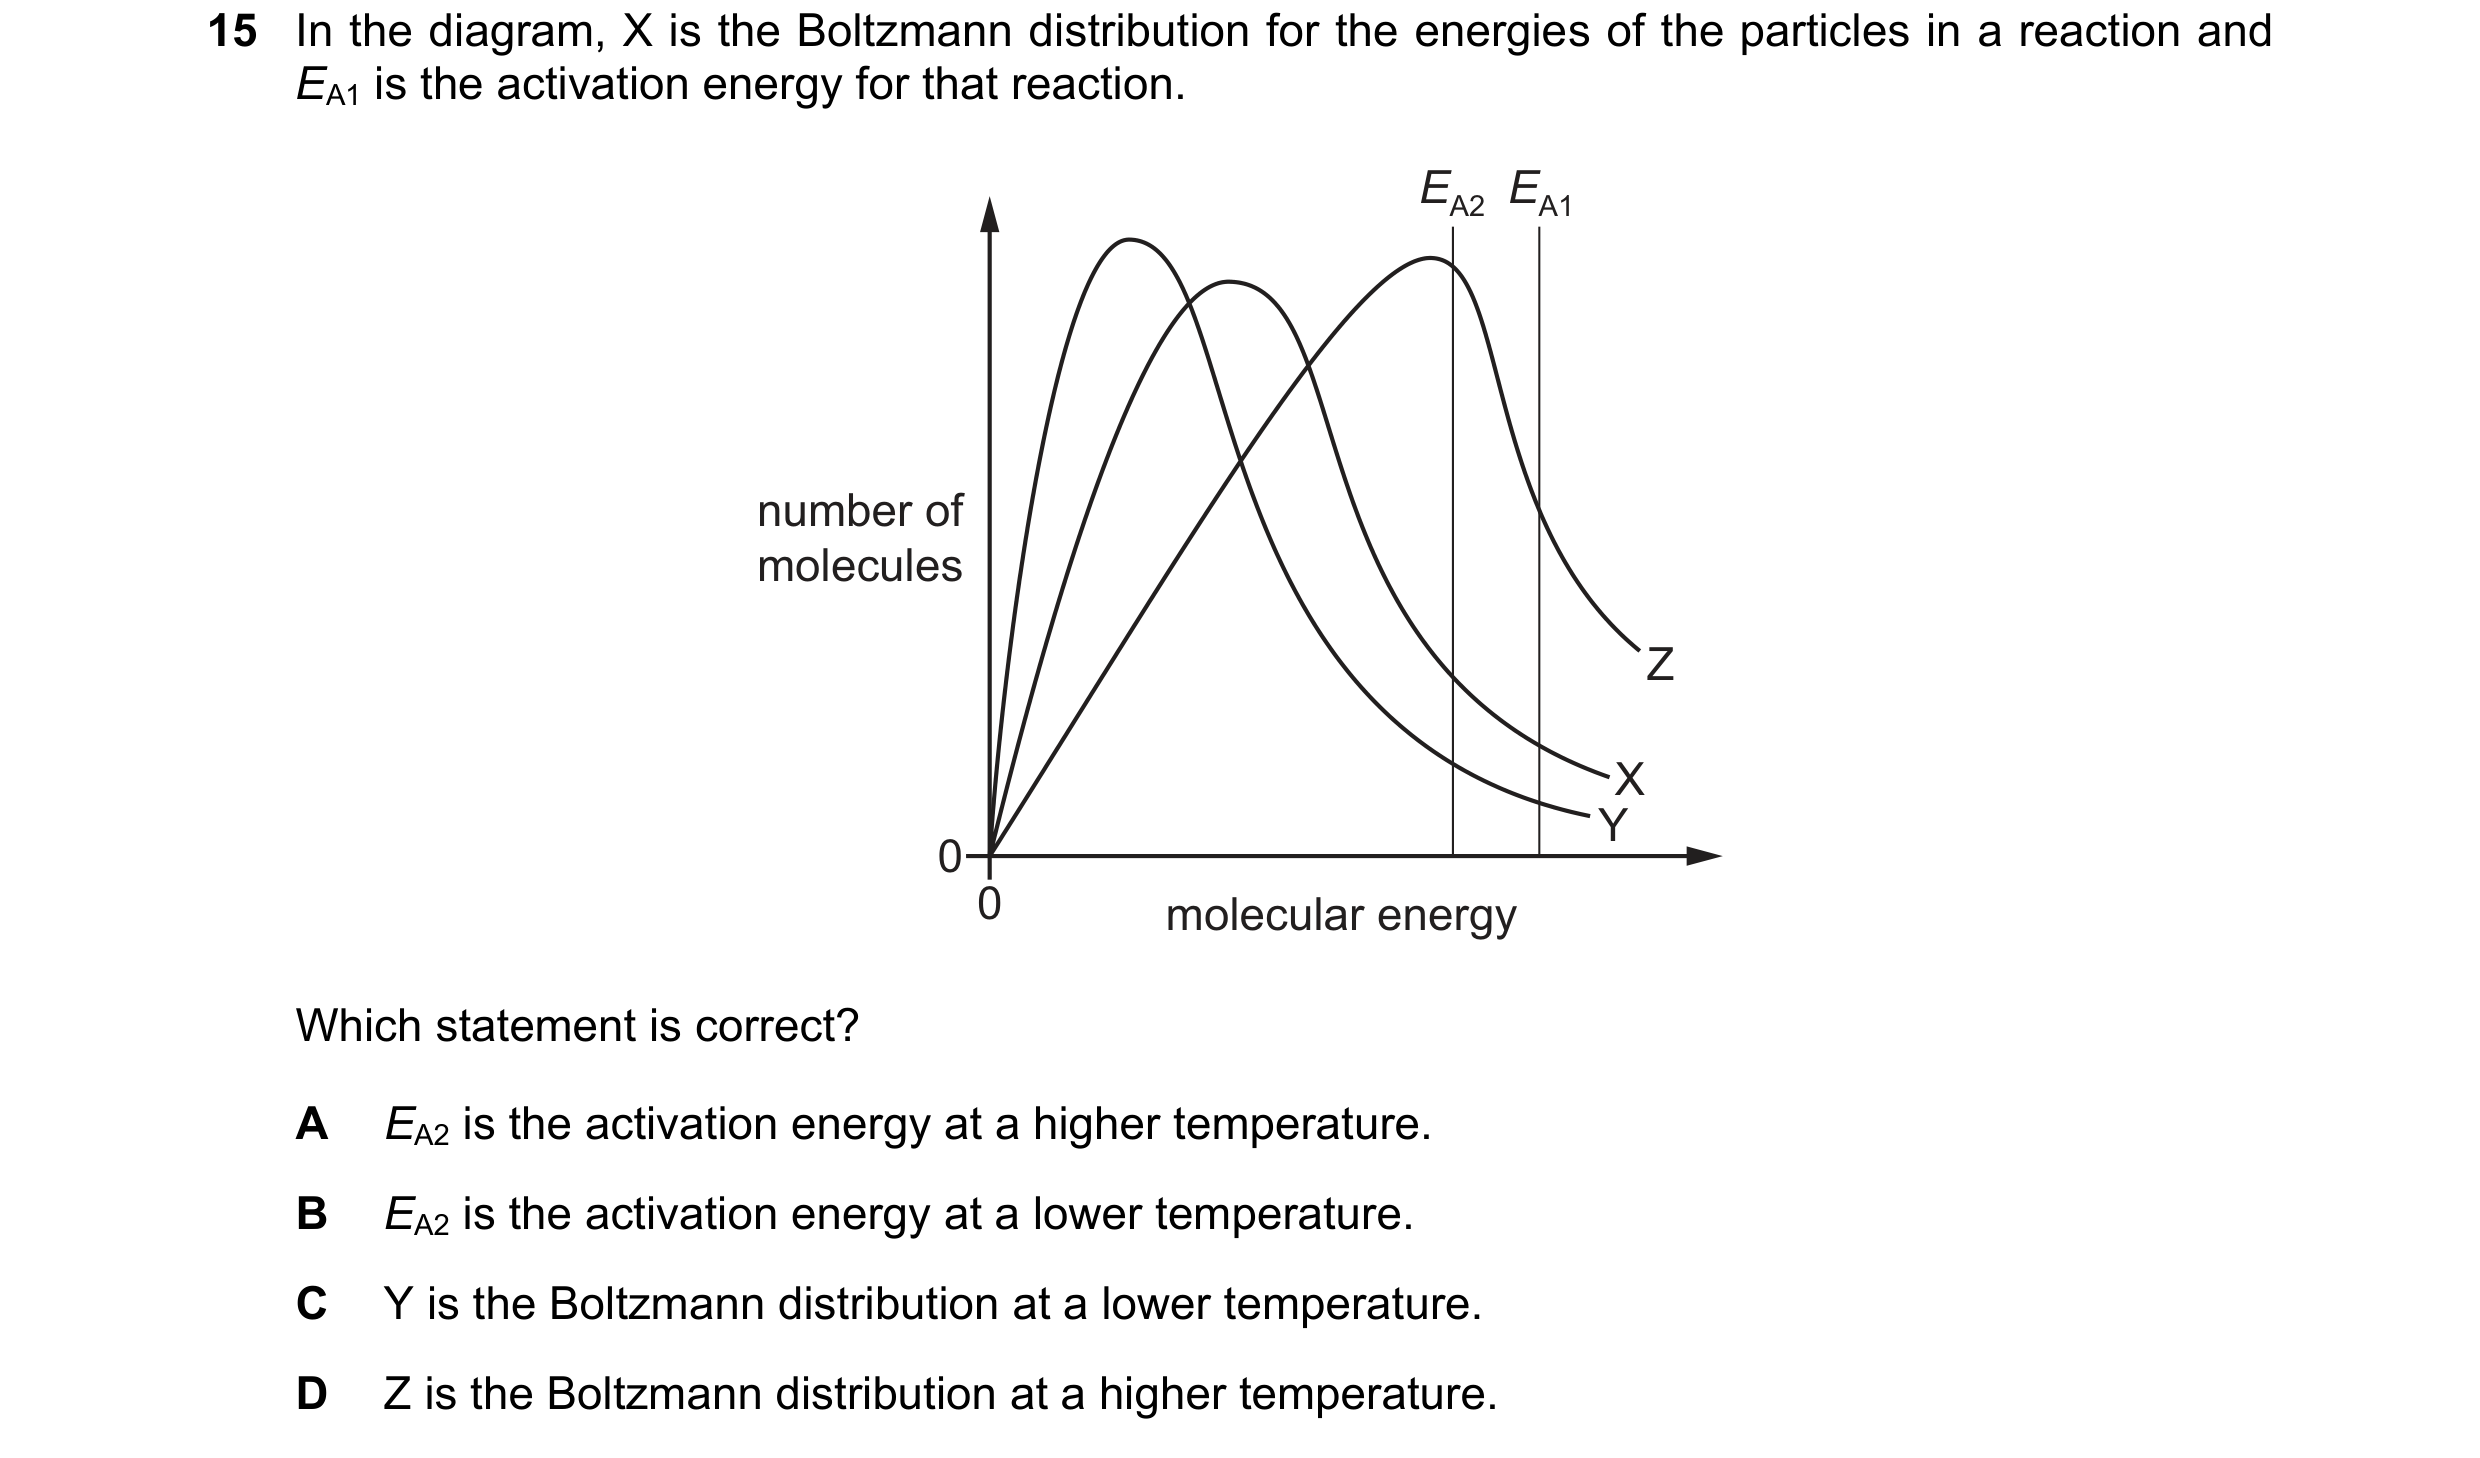
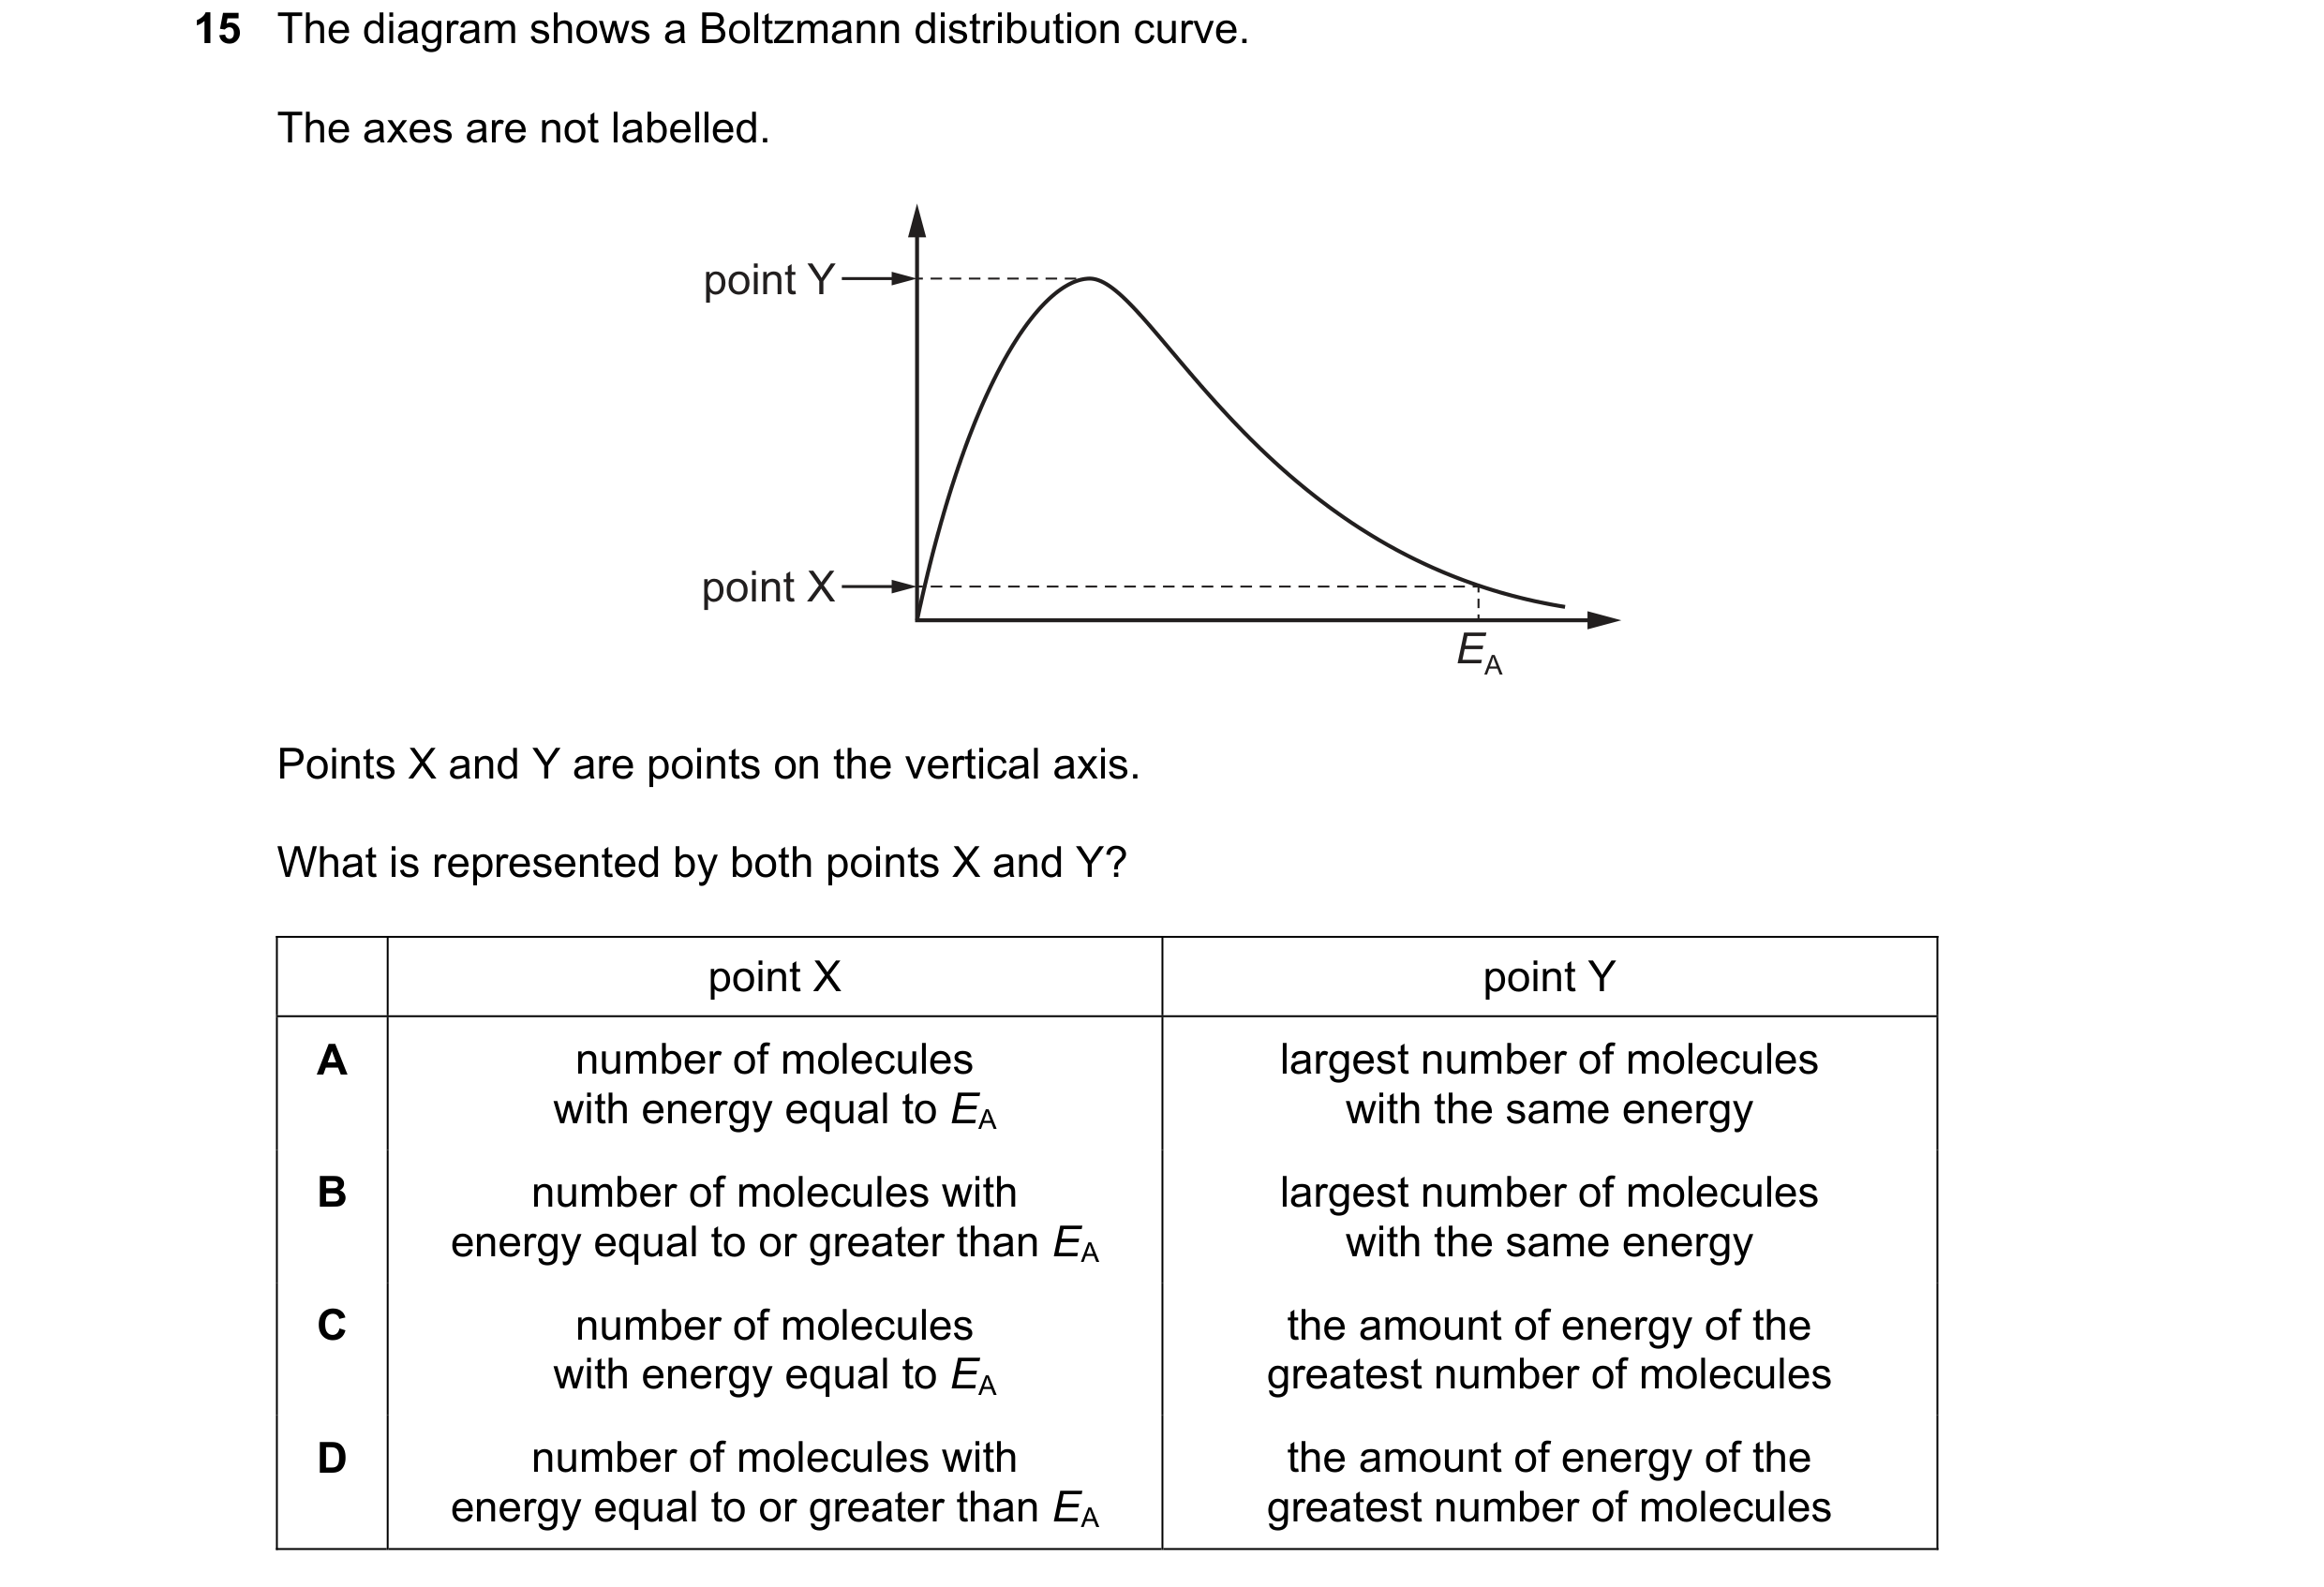 61 / 67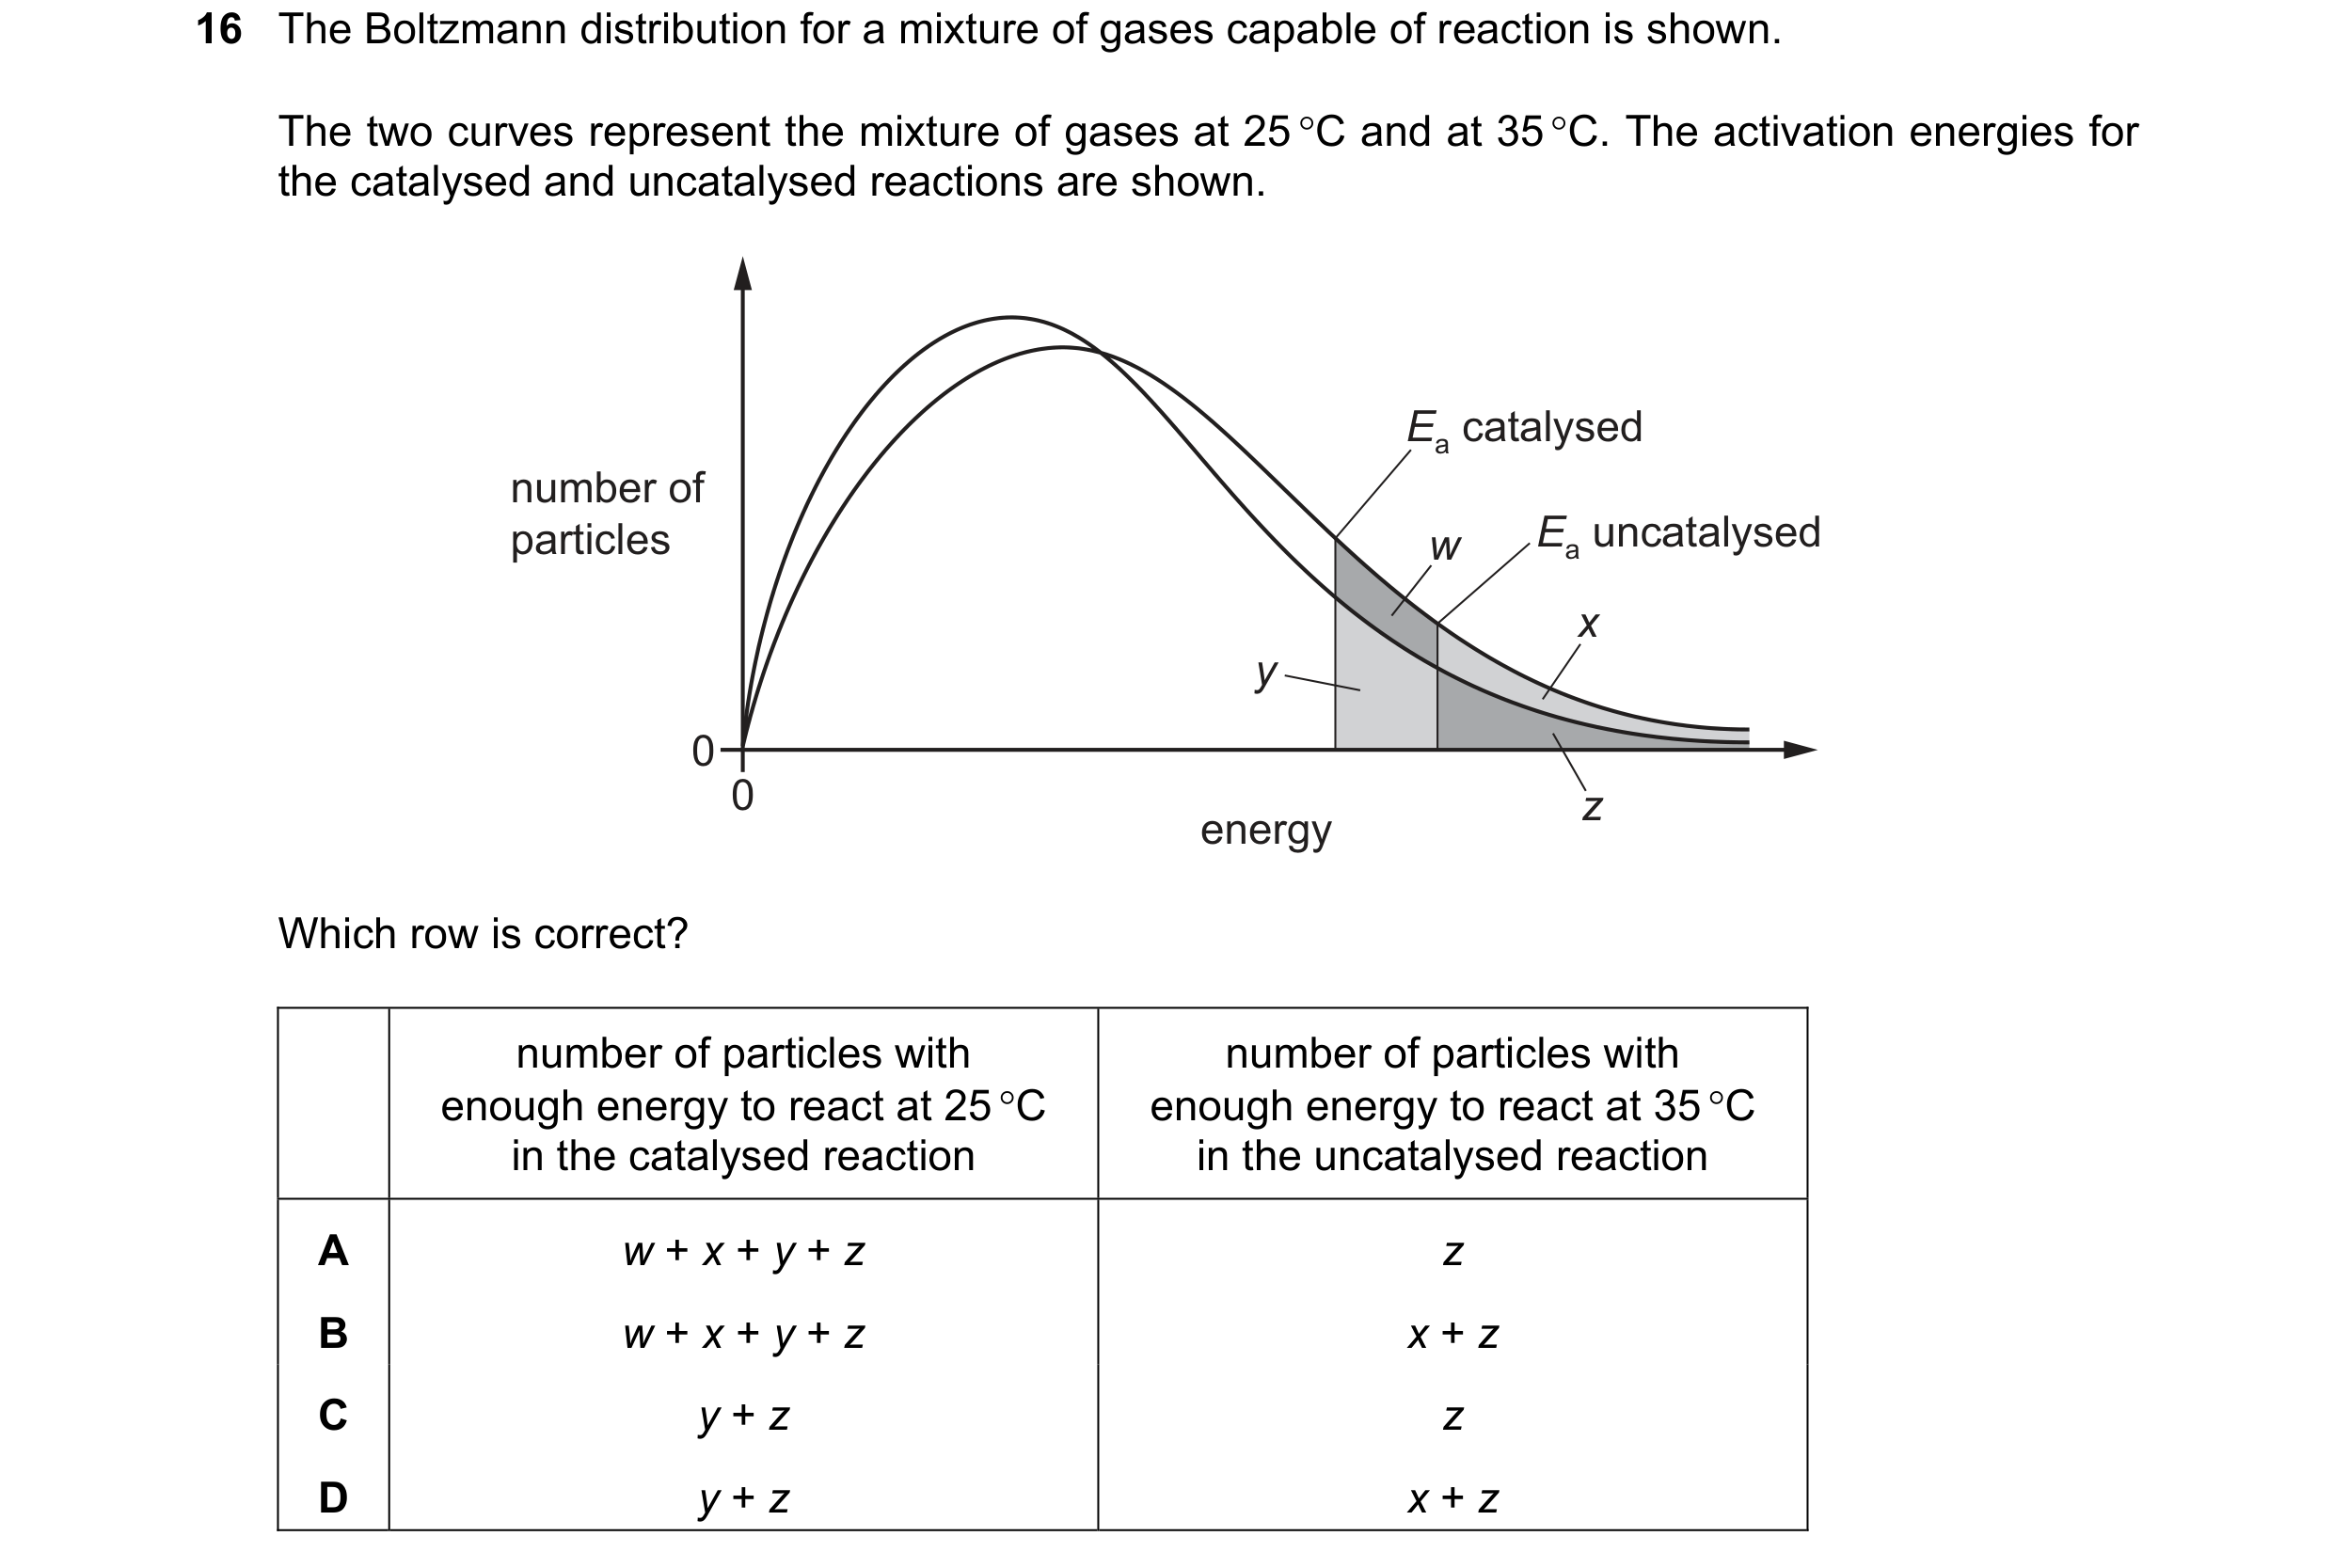
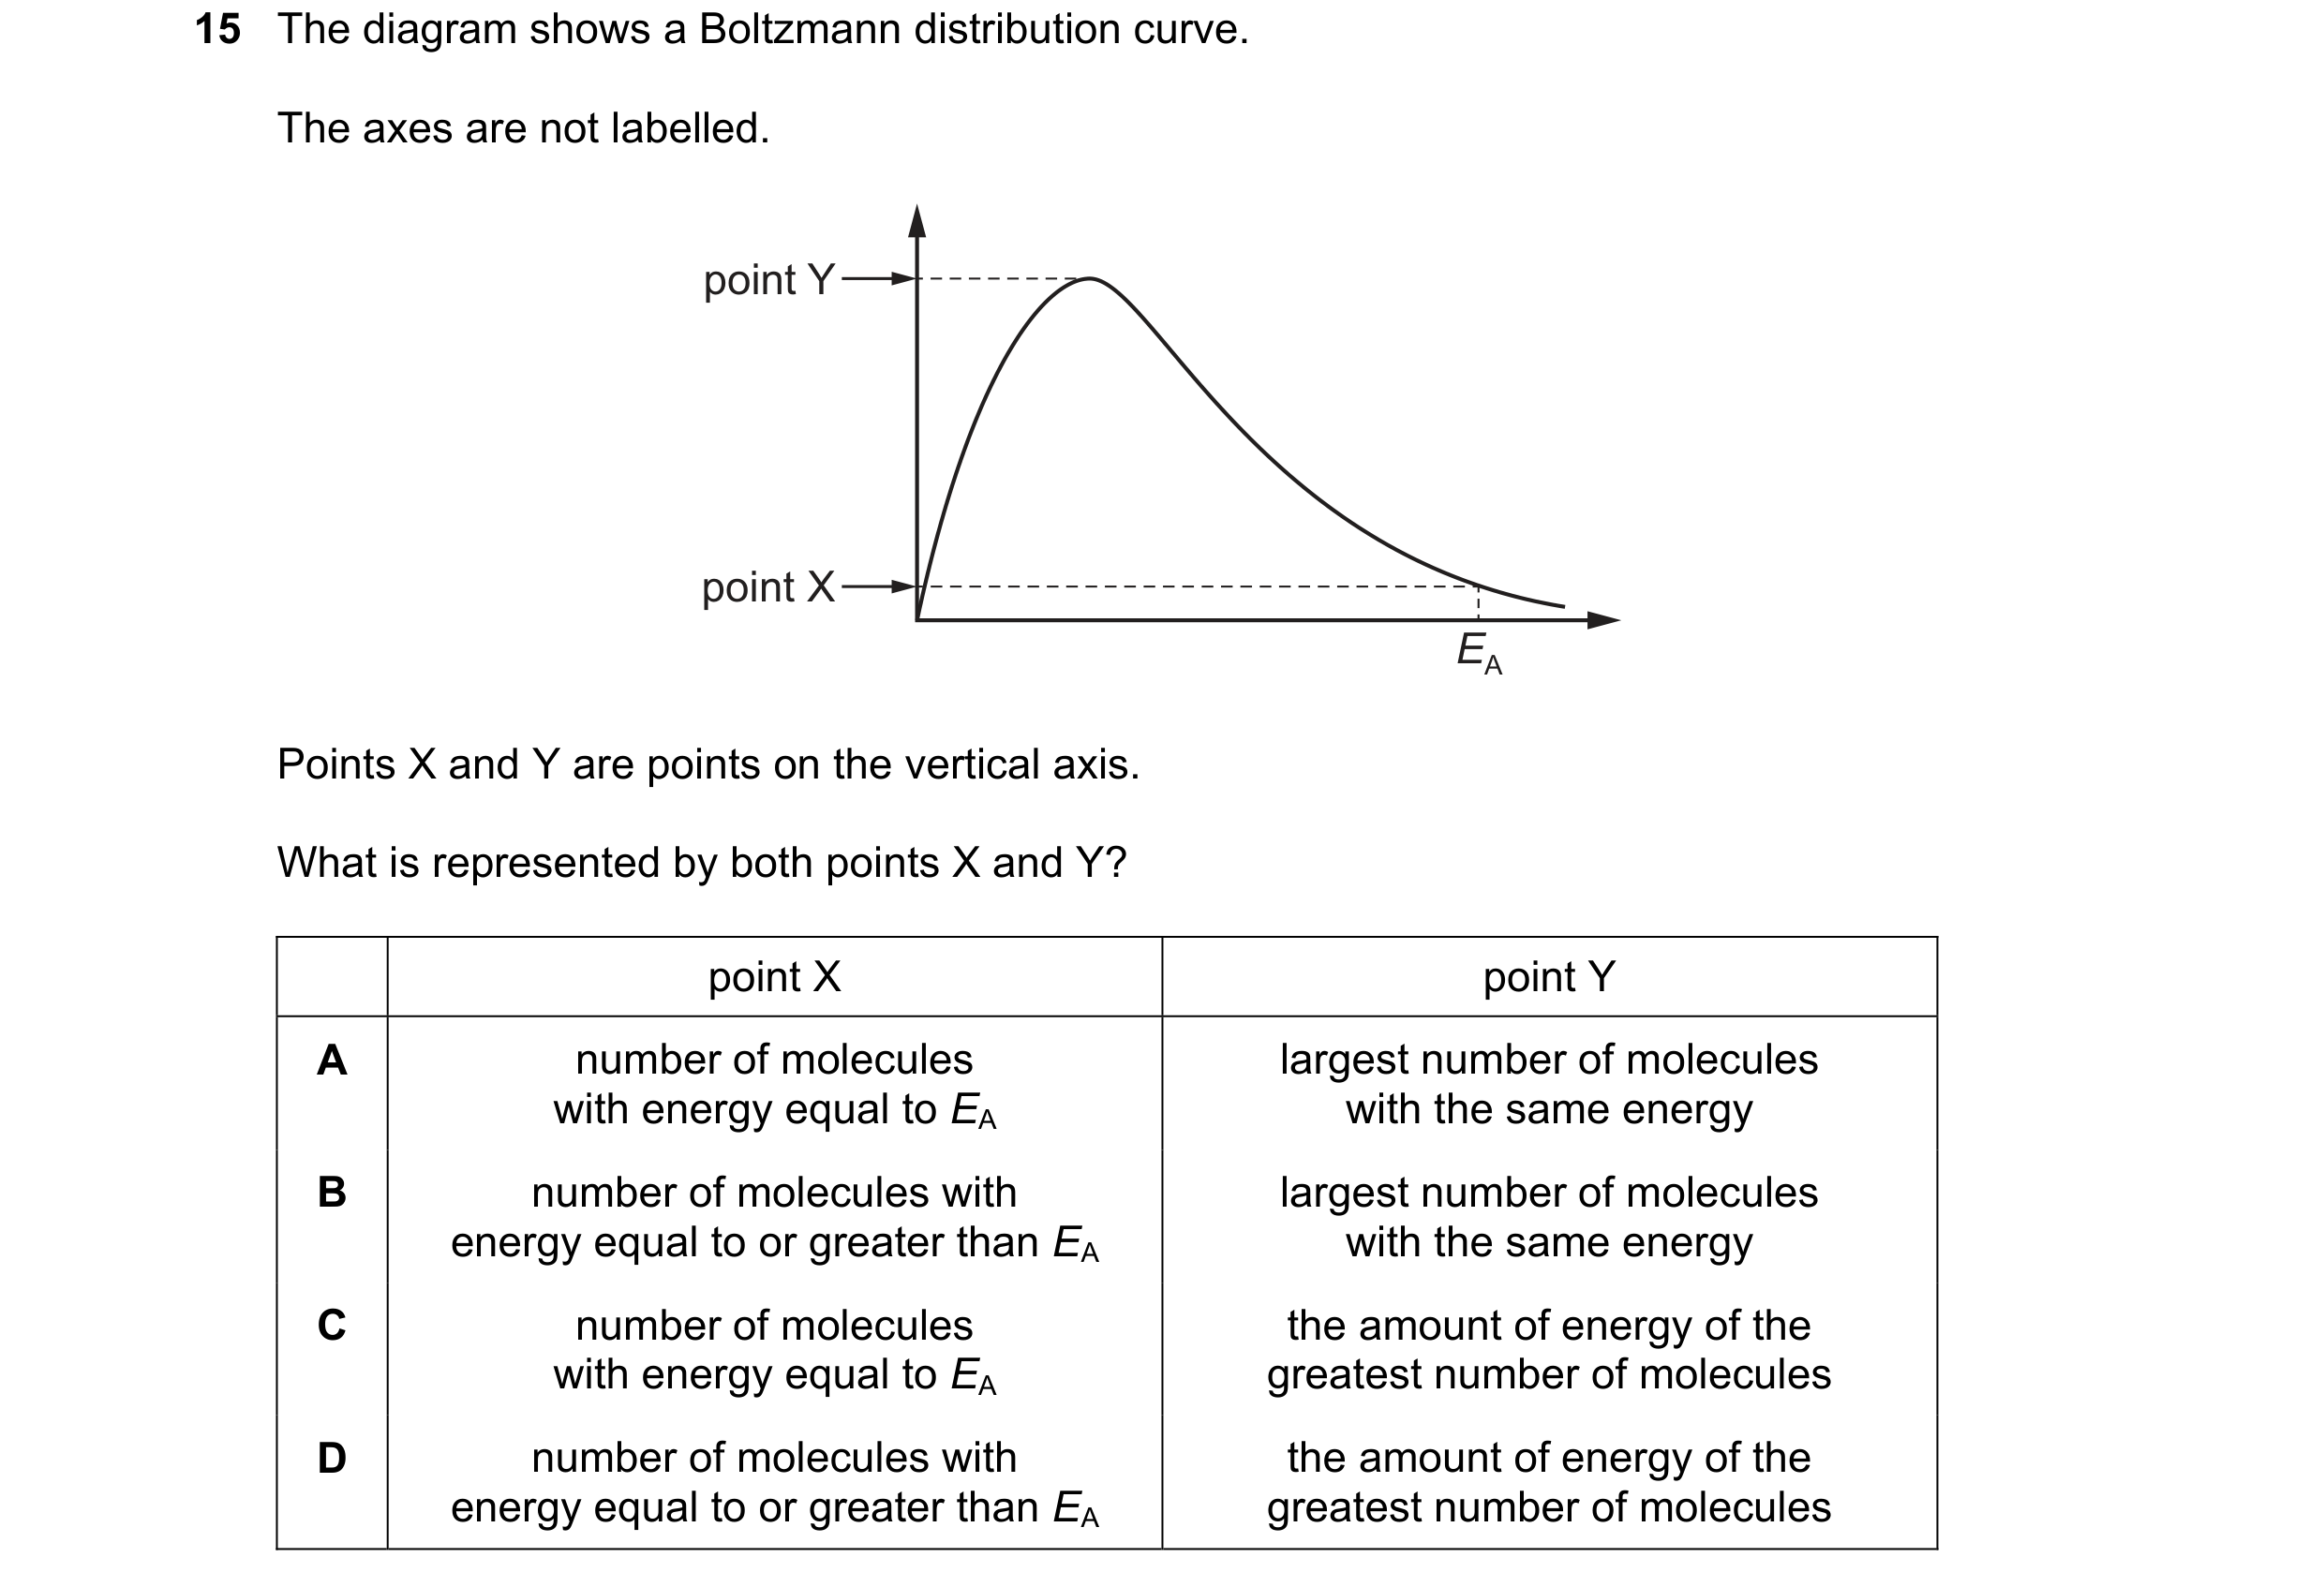 62 / 67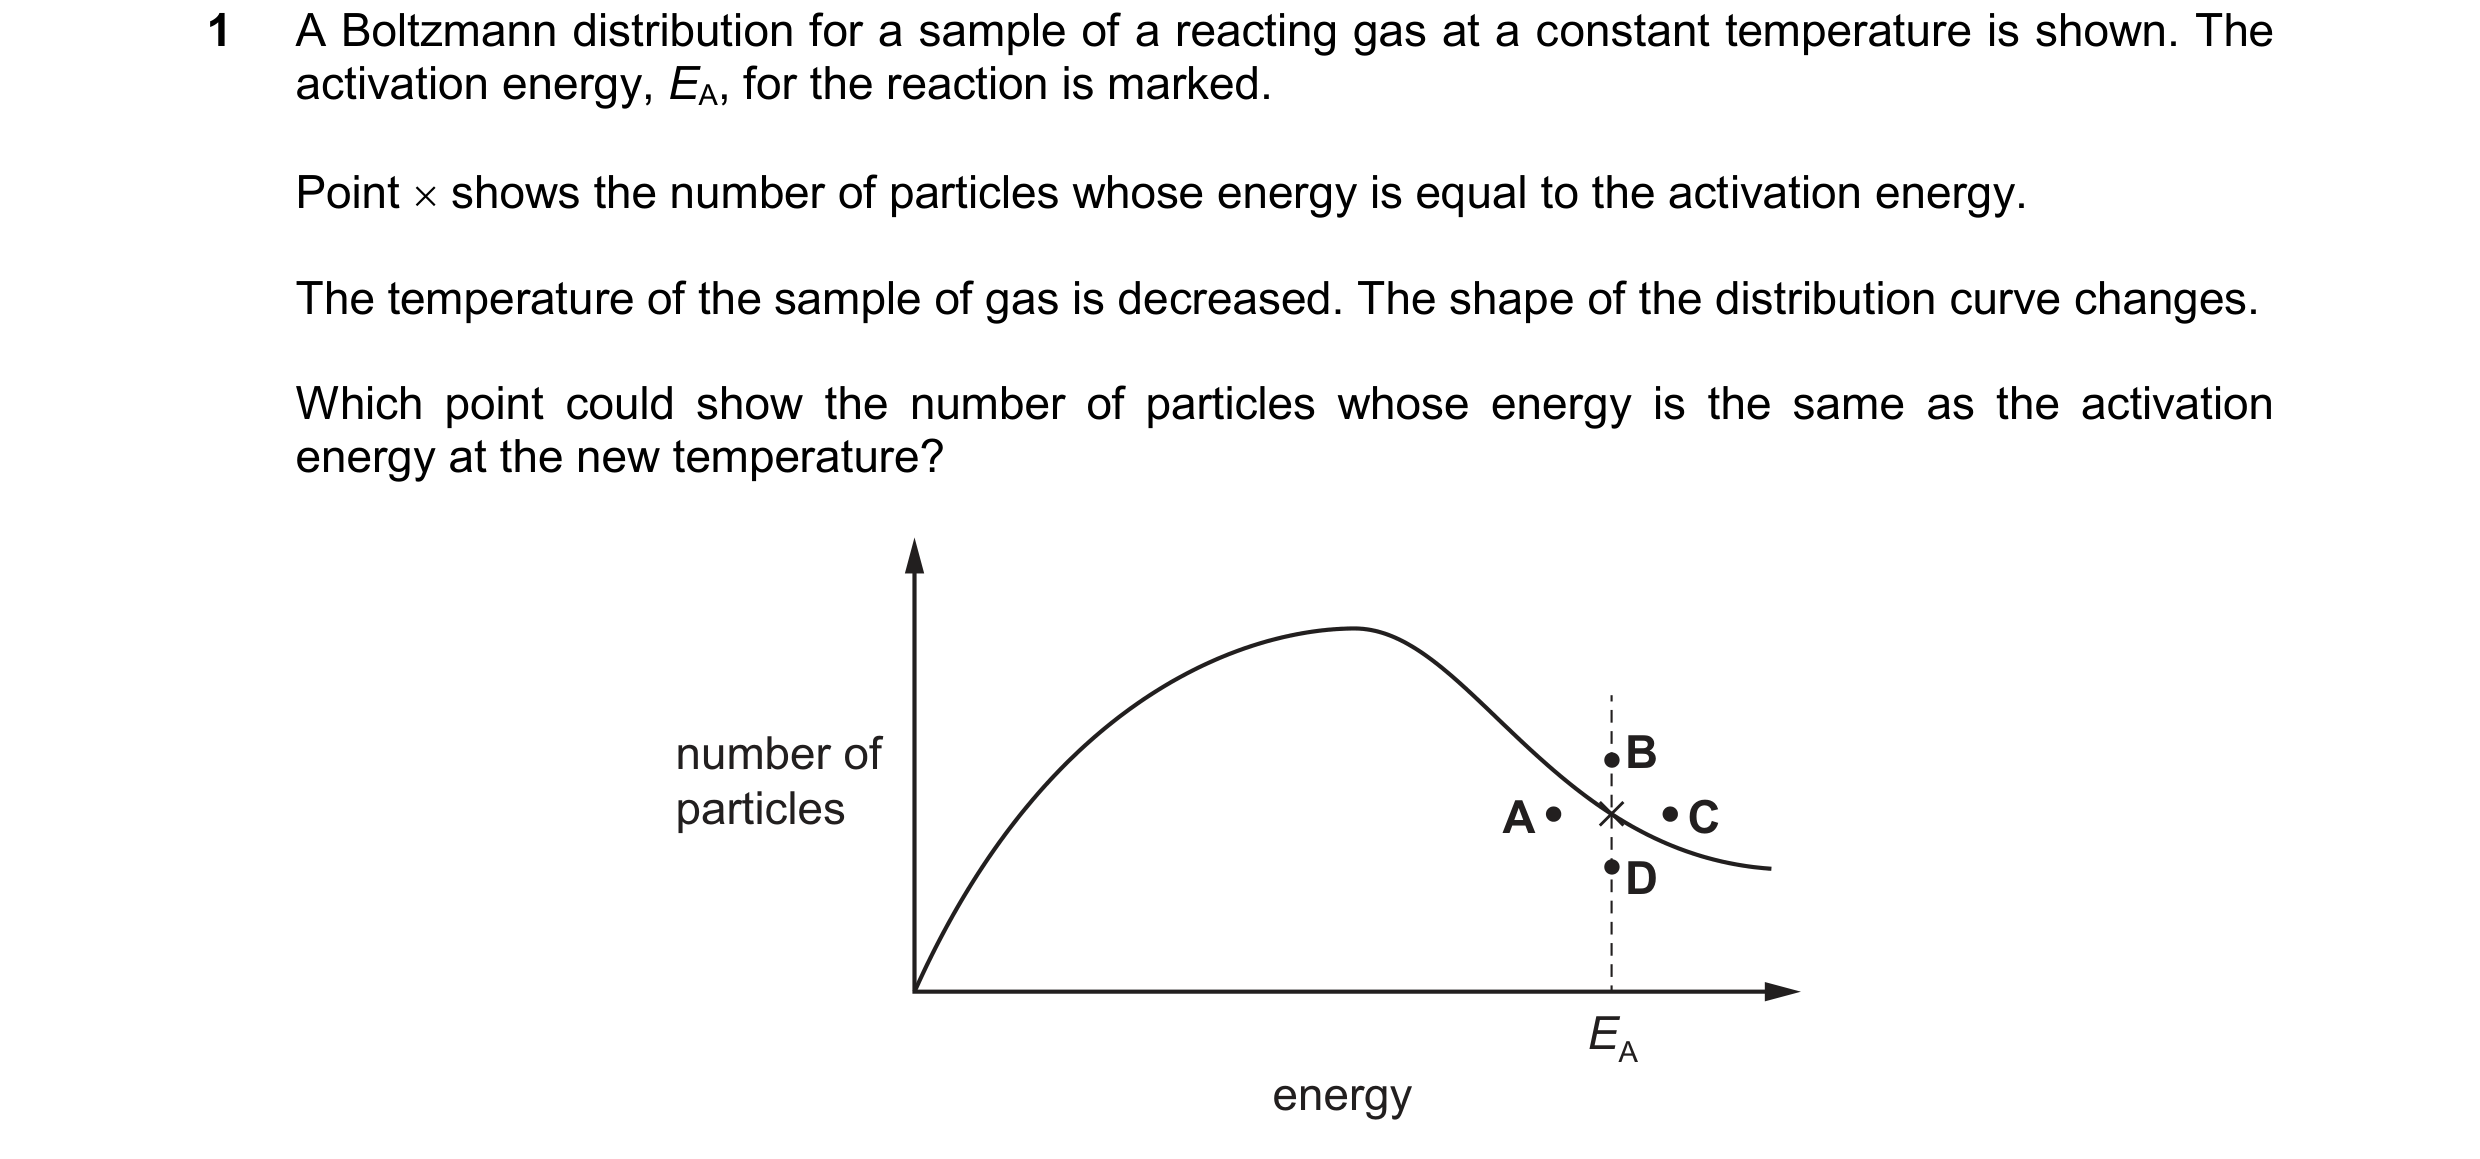
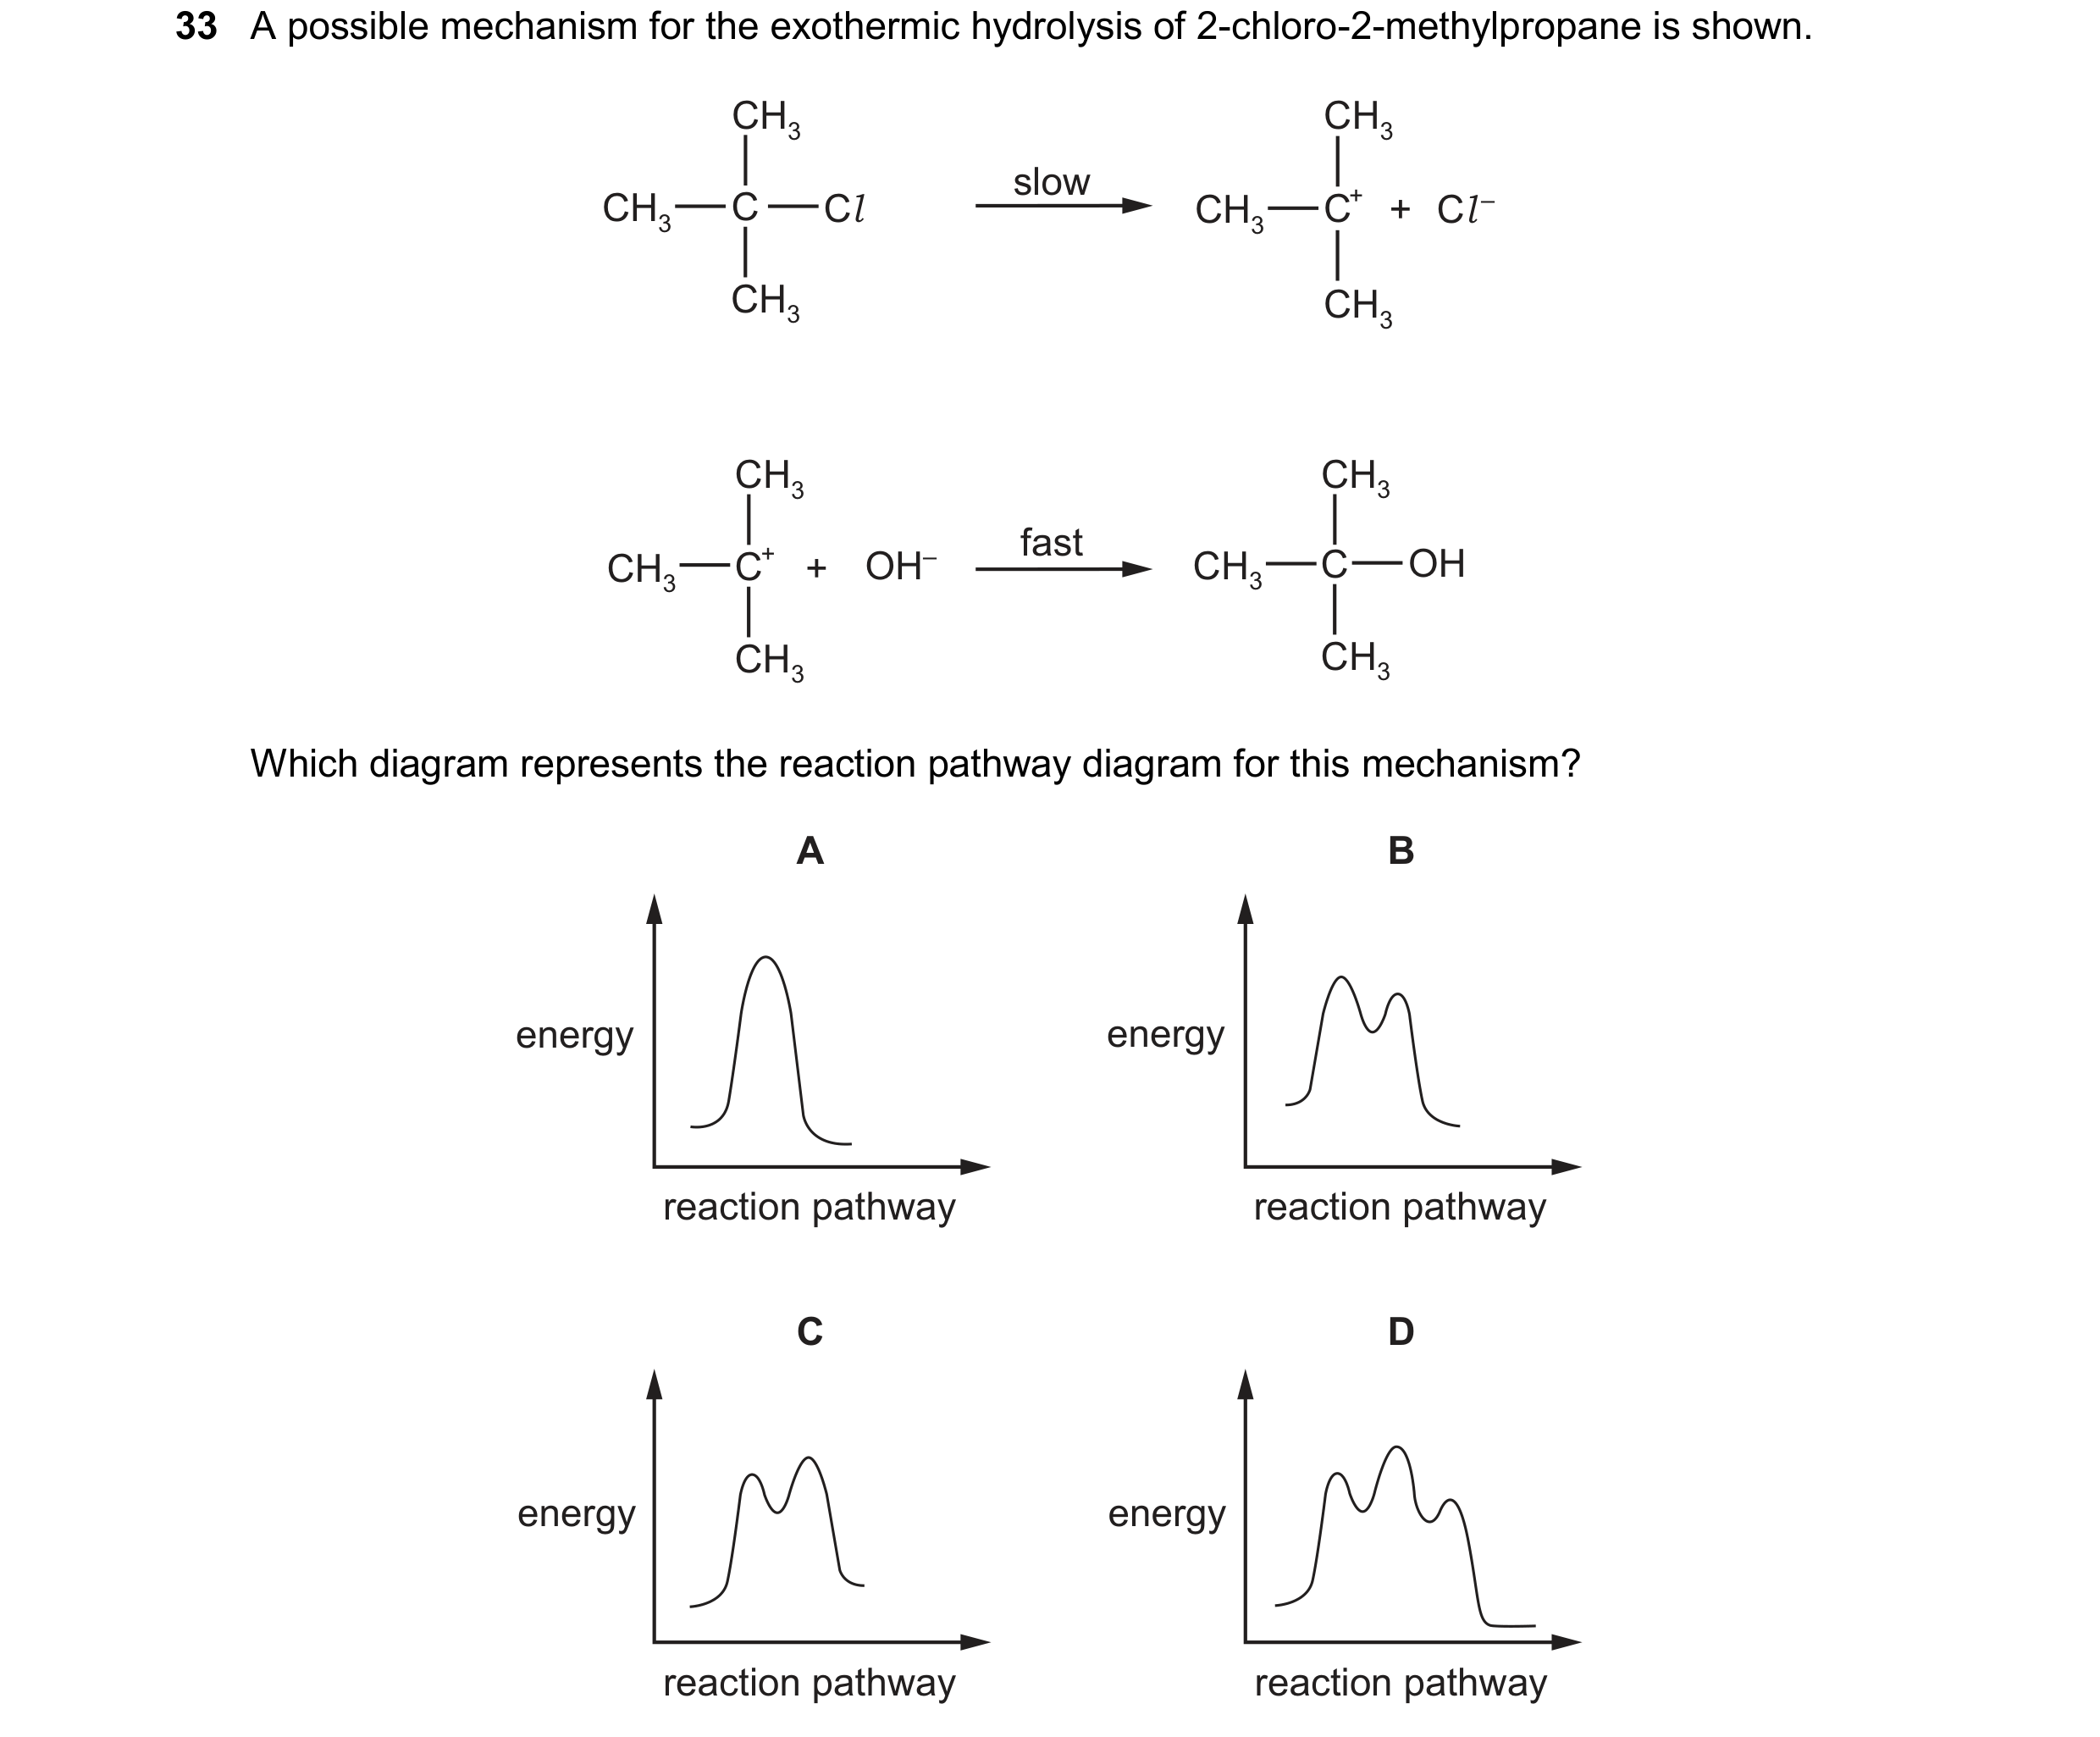 63 / 67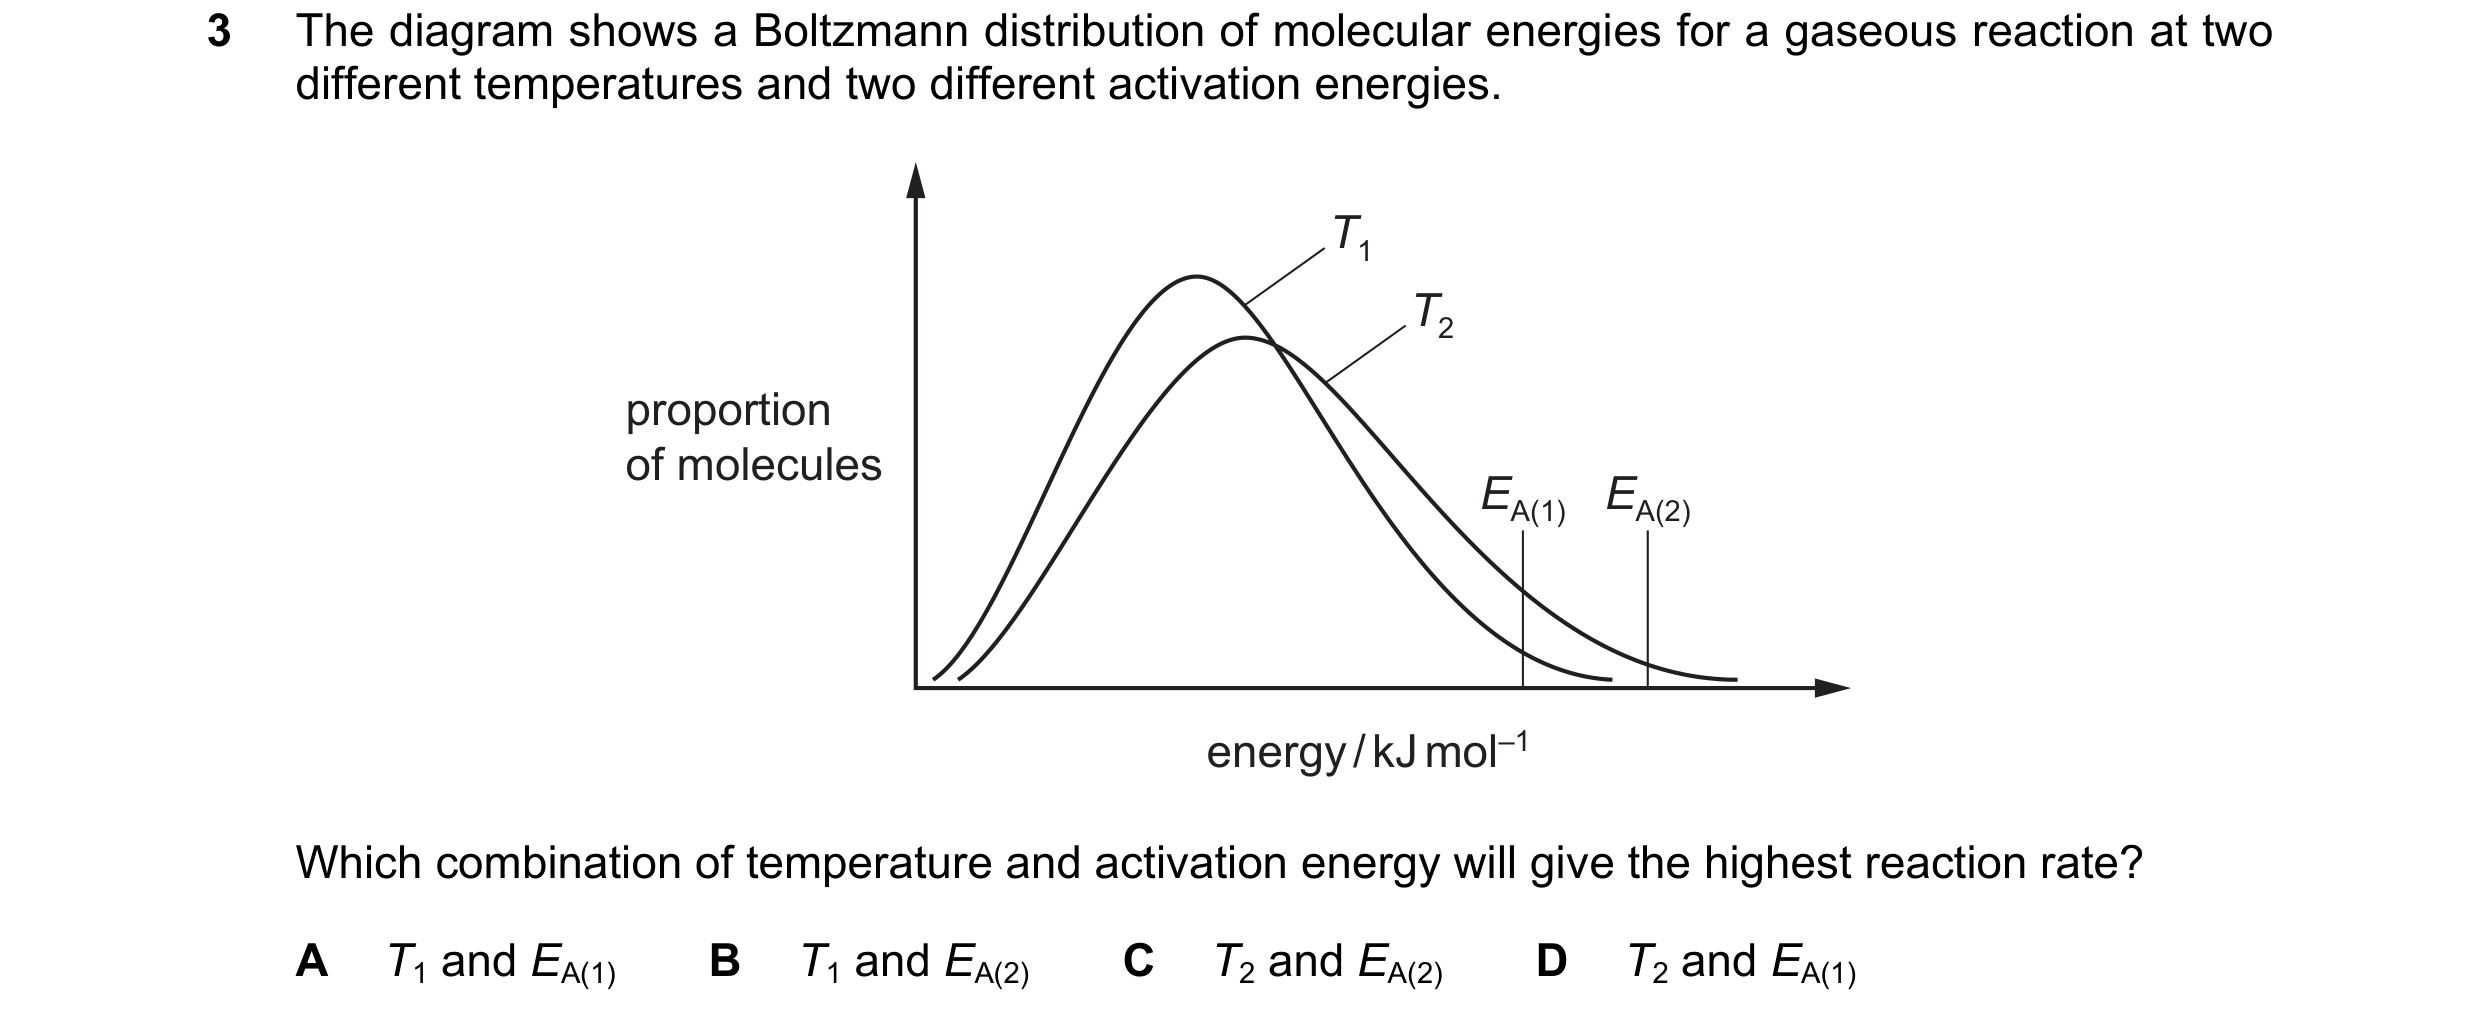
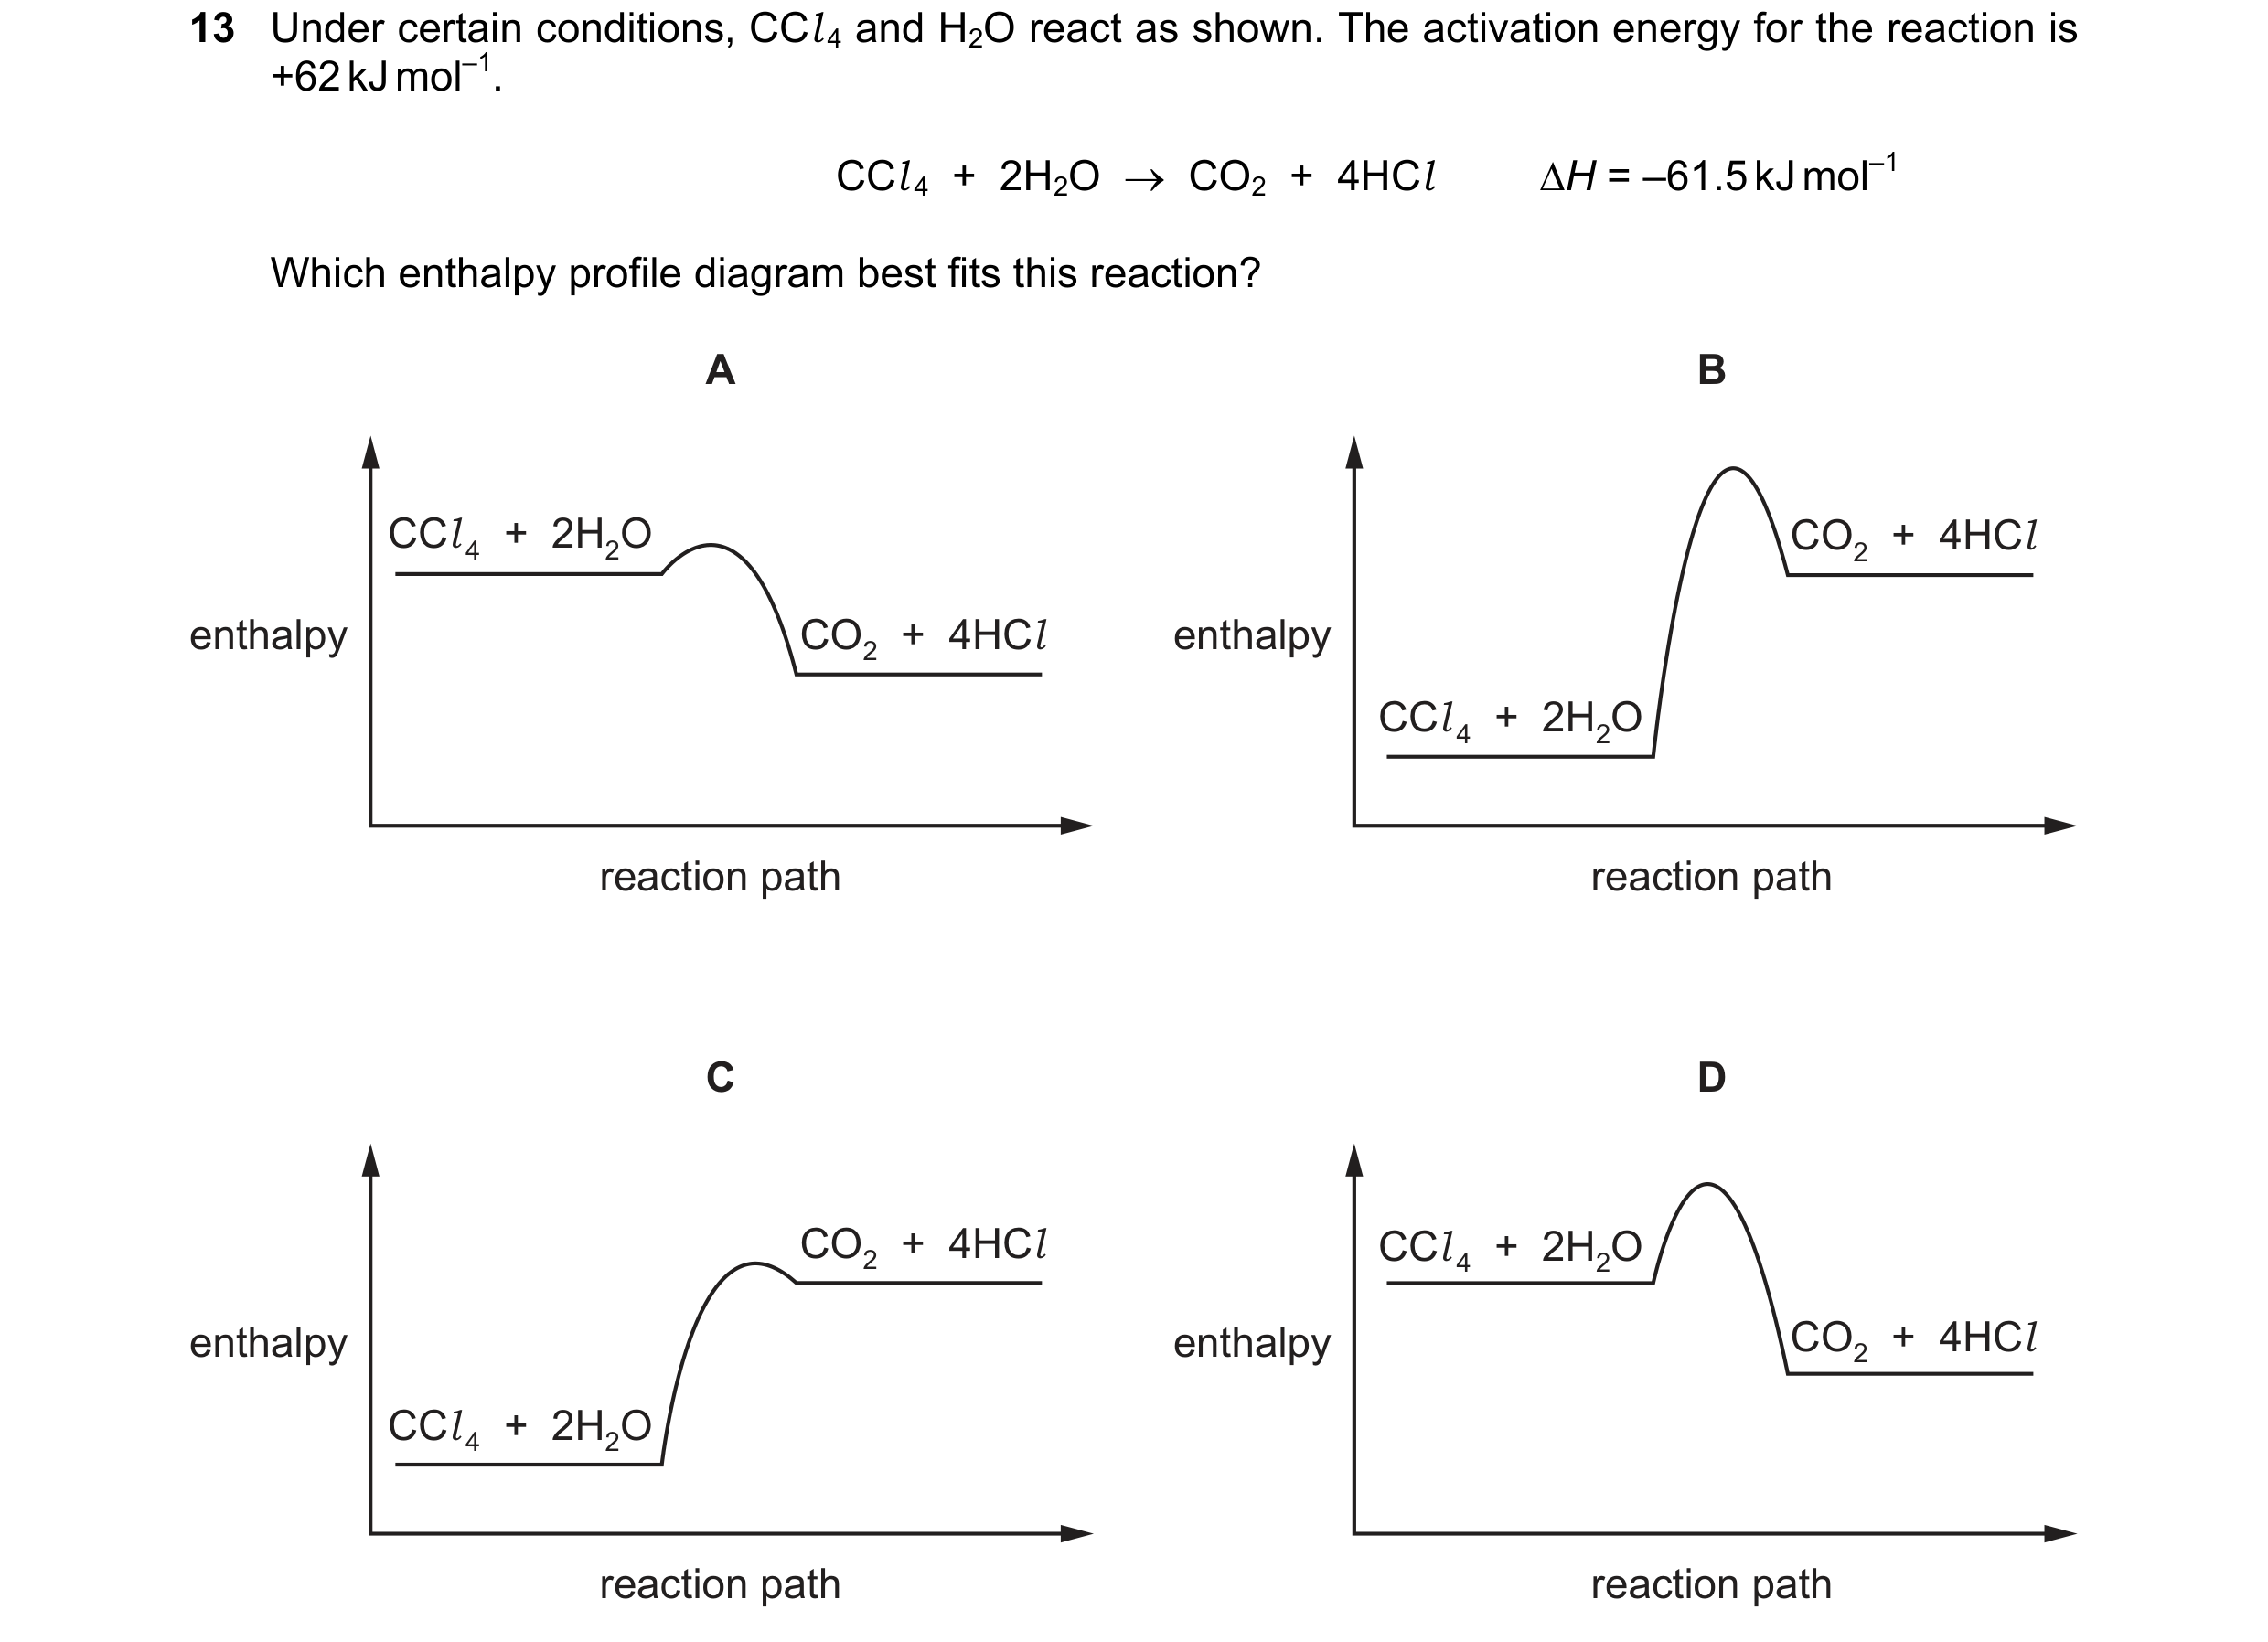 64 / 67
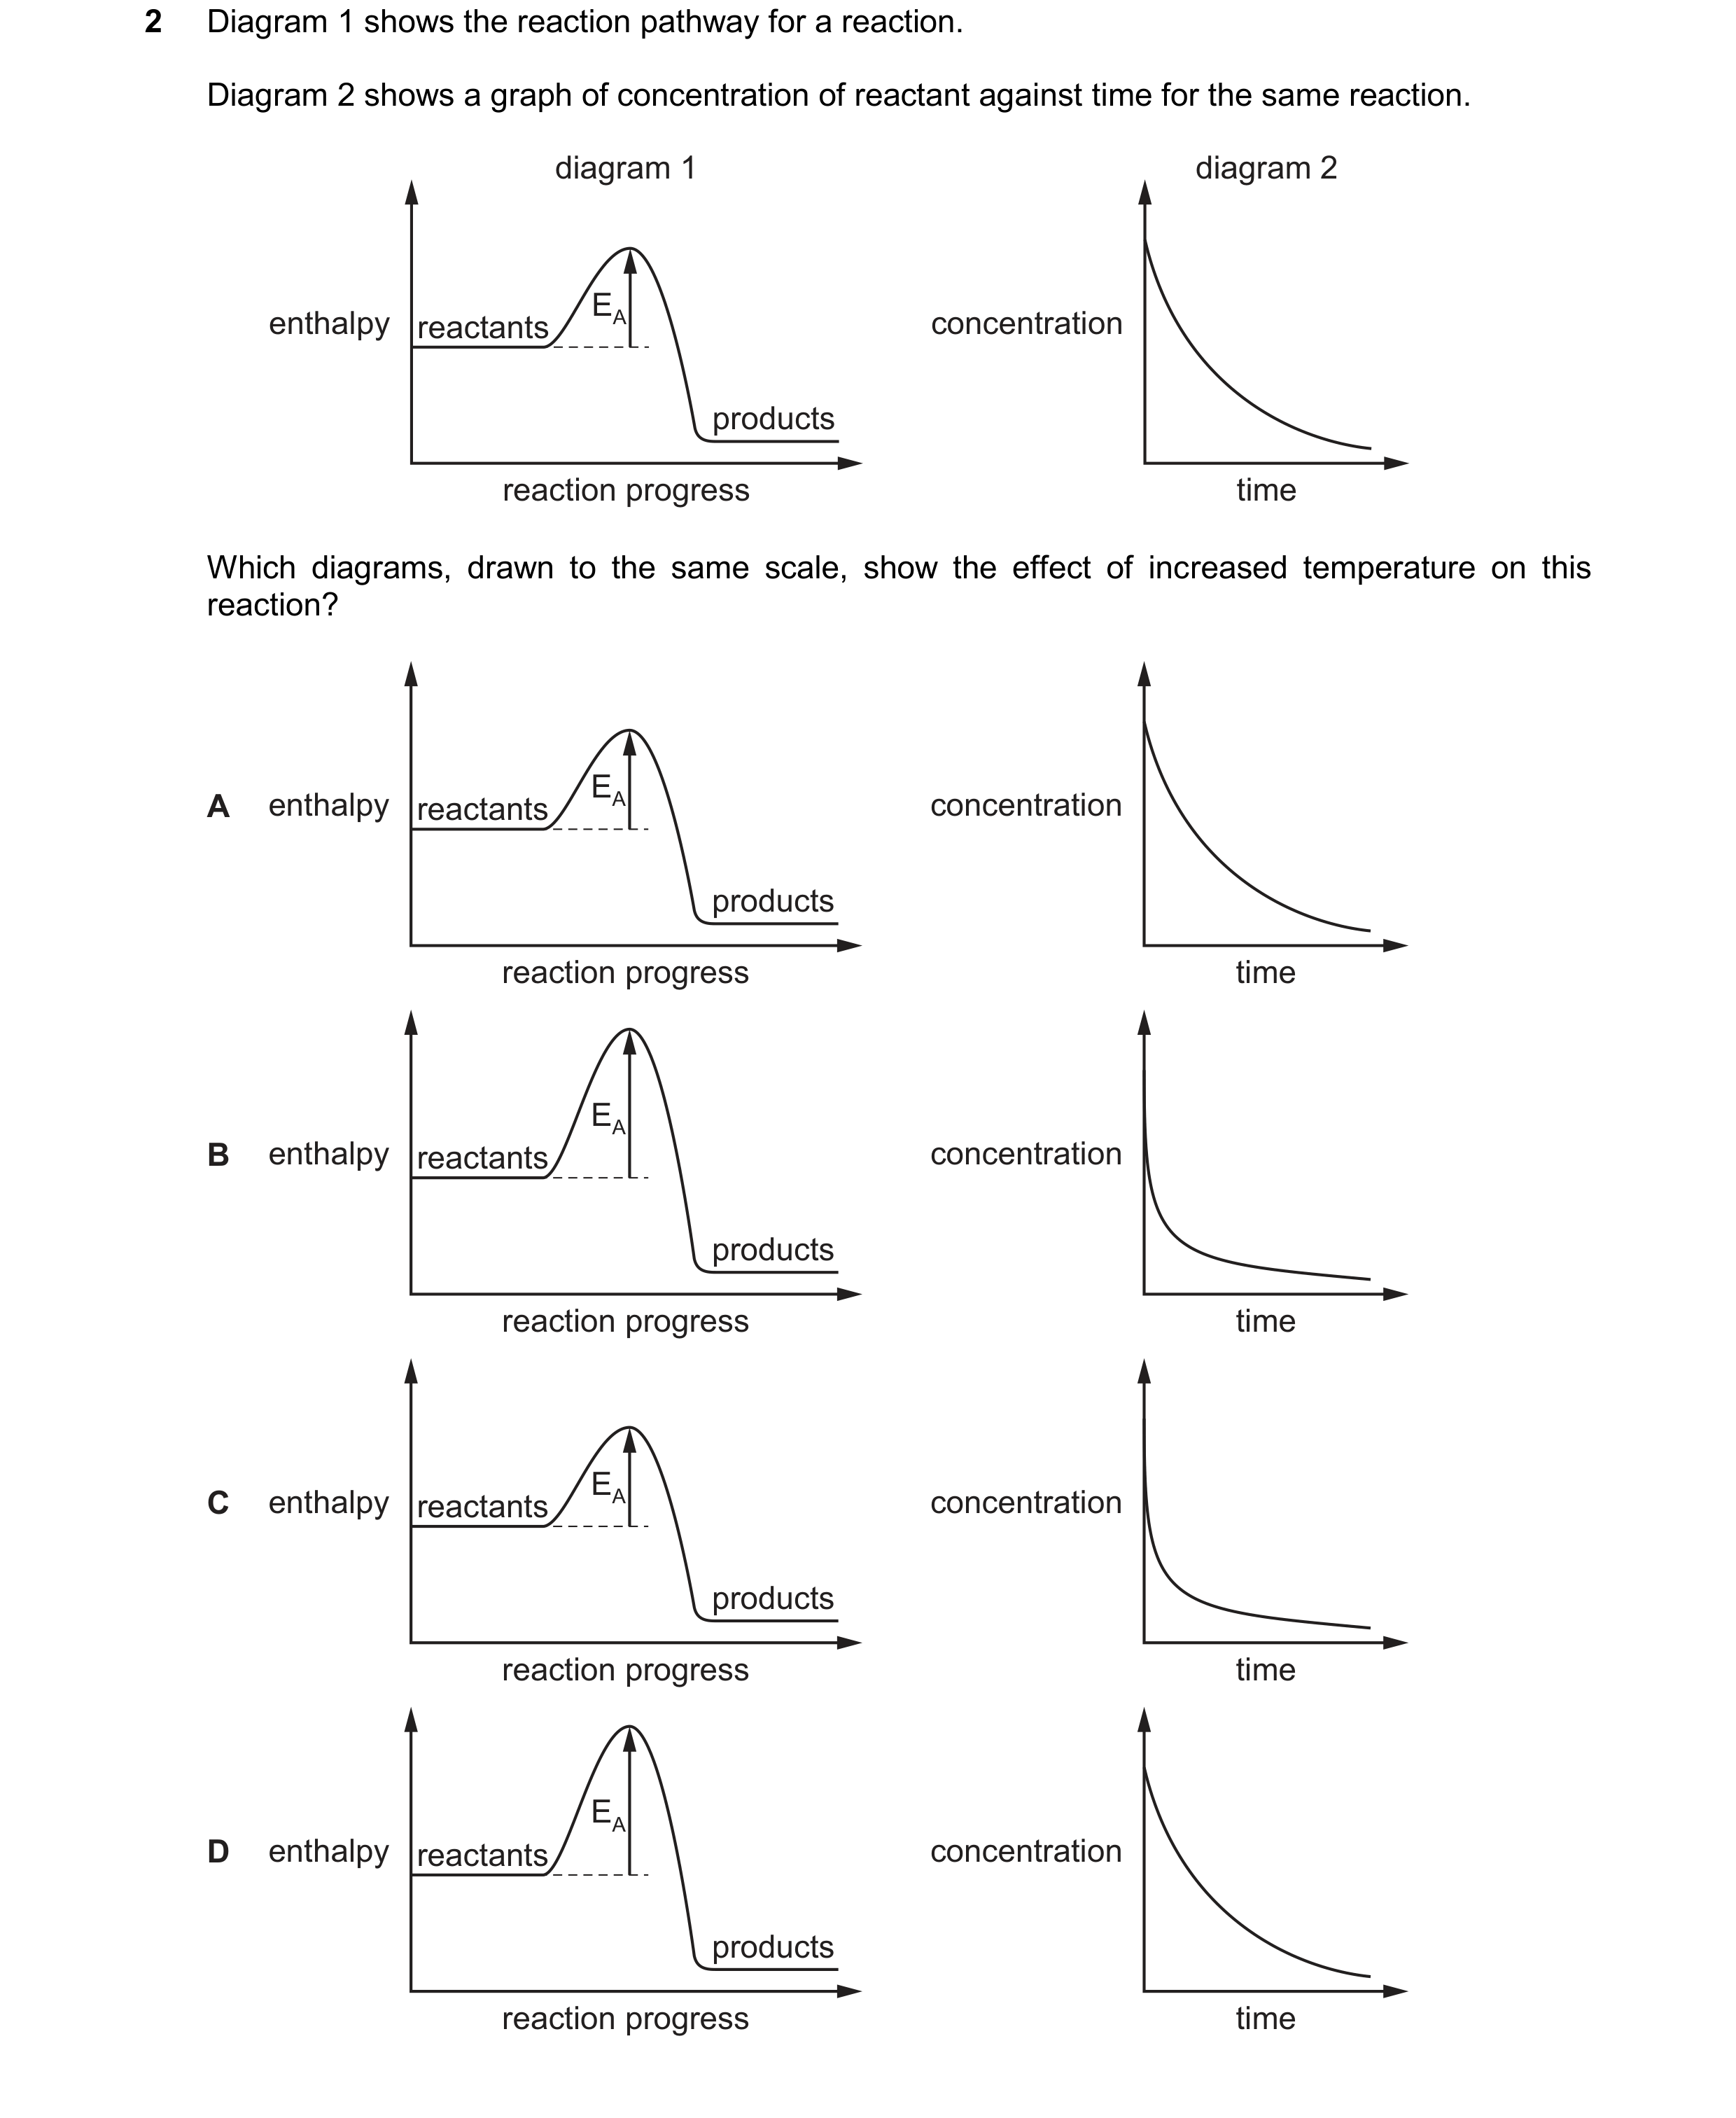 65 / 67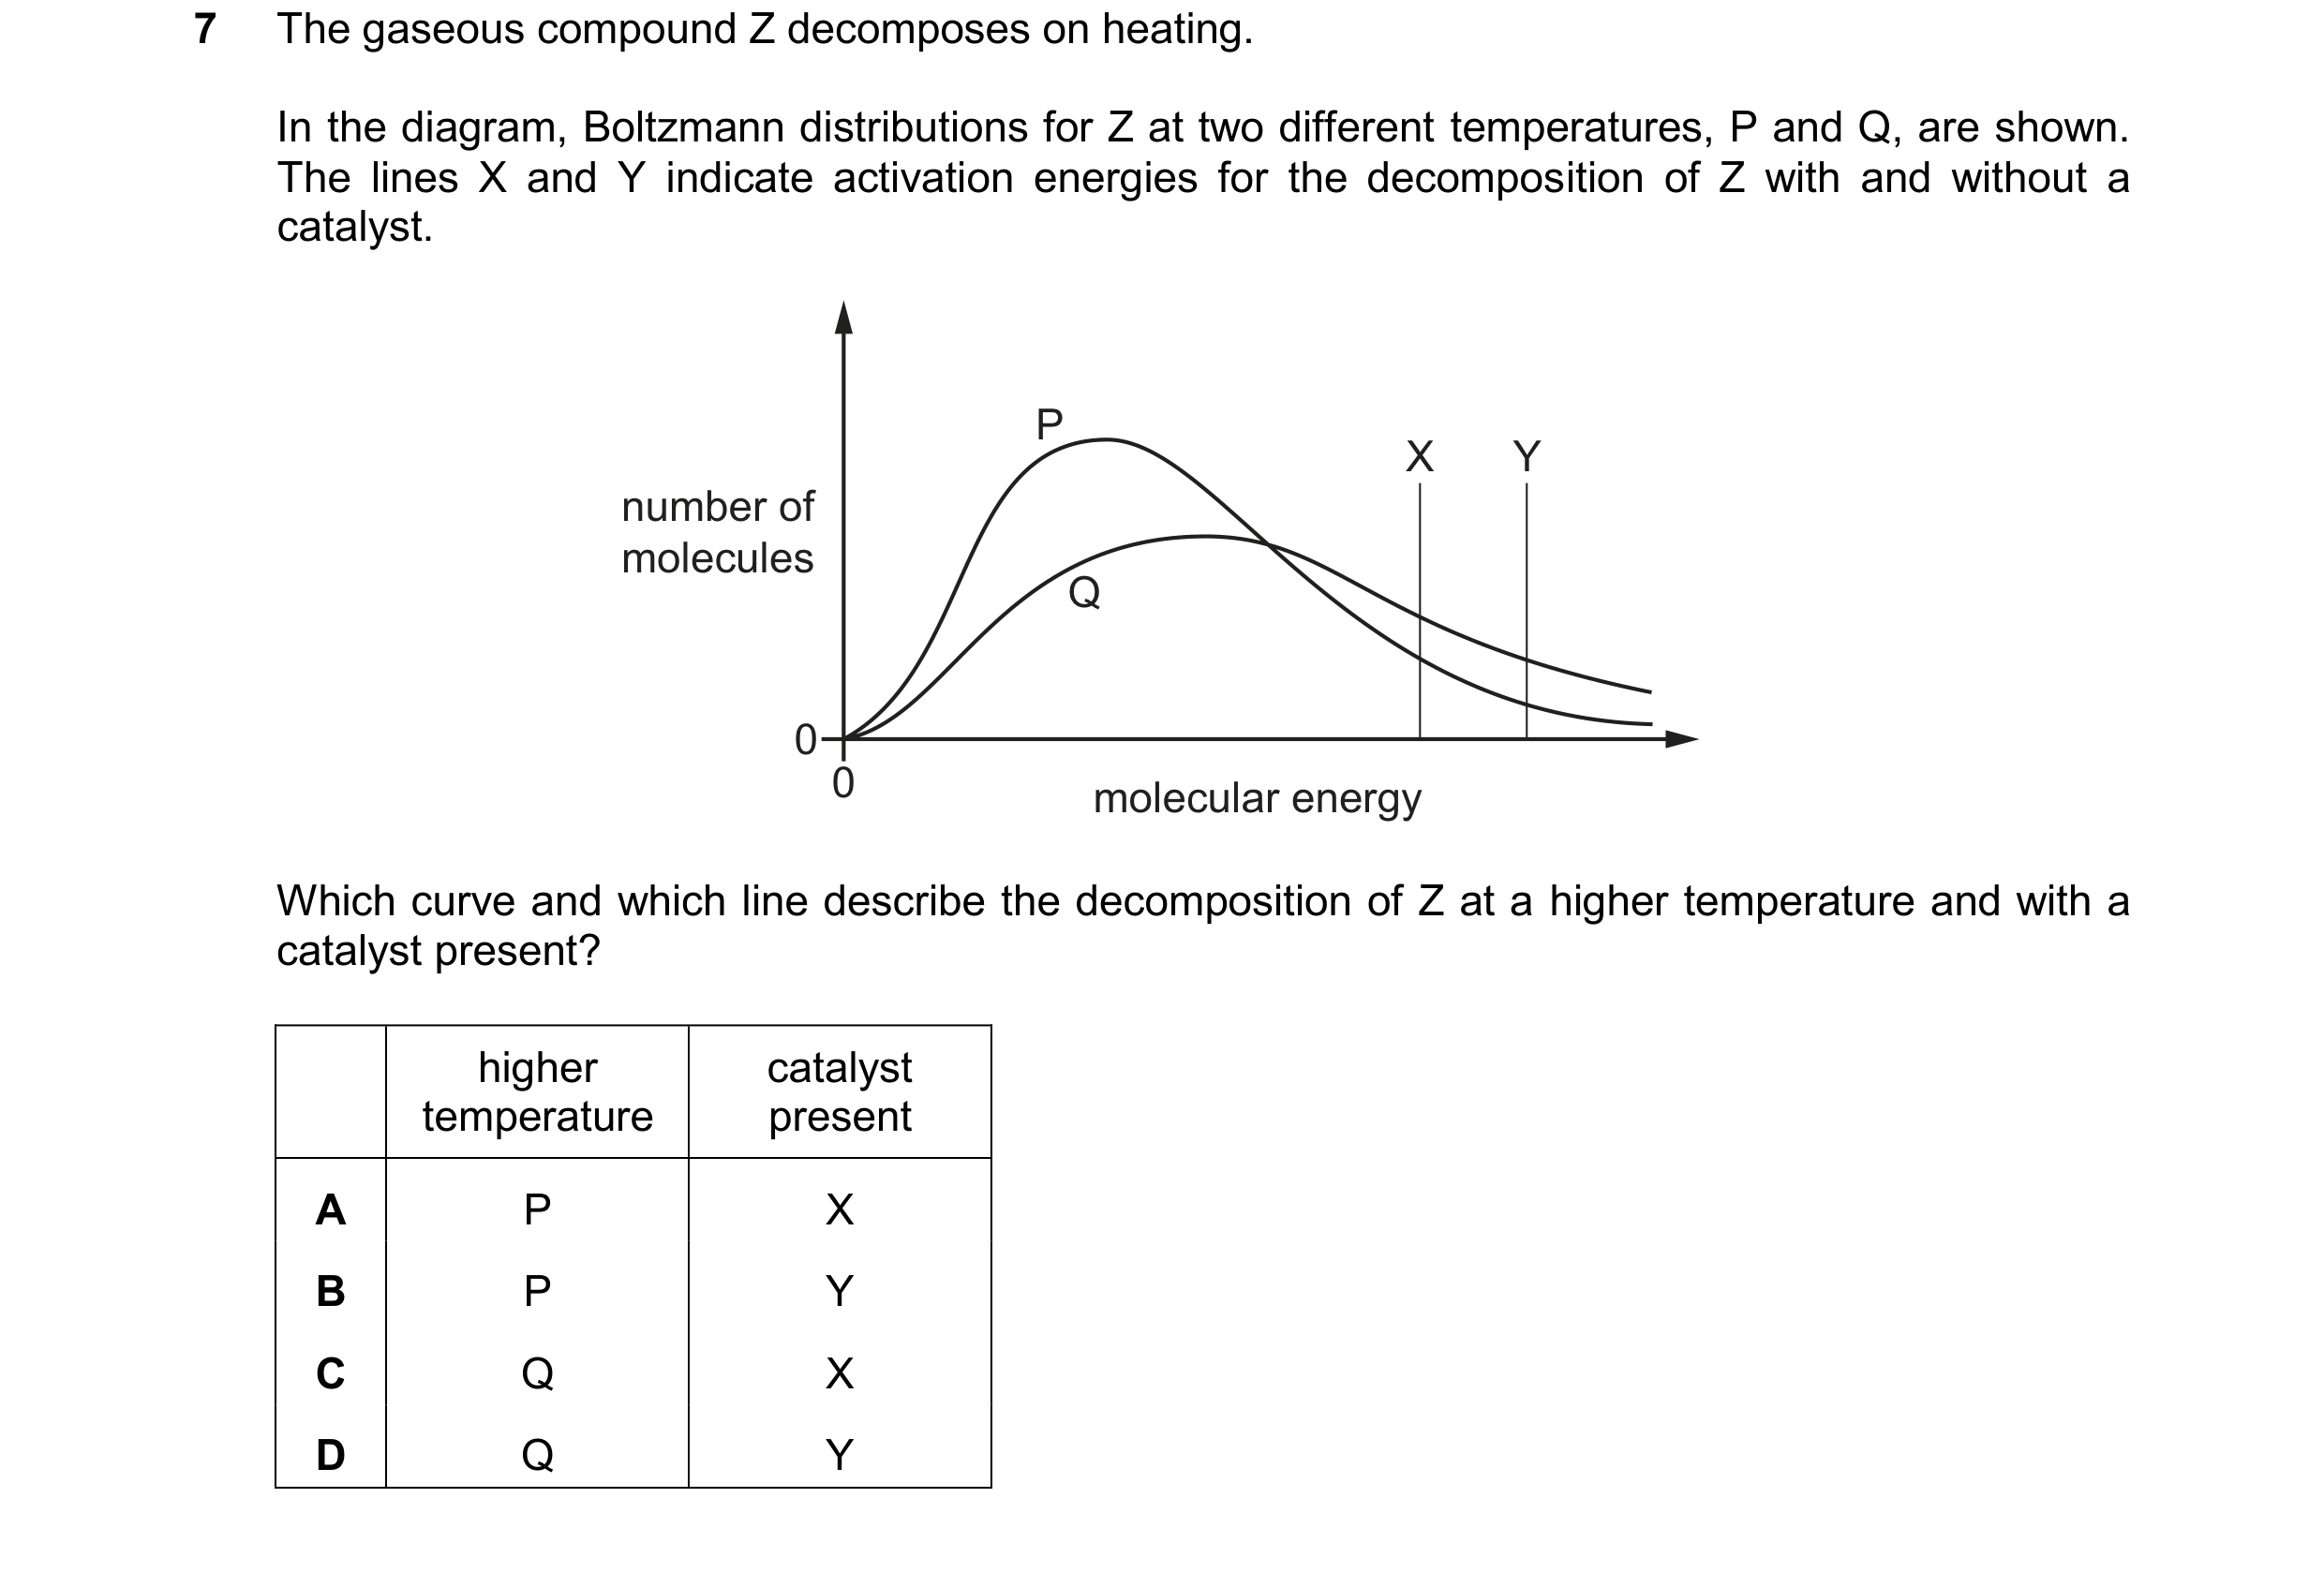
 66 / 67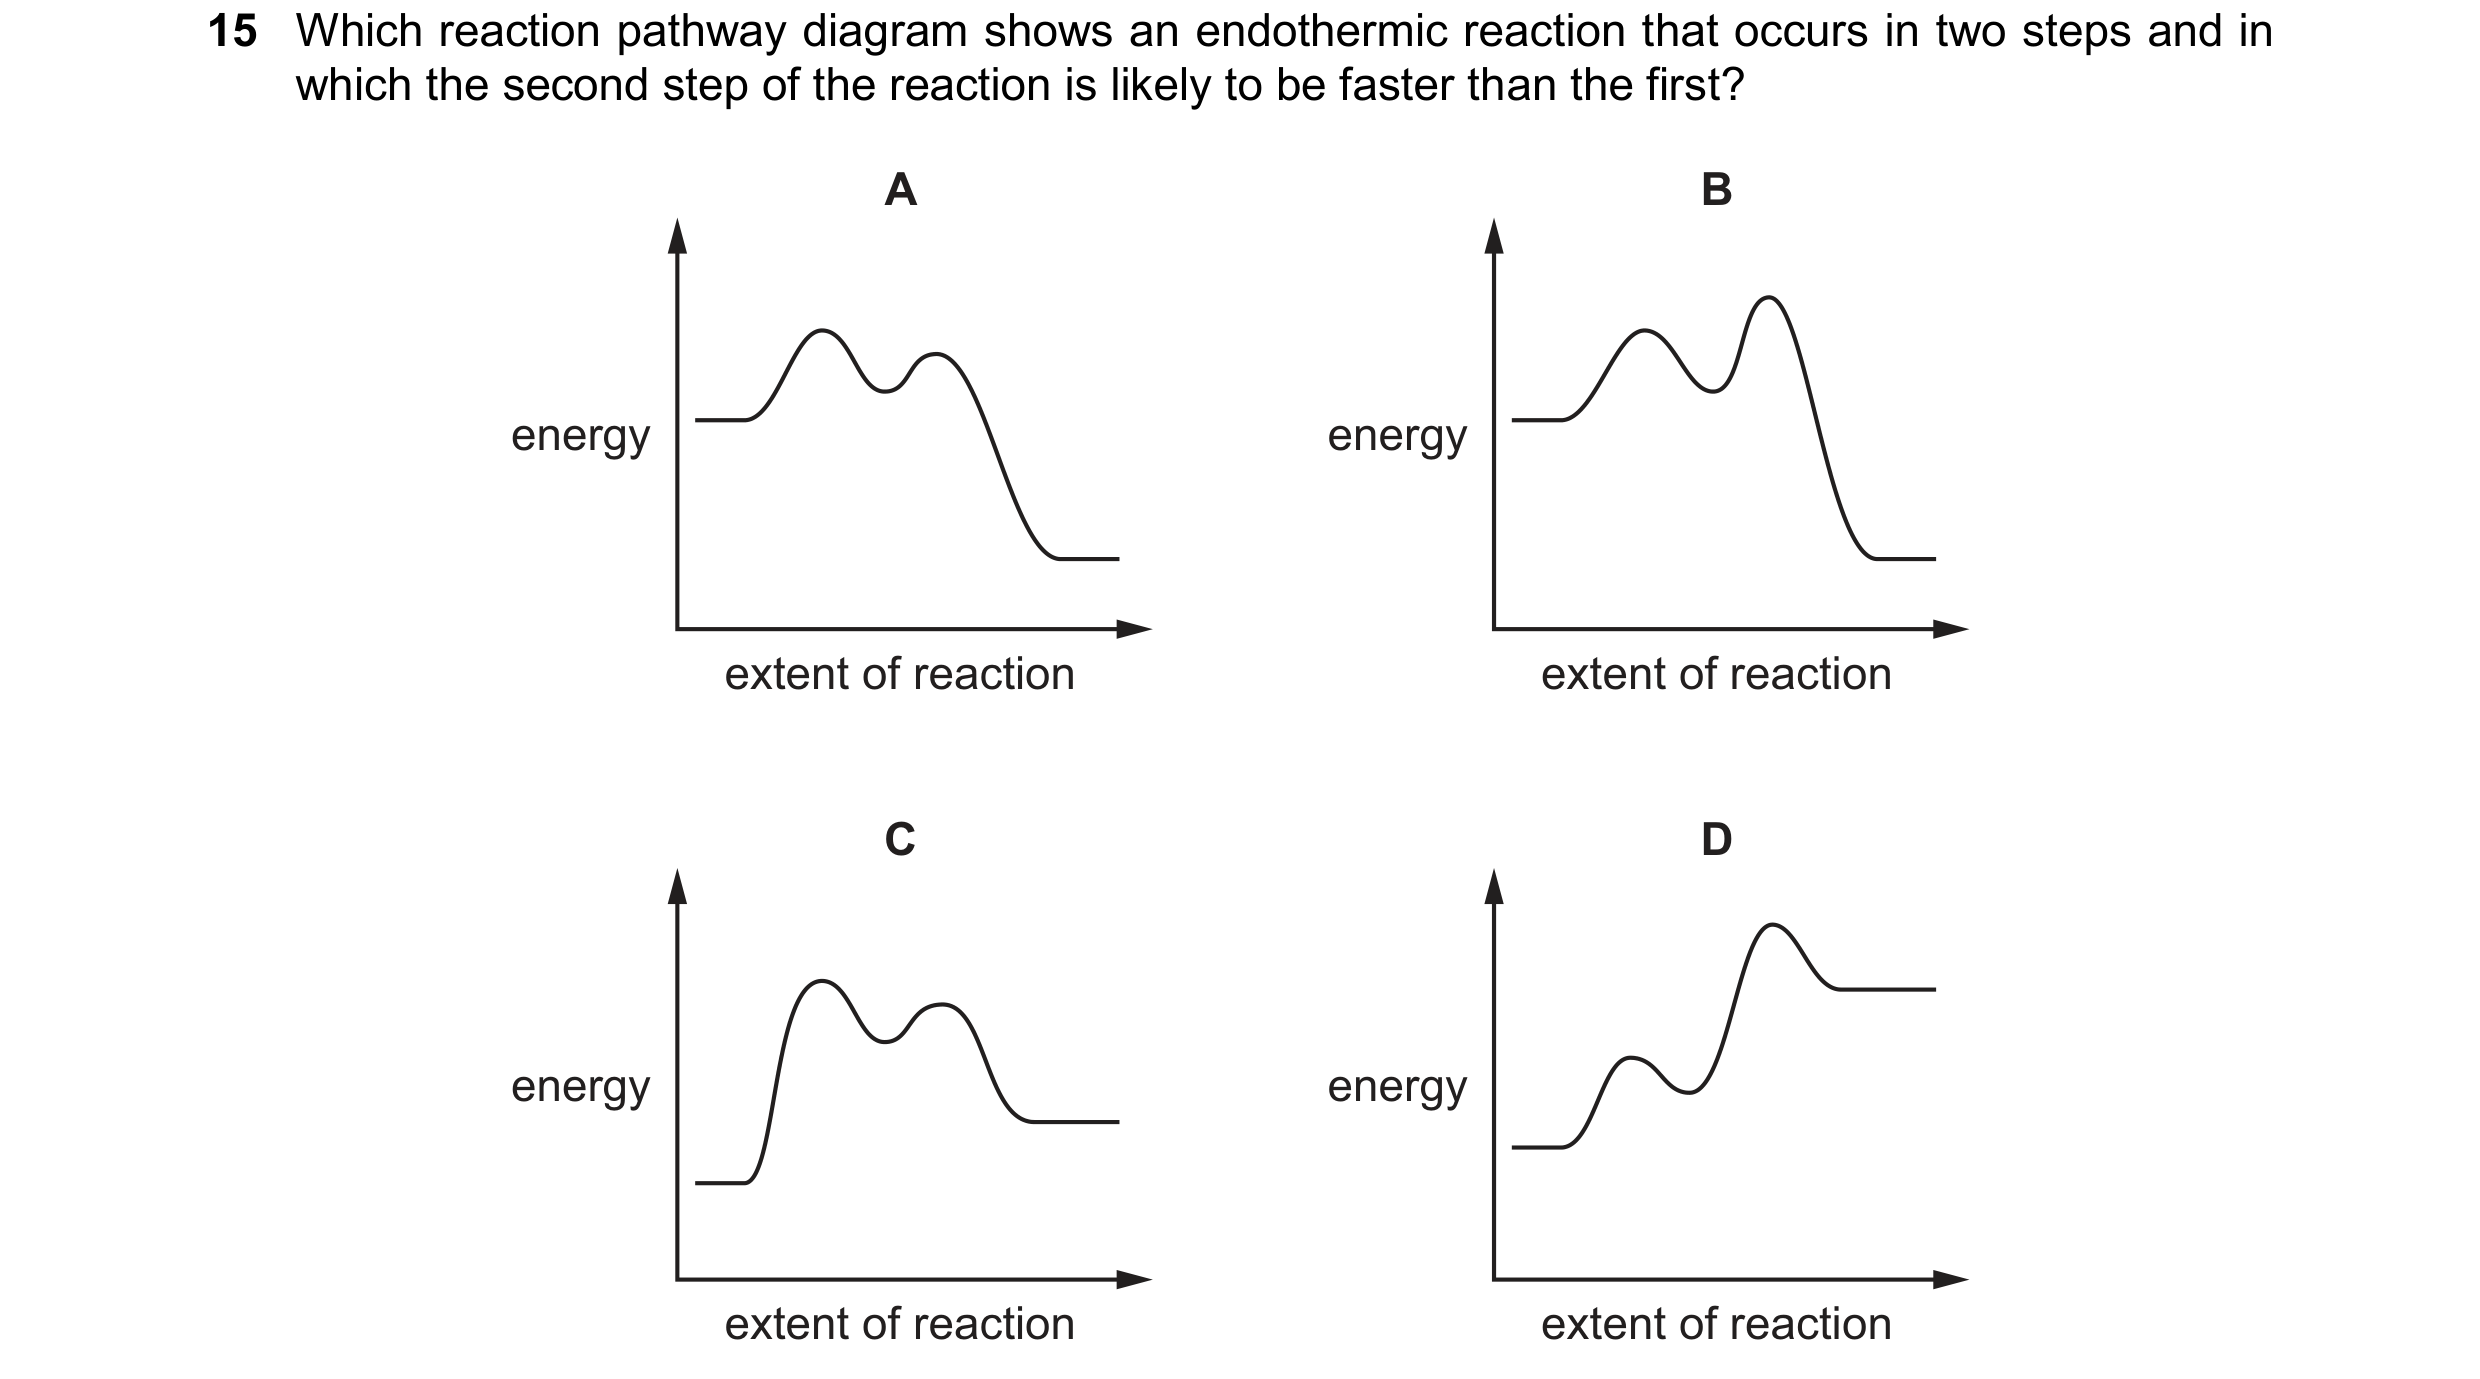
 67 / 67