Questions as text
Q1 · The curve X shows the activity of an enzyme at 20 oC 9700/11 Oct/Nov 2004
14 The curve X shows the activity of an enzyme at 20 oC. Curves A to D show the effect of different conditions on the activity of the enzyme. Which curve shows the effect of increasing the temperature by 10 oC and adding extra substrate? A B amount of product C D X time
1 marks
Answer: B
This question in 9700/11 Oct/Nov 2004
Q2 · What is the effect of increasing substrate concentration on the degree of inhibition of… 9700/11 Oct/Nov 2004
15 What is the effect of increasing substrate concentration on the degree of inhibition of an enzyme-controlled reaction? competitive inhibition non-competitive inhibition A decreased increased B decreased no change C increased decreased D no change increased
1 marks
Answer: B
This question in 9700/11 Oct/Nov 2004
Q3 · A solution of starch is mixed with a solution of amylase 9700/11 May/June 2006
8 A solution of starch is mixed with a solution of amylase. Which reagent should be used to confirm that a reaction had taken place and what would be the appearance of the mixture when the reaction was complete? the appearance of reagent the mixture A Benedict’s solution brick-red B biuret solution blue C ethanol cloudy D iodine in potassium iodide solution blue-black
1 marks
Answer: A
This question in 9700/11 May/June 2006
Q4 · Two enzyme experiments were carried out 9700/11 May/June 2006
13 Two enzyme experiments were carried out. The first, experiment X, was carried out at a constant temperature of 37 oC. During the second experiment the temperature was increased from 37 oC to 80 oC. Which graph shows the results? A B X X product product concentration concentration time time C D X product X product concentration concentration time time
1 marks
Answer: A
This question in 9700/11 May/June 2006
Q5 · Which properties are characteristic of a non-competitive inhibitor of an enzyme? 9700/11 May/June 2006
14 Which properties are characteristic of a non-competitive inhibitor of an enzyme? binding effect of adding more substrate A at active site reduces inhibition B at active site does not reduce inhibition C not at active site reduces inhibition D not at active site does not reduce inhibition
1 marks
Answer: D
This question in 9700/11 May/June 2006
Q6 · How does increasing substrate concentration affect the rate of an enzyme-catalysed… 9700/11 Oct/Nov 2006
13 How does increasing substrate concentration affect the rate of an enzyme-catalysed reaction in the presence of a competitive inhibitor? A The rate of the reaction decreases. B The rate of the reaction decreases initially and then recovers. C The rate of the reaction increases. D The rate of the reaction is not affected.
1 marks
Answer: C
This question in 9700/11 Oct/Nov 2006
Q7 · Which graph represents the action of a non-competitive inhibitor? 9700/11 Oct/Nov 2007
14 Which graph represents the action of a non-competitive inhibitor? A B maximum maximum rate of rate of reaction reaction concentration of substrate concentration of substrate key without inhibitor C D with inhibitor maximum maximum rate of rate of reaction reaction concentration of substrate concentration of substrate
1 marks
Answer: A
This question in 9700/11 Oct/Nov 2007
Q8 · What will break an ionic bond between amino acids? 9700/11 May/June 2008
10 What will break an ionic bond between amino acids? A condensation B hydrolysis C low temperature D pH change
1 marks
Answer: D
This question in 9700/11 May/June 2008
Q9 · The curve X shows the activity of an enzyme at 20 °C 9700/11 May/June 2008
12 The curve X shows the activity of an enzyme at 20 °C. Curves A, B, C and D show the effect of different conditions on the activity of the enzyme. Which curve shows the effect of increasing the temperature by 10 °C and adding extra substrate? A B amount of product C D X time
1 marks
Answer: B
This question in 9700/11 May/June 2008
Q10 · Following a heart attack, the enzyme lactate dehydrogenase leaks into the blood plasma… 9700/11 May/June 2008
13 Following a heart attack, the enzyme lactate dehydrogenase leaks into the blood plasma from
damaged heart muscle.
Which steps are required to obtain the best estimate of lactate dehydrogenase activity in a
sample of blood plasma?
a incubate with incubate with
sterilise blood
lasma by substrate for lactate
P heatin lactate dehydrogenase
g dehydrogenase inhibitor
A x J x
B Jv x J
Cc x J Jv
D Jv Jv J
key
/¥ = step required
X = step not required
1 marks
Answer: A
This question in 9700/11 May/June 2008
Q11 · The rate of an enzyme controlled reaction was measured at temperatures within the range… 9700/11 Oct/Nov 2008
12 The rate of an enzyme controlled reaction was measured at temperatures within the range 10 - 60 °C. Which curve represents the most usual relationship between temperature and enzyme activity? A B rate of rate of reaction reaction 0 0 10 60 10 60 temperature / °C temperature / °C C D rate of rate of reaction reaction 0 0 10 60 10 60 temperature / °C temperature / °C
1 marks
Answer: D
This question in 9700/11 Oct/Nov 2008
Q12 · In an experiment, 5 cm3 of 1 % salivary amylase are added to 100 cm3 of different… 9700/12 Oct/Nov 2009
16 In an experiment, 5 cm3 of 1 % salivary amylase are added to 100 cm3 of different concentrations of starch. Which graph shows the results of plotting the initial rate of reaction (y-axis) against the concentration of substrate (x-axis)? A B 0 0 C D 0 0
1 marks
Answer: A
This question in 9700/12 Oct/Nov 2009
Q13 · An enzyme is completely denatured at 50 °C 9700/11 May/June 2010
14 An enzyme is completely denatured at 50 °C. A fixed concentration of this enzyme is added to a fixed concentration of its substrate. The time taken for completion of the reaction is measured at different temperatures. Which graph shows the results? A B time taken time taken for completion for completion of the reaction of the reaction 10 20 30 40 50 60 10 20 30 40 50 60 temperature / °C temperature / °C C D time taken time taken for completion for completion of the reaction of the reaction 10 20 30 40 50 60 10 20 30 40 50 60 temperature / °C temperature / °C
1 marks
Answer: A
This question in 9700/11 May/June 2010
Q14 · An enzyme is completely denatured at 50 °C 9700/12 May/June 2010
24 An enzyme is completely denatured at 50 °C. A fixed concentration of this enzyme is added to a fixed concentration of its substrate. The time taken for completion of the reaction is measured at different temperatures. Which graph shows the results? A B time taken time taken for completion for completion of the reaction of the reaction 10 20 30 40 50 60 10 20 30 40 50 60 temperature / °C temperature / °C C D time taken time taken for completion for completion of the reaction of the reaction 10 20 30 40 50 60 10 20 30 40 50 60 temperature / °C temperature / °C
1 marks
Answer: A
This question in 9700/12 May/June 2010
Q15 · An enzyme is completely denatured at 50 °C 9700/13 May/June 2010
2 An enzyme is completely denatured at 50 °C. A fixed concentration of this enzyme is added to a fixed concentration of its substrate. The time taken for completion of the reaction is measured at different temperatures. Which graph shows the results? A B time taken time taken for completion for completion of the reaction of the reaction 10 20 30 40 50 60 10 20 30 40 50 60 temperature / °C temperature / °C C D time taken time taken for completion for completion of the reaction of the reaction 10 20 30 40 50 60 10 20 30 40 50 60 temperature / °C temperature / °C
1 marks
Answer: A
This question in 9700/13 May/June 2010
Q16 · The graph shows the course of an enzyme-catalysed reaction at 30 °C 9700/11 Oct/Nov 2010
13 The graph shows the course of an enzyme-catalysed reaction at 30 °C. concentration of product X time What is true at time X? A Most enzyme molecules will have free active sites. B The number of available substrate molecules is high. C The number of enzyme-substrate complexes is low. D The rate remains the same if more enzyme is added.
1 marks
Answer: B
This question in 9700/11 Oct/Nov 2010
Q17 · The rate of enzyme-catalysed reactions in human cells is regulated 9700/11 Oct/Nov 2010
14 The rate of enzyme-catalysed reactions in human cells is regulated. Which may be involved in such regulation? 1 a change in enzyme concentration 2 a change in substrate concentration 3 inhibition by the final product of the reaction A 1 and 2 only B 1 and 3 only C 2 and 3 only D 1, 2 and 3
1 marks
Answer: D
This question in 9700/11 Oct/Nov 2010
Q18 · A fixed volume of the enzyme catalase was added to a fixed volume of hydrogen peroxide… 9700/12 Oct/Nov 2010
11 A fixed volume of the enzyme catalase was added to a fixed volume of hydrogen peroxide solution. The diagram shows how the rate of the reaction changed over the course of the reaction. initial rate actual rate rate of reaction 00 time Why did the actual rate of reaction decrease over time? A The enzyme active sites become saturated. B The enzymes were denatured. C The product inhibited the reaction. D The substrate molecules were used up.
1 marks
Answer: D
This question in 9700/12 Oct/Nov 2010
Q19 · The breakdown of hydrogen peroxide to water and oxygen is catalysed by the enzyme catalase 9700/11 May/June 2011
12 The breakdown of hydrogen peroxide to water and oxygen is catalysed by the enzyme catalase. In an investigation into the effect of pH on the rate of reaction of catalase, potato cubes were added to hydrogen peroxide. Which dependent variable should be recorded? A the change in mass of the potato after a given time B the pH of the solution at regular time intervals C the number of potato cubes added at the start D the volume of oxygen given off at regular time intervals
1 marks
Answer: D
This question in 9700/11 May/June 2011
Q20 · Some inhibitors of enzyme reactions bind to the enzyme / substrate complex 9700/11 May/June 2011
14 Some inhibitors of enzyme reactions bind to the enzyme / substrate complex. Which statements about this type of inhibition are correct? 1 The active site changes shape. 2 The inhibitor is non-competitive. 3 The initial rate of reaction is reduced. 4 The maximum rate of reaction (Vmax) is increased. A 1 and 2 only B 1 and 3 only C 2 and 3 only D 2, 3 and 4 only
1 marks
Answer: C
This question in 9700/11 May/June 2011
Q21 · The graphs show the effects of temperature and pH on enzyme activity 9700/12 May/June 2011
14 The graphs show the effects of temperature and pH on enzyme activity. Q R P rate of rate of reaction reaction S temperature pH Which statement explains the enzyme activity at the point shown? A At P, hydrogen bonds are formed between enzyme and substrate. B At Q, the kinetic energy of enzyme and substrate is highest. C At R, peptide bonds in the enzyme begin to break. D At S, the enzyme is completely denatured.
1 marks
Answer: A
This question in 9700/12 May/June 2011
Q22 · Some inhibitors of enzyme reactions bind to the enzyme / substrate complex 9700/13 May/June 2011
22 Some inhibitors of enzyme reactions bind to the enzyme / substrate complex. Which statements about this type of inhibition are correct? 1 The active site changes shape. 2 The inhibitor is non-competitive. 3 The initial rate of reaction is reduced. 4 The maximum rate of reaction (Vmax) is increased. A 1 and 2 only B 1 and 3 only C 2 and 3 only D 2, 3 and 4 only
1 marks
Answer: C
This question in 9700/13 May/June 2011
Q23 · The breakdown of hydrogen peroxide to water and oxygen is catalysed by the enzyme catalase 9700/13 May/June 2011
24 The breakdown of hydrogen peroxide to water and oxygen is catalysed by the enzyme catalase. In an investigation into the effect of pH on the rate of reaction of catalase, potato cubes were added to hydrogen peroxide. Which dependent variable should be recorded? A the change in mass of the potato after a given time B the pH of the solution at regular time intervals C the number of potato cubes added at the start D the volume of oxygen given off at regular time intervals
1 marks
Answer: D
This question in 9700/13 May/June 2011
Q24 · Which statements about the effect of all enzyme inhibitors are correct? 9700/11 Oct/Nov 2011
12 Which statements about the effect of all enzyme inhibitors are correct? 1 alter the shape of the active site 2 denature the enzyme 3 reduce the rate of the enzyme catalysed reaction A 1, 2 and 3 B 1 and 2 only C 1 and 3 only D 3 only
1 marks
Answer: D
This question in 9700/11 Oct/Nov 2011
Q25 · Which statements about the effect of all enzyme inhibitors are correct? 9700/13 Oct/Nov 2011
23 Which statements about the effect of all enzyme inhibitors are correct? 1 alter the shape of the active site 2 denature the enzyme 3 reduce the rate of the enzyme catalysed reaction A 1, 2 and 3 B 1 and 2 only C 1 and 3 only D 3 only
1 marks
Answer: D
This question in 9700/13 Oct/Nov 2011
Q26 · Catalase is an enzyme that catalyses the conversion of hydrogen peroxide into water and… 9700/11 May/June 2012
13 Catalase is an enzyme that catalyses the conversion of hydrogen peroxide into water and oxygen. Two students investigated the effect of enzyme concentration on the rate of reaction of the enzyme catalase. The students predicted their results would show the same trend. The graphs show the rates obtained by each student. student 1 student 2 initial initial rate of rate of reaction reaction / cm3 oxygen / cm3 oxygen min–1 min–1 enzyme concentration enzyme concentration Which statement explains the different trend shown by student 2’s results? A Student 2 included a competitive inhibitor in the investigation. B Student 2 performed the investigation at a higher temperature. C Student 2 performed the investigation at pH6 compared to pH8. D Student 2 used a lower concentration of substrate in the investigation.
1 marks
Answer: D
This question in 9700/11 May/June 2012
Q27 · Catalase is an enzyme that catalyses the conversion of hydrogen peroxide into water and… 9700/13 May/June 2012
18 Catalase is an enzyme that catalyses the conversion of hydrogen peroxide into water and oxygen. Two students investigated the effect of enzyme concentration on the rate of reaction of the enzyme catalase. The students predicted their results would show the same trend. The graphs show the rates obtained by each student. student 1 student 2 initial initial rate of rate of reaction reaction / cm3 oxygen / cm3 oxygen min–1 min–1 enzyme concentration enzyme concentration Which statement explains the different trend shown by student 2’s results? A Student 2 included a competitive inhibitor in the investigation. B Student 2 performed the investigation at a higher temperature. C Student 2 performed the investigation at pH6 compared to pH8. D Student 2 used a lower concentration of substrate in the investigation.
1 marks
Answer: D
This question in 9700/13 May/June 2012
Q28 · Which of the bonds will be last to break as the temperature of an enzyme is increased? 9700/11 Oct/Nov 2012
9 Which of the bonds will be last to break as the temperature of an enzyme is increased? A covalent B hydrogen C hydrophobic interactions D ionic
1 marks
Answer: A
This question in 9700/11 Oct/Nov 2012
Q29 · Two enzyme experiments were carried out 9700/12 Oct/Nov 2012
14 Two enzyme experiments were carried out. The first, experiment X, was carried out at a constant temperature of 37 oC. During the second experiment the temperature was increased from 37 oC to 80 oC. All other factors were kept the same. Which graph shows the results? A B X X product product concentration concentration time time C D X product X product concentration concentration time time
1 marks
Answer: A
This question in 9700/12 Oct/Nov 2012
Q30 · Which bonds are the last to break when an enzyme is heated? 9700/13 Oct/Nov 2012
7 Which bonds are the last to break when an enzyme is heated? A disulfide B hydrogen C hydrophobic interactions D ionic
1 marks
Answer: A
This question in 9700/13 Oct/Nov 2012
Q31 · The diagrams show where an inhibitor becomes attached to an enzyme and whether this is… 9700/13 Oct/Nov 2012
13 The diagrams show where an inhibitor becomes attached to an enzyme and whether this is permanent or temporary. substrate enzyme 1 2 3 4 inhibitor permanent permanent temporary temporary Which diagrams represent a non-competitive inhibitor? A 1 and 2 only B 2 and 3 only C 3 and 4 only D 1, 2 and 3 only
1 marks
Answer: D
This question in 9700/13 Oct/Nov 2012
Q32 · Four students, 1, 2, 3 and 4, counted the number of bubbles of oxygen given off in a… 9700/11 May/June 2013
14 Four students, 1, 2, 3 and 4, counted the number of bubbles of oxygen given off in a minute when investigating the effect of catalase from plant tissue on hydrogen peroxide. Each student repeated the experiment five times and calculated the mean number of bubbles per minute. Which have correctly calculated the mean? raw data / number of bubbles minute–1 mean / number of student bubbles minute-1 1 12 10 11 13 9 10.5 2 8 19 16 18 19 18 3 8 10 11 9 8 9 4 21 18 17 6 18 18.5 A 1 and 4 only B 2 and 3 only C 1, 2, 3 and 4 D 3 only
1 marks
Answer: B
This question in 9700/11 May/June 2013
Q33 · The diagram shows a metabolic pathway 9700/11 May/June 2013
15 The diagram shows a metabolic pathway. enzyme 1 enzyme 2 enzyme 3 reactant substance X substance Y end product What would be the effect of adding a small amount of a non-competitive inhibitor of enzyme 2? A Enzyme 2 would be partially denatured. B Substance X would increase in concentration. C Substance Y would no longer be formed. D The initial reactant would no longer be metabolised.
1 marks
Answer: B
This question in 9700/11 May/June 2013
Q34 · Two pairs of students each counted the number of bubbles of oxygen given off in a minute… 9700/12 May/June 2013
14 Two pairs of students each counted the number of bubbles of oxygen given off in a minute when investigating the effect of catalase from plant tissue on hydrogen peroxide. Each pair repeated the experiment five times and calculated the mean number of bubbles per minute. Which have correctly calculated the mean? raw data / number of bubbles minute-1 mean / number of student bubbles minute-1 1 8 10 11 9 8 9.2 2 8 10 11 9 8 9 3 21 18 6 17 19 16.2 4 21 18 6 17 19 18.8 A 1, 3 and 4 only B 1 and 4 only C 2 only D 3 only
1 marks
Answer: C
This question in 9700/12 May/June 2013
Q35 · When investigating the rate of reaction of the enzyme lipase on the hydrolysis of… 9700/12 May/June 2013
15 When investigating the rate of reaction of the enzyme lipase on the hydrolysis of triglycerides, the pH must be maintained at an optimum to prevent the lipase denaturing. What is the reason for this? A The addition of water molecules produced by hydrolysis increases pH. B The products of hydrolysis decrease the pH. C The products of hydrolysis increase the pH. D The removal of water molecules used in hydrolysis decreases pH.
1 marks
Answer: B
This question in 9700/12 May/June 2013
Q36 · What occurs during protein denaturation by extremes of pH? 9700/13 May/June 2013
12 What occurs during protein denaturation by extremes of pH? 1 breakage of peptide bonds leading to loss of shape of active site 2 disruption of existing ionic bonds between amino acid R-groups 3 loss of α-helical regular arrangement of amino acids 4 loss of protein tertiary structure resulting in loss of function A 1, 2, 3 and 4 B 2, 3 and 4 only C 1 and 3 only D 2 and 4 only
1 marks
Answer: B
This question in 9700/13 May/June 2013
Q37 · How does increasing substrate concentration affect the rate of an enzyme-catalysed… 9700/13 May/June 2013
14 How does increasing substrate concentration affect the rate of an enzyme-catalysed reaction in the presence of a competitive inhibitor? A The rate of the reaction decreases. B The rate of the reaction decreases initially and then recovers. C The rate of the reaction increases. D The rate of the reaction is not affected.
1 marks
Answer: C
This question in 9700/13 May/June 2013
Q38 · Four students investigated the effect of catalase on hydrogen peroxide 9700/13 May/June 2013
15 Four students investigated the effect of catalase on hydrogen peroxide. Each student started a digital clock at the beginning of the experiment and stopped the clock after 25 bubbles had been counted. The time recorded on the digital clock is shown below. hours minutes seconds hundredths 00 01 33 54 Which student recorded the results to the best level of precision for the apparatus used? student time recorded A 1.34 minutes B 1 minute 33.54 seconds C 94 seconds D 93.54 seconds
1 marks
Answer: C
This question in 9700/13 May/June 2013
Q39 · Which statements about competitive inhibitors of enzyme action are correct? 9700/11 Oct/Nov 2013
11 Which statements about competitive inhibitors of enzyme action are correct? 1 Increasing the concentration of the enzyme’s substrate will reduce their effect. 2 They bind to an enzyme at its active site. 3 They reduce the activation energy required for a reaction to take place. 4 They reduce the maximum rate of reaction. A 1 and 2 only B 1 and 3 only C 2 and 3 only D 2, 3 and 4 only
1 marks
Answer: A
This question in 9700/11 Oct/Nov 2013
Q40 · An enzyme is completely denatured at 50 °C 9700/11 Oct/Nov 2013
12 An enzyme is completely denatured at 50 °C. A fixed concentration of this enzyme is added to a fixed concentration of its substrate. The time taken for completion of the reaction is measured at different temperatures. Which graph shows the results? A B time taken time taken for completion for completion of the reaction of the reaction 10 20 30 40 50 60 10 20 30 40 50 60 temperature / °C temperature / °C C D time taken time taken for completion for completion of the reaction of the reaction 10 20 30 40 50 60 10 20 30 40 50 60 temperature / °C temperature / °C
1 marks
Answer: A
This question in 9700/11 Oct/Nov 2013
Q41 · Which is correct for a non-competitive inhibitor of enzyme action? 9700/12 Oct/Nov 2013
11 Which is correct for a non-competitive inhibitor of enzyme action? 1 Increasing the concentration of the enzyme’s substrate will reduce its effect. 2 It reduces the activation energy required for a reaction to take place. 3 It reduces the maximum rate of reaction. A 1 only B 3 only C 1 and 3 only D 2 and 3 only
1 marks
Answer: B
This question in 9700/12 Oct/Nov 2013
Q42 · Which is correct for competitive inhibitors of enzymes? 9700/13 Oct/Nov 2013
11 Which is correct for competitive inhibitors of enzymes? 1 They occupy the active site of an enzyme. 2 They have exactly the same shape as the substrate. 3 They can be used to control the rate of enzyme activity. 4 They can bind to a site on an enzyme other than the active site. A 1 only B 1 and 3 only C 1, 2 and 3 only D 2, 3 and 4 only
1 marks
Answer: B
This question in 9700/13 Oct/Nov 2013
Q43 · The graph shows the course of an enzyme-catalysed reaction at 30 °C 9700/13 Oct/Nov 2013
12 The graph shows the course of an enzyme-catalysed reaction at 30 °C. concentration of product X time What is true at time X? A Most enzyme molecules will have free active sites. B The number of available substrate molecules is high. C The number of enzyme-substrate complexes is low. D The rate remains the same if more enzyme is added.
1 marks
Answer: B
This question in 9700/13 Oct/Nov 2013
Q44 · The statements are about enzymes 9700/11 May/June 2014
12 The statements are about enzymes. 1 They are globular proteins. 2 They are formed in the smooth endoplasmic reticulum. 3 They are only found attached to plasma membranes in the cell. 4 They can be inhibited by competitive inhibitors. Which statements are correct for all enzymes? A 1 and 4 only B 2 and 4 only C 1, 2 and 3 only D 1, 2, 3 and 4
1 marks
Answer: A
This question in 9700/11 May/June 2014
Q45 · The drug ritonavir is sometimes used in the treatment of HIV / AIDS 9700/12 May/June 2014
13 The drug ritonavir is sometimes used in the treatment of HIV / AIDS. Ritonavir consists of three amino acids and is a competitive inhibitor of HIV protease. HIV causes this protease to be made inside human cells. Ritonavir produces many side effects as it interferes with many metabolic processes in human cells. Which statements about ritonavir are correct? 1 Ritonavir has a shape complementary to the active site of HIV protease. 2 Ritonavir will enter human cells directly through the lipid bilayer and not require any transport proteins. 3 Ritonavir is likely to inhibit many of the enzymes of human cells. 4 Complete hydrolysis of ritonavir would require the addition of three water molecules. A 1, 2 and 3 B 1 and 3 only C 2 and 4 D 3 and 4
1 marks
Answer: B
This question in 9700/12 May/June 2014
Q46 · The graph shows the rate of activity of the enzyme sucrase plotted against the… 9700/13 May/June 2014
13 The graph shows the rate of activity of the enzyme sucrase plotted against the concentration of sucrose. 12 10 8 rate of enzyme activity 6 / arbitrary units 4 2 0 0 20 40 60 80 100 concentration of sucrose / g dm–3 Why does the rate of enzyme activity remain constant from 80 – 90 g dm–3. A All the enzyme has been inhibited. B All the substrate has been used up. C The concentration of the enzyme is limiting the rate. D The concentration of the substrate is limiting the rate.
1 marks
Answer: C
This question in 9700/13 May/June 2014
Q47 · Which graph represents the action of a non-competitive inhibitor? 9700/13 May/June 2014
14 Which graph represents the action of a non-competitive inhibitor? A B maximum maximum rate of rate of reaction reaction concentration of substrate concentration of substrate key without inhibitor C D with inhibitor maximum maximum rate of rate of reaction reaction concentration of substrate concentration of substrate
1 marks
Answer: A
This question in 9700/13 May/June 2014
Q48 · Why do large increases in the temperature or pH alter enzyme activity? 9700/11 Oct/Nov 2014
11 Why do large increases in the temperature or pH alter enzyme activity? 1 They change the three-dimensional shape of the enzyme. 2 They disrupt hydrogen and ionic bonds in the enzyme. 3 They increase hydrophobic interactions in the enzyme. A 1 and 2 B 1 and 3 C 2 and 3 D 1 only
1 marks
Answer: A
This question in 9700/11 Oct/Nov 2014
Q49 · Ethylene glycol is a chemical used to prevent water from freezing 9700/11 Oct/Nov 2014
12 Ethylene glycol is a chemical used to prevent water from freezing. If ethylene glycol is swallowed accidentally, it is metabolised by an enzyme found in liver cells to produce a toxic product. The enzyme normally catalyses the oxidation of ethanol to a harmless product. People who have swallowed ethylene glycol are treated with large doses of ethanol. This prevents formation of a toxic product and allows the body to excrete the ethylene glycol. Which statement describes why this treatment works? A Ethanol binds near the active site on the enzyme, altering its shape. B Ethanol binds permanently to the active site of the enzyme, blocking it. C Ethanol changes the tertiary structure of the enzyme, denaturing it. D Ethanol is more likely to bind to the active site on the enzyme.
1 marks
Answer: D
This question in 9700/11 Oct/Nov 2014
Q50 · Which of the bonds stabilising the tertiary structure of a protein would be least likely… 9700/12 Oct/Nov 2014
10 Which of the bonds stabilising the tertiary structure of a protein would be least likely to break when the temperature is increased above the optimum for the protein? A disulfide B hydrogen C hydrophobic D ionic
1 marks
Answer: A
This question in 9700/12 Oct/Nov 2014
Q51 · Which words from the table correctly complete the paragraph about enzymes? 9700/12 Oct/Nov 2014
13 Which words from the table correctly complete the paragraph about enzymes? When the pH of an environment is decreased below an enzyme’s optimum pH, ……1…… bonds between adjacent ……2…… groups, holding the ……3…… structure, are disrupted. 1 2 3 A hydrogen and ionic R tertiary B hydrogen hydroxyl secondary C ionic and peptide R primary and tertiary D peptide amine primary
1 marks
Answer: A
This question in 9700/12 Oct/Nov 2014
Q52 · Lipase is a digestive enzyme produced by the pancreas that catalyses the hydrolysis of… 9700/12 Oct/Nov 2014
14 Lipase is a digestive enzyme produced by the pancreas that catalyses the hydrolysis of dietary lipids. The table shows how the pH of a liquid food containing a high proportion of lipids decreases over time. 8 pH of a 7 liquid food 6 0 5 10 15 20 25 30 35 40 45 50 55 60 time / min Which statements are possible explanations of the results of the experiment between 50 and 60 minutes? 1 Enzyme concentration becomes the limiting factor. 2 Substrate concentration becomes the limiting factor. 3 All the enzyme active sites are saturated. 4 Denaturation of the enzyme by the products. 5 Products are acting as competitive inhibitors. A 1, 2 and 3 B 1, 4 and 5 C 2, 3 and 4 D 2, 4 and 5
1 marks
Answer: D
This question in 9700/12 Oct/Nov 2014
Q53 · Which is correct for a competitive inhibitor of an enzyme? 9700/13 Oct/Nov 2014
13 Which is correct for a competitive inhibitor of an enzyme? A inhibitor binds to a site on the enzyme the substrate concentration has no other than the active site effect on the level of inhibition B inhibitor binds to the active site of the increasing the substrate concentration enzyme decreases the effect of the inhibitor C inhibitor binds to the active site of the the substrate concentration has no enzyme effect on the level of inhibition D inhibitor binds to the enzyme-substrate increasing the substrate concentration complex decreases the effect of the inhibitor
1 marks
Answer: B
This question in 9700/13 Oct/Nov 2014
Q54 · Which statements about the effect of all enzyme inhibitors are correct? 9700/11 May/June 2015
13 Which statements about the effect of all enzyme inhibitors are correct? 1 change the shape of the active site 2 denature the enzyme 3 reduce the rate of the enzyme-catalysed reaction A 1, 2 and 3 B 1 and 2 only C 1 and 3 only D 3 only
1 marks
Answer: D
This question in 9700/11 May/June 2015
Q55 · The graphs show the rate of reaction of an enzyme-catalysed reaction 9700/11 May/June 2015
14 The graphs show the rate of reaction of an enzyme-catalysed reaction. Which graph shows the effect of increasing the concentration of the substrate at two different concentrations of a competitive inhibitor? key no inhibitor low concentration of inhibitor high concentration of inhibitor A B rate of rate of reaction reaction substrate substrate concentration concentration C D rate of rate of reaction reaction substrate substrate concentration concentration
1 marks
Answer: B
This question in 9700/11 May/June 2015
Q56 · Which levels of protein structure are always involved when competitive and… 9700/12 May/June 2015
13 Which levels of protein structure are always involved when competitive and non-competitive inhibitors bind to enzymes? competitive non-competitive A primary, secondary and tertiary secondary B quaternary and tertiary quaternary and tertiary C secondary primary and tertiary D tertiary tertiary
1 marks
Answer: D
This question in 9700/12 May/June 2015
Q57 · Which statements are true about the optimum temperature of all enzymes? 9700/12 May/June 2015
14 Which statements are true about the optimum temperature of all enzymes? 1 It is the temperature at which the enzymes work best. 2 It is the highest temperature at which the enzyme will work. 3 It is between 35 °C and 40 °C. A 1, 2 and 3 B 2 and 3 only C 1 only D 3 only
1 marks
Answer: C
This question in 9700/12 May/June 2015
Q58 · Some inhibitors of enzyme reactions bind to the enzyme-substrate complex 9700/13 May/June 2015
13 Some inhibitors of enzyme reactions bind to the enzyme-substrate complex. Which statements about this type of inhibition are correct? 1 The active site changes shape. 2 The inhibitor is non-competitive. 3 The initial rate of reaction is reduced. 4 The maximum rate of reaction (Vmax) stays the same. A 2, 3 and 4 B 1 and 2 C 1 and 3 D 2 and 3 only
1 marks
Answer: D
This question in 9700/13 May/June 2015
Q59 · The enzyme DNA polymerase is used in DNA replication 9700/13 May/June 2015
14 The enzyme DNA polymerase is used in DNA replication. This enzyme was extracted from bacteria living in natural hot water springs where the water temperature is between 85 °C and 95 °C. Which graph would represent the relationship between temperature and the rate of DNA replication when catalysed by the enzyme from these bacteria? A B rate of rate of reaction reaction 0 0 10 60 10 60 temperature / °C temperature / °C C D rate of rate of reaction reaction 0 0 10 60 10 60 temperature / °C temperature / °C
1 marks
Answer: C
This question in 9700/13 May/June 2015
Q60 · Which statements about enzyme inhibitors are correct? 9700/11 Oct/Nov 2015
13 Which statements about enzyme inhibitors are correct? 1 Competitive inhibitors may be similar shapes to the substrate. 2 Competitive inhibitors bind to the active site. 3 Non-competitive inhibitors alter the shape of the enzyme. 4 Non-competitive inhibitors bind to the substrate. A 1, 2 and 3 B 2, 3 and 4 C 1 and 2 only D 3 and 4 only
1 marks
Answer: A
This question in 9700/11 Oct/Nov 2015
Q61 · A fixed volume of the enzyme catalase was added to a fixed volume of hydrogen peroxide… 9700/11 Oct/Nov 2015
14 A fixed volume of the enzyme catalase was added to a fixed volume of hydrogen peroxide solution. The diagram shows how the amount of product changed over the course of the reaction. amount of product 00 time What explains the shape of this graph? A The active sites become saturated. B The enzyme was denatured. C The hydrogen peroxide inhibited the reaction. D The substrate molecules were used up.
1 marks
Answer: D
This question in 9700/11 Oct/Nov 2015
Q62 · The diagram shows the mass of product formed over time in three reactions using the same… 9700/12 Oct/Nov 2015
13 The diagram shows the mass of product formed over time in three reactions using the same substrate and enzyme. The volumes of substrate, enzyme and temperature were kept constant in each reaction. 1 2 mass of product 3 00 time Which statement explains the difference in these reactions? A The pH in reactions 2 and 3 has denatured the enzyme. B There is a non-competitive inhibitor present in reaction 3. C There is the highest concentration of enzyme in reaction 1. D There is the highest concentration of substrate in reaction 1.
1 marks
Answer: C
This question in 9700/12 Oct/Nov 2015
Q63 · Tyrosinase is an enzyme that catalyses the conversion of the amino acid tyrosine into the… 9700/12 Oct/Nov 2015
14 Tyrosinase is an enzyme that catalyses the conversion of the amino acid tyrosine into the black pigment melanin. It is responsible for the black fur colour of some rabbits. A group of rabbits kept at 30 °C resulted in 90% of the rabbits with light fur colour. A second group of rabbits kept at 10 °C resulted in 90% of the rabbits with black fur colour. Which hypothesis is supported by these results? A An inhibitor is present in rabbit skin cells that can bind strongly to tyrosinase when the external temperature is 30 °C. B At 10 °C external temperature there are fewer tyrosinase-tyrosine complexes formed and less melanin is produced. C Tyrosinase is an enzyme that is coded for by a gene that is switched off when the external temperature is 10 °C. D Tyrosinase is a temperature-sensitive molecule that is only activated when the external temperature is 30 °C.
1 marks
Answer: A
This question in 9700/12 Oct/Nov 2015
Q64 · Line X represents the course of an enzyme-catalysed reaction under optimum conditions 9700/13 Oct/Nov 2015
14 Line X represents the course of an enzyme-catalysed reaction under optimum conditions. Line Y shows the action of the same enzyme on the same substrate but with one variable changed: substrate concentration or pH or temperature. 100 percentage Y of unreacted 50 substrate molecules X 0 time Which changes to the variables could give the results shown by line Y? 1 decreased substrate concentration 2 higher pH 3 lower temperature A 1, 2 and 3 B 1 and 2 only C 1 and 3 only D 2 and 3 only
1 marks
Answer: D
This question in 9700/13 Oct/Nov 2015
Q65 · The rate of enzyme-catalysed reactions in human cells is regulated 9700/12 Feb/March 2016
11 The rate of enzyme-catalysed reactions in human cells is regulated. What may be involved in such regulation? 1 a change in enzyme concentration 2 a change in substrate concentration 3 inhibition by the final product of the reaction A 1, 2 and 3 B 1 and 2 only C 1 and 3 only D 2 and 3 only
1 marks
Answer: A
This question in 9700/12 Feb/March 2016
Q66 · The graphs show the effects of temperature and pH on enzyme activity 9700/12 Feb/March 2016
12 The graphs show the effects of temperature and pH on enzyme activity. Q R P rate of rate of reaction reaction S temperature pH Which statement is a correct explanation of the enzyme activity? A At P, hydrogen bonds are formed between enzyme and substrate. B At Q, the kinetic energy of enzyme and substrate is highest. C At R, disulfide bonds in the enzyme begin to break. D At S, the enzyme is completely denatured.
1 marks
Answer: A
This question in 9700/12 Feb/March 2016
Q67 · Which statement correctly describes the action of competitive enzyme inhibitors? 9700/12 Feb/March 2016
13 Which statement correctly describes the action of competitive enzyme inhibitors? A They bind permanently to the active site. B They change the shape of the active site. C They limit the formation of enzyme-substrate complexes. D They lower the activation energy of the reaction.
1 marks
Answer: C
This question in 9700/12 Feb/March 2016
Q68 · Which row about competitive inhibitors of enzymes is correct? 9700/11 May/June 2016
13 Which row about competitive inhibitors of enzymes is correct?
bind to a site other
than the active
site
lower the
activation energy
needed for a
reaction to occur
0 0O DW >
x KOK
v key
x ¥ = true
v X = false
x
1 marks
Answer: D
This question in 9700/11 May/June 2016
Q69 · The graph shows the effect of increasing the concentration of substrate on the rate of an… 9700/11 May/June 2016
14 The graph shows the effect of increasing the concentration of substrate on the rate of an enzyme-catalysed reaction. 2 key without an inhibitor rate of 3 with fixed concentration reaction 1 of competitive inhibitor with fixed concentration 4 of non-competitive inhibitor concentration of substrate What is limiting the rate of the enzyme-catalysed reaction at 1, 2, 3 and 4 on the graph? 1 2 3 4 A enzyme substrate competitive non-competitive concentration concentration inhibitor inhibitor B enzyme substrate non-competitive competitive concentration concentration inhibitor inhibitor C substrate enzyme competitive non-competitive concentration concentration inhibitor inhibitor D substrate enzyme non-competitive competitive concentration concentration inhibitor inhibitor
1 marks
Answer: C
This question in 9700/11 May/June 2016
Q70 · In two investigations, the rate of an enzyme-catalysed reaction was measured in the… 9700/12 May/June 2016
10 In two investigations, the rate of an enzyme-catalysed reaction was measured in the presence of either a competitive inhibitor or a non-competitive inhibitor. What could be the effect of increasing the substrate concentration on each rate of reaction? rate of reaction with competitive with non-competitive inhibitor inhibitor A decreases no change B increases decreases C increases no change D no change decreases
1 marks
Answer: C
This question in 9700/12 May/June 2016
Q71 · Two enzymes, X and Y, were used in an experiment 9700/12 May/June 2016
11 Two enzymes, X and Y, were used in an experiment. Enzyme X was from bacteria that live in rivers and lakes at temperatures from 5 °C to 20 °C. Enzyme Y was from bacteria that live in hot water springs at temperatures from 40 °C to 85 °C. The experiment measured the concentration of product produced by each enzyme at temperatures between 0 °C and 100 °C after 5 minutes. Which graph shows the results? A B X Y X Y concentration concentration of product of product 0 100 0 100 temperature / °C temperature / °C C D X Y concentration Y concentration of product of product X 0 100 0 100 temperature / °C temperature / °C
1 marks
Answer: B
This question in 9700/12 May/June 2016
Q72 · Which of the bonds will be last to break as the temperature of an enzyme is increased? 9700/13 May/June 2016
10 Which of the bonds will be last to break as the temperature of an enzyme is increased? A hydrogen B hydrophobic interactions C ionic D peptide
1 marks
This question in 9700/13 May/June 2016
Q73 · The effect of substrate concentration on an enzyme-catalysed reaction was measured in… 9700/13 May/June 2016
12 The effect of substrate concentration on an enzyme-catalysed reaction was measured in three different conditions: ● with no inhibitor ● with inhibitor X ● with inhibitor Y. The graph shows the results. enzyme with no inhibitor inhibitor X rate of reaction inhibitor Y 0 0 substrate concentration Which statement is correct? A X is a competitive inhibitor which binds away from the active site of the enzyme. B X is a non-competitive inhibitor which has a similar shape to the substrate. C Y is a competitive inhibitor which has a similar shape to the substrate. D Y is a non-competitive inhibitor which binds away from the active site of the enzyme.
1 marks
This question in 9700/13 May/June 2016
Q74 · Following a heart attack, the enzyme lactate dehydrogenase leaks into the blood plasma… 9700/11 Oct/Nov 2016
12 Following a heart attack, the enzyme lactate dehydrogenase leaks into the blood plasma from
damaged heart muscle.
Which steps are required to obtain an estimate of lactate dehydrogenase activity in a sample of
blood plasma?
sterilise blood
incubate with
substrate for
incubate with
lactate
Proating lactate dehydrogenase
dehydrogenase inhibitor
A JV 4 V
B x 4 V
Cc x 4 x
D x x V
key
/¥ = step required
X = step not required
1 marks
Answer: C
This question in 9700/11 Oct/Nov 2016
Q75 · Two experiments were carried out using an enzyme from humans 9700/11 Oct/Nov 2016
13 Two experiments were carried out using an enzyme from humans. The first experiment, X, was carried out at a constant temperature of 37 °C. During the second experiment, the temperature was increased from 37 °C to 80 °C. All other factors were kept the same. Which graph shows the results? A B X X product product concentration concentration 0 1 2 3 4 5 0 1 2 3 4 5 time / minutes time / minutes C D X product X product concentration concentration 0 1 2 3 4 5 0 1 2 3 4 5 time / minutes time / minutes
1 marks
Answer: A
This question in 9700/11 Oct/Nov 2016
Q76 · An investigation into the rate of an enzyme-catalysed reaction was carried out 9700/13 Oct/Nov 2016
11 An investigation into the rate of an enzyme-catalysed reaction was carried out. During the investigation the concentration of the substrate was kept higher than the concentration of the enzyme. During this investigation, which change in the variables would always lead to an increase in the rate of the reaction? 1 increase in enzyme concentration 2 increase in pH 3 increase in temperature A 1 and 2 B 1 and 3 C 2 and 3 D 1 only
1 marks
Answer: D
This question in 9700/13 Oct/Nov 2016
Q77 · The value Km is the substrate concentration at which the rate of an enzyme-catalysed… 9700/13 Oct/Nov 2016
13 The value Km is the substrate concentration at which the rate of an enzyme-catalysed reaction is Vmax . half its maximum rate, 2 Vmax initial rate Vmax of reaction 2 Km substrate concentration The Km was measured in the presence of a competitive inhibitor and in the presence of a non-competitive inhibitor. What could be the value of Km with inhibitor compared to the value of Km with no inhibitor? value of Km in presence of competitive inhibitor non-competitive inhibitor A less less B less more C more less D the same more
1 marks
Answer: C
This question in 9700/13 Oct/Nov 2016
Q78 · An enzyme was added to a small excess of its substrate 9700/12 Feb/March 2017
14 An enzyme was added to a small excess of its substrate. All variables were kept constant. A student was asked to sketch a graph to show how the concentration of the enzyme-substrate complex changes over time. Which graph shows this correctly? A B concentration concentration 0 0 0 time 0 time C D concentration concentration 0 0 0 time 0 time
1 marks
Answer: D
This question in 9700/12 Feb/March 2017
Q79 · The table contains results recorded by a student from an investigation into the effect of… 9700/12 Feb/March 2017
15 The table contains results recorded by a student from an investigation into the effect of temperature on an enzyme-catalysed reaction. All other variables were standardised. rate of reaction temperature / °C / arbitrary units 10 3 20 7 30 16 40 33 50 32 60 14 What is the correct conclusion? A 40 °C was the optimum temperature. B The data for 50 °C was anomalous. C The optimum temperature was between 30 °C and 50 °C. D The optimum temperature was between 40 °C and 50 °C.
1 marks
Answer: C
This question in 9700/12 Feb/March 2017
Q80 · A student carried out experiments to investigate the effect of enzyme concentration on… 9700/11 May/June 2017
14 A student carried out experiments to investigate the effect of enzyme concentration on the rate of hydrolysis (break down) of protein in milk. When the enzyme and milk were mixed, the protein was hydrolysed and the mixture changed from cloudy to clear. The student investigated five different enzyme concentrations and recorded the time taken to reach the end-point for each. What is an appropriate control for this investigation? A Carrying out a further experiment where the enzyme solution is replaced with water. B Carrying out each experiment in a thermostatically regulated water-bath at 35 °C. C Performing three repeat experiments for each of the five enzyme concentrations. D Using the same volume of enzyme solution for each of the five experiments.
1 marks
Answer: A
This question in 9700/11 May/June 2017
Q81 · The graph shows the effect of temperature on the rate at which the enzyme in a biological… 9700/11 May/June 2017
16 The graph shows the effect of temperature on the rate at which the enzyme in a biological washing powder digests and removes fruit juice stains. rate of reaction X temperature Which statements explain the shape of the graph at temperatures higher than X? 1 Bonds are broken between the R groups of the amino acids in the polypeptide chains of the enzyme. 2 There are more collisions between the enzyme and its substrate. 3 The tertiary structure of the enzyme is altered. 4 The shapes of the active site and the substrate are no longer complementary. A 1, 2 and 3 B 1, 2 and 4 C 1, 3 and 4 D 2, 3 and 4
1 marks
Answer: C
This question in 9700/11 May/June 2017
Q82 · The enzyme invertase catalyses the breakdown of sucrose to glucose and fructose 9700/12 May/June 2017
10 The enzyme invertase catalyses the breakdown of sucrose to glucose and fructose. Three different enzyme inhibitors of invertase X, Y and Z were investigated. The percentage inhibition of invertase was measured at different concentrations of inhibitor. The graph shows the result of the investigation. inhibitor X inhibitor Y percentage inhibition inhibitor Z 0 2 4 6 8 inhibitor concentration / arbitrary units Which are valid conclusions from these results? 1 The higher the concentration of inhibitor X, the less sucrose is broken down. 2 The production of glucose and fructose using inhibitor Y is higher than when inhibitor Z is used. 3 The production of glucose and fructose at an inhibitor concentration of 2 arbitrary units is lower than at an inhibitor concentration of 4 arbitrary units, for all inhibitors. A 1 and 2 B 1 only C 2 and 3 D 3 only
1 marks
Answer: B
This question in 9700/12 May/June 2017
Q83 · How is the Michaelis-Menten constant (Km) used? 9700/12 May/June 2017
12 How is the Michaelis-Menten constant (Km) used? A to assess the efficiency of an enzyme in catalysing a reaction B to compare the affinity of enzymes for their substrate C to find the maximum velocity of an enzyme (Vmax) D to find the rate at which substrate is loaded by an enzyme
1 marks
Answer: B
This question in 9700/12 May/June 2017
Q84 · The graph shows the results of investigations into the effect of amylase on the… 9700/13 May/June 2017
11 The graph shows the results of investigations into the effect of amylase on the hydrolysis of starch at three different temperatures. 50 °C 60 °C concentration of reducing sugar 70 °C / arbitrary units 0 30 60 time / minutes In each investigation the concentration and volume of the solutions was kept constant. Which conclusion may be drawn? A 50 °C is the optimum temperature of amylase. B At 60 °C all the starch is hydrolysed after 30 minutes. C At 70 °C the amylase is denatured before hydrolysis is complete. D The rate of hydrolysis of starch is faster at 50 °C than at 70 °C.
1 marks
Answer: C
This question in 9700/13 May/June 2017
Q85 · The graph compares the effect of temperature on the activity of the protease enzyme… 9700/13 May/June 2017
12 The graph compares the effect of temperature on the activity of the protease enzyme, papain, when in solution (free) and when immobilised in alginate beads. immobilised papain activity of papain free papain 0 20 40 60 80 temperature / °C Which statement about the effect of immobilisation of papain is correct? A It alters the shape of papain’s active site at higher temperatures. B It decreases the activity of papain at higher temperatures. C It increases the stability of papain at higher temperatures. D It reduces the number of collisions of papain with the substrate.
1 marks
Answer: C
This question in 9700/13 May/June 2017
Q86 · An experiment was carried out in which the enzyme lipase was used to hydrolyse a… 9700/12 Oct/Nov 2017
15 An experiment was carried out in which the enzyme lipase was used to hydrolyse a triglyceride. The pH was recorded at regular intervals during the reaction. The results are shown in the table. time / minutes pH 0 7.0 2 6.2 4 5.6 6 5.1 8 4.7 10 4.6 12 4.6 14 4.6 At 14 minutes unreacted triglyceride was still present. What explains the results after 10 minutes? A The end-products acted as competitive inhibitors. B The end-products acted as non-competitive inhibitors. C The enzyme reaction had reached Vmax. D The tertiary structure of the enzyme had been lost.
1 marks
Answer: D
This question in 9700/12 Oct/Nov 2017
Q87 · Which statement about the effect of substrate concentration on the activity of an enzyme… 9700/12 Oct/Nov 2017
16 Which statement about the effect of substrate concentration on the activity of an enzyme is correct? A Above a certain concentration of substrate an enzyme reaches its maximum rate of reaction. B At high concentration of competitive inhibitor increasing the substrate concentration has no effect. C At high substrate concentration a non-competitive inhibitor no longer affects the enzyme activity. D The higher the concentration of substrate the faster an enzyme can catalyse a reaction.
1 marks
Answer: A
This question in 9700/12 Oct/Nov 2017
Q88 · An experiment was conducted to investigate the effect of temperature on the activity of… 9700/13 Oct/Nov 2017
13 An experiment was conducted to investigate the effect of temperature on the activity of the enzyme β-glucosidase. The enzyme was tested when in solution (free) and when immobilised in alginate beads. The results are shown in the graph below. 120 100 80 β-glucosidase activity 60 / arbitrary units 40 immobilised 20 free enzyme enzyme 0 0 10 20 30 40 50 60 70 80 90 100 temperature / °C Which statement about the effect of immobilisation of β-glucosidase is correct? A It increases the kinetic energy of the enzyme. B It inhibits the activity of the enzyme. C It reduces the optimum temperature of the enzyme. D It stabilises the enzyme against denaturation.
1 marks
Answer: D
This question in 9700/13 Oct/Nov 2017
Q89 · An investigation was carried out into the effect of an increasing concentration of… 9700/13 Oct/Nov 2017
14 An investigation was carried out into the effect of an increasing concentration of substrate molecules on the rate of an enzyme-catalysed reaction. All other variables were standardised. Which statement is correct? A The rate increases to a maximum and then levels off. B The rate increases to an optimum and then decreases. C The value of Km will increase. D The Vmax will never be reached.
1 marks
Answer: A
This question in 9700/13 Oct/Nov 2017
Q90 · Which features are correct for a competitive inhibitor of an enzyme-catalysed reaction? 9700/13 Oct/Nov 2017
15 Which features are correct for a competitive inhibitor of an enzyme-catalysed reaction?
rate of reaction
binds to changes shape | similar shape affected by
active site of enzyme to substrate concentration
of inhibitor
A J x J Jv key
B Jv x x Jv ¥ = correct
Cc x v v x X = incorrect
D x v x x
1 marks
Answer: A
This question in 9700/13 Oct/Nov 2017
Q91 · Liver cells contain membrane-bound organelles called peroxisomes, which contain the… 9700/13 Oct/Nov 2017
16 Liver cells contain membrane-bound organelles called peroxisomes, which contain the enzyme catalase. This enzyme hydrolyses hydrogen peroxide into water and oxygen gas. A student cut two identical sized pieces of liver and placed one in a refrigerator at 5 °C and the other in a freezer at –18 °C. After 12 hours both pieces were raised to room temperature and placed in equal volumes of hydrogen peroxide. The liver that had been at –18°C produced bubbles of oxygen more rapidly than the liver that had been at 5 °C. Which statement explains why the liver that had been at –18 °C produced bubbles of oxygen more rapidly than the liver that had been at 5 °C? A At 5 °C the cell surface membrane allowed water to enter cells and dilute the catalase. B Freezing at –18 °C made the cell walls more permeable to hydrogen peroxide. C Ice crystals damaged the cell membranes of the liver cells at –18 °C. D The higher temperature had denatured some of the catalase.
1 marks
Answer: C
This question in 9700/13 Oct/Nov 2017
Q92 · What could be used to calculate the rate of an enzyme-catalysed reaction? 9700/12 Feb/March 2018
15 What could be used to calculate the rate of an enzyme-catalysed reaction? 1 the appearance of product 2 the disappearance of substrate 3 the Michaelis-Menten constant (Km) A 1 and 2 B 1 and 3 C 1 only D 2 and 3
1 marks
Answer: A
This question in 9700/12 Feb/March 2018
Q93 · Which words from the table correctly complete the paragraph about enzymes? 9700/11 May/June 2018
12 Which words from the table correctly complete the paragraph about enzymes? When the pH of an environment is decreased below the optimum pH of an enzyme, ««1«« bonds between adjacent ««2«« groups, holding the ««3«« structure, are disrupted. 1 2 3 A hydrogen and ionic R tertiary B hydrogen hydroxyl secondary C ionic and peptide R primary and tertiary D peptide amine primary
1 marks
Answer: A
This question in 9700/11 May/June 2018
Q94 · The effect of substrate concentration on an enzyme-catalysed reaction was measured in… 9700/11 May/June 2018
13 The effect of substrate concentration on an enzyme-catalysed reaction was measured in three different conditions: ● with no inhibitor ● with a competitive inhibitor ● with a non-competitive inhibitor. The graph shows the results. enzyme with no inhibitor inhibitor X rate of reaction inhibitor Y 0 0 substrate concentration Which statement is correct? A X is a competitive inhibitor which binds to a site other than the active site of the enzyme. B X is a non-competitive inhibitor which has a similar shape to the active site of the enzyme. C Y is a competitive inhibitor which has a similar shape to the active site of the enzyme. D Y is a non-competitive inhibitor which binds to a site other than the active site of the enzyme.
1 marks
Answer: D
This question in 9700/11 May/June 2018
Q95 · A student investigated the hydrolysis of the lipid in high-fat milk, using the enzyme… 9700/12 May/June 2018
12 A student investigated the hydrolysis of the lipid in high-fat milk, using the enzyme lipase. • 1 cm3 of enzyme solution was added to 10 cm3 of high-fat milk. • The temperature was kept constant. • The pH of the reaction mixture was recorded at time 0 minutes and every minute for 20 minutes. Which statements could be supported by the results of the investigation? 1 Less product is made as time proceeds because the substrate is decreasing. 2 The pH of the reaction mixture changes more rapidly in the first few minutes and then changes less rapidly. 3 The product gradually causes more lipase molecules to denature. A 1, 2 and 3 B 1 and 2 only C 1 and 3 only D 2 and 3 only
1 marks
Answer: A
This question in 9700/12 May/June 2018
Q96 · A student carried out an investigation into the effect of temperature on the rate of an… 9700/12 May/June 2018
13 A student carried out an investigation into the effect of temperature on the rate of an enzyme-catalysed reaction. At each temperature, the substrate concentration was measured after 10 minutes. All the other variables were kept constant. Which graph shows the effect of increasing temperature on the substrate concentration after 10 minutes? A B substrate substrate concentration concentration temperature / °C temperature / °C C D substrate substrate concentration concentration temperature / °C temperature / °C
1 marks
Answer: D
This question in 9700/12 May/June 2018
Q97 · Catechol is a chemical found in a number of fruits 9700/13 May/June 2018
13 Catechol is a chemical found in a number of fruits. Catechol can be oxidised to a quinone by the enzyme catechol oxidase. Catechol oxidase is inhibited by parahyroxybenzoic acid (PHBA) which is structurally similar to catechol. Catechol oxidase is also inhibited by phenylthiourea (PTU) which binds to a copper atom in the enzyme. How do both these inhibitors reduce the enzyme activity? 1 altering the specificity of the enzyme 2 competing with substrates for the active site 3 decreasing the Vmax of the reaction A 1, 2 and 3 B 1 only C 2 only D 3 only
1 marks
Answer: B
This question in 9700/13 May/June 2018
Q98 · Four students investigated the effect of catalase on hydrogen peroxide 9700/13 May/June 2018
14 Four students investigated the effect of catalase on hydrogen peroxide. Each student started a digital clock at the beginning of the experiment and stopped the clock after 25 bubbles had been counted. The time recorded on the digital clock is shown below. hundredths hours minutes seconds of a second 00 01 33 54 Which of the times recorded by the students is appropriate for this experiment? A 1.34 minutes B 1 minute 33.54 seconds C 94 seconds D 93.54 seconds
1 marks
Answer: C
This question in 9700/13 May/June 2018
Q99 · A mutation occurred within the DNA sequence coding for an enzyme, causing a decrease in… 9700/11 Oct/Nov 2018
13 A mutation occurred within the DNA sequence coding for an enzyme, causing a decrease in the rate of a reaction catalysed by this enzyme. Which statements could explain the decrease in the rate of reaction? 1 An inhibitor for this enzyme has an increased affinity for the enzyme and forms an enzyme–inhibitor complex more easily. 2 The active site of the enzyme might have changed shape and so is no longer complementary. 3 The activation energy for the reaction with the mutated enzyme is greater than with the non-mutated enzyme. A 1, 2 and 3 B 1 and 2 only C 1 and 3 only D 2 and 3 only
1 marks
Answer: C
This question in 9700/11 Oct/Nov 2018
Q100 · Which row is correct for an enzyme with a low Michaelis-Menten constant? 9700/11 Oct/Nov 2018
14 Which row is correct for an enzyme with a low Michaelis-Menten constant? affinity of enzyme substrate concentration for substrate at maximum reaction rate A high high B high low C low high D low low
1 marks
Answer: B
This question in 9700/11 Oct/Nov 2018
Q101 · Aspirin inhibits an enzyme by reacting with an amino acid that forms an essential part of… 9700/12 Oct/Nov 2018
14 Aspirin inhibits an enzyme by reacting with an amino acid that forms an essential part of the 3D structure of the enzyme. Part of the aspirin molecule binds firmly with the amino acid. What describes this inhibition? 1 competitive inhibition 2 non-competitive inhibition 3 reversible inhibition A 1 and 3 B 1 only C 2 and 3 D 2 only
1 marks
Answer: D
This question in 9700/12 Oct/Nov 2018
Q102 · The table shows the Michaelis-Menten constant, Km, for three enzymes 9700/12 Oct/Nov 2018
15 The table shows the Michaelis-Menten constant, Km, for three enzymes. enzyme Km / mmoldm–3 C 1.5 × 10⁻² P 3.0 × 10⁻⁴ F 5.0 × 10⁻⁶ Which interpretation of the information is correct? A Enzyme C has a Vmax which is half that of enzyme P. B Enzyme C will reach Vmax in the shortest time interval. C Enzyme F has the greatest affinity for its substrate. D Enzyme P has a Vmax of 6.0 × 10⁻³ mmoldm–3.
1 marks
Answer: C
This question in 9700/12 Oct/Nov 2018
Q103 · Which statement about the typical modes of action of a competitive inhibitor and a… 9700/13 Oct/Nov 2018
13 Which statement about the typical modes of action of a competitive inhibitor and a non-competitive inhibitor is correct? A Competitive inhibitors can bind to alternative (allosteric) sites of an enzyme, non-competitive inhibitors have an irreversible effect on the enzyme. B Competitive inhibitors have exactly the same shape as the substrate, non-competitive inhibitors can have any shape. C Competitive inhibitors may be used to regulate enzyme activity, non-competitive inhibitors have no functions in enzyme regulation. D Competitive inhibitors will not alter Vmax, non-competitive inhibitors will reduce Vmax.
1 marks
Answer: D
This question in 9700/13 Oct/Nov 2018
Q104 · An investigation was carried out on the effect of temperature on an enzyme-catalysed… 9700/13 Oct/Nov 2018
15 An investigation was carried out on the effect of temperature on an enzyme-catalysed reaction. The enzyme and its substrate were initially placed into separate test-tubes and raised to the temperature required. They were then mixed and placed into four tubes A, B, C and D. These tubes were incubated for the time and at the temperature stated. The mass of the product formed was then measured. In which tube was the rate of reaction highest? incubation incubation mass of time / s temperature / °C product / µg A 30 25 2.5 B 30 45 5.0 C 600 25 32.0 D 600 45 10.0
1 marks
Answer: B
This question in 9700/13 Oct/Nov 2018
Q105 · The graph shows the effect of substrate concentration on the initial rate of an… 9700/12 Feb/March 2019
15 The graph shows the effect of substrate concentration on the initial rate of an enzyme-catalysed reaction. The enzyme concentration is constant. S T initial rate of reaction R 0 0 substrate concentration Which statement about the graph is correct? A Between R and S the number of enzyme molecules is limiting the rate of reaction. B Between R and S the number of product molecules is limiting the rate of reaction. C Between S and T the number of enzyme molecules is limiting the rate of reaction. D Between S and T the number of substrate molecules is limiting the rate of reaction.
1 marks
Answer: C
This question in 9700/12 Feb/March 2019
Q106 · The diagram represents the reversible interaction between the active site of an enzyme… 9700/12 Feb/March 2019
16 The diagram represents the reversible interaction between the active site of an enzyme and different inhibitors, X and Y. change in the shape enzyme molecules of the active site of the enzyme molecule active site active site inhibitor X inhibitor Y Which row correctly identifies the type of inhibition shown by inhibitor X and inhibitor Y? X Y A competitive competitive B competitive non-competitive C non-competitive competitive D non-competitive non-competitive
1 marks
Answer: B
This question in 9700/12 Feb/March 2019
Q107 · In an investigation, the same concentration of the enzyme phosphorylase was added to… 9700/11 May/June 2019
13 In an investigation, the same concentration of the enzyme phosphorylase was added to different concentrations of glucose phosphate and incubated at 30 °C. At 1 minute intervals, one drop of the reaction mixture was removed and added to a drop of iodine solution on a white tile. The diagram shows the results of this investigation. concentration of glucose phosphate / mg dm–3 0 5 10 15 20 25 30 35 colour of 0 iodine solution 1 2 brown 3 black time / minutes 4 5 6 7 8 9 What explains the trend in the results of this investigation? A Phosphorylase catalyses a reaction converting glucose phosphate to starch. B The maximum rate of reaction is reached at 20 mg dm–3 of glucose phosphate. C Substrate concentration is limiting at concentrations of glucose phosphate 25 mg dm–3 or less. D Enzyme concentration is limiting at concentrations of glucose phosphate 25 mg dm–3 or less.
1 marks
Answer: C
This question in 9700/11 May/June 2019
Q108 · A fixed volume of the enzyme catalase was added to a fixed volume of hydrogen peroxide… 9700/12 May/June 2019
10 A fixed volume of the enzyme catalase was added to a fixed volume of hydrogen peroxide solution. The diagram shows how the concentration of product changed over the course of the reaction. concentration of product 00 time What explains the shape of this graph? A The active sites become saturated. B The enzyme was denatured. C The hydrogen peroxide inhibited the reaction. D The substrate molecules were used up.
1 marks
Answer: D
This question in 9700/12 May/June 2019
Q109 · A fixed volume and concentration of substrate and enzyme were mixed 9700/12 May/June 2019
11 A fixed volume and concentration of substrate and enzyme were mixed. All other variables were kept constant. The enzyme-catalysed reaction was left until it was complete. Which graph shows how the rate of reaction changes with time? A B rate of rate of reaction reaction 00 00 time time C D rate of rate of reaction reaction 00 00 time time
1 marks
Answer: C
This question in 9700/12 May/June 2019
Q110 · A solution of amylase was added to a suspension of starch 9700/13 May/June 2019
7 A solution of amylase was added to a suspension of starch. The mixture was stirred and kept at 40 °C for 45 minutes. Samples were then tested with various reagents. What is the expected set of results? test and resulting colour iodine test Benedict’s test biuret test A black blue blue B black orange purple C brown blue blue D brown orange purple
1 marks
Answer: D
This question in 9700/13 May/June 2019
Q111 · The enzyme β-galactosidase can catalyse the hydrolysis of four substrates, A, B, C and D… 9700/13 May/June 2019
15 The enzyme β-galactosidase can catalyse the hydrolysis of four substrates, A, B, C and D, with similar structures. Each substrate has a different Km value. For which substrate does β-galactosidase have the lowest affinity? A Km = 4 × 10⁻³ mol dm–3 B Km = 1 × 10⁻³ mol dm–3 C Km = 2 × 10⁻⁴ mol dm–3 D Km = 1 × 10⁻⁴ mol dm–3
1 marks
Answer: A
This question in 9700/13 May/June 2019
Q112 · Which is correct for competitive inhibitors of enzymes? 9700/13 May/June 2019
16 Which is correct for competitive inhibitors of enzymes? 1 They occupy the active site of an enzyme. 2 They have exactly the same shape as the substrate. 3 They can be used to control the rate of enzyme activity. 4 They can bind to a site on an enzyme other than the active site. A 1, 2 and 3 B 1 and 3 only C 1 only D 2, 3 and 4
1 marks
Answer: B
This question in 9700/13 May/June 2019
Q113 · The Vmax and Km are determined for an enzyme-catalysed reaction 9700/11 Oct/Nov 2019
13 The Vmax and Km are determined for an enzyme-catalysed reaction. What will be the effects on the Vmax and Km in the presence of a competitive inhibitor? Vmax Km A decreases increases B increases decreases C stays the same decreases D stays the same increases
1 marks
Answer: D
This question in 9700/11 Oct/Nov 2019
Q114 · When investigating the rate of reaction of the enzyme lipase on the hydrolysis of… 9700/12 Oct/Nov 2019
15 When investigating the rate of reaction of the enzyme lipase on the hydrolysis of triglycerides, the pH must be maintained at an optimum to prevent the lipase denaturing. What is the reason for this? A The addition of water molecules produced by hydrolysis increases the pH. B The products of hydrolysis decrease the pH. C The products of hydrolysis increase the pH. D The removal of water molecules used in hydrolysis decreases the pH.
1 marks
Answer: B
This question in 9700/12 Oct/Nov 2019
Q115 · An experiment was carried out to compare the effect of pH on the activity of an enzyme… 9700/12 Oct/Nov 2019
16 An experiment was carried out to compare the effect of pH on the activity of an enzyme that was in solution and the same enzyme that had been immobilised on a gel. All other variables were kept the same. The results are shown in the graph. enzyme key activity immobilised enzyme enzyme in solution 4 5 6 7 8 9 10 11 pH Which statement explains these results when the enzyme is immobilised? A The primary structure has changed. B The secondary structure has changed. C The tertiary structure has changed. D The quaternary structure has changed.
1 marks
Answer: C
This question in 9700/12 Oct/Nov 2019
Q116 · The Michaelis-Menten constant for an enzyme-catalysed reaction is referred to as Km, and… 9700/13 Oct/Nov 2019
12 The Michaelis-Menten constant for an enzyme-catalysed reaction is referred to as Km, and the maximum velocity of such a reaction is known as Vmax. Which statement about Km and Vmax is correct? A An enzyme with a high value of Km can reach its Vmax at a low substrate concentration. B An enzyme with a high value of Km has a high affinity to its substrate. C An enzyme with a low value of Km can reach its Vmax at a high substrate concentration. D An enzyme with a low value of Km has a high affinity to its substrate.
1 marks
Answer: D
This question in 9700/13 Oct/Nov 2019
Q117 · What is the most appropriate set of controls to use in an investigation into the rate of… 9700/12 Feb/March 2020
13 What is the most appropriate set of controls to use in an investigation into the rate of an enzyme-catalysed reaction over a range of temperatures from 25 °C to 65 °C? A enzyme and substrate at all temperatures tested B enzyme and boiled substrate at all temperatures tested C boiled enzyme only at all temperatures tested D substrate only at all temperatures tested
1 marks
Answer: D
This question in 9700/12 Feb/March 2020
Q118 · An investigation is carried out with an enzyme at its optimum temperature and pH 9700/12 Feb/March 2020
14 An investigation is carried out with an enzyme at its optimum temperature and pH. The rate of the enzyme reaction is measured at different substrate concentrations. The investigation is repeated in the presence of a competitive inhibitor. How will the results with the competitive inhibitor be different from the original results? Km with competitive Vmax with competitive inhibitor inhibitor A higher lower B higher the same C the same lower D the same the same
1 marks
Answer: B
This question in 9700/12 Feb/March 2020
Q119 · An enzyme is modified for industrial use 9700/11 May/June 2020
13 An enzyme is modified for industrial use. It has a lower Michaelis-Menten constant (Km) than the unmodified enzyme. What is true of the modified enzyme? A It is more specific. B It has a higher affinity for its substrate. C It has a lower maximum rate of reaction (Vmax). D It needs more substrate to become saturated.
1 marks
Answer: B
This question in 9700/11 May/June 2020
Q120 · The diagram shows a metabolic pathway 9700/12 May/June 2020
13 The diagram shows a metabolic pathway. enzyme 1 enzyme 2 enzyme 3 reactant substance X substance Y end product What would be the effect of adding a small amount of a non-competitive inhibitor of enzyme 2? A Enzyme 2 would be partially denatured. B Substance X would increase in concentration. C Substance Y would no longer be formed. D The initial reactant would no longer be metabolised.
1 marks
Answer: B
This question in 9700/12 May/June 2020
Q121 · Two enzymes are added to a solution containing a low concentration of a substrate that… 9700/12 May/June 2020
14 Two enzymes are added to a solution containing a low concentration of a substrate that they can both use. Which statement is correct? A Both enzymes will use equal amounts of the substrate. B Neither enzyme will be able to use the substrate. C The enzyme with the lower Vmax will use less of the substrate than the other enzyme. D The enzyme with the lower Vmax will use more of the substrate than the other enzyme.
1 marks
Answer: D
This question in 9700/12 May/June 2020
Q122 · The enzyme trypsin hydrolyses proteins to amino acids 9700/13 May/June 2020
9 The enzyme trypsin hydrolyses proteins to amino acids. Trypsin does not function when the pH is very low as its 3D shape would be changed. What explains this change in 3D shape? A Hydrogen ions attach themselves to negatively charged R groups. B Hydrogen ions disrupt disulfide bonds. C Hydrogen ions increase hydrogen bonding between amino acids. D Hydrogen ions reduce the affinity of hydrophilic R groups for water.
1 marks
Answer: A
This question in 9700/13 May/June 2020
Q123 · Two experiments, X and Y, were carried out using an enzyme from humans 9700/13 May/June 2020
12 Two experiments, X and Y, were carried out using an enzyme from humans. Experiment X was carried out at a constant temperature of 37 °C. During experiment Y, the temperature was increased from 37 °C to 80 °C. All other factors were kept the same. Which graph shows the results? A B X X product product concentration Y concentration Y 0 1 2 3 4 5 0 1 2 3 4 5 time / minutes time / minutes C D X Y product X product concentration concentration Y 0 1 2 3 4 5 0 1 2 3 4 5 time / minutes time / minutes
1 marks
Answer: A
This question in 9700/13 May/June 2020
Q124 · What affects the rate of an enzyme-catalysed reaction when in the presence of a… 9700/13 May/June 2020
13 What affects the rate of an enzyme-catalysed reaction when in the presence of a non-competitive inhibitor? 1 enzyme concentration 2 inhibitor concentration 3 substrate concentration A 1, 2 and 3 B 1 and 2 only C 1 and 3 only D 2 and 3 only
1 marks
Answer: A
This question in 9700/13 May/June 2020
Q125 · Which effects can non-competitive inhibitors have on enzyme-controlled reactions? 9700/11 Oct/Nov 2020
15 Which effects can non-competitive inhibitors have on enzyme-controlled reactions? 1 lower the Km value 2 reduce the concentration of the product 3 reduce the rate of a metabolic pathway A 1, 2 and 3 B 1 and 2 only C 1 and 3 only D 2 and 3 only
1 marks
Answer: D
This question in 9700/11 Oct/Nov 2020
Q126 · Which letter in the flow diagram shows the effect of adding a competitive inhibitor to an… 9700/13 Oct/Nov 2020
14 Which letter in the flow diagram shows the effect of adding a competitive inhibitor to an enzyme-catalysed reaction? is a reversible reaction yes no affects the Vmax value affects the Km value of the enzyme of the enzyme yes no yes no A B C D
1 marks
Answer: B
This question in 9700/13 Oct/Nov 2020
Q127 · Catechol is a chemical found in a number of fruits 9700/12 Feb/March 2021
13 Catechol is a chemical found in a number of fruits. Catechol can be oxidised to a quinone by the enzyme catechol oxidase. Catechol oxidase is inhibited by parahydroxybenzoic acid (PHBA), which is structurally similar to catechol. In the presence of PHBA, the Michaelis-Menten constant (Km) for catechol oxidase increases. How does PHBA inhibit catechol oxidase? 1 PHBA and catechol can both bind to the enzyme but not at the same time. 2 PHBA is a non-competitive inhibitor of catechol oxidase. 3 PHBA decreases the Vmax of the reaction. A 1, 2 and 3 B 1 only C 2 only D 3 only
1 marks
Answer: B
This question in 9700/12 Feb/March 2021
Q128 · The enzyme -galactosidase can catalyse the hydrolysis of four substrates with similar… 9700/13 May/June 2021
14 The enzyme -galactosidase can catalyse the hydrolysis of four substrates with similar structures. Each substrate gives a different Km value. For which substrate does -galactosidase have the highest affinity? substrate Km / mol dm–3 A 1 4 10–3 B 2 1 10–3 C 3 2 10–4 D 4 1 10–4
1 marks
Answer: D
This question in 9700/13 May/June 2021
Q129 · An investigation was carried out on the effect of temperature on the activity of an… 9700/13 May/June 2021
15 An investigation was carried out on the effect of temperature on the activity of an enzyme when it is immobilised and when it is non-immobilised (free in solution). The product of the enzyme- catalysed reaction causes a decrease in pH. The graph shows the results of the investigation. key non-immobilised, 75 °C pH immobilised, 75 °C immobilised, 37 °C non-immobilised, 37 °C time Which would give the highest yield of product? A immobilised, 37 C B immobilised, 75 C C non-immobilised, 37 C D non-immobilised, 75 C
1 marks
Answer: C
This question in 9700/13 May/June 2021
Q130 · The table shows the Michaelis–Menten constant, Km, for three enzymes 9700/11 Oct/Nov 2021
13 The table shows the Michaelis–Menten constant, Km, for three enzymes. enzyme Km / mmol dm–3 C 1.5 10–2 P 3.0 10–4 F 5.0 10–6 Which interpretation of the information is correct? A Enzyme C has a Vmax which is half that of enzyme P. B Enzyme C will reach Vmax in the shortest time interval. C Enzyme F has the greatest affinity for its substrate. D Enzyme P has a Vmax of 6.0 10–3 mmol dm–3.
1 marks
Answer: C
This question in 9700/11 Oct/Nov 2021
Q131 · The graph shows the relationship between the concentration of substrate and the rate of… 9700/12 Oct/Nov 2021
15 The graph shows the relationship between the concentration of substrate and the rate of an enzyme-catalysed reaction. rate of enzyme-catalysed reaction 0 0 concentration of substrate Which row shows how Km and Vmax for this enzyme would be affected if the same reaction was carried out in the presence of a competitive inhibitor? Km Vmax A increases decreases B increases remains the same C remains the same decreases D remains the same remains the same
1 marks
Answer: B
This question in 9700/12 Oct/Nov 2021
Q132 · The cells in the roots of beetroot plants contain a red pigment 9700/13 Oct/Nov 2021
15 The cells in the roots of beetroot plants contain a red pigment. When pieces of root tissue are soaked in cold water, some of the red pigment leaks out of the cells into the water. An experiment was carried out to investigate the effect of temperature on the loss of red pigment from the root cells. It was found that the higher the temperature of the water, the higher the rate of loss of red pigment from the root cells. Which statements could explain this trend? 1 Enzymes in the cells denature as the temperature increases, so the pigment can no longer be used for reactions inside the cells and diffuses out. 2 As the temperature increases, the tertiary structure of protein molecules in the cell surface membrane changes, increasing the permeability of the membrane. 3 Phospholipid molecules gain kinetic energy as the temperature rises, increasing the fluidity of the phospholipid bilayer and allowing pigment molecules to diffuse out more easily. A 1 and 2 B 2 and 3 C 2 only D 3 only
1 marks
Answer: B
This question in 9700/13 Oct/Nov 2021
Q133 · A student used colorimetry to monitor the hydrolysis of a protein by a protease enzyme 9700/11 May/June 2022
12 A student used colorimetry to monitor the hydrolysis of a protein by a protease enzyme. The student used biuret solution to determine the concentration of protein in the hydrolysis reaction. The student produced a calibration curve using known concentrations of protein. Which diagram shows the calibration curve? A B transmission absorbance 0 0 0 protein 0 protein concentration concentration C D transmission absorbance 0 0 0 protein 0 protein concentration concentration
1 marks
Answer: B
This question in 9700/11 May/June 2022
Q134 · A student completed an experiment to measure how increasing concentrations of substrate… 9700/11 May/June 2022
13 A student completed an experiment to measure how increasing concentrations of substrate affects the rate of an enzyme-controlled reaction. The student then repeated the experiment after adding a fixed quantity of a reversible competitive inhibitor. Which row describes the effect of a reversible competitive inhibitor on enzyme activity? attachment of inhibitor effect of increasing substrate concentration at active site on rate of enzyme-controlled reaction A no little effect on the rate B yes rate increases C no rate increases D yes little effect on the rate
1 marks
Answer: B
This question in 9700/11 May/June 2022
Q135 · Which statement about the Michaelis–Menten constant (Km) is correct for an enzyme with a… 9700/12 May/June 2022
12 Which statement about the Michaelis–Menten constant (Km) is correct for an enzyme with a low affinity for its substrate? A It has a high Km and reaches Vmax at a high substrate concentration. B It has a high Km and reaches Vmax at a low substrate concentration. C It has a low Km and reaches Vmax at a high substrate concentration. D It has a low Km and reaches Vmax at a low substrate concentration.
1 marks
Answer: A
This question in 9700/12 May/June 2022
Q136 · What is a feature of competitive enzyme inhibition? 9700/13 May/June 2022
13 What is a feature of competitive enzyme inhibition? A The inhibitor binds permanently to the active site. B Inhibition can be reversed by increasing the concentration of the substrate. C The inhibitor molecule changes the secondary structure of the enzyme. D The substrate and the inhibitor are the same shape.
1 marks
Answer: B
This question in 9700/13 May/June 2022
Q137 · A student investigated the rate of enzyme activity with increasing substrate concentration 9700/11 Oct/Nov 2022
14 A student investigated the rate of enzyme activity with increasing substrate concentration. The experiment was repeated with the addition of a reversible non-competitive enzyme inhibitor. A graph was plotted to show the results. Which graph represents the results of the two experiments? A B rate of rate of enzyme enzyme activity activity substrate substrate concentration concentration key = without enzyme = inhibitor C D = with enzyme = inhibitor rate of rate of enzyme enzyme activity activity substrate substrate concentration concentration
1 marks
Answer: B
This question in 9700/11 Oct/Nov 2022
Q138 · A student investigated the effect of substrate concentration on the activity of an enzyme 9700/12 Oct/Nov 2022
13 A student investigated the effect of substrate concentration on the activity of an enzyme. The graph shows the results of this investigation. X activity of enzyme substrate concentration An increase in which factors could lead to a change in the activity of the enzyme at point X on the graph? 1 pH 2 substrate concentration 3 temperature A 1, 2 and 3 B 1 and 2 only C 1 and 3 only D 2 and 3 only
1 marks
Answer: A
This question in 9700/12 Oct/Nov 2022
Q139 · The Michaelis–Menten constant, Km, is the substrate concentration at which an enzyme… 9700/12 Oct/Nov 2022
14 The Michaelis–Menten constant, Km, is the substrate concentration at which an enzyme works at half its maximum rate. What is correct when the Km value is low? A The enzyme has a low affinity for the substrate and the quicker the reaction will proceed to its maximum rate. B The enzyme has a low affinity for the substrate and the slower the reaction will proceed to its maximum rate. C The enzyme has a high affinity for the substrate and the quicker the reaction will proceed to its maximum rate. D The enzyme has a high affinity for the substrate and the slower the reaction will proceed to its maximum rate.
1 marks
Answer: C
This question in 9700/12 Oct/Nov 2022
Q140 · Yeast contains the enzyme catalase which catalyses the breakdown of hydrogen peroxide… 9700/13 Oct/Nov 2022
13 Yeast contains the enzyme catalase which catalyses the breakdown of hydrogen peroxide (H2O2) as shown. catalase 2H2O2 2H2O + O2 Yeast was added to a solution of hydrogen peroxide and the total volume of oxygen released was recorded every 30 seconds for 2 minutes. All other variables were standardised. The data is shown in the table. total volume of time / s O2 / cm3 30 157 60 251 90 283 120 285 What explains the pattern of the data? A The rate of reaction increases as more enzyme–substrate complexes are formed. B The rate of reaction increases as the enzyme reaches its maximum velocity (Vmax). C The volume of oxygen released decreases as the enzymes begin to denature. D The volume of oxygen released decreases as more substrate is converted into product.
1 marks
Answer: D
This question in 9700/13 Oct/Nov 2022
Q141 · The Michaelis–Menten constant, Km, is a measure of the affinity of an enzyme for its… 9700/13 Oct/Nov 2022
14 The Michaelis–Menten constant, Km, is a measure of the affinity of an enzyme for its substrate. 1 The higher the affinity, the lower the Km. 2 The lower the affinity, the slower the reaction will be. 3 At Km, half the active sites of the enzyme are occupied by the substrate. Which statements about Km are correct? A 1, 2 and 3 B 1 and 2 only C 1 and 3 only D 2 and 3 only
1 marks
Answer: A
This question in 9700/13 Oct/Nov 2022
Q142 · A scientist investigated the rate of breakdown of hydrogen peroxide 9700/12 Feb/March 2023
16 A scientist investigated the rate of breakdown of hydrogen peroxide. Four experiments were carried out using different mixtures. substrate only substrate + enzyme substrate + enzyme + competitive inhibitor substrate + enzyme + non-competitive inhibitor The results are sketched in the graph. 1 rate of 2 breakdown of hydrogen 3 peroxide 4 substrate concentration Which row shows the correct lines for two of the experimental mixtures? substrate + enzyme + substrate only competitive inhibitor A 1 2 B 4 2 C 1 3 D 4 3
1 marks
Answer: B
This question in 9700/12 Feb/March 2023
Q143 · The graph shows the effect of an increasing substrate concentration on the rate of an… 9700/11 May/June 2023
13 The graph shows the effect of an increasing substrate concentration on the rate of an enzyme-catalysed reaction. maximum rate of reaction rate of reaction P Q substrate concentration Line P represents the result when the enzyme is used at its optimum pH and optimum temperature and without an inhibitor. Line Q represents the result when the reaction conditions are changed. Which descriptions of changes to the reaction conditions could result in line Q if all other conditions were kept the same? 1 Add an inhibitor that attaches to a site other than the active site. 2 Add an inhibitor that has a similar shape to the substrate. 3 Add an inhibitor that blocks the active site of the enzyme. 4 Carry out the reaction at a higher temperature. A 1, 3 and 4 B 1 and 4 only C 2, 3 and 4 D 2 and 3 only
1 marks
Answer: D
This question in 9700/11 May/June 2023
Q144 · CYP3A4 is an important enzyme in the human digestive system where it is needed to break… 9700/12 May/June 2023
13 CYP3A4 is an important enzyme in the human digestive system where it is needed to break down a range of different toxins. The activity of CYP3A4 has been shown to be reduced by substances called furanocoumarins. Furanocoumarins are found in some fruits and so dangerous concentrations of toxins may develop in the human digestive system when fruits containing furanocoumarins are eaten. From the information provided, what can be concluded about molecules of the enzyme CYP3A4? A They lower the activation energy of the toxin breakdown reactions. B They bind specifically through the active site to a substrate found in some fruits. C They change permanently when acted upon by furanocoumarin molecules. D They resume normal activity when concentrations of furanocoumarins decrease.
1 marks
Answer: A
This question in 9700/12 May/June 2023
Q145 · A fixed volume and concentration of substrate and enzyme were mixed 9700/12 May/June 2023
14 A fixed volume and concentration of substrate and enzyme were mixed. All other variables were kept constant. The enzyme-catalysed reaction was left until it was complete. Which graph shows how the rate of reaction changes with time? A B rate of rate of reaction reaction 0 0 0 time 0 time C D rate of rate of reaction reaction 0 0 0 time 0 time
1 marks
Answer: C
This question in 9700/12 May/June 2023
Q146 · Some animals produce antimicrobial proteins which protect them from pathogens 9700/13 May/June 2023
14 Some animals produce antimicrobial proteins which protect them from pathogens. These proteins could be used to kill human pathogens, however when used as a medicine they are broken down by protein-digesting enzymes. Replacing one of the amino acids found in the protein with an amino acid that had been synthesised in the laboratory resulted in a modified protein that was not broken down. What could explain why this modified protein was not broken down by the protein-digesting enzymes? 1 The modified protein has a different tertiary structure to the original protein. 2 The modified protein is not complementary in shape to the enzyme’s active site. 3 The modified protein is unable to induce a fit with the protein-digesting enzyme. A 1, 2 and 3 B 1 and 2 only C 1 and 3 only D 2 and 3 only
1 marks
Answer: A
This question in 9700/13 May/June 2023
Q147 · A student investigated the effect of substrate concentration on the rate of an… 9700/13 May/June 2023
15 A student investigated the effect of substrate concentration on the rate of an enzyme-catalysed reaction. A graph was plotted to show the relationship between these two variables. The student was asked to take readings from the graph that could be used to determine the Michaelis–Menten constant, Km, for this enzyme. J, K, L and M show points read from the graphs which the student could use to determine the value of Km. J rate of rate of reaction reaction 0 0 K 0 0 concentration concentration of substrate of substrate rate of rate of reaction reaction L 0 0 M 0 0 concentration concentration of substrate of substrate Which two readings must the student use to determine the value of Km? A J and K B J and M C K and L D L and M
1 marks
Answer: C
This question in 9700/13 May/June 2023
Q148 · The end-product of a metabolic pathway can act as a competitive inhibitor 9700/13 May/June 2023
16 The end-product of a metabolic pathway can act as a competitive inhibitor. This is called end-product inhibition and allows a cell to control a metabolic pathway. The diagram shows a metabolic pathway where the end-product could act as an inhibitor of enzyme W. substrate enzyme W intermediate 1 enzyme X intermediate 2 inhibition enzyme Y intermediate 3 enzyme Z end-product What would be the effect if enzyme Z was inhibited by the end-product instead of enzyme W? quantity of quantity of intermediate 1 end-product A increase decrease B increase unchanged C decrease decrease D decrease unchanged
1 marks
Answer: A
This question in 9700/13 May/June 2023
Q149 · The graph shows the results of two experiments on the effect of increasing substrate… 9700/12 Oct/Nov 2023
13 The graph shows the results of two experiments on the effect of increasing substrate concentration on the rate of an enzyme-catalysed reaction. One experiment was at a high concentration of enzyme and the second was at a low concentration of enzyme. All other variables were standardised. high enzyme concentration initial rate low enzyme X concentration of reaction substrate concentration What would limit the initial rate of reaction at point X? A enzyme concentration B pH C substrate concentration D temperature
1 marks
Answer: A
This question in 9700/12 Oct/Nov 2023
Q150 · Which statements about the Michaelis–Menten constant (Km) of an enzyme are correct? 9700/12 Oct/Nov 2023
14 Which statements about the Michaelis–Menten constant (Km) of an enzyme are correct? 1 At the Km value, half the active sites of the enzyme should be occupied by the substrate. 2 Km represents the substrate concentration at which the enzyme is working at half its maximum rate. 3 The lower the Km value, the lower the affinity of the enzyme to its substrate. 4 When an enzyme has a high Km value, the enzyme-catalysed reaction will proceed very slowly to its maximum rate. A 1, 2 and 3 B 1, 2 and 4 C 1 and 3 only D 2 and 4 only
1 marks
Answer: B
This question in 9700/12 Oct/Nov 2023
Q151 · The graph compares the effect of temperature on the activity of the protease enzyme… 9700/13 Oct/Nov 2023
16 The graph compares the effect of temperature on the activity of the protease enzyme, papain, when in solution (free) and when immobilised in alginate beads. immobilised papain activity of papain free papain 0 20 40 60 80 temperature / °C Which statement about the effect of immobilisation of papain is correct? A It alters the shape of papain’s active site at higher temperatures. B It decreases the activity of papain at higher temperatures. C It increases the stability of papain at higher temperatures. D It reduces the number of collisions of papain with the substrate.
1 marks
Answer: C
This question in 9700/13 Oct/Nov 2023
Q152 · A scientist investigated the progress of two enzyme-catalysed reactions in separate… 9700/12 Feb/March 2024
13 A scientist investigated the progress of two enzyme-catalysed reactions in separate test-tubes, X and Y. Both reactions result in colour changes that can be detected using colorimetry. 0.5 cm3 samples were taken from each test-tube at the start of the investigation and at regular intervals for the next 5 minutes. Copper ions were added to each sample as soon as the sample was collected to inactivate the enzymes and stop the reactions from progressing further. The absorbance of each sample was measured using a colorimeter. The graph shows the results of this investigation. X percentage absorbance Y 0 1 2 3 4 5 time / minutes Which statement is consistent with the results shown in the graph? A The substrate in test-tube X has a higher absorbance than the product. B The product in test-tube Y has a lower absorbance than the substrate. C The rate of the reaction in test-tube X increased with time. D The rate of the reaction in test-tube Y increased with time.
1 marks
Answer: B
This question in 9700/12 Feb/March 2024
Q153 · A student investigated the hydrolysis of lipid in high-fat milk, using the enzyme lipase 9700/12 Feb/March 2024
14 A student investigated the hydrolysis of lipid in high-fat milk, using the enzyme lipase. 1 cm3 of enzyme solution was added to 10 cm3 of high-fat milk. • • The temperature was kept constant. • The pH of the reaction mixture was recorded at time 0 minutes and every minute for 20 minutes. Which statements correctly describe the expected results of this investigation? 1 The product forms more slowly as time proceeds because the concentration of the substrate is decreasing. 2 The pH of the reaction mixture increases rapidly in the first few minutes and then increases less rapidly. 3 The increase in the concentration of product eventually causes the lipase molecules to denature. A 1, 2 and 3 B 1 and 2 only C 1 and 3 only D 2 and 3 only
1 marks
Answer: C
This question in 9700/12 Feb/March 2024
Q154 · The graph shows the trend from an enzyme-catalysed reaction 9700/11 May/June 2024
11 The graph shows the trend from an enzyme-catalysed reaction. y x Which labels are correct for the x-axis and y-axis? x-axis y-axis A rate of reaction substrate concentration B enzyme concentration temperature C pH rate of reaction D substrate concentration pH
1 marks
Answer: C
This question in 9700/11 May/June 2024
Q155 · Which statements about the Michaelis–Menten constant (Km) are correct? 9700/11 May/June 2024
12 Which statements about the Michaelis–Menten constant (Km) are correct? 1 The higher the Km, the higher the enzyme affinity for the substrate. 2 Km is a measure of the degree of enzyme affinity for the substrate. 3 Km is defined as the substrate concentration at which the enzyme functions at half its maximum rate. A 1, 2 and 3 B 1 and 2 only C 1 and 3 only D 2 and 3 only
1 marks
Answer: D
This question in 9700/11 May/June 2024
Q156 · Which row describes the expected effect on Vmax and Km when a competitive reversible… 9700/12 May/June 2024
10 Which row describes the expected effect on Vmax and Km when a competitive reversible inhibitor is added to an enzyme-catalysed reaction? substrate effect on Vmax concentration at Km A no change increases B no change no change C decreases increases D decreases no change
1 marks
Answer: A
This question in 9700/12 May/June 2024
Q157 · The graph shows the effect of substrate concentration on the rates of reaction of three… 9700/12 May/June 2024
11 The graph shows the effect of substrate concentration on the rates of reaction of three enzymes, X, Y, and Z. 2500 enzyme Y 2000 rate of 1500 enzyme X reaction / product per second 1000 500 enzyme Z 0 0 200 400 600 800 1000 1200 substrate concentration / μmol dm–3 What is the correct order of affinity of these enzymes for their substrates, starting with the enzyme with the highest affinity? A X Y Z B X Z Y C Y X Z D Z X Y
1 marks
Answer: B
This question in 9700/12 May/June 2024
Q158 · The diagram shows different molecules in a solution 9700/13 May/June 2024
10 The diagram shows different molecules in a solution. P Q R S Which statement could explain what happens when some of the molecules are mixed together? A Molecule P forms an enzyme–substrate complex with the non-competitive inhibitor molecule Q. B Molecule Q binds to molecule P, increasing the activation energy. C Molecules R and S bind to the active site of molecule P. D Molecules S and R are the products of the breakdown of molecule P.
1 marks
Answer: C
This question in 9700/13 May/June 2024
Q159 · The effect of substrate concentration on an enzyme-catalysed reaction was measured in… 9700/13 May/June 2024
11 The effect of substrate concentration on an enzyme-catalysed reaction was measured in three different conditions: ● without an inhibitor ● with a competitive inhibitor ● with a non-competitive inhibitor. The graph shows the results. 1 2 rate of reaction 3 substrate concentration Which row is correct? with a with a without an competitive non-competitive inhibitor inhibitor inhibitor A 1 2 3 B 1 3 2 C 3 1 2 D 3 2 1
1 marks
Answer: A
This question in 9700/13 May/June 2024
Q160 · Which aspect of enzyme activity can be compared by the Michaelis–Menten constant? 9700/13 May/June 2024
12 Which aspect of enzyme activity can be compared by the Michaelis–Menten constant? A activation energy of a reaction with or without an enzyme B affinity of different enzymes for their substrates C affinity of an enzyme at different substrate concentrations D maximum rate of reaction (Vmax) at different temperatures
1 marks
Answer: B
This question in 9700/13 May/June 2024
Q161 · A student carried out investigations at pH 1–8 to look at the effect of pH on an… 9700/11 Oct/Nov 2024
12 A student carried out investigations at pH 1–8 to look at the effect of pH on an enzyme-catalysed reaction. The optimum condition for this enzyme is the acidic environment of the stomach at pH 1–2. The remaining substrate concentration was measured after five minutes at each different pH. Which graph shows the effect of increasing pH on substrate concentration remaining after five minutes? A B substrate substrate concentration concentration remaining remaining after five min after five min 1 2 3 4 5 6 7 8 1 2 3 4 5 6 7 8 pH pH C D substrate substrate concentration concentration remaining remaining after five min after five min 1 2 3 4 5 6 7 8 1 2 3 4 5 6 7 8 pH pH
1 marks
Answer: A
This question in 9700/11 Oct/Nov 2024
Q162 · Which statement is correct for a non-competitive inhibitor? 9700/11 Oct/Nov 2024
13 Which statement is correct for a non-competitive inhibitor? A The inhibitor binds to the active site of the enzyme and decreases Vmax. B The inhibitor binds away from the active site and increases the Michaelis–Menten constant. C The inhibitor decreases Vmax, but the Michaelis–Menten constant does not change. D The inhibitor does not change Vmax but increases the Michaelis–Menten constant.
1 marks
Answer: C
This question in 9700/11 Oct/Nov 2024
Q163 · Pyrophosphatase enzymes catalyse a hydrolysis reaction 9700/11 Oct/Nov 2024
14 Pyrophosphatase enzymes catalyse a hydrolysis reaction. pyrophosphatase pyrophosphate ions phosphate ions substrate product In experiment 1, a scientist studied the rate of this reaction, using a colorimeter. The absorbance of the solution was measured at regular intervals until all of the pyrophosphate ions had been converted into phosphate ions. In experiment 2, the scientist repeated the procedure with a higher concentration of pyrophosphatase. All other variables were standardised. Which graph shows the effect of increasing the concentration of pyrophosphatase? A B absorbance absorbance time time C D absorbance absorbance time time key = experiment 1 = experiment 2
1 marks
Answer: C
This question in 9700/11 Oct/Nov 2024
Q164 · The initial rate of a reaction catalysed by an enzyme was measured at various substrate… 9700/12 Oct/Nov 2024
12 The initial rate of a reaction catalysed by an enzyme was measured at various substrate concentrations. Which graph shows the effect of a low concentration of non-competitive inhibitor on the reaction? A B initial rate initial rate of reaction of reaction substrate substrate key concentration concentration = without inhibitor C D = with inhibitor initial rate initial rate of reaction of reaction substrate substrate concentration concentration
1 marks
Answer: D
This question in 9700/12 Oct/Nov 2024
Q165 · Gout is a type of arthritis in which small uric acid crystals form inside and around the… 9700/12 Oct/Nov 2024
13 Gout is a type of arthritis in which small uric acid crystals form inside and around the joints. It causes sudden attacks of severe pain and swelling. The diagram shows how uric acid is formed from hypoxanthine catalysed by the enzyme xanthine oxidase. O O O H H H HN N HN N HN N xanthine oxidase xanthine oxidase O N N O N N O N N H2O + O2 H2O2 H2O + O2 H2O2 H H H hypoxanthine xanthine uric acid Gout can be treated using a drug called allopurinol which has a similar shape to hypoxanthine. OH N N N N H allopurinol What can be concluded from this information about how allopurinol prevents the formation of uric acid? A It binds to the active site of xanthine oxidase instead of hypoxanthine, resulting in reduced production of uric acid. B It binds to another part of xanthine oxidase and this changes the shape of the active site. C It disrupts the hydrogen bonds within xanthine oxidase so it denatures and the active site is no longer complementary to hypoxanthine and xanthine. D It hydrolyses the peptide bonds within xanthine oxidase to change the shape of the active site.
1 marks
Answer: A
This question in 9700/12 Oct/Nov 2024
Q166 · Two different enzymes, P and Q, are investigated to find the optimum pH for each enzyme 9700/13 Oct/Nov 2024
10 Two different enzymes, P and Q, are investigated to find the optimum pH for each enzyme. The results show that P works only in acidic conditions. Q has an optimum pH which is slightly alkaline. Which graph shows the correct results for P and Q? A B Q P Q substrate rate of P concentration reaction at 1 minute 0 7 14 0 7 14 pH pH C D 14 7 Q pH 7 P pH P Q 0 0 product concentration rate of reaction at 1 minute
1 marks
Answer: B
This question in 9700/13 Oct/Nov 2024
Q167 · A student investigated the effect of substrate concentration on the rate of an… 9700/13 Oct/Nov 2024
11 A student investigated the effect of substrate concentration on the rate of an enzyme-catalysed reaction. The student plotted the results in a graph. 40 30 reaction rate 20 / mol dm–3 s–1 10 0 0 10 20 30 40 50 substrate concentration / mol dm–3 What is the Km for this enzyme-catalysed reaction? A 12 mol dm–3 B 15 mol dm–3 s–1 C 30 mol dm–3 s–1 D 50 mol dm–3
1 marks
Answer: A
This question in 9700/13 Oct/Nov 2024
Q168 · Which description identifies a reversible, non-competitive enzyme inhibitor? 9700/13 Oct/Nov 2024
13 Which description identifies a reversible, non-competitive enzyme inhibitor? A It can attach to the active site. B It can attach to a site other than the active site. C It can attach to the active site and another site simultaneously. D It can attach to either the active site or another site.
1 marks
Answer: B
This question in 9700/13 Oct/Nov 2024
Q169 · Catalase is an enzyme that breaks down hydrogen peroxide into water and oxygen 9700/12 Feb/March 2025
14 Catalase is an enzyme that breaks down hydrogen peroxide into water and oxygen. Catalase was added to a solution of hydrogen peroxide and the oxygen produced was collected in a gas syringe. The total volume of oxygen produced from the start of the reaction was recorded every 10 seconds for 1 minute. The results are shown in the table. total volume time / s of oxygen produced / cm3 0 0 10 22 20 40 30 50 40 55 50 57 60 58 What can be concluded from these results? A The reaction stopped after 60 seconds and no more oxygen was produced. B The highest rate of oxygen production occurred 10 seconds after the start of the reaction. C It took more than 20 seconds from the start of the reaction for half of the substrate to be converted to water and oxygen. D The mean rate of reaction between 20 and 30 seconds was twice the mean rate of reaction between 30 and 40 seconds.
1 marks
Answer: D
This question in 9700/12 Feb/March 2025
Q170 · Succinic dehydrogenase is an enzyme that catalyses the conversion of succinate to… 9700/12 Feb/March 2025
15 Succinic dehydrogenase is an enzyme that catalyses the conversion of succinate to fumarate in aerobic respiration. Malonate is a reversible inhibitor of succinic dehydrogenase. Malonate reduces the enzyme’s activity by binding to its active site. Malonate and succinate cannot bind to the active site at the same time. Which statement describes the effect of malonate on the activity of succinic dehydrogenase? A In the presence of malonate, Vmax can still be reached if the concentration of succinate is increased. B Malonate has no effect on the Km. C In the presence of malonate, Vmax can still be reached if the concentration of fumarate is increased. D Malonate decreases the Km.
1 marks
Answer: A
This question in 9700/12 Feb/March 2025
Q171 · Which graphs could show the effect of pH on the rate of enzyme-catalysed reactions? 9700/12 May/June 2025
14 Which graphs could show the effect of pH on the rate of enzyme-catalysed reactions? 1 2 3 4 rate of rate of rate of rate of reaction reaction reaction reaction 0 0 0 0 1 14 1 14 1 14 1 14 pH pH pH pH A 1 and 2 B 1 and 3 C 2 and 4 D 3 and 4
1 marks
Answer: C
This question in 9700/12 May/June 2025
Q172 · After a heart attack, the enzyme lactate dehydrogenase leaks into the blood plasma from… 9700/12 May/June 2025
15 After a heart attack, the enzyme lactate dehydrogenase leaks into the blood plasma from
damaged heart muscle.
What is required to measure the activity of lactate dehydrogenase activity in a sample of blood
plasma?
sterilisation of incubation of incubation of
blood plasma sample with sample with lactate
b heatin substrate for lactate dehydrogenase
y g dehydrogenase inhibitor
A v v v
B x v v
Cc x v x
D x x v
key
/¥ = required
X = not required
1 marks
Answer: C
This question in 9700/12 May/June 2025
Q173 · Which graph correctly shows Km and Vmax? 9700/12 May/June 2025
16 Which graph correctly shows Km and Vmax? A B Vmax Vmax rate of rate of Km reaction reaction Km concentration of enzyme concentration of substrate C D Vmax Vmax rate of rate of Km reaction reaction Km concentration of substrate concentration of enzyme
1 marks
Answer: B
This question in 9700/12 May/June 2025
Q174 · The activity of an enzyme can be affected by a competitive inhibitor 9700/13 May/June 2025
16 The activity of an enzyme can be affected by a competitive inhibitor. Which row is correct for the effect of a competitive inhibitor on the value of Km and the reason for this? effect of a competitive inhibitor reason on the value of Km A increased Few substrate molecules will bind to the active site when the substrate concentration is low because the active site is blocked by the inhibitor. B increased Vmax will increase because the substrate will only bind to the active site when the concentration of the substrate is high. C no effect At high substrate concentrations, substrate molecules are still able to bind to the enzymes in the presence of a competitive inhibitor. D no effect The inhibitor molecule does not bind to the active site; it binds to a site on another part of the enzyme.
1 marks
Answer: A
This question in 9700/13 May/June 2025
Q175 · An investigation was carried out to see if compound X could improve the thermostability… 9700/14 May/June 2025
14 An investigation was carried out to see if compound X could improve the thermostability of an
enzyme. Thermostable enzymes will function well at high temperatures.
The results of the investigation are shown.
120
100
80
enzyme ‘ xperiment 2
activity 60 experiment 1——--*s without compound -X
I% with compound XC
40
©
20 ‘
@) =
10 20 30 40 50 60 70
temperature /°C
Which row is correct?
compound X makes the
enzyme more
thermostable
at 40°C in experiment 1
most of the enzyme
active sites will no longer
be complementary to the
at 45°C in experiment 2
approximately half of the
enzymes are forming
enzyme-—substrate
substrate complexes
A Jv x x
B Jv v x
Cc x v v
D x x v
key
¥ = correct
X = not correct
1 marks
Answer: C
This question in 9700/14 May/June 2025
Q176 · The table shows the results from an investigation into the effect of temperature on an… 9700/14 May/June 2025
15 The table shows the results from an investigation into the effect of temperature on an enzyme-catalysed reaction. All other variables were standardised. rate of reaction temperature / C / arbitrary units 10 3 20 7 30 16 40 33 50 32 60 14 What is the correct conclusion? A 40 C was the optimum temperature. B The data for 50 C was anomalous. C The optimum temperature was between 30 C and 50 C. D All the enzymes denatured at 60 °C.
1 marks
Answer: C
This question in 9700/14 May/June 2025
Q177 · The graph shows how the rate of a reaction changes with substrate concentration in the… 9700/14 May/June 2025
16 The graph shows how the rate of a reaction changes with substrate concentration in the presence of: no inhibitor inhibitor X inhibitor Y. One of the inhibitors is competitive and the other inhibitor is non-competitive. 0.006 0.005 no enzyme inhibitor no enzyme inhibitor no enzyme inhibitor 0.004 with inhibitor X with inhibitor X with inhibitor X rate of reaction 0.003 / mol dm–3 s–1 0.002 with inhibitor Y with inhibitor Y with inhibitor Y 0.001 0 0 0.1 0.2 0.3 0.4 0.5 0.6 0.7 substrate concentration / mol dm–3 What is the correct estimate of Km for the reaction shown when a competitive inhibitor is present? A 0.11 mol dm–3 B 0.23 mol dm–3 C 0.38 mol dm–3 D 0.65 mol dm–3
1 marks
Answer: B
This question in 9700/14 May/June 2025
Q178 · The graph shows the effect of substrate concentration on an enzyme-catalysed reaction… 9700/11 Oct/Nov 2025
12 The graph shows the effect of substrate concentration on an enzyme-catalysed reaction with and without a competitive inhibitor. rate of key reaction with inhibitor without inhibitor substrate concentration What is the effect of the competitive inhibitor on Vmax and Km? A Vmax decreases and Km decreases. B Vmax stays the same and Km decreases. C Vmax stays the same and Km increases. D Vmax decreases and Km stays the same.
1 marks
Answer: C
This question in 9700/11 Oct/Nov 2025
Q179 · The graph shows the results of an investigation into the effect of amylase on starch at… 9700/13 Oct/Nov 2025
16 The graph shows the results of an investigation into the effect of amylase on starch at three different temperatures. 50 °C 60 °C concentration of reducing sugar 70 °C 0 30 60 time / minutes Which statements are correct conclusions using these results? 1 The optimum temperature is 50 °C. 2 The initial rate of reaction is highest at 70 °C. 3 The higher the temperature the more quickly the enzyme denatures. A 1, 2 and 3 B 1 and 2 only C 1 and 3 only D 2 and 3 only
1 marks
Answer: D
This question in 9700/13 Oct/Nov 2025
Q180 · The rate of enzyme-catalysed reactions in human cells is regulated 9700/13 Oct/Nov 2025
17 The rate of enzyme-catalysed reactions in human cells is regulated. What may be involved in this regulation? 1 a change in enzyme concentration 2 a change in substrate concentration 3 inhibition by the final product of the reaction A 1, 2 and 3 B 1 and 2 only C 1 and 3 only D 2 and 3 only
1 marks
Answer: A
This question in 9700/13 Oct/Nov 2025
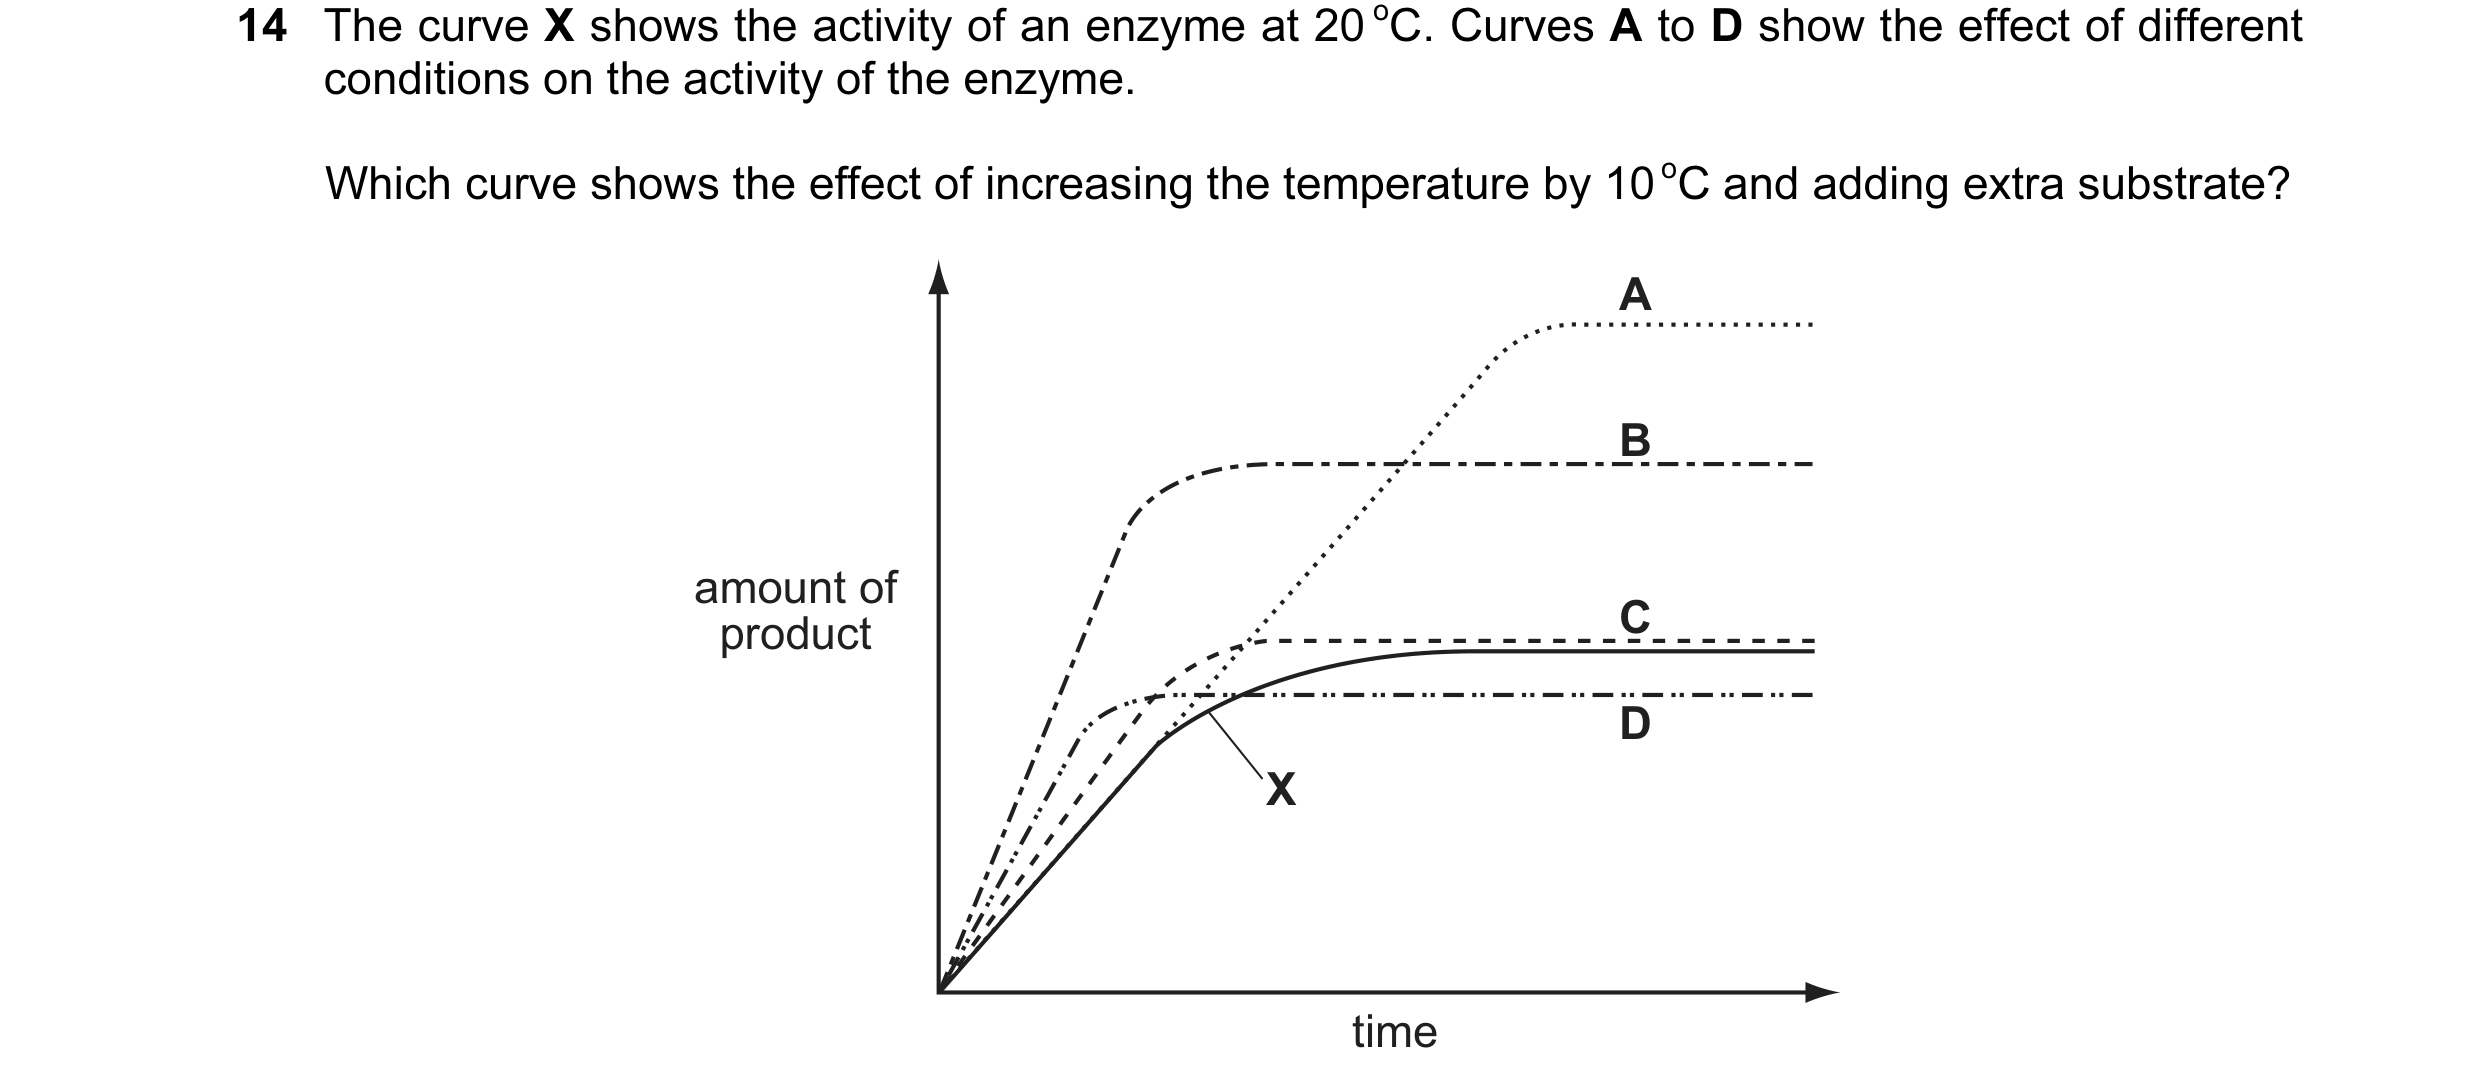
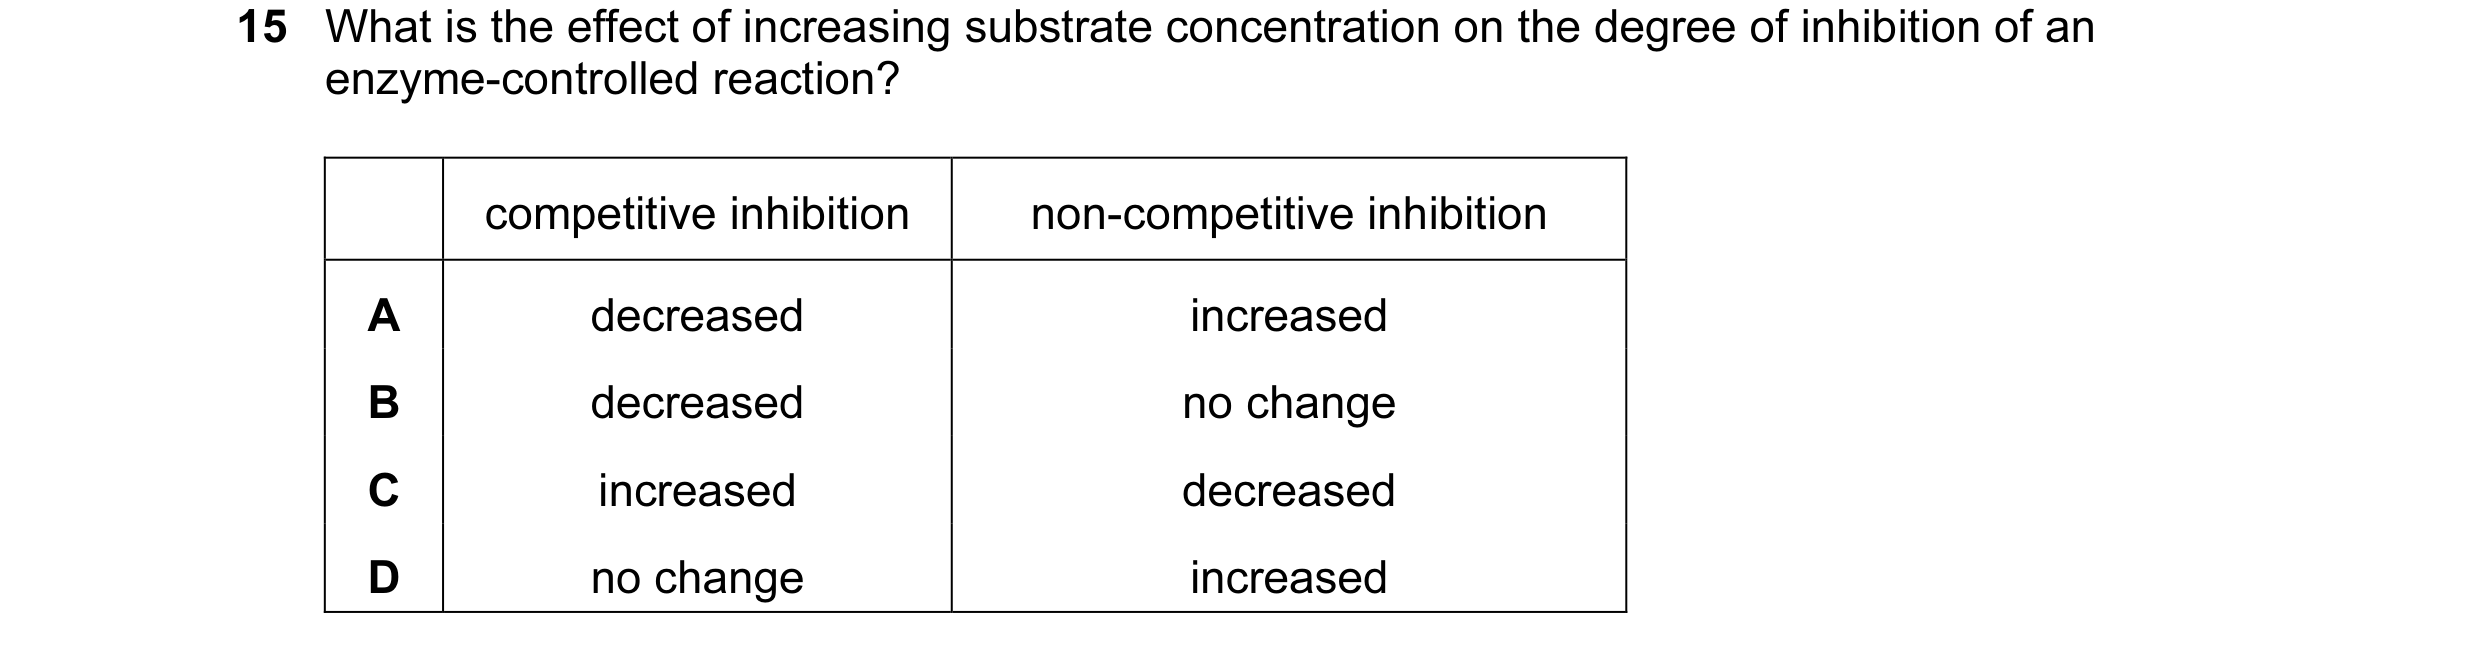
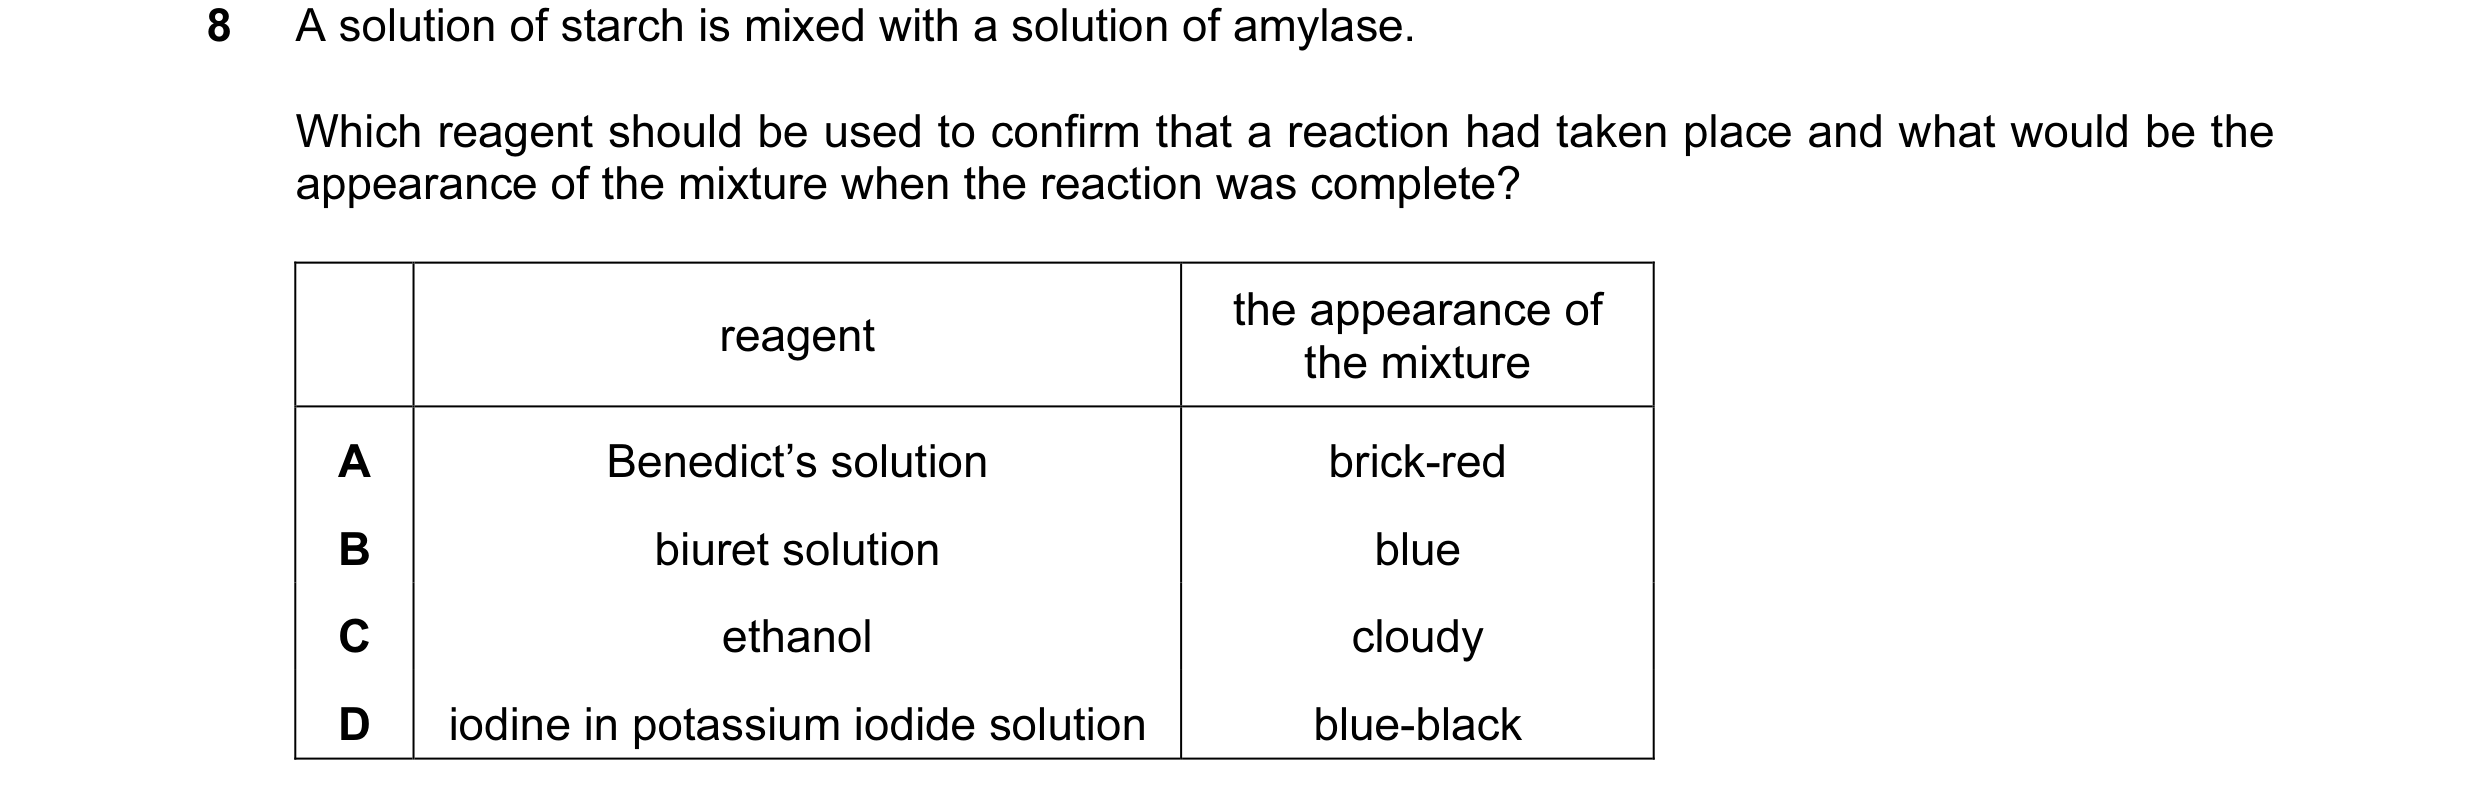 1 / 76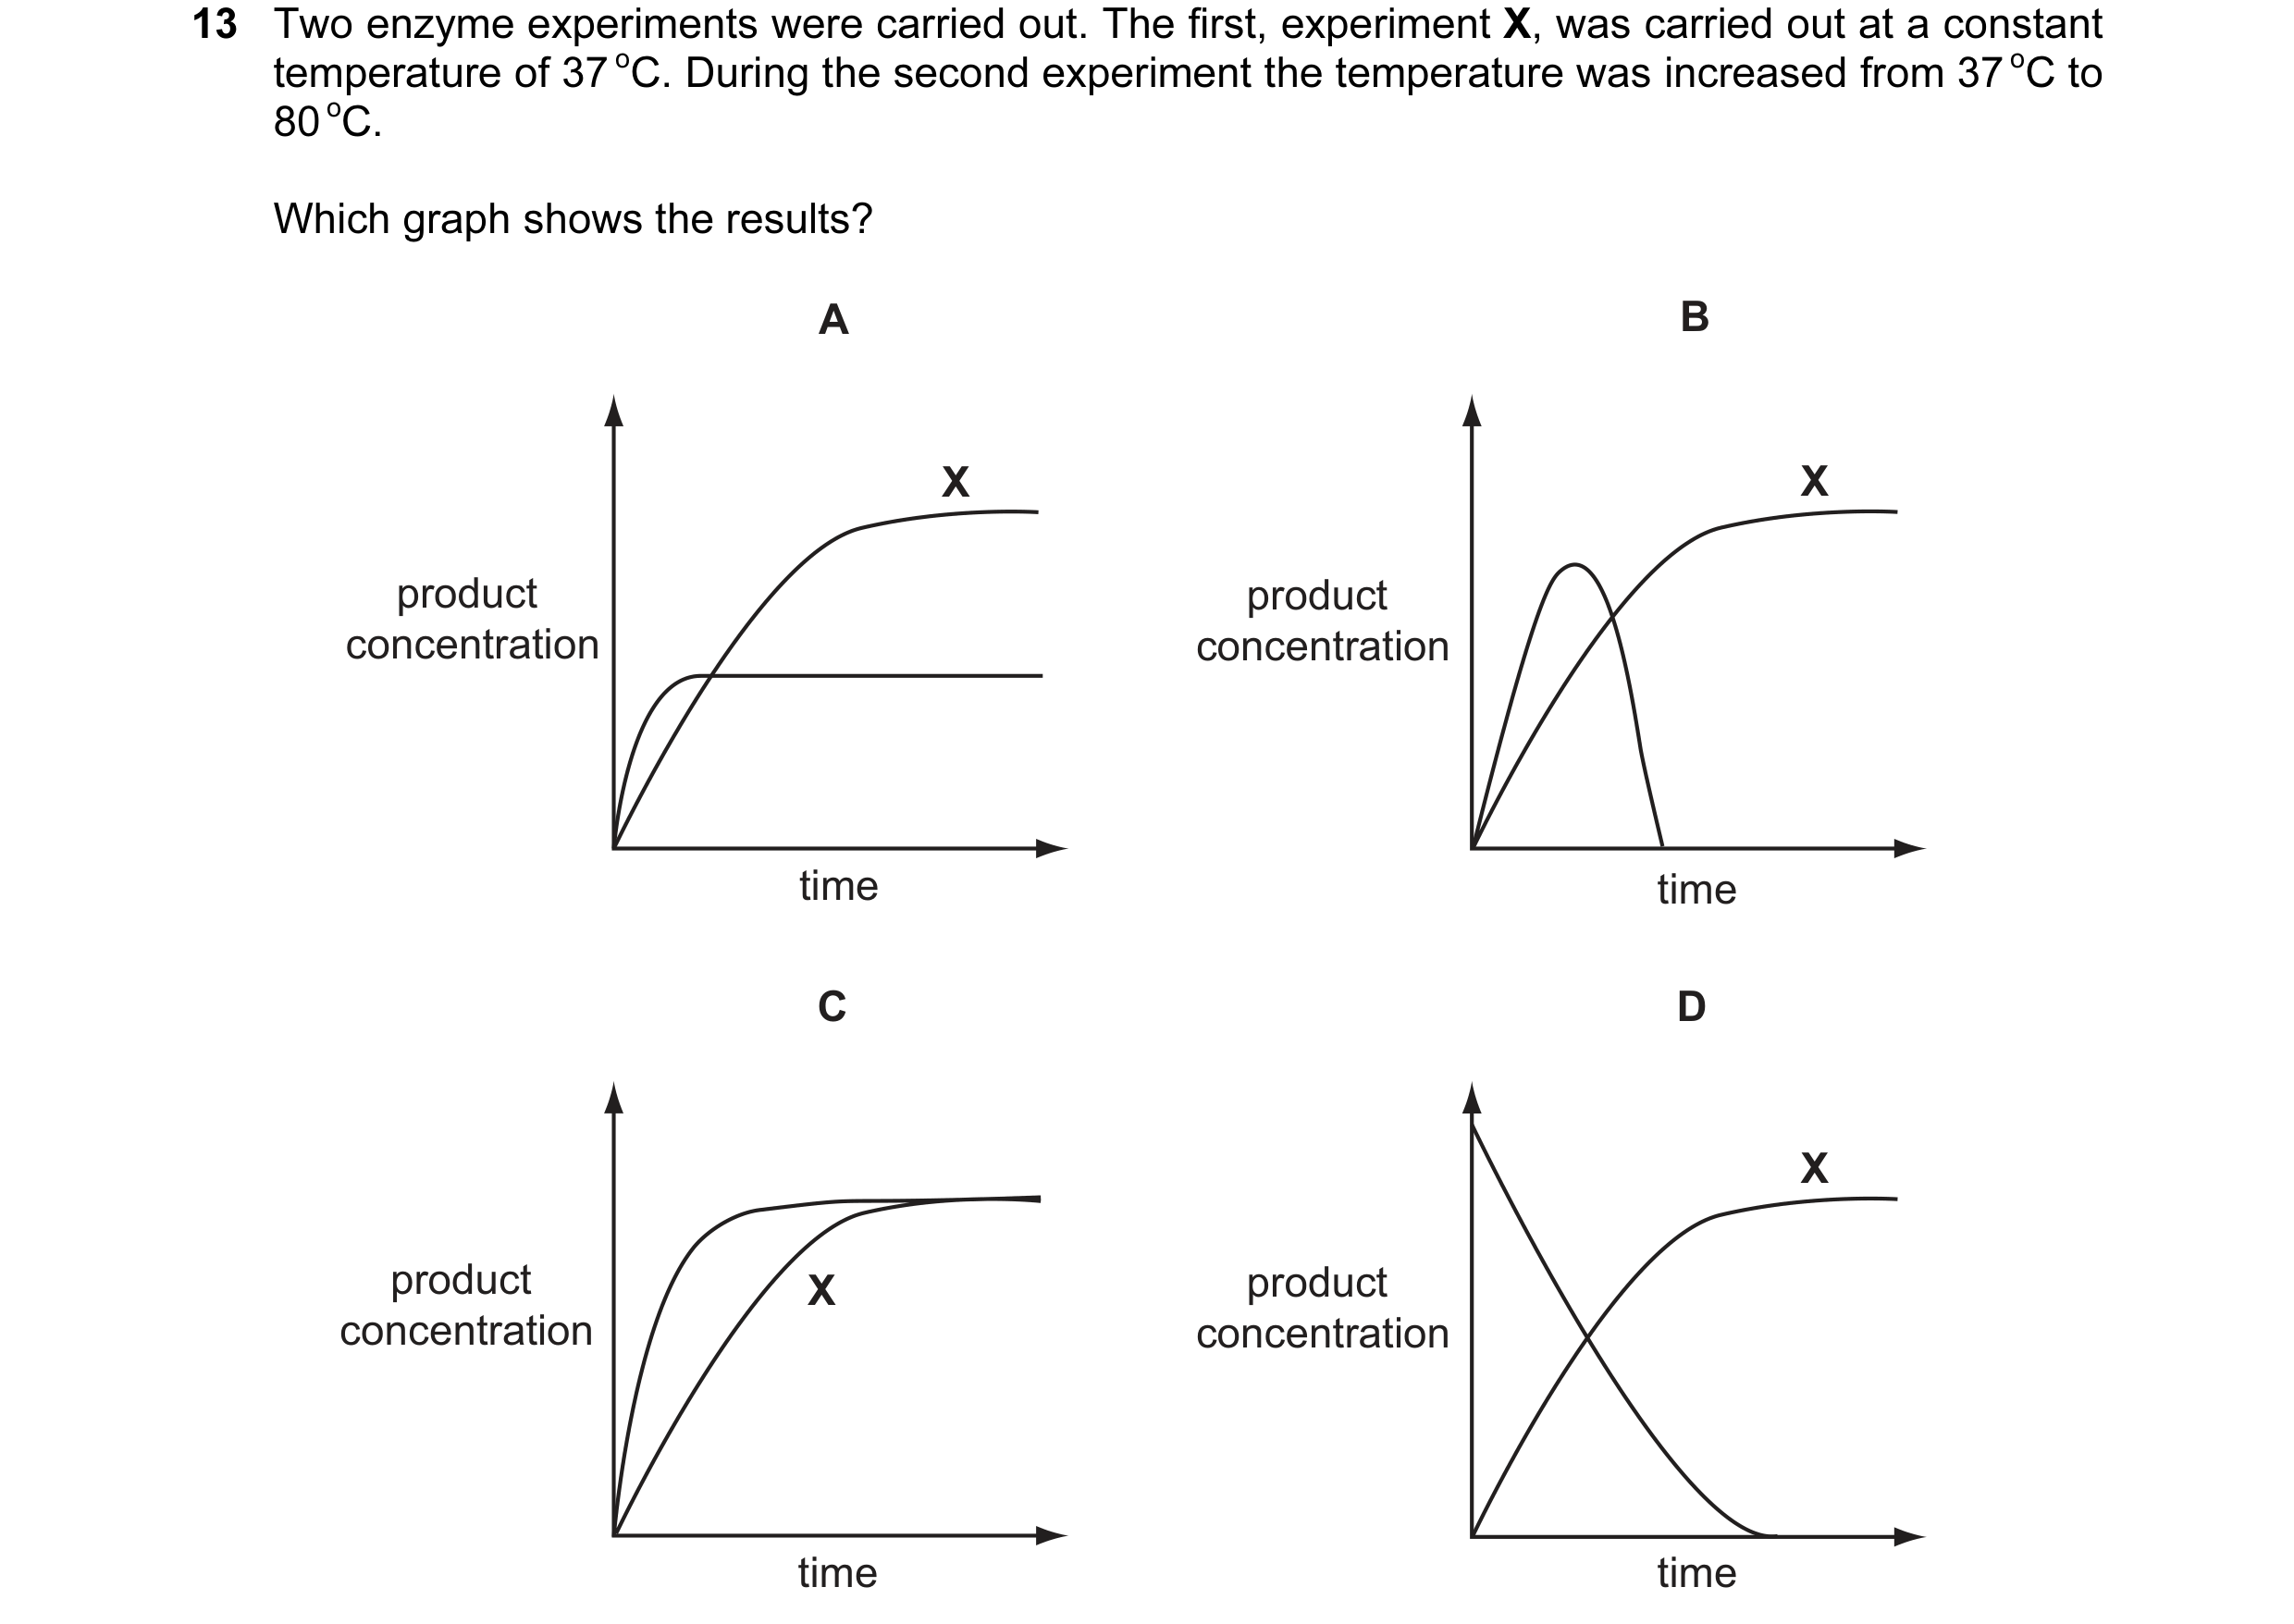
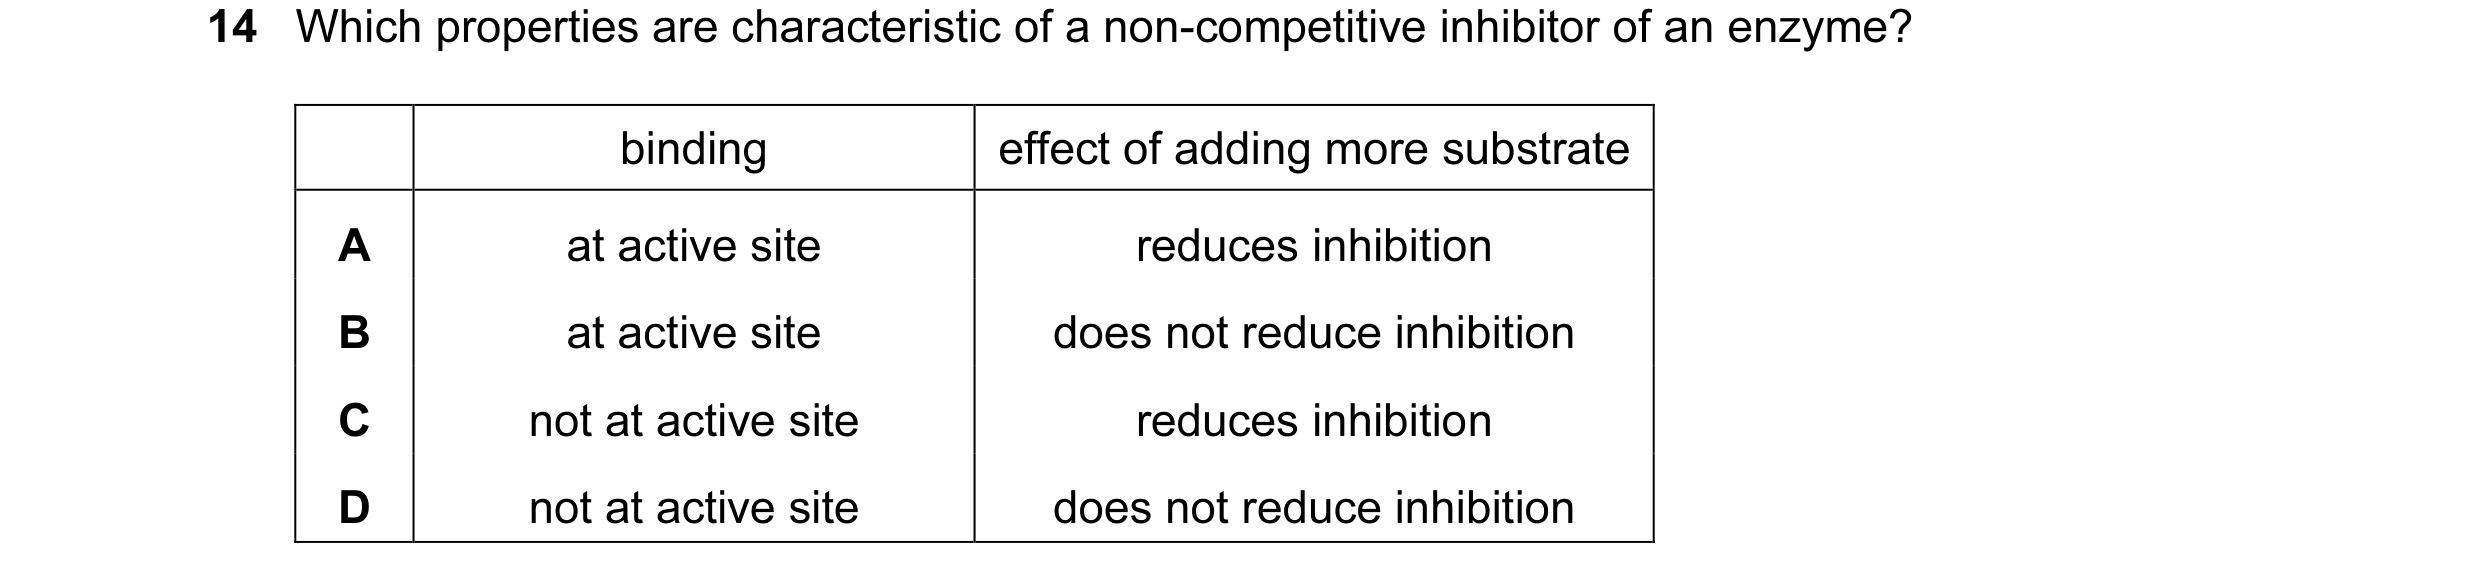
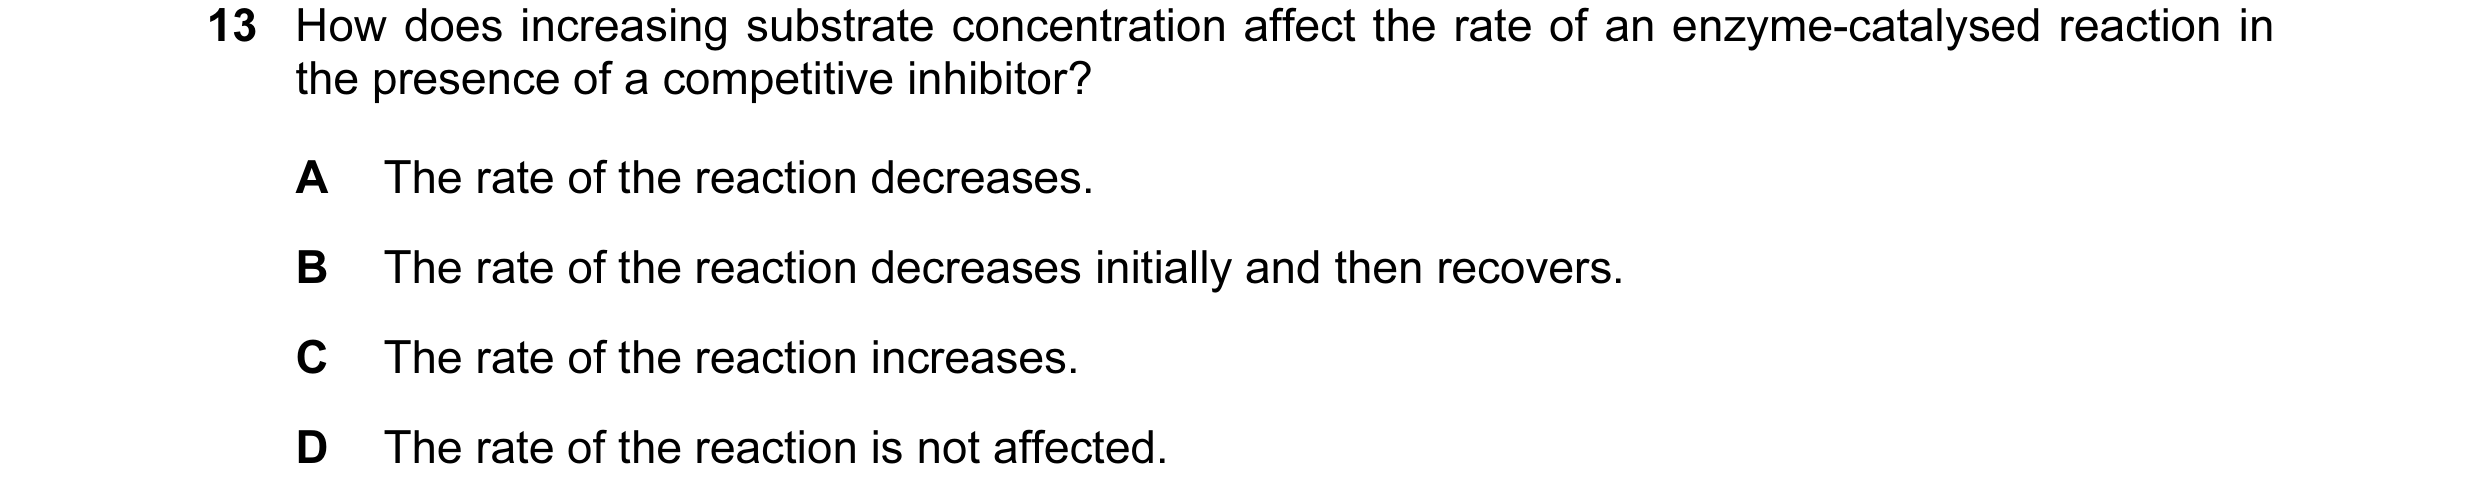 2 / 76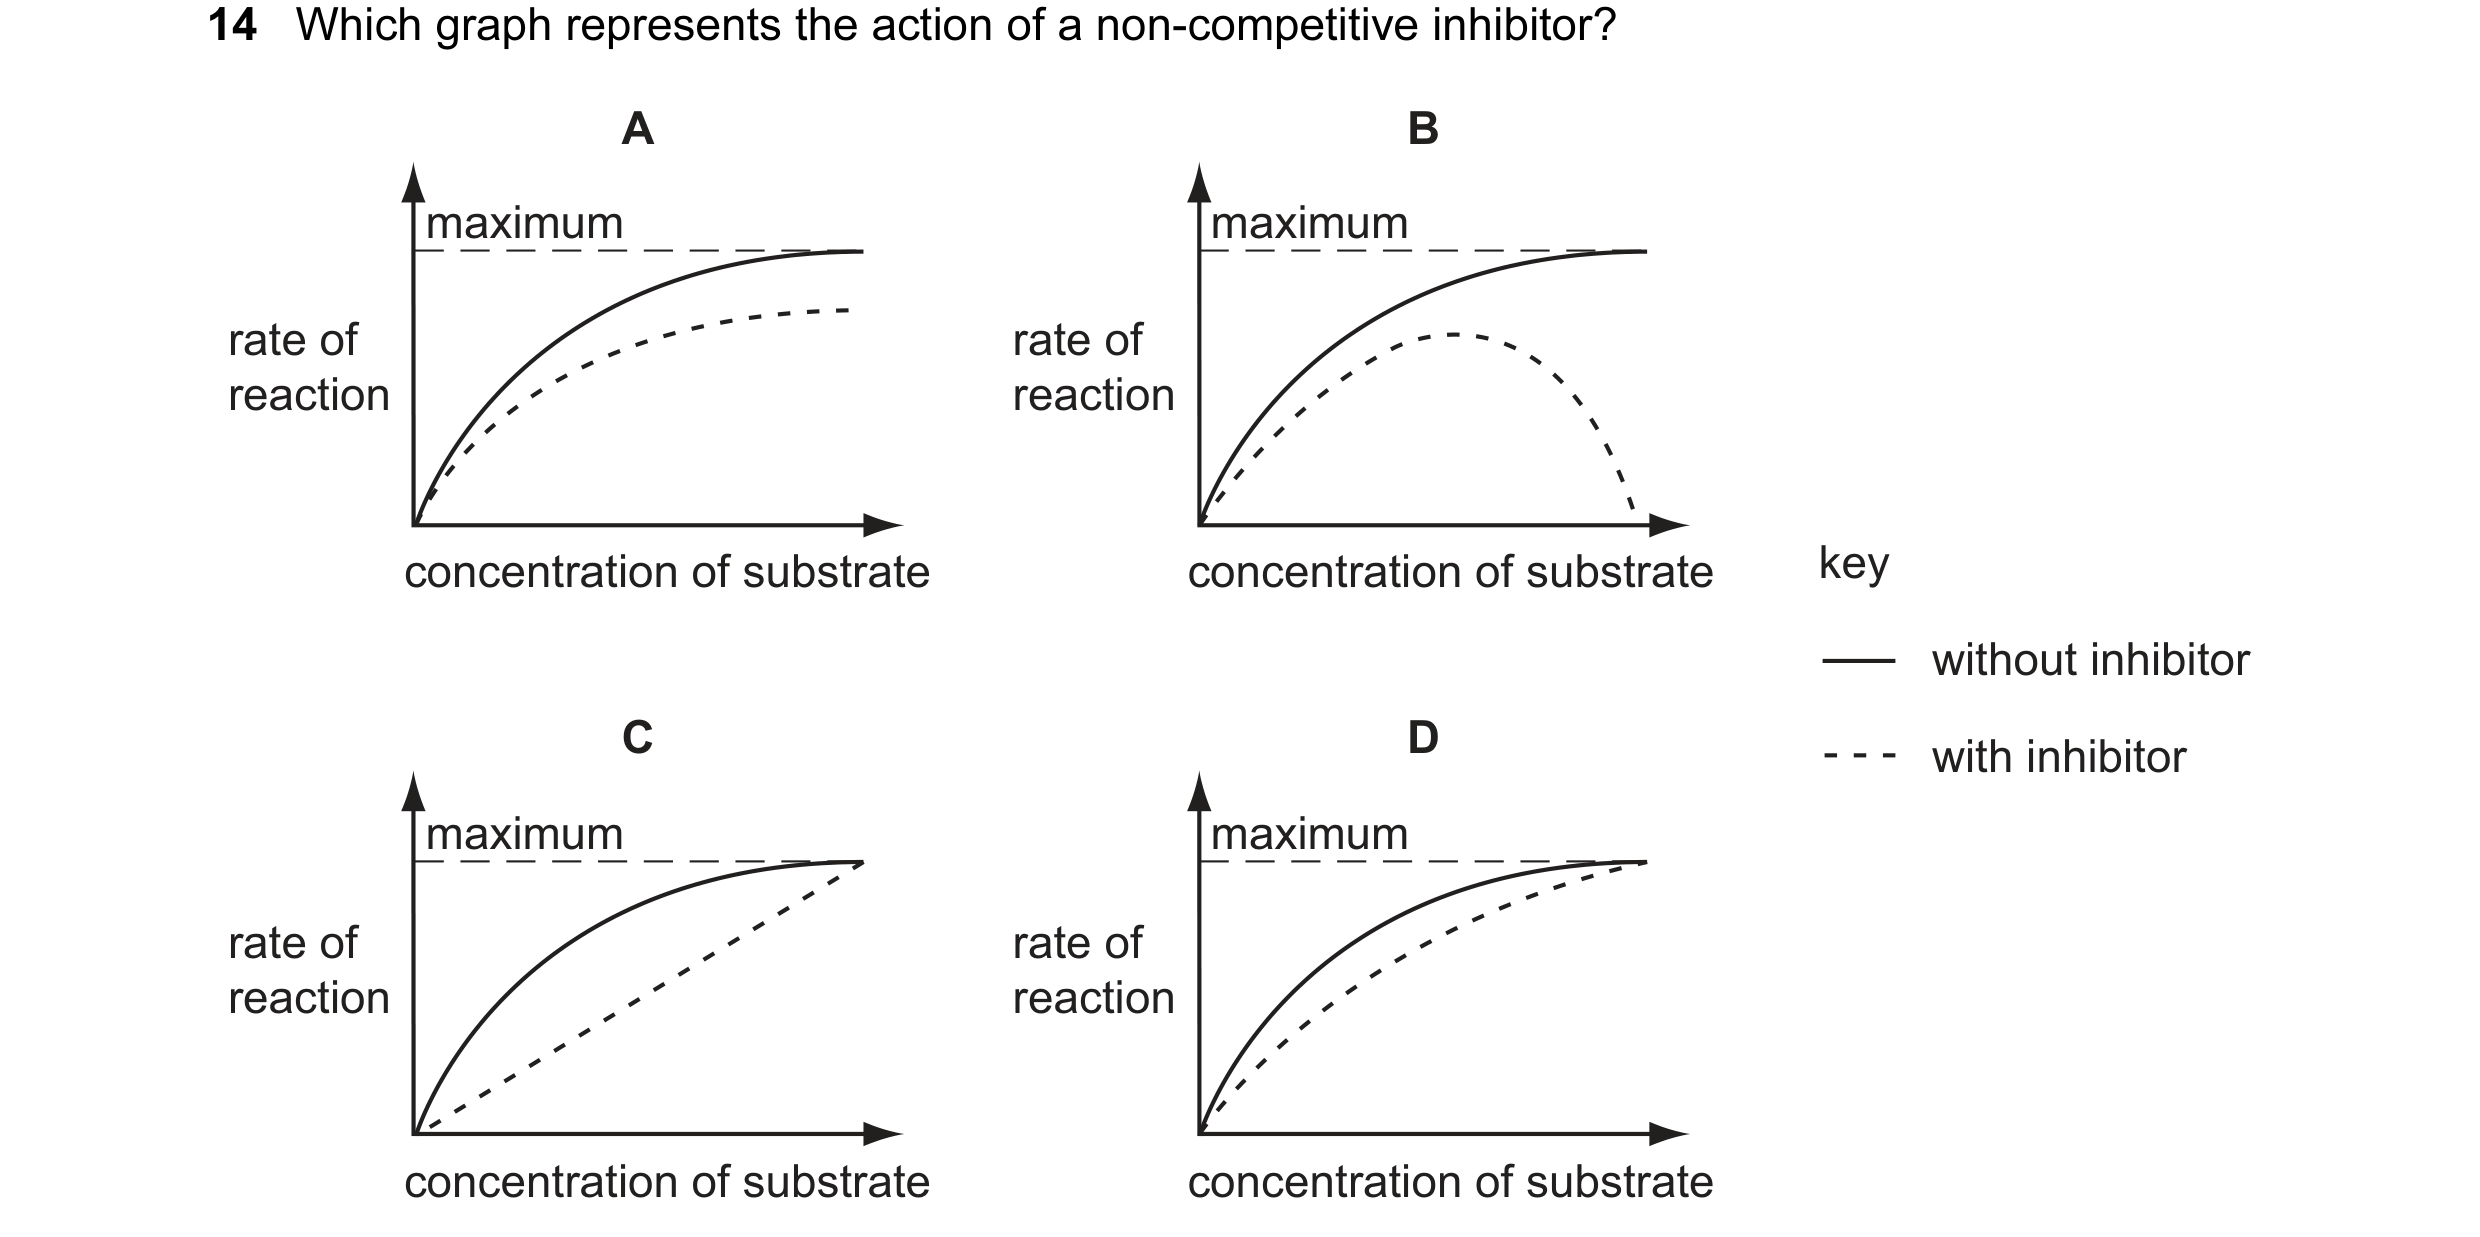

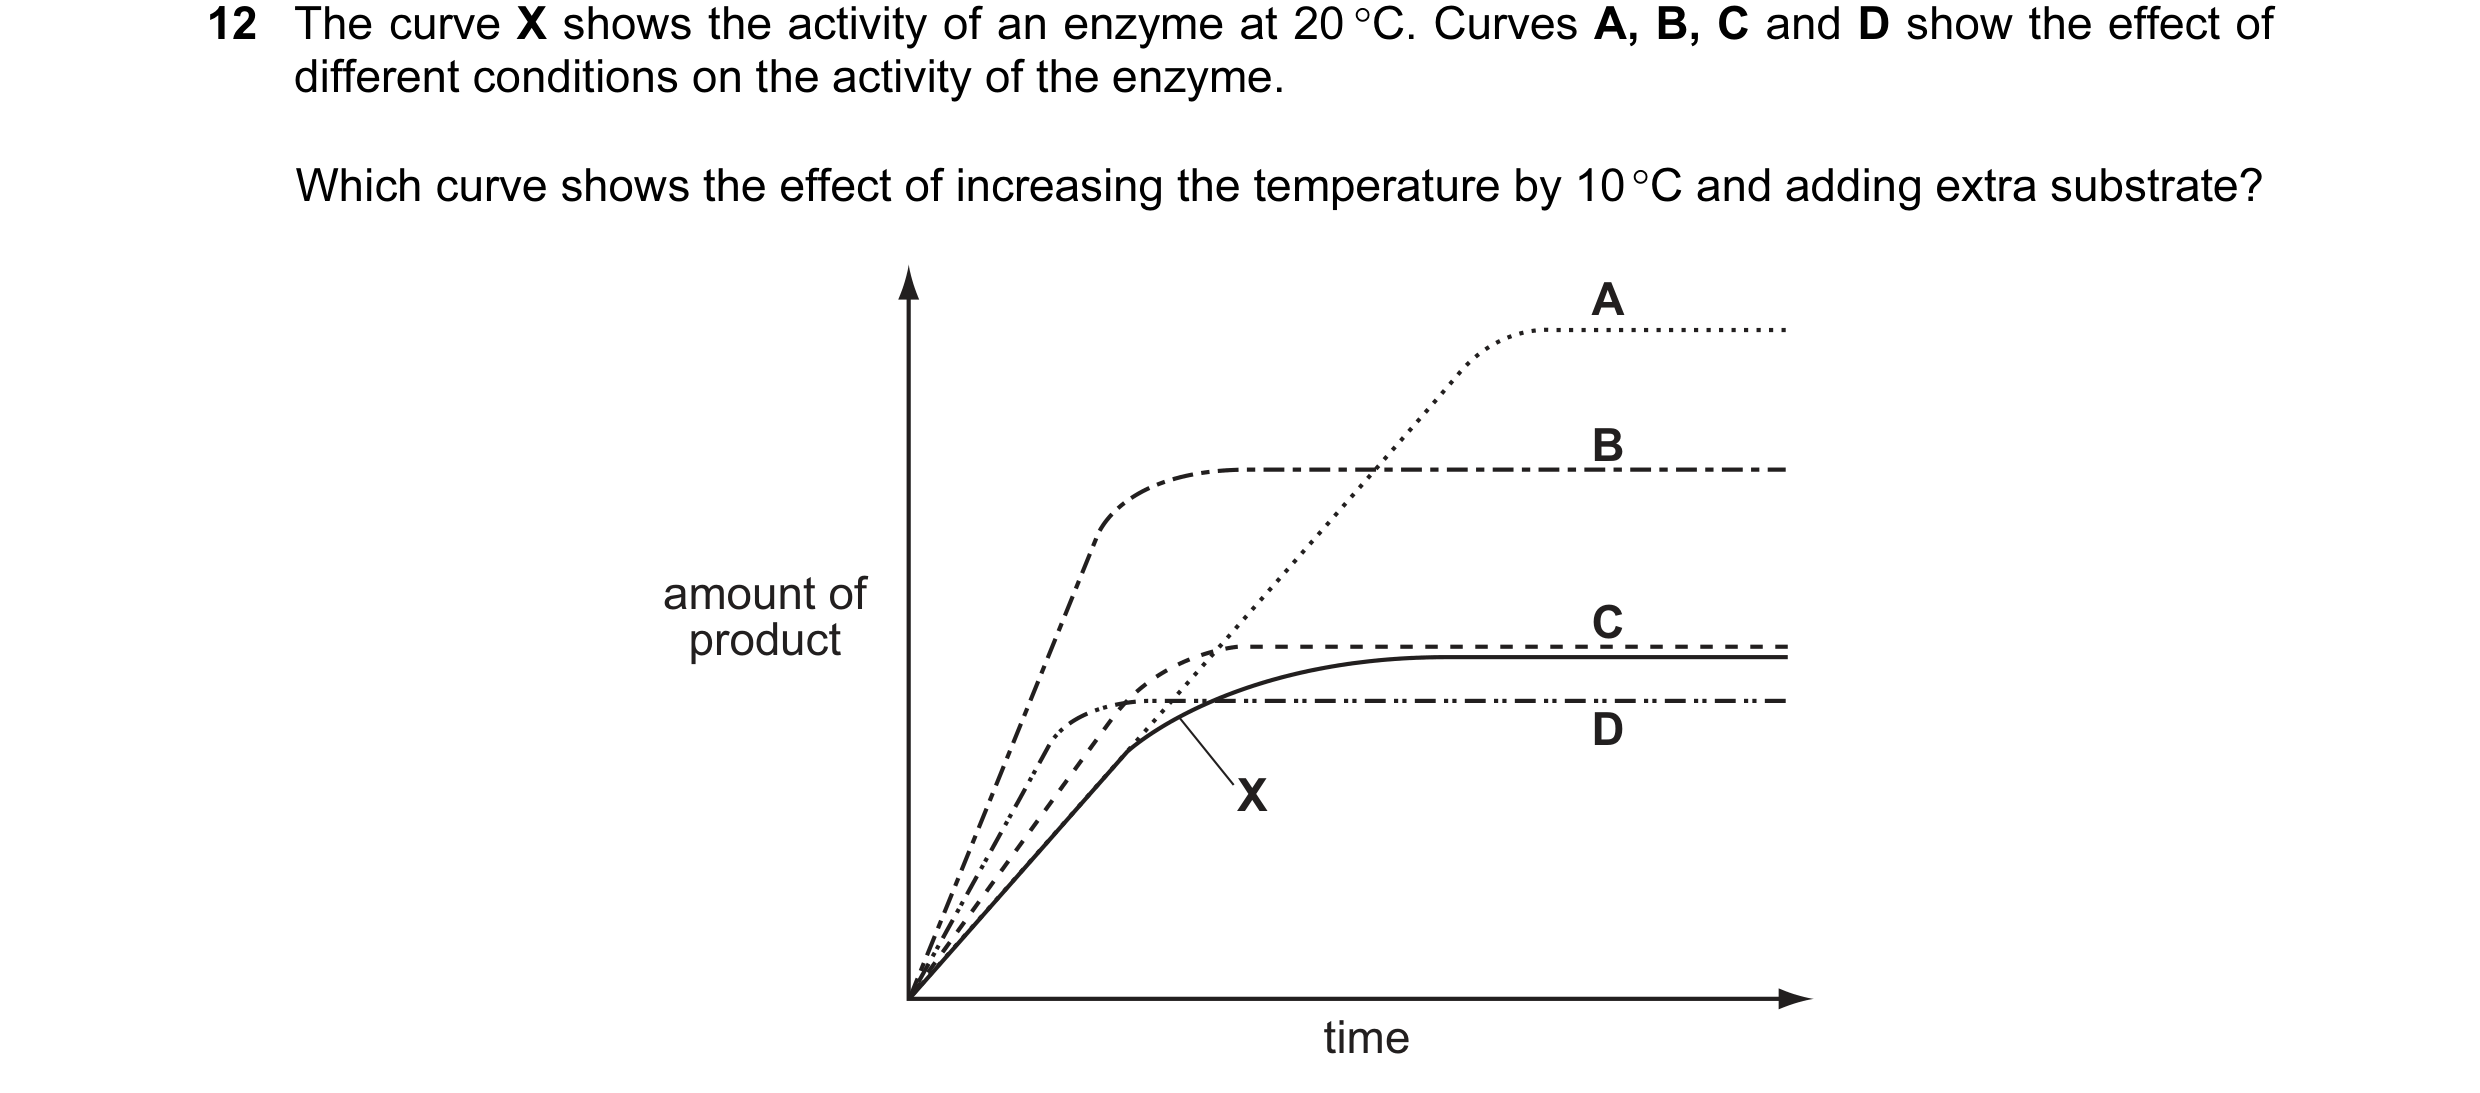 3 / 76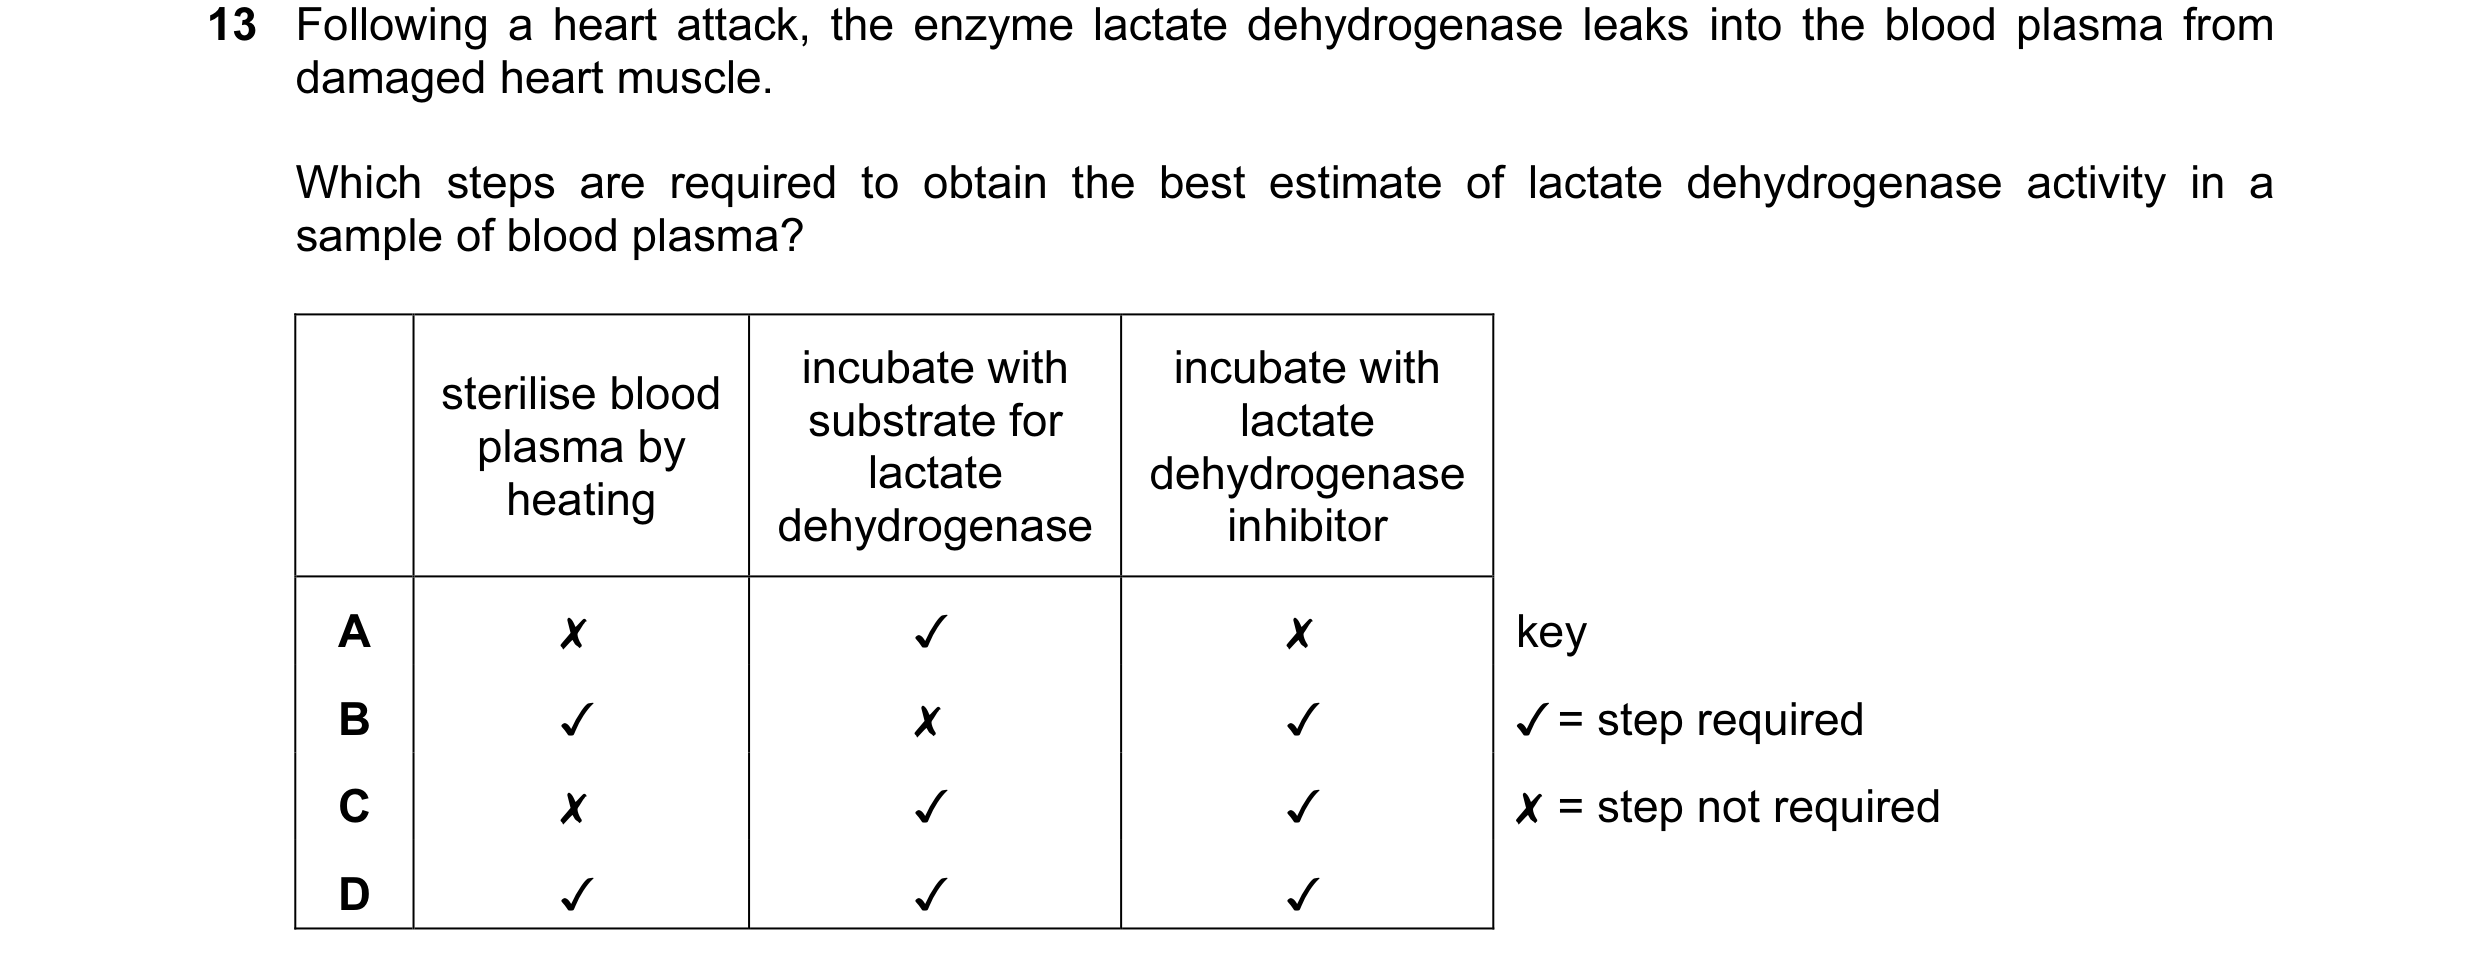
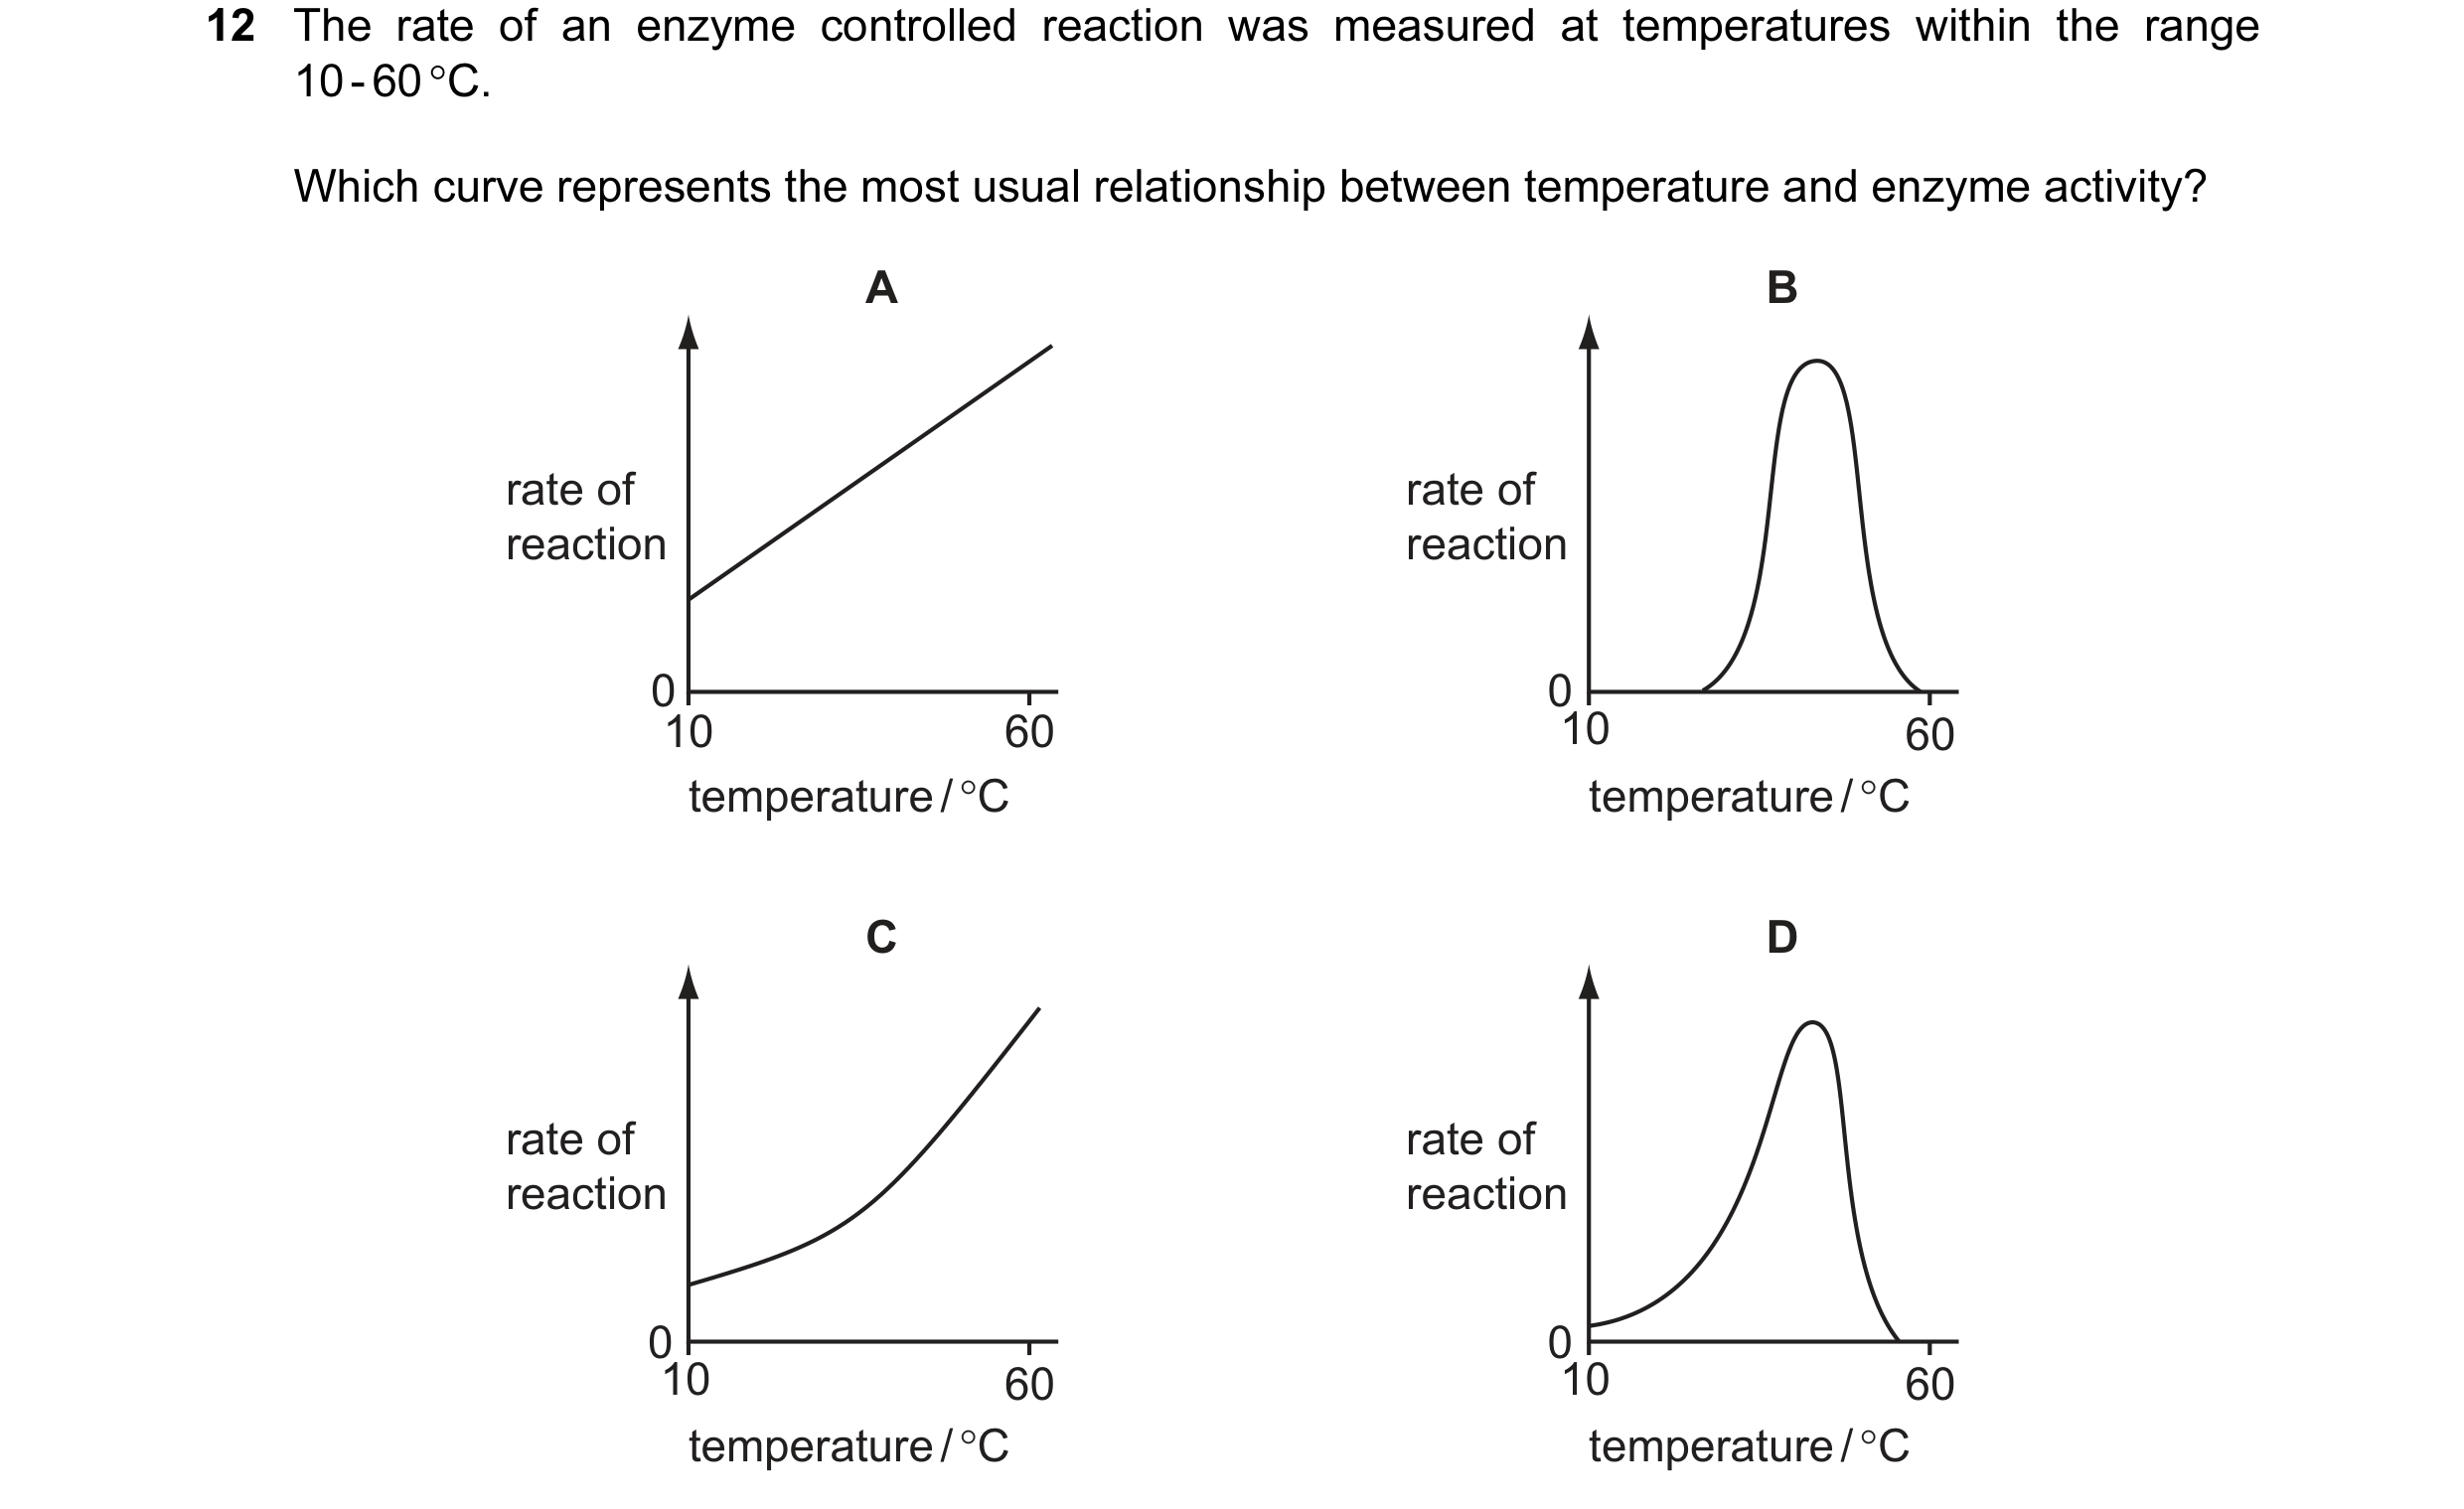 4 / 76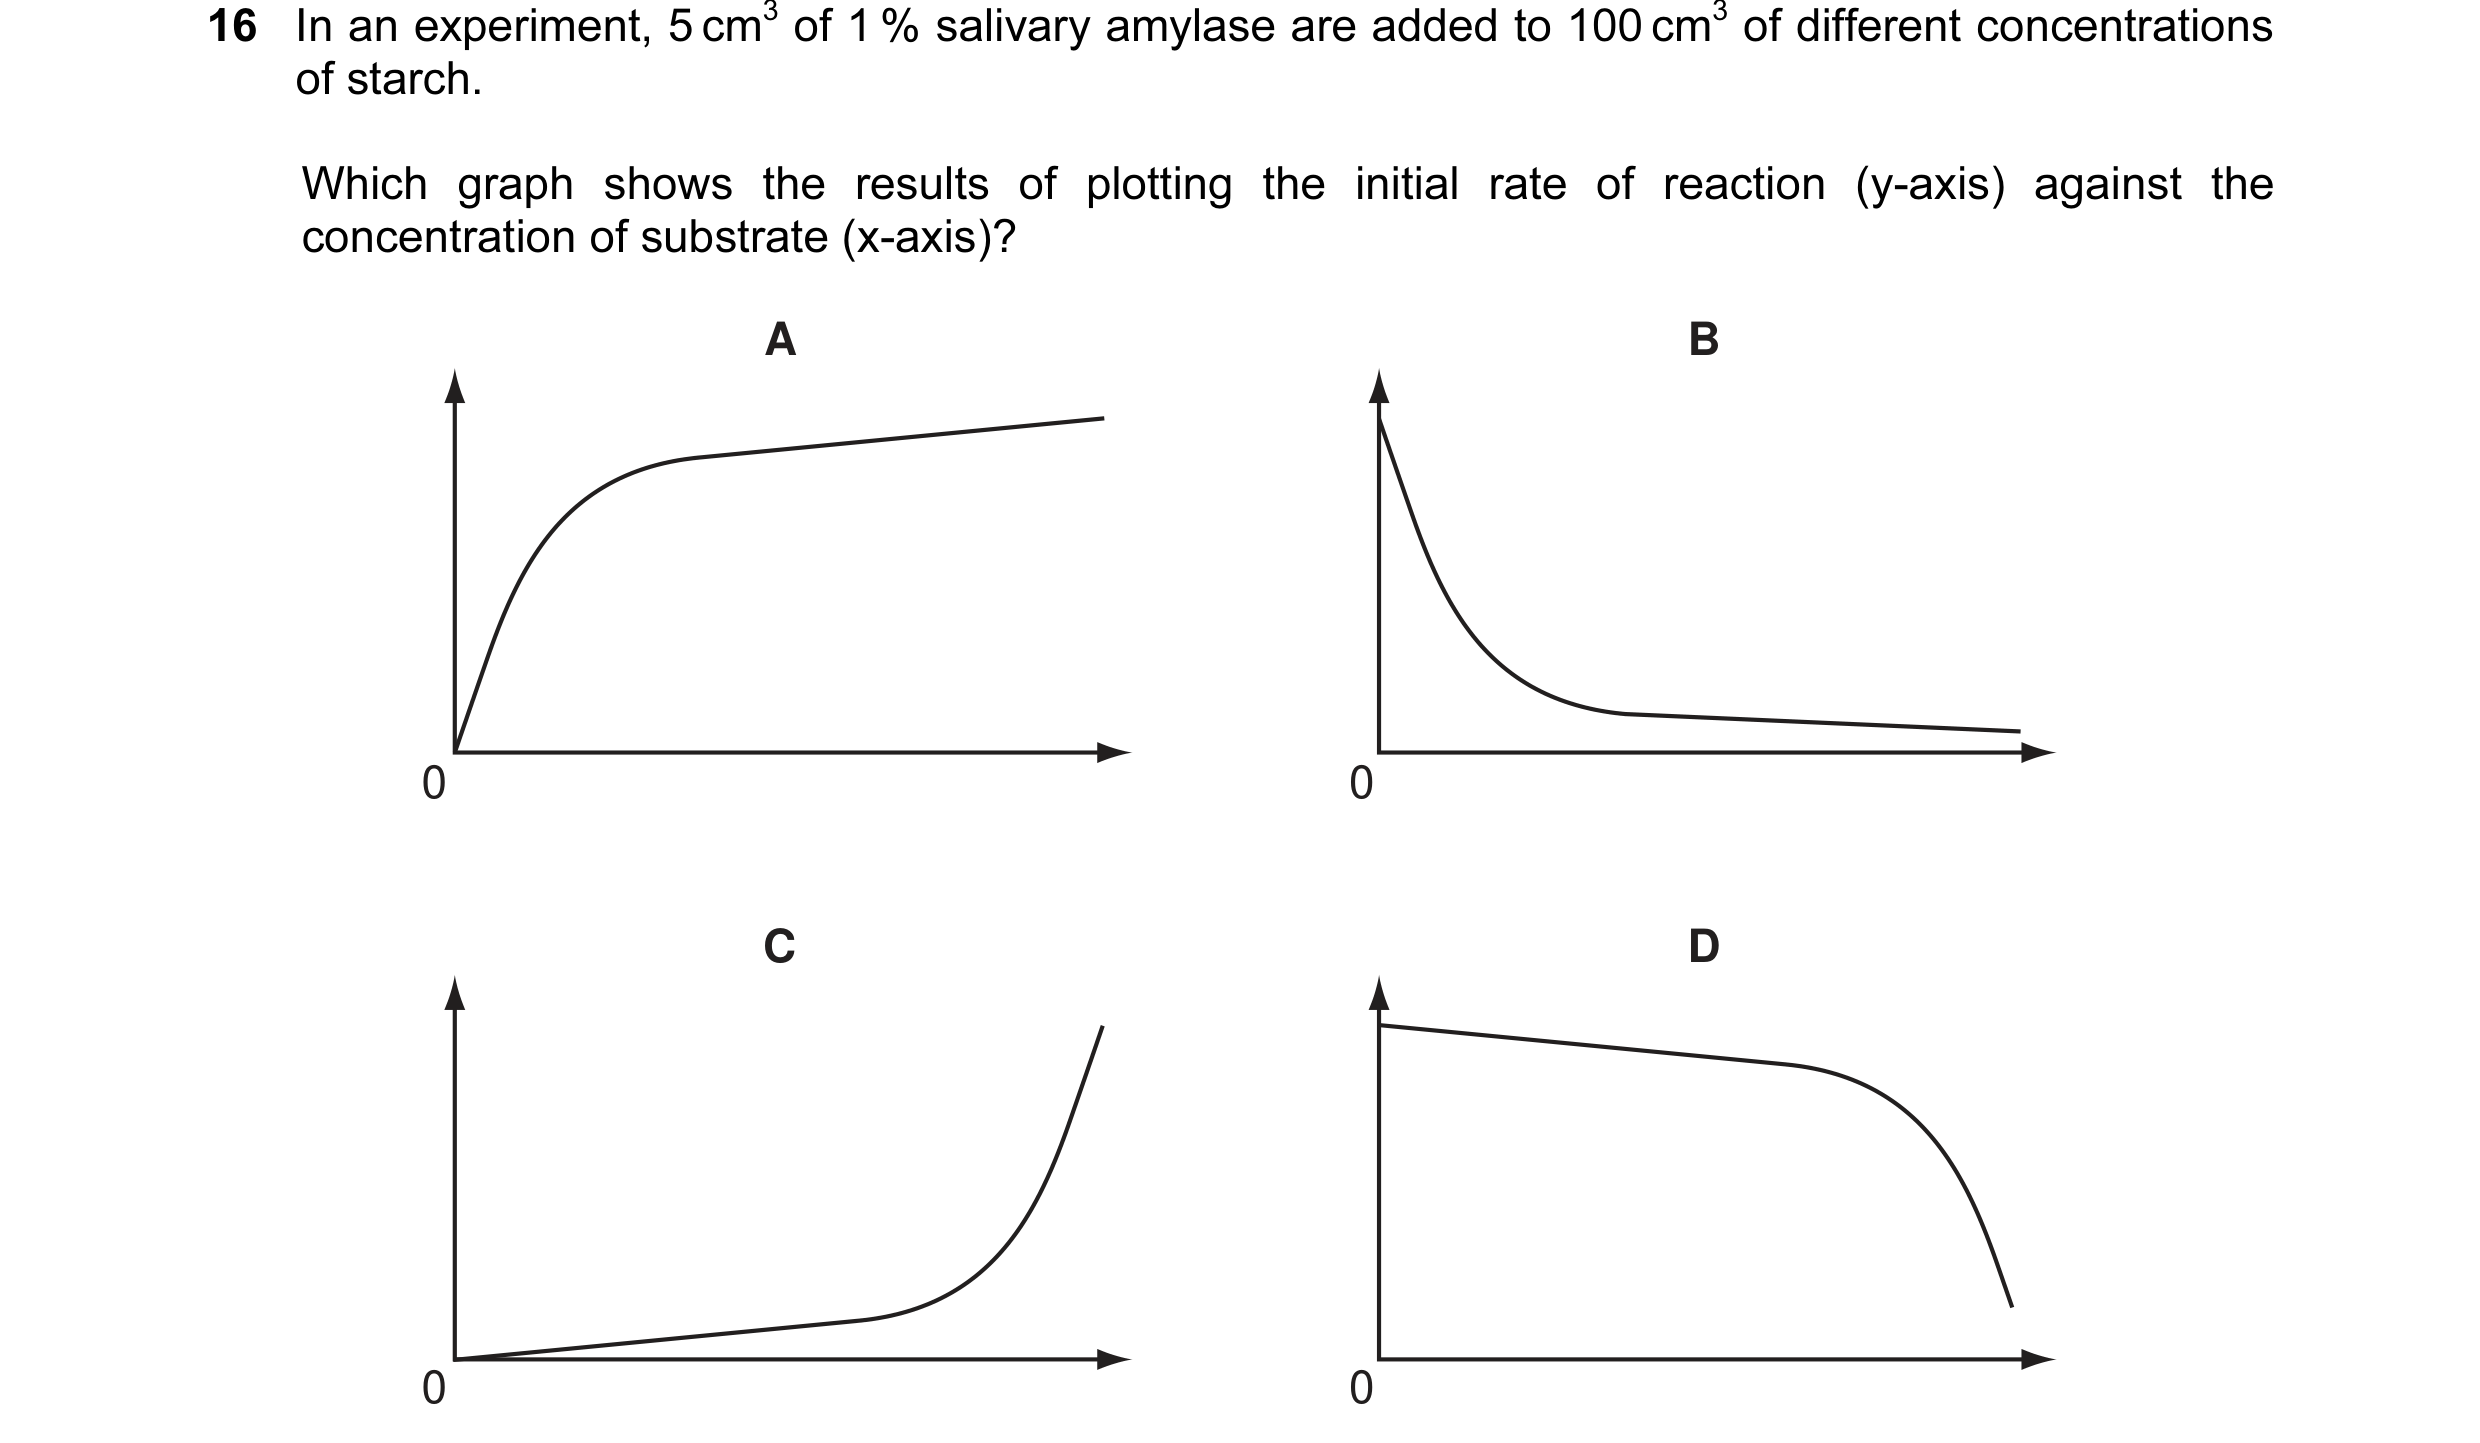
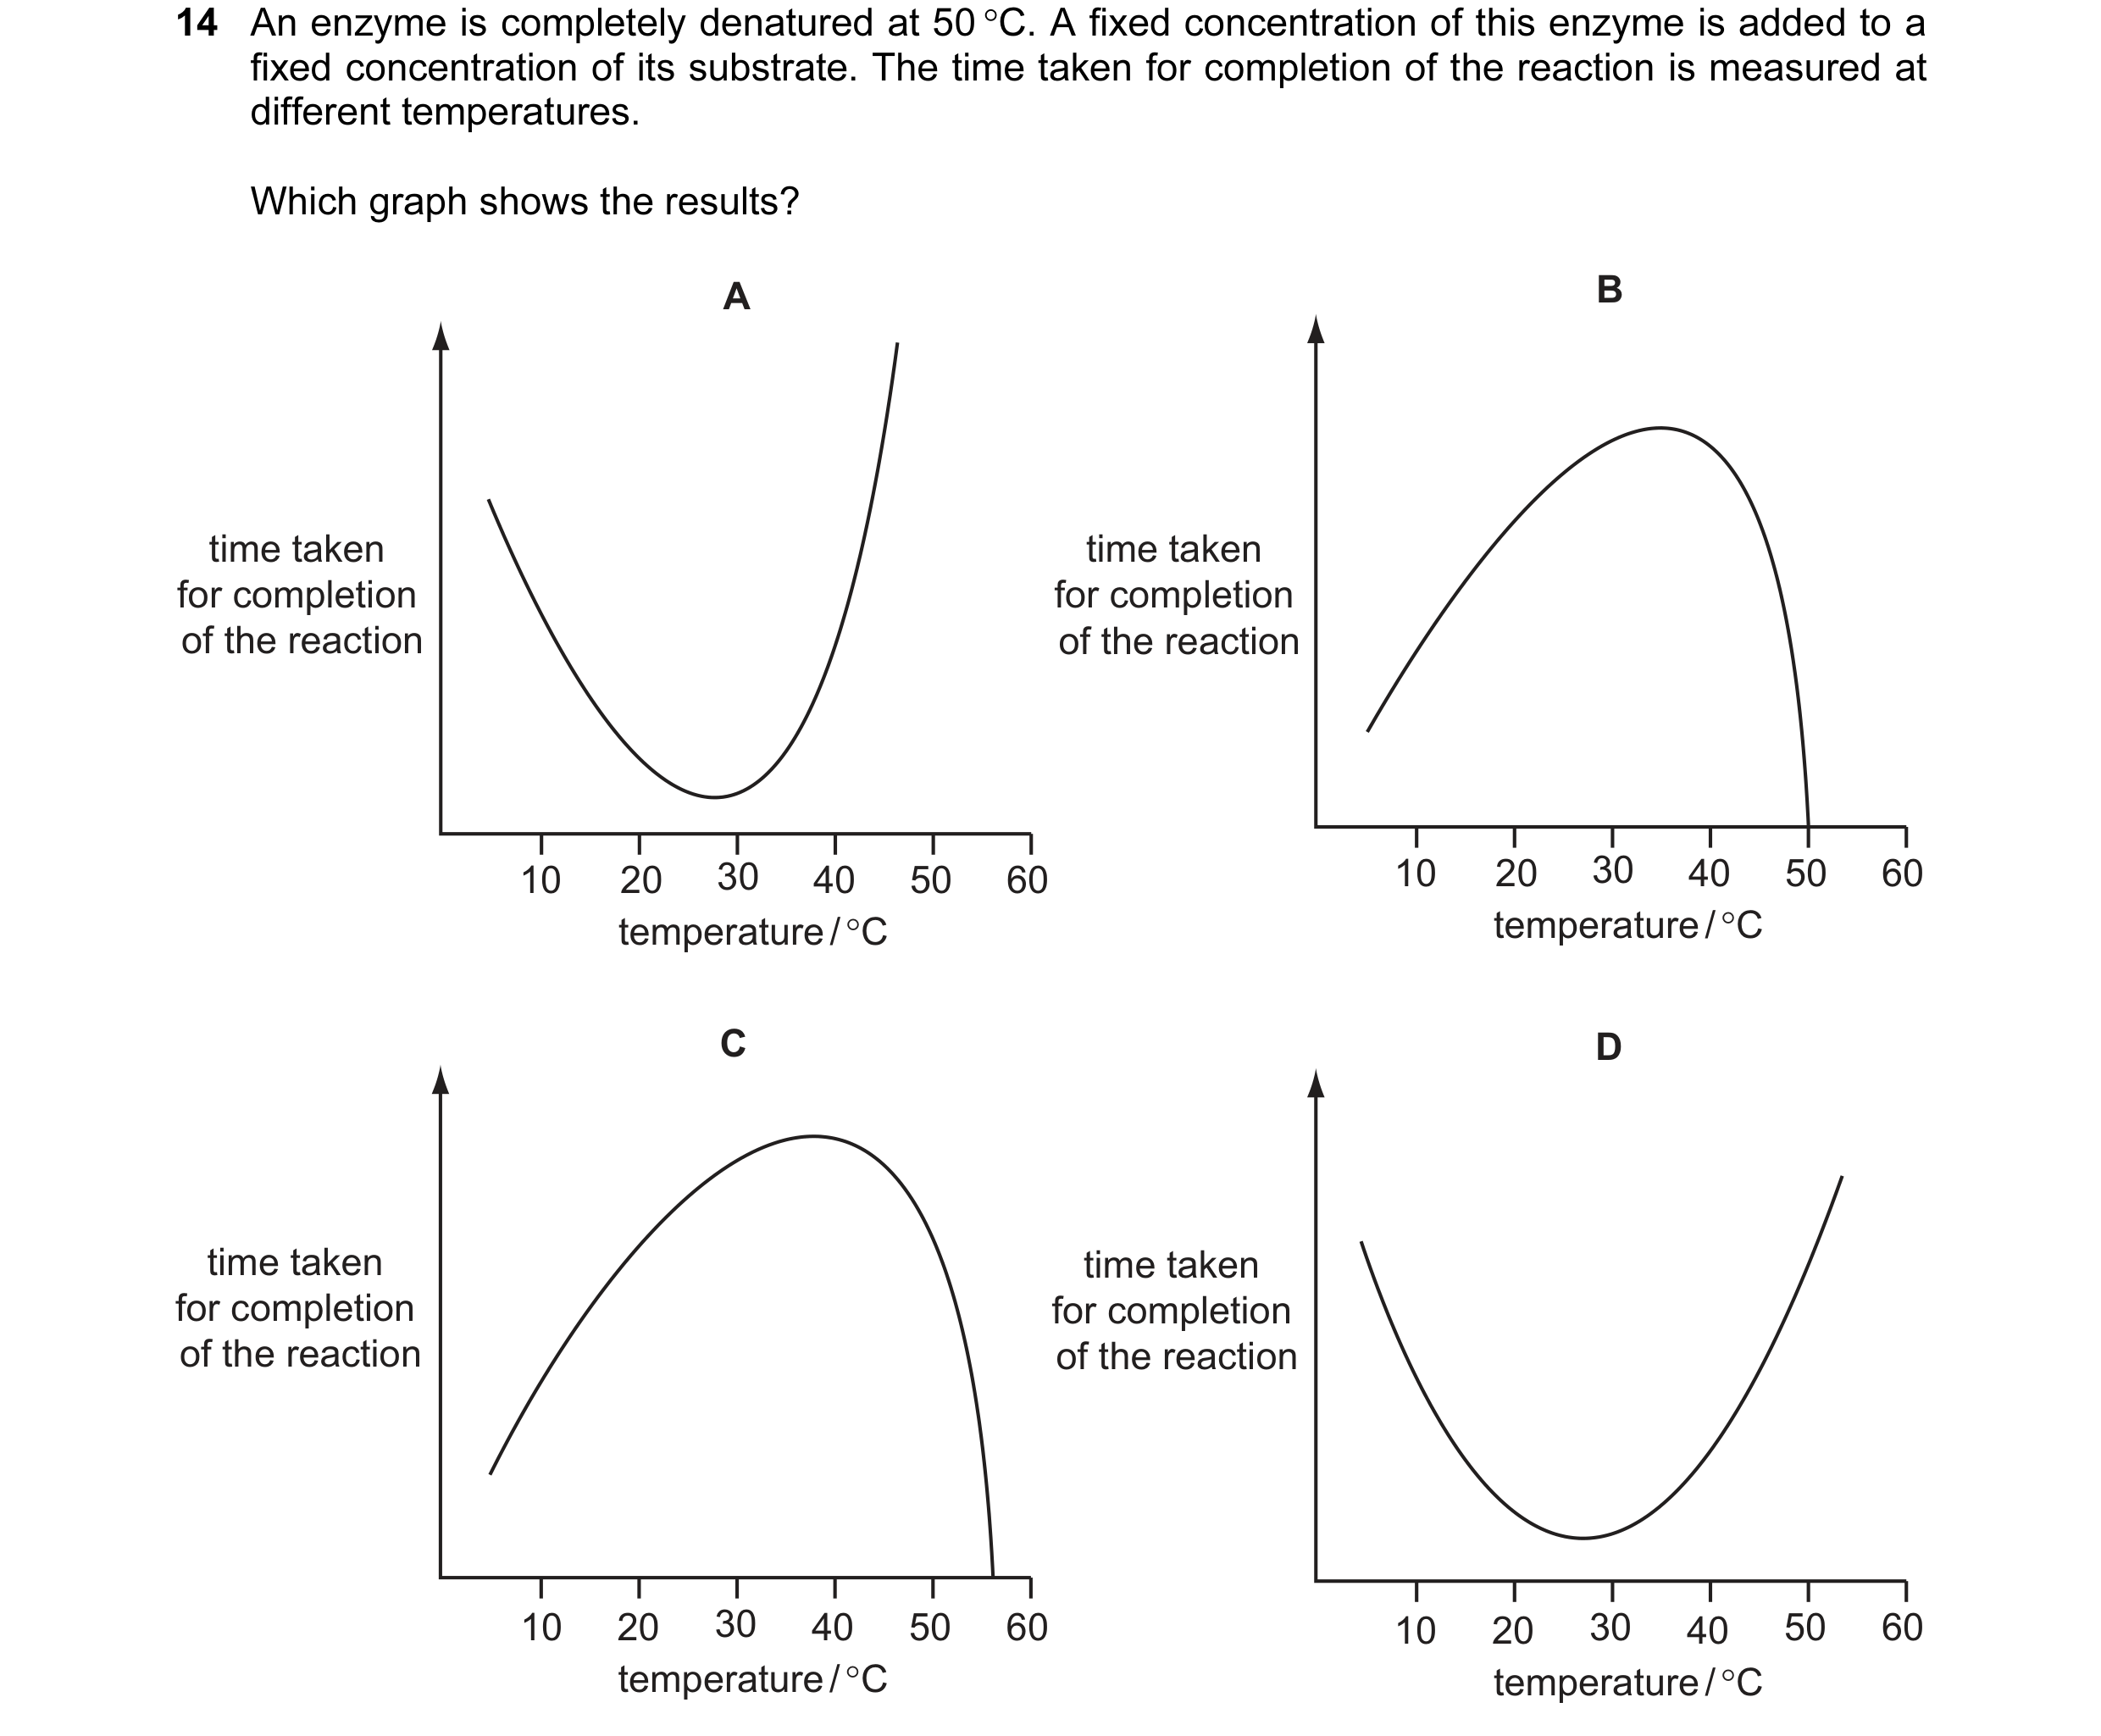 5 / 76
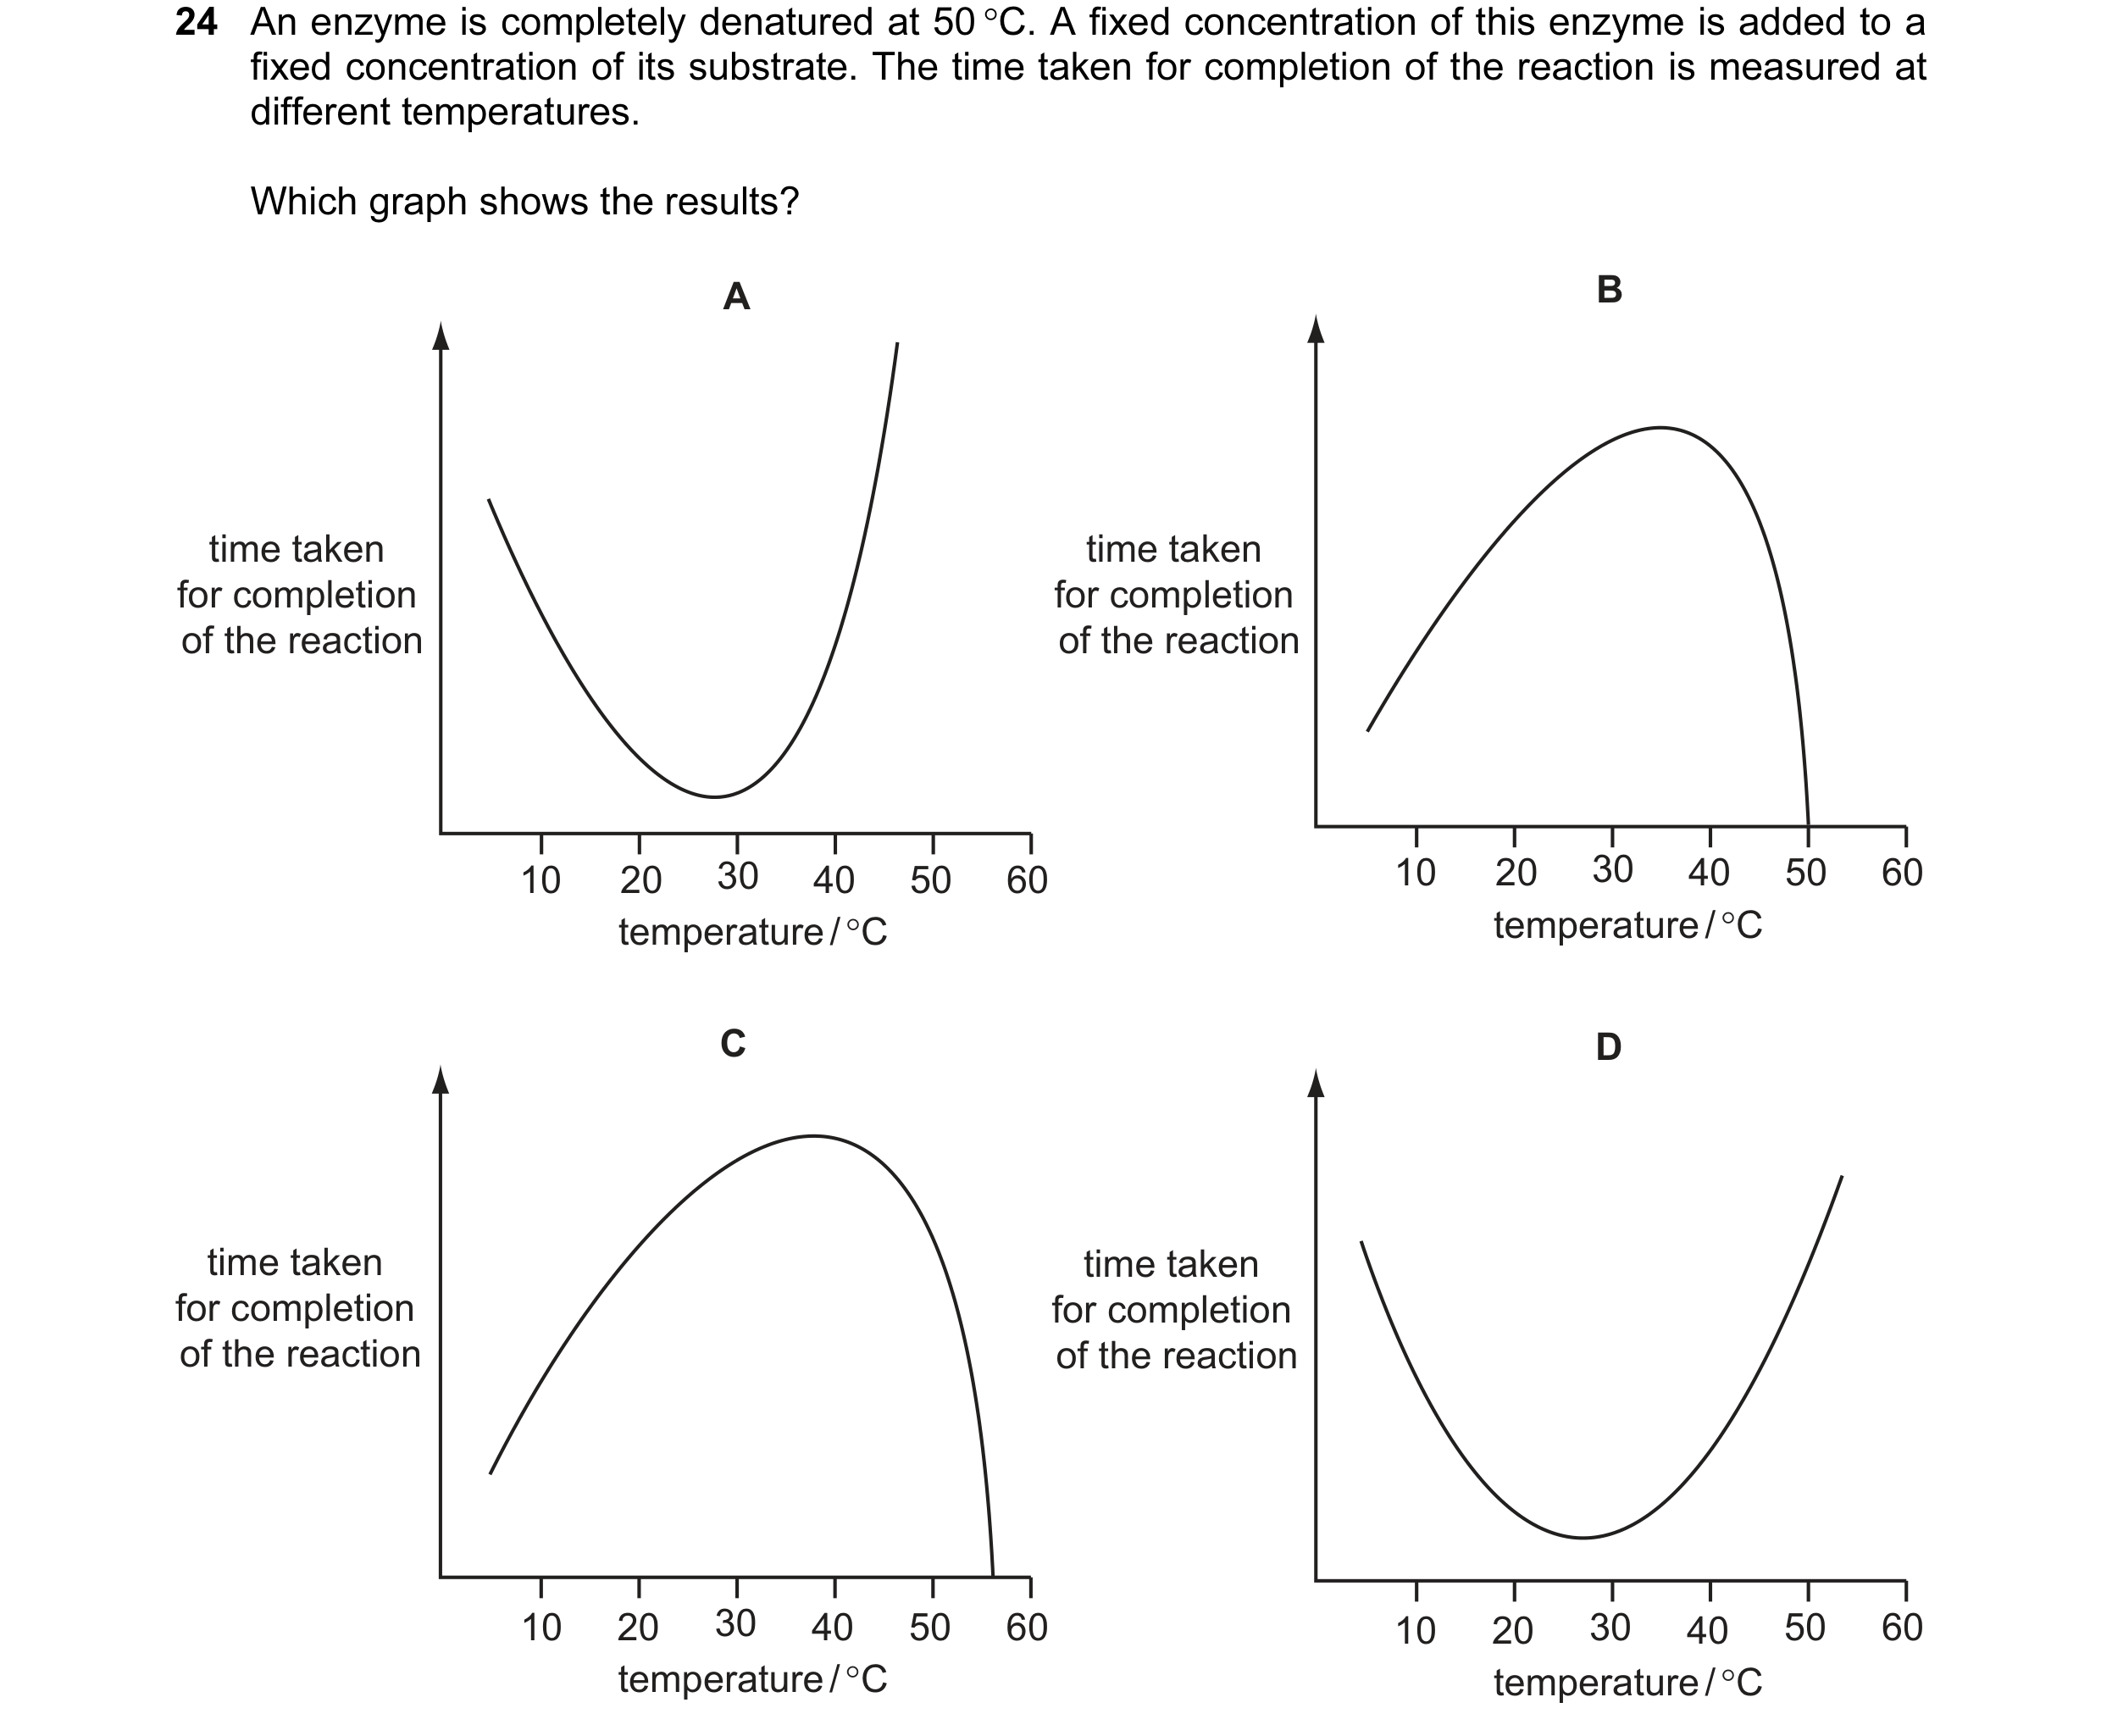 6 / 76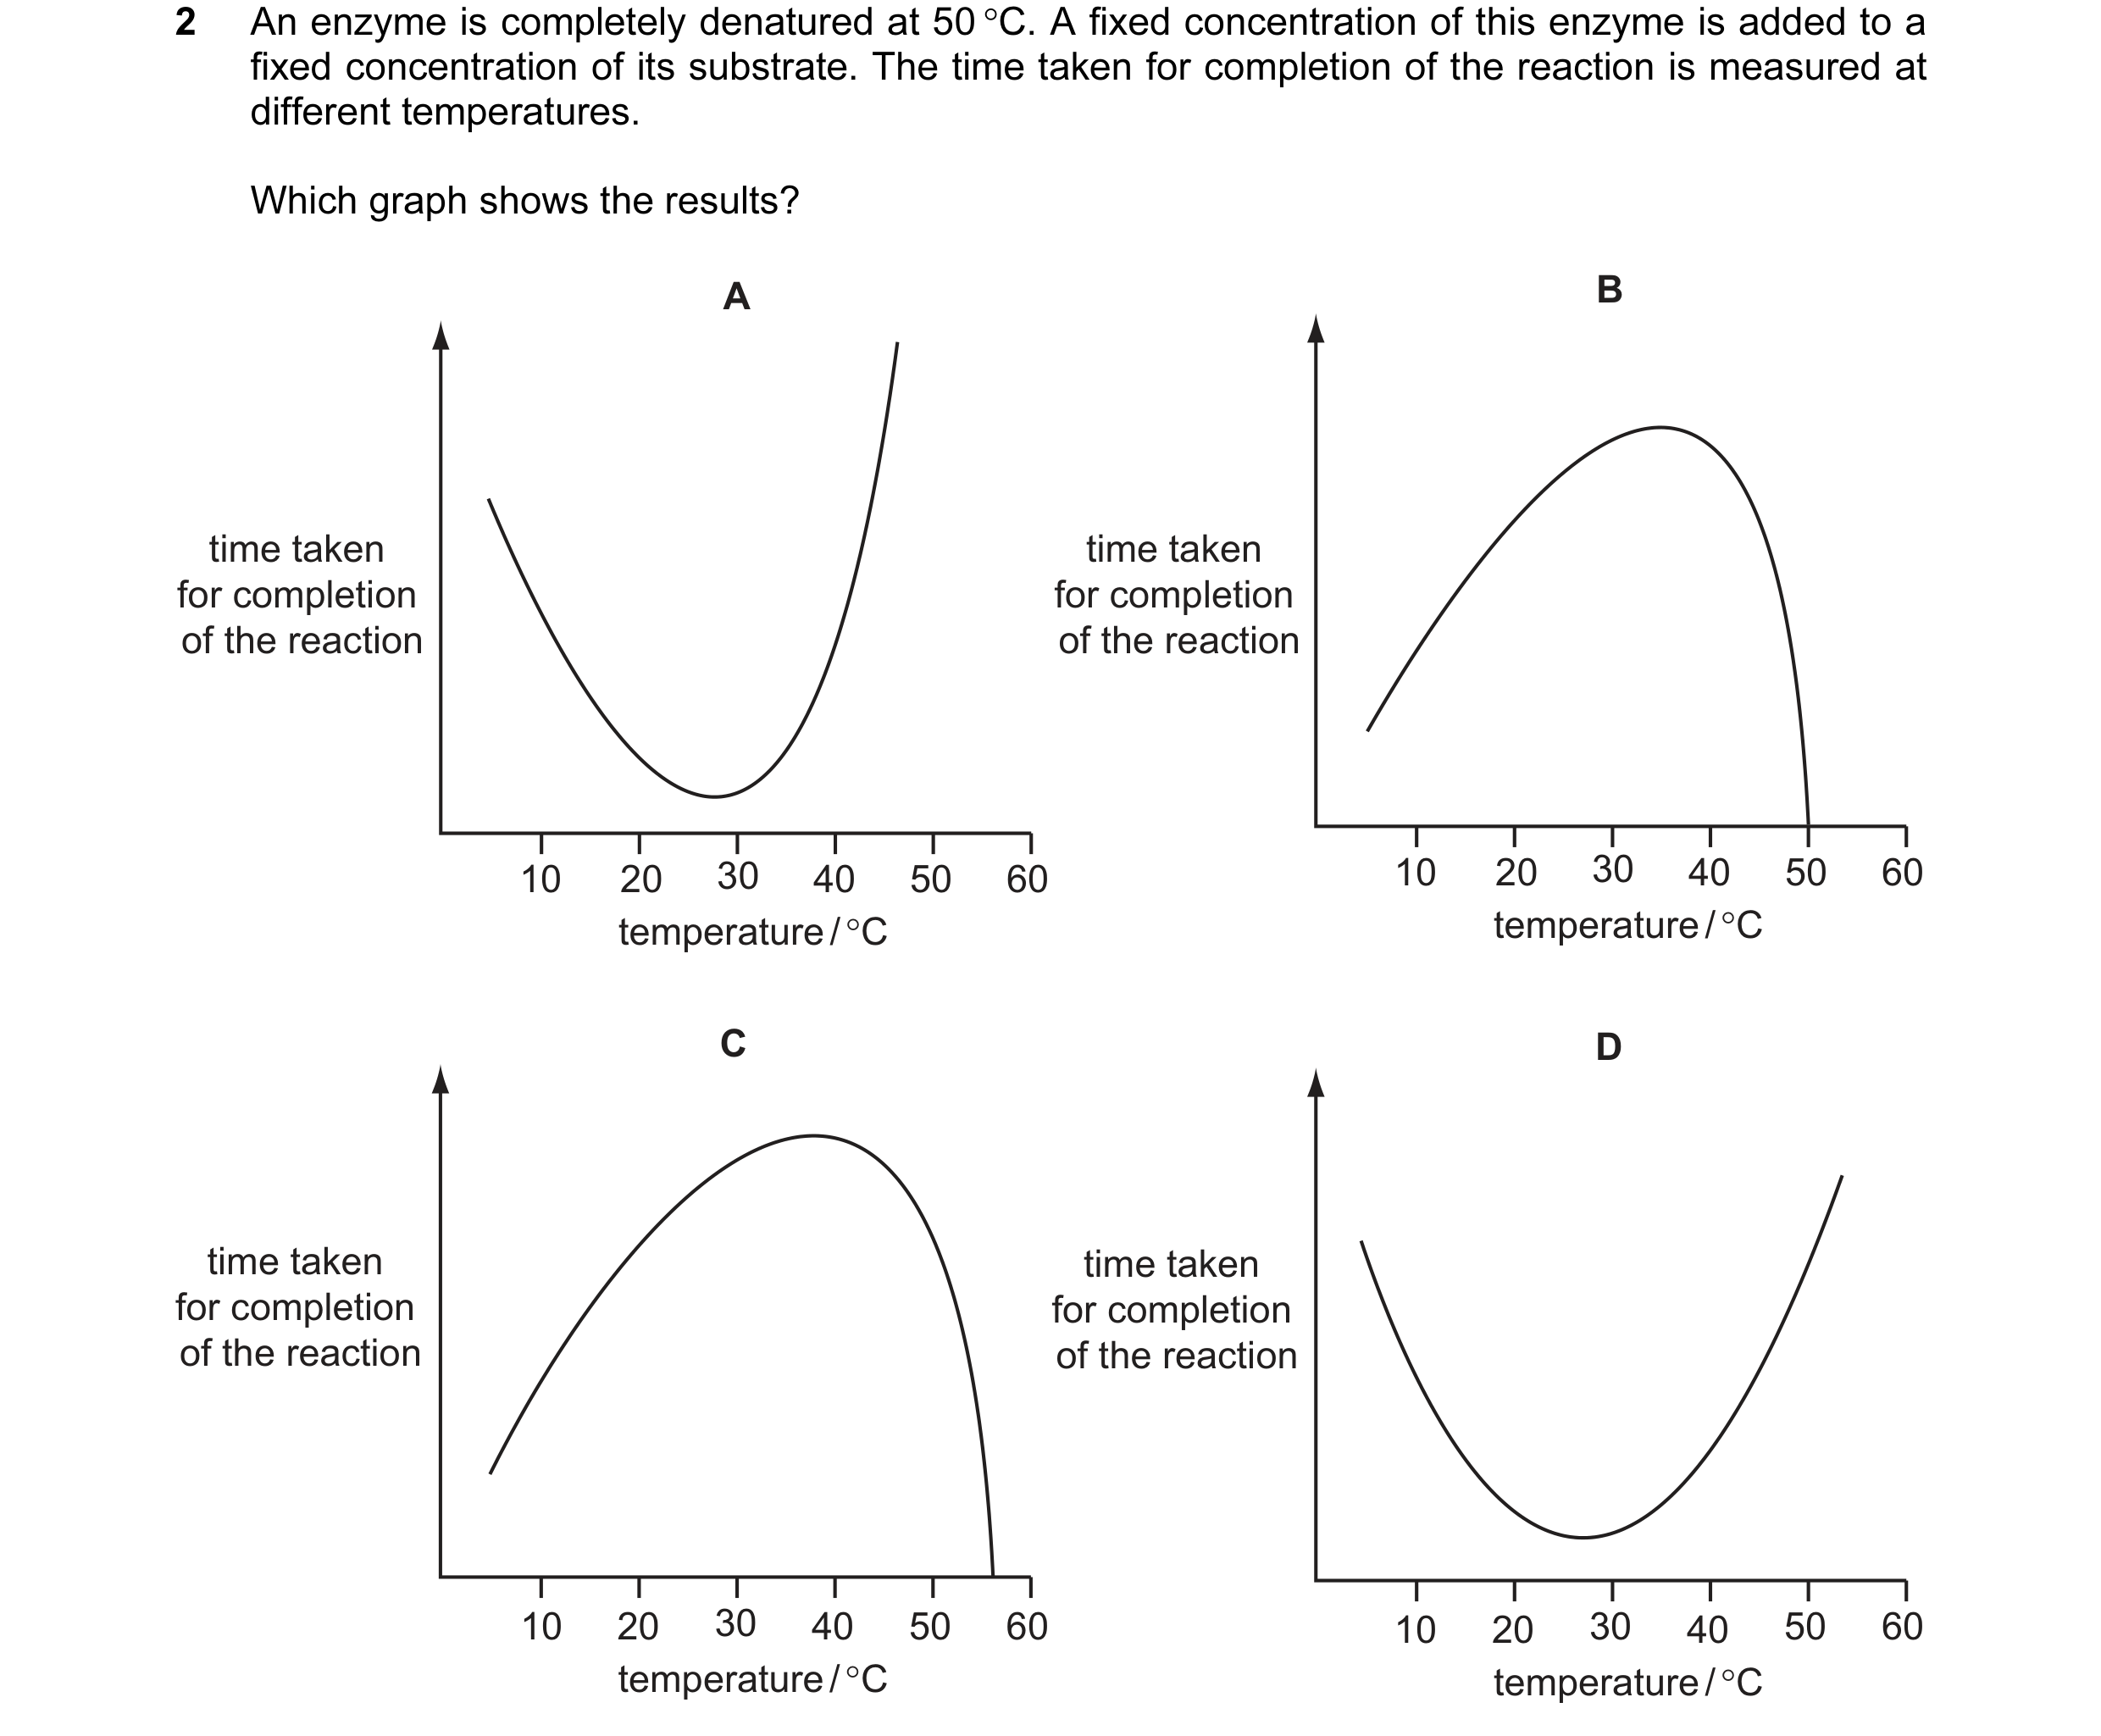
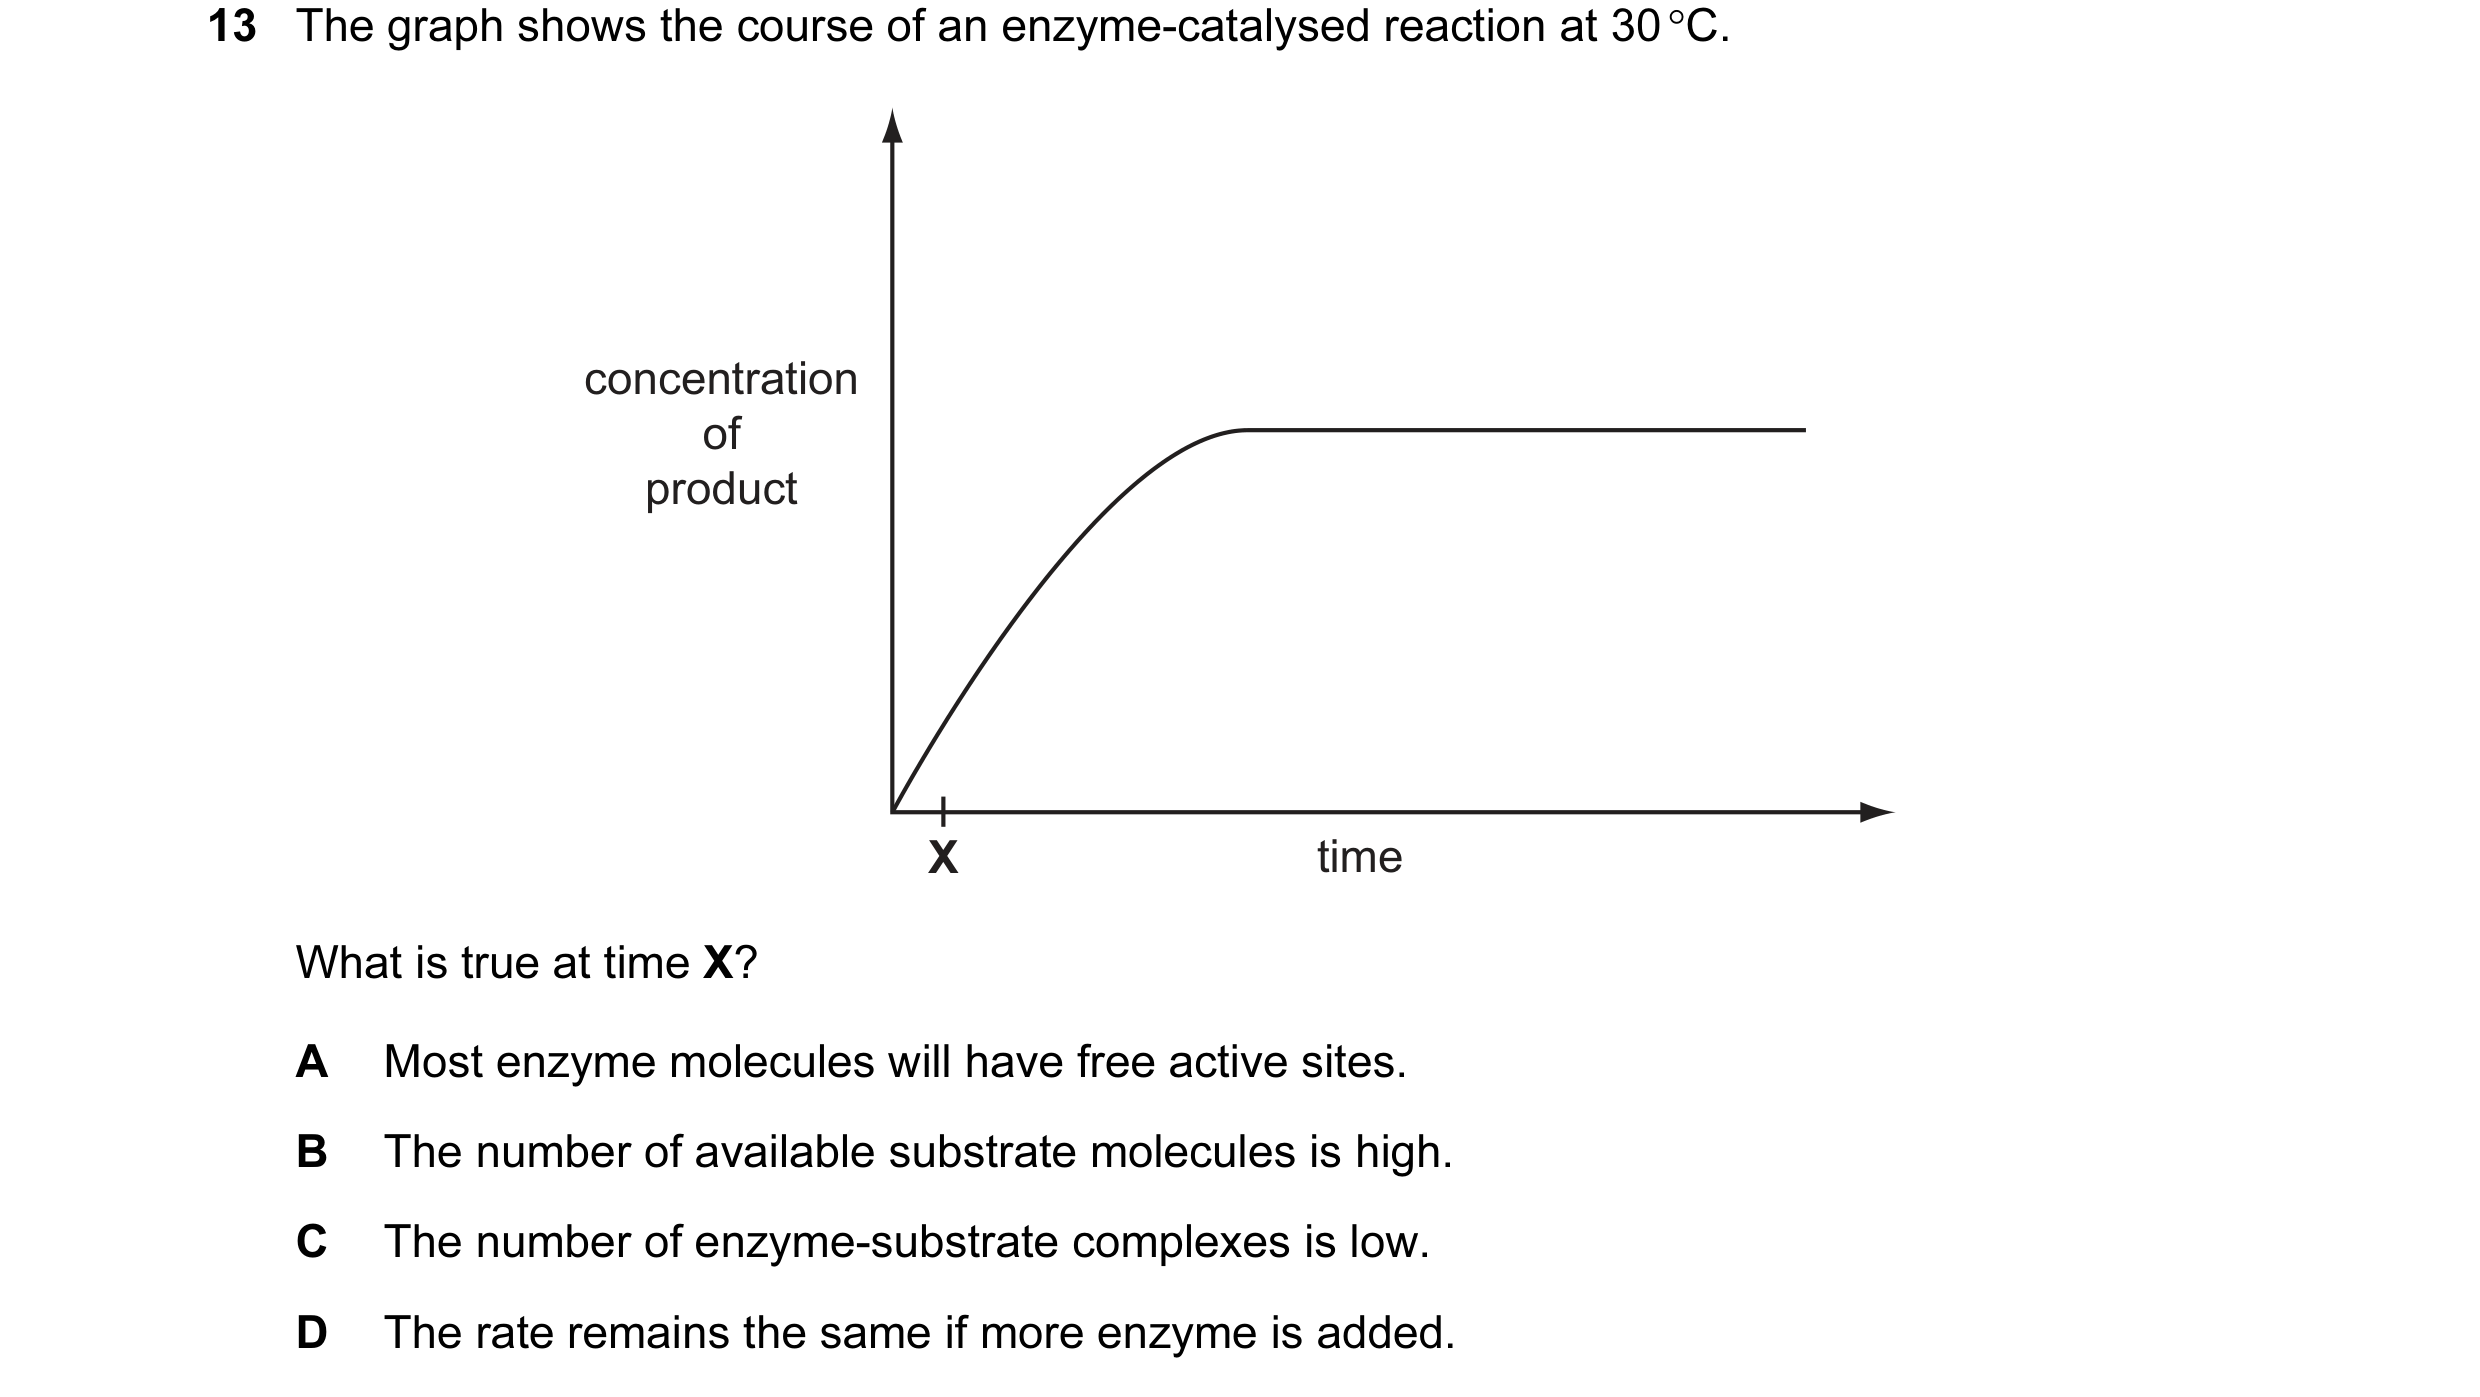 7 / 76
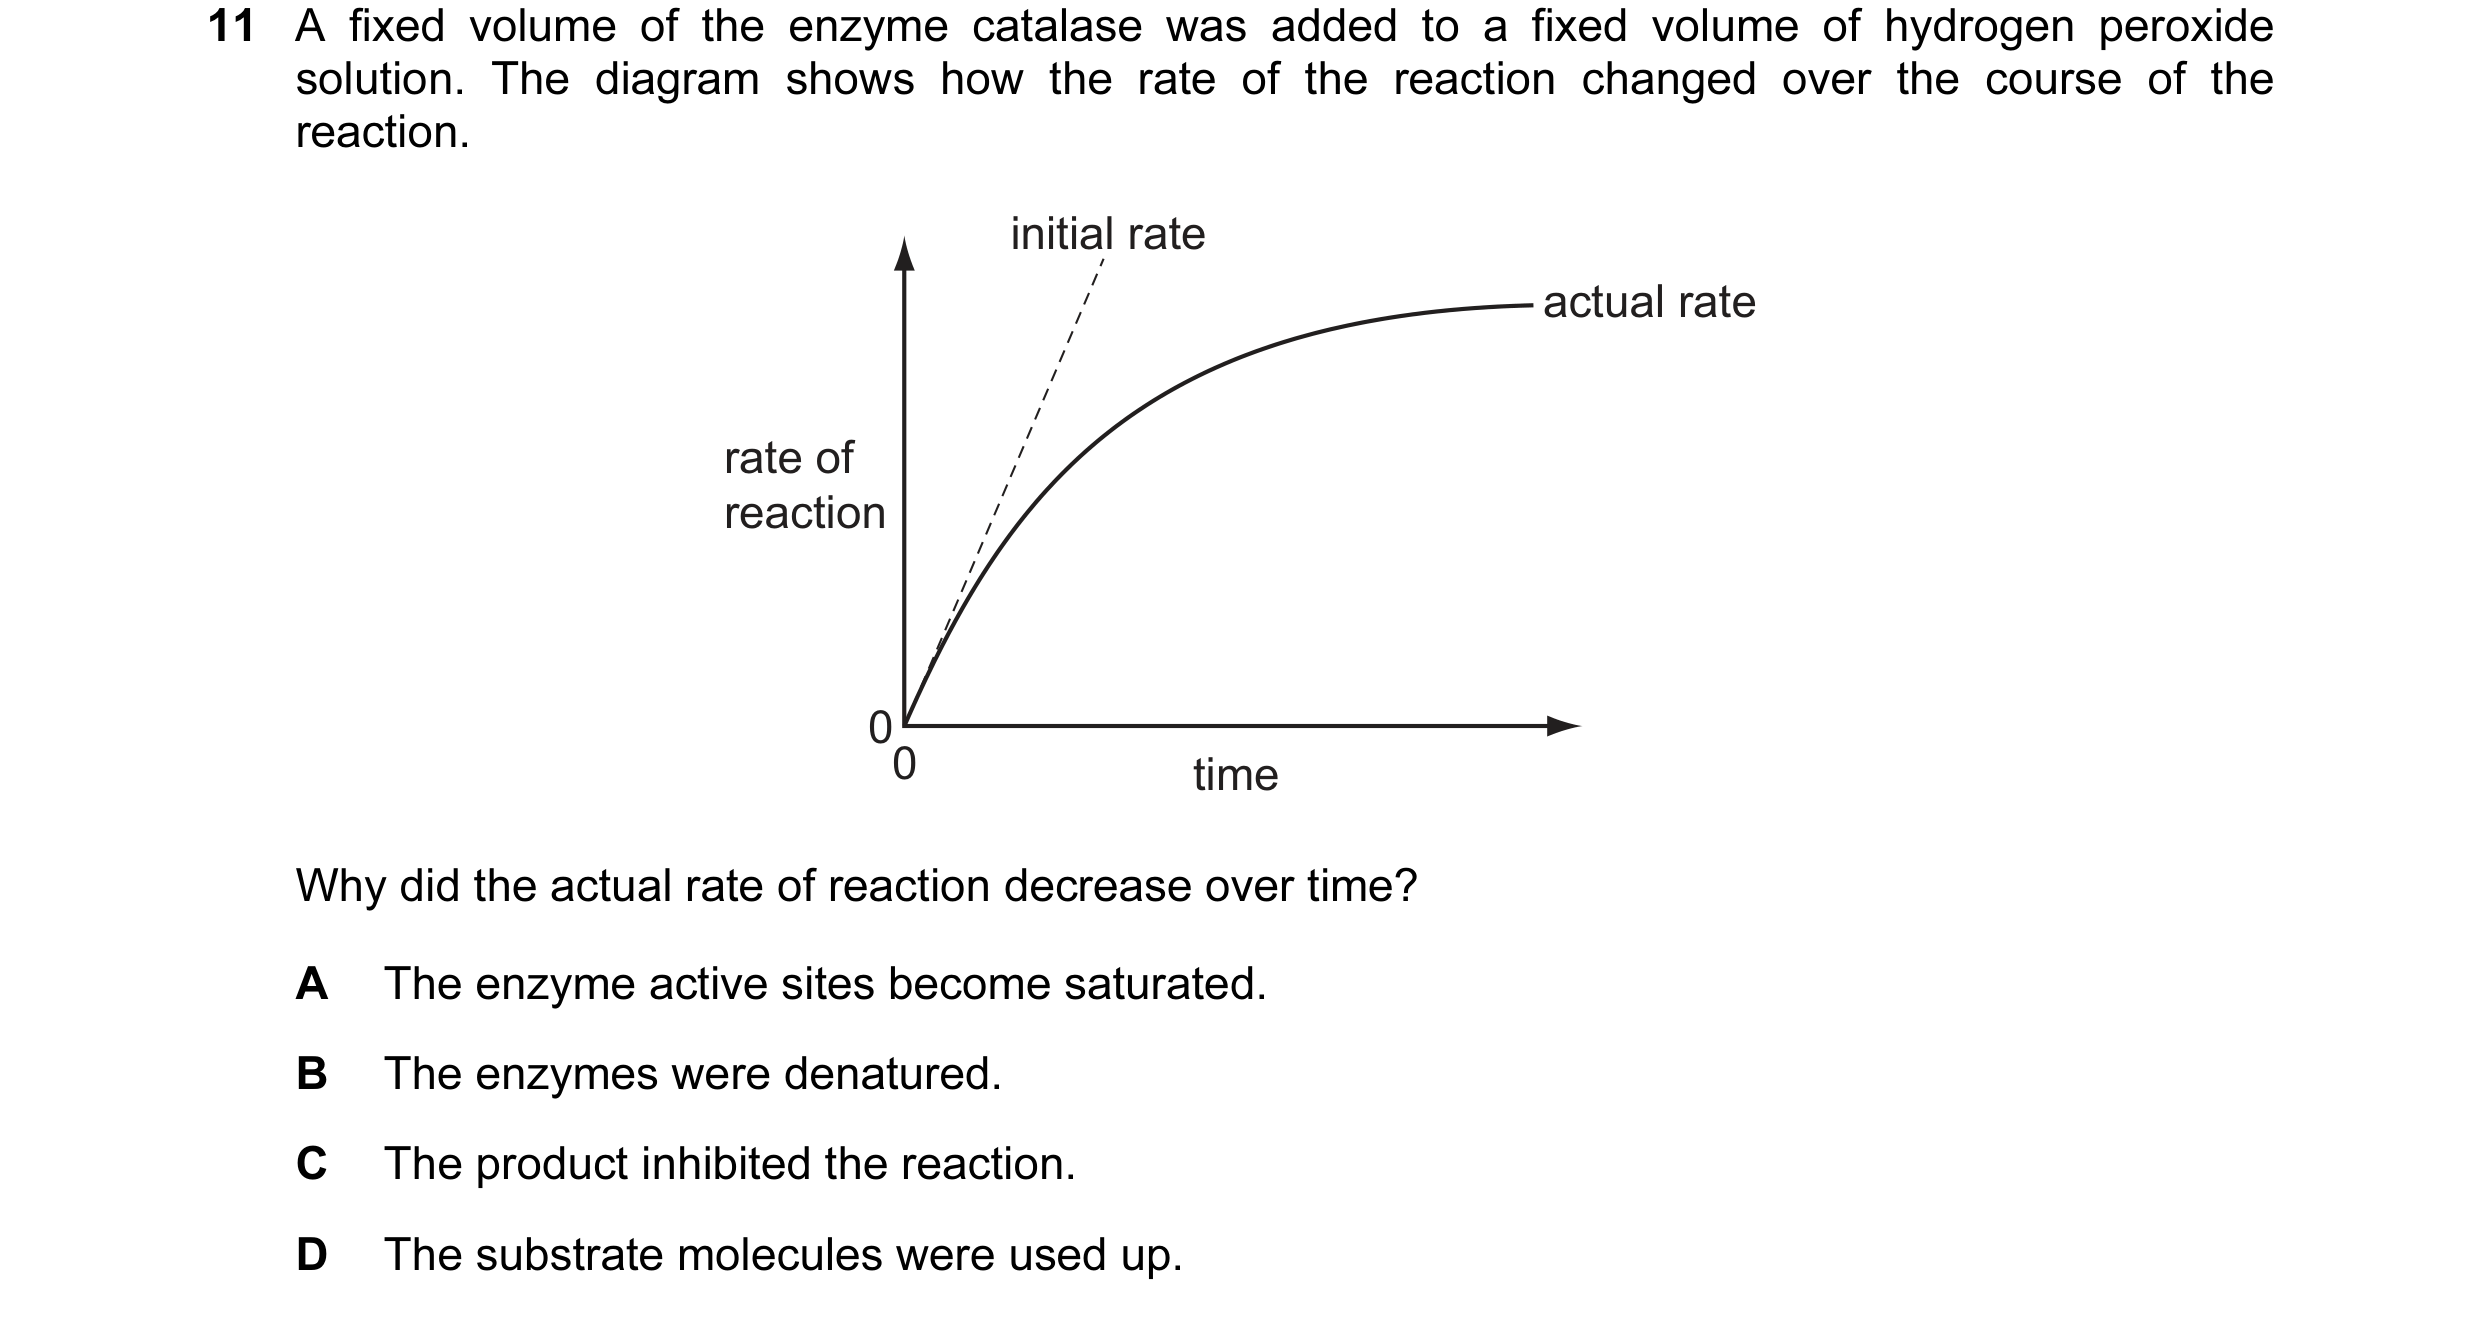
 8 / 76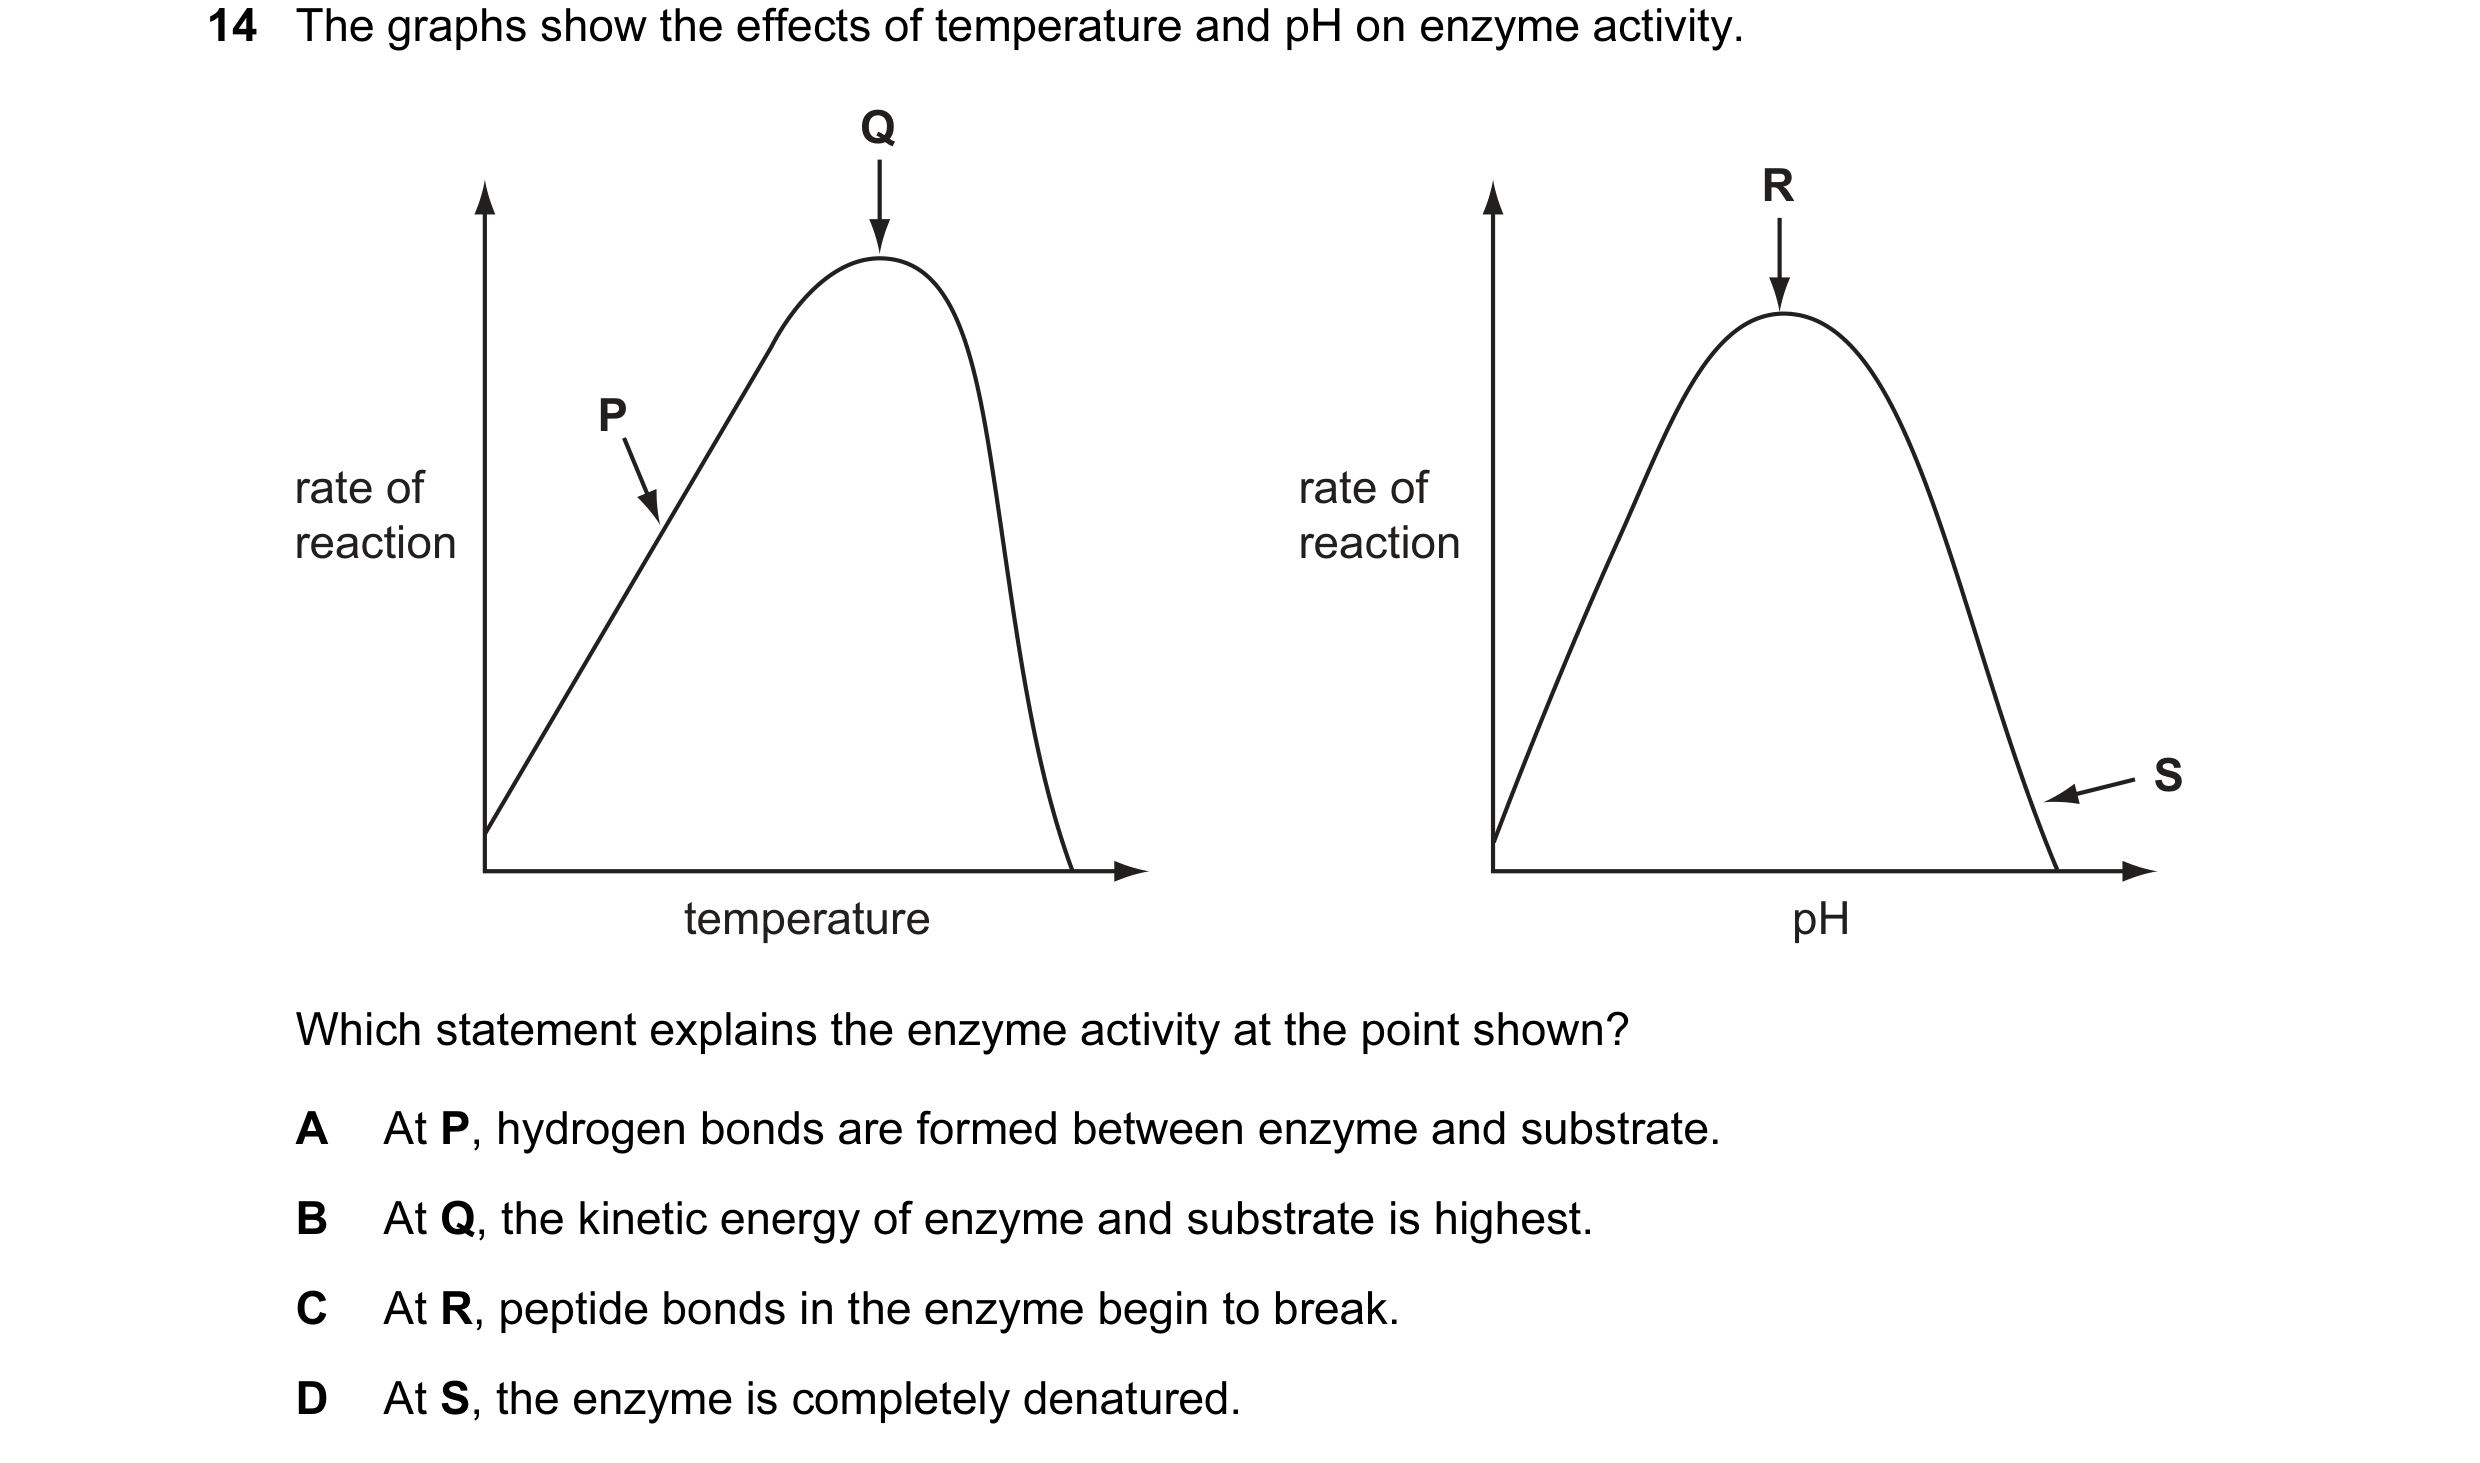
 9 / 76
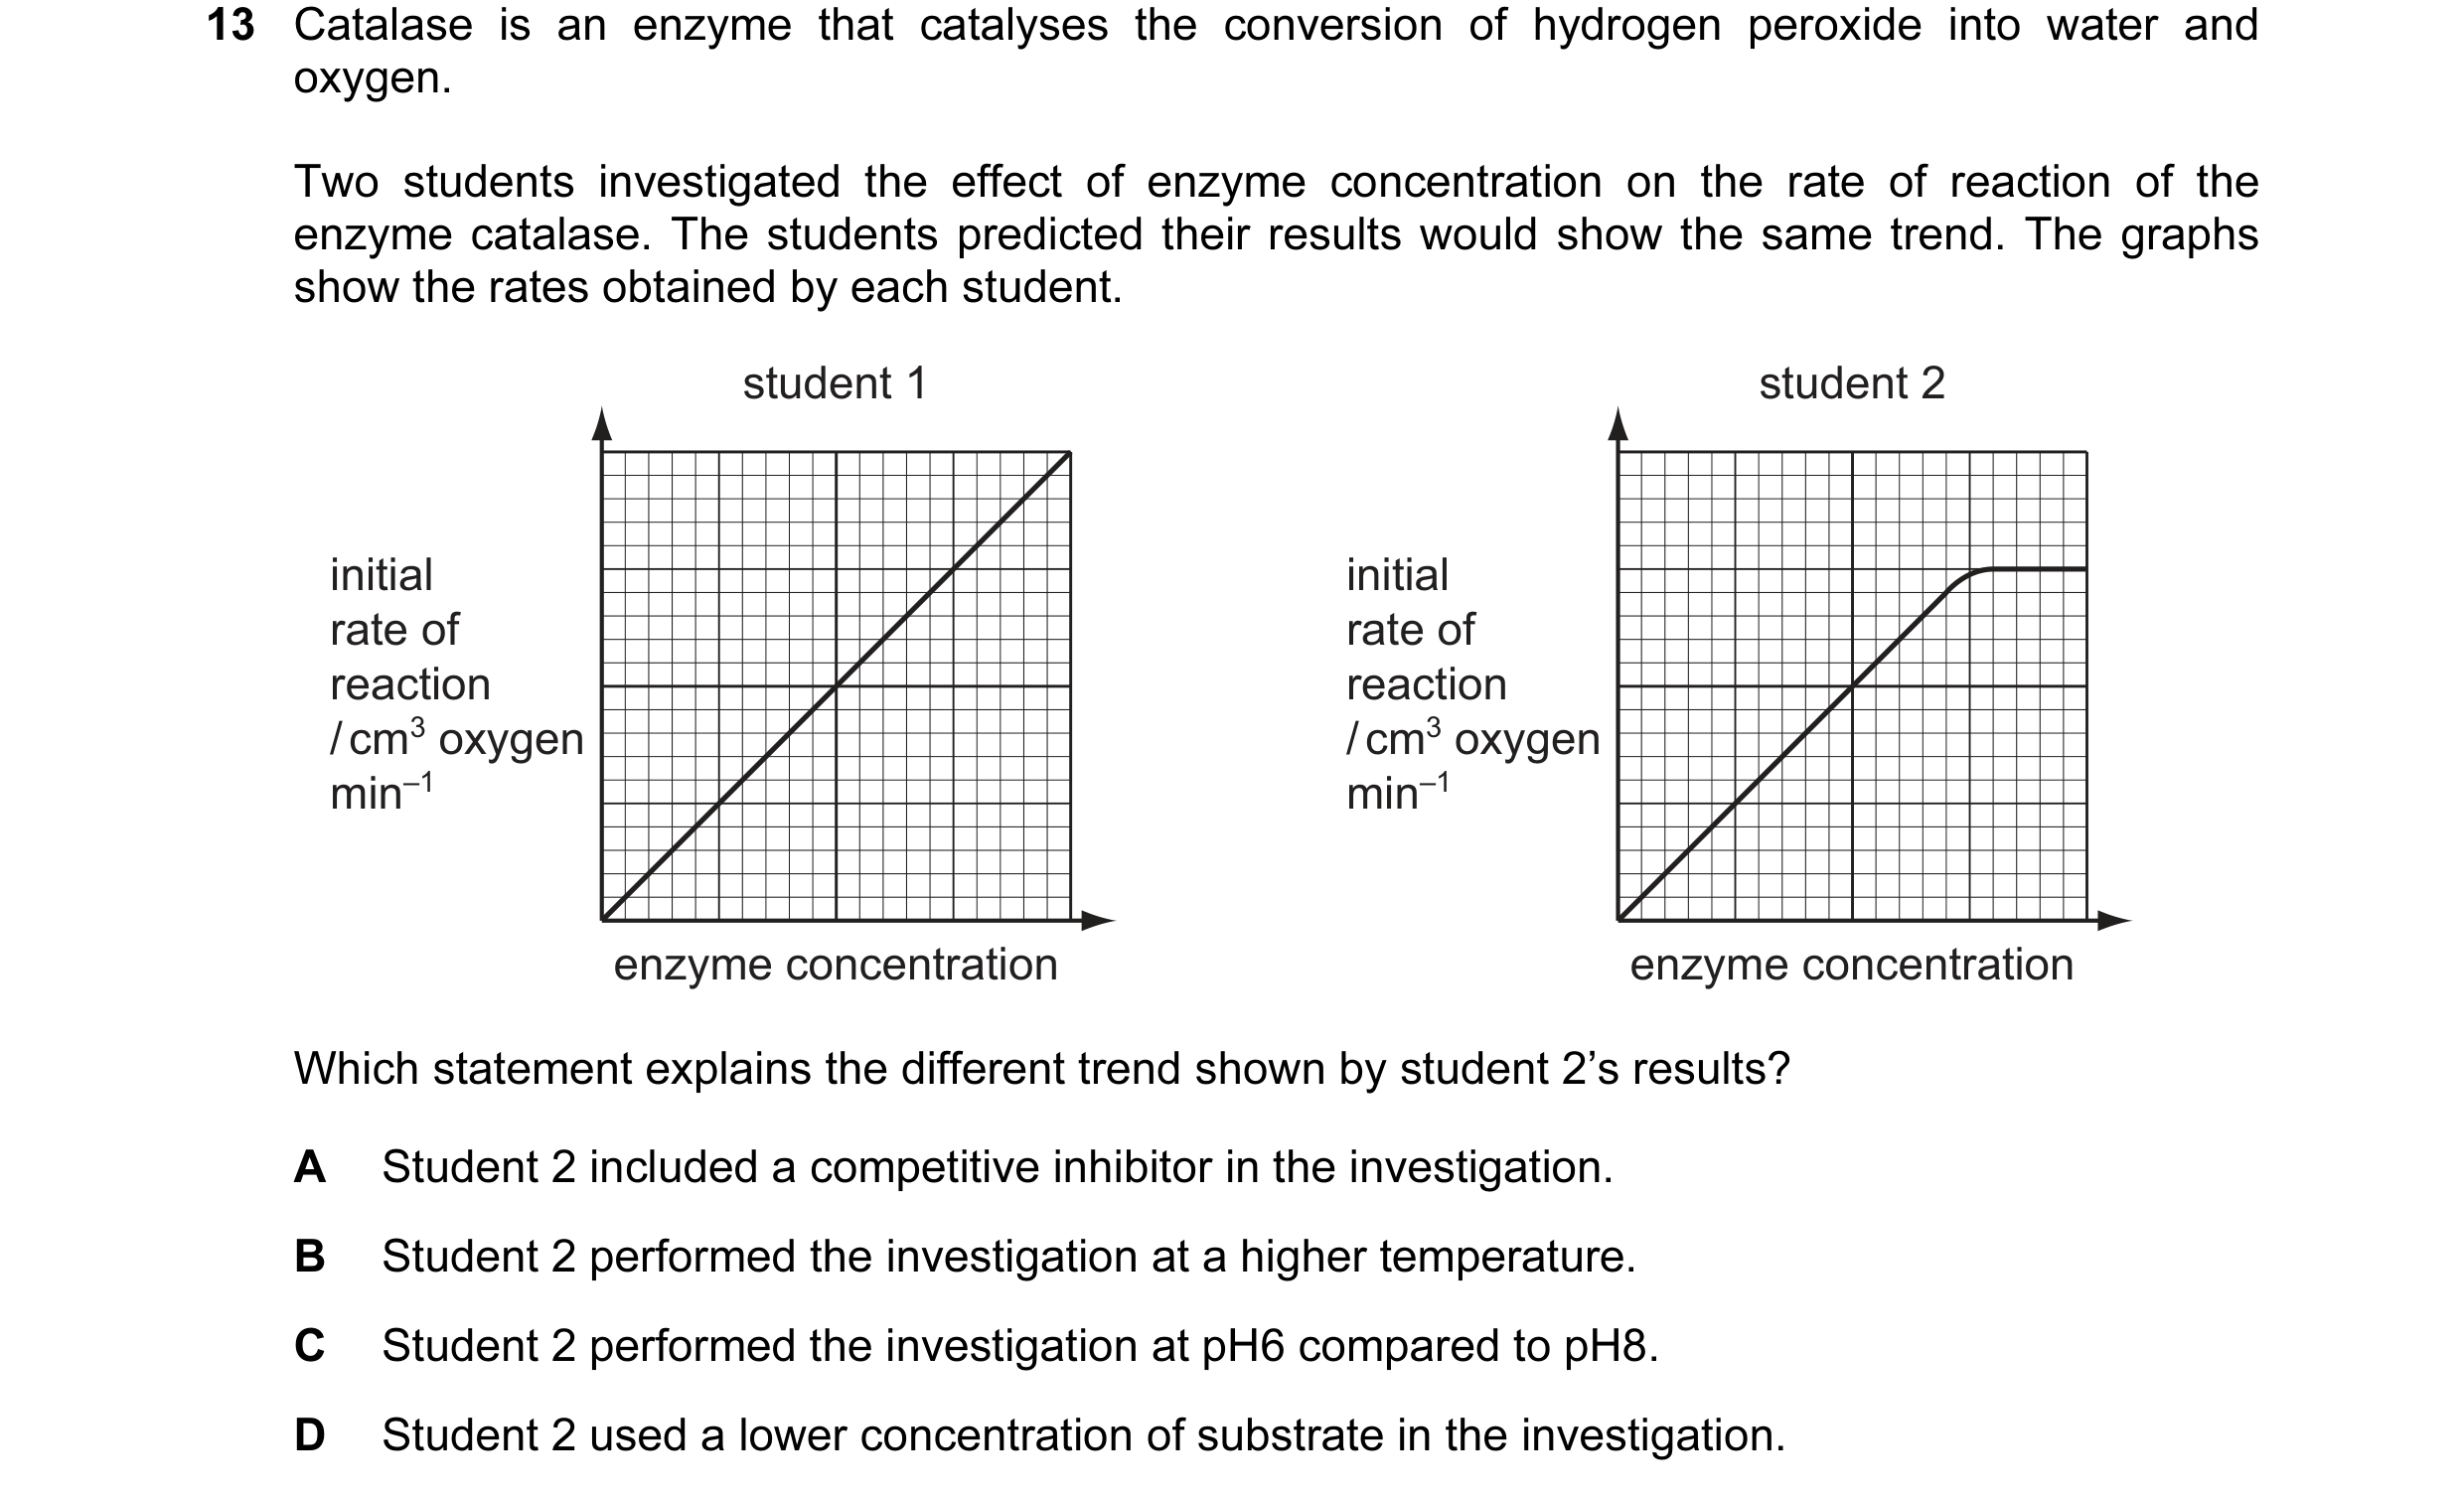 10 / 76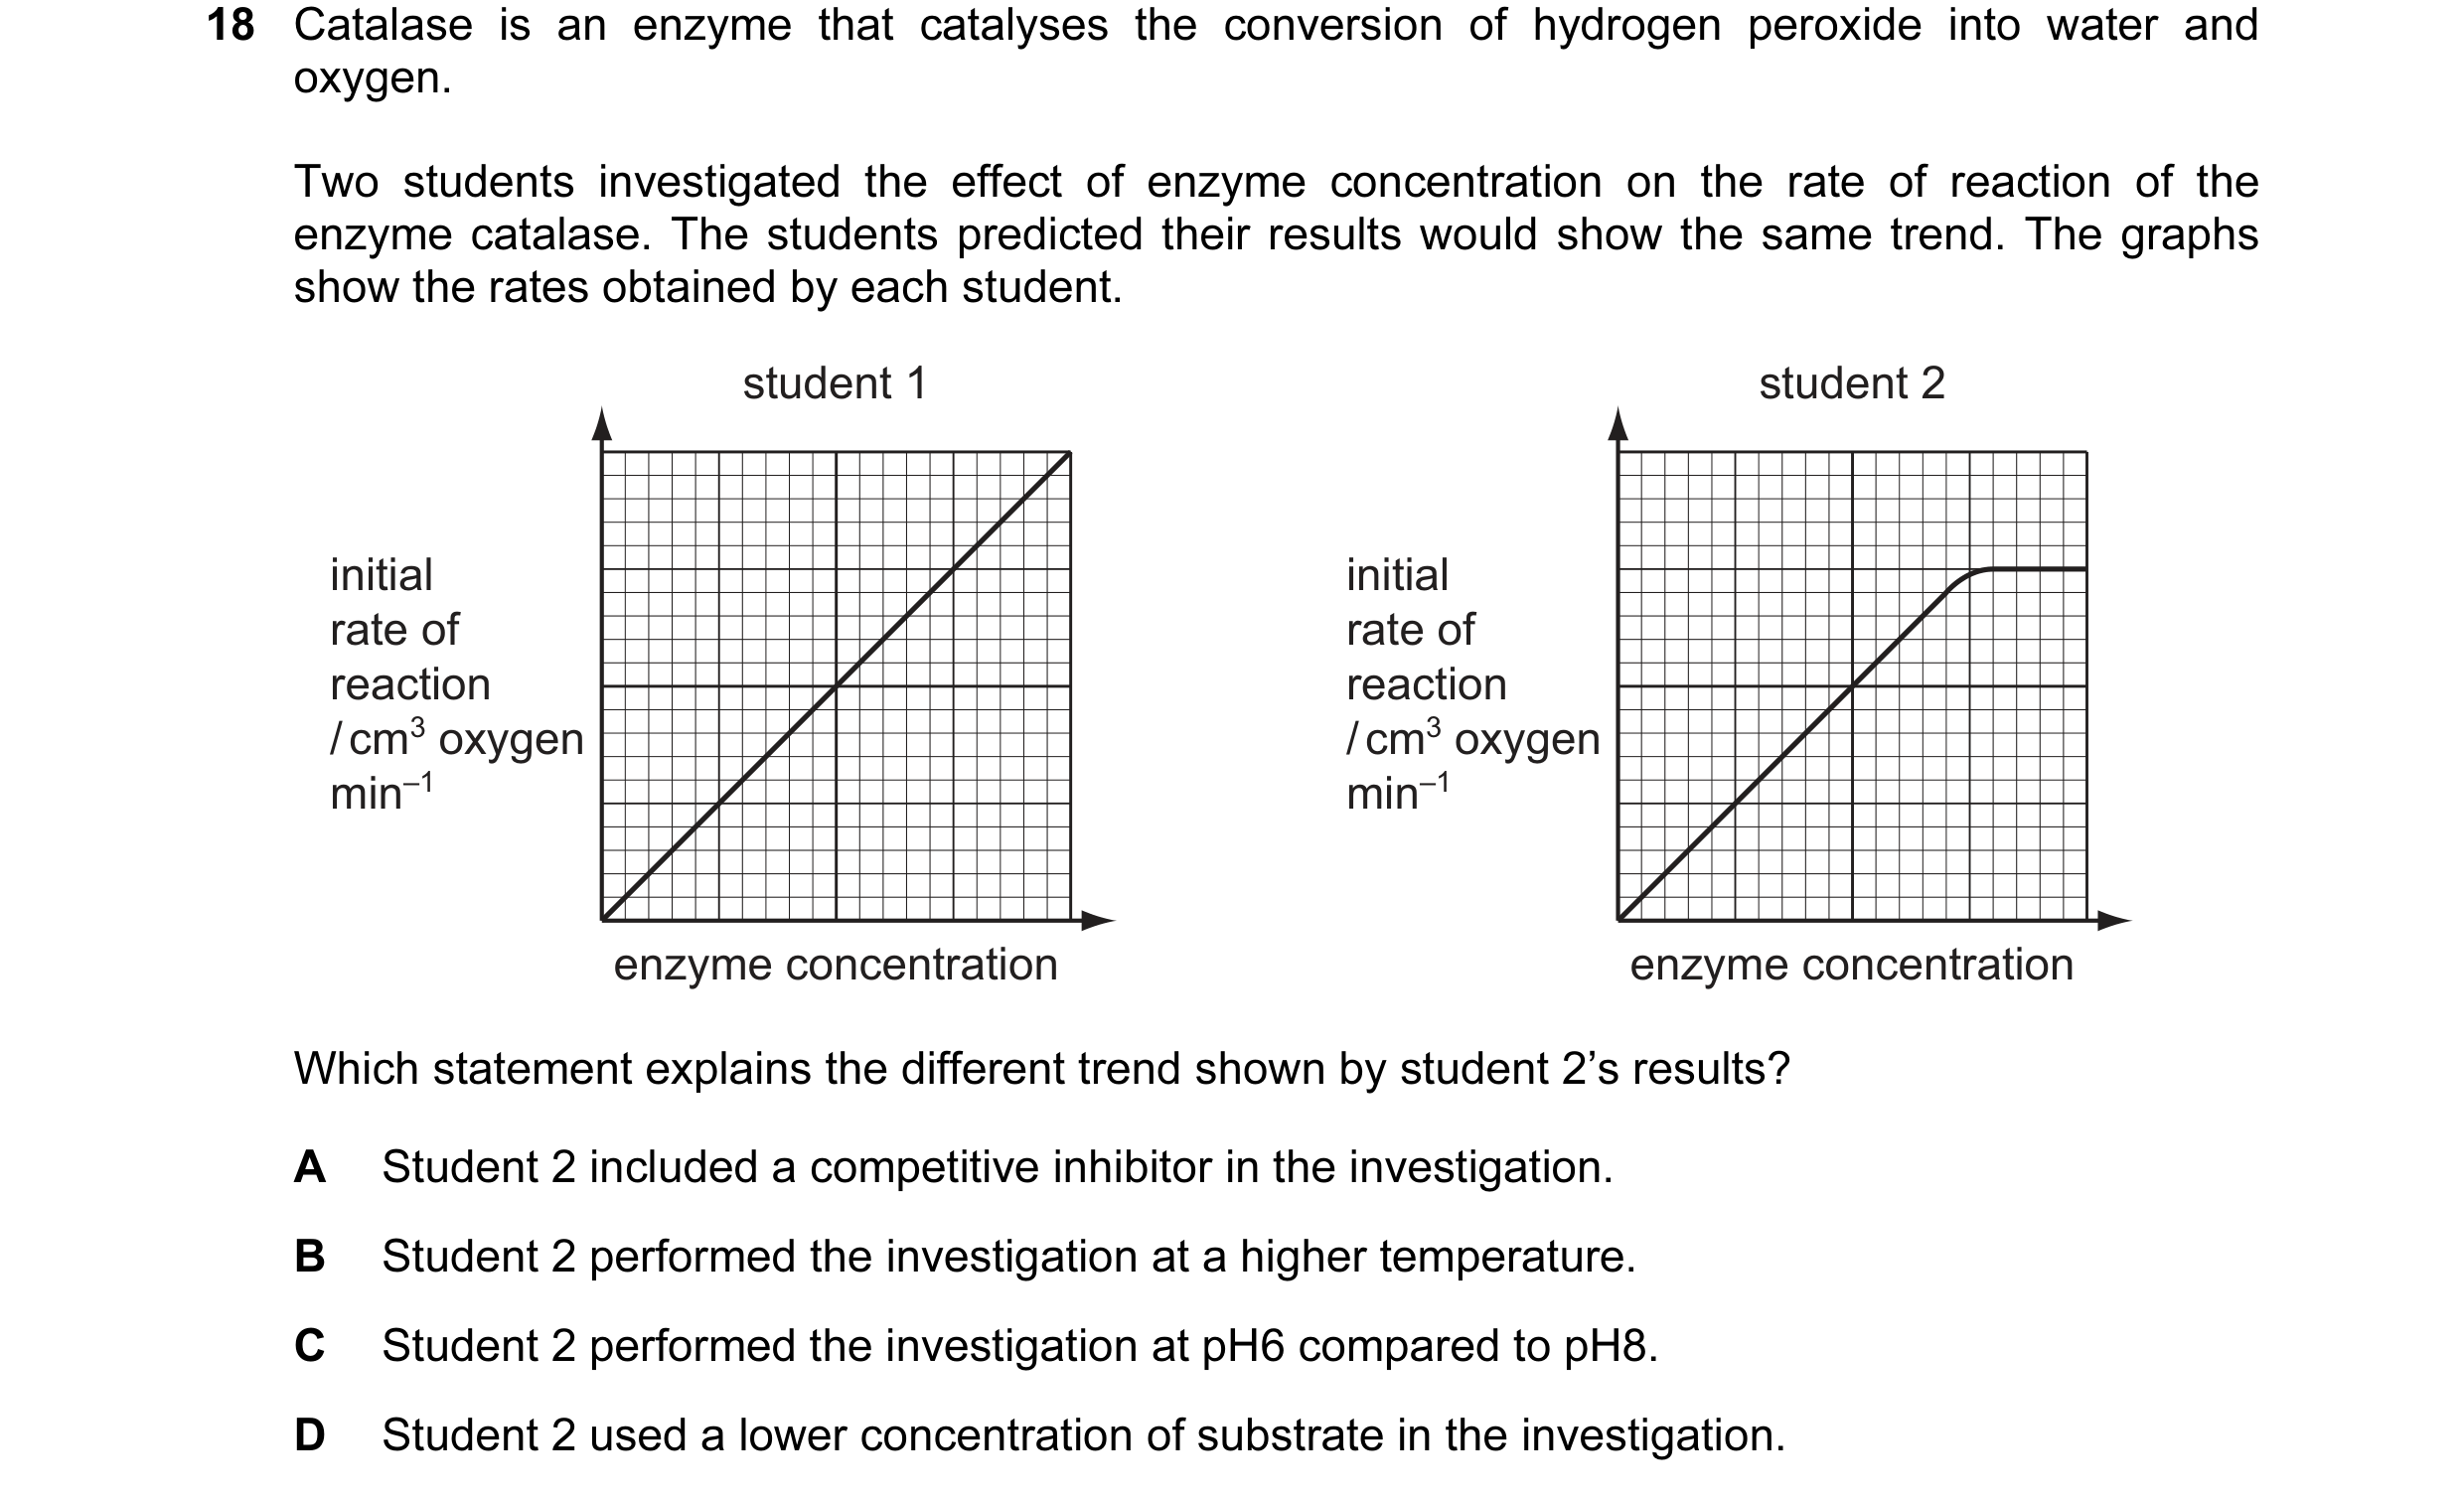
 11 / 76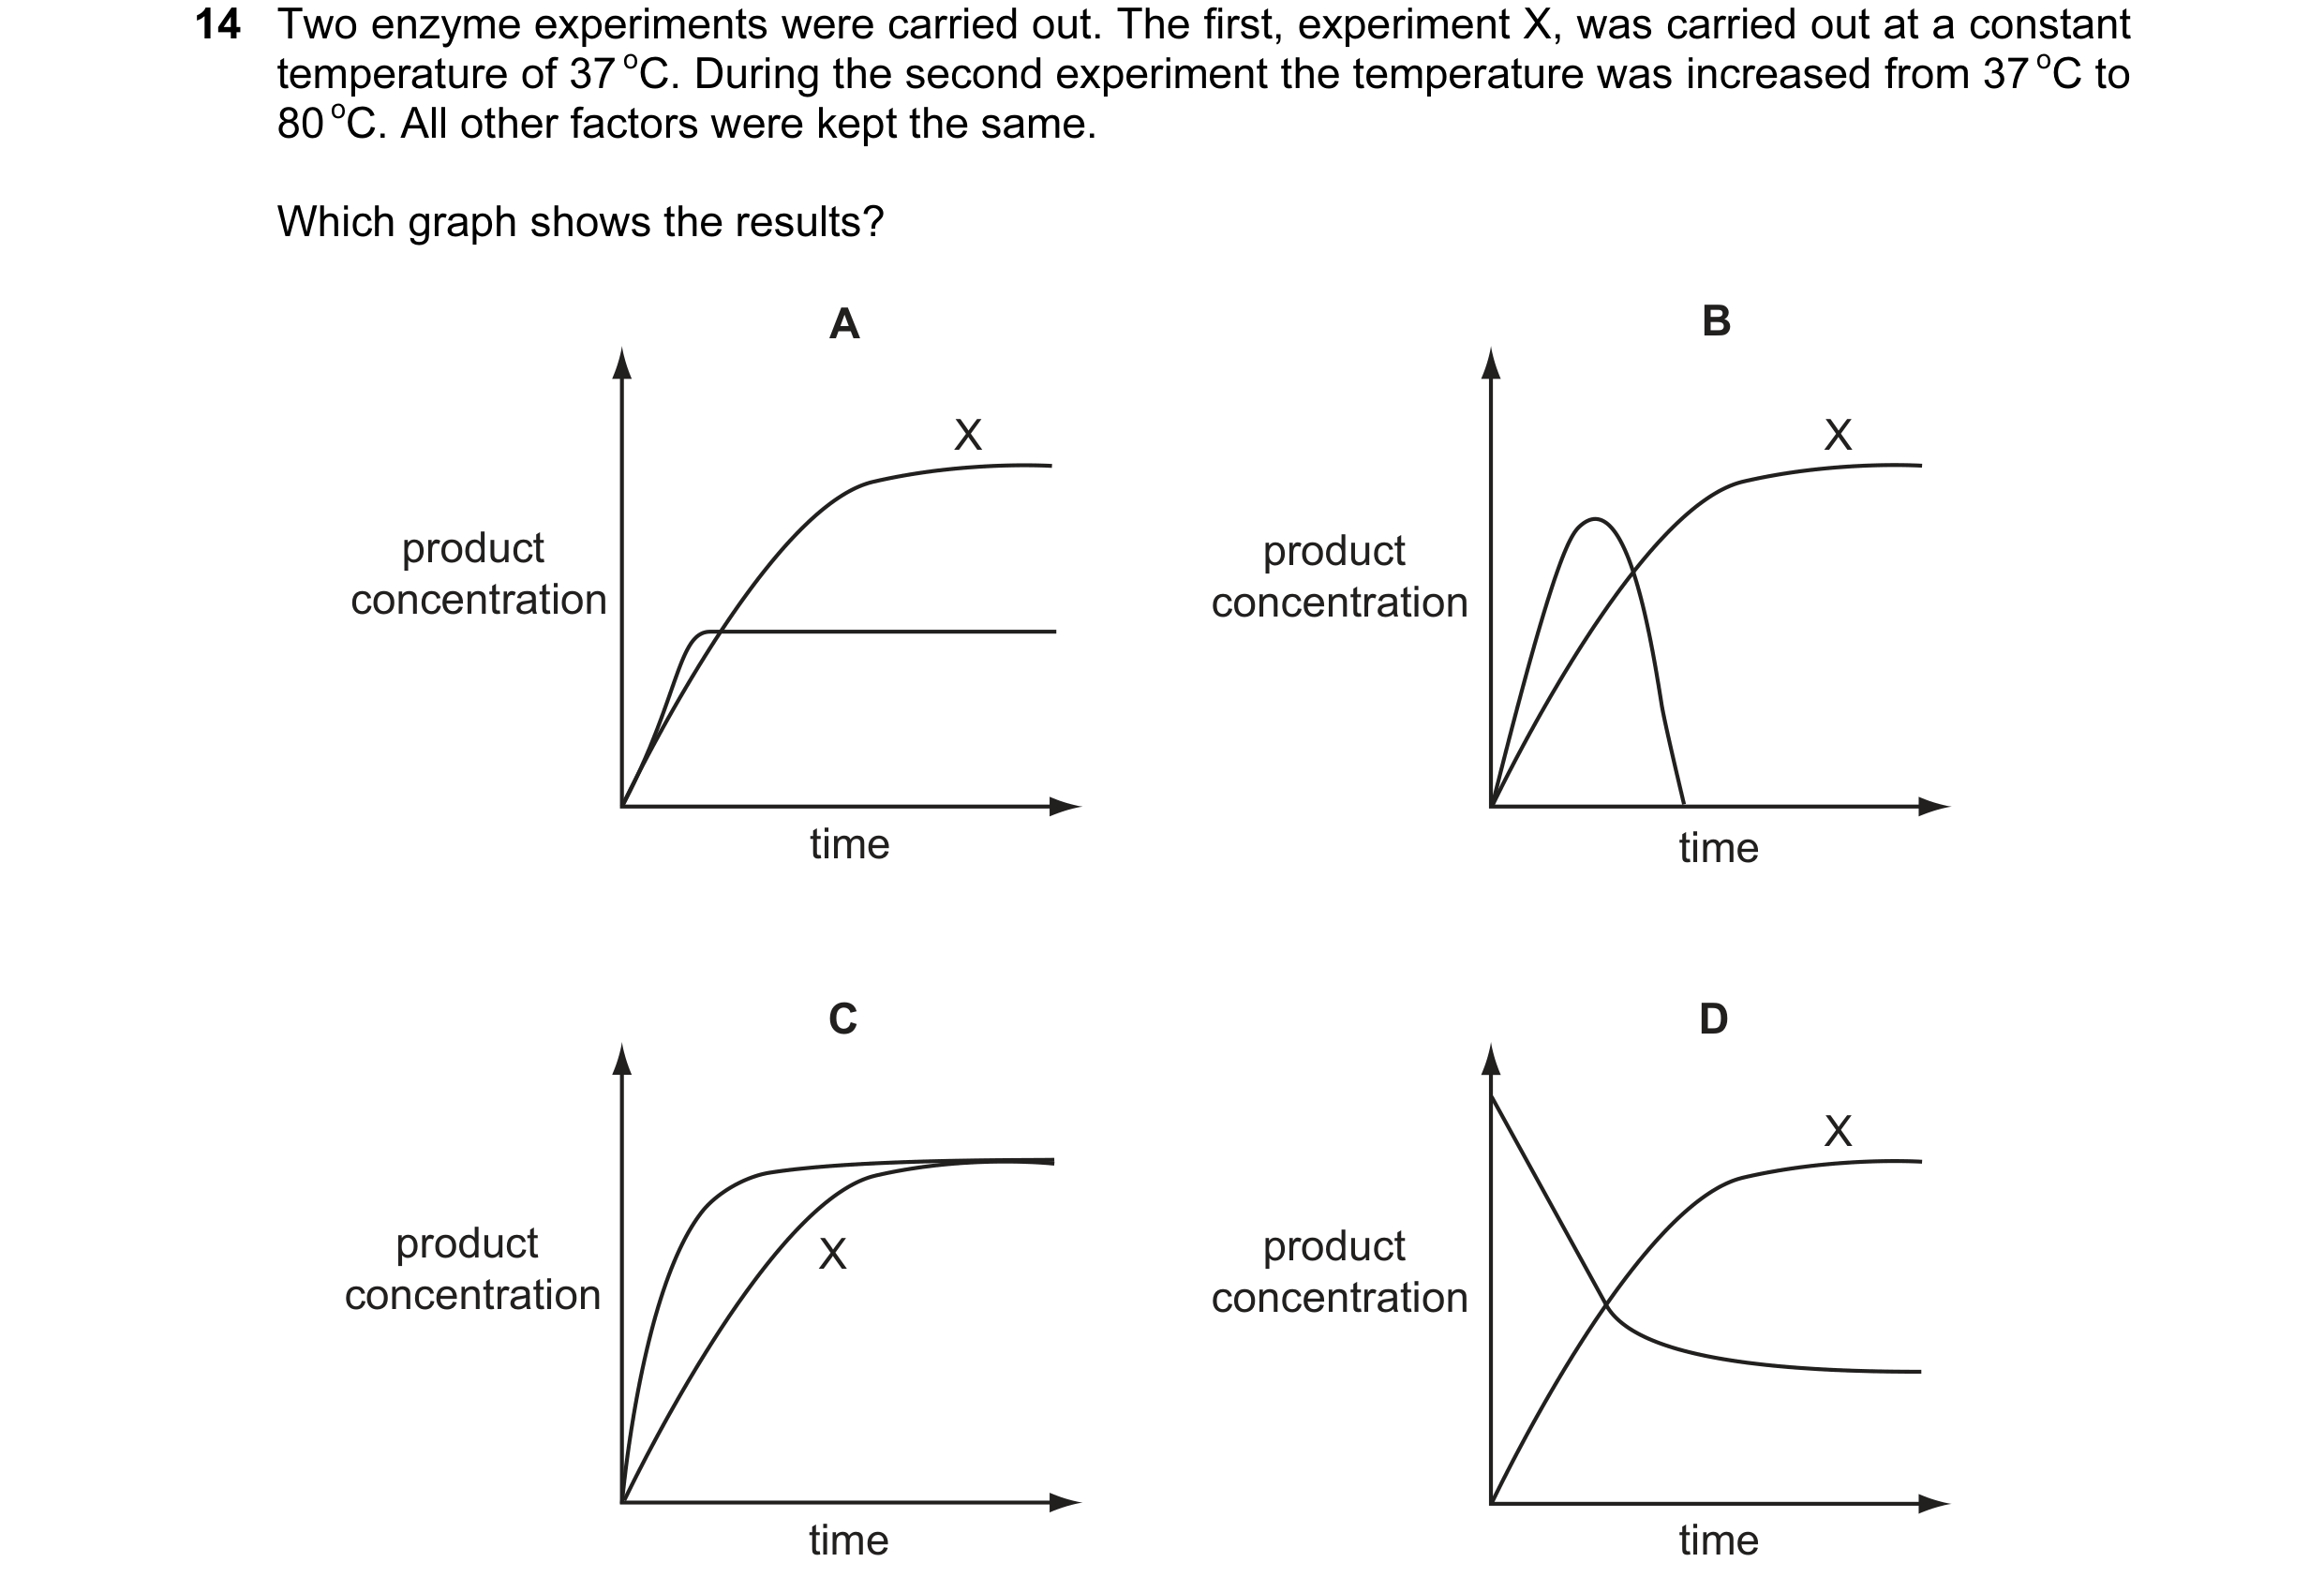
 12 / 76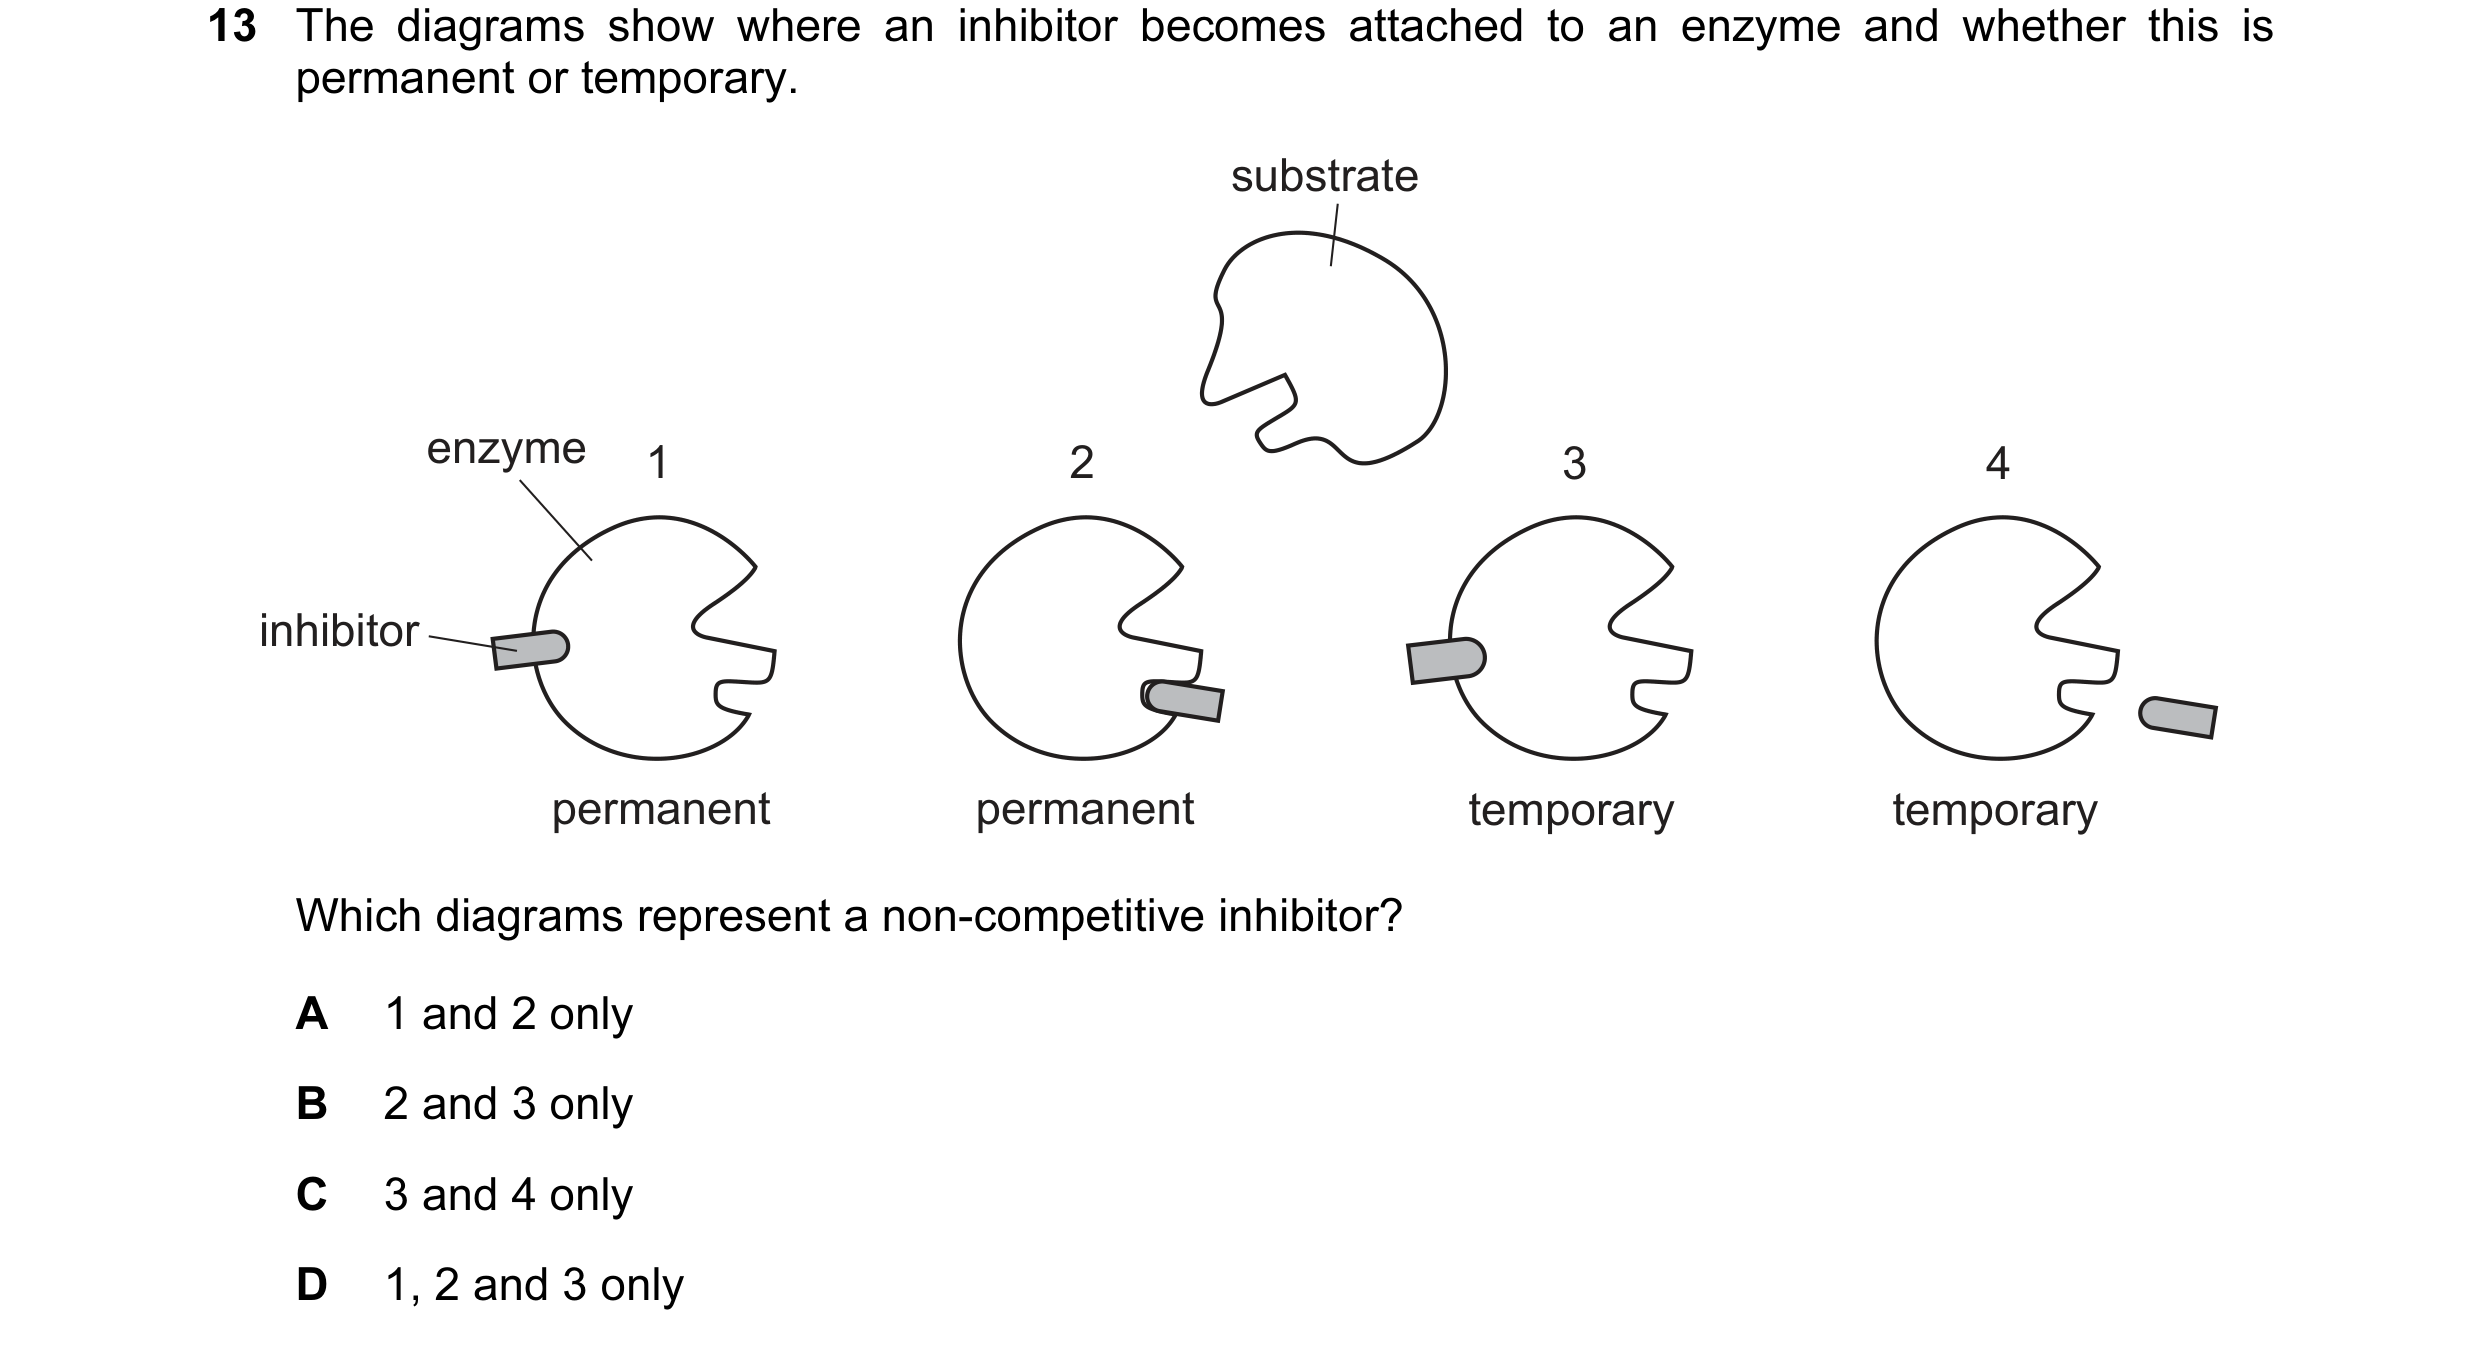
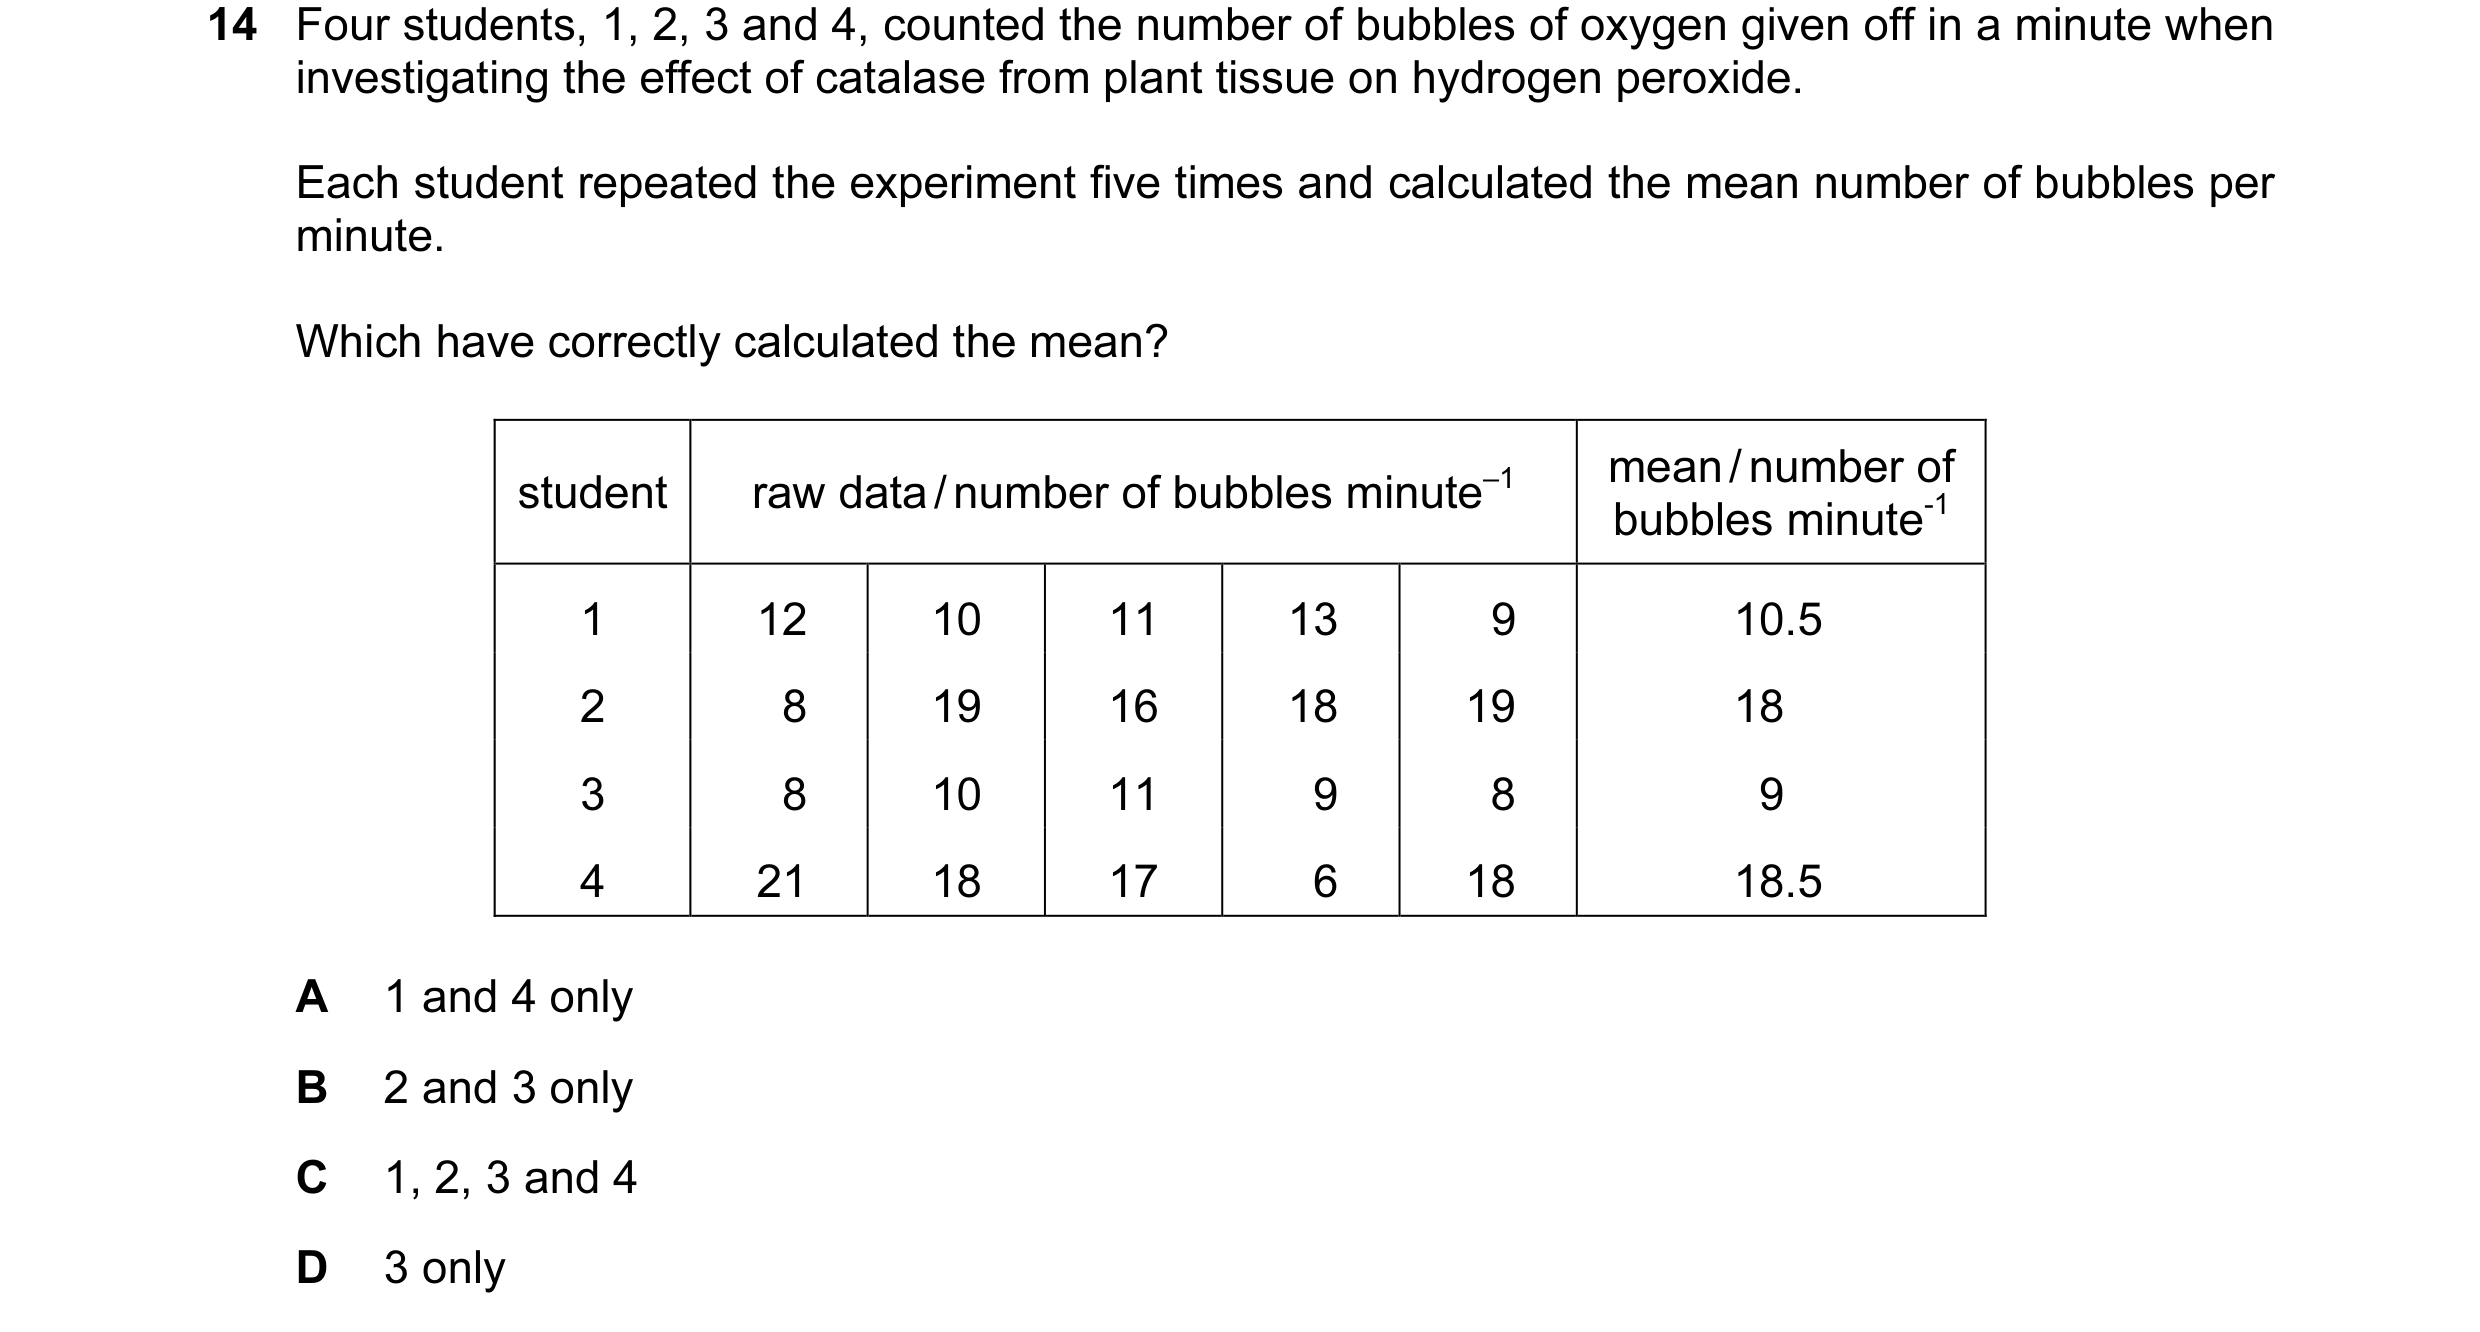
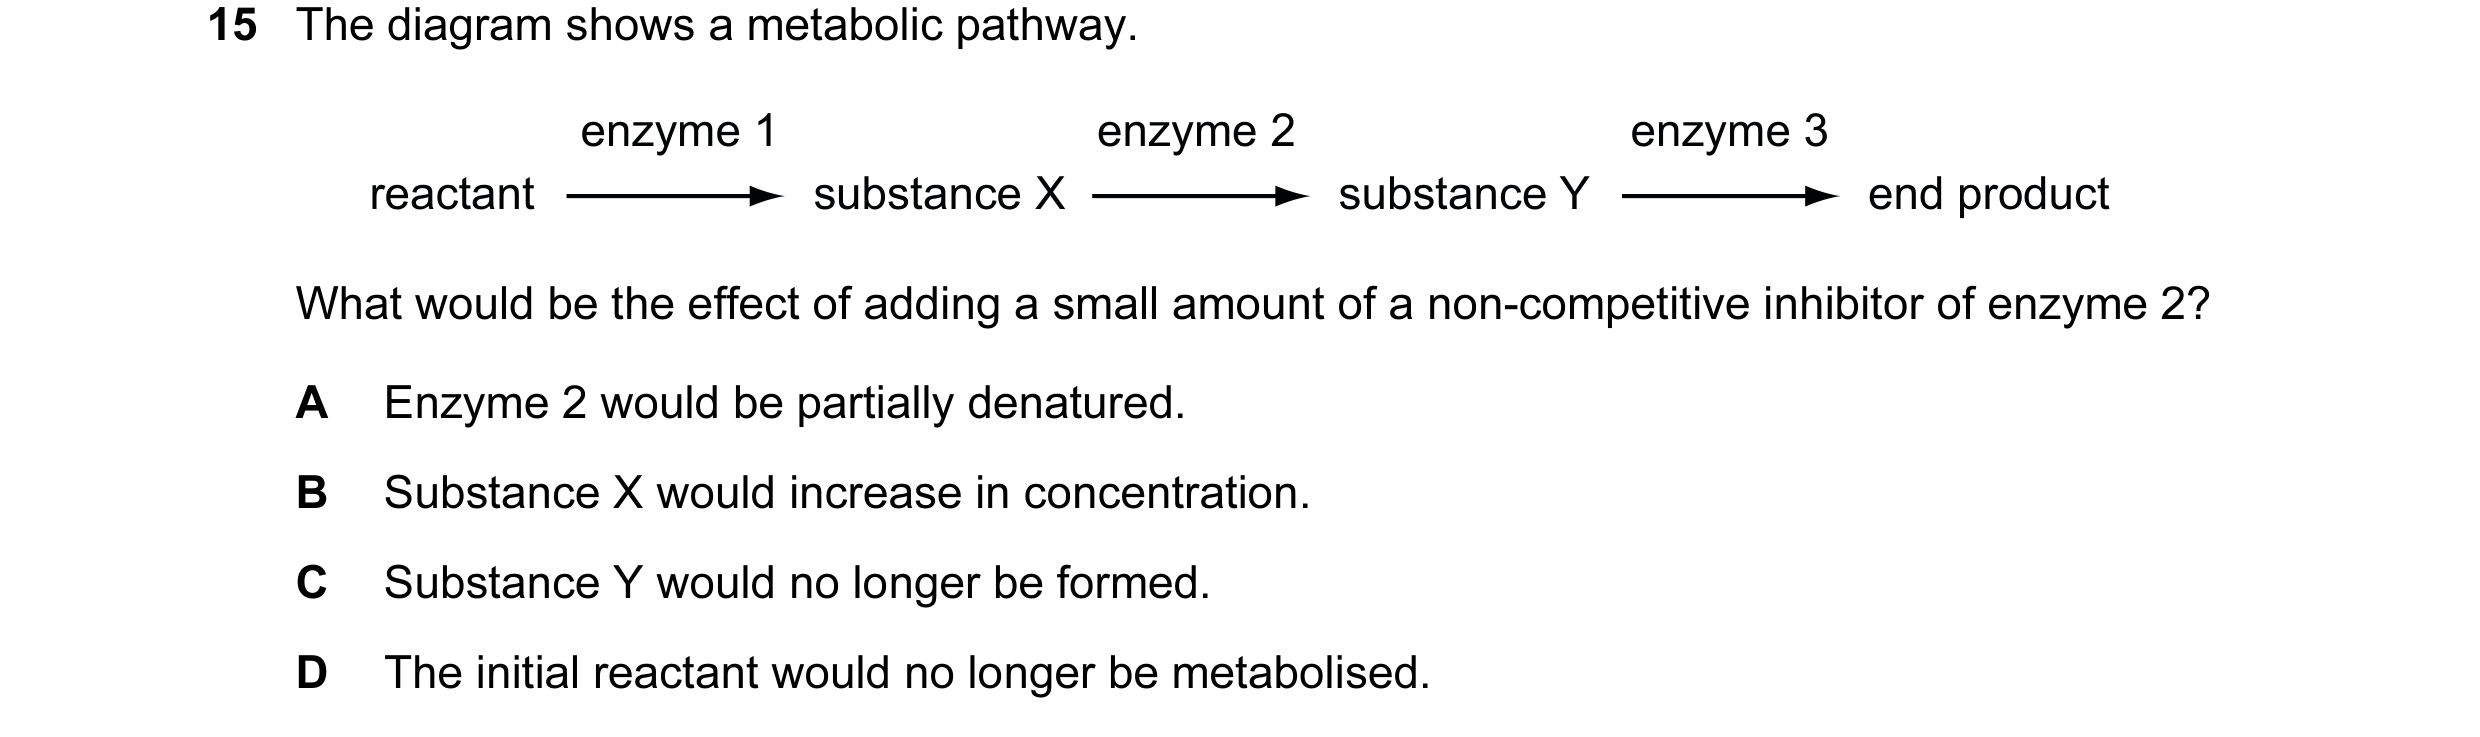 13 / 76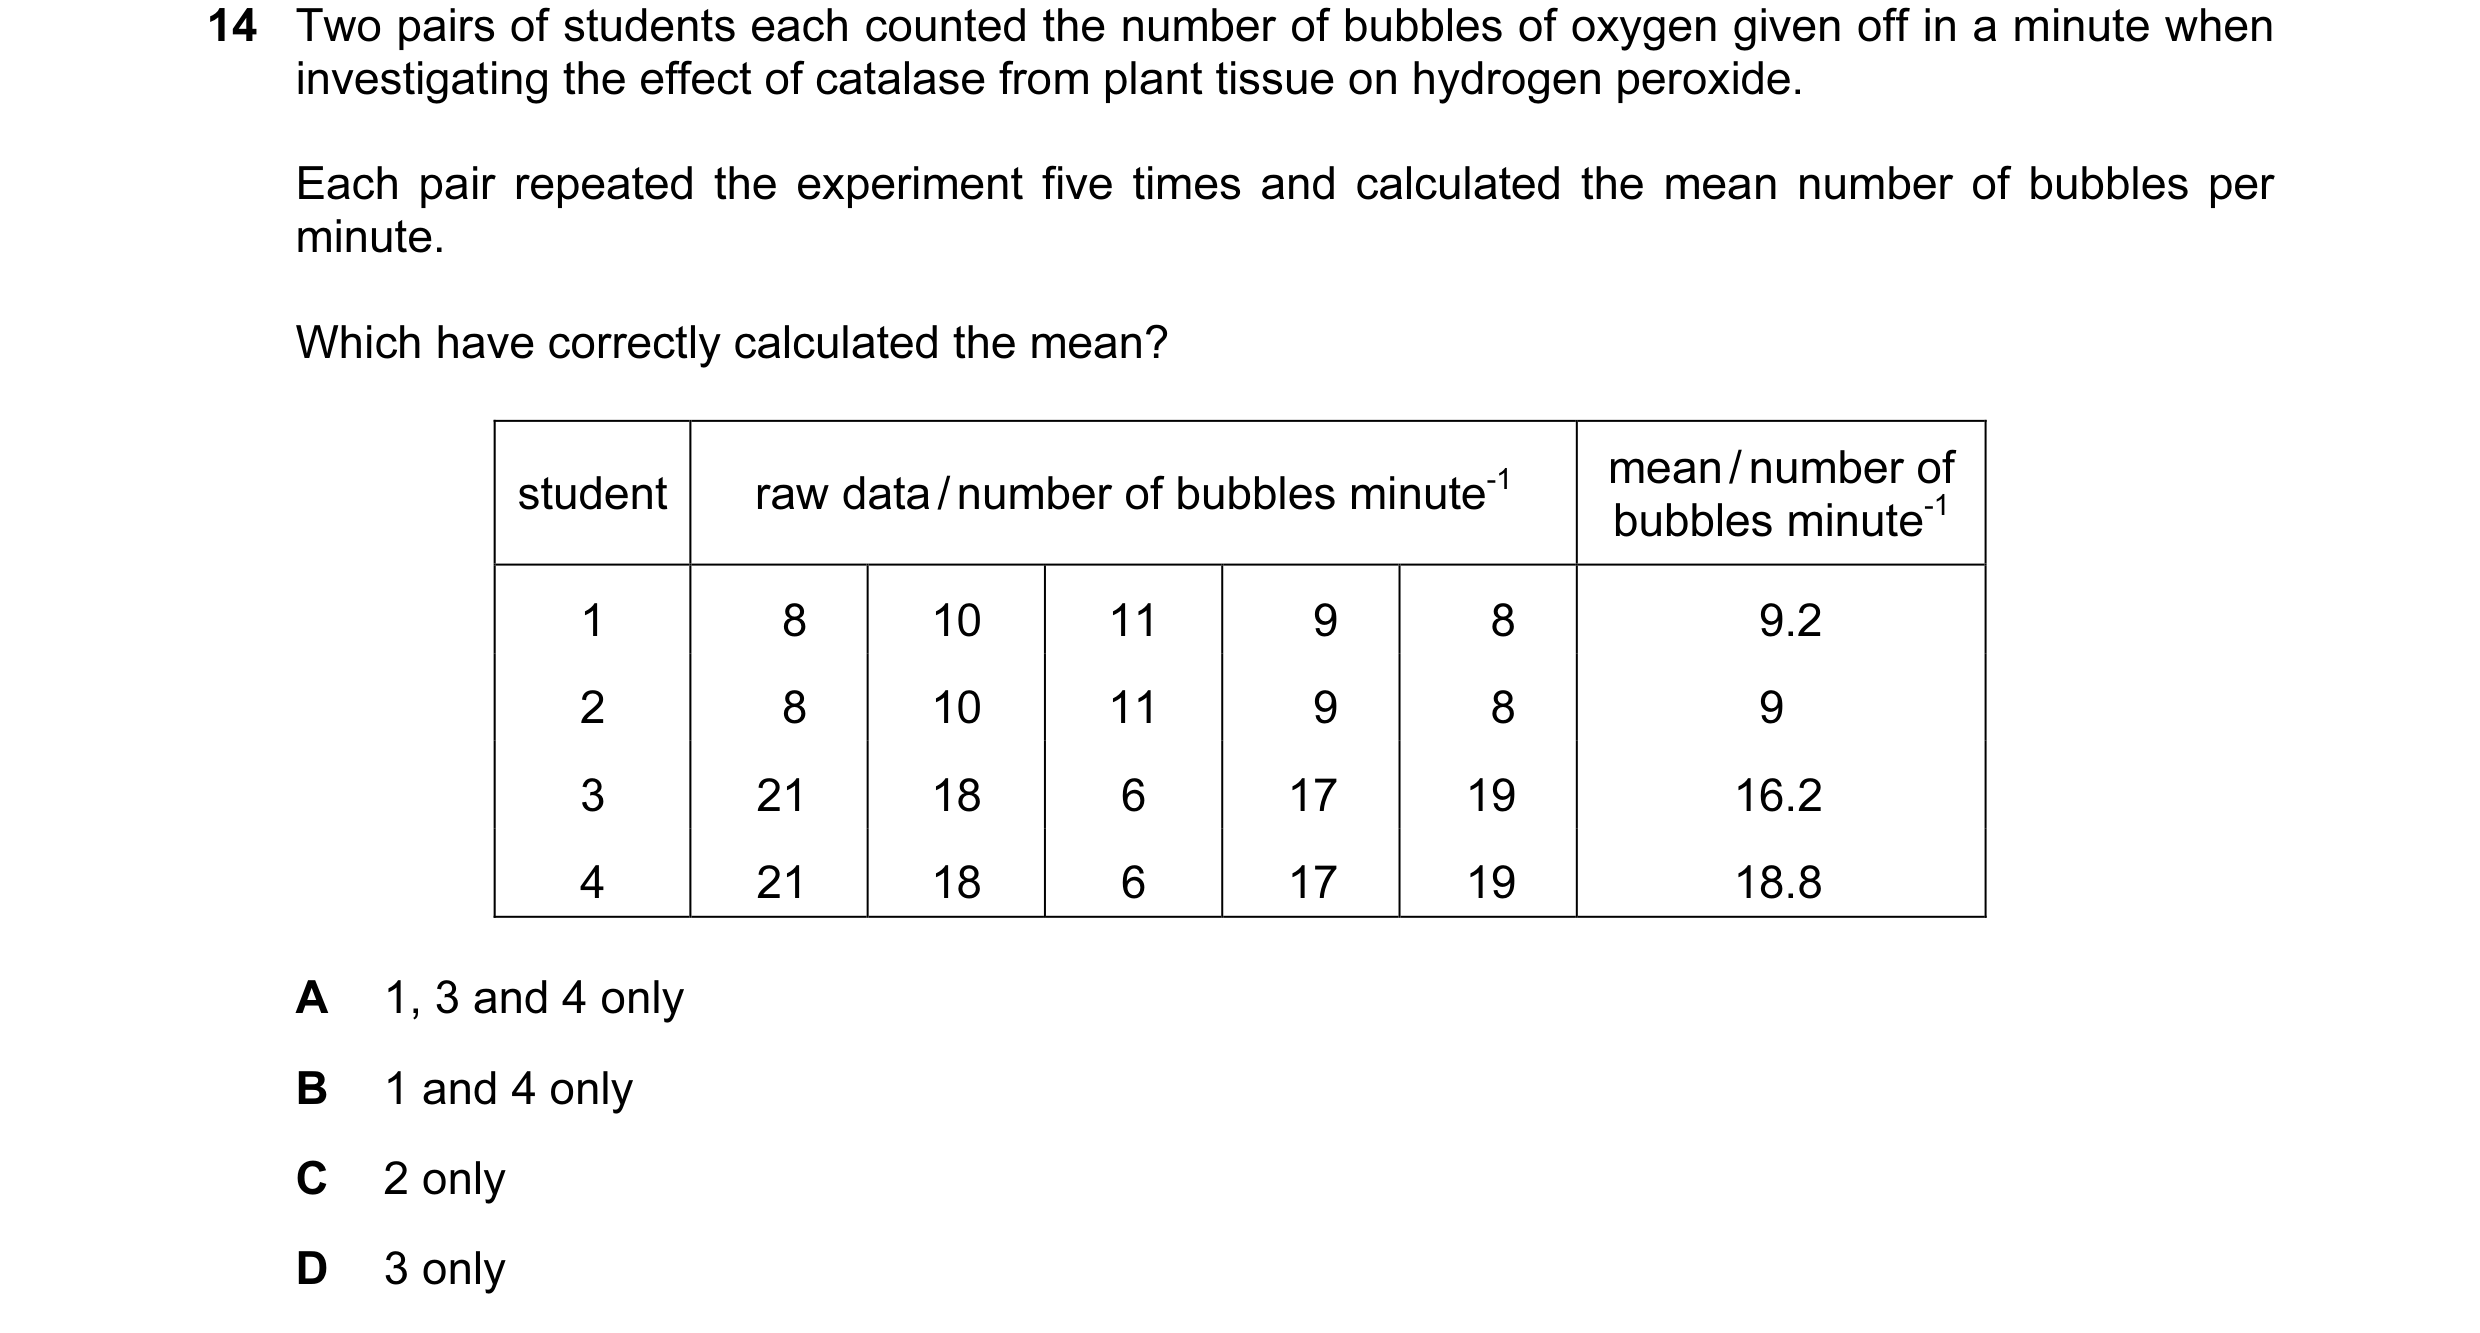
 14 / 76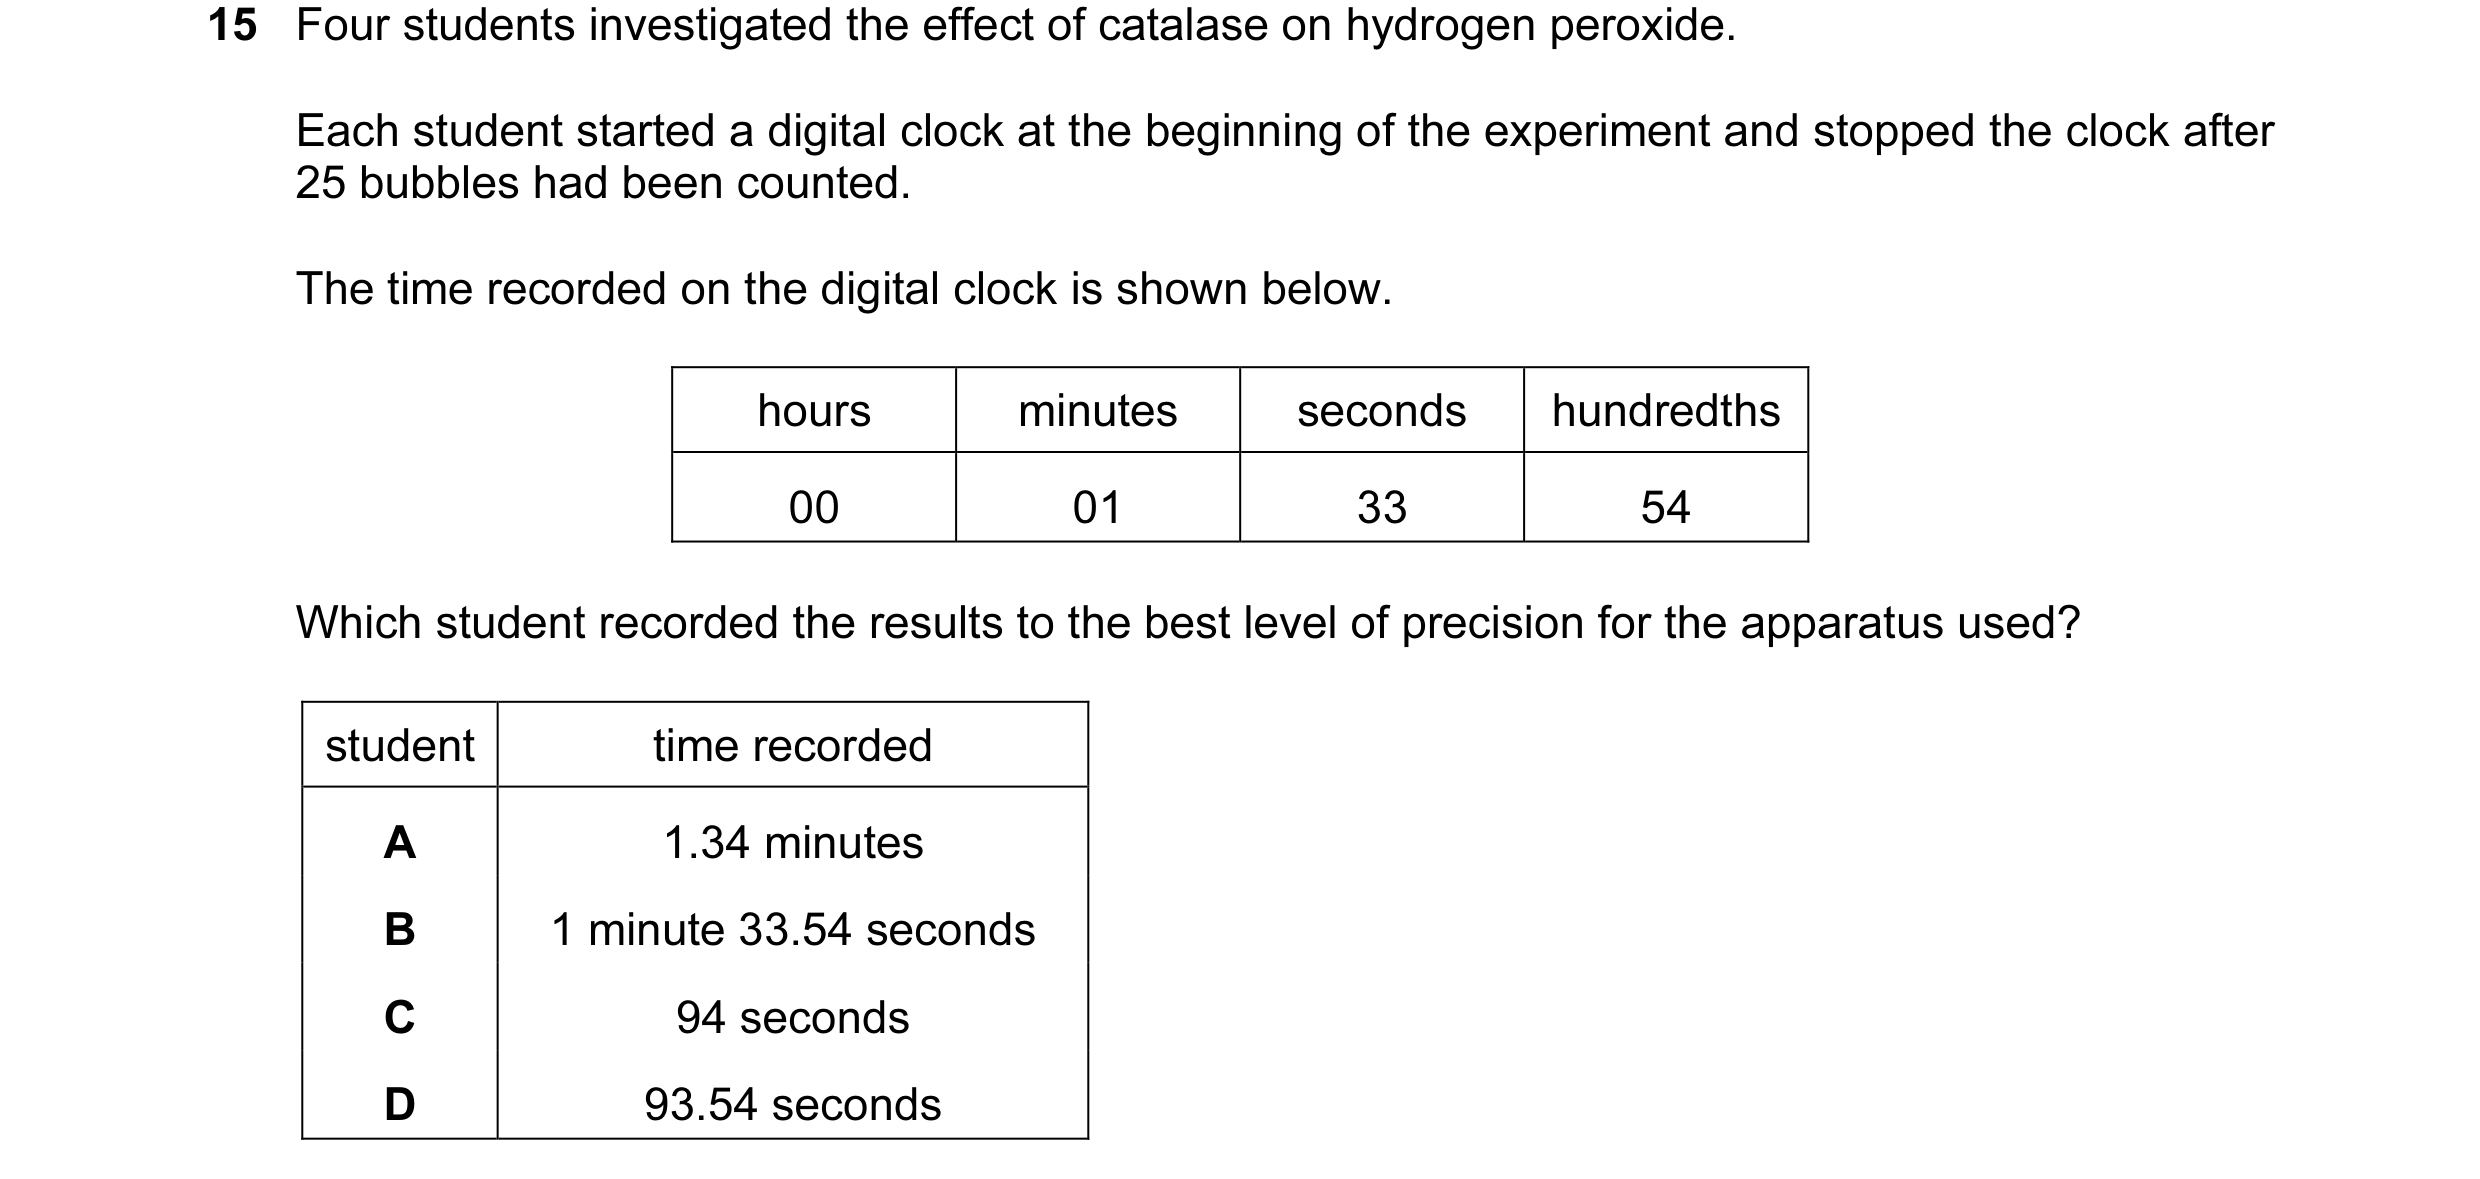
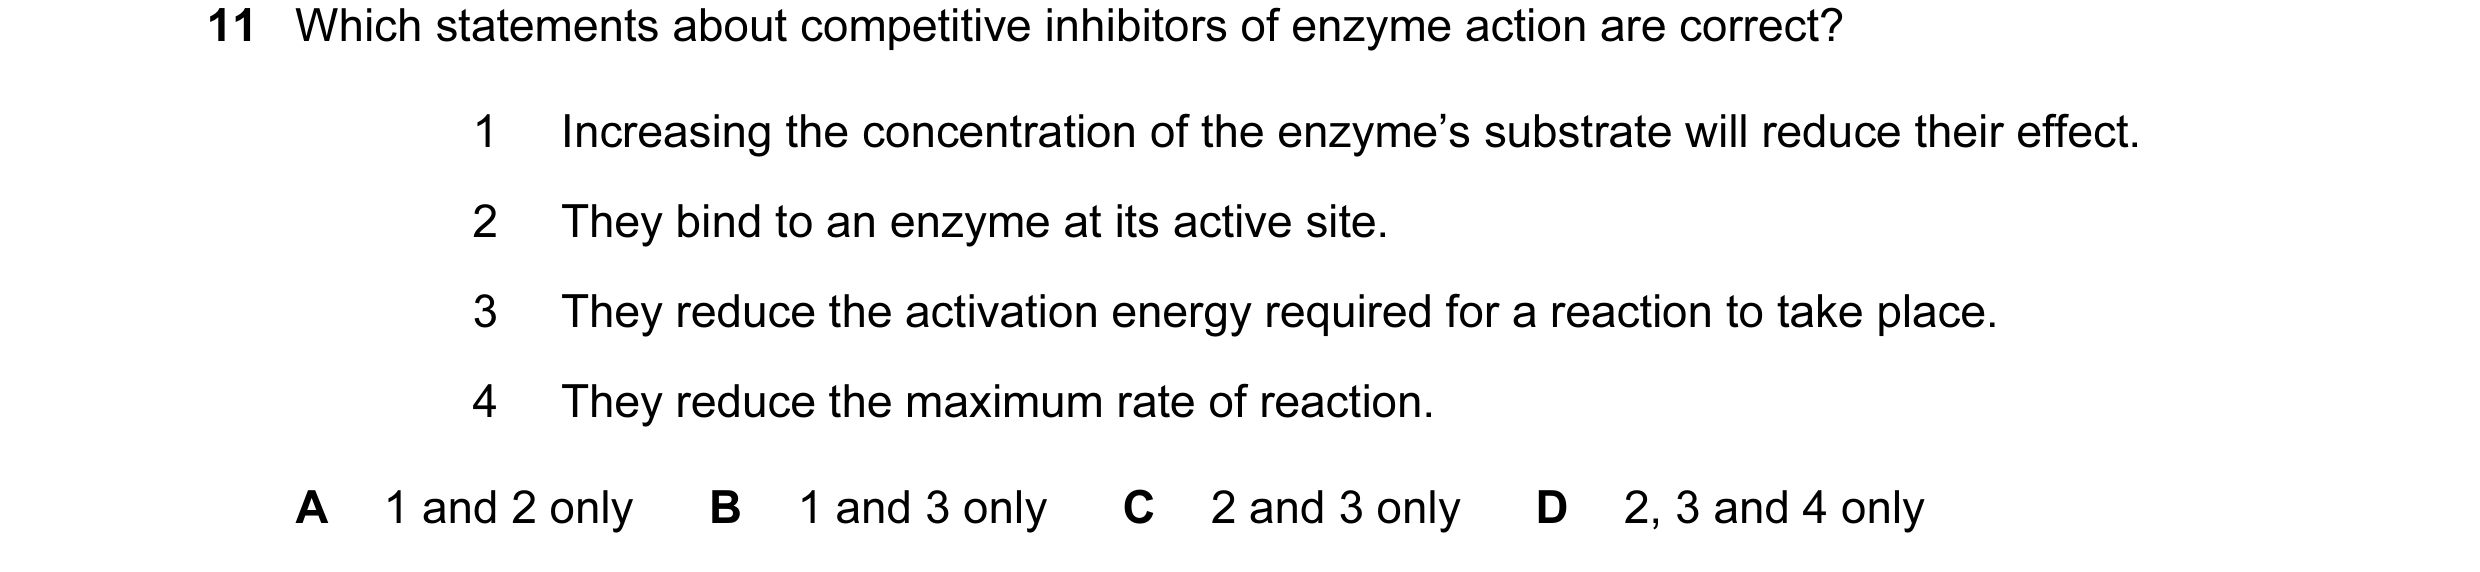 15 / 76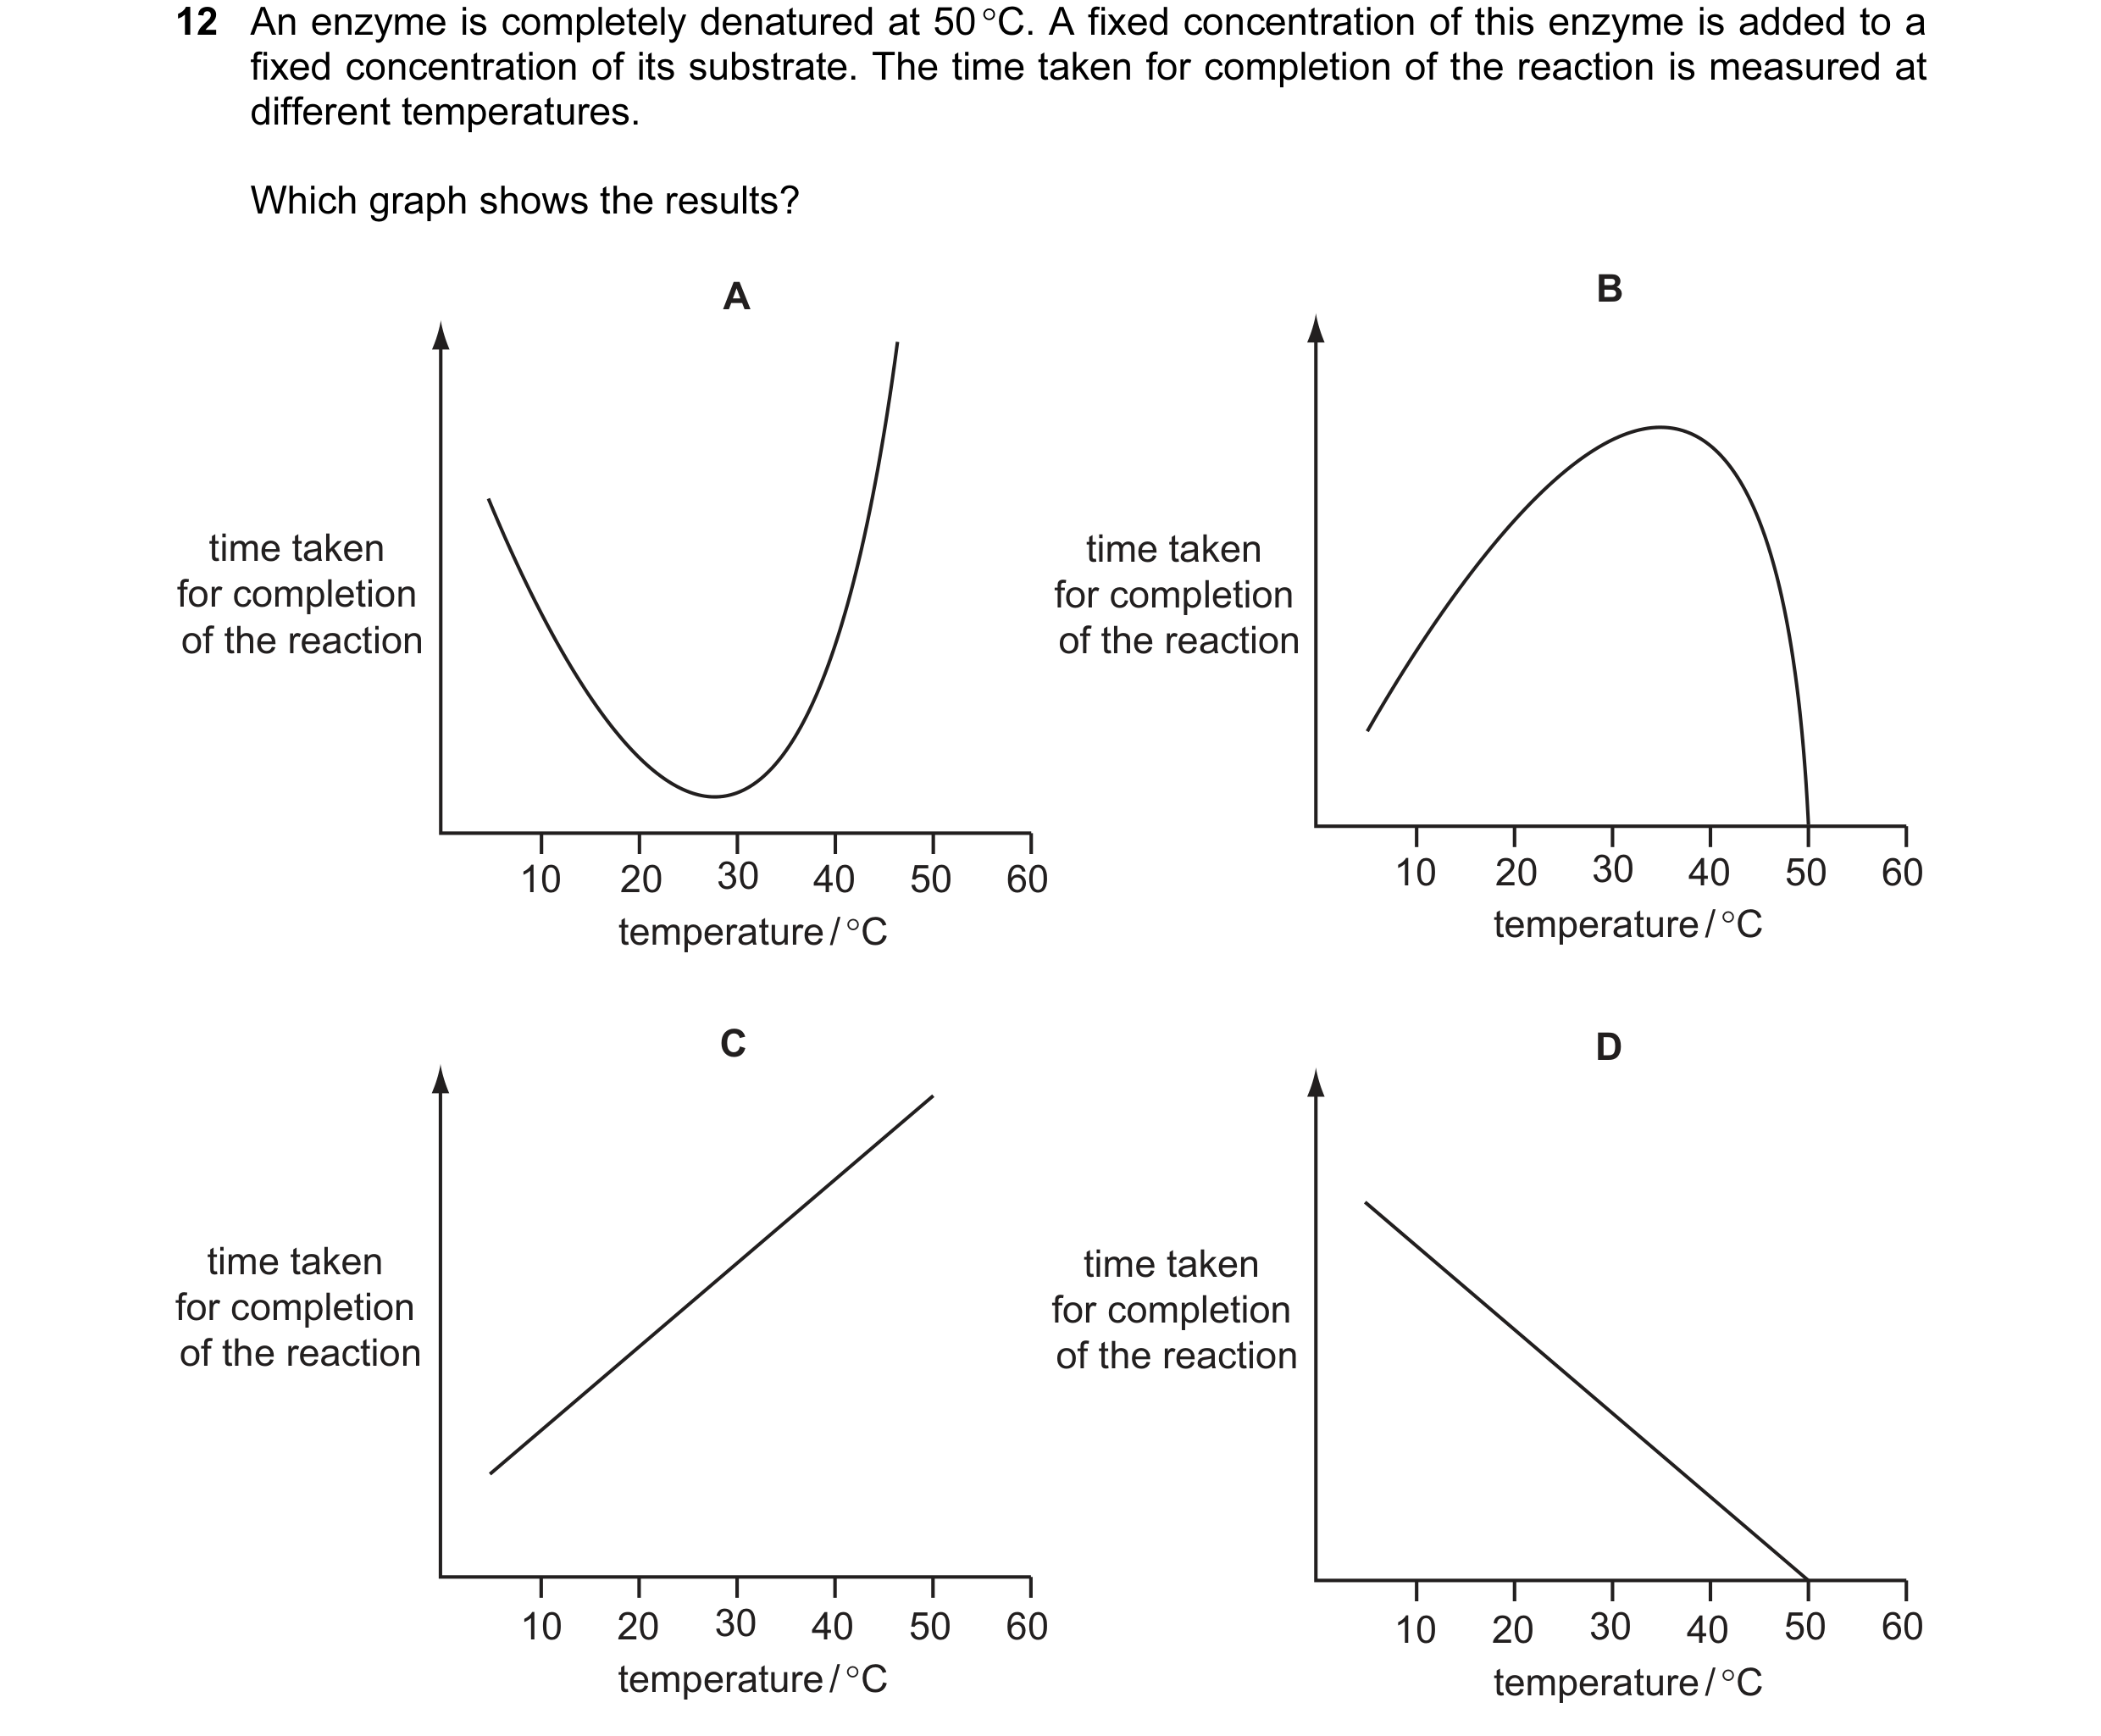

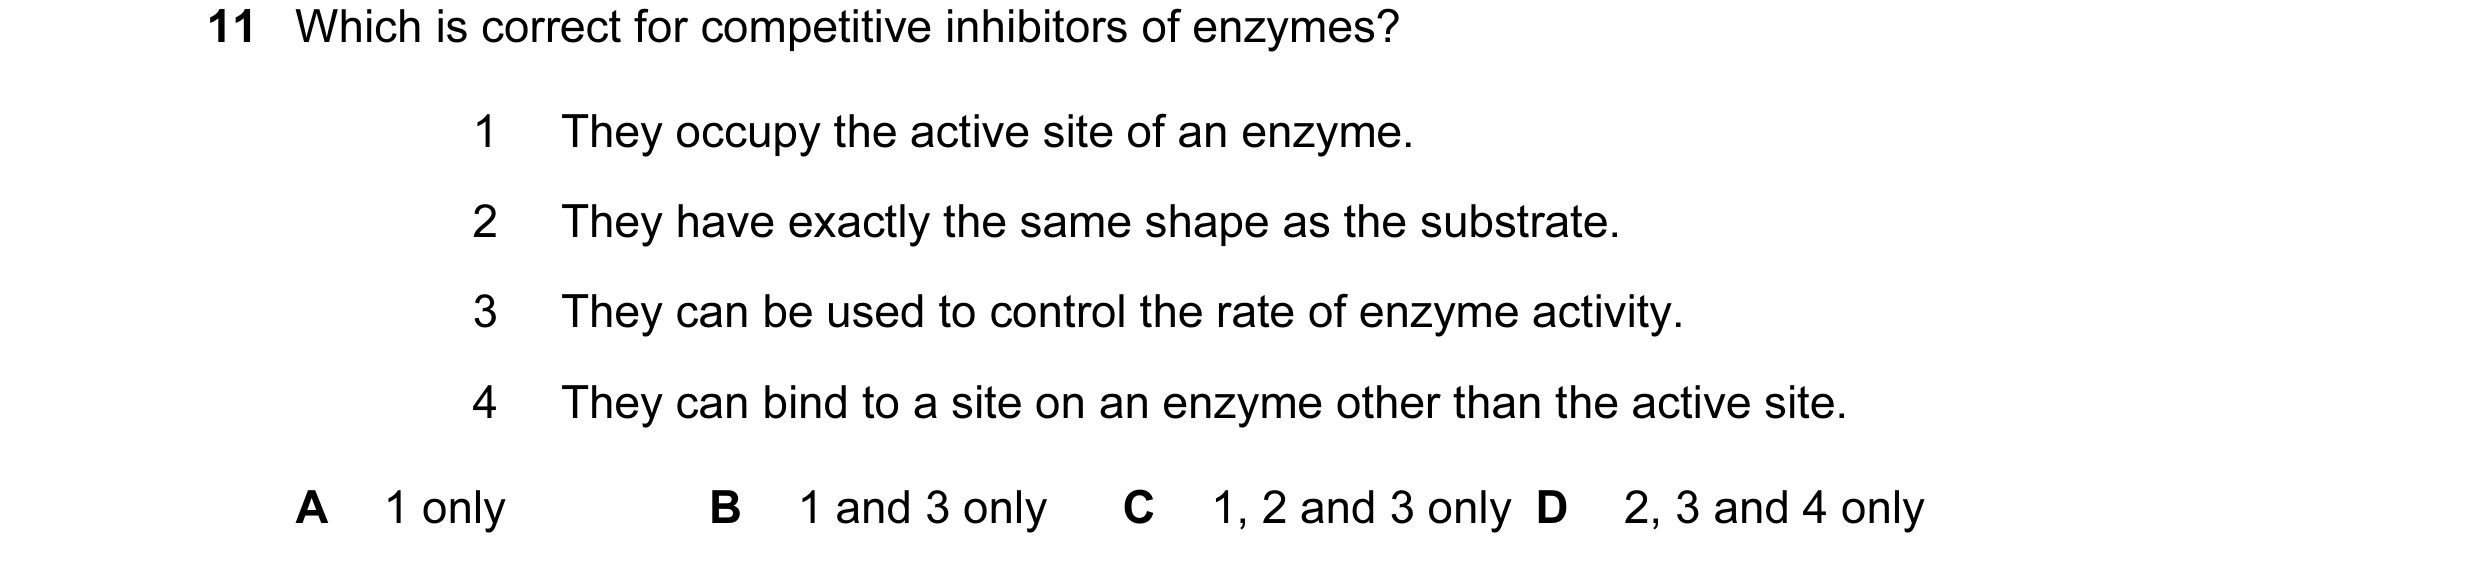 16 / 76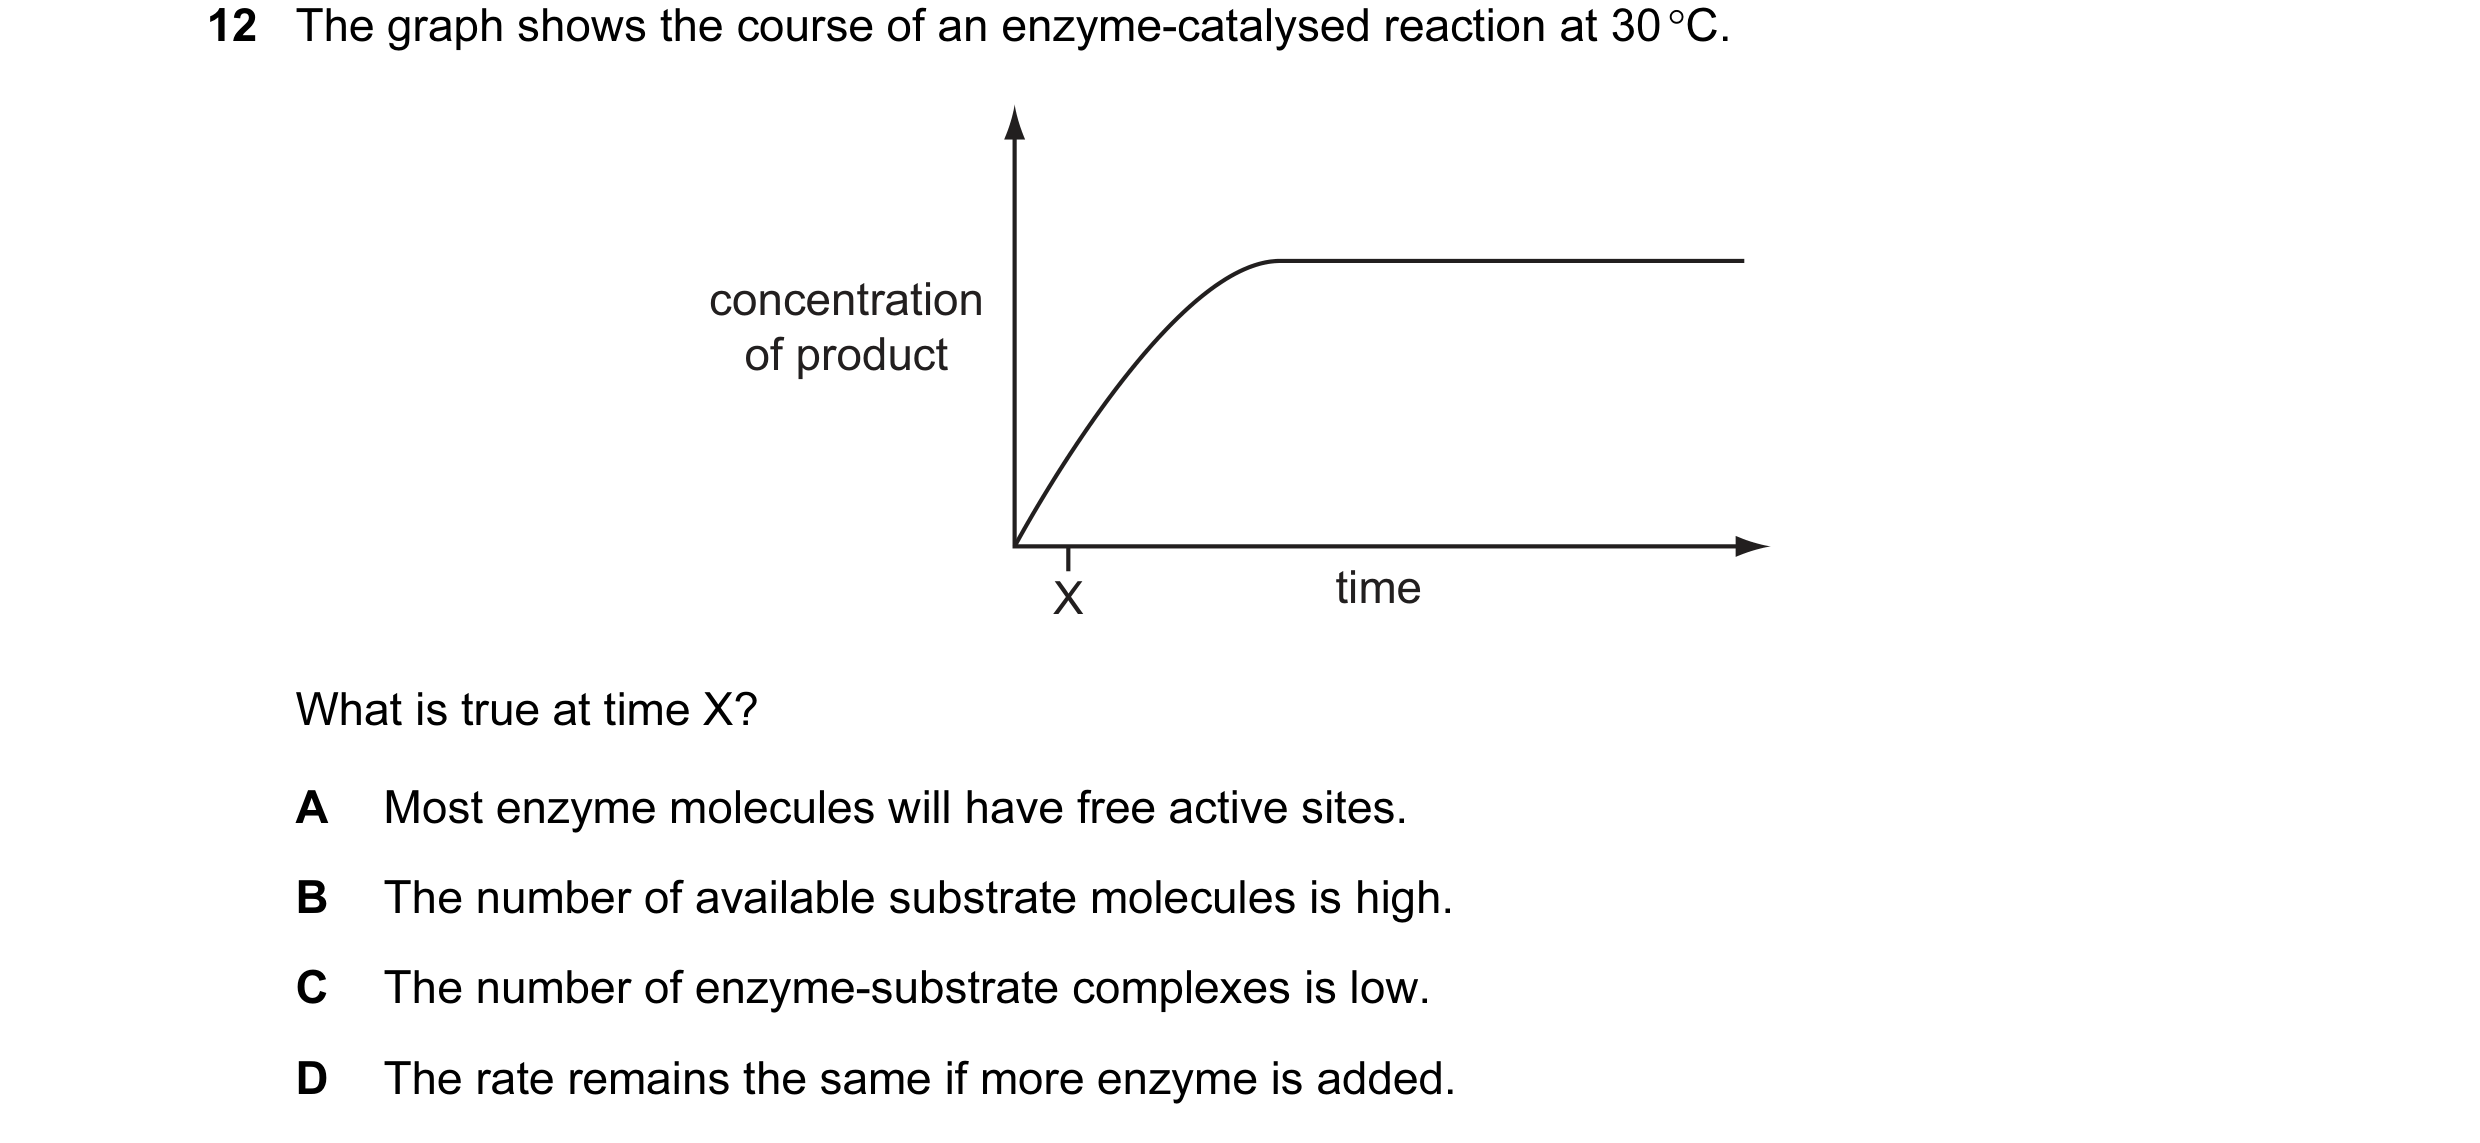
 17 / 76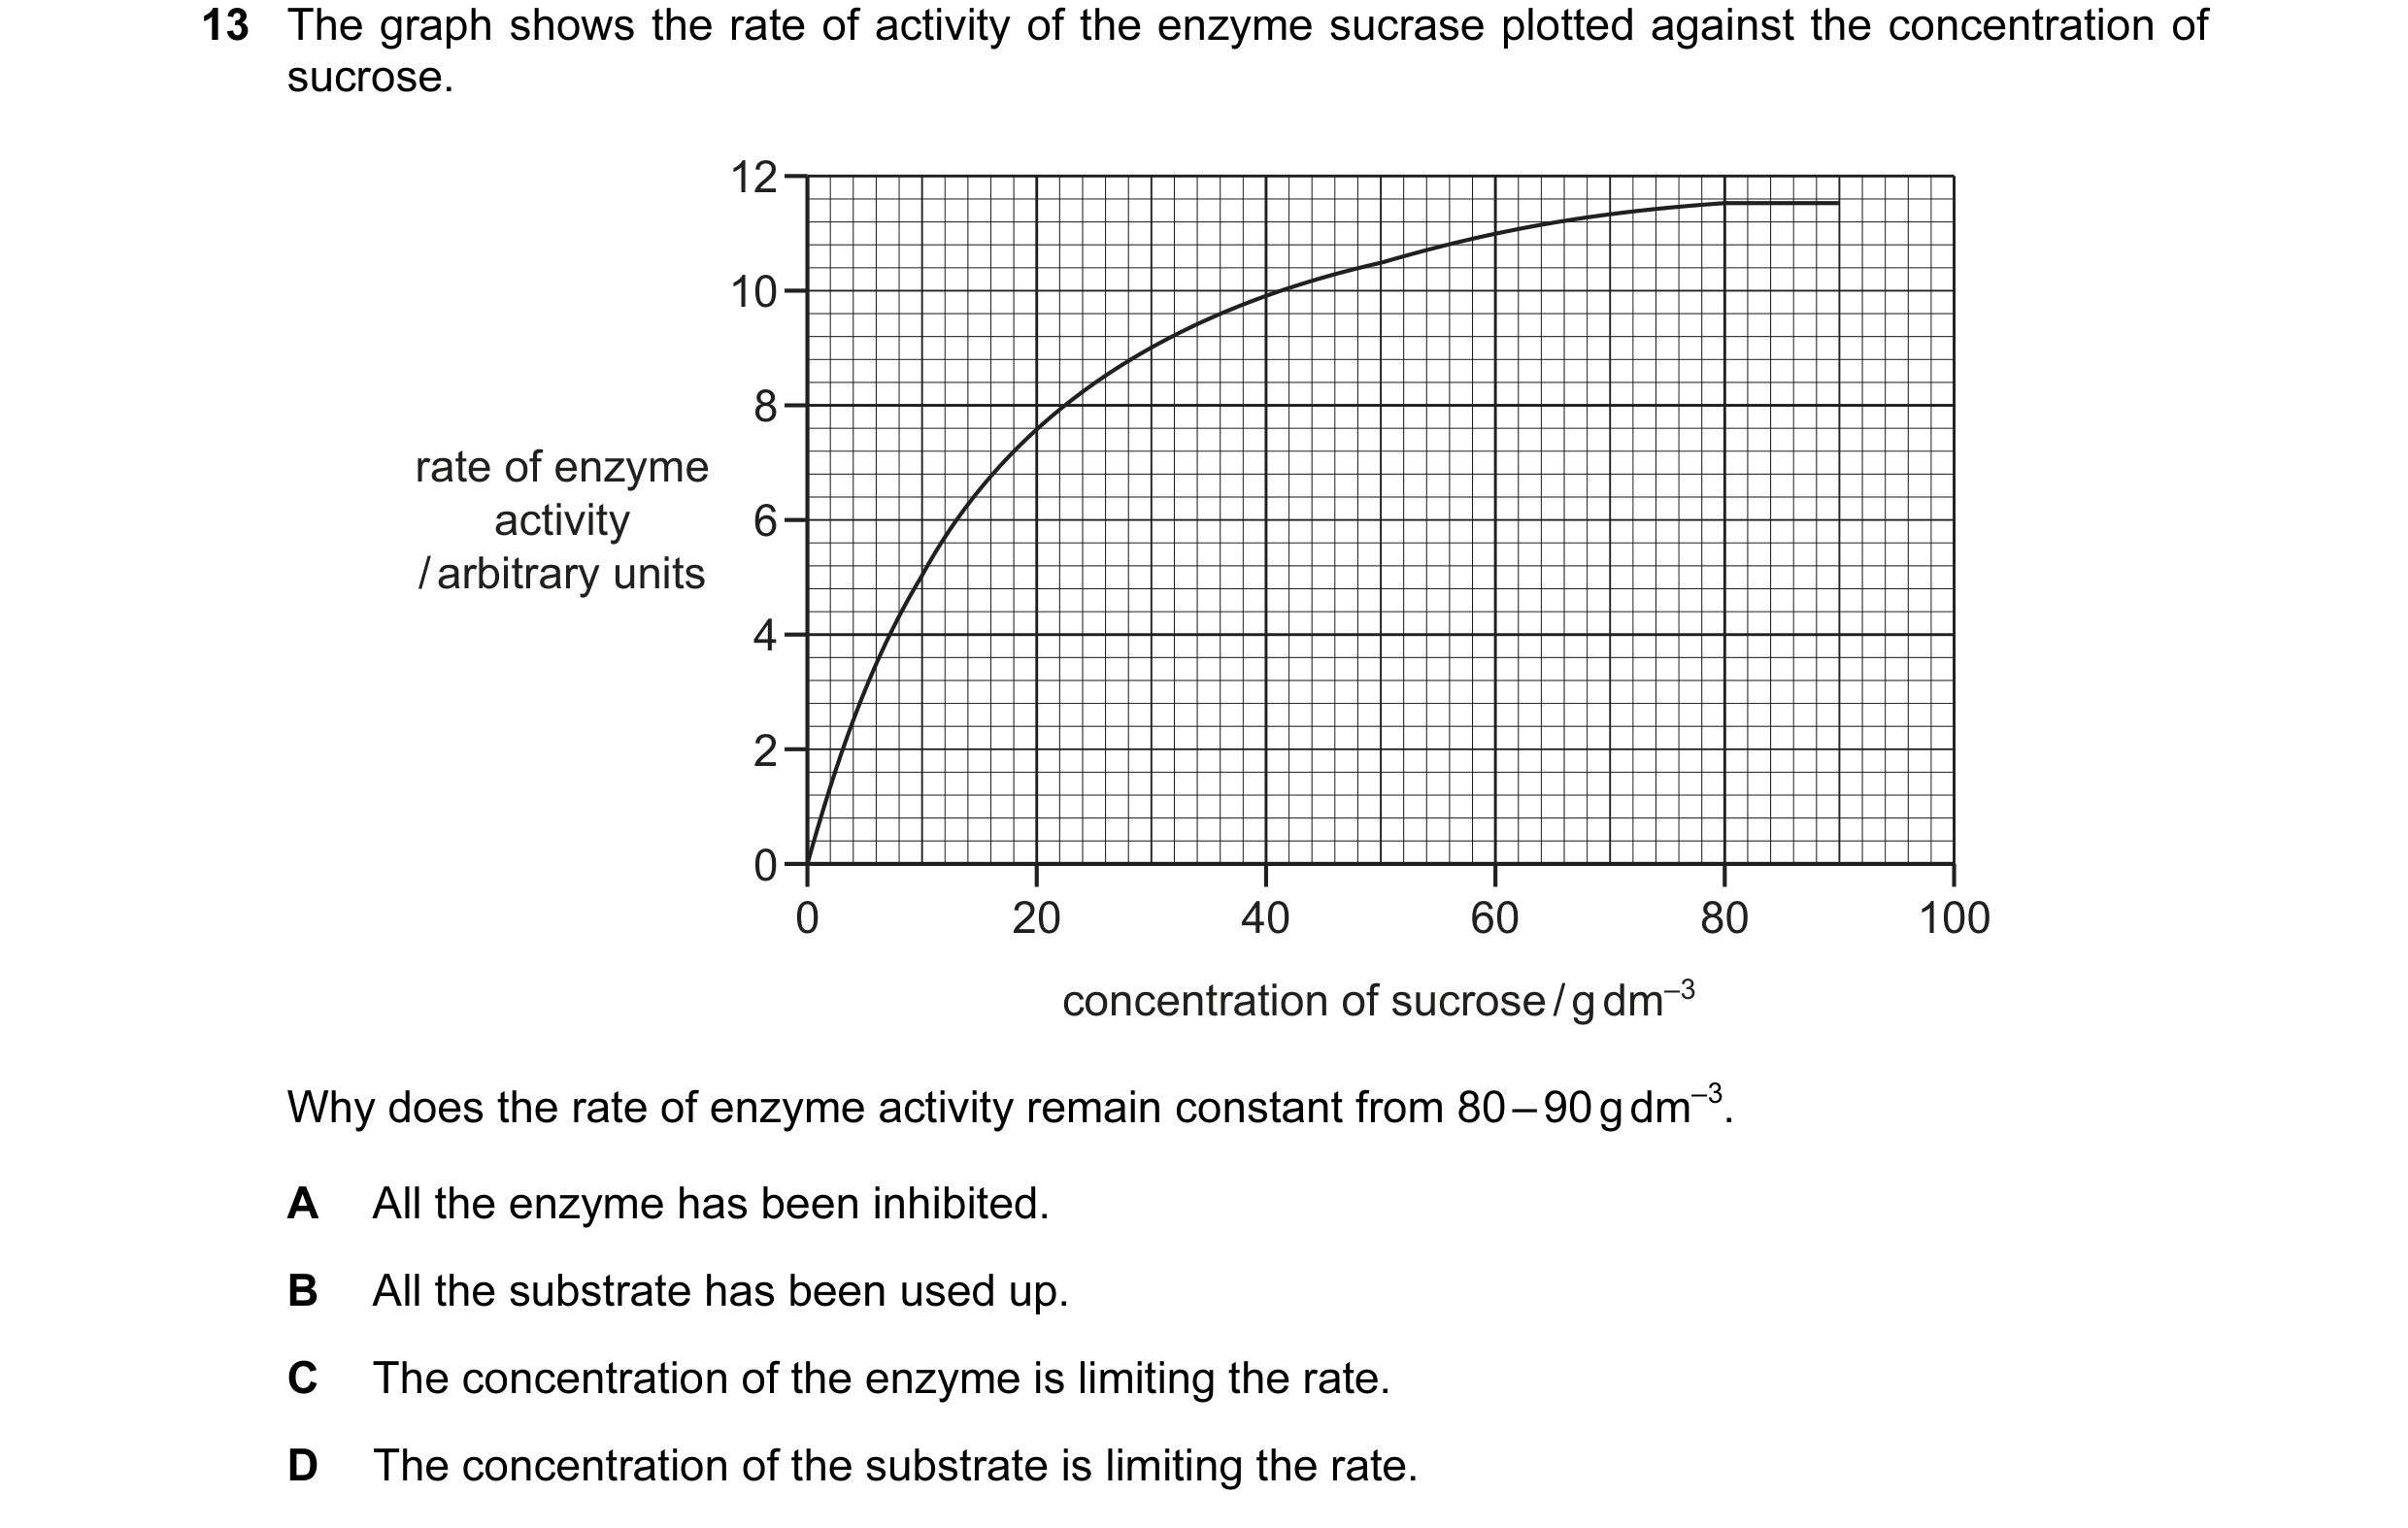
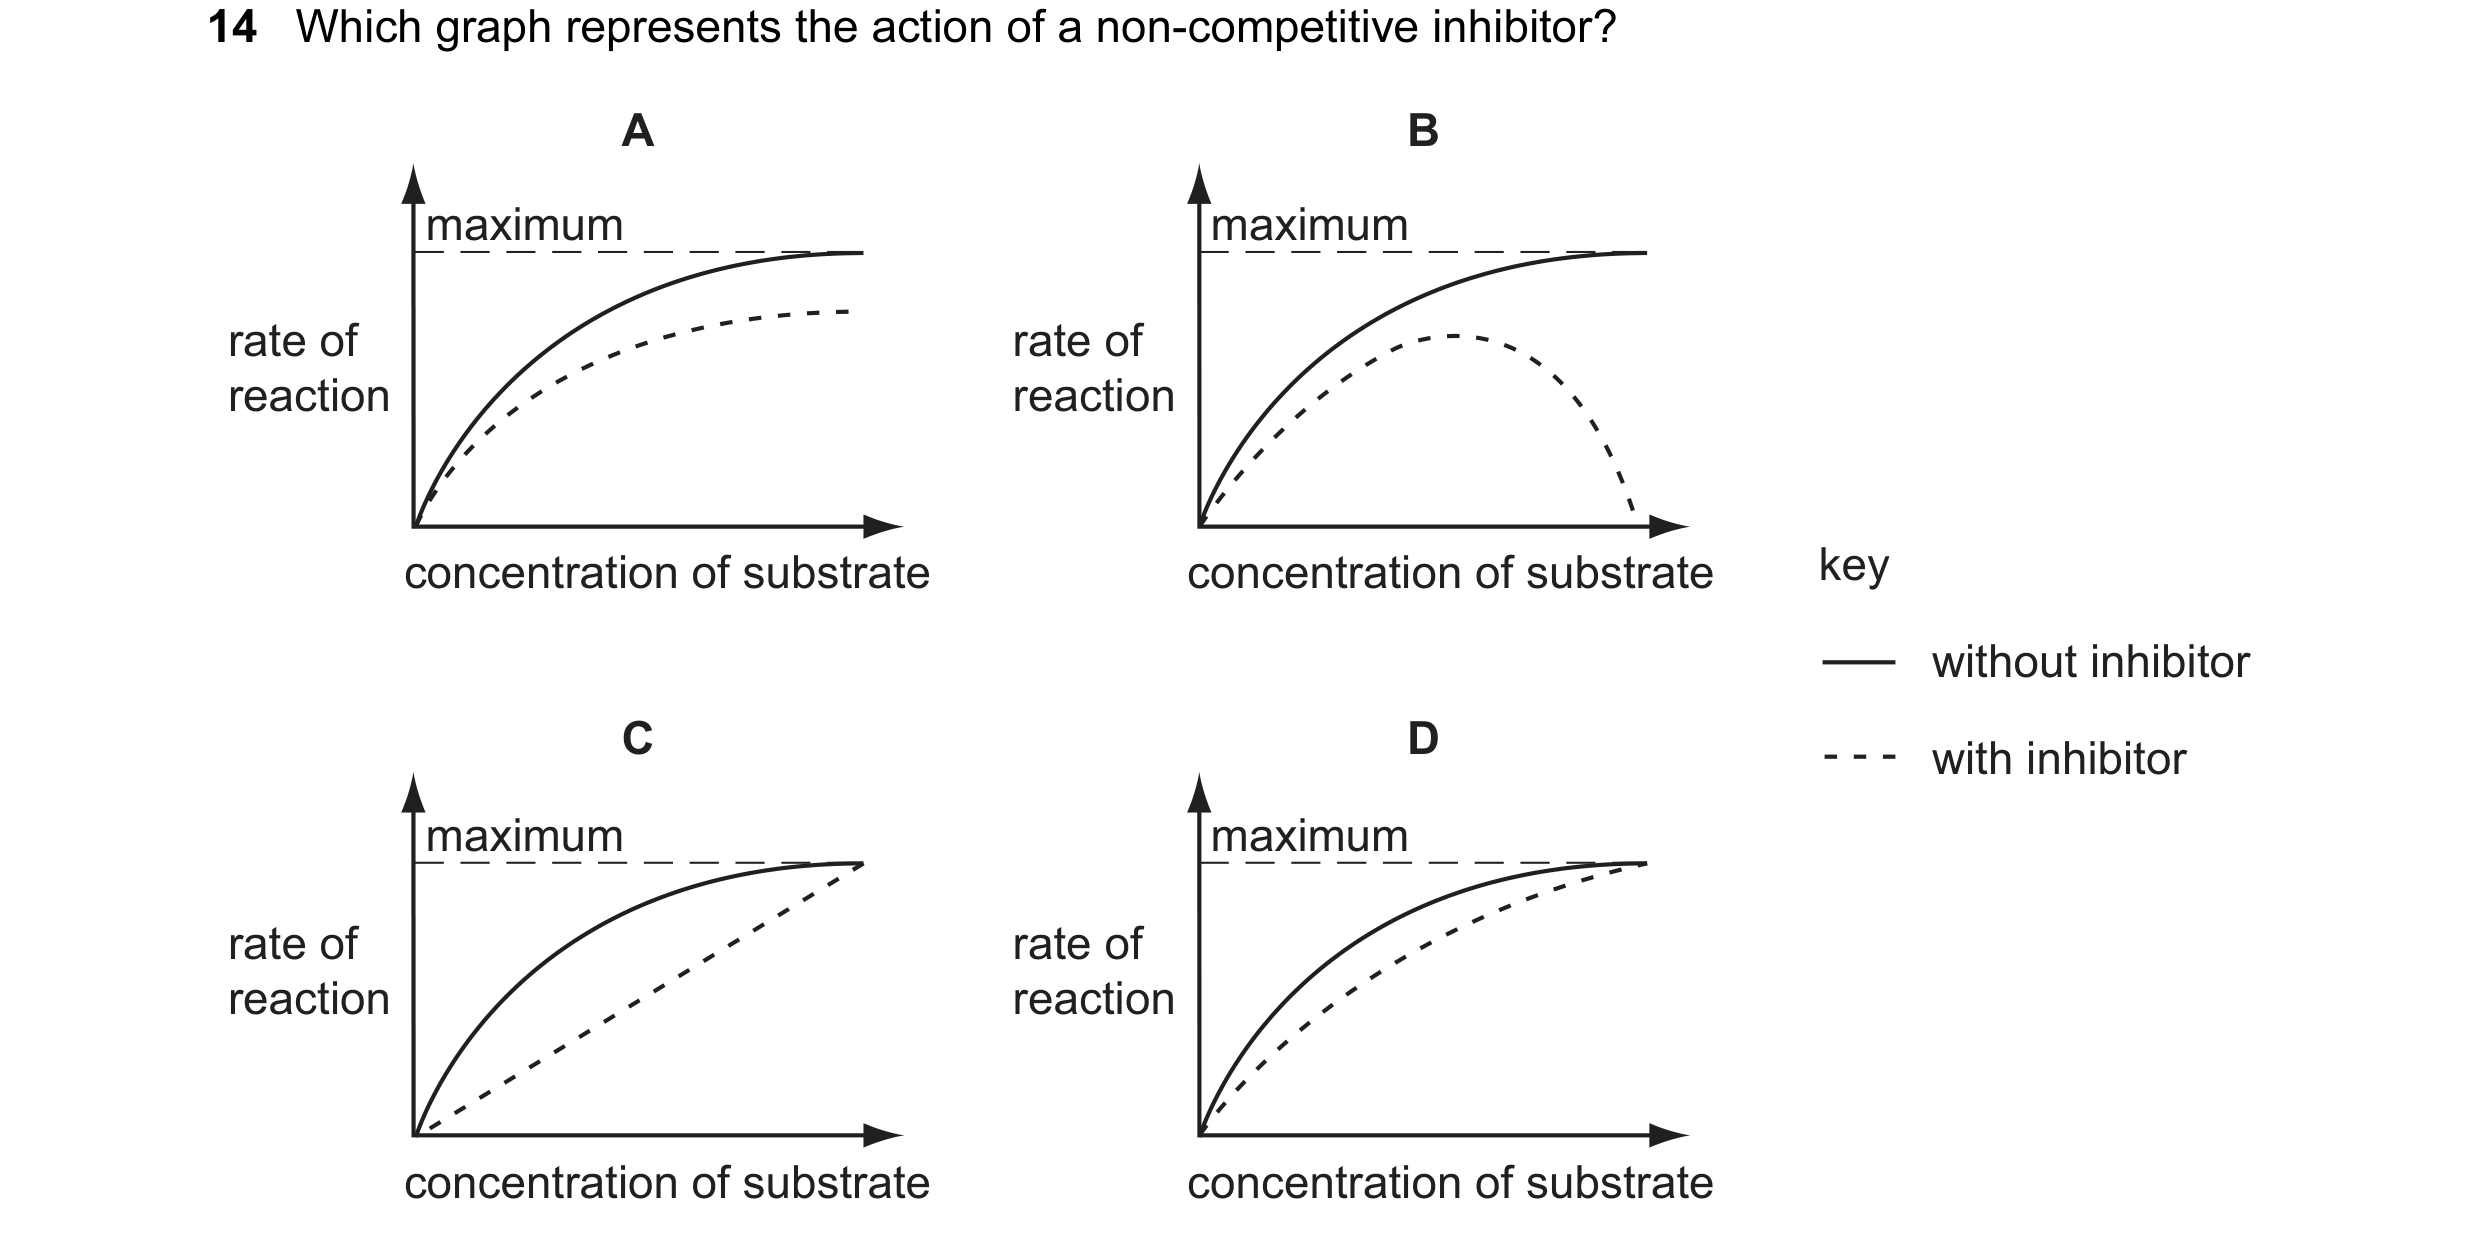
 18 / 76
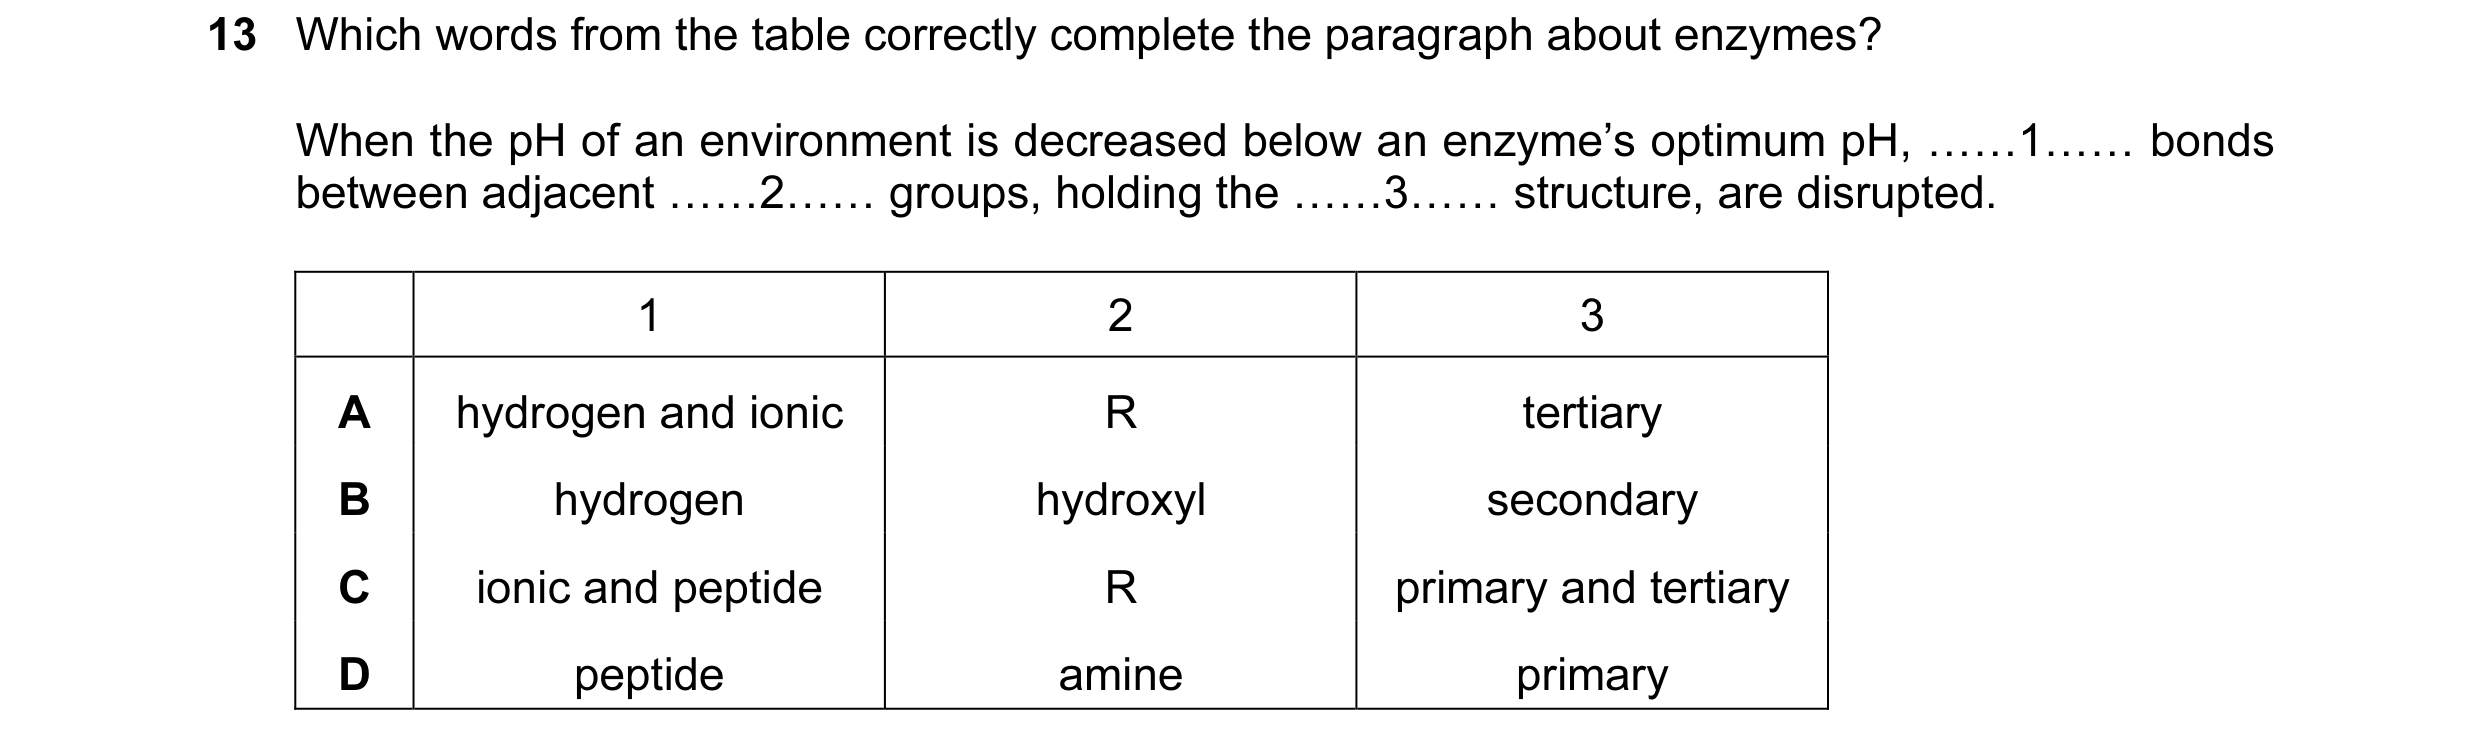 19 / 76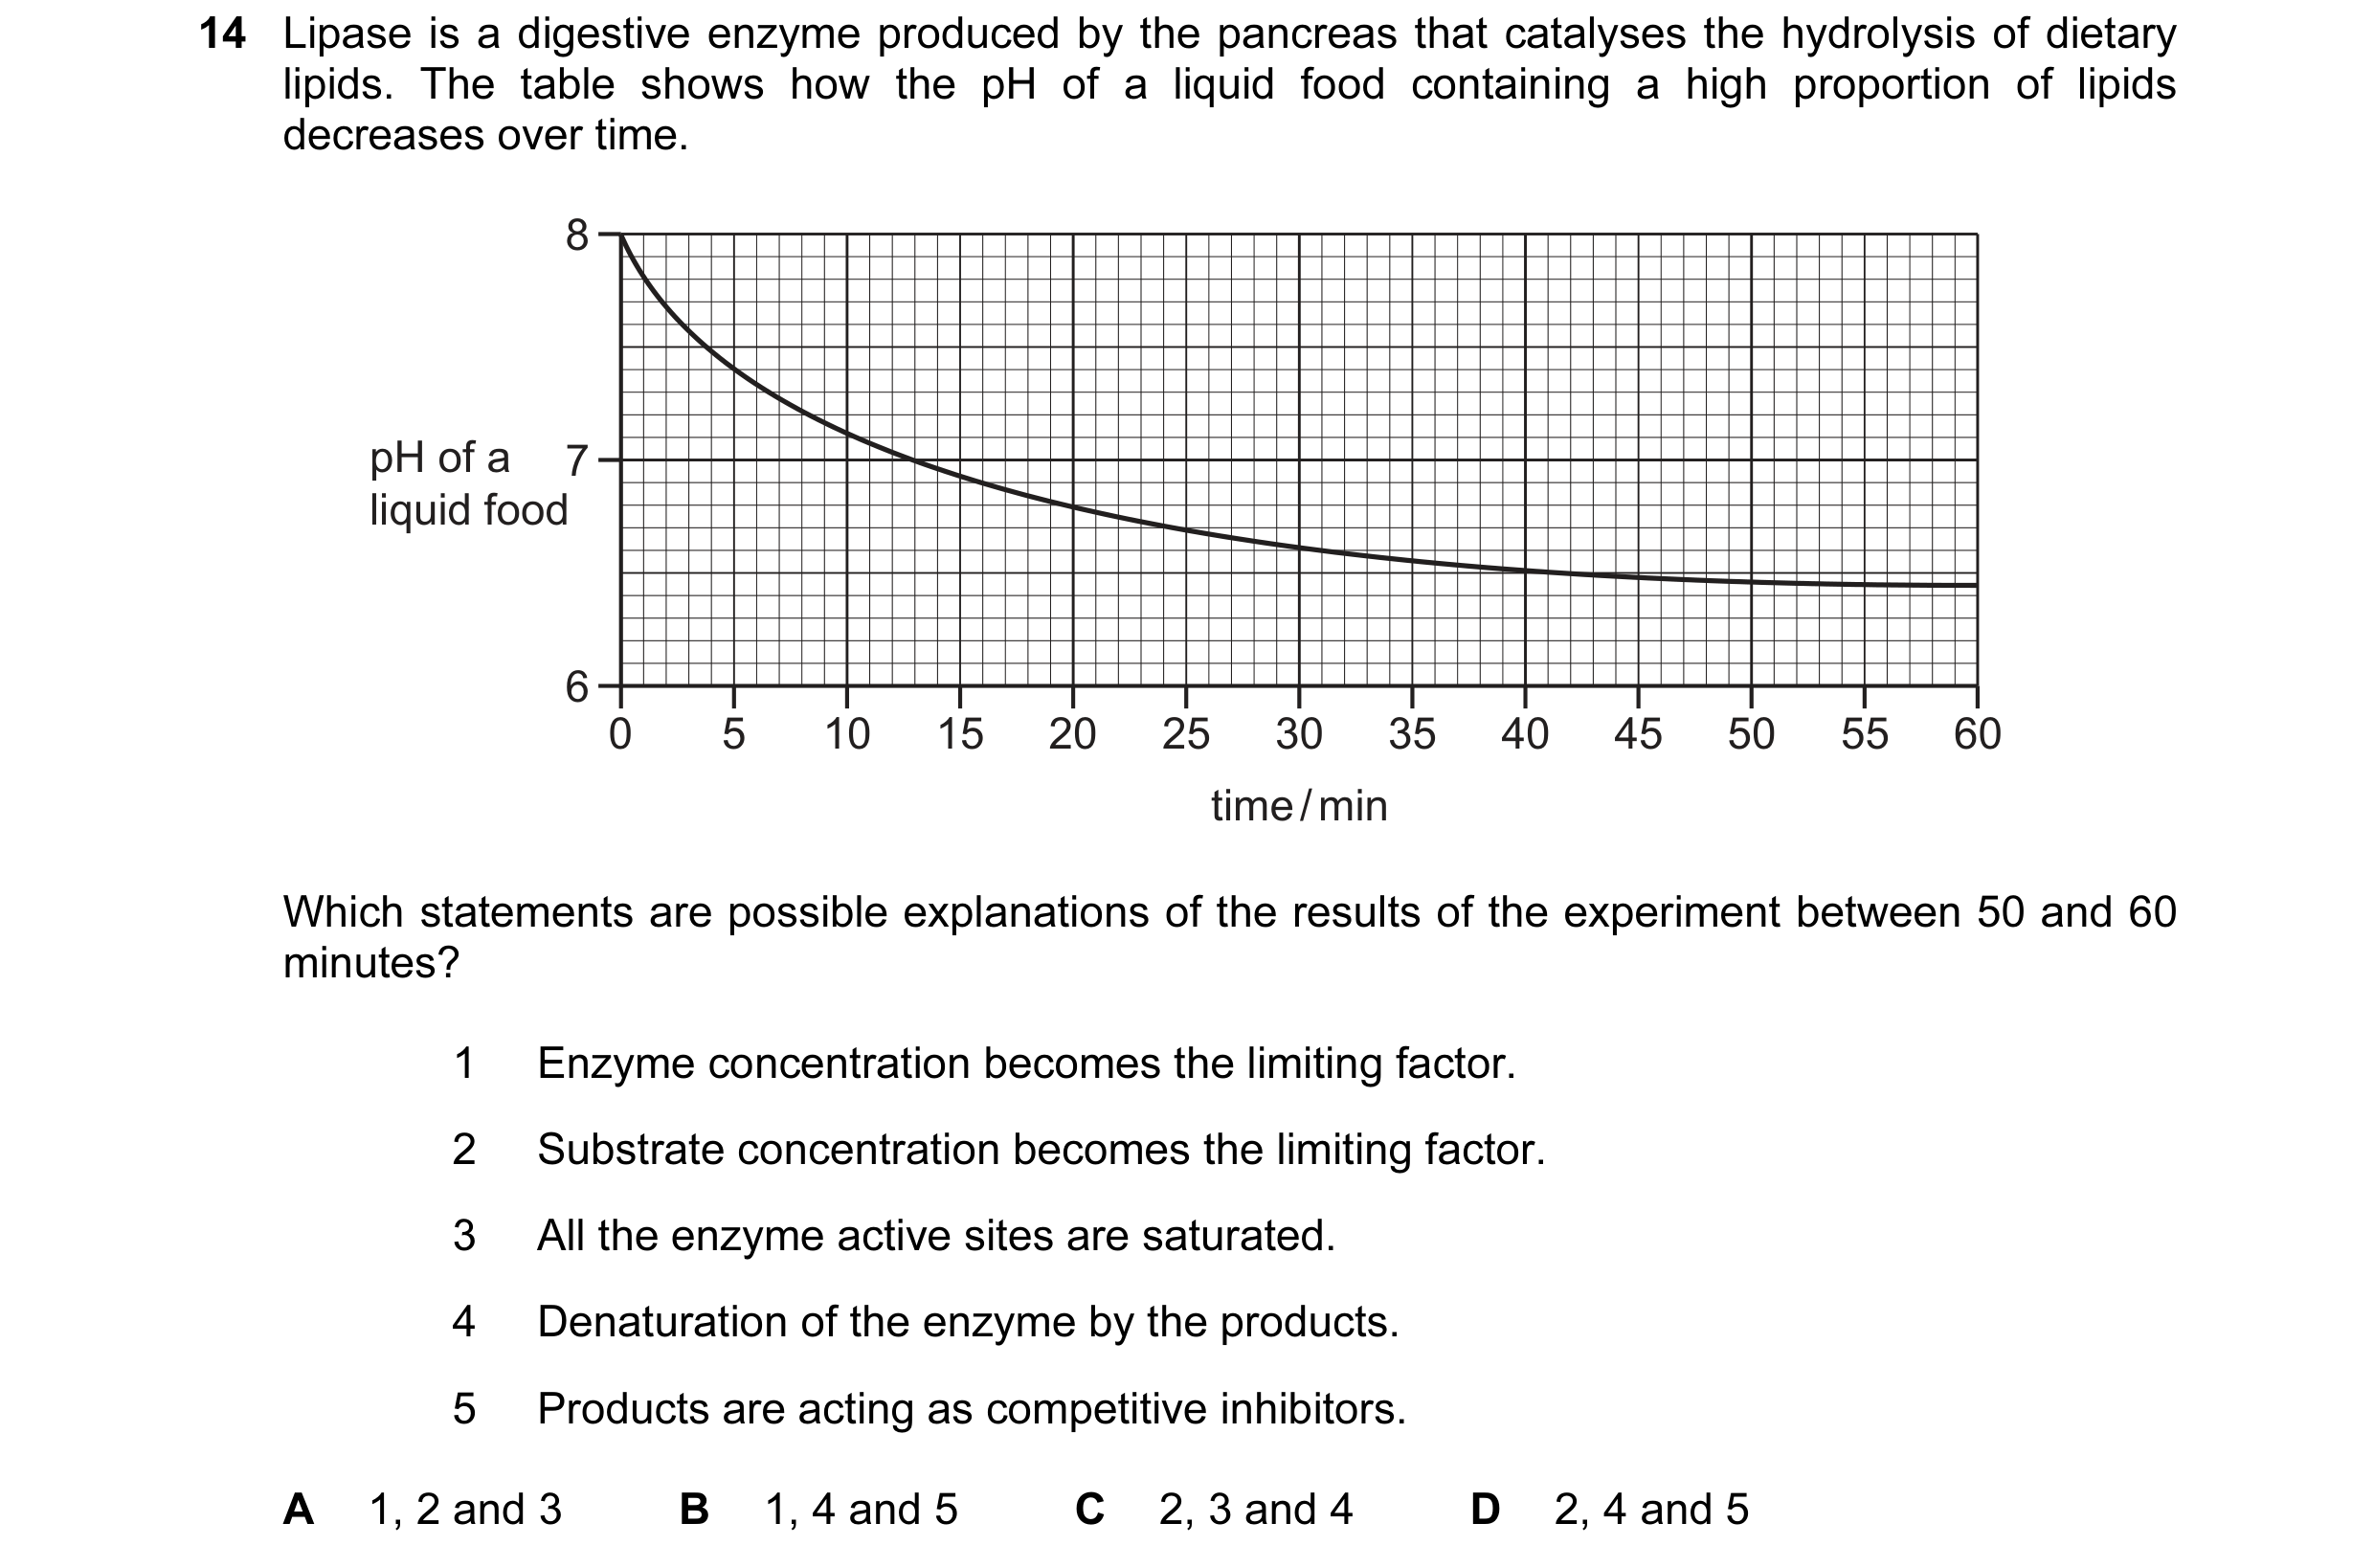
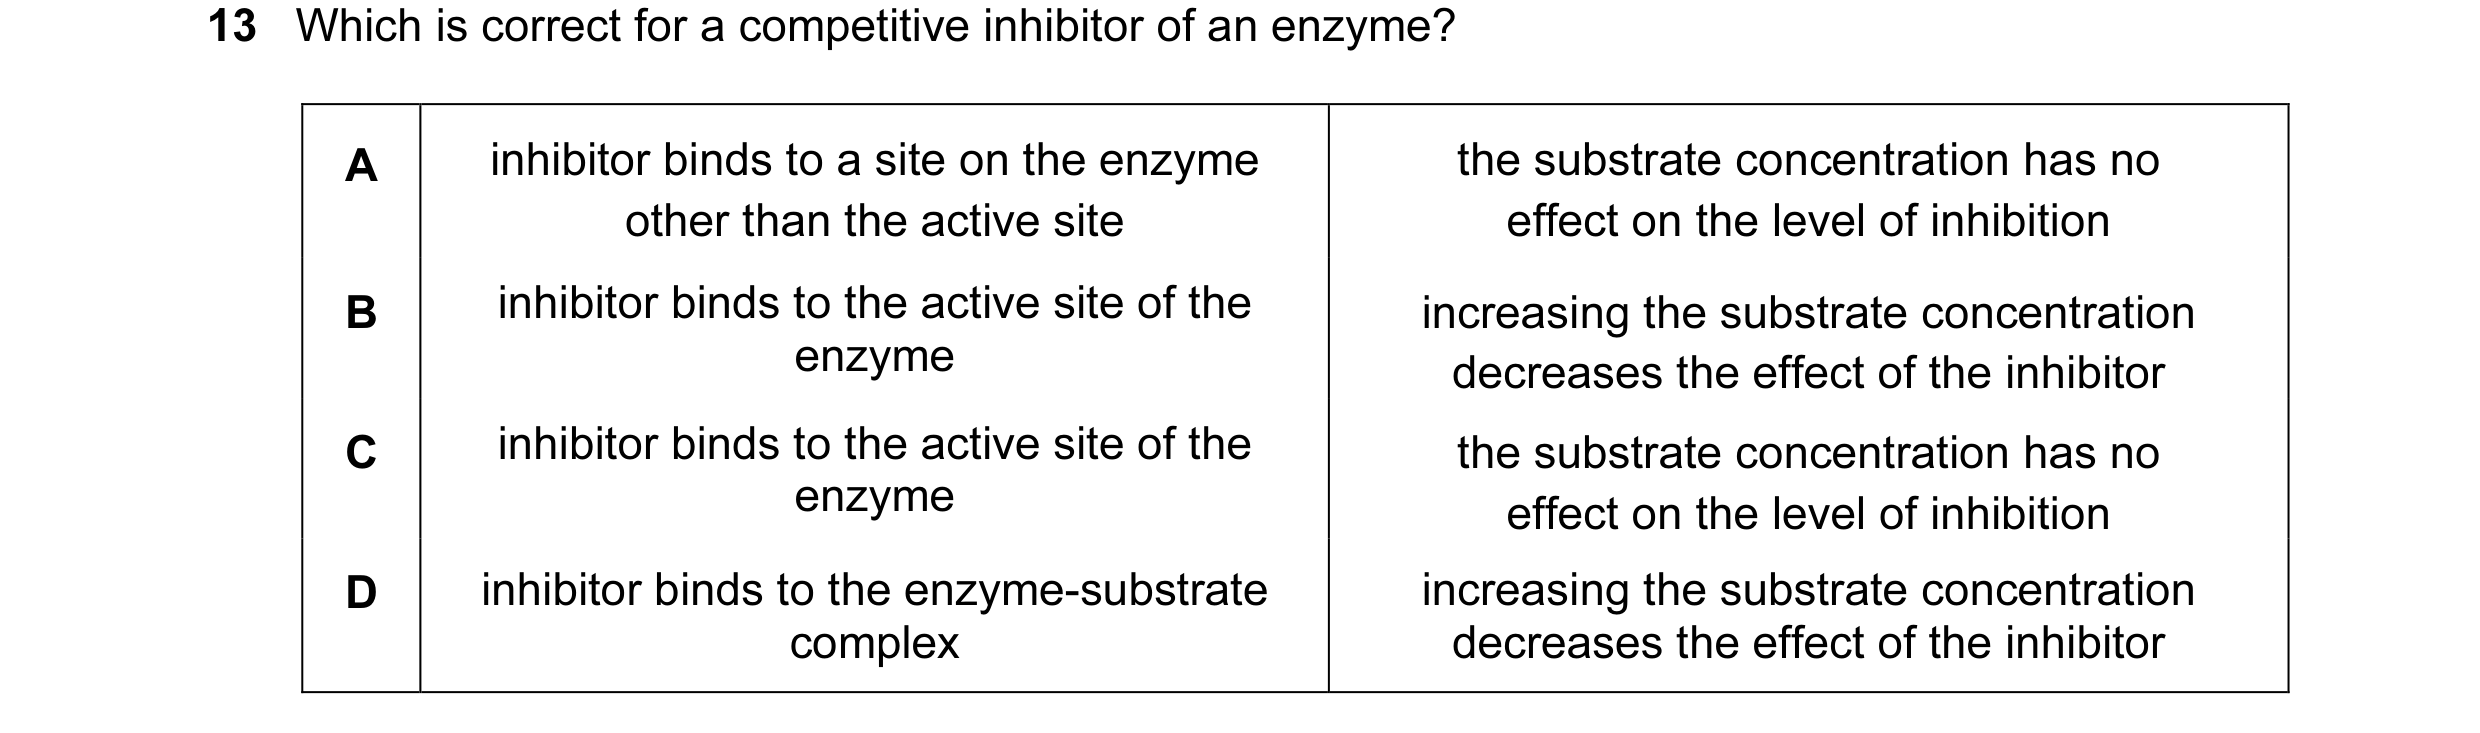
 20 / 76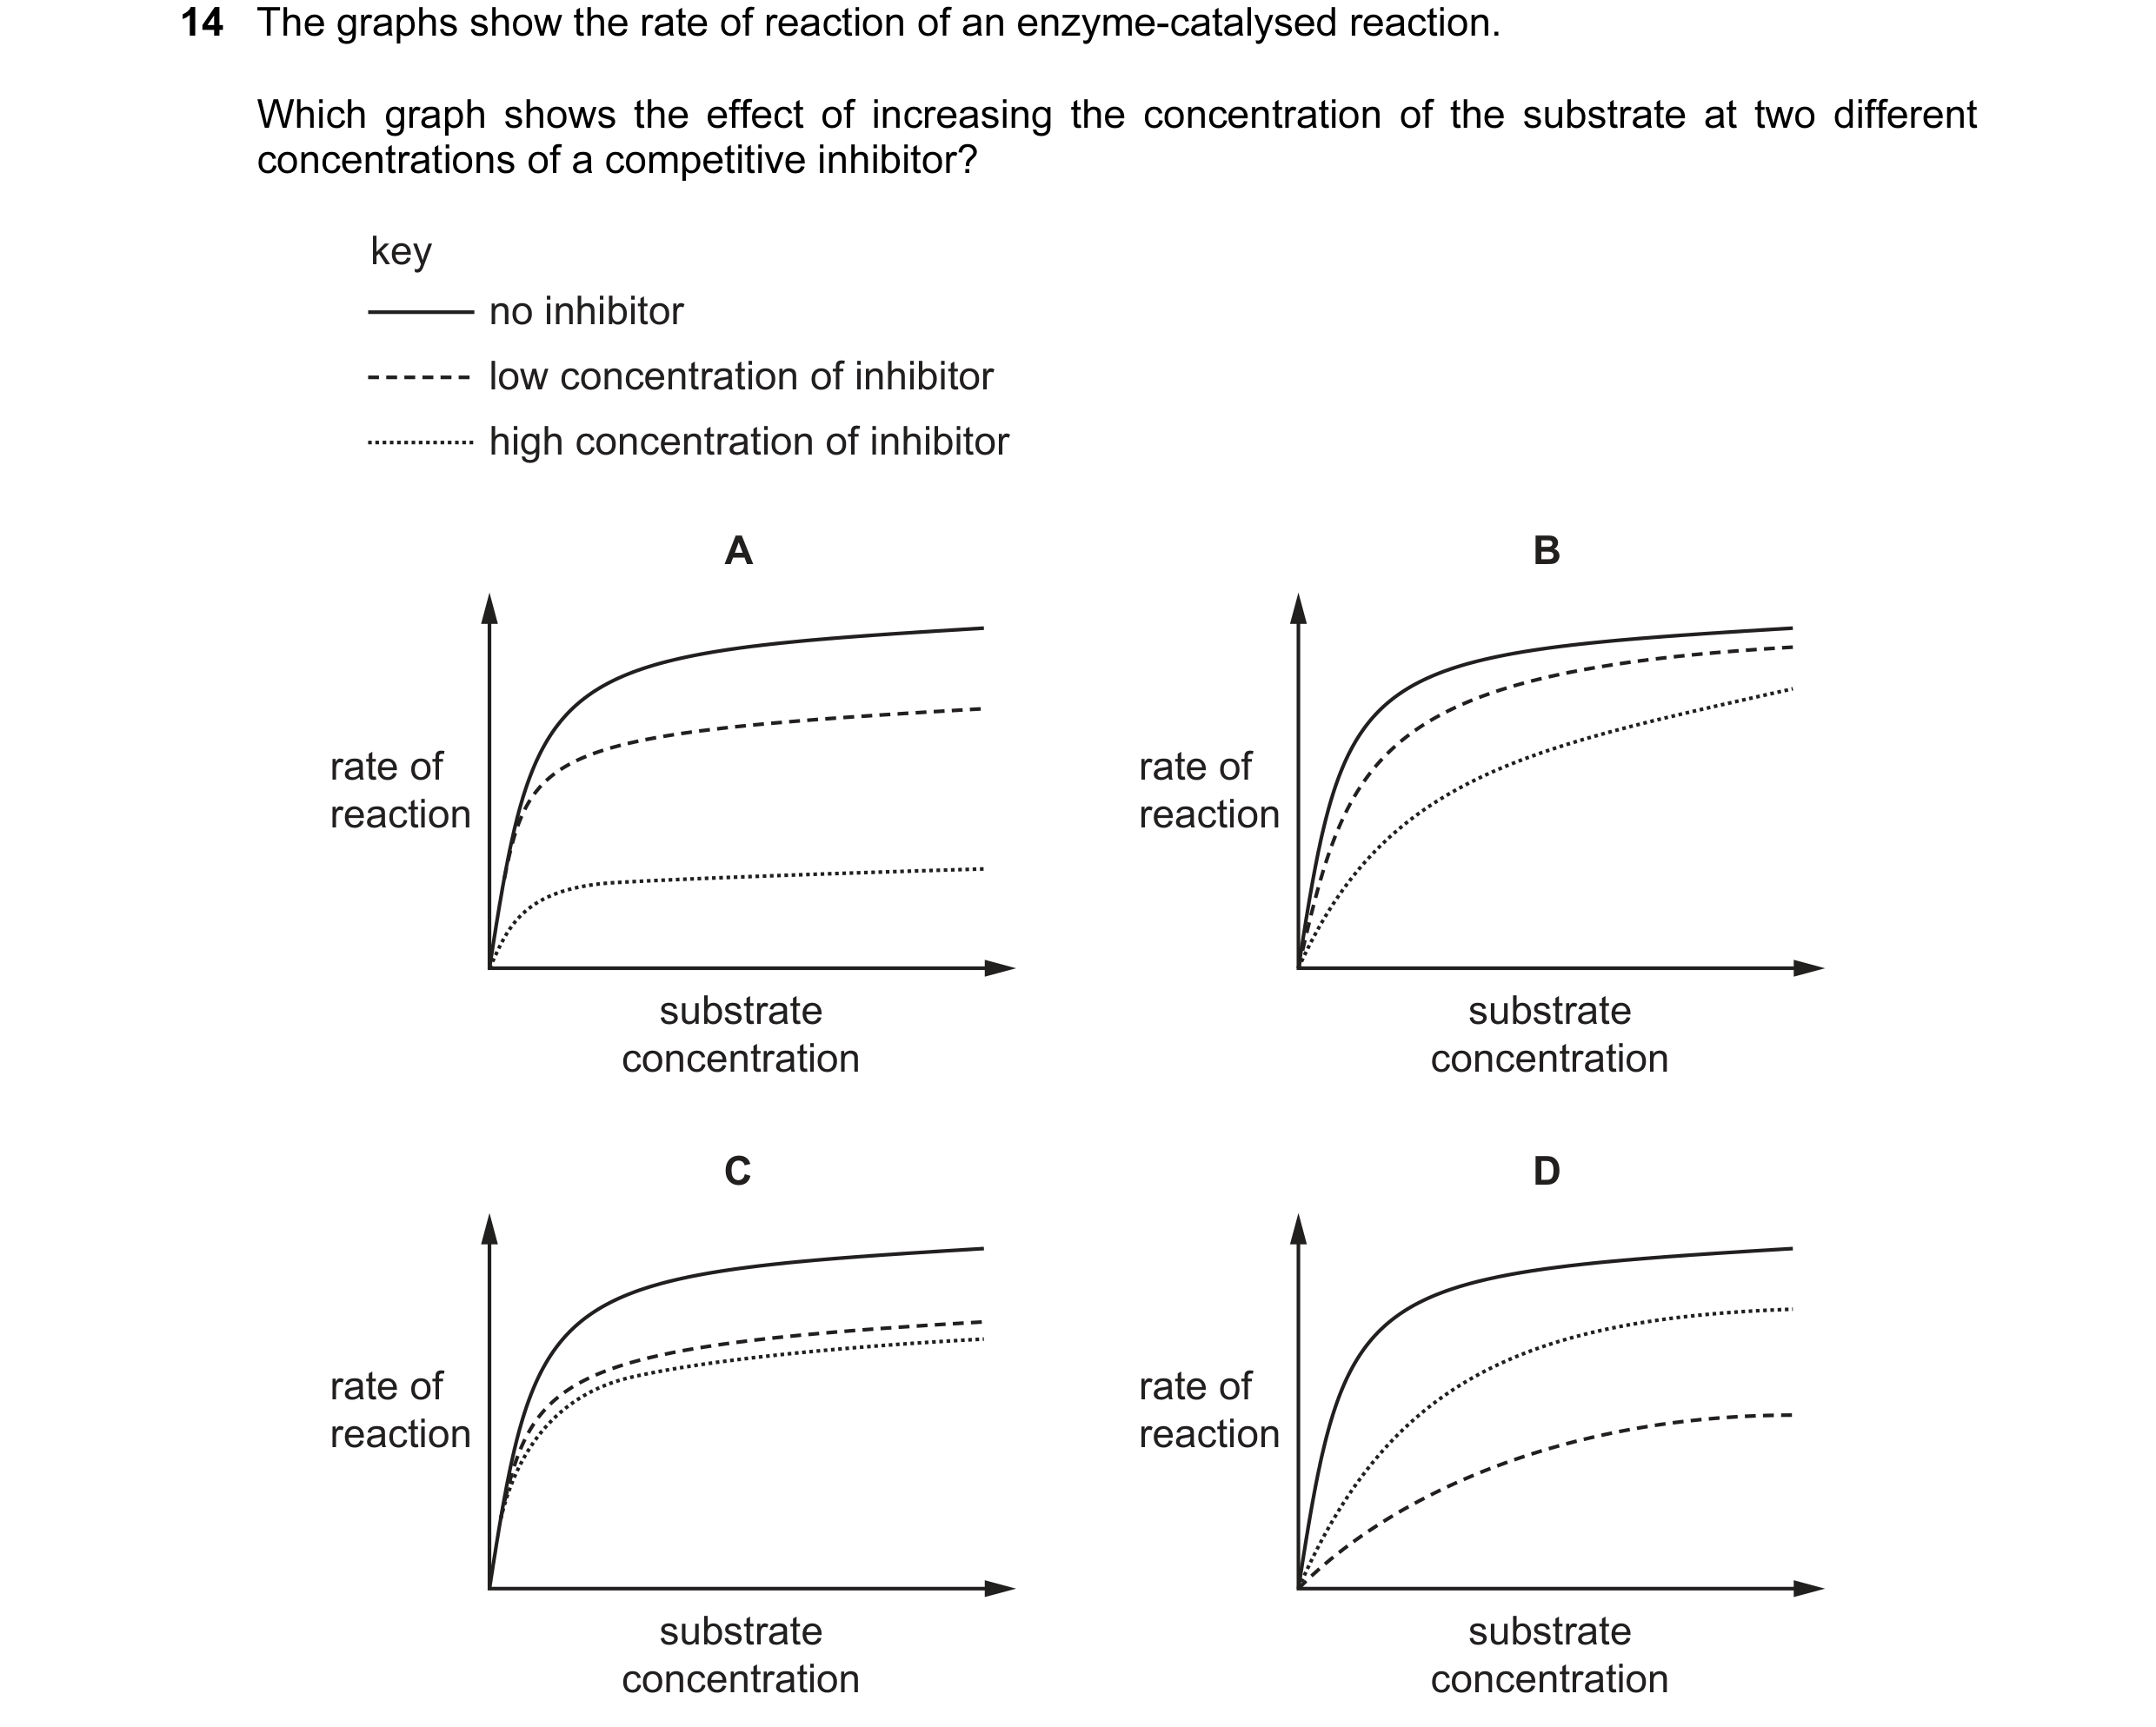
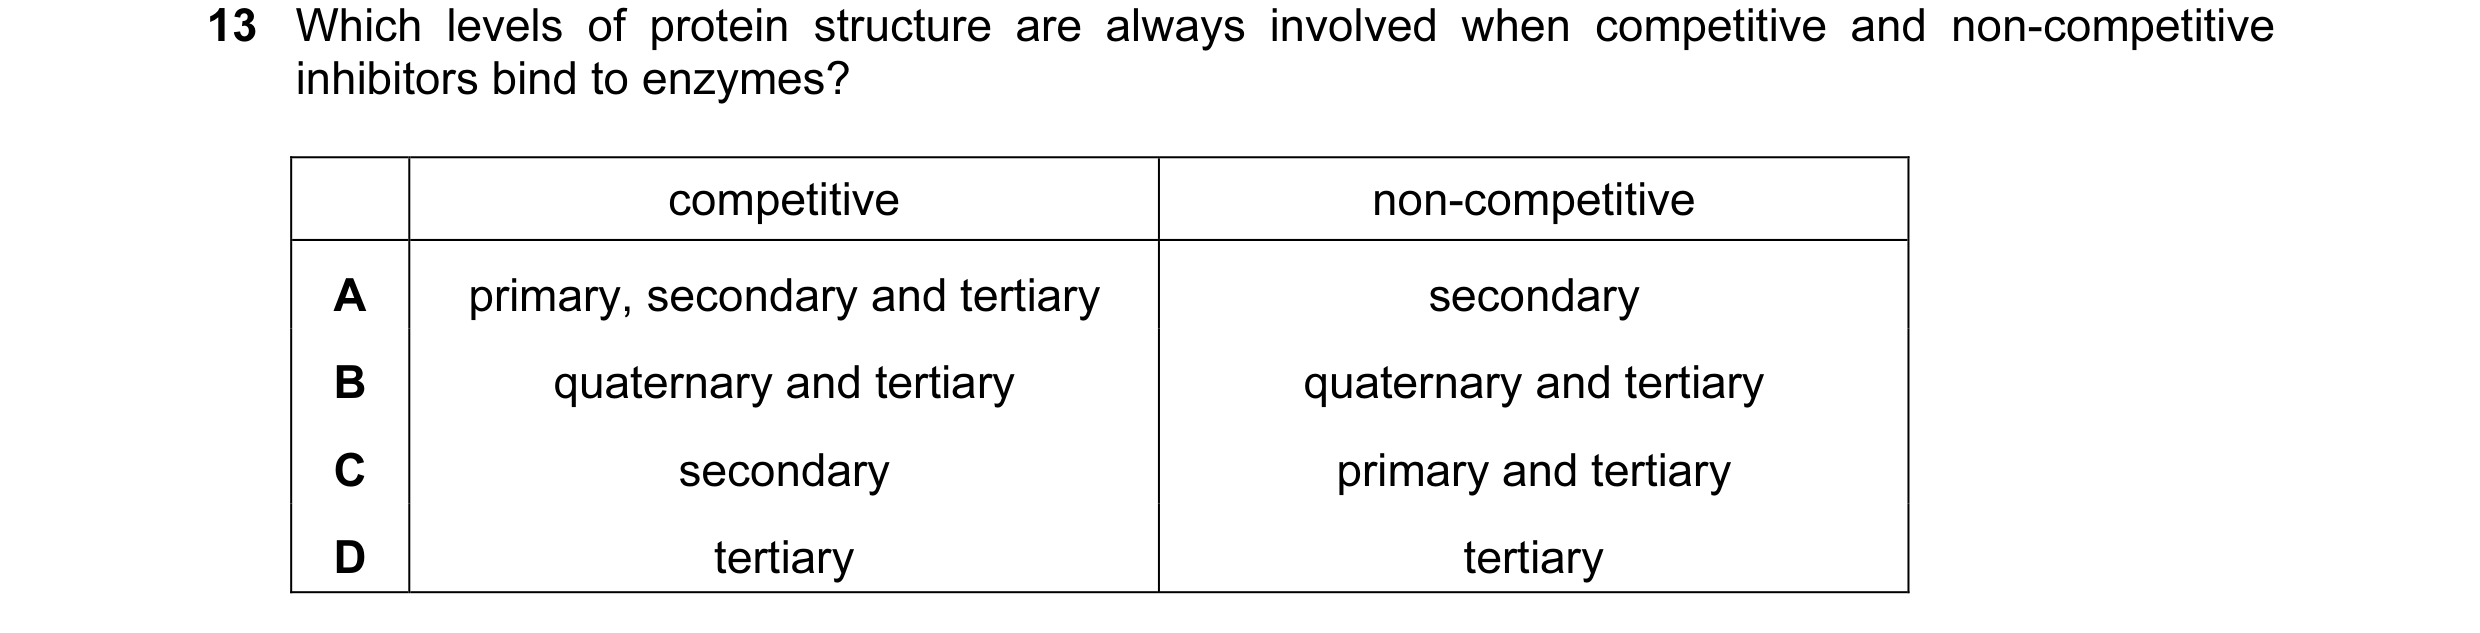
 21 / 76
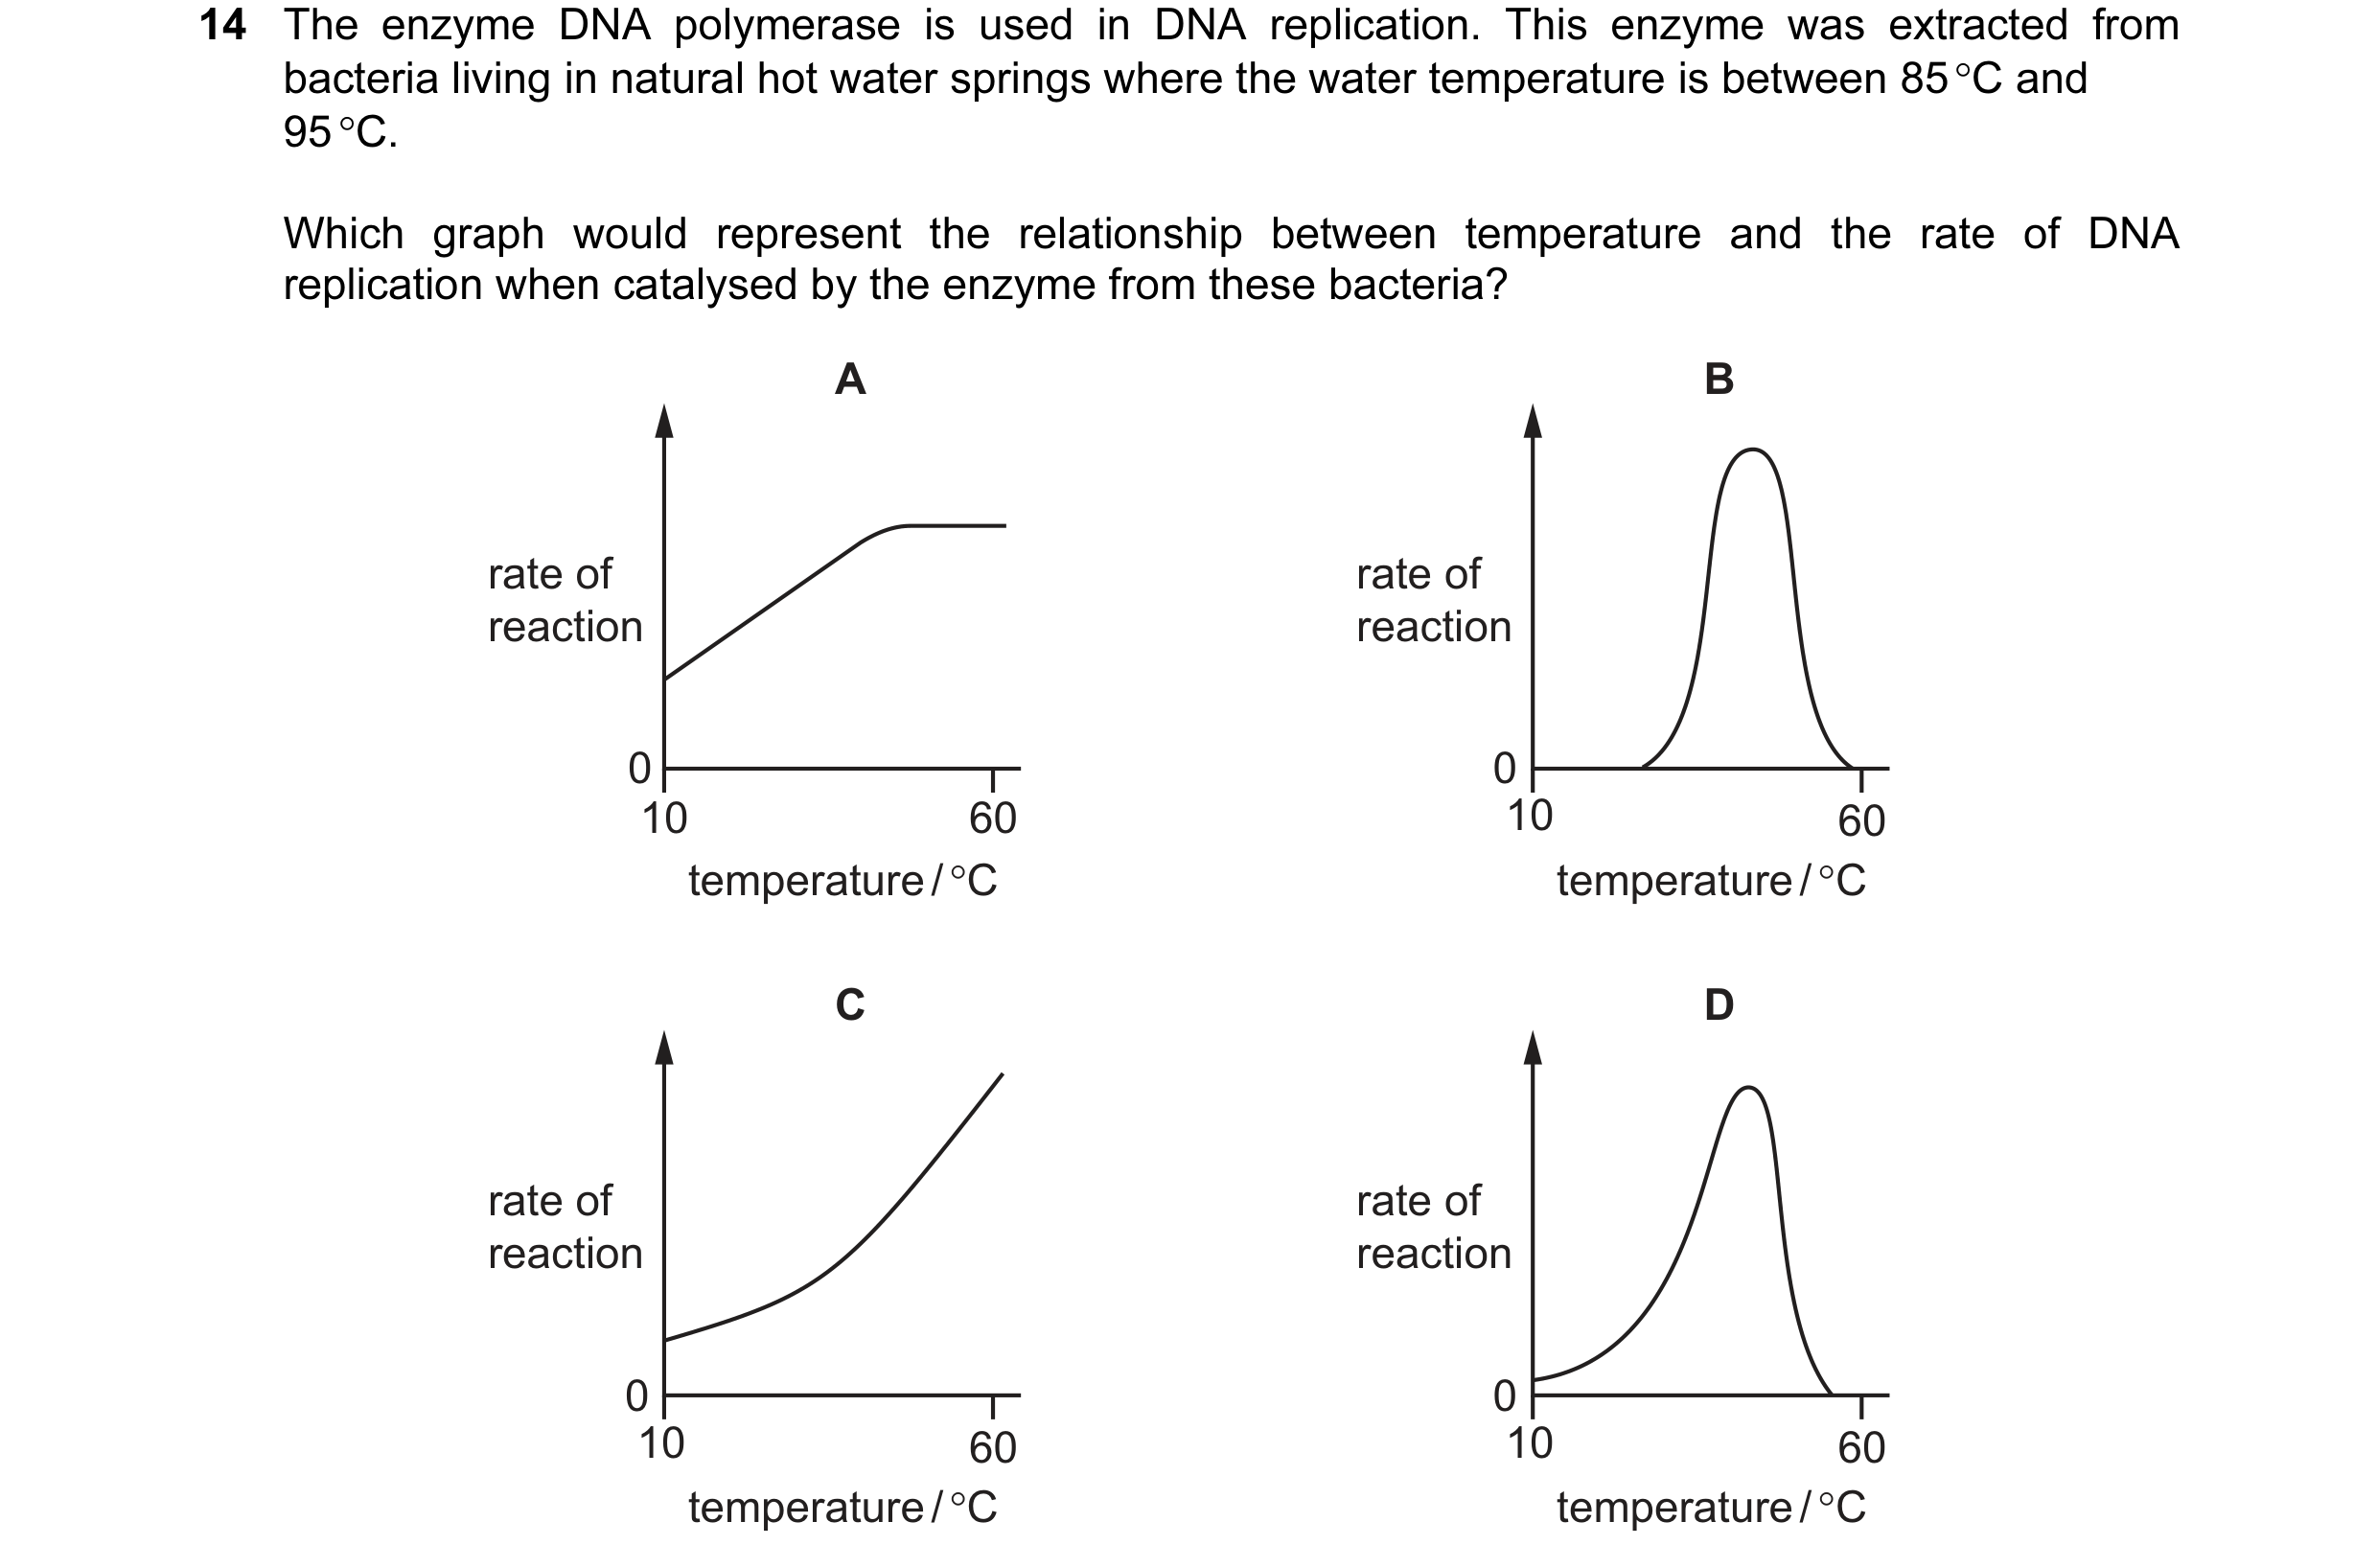
 22 / 76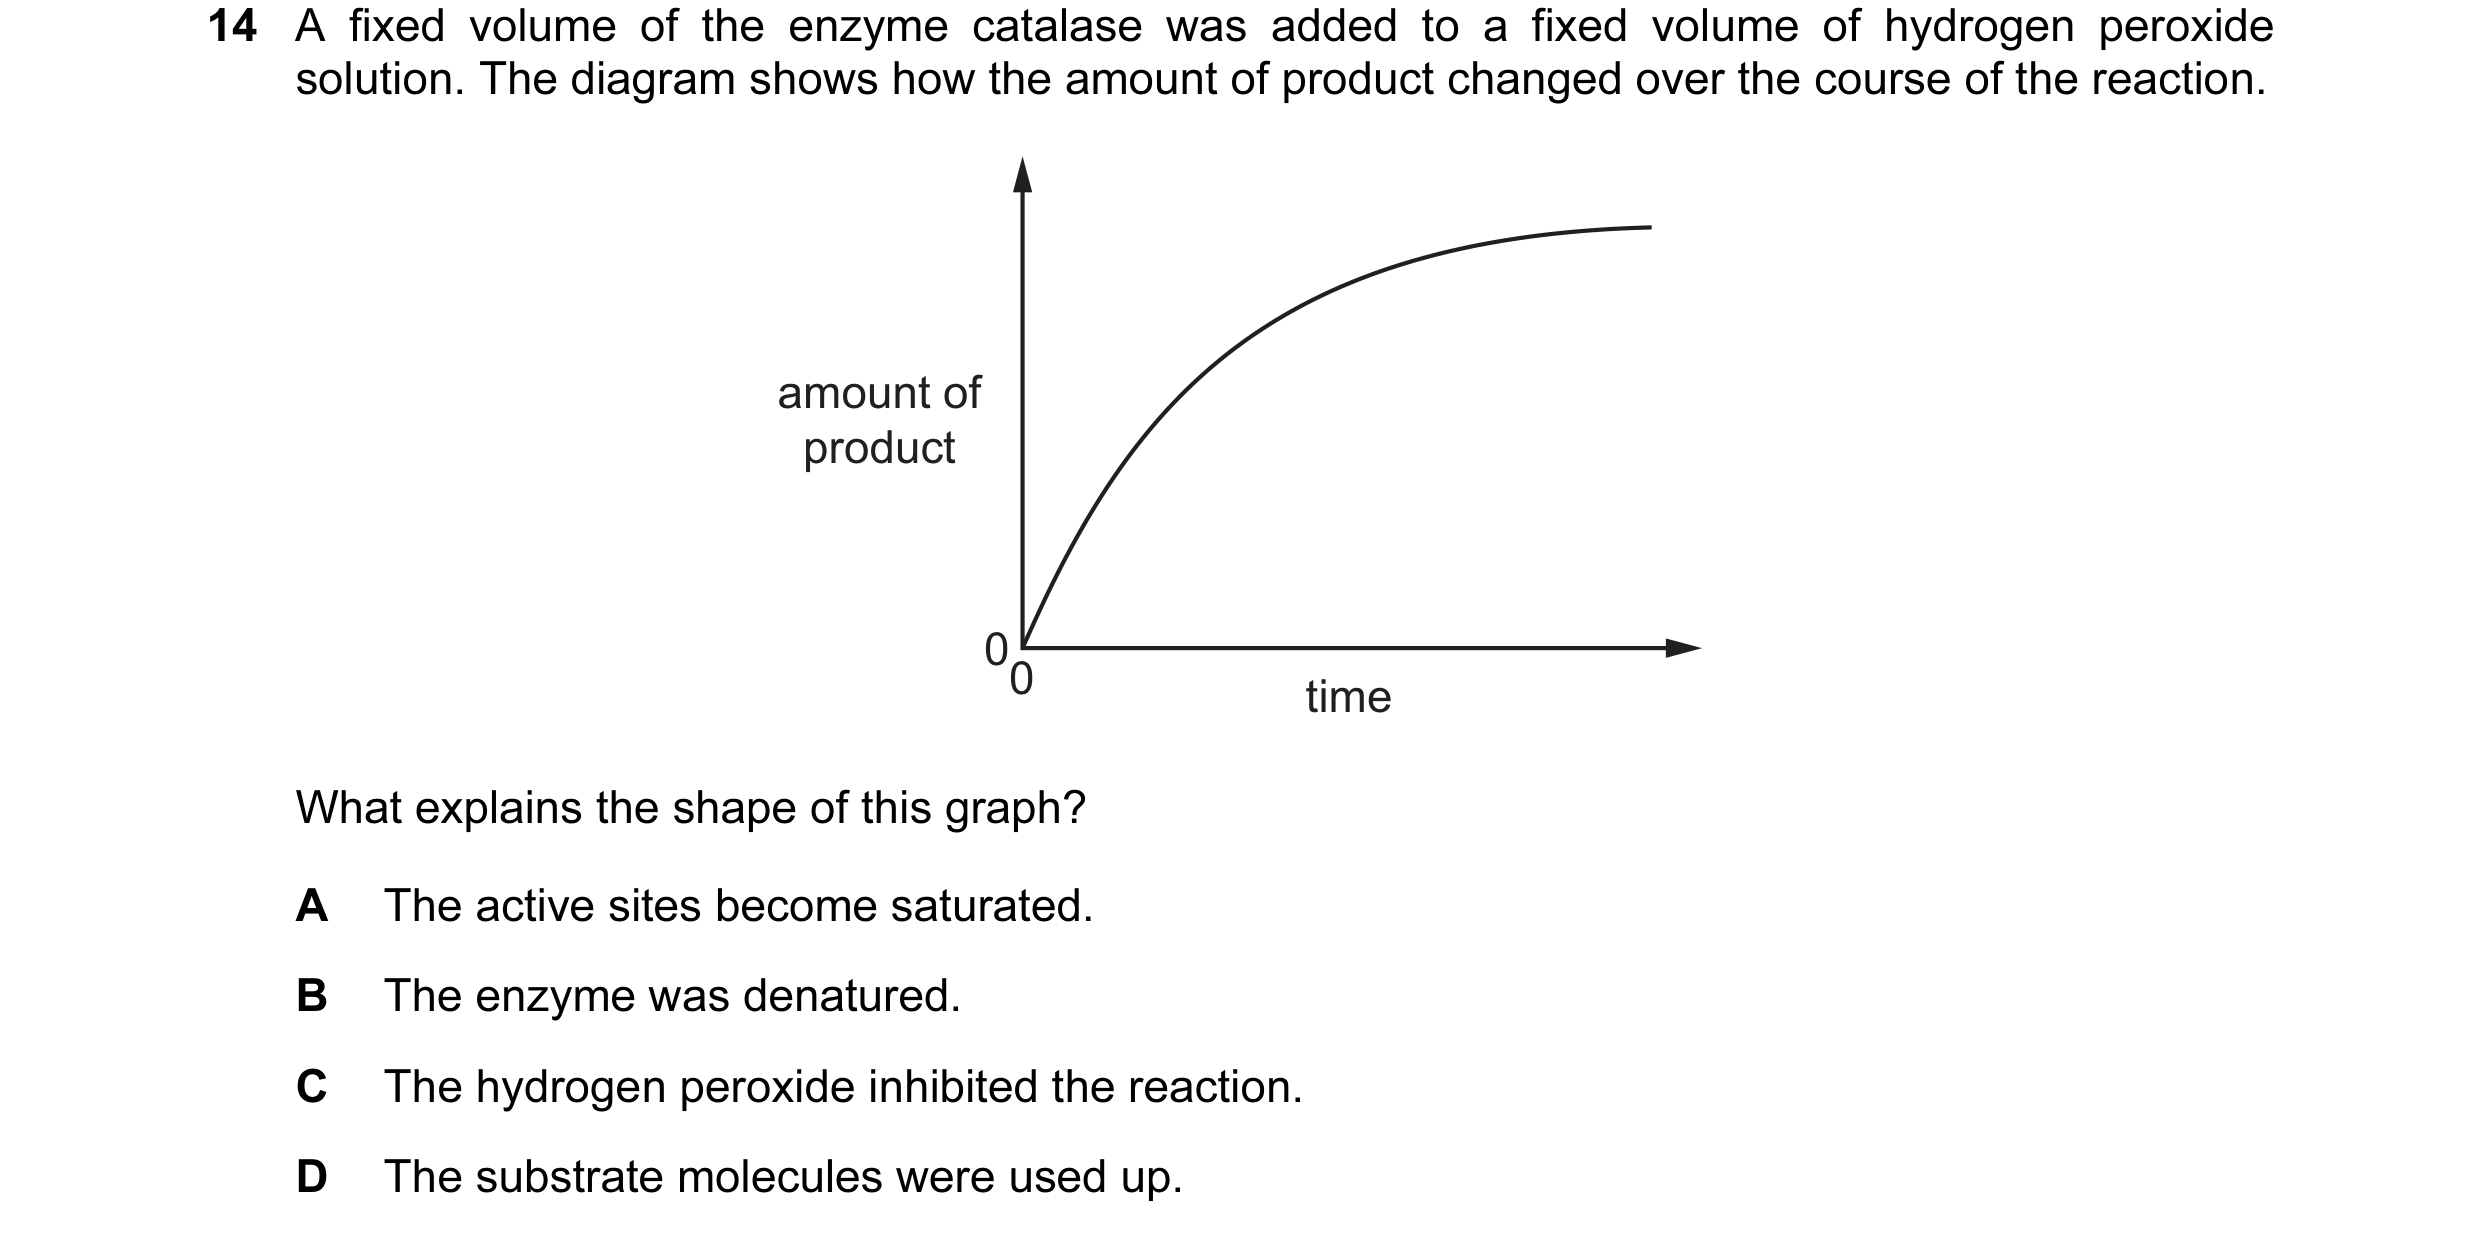
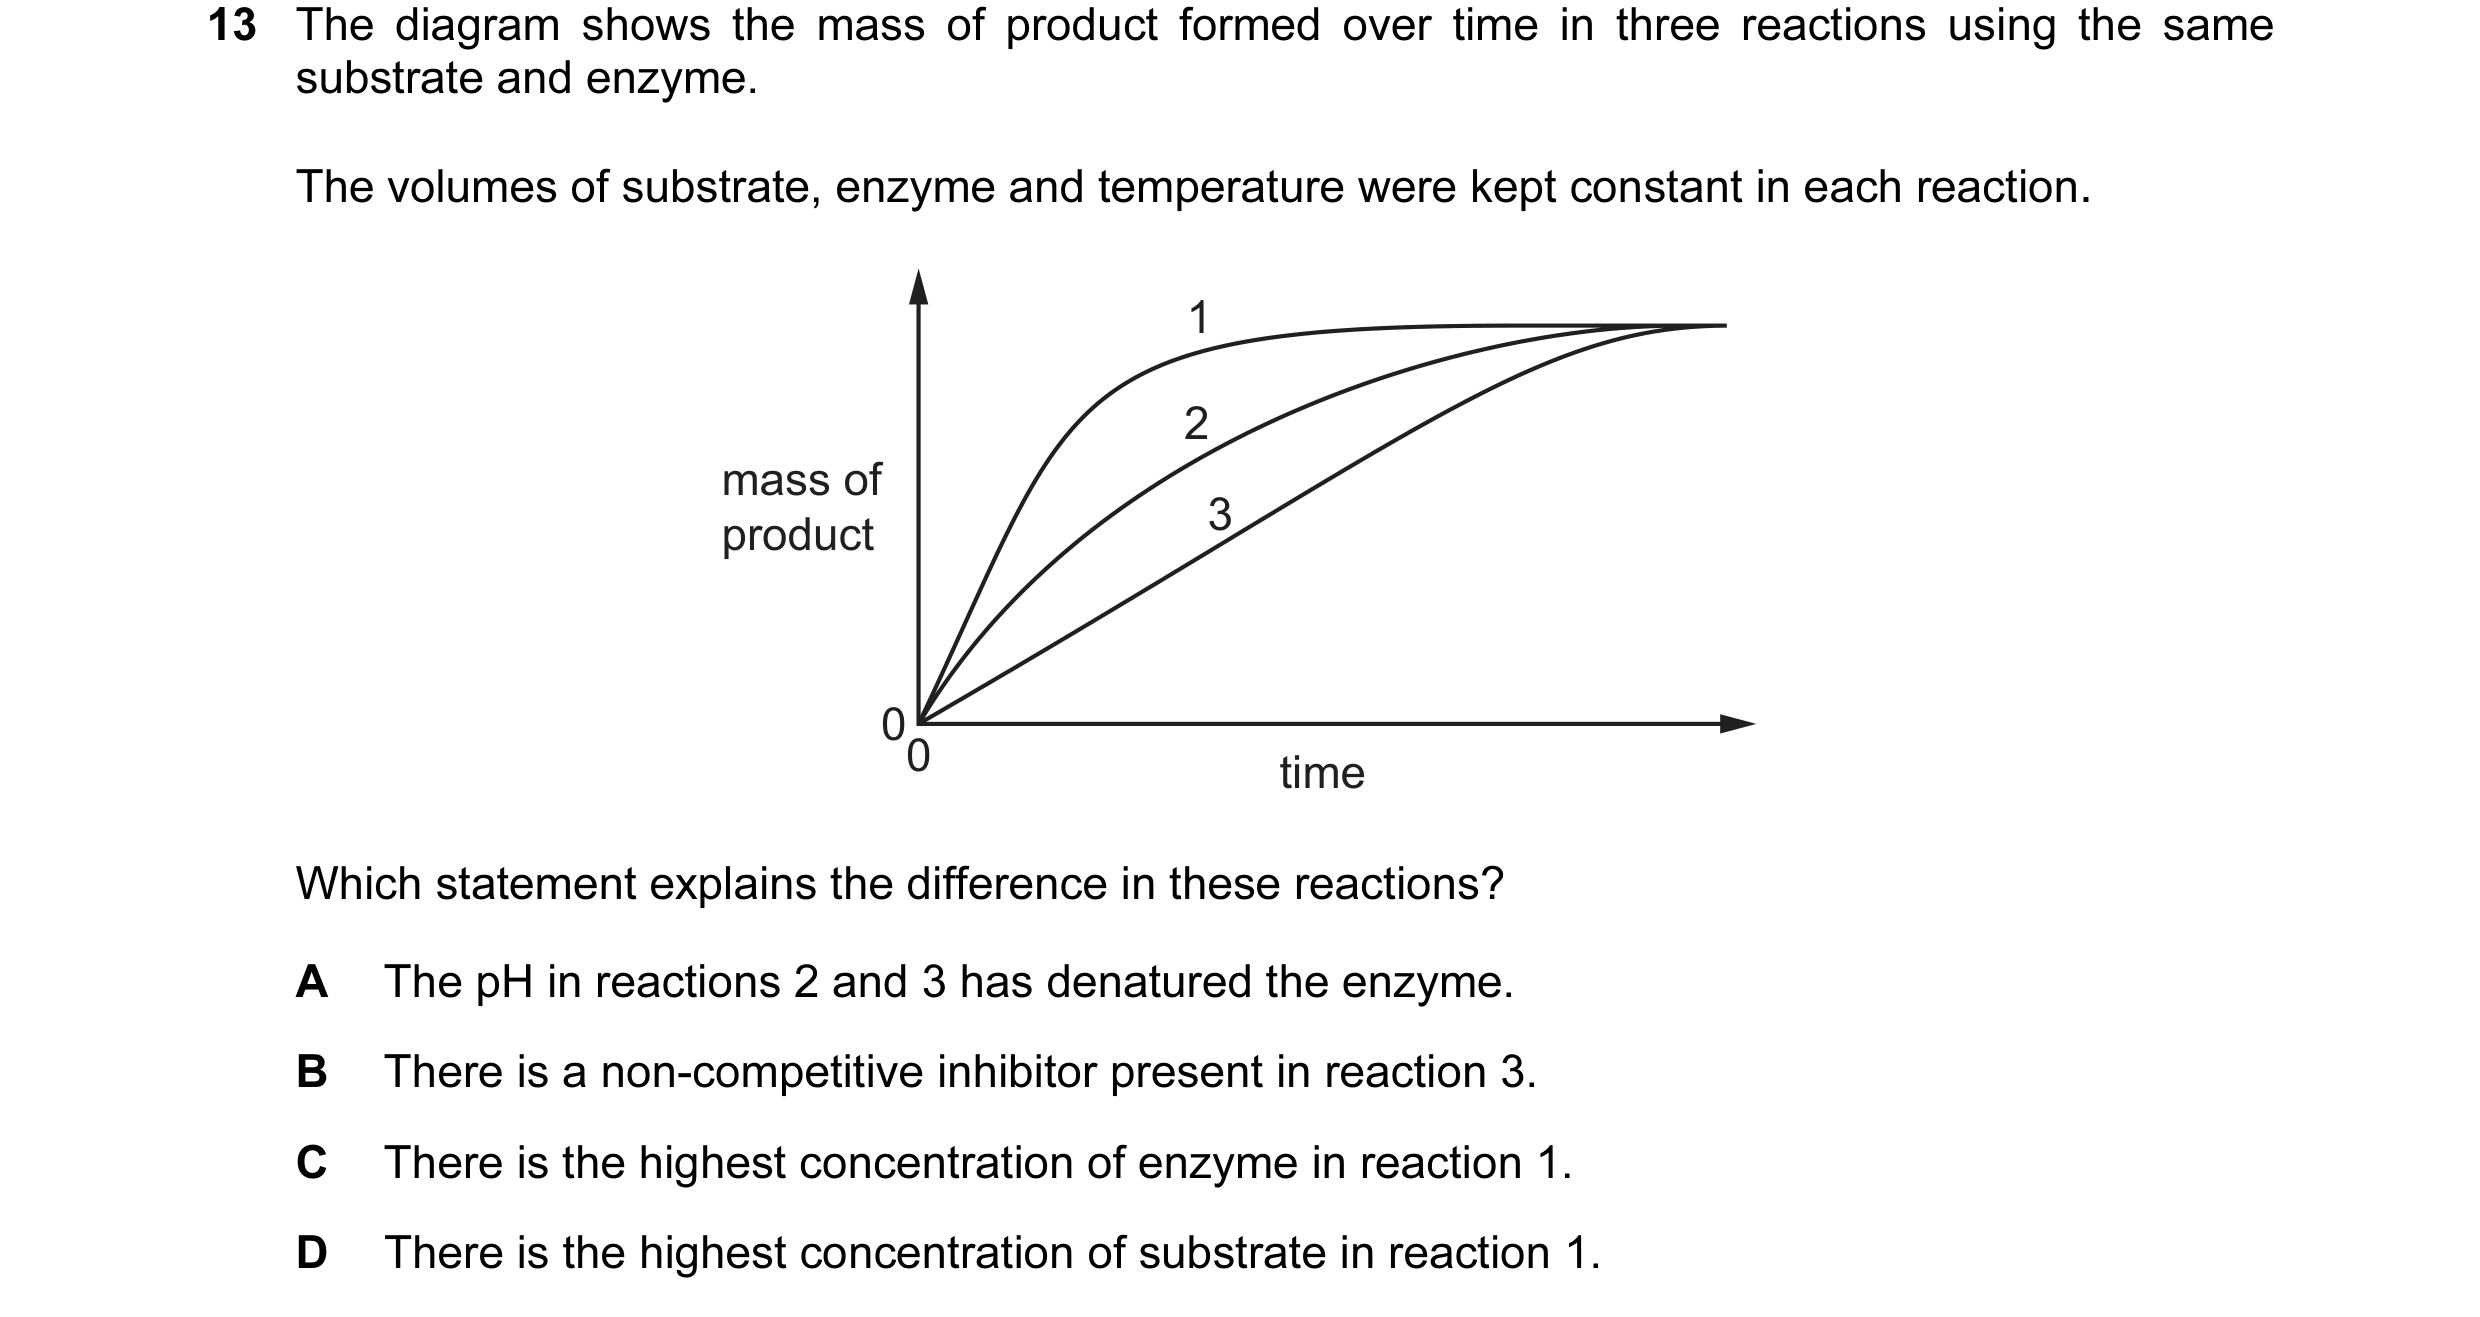 23 / 76
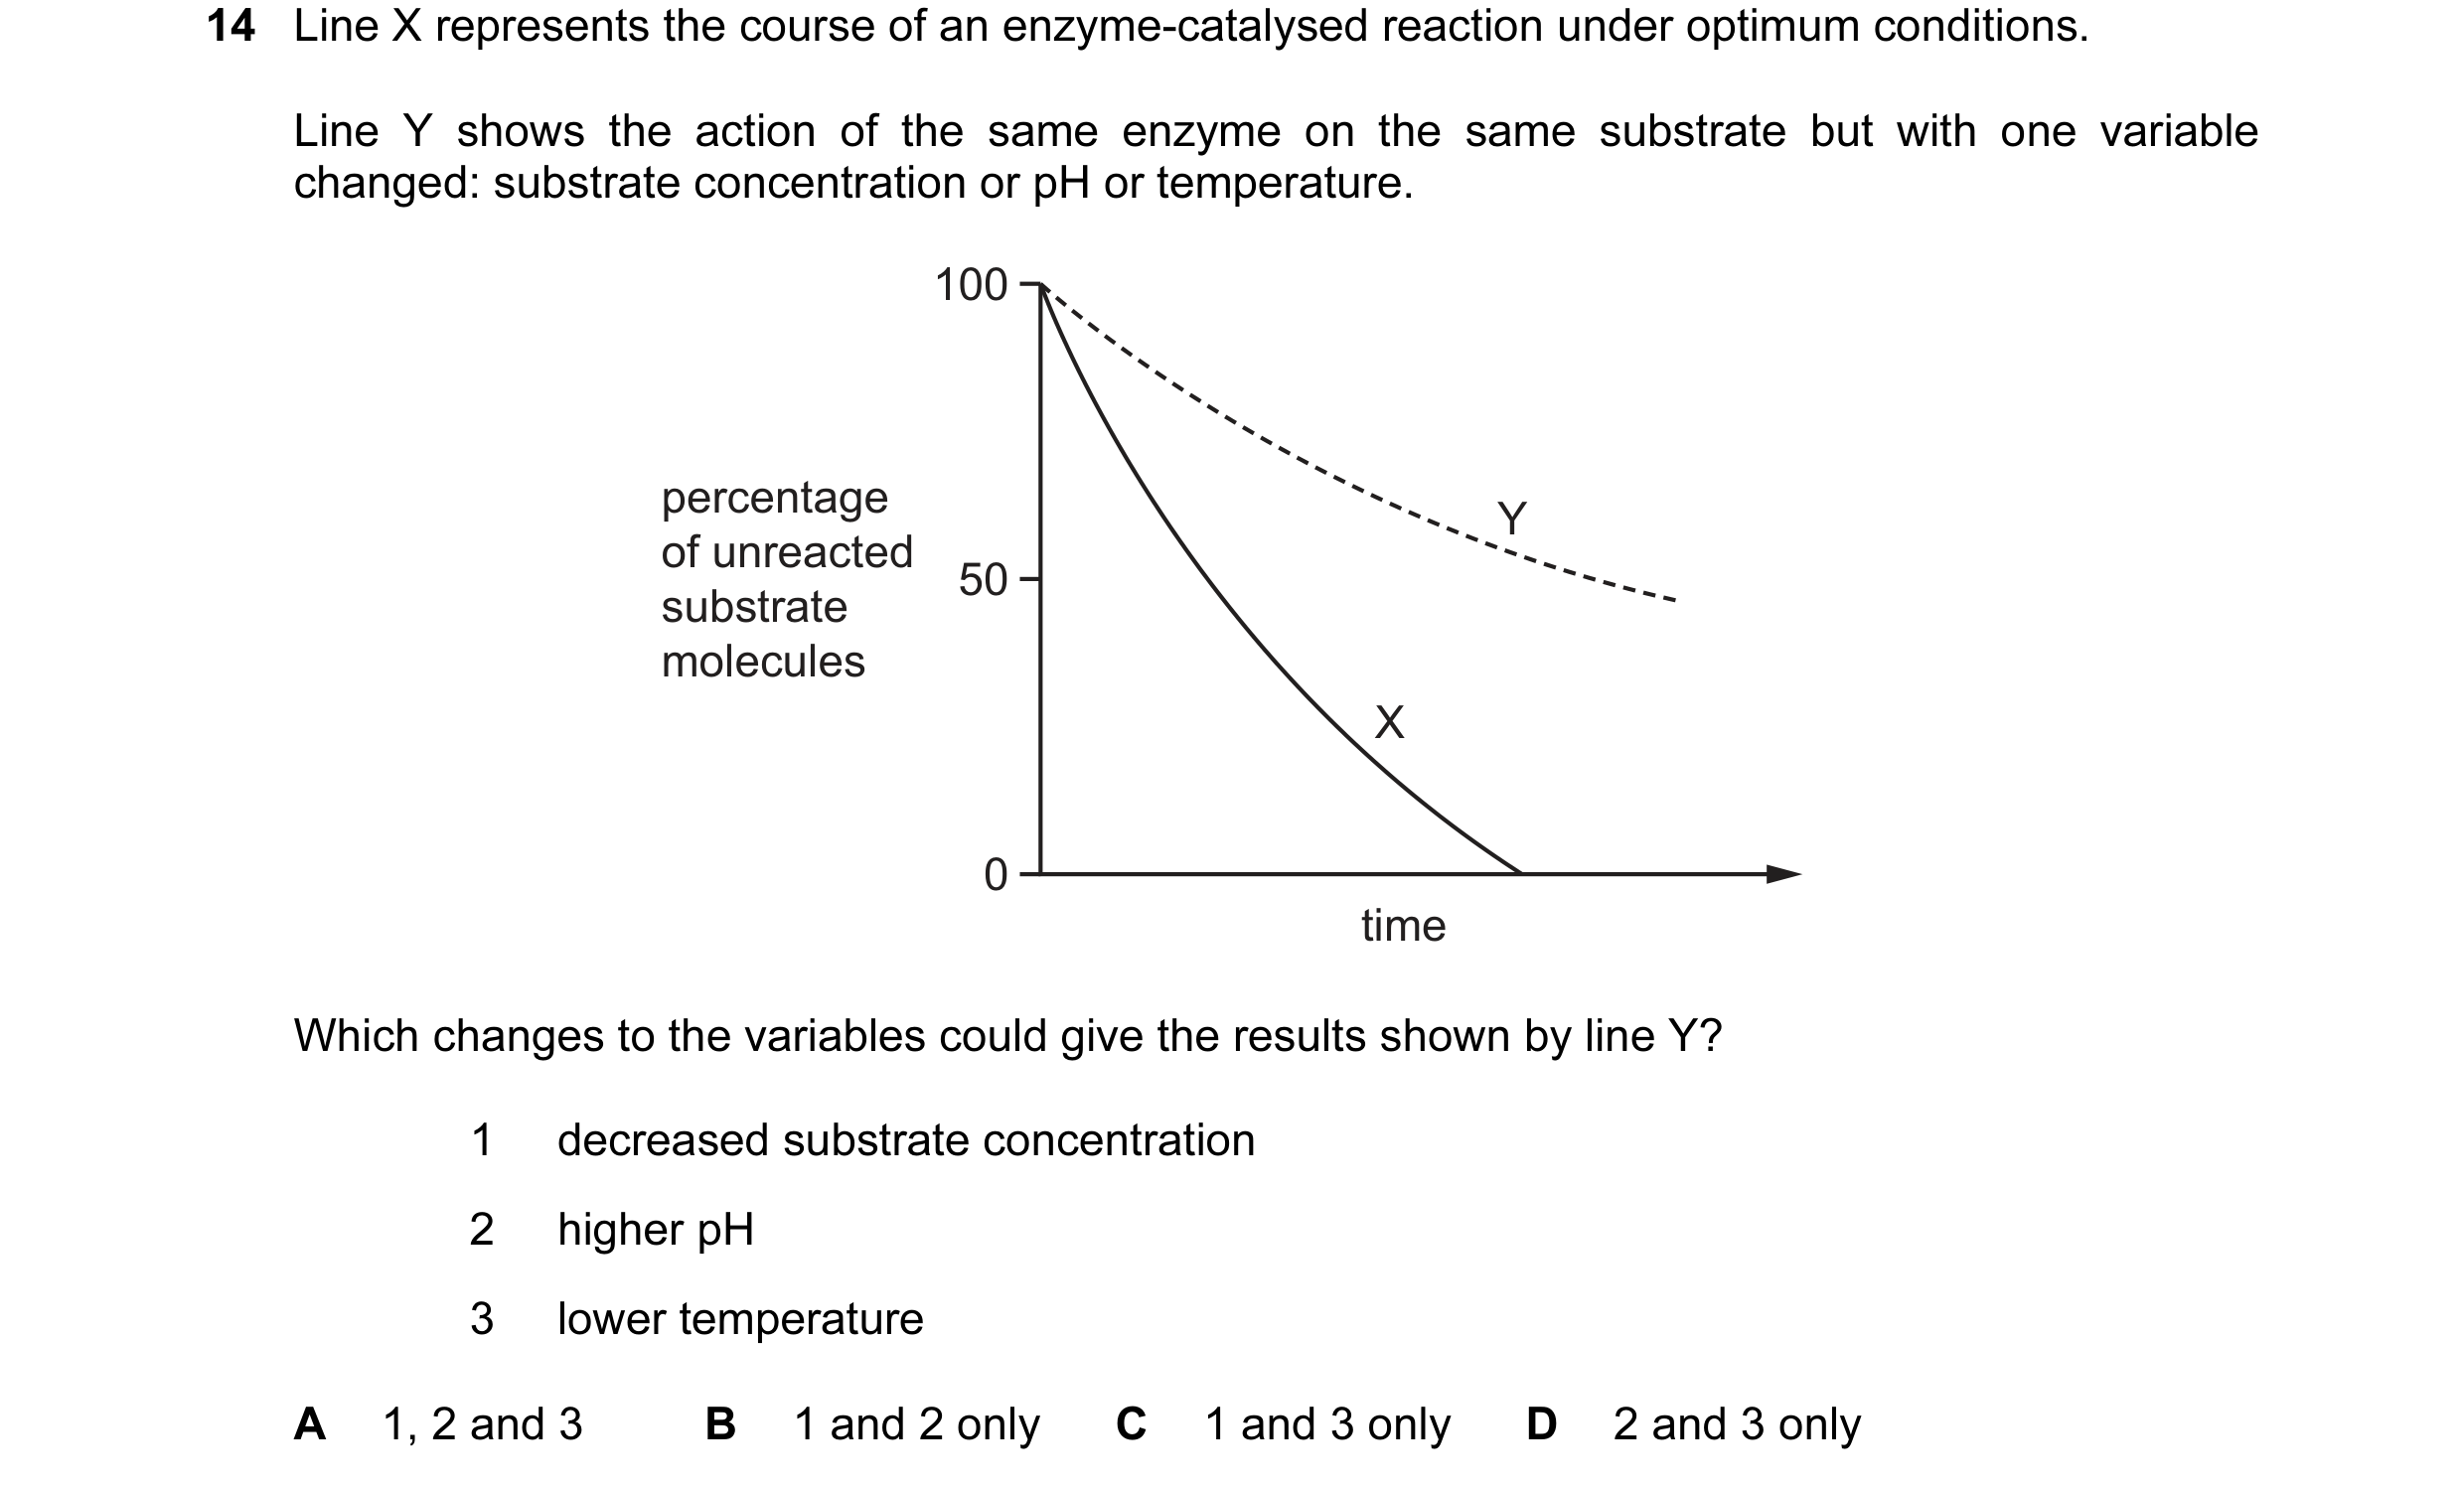
 24 / 76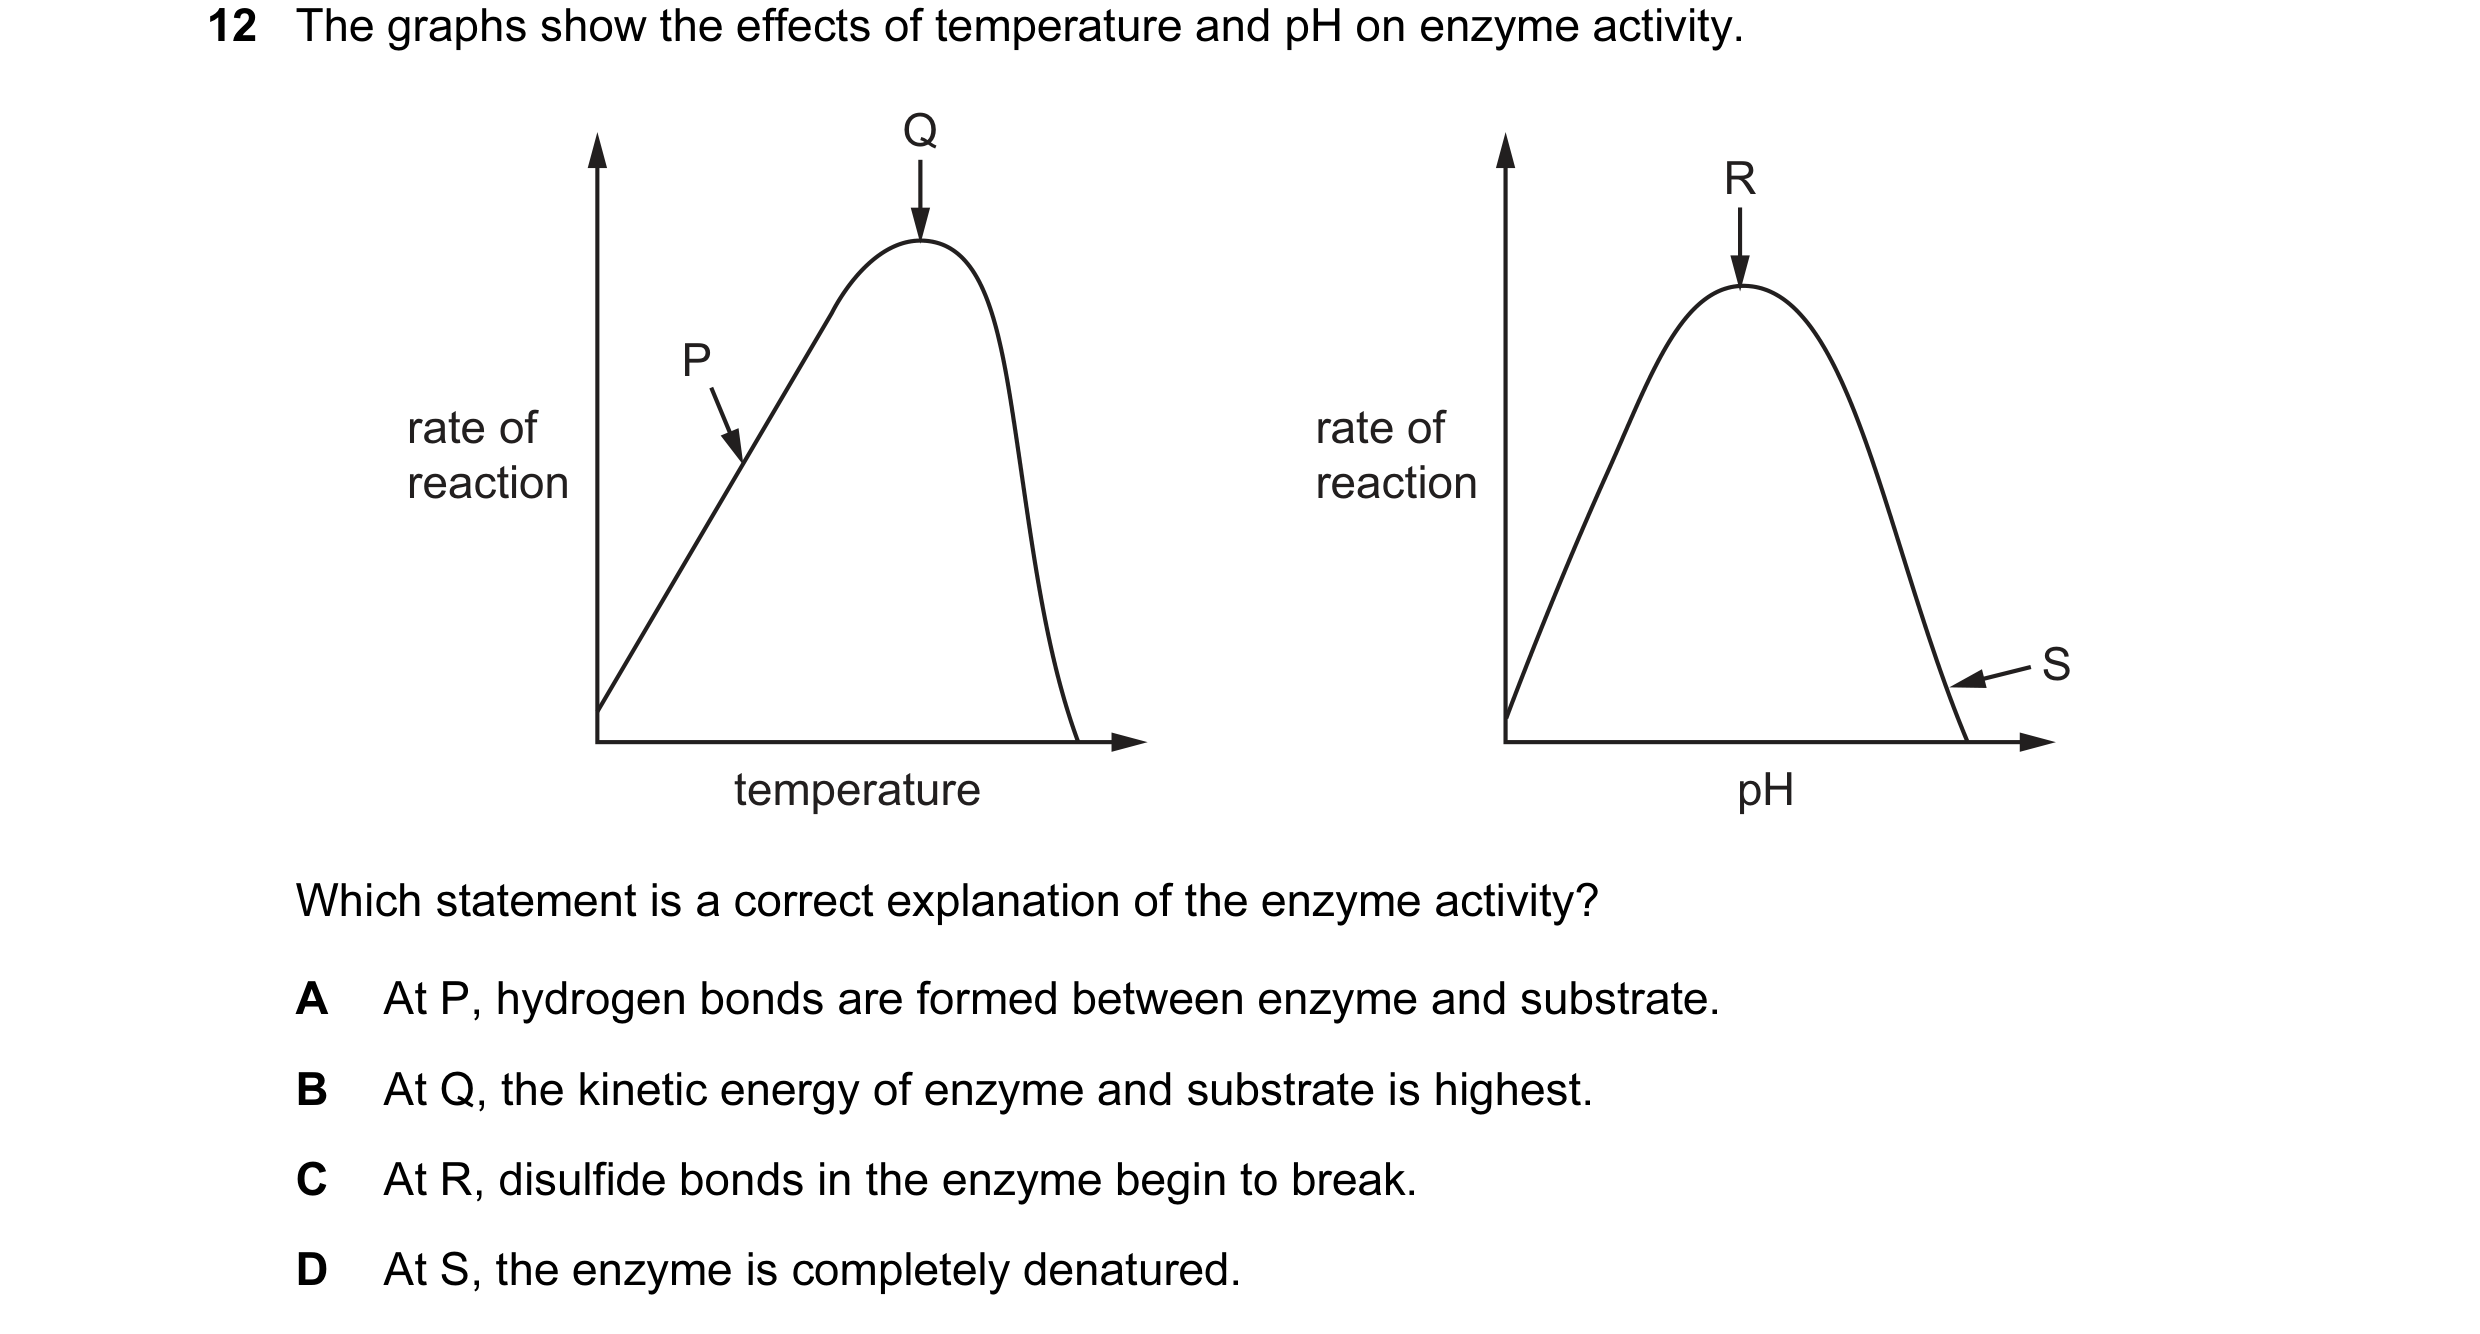

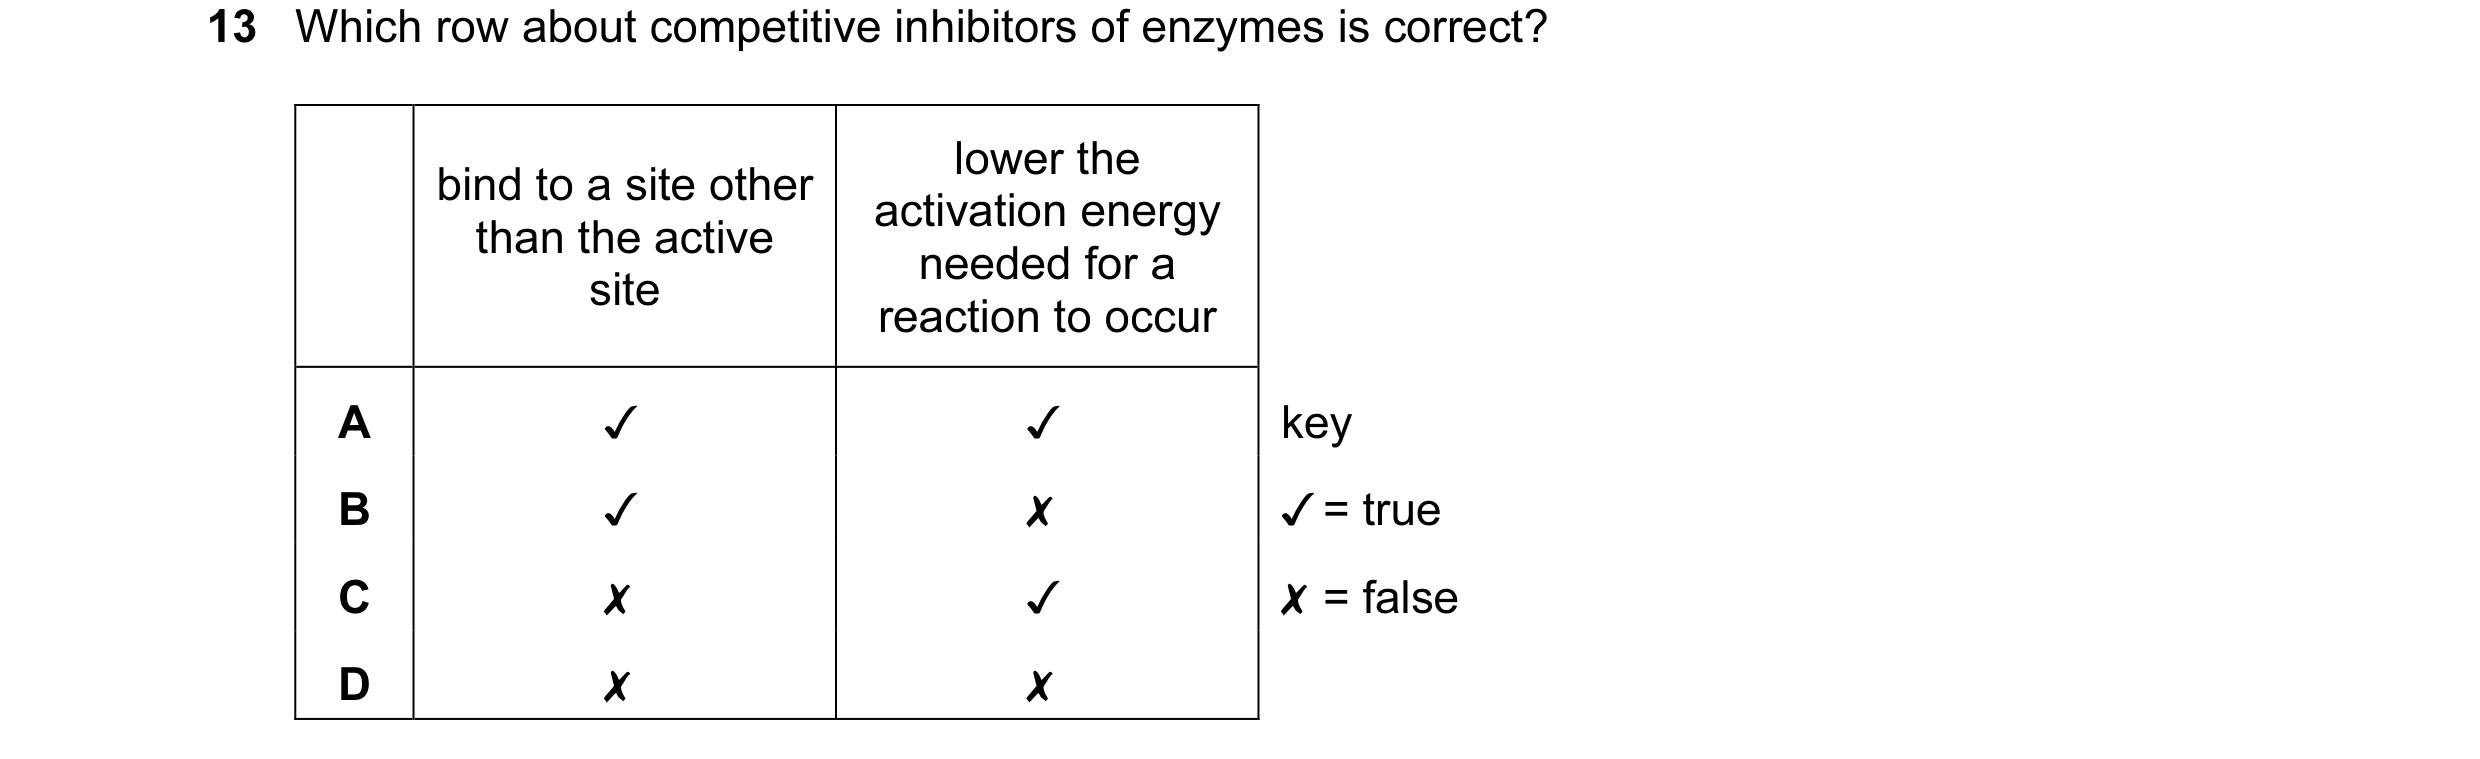 25 / 76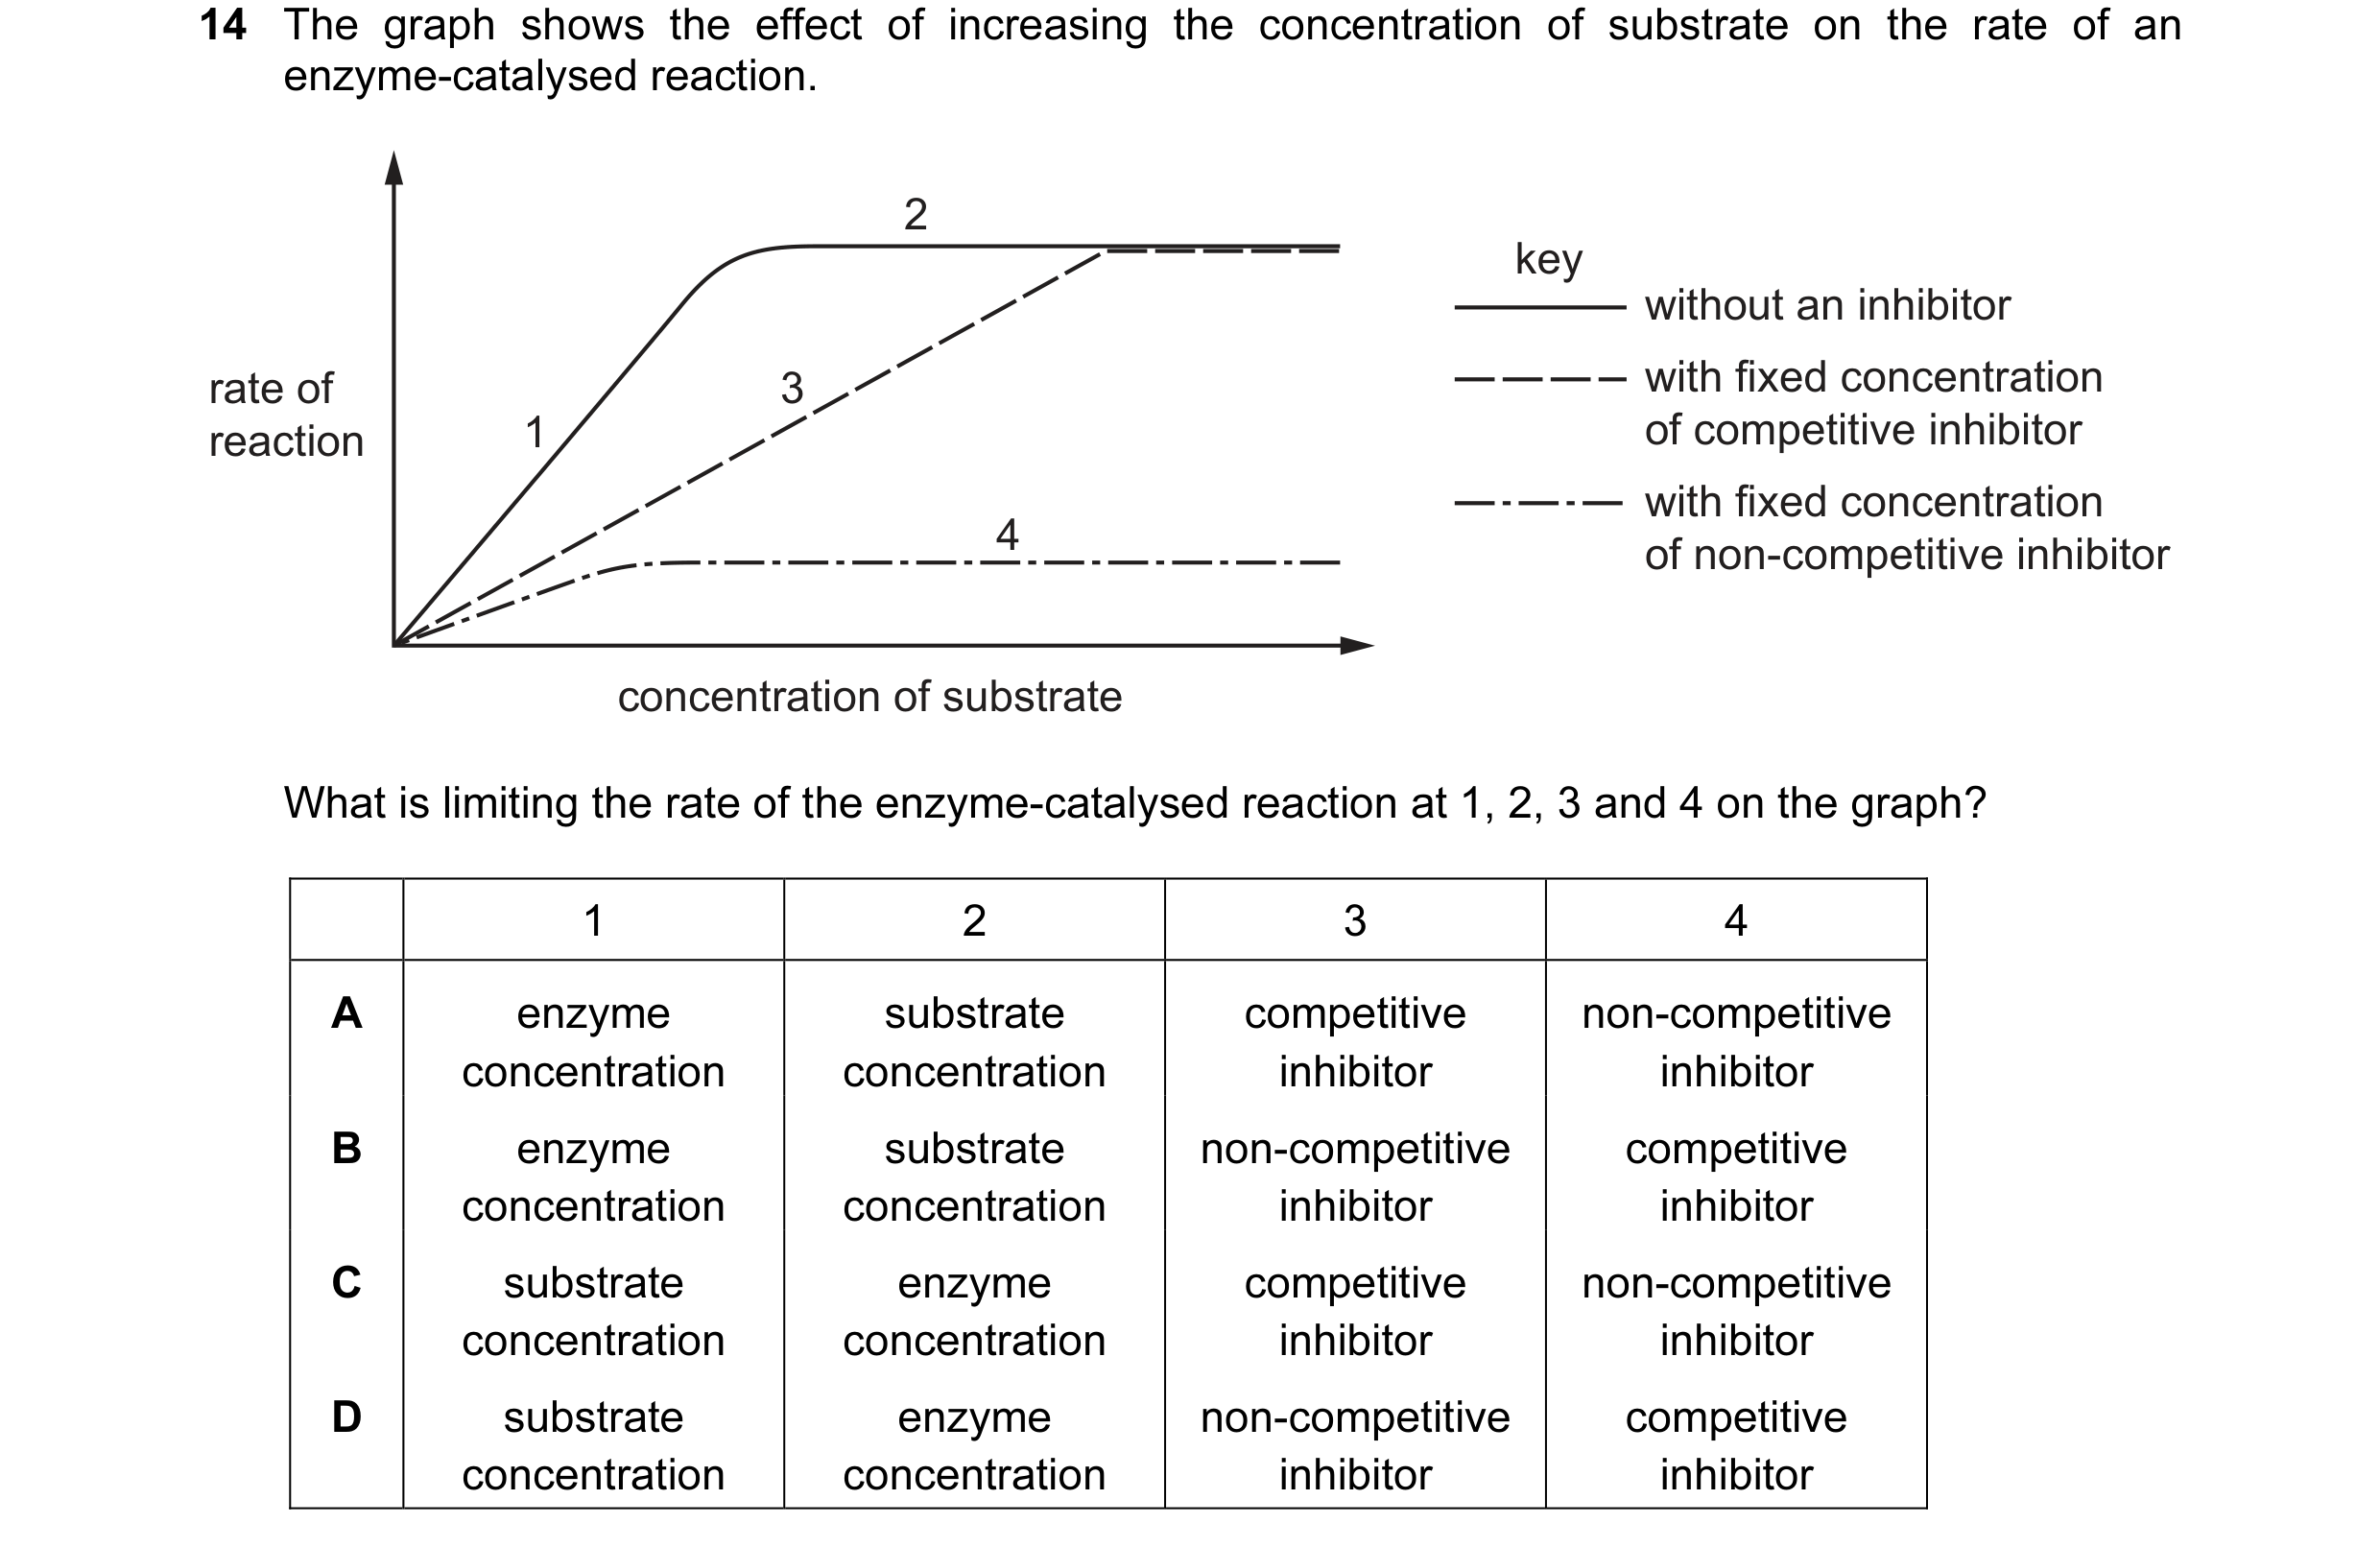
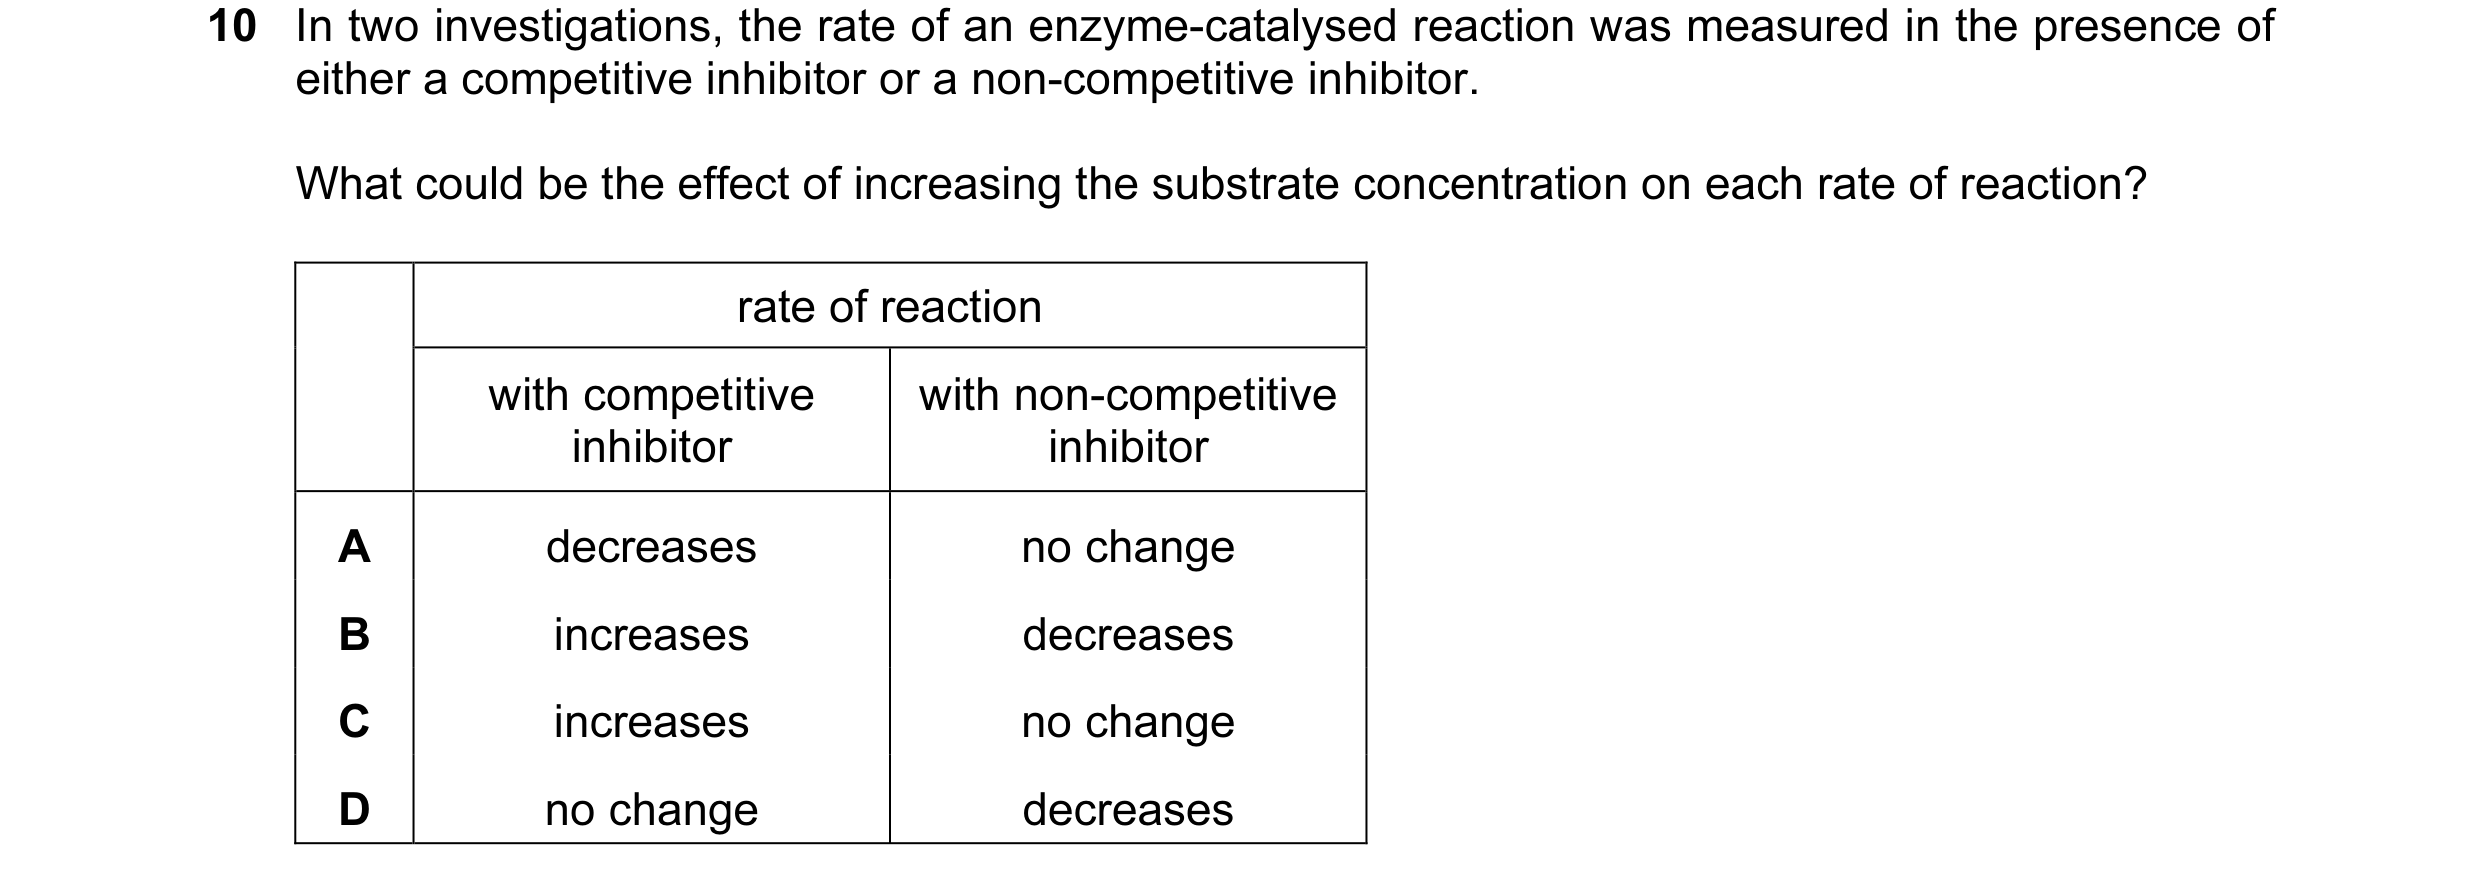 26 / 76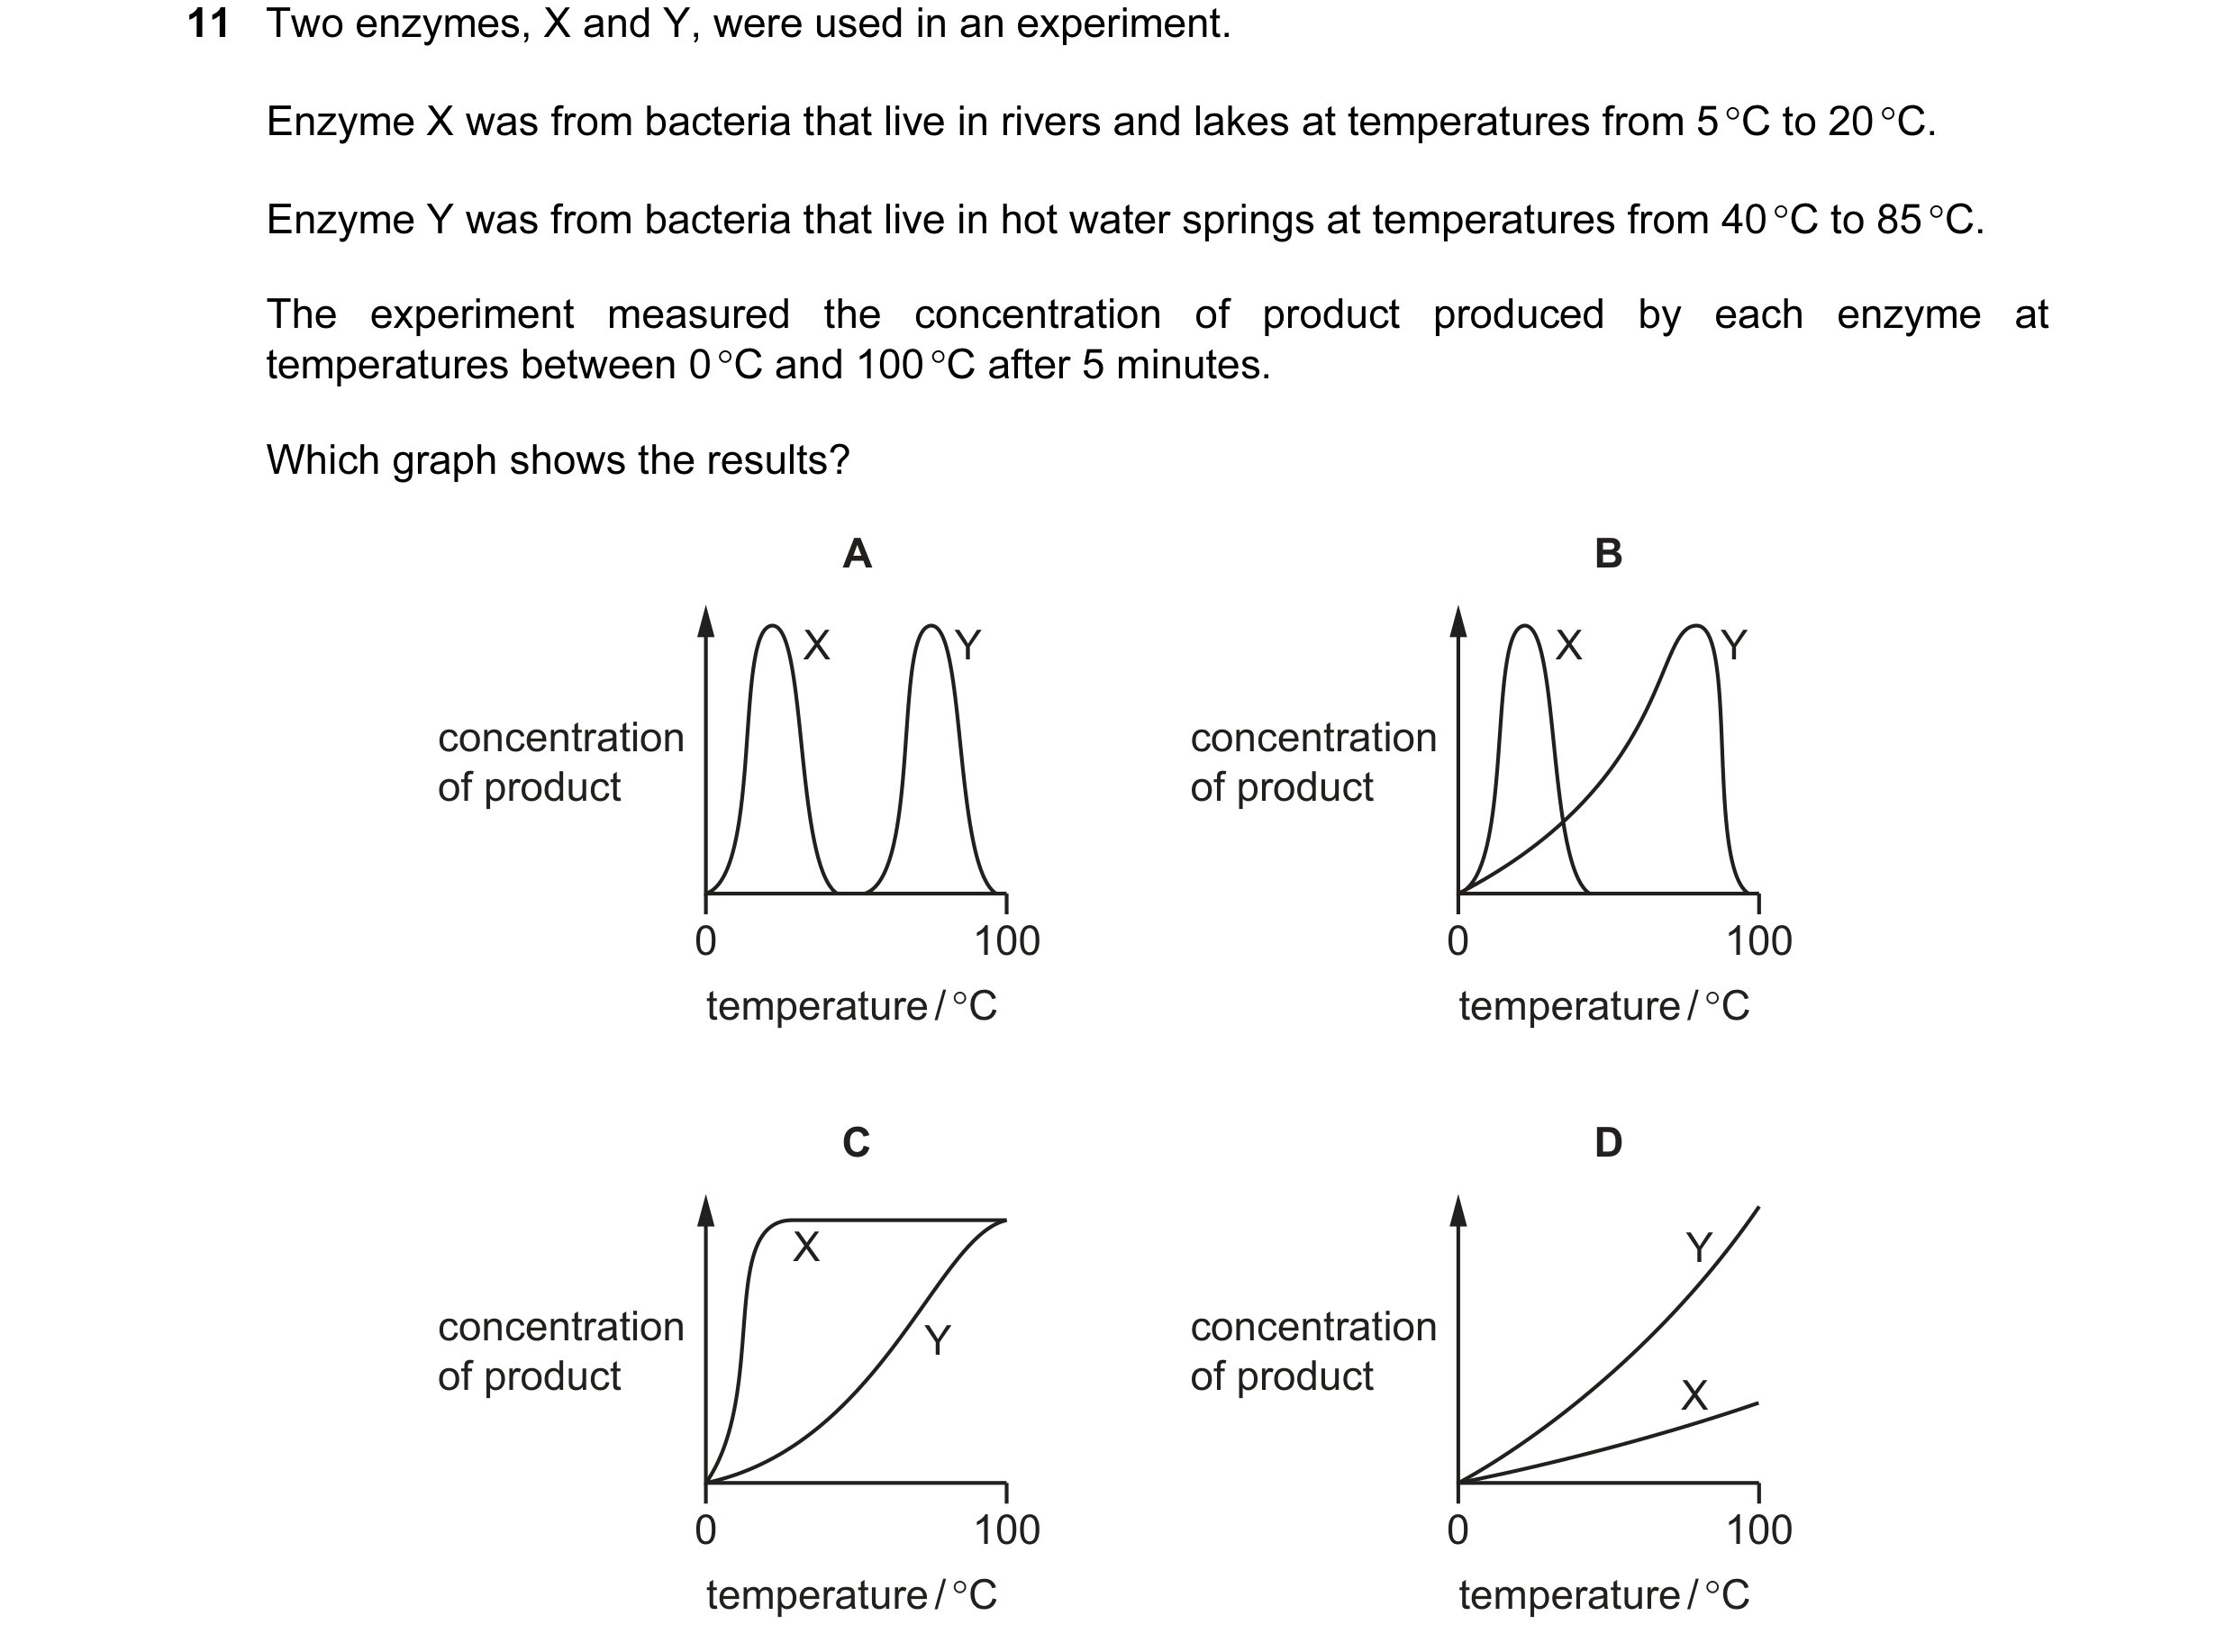
 27 / 76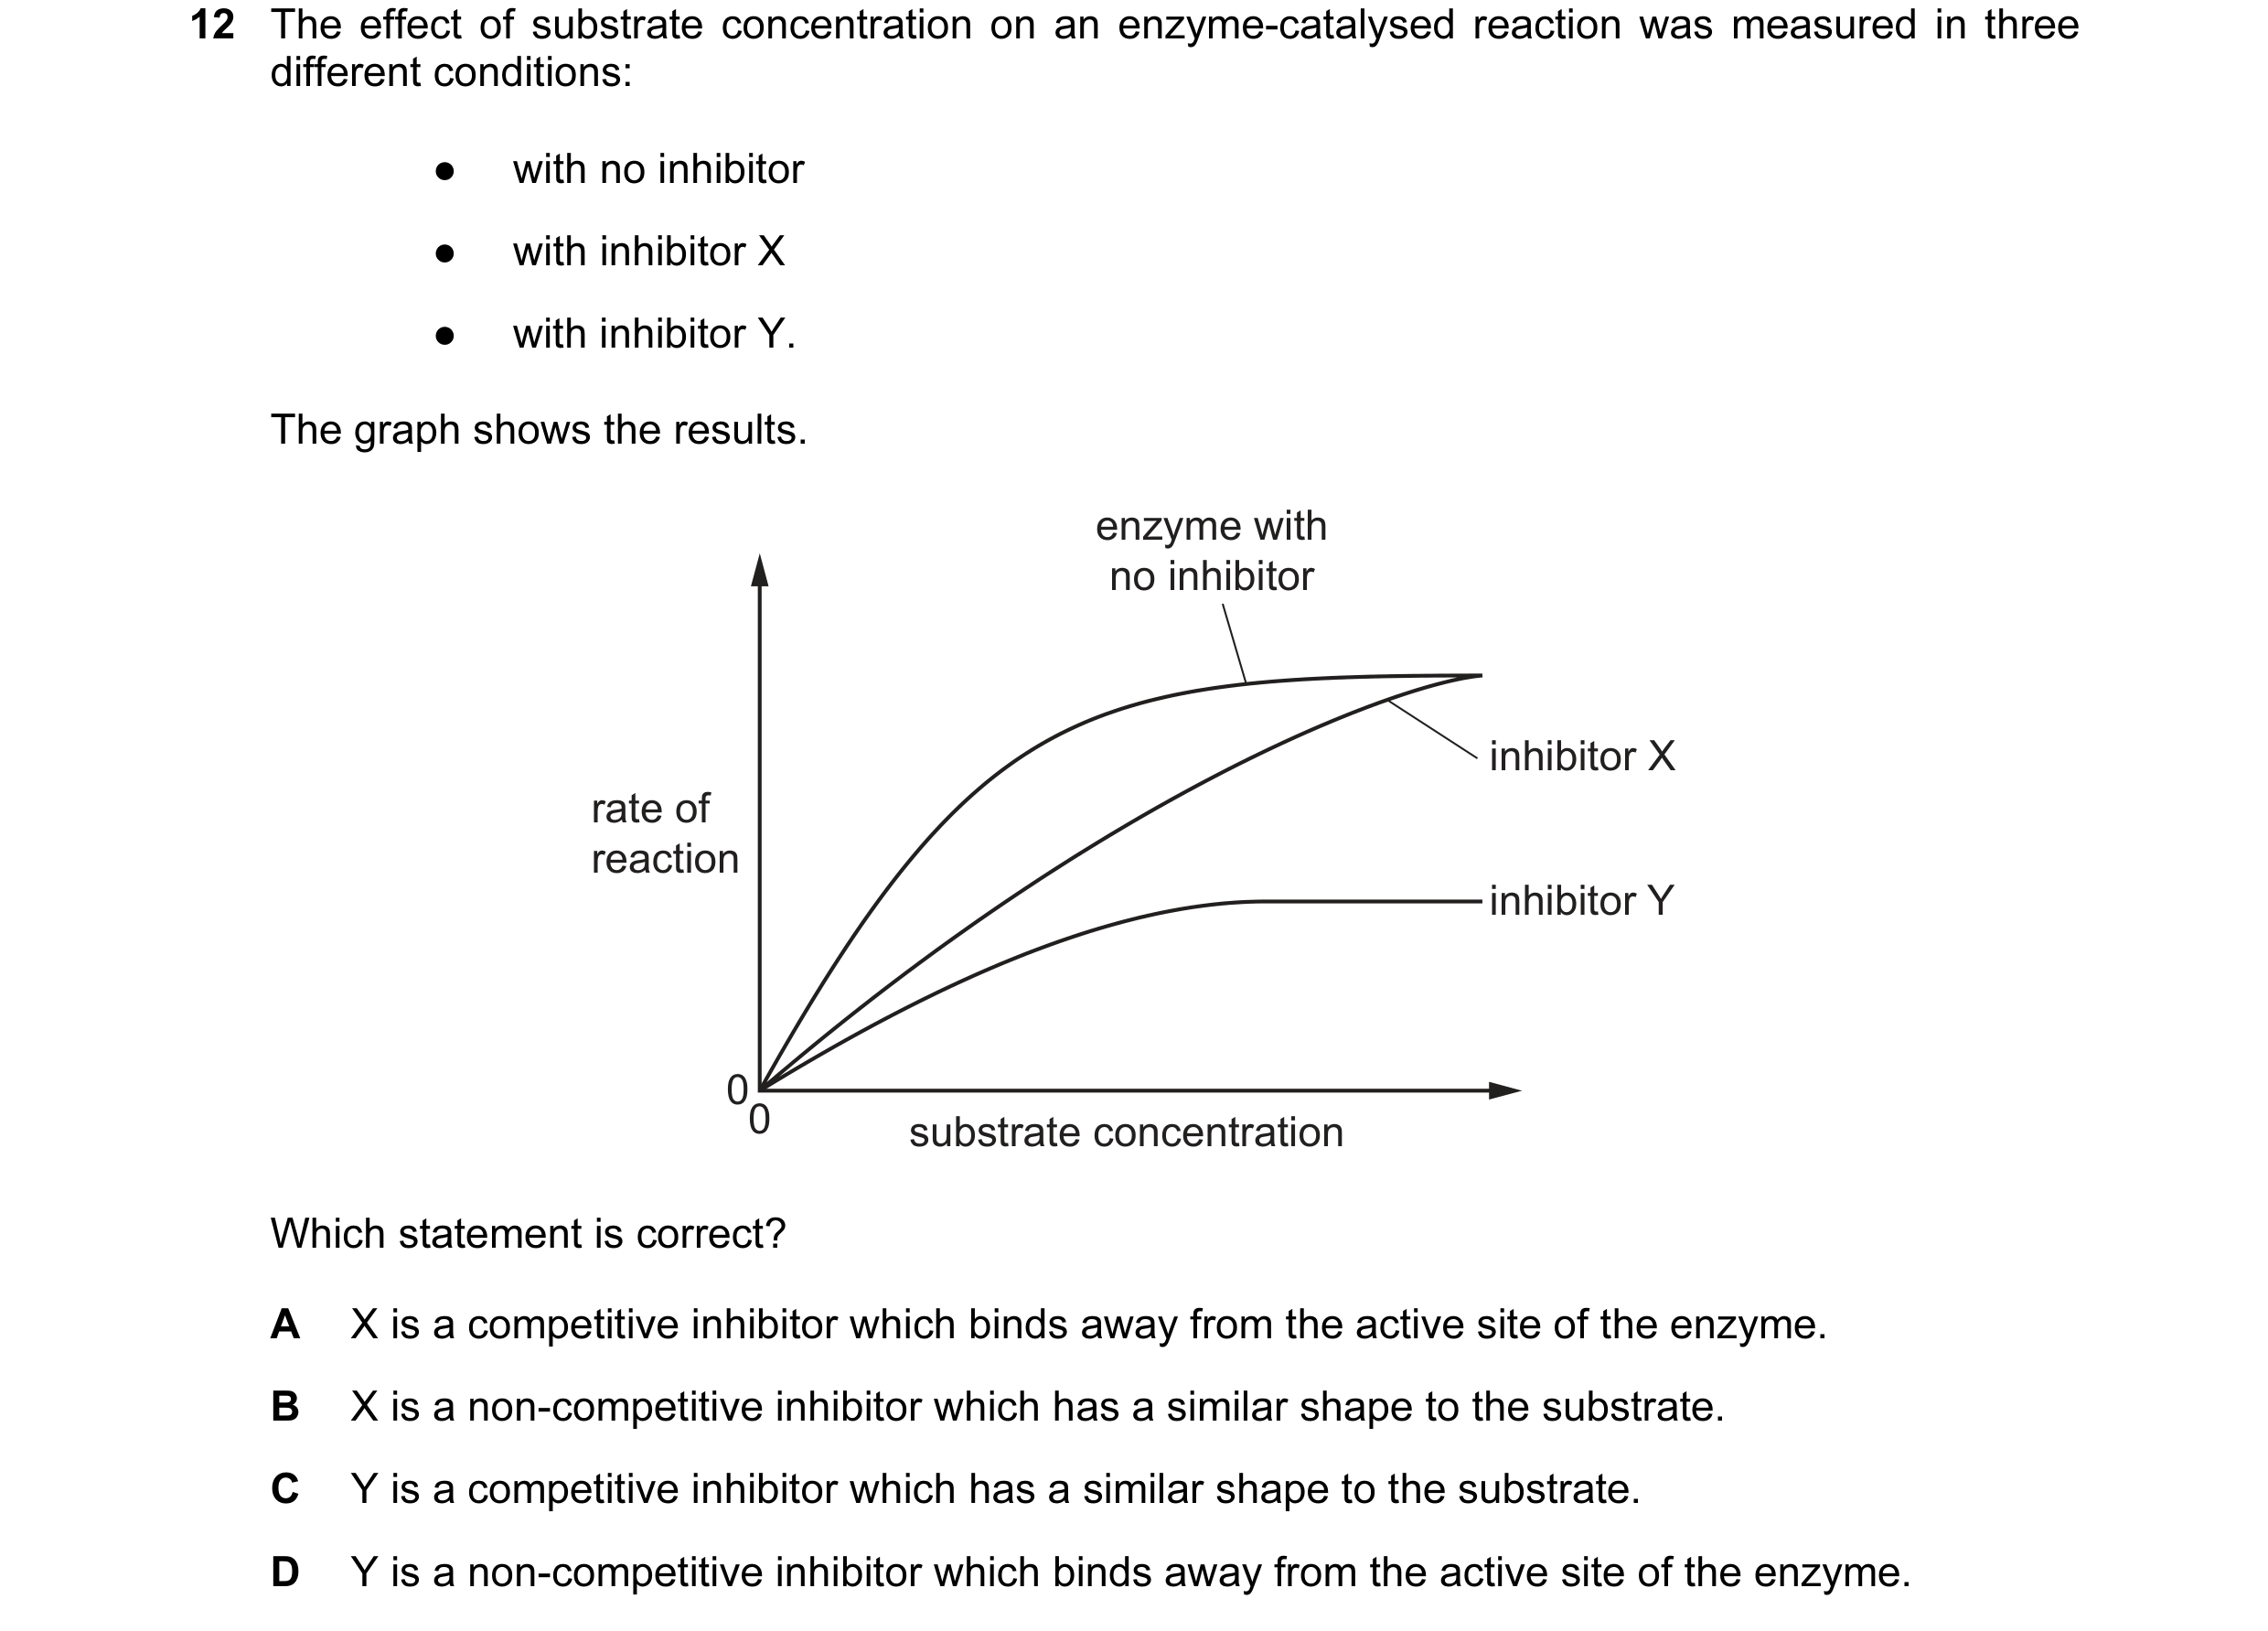
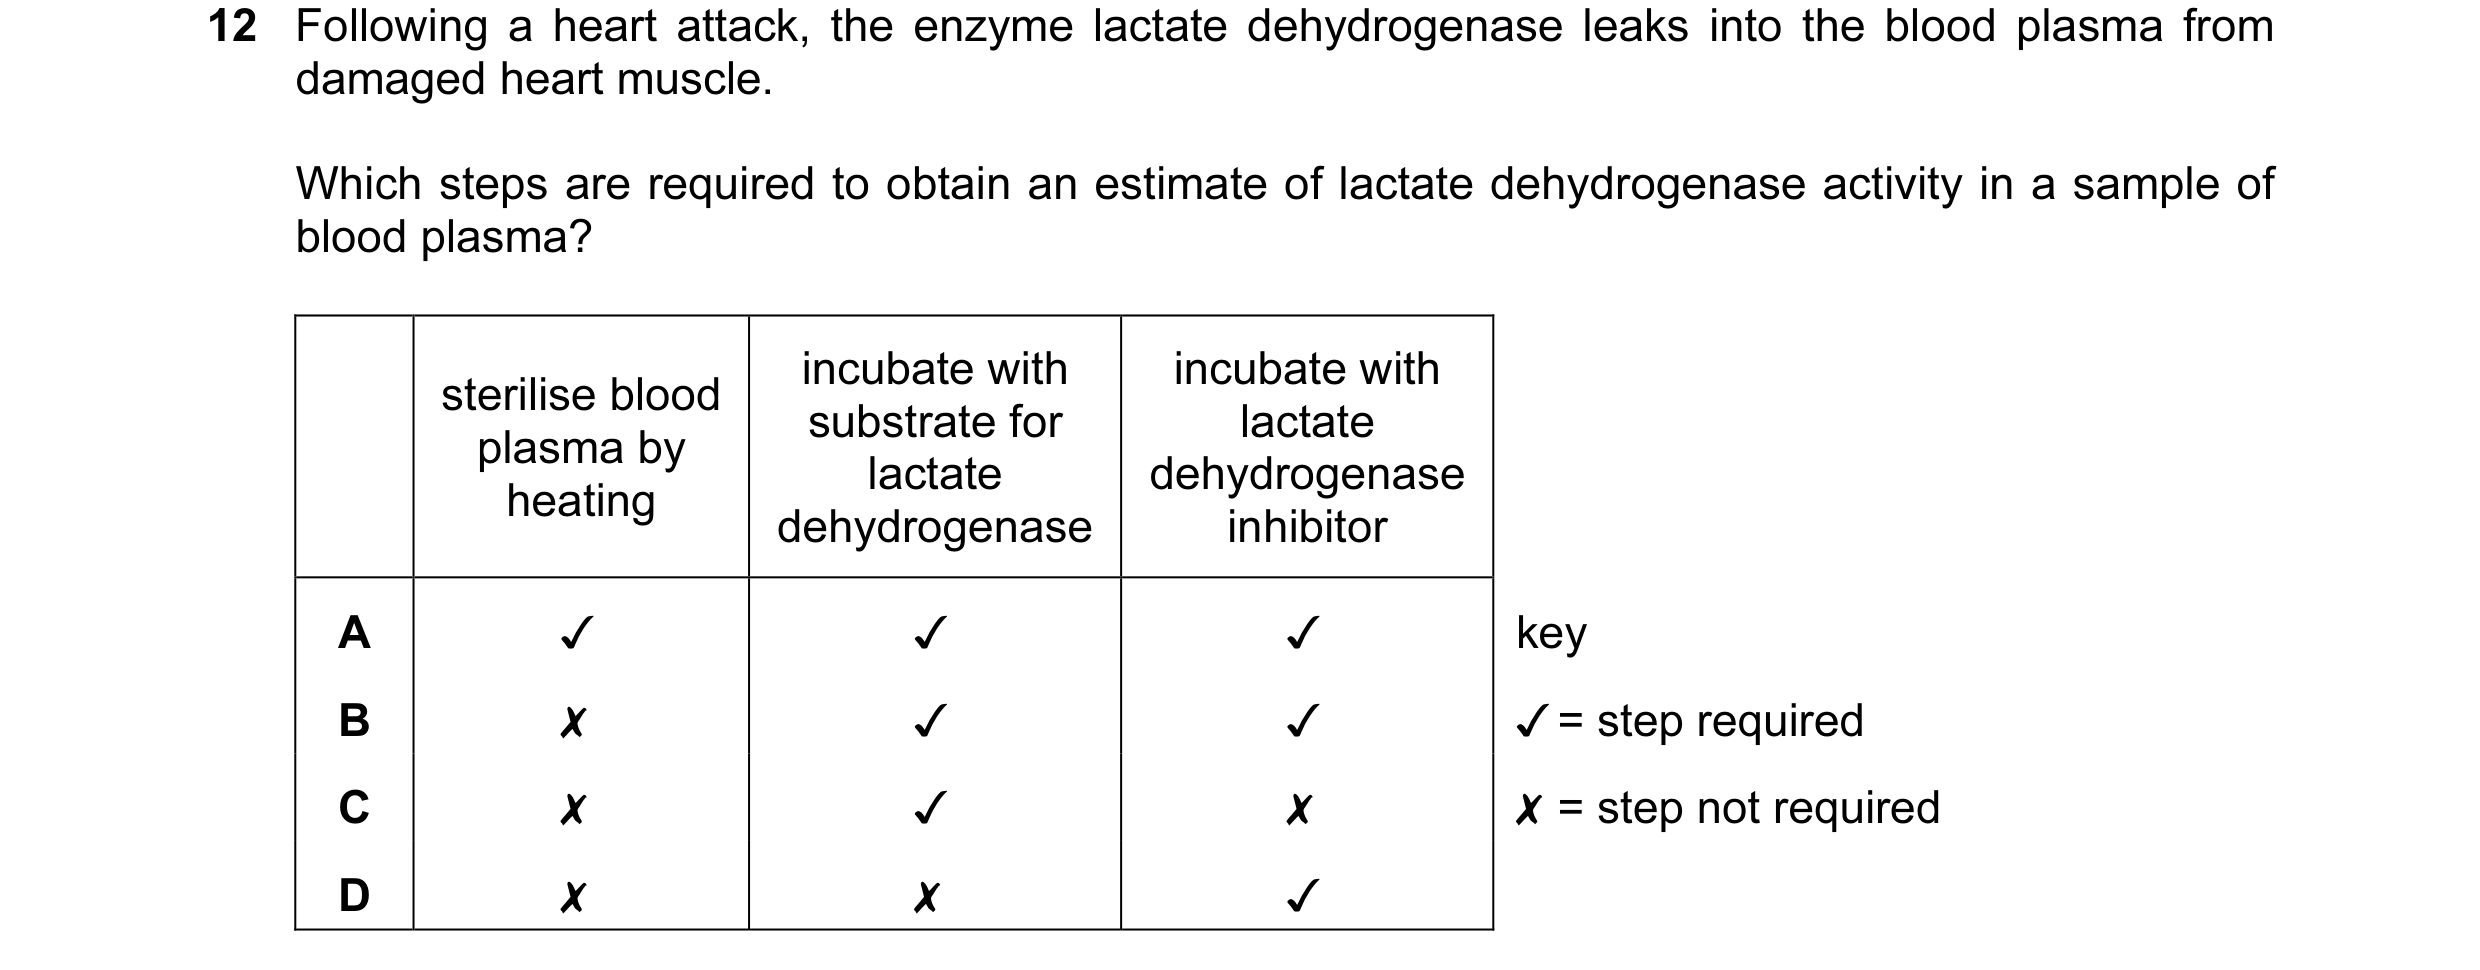 28 / 76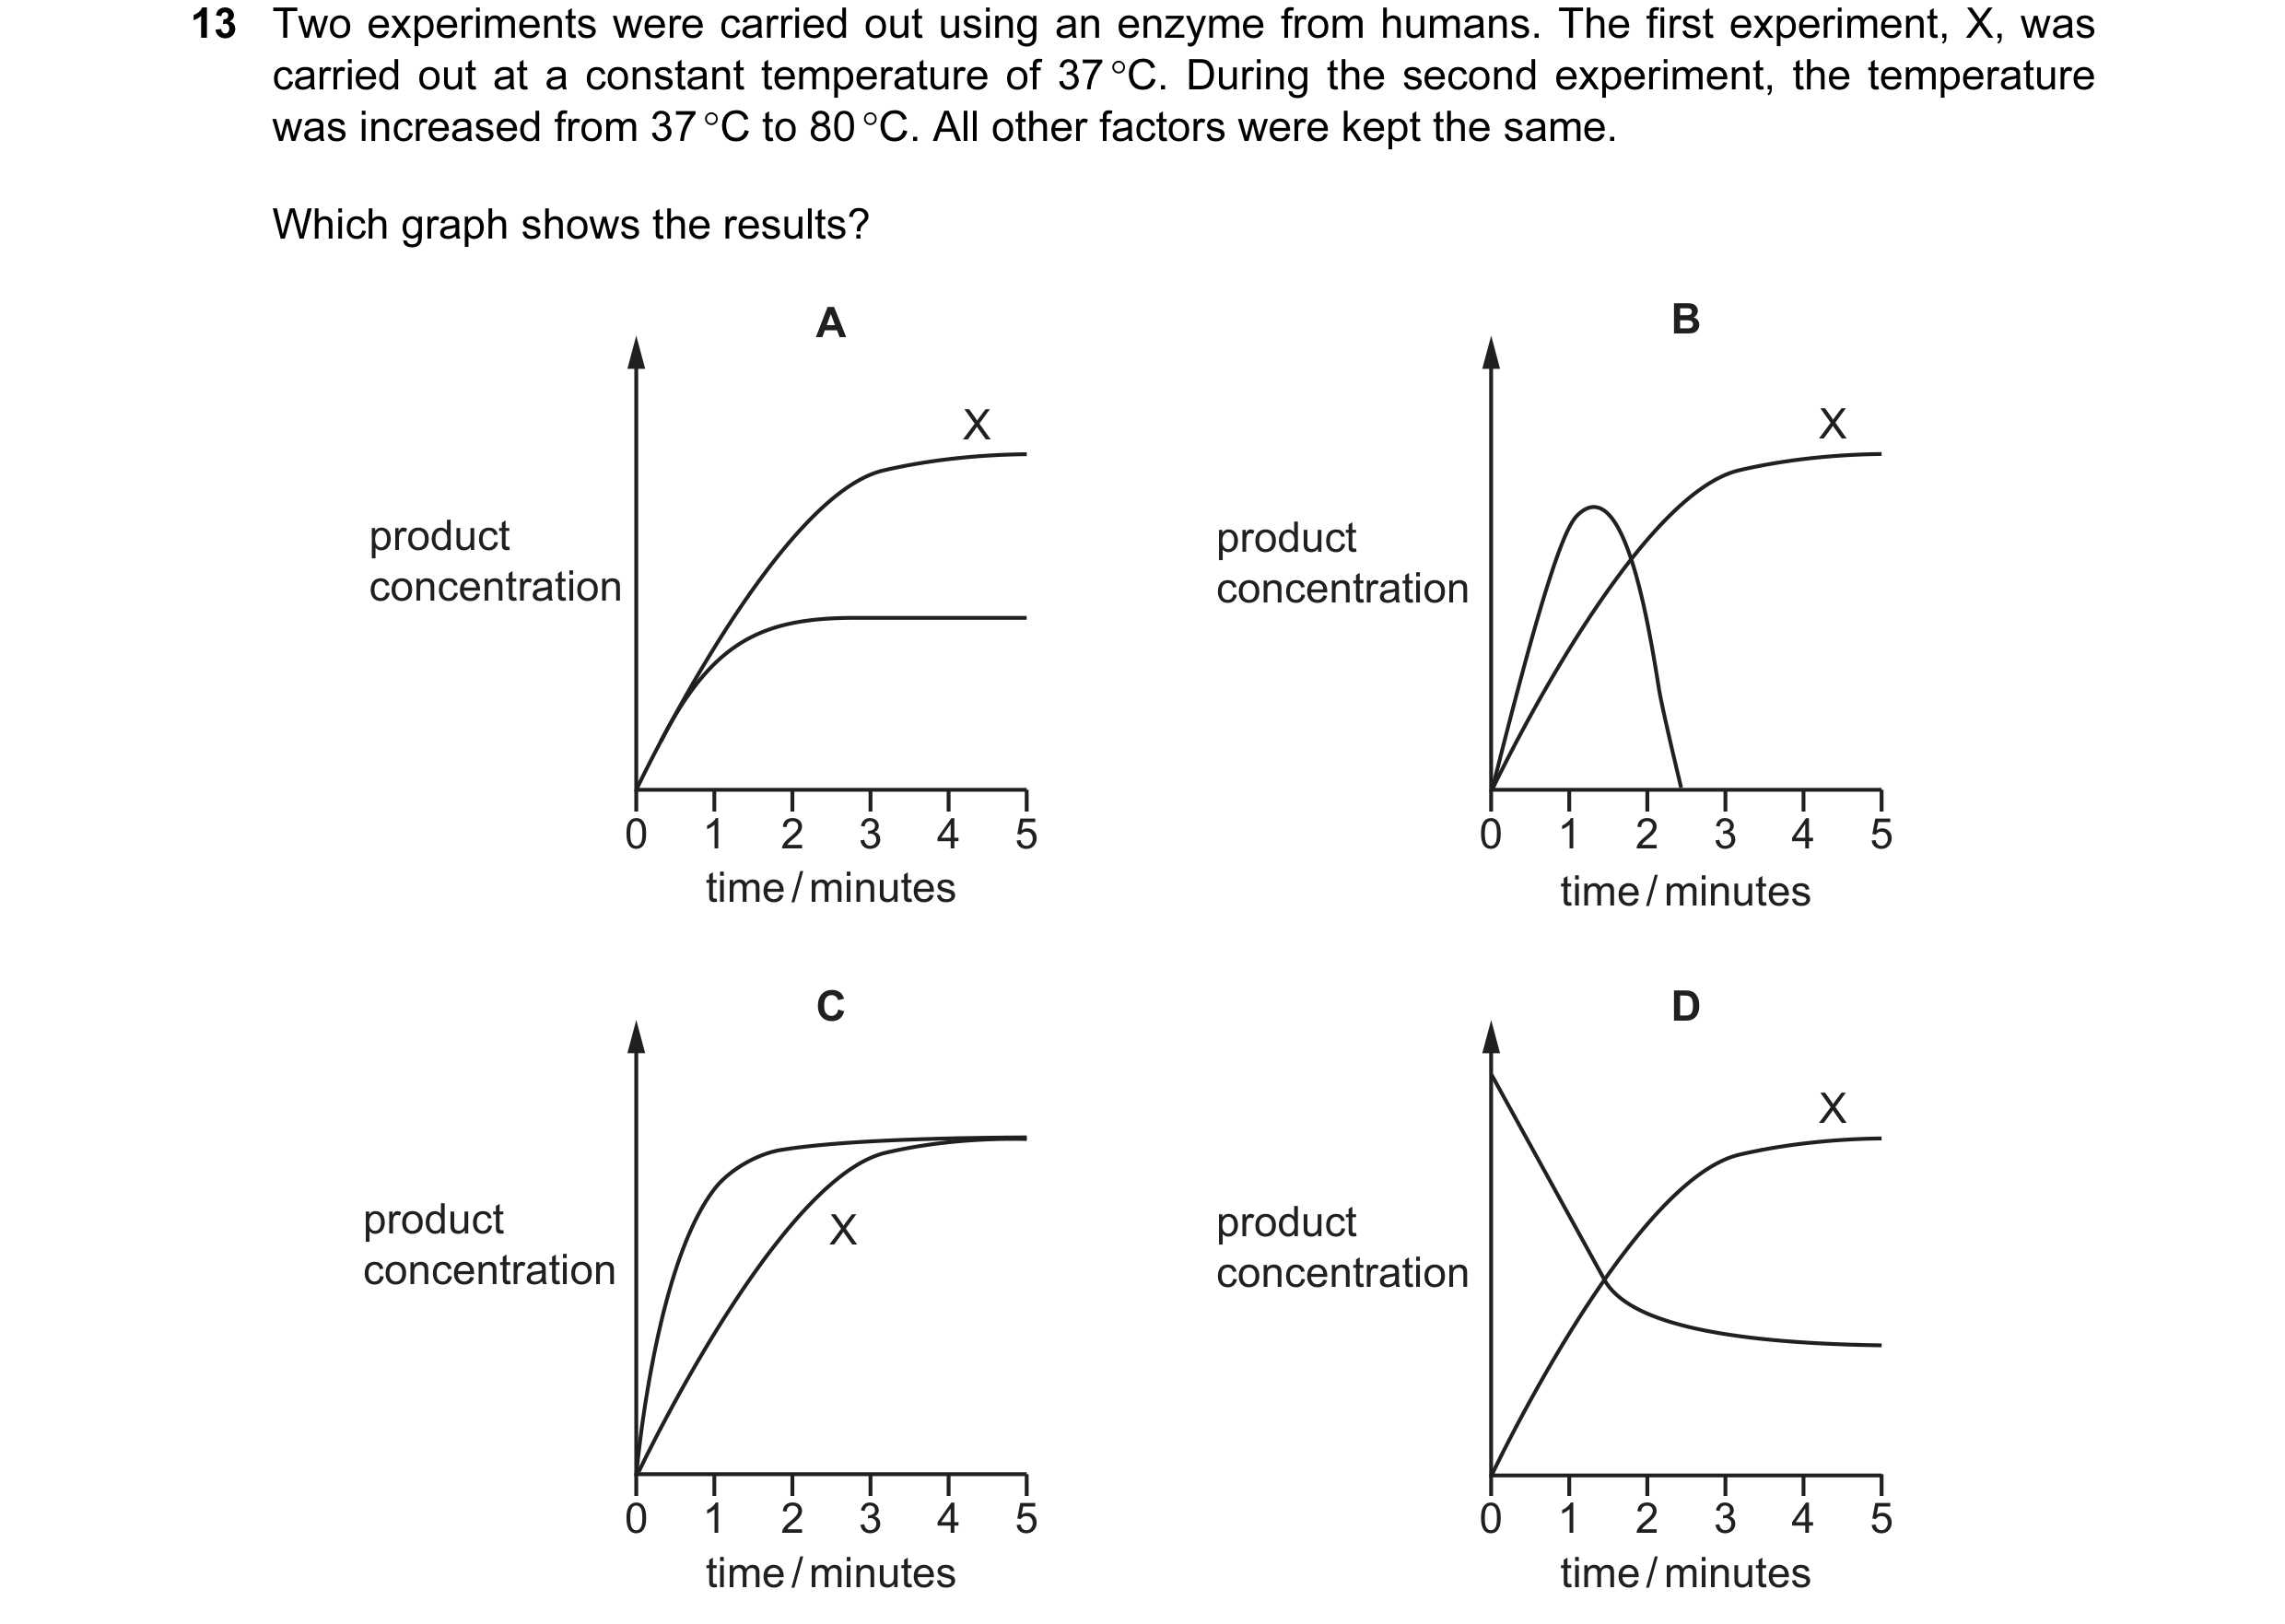
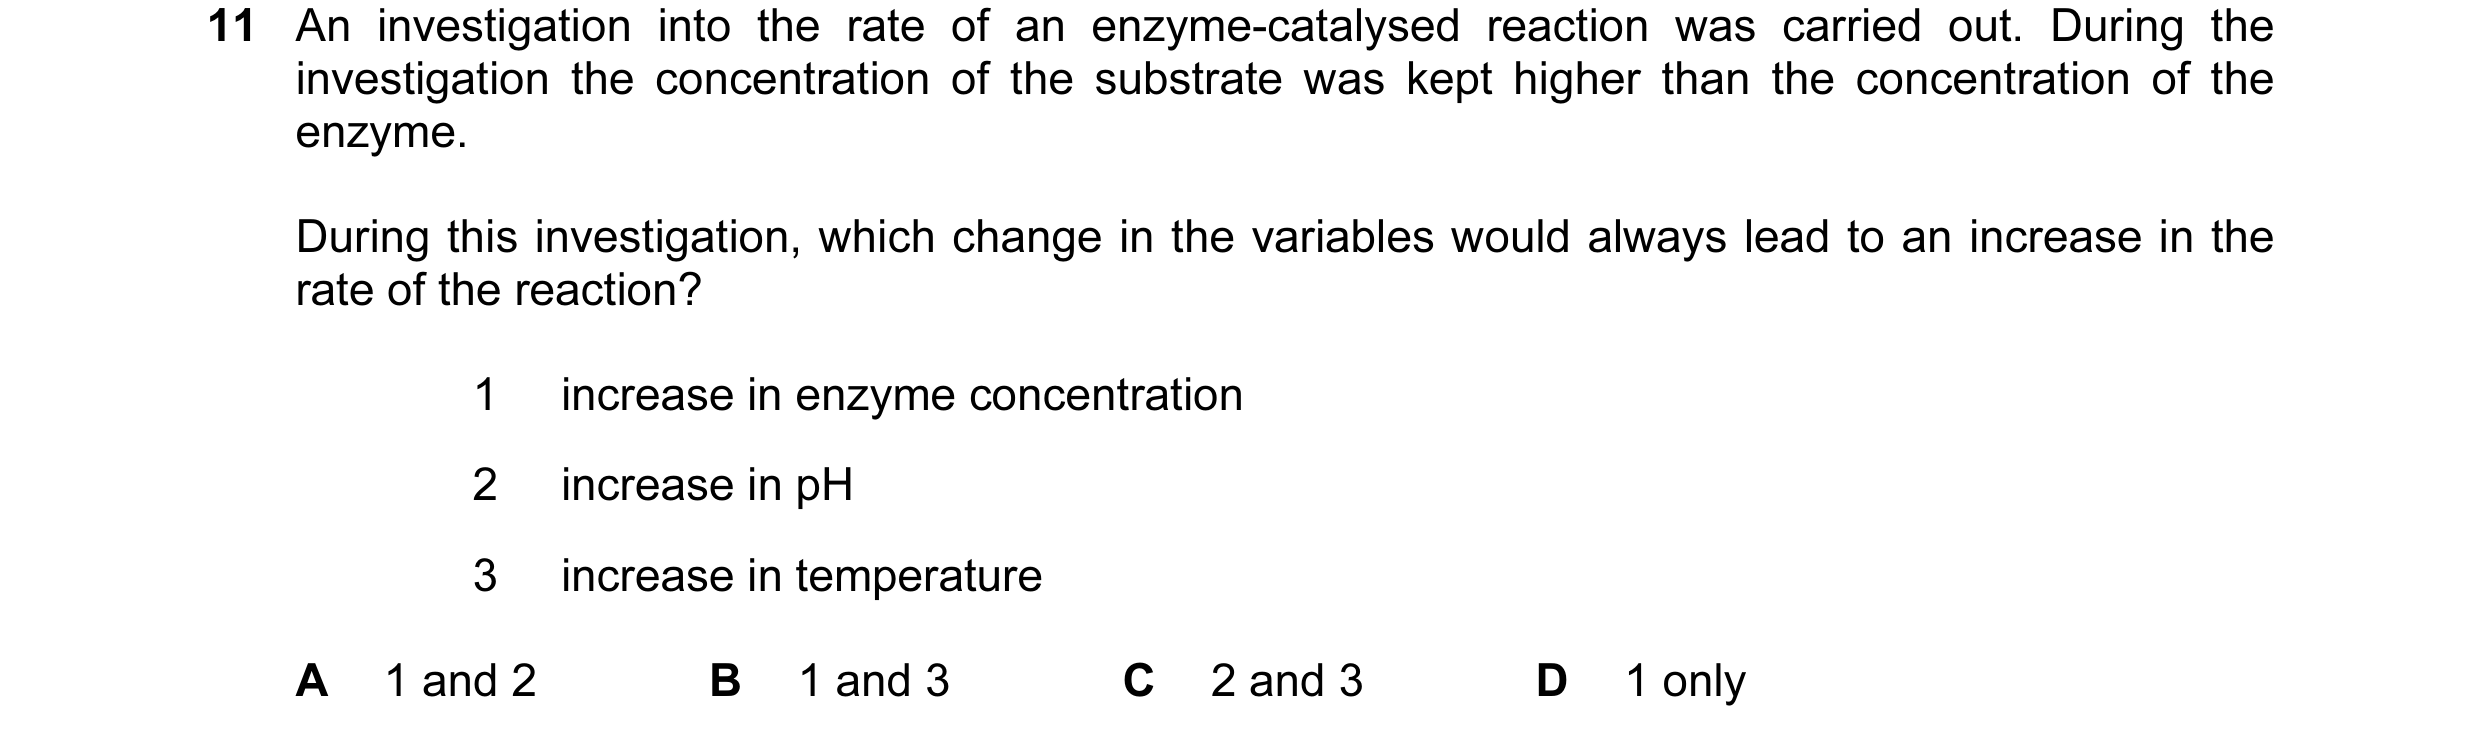 29 / 76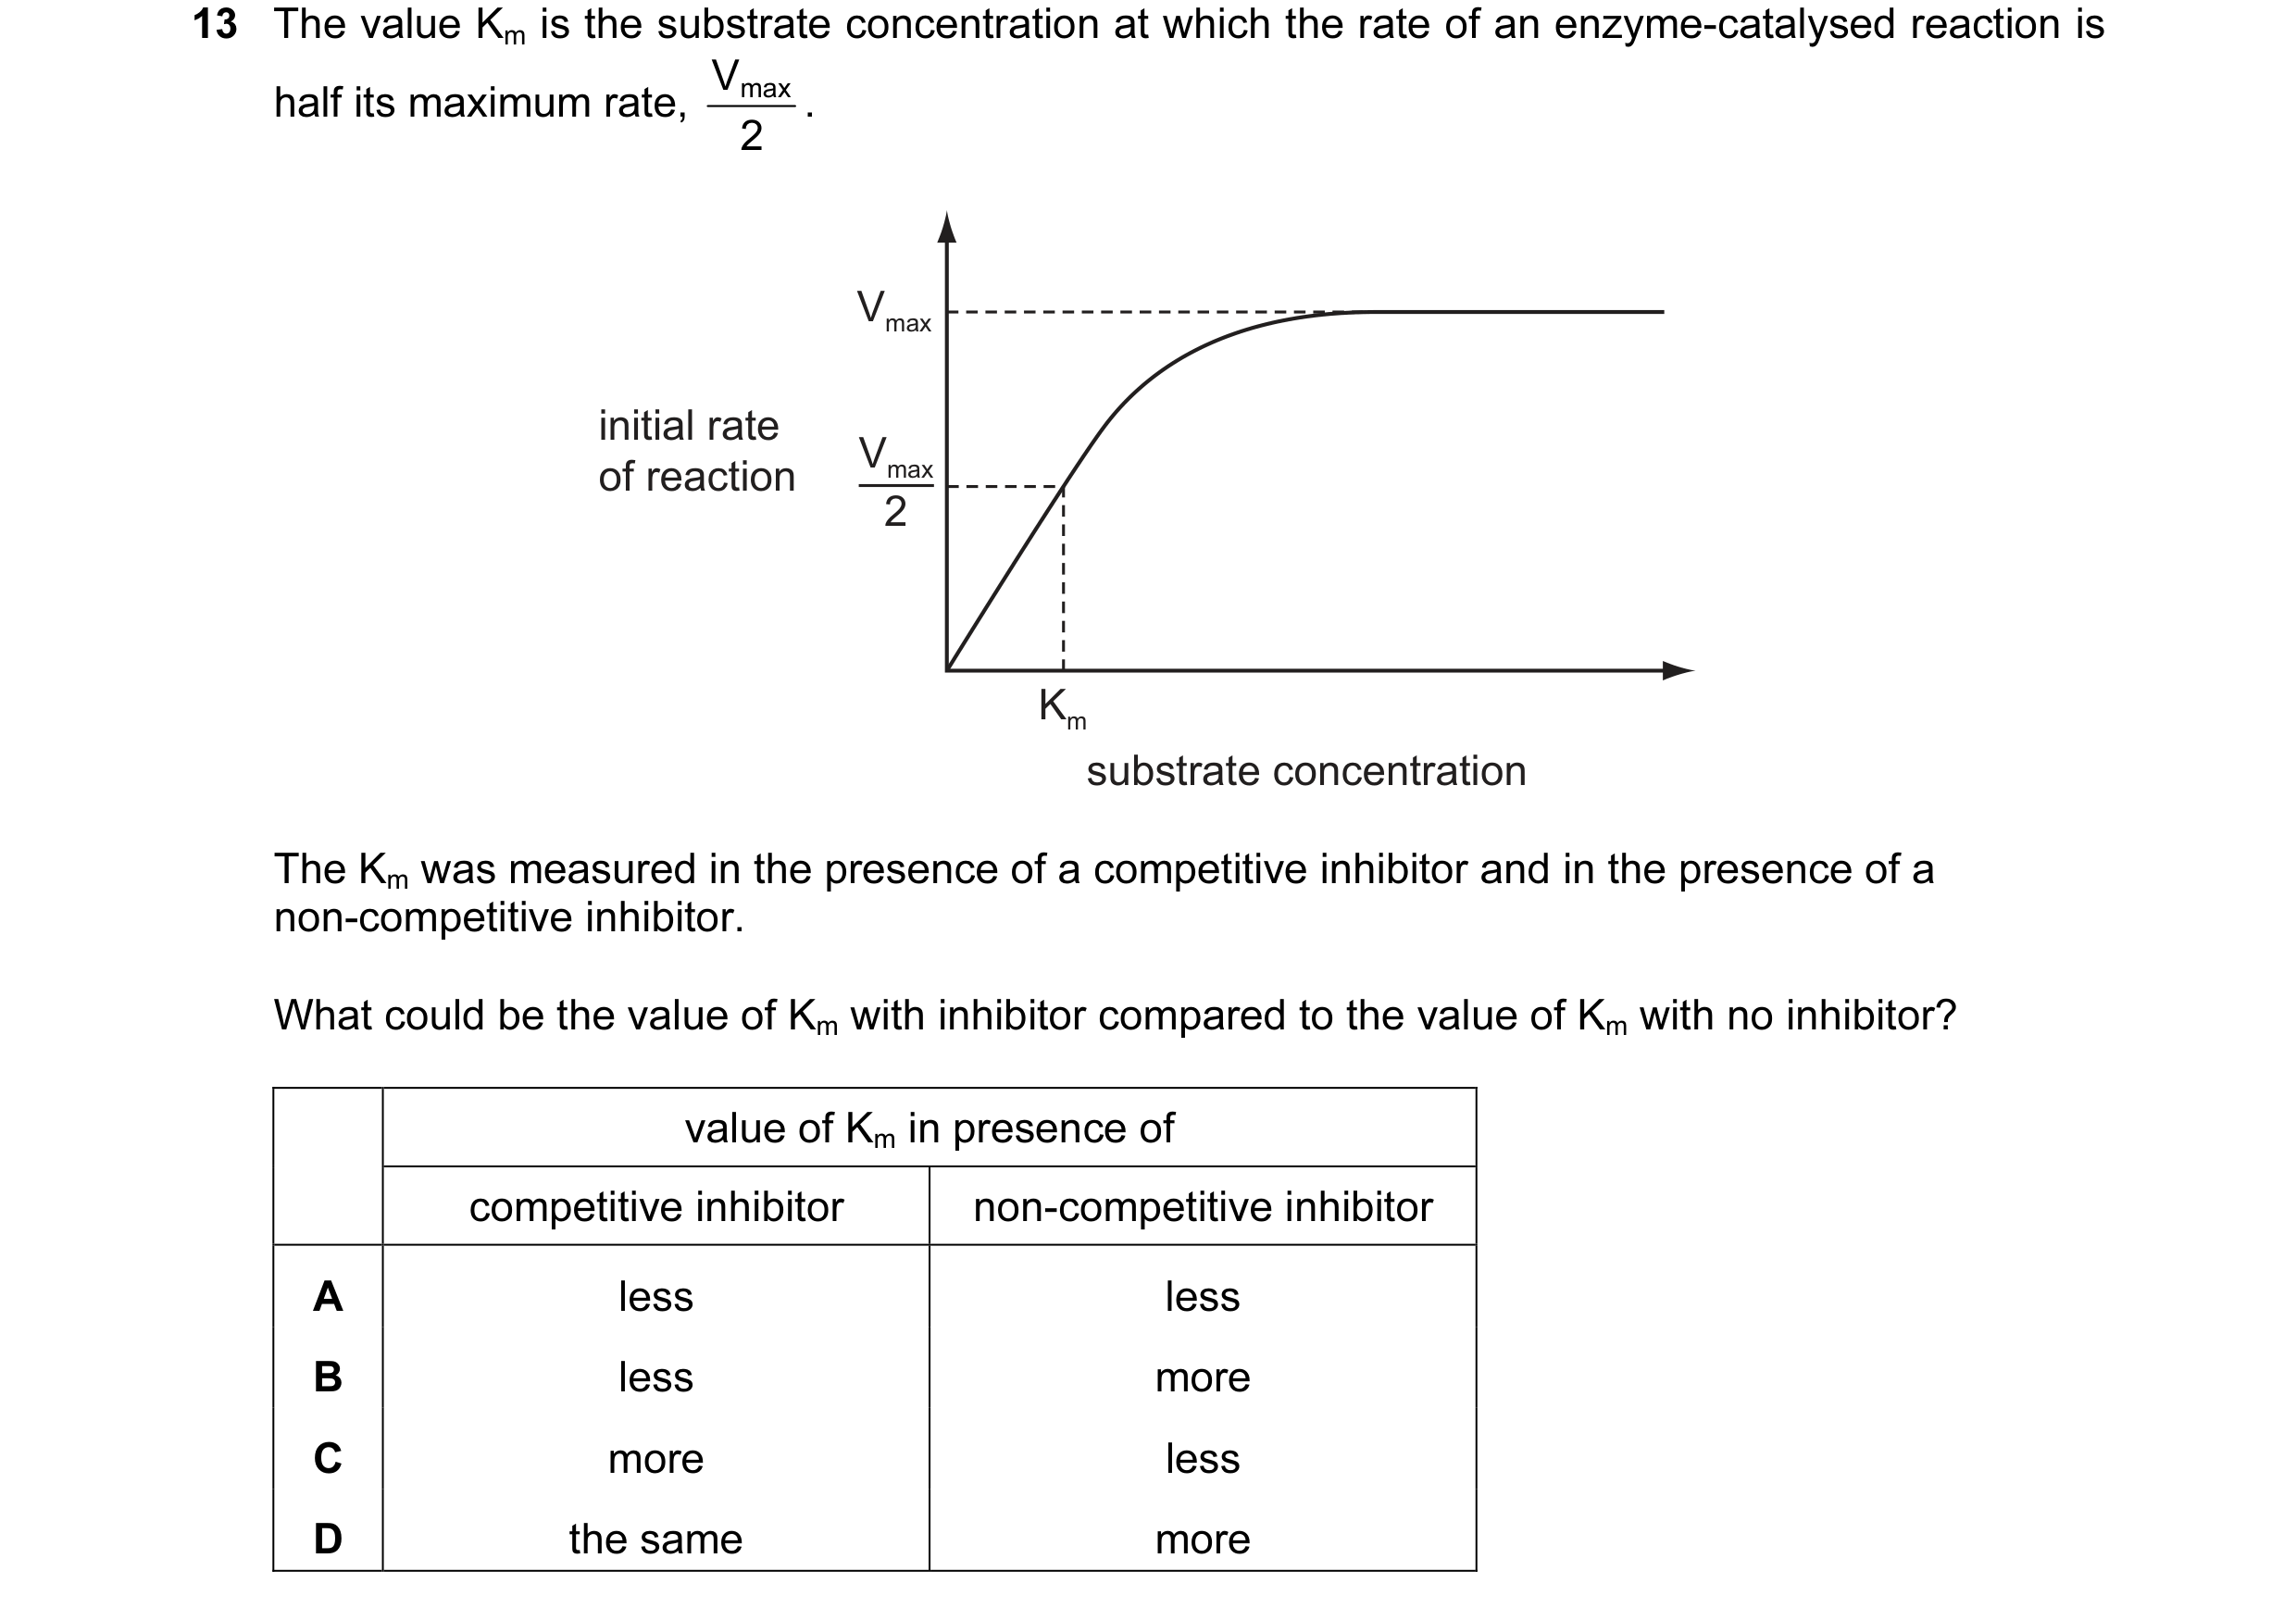
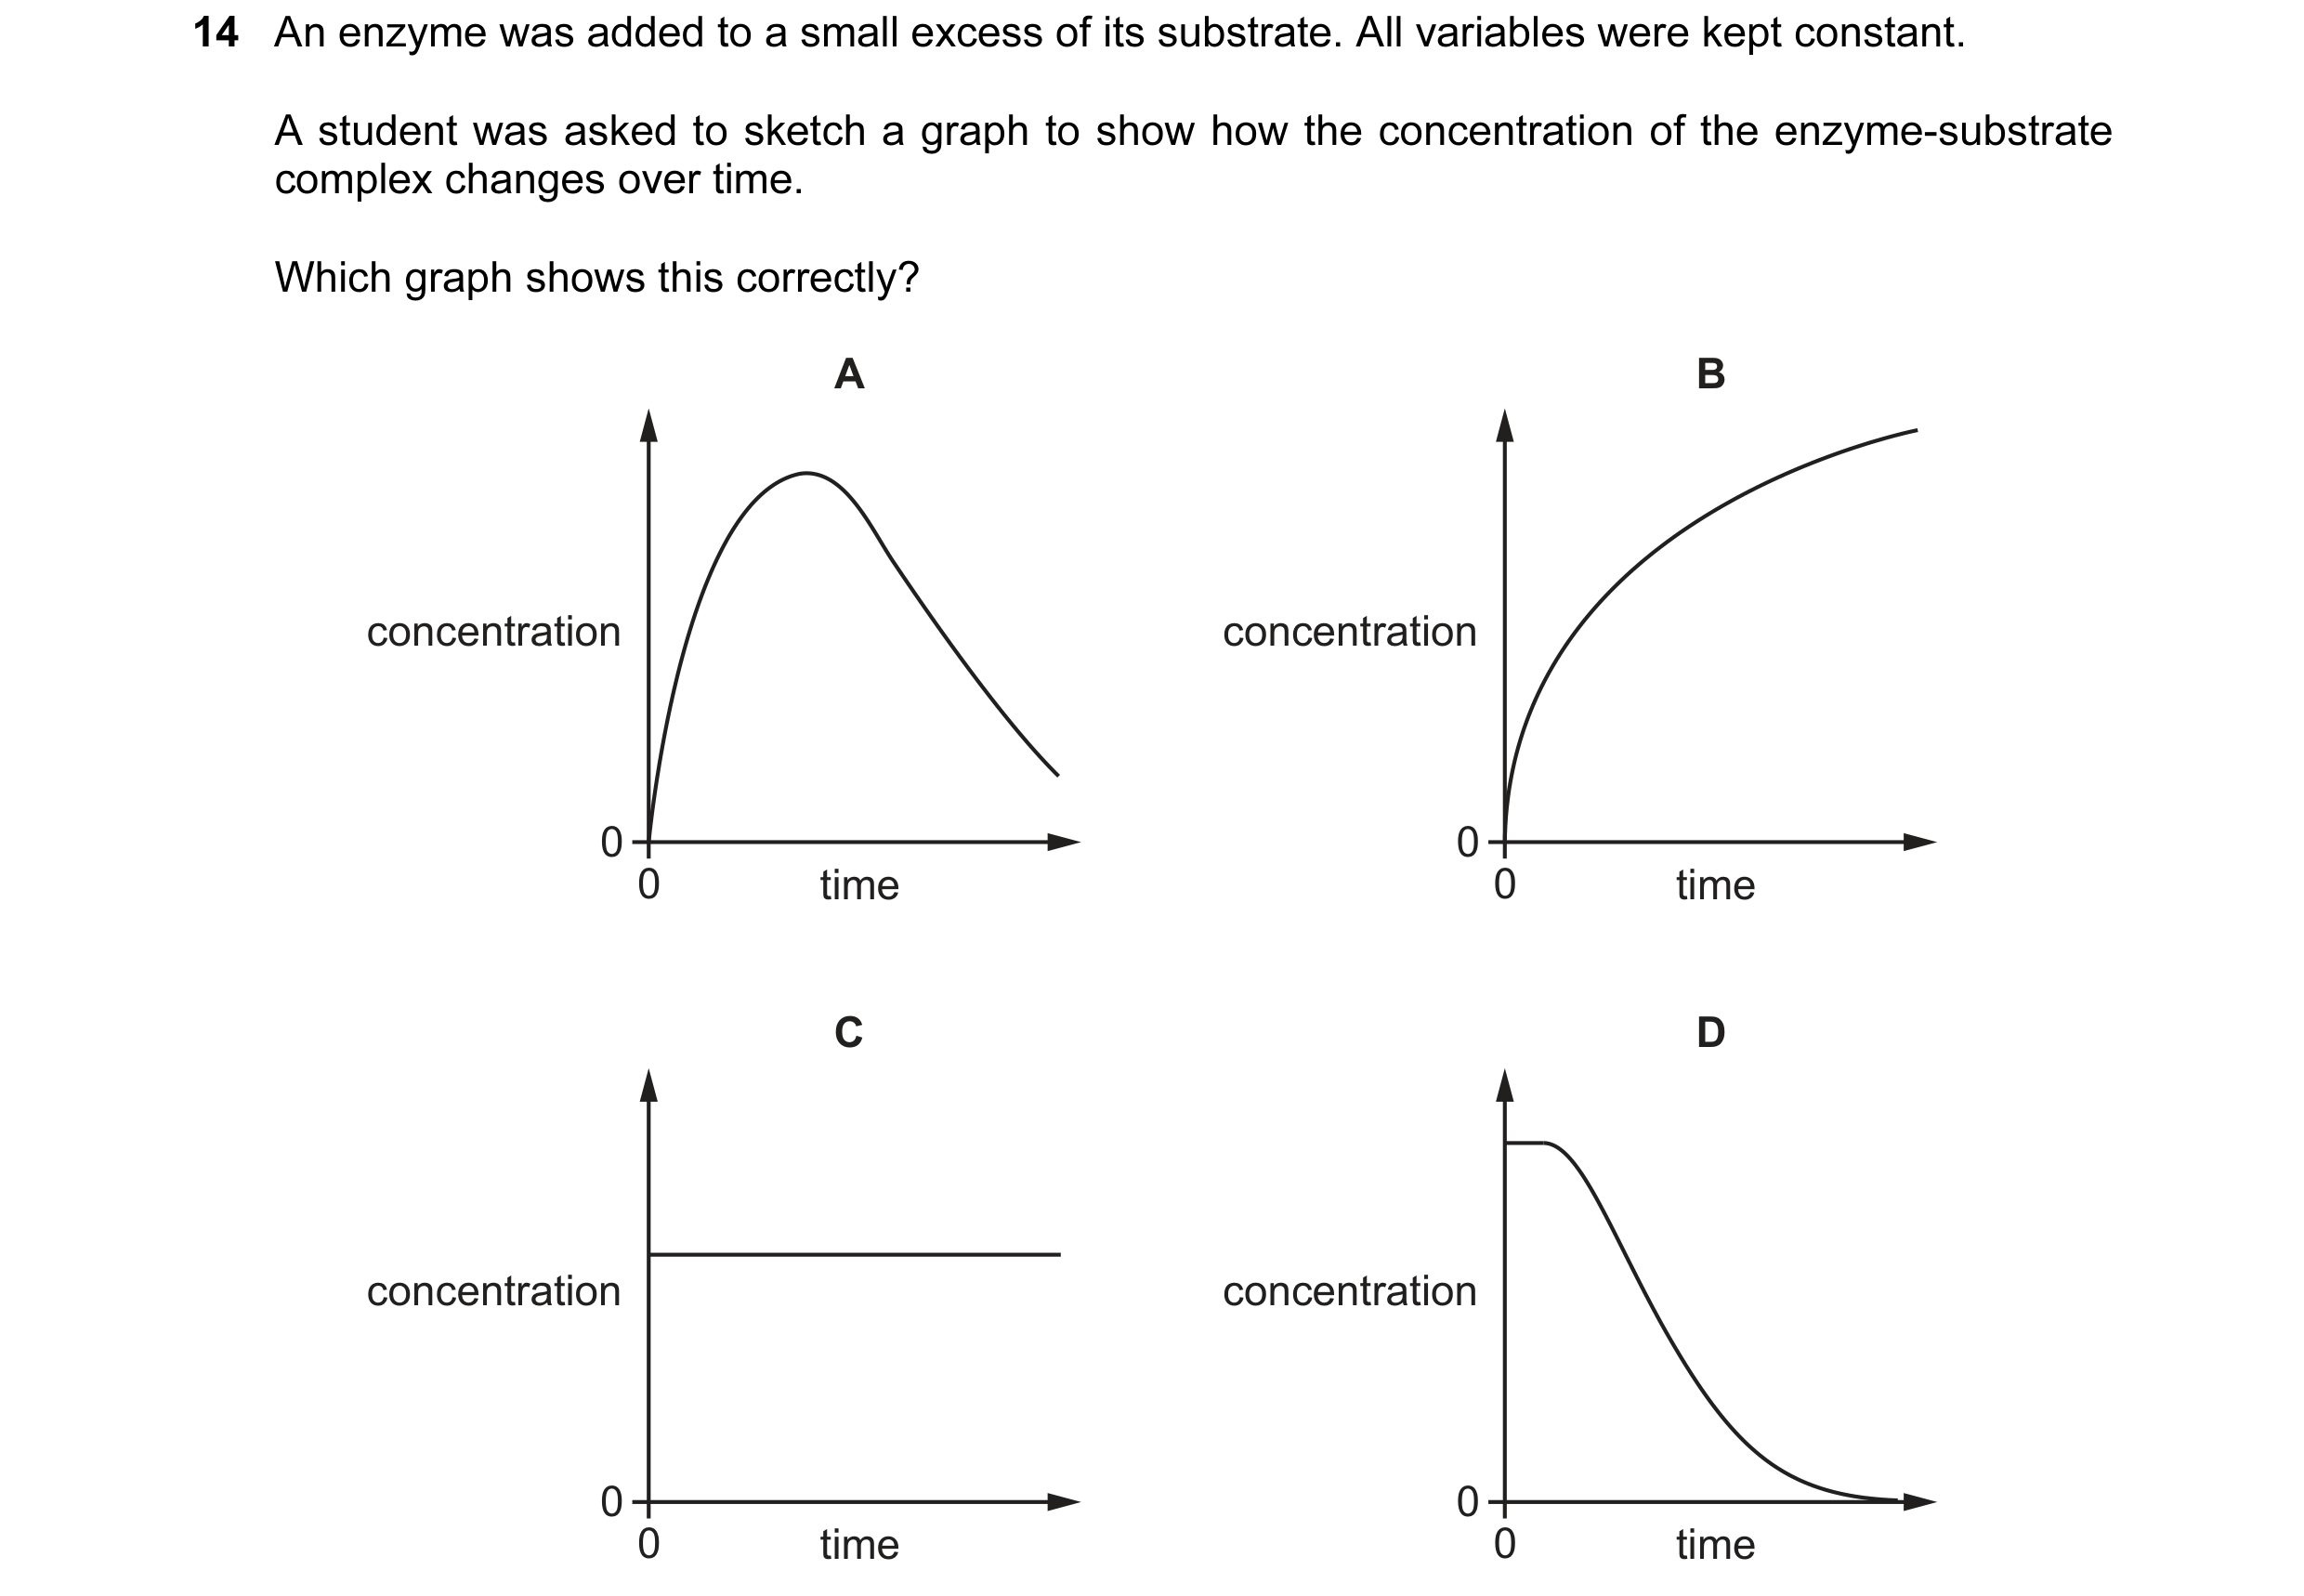 30 / 76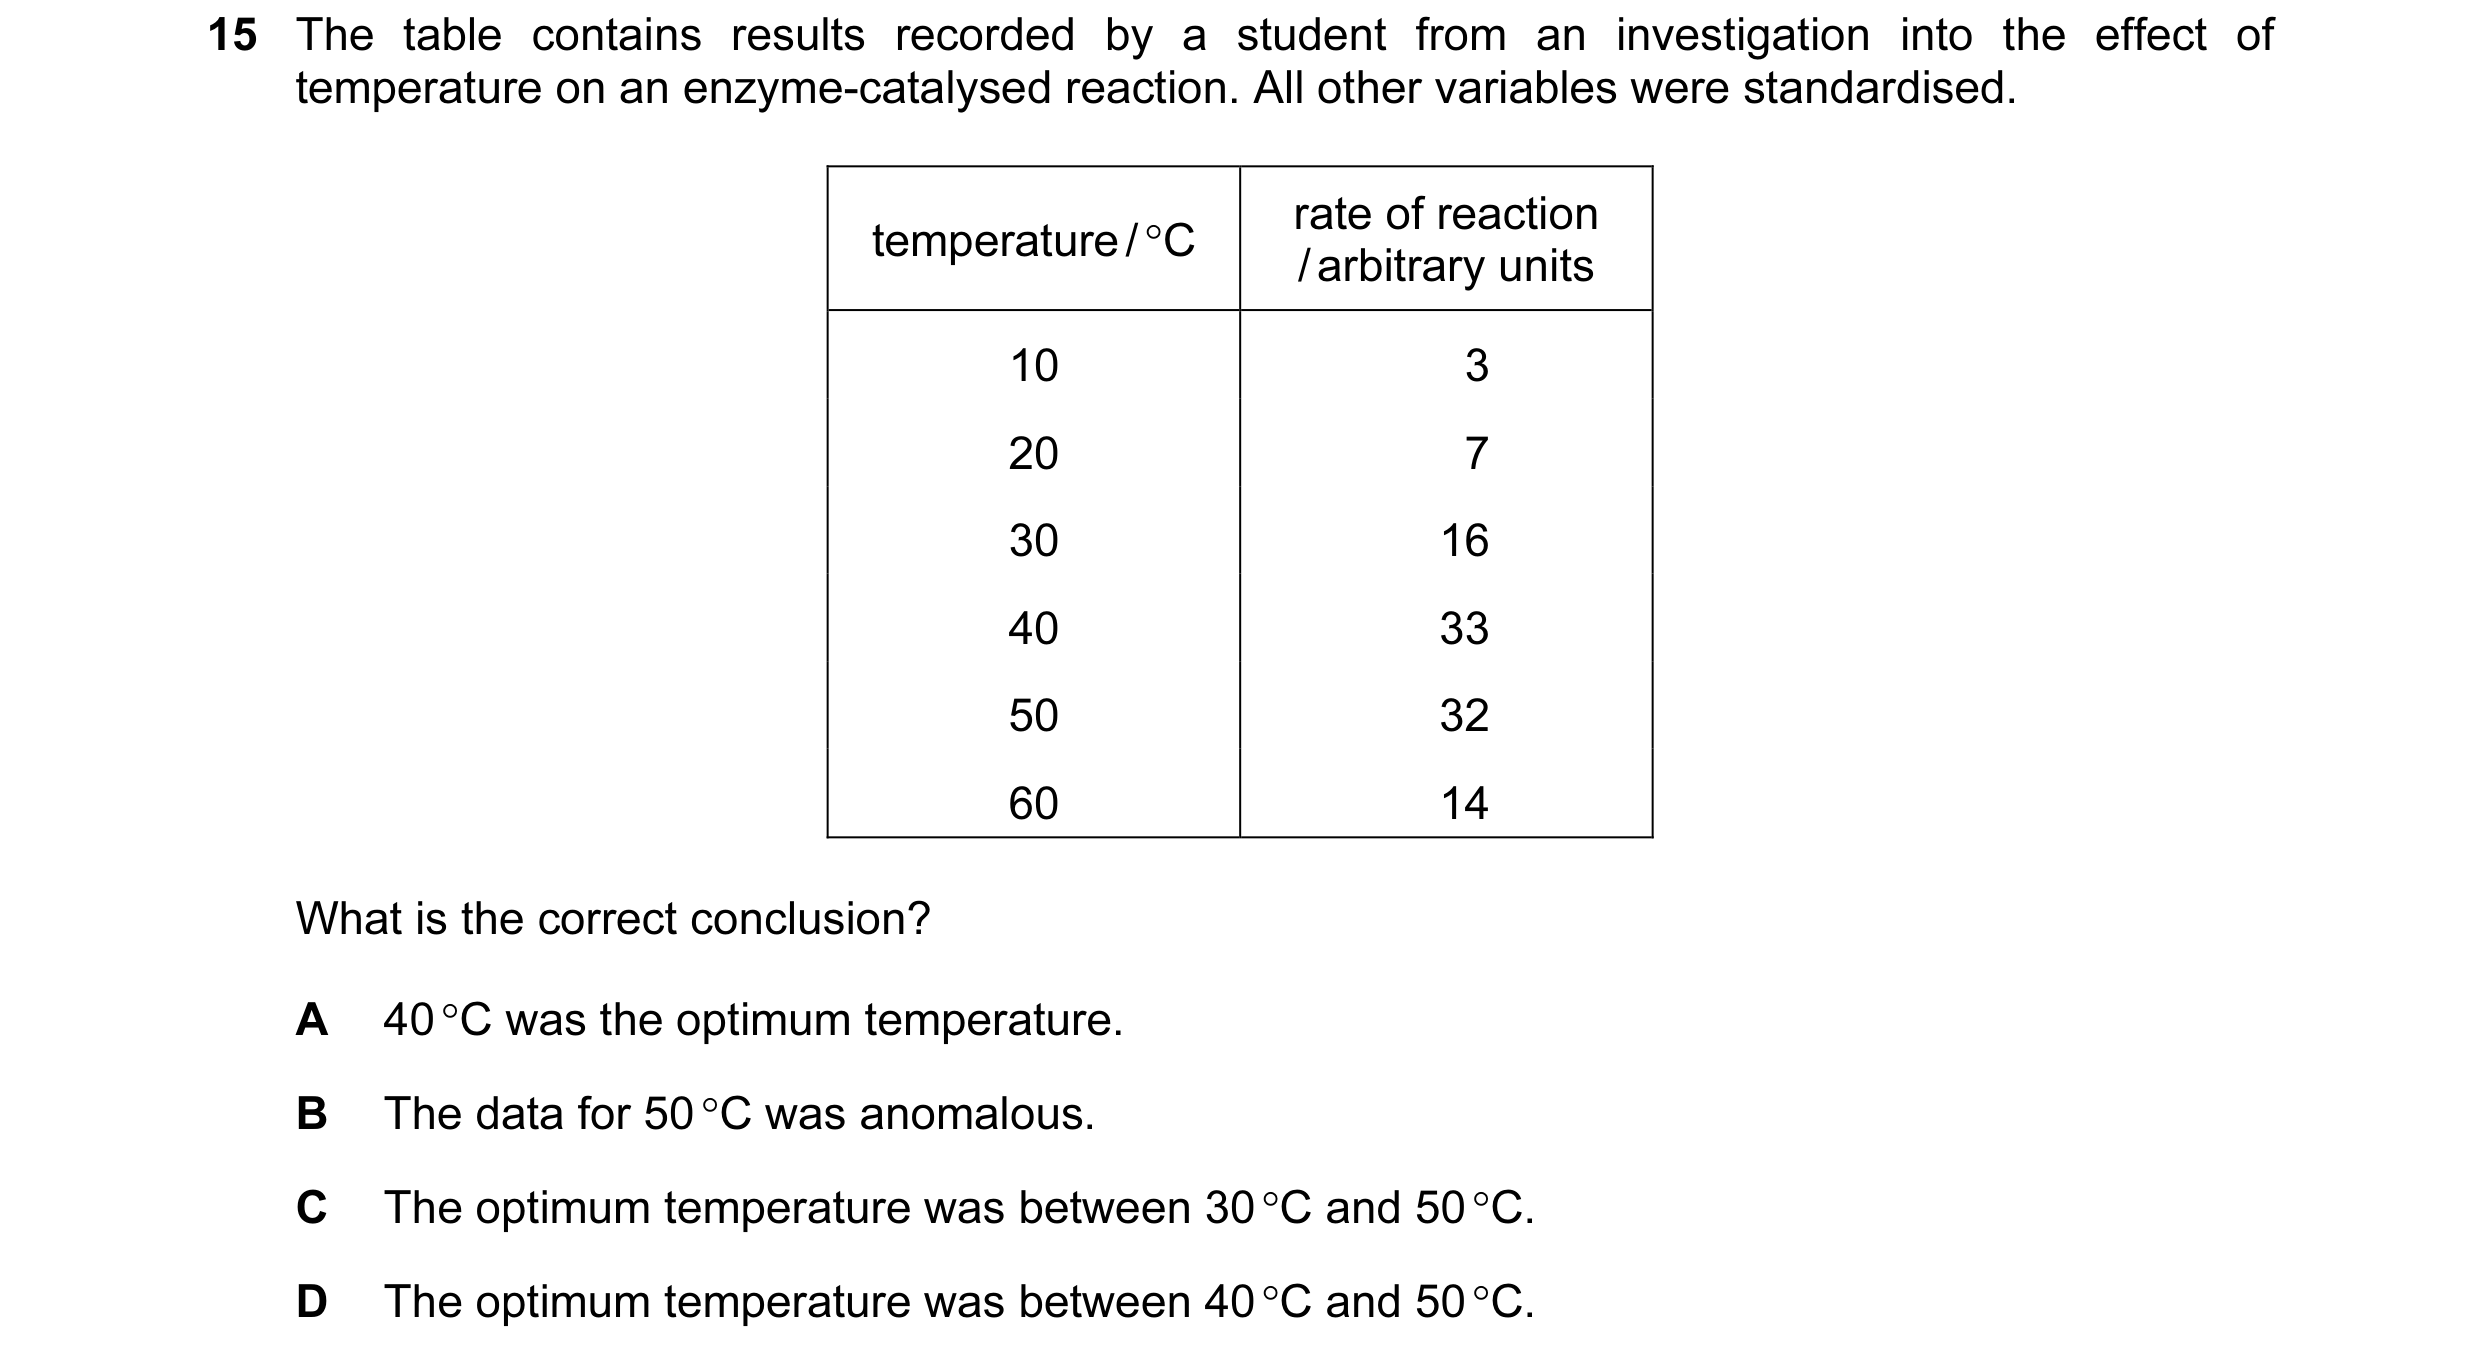
 31 / 76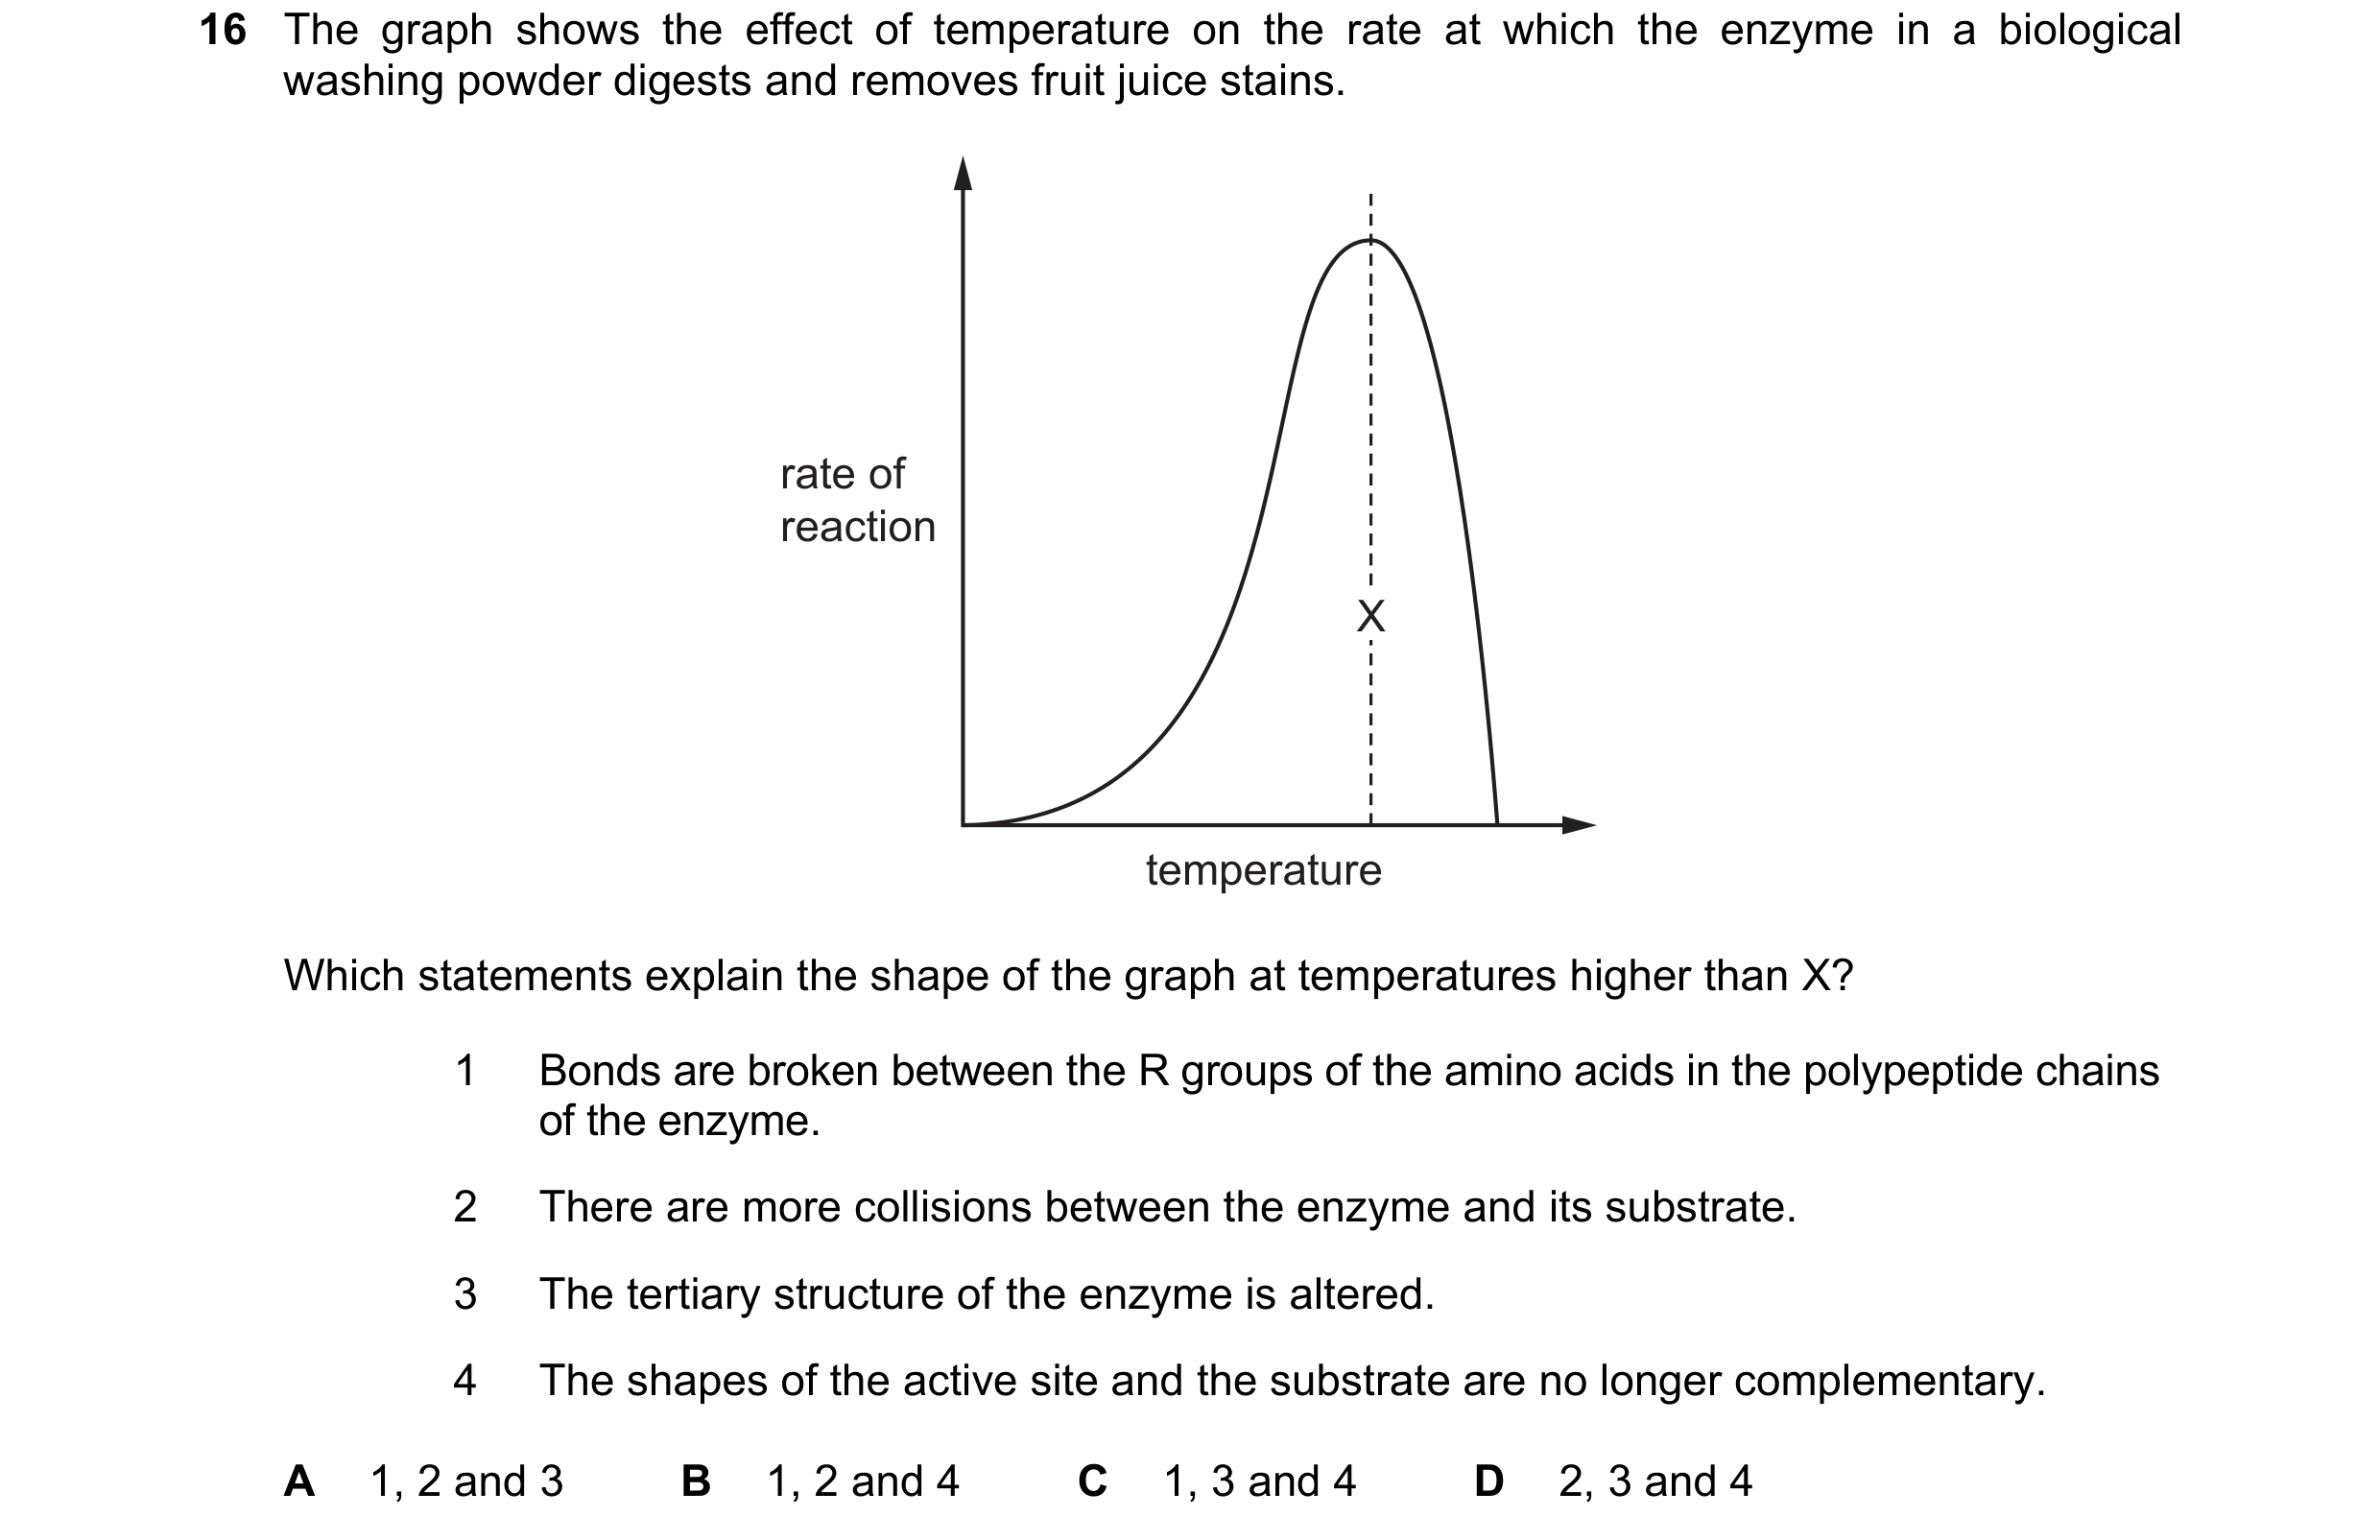
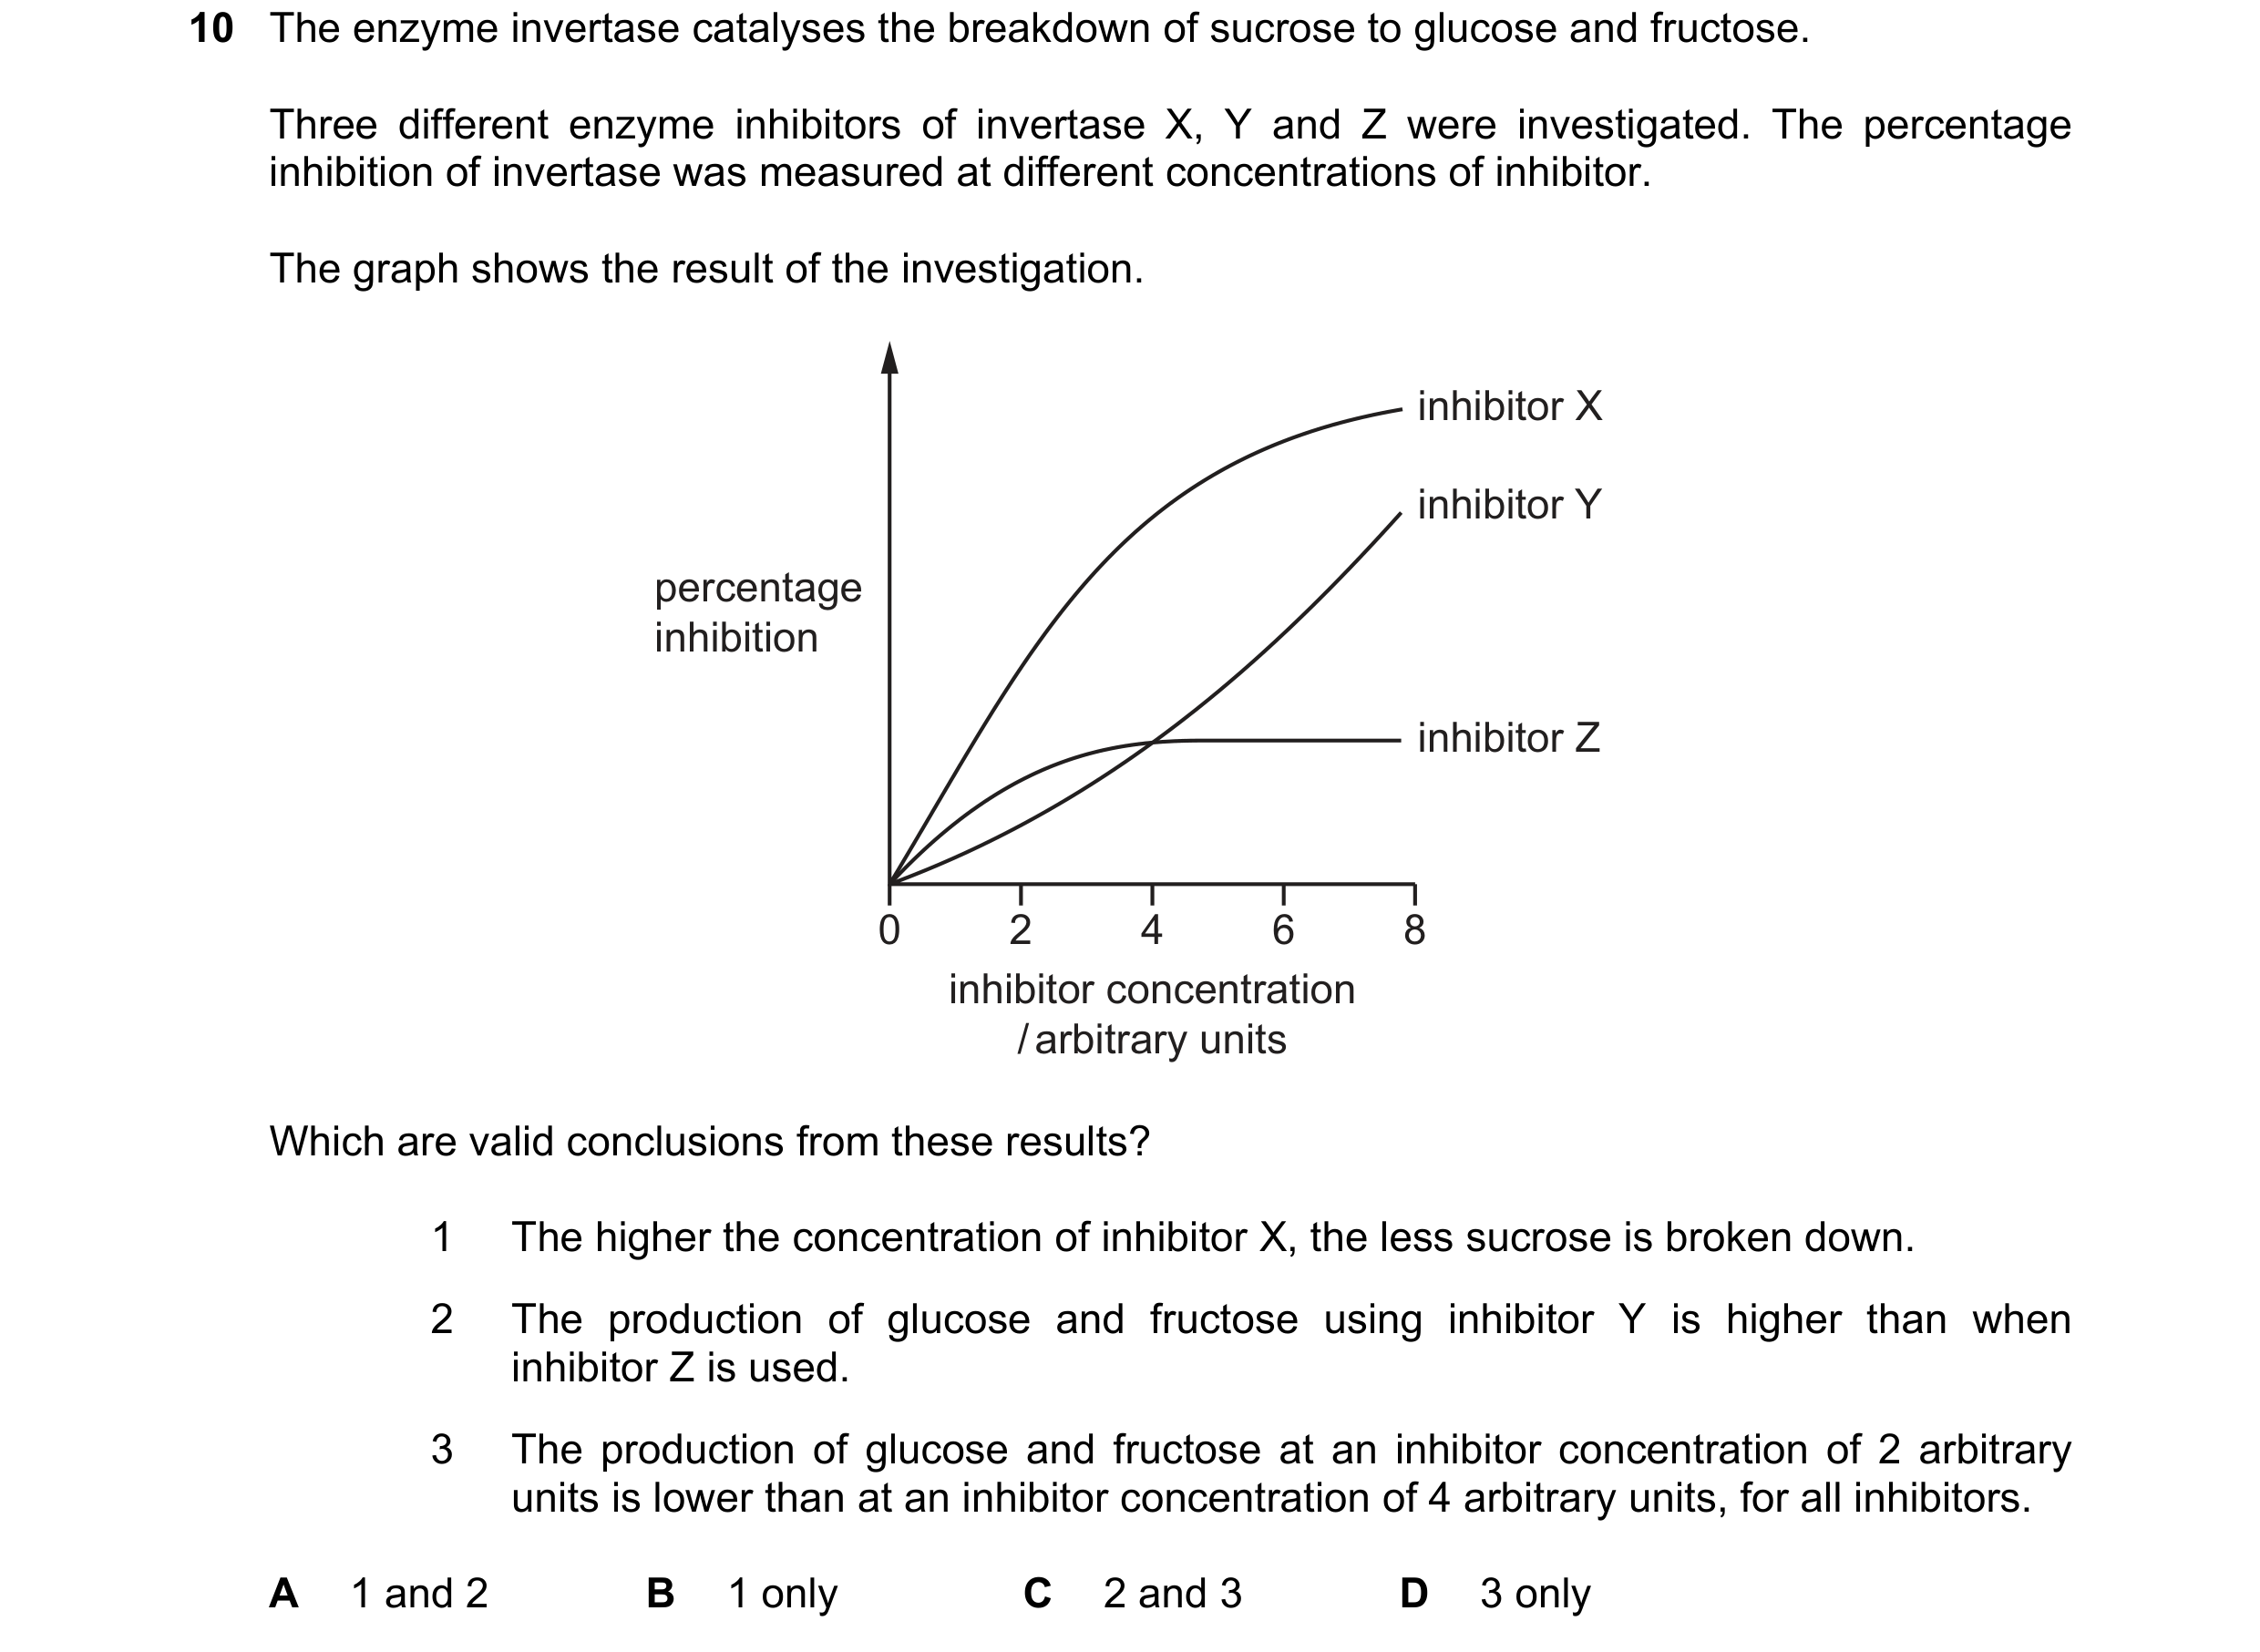 32 / 76
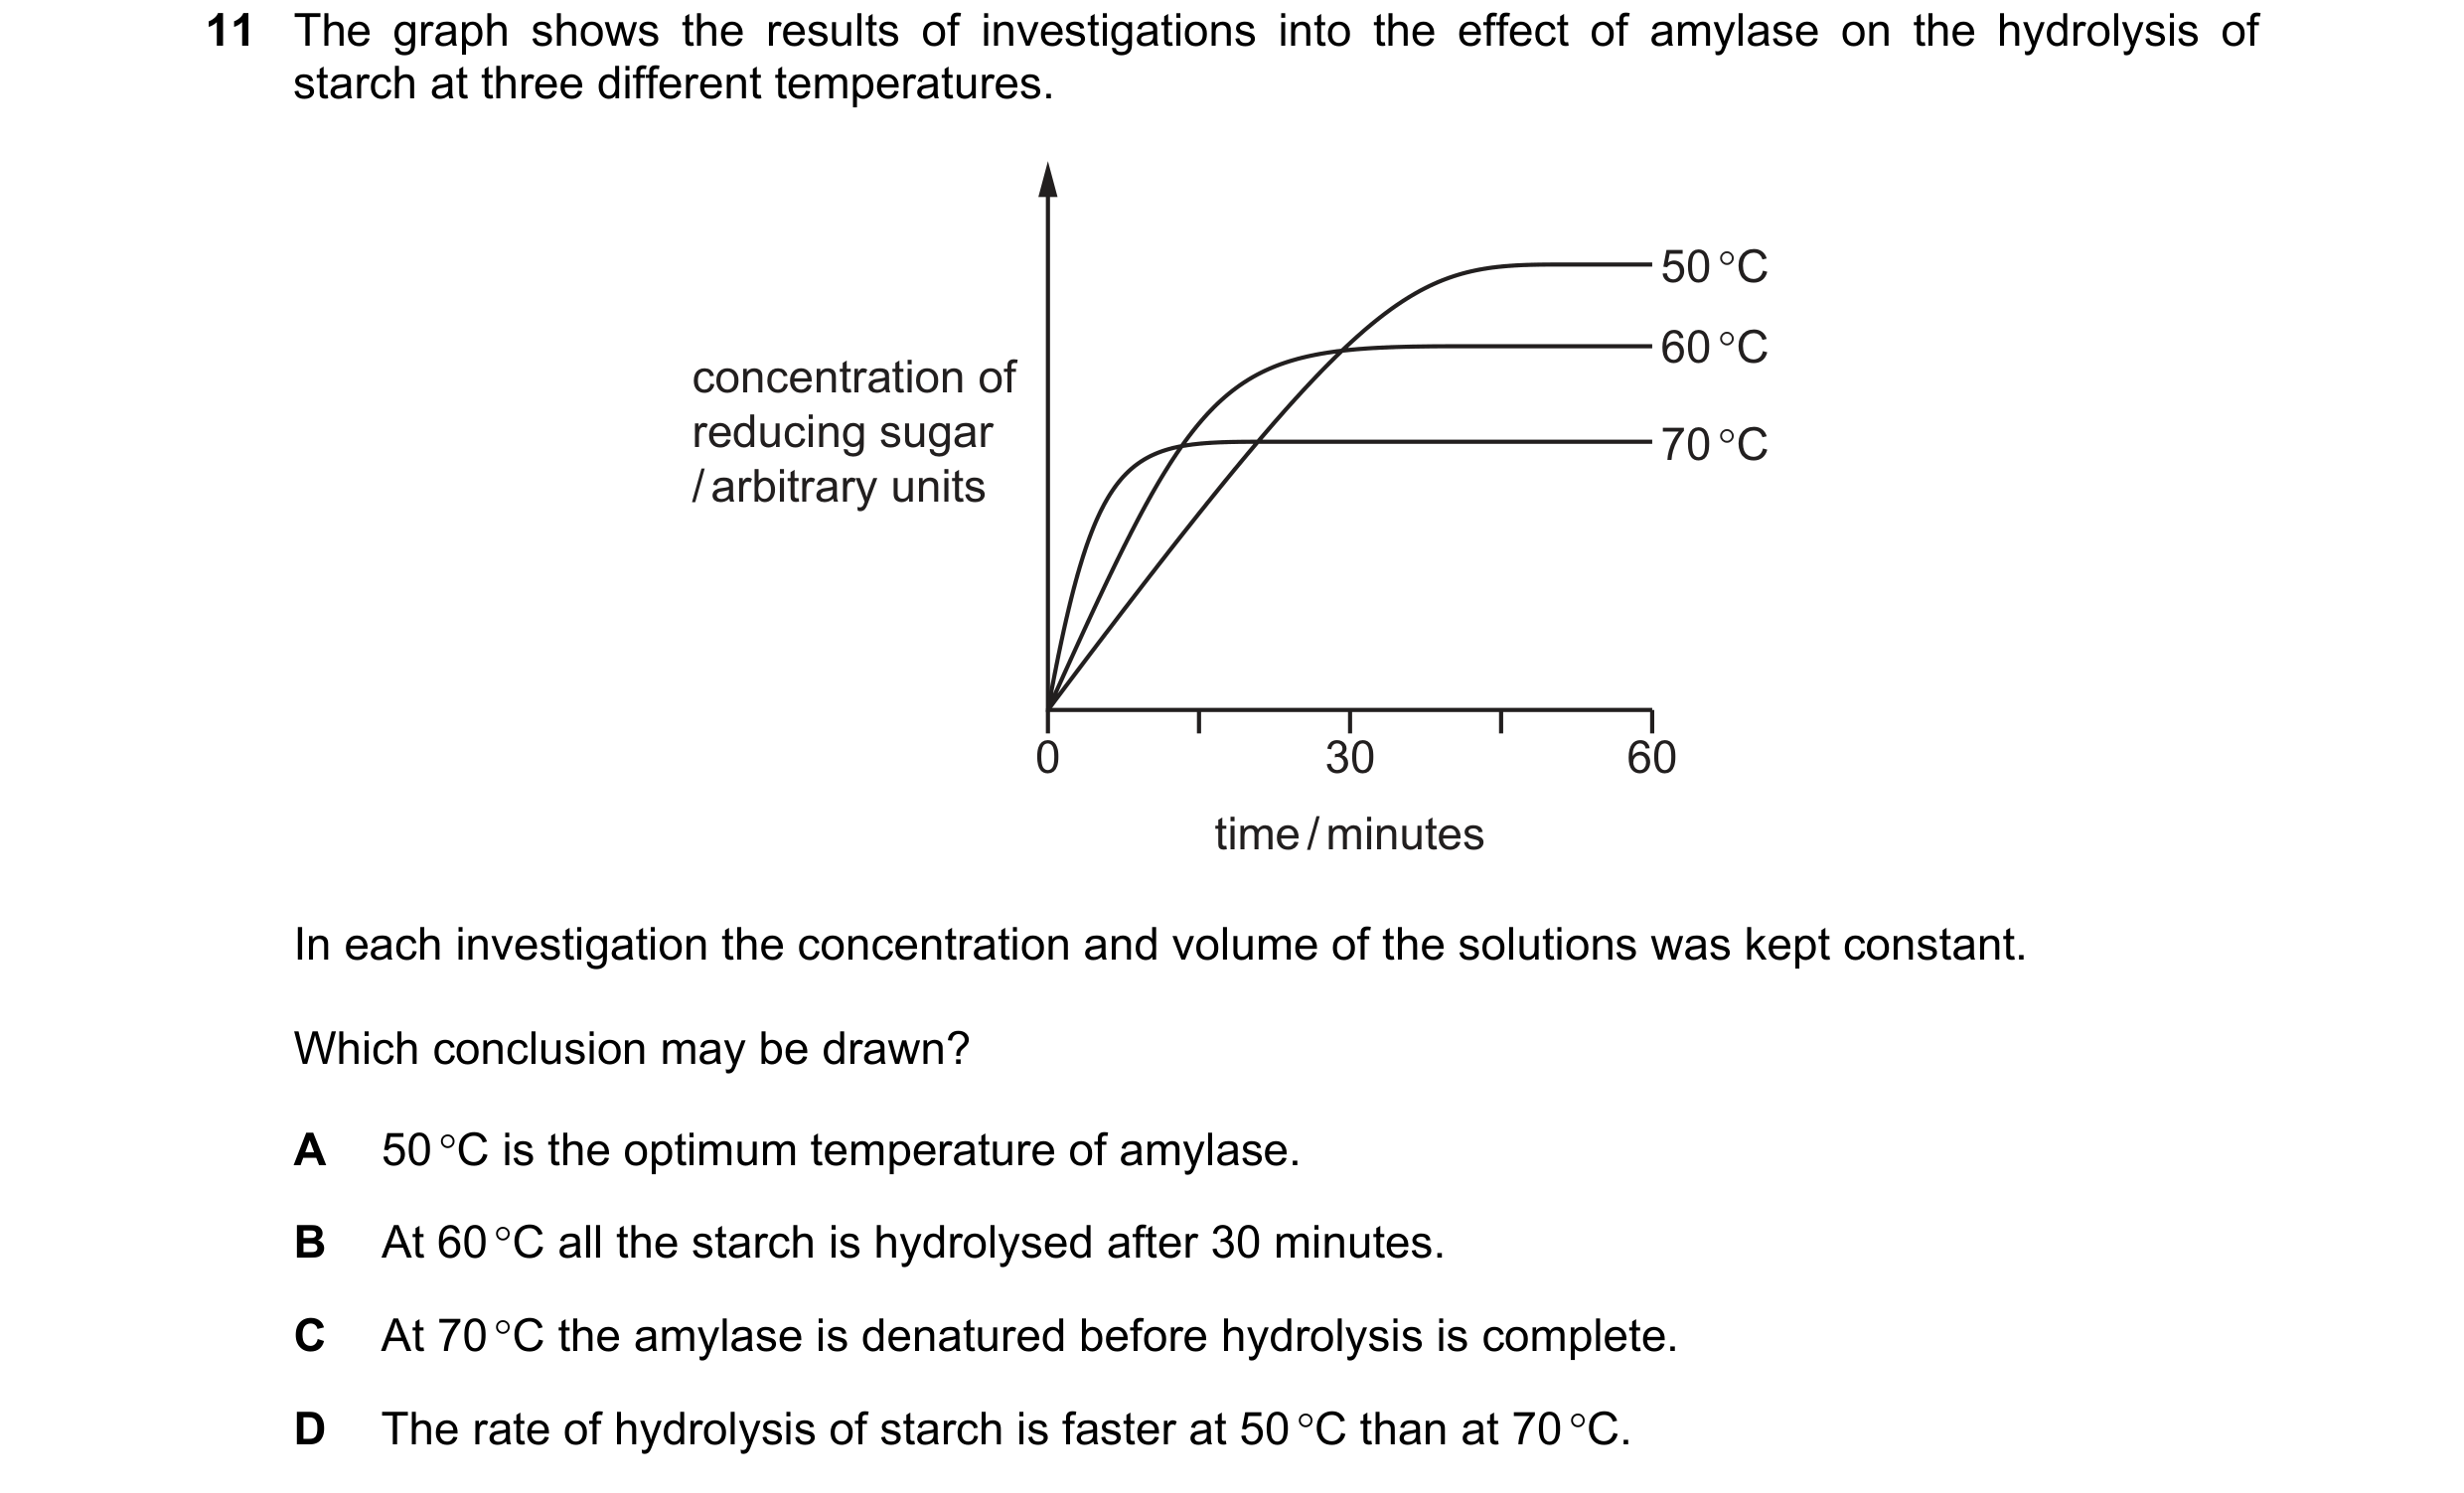 33 / 76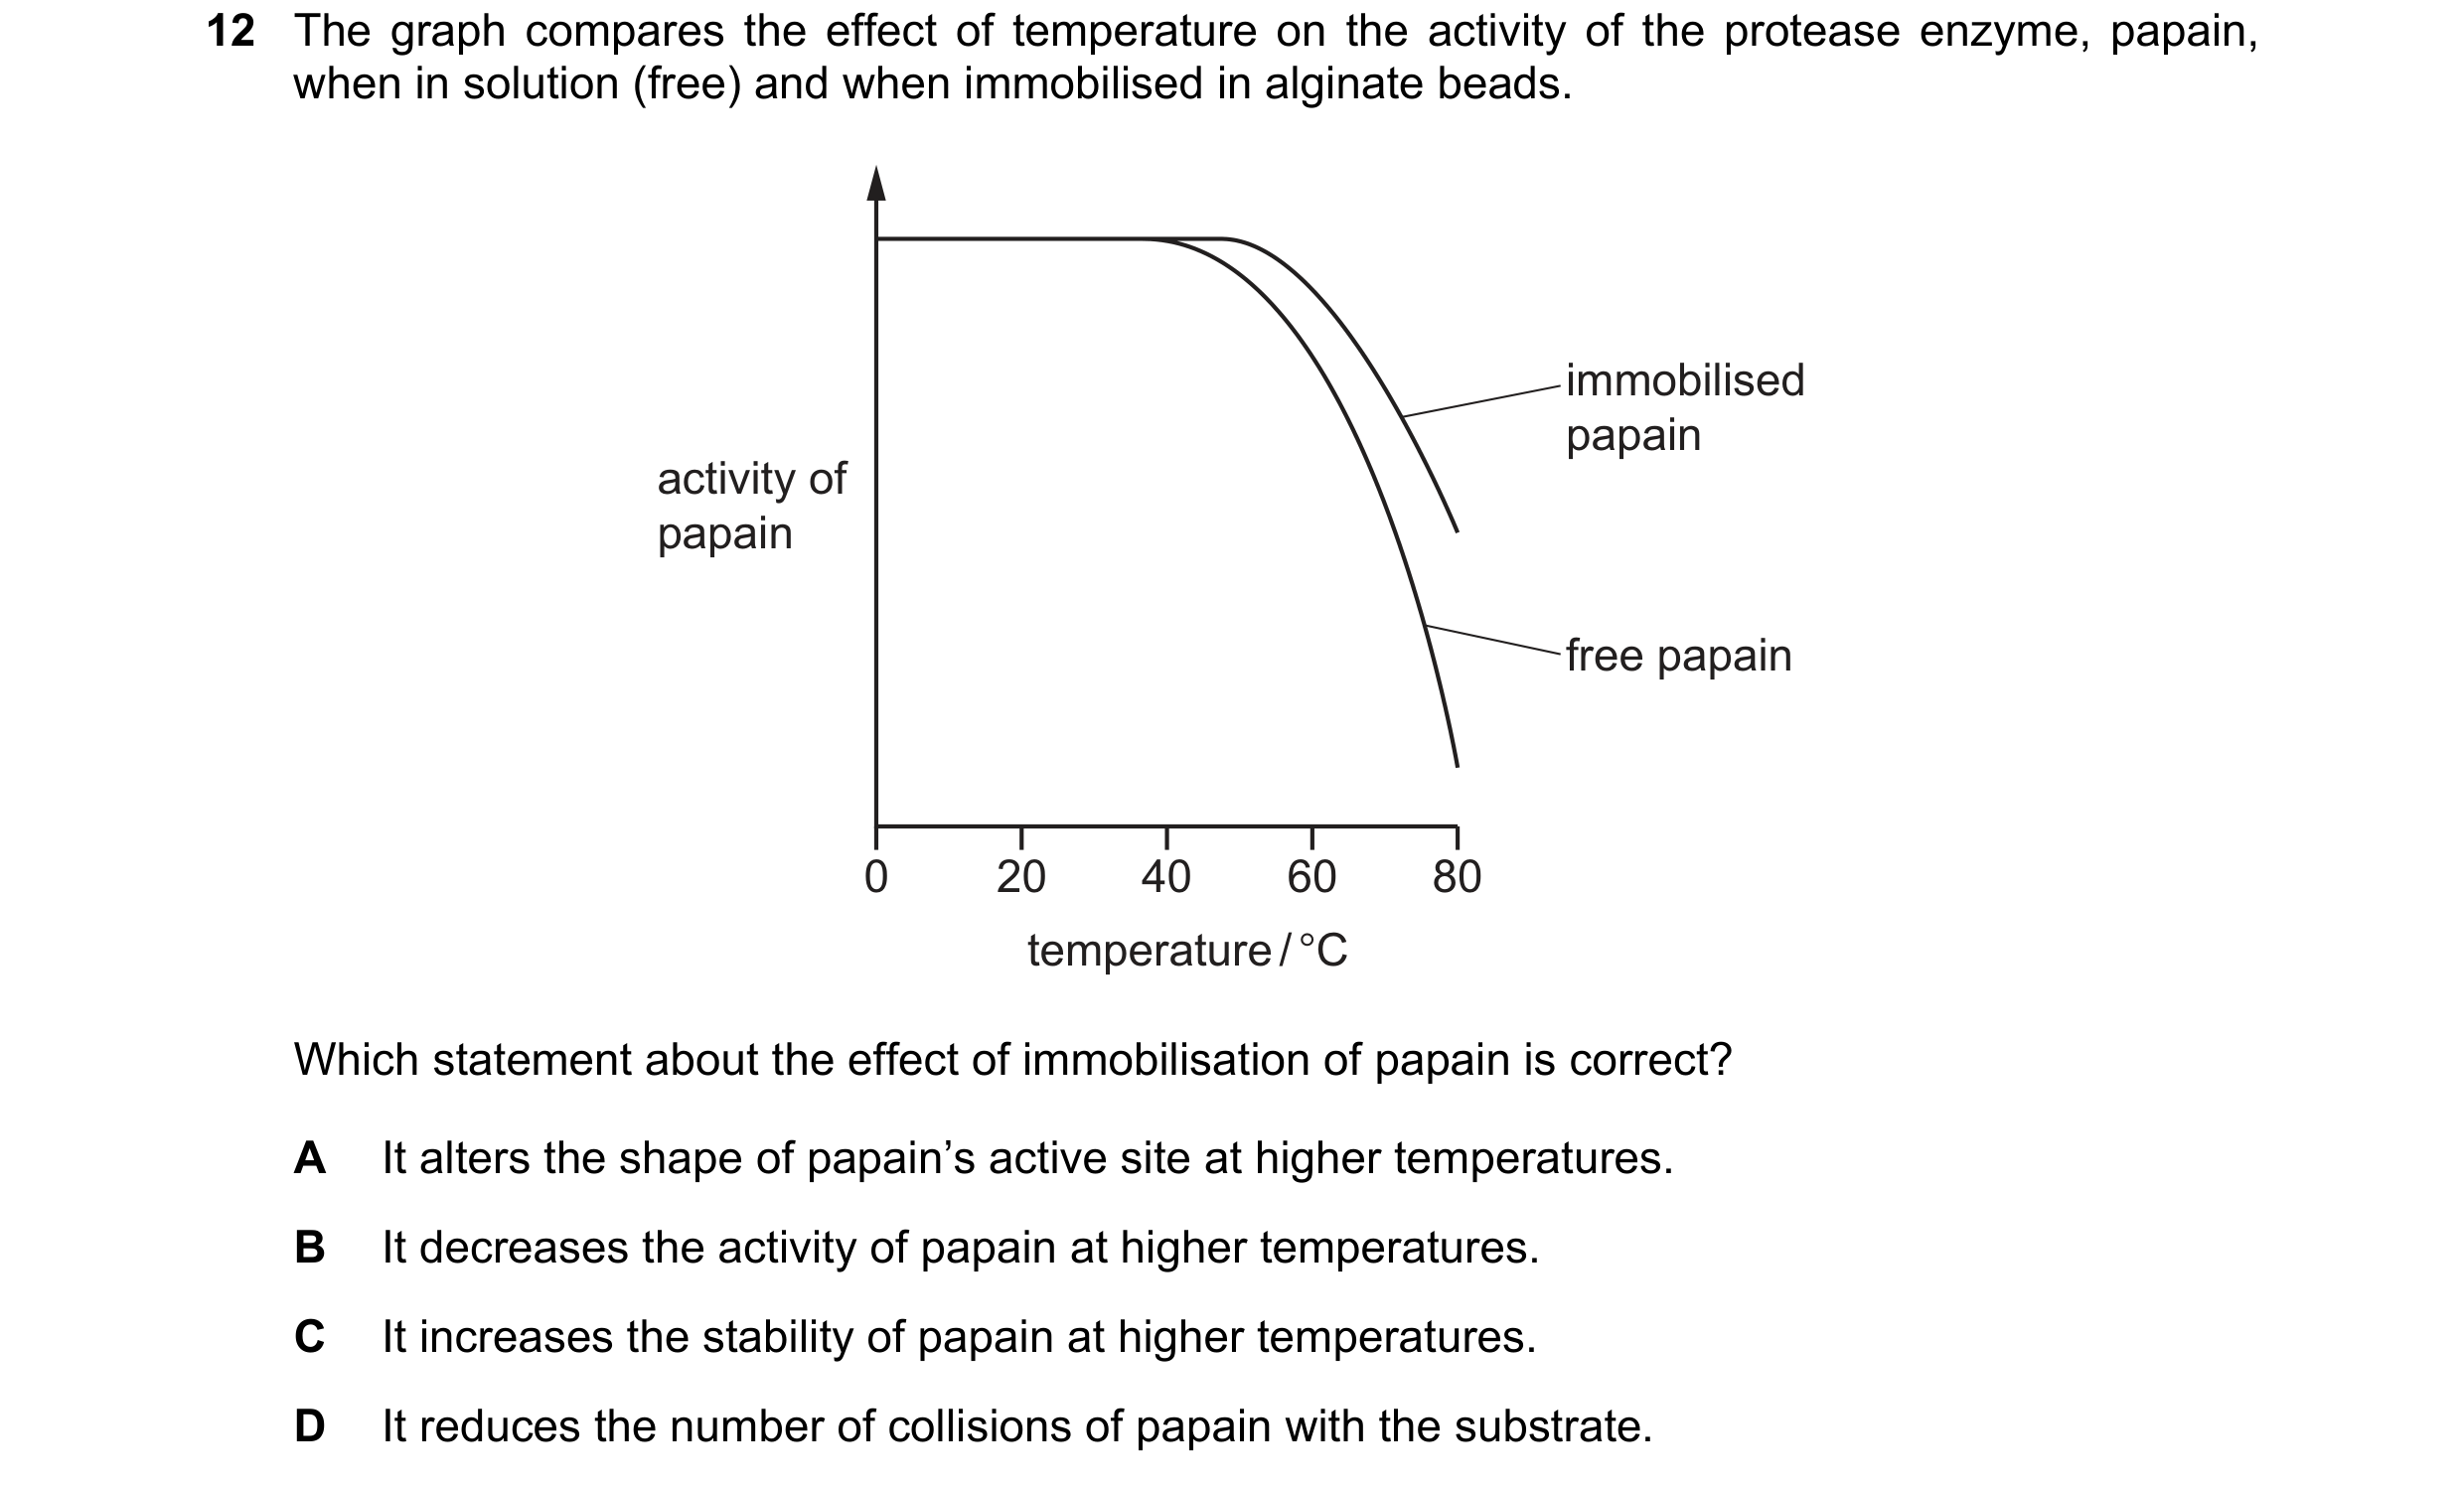
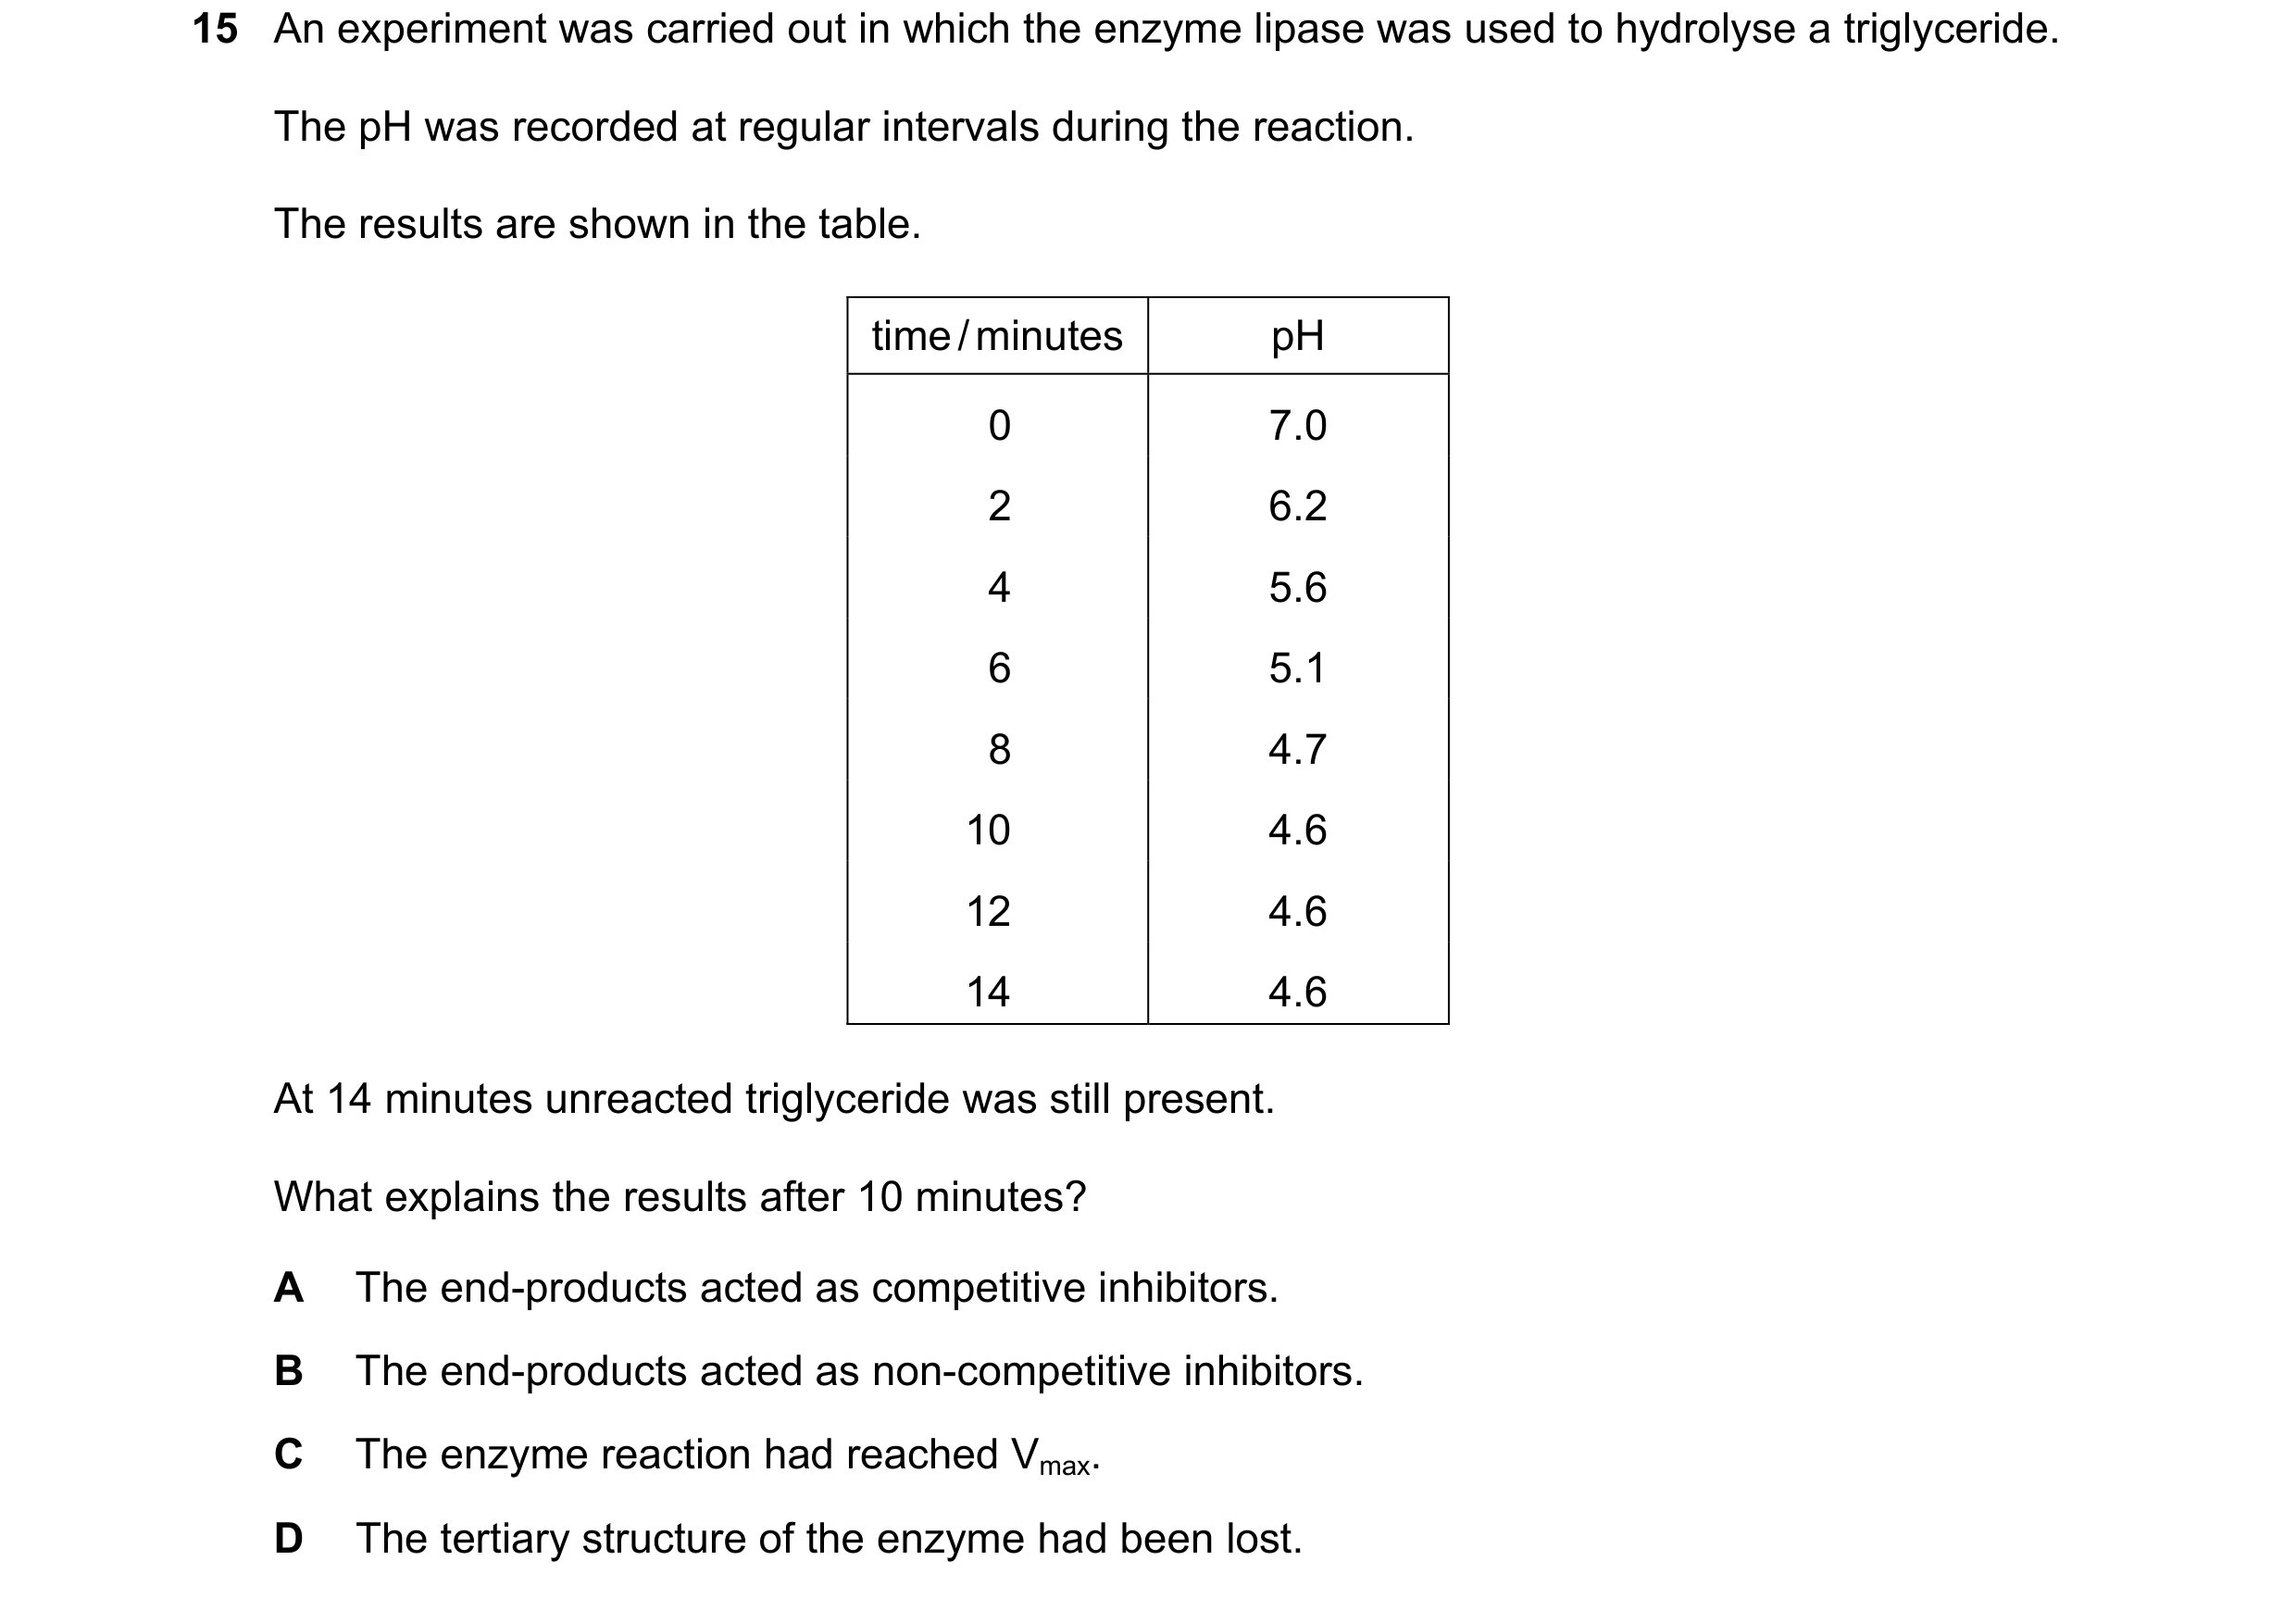 34 / 76
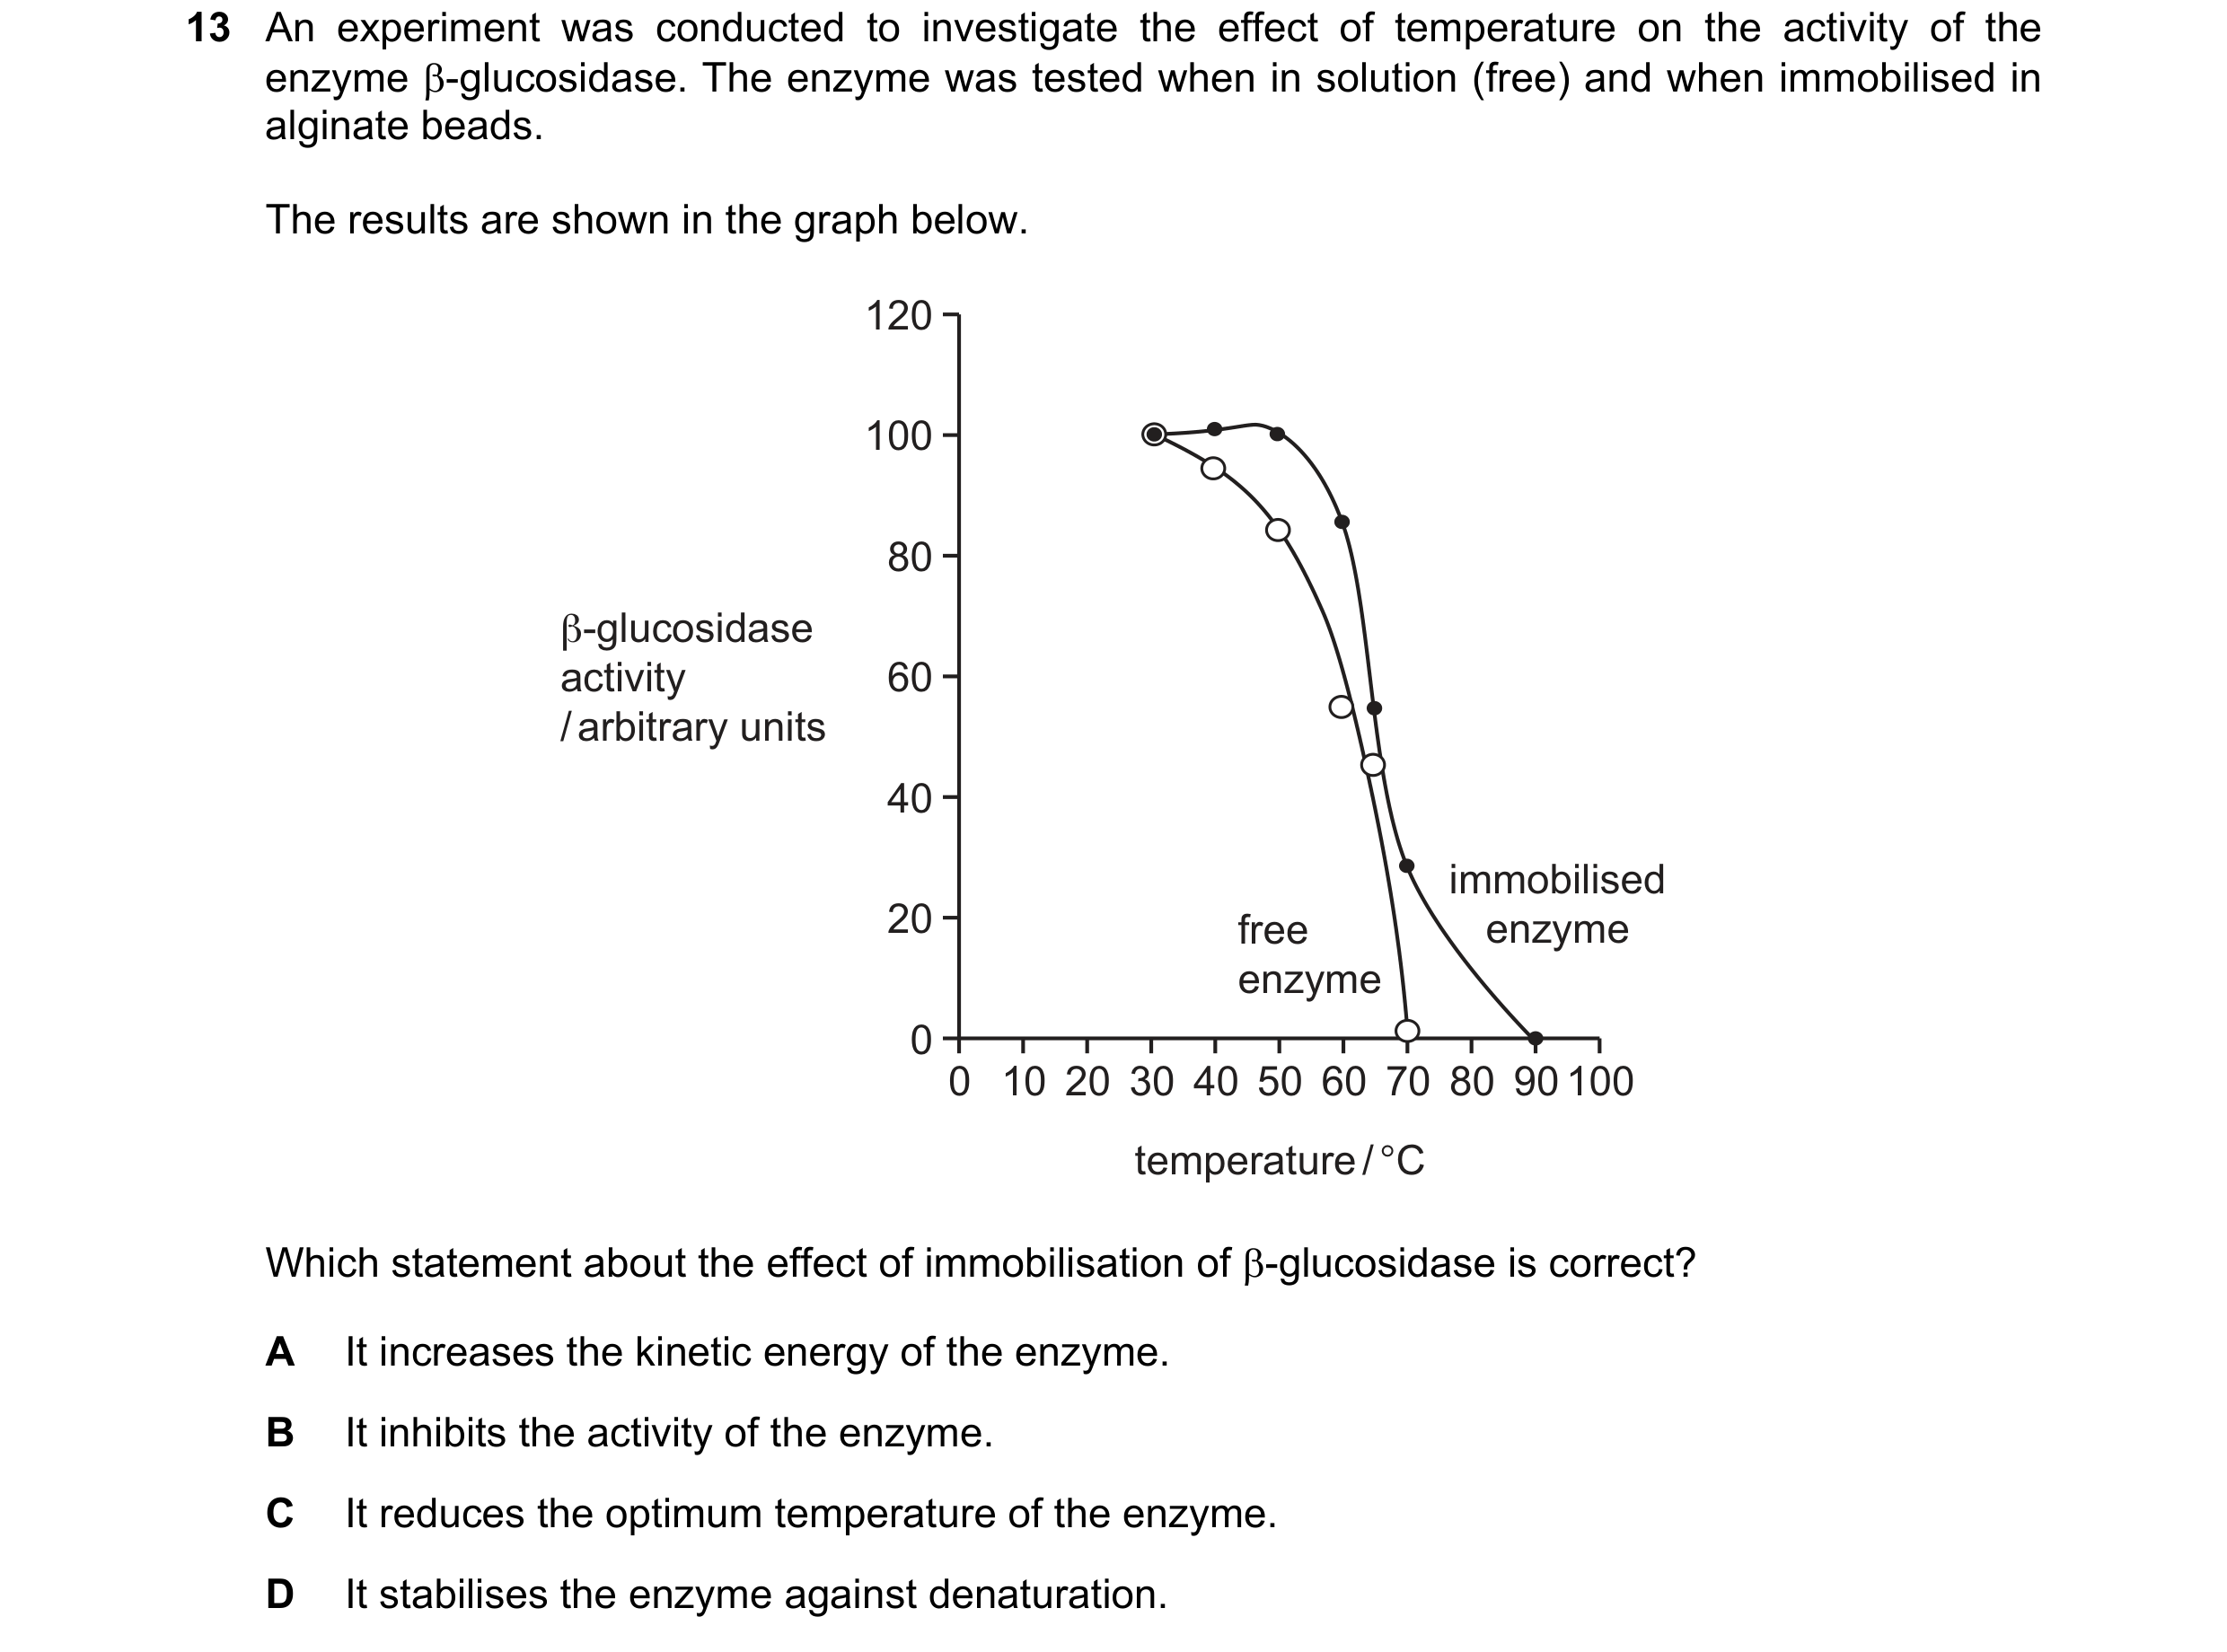
 35 / 76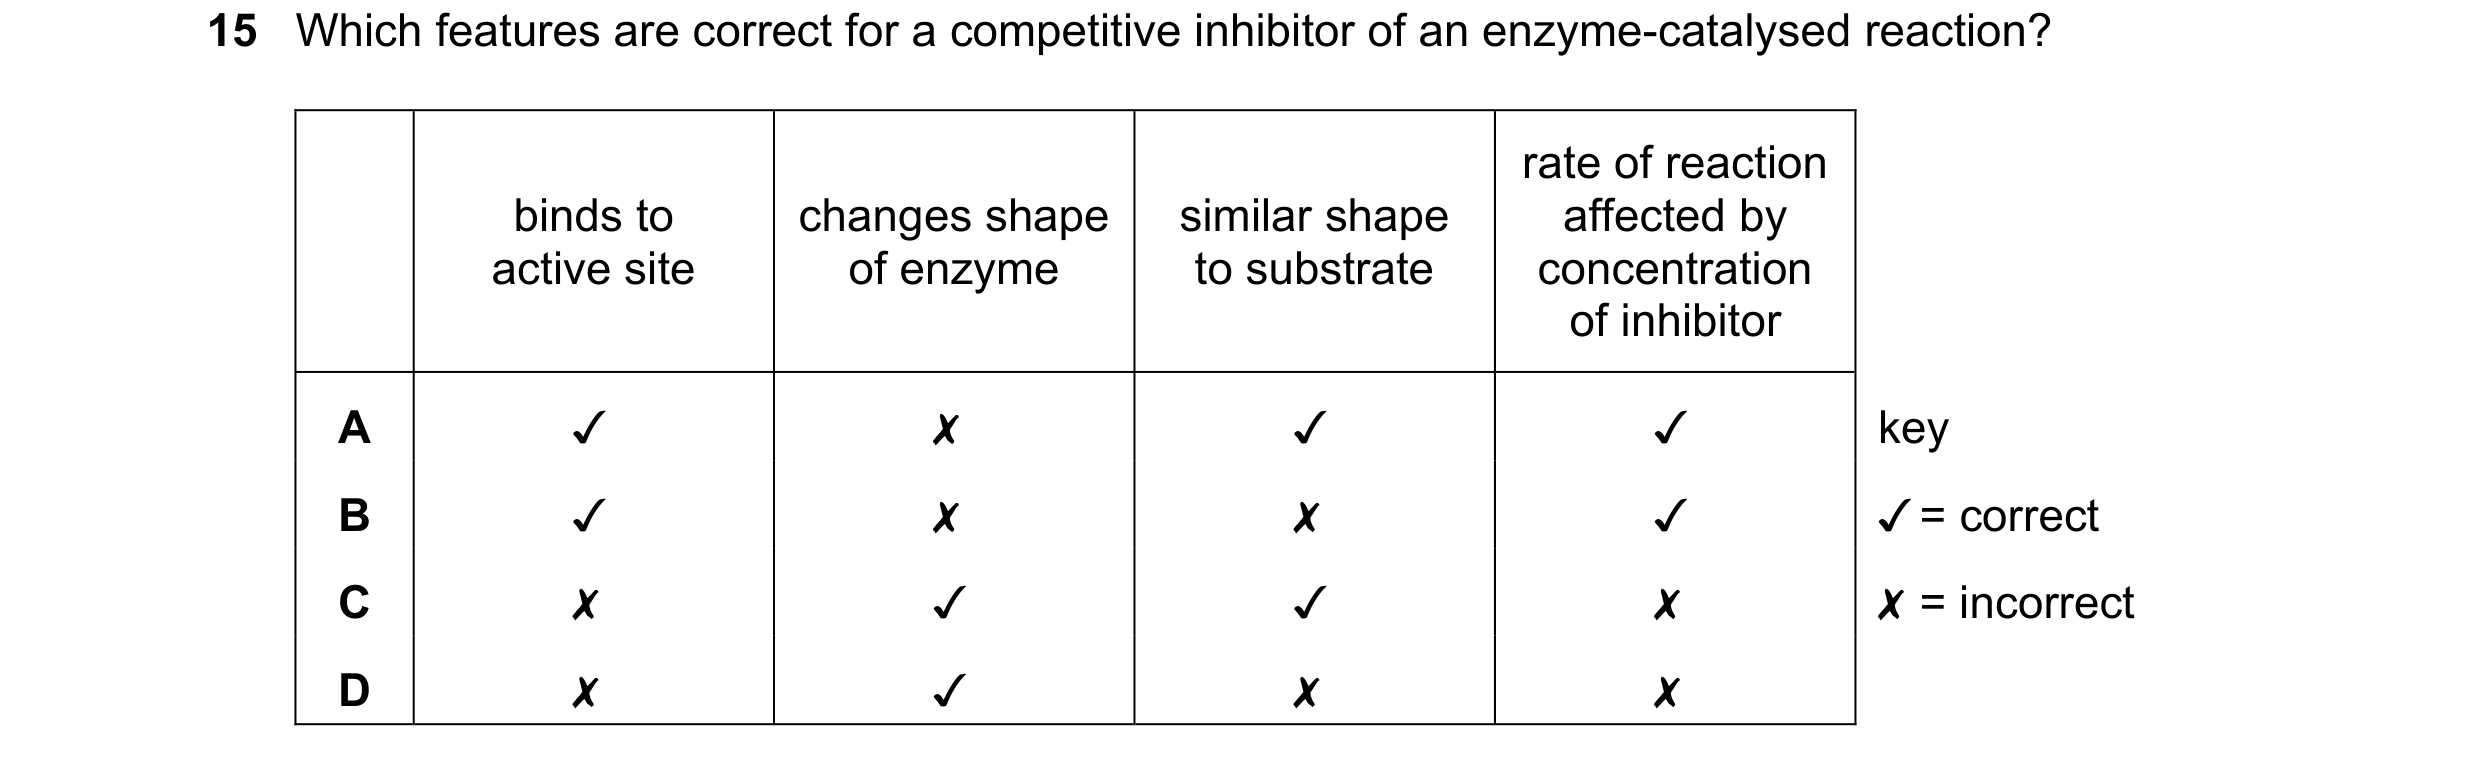

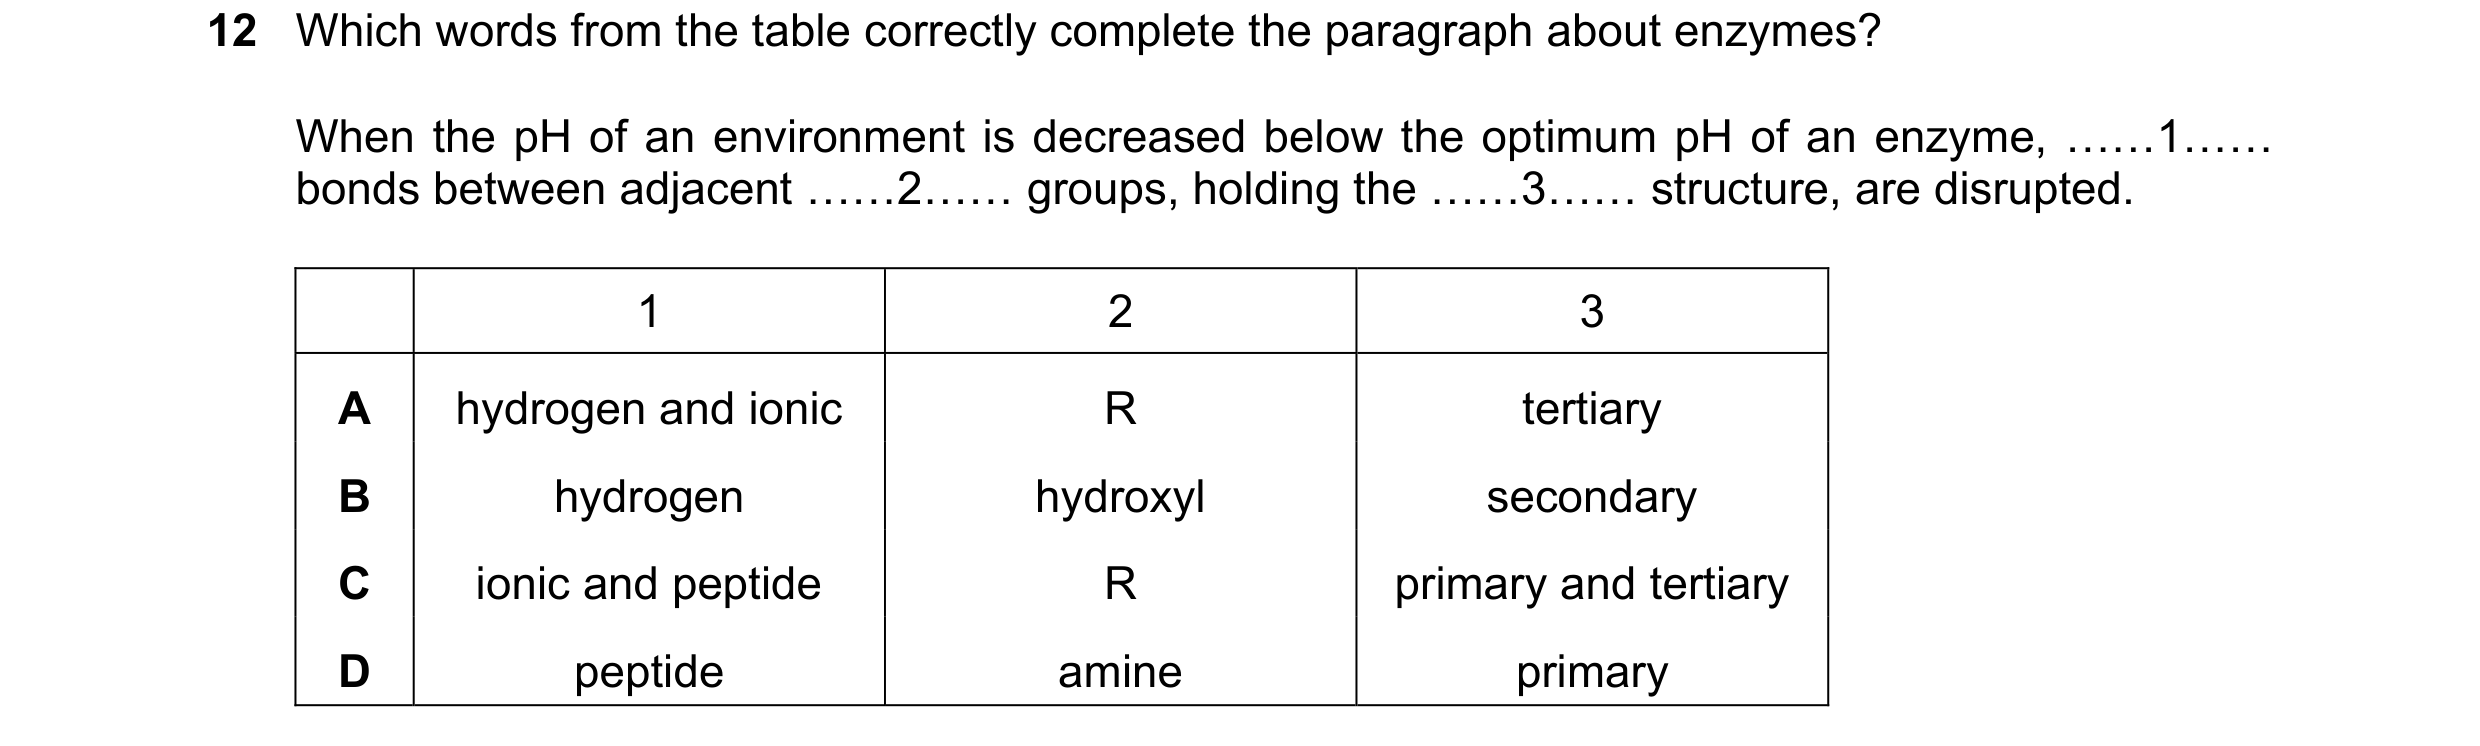 36 / 76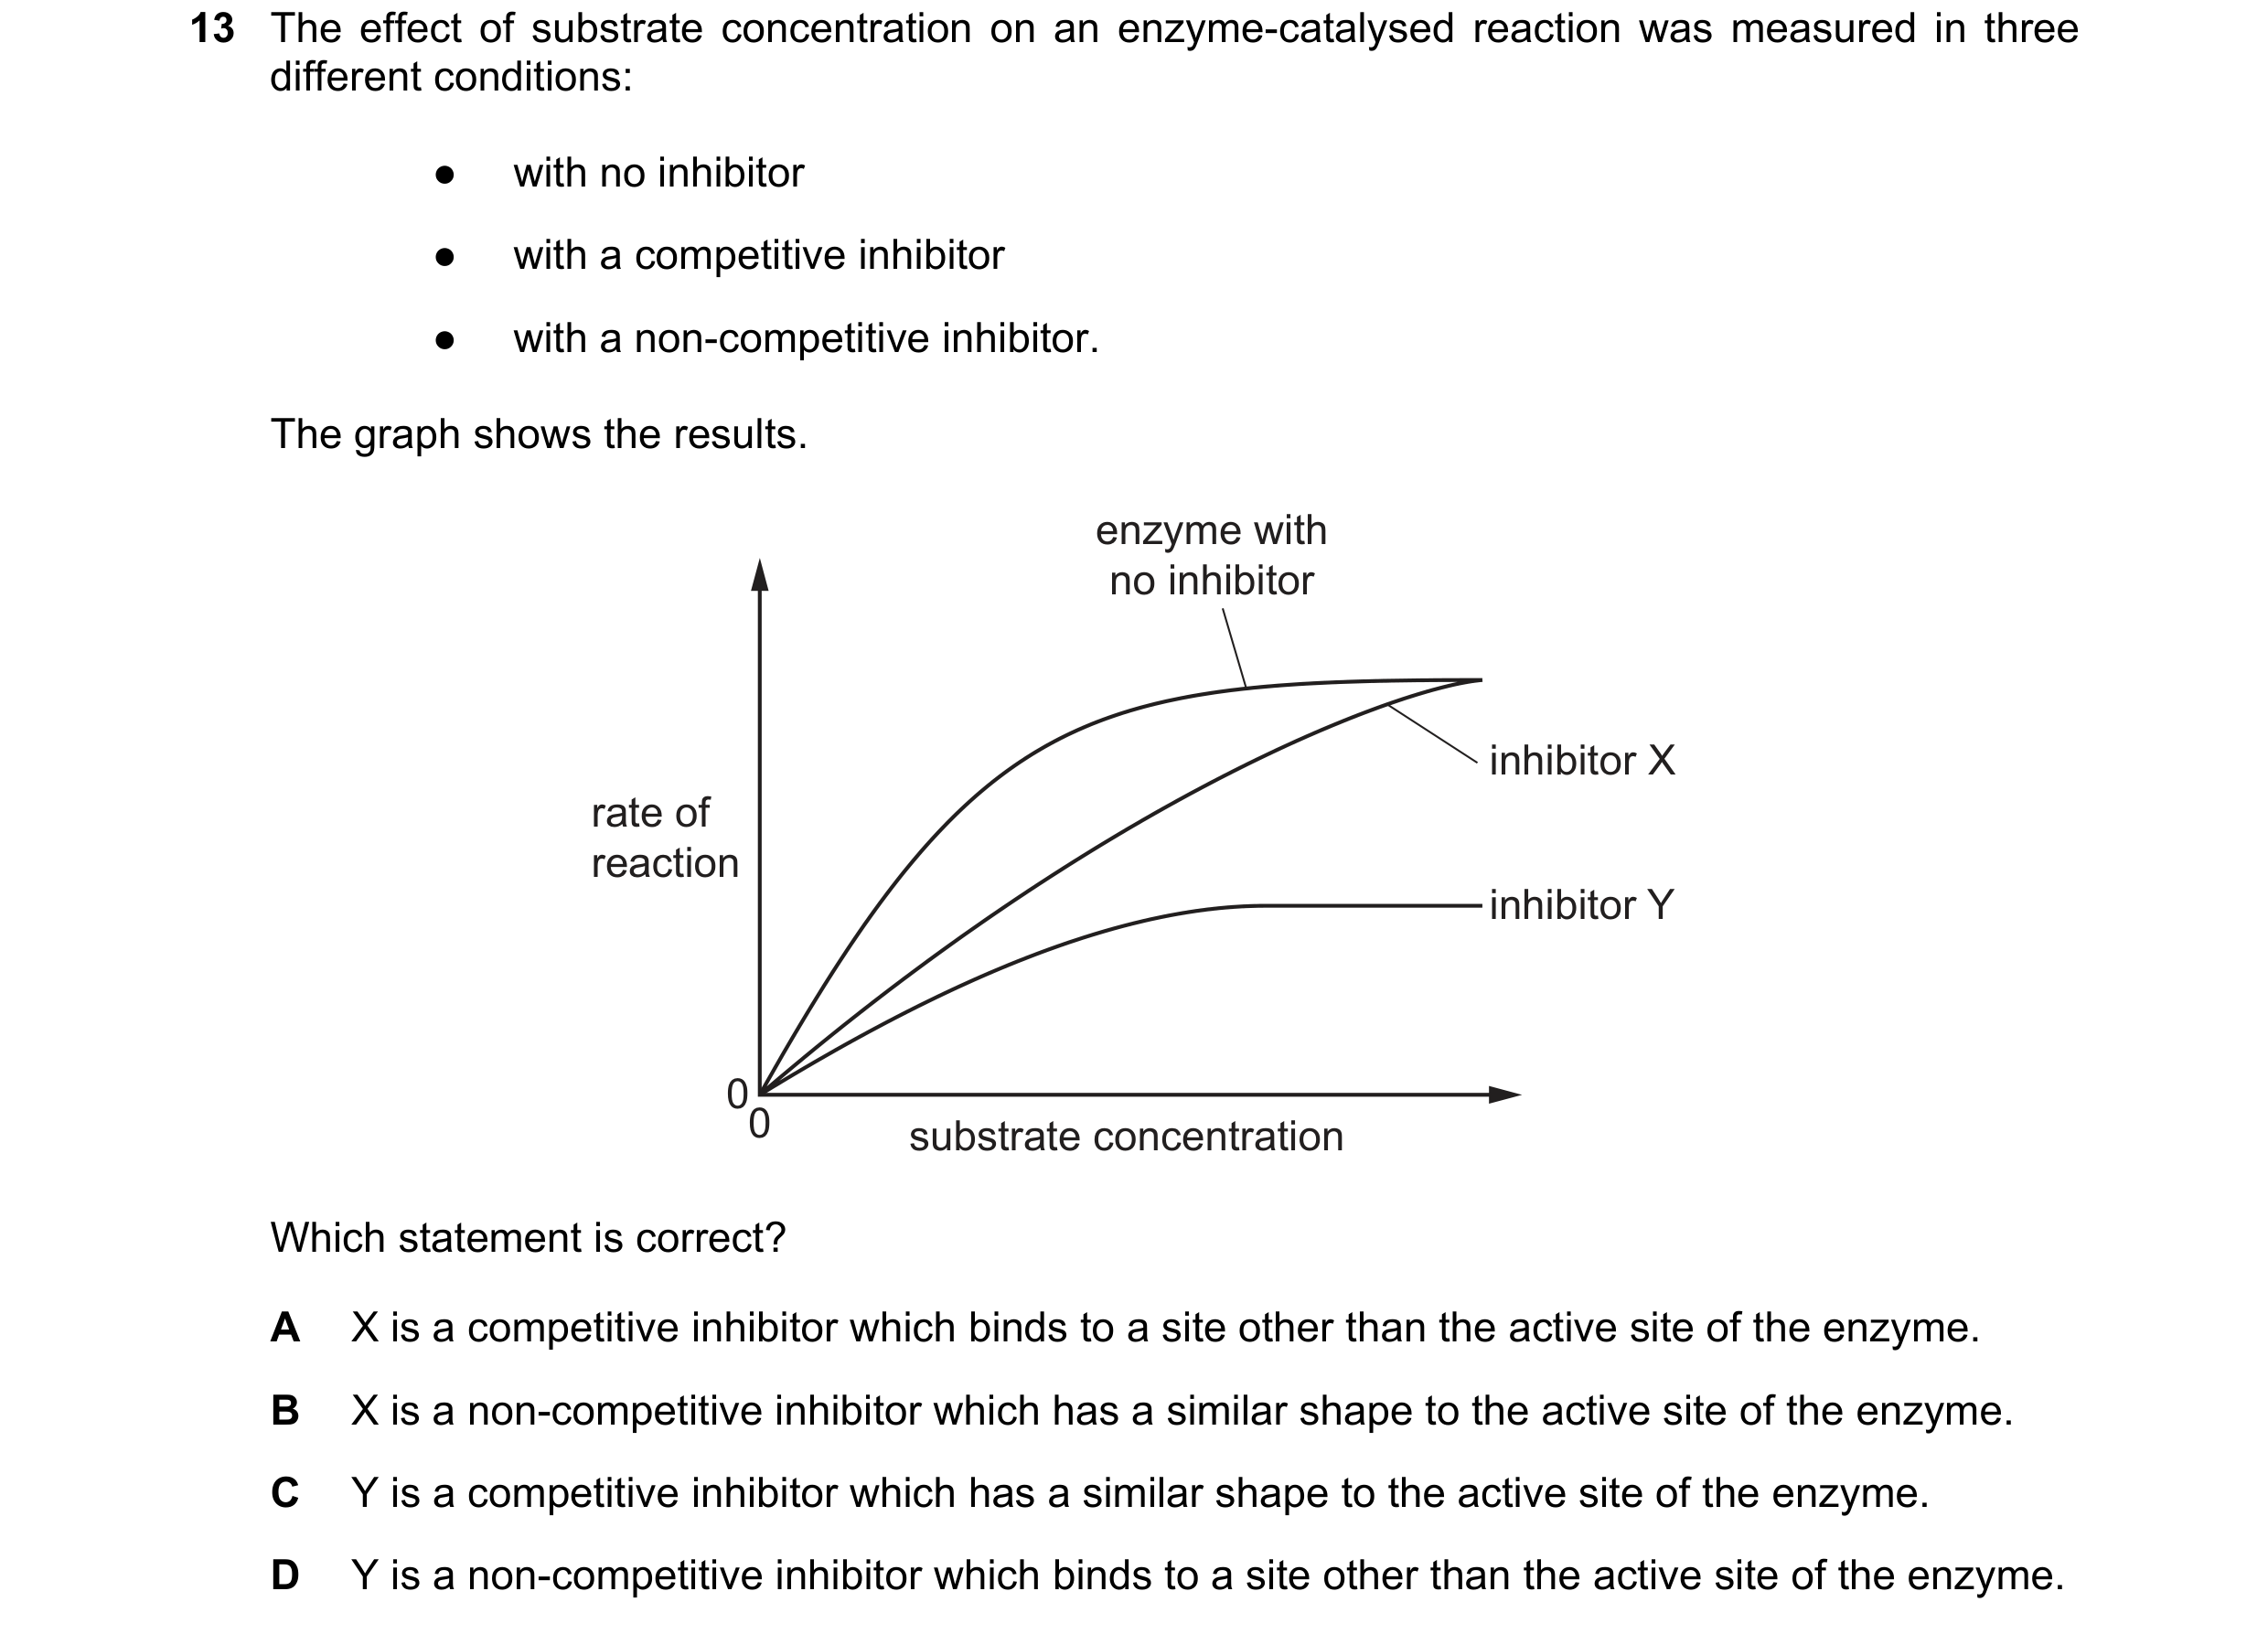
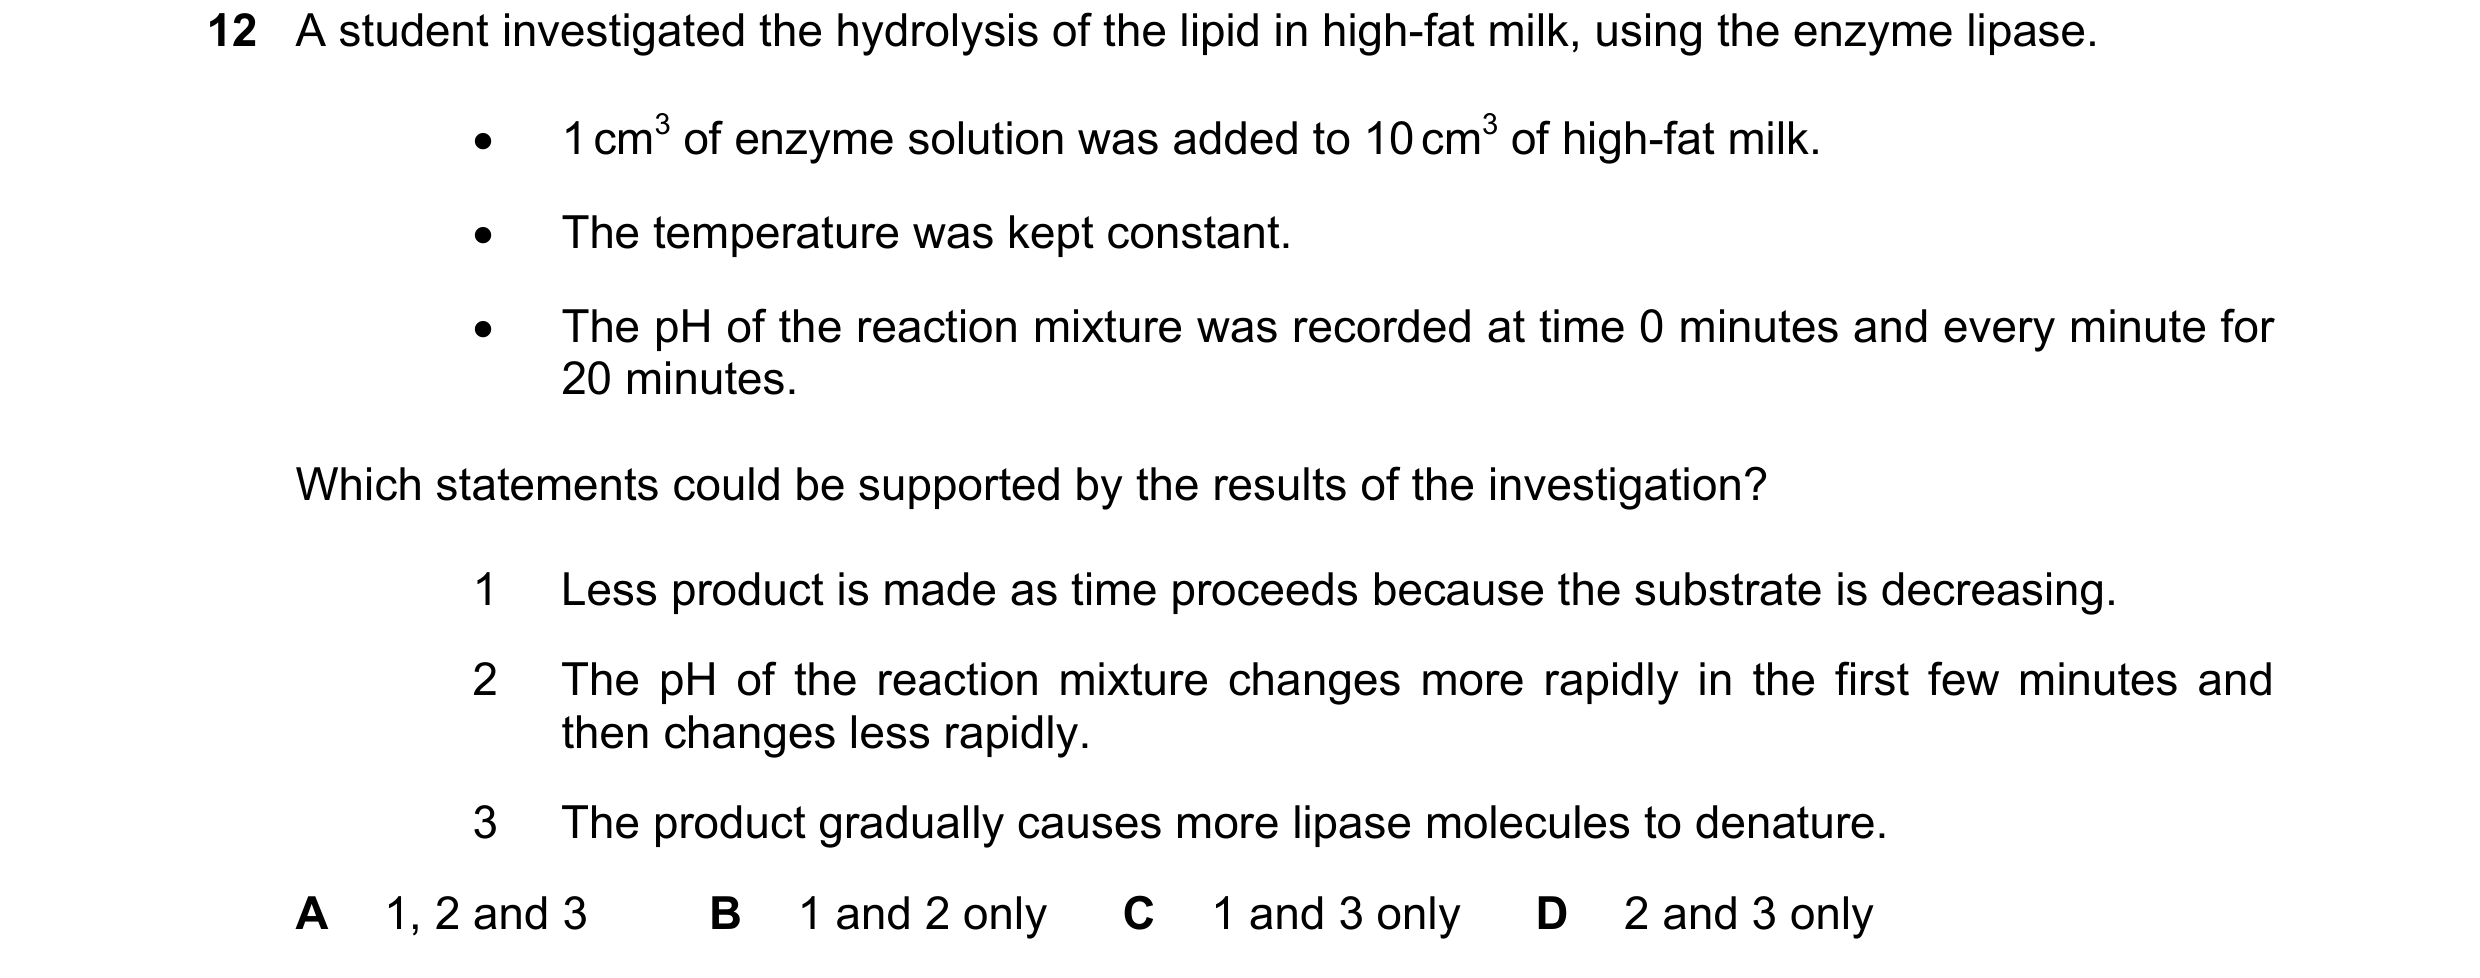 37 / 76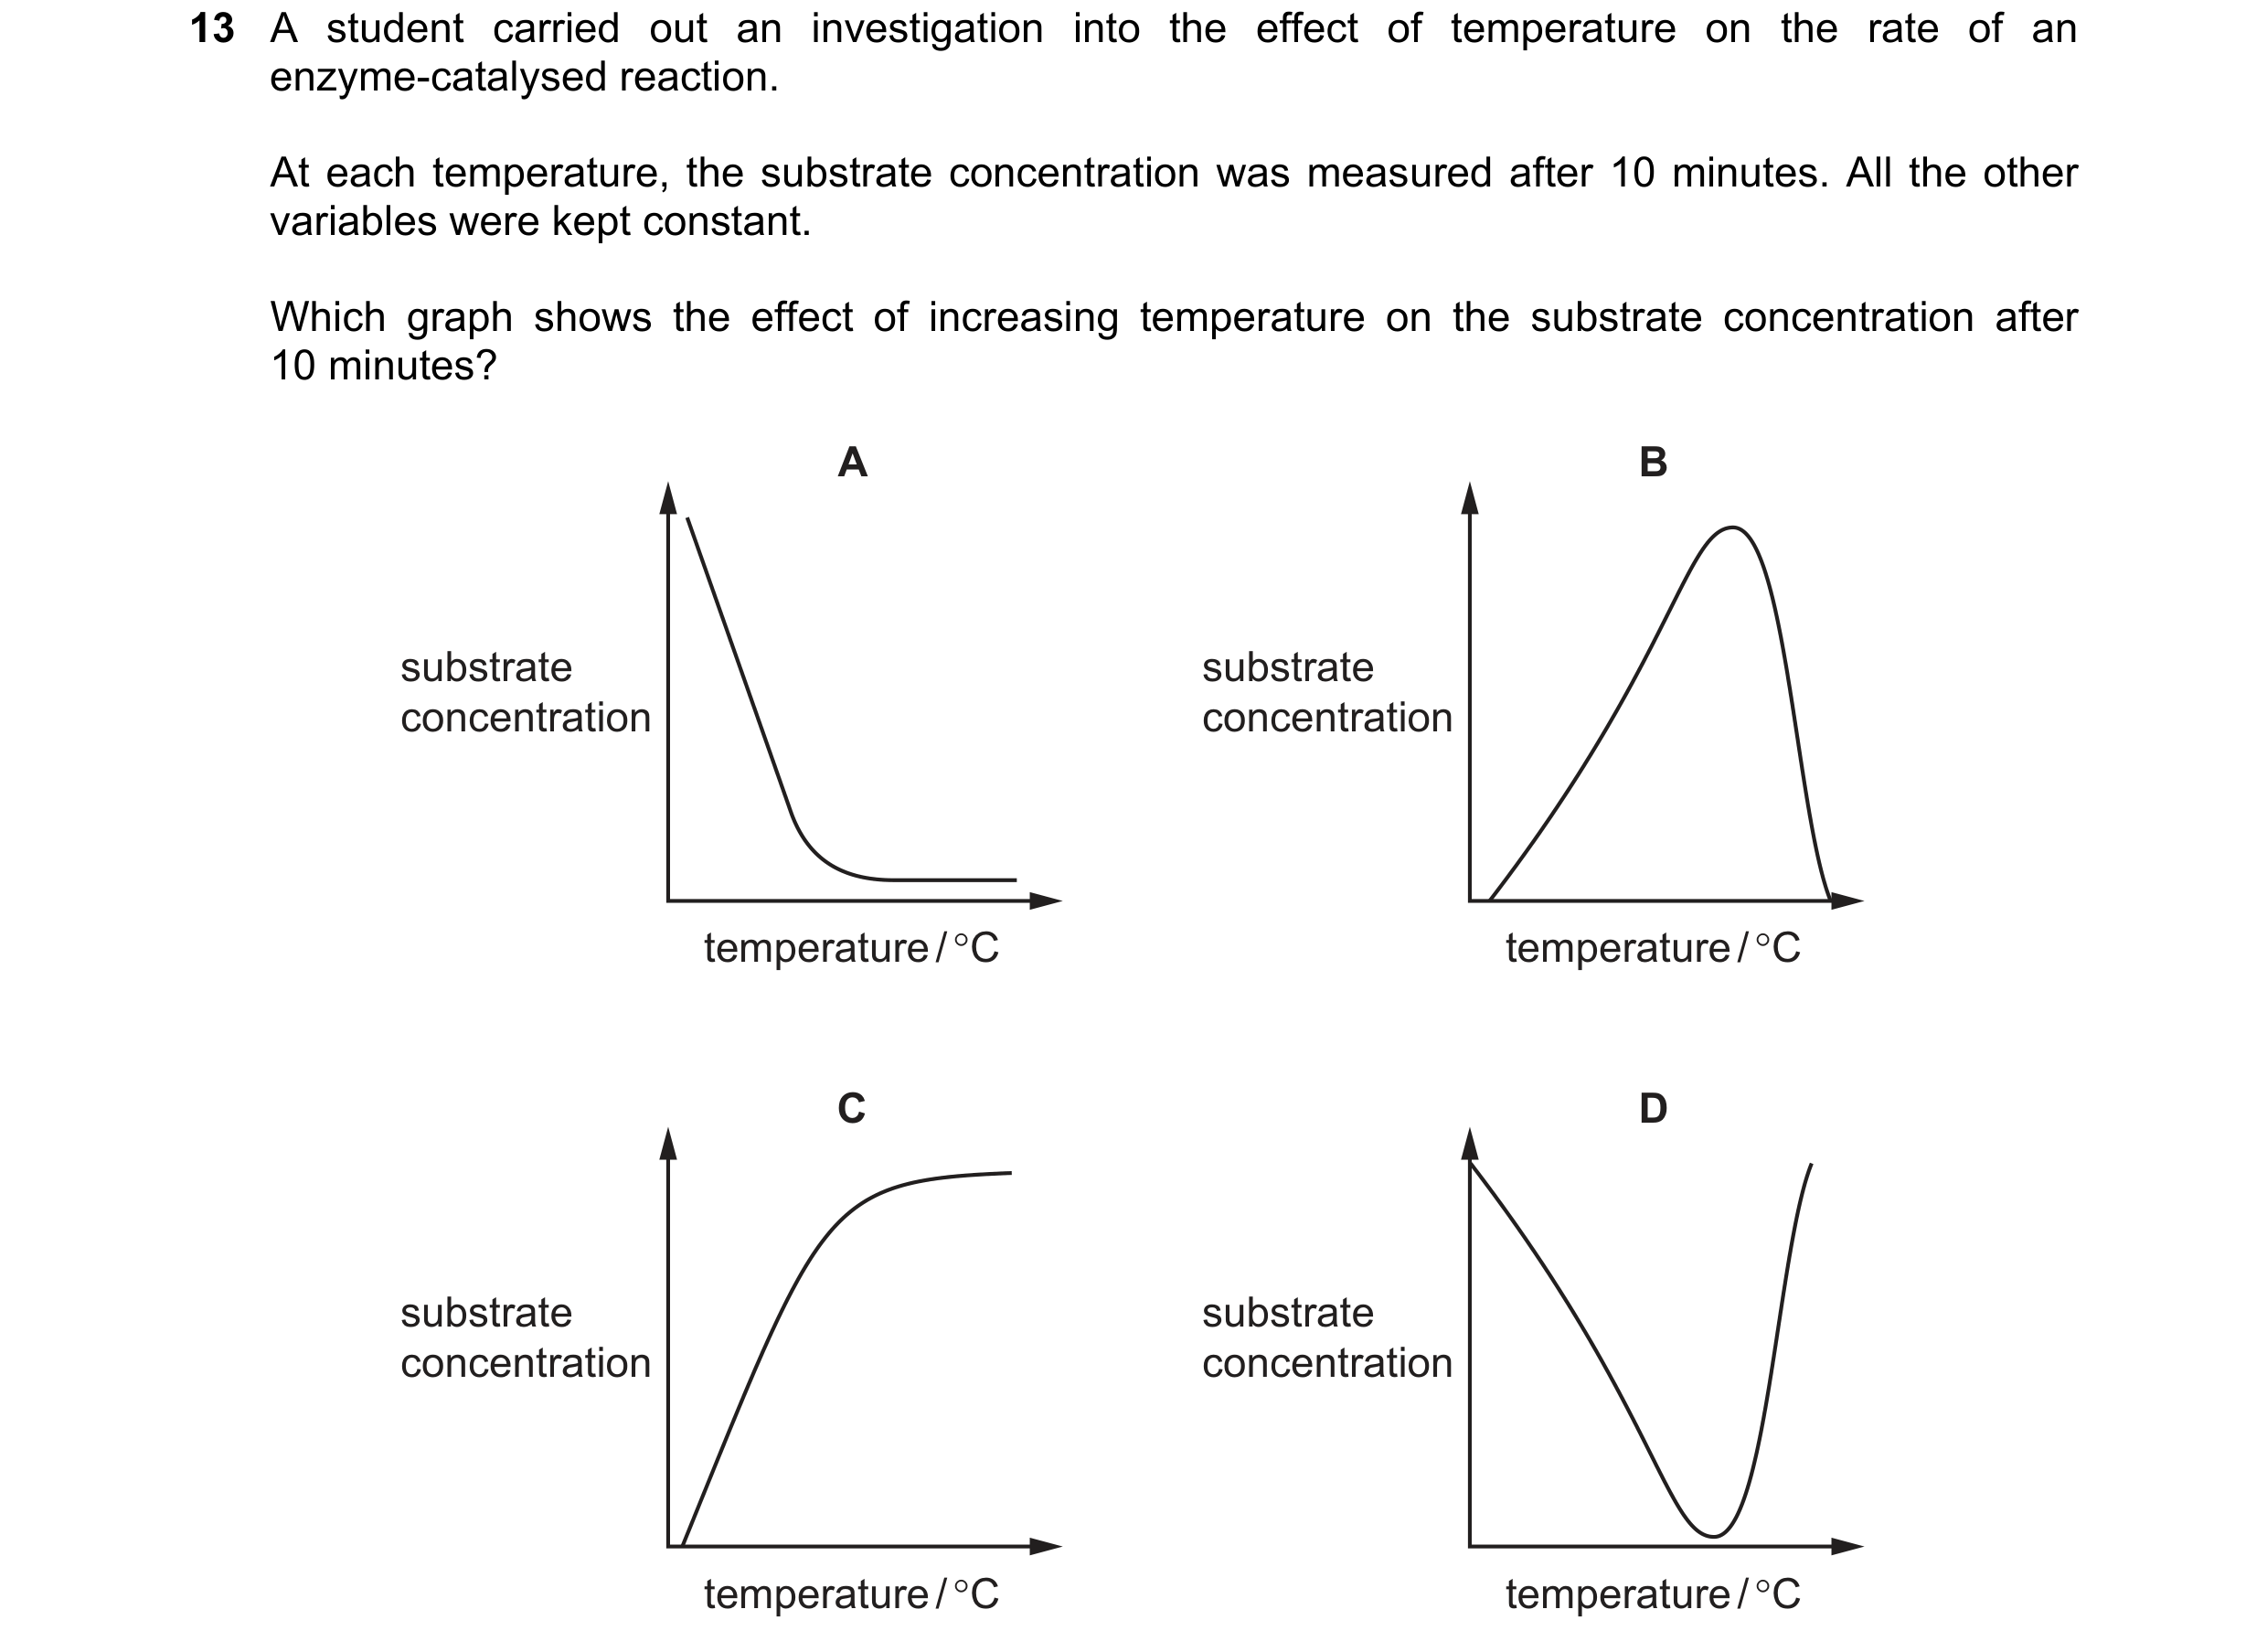
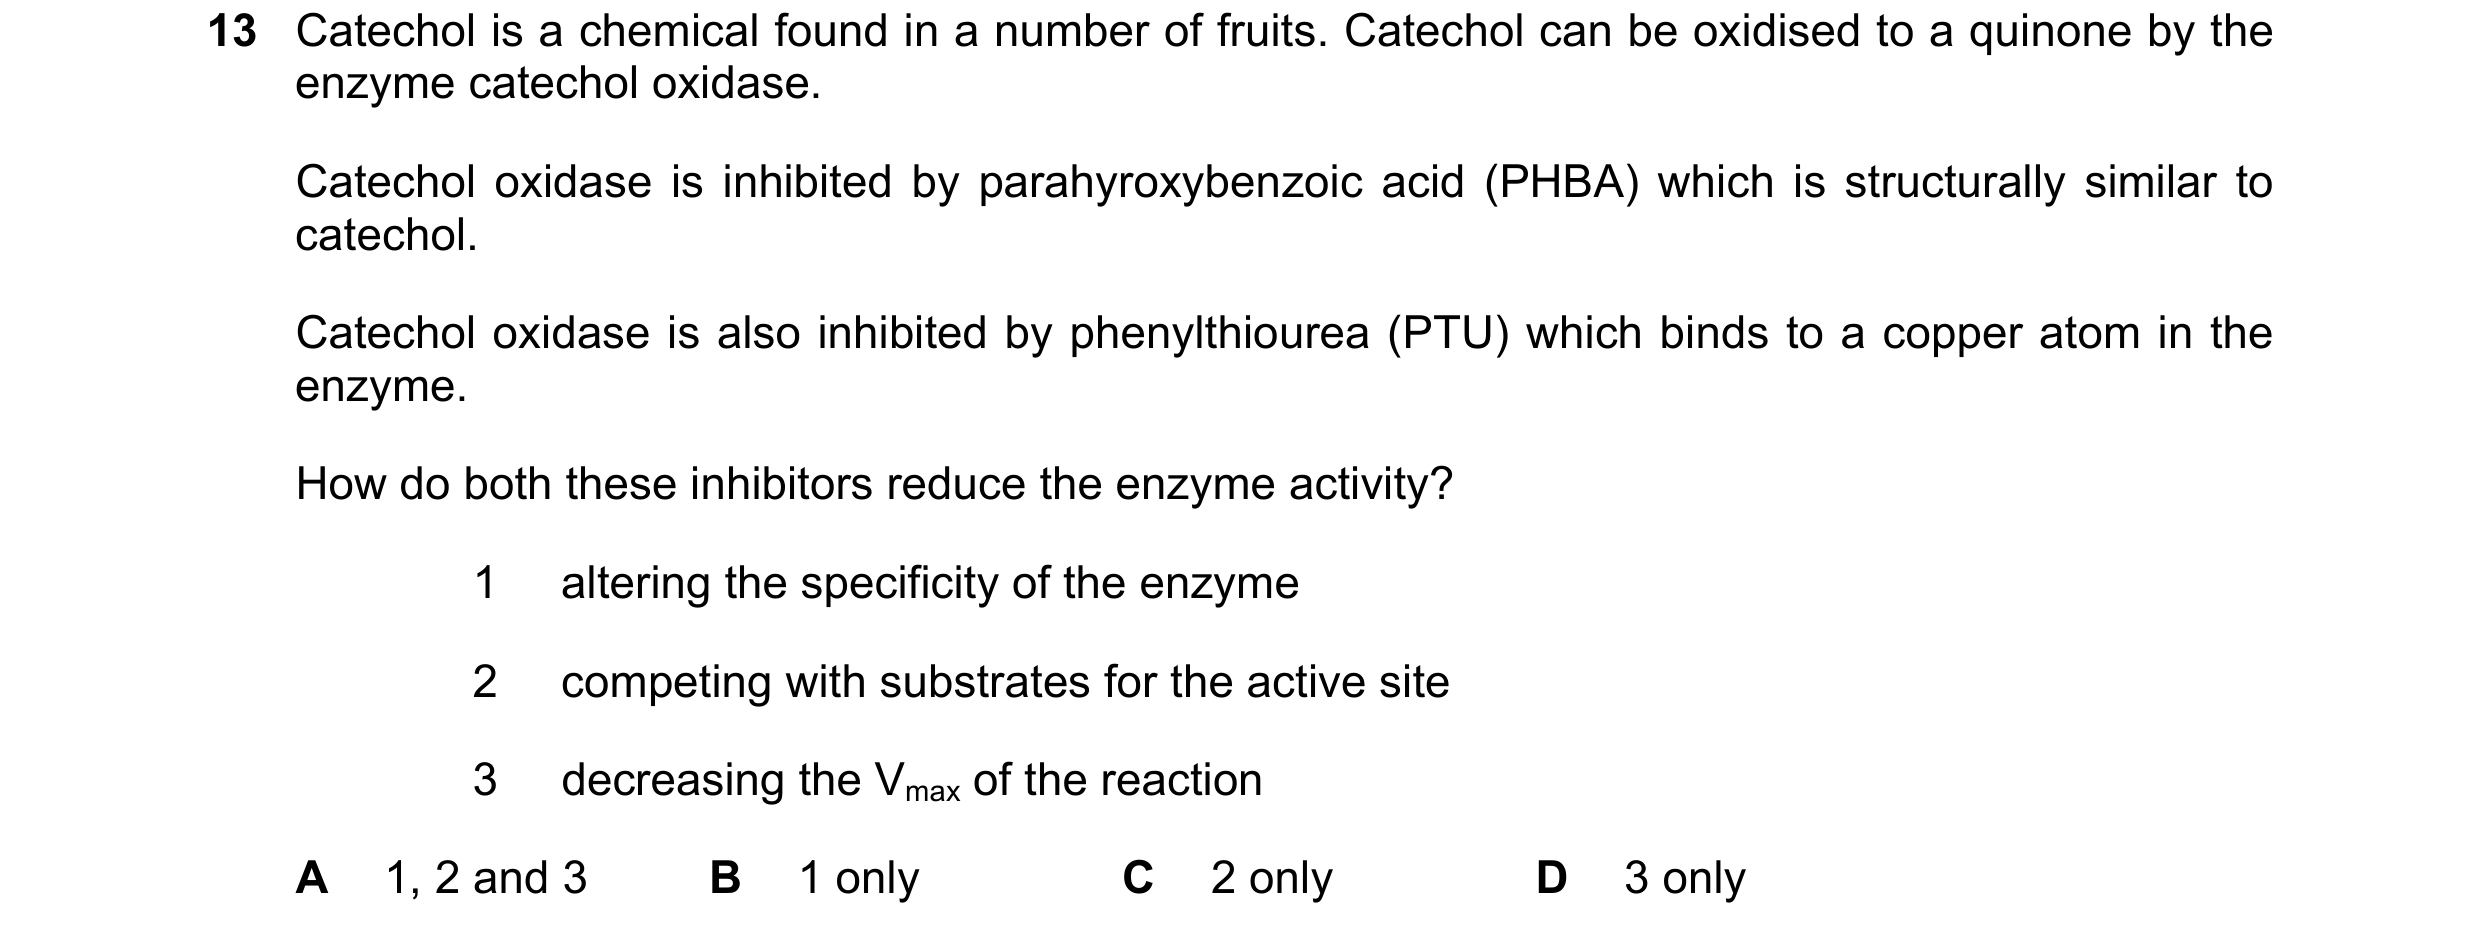 38 / 76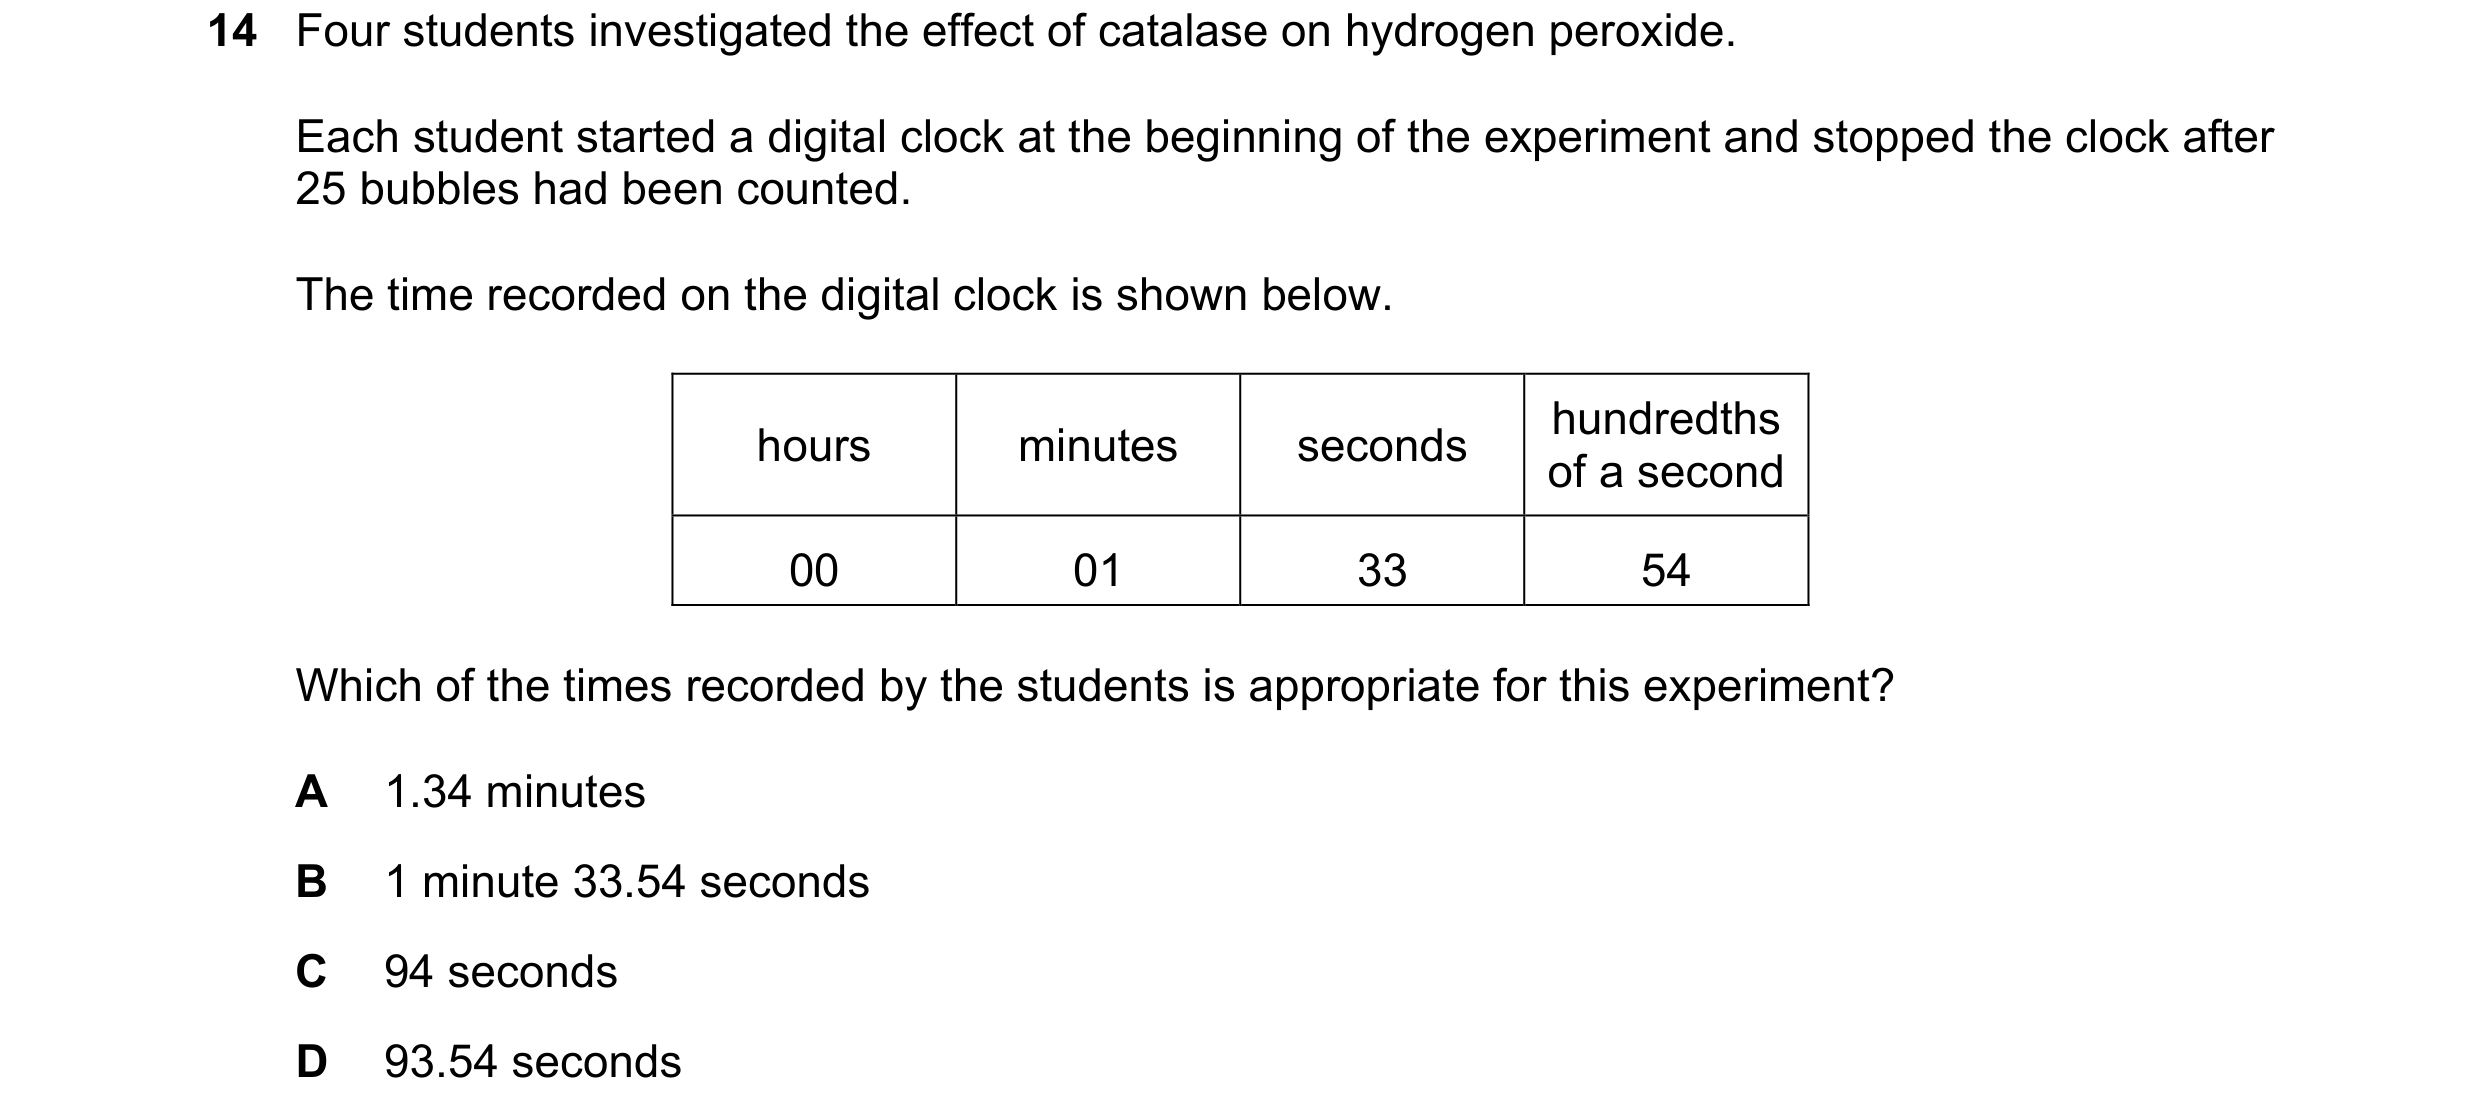
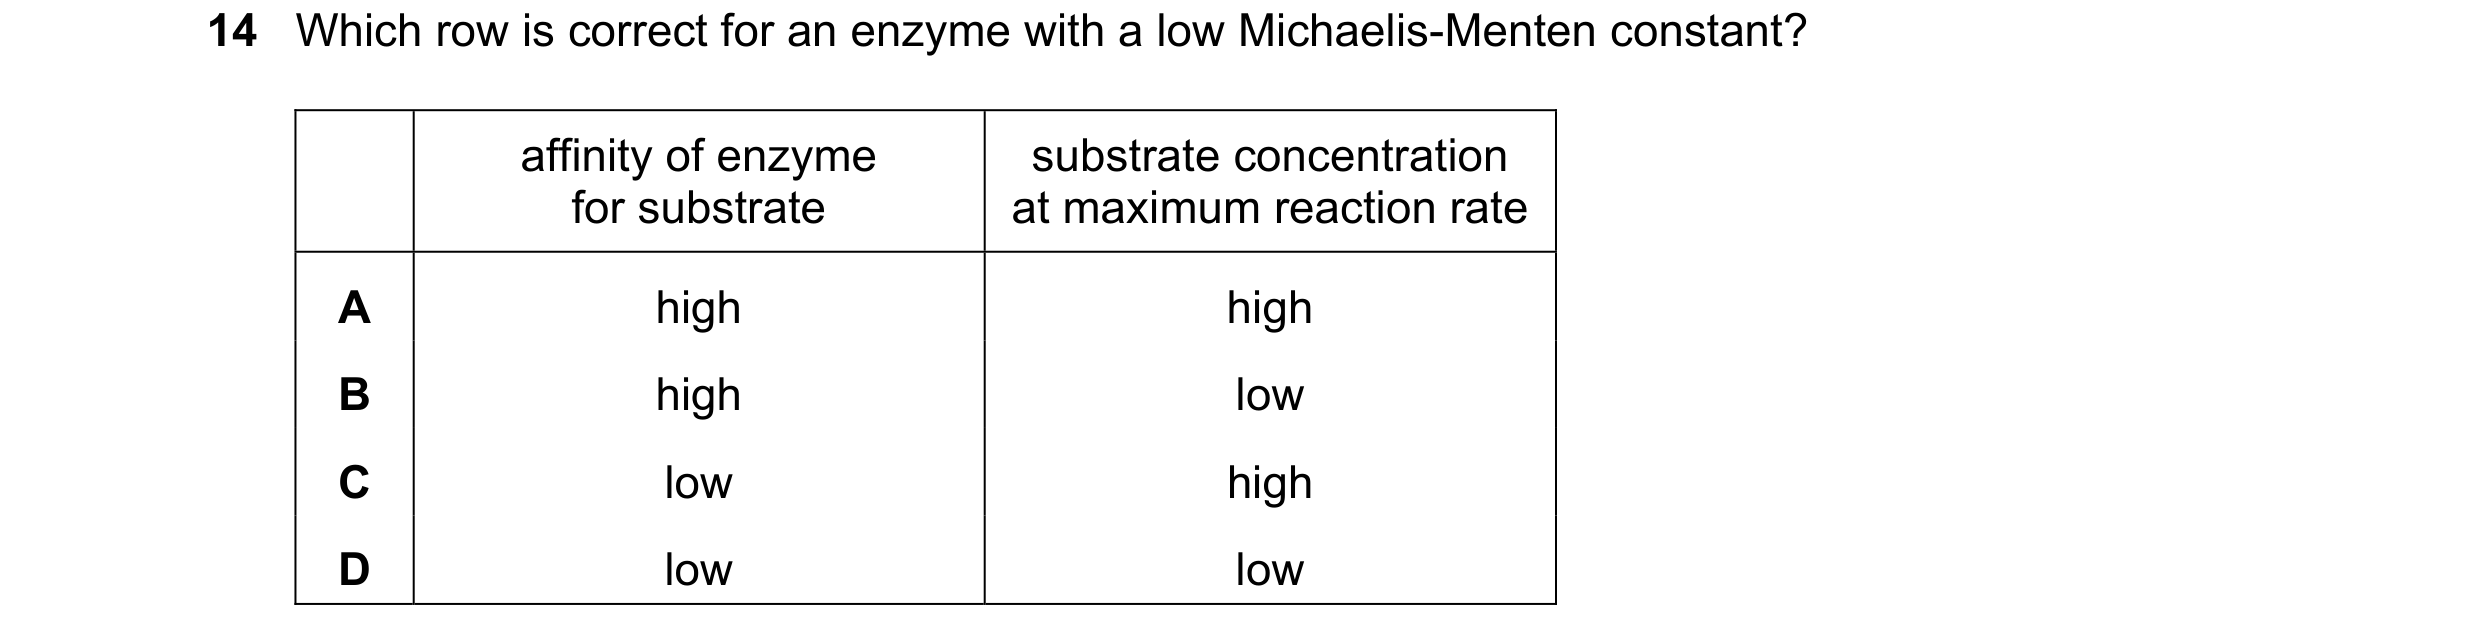
 39 / 76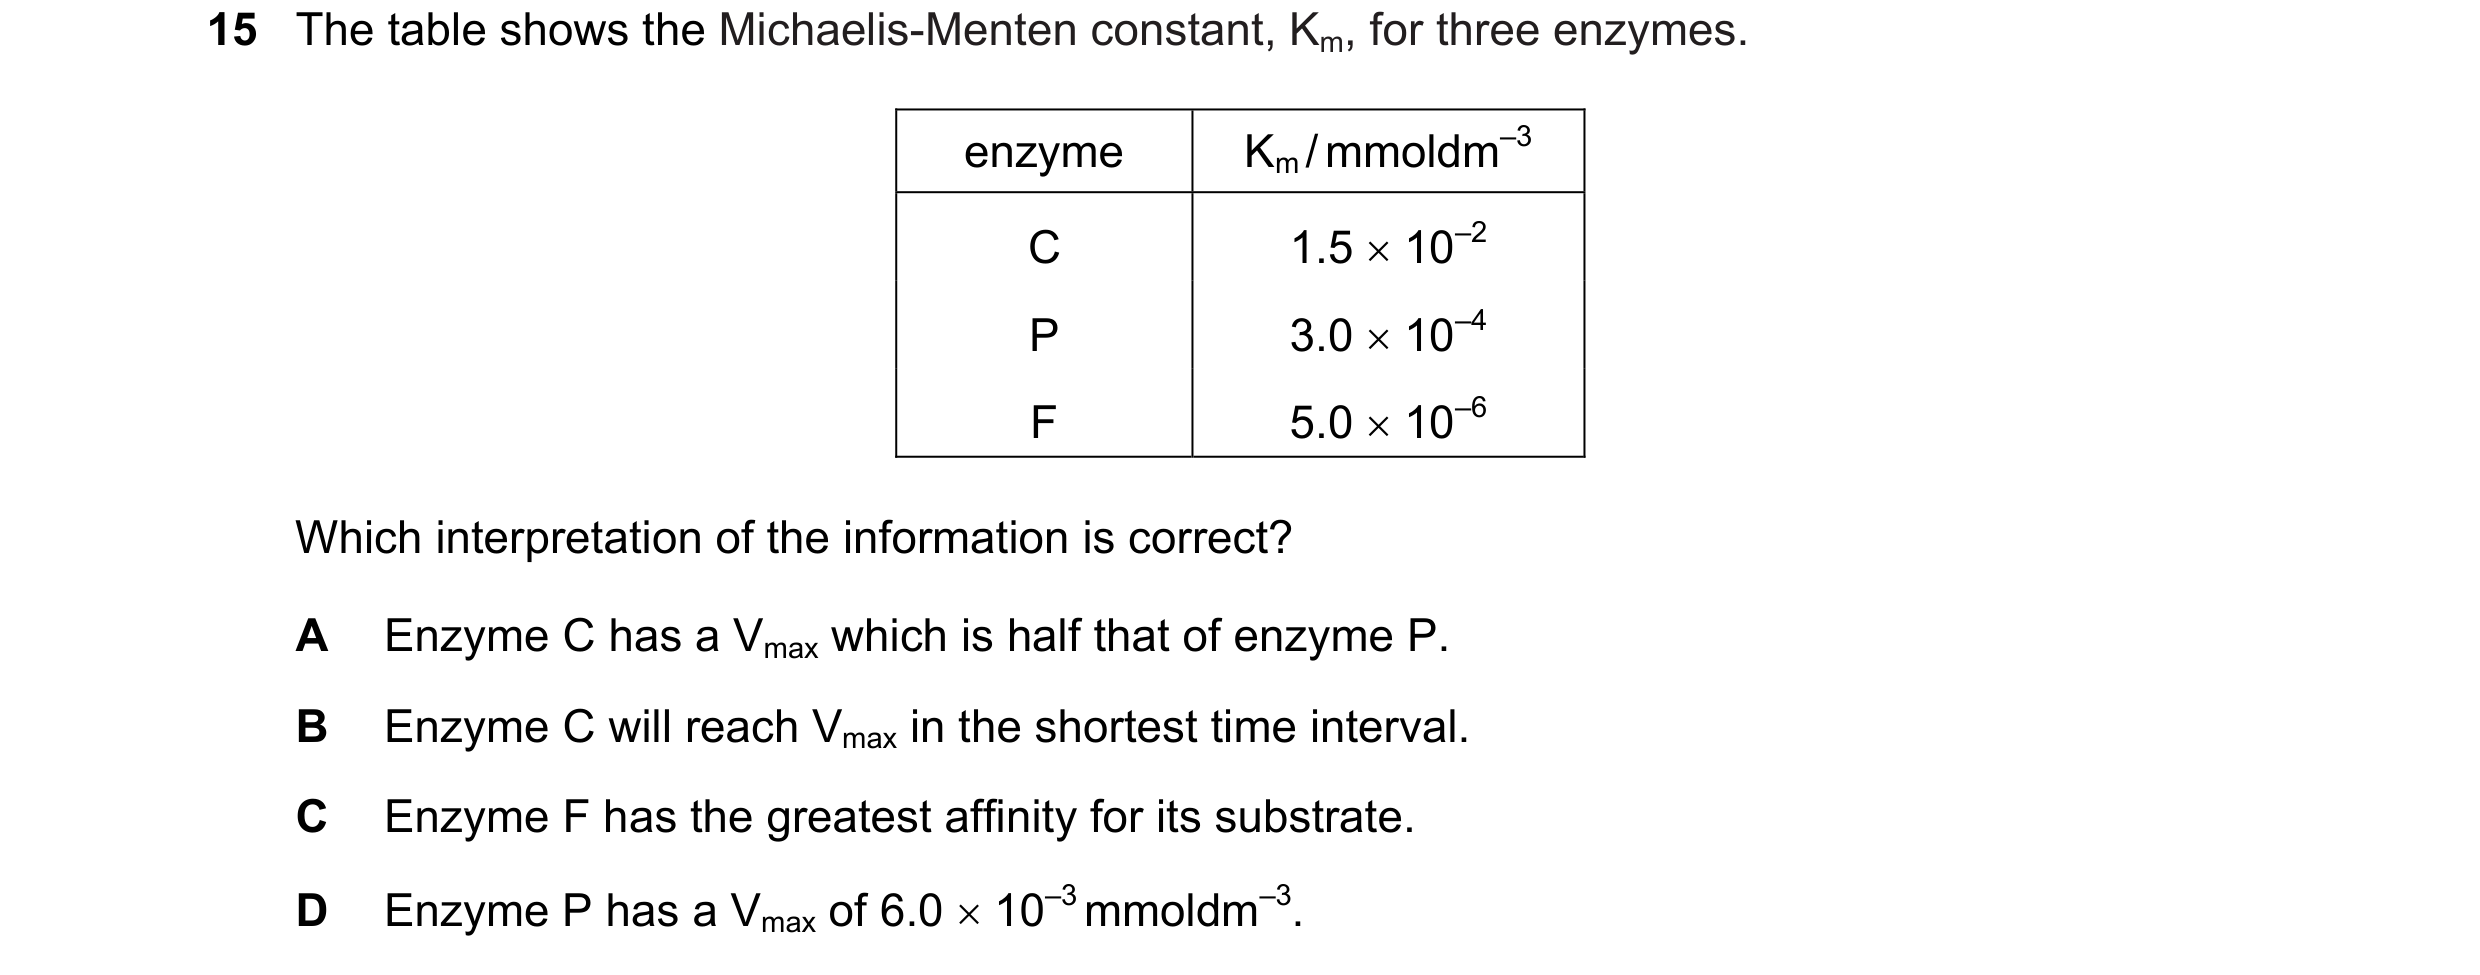
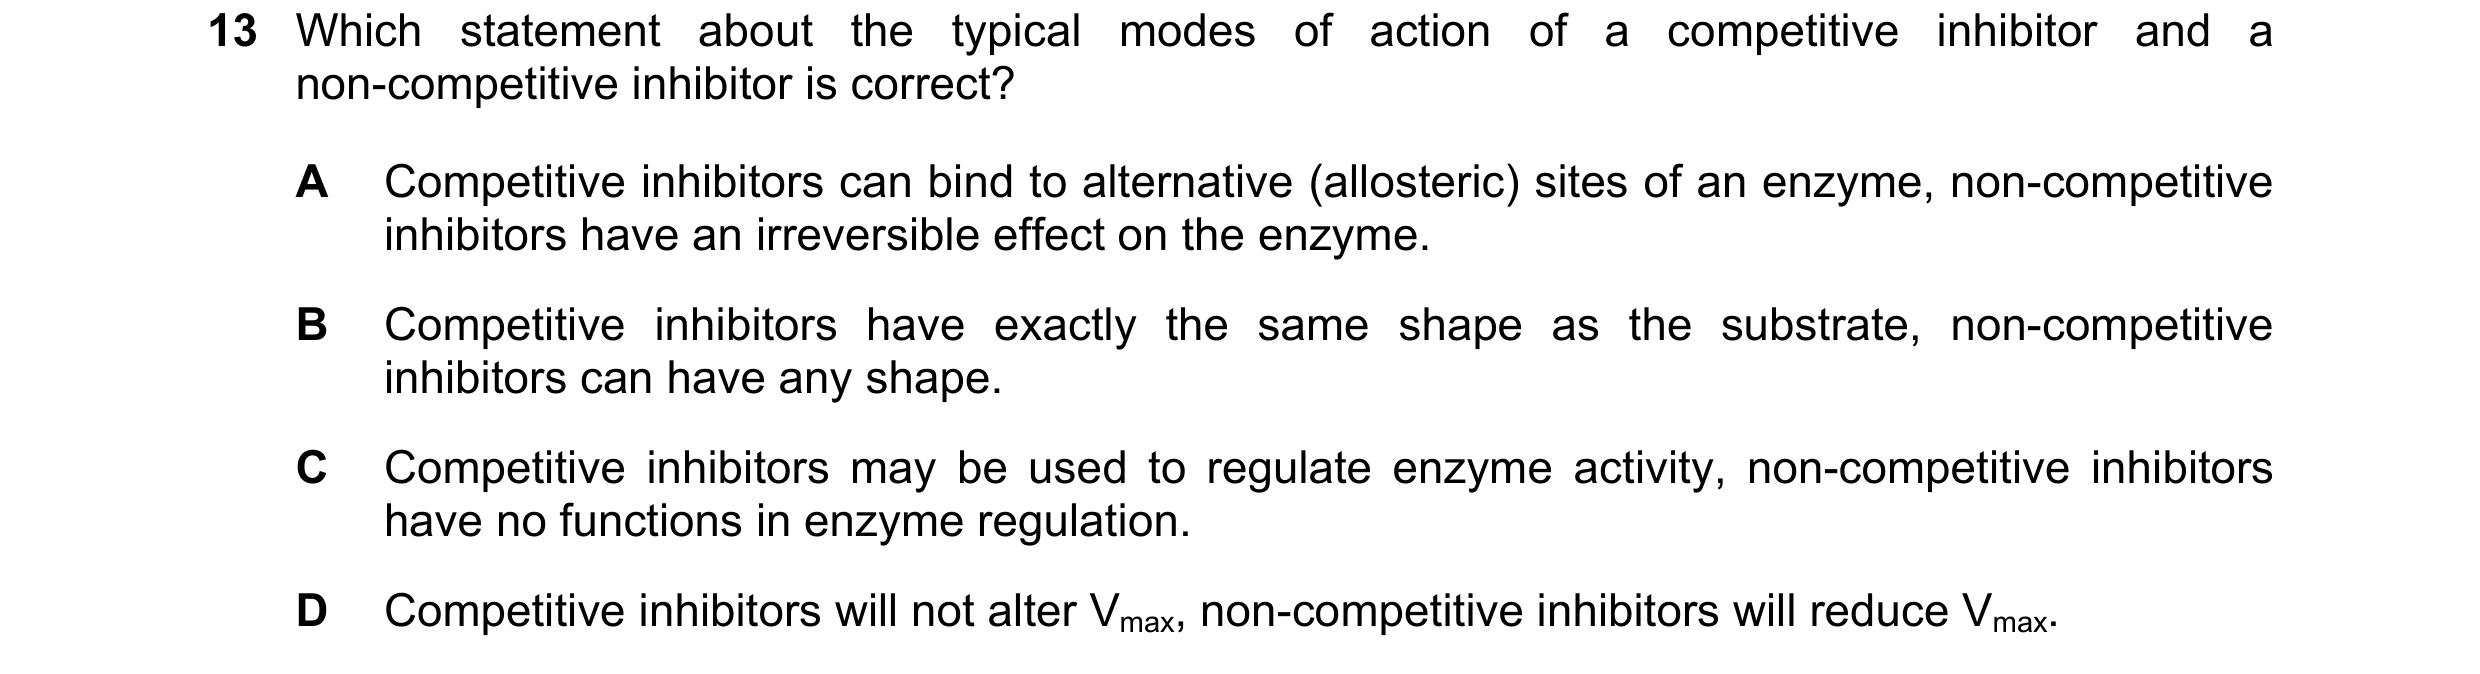
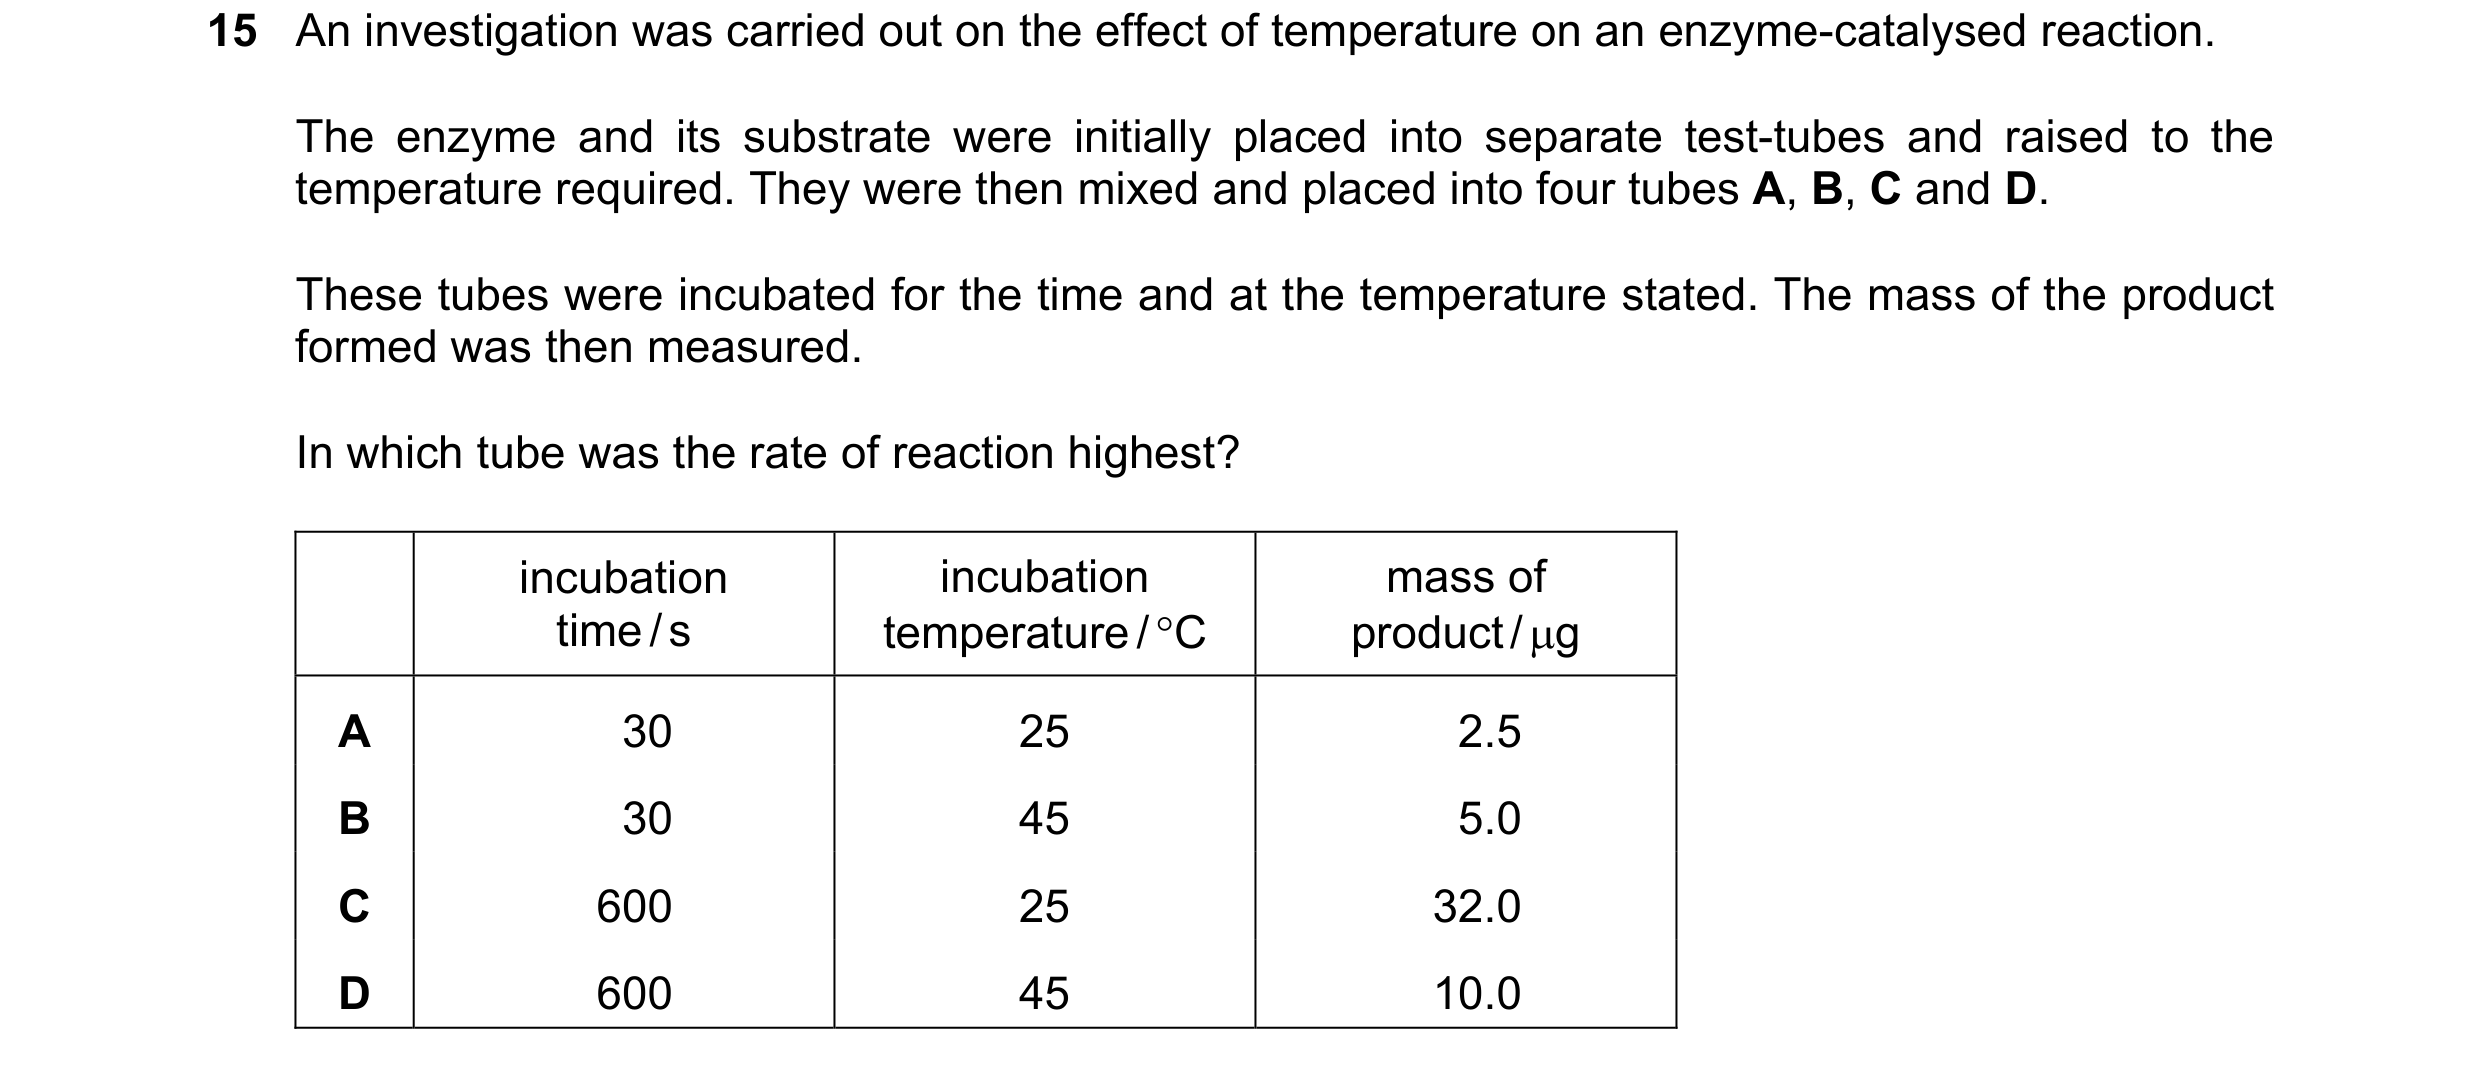 40 / 76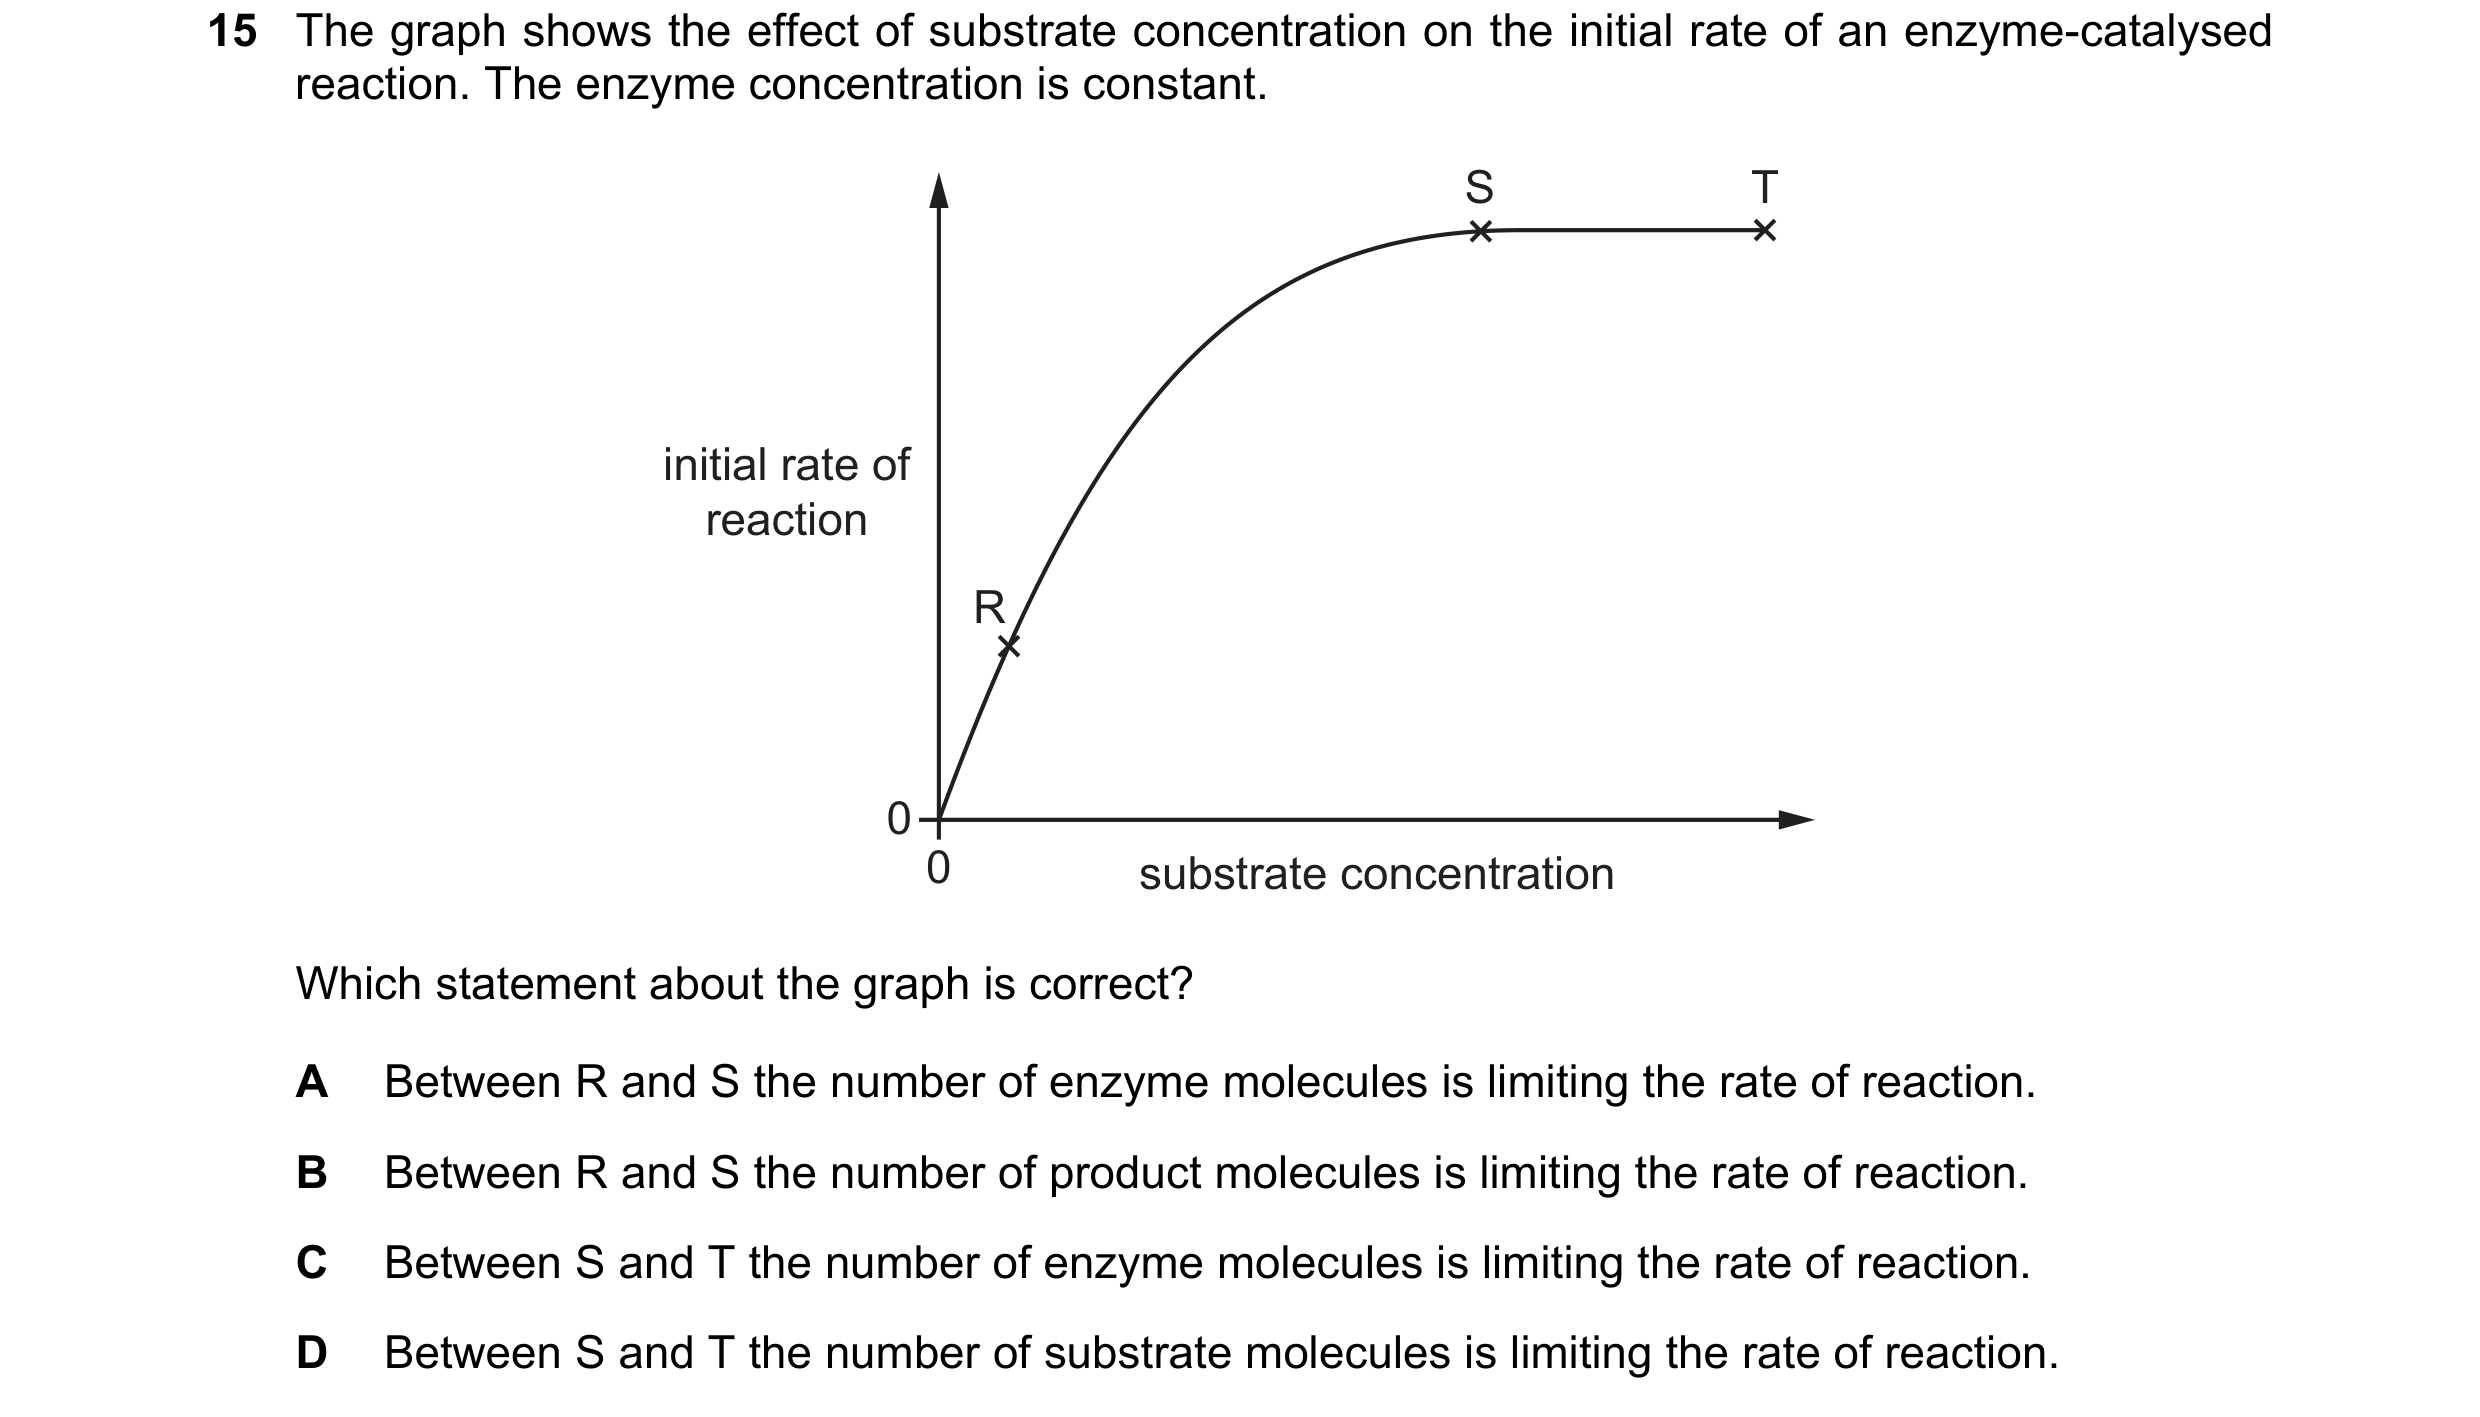
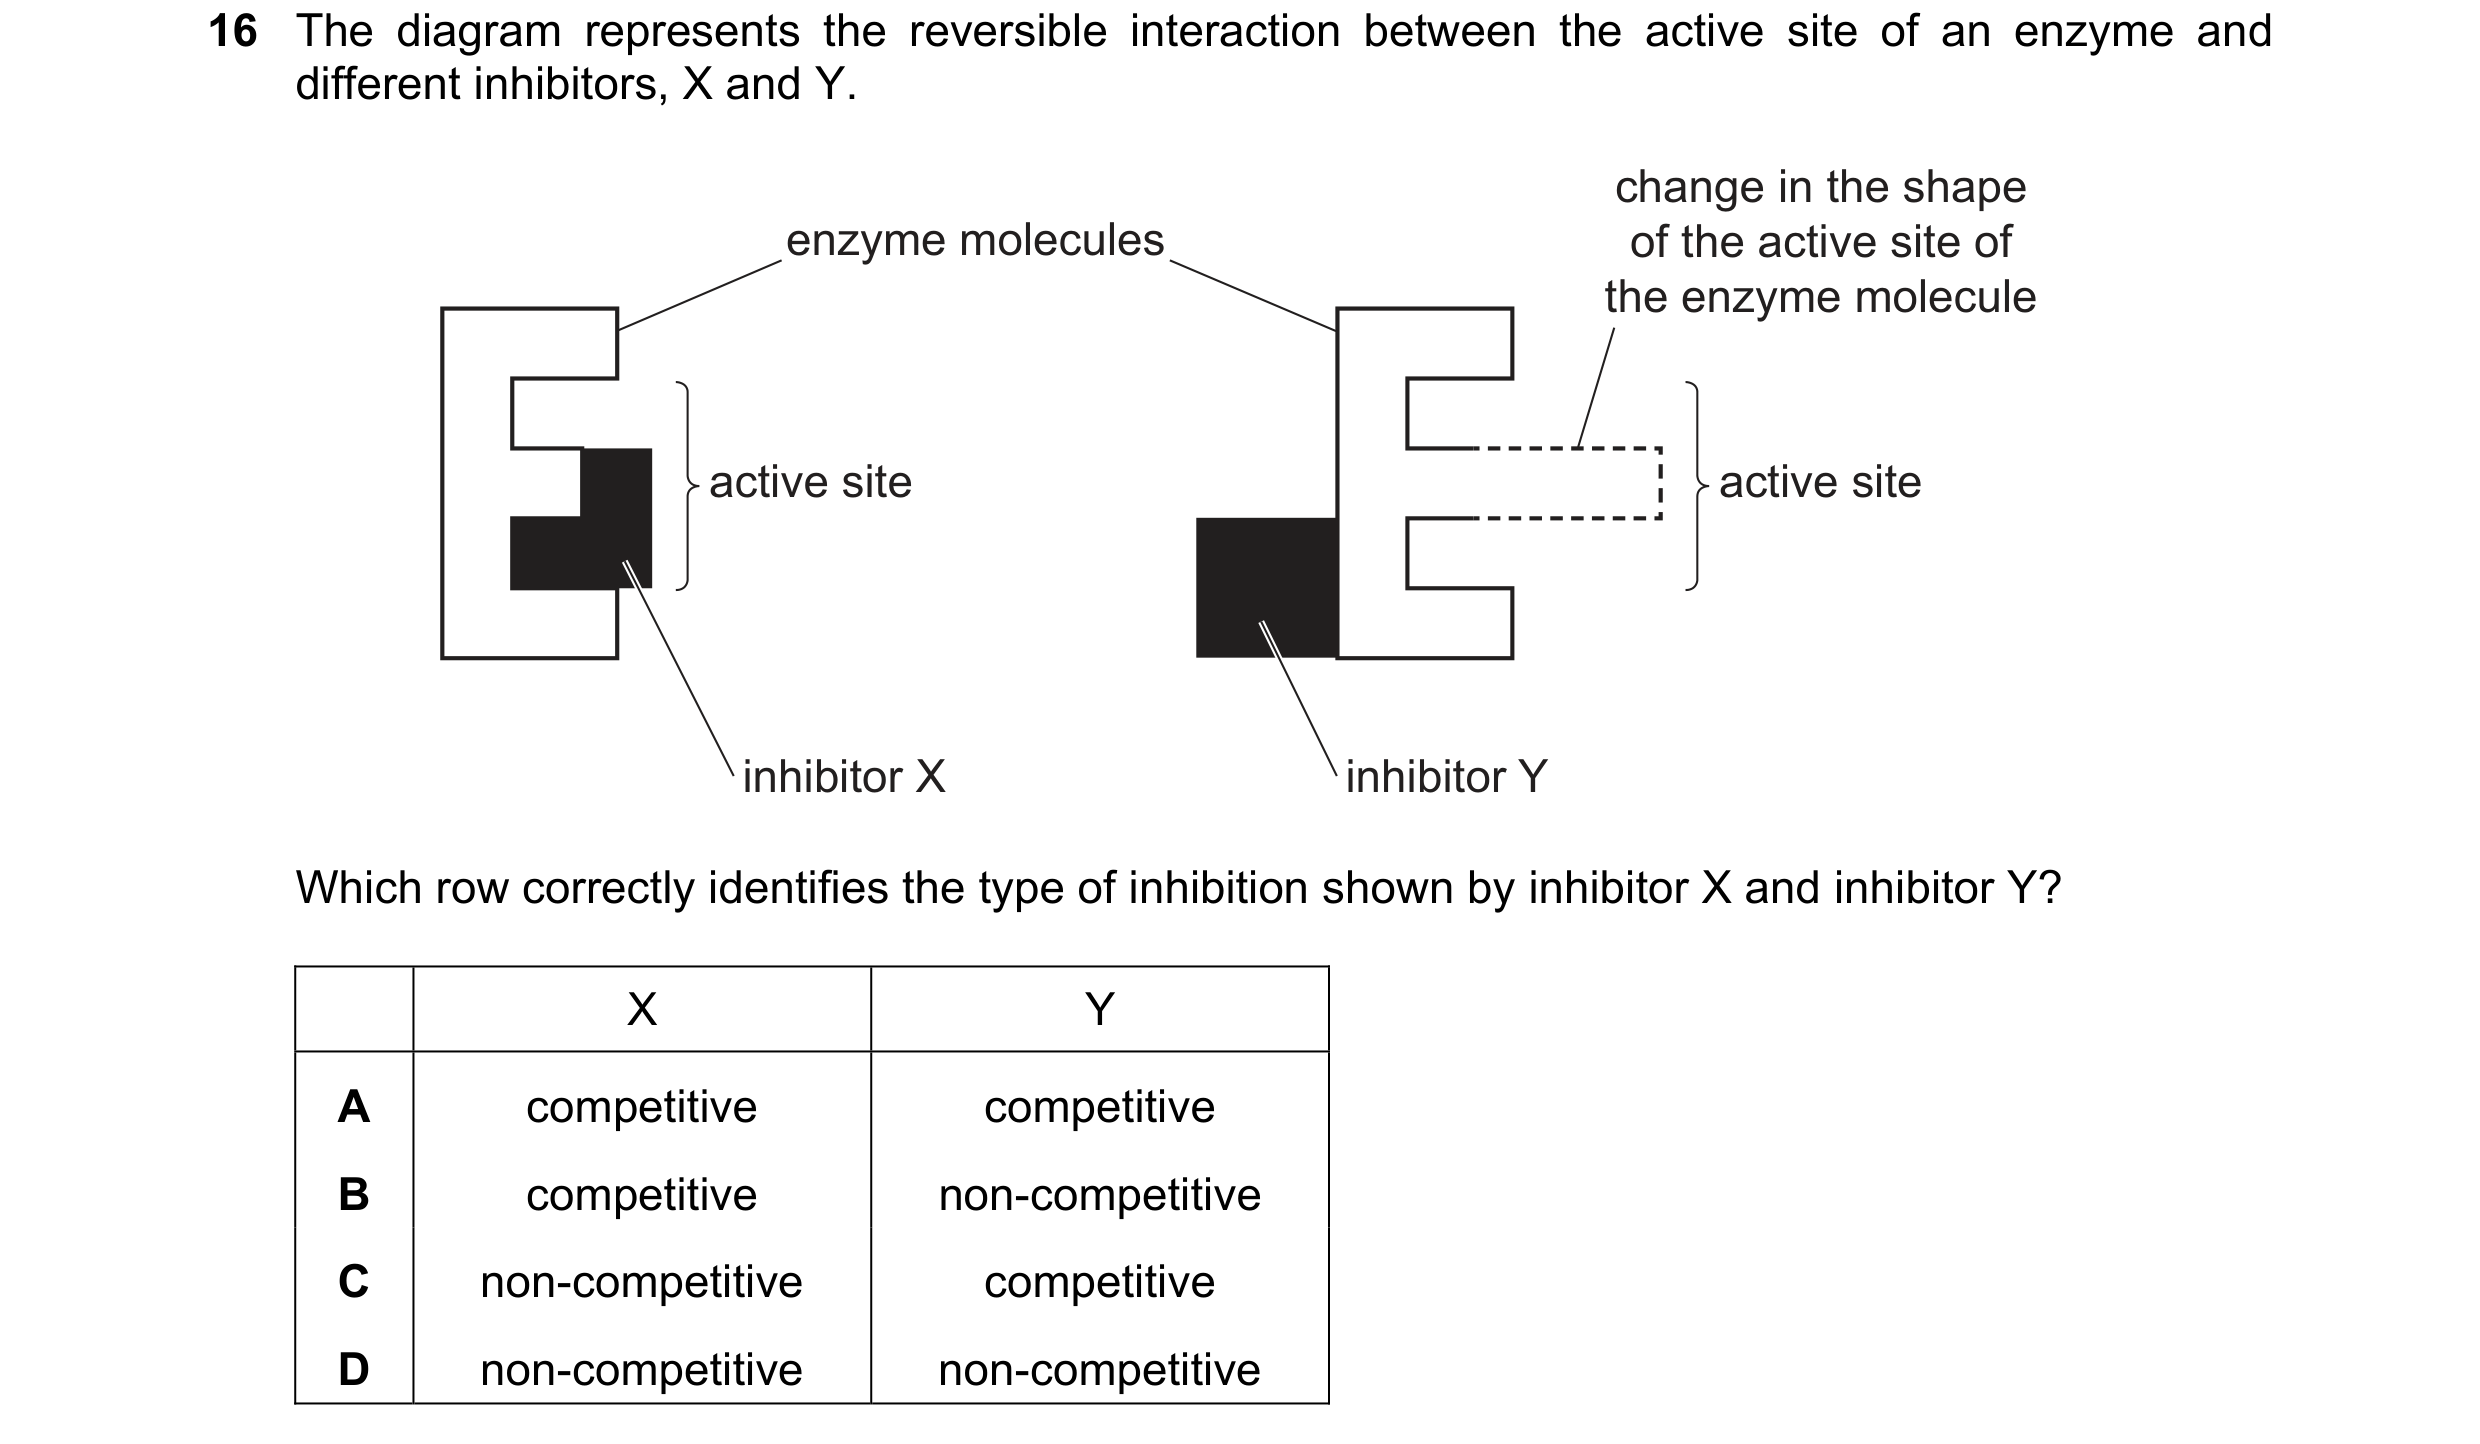 41 / 76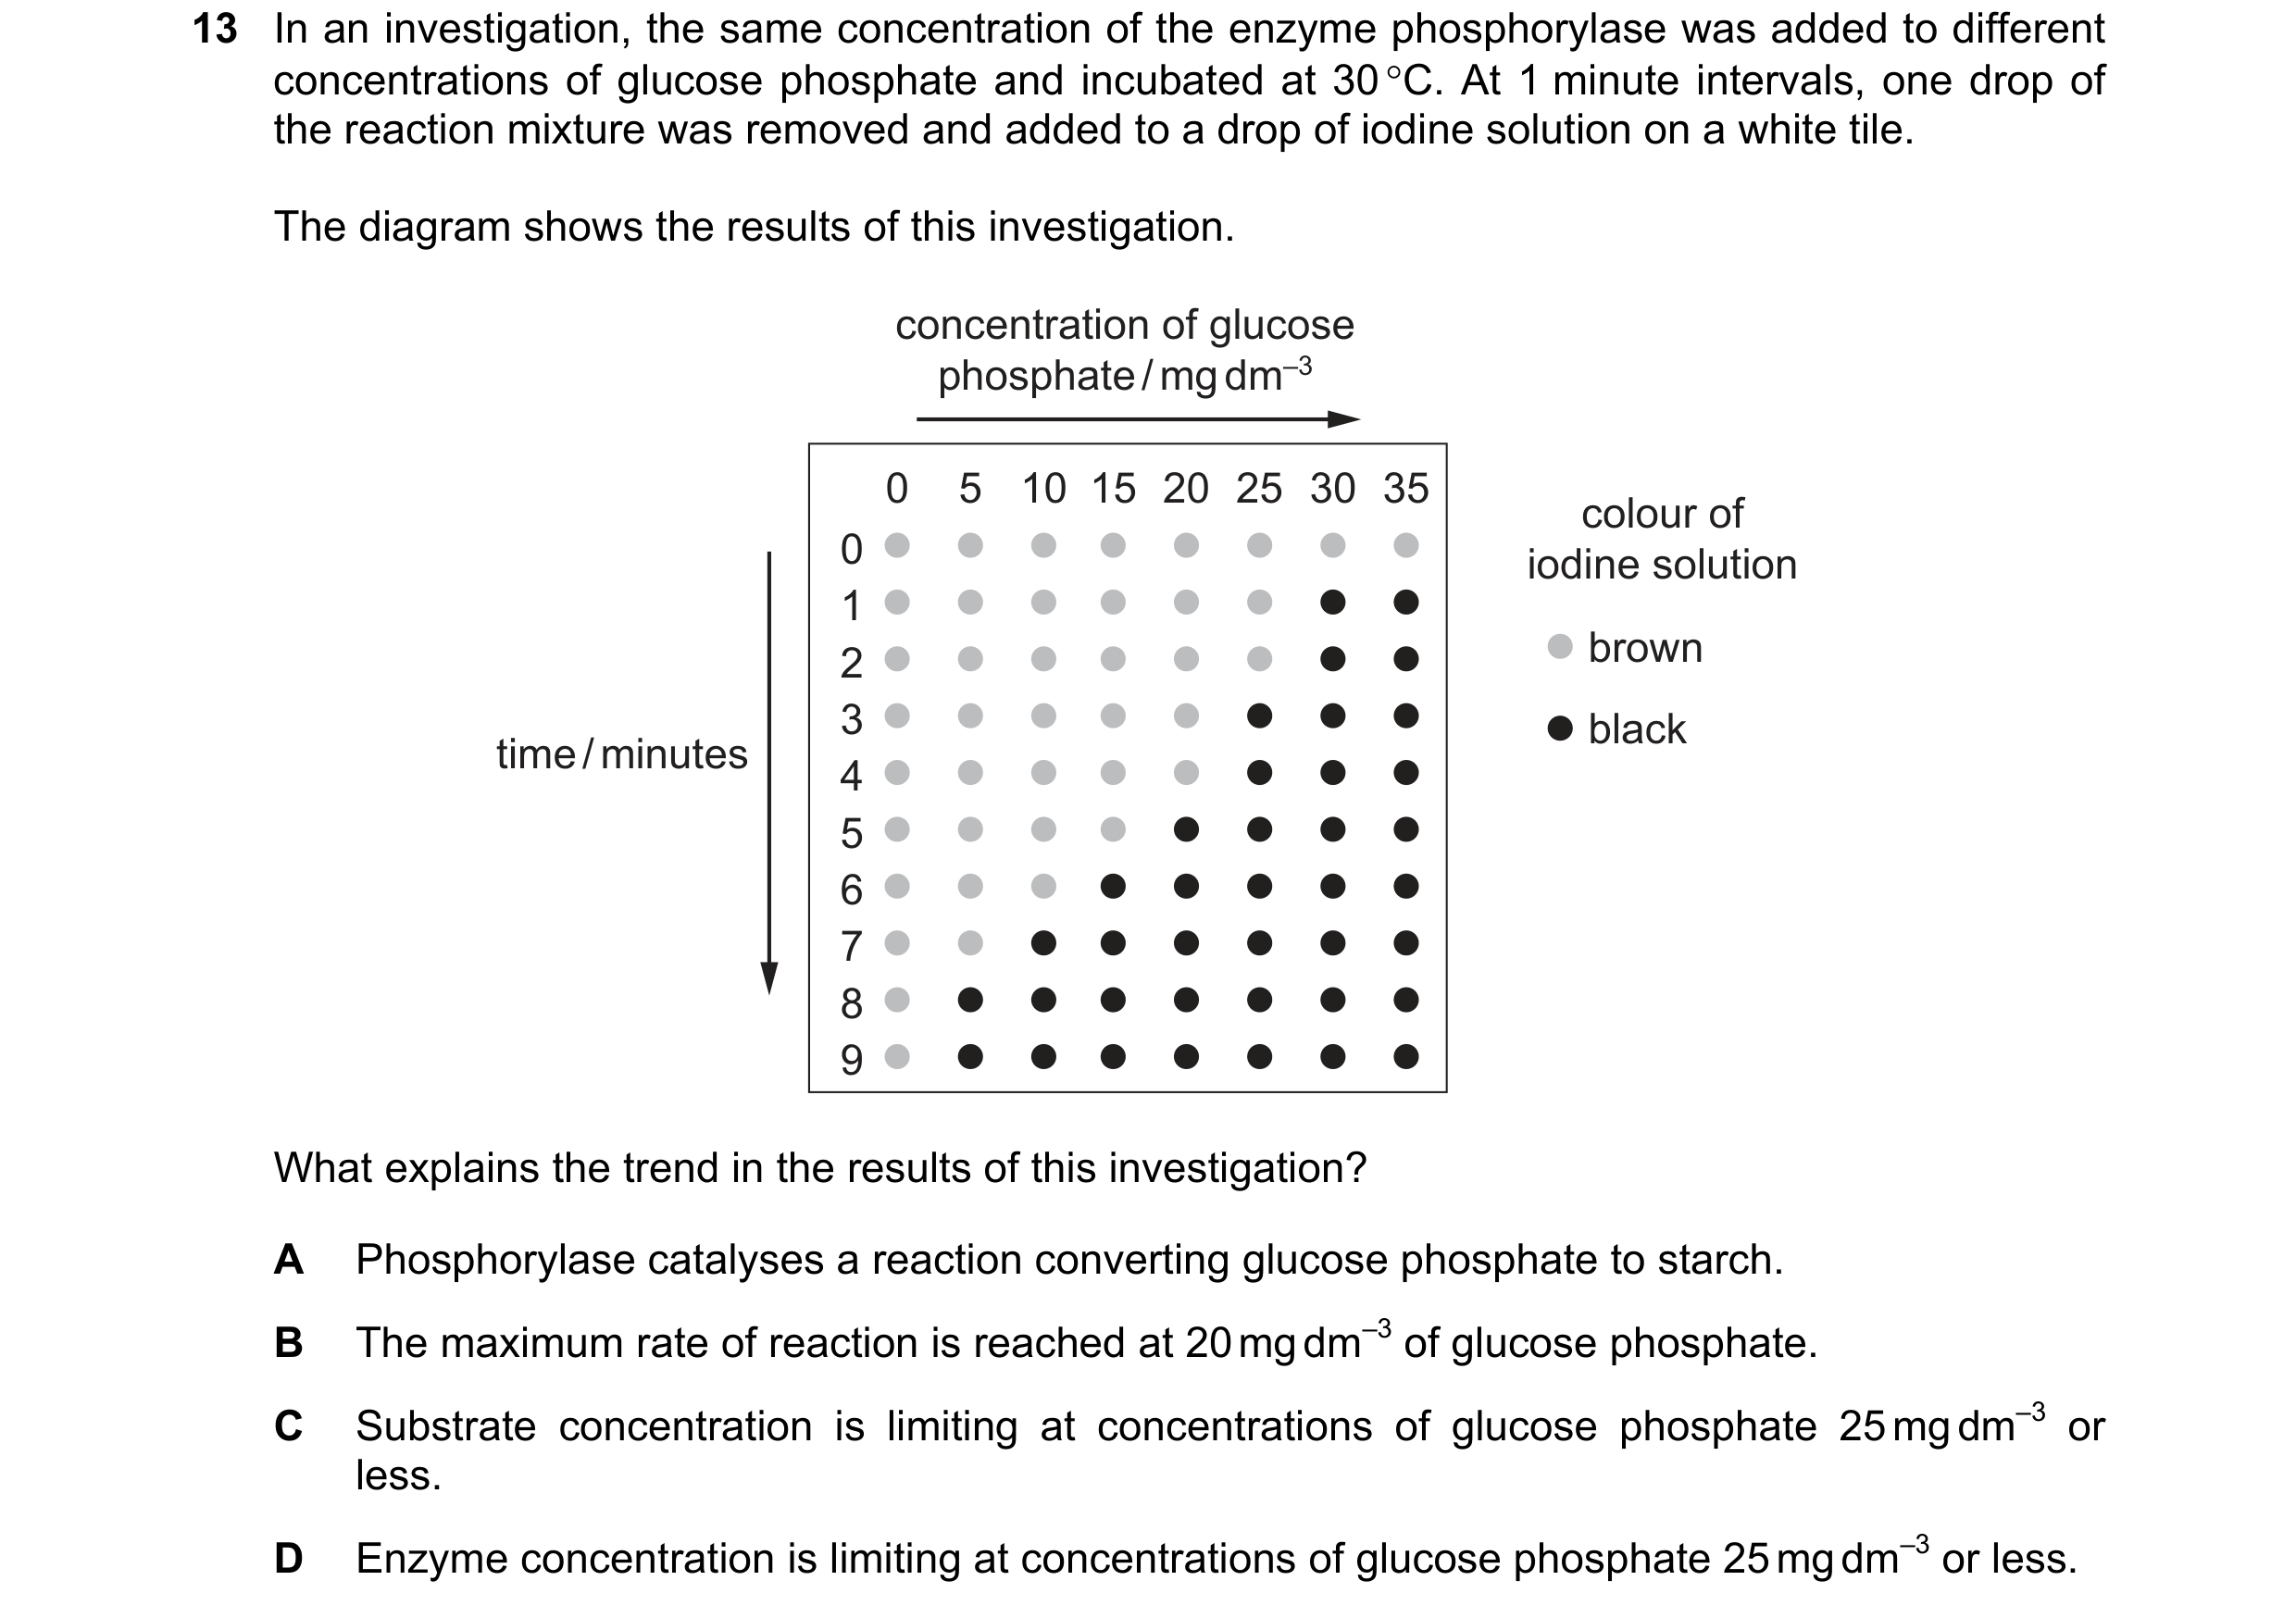
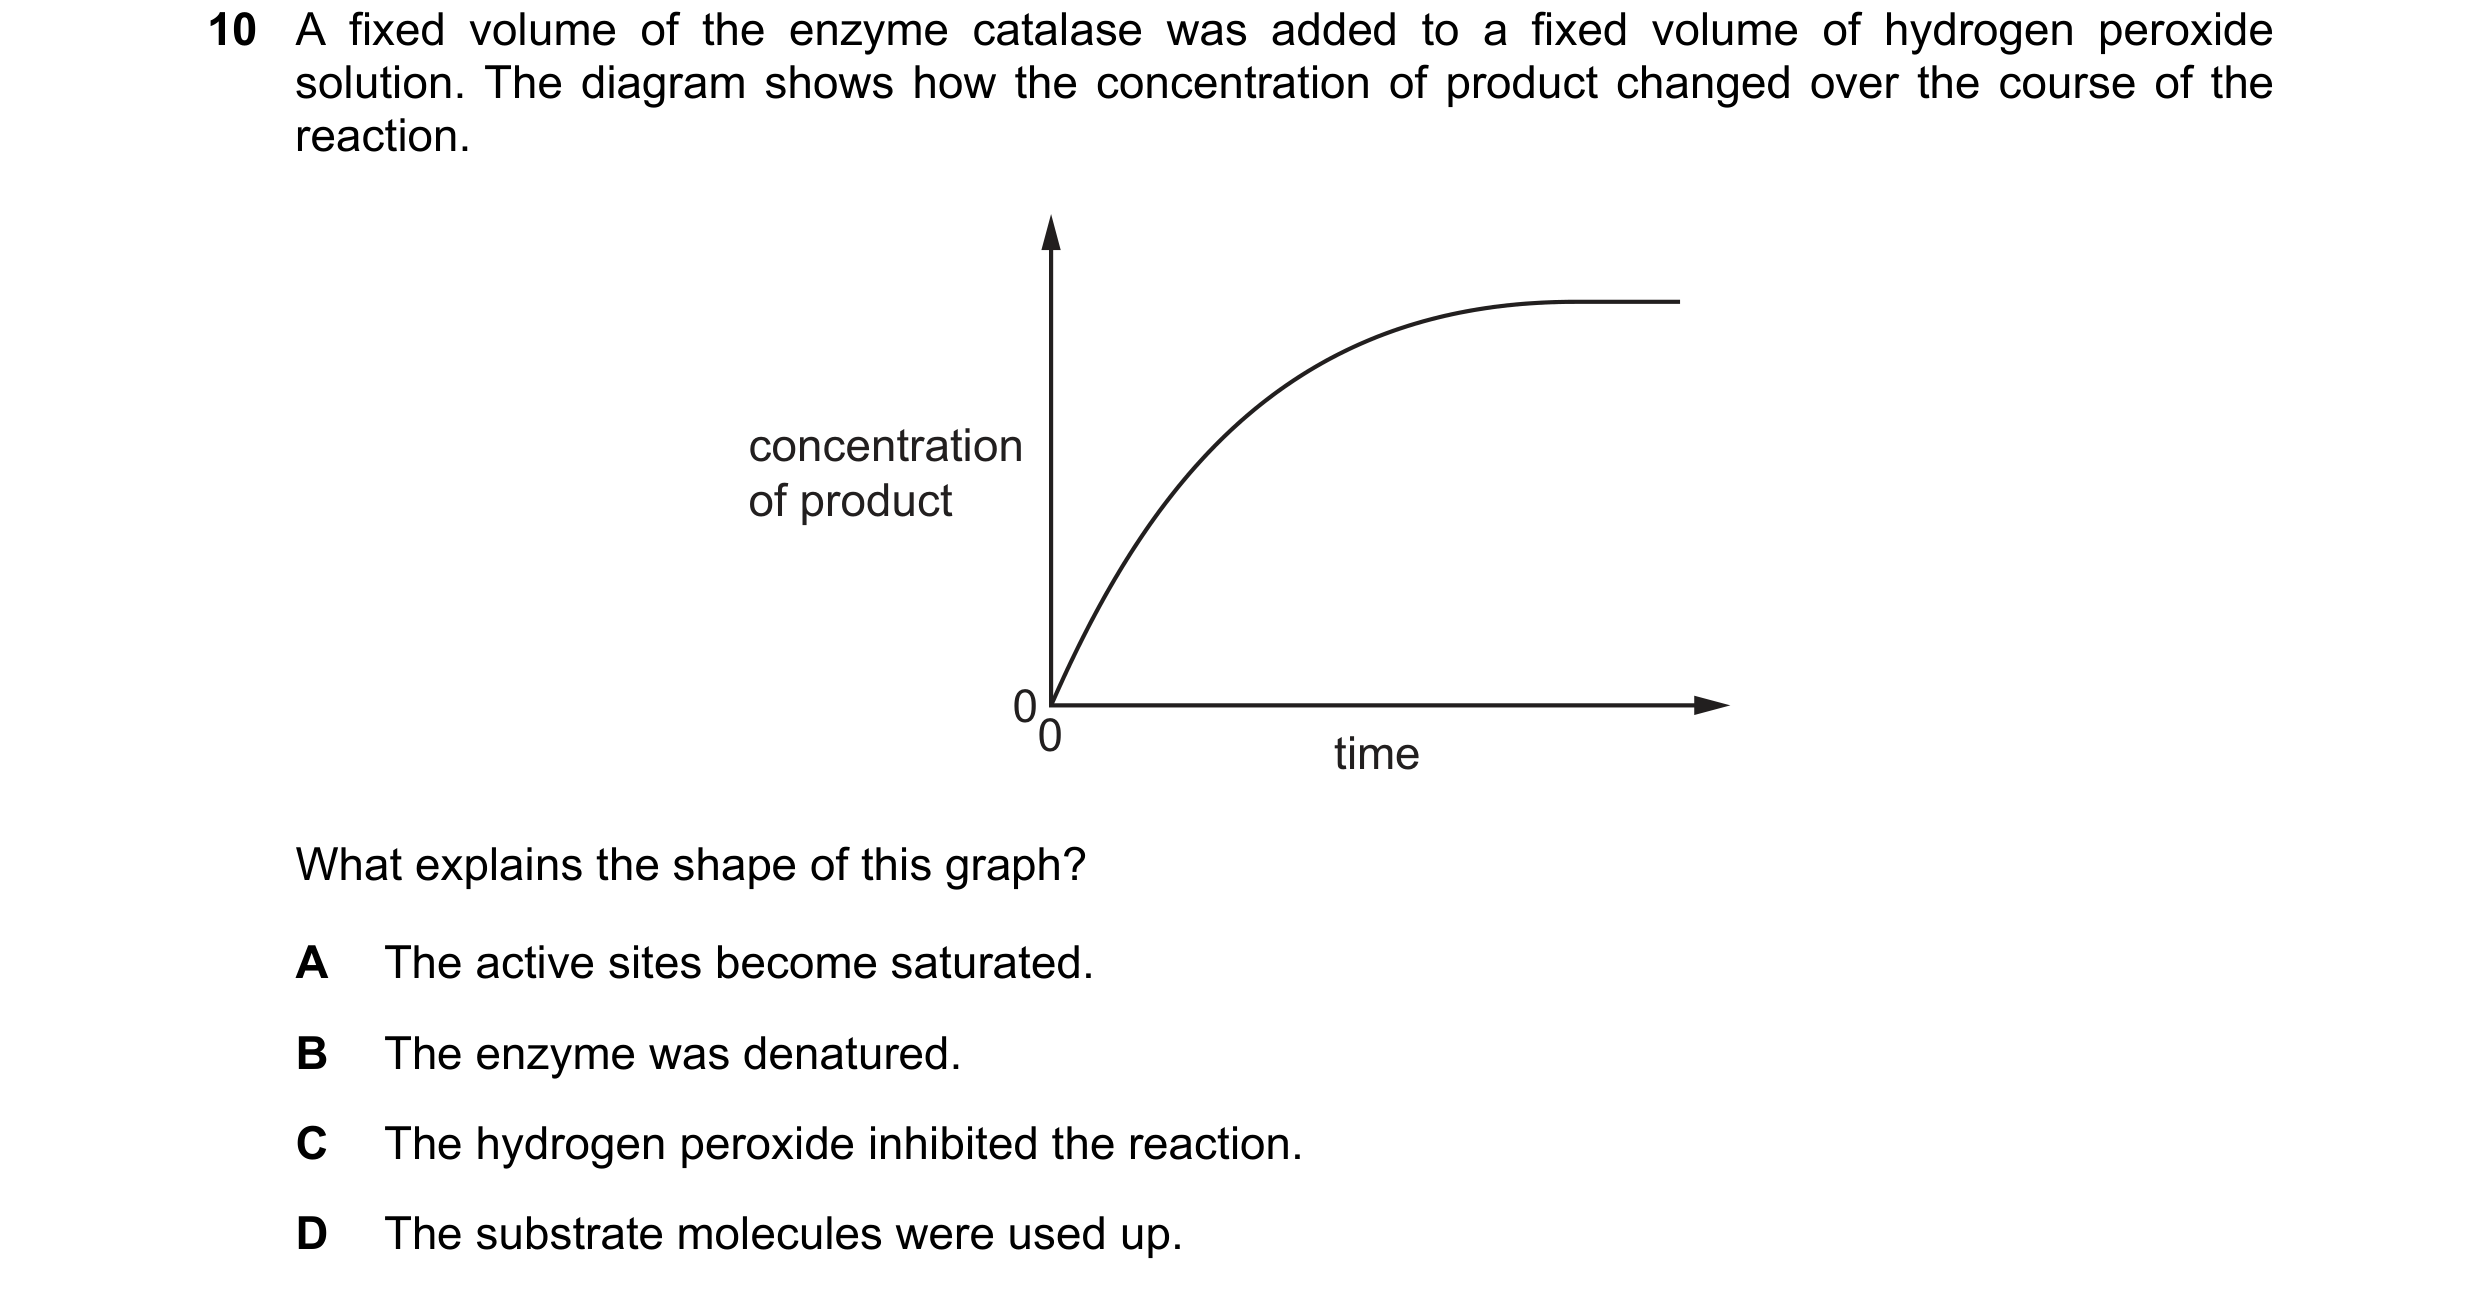 42 / 76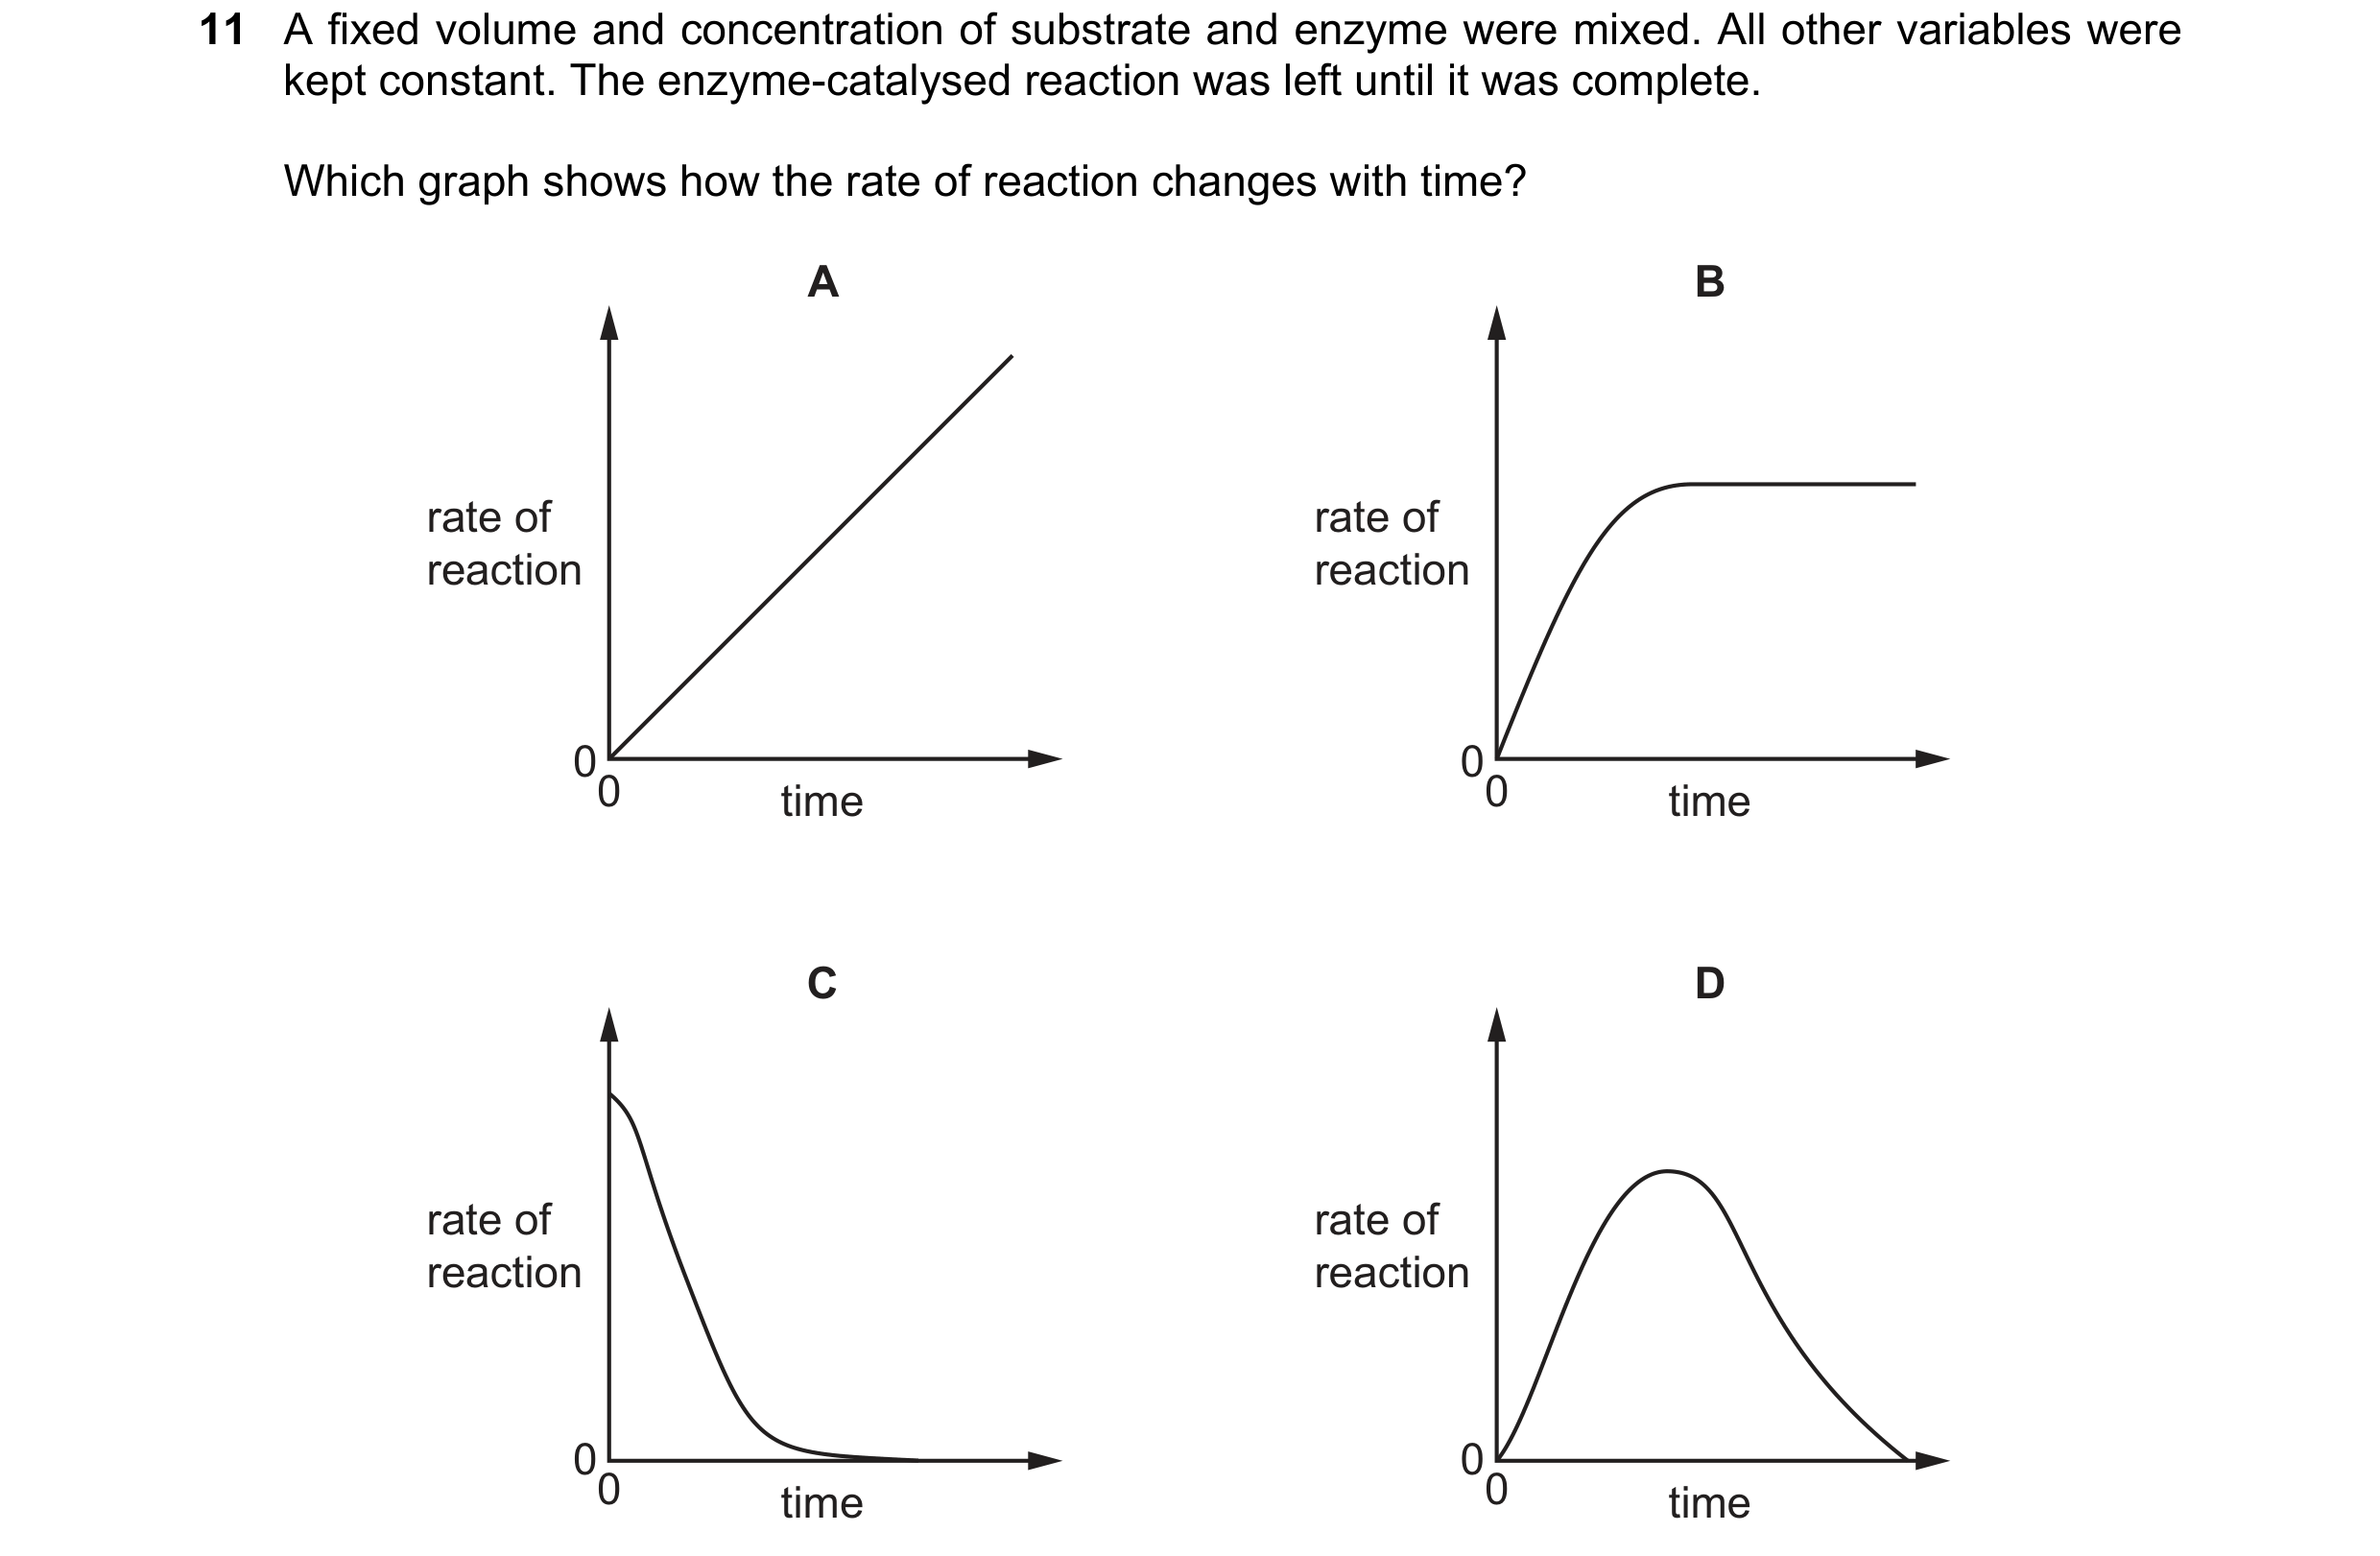
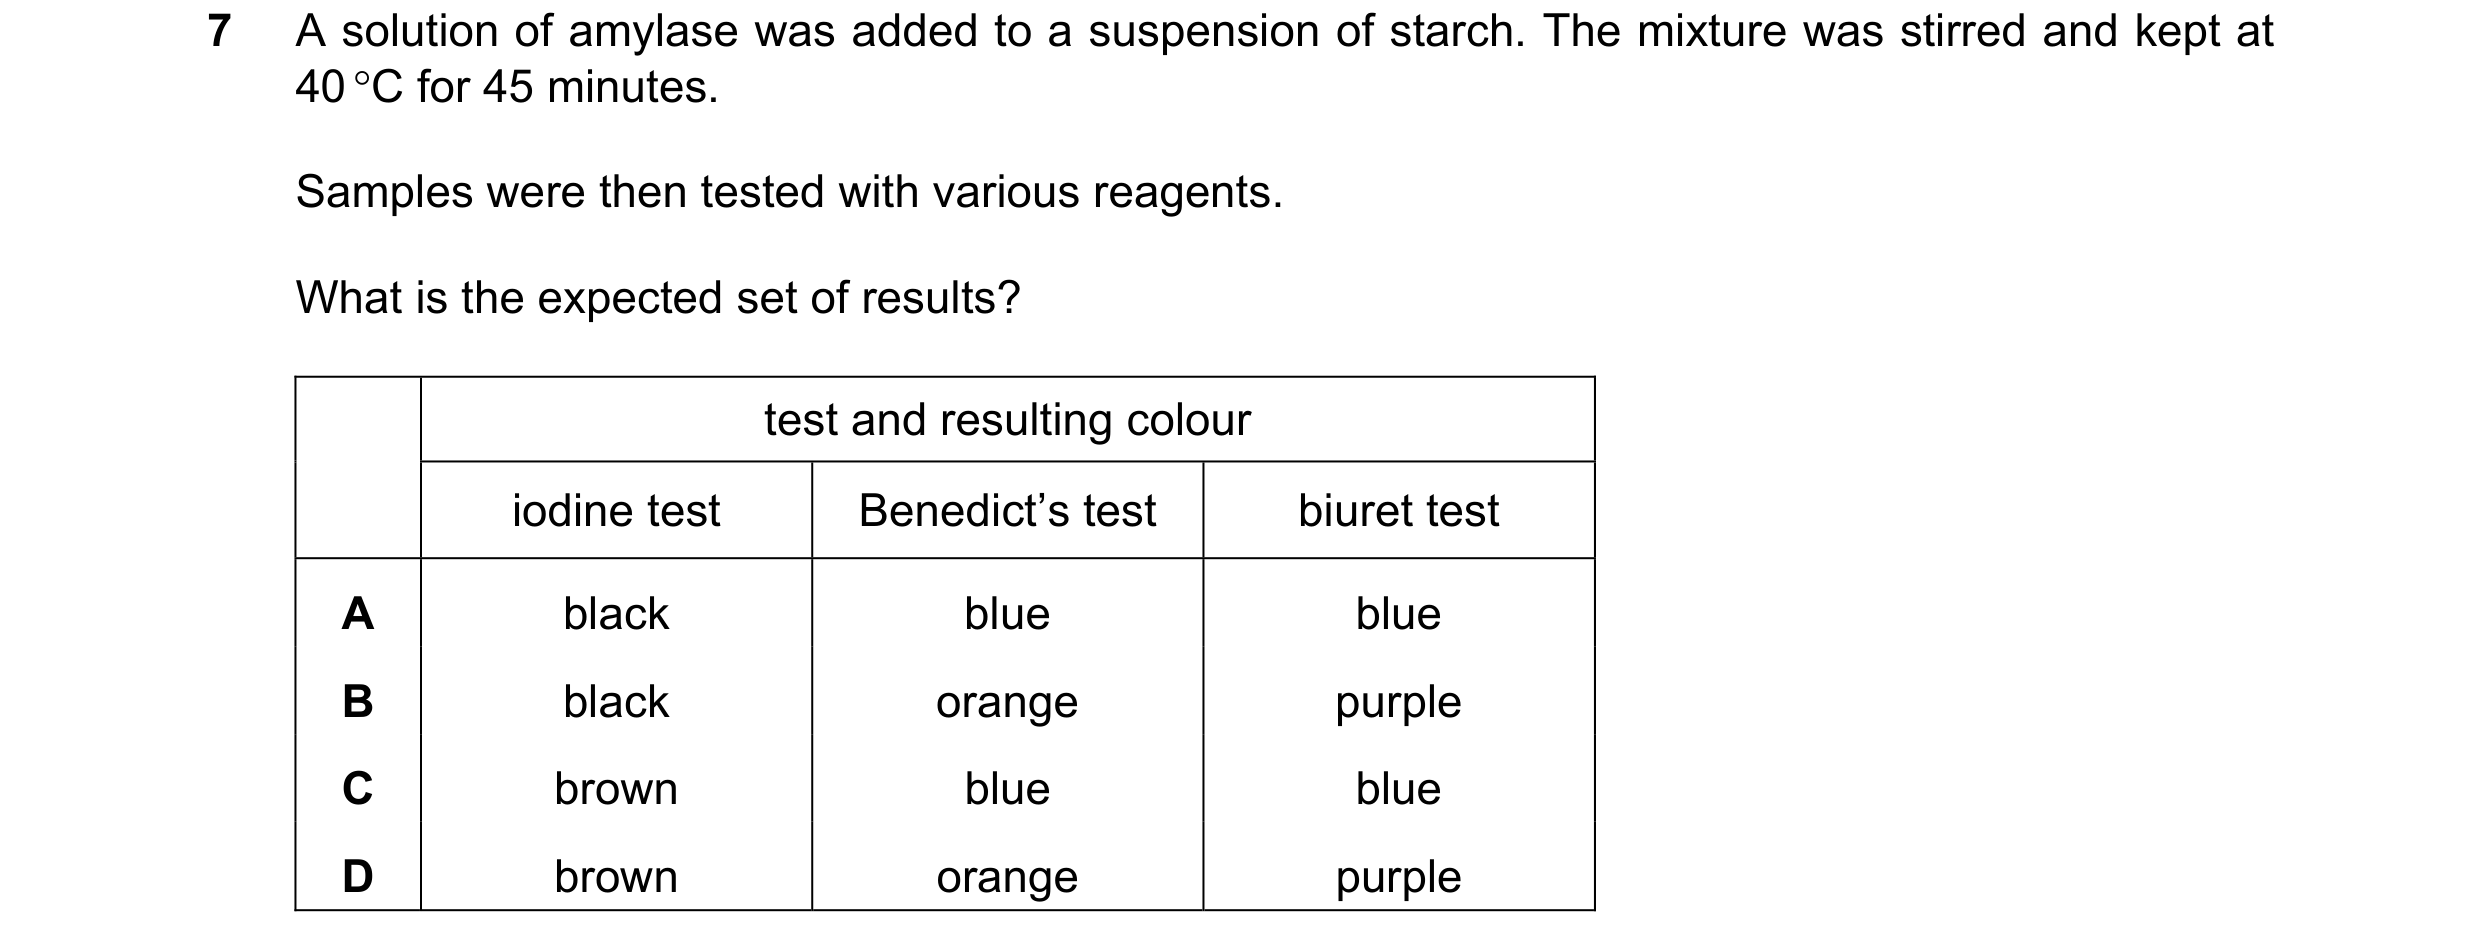
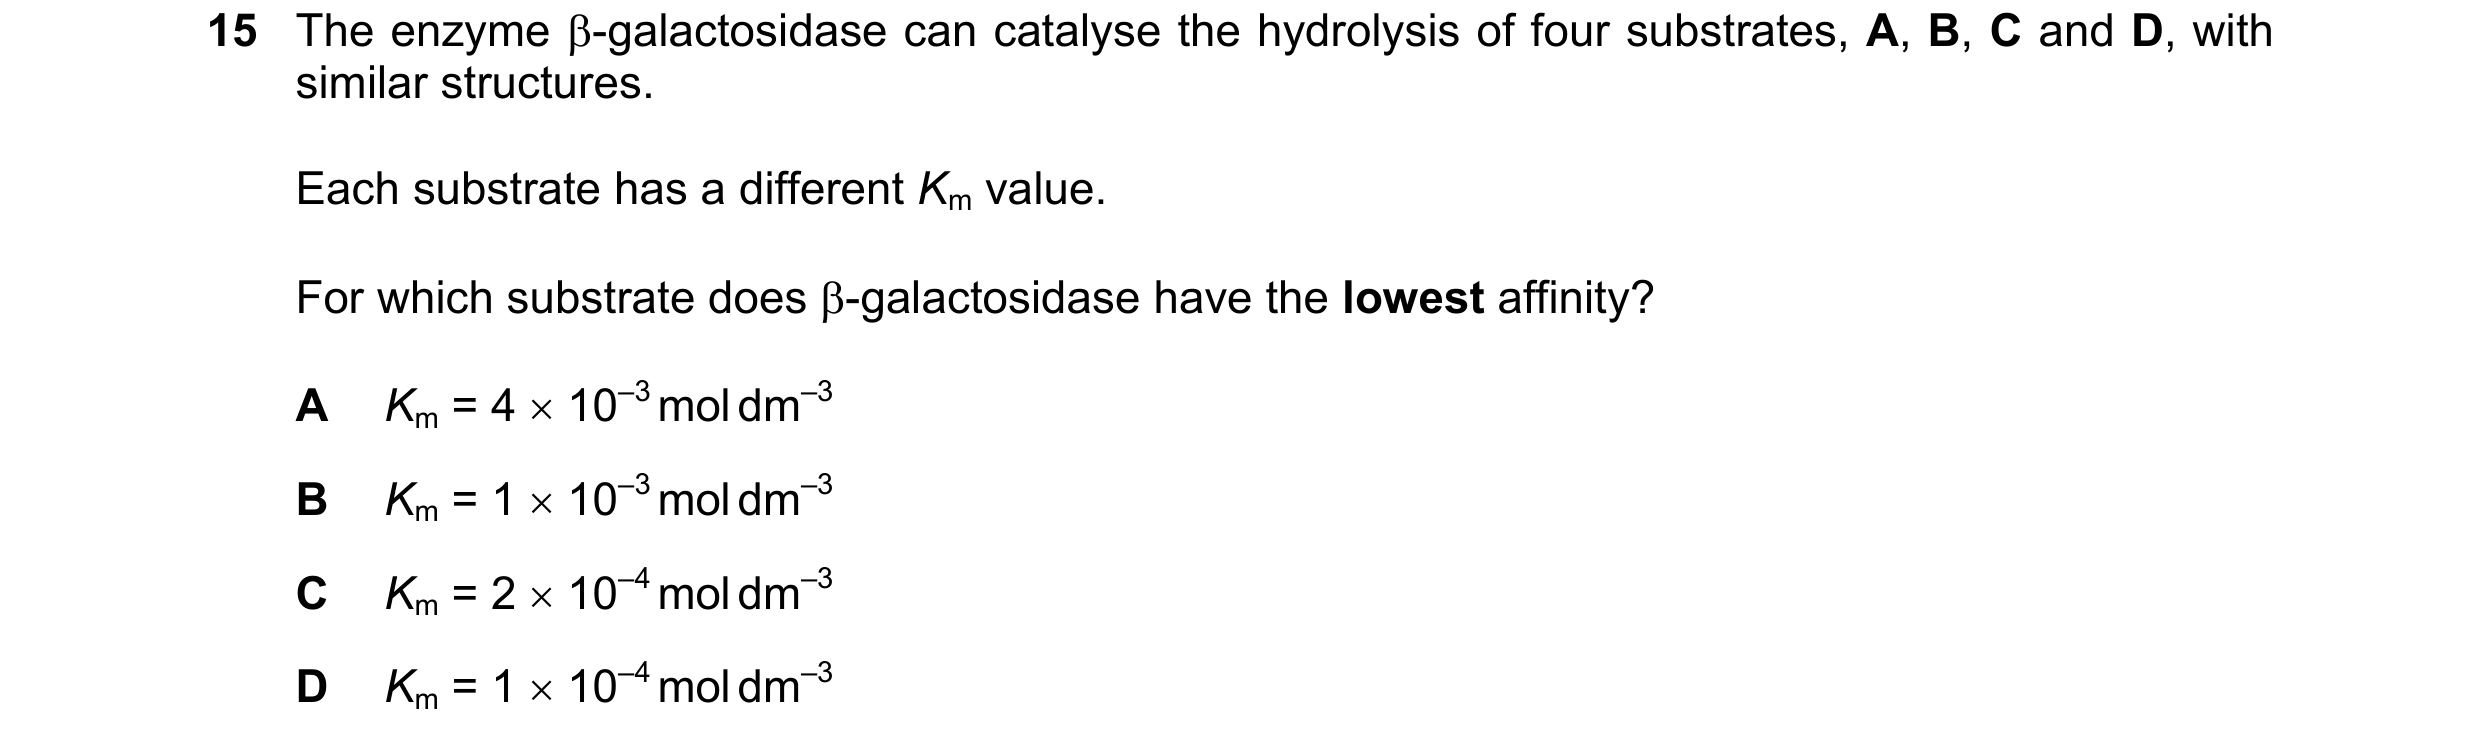 43 / 76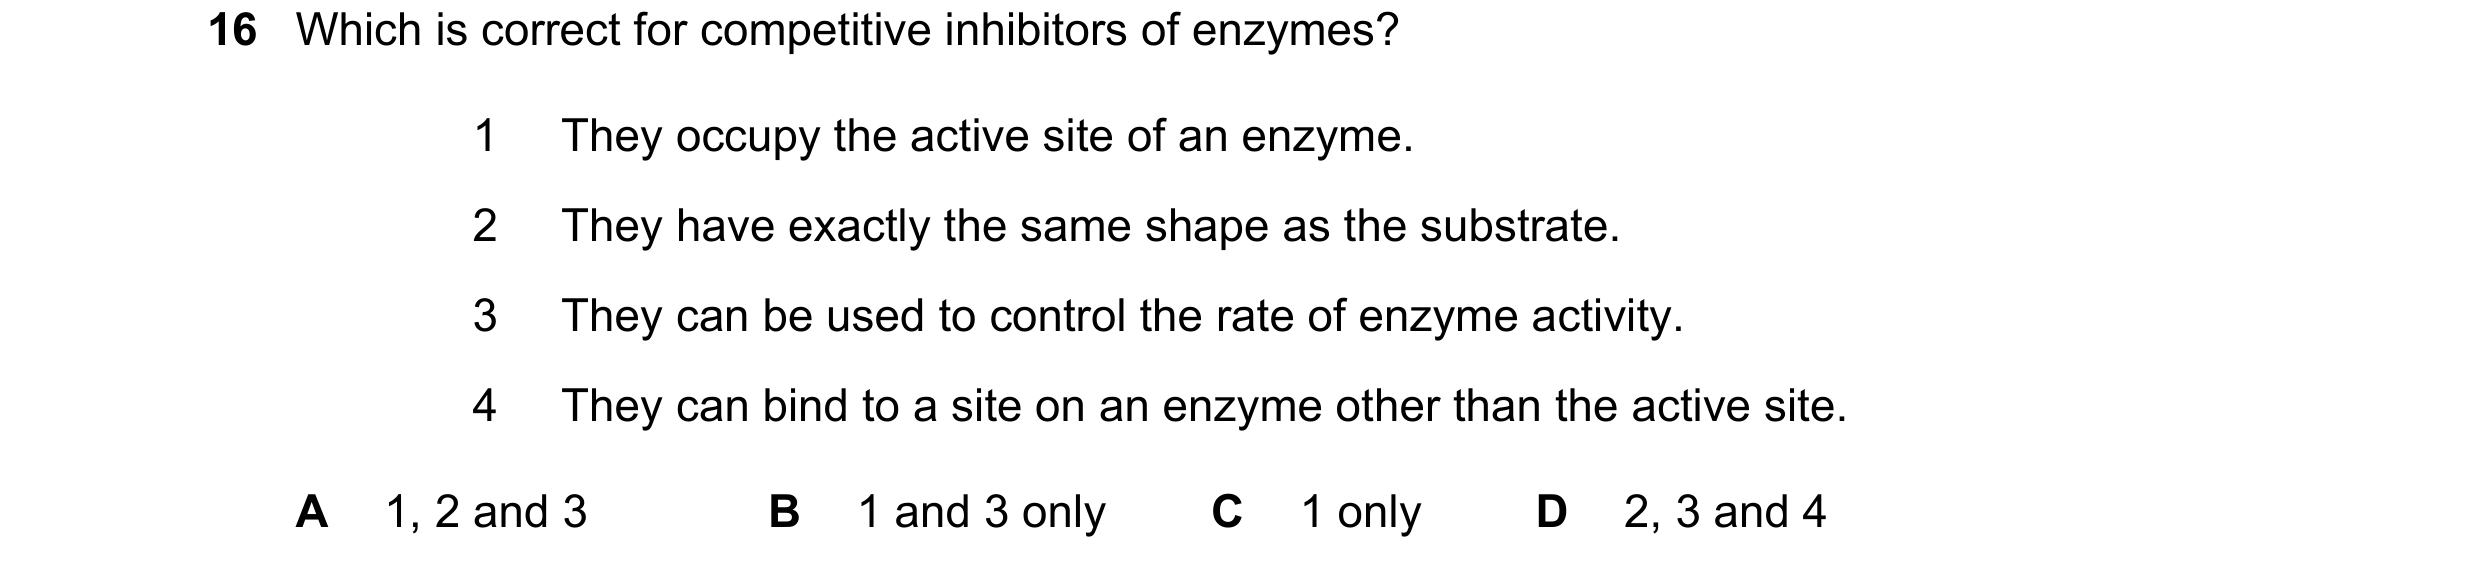
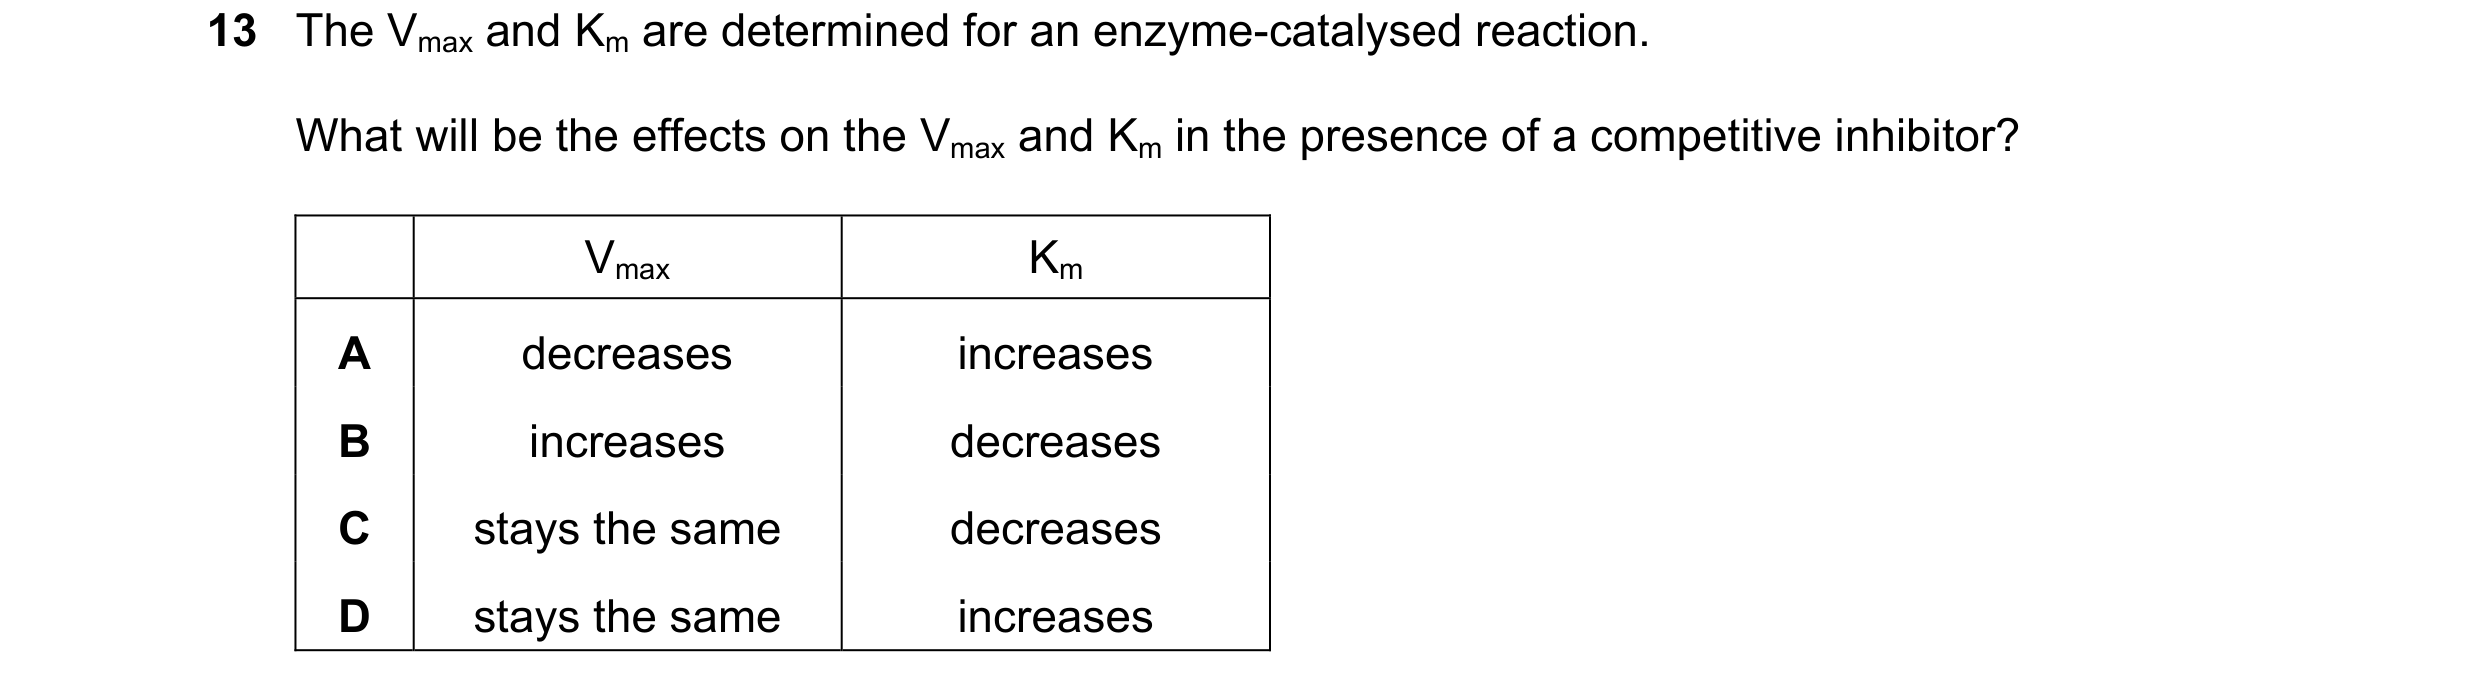
 44 / 76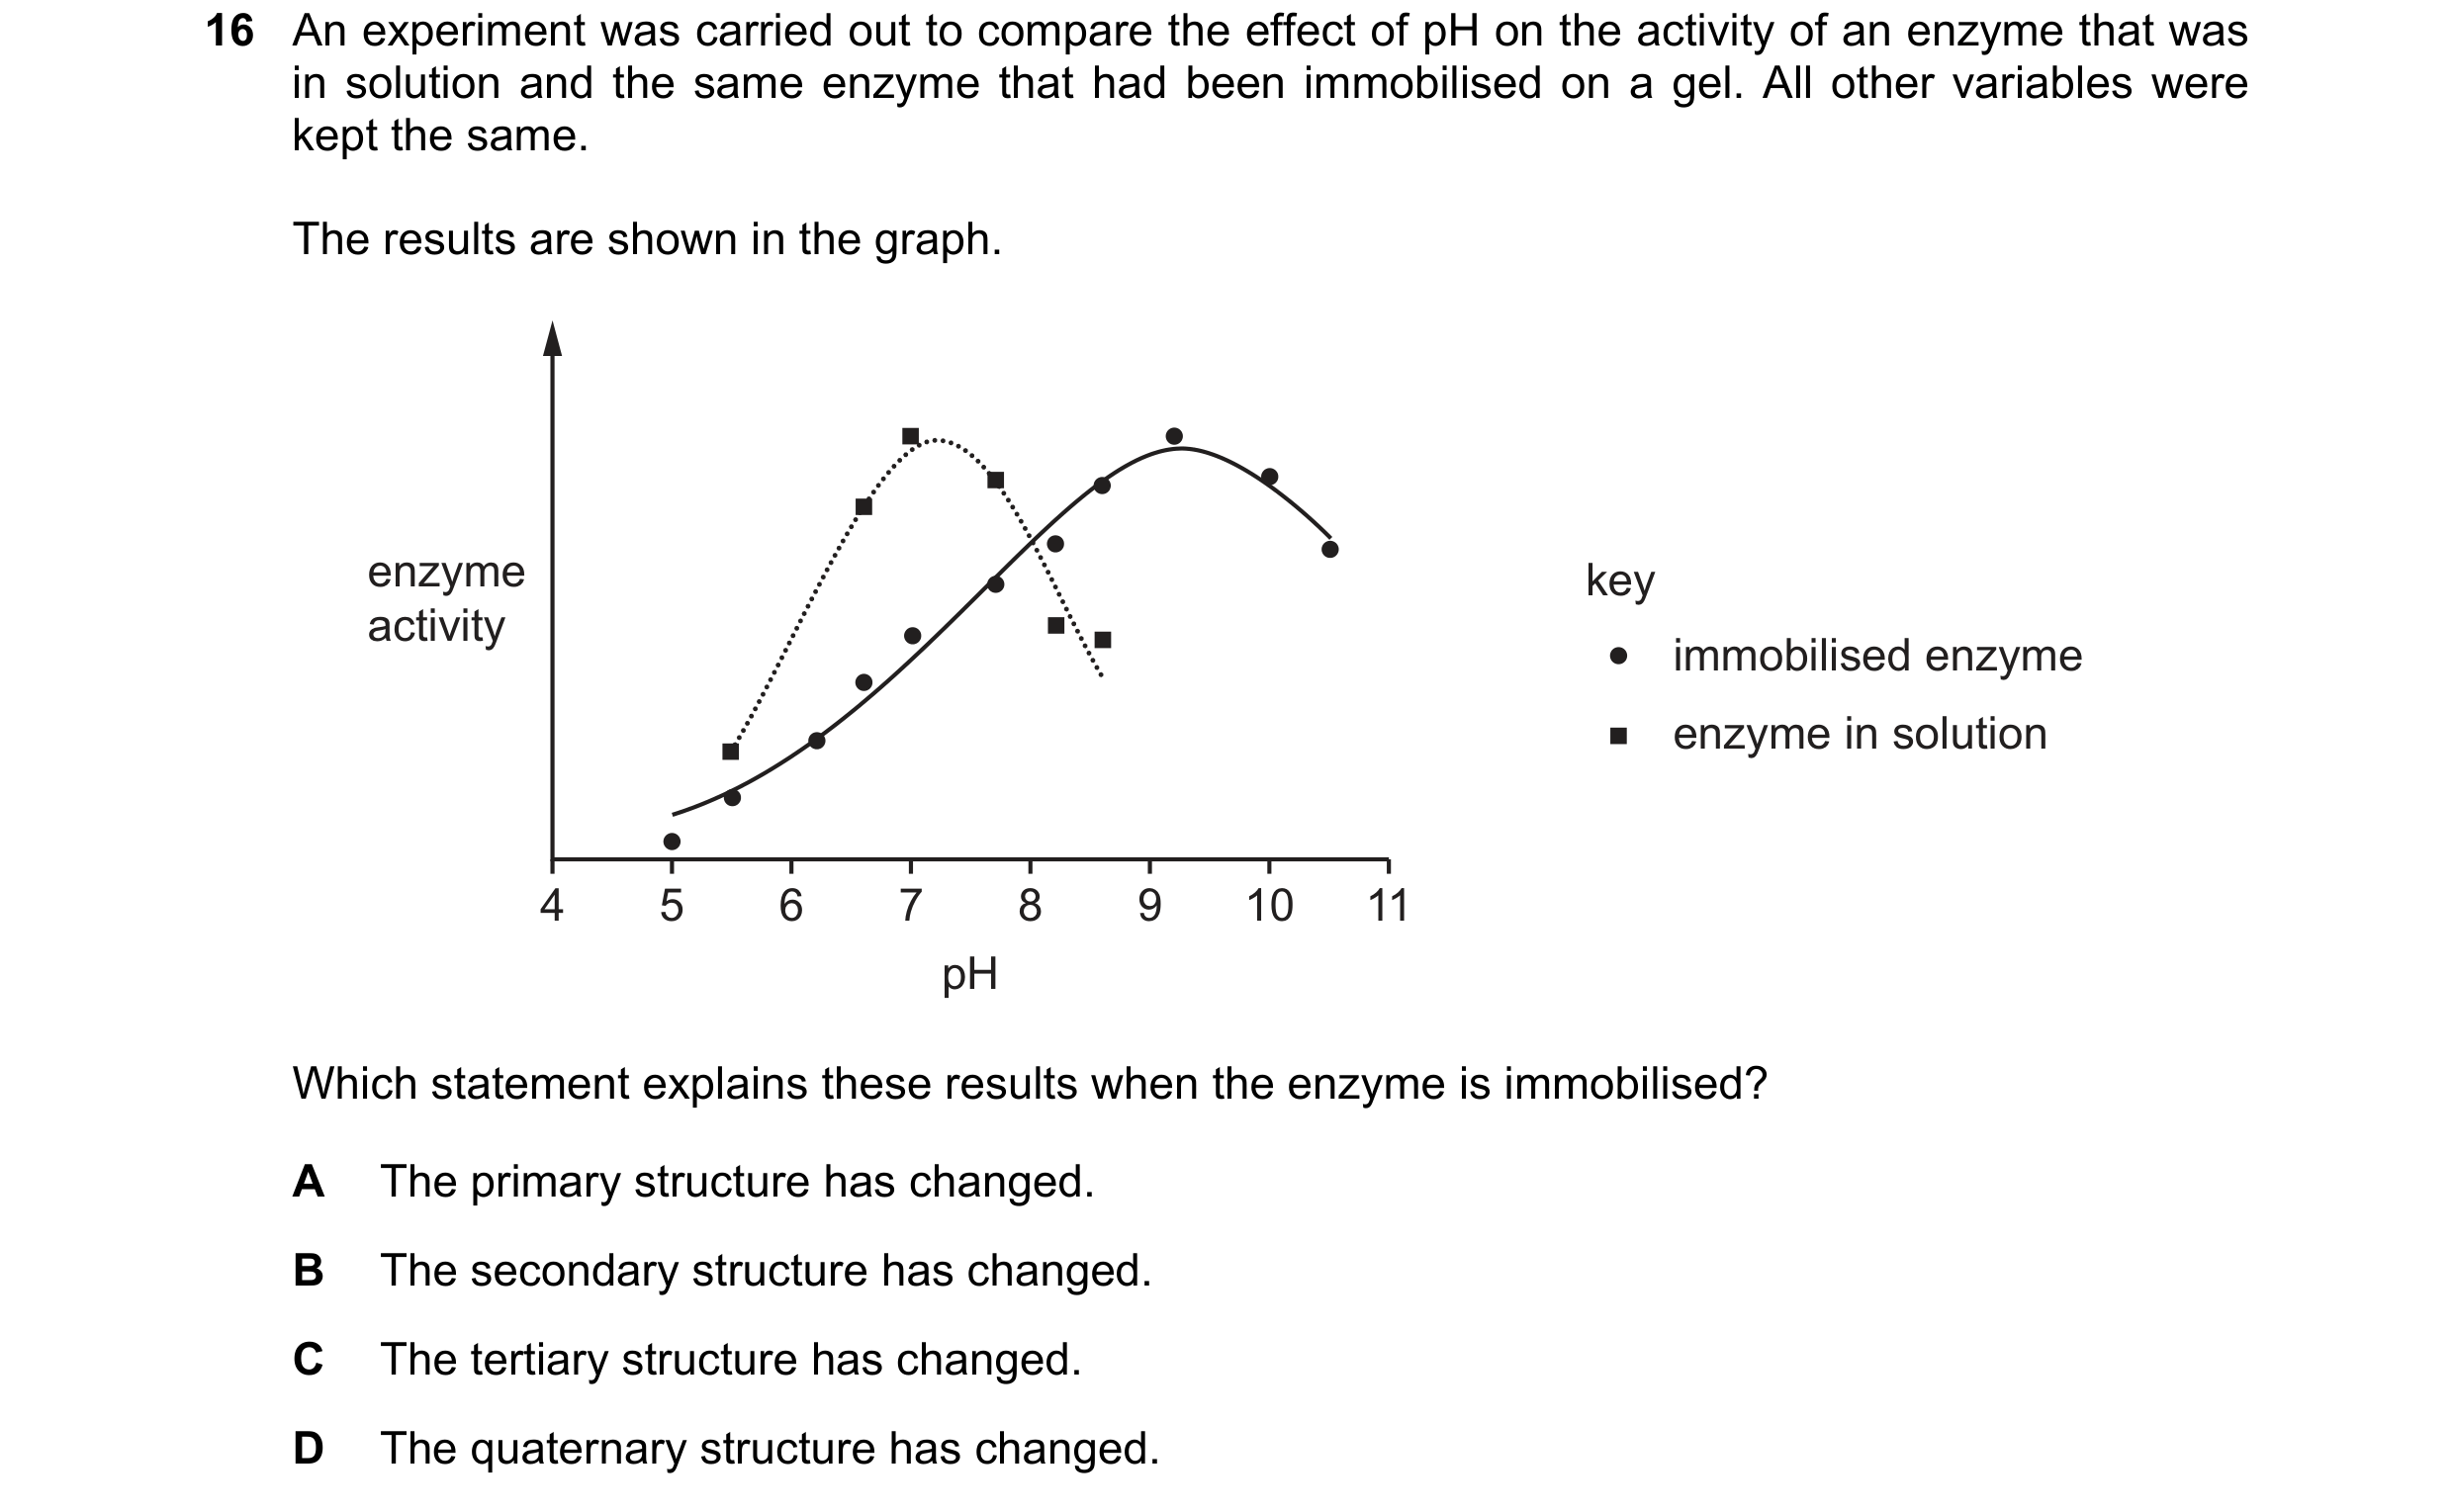
 45 / 76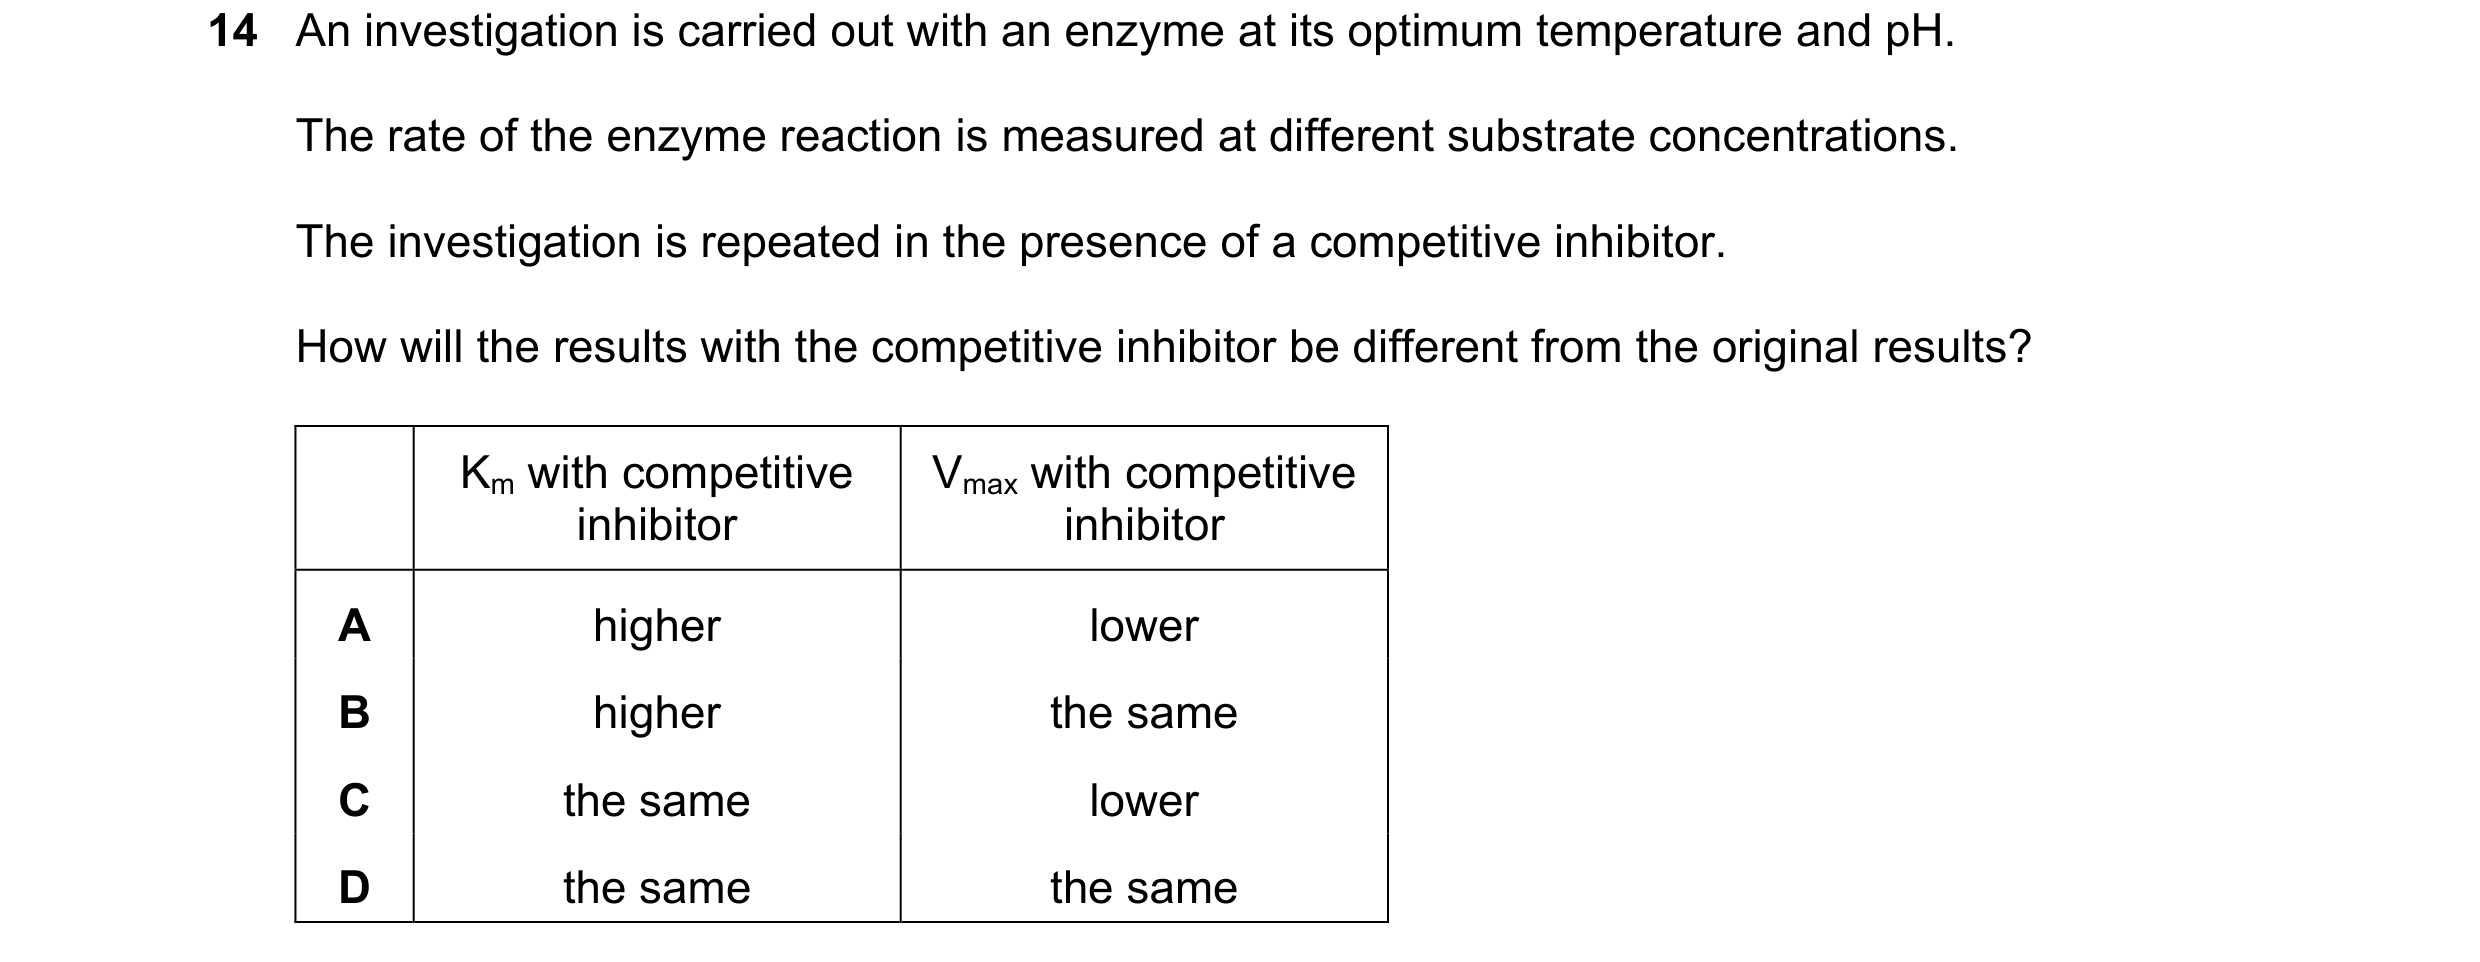
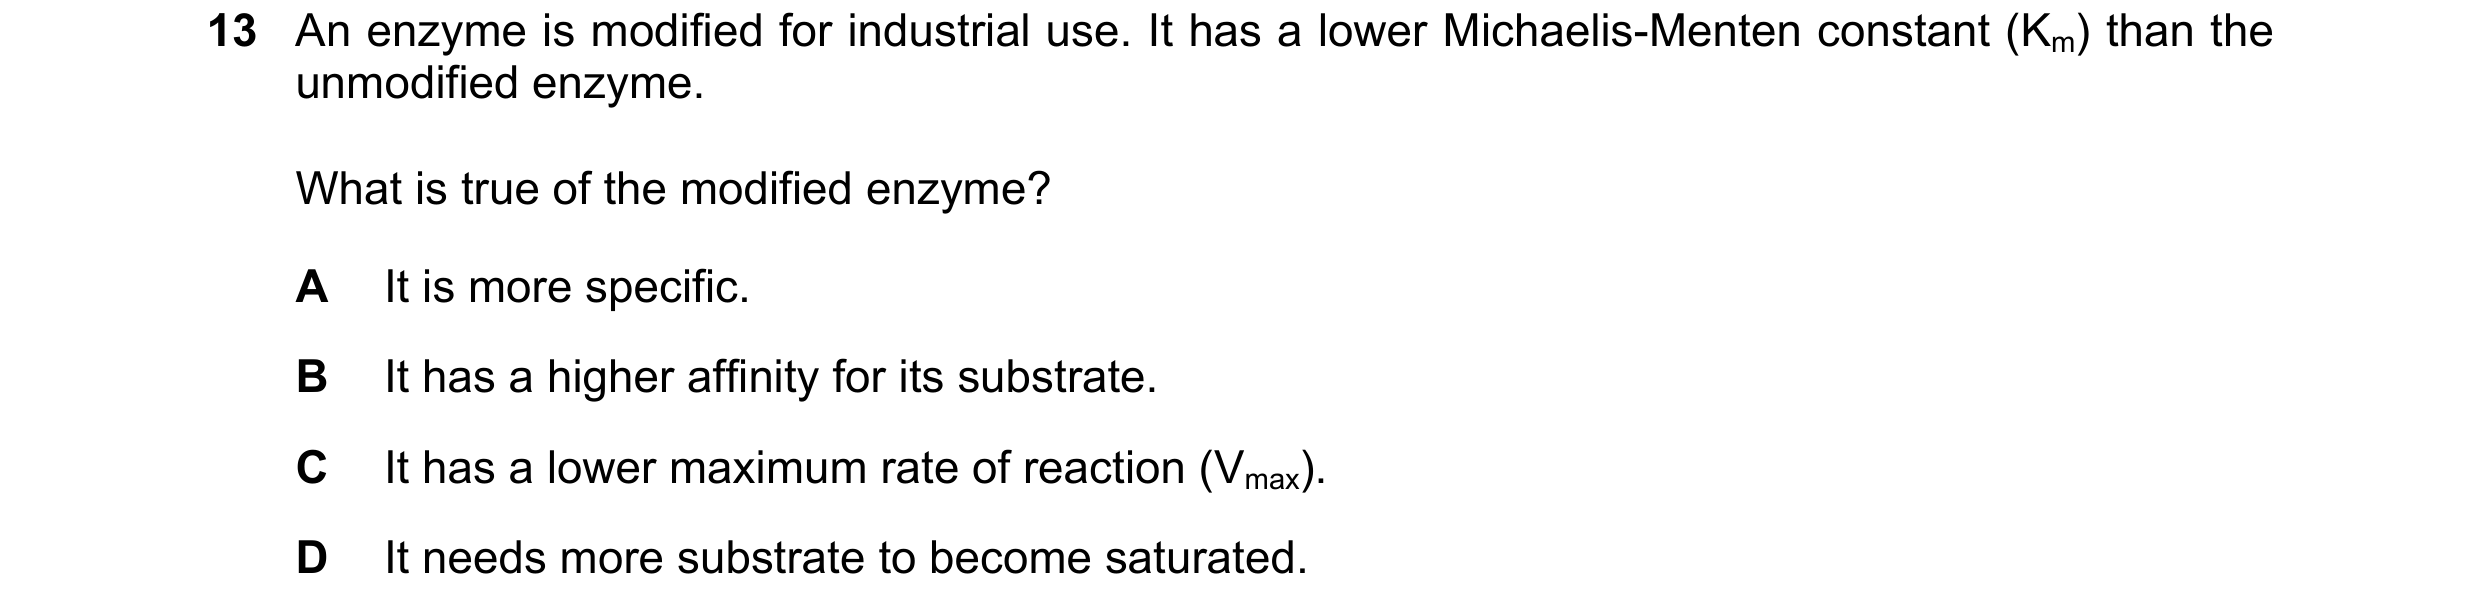
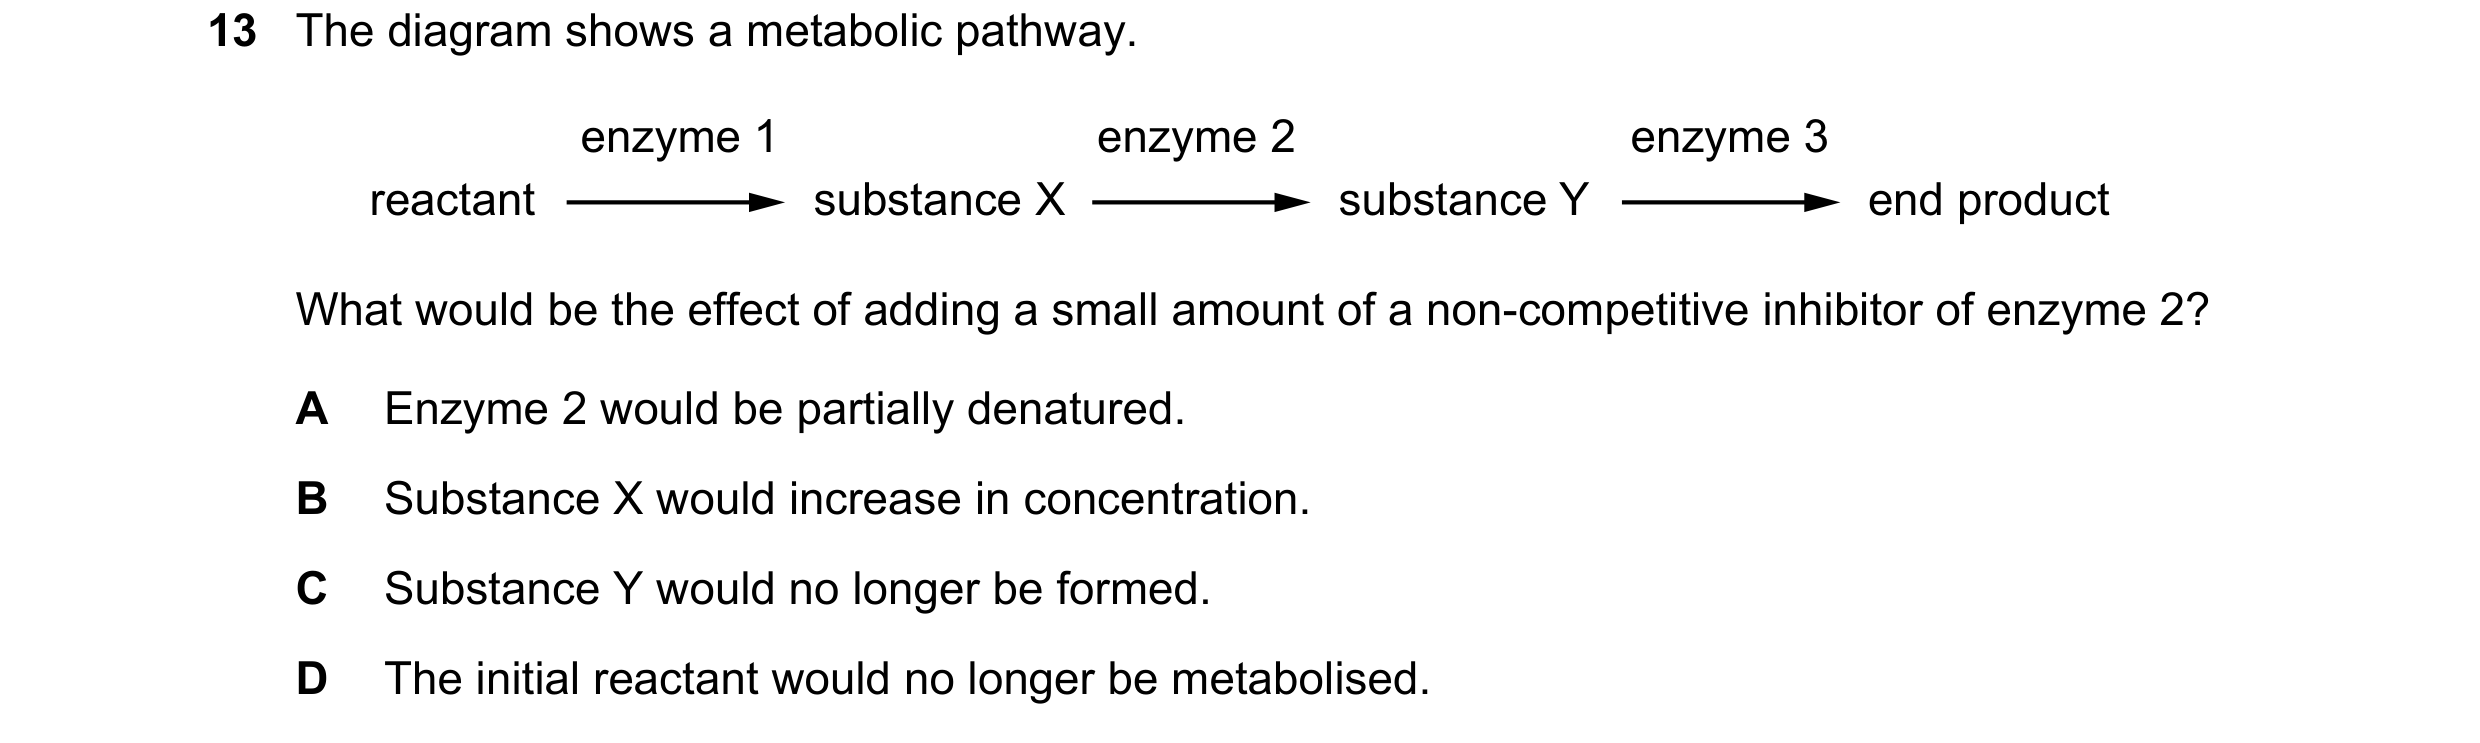
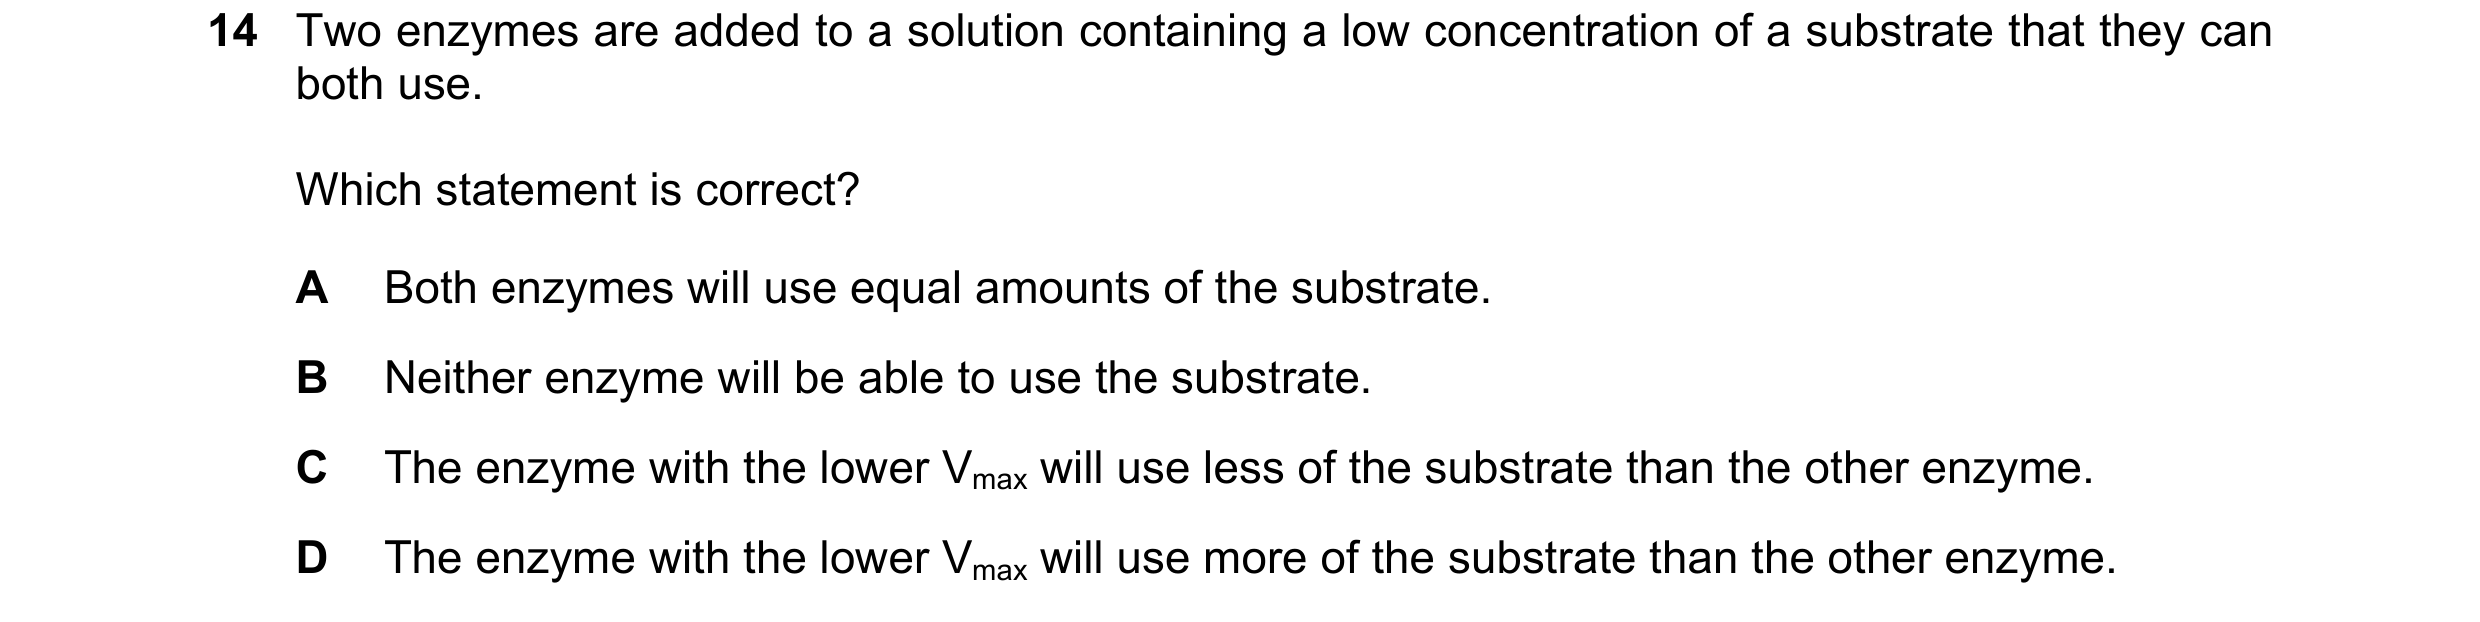 46 / 76
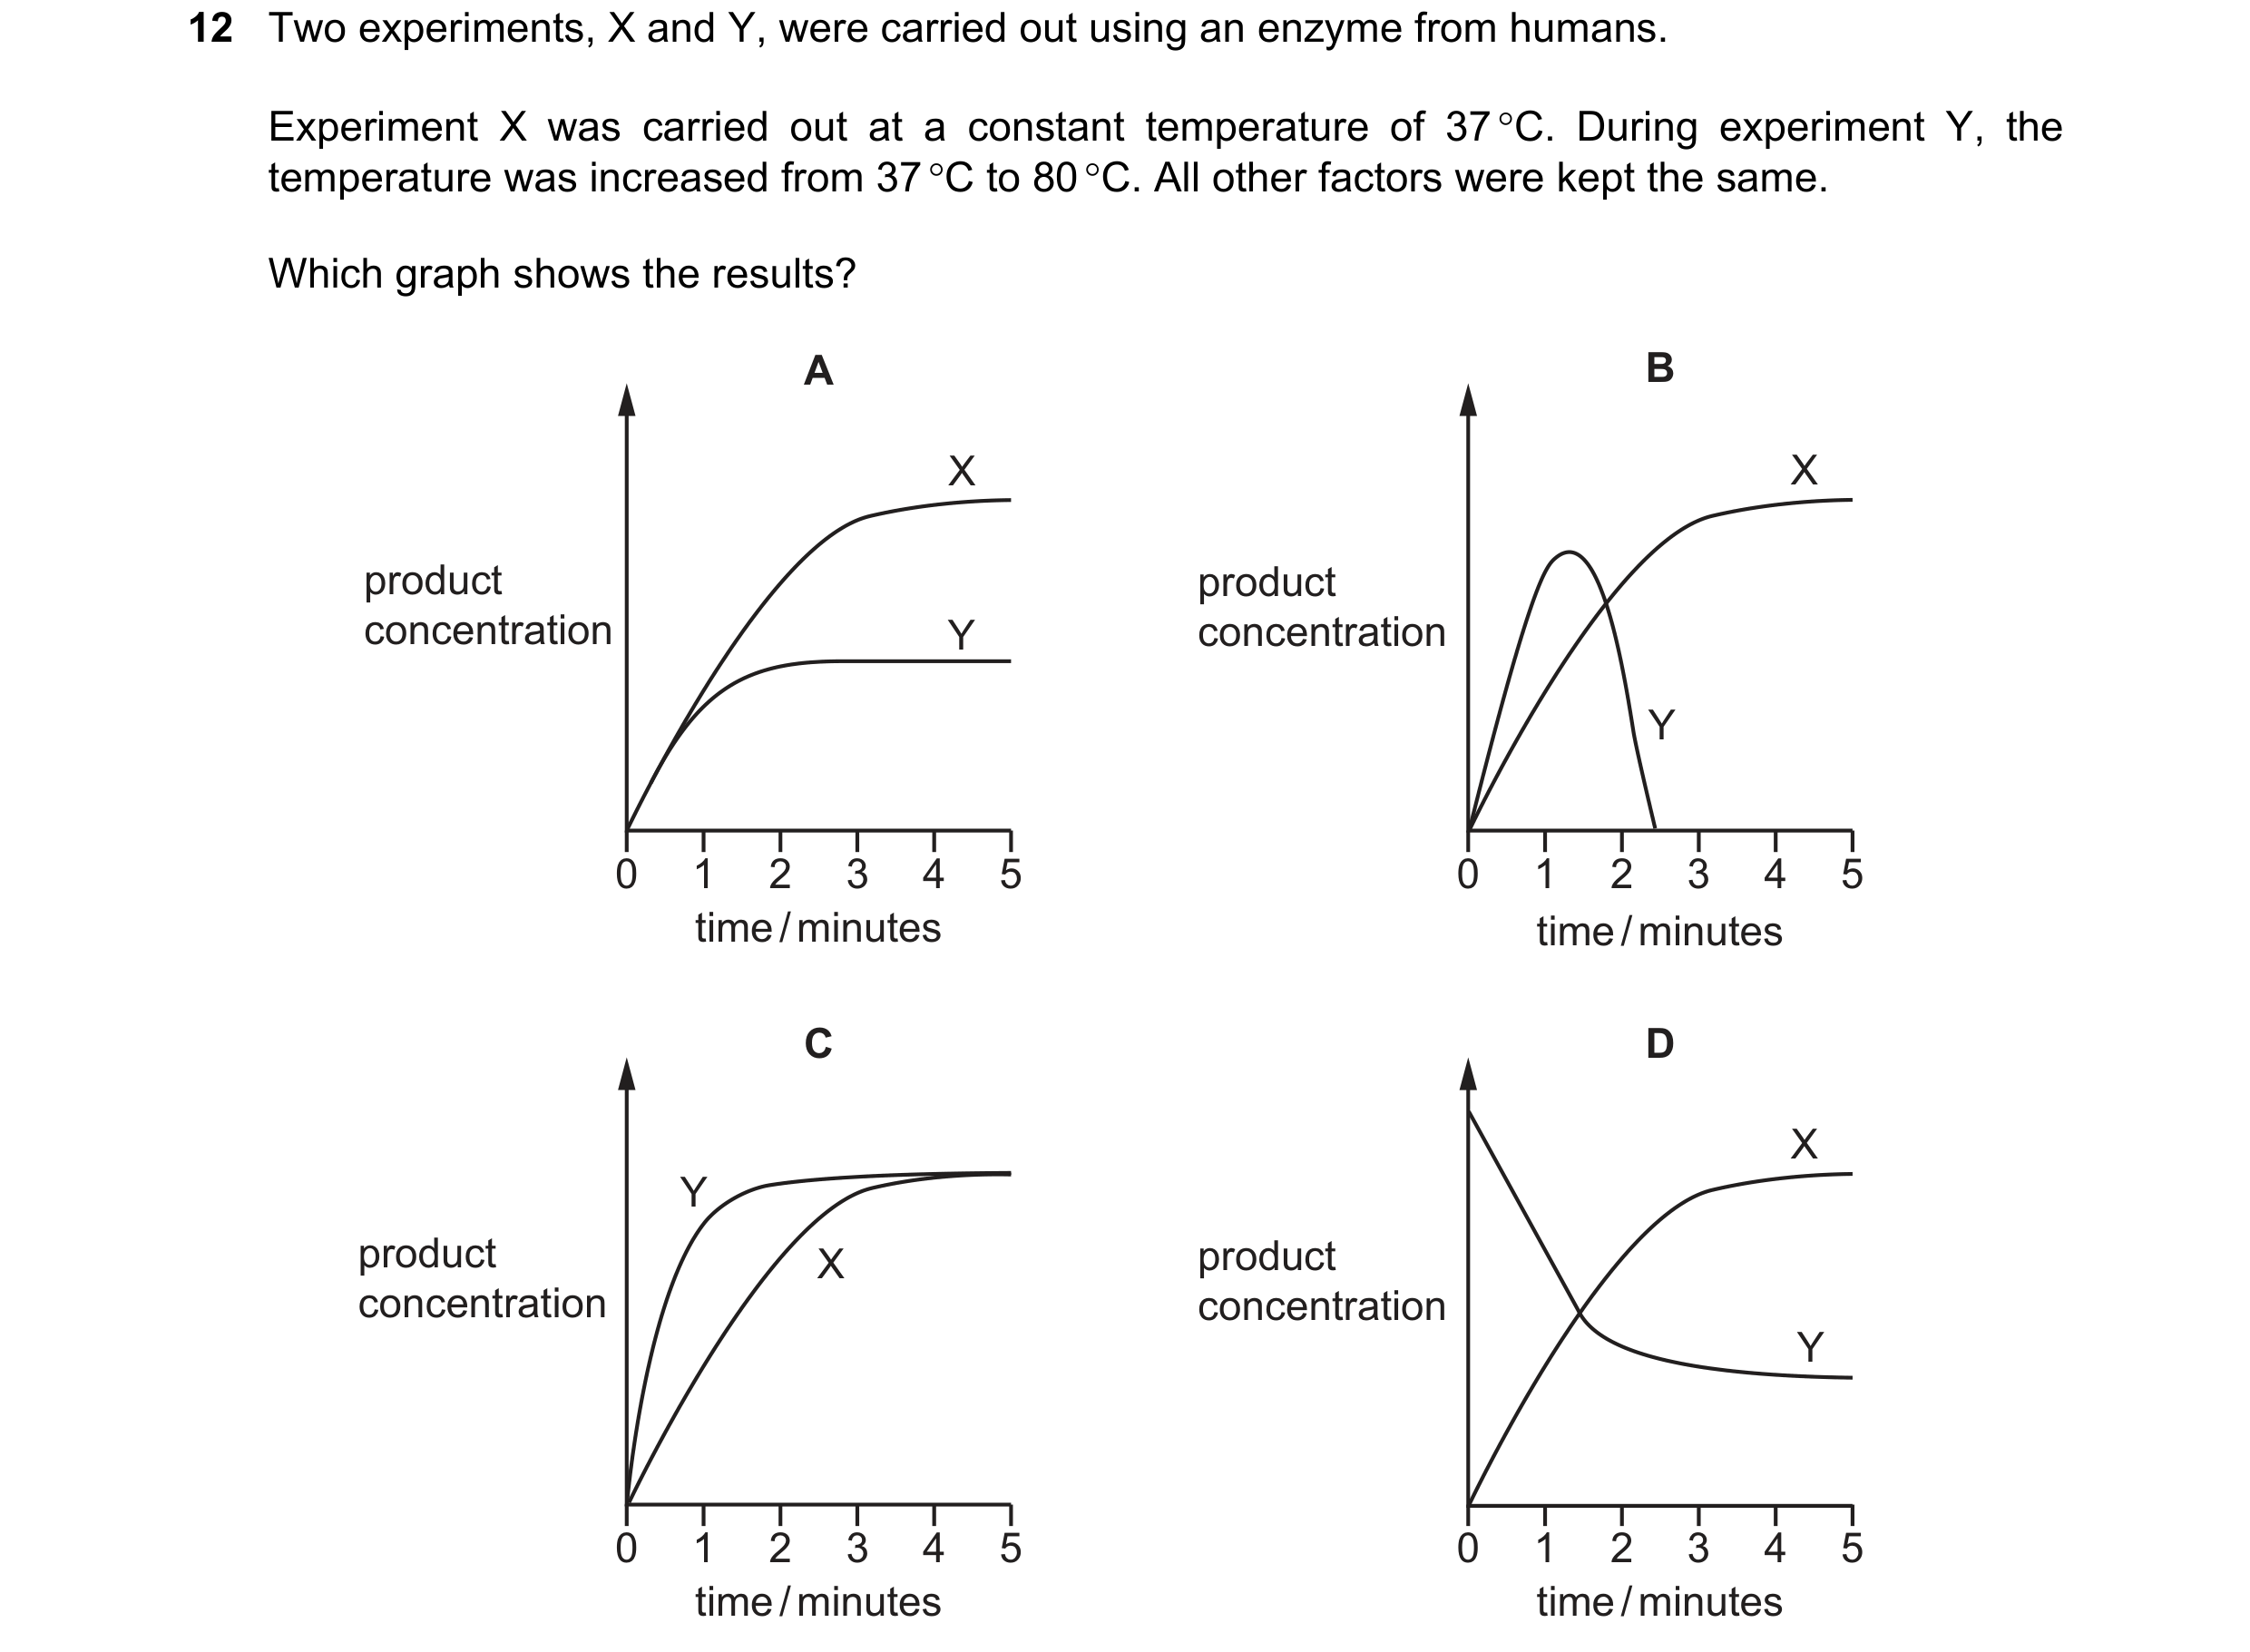
 47 / 76
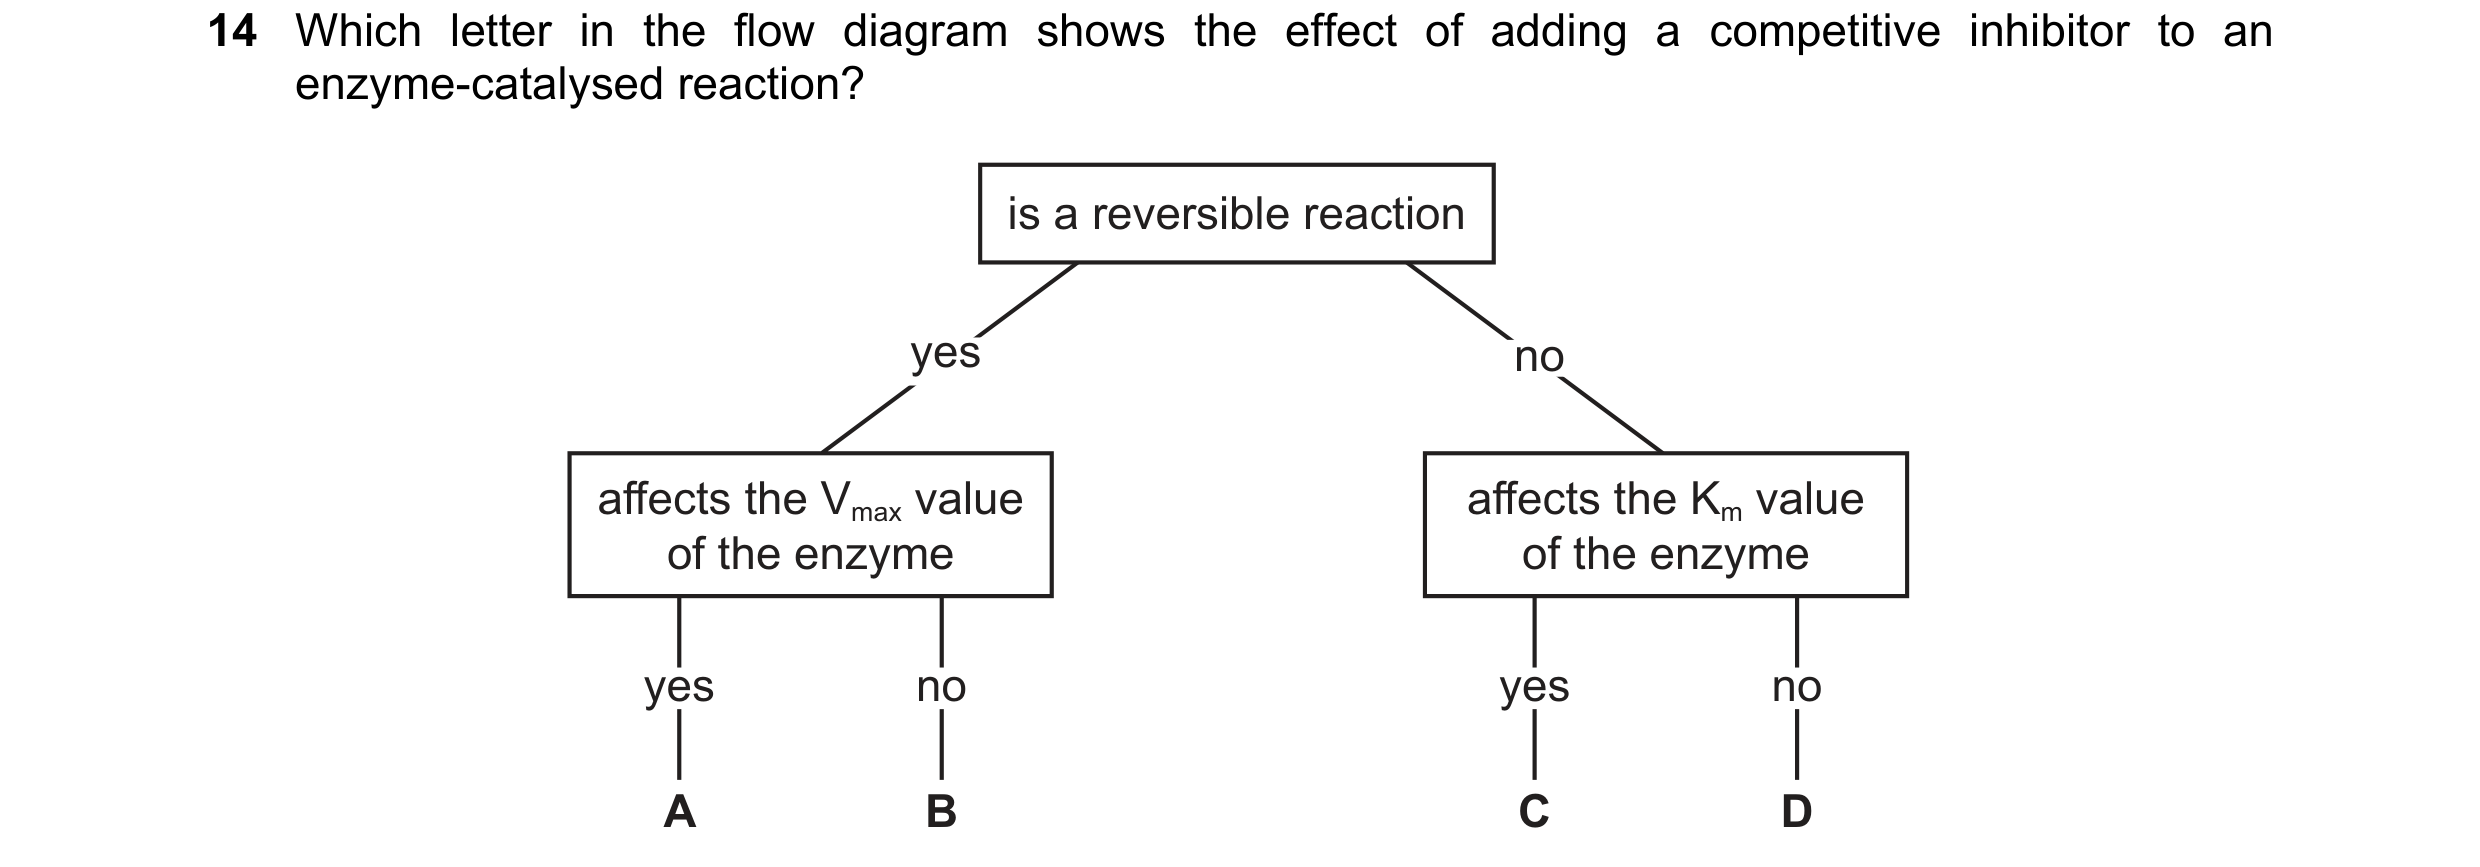
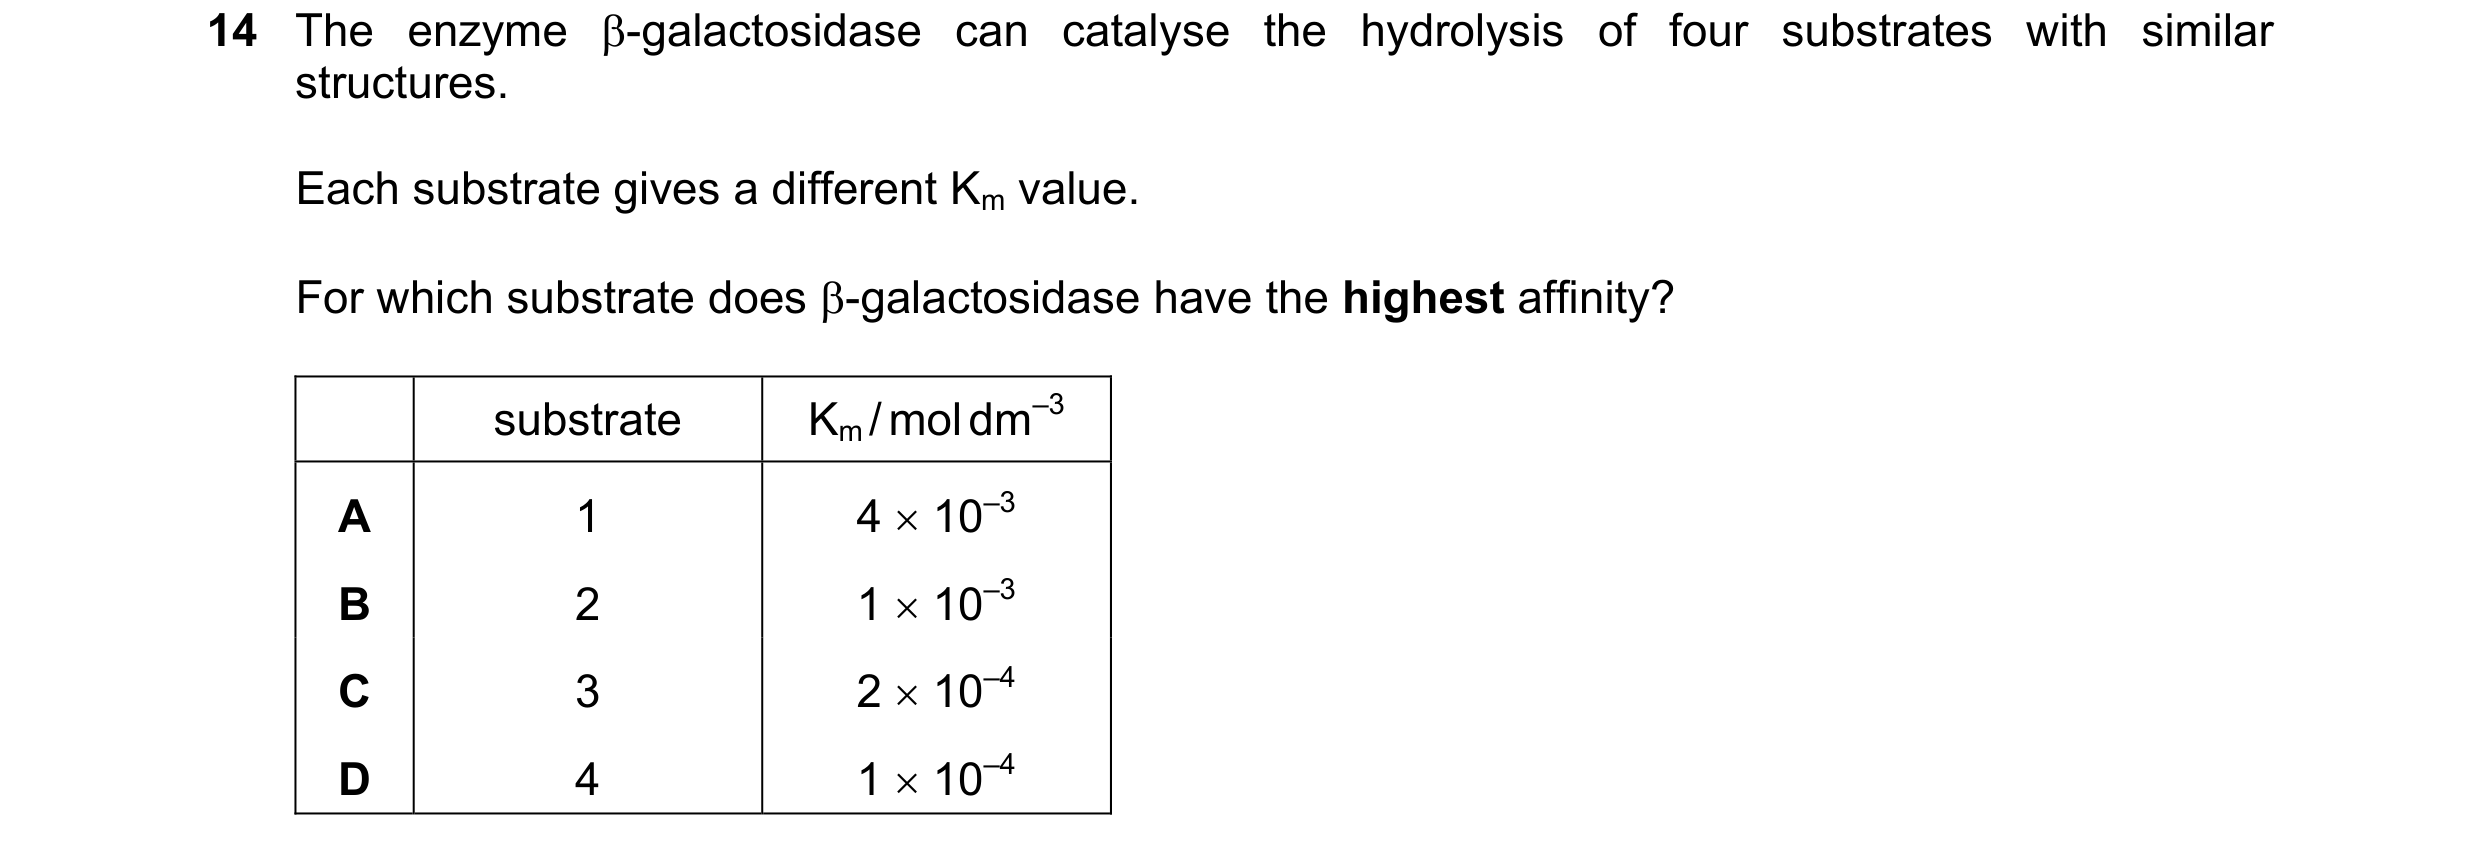 48 / 76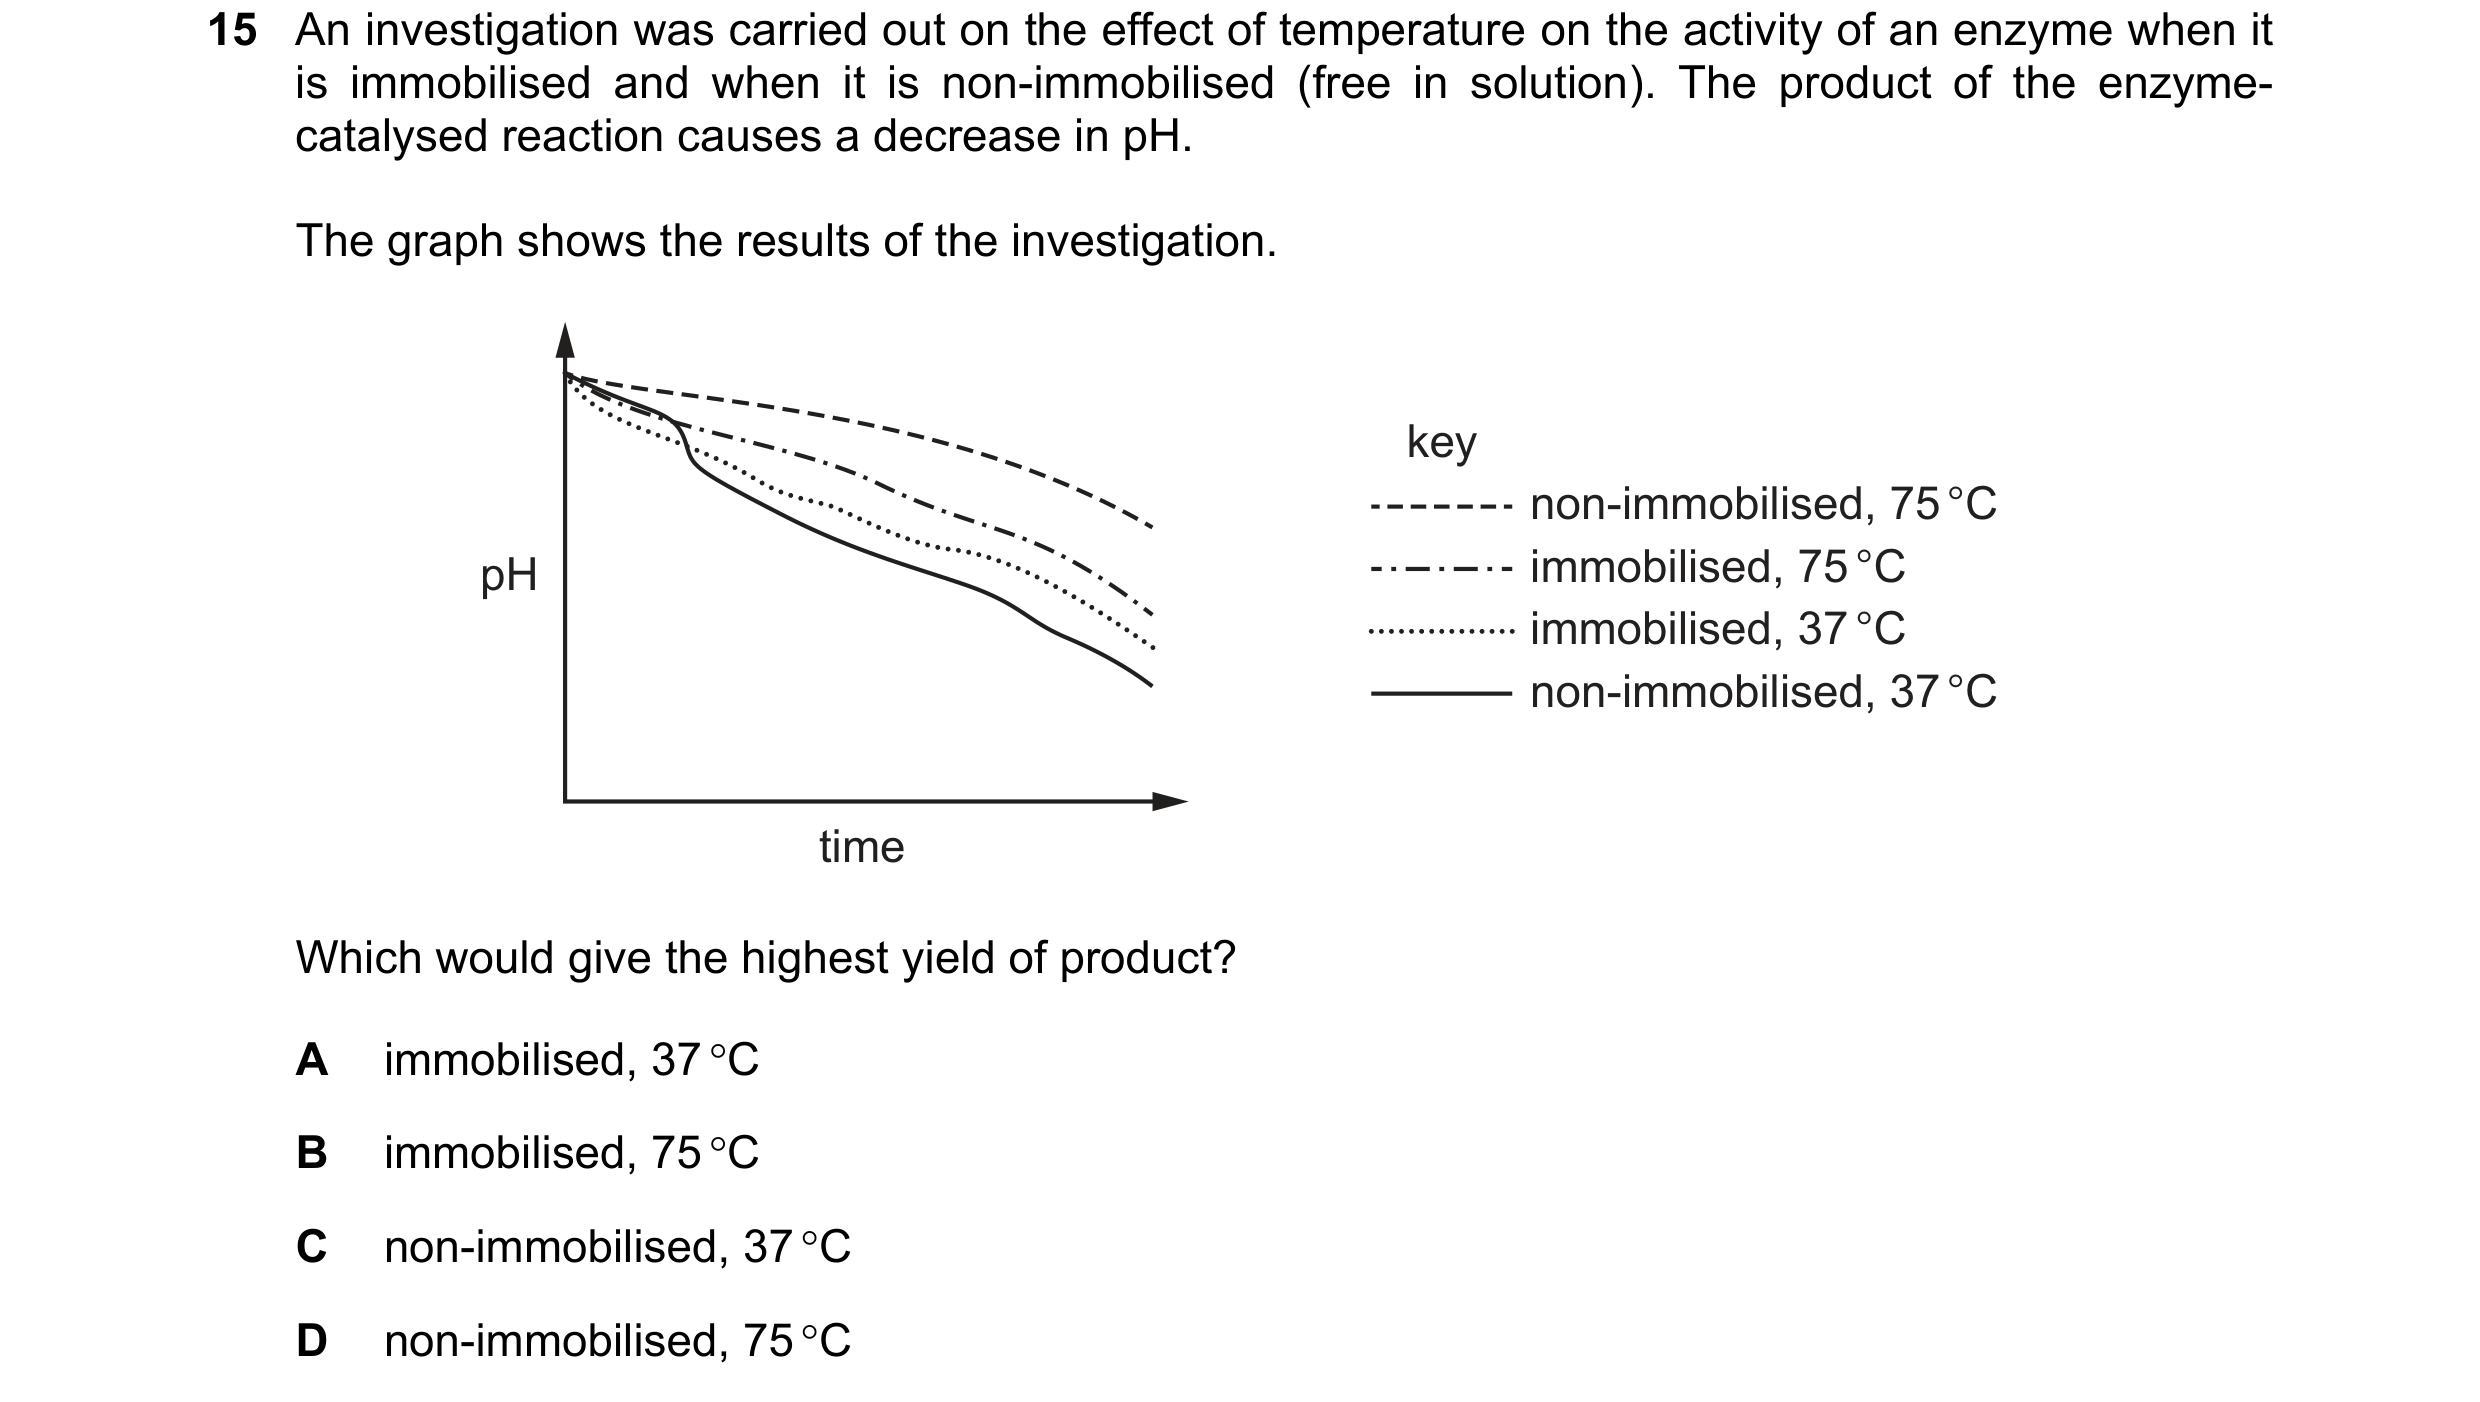
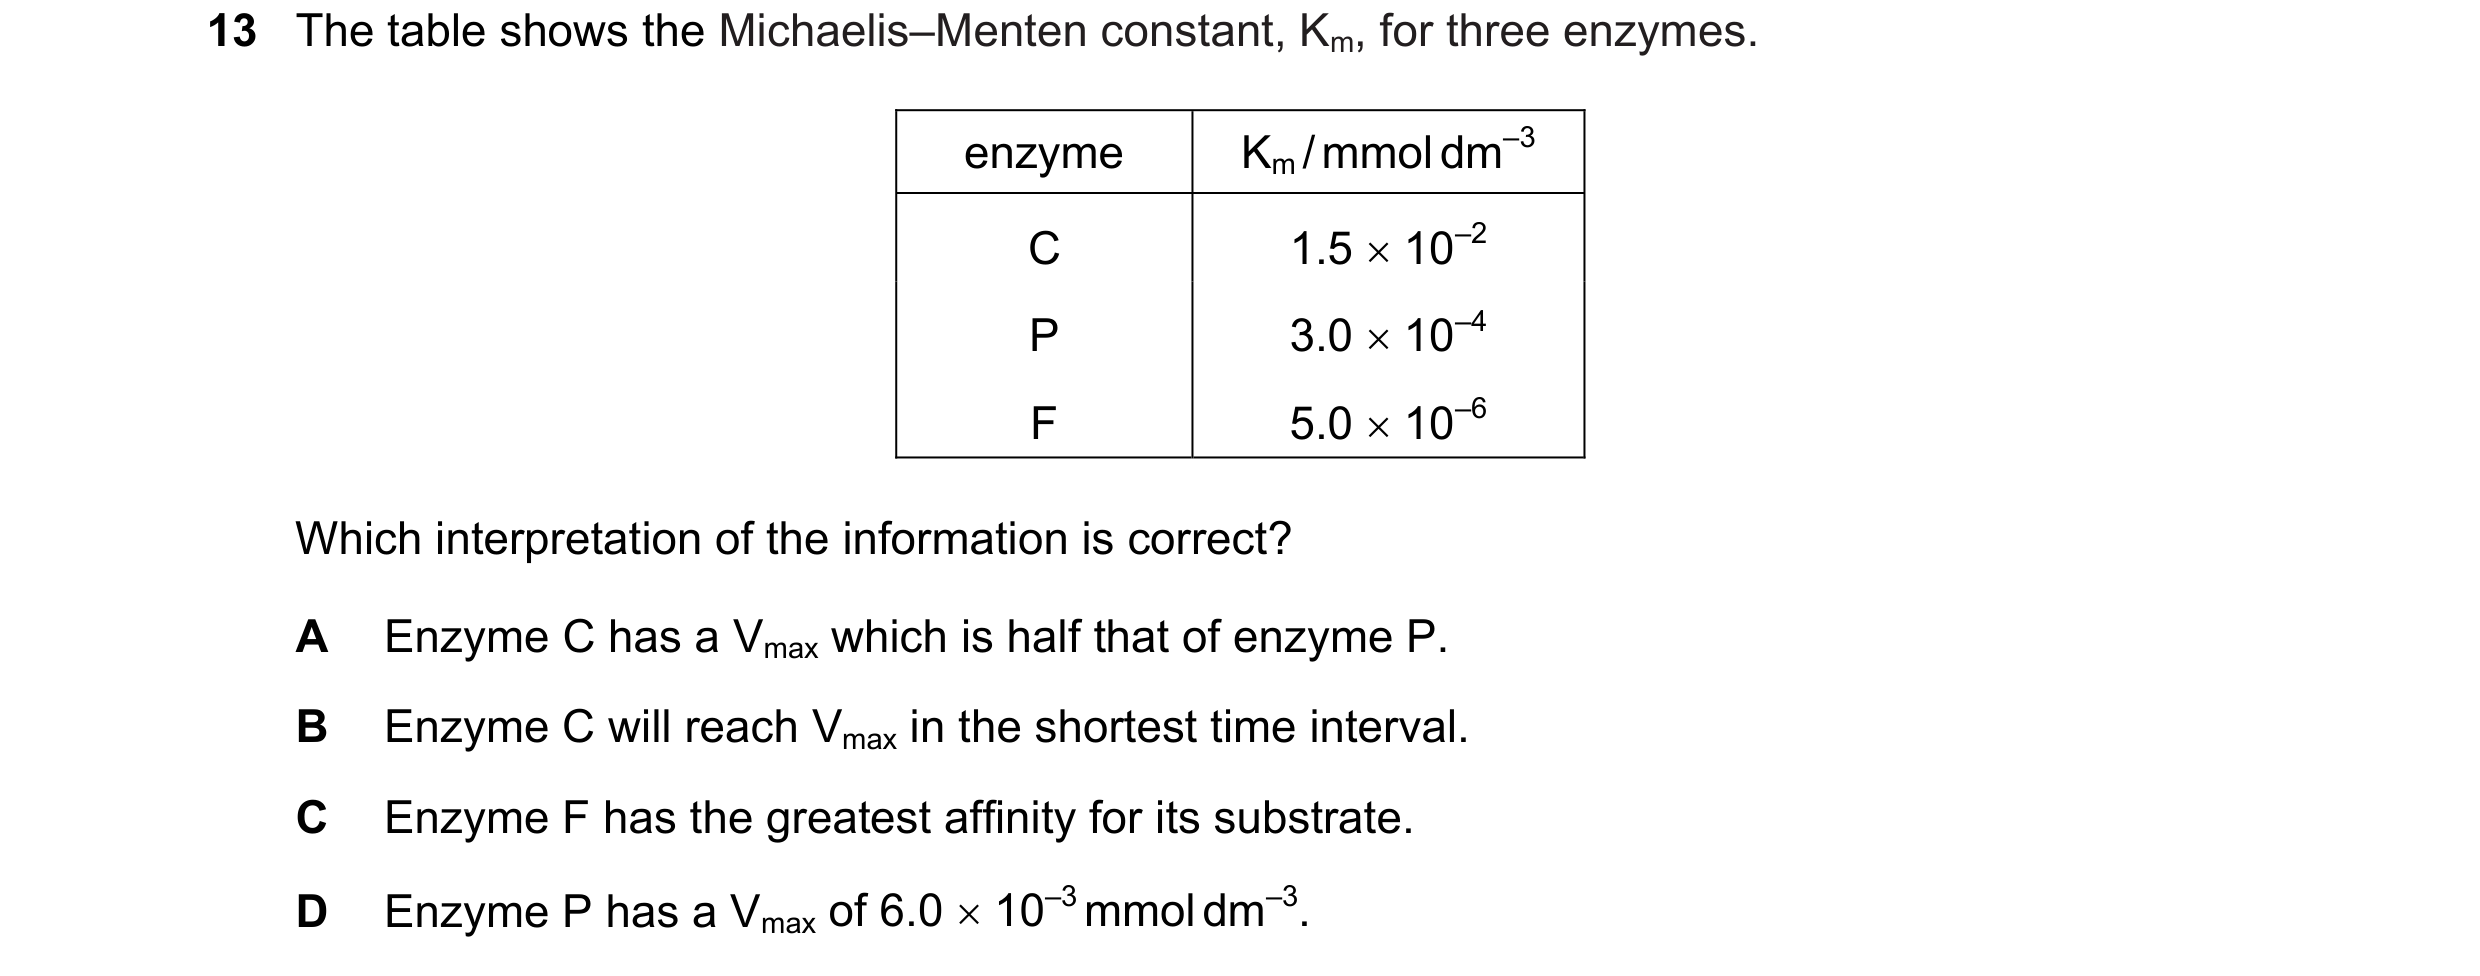 49 / 76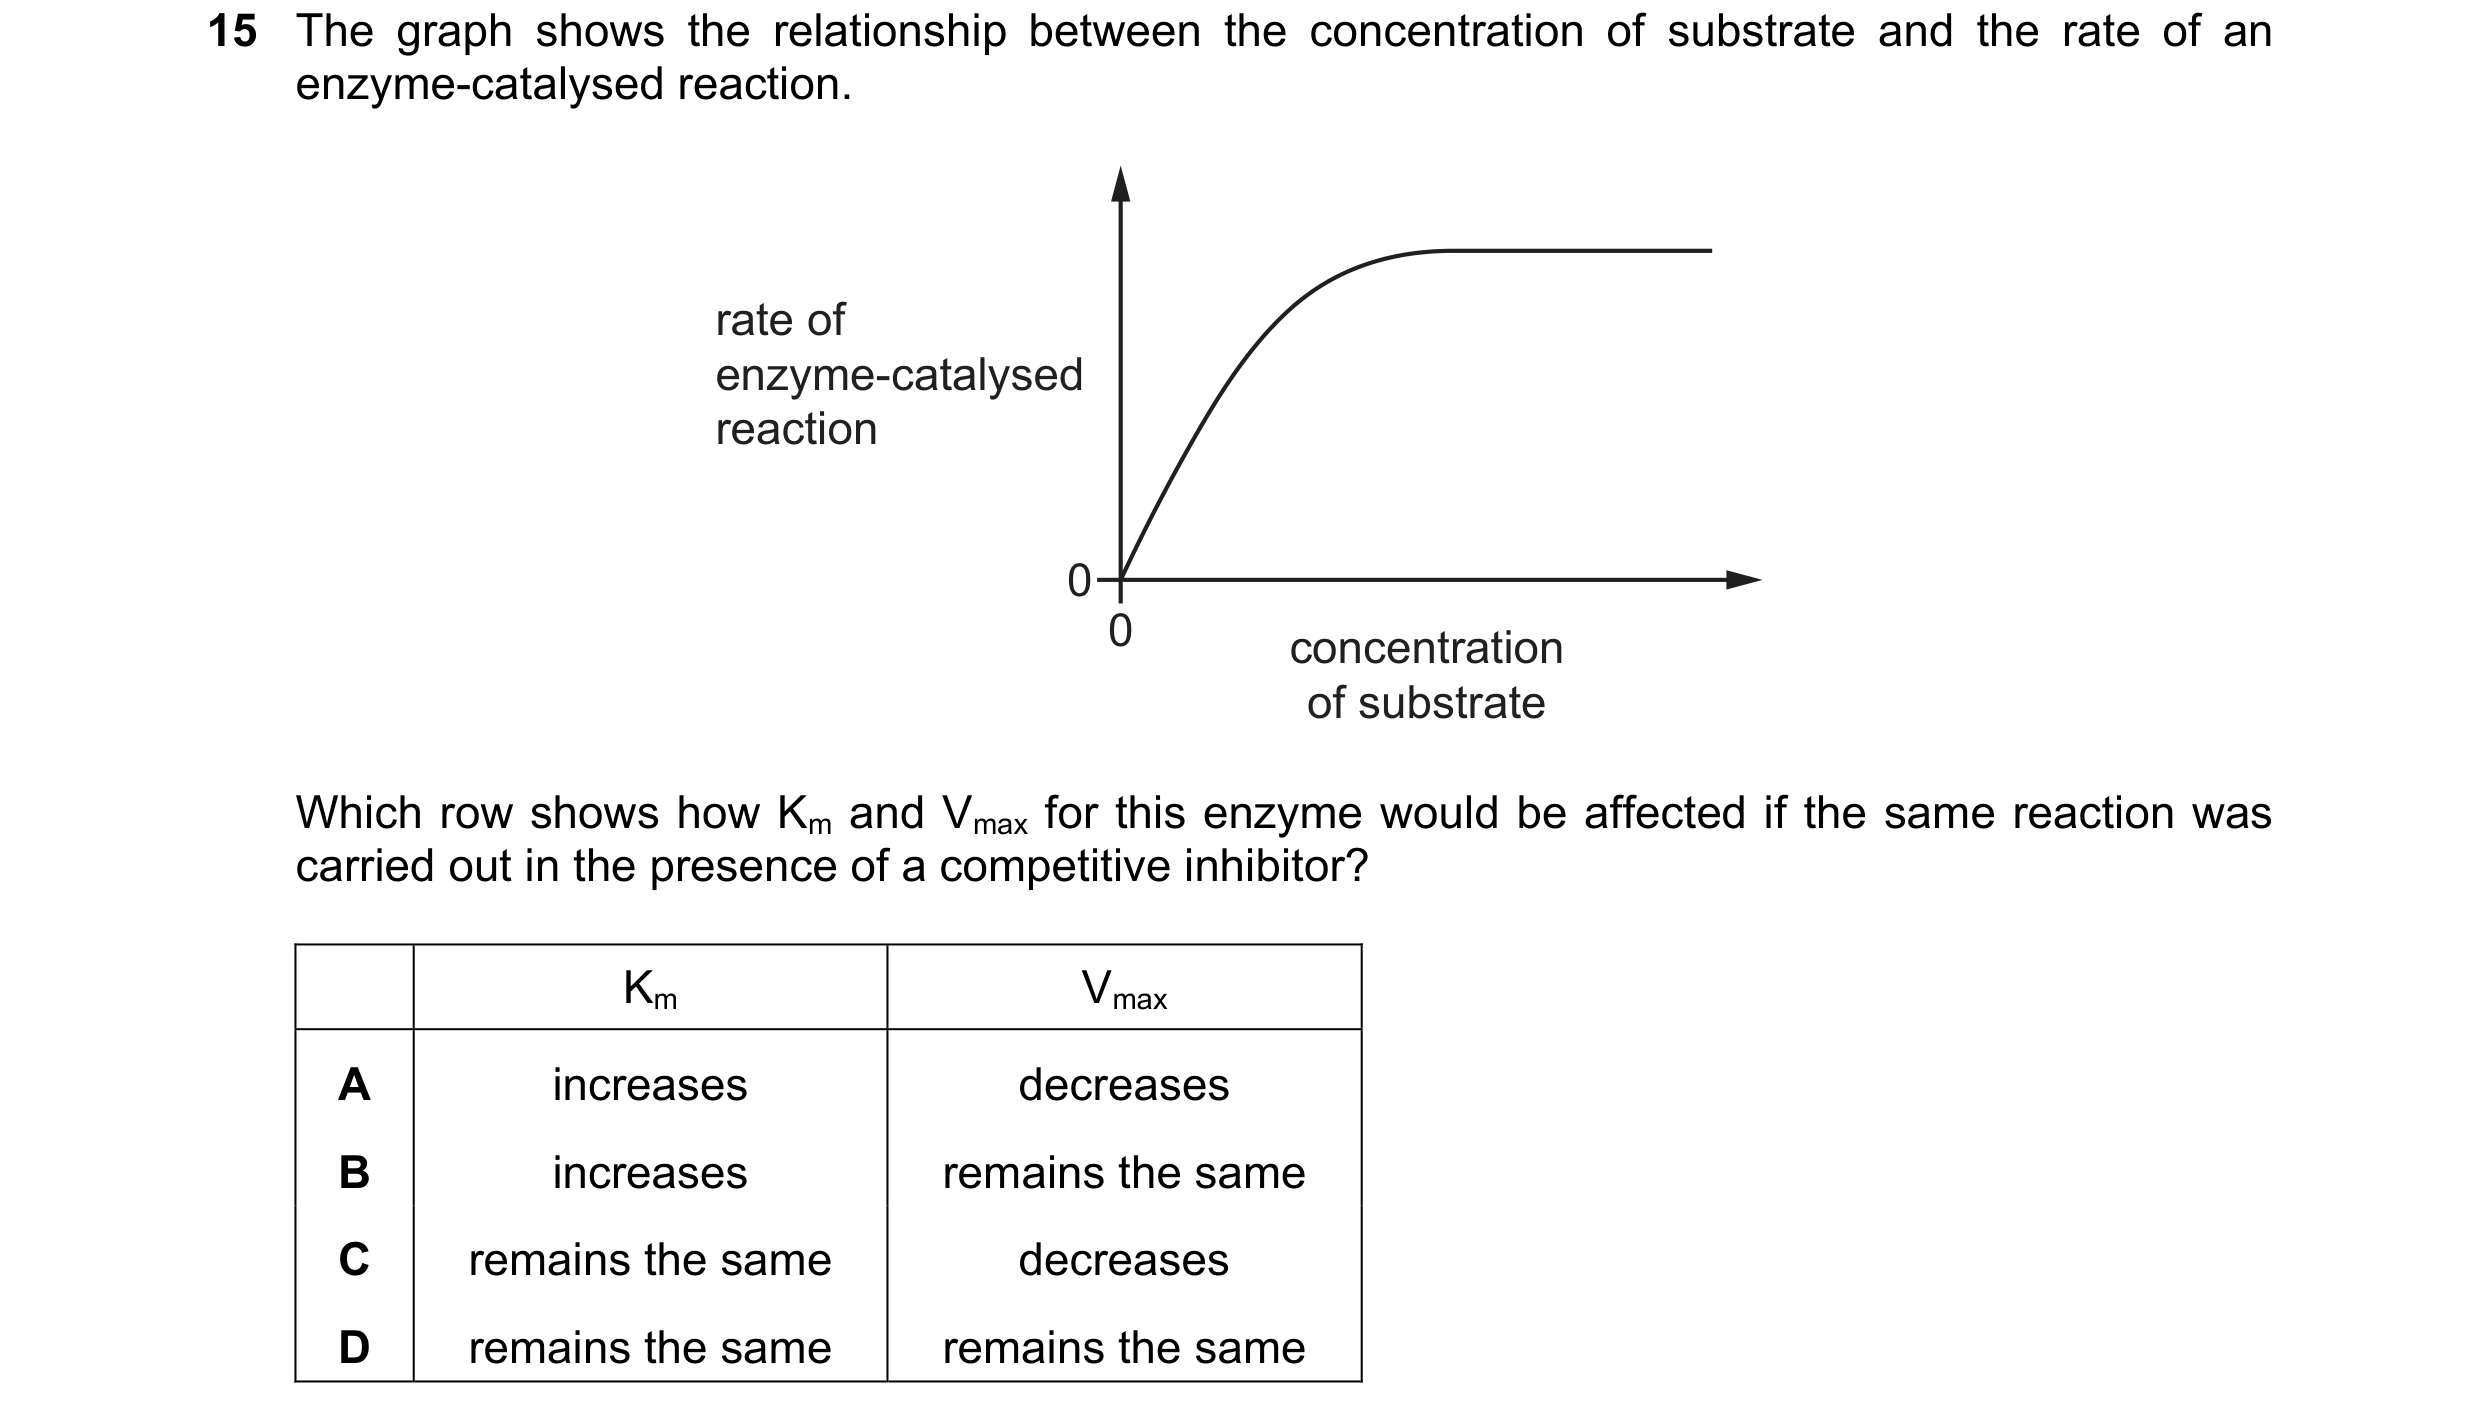
 50 / 76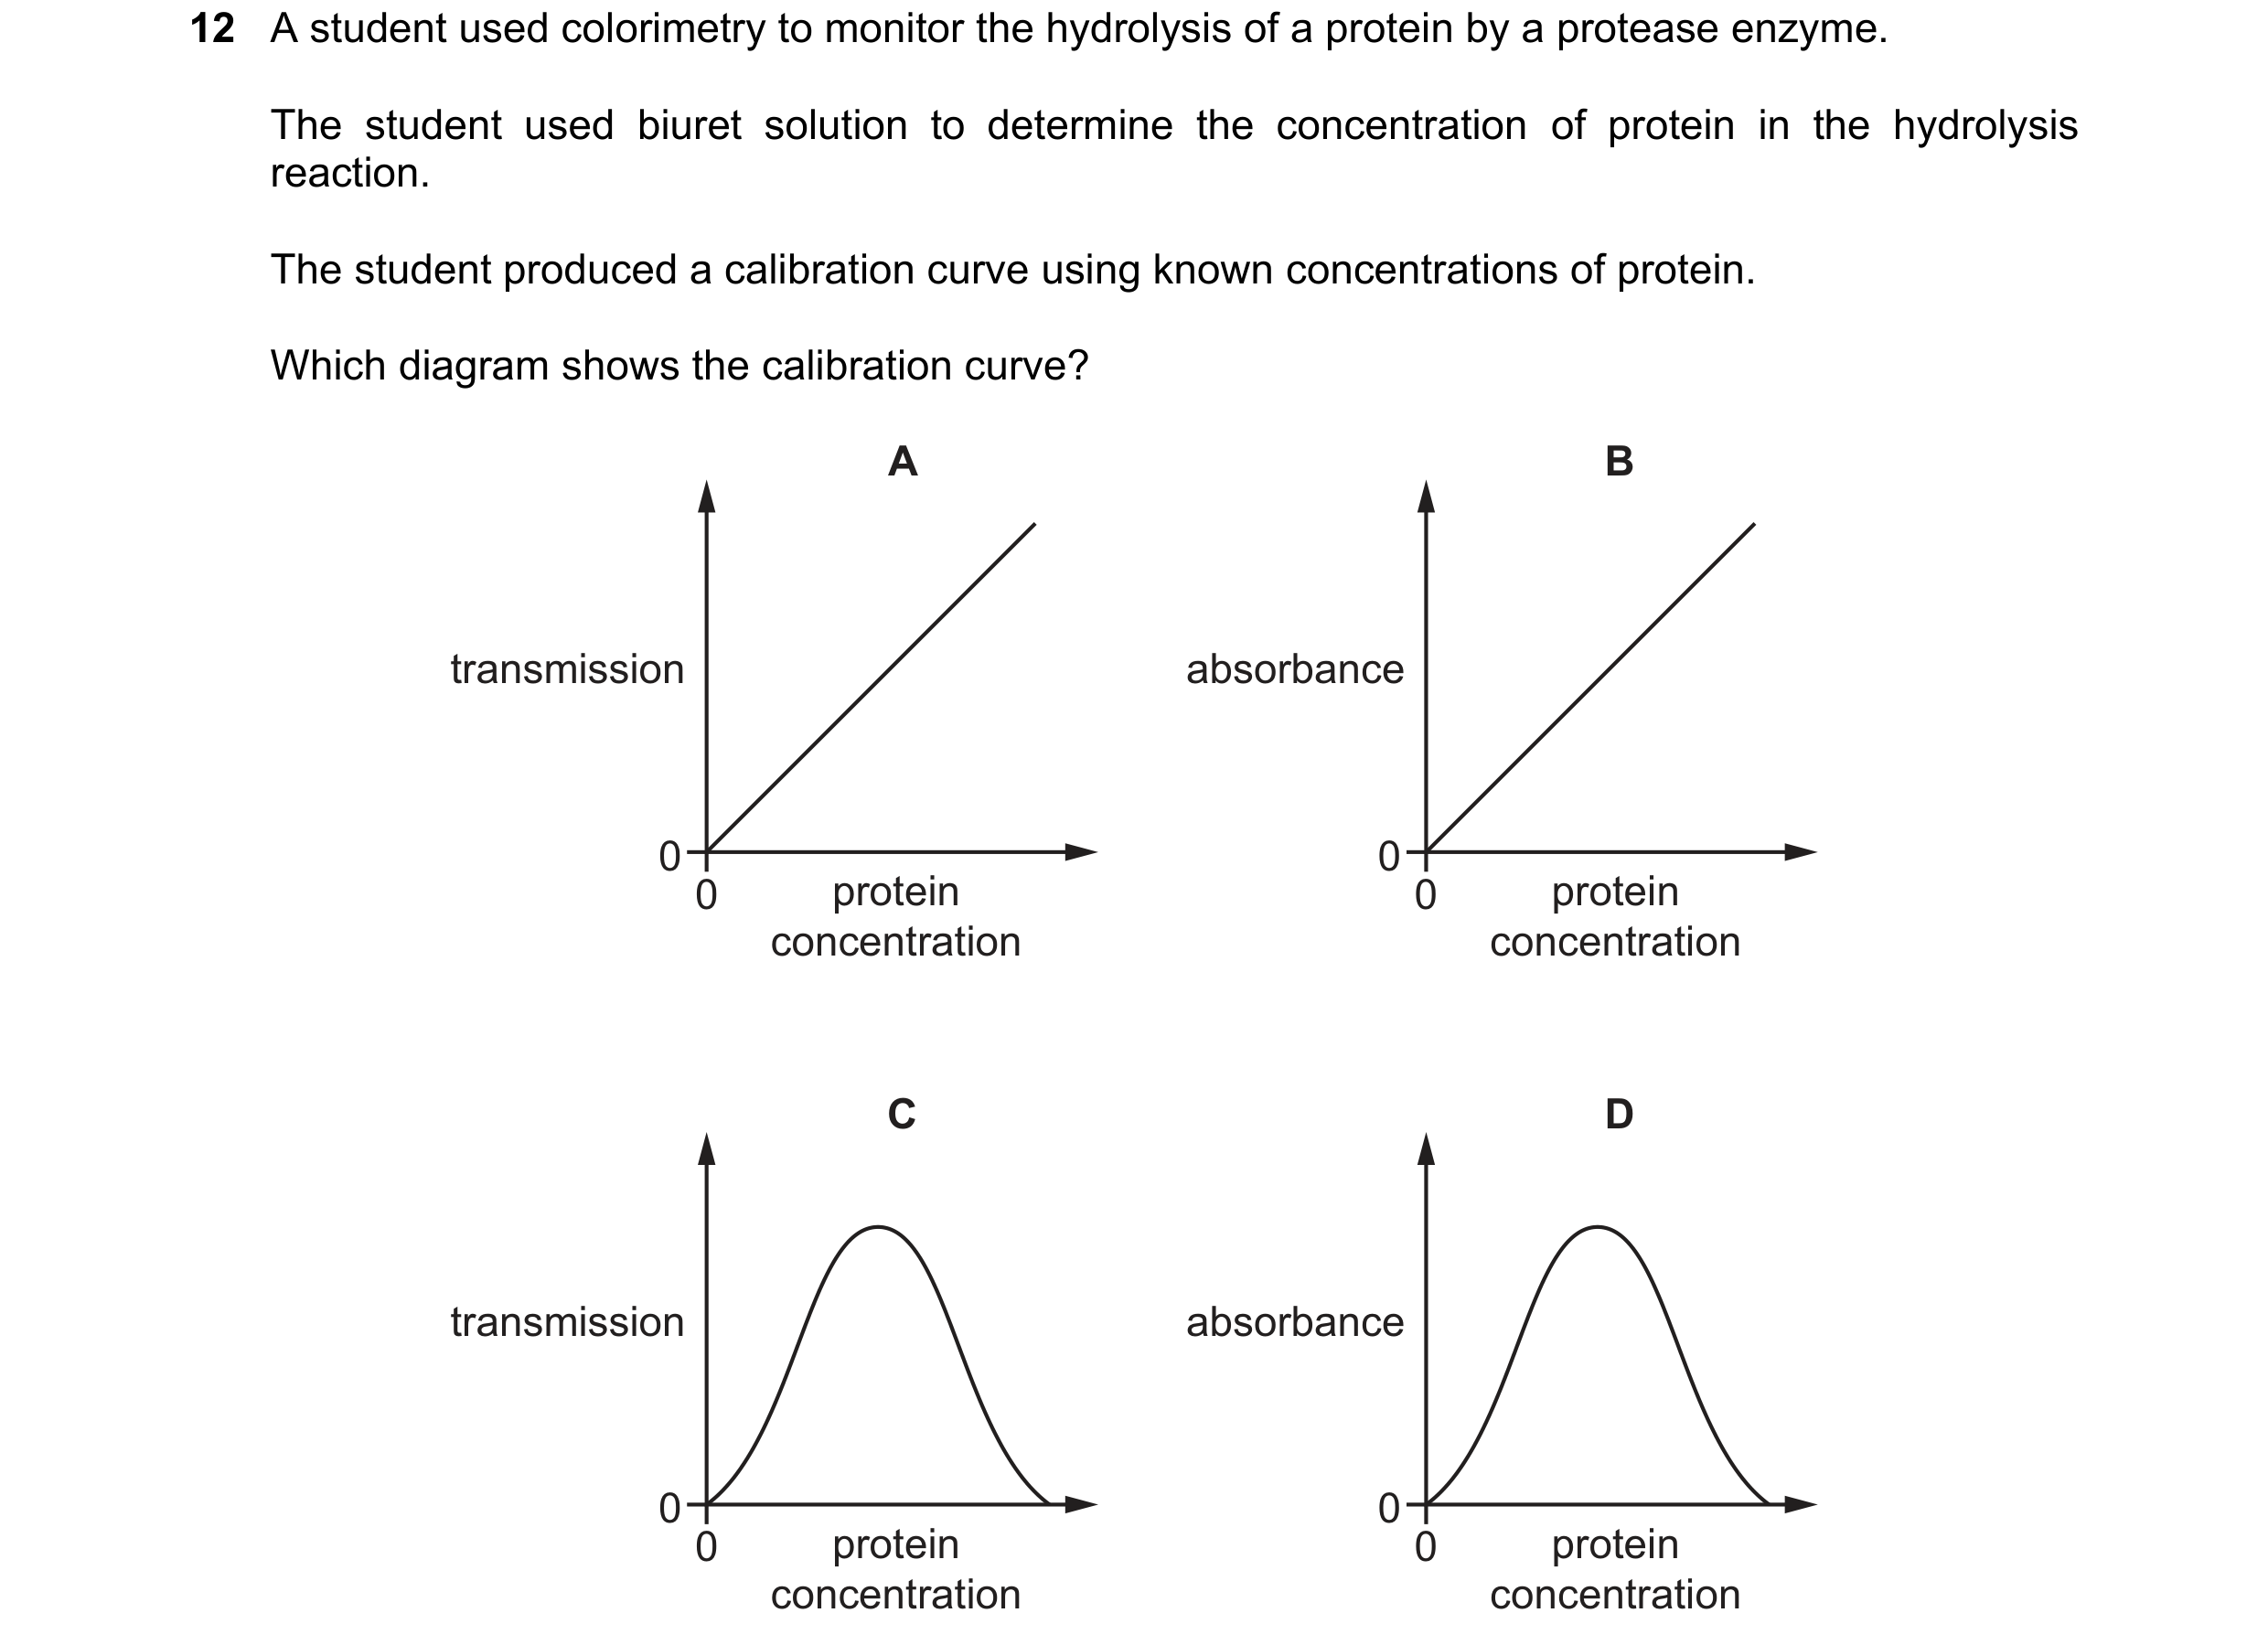
 51 / 76
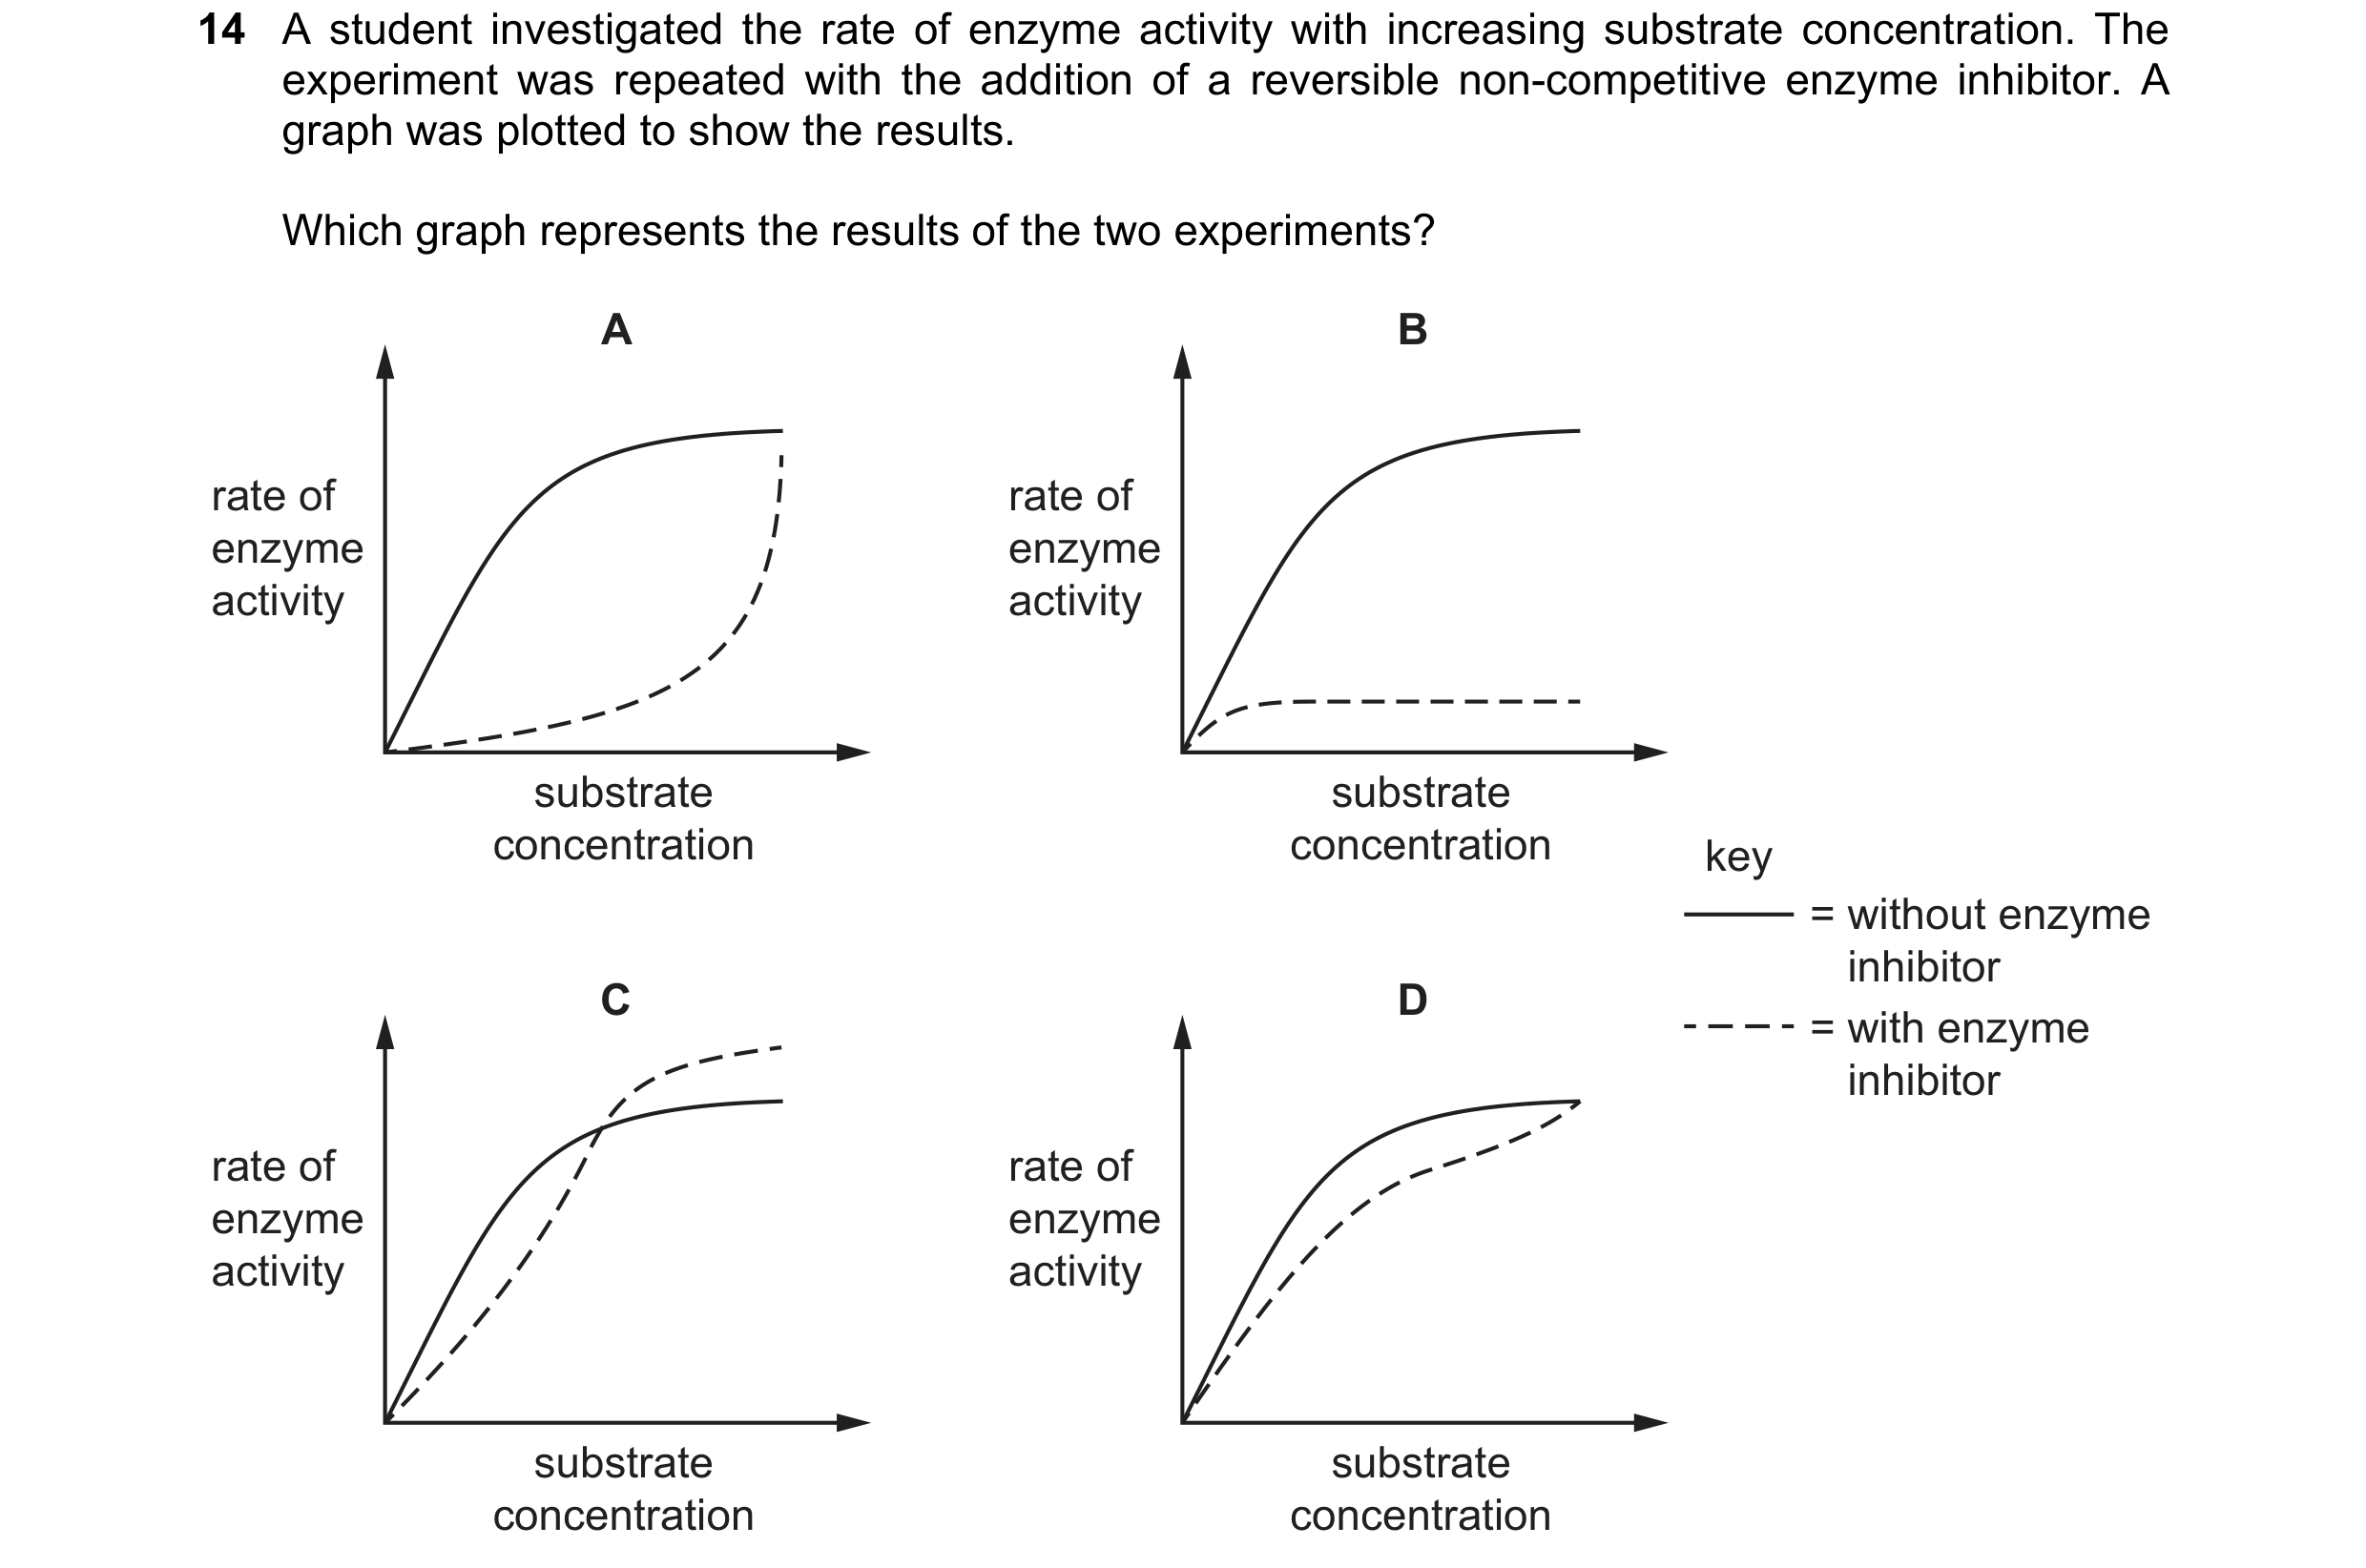 52 / 76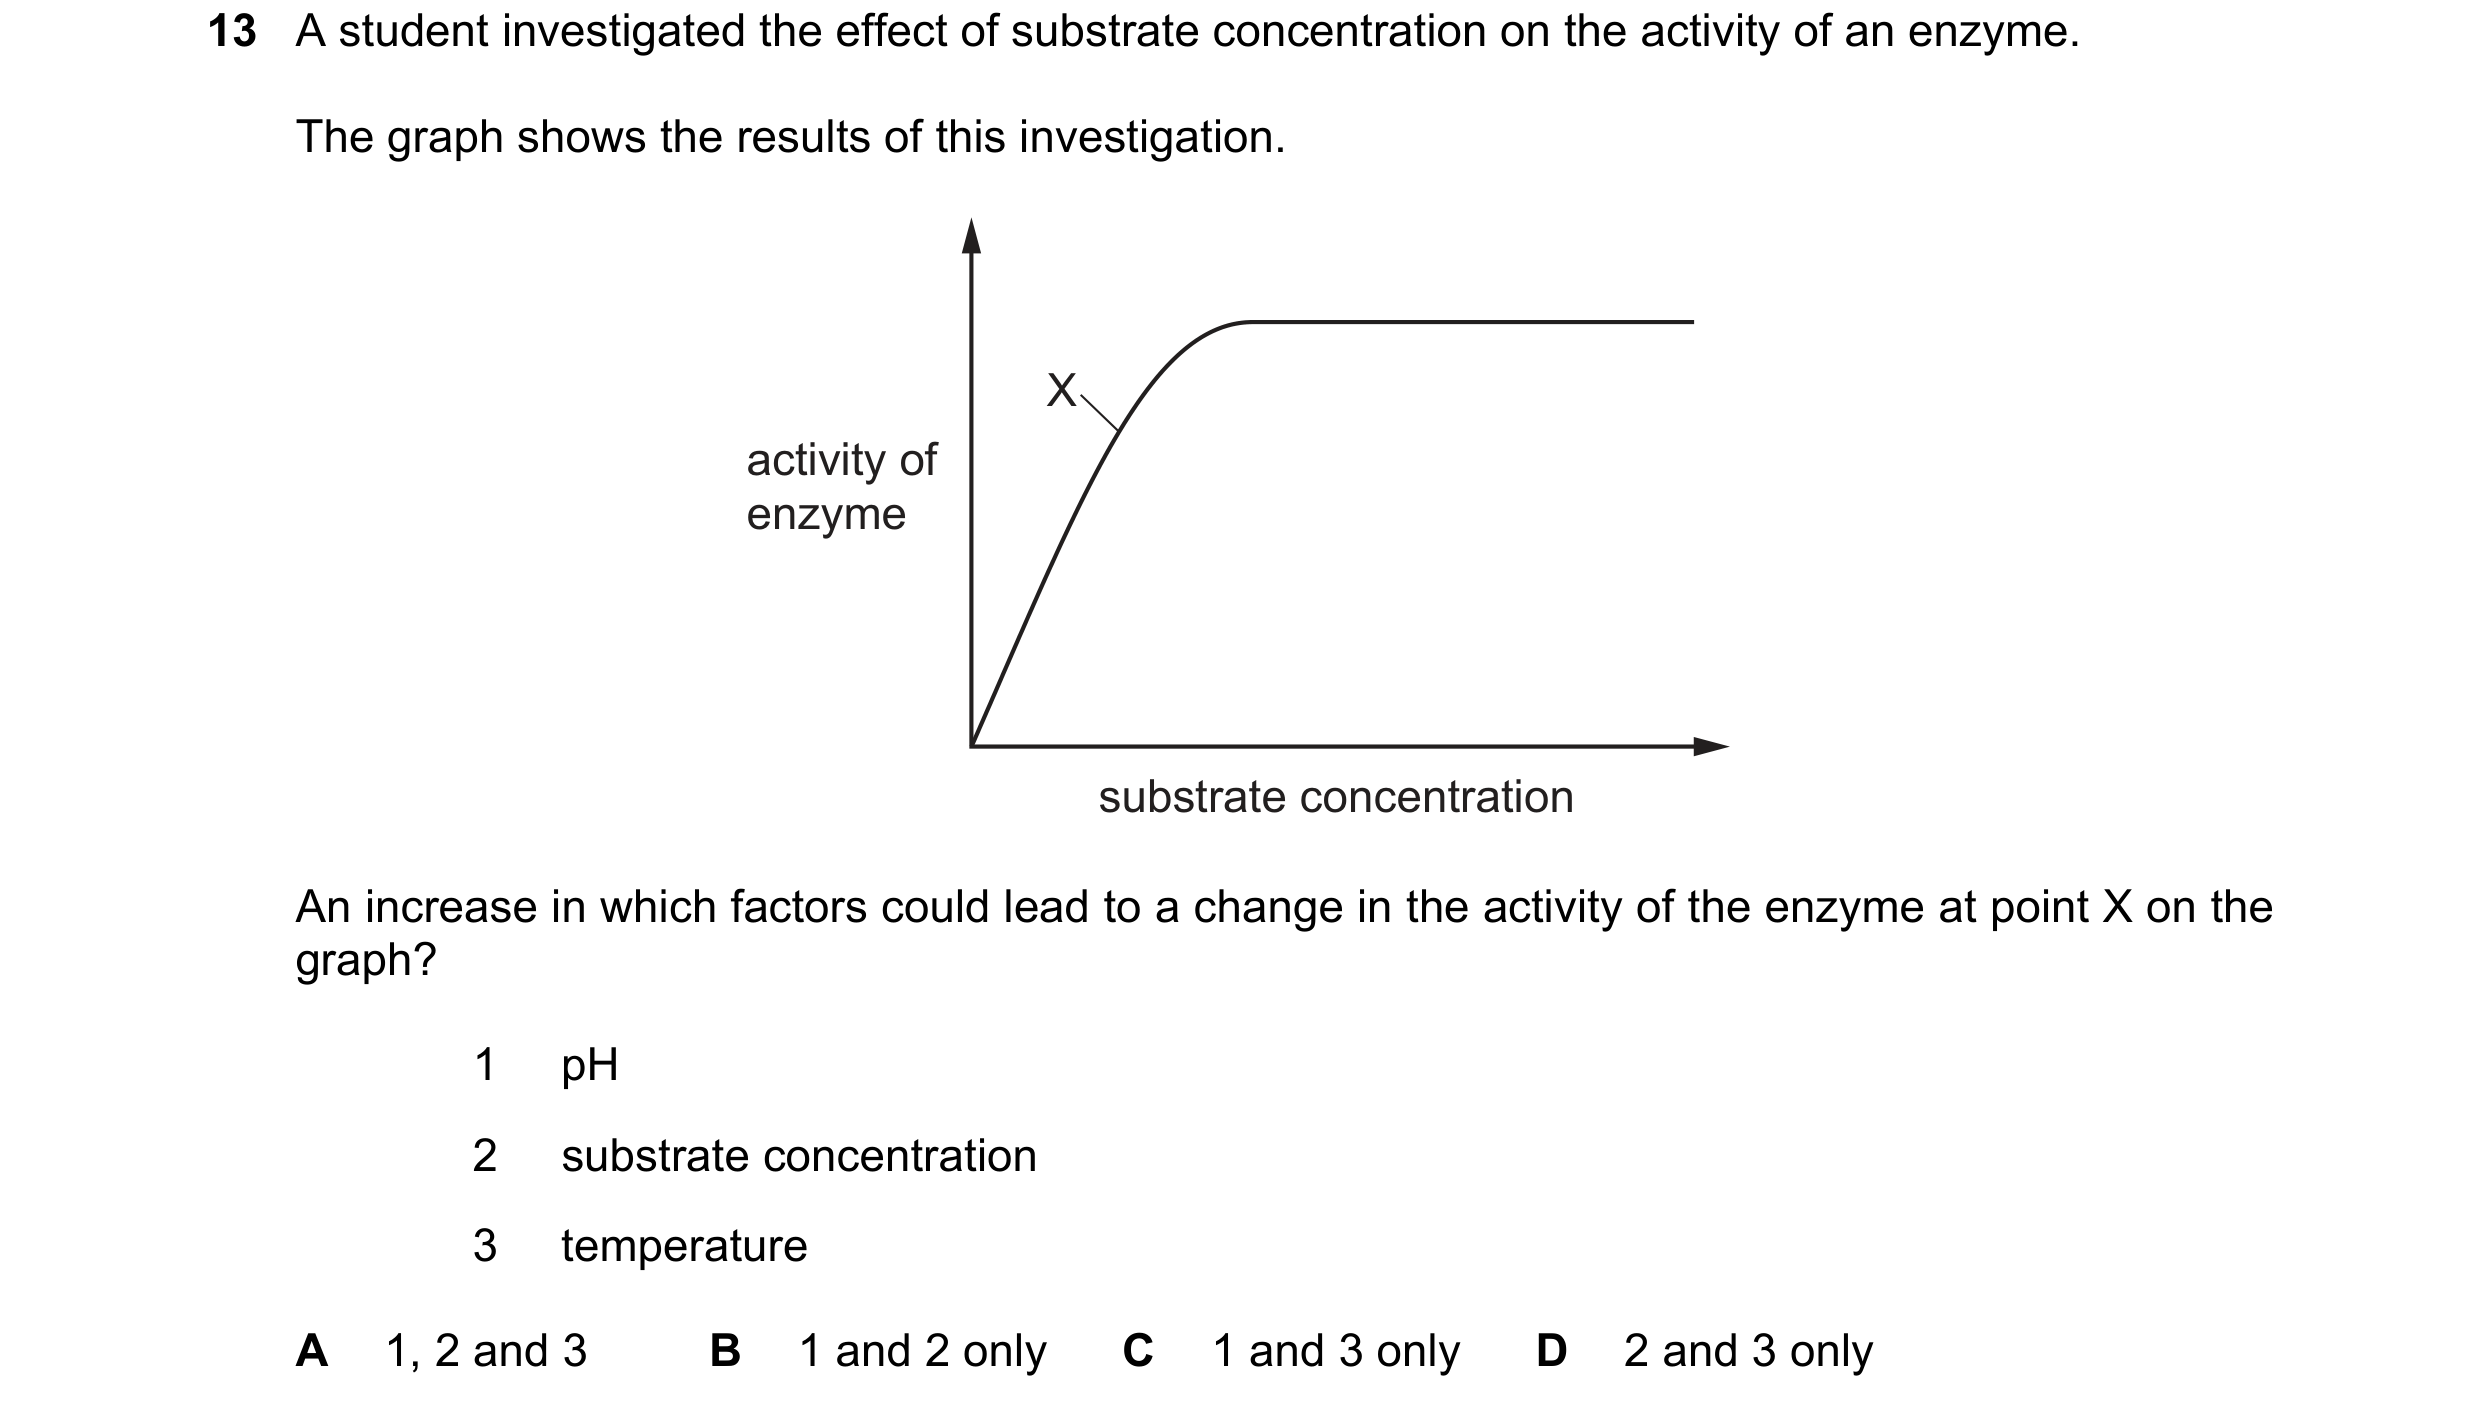
 53 / 76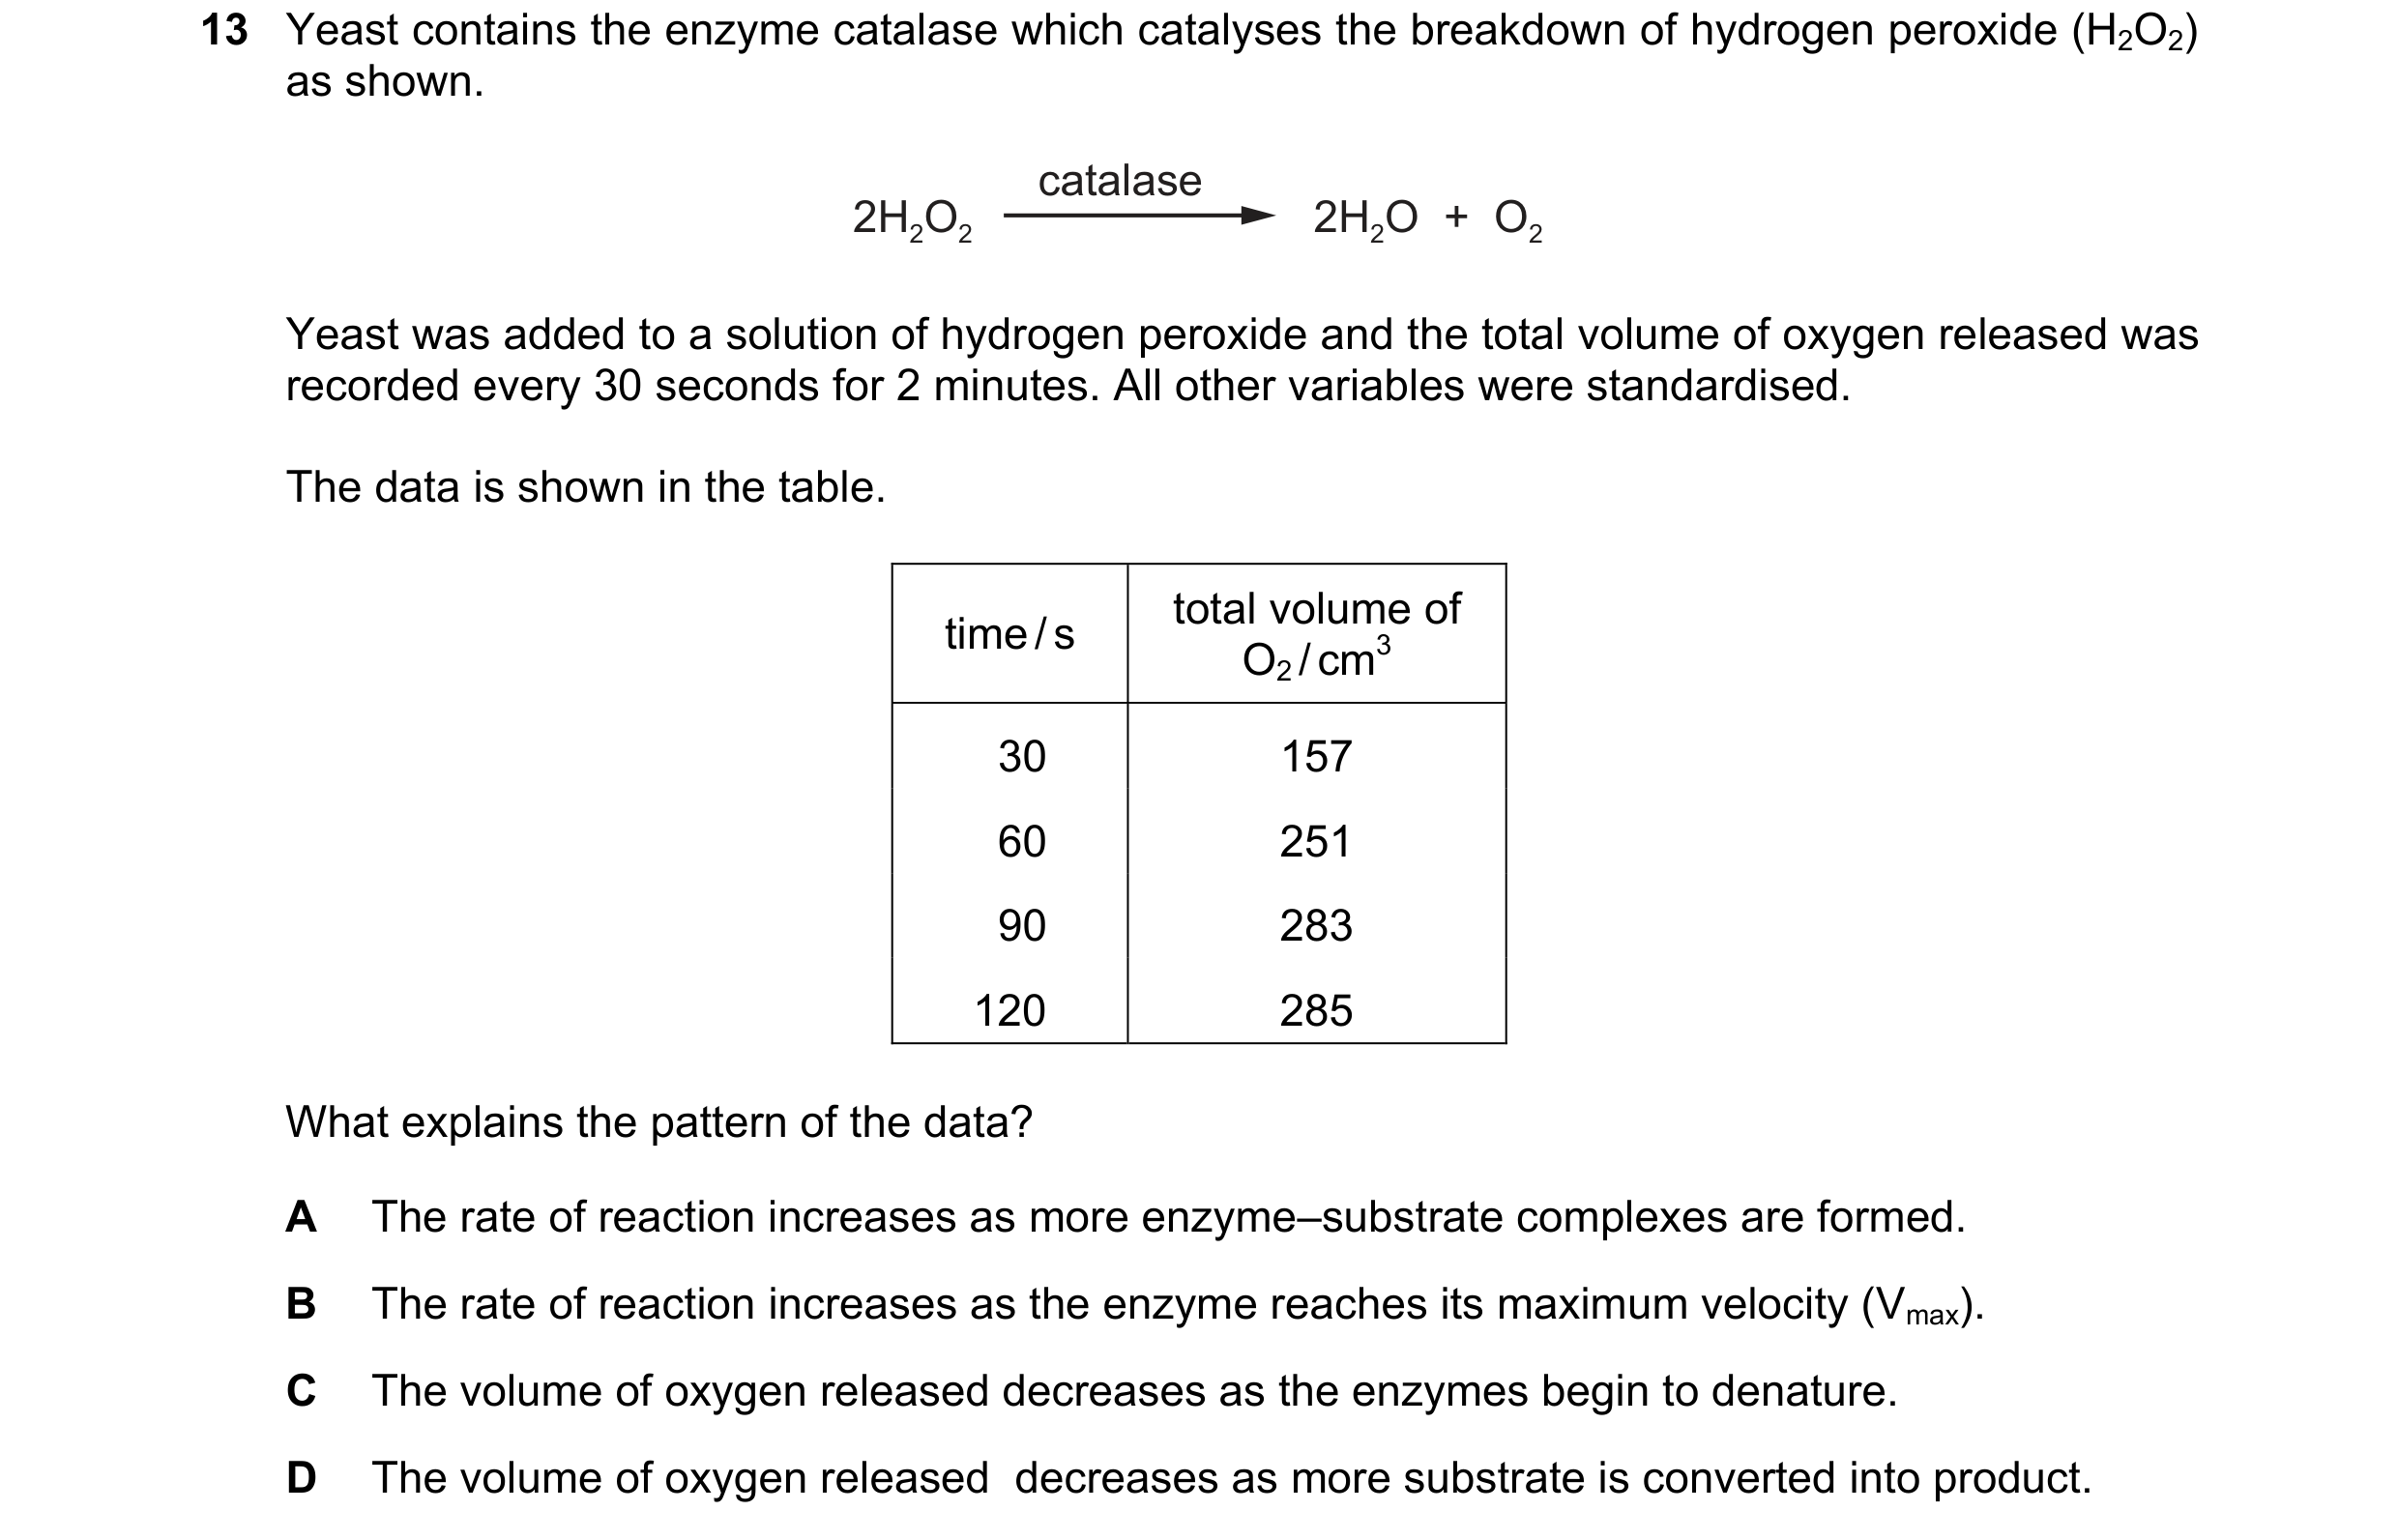
 54 / 76
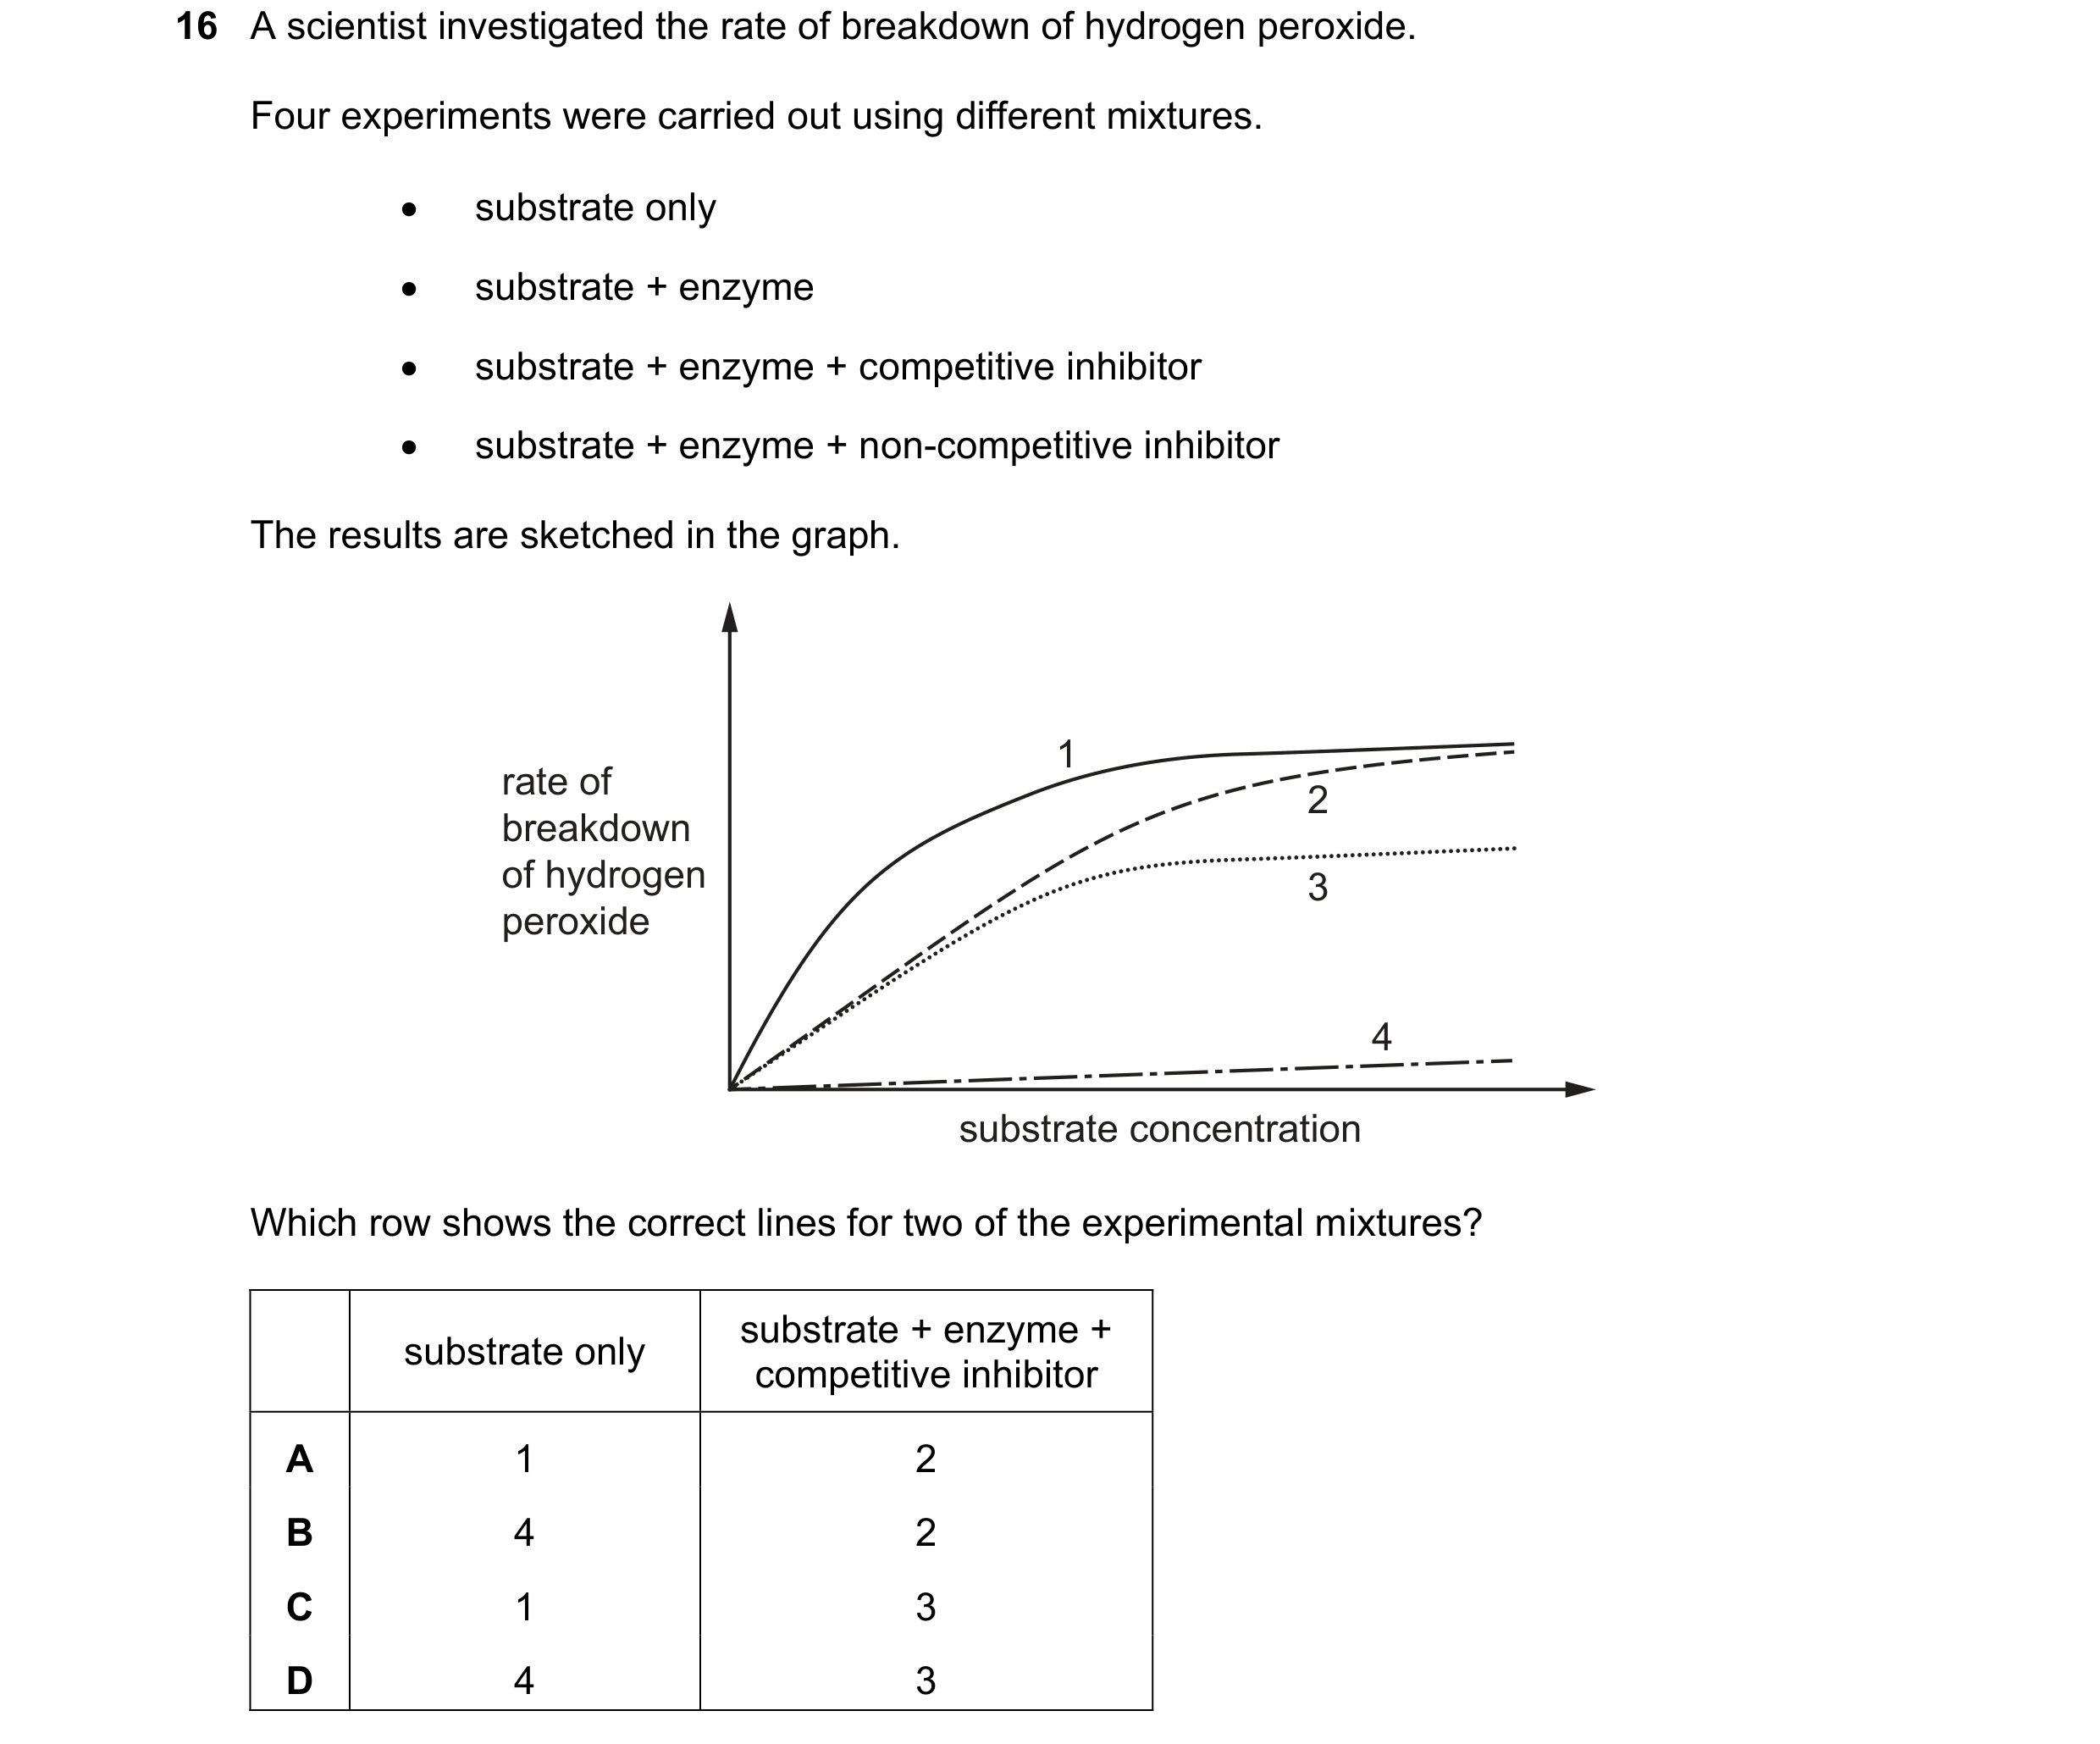 55 / 76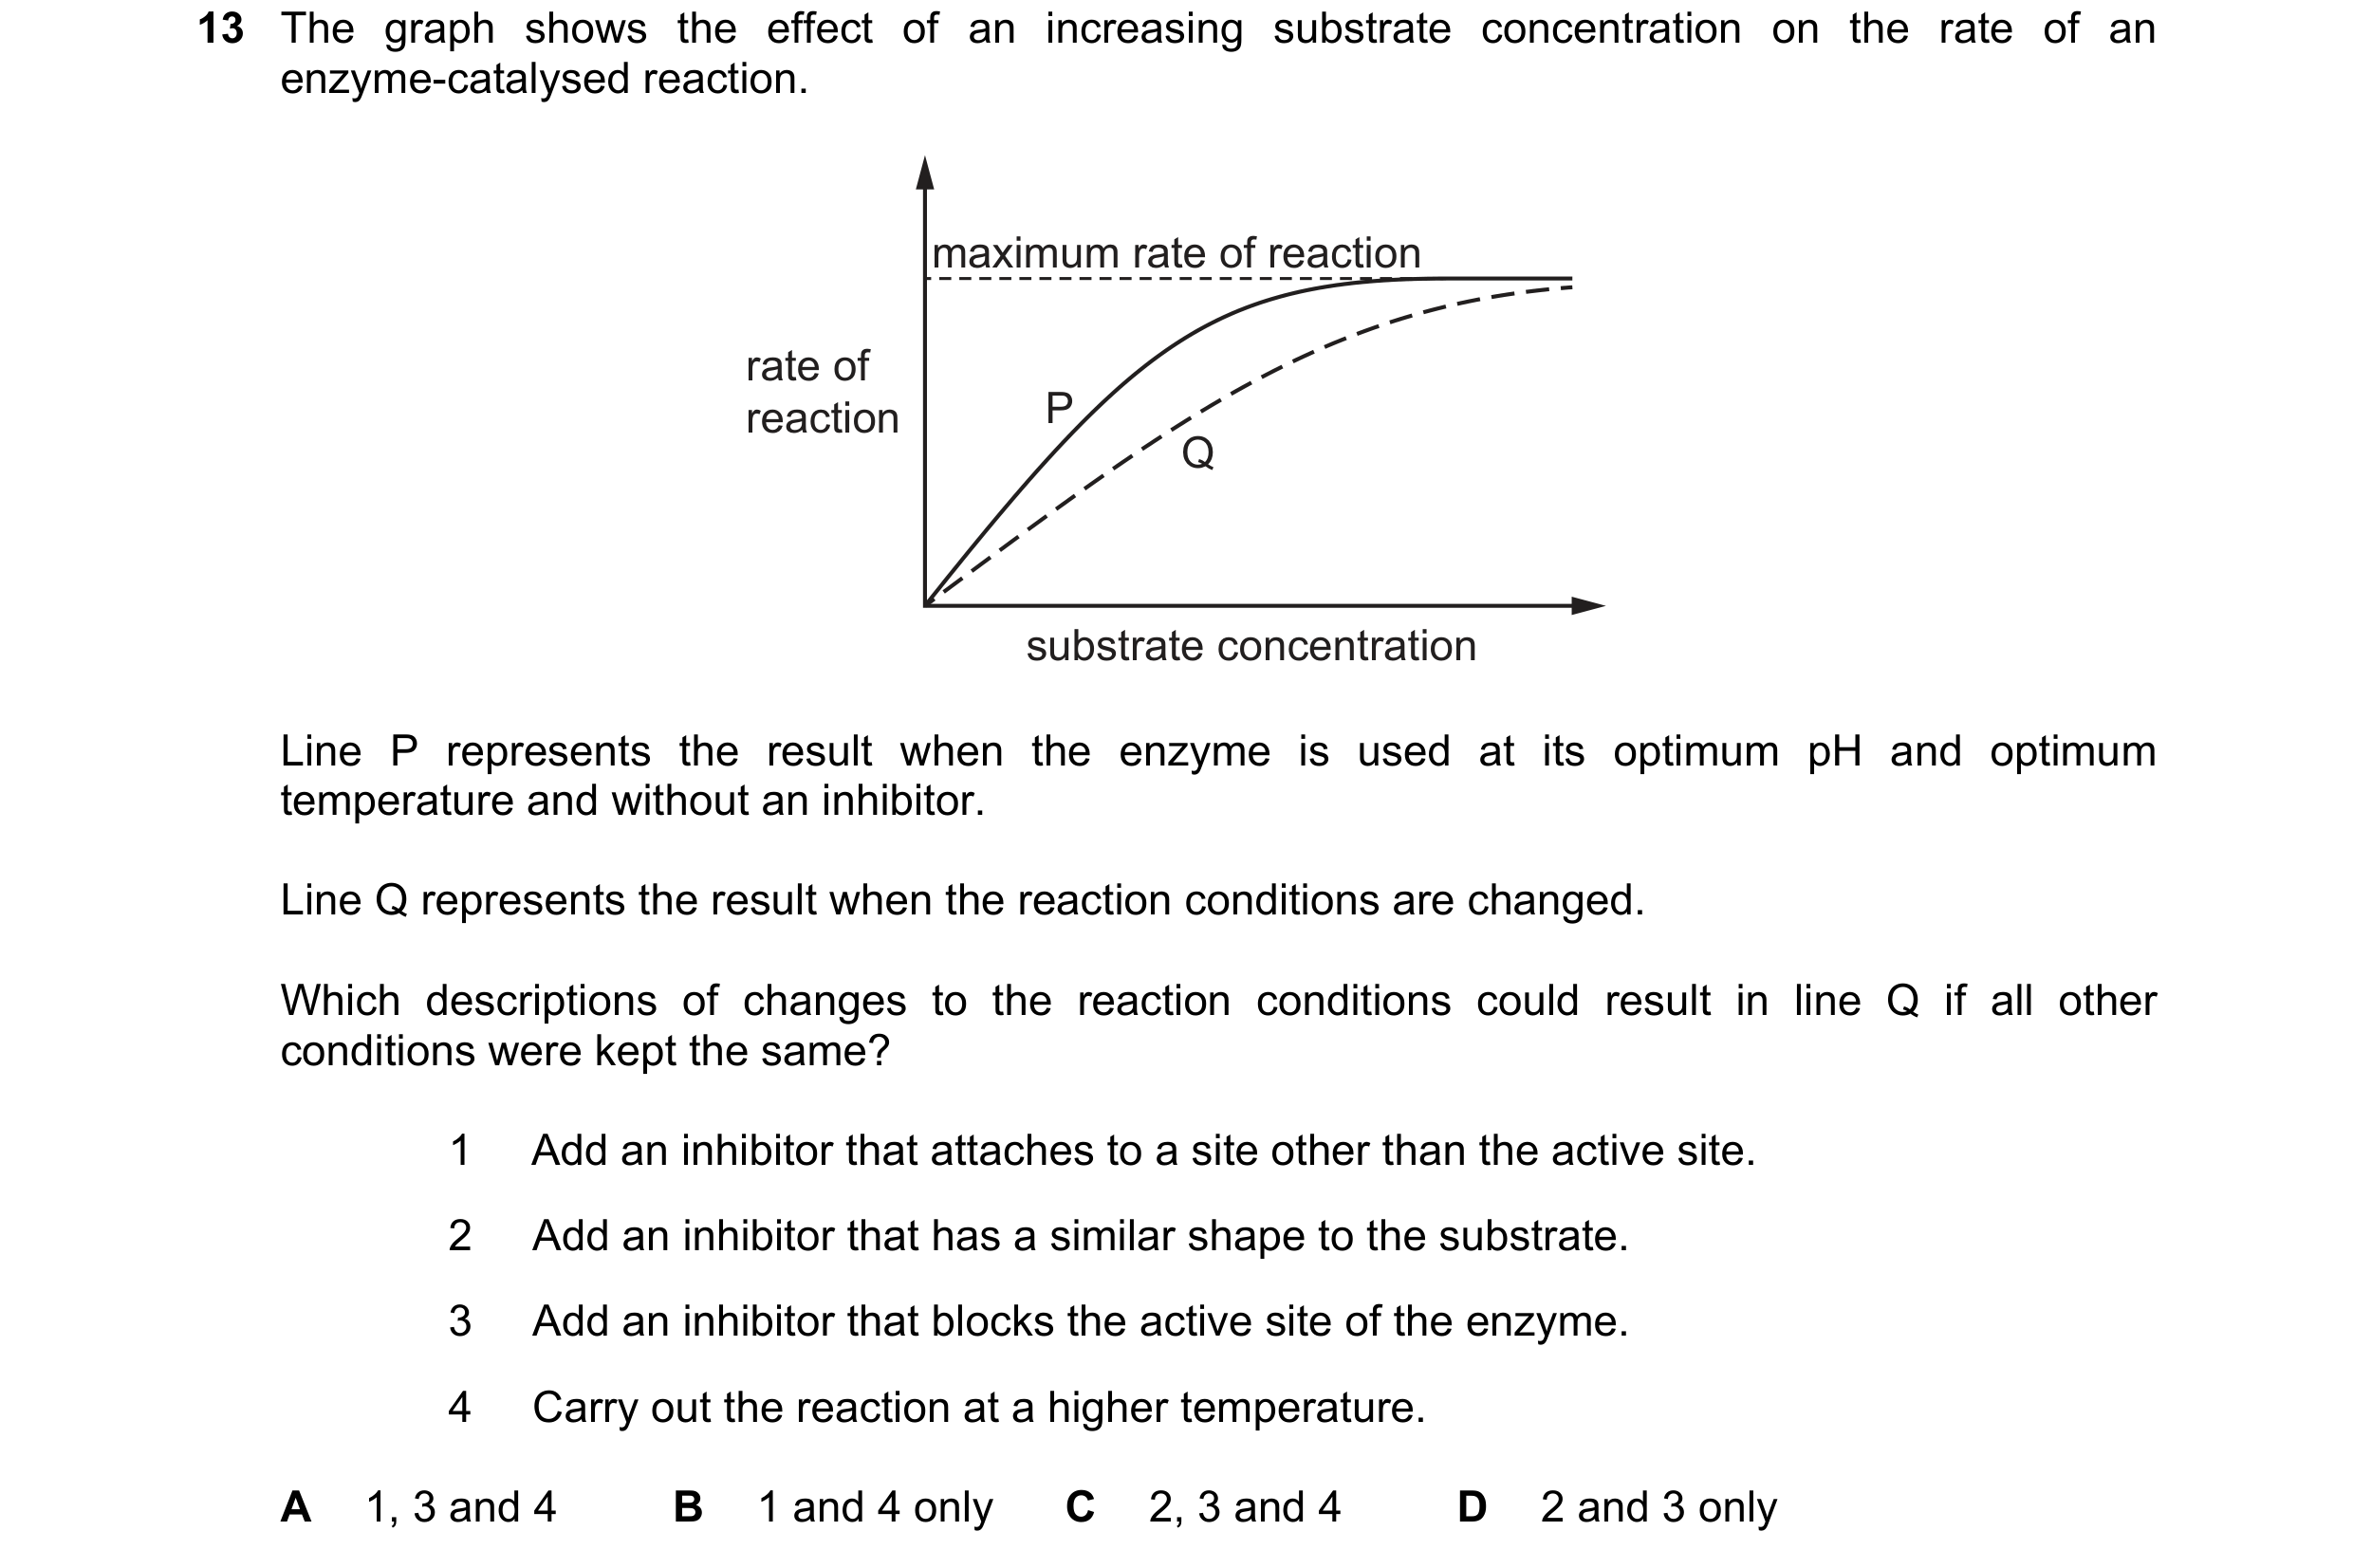
 56 / 76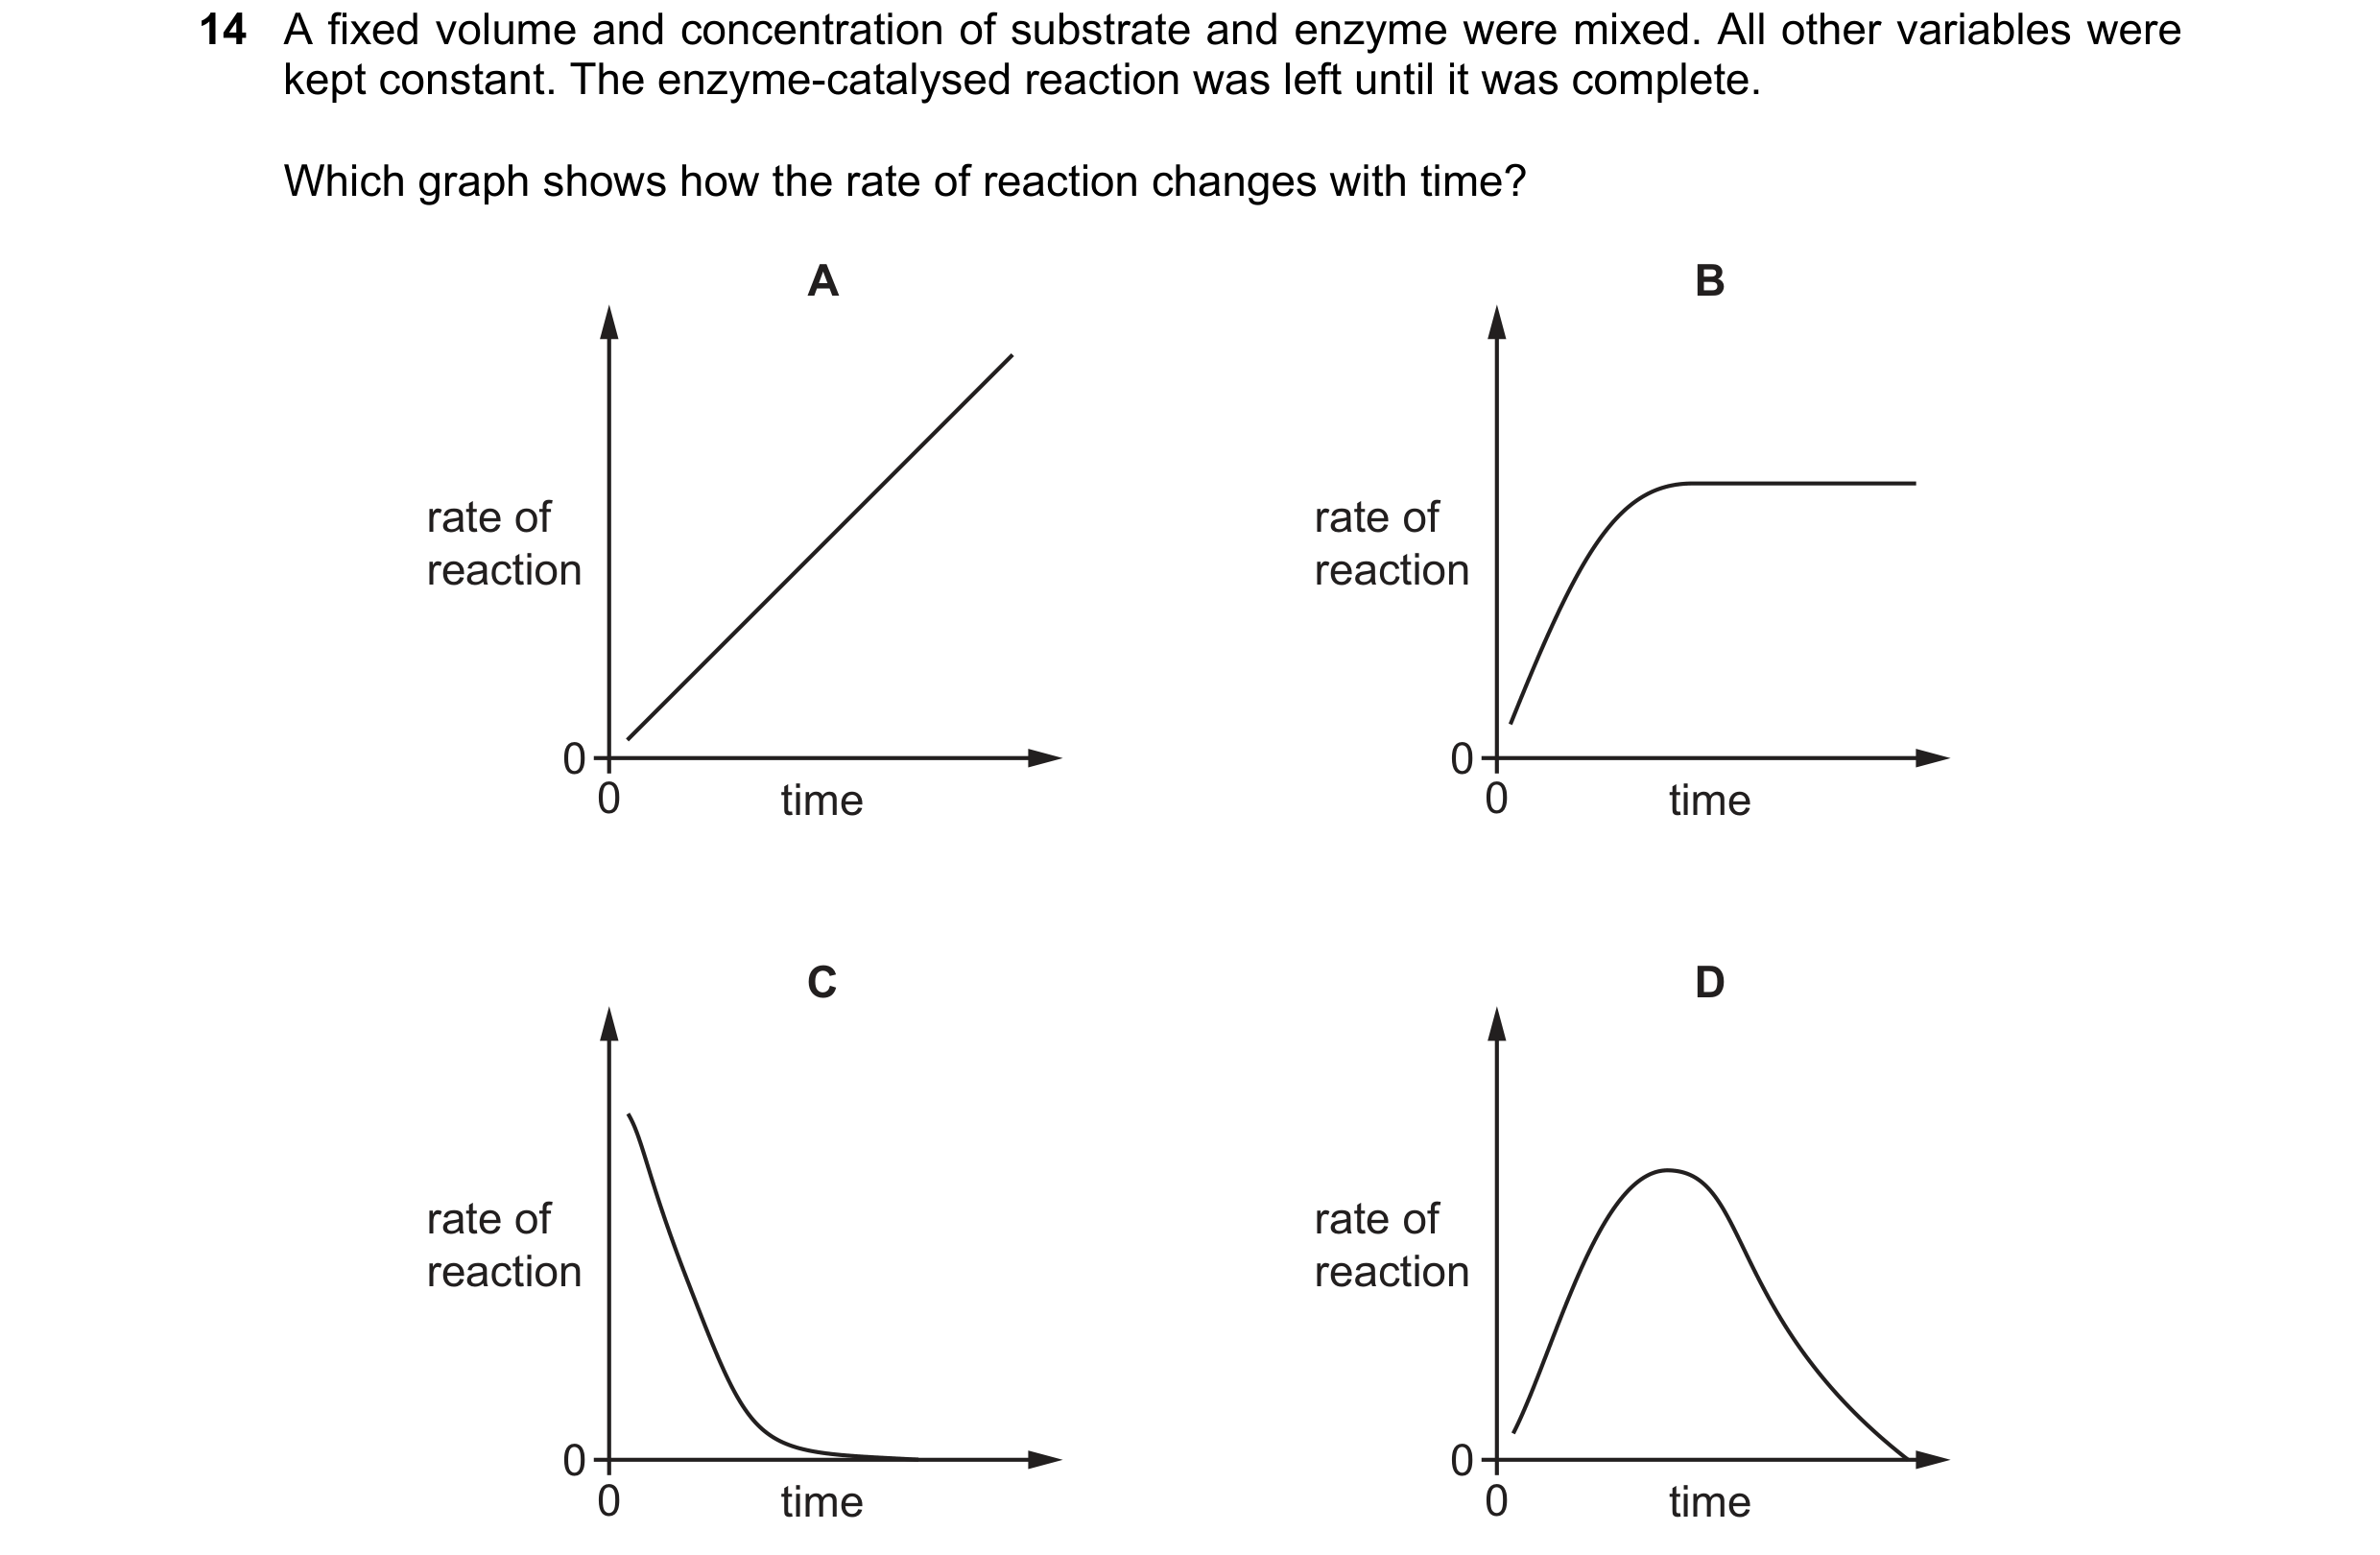
 57 / 76
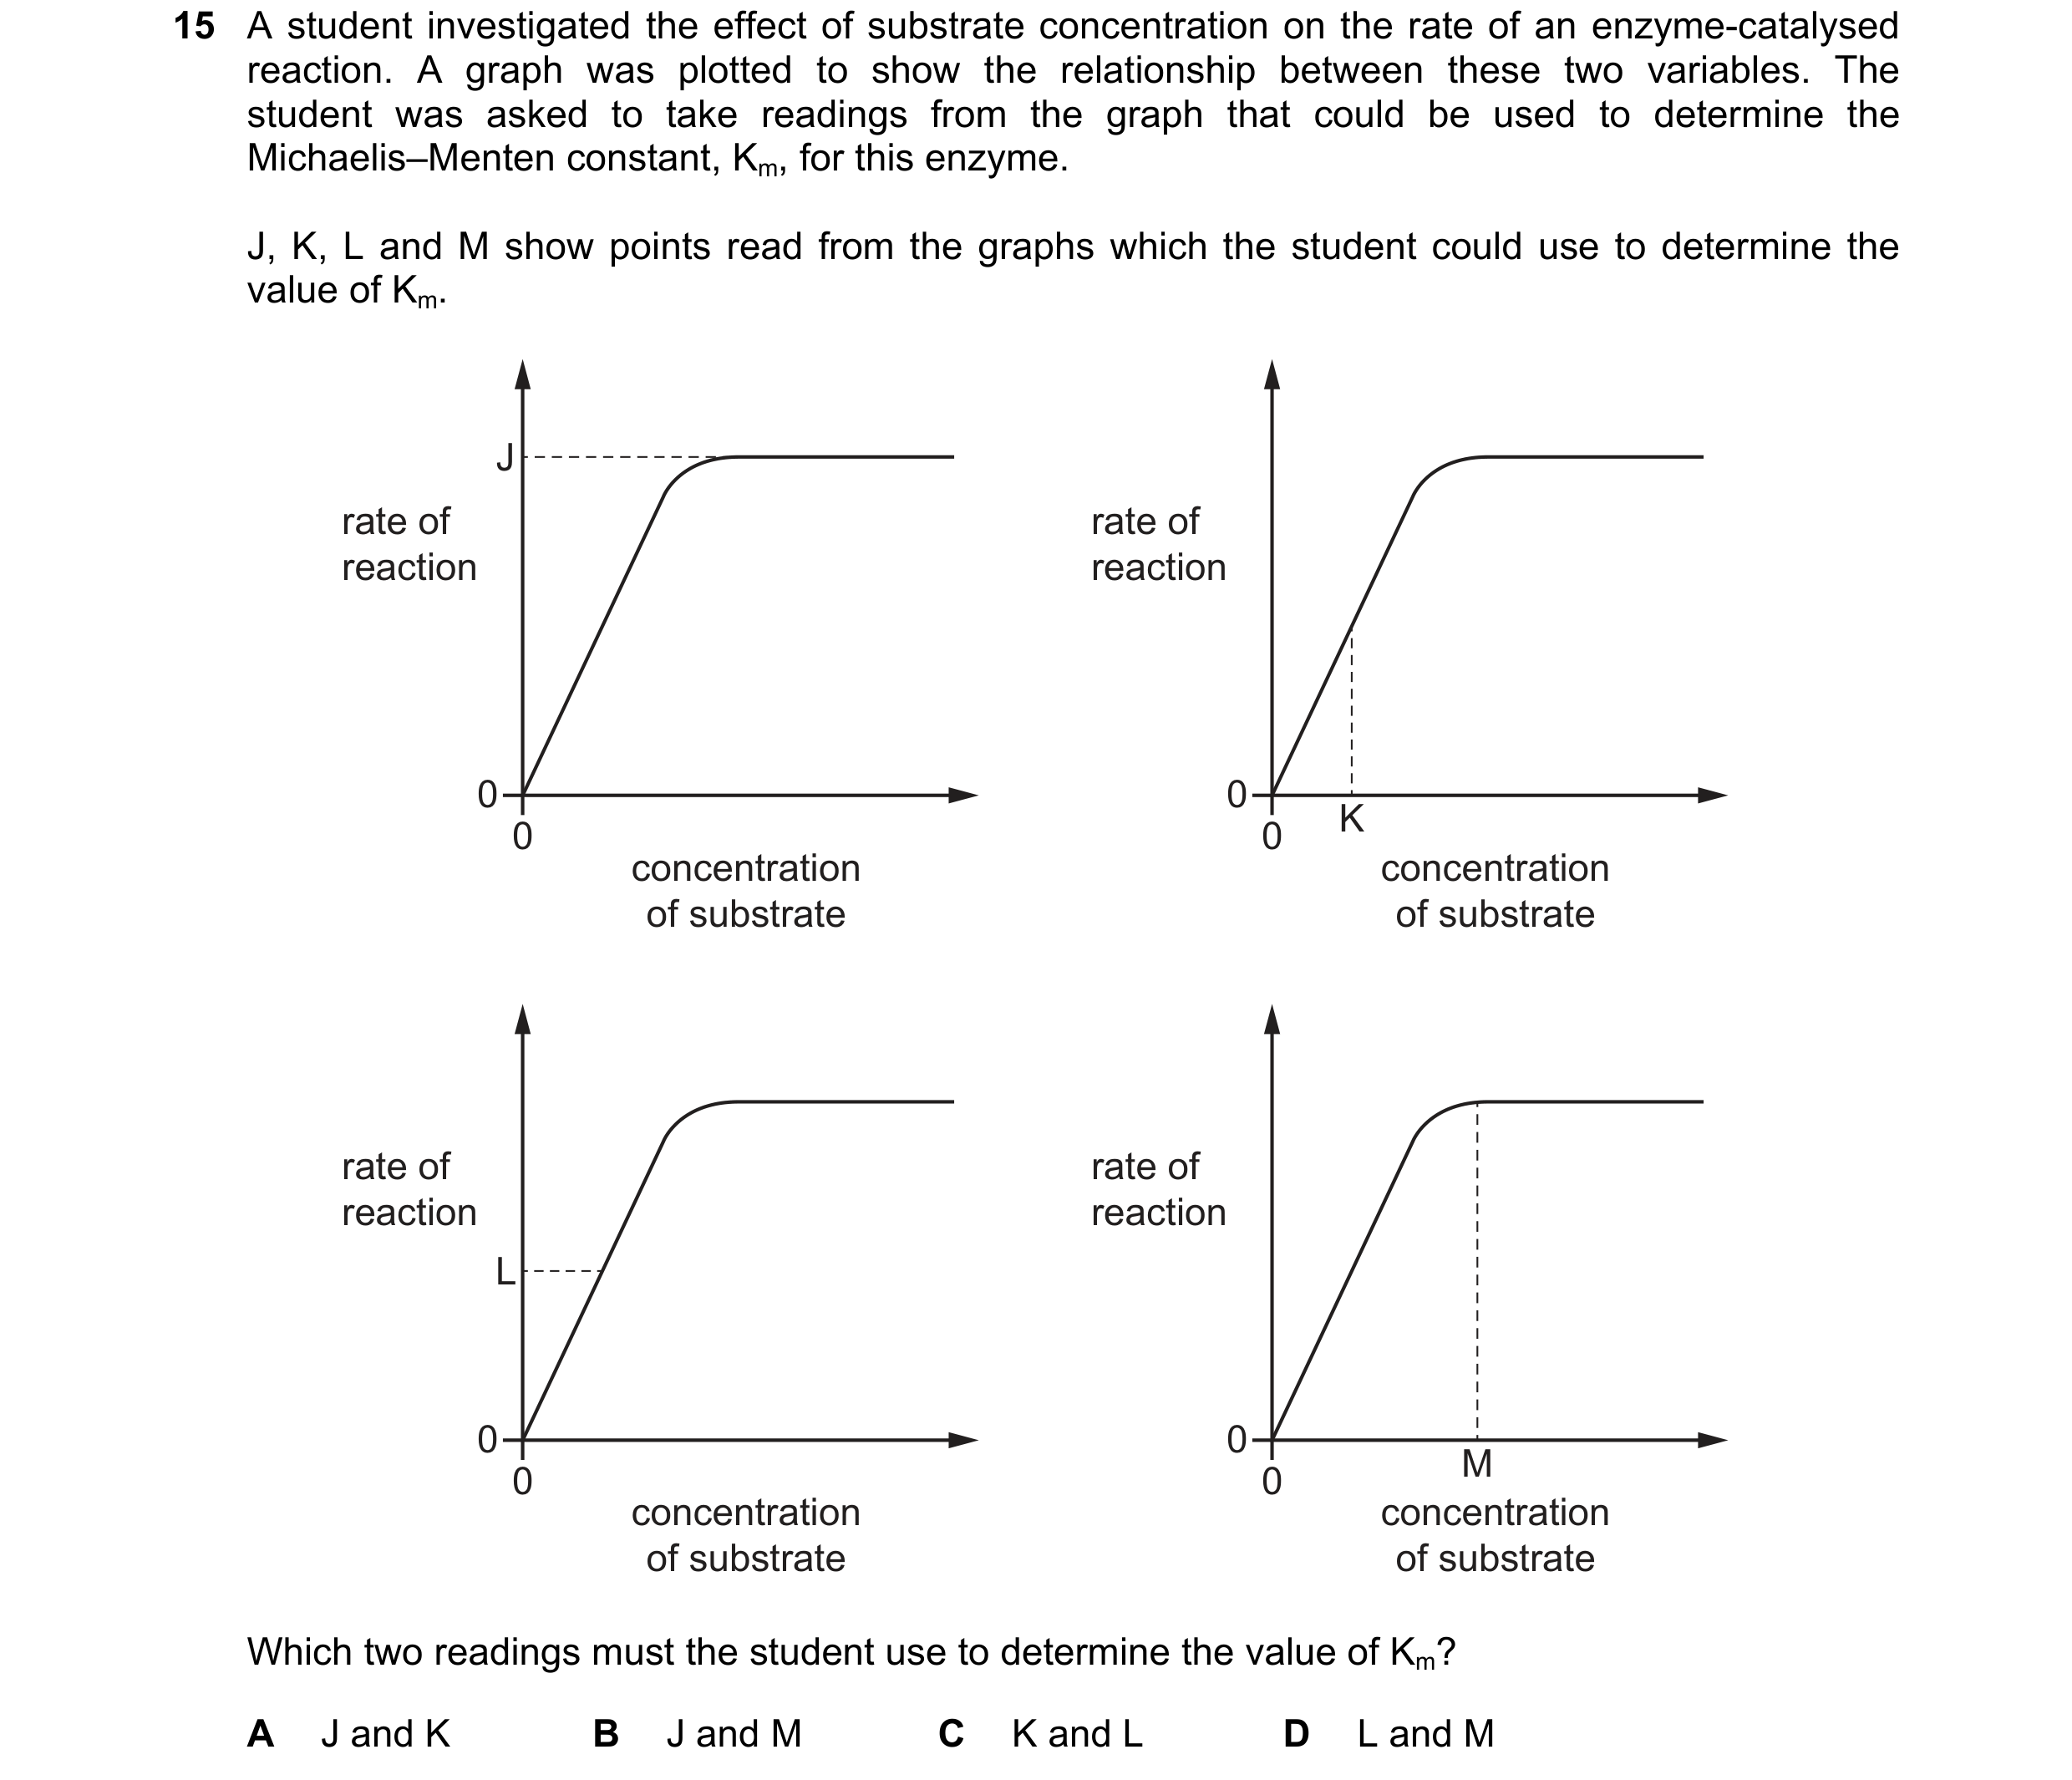 58 / 76
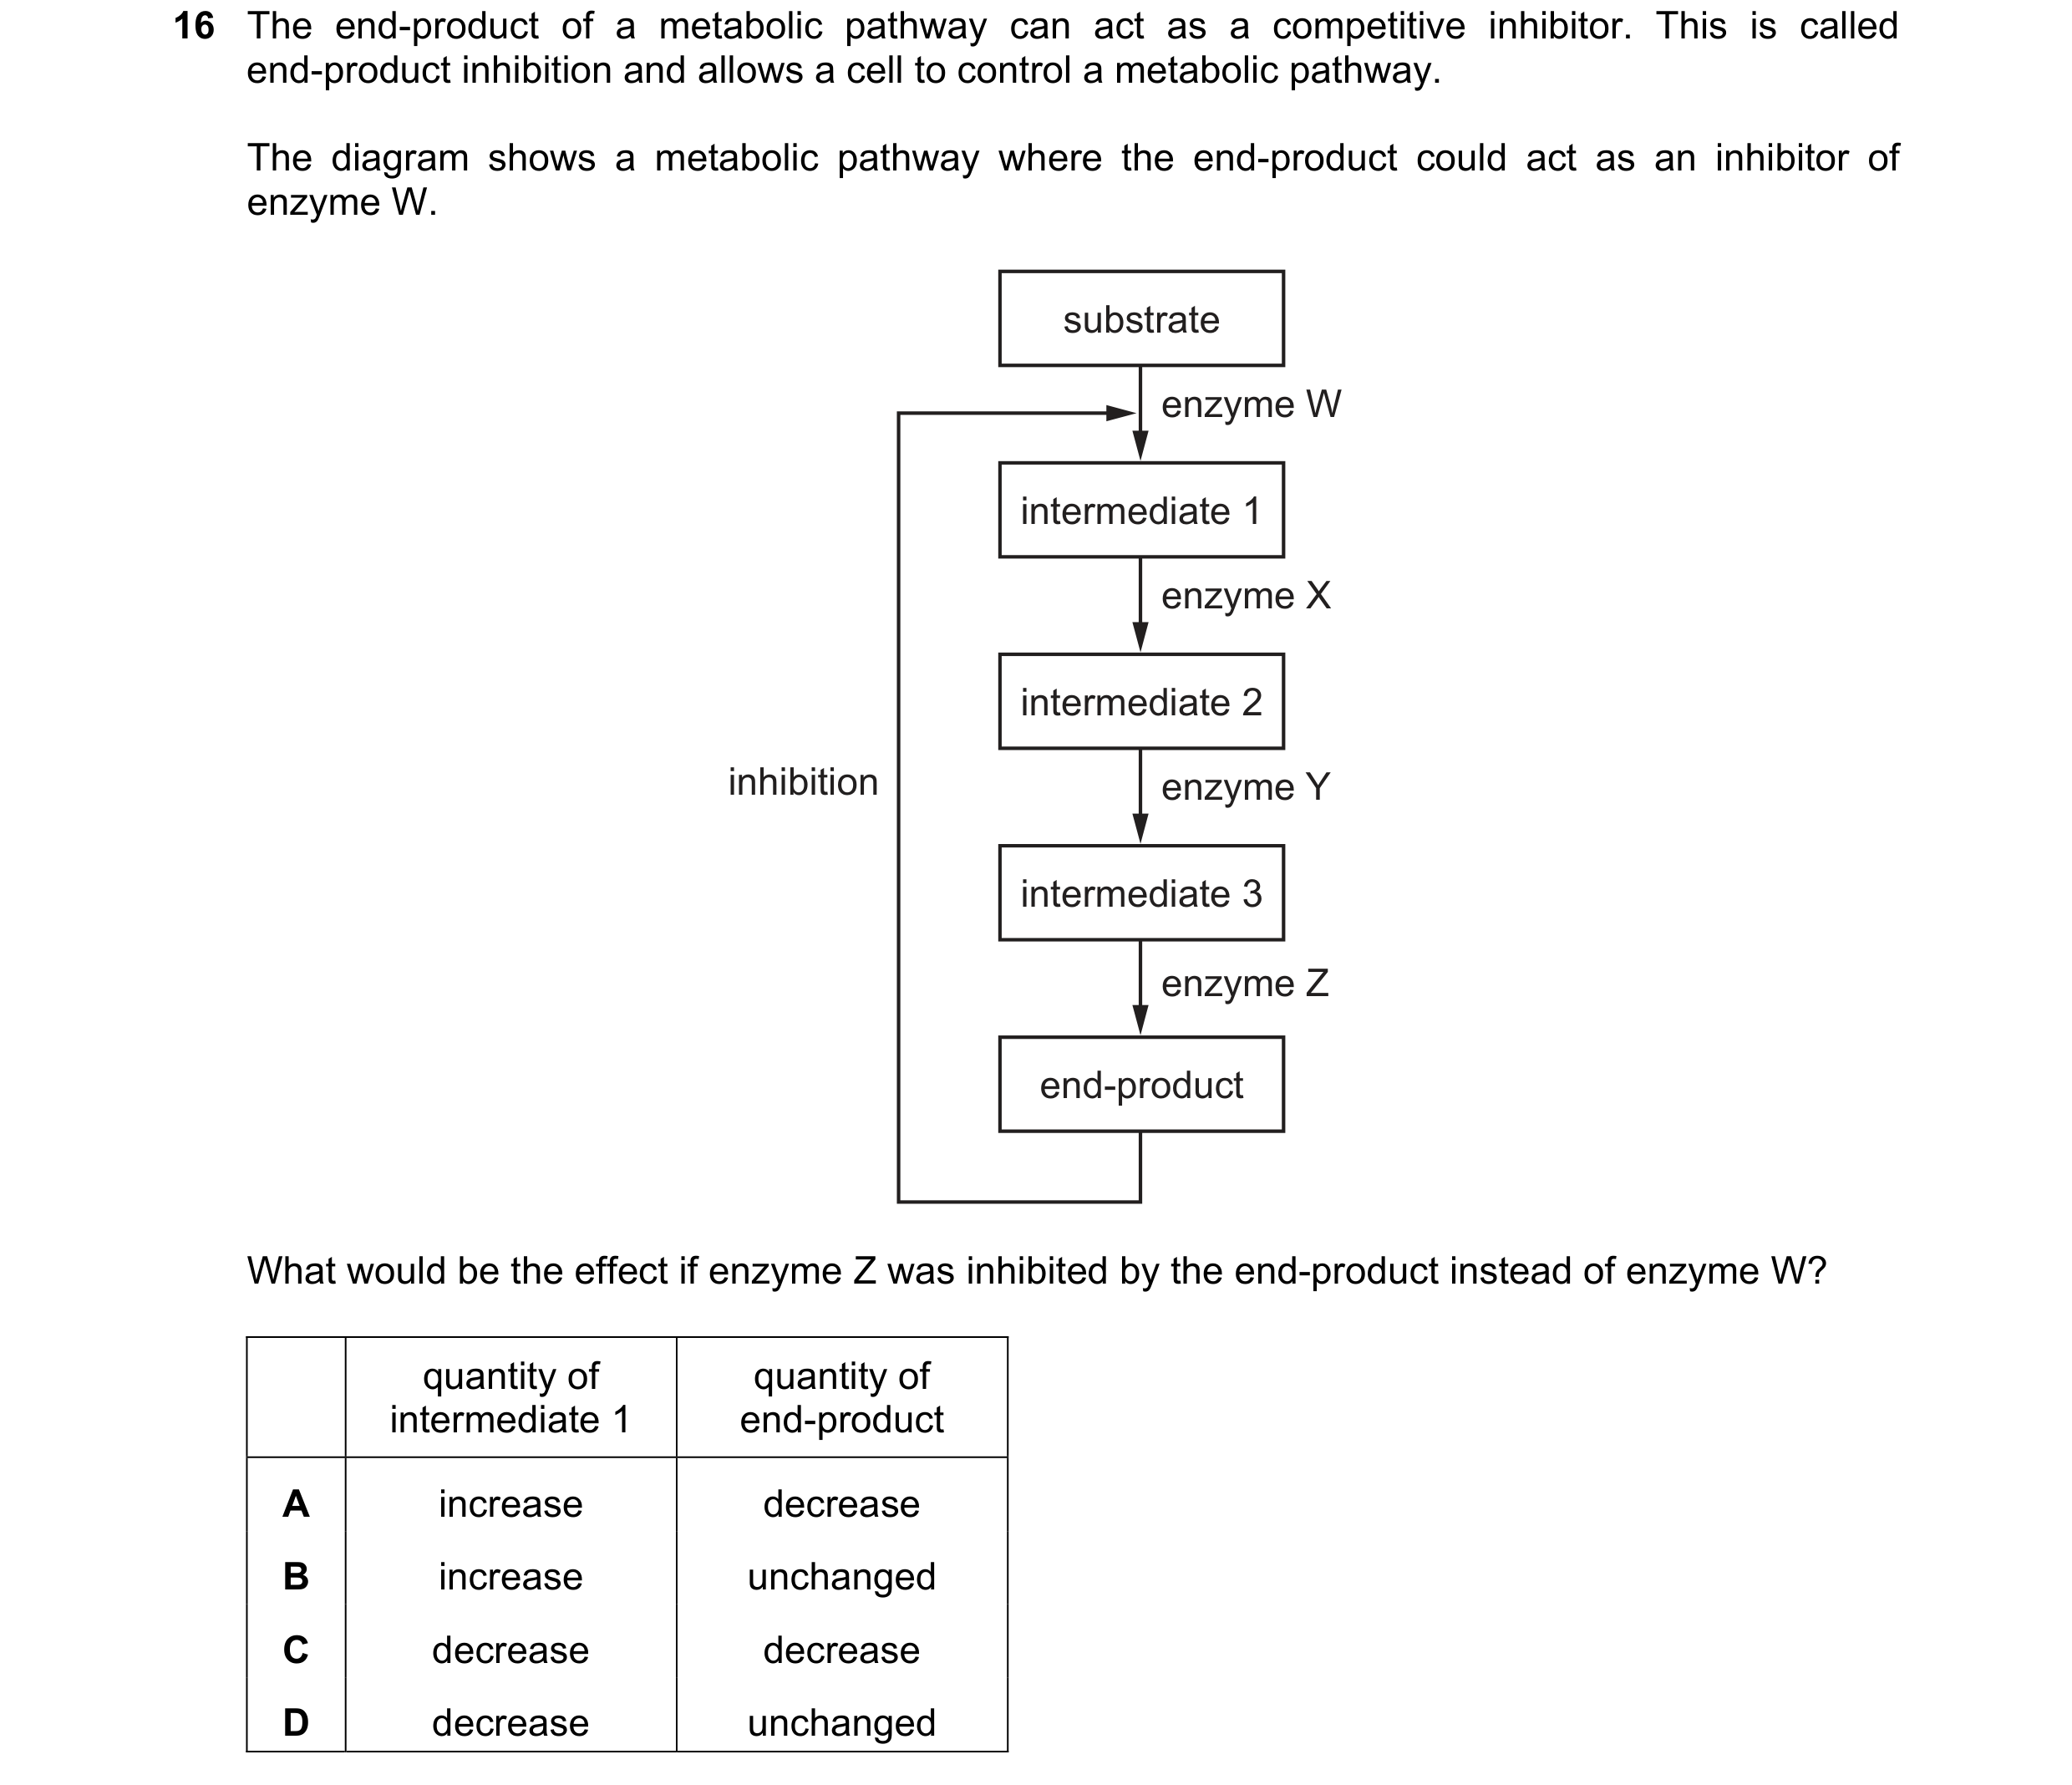 59 / 76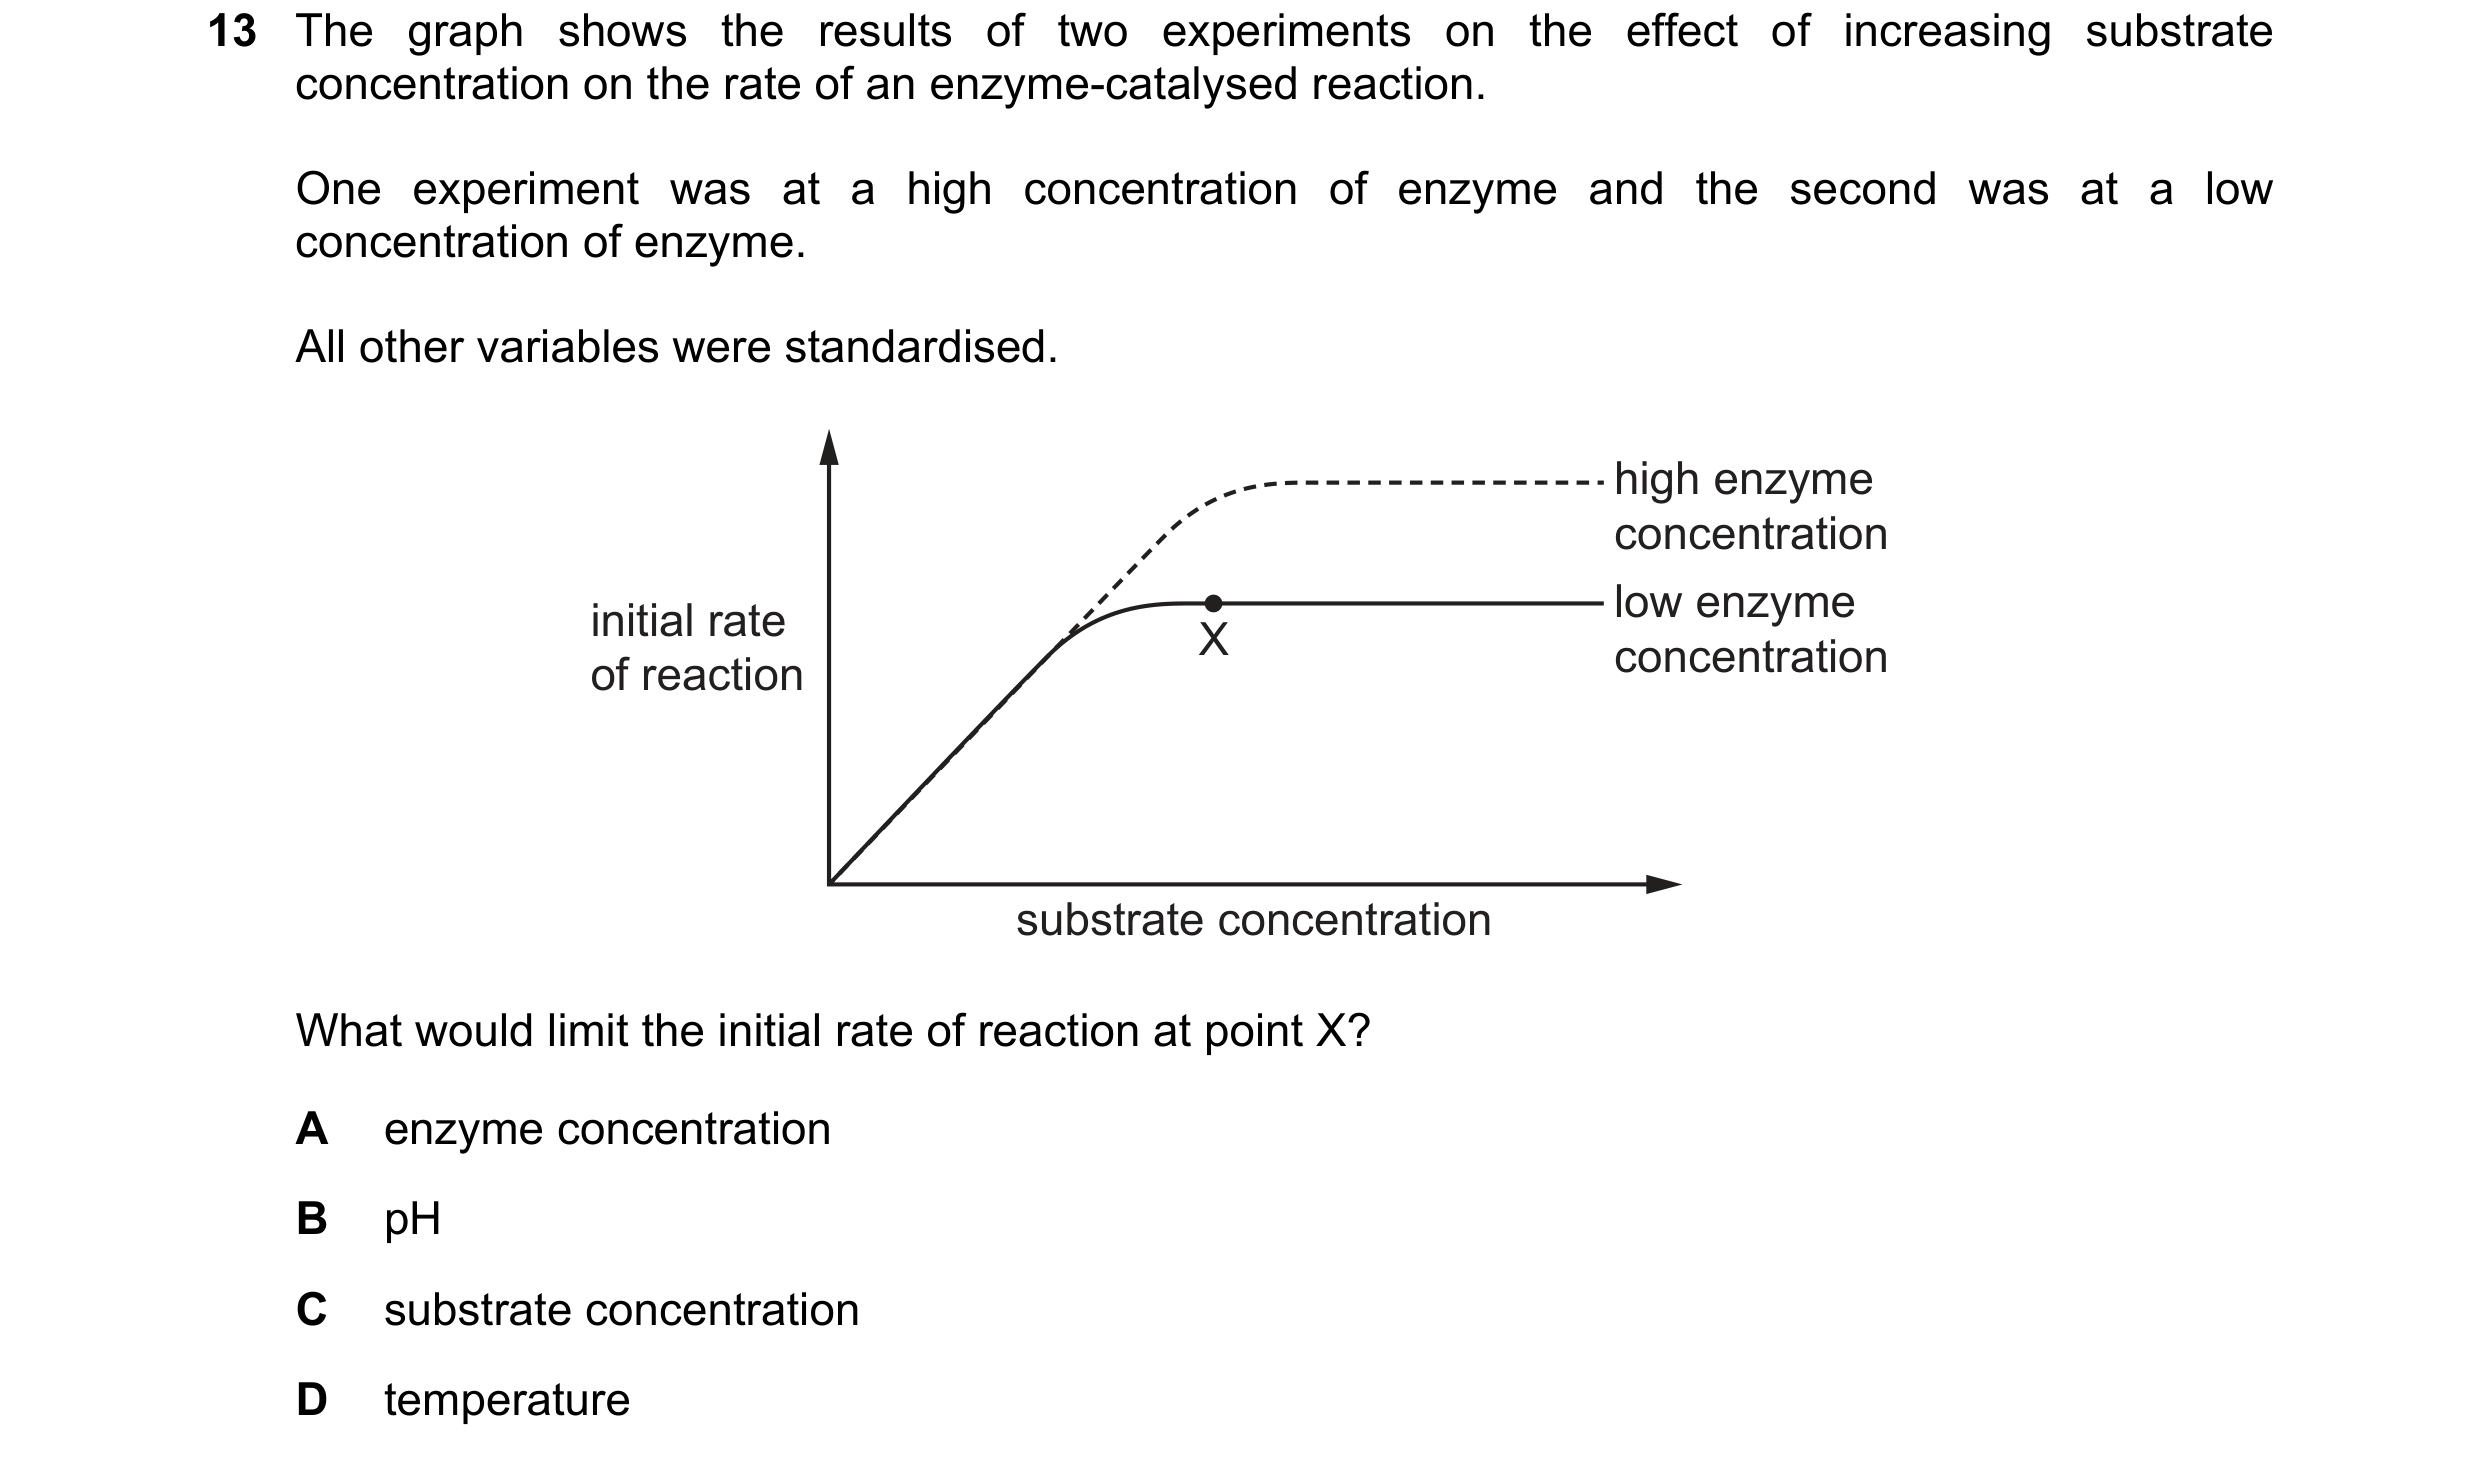
 60 / 76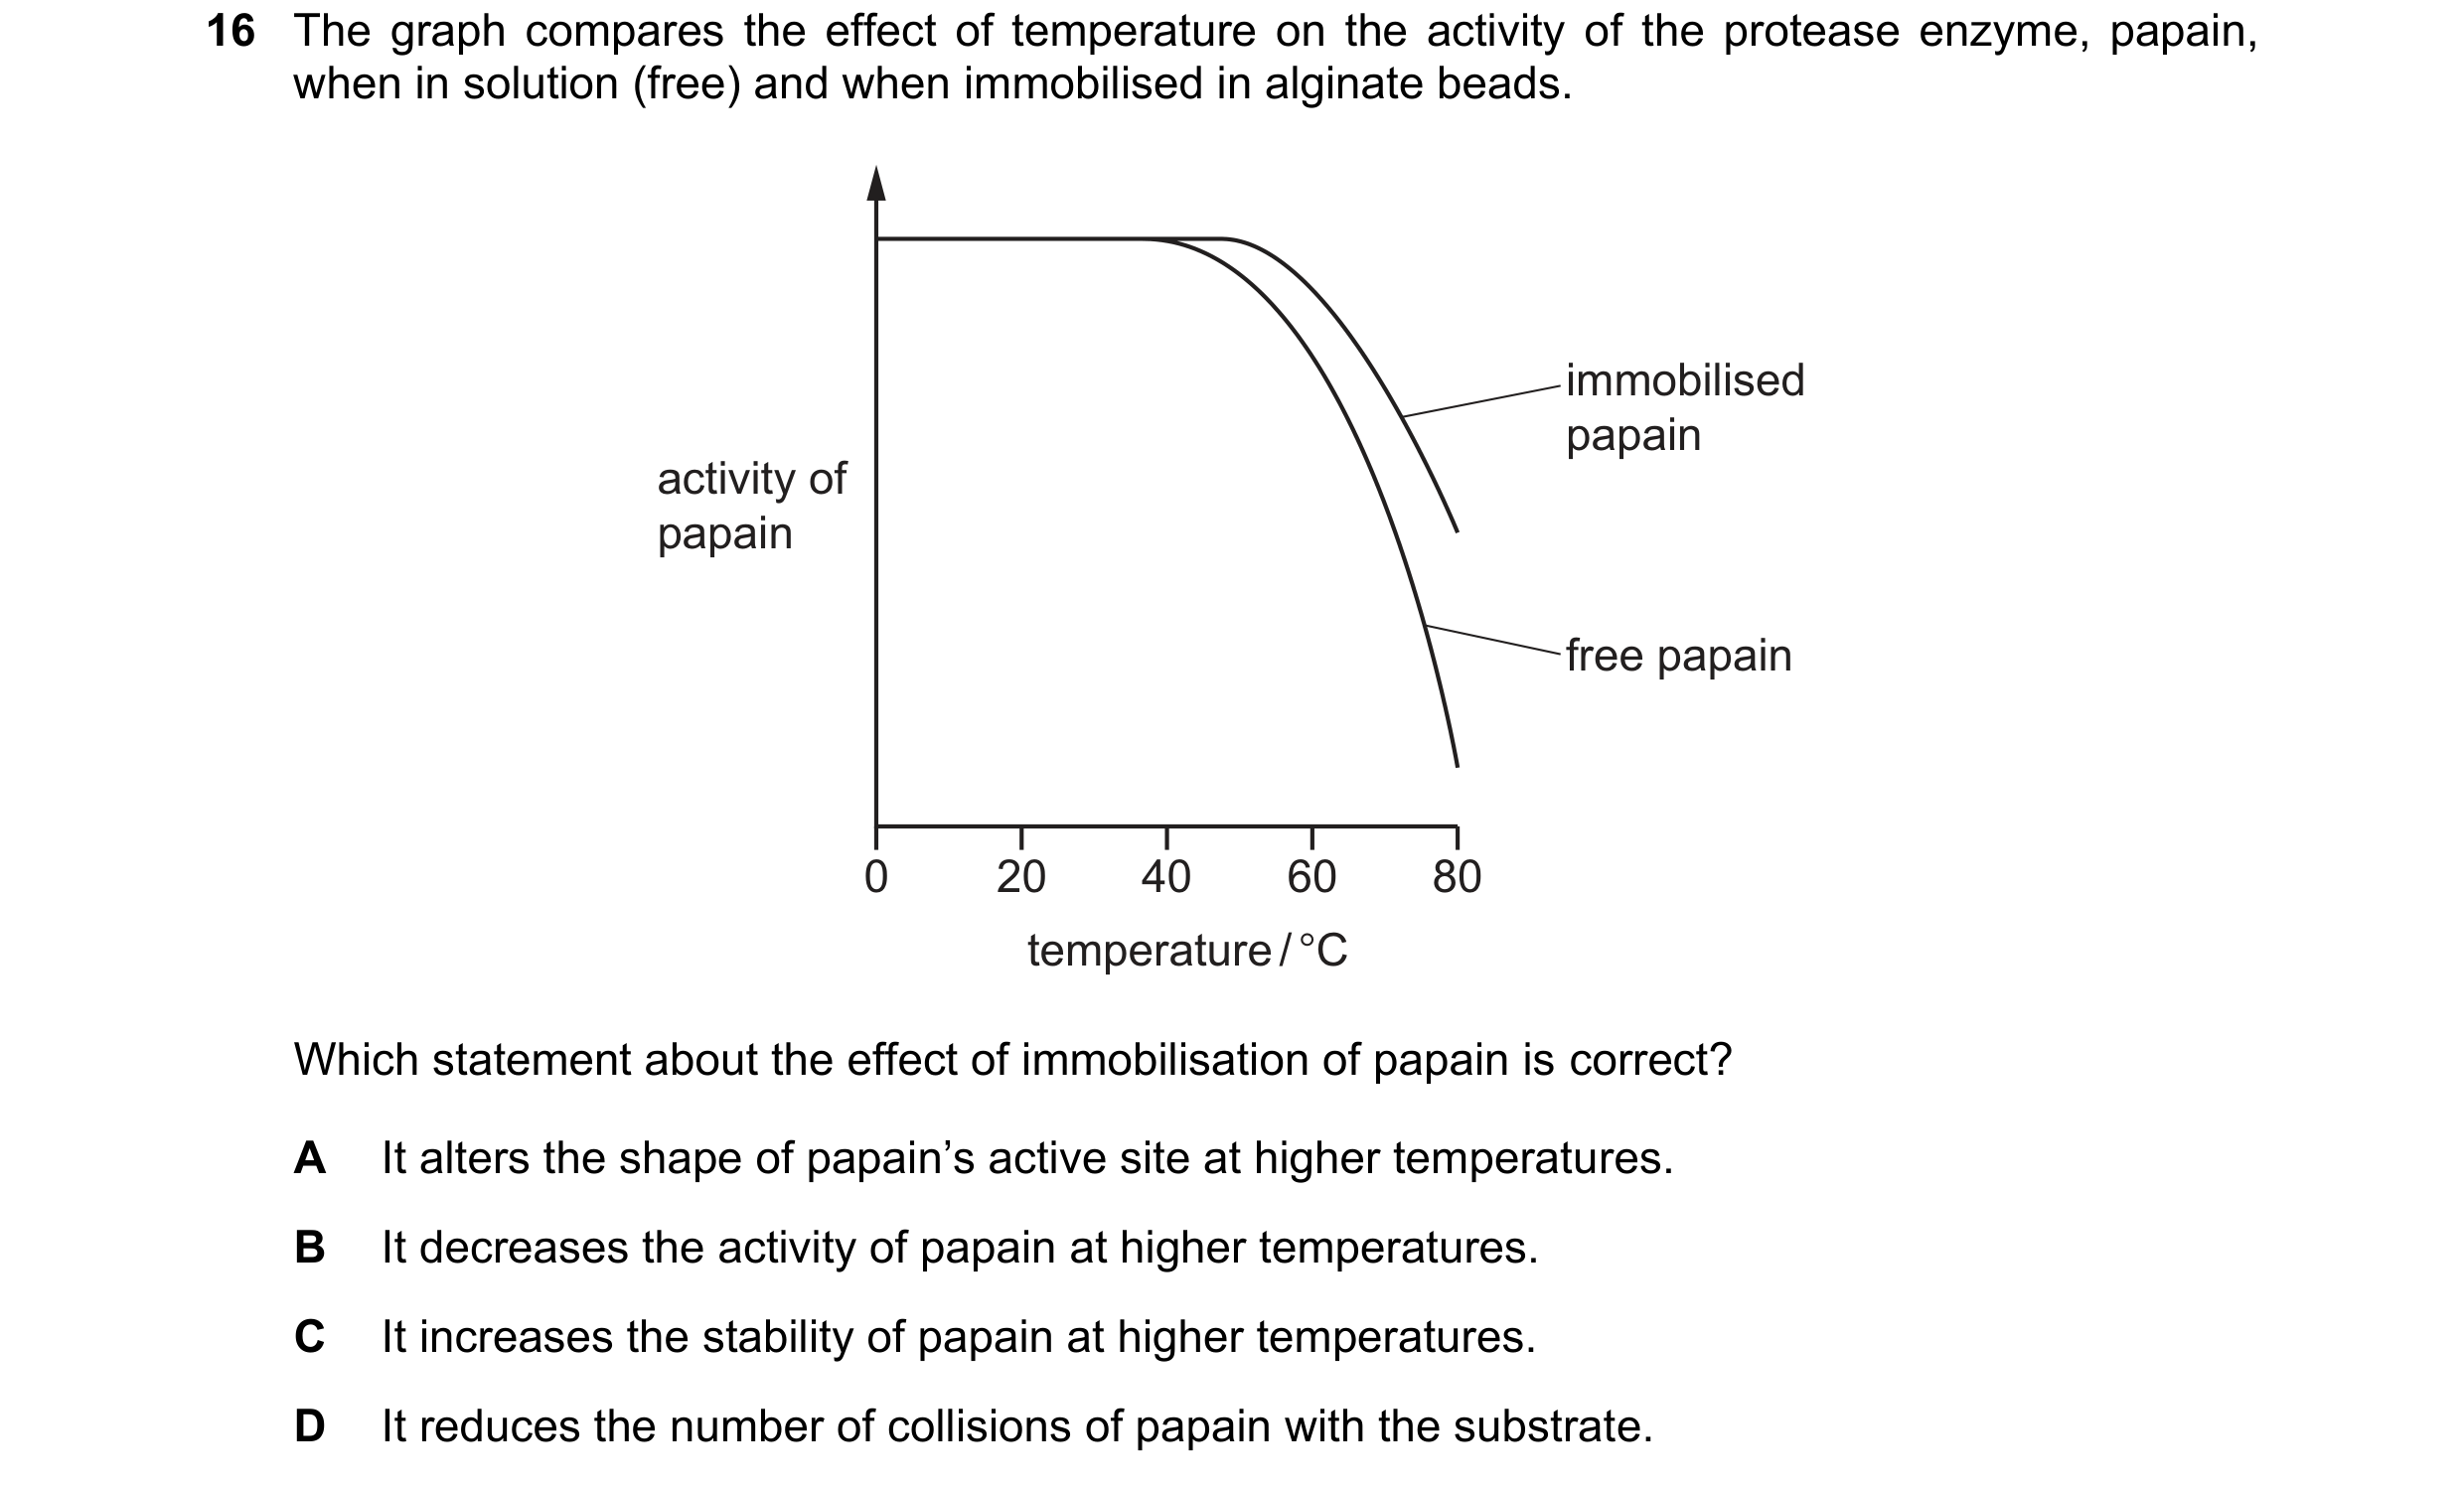
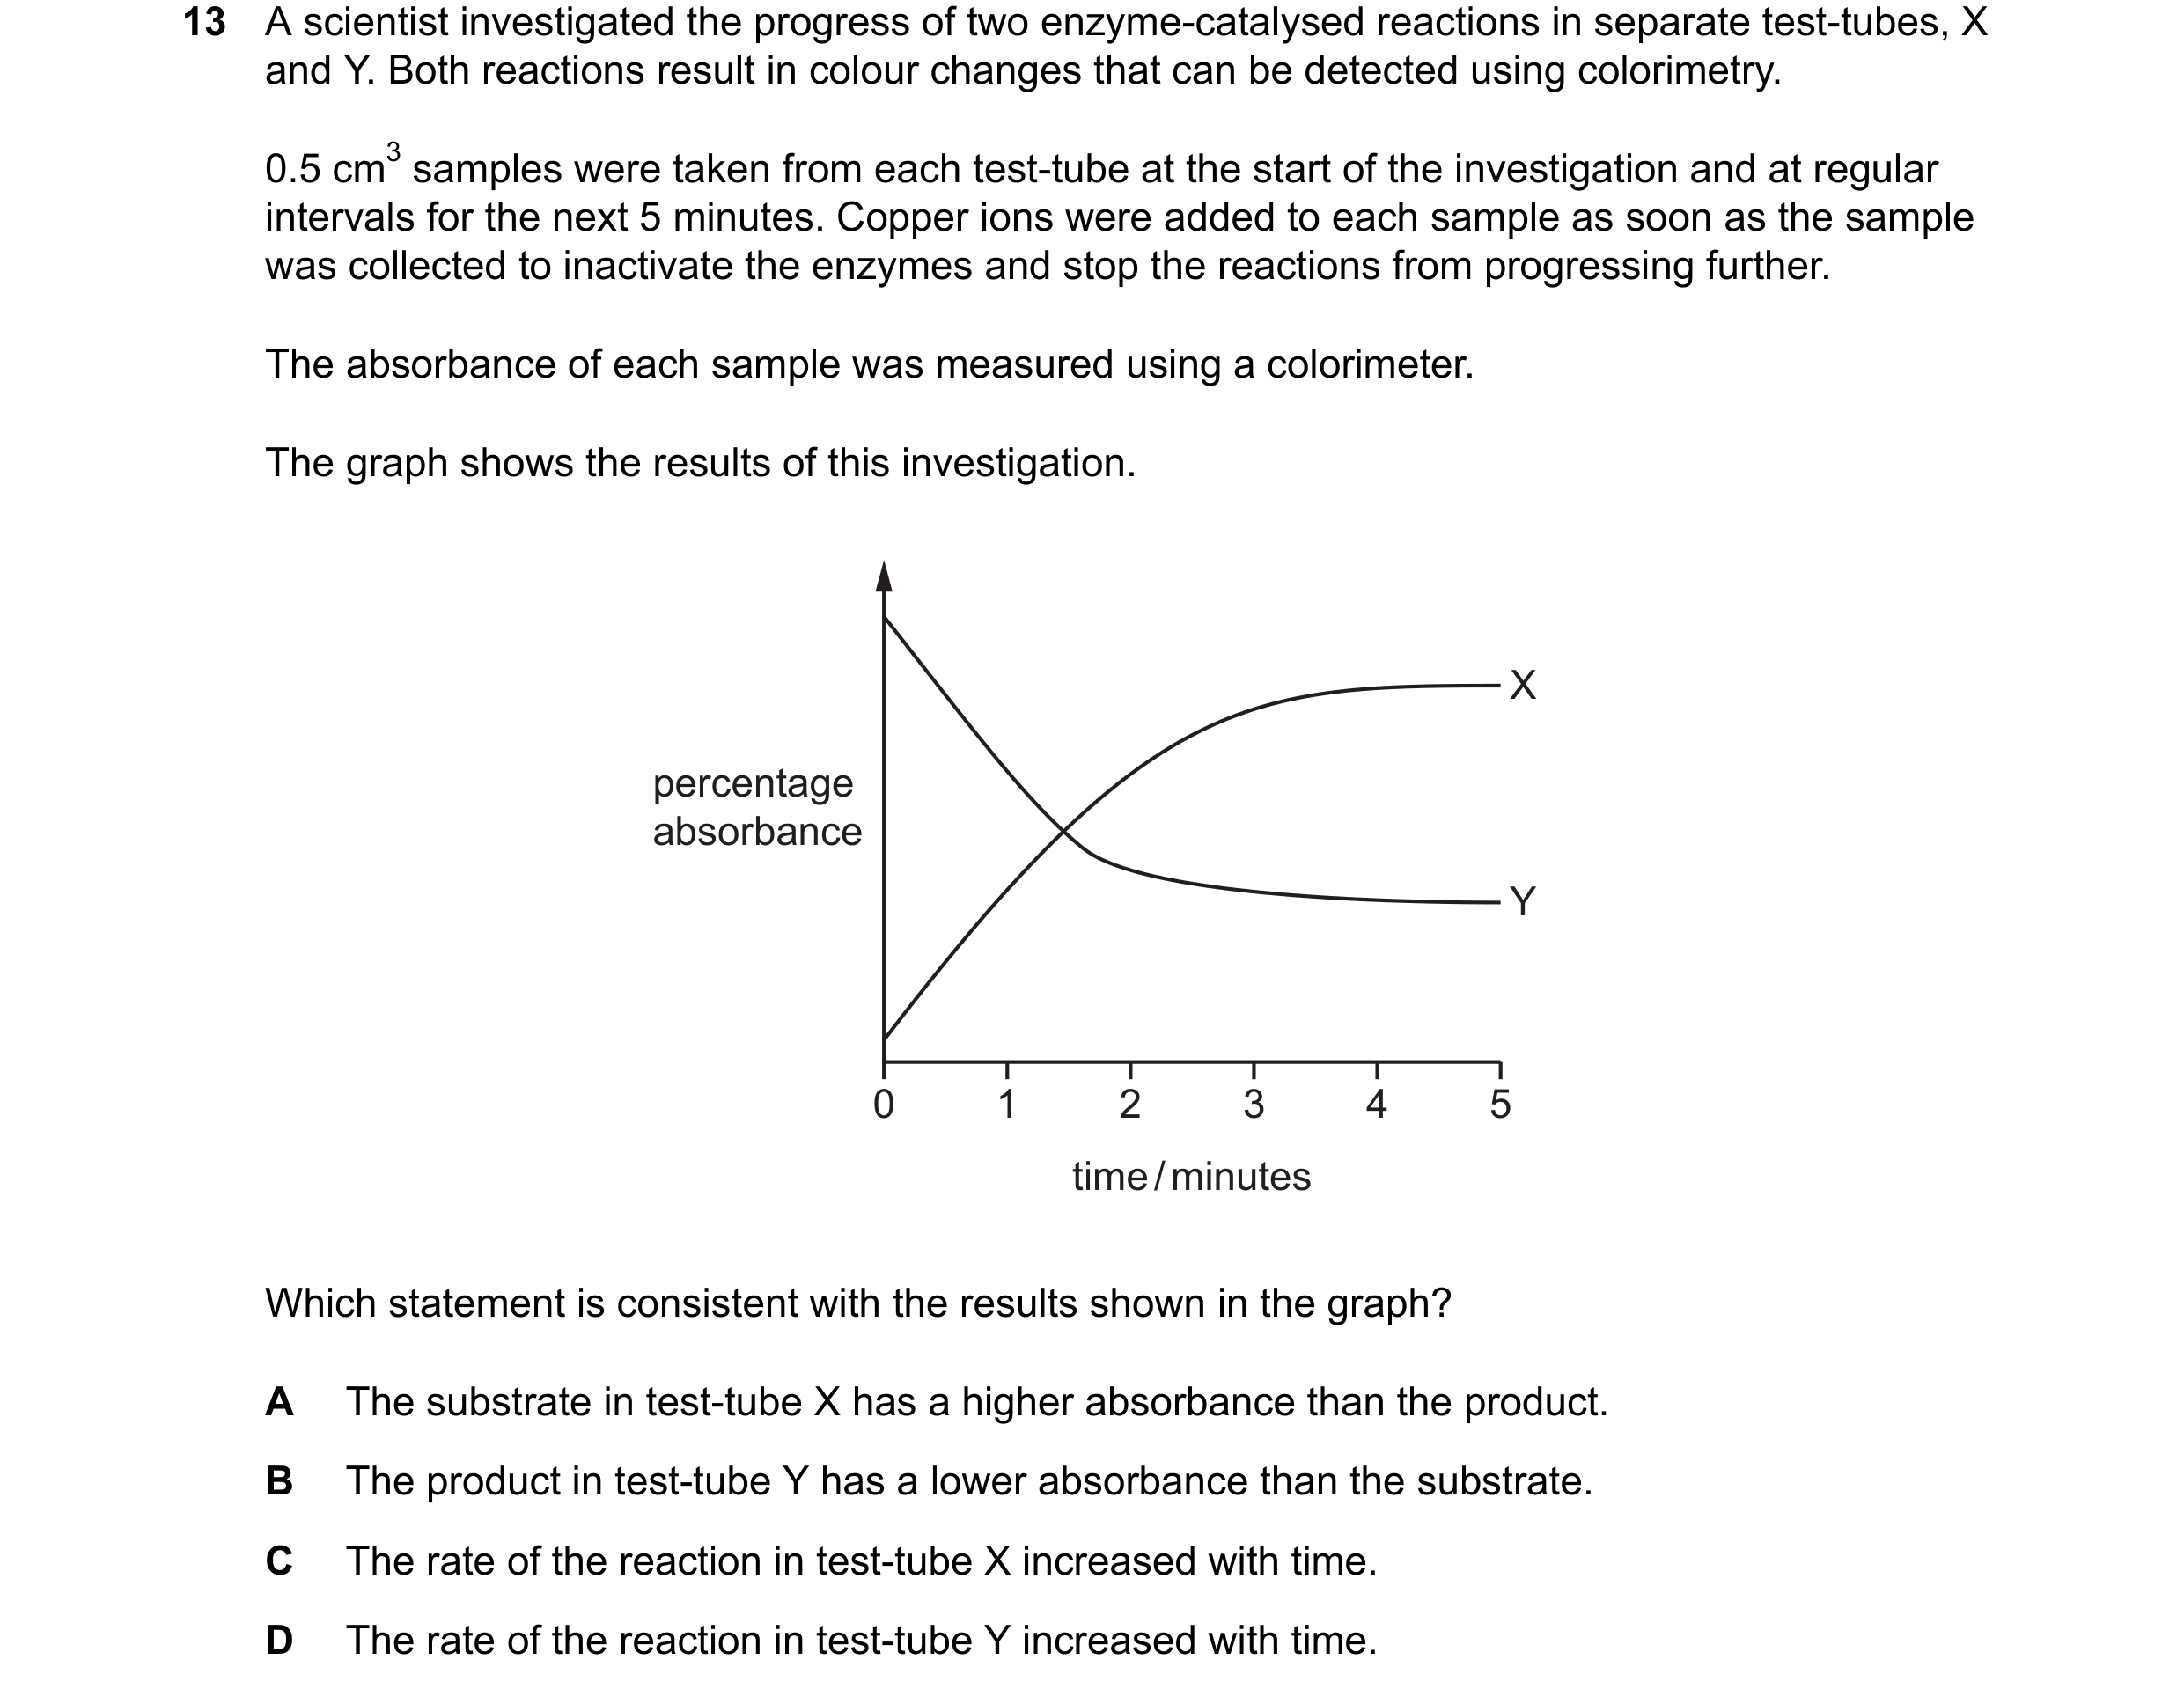 61 / 76
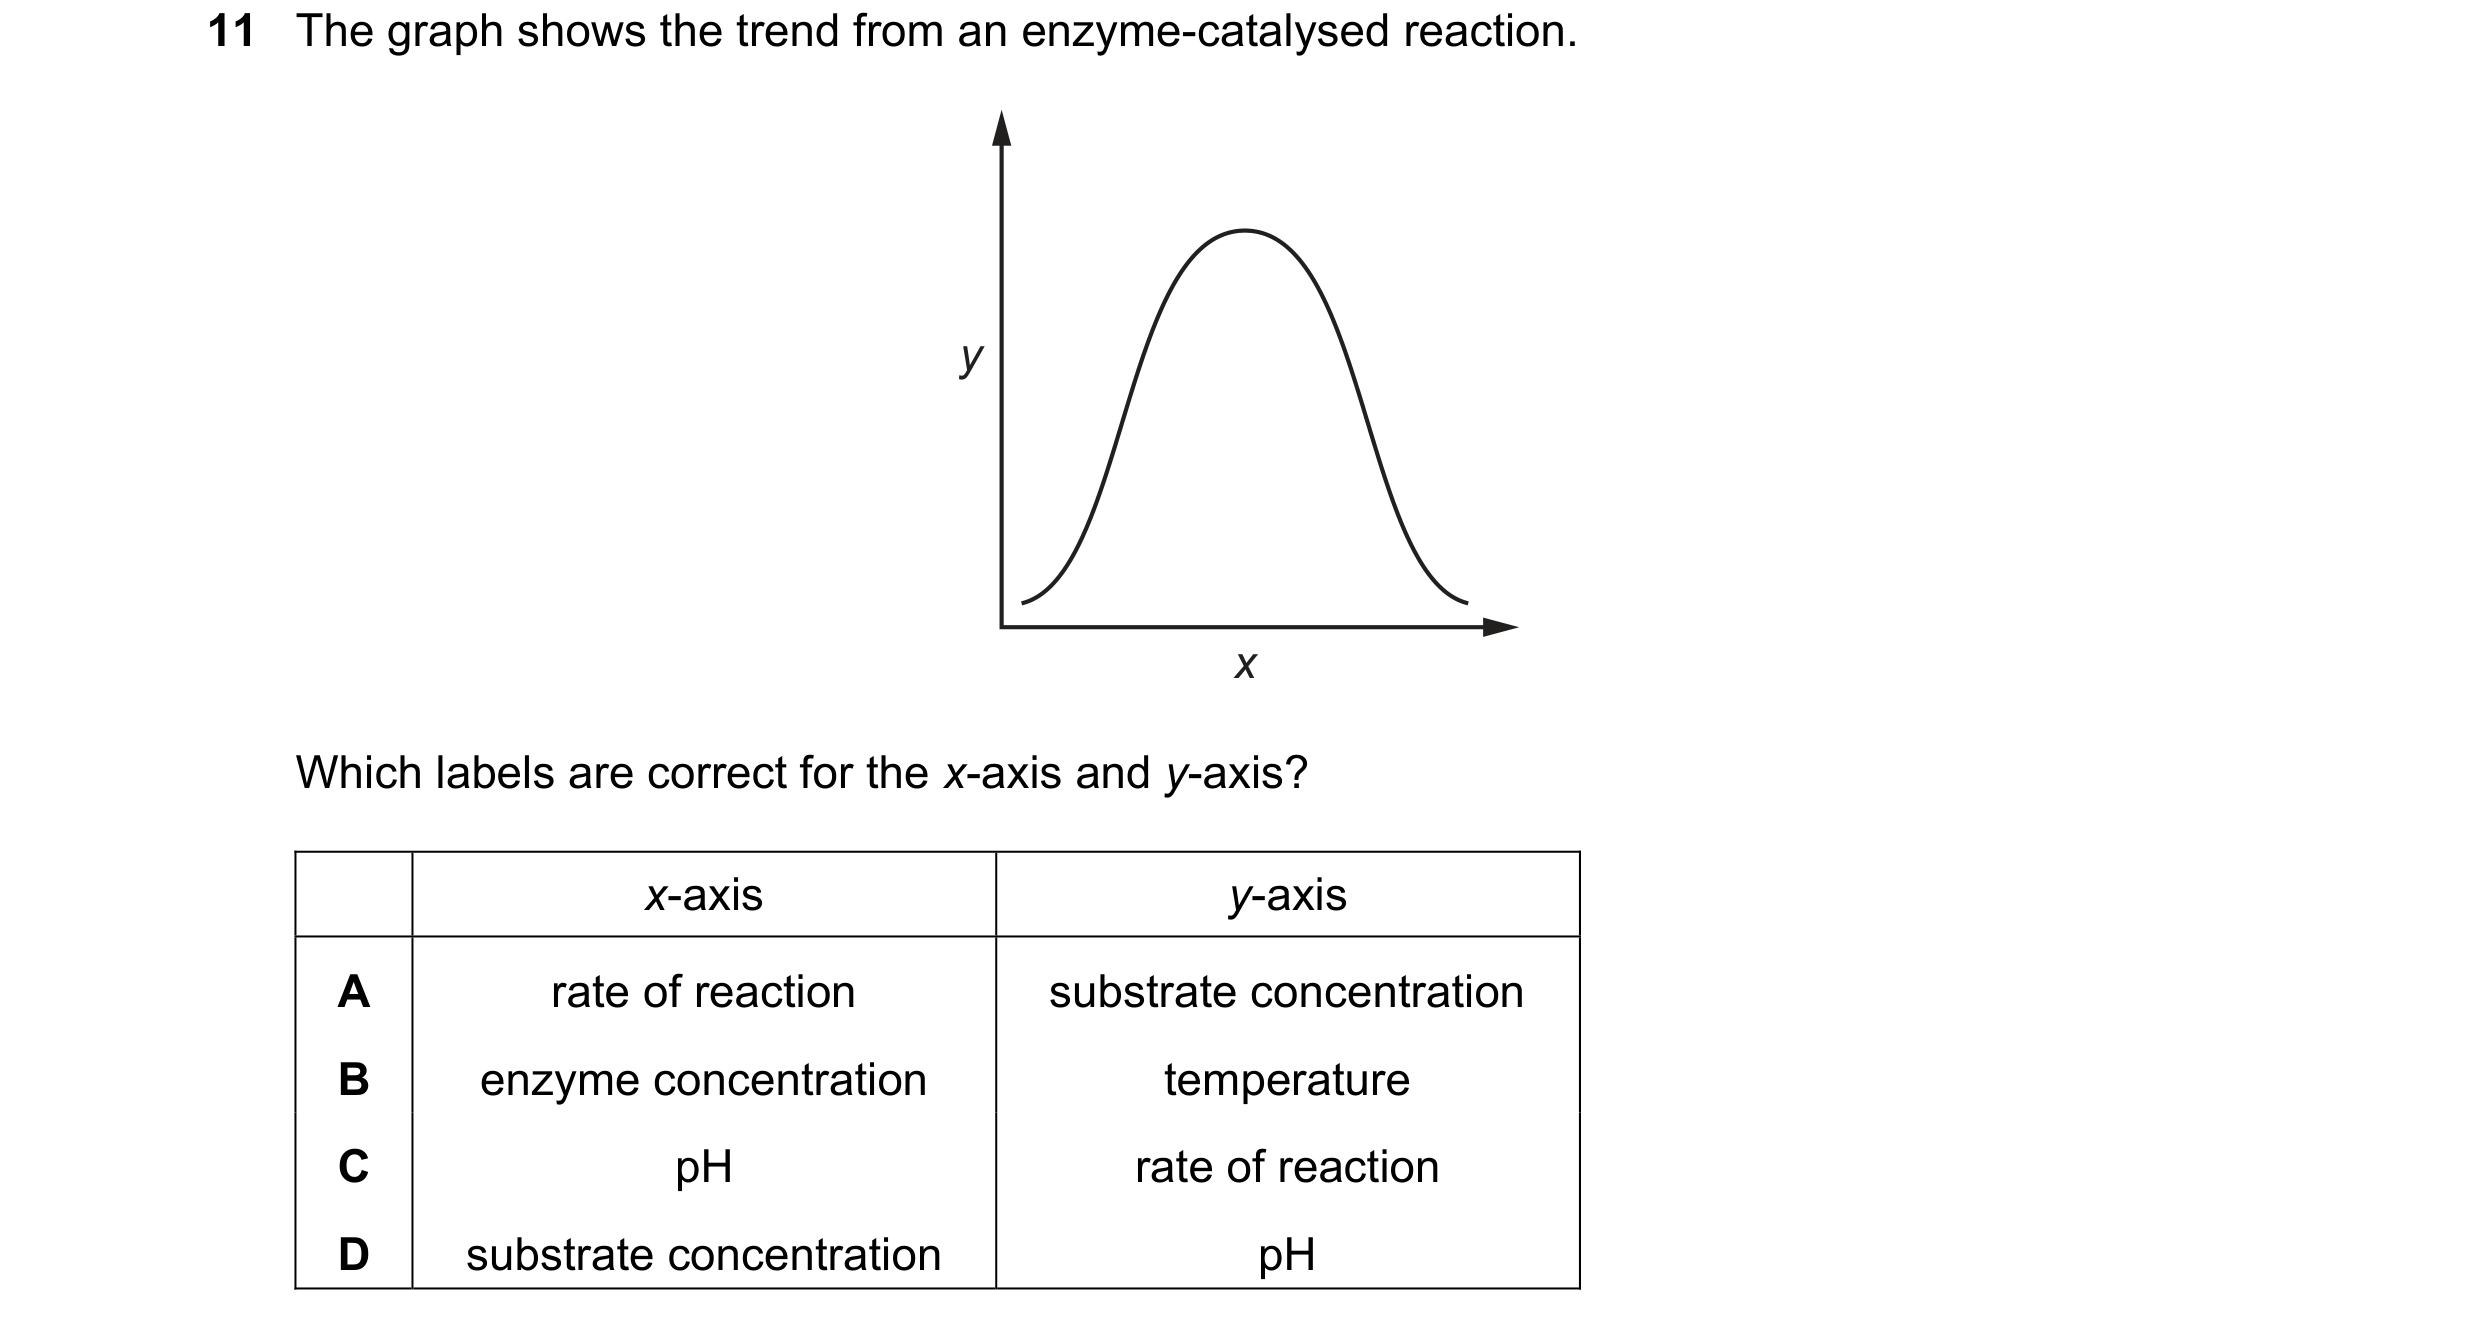
 62 / 76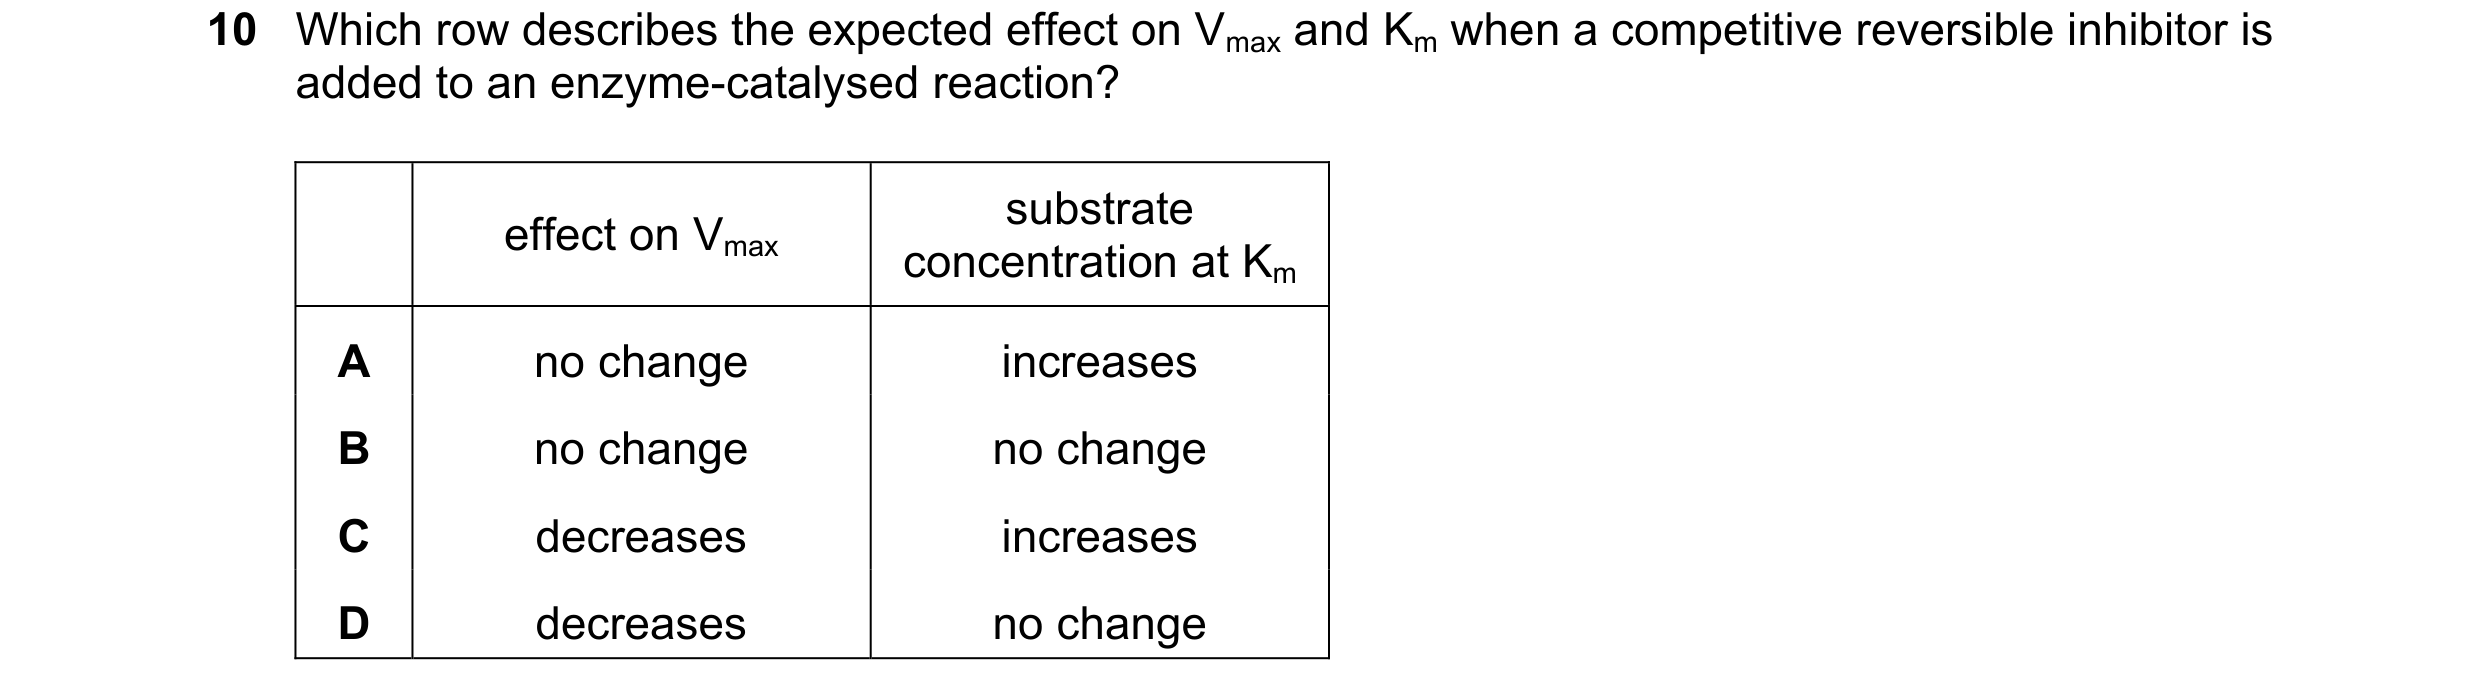
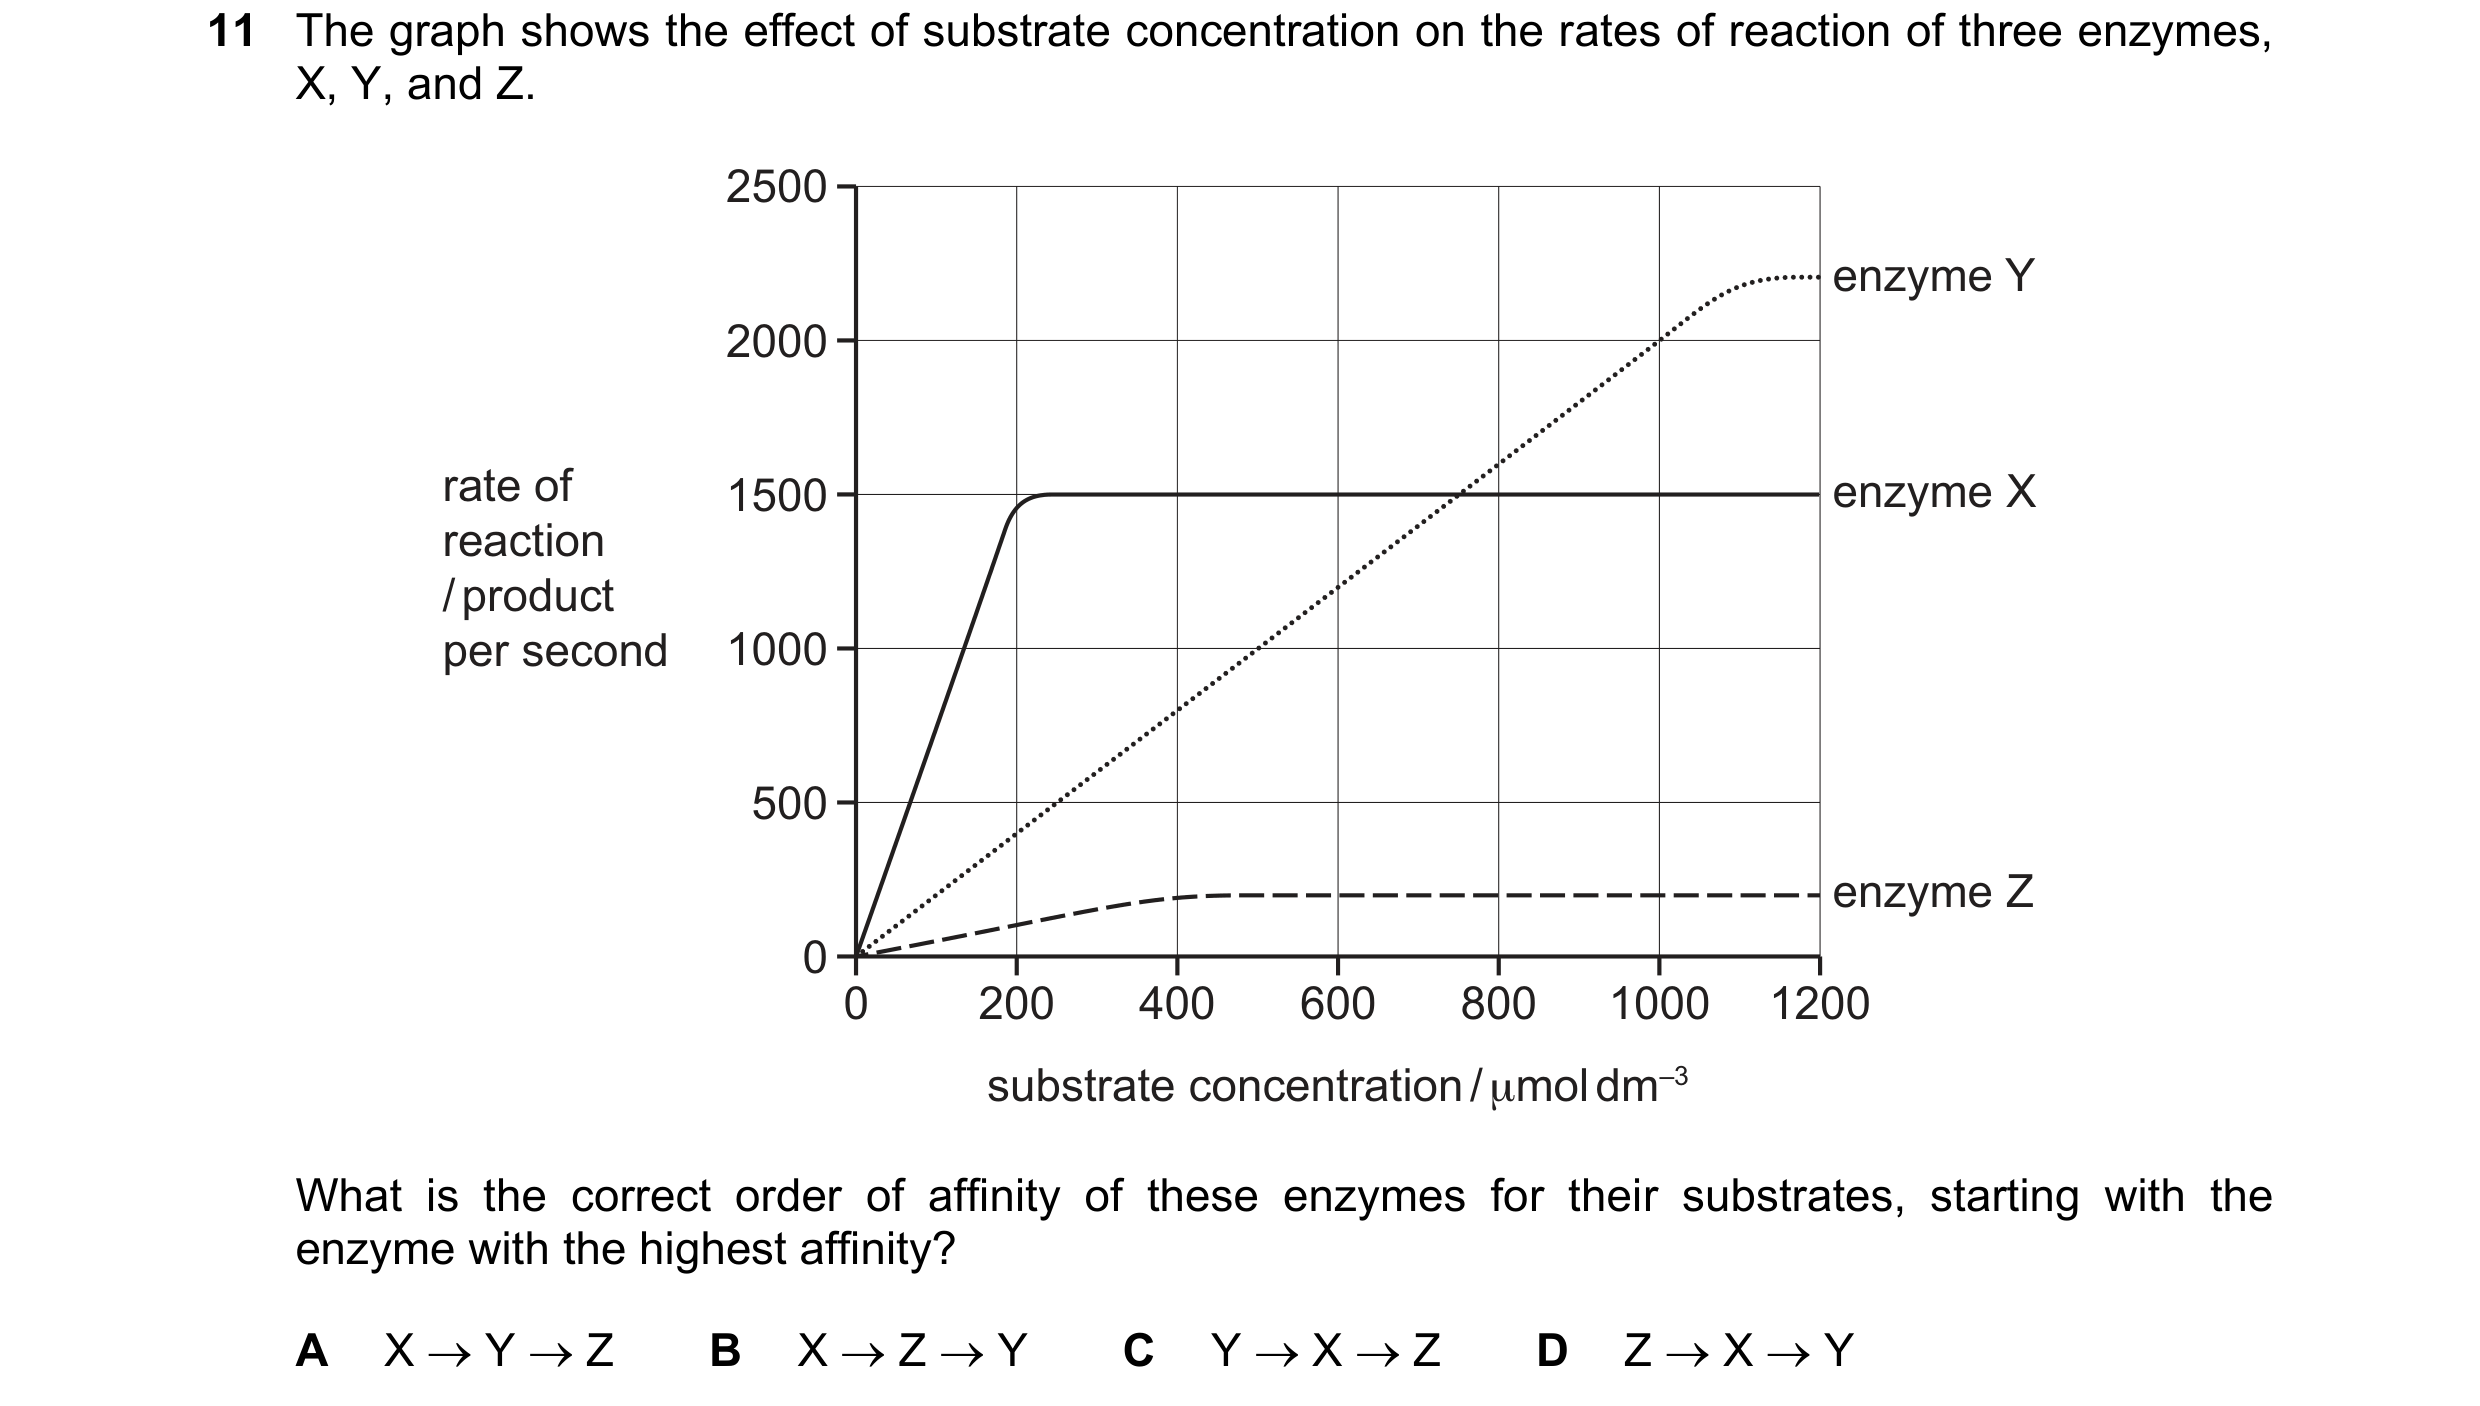
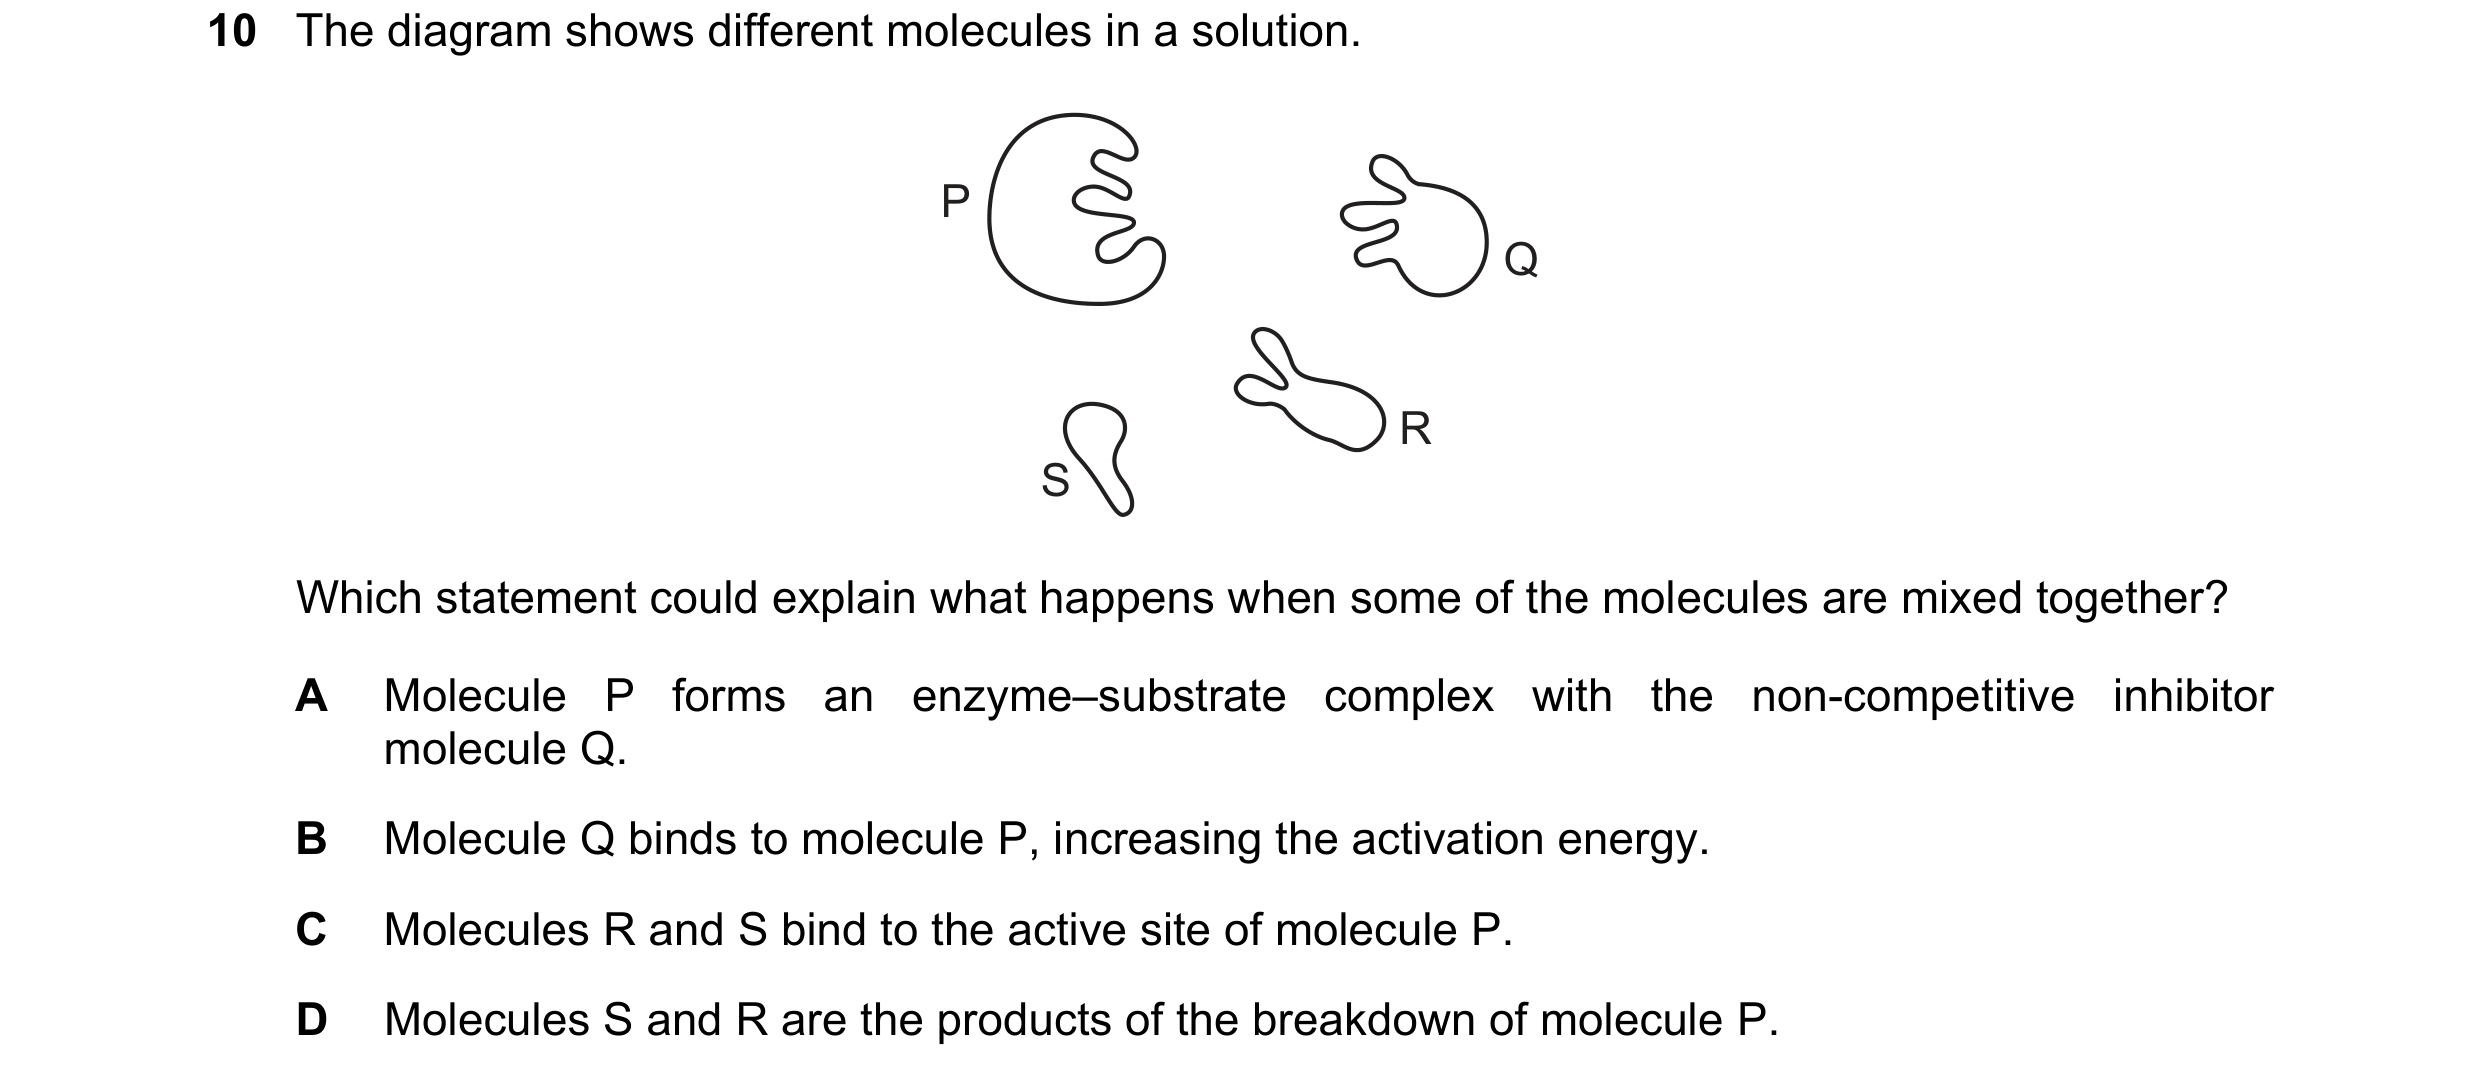 63 / 76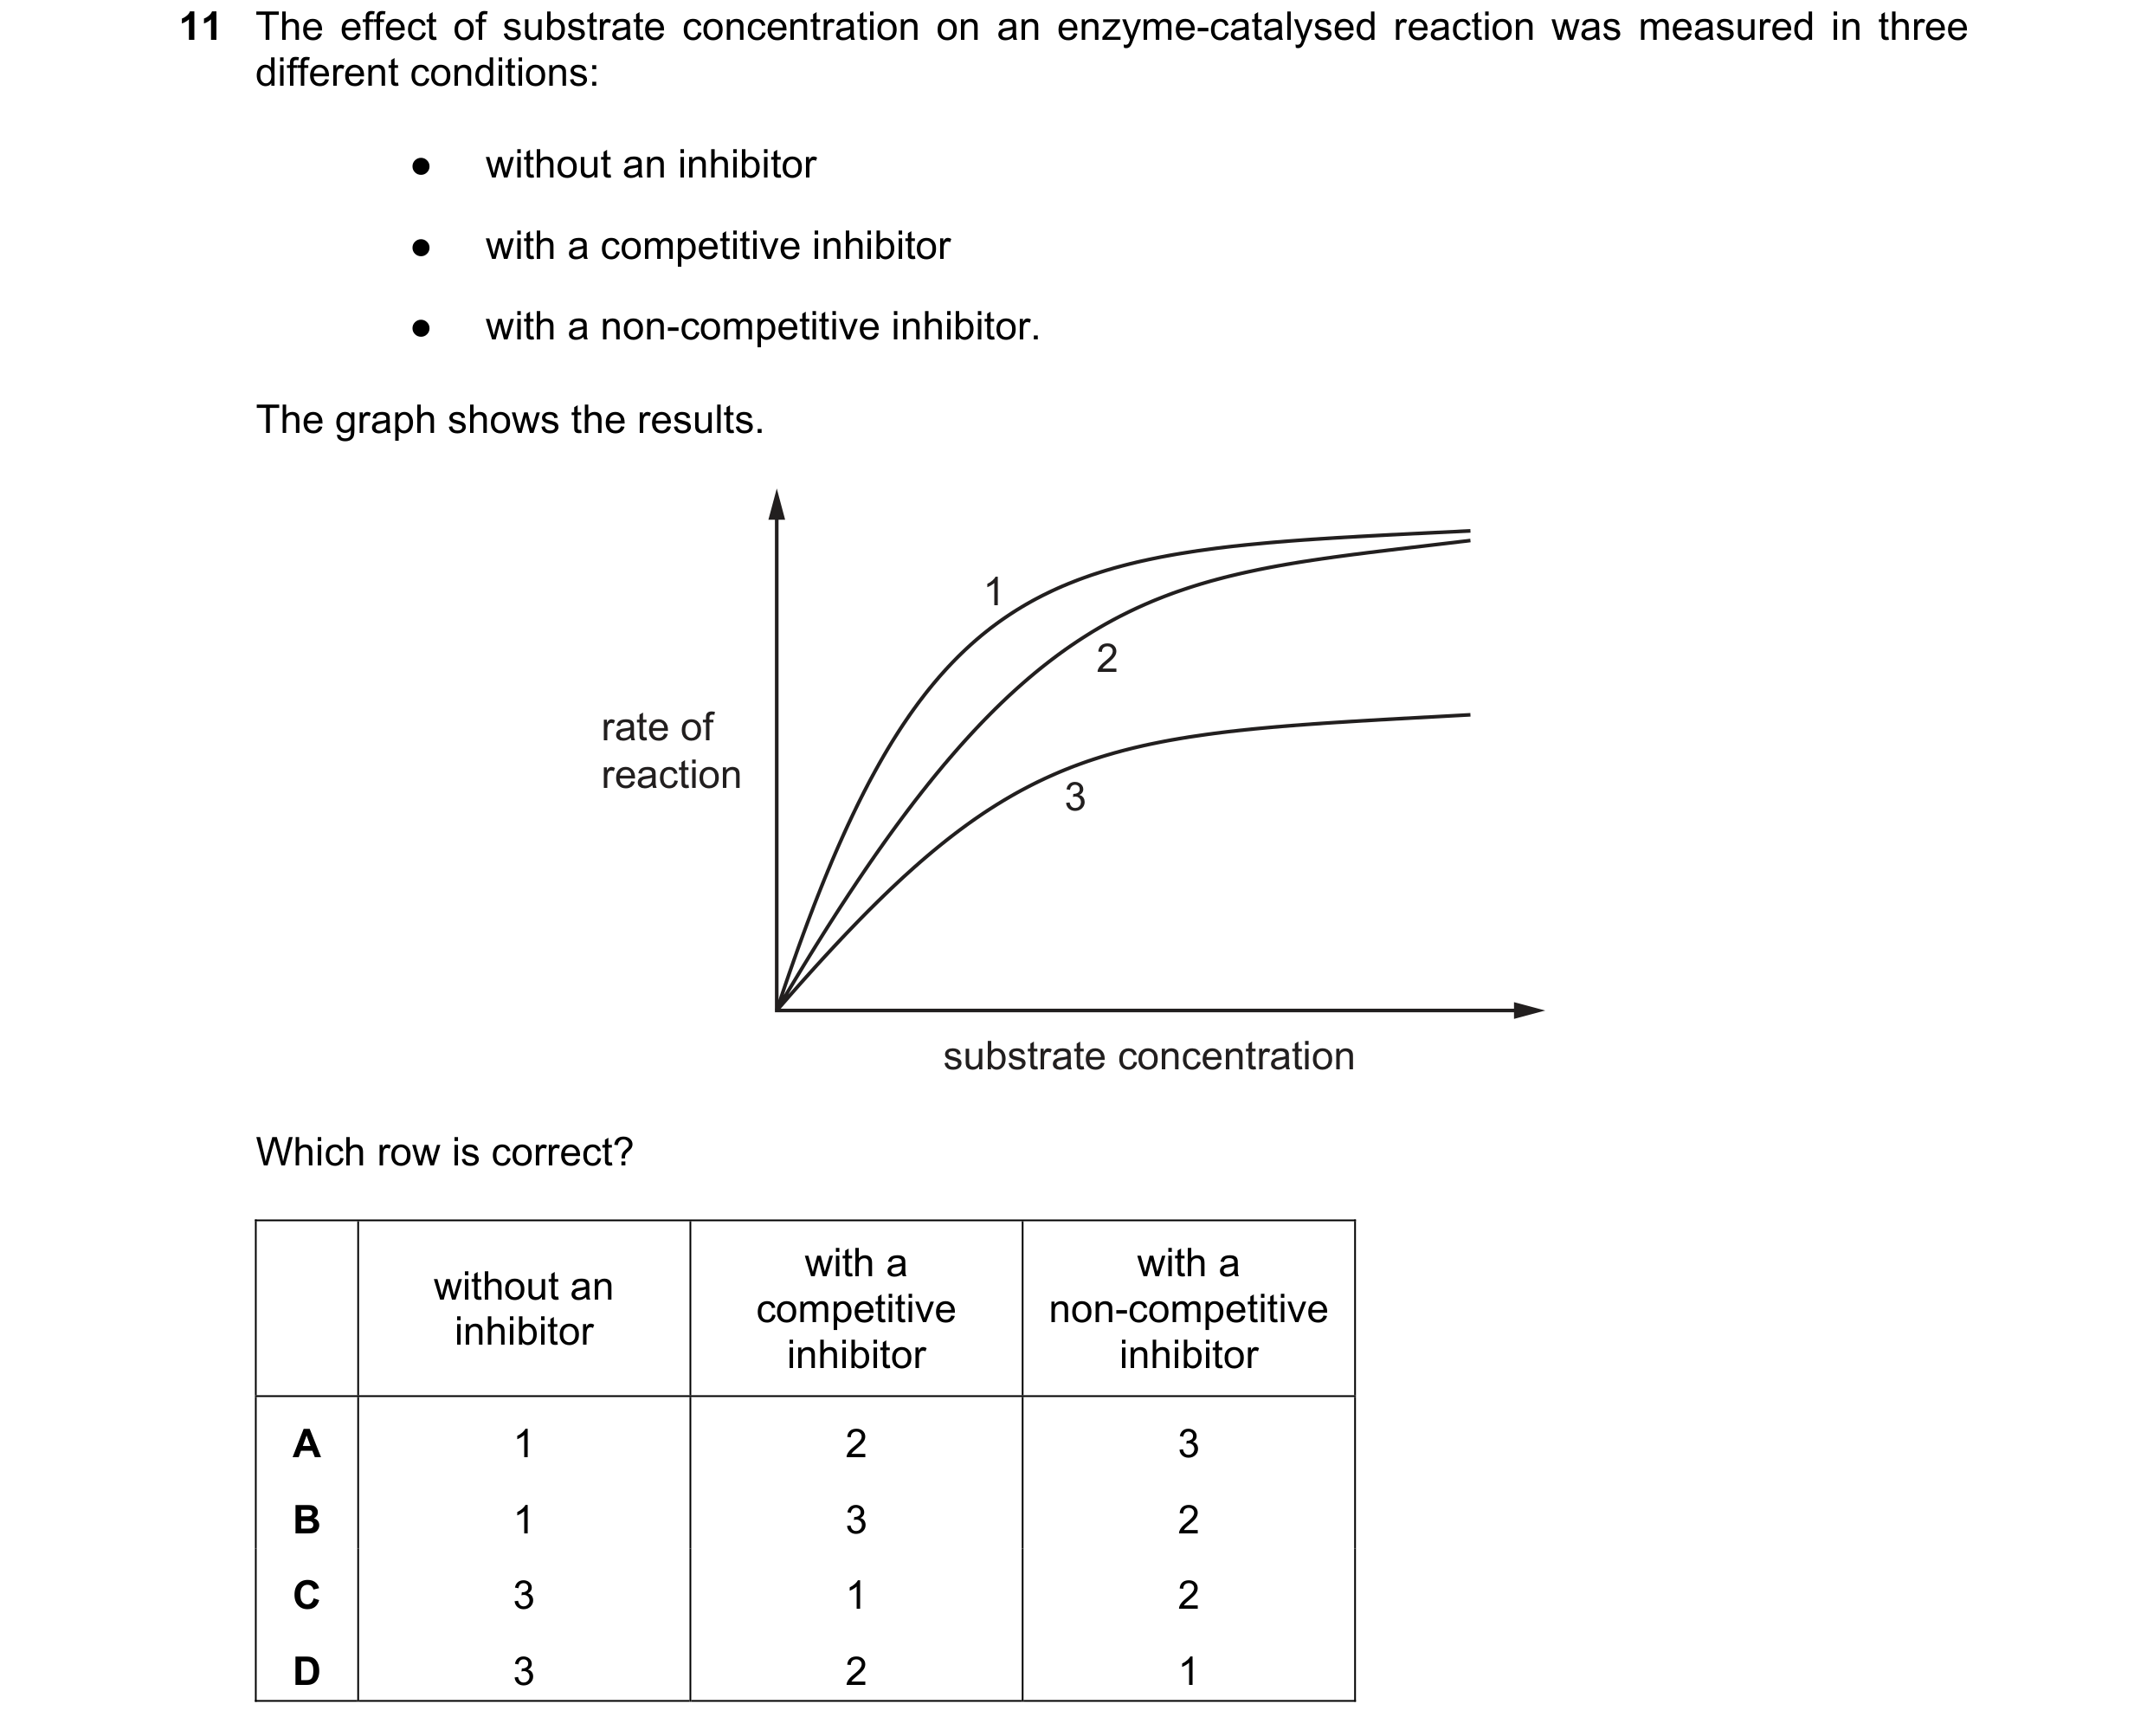
 64 / 76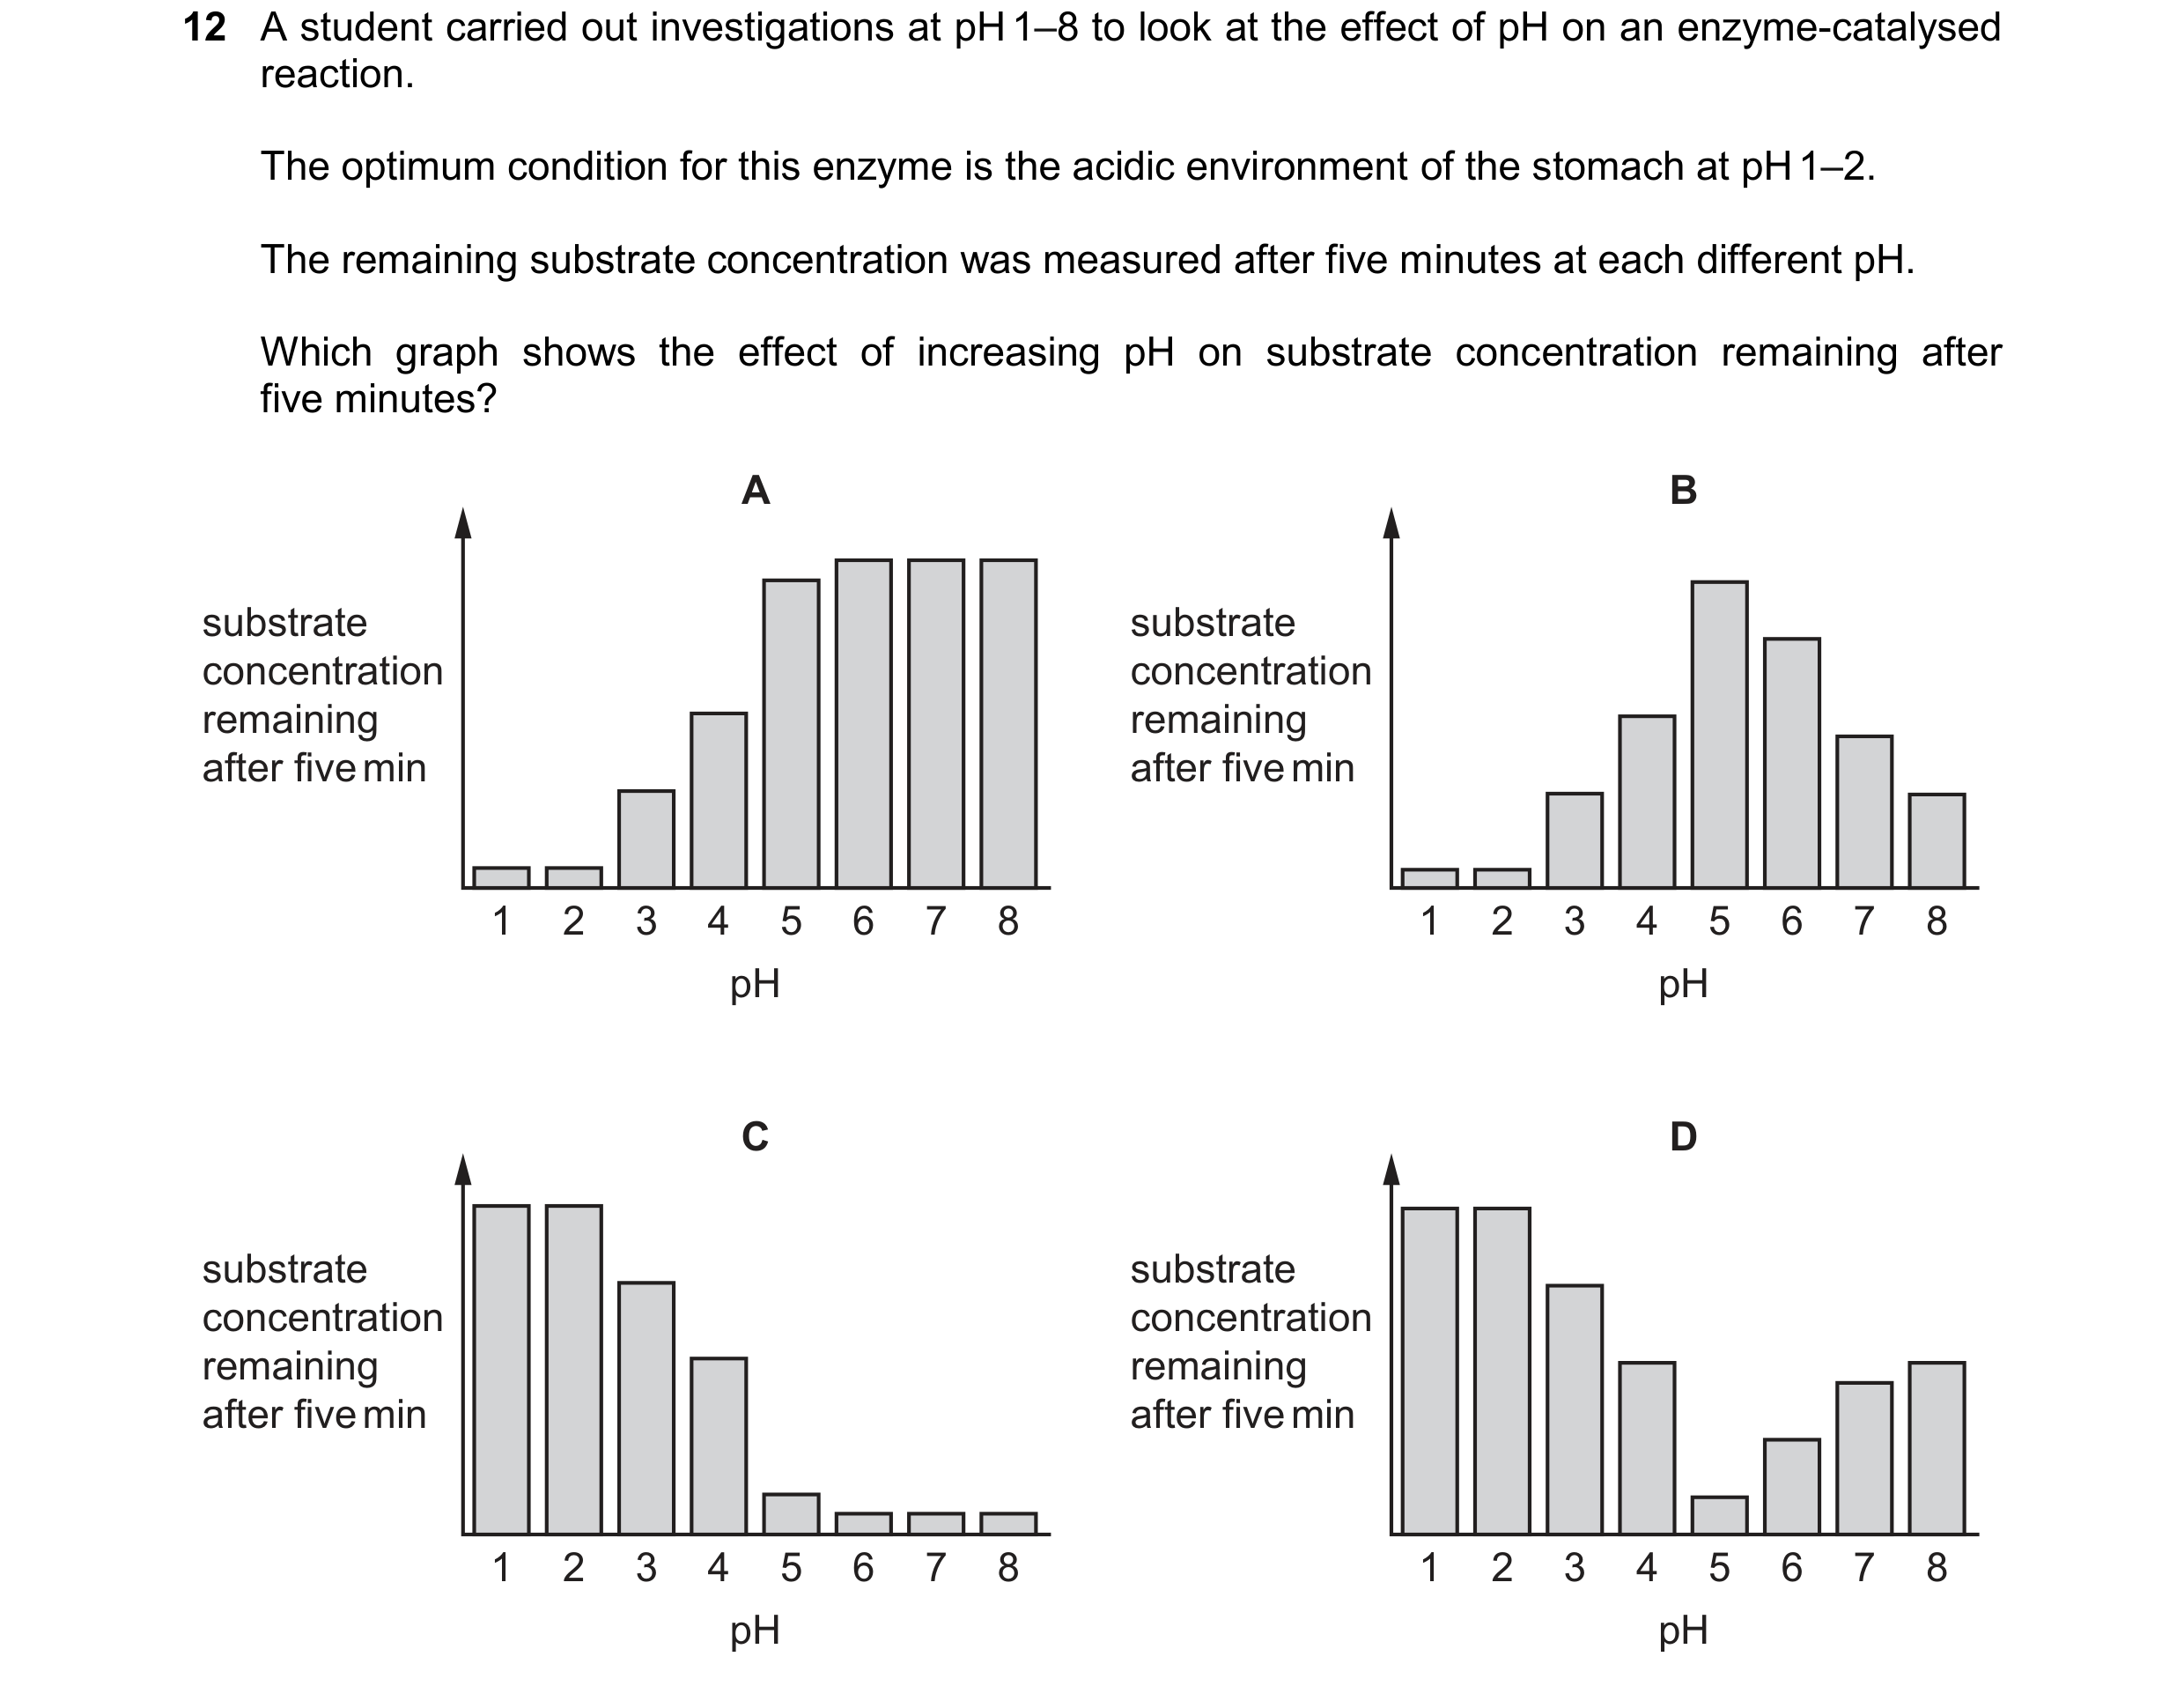
 65 / 76
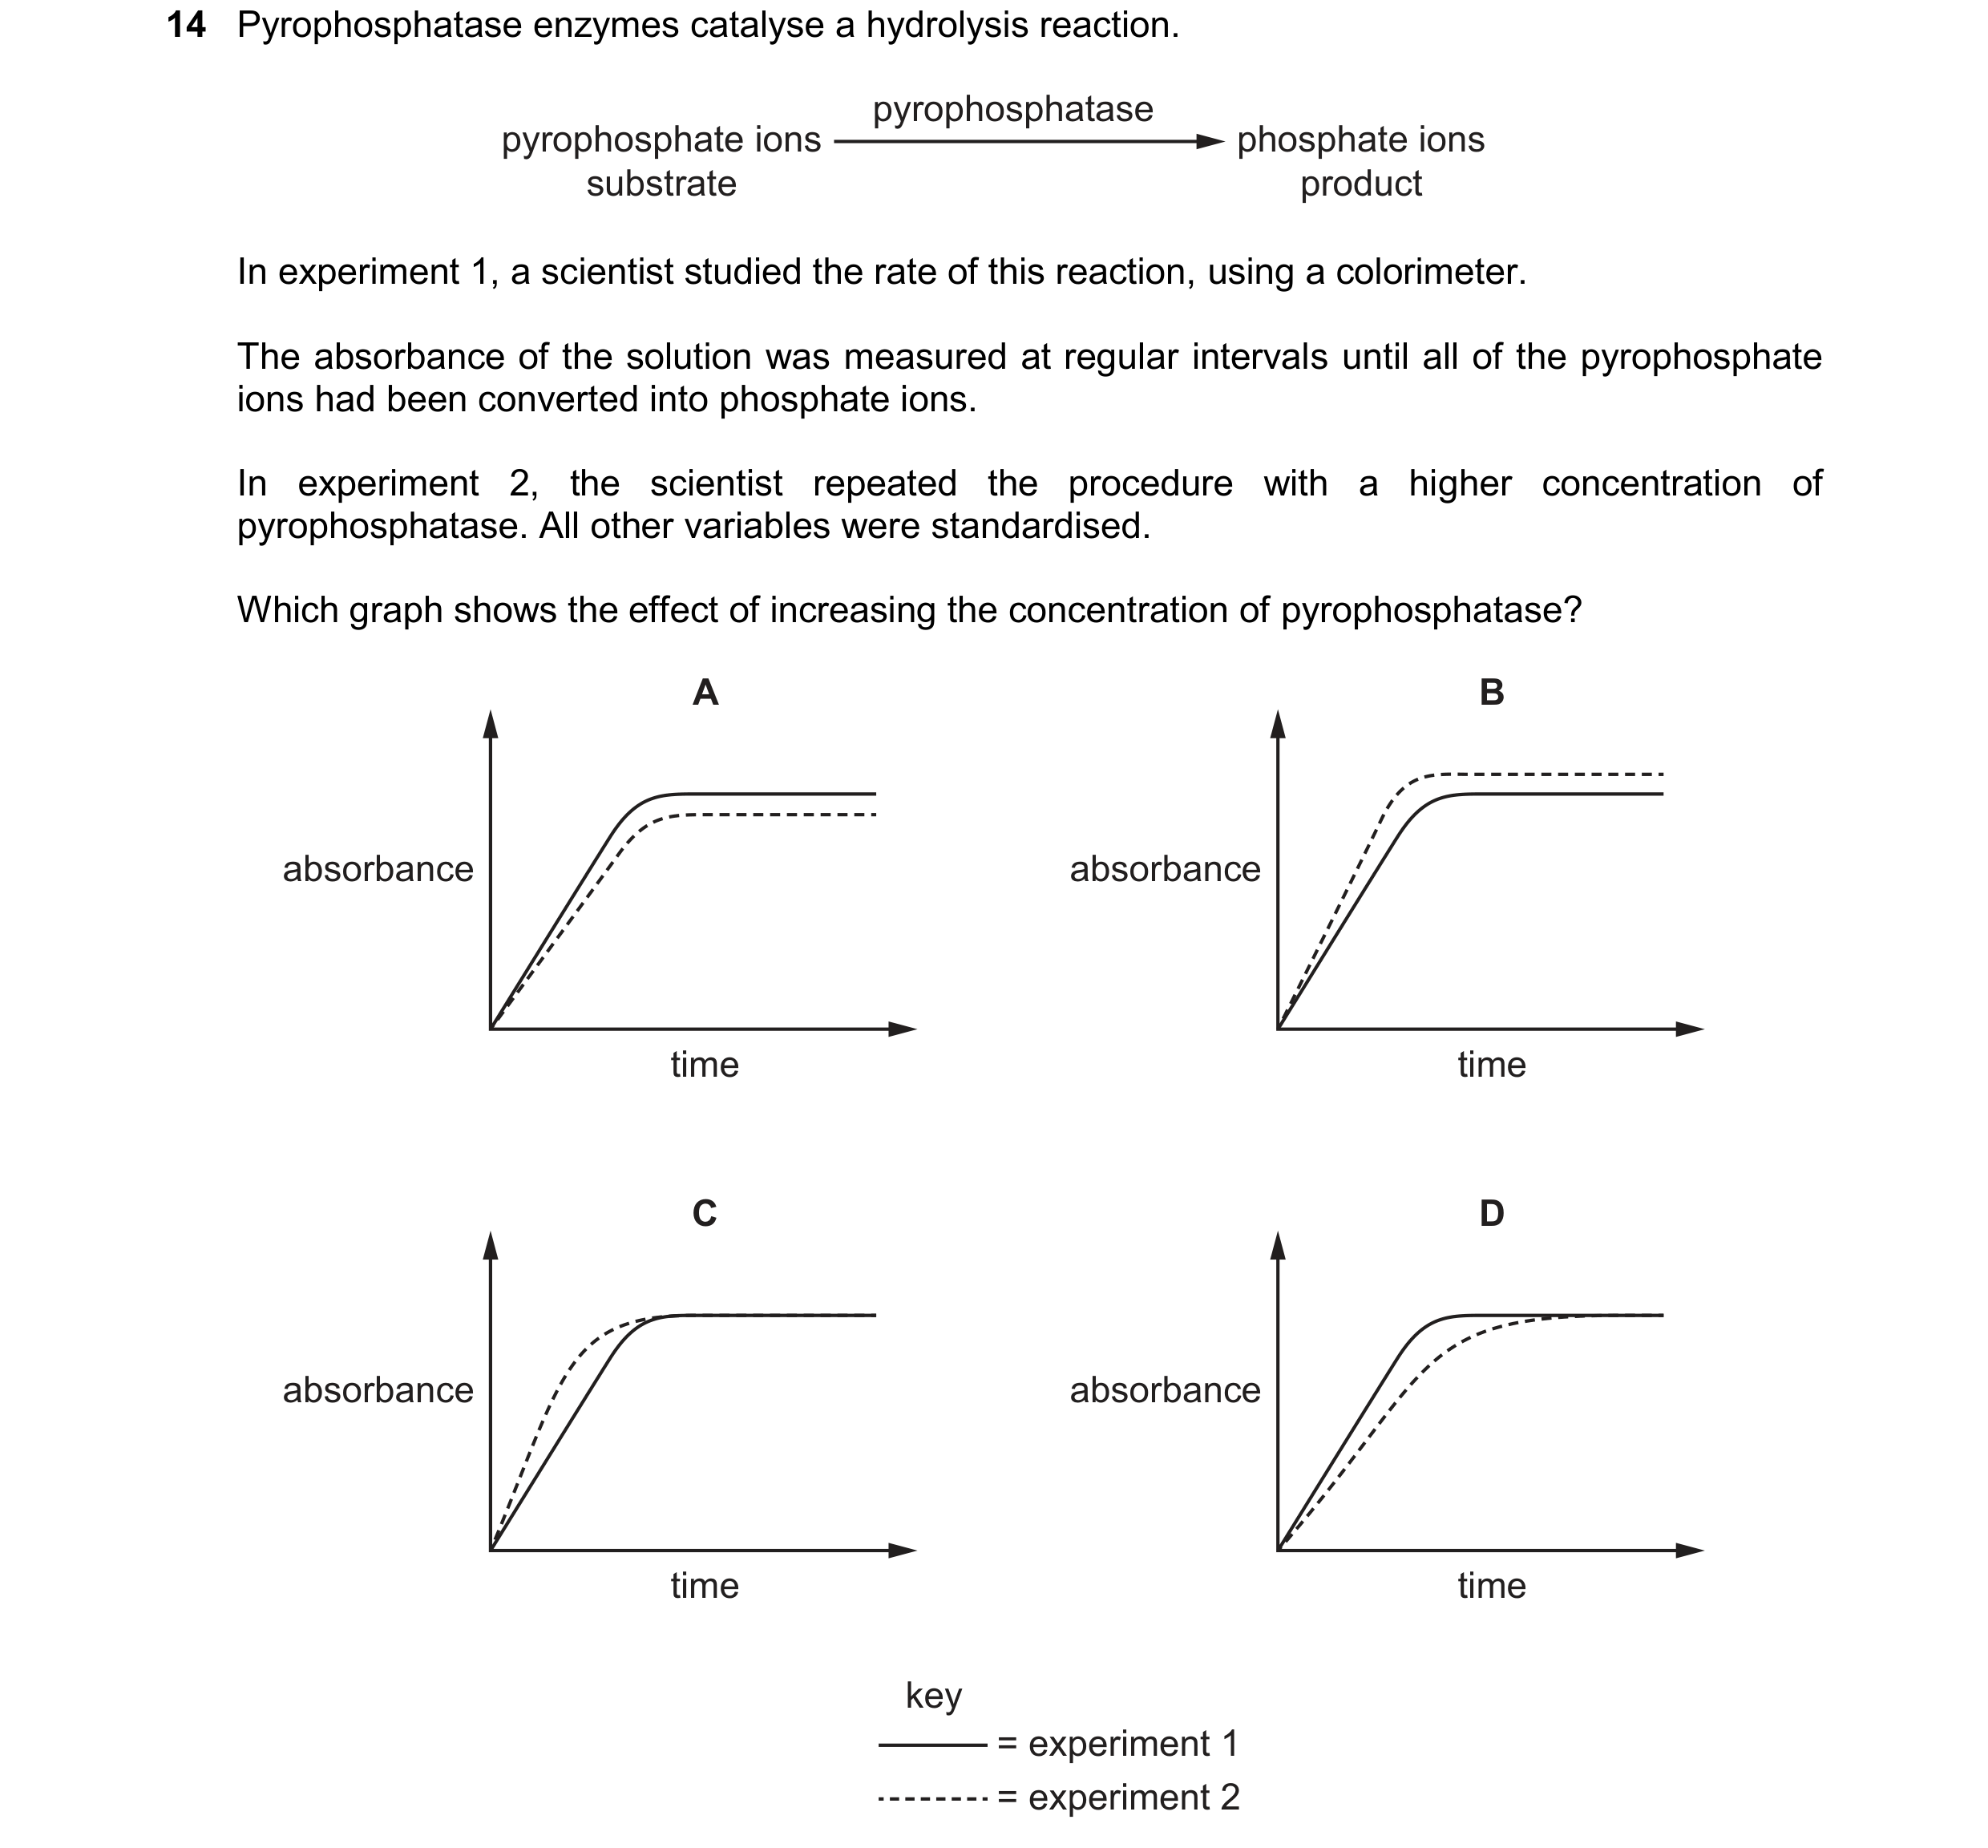 66 / 76
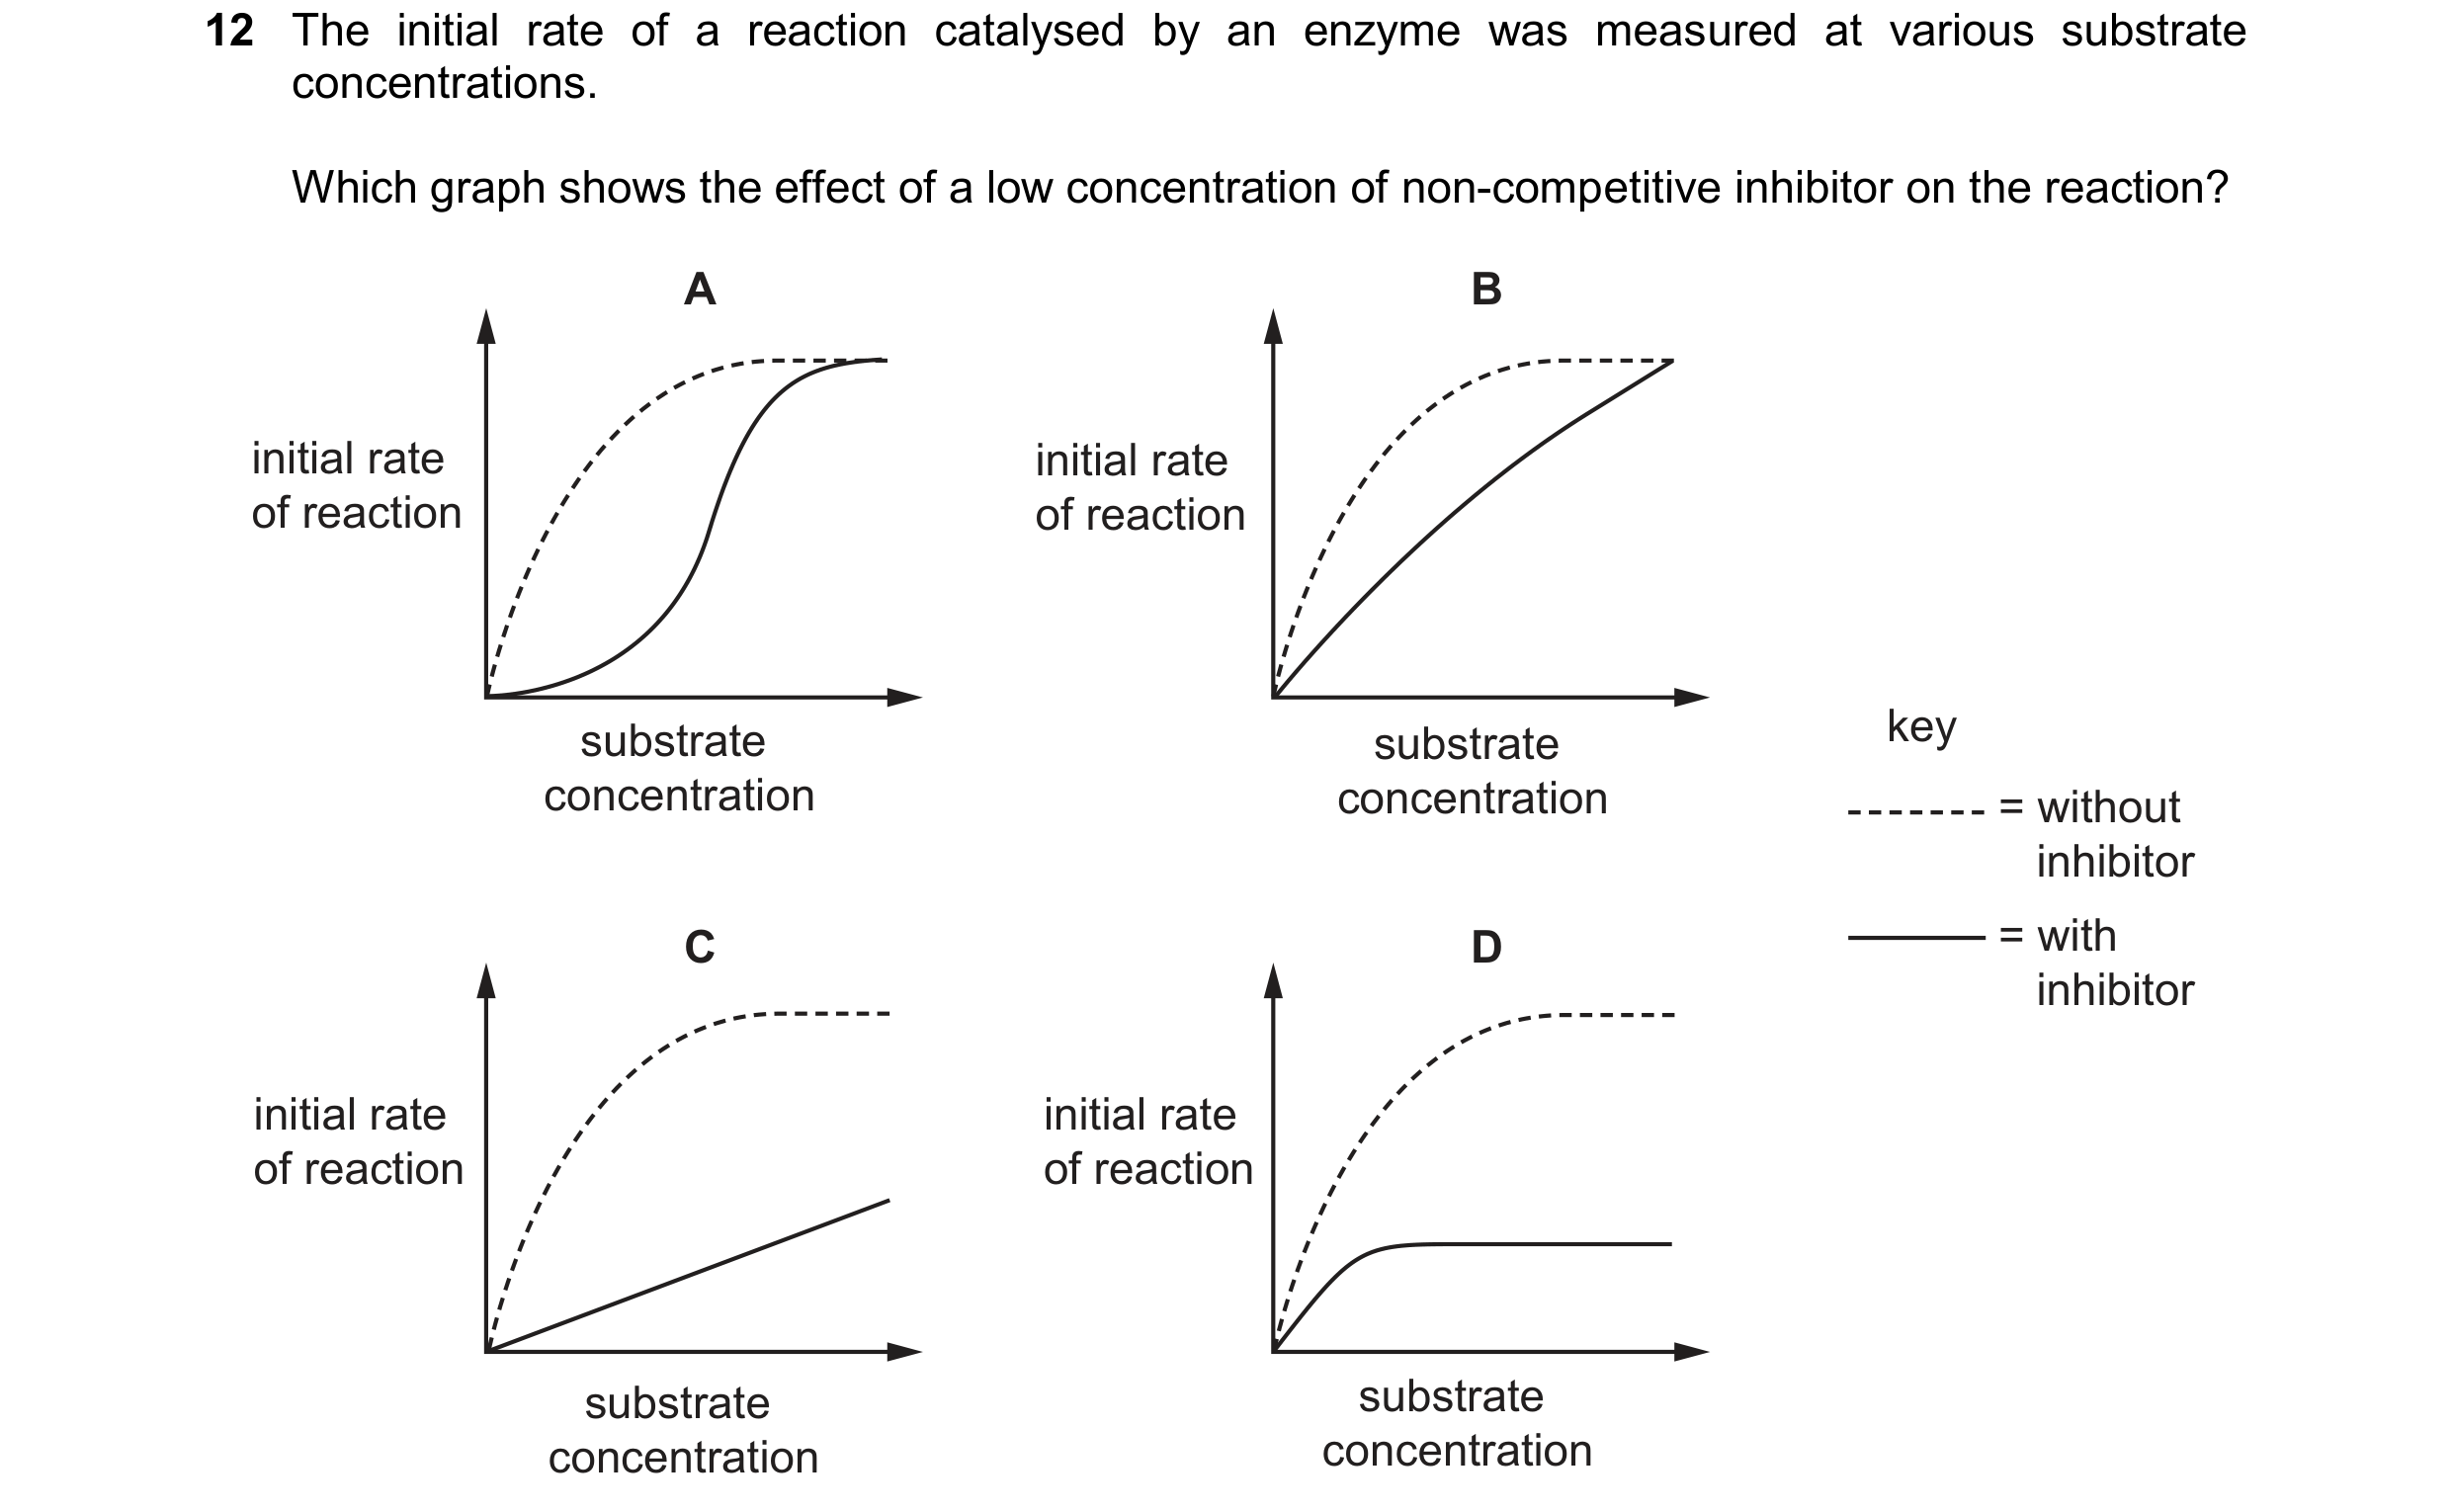 67 / 76
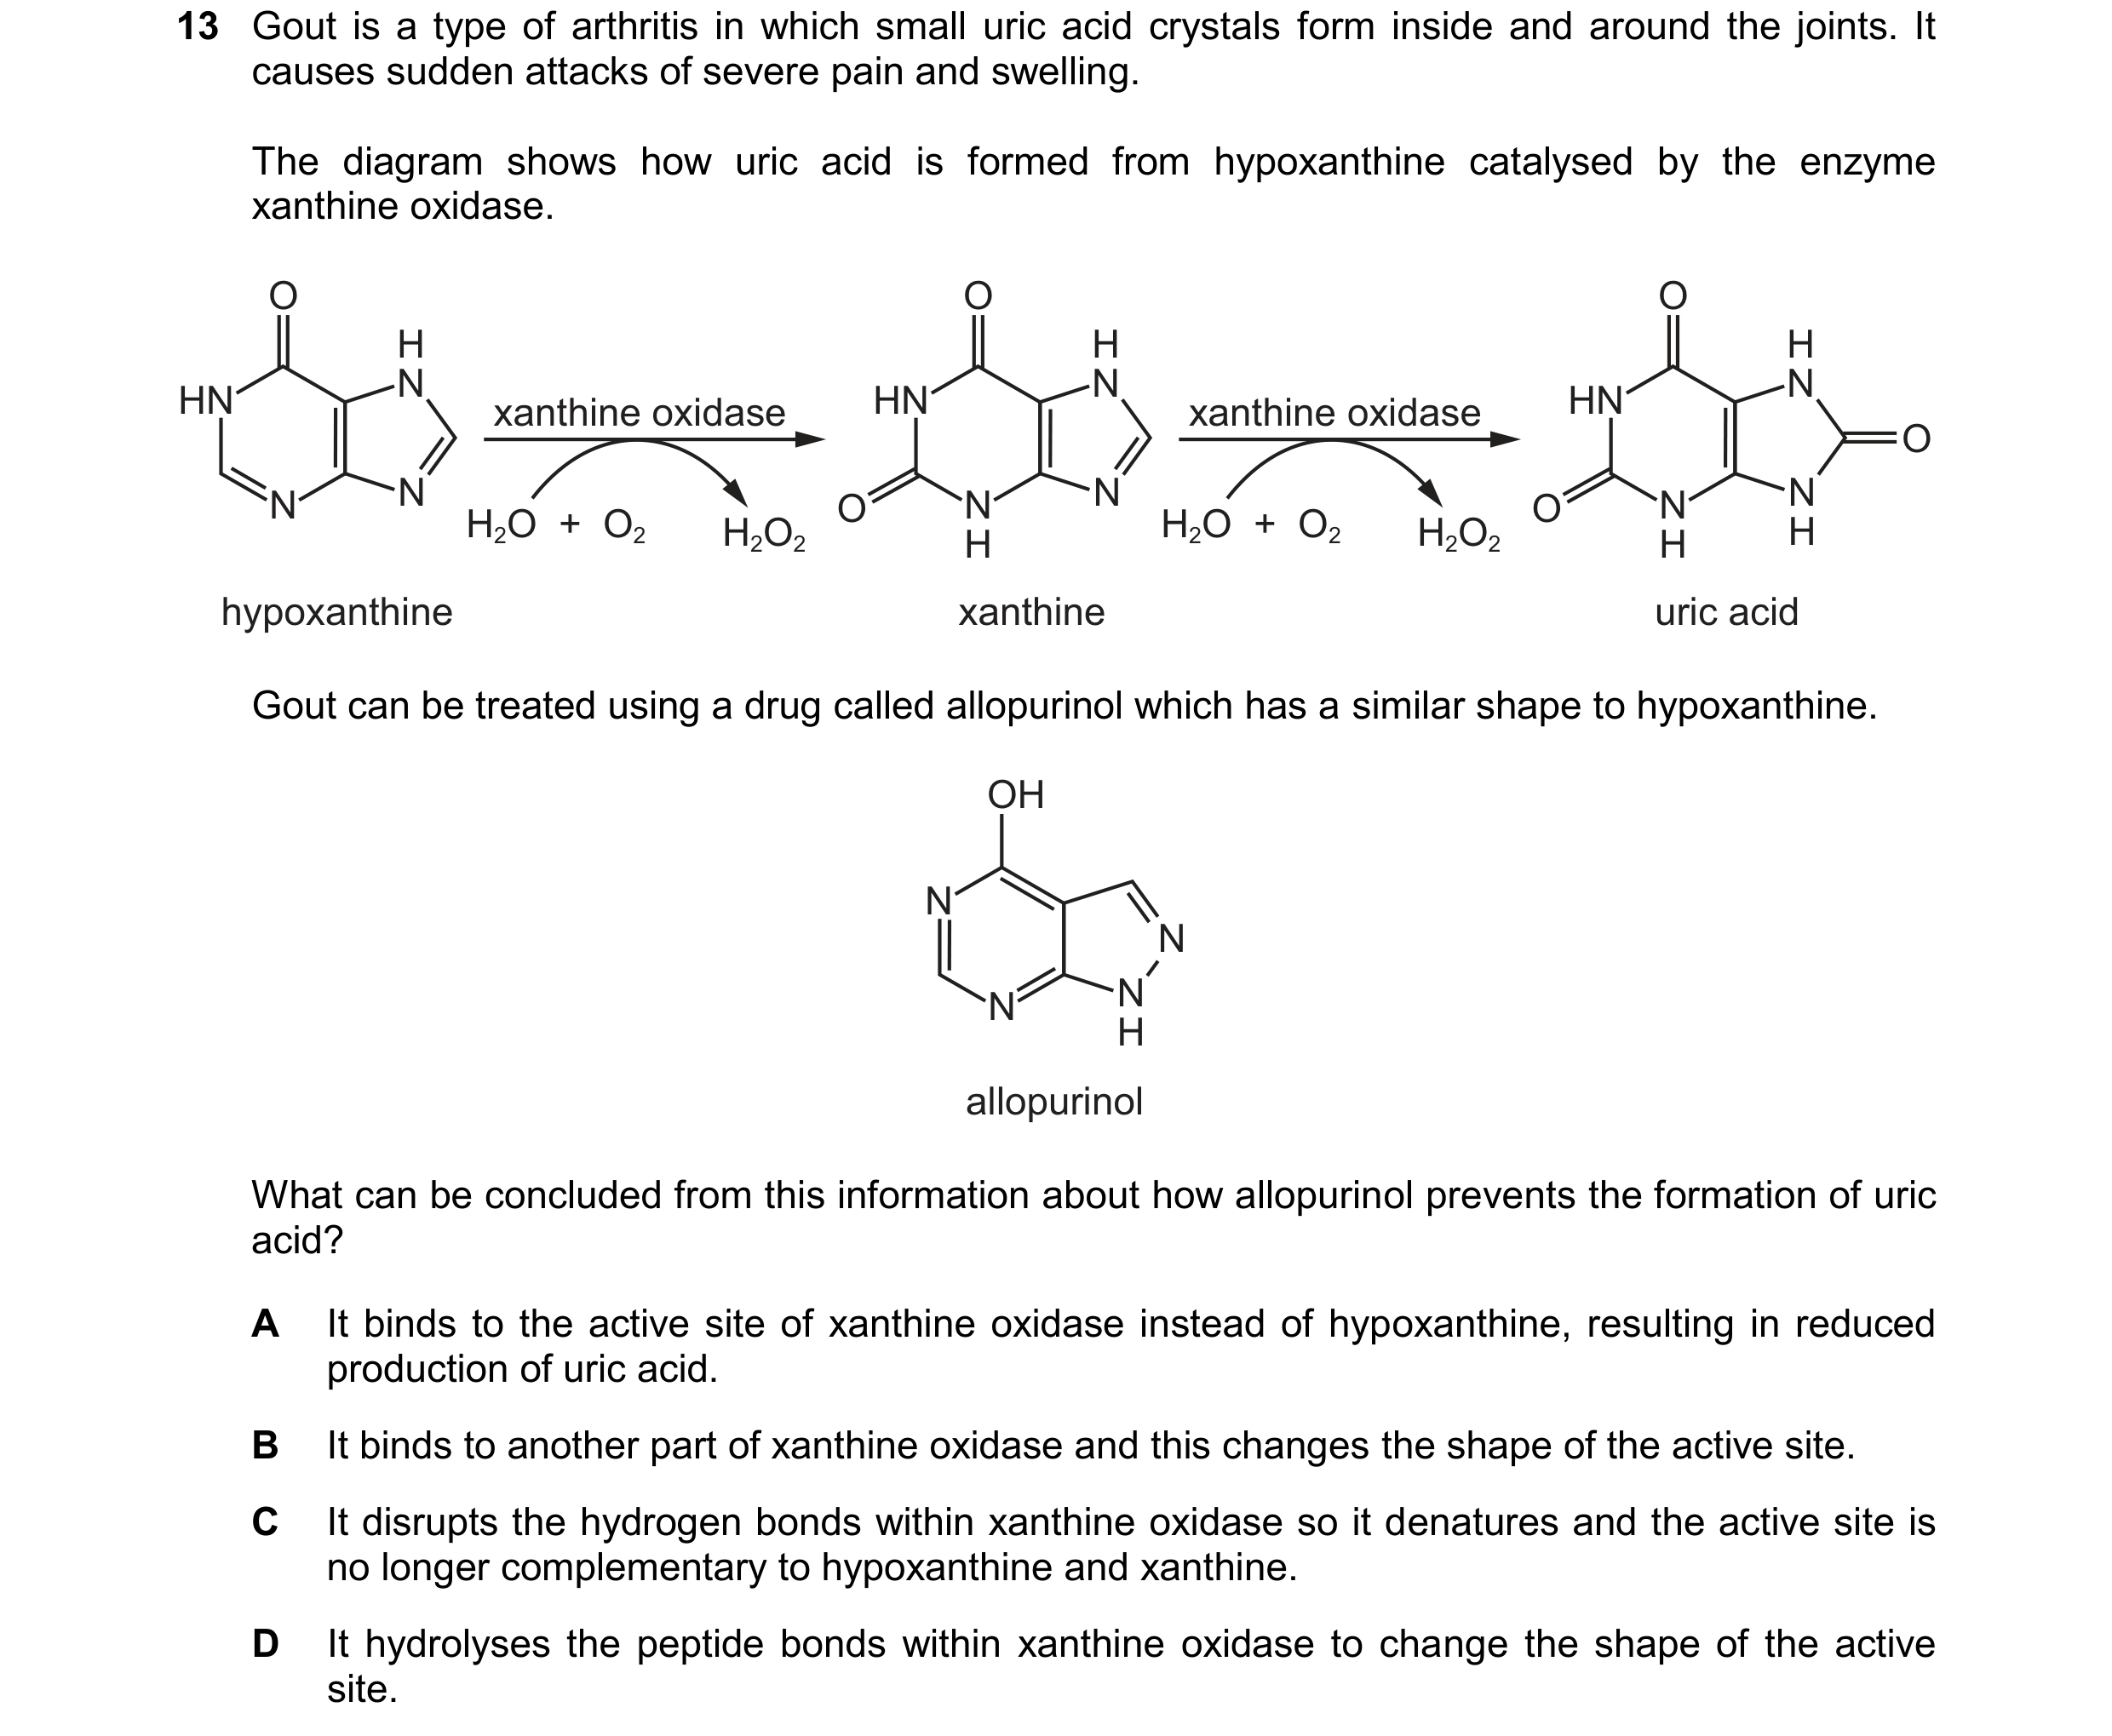 68 / 76
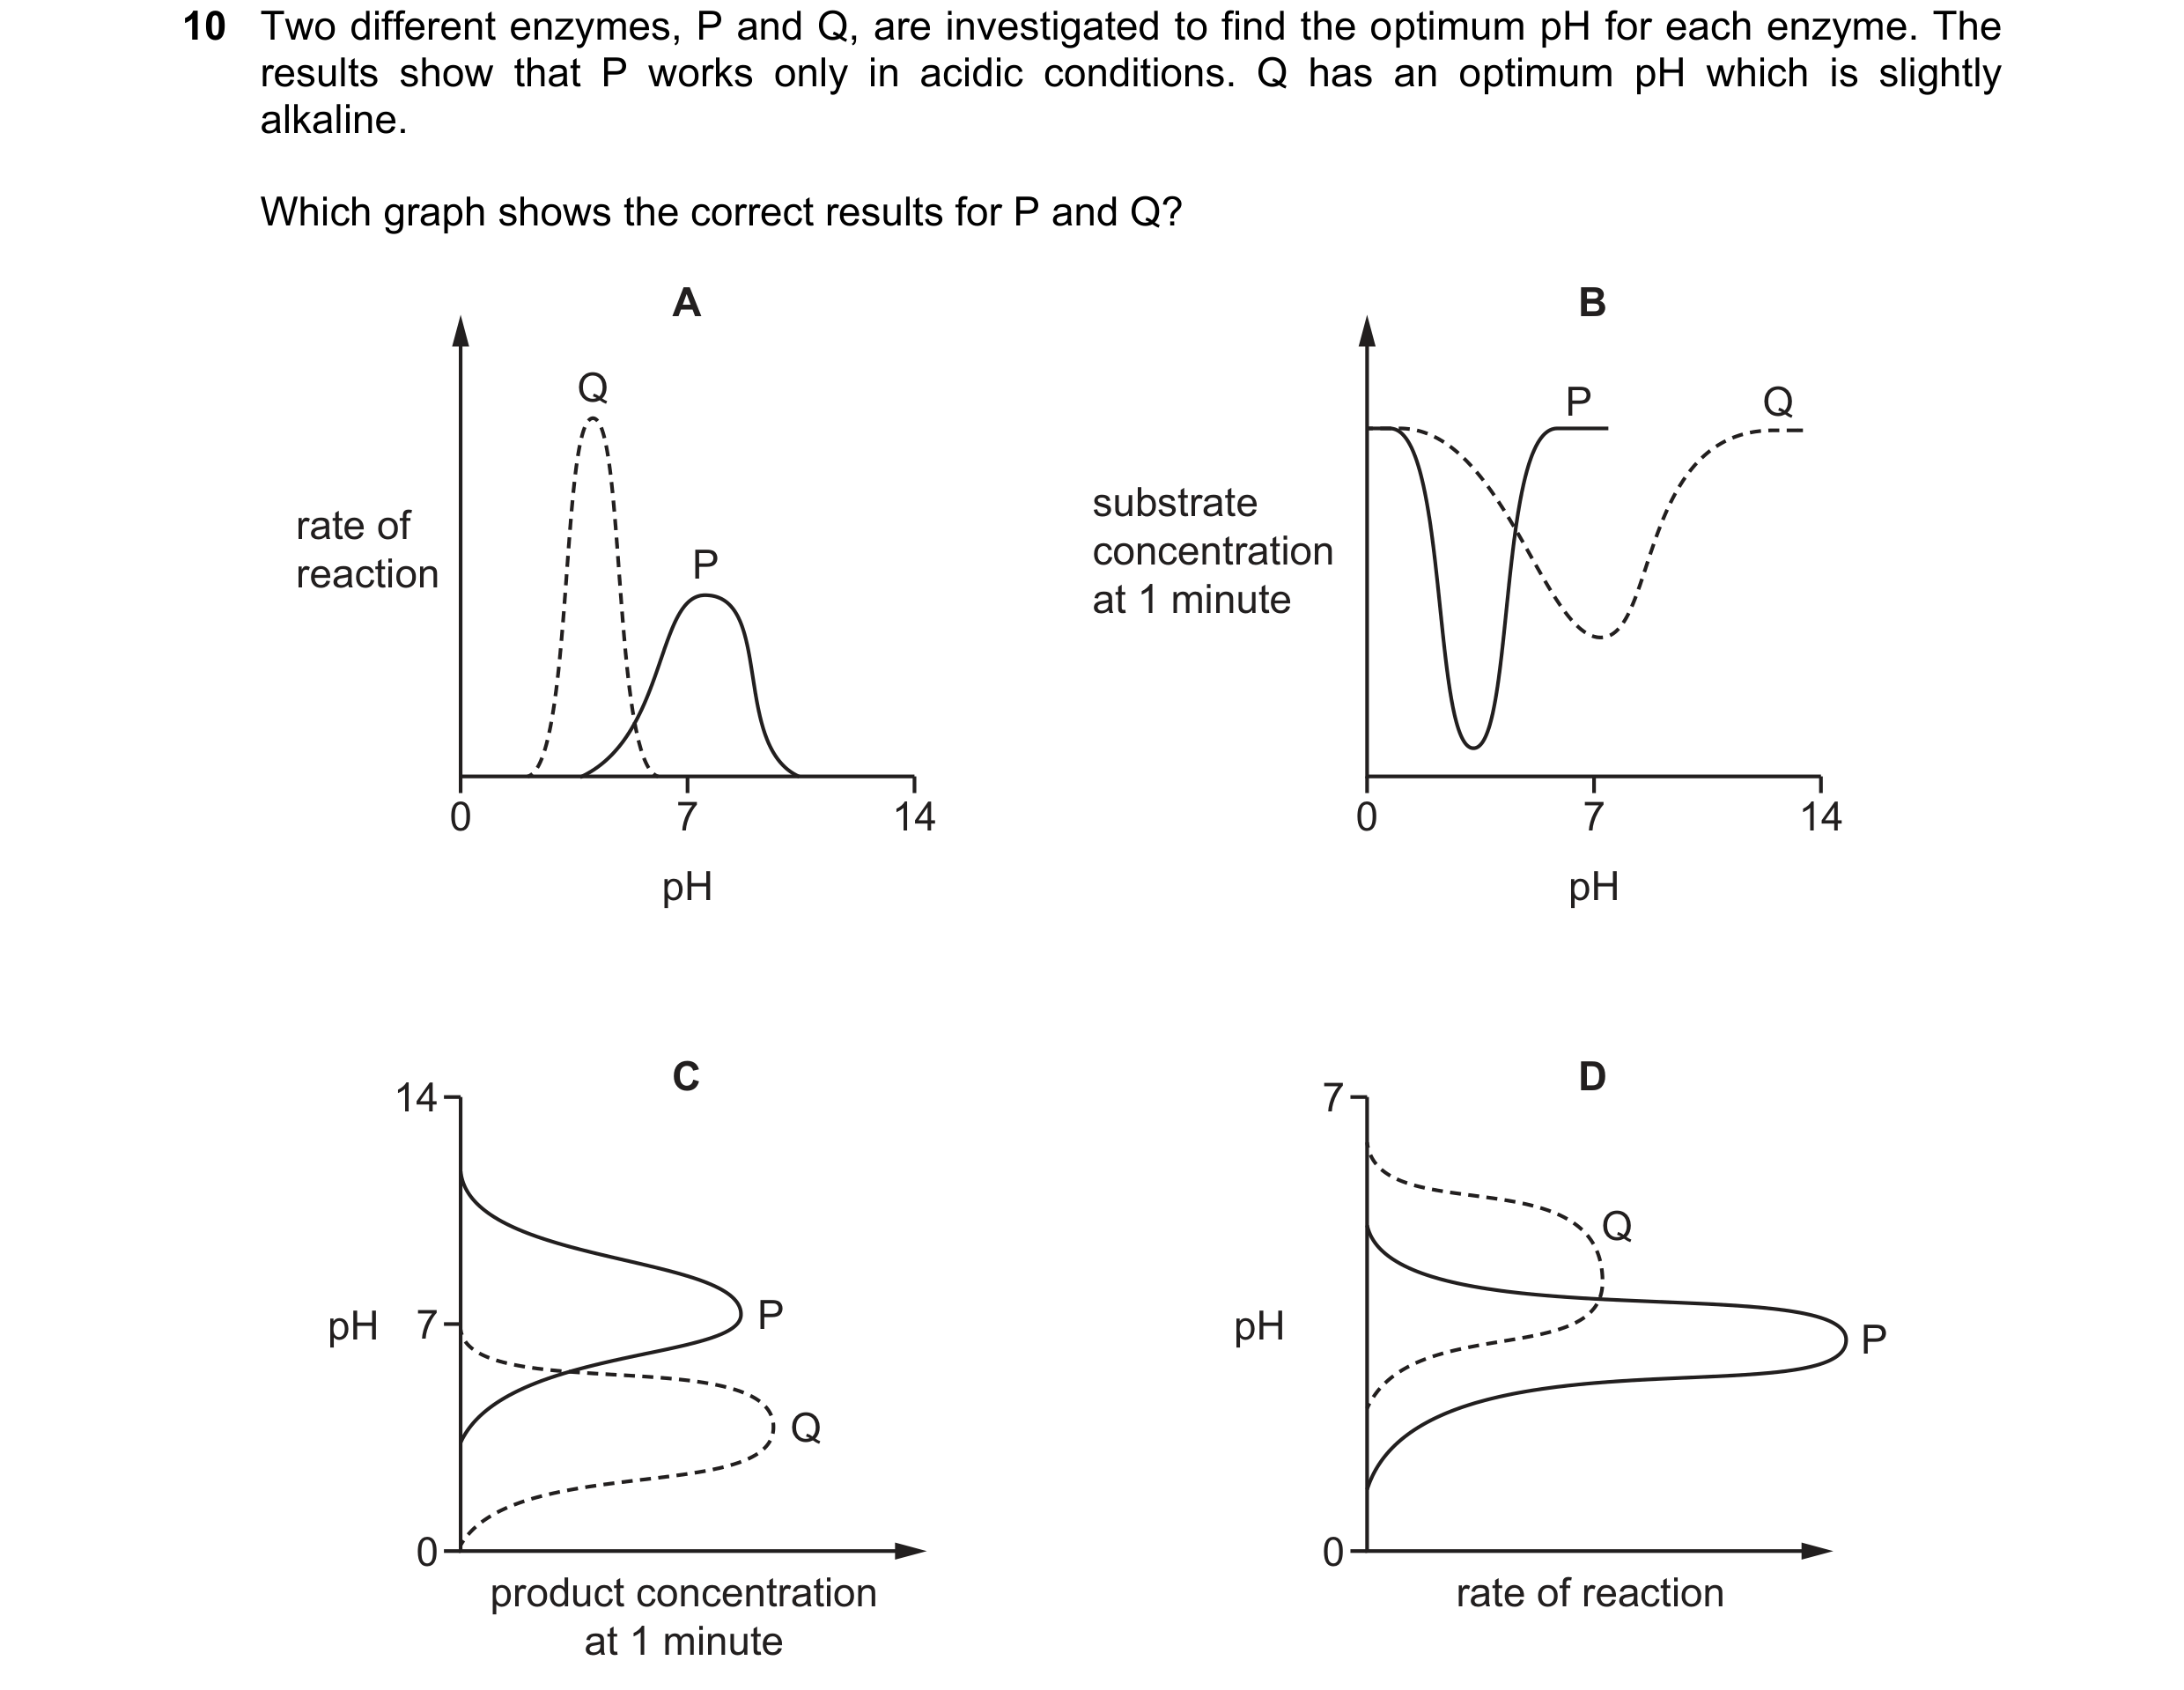 69 / 76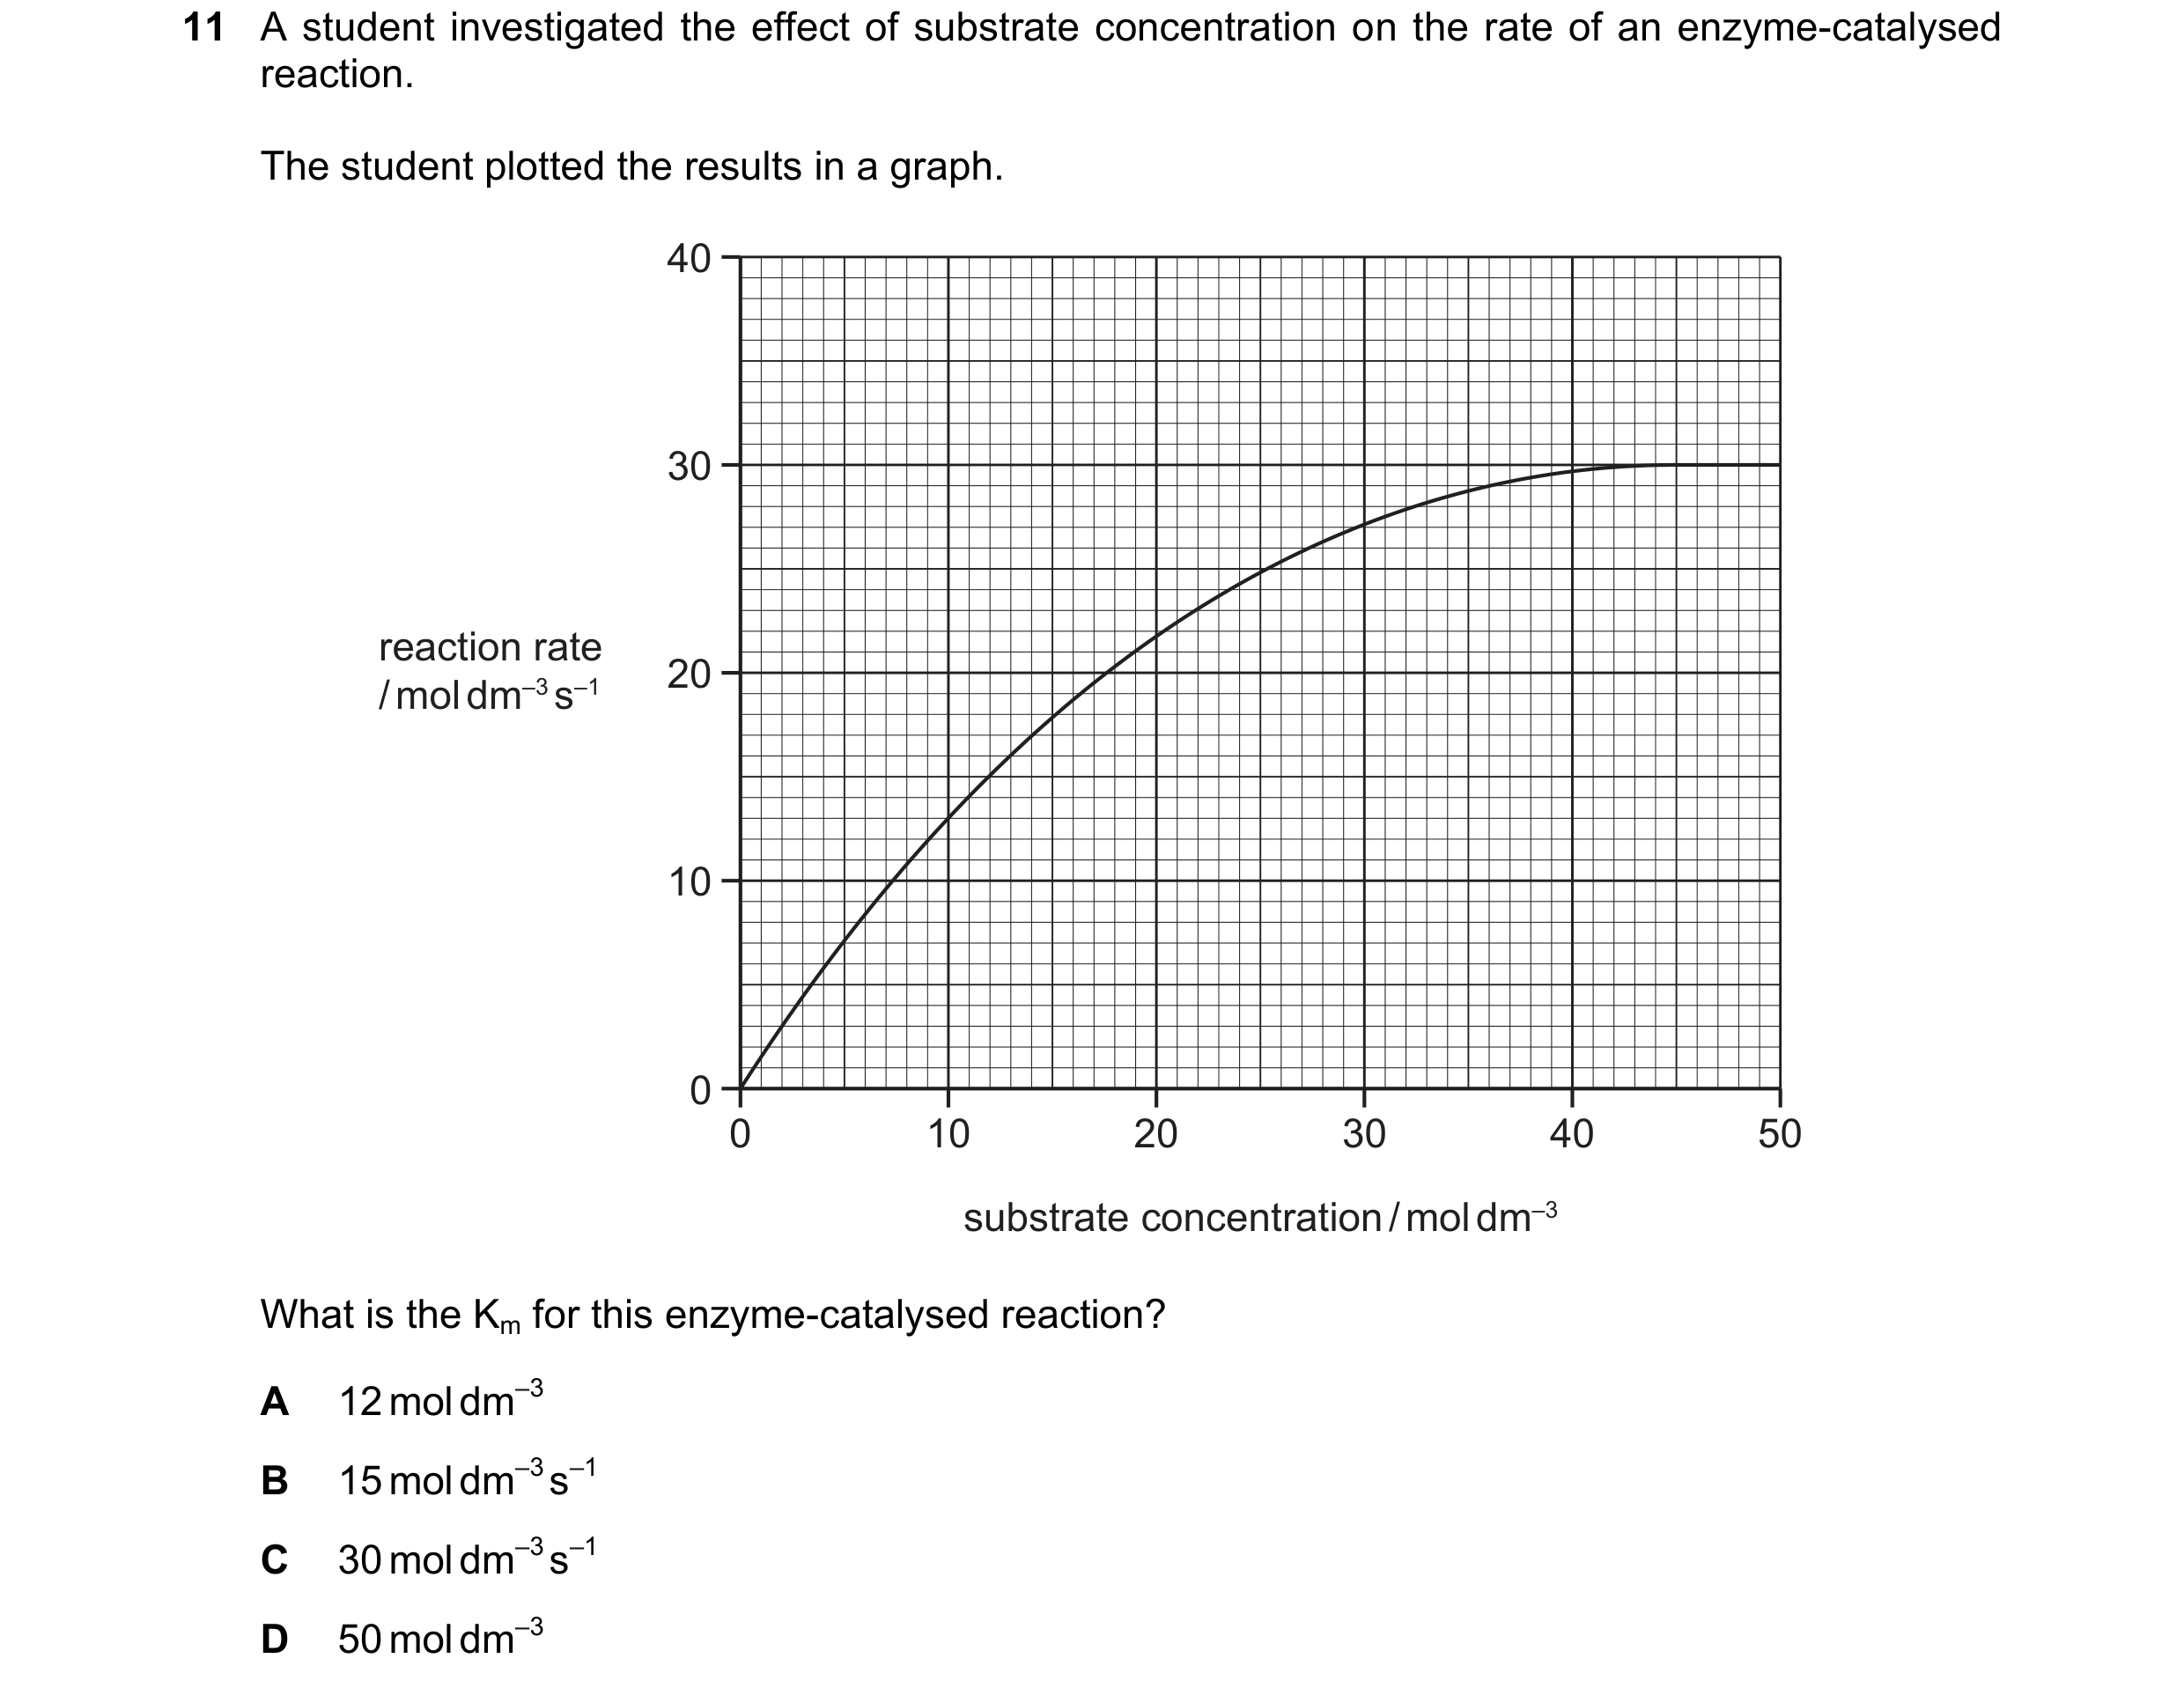
 70 / 76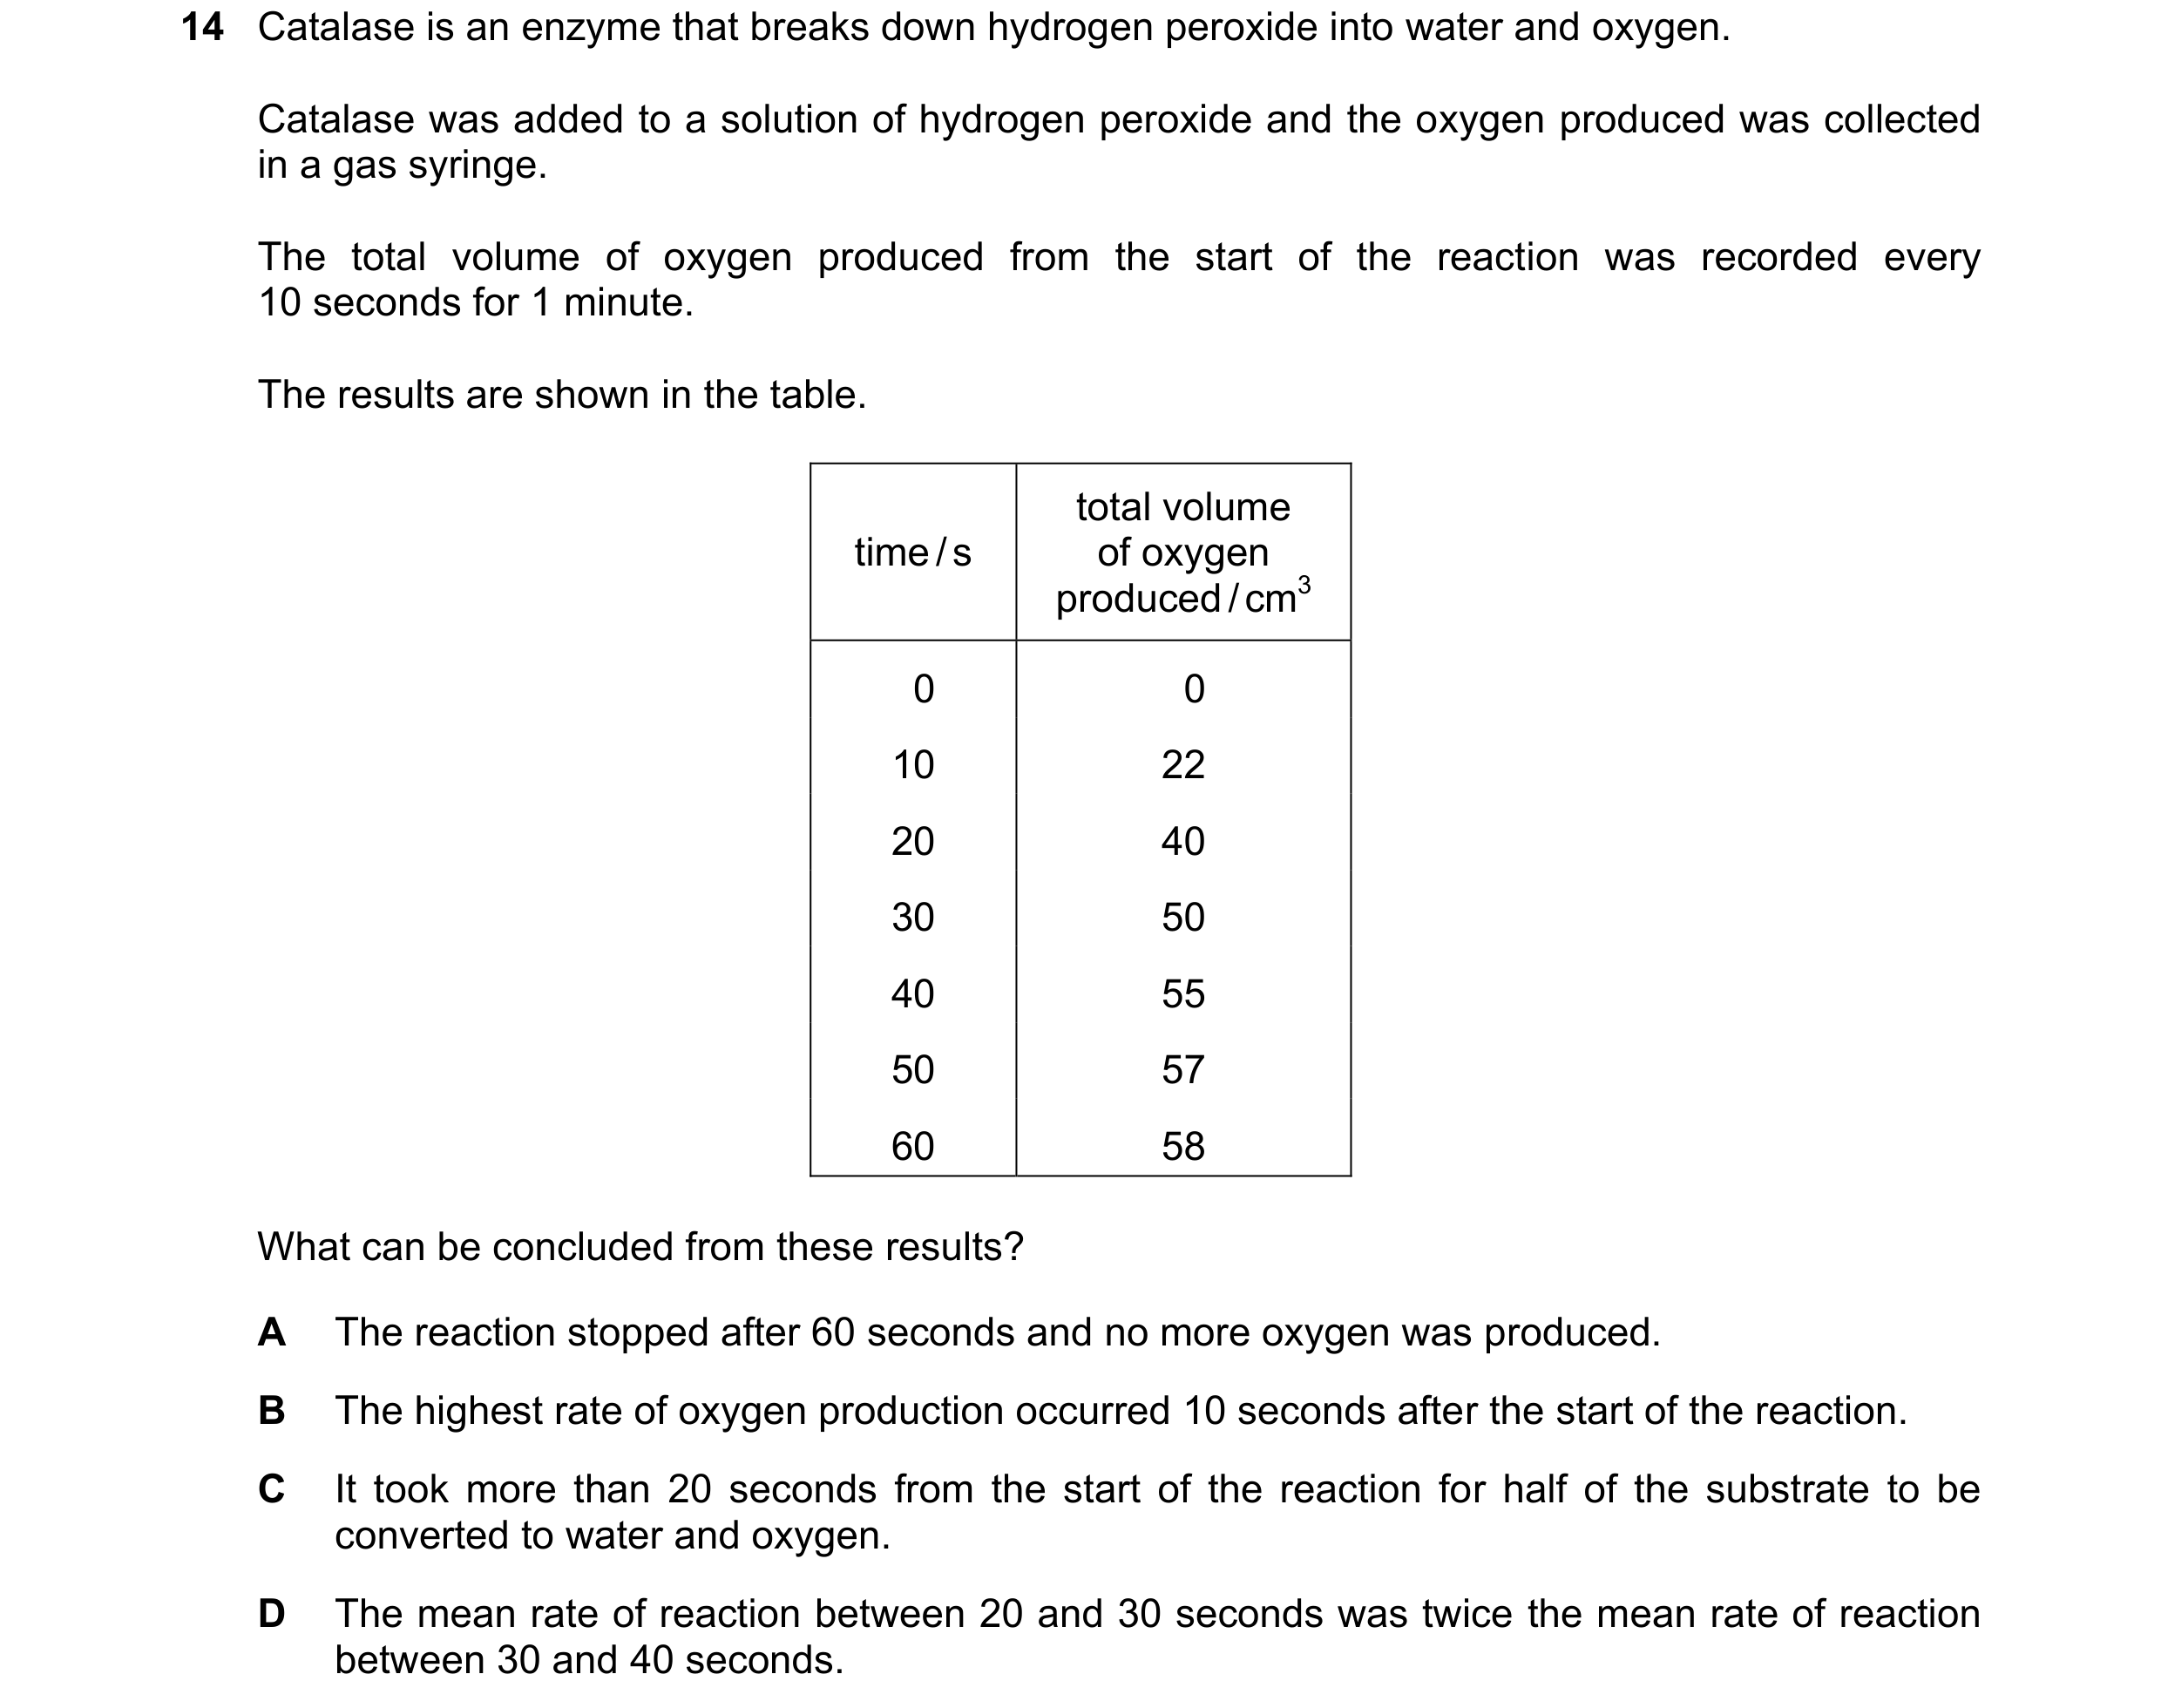
 71 / 76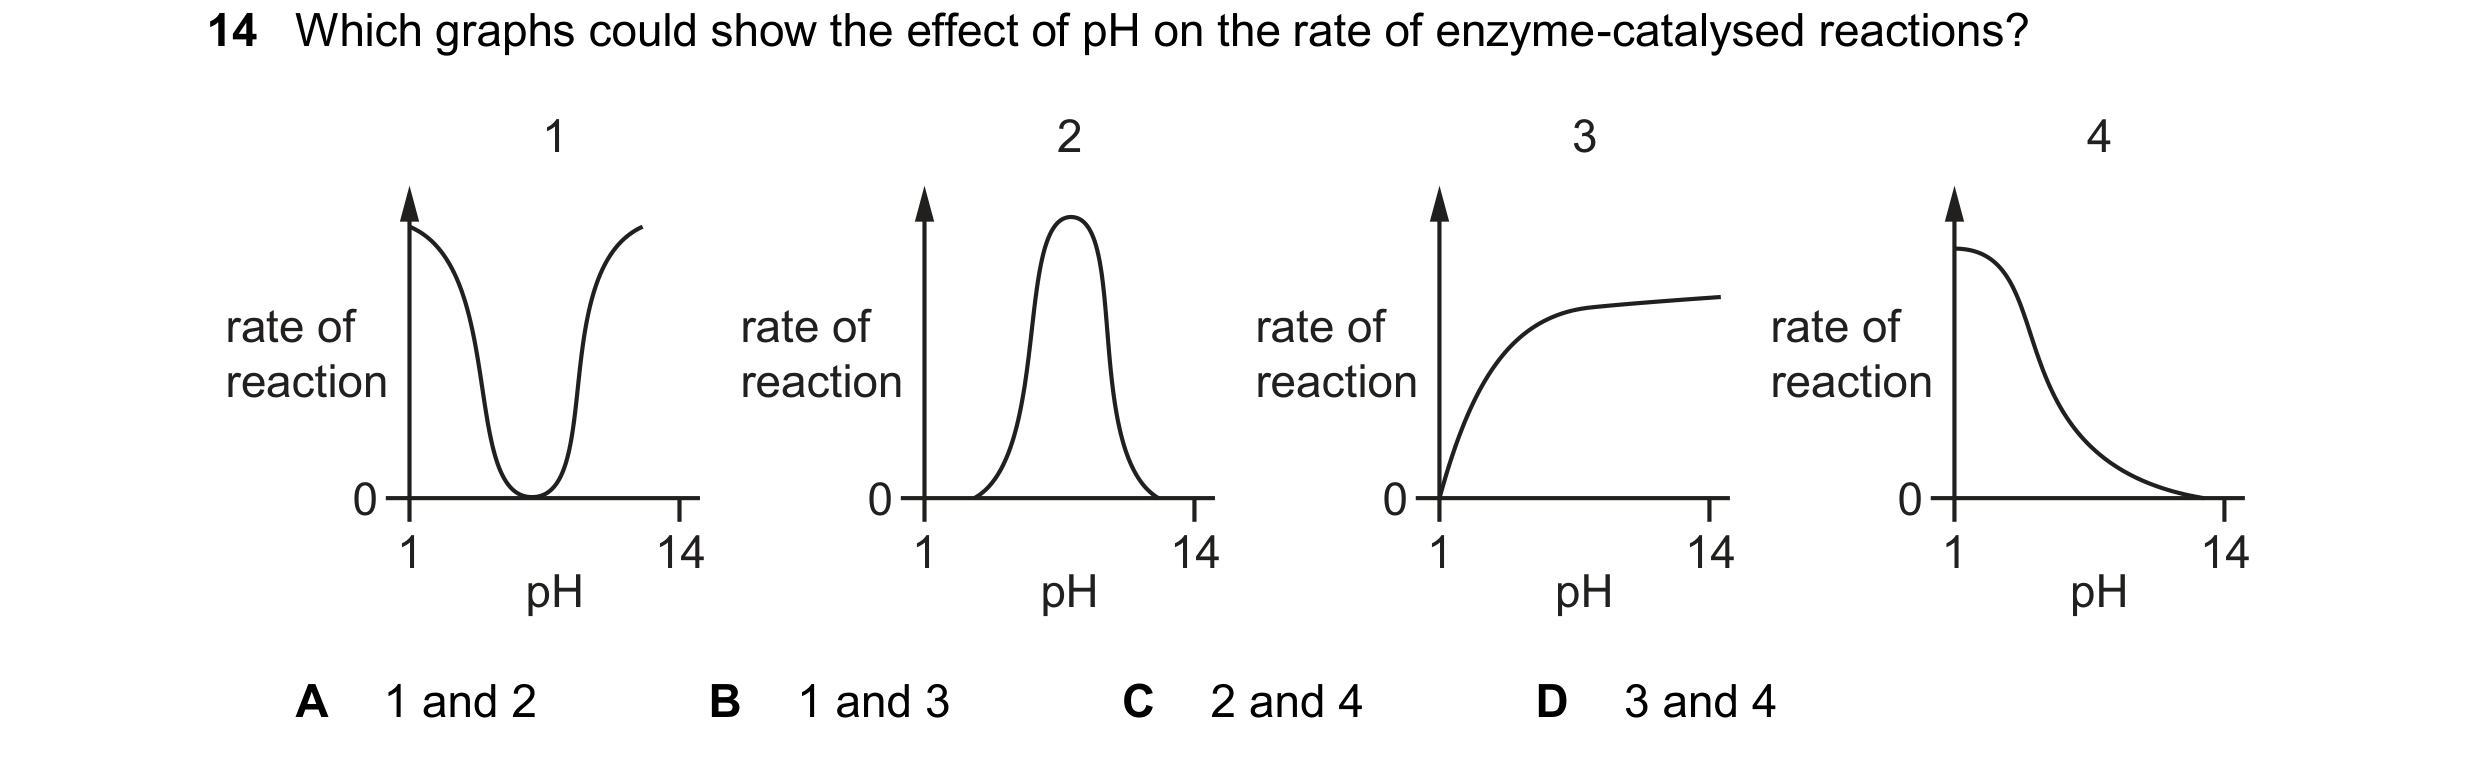
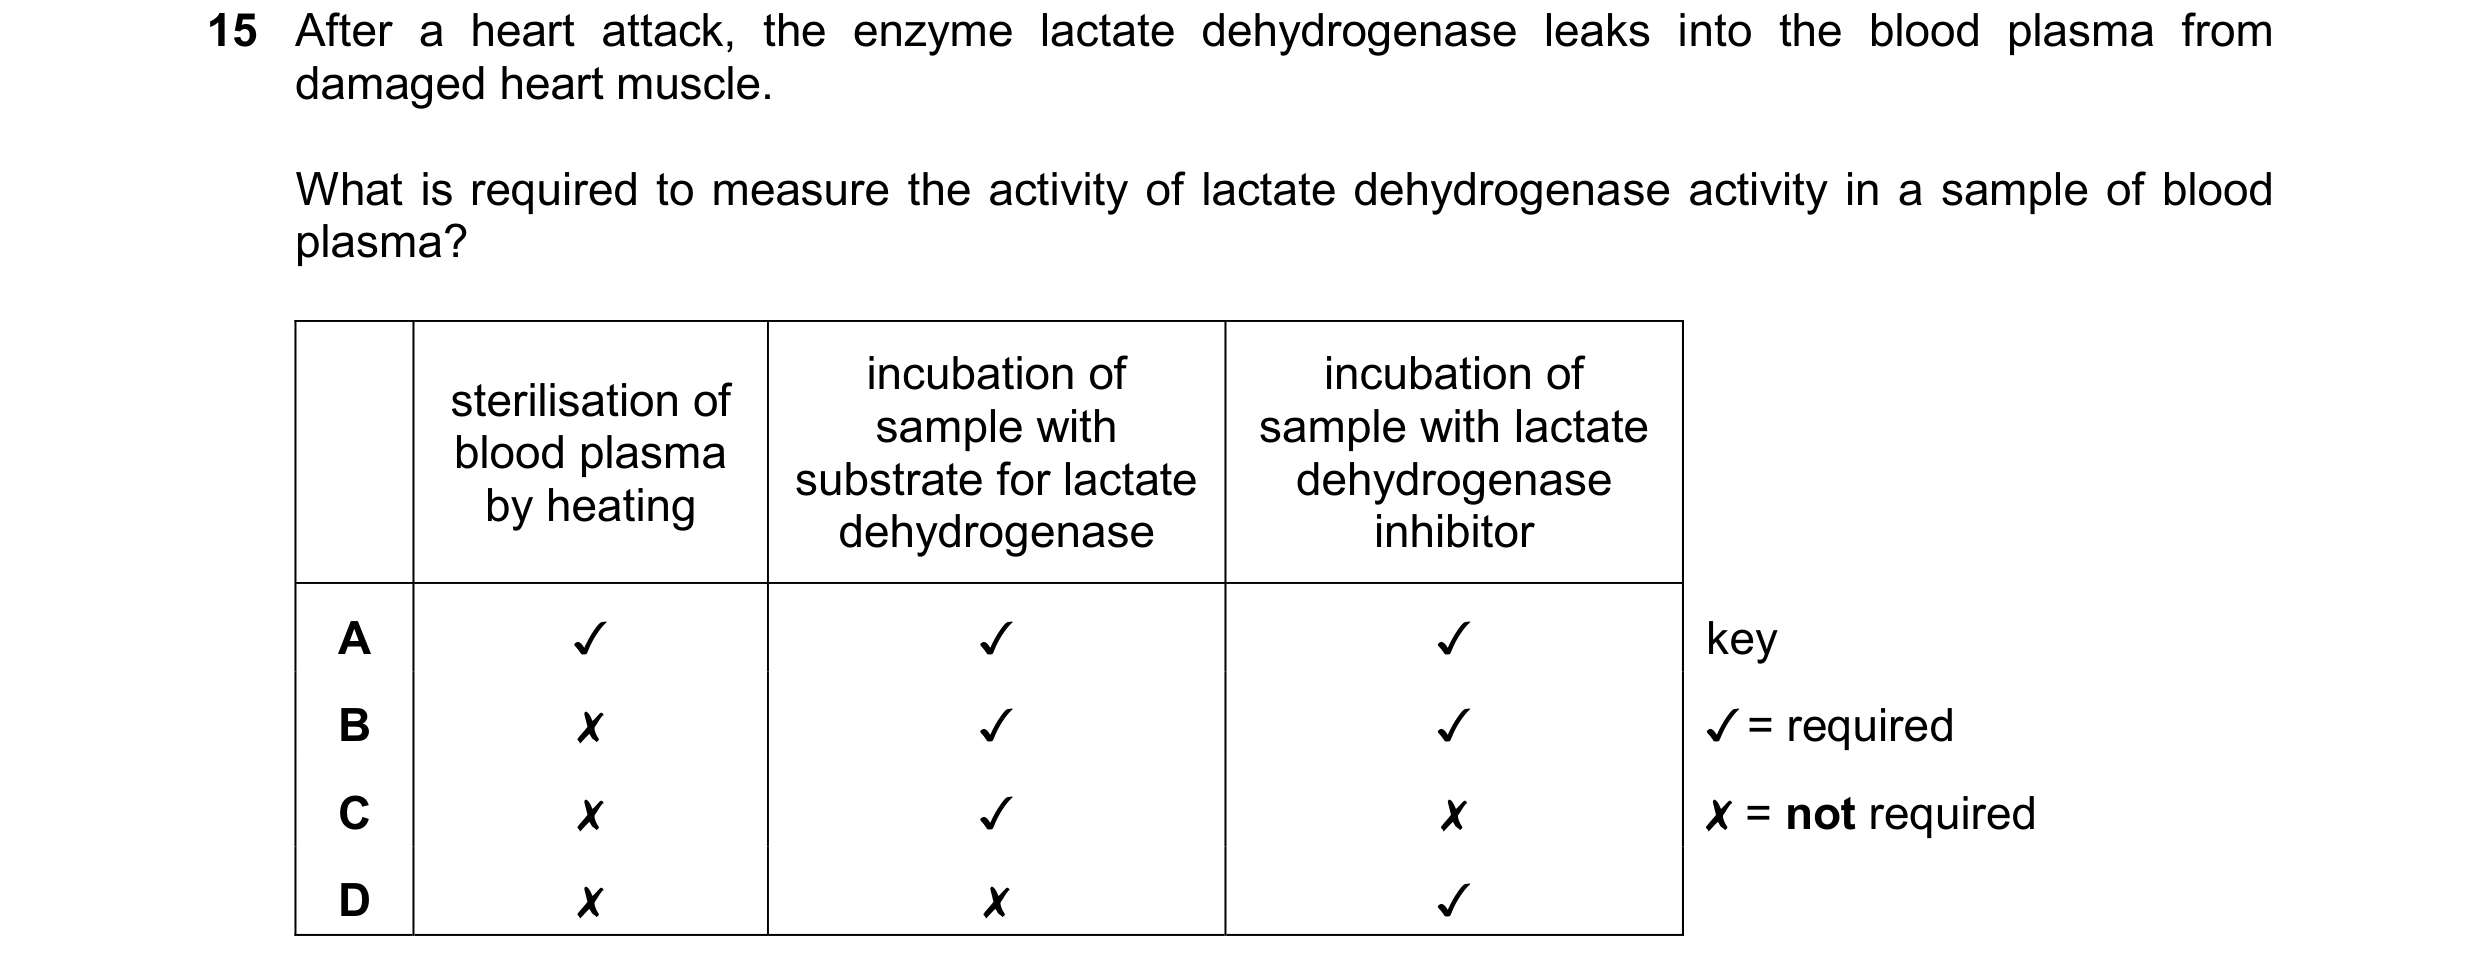 72 / 76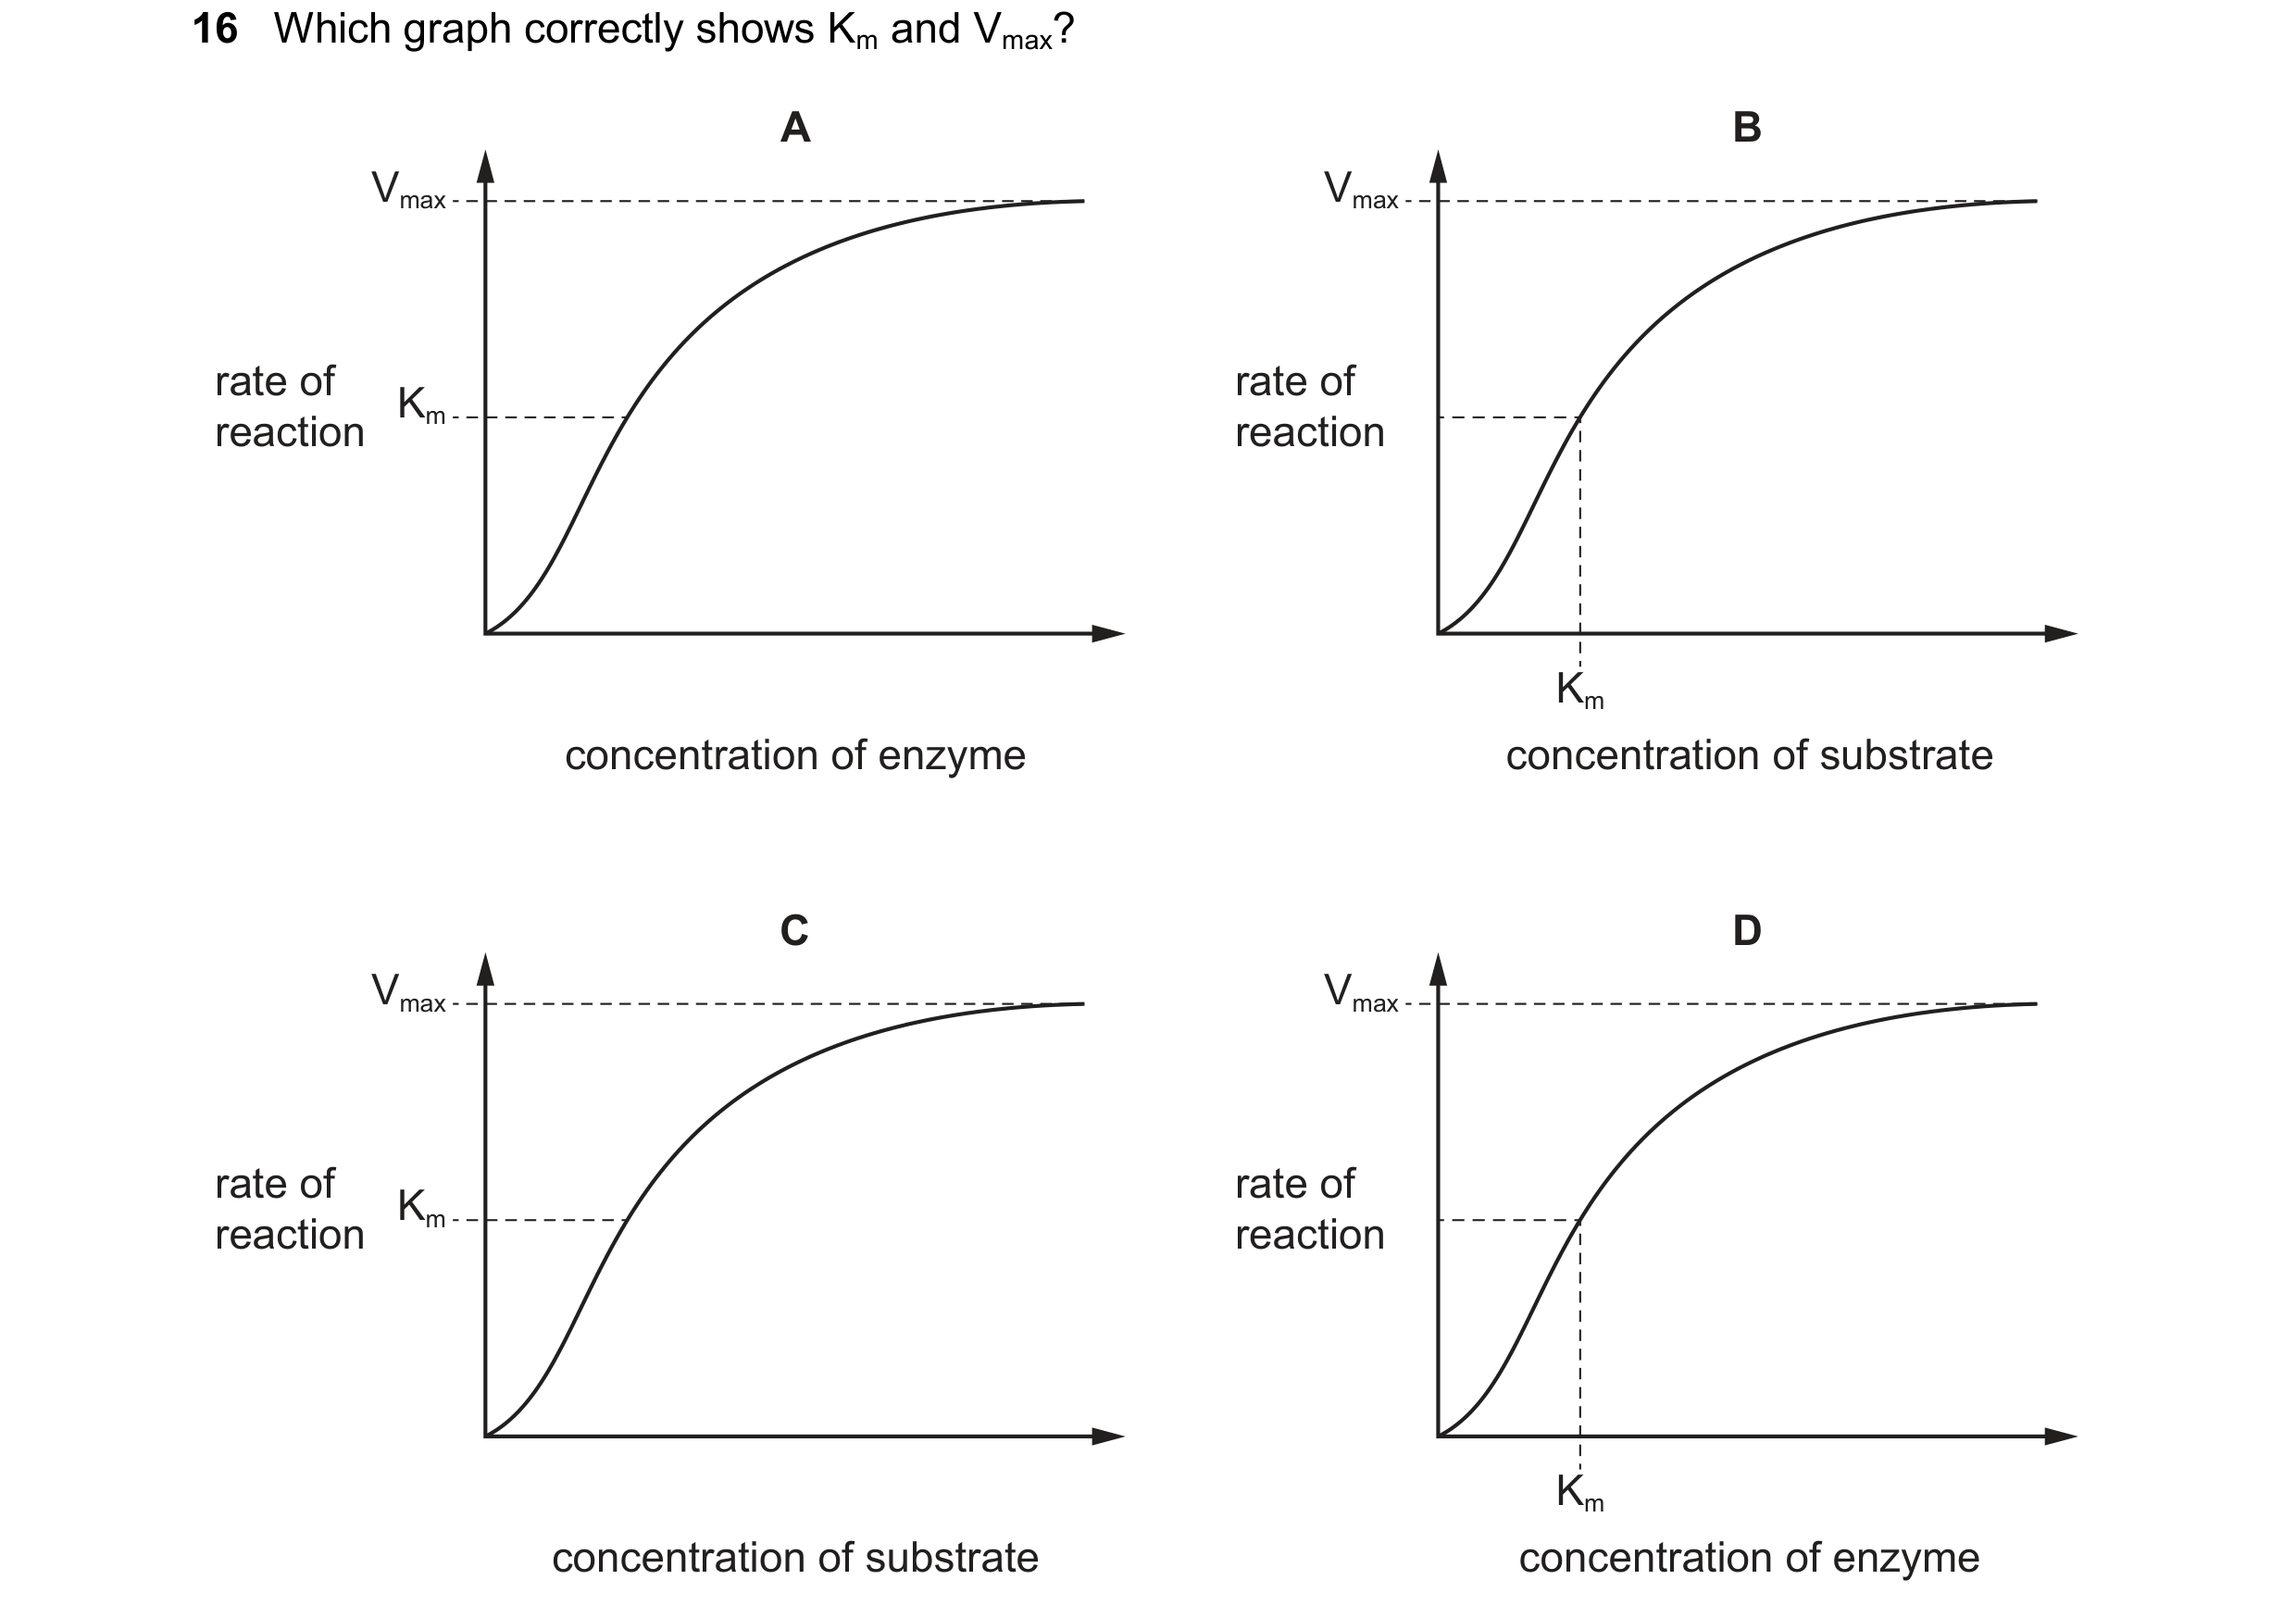
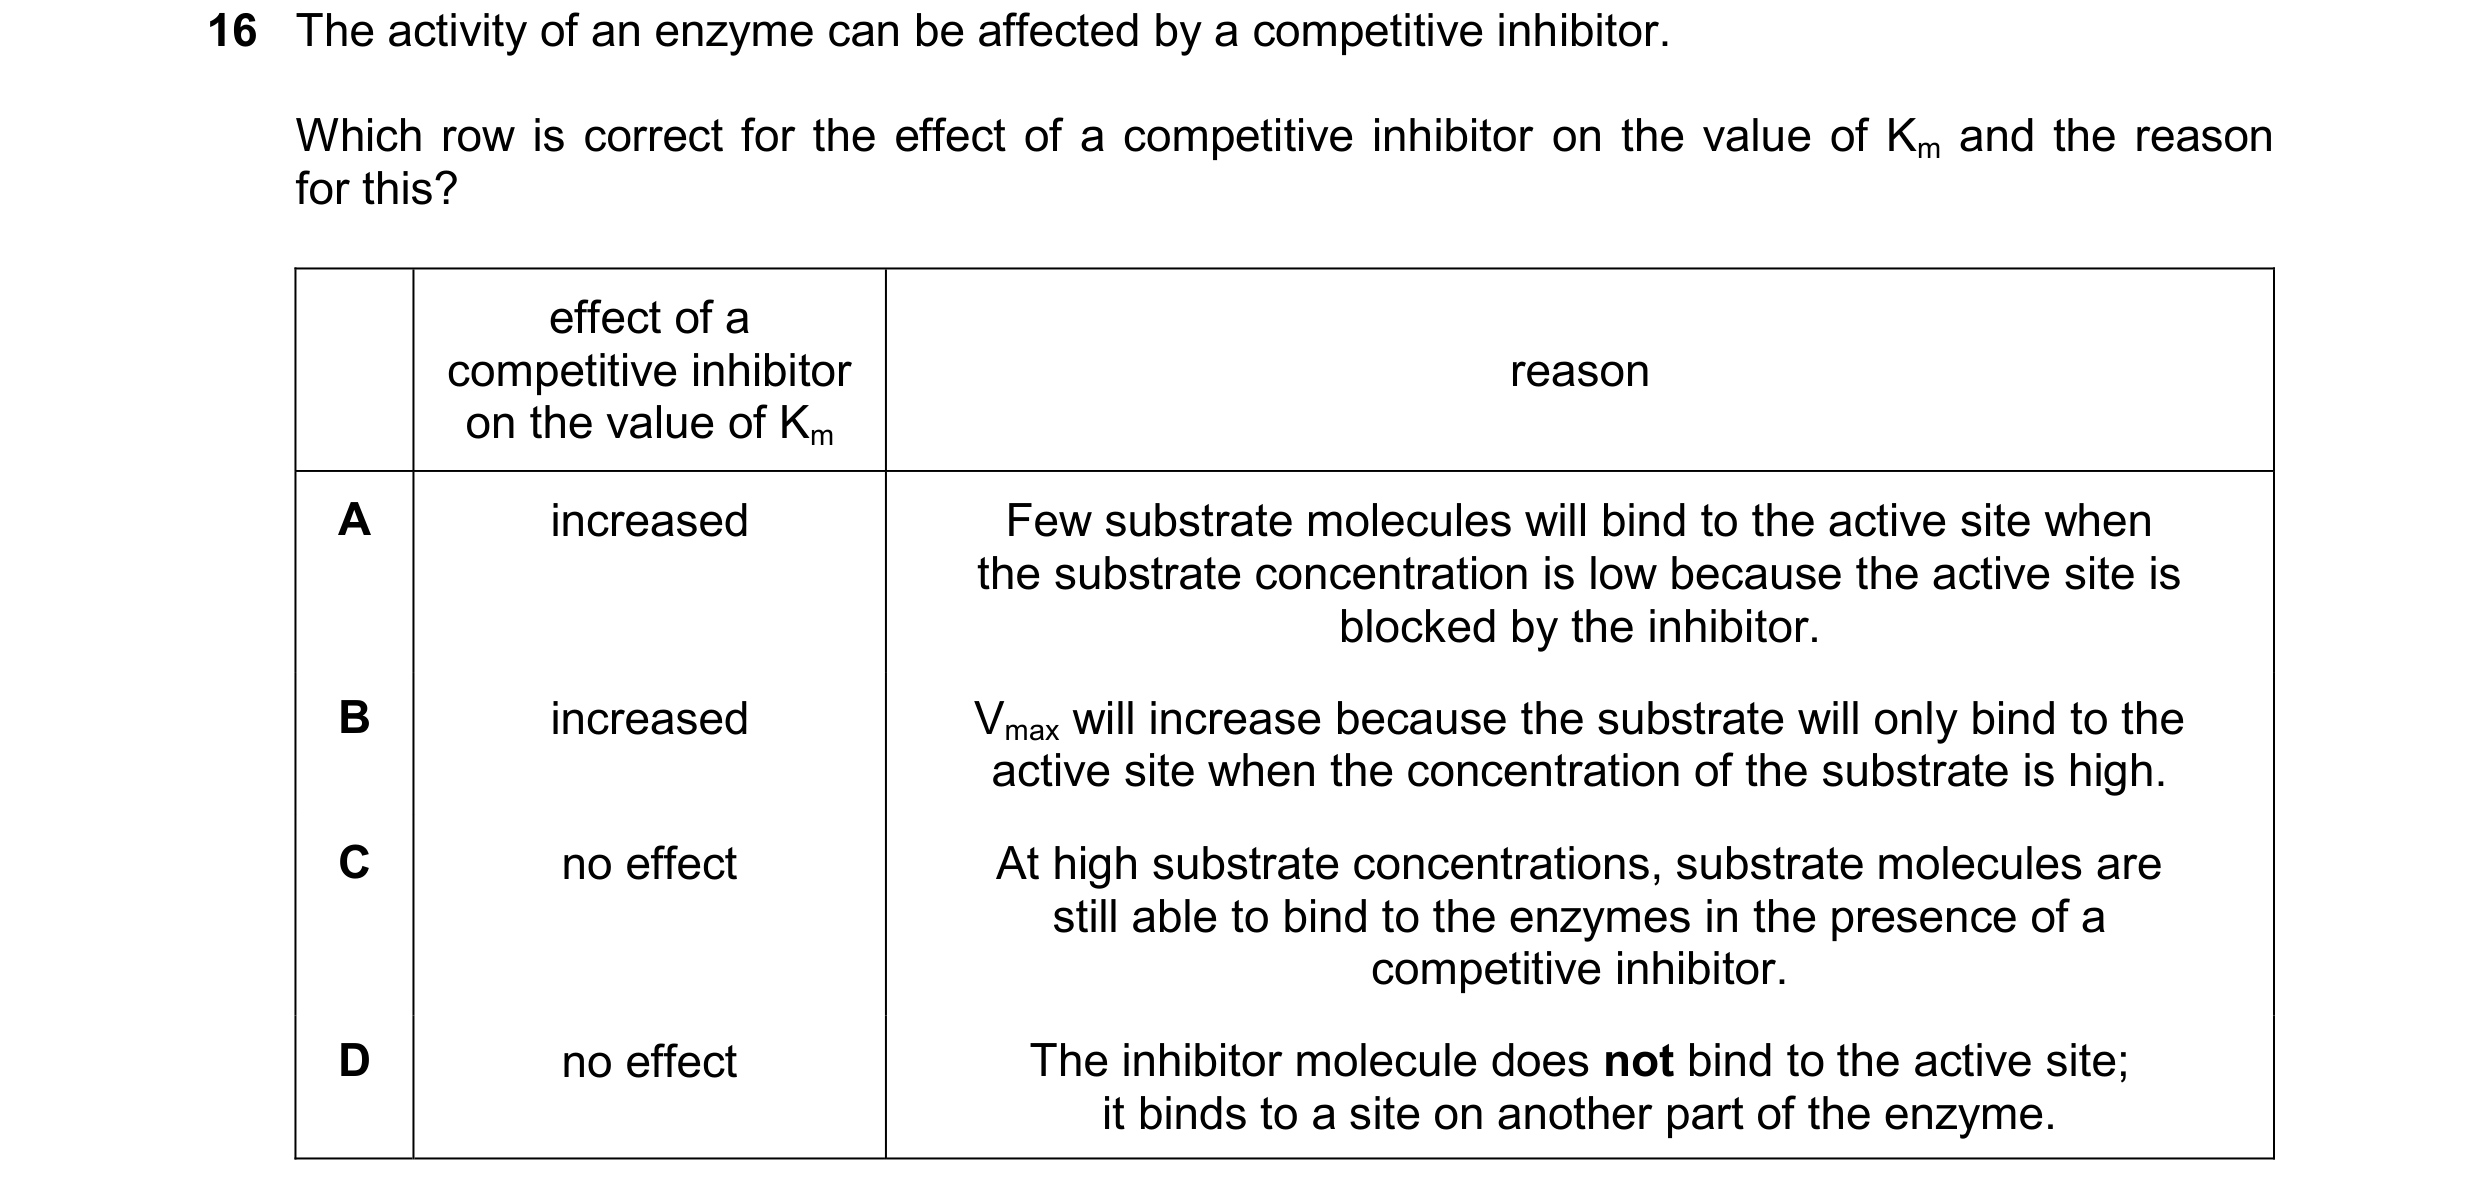 73 / 76
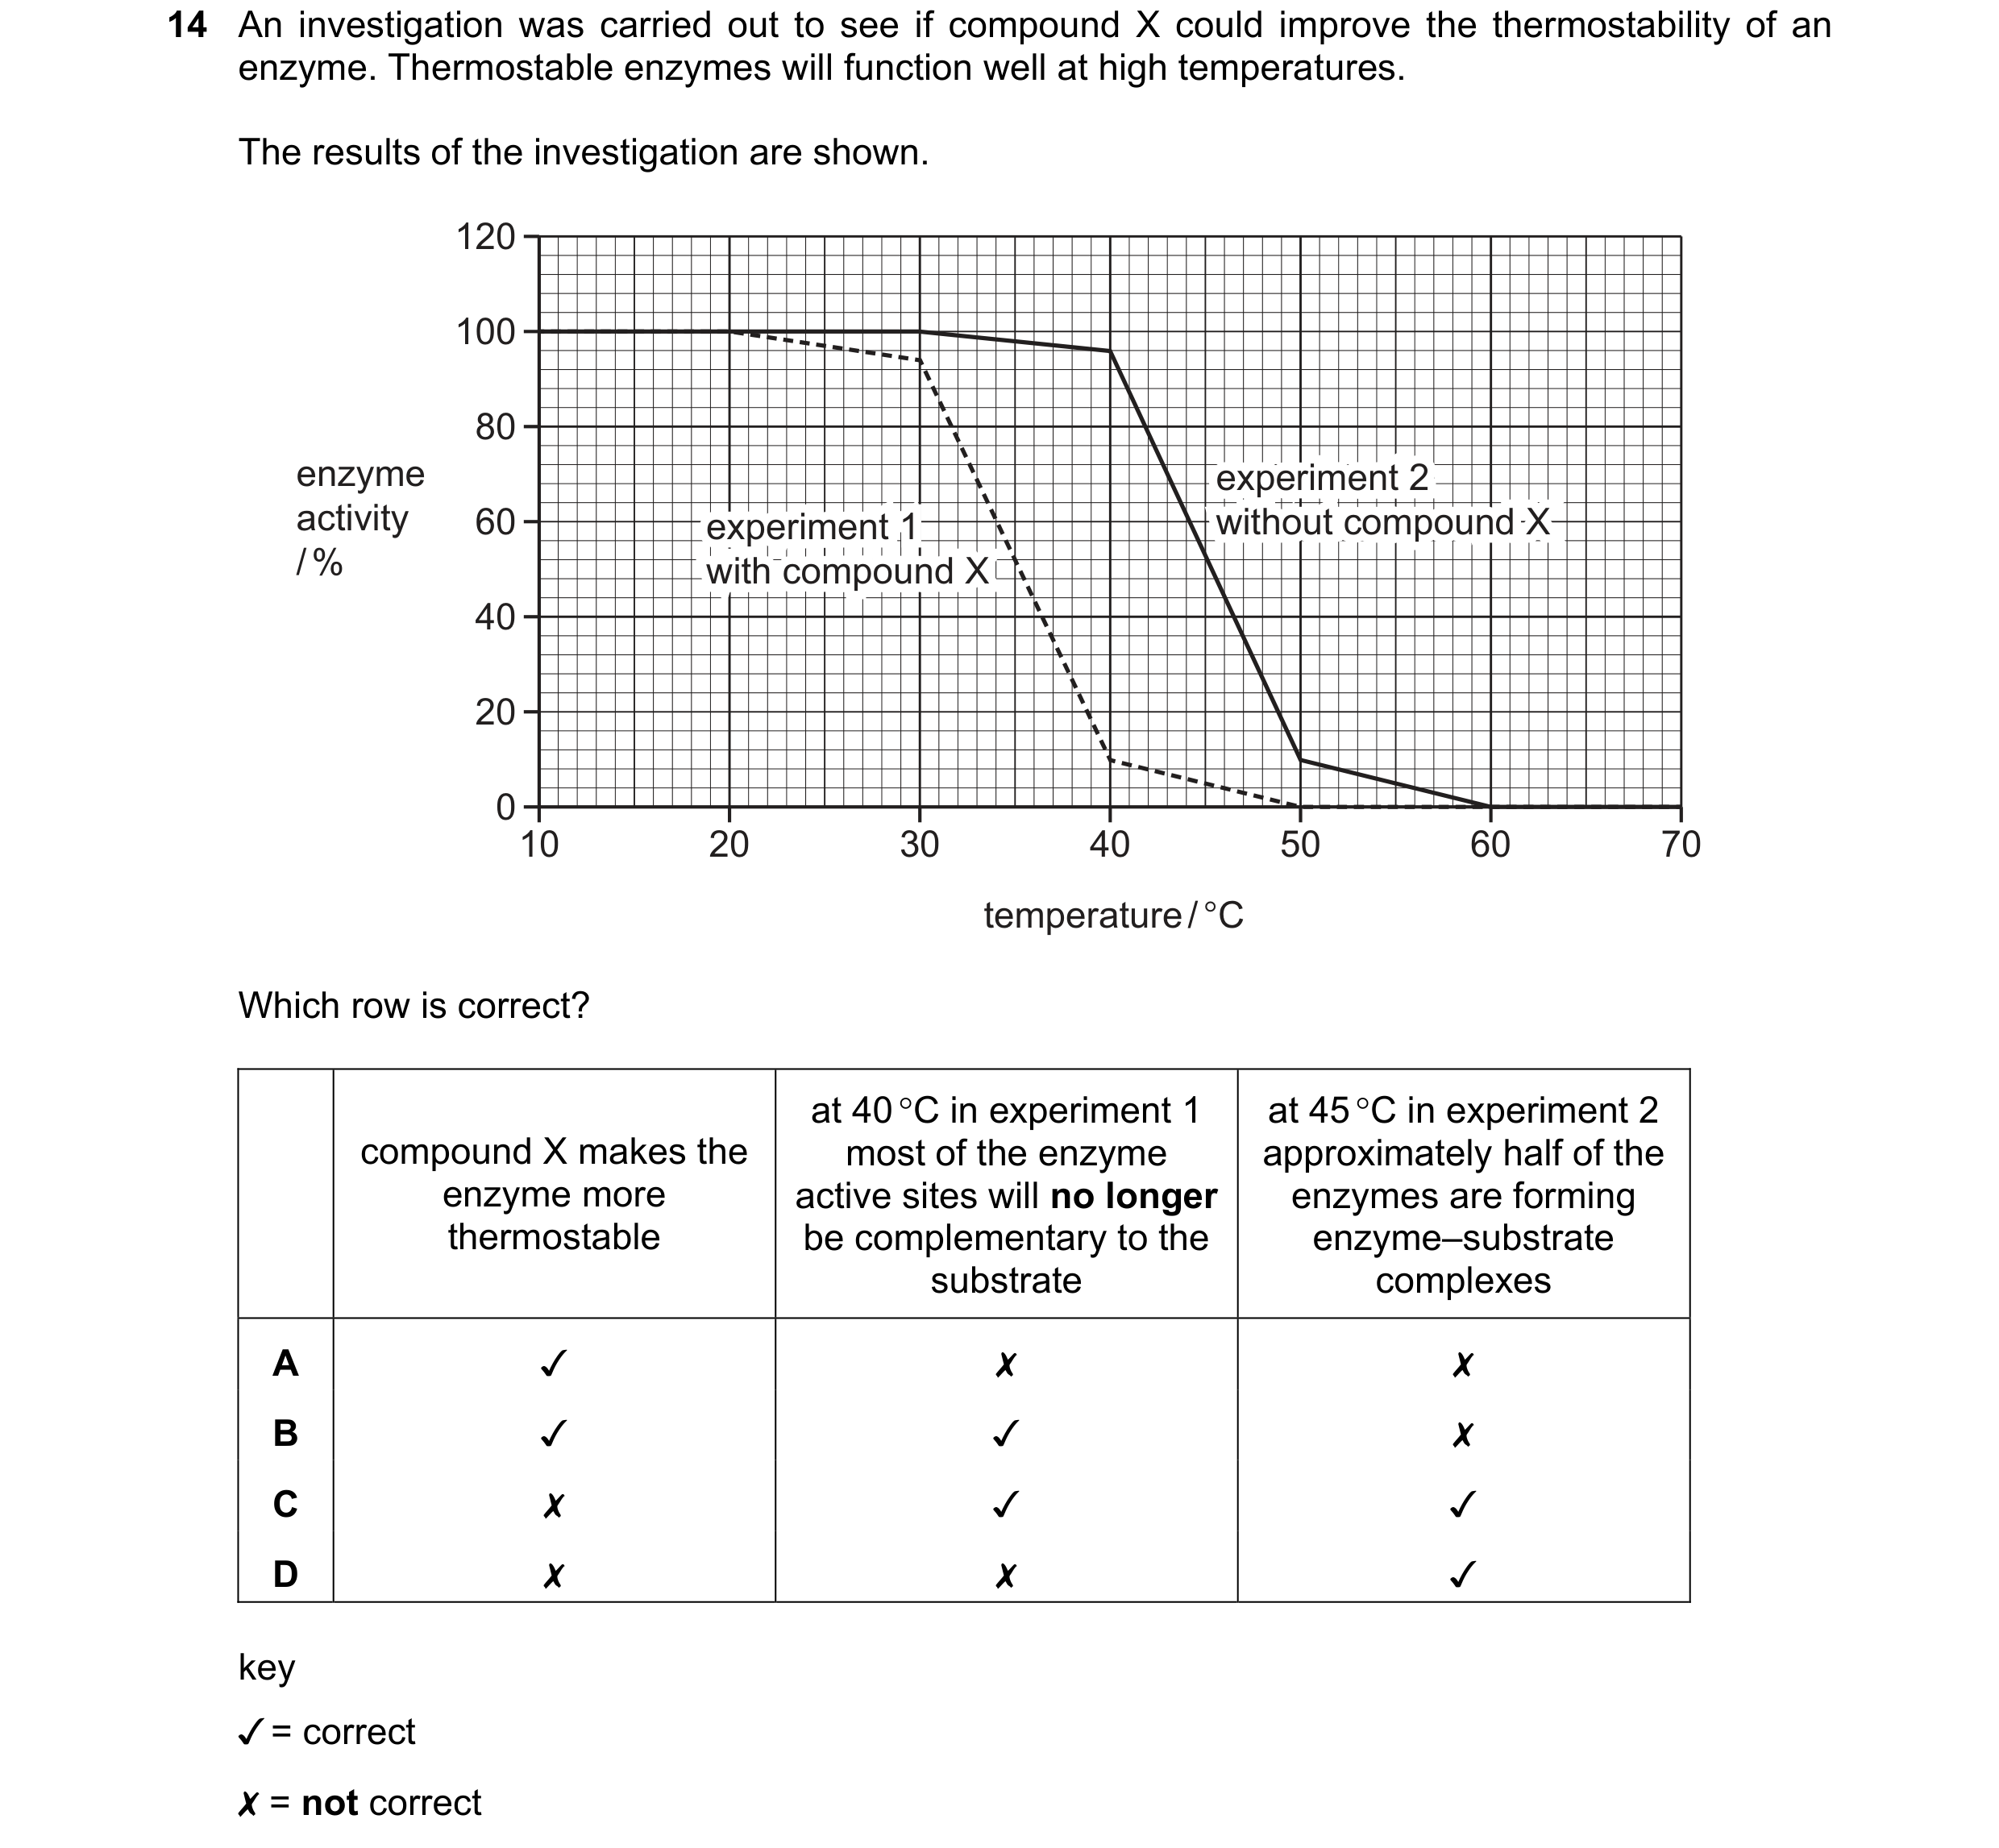 74 / 76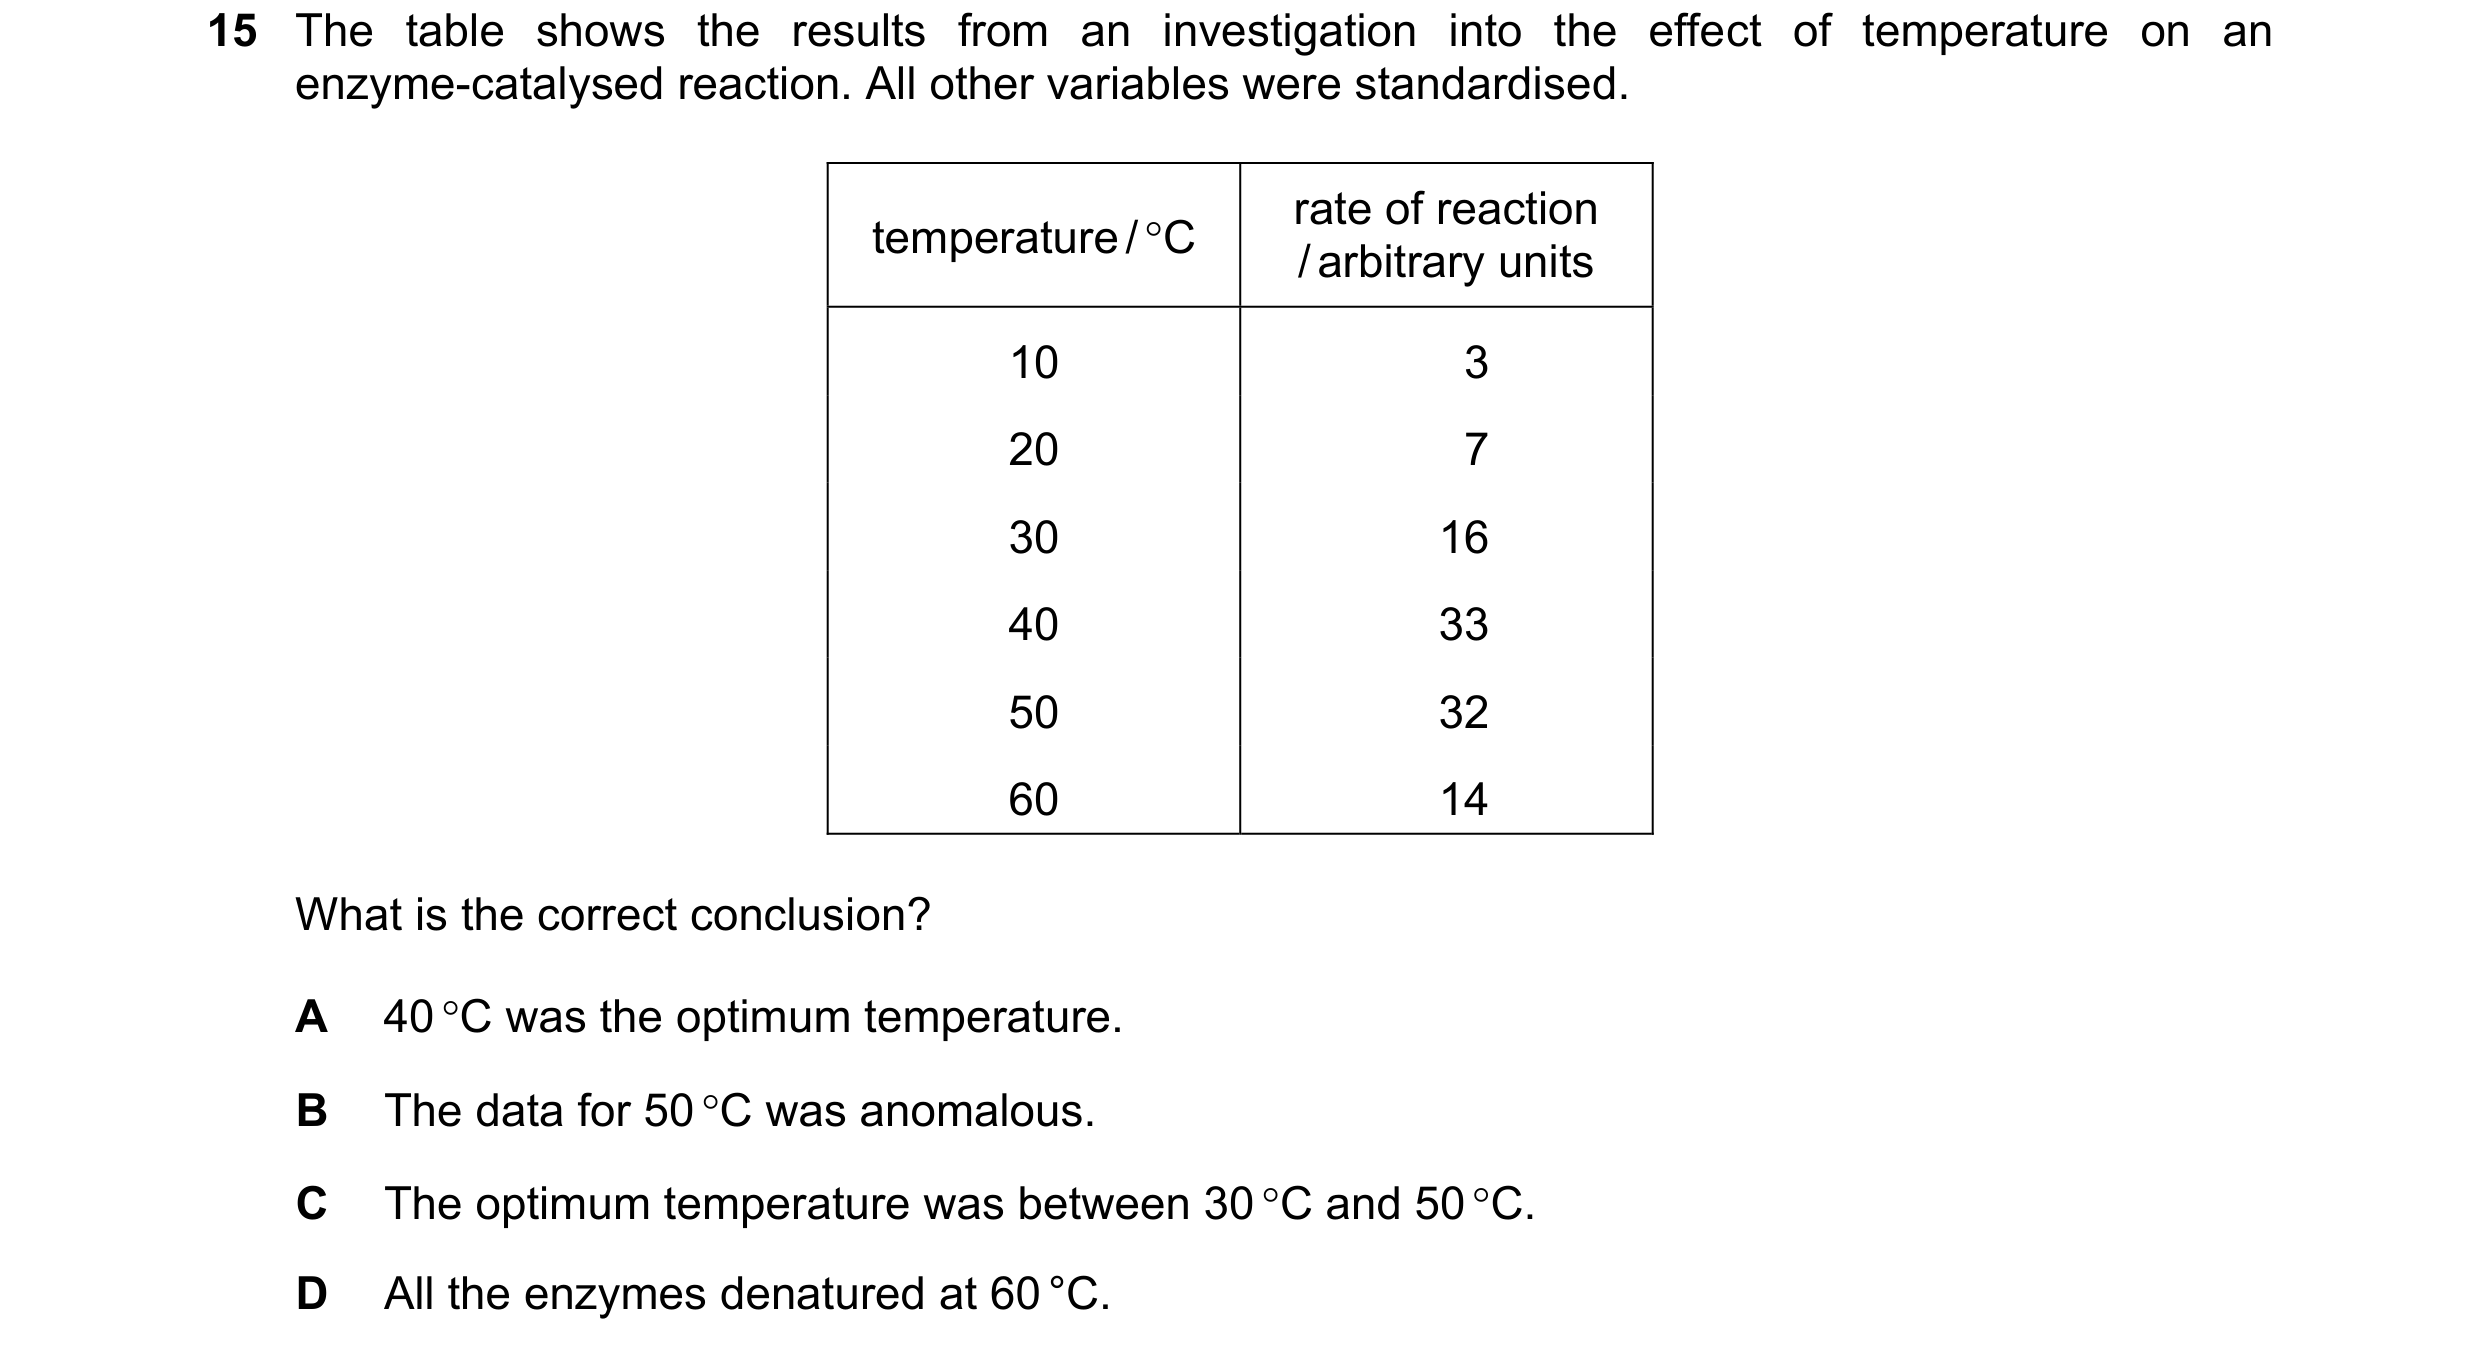
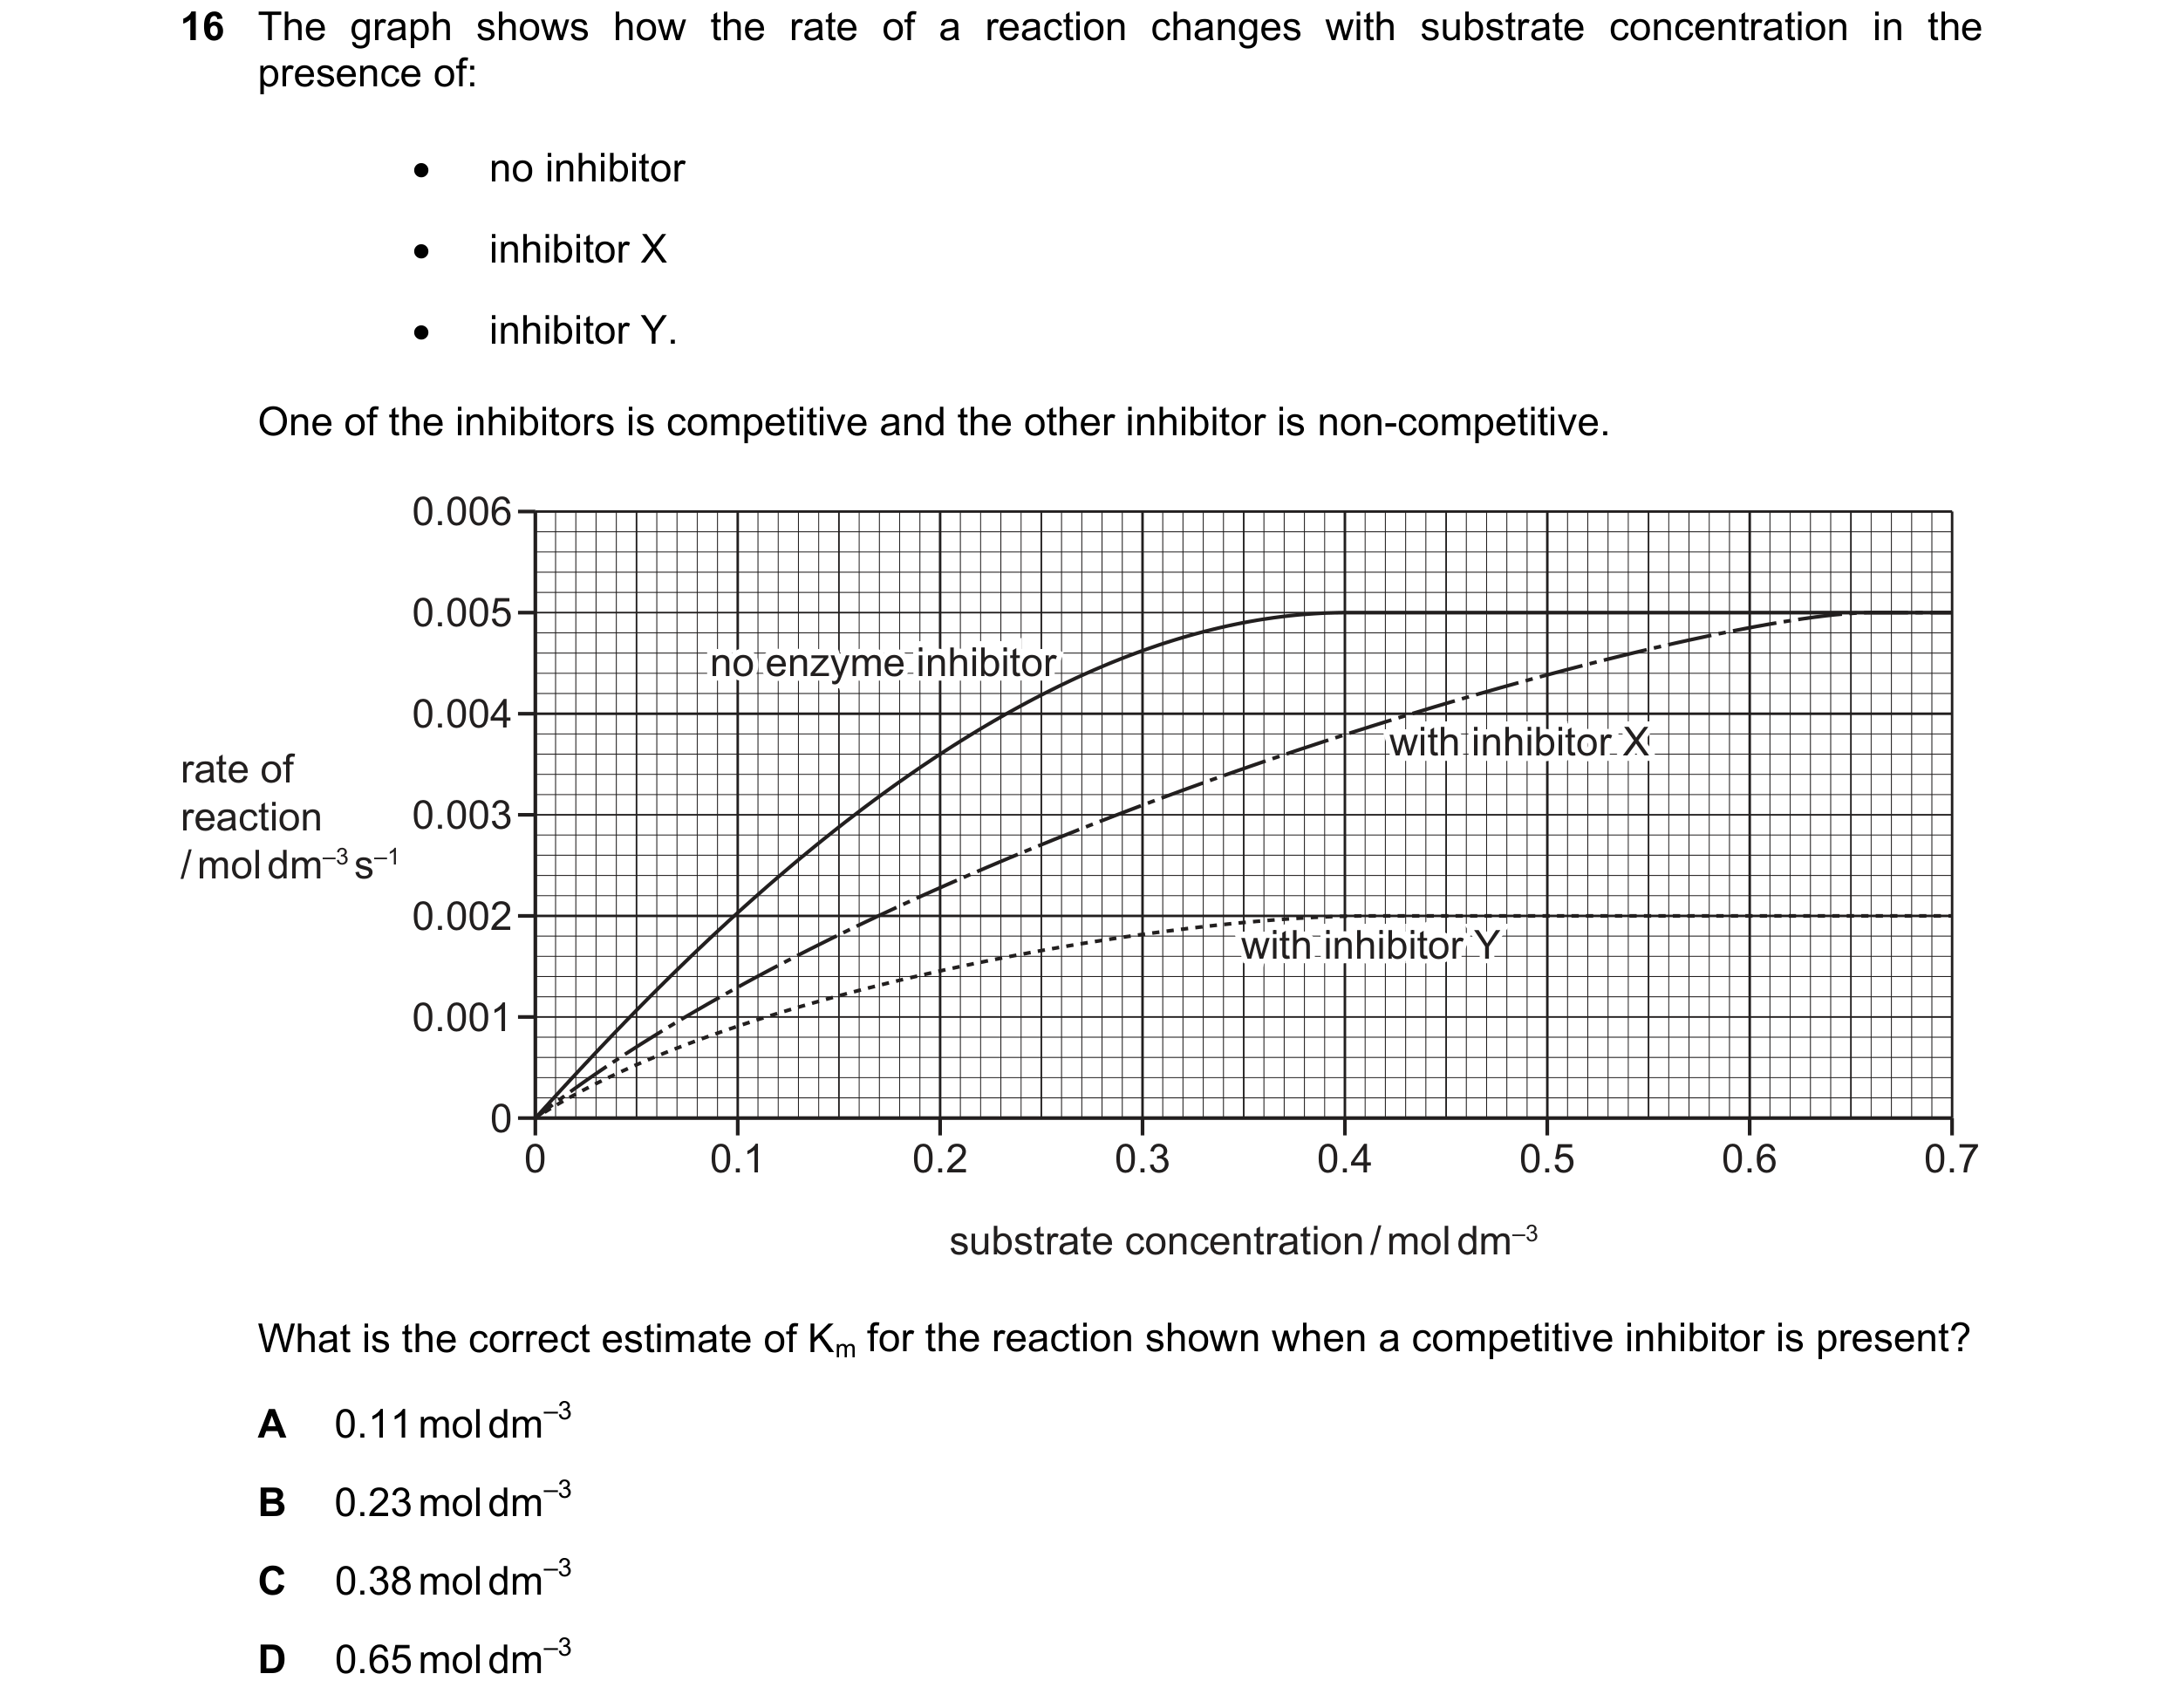 75 / 76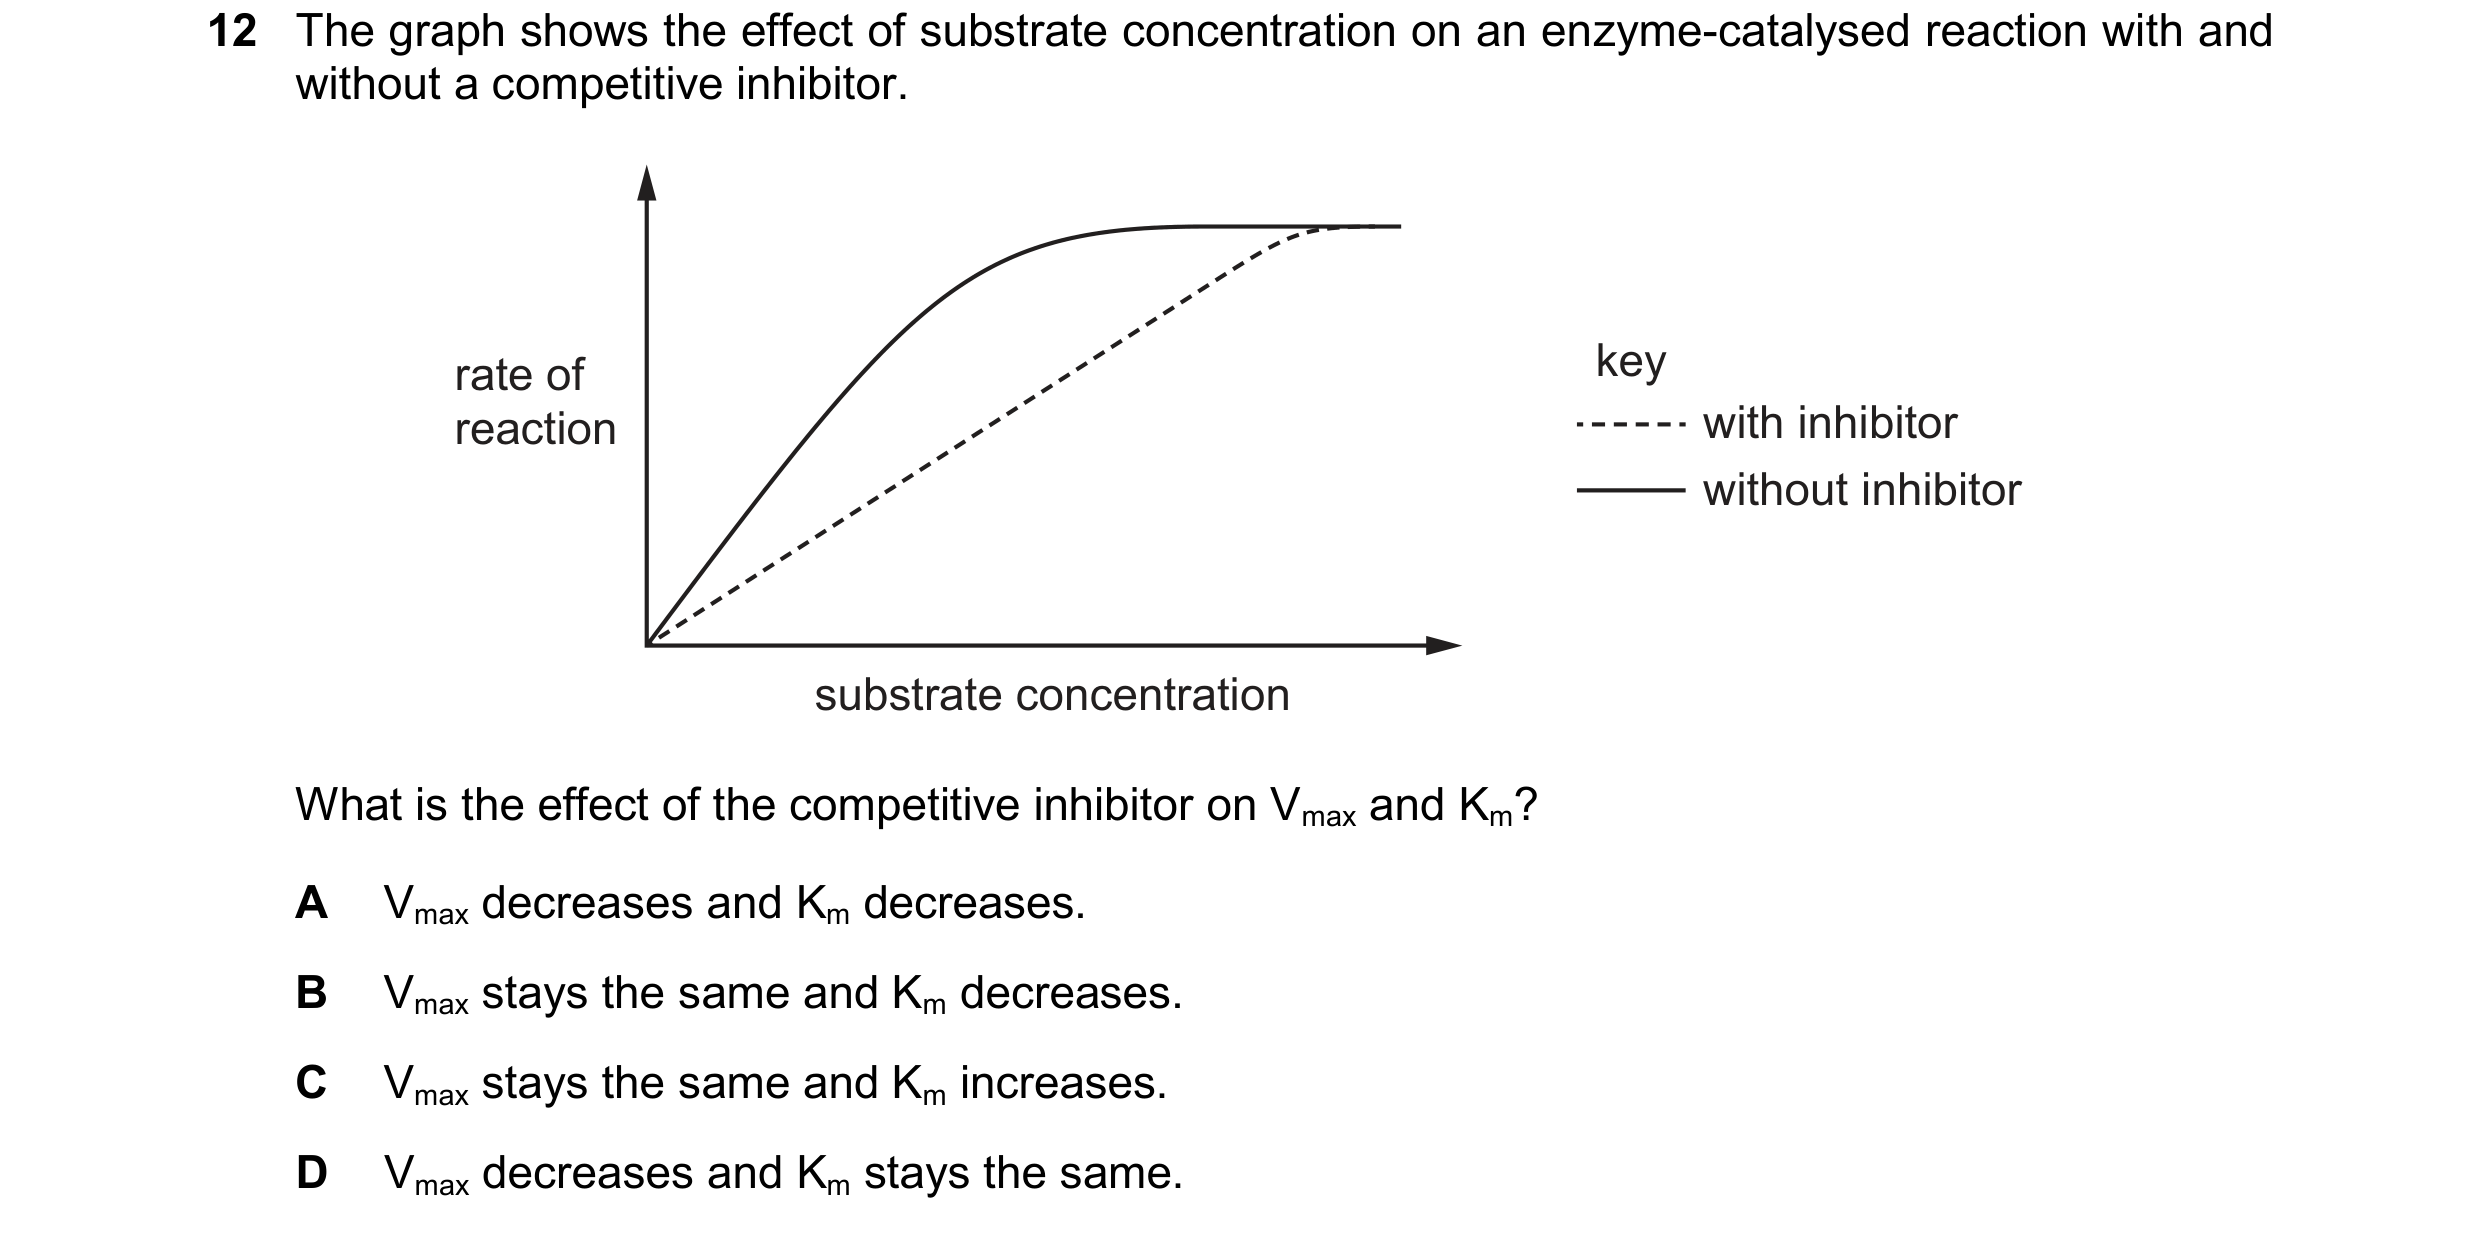
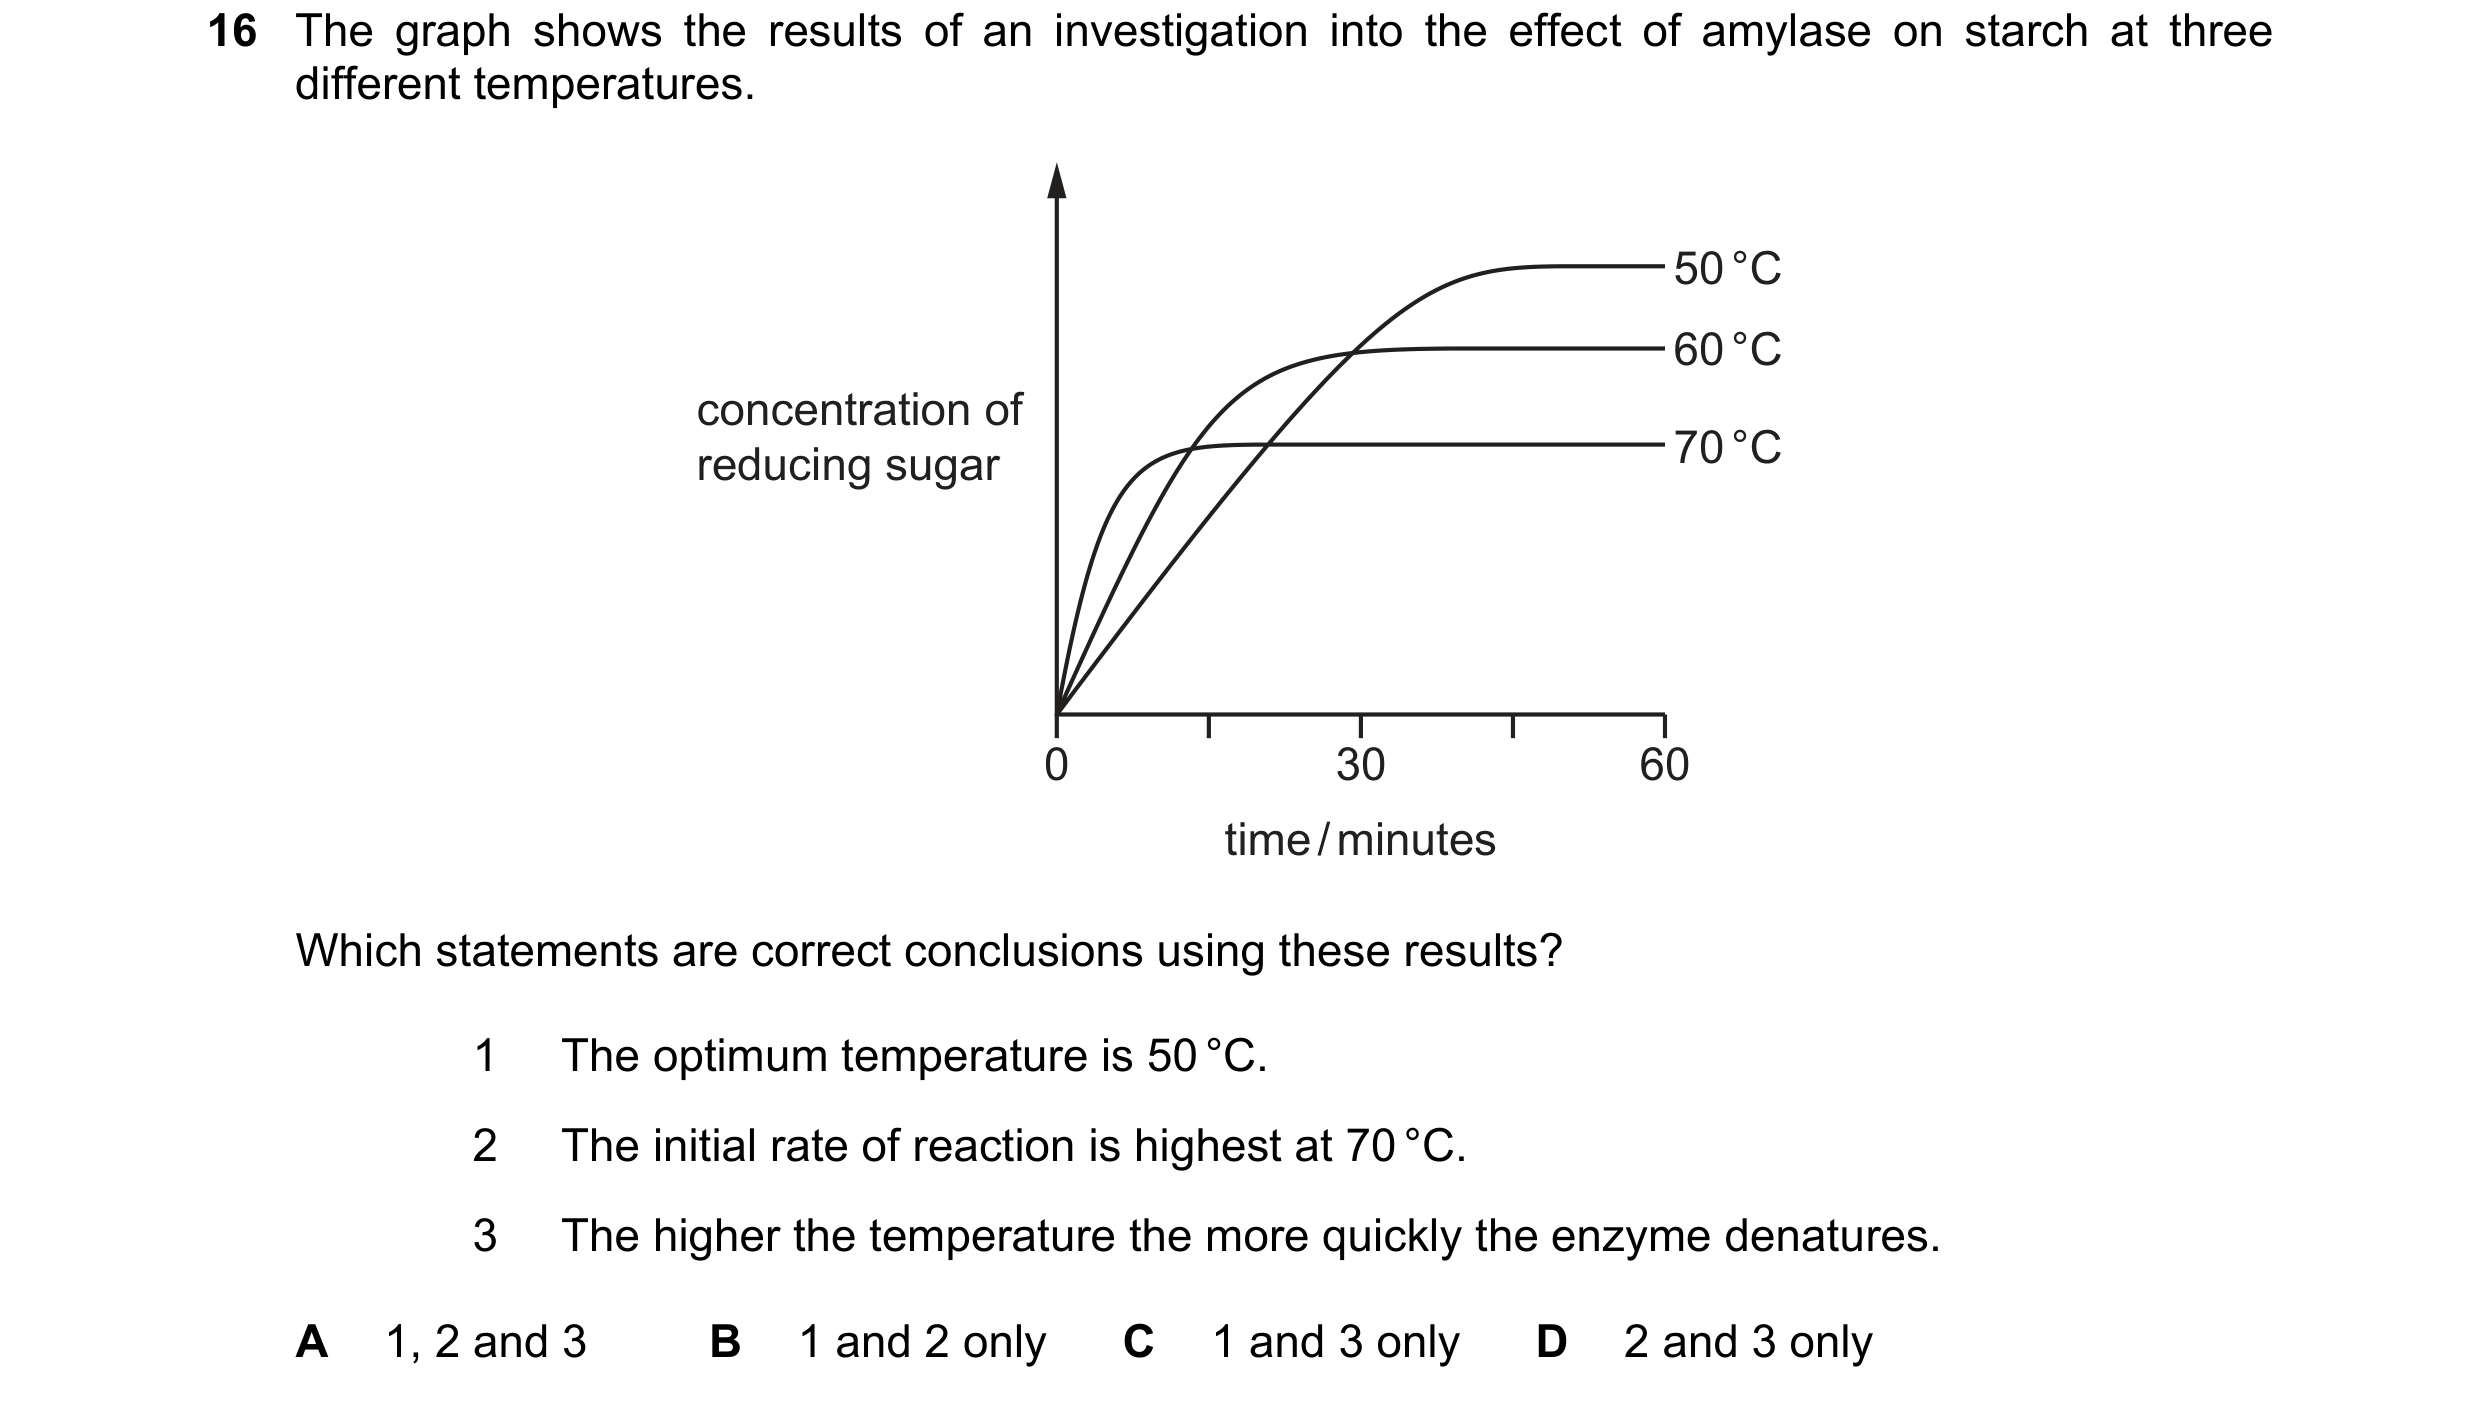
 76 / 76