Questions as text
Q1 · How the speed of a car varies over a short time 0625/32 Feb/March 2017
1 Fig. 1.1 shows how the speed of a car varies over a short time. C 16 speed m / s 12 D B 8 4 A E 0 0 4 8 12 16 20 24 28 32 time / s Fig. 1.1 (a) Different parts of the journey are labelled A, B, C, D and E. (i) State a part of the graph that shows the car at rest. … [1] (ii) State a part of the graph that shows the car moving with constant speed. … [1] (iii) During part of the journey the car decelerates. Calculate the distance travelled by the car when it is decelerating. distance travelled = … m [3] (b) Another car accelerates, from rest, starting at time 0 s. This car has a constant acceleration. Its speed at 20 s is 10 m / s. On Fig. 1.1, draw a line to show this motion. [2] (c) Describe, using Fig. 1.1, how you can decide which car has the greater acceleration. … … [1] [Total: 8]
8 marks
Mark scheme: 1(a)(i) A OR E stated B1 1(a)(ii) C B1 1(a)(iii) area under graph C1 0.5 × 16 × 8 C1 64 (m) A1 1(b) single straight line from origin drawn B1 diagonal line finishing at 10 m / s in 20 s B1 1(c) Steeper (gradient) owtte B1 Total: 8
This question in 0625/32 Feb/March 2017
Q2 · Three racing cars, A, B and C, all accelerate steadily and then continue at a constant… 0625/31 May/June 2017
2 Three racing cars, A, B and C, all accelerate steadily and then continue at a constant speed. Fig. 2.1 gives information about the movement of car A and car B at the start of the race. 40 speed m / s A 30 B 20 10 0 0 10 20 30 40 time / s Fig. 2.1 (a) State the maximum speed of car A. … [1] (b) Calculate the distance travelled by car B when accelerating. distance = … m [3] (c) Car C has a greater acceleration than car A, but it reaches a lower constant speed than car B. On Fig. 2.1, draw a line to show the movement of car C. [2] [Total: 6]
6 marks
Mark scheme: 2(a) 35 m / s B1 2(b) area under line/graph C1 0.5 × 15 × 25 C1 187.5 (m) A1 2(c) single straight line with steeper gradient than car A B1 horizontal line below 25 m / s B1 Total: 6
This question in 0625/31 May/June 2017
Q3 · Students about to start a 50.0 m swimming race 0625/32 May/June 2017
1 Fig. 1.1 shows students about to start a 50.0 m swimming race. Fig. 1.1 (a) The length of the pool is 50.0 m. Name a suitable piece of equipment that could be used to measure the length of the pool. … [1] (b) The race starts and the students swim to the end of the 50.0 m pool. Fig. 1.2 shows the times recorded on the stop watches for the winner and the swimmer in second place. winner second place min s 1 s min s 1 s 100 100 0. 58 75 1. 05 87 Fig. 1.2 (i) Determine the time taken by the winner to swim 50.0 m. Use information from Fig. 1.2. winner’s time = … s [1] (ii) Calculate the average speed of the winner. average speed = … m/s [2] (iii) Calculate the time difference between the winner and the swimmer in second place. time difference = … s [1] [Total: 5]
5 marks
Mark scheme: 1(a) flexible rule/tape measure/measuring tape B1 1(b)(i) 58.75 (s) B1 1(b)(ii) speed = distance ÷ time in any form C1 0.85 (m / s) A1 1(b)(iii) 7.12 (s) B1 Total: 5
This question in 0625/32 May/June 2017
Q4 · A woman drives a car from town A to town B 0625/33 May/June 2017
3 A woman drives a car from town A to town B. She stops at a garage during her journey. The distance-time graph for the journey is shown in Fig. 3.1. 120 100 town B distance / km 80 60 40 20 town A 0 0 0.5 1.0 1.5 2.0 2.5 time / h Fig. 3.1 (a) (i) Determine the total time for the whole journey. time = … h [1] (ii) Determine the time for which the car is not moving. time = … h [1] (iii) Determine the distance between town A and town B. distance = … km [1] (iv) Calculate the average speed of the car between 0 and 0.75 h. average speed = … km / h [3] (b) The speed of the car before stopping at the garage is different from its speed after stopping at the garage. Describe this difference in speed and explain how the graph in Fig. 3.1 shows it. … … … [2] [Total: 8]
8 marks
Mark scheme: 3(a)(i) 1.75 (hours) 1 hour 45 minutes B1 3(a)(ii) 0.5 (hours) 30 minutes B1 3(a)(iii) 100 (km) B1 3(a)(iv) Speed = distance ÷ time in any form C1 50 ÷ 0.75 C1 66.67 (km / h) A1 3(a)(v) (average) speed after stopping is faster B1 line on graph is steeper B1 Total: 8
This question in 0625/33 May/June 2017
Q5 · A river flowing through a village 0625/31 Oct/Nov 2017
2 Fig. 2.1 shows a river flowing through a village. There are two bridges across the river. bridge X direction of flow bridge Y Fig. 2.1 Two students plan to measure the speed of a stick as it floats on the river between bridge X and bridge Y. (a) The students plan to drop a stick into the middle of the river from bridge X. The stick moves with the water between bridge X and bridge Y. Describe how the students can determine the average speed of the stick. … … … … … … … … [4] (b) The stick moves with constant speed. One statement correctly describes the horizontal forces acting on the stick. Put a tick (✓) in the box next to the correct statement. Only a forward force acts. The forward force and the backward force are equal. The forward force is greater than the backward force. The backward force is greater than the forward force. [1] [Total: 5]
5 marks
Mark scheme: 2(a) Any four from: Measure the distance between the two bridges Start stopwatch when stick hits water / starts moving (with river) stop stopwatch when stick reaches bridge Y Use speed = distance ÷ time repeat procedure and find average B4 2(b) 2nd box ticked The forward force and the backward force are equal B1
This question in 0625/31 Oct/Nov 2017
Q6 · A man listening to a radio 0625/31 Oct/Nov 2017
7 (a) Fig. 7.1 shows a man listening to a radio. X centre of loudspeaker Fig. 7.1 (i) Sound from the radio makes an air particle at X vibrate. On Fig. 7.1 draw two arrows on point X to show the directions of vibration of the air particle. [2] (ii) Which of these terms correctly describes the sound wave? Tick one box. transverse longitudinal electromagnetic [1] (iii) Suggest a value for the frequency of the sound that the man can hear. State the unit. frequency = … [2] (iv) Explain why the man cannot hear ultrasound. … … [1] (b) Fig. 7.2 shows a distance-time graph for ultrasound travelling in sea-water. 1000 distance / m 800 600 400 200 0 0 0.20 0.40 0.60 0.80 time / s Fig. 7.2 (i) Use the graph to calculate the speed of ultrasound in sea-water. speed = … m / s [2] (ii) A scientist measures the depth of the sea by using ultrasound. She sends a pulse of ultrasound from the ship to the seabed. It reflects from the seabed as shown in Fig. 7.3. reflection pulse of ultrasound Fig. 7.3 The time taken between sending a pulse and receiving the echo is 0.60 s. Use the graph to determine the depth of the sea. depth = … m [2]
10 marks
Mark scheme: 7(a)(i) arrows horizontal / on line from radio to man B1 arrows in opposite direction B1 7(a)(ii) middle box ticked longitudinal B1 7(a)(iii) number in range 20–20 000 B1 hertz B1 7(a)(iv) (frequency of ultrasound) is above human (hearing) range B1 7(b)(i) speed = dist ÷ time or any two corresponding values of distance ÷ time e.g. 600 ÷ 0.4 C1 1500 (m / s) A1 7(b)(ii) 900 (m) read from graph C1 depth = 450 (m) A1
This question in 0625/31 Oct/Nov 2017
Q7 · A speed-time graph for a ship starting to move 0625/32 Oct/Nov 2017
2 Fig. 2.1 shows a speed-time graph for a ship starting to move. D 10 8 speed 6 C m / s 4 B 2 A 0 0 1 2 3 4 5 6 7 8 9 10 time / minutes Fig. 2.1 (a) Describe the motion of the ship during each section of the graph. A … … B … … C … … D … … [4]
4 marks
Mark scheme: 2(a) A – accelerates (from rest) B1 B – constant speed (of 2 m / s) B1 C – accelerates at faster rate / higher acceleration than previously B1 D – faster constant speed (of 10 m / s) B1 2(b) 2 minutes = 120 s C1 area under the graph OR d = s × t OR 2 × 120 C1 240 (m) A1
This question in 0625/32 Oct/Nov 2017
Q8 · A student determines the speed of three cars on a straight road 0625/33 Oct/Nov 2017
1 (a) A student determines the speed of three cars on a straight road. The student measured the time for the cars to travel 50 m. The table shows the measurements. car distance travelled / m time taken / s A 50 3.2 B 50 4.0 C 50 3.6 (i) Without calculation, identify the fastest car and the slowest car. Complete the table. car the fastest car the slowest car [2] (ii) Calculate the speed of car B. speed = … m / s [3] (b) (i) Estimate the time, in minutes, for car C to travel 5000 m. estimated time = … minutes [2] (ii) Explain why your answer in (b)(i) may not be the same as the actual time taken for the car to travel 5000 m. … … [1] [Total: 8]
8 marks
Mark scheme: 1(a)(i) A AND B cars identified B1 A = fastest AND B = slowest B1 1(a)(ii) speed = distance ÷ time in any recognised form C1 50 ÷ 4 C1 1(b)(i) 12.5 (m / s) A1 100 × 3.6 OR 360 (s) indicated C1 answers in the range 5–7 minutes A1 1(b)(ii) any one from: car will move faster / slower at times / speed not constant B1 road will have bends / hills etc. slower moving traffic or other sensible road conditions
This question in 0625/33 Oct/Nov 2017
Q9 · Model trains move along a track passing through two model stations 0625/31 May/June 2018
1 Model trains move along a track passing through two model stations. Students analyse the motion of a train. They start a digital timer as the train starts to move. They record the time that it enters Station A and the time it enters Station B. Fig. 1.1 shows the time on entering Station A and the time on entering Station B. hour min sec hour min sec time entering Station A time entering Station B Fig. 1.1 (a) Calculate the time taken from the train entering Station A to the train entering Station B. State your answer in seconds. time taken = … s [1] (b) A faster train takes 54 s to travel from Station A to Station B. The distance between the stations is 120 m. Calculate the average speed of this train. average speed = … m / s [3] (c) Fig. 1.2 shows the speed-time graph for a train travelling on a different part of the track. 4.0 speed m / s 3.0 2.0 1.0 0 0 2.0 4.0 6.0 8.0 10.0 12.0 14.0 time / s Fig. 1.2 Determine the total distance travelled by the train on this part of the track. distance = … m [4] [Total: 8]
8 marks
Mark scheme: 1(a) 72 (s) 1 1(b) (average speed =) distance ÷ time 1 120 ÷ 54 1 2.2(2) (m / s) 1 1(c) area under line OR three areas indicated OR (dist =) (av.) speed × time OR 1/2 (b + h) × L 1 1 3.5 4.0 2 × × OR 7 (m) seen OR 6 × 3.5 OR 21 (m) 1 6 × 3.5 OR 21 (m) AND { 1 2 × 3.5 × 4.0 OR 7 (m)} OR 14 (m) 1 (21 + 14 =) 35 (m) 1
This question in 0625/31 May/June 2018
Q10 · The vertical forces on a rocket 0625/31 May/June 2018
3 (a) Fig. 3.1 shows the vertical forces on a rocket. thrust 74.2 N air resistance 2.4 N weight 43.0 N Fig. 3.1 Calculate the resultant force on the rocket. resultant force = … N direction = … [3] (b) Fig. 3.2 shows the speed and direction of motion of an object at a point in time. 150.0 m / s object Fig. 3.2 The resultant force on the object is zero for 10 seconds. Deduce the speed and direction of motion after 5 seconds. Indicate the speed and direction of the object by drawing a labelled arrow next to the object in Fig. 3.3. Fig. 3.3 [1] [Total: 4]
4 marks
Mark scheme: 3(a) 43.0 + 2.4 = 45.4 (N) 1 (74.2 – 45.4 =) 28.8 (N) 1 upwards 1 3(b) 1
This question in 0625/31 May/June 2018
Q11 · The speed-time graph for a car 0625/32 May/June 2018
1 Fig. 1.1 shows the speed-time graph for a car. 25 speed m / s X Y 20 15 10 5 Z W 0 0 10 20 30 40 50 60 70 80 90 100 time / s Fig. 1.1 (a) On Fig. 1.1, the labels W, X, Y and Z show the points when the car’s motion changed. On Fig. 1.2, draw a line from each section of the graph to the correct description of the motion. section of graph description of the motion accelerating from W to X decelerating from X to Y stationary from Y to Z constant speed Fig. 1.2 [3] (b) Calculate the distance that the car travels between 60 s and 100 s. distance travelled = … m [3] (c) Fig. 1.1 shows that the car’s acceleration is greater than its deceleration. Explain how the graph shows this. … … [1] [Total: 7]
7 marks
Mark scheme: 1(a) 1 mark for each correct line. 2 or more lines from any section loses the mark. 3 1(b) (distance travelled) = area under graph OR ½ × base × height 1 ½ × 40 × 20 1 400 (m) 1 1(c) 1st section/WX/from 0 s to 30 s has greater gradient than last (section)/YZ/from 60 s to 100 s 1
This question in 0625/32 May/June 2018
Q12 · A student watches a car race around a track 0625/33 May/June 2018
1 A student watches a car race around a track. He uses a stopwatch to measure the time for the car to make one lap of the track. (a) The student forgets to reset the stopwatch at the start of the race. Fig. 1.1 shows the time on the stopwatch at the start and the time after going around the track once. time at start time after going around the track once min s 1 s min s 1 s 100 100 01:22. 02:33. Fig. 1.1 Calculate the time the car takes to go around the track once, in seconds. time = … s [2] (b) The length of the track is 4.0 km. The car goes around the track 20 times. The car takes 26 minutes and 40 seconds to complete the 20 laps. Calculate the average speed of the car in m / s. average speed = … m / s [4] (c) Fig. 1.2 shows a speed-time graph for the car during part of the race. 80.0 speed V m / s T S 60.0 R Q 40.0 20.0 P 0 0 5.0 10.0 15.0 20.0 25.0 30.0 35.0 time / s Fig. 1.2 (i) State the section of the graph that shows the greatest acceleration. … Explain your answer. … [2] (ii) Calculate the distance travelled by the car during the first 2.5 seconds. distance = … m [3] [Total: 11]
11 marks
Mark scheme: 1(a) 2 : 33 : 65 – 1 : 22 : 15 OR 153.65 – 82.15 1 71.50 (s) 1 1(b) 4 × 20 OR 4000 × 20 1 (average speed =) distance ÷ time 1 80 000 ÷ 1600 1 50 (m / s) 1 1(c)(i) (section) P or from 0 s to 2.5 s 1 (line has) greatest gradient 1 1(c)(ii) dist travelled = area under graph OR ½ × b × h 1 ½ × 2.5 × 40 1 50 (m) 1
This question in 0625/33 May/June 2018
Q13 · A speed-time graph for a student who is running 0625/31 Oct/Nov 2018
1 Fig. 1.1 shows a speed-time graph for a student who is running. 5 speed 4 m / s 3 2 1 00 10 20 30 40 50 60 70 80 90 100 time / s Fig. 1.1 (a) (i) Describe the movement of the student, as shown in Fig. 1.1. … … … [2] (ii) Calculate the distance travelled by the student between 80 s and 100 s. distance travelled = … m [3] (b) An athlete runs 630 m in 130 s on a flat section of a road and then 254 m in 40 s on a downhill slope. Calculate the average speed for the total distance run by the athlete. average speed = … m / s [3] [Total: 8]
8 marks
Mark scheme: 1(a)(i) constant speed OR speed of 4 m / s (for 80 s) B1 (constant) deceleration OR speed decreases OR slows (down after 80 s) OR stops after 100 s B1 1(a)(ii) distance = area under graph C1 20 × 4 × 0.5 or area = ½ × base × height C1 40 (m) A1 1(b) (average speed =) total distance ÷ total time C1 (630 + 254) ÷ (130 +40) OR 884 ÷ 170 C1 5.2 (m / s) A1
This question in 0625/31 Oct/Nov 2018
Q14 · A person on roller skates makes a journey 0625/32 Oct/Nov 2018
1 A person on roller skates makes a journey. Fig. 1.1 shows the speed-time graph for the journey. 25 speed X Y 20 m / s 15 10 5 W Z 0 0 10 20 30 40 50 60 70 80 90 100 time / s Fig. 1.1 (a) The graph shows three types of motion. Complete the table to show when each type of motion occurs. Use the letters shown on Fig. 1.1. Add a letter to each of the blank spaces. The first row is done for you. motion start of motion end of motion acceleration W X deceleration constant speed [2] (b) Calculate the distance travelled between 60 s and 100 s. distance = … m [3] (c) The size of the acceleration is greater than the deceleration. Describe how Fig. 1.1 shows this. … … [1] [Total: 6]
6 marks
Mark scheme: 1(a) middle row: YZ B1 bottom tow: XY B1 1(b) area under graph C1 0.5 × 20 × 40 OR ½ base × height C1 400 (m) A1 1(c) (WX or acceleration has) steeper line / gradient B1
This question in 0625/32 Oct/Nov 2018
Q15 · A drone is a machine that can fly 0625/32 Oct/Nov 2018
4 A drone is a machine that can fly. Fig. 4.1 shows a drone rising into the air, lifting a camera. camera Fig. 4.1 The drone obtains energy from a battery of cells. (a) Complete the sequence of useful energy transfers as the drone rises into the air. One part is done for you. … electrical energy … [2] (b) The drone can move in any direction up or down, backwards or forwards, left or right. It can also remain stationary above the ground. Describe the motion and position of the drone when it has both a large quantity of potential energy and a small quantity of kinetic energy. … … [2] (c) When the drone moves, it wastes some energy. State the form of wasted energy and describe what happens to this energy. form of energy … description … … [2] [Total: 6]
6 marks
Mark scheme: 4(a) chemical gravitational potential energy OR kinetic B2 4(b) hovering OR stationary OR moving slowly owtte B1 at max height B1 4(c) thermal dissipated to the air / surroundings B2
This question in 0625/32 Oct/Nov 2018
Q16 · A large tank containing water 0625/33 Oct/Nov 2018
1 Fig. 1.1 shows a large tank containing water. The tank leaks. Drops of water fall from the tank. The drops hit the ground at a regular rate. tank water drops of water 12 m ground Fig. 1.1 (a) A student measures the time interval between two drops of water hitting the ground. She uses a stopwatch and repeats the procedure three times. Fig. 1.2 shows each stopwatch reading. min s 1 s min s 1 s min s 1 s 100 100 100 . . . 0. 01. 24 0. 01. 14 0. 01. 16 time = … s time = … s time = … s Fig. 1.2 (i) On the line below each stopwatch, state the time readings shown, in seconds. [1] (ii) Calculate the average time interval between two drops of water hitting the ground. average time = … s [2] (b) Another student measures the average time taken for a drop of water to fall from the tank to the ground. The time taken is 1.6 s. Calculate the average speed of this drop of water. average speed = … m/s [3] (c) Fig. 1.3 shows the speed-time graph for a different drop of water. 5.0 P Q 4.5 speed m / s 4.0 3.5 3.0 2.5 2.0 1.5 1.0 0.5 0 0 0.5 1.0 1.5 2.0 2.5 time / s Fig. 1.3 Use Fig. 1.3 to determine the distance fallen by the drop between P and Q. distance = … m [3] [Total: 9]
9 marks
Mark scheme: 1(a)(i) 1.24 (s) AND 1.14 (s) AND 1.16 (s) B1 1(a)(ii) (1.24 + 1.14 + 1.16) ÷ 3 OR 3.54 ÷ 3 C1 1.18 (s) A1 1(b) (average speed =) dist ÷ time C1 12 ÷ 1.6 C1 7.5 (m / s) A1 1(c) distance travelled = area under graph OR counting squares C1 4.5 × 0.75 C1 3.375 OR 3.4 A1
This question in 0625/33 Oct/Nov 2018
Q17 · Students getting onto a school bus 0625/32 Feb/March 2019
2 Fig. 2.1 shows students getting onto a school bus. Fig. 2.1 (a) A student describes part of the journey. The bus accelerates from rest at a constant rate for 10 s. It reaches a maximum speed of 10 m / s. The bus maintains a constant speed of 10 m / s for 60 s. The bus then decelerates at a constant rate for 15 s, until it stops. On Fig. 2.2, draw the speed-time graph for this part of the journey made by the bus. 12 speed m / s 10 8 6 4 2 0 0 10 20 30 40 50 60 70 80 90 100 time / s Fig. 2.2 [5] (b) On another part of the journey, the average speed of the bus is 7.5 m / s. Calculate the distance the bus travels in 150 s. distance = … m [3]
8 marks
Mark scheme: 2(a) line starts from 0 on y-axis straight diagonal line to 10 m / s line parallel to time axis straight diagonal line to x-axis at greater time (from horizontal section) line drawn to time axis at (85, 0) B5 2(b) speed = distance ÷ time in any form OR (distance =) speed × time C1 7.5 × 150 C1 1125 (m) A1
This question in 0625/32 Feb/March 2019
Q18 · A teacher investigates the reaction time of five students 0625/31 May/June 2019
3 A teacher investigates the reaction time of five students. A 0.50 m ruler is held above the hand of a student before being allowed to fall. The arrangement is shown in Fig. 3.1. teacher’s hand student’s hand Fig. 3.1 As soon as the ruler falls the student closes their hand, catching the ruler. The further the ruler falls, the greater the reaction time of the student. The results obtained are shown in Fig. 3.2. 24 distance ruler 22 falls / cm 20 18 16 14 12 10 8 6 4 2 0 A B C D E students Fig. 3.2 (a) Using the results shown in Fig. 3.2, calculate the average distance that the ruler drops. average distance = … cm [2] (b) List the students in order of their reaction times, with the shortest reaction time at the top of the table. One has been done for you. order student 1st 2nd 3rd B 4th 5th [2] (c) In a similar investigation, a ruler drops a distance of 11.0 cm and has an average speed of 16 cm / s. Calculate the reaction time. reaction time = … s [3] [Total: 7]
7 marks
Mark scheme: 3(a) 67 (cm) C1 (67 ÷ 5 =) 13.4 (cm) A1 3(b) C 1st ; A 2nd; B1 D 4th; E 5th B1 3(c) speed = distance ÷ time in any form OR (t = ) distance ÷ speed C1 11 ÷ 16 C1 0.69 (s) A1
This question in 0625/31 May/June 2019
Q19 · A student moves a model car along a bench 0625/32 May/June 2019
1 A student moves a model car along a bench. Fig. 1.1 is the speed-time graph for the motion of the model car. 4.0 speed B m / s 3.0 C 2.0 A 1.0 D 0 0 5.0 10.0 15.0 20.0 time / s Fig. 1.1 (a) Describe the motion of the car in each of the sections A, B, C and D. A … B … C … D … [4] (b) Determine the distance moved by the model car in the first five seconds. distance = … m [3] [Total: 7]
7 marks
Mark scheme: 1(a) A accelerating (uniformly) / speeding up B1 B steady/constant/uniform speed B1 C deceleration (non-uniform) / slowing down B1 D at rest / stopped/stationary / not moving B1 1(b) distance = area under graph OR area = ½ × base × height C1 0.5 × 3.5 × 5 C1 8.75 (m) A1
This question in 0625/32 May/June 2019
Q20 · A simple pendulum swinging backwards and forwards between P and Q 0625/32 May/June 2019
3 Fig. 3.1 shows a simple pendulum swinging backwards and forwards between P and Q. One complete oscillation of the pendulum is when the bob swings from P to Q and then back to P. support string P Q R pendulum bob Fig. 3.1 (a) A student starts two stopwatches at the same time while the pendulum bob is swinging. The student stops one stopwatch when the pendulum bob is at P. He stops the other stopwatch when the pendulum bob next is at Q. Fig. 3.2 shows the readings on the stopwatches. reading at P reading at Q min s 1 s min s 1 s 100 100 0 : 2 : 22 0 : 2 : 77 Fig. 3.2 (i) Use readings from Fig. 3.2 to determine the time for one complete oscillation of the pendulum. time = … s [2] (ii) The method described in (a) does not give an accurate value for one complete oscillation of the pendulum. Describe how the student could obtain an accurate value for one complete oscillation of the pendulum. … … … … … … [4] (b) As the pendulum bob moves from R to Q it gains 0.4 J of gravitational potential energy. Air resistance can be ignored. State the value of kinetic energy of the pendulum bob at 1. R … J 2. Q … J [2] [Total: 8]
8 marks
Mark scheme: 3(a)(i) 2.77 – 2.22 OR 0.55 B1 1.1(0) (s) B1 3(a)(ii) any four from: (idea of) use of fiducial mark start watch as pendulum passes fiducial mark OR when pendulum released count large number (must be >=10) of swings stop watch as pendulum passes marker OR starting point divide total time by the number of swings timing to centre of swing B4 3(b) 1 0.4(J) B1 2 0 or zero or no (J) B1
This question in 0625/32 May/June 2019
Q21 · A distance-time graph for a man walking from home to a café 0625/33 May/June 2019
2 Fig. 2.1 shows a distance-time graph for a man walking from home to a café. At the café the man stops for a drink. On the return journey from the café, the man stops to rest. 12.0 distance / km 10.0 8.0 6.0 4.0 2.0 0 0 1.0 2.0 3.0 4.0 5.0 6.0 time / hours Fig. 2.1 (a) Using Fig. 2.1, determine (i) the distance from the man’s home to the café. distance = … km [1] (ii) the time taken to walk to the café. time = … hours [1] (iii) the speed, in km / hour, of the man as he walks to the café. speed = … km / hour [3] (b) On the return journey from the café, the man stopped to rest. (i) The man left home at 13:00. Determine the time when the man began his rest. time when rest began … [1] (ii) For how long did the man rest on the return journey? State the time in minutes. time = … minutes [1] (iii) Describe, in words, how the graph in Fig. 2.1 shows that the man travelled at a slower speed on the return journey after resting. … … [1] [Total: 8]
8 marks
Mark scheme: 2(a)(i) 10 (km) B1 2(a)(ii) 1.5 (hours) B1 2(a)(iii) speed = distance ÷ time in any form C1 10 ÷ 1.5 C1 6.7 (km/h) accept 6.67 (km/h) A1 2(b)(i) 4:30 (pm) OR 16:30 B1 2(b)(ii) 30 (minutes) B1 2(b)(iii) smaller gradient OR less steep slope owtte B1
This question in 0625/33 May/June 2019
Q22 · Four students P, Q, R and S each attempt to measure the time period (the time for one… 0625/31 Oct/Nov 2019
2 Four students P, Q, R and S each attempt to measure the time period (the time for one complete oscillation) of a pendulum. The arrows in Fig. 2.1 show the movements of the pendulum that each student times. P Q R S start end start start start end end end Fig. 2.1 (a) State the student who has chosen the correct movement for one period of a pendulum. student … [1] (b) Another student uses a stopwatch to measure the time taken for 50 periods of a pendulum. Fig. 2.2 shows the time taken on the stopwatch. min s 1 s 100 01:23.37 Fig. 2.2 Calculate the time for one period of the pendulum. Give your answer to 3 significant figures. time for one period = … s [3] (c) The student measures the displacement of the pendulum bob from its rest position. The displacement is 16.5 cm, as shown in Fig. 2.3. 16.5 cm Fig. 2.3 State the displacement in millimetres. displacement = … mm [1] [Total: 5]
5 marks
Mark scheme: 2(a) (student) S B1 2(b) 83.37 (s) seen C1 83.37 ÷ 50 C1 1.67 (s) cao A1 2(c) 165 (mm) B1
This question in 0625/31 Oct/Nov 2019
Q23 · A water tank that is leaking 0625/32 Oct/Nov 2019
1 Fig. 1.1 shows a water tank that is leaking. Drops of water fall from the tank at a constant rate. water tank water drops of water supports ground Fig. 1.1 (NOT to scale) (a) A student uses a stopwatch to determine the time between two drops hitting the ground. He sets the stopwatch to zero. He starts the stopwatch when the first drop hits the ground. He stops the stopwatch after a further 30 drops have hit the ground. The reading on the stopwatch is recorded and shown in Fig. 1.2. min s 1 s 100 00:13. 20 Fig. 1.2 (i) State the time taken for 30 drops to hit the ground. time = … s [1] (ii) Calculate the average time between two drops hitting the ground. time = … s [2] (iii) Explain why the student measures the time for 30 drops to hit the ground instead of measuring the time for one drop to hit the ground. … … [1] (b) Fig. 1.1 shows that the drops get further apart as they get close to the ground. State why the drops get further apart. … … [1] (c) In another experiment the student determines the speed of a falling weight at different times. The speed–time graph for his results is shown in Fig. 1.3. 15.0 speed m / s 10.0 5.0 0 0 0.5 1.0 1.5 time / s Fig. 1.3 Calculate the distance fallen by the weight in the first 1.5 s. distance = … m [3] [Total: 8]
8 marks
Mark scheme: 1(a)(i) 13.2(0) (s) B1 1(a)(ii) 13.2 ÷ 30 C1 0.44 (s) A1 1(a)(iii) reduces the effects of (timing / reaction time) errors owtte B1 1(b) Drops are accelerating OR moving with increasing speed B1 1(c) distance = area under graph OR ½ × b × h C1 0.5 × 1.5 × 15 C1 11.25 (m) A1
This question in 0625/32 Oct/Nov 2019
Q24 · A student reviews some data about athletes and footballers 0625/33 Oct/Nov 2019
2 A student reviews some data about athletes and footballers. (a) An athlete runs 12 km in 1.5 hours. Calculate the athlete’s average speed in km / h. average speed = … km / h [3] (b) Fig. 2.1 shows the speed-time graph for a footballer for the first 15.0 seconds of a game. 7.0speed m / s 6.0 5.0 4.0 3.0 2.0 1.0 0 0 1.0 2.0 3.0 4.0 5.0 6.0 7.0 8.0 9.0 10.0 11.0 12.0 13.0 14.0 15.0 time / s Fig. 2.1 (i) Use the graph in Fig. 2.1 to calculate the distance travelled by the footballer during the first 4.0 seconds. distance = … m [3] (ii) Use the graph in Fig. 2.1 to determine when the footballer is moving with greatest acceleration. Between … s and … s Give a reason for your answer. … … [2] (c) Another footballer has a mass of 72 kg. Calculate the weight of this footballer. weight = … N [3]
11 marks
Mark scheme: 2(a) speed = (total) distance ÷ time in any form 12 ÷ 1.5 8 (km / h) C1 C1 A1 2(b)(i) distance = area under graph OR area = ½ × base × height ½ × 3.0 × 4.0 6(.0) (m) C1 C1 A1 2(b)(ii) (between) 10(.0) and 12(.0) steepest section of graph / greatest gradient M1 A1 2(c) W = mg in any form 72 × 10 720 (N) C1 C1 A1
This question in 0625/33 Oct/Nov 2019
Q25 · A student drops a ball from a high window 0625/32 Feb/March 2020
3 A student drops a ball from a high window. (a) The mass of the ball is 0.12 kg. Calculate the weight of the ball. weight = … N [3] (b) Fig. 3.1 shows the speed of the ball while it is falling. The points S, T, U, V and W are shown on the graph. 25 speed 20 U V W m / s 15 10 T 5 S 0 0 1.0 2.0 3.0 4.0 5.0 time / s Fig. 3.1 Draw one line from each section of the graph to the correct description of the motion. One has been drawn for you. section of graph description of motion at rest S – T decreasing acceleration T – U constant acceleration moving with constant speed U – V slowing down [2] (c) Determine the distance fallen by the ball in section U – V of the graph. distance = … m [3] (d) State the distance fallen by the ball in section V – W of the graph. distance = … m [1] [Total: 9]
9 marks
Mark scheme: 3(a) W = m × g in any form C1 0.12 × 10 C1 (weight =) 1.2 (N) A1 3(b) Line from T–U to decreasing acceleration B1 Line from U–V to moving with constant speed B1 3(c) (distance travelled =) area under the graph C1 2 × 20 C1 40 (m) A1 3(d) 20 OR answer = (c) answer ÷ 2 B1
This question in 0625/32 Feb/March 2020
Q26 · During part of a race, a skier travels a distance of 200 m in a time of 6.4 s 0625/31 May/June 2020
4 (a) During part of a race, a skier travels a distance of 200 m in a time of 6.4 s. Calculate the average speed of the skier. average speed = … m / s [3] (b) Fig. 4.1 shows a speed–time graph for the skier in another part of the race. 20.0 Q speed m / s 15.0 P 10.0 R 5.0 S 0 0 5.0 10.0 15.0 20.0 25.0 30.0 time / s Fig. 4.1 Describe the motion of the skier at each point P, Q, R and S on the graph. P … Q … R … S … [4] (c) Skis are strapped to a skier’s feet and are longer and wider than the skier’s feet. Explain how the skis prevent the skier from sinking into soft snow. … … … [2] [Total: 9]
9 marks
Mark scheme: 4(a) C1 (s =) 200 ÷ 6.4 C1 (s =) 31 (m / s) A1 4(b) P – (constantly) accelerates (from 5 m / s) B1 Q – constant speed (of 17.5 m / s) B1 R – (non-constant) decelerates (from 17.5 m / s to rest) B1 S – at rest or stationary B1 4(c) (skis have) large (surface) area B1 (so) less pressure (on snow / ground) B1
This question in 0625/31 May/June 2020
Q27 · Some students determine the speed of a car on a road 0625/32 May/June 2020
2 (a) Some students determine the speed of a car on a road. The students measure the time for the car to travel 30 m along the road. The time is 5.4 s. Calculate the average speed of the car. average speed = … m / s [3] (b) Another car moves at a constant speed of 16 m / s for 4.0 seconds. During the next 2.0 seconds, the car decelerates from a speed of 16 m / s to a speed of 13 m / s. It then continues at a constant speed of 13 m / s for 3.0 seconds. On Fig. 2.1, plot the speed–time graph for the motion of the car during these 9.0 s. 20 speed m / s 15 10 5 0 0 2.0 4.0 6.0 8.0 10.0 time / s Fig. 2.1 [3] (c) A motorcycle accelerates as shown in Fig. 2.2. Calculate the distance the motorcycle travels while it is accelerating. Use information from Fig. 2.2. 40 speed m / s 30 20 10 0 0 1.0 2.0 3.0 4.0 5.0 time / s Fig. 2.2 distance travelled = … m [3] [Total: 9]
9 marks
Mark scheme: 2(a) (s =) d ÷ t OR s = d ÷ t in any form C1 (average speed =) 30 ÷ 5.4 C1 5.6 (m / s) A1 2(b)(i) first section and third section horizontal straight lines B1 second section line with negative gradient B1 first section horizontal line at 16 m / s AND third section horizontal line at 13 m / s at correct times B1 2(b)(ii) (d =) 1 2 × (a + b) × t OR area under graph C1 1 2 × (24 + 30) × 2.5 OR (24 × 2.5) + ( 1 2 × 6 × 2.5) C1 67.5 (m) A1
This question in 0625/32 May/June 2020
Q28 · Student P and student Q run in a 100 m race 0625/31 Oct/Nov 2020
1 Student P and student Q run in a 100 m race. Fig. 1.1 shows the distance–time graph for each student during the race. 100 distance / m 80 60 40 20 0 0 2.0 4.0 6.0 8.0 10.0 12.0 time / s Key student P student Q Fig. 1.1 (a) Determine the time taken for student Q to run 100 m. time = … s [1] (b) Determine the distance between the two students as Q reaches 100 m. distance = … m [1] (c) Calculate the average speed of student Q during the 100 m race. average speed = … m / s [3] (d) State which student has the faster speed between 3.0 s and 6.0 s. Explain how Fig. 1.1 allows you to compare speeds without calculation. … … … [1] [Total: 6]
6 marks
Mark scheme: 1(a) 12.0 (s) B1 1(b) (distance = 100 – 96 =) 4.0 (m) B1 1(c) (av. speed =) distance ÷ time in any form C1 (av. speed =) 100 ÷ 12.0 C1 (av. speed =) 8.3 (m / s) A1 1(d) (student Q) M0 the steeper the line the faster(the runner) ORA A1
This question in 0625/31 Oct/Nov 2020
Q29 · A box attached to a parachute 0625/32 Oct/Nov 2020
1 Fig. 1.1 shows a box attached to a parachute. The box and the parachute are falling through the air. 16.0 N parachute 2.5 N box 20.0 N Fig. 1.1 (a) Fig. 1.1 shows three vertical forces acting on the box and the parachute. (i) Calculate the resultant vertical force and state its direction. resultant vertical force = … N direction … [3] (ii) Suggest and explain what happens to the size of the upward vertical force on the parachute if the area of the parachute used is increased. suggestion … explanation … … [2] (b) Fig. 1.2 shows the speed–time graph for the box before the parachute is opened. 45 40 35 speed m / s 30 25 20 15 10 5 0 0 10 20 30 40 time / s Fig. 1.2 (i) Determine the time when the speed of the box is 30 m / s. time = … s [1] (ii) Deduce the size of the resultant vertical force on the box when the time is 35 s. Explain your answer. size of resultant vertical force … explanation … … [2] (iii) Calculate the distance the box moves between time = 30 s and time = 40 s. distance = … m [3] [Total: 11]
11 marks
Mark scheme: 1(a)(i) 20.0 – (2.5 + 16.0) C1 1.5 (N) A1 (vertically) down B1 1(a)(ii) (upwards force) increases B1 increases air resistance B1 1(b)(i) 6.5 (s) B1 (b)(ii) (resultant force is) zero B1 (because the) speed (of parachute) is constant / steady / uniform B1 1(b)(iii) (dist. travelled =) area under line (of speed-time graph) C1 45 x 10 C1 450 (m) A1
This question in 0625/32 Oct/Nov 2020
Q30 · A teacher uses a long spring to demonstrate wave motion 0625/32 Oct/Nov 2020
7 A teacher uses a long spring to demonstrate wave motion. She makes a wave move along the coils of the spring. Fig. 7.1 shows the wave on the spring. direction of wave travel movement of coils Fig. 7.1 (a) Explain why the type of wave in Fig. 7.1 is a longitudinal wave. … … [2] (b) Measure the wavelength of the wave shown in Fig. 7.1. wavelength = … cm [1] (c) State what is meant by the frequency of a wave. … … [2] (d) The wave in Fig. 7.1 travels 25 cm in 0.20 s. Calculate the speed of the wave. speed = … cm / s [3] [Total: 8]
8 marks
Mark scheme: 7(a) movement (of coils / spring) parallel B1 to the direction wave / it / disturbance travels B1 7(b) 5.2 (cm) B1 7(c) number of waves (passing a point OR sent out) B1 (in) one second / unit time. B1 7(d) speed = distance ÷ time C1 25 ÷ 0.2(0) C1 125 (cm / s) A1
This question in 0625/32 Oct/Nov 2020
Q31 · A lorry moving on a straight road 0625/33 Oct/Nov 2020
1 (a) Fig. 1.1 shows a lorry moving on a straight road. The arrows represent the horizontal forces acting on the lorry. These forces act along the same straight line. 500 N 1000 N 1500 N Fig. 1.1 (i) Calculate the size of the resultant horizontal force on the lorry. size of resultant force = … N [2] (ii) Describe the effect of a horizontal resultant force of zero on the speed of the lorry. Put a tick (3) in one box. speed increases to a higher constant speed speed stays the same speed decreases to a lower constant speed speed decreases to zero [1] (b) The speed of the motorcycle in Fig. 1.2 is 20 m / s. Fig. 1.2 The rider reacts to a sudden change in the traffic ahead. He stops as quickly as possible by applying the brakes. The total stopping distance is made up of the distance travelled while the rider is reacting and the distance travelled when the brakes are applied. Fig. 1.3 shows information about stopping when the speed of the motorcycle is 20 m / s. 15 m 38 m distance travelled distance travelled while braking while reacting Fig. 1.3 (i) Calculate the total stopping distance when the speed of the motorcycle is 20 m / s. total stopping distance = … m [1] (ii) Suggest one factor that could increase the total stopping distance. … [1] [Total: 5]
5 marks
Mark scheme: 1(a)(i) 1000 + 500 OR 1500 OR 1500 – 1500 OR 1500 – their ‘1500’ OR 1500 – 1000 OR 1500 – 500 C1 0 / zero A1 1(a)(ii) 2nd box (speed stays the same) B1 1(b)(i) (15 + 38) = 53 (m) B1 1(b)(ii) reduced friction / wet / icy (conditions) / worn tyres tiredness / drugs / alcohol / higher speed / going down hill B1
This question in 0625/33 Oct/Nov 2020
Q32 · A box dropped from an aeroplane 0625/32 Feb/March 2021
1 Fig. 1.1 shows a box dropped from an aeroplane. The box contains supplies. A parachute is attached to the box. The parachute is opened when the time is 6.0 s. parachute box containing supplies Fig. 1.1 The graph in Fig. 1.2 shows the vertical speed of the box as it falls. 50 40 30 speed m / s 20 10 0 0 2.0 4.0 6.0 8.0 10.0 12.0 14.0 16.0 18.0 time / s Fig. 1.2 (a) State and explain what happens to the kinetic energy of the box during the first 6.0 s of its descent. … … … [2] (b) State and explain what happens to the gravitational potential energy of the box during the first 6.0 s. … … … [2] (c) (i) Use the graph in Fig. 1.2 to determine the speed of the object when the object is moving with a constant speed. speed of the object at constant speed = … m / s [2] (ii) State the size of the resultant vertical force on the box when it is falling at a constant speed. … [1] (d) Use the graph in Fig. 1.2 to determine the distance travelled by the box during the first 6.0 s. distance travelled in first 6.0 s = … m [3] (e) Without calculation, describe how Fig. 1.2 shows that the deceleration of the box is greater than the acceleration of the box. … … [1] [Total: 11]
11 marks
Mark scheme: 1(a) (kinetic energy / it) increases B1 (because) speed / velocity (of box) increases OR faster B1 1(b) (gravitational potential energy) decreases M1 (because) height (of box) decreases A1 1(c)(i) any indication on graph / in text that horizontal section represents steady speed C1 10 (m / s) A1 1(c)(ii) (resultant vertical force =) zero OR 0 (N) B1 1(d) distance = area under graph OR ½ × b × h C1 (distance =) ½ × 6.0 × 45 C1 135 (m) A1 1(e) deceleration (line) is steeper OR higher gradient than acceleration (line) B1
This question in 0625/32 Feb/March 2021
Q33 · A speed–time graph for a car 0625/31 May/June 2021
1 Fig. 1.1 shows a speed–time graph for a car. 10 8 speed 6 m / s 4 2 0 0 10 20 30 40 50 60 70 80 90 100 time / s Fig. 1.1 (a) (i) Describe the motion of the car from 0 to 50 s, as shown in Fig. 1.1. … [1] (ii) Describe the motion of the car from 50 s to 90 s, as shown in Fig. 1.1. … … [1] (iii) Calculate the distance travelled by the car between 50 s and 90 s. distance travelled = … m [3] (b) A motorcycle travels at a constant speed. (i) The motorcycle travels 710 m in 87 s. Calculate the speed of the motorcycle and show that it is close to 8 m / s. [3] (ii) The motorcycle in part (b)(i) travels at a constant speed for 87 s. On Fig. 1.1, draw the speed–time graph for the motorcycle. [2] [Total: 10]
10 marks
Mark scheme: 1(a)(i) constant speed/velocity OR (moving at) 6 m / s B1 1(a)(ii) (constant) deceleration/decelerating OR (then) slows OR decreasing speed B1 1(a)(iii) (distance =) area under graph OR ½ × b × h C1 40 × 6 × 0.5 C1 120 (m) A1 1(b)(i) (speed =) distance ÷ time C1 710 ÷ 87 C1 8.2 (m / s) A1 1(b)(ii) horizontal line on Fig. 1.1 M1 horizontal line only at 8.2 m / s OR 8.0 m / s (by eye) to at least 80 s A1
This question in 0625/31 May/June 2021
Q34 · How the speed of a car varies between 0 and 60.0 s 0625/32 May/June 2021
2 Fig. 2.1 shows how the speed of a car varies between 0 and 60.0 s. 40.0 speed m / s 30.0 20.0 10.0 0 0 10.0 20.0 30.0 40.0 50.0 60.0 time / s Fig. 2.1 (a) Determine the speed of the car using information from Fig. 2.1: (i) when the time is 5.0 s speed = … m / s [2] (ii) when the car is moving with a constant speed. speed = … m / s [1] (b) Describe how the speed of the car changes between 30.0 s and 60.0 s. … [2] (c) Determine the distance travelled by the car between 10.0 s and 30.0 s. distance travelled = … m [3] (d) The total distance travelled by the car in the last 30.0 s is 226 m. Calculate the average speed of the car in the last 30.0 s. average speed = … m / s [3] [Total: 11]
11 marks
Mark scheme: 2(a)(i) 22.5 (m / s) A1 2(a)(ii) 35 (m / s) B1 2(b) (speed of car) decreasing OR slows (down) B1 (until speed of car) is zero OR stops (moving) B1 2(c) (distance =) area under graph OR (distance =) speed × time C1 20 × 35 C1 700 (m) A1 Question Answer Marks 2(d) (average speed =) (total) distance ÷ (total) time C1 226 ÷ 30(.0) C1 7.53 (m / s) A1
This question in 0625/32 May/June 2021
Q35 · The speed–time graph for a car travelling along a road 0625/33 May/June 2021
1 Fig. 1.1 shows the speed–time graph for a car travelling along a road. 18 speed 16 m / s 14 12 10 8 6 4 2 0 0 20 40 60 80 100 120 time / s Fig. 1.1 (a) Determine the distance travelled by the car between 30 s and 60 s. distance travelled = … m [3] (b) The distance travelled by the car between 60 s and 110 s is 460 m. Calculate the average speed of the car between 60 s and 110 s. average speed = … m / s [4] (c) Describe the motion of the car between 30 s and 60 s. … [1] (d) Describe the motion of the car between 60 s and 80 s. … [1] [Total: 9]
9 marks
Mark scheme: 1(a) (distance =) area under graph C1 16 × 30 C1 480 (m) A1 1(b) (110 – 60 =) 50 B1 (speed =) distance ÷ time in any form C1 460 / 50 C1 9.2 (m / s) A1 1(c) constant speed OR 16 m / s B1 1(d) decelerating OR negative acceleration OR slowing down / owtte B1
This question in 0625/33 May/June 2021
Q36 · A slope is made by resting one end of a plank of wood on a block, as shown in Fig 0625/31 Oct/Nov 2021
2 A slope is made by resting one end of a plank of wood on a block, as shown in Fig. 2.1. plank trolley block of wood Fig. 2.1 Two students each use a digital stop‑watch to measure the time for a small trolley to roll down the full length of the slope. Fig. 2.2 shows the times on the stop‑watches. min sec 1100 student 1 00 : 06 14 time = … s min sec 1100 student 2 00 : 06 28 time = … s Fig. 2.2 (a) (i) On the line next to each stop‑watch, write the time it shows. [1] (ii) Calculate the average time for the trolley to roll down the slope. average time = … s [2] (iii) The students want the same trolley to take more time to roll down the plank. Suggest how the students alter the arrangement in Fig. 2.1. … [1] (b) A different trolley travels 1.2 m down the slope in a time of 7.8 s. Calculate the average speed of the trolley. average speed = … m / s [3] (c) The trolley travels down a different slope. Fig. 2.3 shows the speed–time graph. 1.6 1.4 speed m / s 1.2 1.0 0.8 0.6 0.4 0.2 0 0 1.0 2.0 3.0 4.0 time / s Fig. 2.3 Calculate the distance travelled by the trolley between time = 0 and time = 4.0 s. distance travelled = … m [3] [Total: 10]
10 marks
Mark scheme: 2(a)(i) 6.14 (s) AND 6.28 (s) B1 2(a)(ii) (6.14 + 6.28) ÷ 2 OR 12.42 ÷ 2 C1 6.21 (s) A1 2(a)(iii) idea of decreasing (angle of) slope OR less steep OR smaller gradient B1 2(b) (average speed =)( total) distance ÷ (total) time in any form C1 1.2 ÷ 7.8 C1 0.15 (m / s) A1 Question Answer Marks 2(c) distance = area under graph OR ½ × base × height C1 4.0 × 1.6 × 0.5 C1 3.2 (m) A1
This question in 0625/31 Oct/Nov 2021
Q37 · A cyclist travels to a friend’s house 0625/32 Oct/Nov 2021
1 A cyclist travels to a friend’s house. Fig. 1.1 shows the distance–time graph of the journey. 1000 E distance / m 800 D 600 400 B C 200 A 0 0 100 200 300 400 500 time / s Fig. 1.1 (a) Determine the distance travelled by the cyclist between points C and E. distance travelled = … m [2] (b) Describe the motion, if any, of the cyclist between points B and C. … [1] (c) State the section, AB, BC, CD or DE, of the graph in which the speed of the cyclist is the fastest. Give a reason for your answer. section of graph … reason … [2] (d) Calculate the average speed of the cyclist between points A and E. Include the unit in your answer. average speed = … unit … [4] [Total: 9]
9 marks
Mark scheme: 1(a) 1000 – 400 C1 600 (m) A1 1(b) stationary / not moving / zero speed / at rest, etc. B1 1(c) CD B1 steep(est (gradient) OR larger distance in smaller time idea B1 1(d) (average speed =)(total) distance ÷ (total) time in any form C1 1000 ÷ 500 C1 2(.0) A1 m / s B1
This question in 0625/32 Oct/Nov 2021
Q38 · A plant pot falling from an upstairs balcony 0625/33 Oct/Nov 2021
1 Fig. 1.1 shows a plant pot falling from an upstairs balcony. The plant pot has a constant acceleration as it falls. balcony plant pot ground level Fig. 1.1 (a) State the cause of the acceleration. … [1] (b) Fig. 1.2 shows the speed–time graph for the falling plant pot. The plant pot hits the ground at time = 1.8 s. 16 speed m / s 12 8 4 0 0 0.4 0.8 1.2 1.6 2.0 time / s Fig. 1.2 Determine the height of the balcony above the ground using the information shown in Fig. 1.2. height = … m [3] [Total: 4]
4 marks
Mark scheme: 1(a) weight / gravitational force / attraction (acting downwards) B1 1(b) area under the graph / line C1 ½ × 1.8 × 16 C1 14 (m) A1
This question in 0625/33 Oct/Nov 2021
Q39 · The horizontal forces acting on a skateboarder 0625/33 Oct/Nov 2021
3 Fig. 3.1 shows the horizontal forces acting on a skateboarder. backward force = 60 N forward force = 100 N skateboarder skateboard Fig. 3.1 (a) Calculate the resultant force acting on the skateboarder. resultant force = … N direction = … [2] (b) Describe the effect of the resultant force in (a) on the motion of the skateboarder. … [1] (c) The skateboarder is moving along a horizontal path. The backward force is 100 N. The forward force is 100 N. Describe the motion of the skateboarder. … [1] [Total: 4]
4 marks
Mark scheme: 3(a) 40 (N) B1 forward / to the right B1 3(b) accelerates / speed increases B1 3(c) constant / uniform speed / zero acceleration B1
This question in 0625/33 Oct/Nov 2021
Q40 · Some masses on a mass hanger attached to an elastic band 0625/32 Feb/March 2022
1 Fig. 1.1 shows some masses on a mass hanger attached to an elastic band. The elastic band is stretched by the masses. rigid support elastic band mass hanger masses Fig. 1.1 (a) The total mass of the masses and the mass hanger is 300 g. Calculate the total weight of the masses and the mass hanger. total weight = … N [3] (b) A student pulls the mass hanger down and then releases it. The mass hanger and masses oscillate up and down. The student uses a stop-watch to time 20 oscillations. Fig. 1.2 shows the time reading on the stop-watch after the 20th oscillation. s min s 1001 Fig. 1.2 (i) Determine the time in seconds for 20 oscillations from the time shown in Fig. 1.2. time for 20 oscillations = … s [1] (ii) Calculate the time in seconds for one oscillation. time for one oscillation = … s [2] (c) When the student pulls the mass hanger down, energy is stored in the elastic band as elastic potential energy. Describe what happens to this energy store when the student releases the mass hanger and it moves upwards. … … [2] [Total: 8]
8 marks
Mark scheme: 1(a) (weight =) 3(.0) (N) A3 300 g = 0.3 kg (B1) (weight =) mass × g (C1) 1(b)(i) 66.4(0) (s) B1 1(b)(ii) 3.3(2) (s) A2 66.4 ÷ 20 (C1) 1(c) any two from: (stored energy OR elastic potential energy OR it) decreases kinetic energy (of masses) increases gravitational potential energy increases B2
This question in 0625/32 Feb/March 2022
Q41 · A student is doing some physical exercise 0625/32 Feb/March 2022
2 (a) A student is doing some physical exercise. Fig. 2.1 shows the student holding a 50 N weight. 0.90 m pivot 50 N Fig. 2.1 The pivot in the shoulder is 0.90 m from the centre of mass of the weight. Calculate the moment of the weight about this pivot. moment of the weight = … N m [3] (b) The student does some running exercises. Fig. 2.2 shows the speed–time graph for one exercise. B CC 8.0 speed m / s 6.0 4.0 2.0 AA D E 0 D 0 5.0 10.0 15.0 20.0 time / s Fig. 2.2 (i) Describe the motion of the athlete in sections AB and DE. section AB … section DE … [2] (ii) Calculate the distance moved by the athlete from time = 0 to time = 5.0 s. distance = … m [3] [Total: 8]
8 marks
Mark scheme: 2(a) 45 (Nm) A3 (moment of force =) force × (perpendicular) distance (of force from pivot) (C1) 50 × 0.9 (C2) 2(b)(i) (section AB) increasing speed OR acceleration B1 (section DE) stationary OR stopped OR at rest B1 2(b)(ii) 20 (m) A3 (distance =) ½ × 8(.0) × 5(.0) (C2) distance travelled = area under graph OR (d = ) speed × time (C1)
This question in 0625/32 Feb/March 2022
Q42 · State and explain which car, A or B, has the greater acceleration during the first 10… 0625/31 May/June 2022
(ii) State and explain which car, A or B, has the greater acceleration during the first 10 seconds. Use information from the graph in Fig. 2.1 in your explanation. … … [2] (b) (i) Describe the motion of car B after 30 s. … … [2] (ii) Calculate the distance moved by car B from time = 0 to time = 30.0 s. distance = … m [3] [Total: 9]
9 marks
Mark scheme: 2(a)(i) 9.3 (m / s) A2 any indication on graph or in working of vertical line from 10.0 s (C1) 2(a)(ii) (car) A (has greater acceleration) M1 (speed-time graph/line) has greater gradient OR is steeper A1 2(b)(i) speed (of car) is steady OR speed is constant B1 (at) 16 m / s B1 2(b)(ii) 240 (m) A3 ( distance =) ½ 16 30 (C2) distance travelled = area under graph OR (d = )speed time OR ½ b h (C1)
This question in 0625/31 May/June 2022
Q43 · A student investigates the motion of a trolley as it travels down a slope 0625/32 May/June 2022
1 A student investigates the motion of a trolley as it travels down a slope. (a) The student makes two measurements to determine the average speed of the trolley as it travels down the slope. State the two measurements. For each measurement, suggest the instrument used for making the measurement. 1. measurement … instrument used … 2. measurement … instrument used … [2] (b) Fig. 1.1 shows the speed–time graph for a different trolley as it travels down a slope. 30 25 speed cm / s 20 15 10 5 0 0 1 2 3 4 5 6 7 8 9 10 time / s Fig. 1.1 (i) Determine the speed of the trolley at time = 2.0 s. speed = … cm / s [2] (ii) Determine the distance moved by the trolley from time = 0 to time = 4.0 s. distance = … cm [3] (iii) Using the information in Fig. 1.1, describe the motion of the trolley from time = 0 to time = 10 s. … … [2] [Total: 9]
9 marks
Mark scheme: 1(a) (measurement) time (instrument used) stopwatch B1 (measurement) distance (instrument used) metre rule(r) B1 1(b)(i) 12.5 (cm / s) A2 any indication on graph or in working of vertical line from 2.0 s (C1) 1(b)(ii) 50 (cm) A3 ½ 4 25 (C2) ( distance = ) area under graph OR ( distance = ) speed time (C1) 1(b)(iii) accelerating (for 4 seconds) B1 (then) constant / steady speed (for 6 seconds) B1
This question in 0625/32 May/June 2022
Q44 · Children about to run a race 0625/33 May/June 2022
1 Fig. 1.1 shows children about to run a race. They have to run 25 m, pick up a small plastic ring and run back to the base line. Each child finishes when they cross the base line holding the plastic ring. hooter base line 25 m plastic rings Fig. 1.1 (a) (i) Suggest what equipment the teacher uses to measure the length of 25 m. … [1] (ii) Determine the total distance for the race. distance = … m [1] (b) The teacher records the following information for one of the children. The child starts to run at time = 0. The child picks up the ring at time = 9.0 s. The child finishes the race at time = 17.0 s. The highest speed occurs as the child finishes the race. Using this information, sketch a speed–time graph on Fig. 1.2, suggesting how the speed of this child varies during the race. speed 0 5 10 15 20 time / s Fig. 1.2 [3] (c) In a different race, a child runs 500 m in 4 minutes and 20 seconds. (i) Determine how many seconds there are in 4 minutes and 20 seconds. time = … s [1] (ii) Calculate the average speed of the child. average speed = … m / s [3] [Total: 9]
9 marks
Mark scheme: 1(a)(i) metre rule B1 1(a)(ii) 50 (m) B1 1(b) graph starts at origin B1 speed = 0 at 9.0 s B1 highest speed at 17 s B1 1(c)(i) 260 (s) B1 1(c)(ii) 1.9 (m / s) A3 500 ÷ 260 OR 500 ÷ (c)(i) (C2) (speed = ) distance ÷ time in any form (C1)
This question in 0625/33 May/June 2022
Q45 · The horizontal forces acting on a car 0625/31 Oct/Nov 2022
2 Fig. 2.1 shows the horizontal forces acting on a car. 900 N 1200 N Fig. 2.1 (not to scale) (a) Calculate the resultant horizontal force on the car. size of force = … N direction … [3] (b) A student uses a digital stop-watch to measure the time for the car to travel 100 m. Fig. 2.2 shows the time reading on the stop-watch. 1 s min s 100 0 : 07 20 Fig. 2.2 (i) Using the information in Fig. 2.2, state the time taken to travel 100 m. time to travel 100 m = … s [1] (ii) The car takes 12.8 s to travel the next 200 m. Calculate the average speed of the car for this 200 m. average speed = … m / s [3] (c) Fig. 2.3 shows the speed–time graph for another car. 20.0 speed 18.0 m / s 16.0 14.0 12.0 10.0 8.0 6.0 4.0 2.0 0.0 0.0 2.0 4.0 6.0 time / s Fig. 2.3 Calculate the distance travelled by this car between time = 2.0 s and time = 6.0 s. distance travelled = … m [3] [Total: 10]
10 marks
Mark scheme: 2(a) 300 (N) A2 (resultant force =) force to right – force to left OR 1200 – 900 C1 to the right OR in forward direction B1 2(b)(i) 7.20 (s) B1 2(b)(ii) 16 (m / s) A3 200 / 12.8 C2 (average speed =) (total) distance / (total) time in any form C1 2(c) 48 (m) A3 1 1 C2 (6 + 18) 4.0 OR 6 4 + 12 4 2 2 distance = area under graph C1 1 OR area = (sum of parallel sides) base 2
This question in 0625/31 Oct/Nov 2022
Q46 · A skydiver jumps from an aeroplane 0625/32 Oct/Nov 2022
1 A skydiver jumps from an aeroplane. She falls freely with her parachute closed; then she opens her parachute. Fig. 1.1 shows the skydiver falling freely with her parachute closed. Fig. 1.2 shows the skydiver falling with the parachute open. Fig. 1.1 Fig. 1.2 Fig. 1.3 shows the speed–time graph for the skydiver’s vertical motion, from leaving the aeroplane to landing on the ground. 60 vertical speed m / s BB CC 50 40 30 20 10 DD EE A 0 0 10 20 30 40 50 60 70 80 time / s Fig. 1.3 (a) Using the information from Fig. 1.3: (i) Describe the vertical motion of the skydiver between time = 0 and time = 20 s. … [1] (ii) Determine the maximum vertical speed of the skydiver. maximum speed = … m / s [1] (iii) Determine the point, A, B, C, D or E, at which the skydiver opens her parachute. … [1] (iv) Determine the distance the skydiver falls between time = 50 s and time = 80 s. distance = … m [3] (b) The weight of the skydiver is 750 N. The weight of the skydiver acts downwards, as shown in Fig. 1.4. While the skydiver is falling, another force acts upwards. The upward force varies as the skydiver falls. … weight = 750 N Fig. 1.4 (not to scale) (i) On Fig. 1.4, write the name of the upward force on the dotted line above the upward force. [1] (ii) Suggest a value for the upward force on the skydiver at time = 10 s. … N [1] (iii) Determine the value of the upward force on the skydiver at time = 30 s. … N [1] (c) The weight of the skydiver is 750 N. Calculate the mass of the skydiver. mass = … kg [3] [Total: 12]
12 marks
Mark scheme: Question Answer Marks 1(a)(i) accelerating / increasing speed B1 1(a)(ii) 50 (m / s) B1 1(a)(iii) C B1 1(a)(iv) 150 (m) A3 5 30 (C2) (distance =) area under graph (C1) 1(b)(i) friction / air resistance / drag B1 1(b)(ii) number greater than 0 AND smaller than 750 (N) B1 1(b)(iii) 750 (N) B1 1(c) 75 (kg) A3 750 ÷ 10 (C2) W = mg OR (m =) W ÷ g OR W ÷ 10 in any form (C1)
This question in 0625/32 Oct/Nov 2022
Question 47 0625/33 Oct/Nov 2022
1 Fig. 1.1 shows a tram. Trams carry passengers from one place to another. Fig. 1.1 A tram travels from A to E, stopping at B, C and D on the way. Fig. 1.2 shows the speed–time graph for this tram journey. 8.0 speed m / s 7.0 6.0 5.0 4.0 3.0 2.0 1.0 A B C D E 0 0 5 10 15 20 25 time / min Fig. 1.2 (a) (i) Determine the time between the tram leaving A and arriving at C. time = … min [1] (ii) Determine the maximum speed of the tram during the journey from A to E. maximum speed = … m / s [1] (iii) The tram decelerates as it approaches each stop. Use information from Fig. 1.2 to identify the greatest deceleration. Give a reason for your answer. Complete the sentence. The greatest deceleration occurs as the tram approaches … . reason … … [2] (b) The total distance between A and E is 5200 m. The tram takes 1380 s to travel from A to E. Calculate the average speed of the tram between A and E. average speed = … m / s [3] [Total: 7]
7 marks
Mark scheme: Question Answer Marks 1(a)(i) 9 (min) B1 1(a)(ii) 7.5 (m / s) B1 1(a)(iii) C M1 greatest slope / greater change of speed in same time interval owtte A1 1(b) 3.8 (m / s) A3 5200 ÷ 1380 (C2) (average speed =) (total) distance ÷ (total) time in any form (C1)
This question in 0625/33 Oct/Nov 2022
Q48 · The distance-time graph for a cyclist 0625/32 Feb/March 2023
3 Fig. 3.1 shows the distance-time graph for a cyclist. The journey has two sections, PQ and QR. Q R 250 200 150 distance / m 100 50 P 0 0 5.0 10.0 15.0 20.0 25.0 30.0 time / s Fig. 3.1 (a) (i) Calculate the speed of the cyclist in section PQ. speed = … m / s [3] (ii) Describe the motion of the cyclist in section QR on the graph. … [1] (b) Fig. 3.2 shows a bicycle fitted with wide tyres and a bicycle fitted with narrow tyres. The two bicycles have the same weight. People use bicycles fitted with wide tyres to ride over soft ground. wide tyre narrow tyre bicycle with wide tyres bicycle with narrow tyres Fig. 3.2 Explain why people use bicycles fitted with wide tyres to ride over soft ground. Use your ideas about pressure. … … … [2] [Total: 6]
6 marks
Mark scheme: 3(a)(i) (speed =) 25 (m / s) A3 (speed =) 250 ÷ 10 (C2) (speed =) gradient of d-t graph OR d ÷ t in any form (C1) 3(a)(ii) (QR –) at rest or stationary B1 3(b) any two from B2 (wide tyres have) large (contact) area (so) less pressure (on ground) so less likely to sink (into soft ground)
This question in 0625/32 Feb/March 2023
Q49 · State, in order, the names of the three planets closest to the Sun 0625/32 Feb/March 2023
12 (a) State, in order, the names of the three planets closest to the Sun. Closest to the Sun … … Furthest from the Sun … [2] (b) Define a light-year. … … [2] (c) Jupiter is 780 000 000 000 m (7.8 # 1011 m) from the Sun. The speed of light is 300 000 000 m / s (3.0 # 108 m / s) . Calculate the time for light to travel from the Sun to Jupiter. time = … s [2] [Total: 6]
6 marks
Mark scheme: 12(a) (closest to Sun) Mercury B2 Venus (furthest from Sun) Earth 12(b) distance M1 travelled by light (in the vacuum of space) in one year A1 12(c) 2.6 103 (s) OR 2600 (s) A2 time = distance ÷ speed OR 7.8 1011 ÷ 3.0 108 (C1) OR 780 000 000 000 ÷ 300 000 000
This question in 0625/32 Feb/March 2023
Q50 · A cyclist is travelling along a straight road 0625/31 May/June 2023
1 A cyclist is travelling along a straight road. Fig. 1.1 shows the speed–time graph for the cyclist. The graph is divided into four sections labelled P, Q, R and S. 14 R 12 10 Q 8 speed m / s 6 S 4 P 2 0 0 100 200 300 400 500 time / s Fig. 1.1 (a) Calculate the distance travelled by the cyclist in section P from time = 0 to time = 100 s. distance travelled = … m [3] (b) Describe the motion of the cyclist in each of sections Q, R and S shown in Fig. 1.1. Q … R … S … [3] (c) The cyclist is moving north along the road. Determine the velocity of the cyclist at time = 300 s. Include the unit. velocity of cyclist = … [2] [Total: 8]
8 marks
Mark scheme: 1(a) (distance travelled =) 400 (m) A3 (distance travelled =) ½ 8 100 (C2) (distance travelled =) area under graph OR ½ b h (C1) 1(b) (section Q) accelerating B1 (section R) constant speed OR steady speed B1 (section S) decelerating B1 1(c) (velocity =) 12 m / s B1 north B1
This question in 0625/31 May/June 2023
Q51 · The speed–time graph for a cyclist 0625/32 May/June 2023
2 Fig. 2.1 shows the speed–time graph for a cyclist. 14 W X 12 speed 10 m / s S T 8 6 4 2 Y Z 0 0 10 20 30 40 50 time / s Fig. 2.1 (a) In Fig. 2.1, the sections ST, TW, WX, XY and YZ indicate stages of the cyclist’s journey. State one section which shows the cyclist moving with: (i) constant speed … [1] (ii) constant deceleration … [1] (iii) constant non-zero acceleration. … [1] (b) Calculate the distance travelled by the cyclist in section ST. distance travelled = … m [3] (c) Fig. 2.2 shows the horizontal forces on a cyclist. 160 N 220 N Fig. 2.2 (i) Calculate the size of the resultant force on the cyclist. resultant force = … N [1] (ii) State the effect, if any, of the resultant force on the motion of the cyclist. … [1] [Total: 8]
8 marks
Mark scheme: 2(a)(i) ST OR WX B1 2(a)(ii) XY B1 2(a)(iii) TW OR XY B1 2(b) (distance travelled =) 100 (m) A3 (distance travelled =) 8 13 (C2) (distance travelled =) area under graph OR b h (C1) 2(c)(i) 60 (N) B1 2(c)(ii) accelerates OR increases speed B1
This question in 0625/32 May/June 2023
Q52 · The distance–time graph for an engineer’s journey 0625/33 May/June 2023
1 Fig. 1.1 shows the distance–time graph for an engineer’s journey. She drives from her home directly to her office and parks the car. She then drives from her office to her friend’s house and parks the car. 70 60 50 distance from 40 home / km 30 20 10 0 0 1 2 3 4 5 6 7 8 9 10 11 time / h Fig. 1.1 (a) Determine the distance between: (i) the engineer’s home and her office … km [1] (ii) the engineer’s office and her friend’s house. … km [1] (b) Determine the time taken to travel between: (i) the engineer’s home and her office … h [1] (ii) the engineer’s office and her friend’s house. … h [1] (c) Calculate the speed of the car between time = 7 h and time = 10 h. speed = … km / h [3] [Total: 7]
7 marks
Mark scheme: 1(a)(i) 60 (km) B1 1(a)(ii) 40 (km) B1 1(b)(i) 2 (h) B1 1(b)(ii) 3 (h) B1 1(c) (speed =) distance / time in any form OR gradient of line C1 40 / 3 C1 13 (km / h) A1
This question in 0625/33 May/June 2023
Q53 · Part of the Solar System 0625/33 May/June 2023
10 Fig. 10.1 represents part of the Solar System. Neptune Earth Jupiter Sun Uranus planet A planet B Venus Saturn Fig. 10.1 (not to scale) (a) (i) State the name of planet A and the name of planet B. planet A … planet B … [2] (ii) On Fig. 10.1, draw an X to represent a moon of Jupiter. Draw a line to show how this moon moves. [1] (iii) State two ways in which the four planets nearest to the Sun are different from the four planets furthest away from the Sun. 1 … 2 … [2] (iv) Complete the following sentences: The galaxy that includes the Solar System is called the … . The … includes billions of galaxies. [2] (b) The distance between the Sun and the Earth is 1.5 × 10¹¹ m. The speed of an electromagnetic wave is 3.0 × 10⁸ m / s. Calculate the time taken for an electromagnetic wave to travel from the Sun to the Earth. time taken = … s [3] [Total: 10]
10 marks
Mark scheme: 10(a)(i) Mercury (nearest to Sun) B1 Mars (between Earth and Jupiter) B1 10(a)(ii) (circular / oval) path round Jupiter B1 10(a)(iii) rocky OR furthest planets are gaseous owtte B1 small(er) OR furthest planets large(r) B1 10(a)(iv) (the) Milky Way B1 (the) Universe B1 10(b) (time =) distance ÷ speed in any form C1 1.5 1011 ÷ 3.0 108 C1 500 (s) A1
This question in 0625/33 May/June 2023
Q54 · A distance–time graph for a cyclist 0625/31 Oct/Nov 2023
1 Fig. 1.1 shows a distance–time graph for a cyclist. 1200 distance / m 1000 800 600 400 200 0 0 50 100 150 200 250 time / s Fig. 1.1 (a) (i) Determine the distance travelled by the cyclist between time = 0 and time = 100 s. distance travelled = … m [1] (ii) Calculate the speed of the cyclist between time = 0 and time = 100 s. speed = … m / s [3] (iii) Describe the motion of the cyclist between time = 100 s and time = 250 s. … … [2] (b) Fig. 1.2 shows the cyclist riding along a long straight road. W S N E Fig. 1.2 The speed of the cyclist is 15 m / s. Determine the velocity of the cyclist. velocity = … m / s direction … [1] [Total: 7]
7 marks
Mark scheme: Question Answer Marks 1(a)(i) (distance =) 400 (m) B1 1(a)(ii) 4(0) (m / s) A3 400 ÷ 100 (C2) (speed =) gradient of distance-time graph OR distance ÷ time (C1) 1(a)(iii) stationary OR stopped OR at rest (between 100 and 150 s) B1 (then) constant / steady speed (between 150 and 250 s) B1 1(b) 15 (m / s) (due) west / W B1
This question in 0625/31 Oct/Nov 2023
Q55 · The speed–time graph for a cyclist beginning a race 0625/32 Oct/Nov 2023
1 Fig. 1.1 shows the speed–time graph for a cyclist beginning a race. The motion of the cyclist changes at points A, B and C. 20 speed m / s C 15 10 B 5 A 0 0 2 4 6 8 10 12 14 16 18 20 22 24 26 28 30 time / s Fig. 1.1 (a) Using information from Fig. 1.1, determine: (i) the speed of the cyclist at time = 6.0 s speed = … m / s [2] (ii) the maximum speed of the cyclist. maximum speed = … m / s [1] (b) (i) Describe the motion of the cyclist between point A and point B. … [1] (ii) Describe how the motion of the cyclist between points B and C differs from the motion between points A and B. Give a reason for your answer. difference … reason … [2] (c) Determine the distance travelled by the cyclist between point A and point B. distance = … m [3] [Total: 9]
9 marks
Mark scheme: Question Answer Marks 1(a)(i) 3(.0) (m / s) A2 any indication on graph or in working of vertical / horizontal line from 6.0 s C1 1(a)(ii) 16 (m / s) B1 1(b)(i) (constant) accelerating / speed increasing B1 1(b)(ii) greater acceleration B1 line is steeper / greater gradient B1 1(c) 25 (m) A3 ½ 5 10 (C2) (distance =) area under graph OR ½ b h (C1) OR (distance =) speed time
This question in 0625/32 Oct/Nov 2023
Q56 · The speed–time graph for a bus journey 0625/33 Oct/Nov 2023
1 Fig. 1.1 shows the speed–time graph for a bus journey. 20 18 speed 16 m / s 14 12 10 8 6 4 2 0 0 5 10 15 20 25 30 35 40 45 50 55 60 65 70 75 80 time / s Fig. 1.1 (a) Using the information in Fig. 1.1, determine: (i) the maximum speed of the bus during the journey maximum speed = … m / s [1] (ii) the speed of the bus at time = 65 s. On Fig. 1.1, show how you obtained this information. speed = … m / s [2] (b) Describe how the speed of the bus changes between time = 60 s and time = 80 s. … … [2] (c) Determine the distance travelled by the bus between time = 0 and time = 10 s. distance travelled = … m [3] (d) Fig. 1.2 shows the speed–time graph for another bus journey. 16 14 speed m / s 12 10 8 6 4 2 0 0 5 10 15 20 25 30 35 40 45 50 55 60 time / s Fig. 1.2 The driver sees a hazard ahead and applies the brakes at time = 40 s. The bus reduces its speed from 14.0 m / s to 6.0 m / s in a time of 5.0 s. On Fig. 1.2, draw the speed–time graph for the bus as it reduces its speed. [2] [Total: 10]
10 marks
Mark scheme: Question Answer Marks 1(a)(i) 18 (m / s) A1 1(a)(ii) 12 (m / s) A2 any indication on graph or in working of vertical / horizontal line from 65.0 s (C1) 1(b) (speed of bus) decreasing OR slows (down) OR decelerates B1 (then speed is) zero OR stops / stationary B1 1(c) 90 (m) A3 ½ 10 18 (C2) (distance =) area under graph OR ½ b h OR speed time (C1) 1(d) line starts from (40, 14) M1 line ends at (45, 6) A1
This question in 0625/33 Oct/Nov 2023
Q57 · The distance–time graph for a student 0625/32 Feb/March 2024
1 Fig. 1.1 shows the distance–time graph for a student. The student walks out of a classroom, stops to talk to some friends, and then walks to their next class. 16 D distance / m B C 12 8 4 A 0 0 2.0 4.0 6.0 8.0 10 12 14 time / s Fig. 1.1 (a) Describe the motion of the student between time = 0 and time = 6.0 s. … [1] (b) Calculate the speed of the student between time = 0 and time = 6.0 s. speed = … m / s [3] (c) Determine the length of time for which the student stops walking. time = … s [1] (d) Compare the student’s speed in section AB with the speed in section CD. … [1] [Total: 6]
6 marks
Mark scheme: Question Answer Marks 1(a) (walking with) constant/steady/uniform speed B1 1(b) 2 (m / s) A3 12 ÷ 6 (C2) (speed =) gradient of distance-time graph (C1) 1(c) (11(.0) – 6(.0) =) 5(.0) (s) B1 1(d) faster OR more (before talking to friends / in section AB) OR double / twice (the speed) B1
This question in 0625/32 Feb/March 2024
Q58 · The four planets nearest to the Sun 0625/32 Feb/March 2024
11 Fig. 11.1 represents the four planets nearest to the Sun. Sun Venus Earth … … Fig. 11.1 (not to scale) (a) Two of the planets in Fig. 11.1 are not labelled. On each dotted line, write the name of the planet. [2] (b) The distance of Venus from the Sun is 1.1 × 10¹¹ m. The speed of light is 3.0 × 10⁸ m / s. Calculate the time it takes light to travel from the Sun to Venus. time taken = … s [3] (c) The mass of the Earth is greater than the mass of Venus. The gravitational field strength on the surface of the Earth is 9.8 N / kg. Suggest a value for the gravitational field strength on the surface of Venus. Give a reason for your answer. gravitational field strength on surface of Venus = … N / kg reason … [2] [Total: 7]
7 marks
Mark scheme: 11(a) Mercury B1 Mars B1 11(b) 370 (s) A3 1.1 1011 ÷ 3.0 108 (C2) speed = distance ÷ time OR (t = ) d ÷ s (C1) 11(c) value smaller than 9.8 (N / kg) B1 Venus has smaller mass ORA OR B1 gravitational field strength depends on / proportional to mass
This question in 0625/32 Feb/March 2024
Q59 · The speed–time graph for a car 0625/31 May/June 2024
1 Fig. 1.1 shows the speed–time graph for a car. 20 S speed R m / s 15 T 10 5 0 0 4 8 12 16 20 time / s Fig. 1.1 (a) (i) For the graph in Fig. 1.1, match each letter, R, S and T, with the motion at that point. Draw one line from each letter to the correct description. One has been done for you. letter on the graph description of motion at rest R moving with constant speed S decelerating (negative acceleration) T accelerating (positive acceleration) [2] (ii) Determine the speed of the car at time = 4.0 s. speed = … m / s [1] (iii) Determine the distance moved by the car from time = 16.0 s to time = 20.0 s. distance moved = … m [3] (b) Define the term velocity. … [1] [Total: 7]
7 marks
Mark scheme: 1(a)(i) line from S to moving with constant speed B1 line from T to decelerating B1 1(a)(ii) 17.8 (m / s) B1 1(a)(iii) 40 (m) A3 ½ 4 20 (C2) (distance travelled =) area under the graph OR ½ b(ase) h(eight) (C1) 1(b) (velocity is defined as) speed in a stated / given direction OR change in displacement per unit time B1
This question in 0625/31 May/June 2024
Q60 · The speed–time graph for a car travelling along a flat straight road 0625/32 May/June 2024
1 Fig. 1.1 shows the speed–time graph for a car travelling along a flat straight road. 20 speed m / s 15 10 5 0 0.0 2.0 4.0 6.0 8.0 10.0 12.0 14.0 time / s Fig. 1.1 (a) Describe the motion of the car between time = 0 and time = 2.0 s. … [1] (b) State the value of the acceleration of the car between time = 4.0 s and time = 8.0 s. … [1] (c) Calculate the distance travelled by the car between time = 8.0 s and time = 14.0 s. distance travelled = … m [3] [Total: 5]
5 marks
Mark scheme: 1(a) (constant) acceleration OR accelerating OR increasing speed B1 1(b) zero B1 1(c) 60 (m) A3 ½ 6(.0) 20 (C2) distance = area under (speed–time) graph OR ½ b h (C1)
This question in 0625/32 May/June 2024
Q61 · A girl is cycling along a straight horizontal road 0625/33 May/June 2024
1 A girl is cycling along a straight horizontal road. Fig. 1.1 shows the directions of the forces acting on the cyclist as she cycles in the direction of force C. force B force A force C force D Fig. 1.1 (a) State which force shows the direction of: (i) the force due to gravity … [1] (ii) the force due to air resistance. … [1] (iii) Force A changes and becomes larger than force C. State any effect this change has on the motion of the cyclist. … [1] (b) Another cyclist travels a distance of 250 m in a time of 21 s. (i) Calculate the average speed of the cyclist. average speed = … m/s [3] (ii) The cyclist exerts a force of 36 N to move the cycle forwards. Calculate the work done by this force when the cyclist travels 250 m. Include the unit. work done = … unit … [4] [Total: 10]
10 marks
Mark scheme: 1(a)(i) D B1 1(a)(ii) A B1 1(a)(iii) decelerating / slowing down / less speed owtte B1 1(b)(i) 12 (m / s) A3 250 21 (C2) (average speed =) (total) distance (travelled) (total) time(taken) in any form (C1) 1(b)(ii) 9000 A3 36 250 (C2) (work =) force distance in any form (C1) J B1
This question in 0625/33 May/June 2024
Q62 · The Solar System contains a number of objects 0625/33 May/June 2024
11 (a) The Solar System contains a number of objects. Some of these objects are listed. asteroids planets the Moon the Sun Write these objects in order of their size. smallest largest [2] (b) Redshift is an increase in the observed wavelength of the light emitted from distant galaxies. (i) State what redshift indicates about the movement of distant galaxies. … [1] (ii) State why redshift in the light from distant galaxies supports the Big Bang Theory. … … [1] (c) (i) Define one light‑year. … [1] (ii) Scientists can send spacecraft to planets. There are many planets outside the Solar System. Suggest one reason, other than cost, why scientists do not send spacecraft to planets outside the Solar System. … … [1] (d) An electromagnetic wave travels from the Sun to the Earth in a time of 500 s. The speed of the electromagnetic wave in space is 3.0 × 10⁸ m / s. Calculate the distance between the Sun and the Earth. distance = … m [3] [Total: 9]
9 marks
Mark scheme: 11(a) asteroids the Moon planets the Sun all 4 correct – 2 marks 2 adjacent OR first AND last boxes correct – 1 mark B2 11(b)(i) receding / moving away B1 11(b)(ii) (Universe) expanding B1 11(c)(i) distance travelled by light (in space) in one year B1 11(c)(ii) distances vast OR (planets) too far away / owtte B1 11(d) 1.5 1011 (m) A3 3.0 108 500 (C2) speed = distance time OR (distance =) speed time (C1)
This question in 0625/33 May/June 2024
Q63 · The speed–time graph for a cyclist riding a bicycle 0625/31 Oct/Nov 2024
1 Fig. 1.1 shows the speed–time graph for a cyclist riding a bicycle. 8 speed 6 m / s 4 2 0 0 5 10 15 20 25 30 time / s Fig. 1.1 (a) State the speed of the cyclist at time = 15 s. speed of cyclist = … m / s [1] (b) Describe the motion of the cyclist 1. from time = 0 to time = 5 s … 2. from time = 10 s to time = 20 s … 3. from time = 20 s to time = 30 s … [3] (c) Calculate the distance travelled by the cyclist from time = 20 s to time = 30 s. distance = … m [3] [Total: 7]
7 marks
Mark scheme: Question Answer Marks 1(a) 8(.0) (m / s) B1 1(b) 1. accelerating OR acceleration B1 2. steady or constant speed B1 3. decelerating OR deceleration B1 1(c) 40 (m) A3 ½ 8(.0) 10 (C2) distance (travelled) = area below speed–time graph (C1)
This question in 0625/31 Oct/Nov 2024
Q64 · Some students near some rocky cliffs looking at a boat at sea 0625/31 Oct/Nov 2024
6 Fig. 6.1 shows some students near some rocky cliffs looking at a boat at sea. The students watch a firework display on the boat. One of the fireworks bursts and makes a loud sound. a firework bursting in air rocky cliffs students boat beach Fig. 6.1 (not to scale) (a) The students hear a loud sound from the firework and then they hear a quieter, similar sound. State what causes the second quieter, similar sound. … [1] (b) The time from when the students see the firework burst to when they hear the first, loud sound is 1.3 s. Calculate the distance from the firework to the students. Use the speed of sound in air = 340 m / s. distance to firework = … m [3] [Total: 4]
4 marks
Mark scheme: 6(a) (sound is) reflected (from cliff ) OR echo (from cliff) B1 6(b) (d =) 440 (m) A3 (d =) 340 1.3 (C2) (d =) s t OR s = d t (C1)
This question in 0625/31 Oct/Nov 2024
Q65 · The distance–time graph for a student’s journey 0625/32 Oct/Nov 2024
1 Fig. 1.1 shows the distance–time graph for a student’s journey. 1600 1400 1200 1000 distance from student's home 800 / m 600 400 200 0 0 10 20 30 40 50 60 70 80 90 100 110 120 time / min Fig. 1.1 The student walks from his home to a shop. He stops at the shop. Then he walks to his friend’s house and stops there for 50 minutes. Then he walks back to his home without stopping. (a) (i) Determine the distance between the student’s home and his friend’s house. distance = … m [1] (ii) Calculate the distance between the shop and the friend’s house. distance = … m [1] (b) Calculate the total time for which the student is walking. time = … min [1] (c) Calculate the average speed of the student when he walks back to his home. speed = … m / s [4] [Total: 7]
7 marks
Mark scheme: Question Answer Marks 1(a)(i) 1400 (m) B1 1(a)(ii) 800 (m) B1 1(b) 45 (min) B1 1(c) 1.2 (m / s) A4 1400 1200 (C2) (speed =) distance time OR (s =) d t (C1) (conversion of 20 min to) 1200 (s) (C1)
This question in 0625/32 Oct/Nov 2024
Q66 · The speed–time graph for a cyclist at the beginning of a race 0625/33 Oct/Nov 2024
1 (a) Fig. 1.1 shows the speed–time graph for a cyclist at the beginning of a race. 5.0 speed m / s 4.0 3.0 2.0 1.0 0 0 2.0 4.0 6.0 8.0 10.0 time / s Fig. 1.1 (i) Describe the motion of the cyclist from time = 6.0 s to time = 10.0 s. … [1] (ii) Determine the distance moved by the cyclist from time = 6.0 s to time = 10.0 s. distance = … m [3] (b) Another cyclist travels 1000 m in 1 minute and 29 seconds. (i) Determine how many seconds there are in 1 minute and 29 seconds. number of seconds = … s [1] (ii) Calculate the average speed of this cyclist. average speed = … m / s [3] (c) The horizontal forces acting on a cyclist vary. Fig. 1.2 shows the horizontal forces at one moment during a race. backward force = 50 N forward force = 90 N Fig. 1.2 (not to scale) (i) Calculate the resultant horizontal force acting on the cyclist. resultant horizontal force = … N direction = … [2] (ii) Describe the effect of the resultant horizontal force in (c)(i) on the motion of the cyclist. … [1] [Total: 11]
11 marks
Mark scheme: Question Answer Marks 1(a)(i) constant speed or moving with zero acceleration B1 1(a)(ii) 18 (m) A3 4.5 4(.0) (C2) (distance =) area under graph OR (distance=) speed time OR (d =) s × t (C1) 1(b)(i) 89 (s) B1 1(b)(ii) 11 (m / s) A3 1000 89 (C2) (speed =) distance time OR (s =) d t (C1) 1(c)(i) 40 (N) B1 forwards / to the right B1 1(c)(ii) accelerate / speed increase owtte B1
This question in 0625/33 Oct/Nov 2024
Q67 · The speed-time graph for a ball falling through the air 0625/32 Feb/March 2025
1 Fig. 1.1 shows the speed-time graph for a ball falling through the air. 4.0 speed 3.0 m / s 2.0 1.0 0.0 0.0 1.0 2.0 3.0 4.0 5.0 time / s Fig. 1.1 (a) Determine the speed of the ball at time = 1.0 s. speed = … m / s [1] (b) Describe the speed of the ball between time = 2.0 s and time = 5.0 s. … [1] (c) Calculate the distance moved by the ball between time = 2.0 s and time = 5.0 s. distance = … m [3] (d) Fig. 1.2 shows the two vertical forces acting on the ball at time = 3.0 s. X ball Y Fig. 1.2 Give the term used to describe each force. upward force X is ………………………………… downward force Y is ………………………………… [2] [Total: 7]
7 marks
Mark scheme: Question Answer Marks 1(a) 3.55 (m/s) B1 1(b) constant/steady (speed) OR B1 zero acceleration 1(c) (distance travelled =) 12 (m) A3 (distance travelled =) 4(.0) 3(.0) (C2) (distance travelled =) area under graph OR b h (C1) 1(d) (upward force is) air resistance OR friction OR drag B1 (downward force Y is) weight OR (force of) gravity B1
This question in 0625/32 Feb/March 2025
Q68 · The Earth’s orbit of the Sun 0625/32 Feb/March 2025
12 Fig. 12.1 represents the Earth’s orbit of the Sun. Sun Earth Fig. 12.1 (Not to scale) (a) State the term used to describe the force that keeps the Earth in orbit around the Sun. … [1] (b) Explain why the Earth has an annual cycle of seasons. … … … [1] (c) The distance of the Earth from the Sun is 1.48 × 10¹¹ m. The speed of light is 3.0 × 10⁸ m / s. Calculate the time it takes light from the Sun to reach the Earth. time taken to reach Earth = … s [3] [Total: 5]
5 marks
Mark scheme: 12(a) gravitational (attraction) B1 12(b) Earth’s axis is tilted (relative to its orbital plane) B1 OR idea that in part of orbit, N or S pole points towards/away from Sun 12(c) 490 (s) A3 1.48 1011 ÷ 3(.0) 108 (C2) speed = distance ÷ time OR (t =) d ÷ s (C1)
This question in 0625/32 Feb/March 2025
Q69 · The speed–time graph for a car travelling along a flat, straight road 0625/31 May/June 2025
1 Fig. 1.1 shows the speed–time graph for a car travelling along a flat, straight road. The graph has four sections, labelled JK, KL, LM and MN. L M 20 speed m / s 15 10 5 K J N 0 0 5 10 15 20 25 30 35 time / s Fig. 1.1 (a) Complete the following sentence. The car has the largest acceleration in section … . [1] (b) Calculate the distance travelled by the car between time = 20 s and time = 35 s. distance travelled = … m [3] (c) Describe the motion of the car during: (i) section LM … [1] (ii) section MN. … [1] (d) Another car travels a distance of 500 m in a time of 20 s. Calculate the average speed of this car. average speed = … m / s [3] [Total: 9]
9 marks
Mark scheme: Question Answer Marks 1(a) (section) KL OR LK B1 1(b) (distance travelled =) 150 (m) A3 (distance travelled =) ½ 20 15 C2 (distance travelled =) area under graph OR ½ b h C1 1(c)(i) (section LM is) constant / steady speed B1 1(c)(ii) (section MN is) decelerating B1 1(d) (average speed =) 25 (m / s) A3 (average speed =) 500 ÷ 20 C2 (average speed =) (total) distance travelled ÷ (total) time C1
This question in 0625/31 May/June 2025
Q70 · A student uses a stop-watch to measure the time for one complete oscillation of a pendulum 0625/31 May/June 2025
2 A student uses a stop-watch to measure the time for one complete oscillation of a pendulum. Fig. 2.1 shows his measurement. 1 min s 100 s 0:00 83 Fig. 2.1 (a) State the time taken for one complete oscillation. Use the information in Fig. 2.1. time for one complete oscillation = … s [1] (b) Another student uses a different pendulum and measures the time for 15 complete oscillations. The time for 15 complete oscillations is 11.7 s. Calculate the average time for one complete oscillation. average time for one complete oscillation = … s [2] (c) Fig. 2.2 represents a pendulum. P and Q are the extreme positions of the pendulum bob. R is the position of the bob when the string is vertical. support string P Q R pendulum bob Fig. 2.2 A student holds the pendulum bob at P and then releases it. Describe the movement of the pendulum bob during one complete oscillation of the pendulum. You may draw on Fig. 2.2 as part of your answer. … … … … [2] [Total: 5]
5 marks
Mark scheme: 2(a) 0.83 (s) B1 2(b) (average time =) 0.78 (s) A2 (average time =) (total) time ÷ (number of complete) oscillations C1 OR 11.7 ÷ 15 2(c) idea / description of pendulum swings (from P) to Q and back (to P) / (almost) to start position A2 idea of pendulum moving (from P) to Q OR Q to P C1
This question in 0625/31 May/June 2025
Q71 · The speed–time graphs for two racing cars, X and Y, at the beginning of a race 0625/32 May/June 2025
1 (a) Fig. 1.1 shows the speed–time graphs for two racing cars, X and Y, at the beginning of a race. 25 speed m / s 20 racingracing carcar XX 15 racingracing carcar YY 10 5 0 0 2 4 6 8 10 12 time / s Fig. 1.1 (i) Using the information on Fig. 1.1, state and explain which racing car, X or Y, has the greater acceleration between time = 2 s and time = 4 s. racing car … explanation … … [1] (ii) Determine the speed of racing car Y at time = 10 s. speed = … m / s [1] (iii) Determine the distance moved by racing car X from time = 0 to time = 4.0 s. distance = … m [3] (b) Fig. 1.2 shows the directions of four forces, A, B, C and D, acting on a racing car. A D B C Fig. 1.2 (i) Force B is described as ‘the driving force’. Describe: force C … force D … [2] (ii) The racing car is decelerating along a straight horizontal track. The value of force D is 2800 N. Suggest a value for force B. force B = … N [1] [Total: 8]
8 marks
Mark scheme: Question Answer Marks 1(a)(i) racing car X M0 steeper slope owtte A1 1(a)(ii) 24 (m / s) B1 1(a)(iii) 44 (m) A3 ½ 22 4 C2 (distance =) area under graph OR ½ b h OR speed time C1 1(b)(i) force C – weight OR (force of) gravity OR gravitational pull B1 force D – (air) resistance/drag/friction B1 1(b)(ii) a value less than 2800 (N) B1
This question in 0625/32 May/June 2025
Q72 · Place ticks (✓) in Table 7.1 to show the properties of sound waves and of microwaves 0625/32 May/June 2025
7 (a) Place ticks (✓) in Table 7.1 to show the properties of sound waves and of microwaves. Table 7.1 property sound waves microwaves longitudinal transverse electromagnetic travel in a vacuum [2] (b) Scientists have placed reflectors on the Moon. Scientists use the reflectors to measure the distance between the Earth and the Moon. reflector on the Moon observatory rayray ofof redred lightlight Fig. 7.1 (not to scale) A scientist in an observatory sends a ray of red light from the observatory to the reflector on the Moon, as shown in Fig. 7.1. The ray takes a total time of 2.5 s to travel from the observatory to the reflector and back to the observatory. The speed of light is 3.0 × 10⁸ m / s. Calculate the distance between the observatory and the reflector. distance = … m [3] (c) (i) State one use of ultraviolet rays. … [1] (ii) State one harmful effect of ultraviolet rays. … [1] [Total: 7]
7 marks
Mark scheme: 7(a) B2 property sound waves microwaves longitudinal ✓ transverse ✓ electromagnetic ✓ travel in a vacuum ✓ 4 correct – 2 marks 2 or 3 correct – 1 mark 7(b) 3.8 108 (m) A3 3(.0) 108 1.25 OR 3(.0) 108 (2.5 ÷ 2) OR 7.5 108 C2 (distance =) speed time C1 7(c)(i) security marking OR detecting fake bank notes OR sterilising water OR fluorescent effects B1 7(c)(ii) damage to surface cells / skin / eyes OR damage to genes / DNA OR skin cancer B1
This question in 0625/32 May/June 2025
Q73 · The speed–time graphs for two racing cars, X and Y, at the beginning of a race 0625/33 May/June 2025
1 (a) Fig. 1.1 shows the speed–time graphs for two racing cars, X and Y, at the beginning of a race. 25 speed m / s 20 racingracing carcar XX 15 racingracing carcar YY 10 5 0 0 2 4 6 8 10 12 time / s Fig. 1.1 (i) Using the information on Fig. 1.1, state and explain which racing car, X or Y, has the greater acceleration between time = 2 s and time = 4 s. racing car … explanation … … [1] (ii) Determine the speed of racing car Y at time = 10 s. speed = … m / s [1] (iii) Determine the distance moved by racing car X from time = 0 to time = 4.0 s. distance = … m [3] (b) Fig. 1.2 shows the directions of four forces, A, B, C and D, acting on a racing car. A D B C Fig. 1.2 (i) Force B is described as ‘the driving force’. Describe: force C … force D … [2] (ii) The racing car is decelerating along a straight horizontal track. The value of force D is 2800 N. Suggest a value for force B. force B = … N [1] [Total: 8]
8 marks
Mark scheme: Question Answer Marks 1(a)(i) racing car X M0 steeper slope owtte A1 1(a)(ii) 24 (m / s) B1 1(a)(iii) 44 (m) A3 ½ 22 4 C2 (distance =) area under graph OR ½ b h OR speed time C1 1(b)(i) force C – weight OR (force of) gravity OR gravitational pull B1 force D – (air) resistance/drag/friction B1 1(b)(ii) a value less than 2800 (N) B1
This question in 0625/33 May/June 2025
Q74 · Place ticks (✓) in Table 7.1 to show the properties of sound waves and of microwaves 0625/33 May/June 2025
7 (a) Place ticks (✓) in Table 7.1 to show the properties of sound waves and of microwaves. Table 7.1 property sound waves microwaves longitudinal transverse electromagnetic travel in a vacuum [2] (b) Scientists have placed reflectors on the Moon. Scientists use the reflectors to measure the distance between the Earth and the Moon. reflector on the Moon observatory rayray ofof redred lightlight Fig. 7.1 (not to scale) A scientist in an observatory sends a ray of red light from the observatory to the reflector on the Moon, as shown in Fig. 7.1. The ray takes a total time of 2.5 s to travel from the observatory to the reflector and back to the observatory. The speed of light is 3.0 × 10⁸ m / s. Calculate the distance between the observatory and the reflector. distance = … m [3] (c) (i) State one use of ultraviolet rays. … [1] (ii) State one harmful effect of ultraviolet rays. … [1] [Total: 7]
7 marks
Mark scheme: 7(a) B2 property sound waves microwaves longitudinal ✓ transverse ✓ electromagnetic ✓ travel in a vacuum ✓ 4 correct – 2 marks 2 or 3 correct – 1 mark 7(b) 3.8 108 (m) A3 3(.0) 108 1.25 OR 3(.0) 108 (2.5 ÷ 2) OR 7.5 108 C2 (distance =) speed time C1 7(c)(i) security marking OR detecting fake bank notes OR sterilising water OR fluorescent effects B1 7(c)(ii) damage to surface cells / skin / eyes OR damage to genes / DNA OR skin cancer B1
This question in 0625/33 May/June 2025
Q75 · The distance-time graph for a cyclist travelling along a flat, straight road 0625/31 Oct/Nov 2025
1 Fig. 1.1 shows the distance-time graph for a cyclist travelling along a flat, straight road. 250 200 150 distance / m 100 50 0 0 10 20 30 40 50 time / s Fig. 1.1 (a) Calculate the speed of the cyclist between time = 0 and time = 10 s. speed = … m / s [3] (b) Describe the motion of the cyclist: (i) between time = 0 and time = 20 s … [1] (ii) between time = 20 s and time = 40 s. … [1] [Total: 5]
5 marks
Mark scheme: Question Answer Marks 1(a) (speed = ) 10 (m/s) A3 (speed = ) 100 ÷ 10 (C2) (speed = ) gradient of line (between 0 and 10 s) (C1) 1(b)(i) constant speed OR steady speed OR uniform speed B1 1(b)(ii) stationary OR stopped B1
This question in 0625/31 Oct/Nov 2025
Q76 · Mars is one of the four rocky planets nearest the Sun 0625/31 Oct/Nov 2025
11 Mars is one of the four rocky planets nearest the Sun. (a) State why the gravitational field strength at the surface of the Earth is greater than the gravitational field strength at the surface of Mars. … [1] (b) State the names of the four gaseous planets further from the Sun than Mars. List the planets in order of increasing distance from the Sun. 1 … 2 … increasing distance from the Sun 3 … 4 … [3] (c) A device on the surface of Mars sends a radio wave to the Earth. The distance from Mars to the Earth is 1.3 × 10¹¹ m. The speed of the radio wave is 3.0 × 10⁸ m / s. Calculate the time taken for the radio wave to travel from Mars to the Earth. time taken = … s [3] [Total: 7]
7 marks
Mark scheme: 11(a) Earth has greater mass ORA B1 11(b) (1) Jupiter B3 (2) Saturn (3) Uranus (4) Neptune 11(c) 430 (s) A3 1.3 (1011) ÷ 3(.0) (108) (C2) speed = distance ÷ time OR (t = ) d ÷ s (C1)
This question in 0625/31 Oct/Nov 2025
Q77 · The speed–time graph for the journey of a cyclist 0625/32 Oct/Nov 2025
1 (a) Fig. 1.1 shows the speed–time graph for the journey of a cyclist. 8 7 speed 6 m / s 5 4 3 2 1 0 0 10 20 30 40 50 60 70 time / s Fig. 1.1 (i) Determine the speed of the cyclist at time = 5.0 s. speed = … m / s [2] (ii) Describe the motion of the cyclist between time = 52 s and time = 60 s. … [1] (iii) Determine the distance travelled by the cyclist between time = 0 and time = 6.0 s. distance = … m [3] (b) On a different journey, the cyclist travels 560 m in 130 s. Calculate the average speed of the cyclist. average speed = … m / s [3] [Total: 9]
9 marks
Mark scheme: Question Answer Marks 1(a)(i) 6.2 (m / s) A2 indication on graph at time = 5 s C1 1(a)(ii) deceleration or slowing down owtte B1 1(a)(iii) 22 (m) A3 ½ 7.4 6(.0) C2 (distance =) area under graph OR ½ b h C1 1(b) 4.3 (m / s) A3 560 ÷ 130 C2 (average speed =) distance / time C1
This question in 0625/32 Oct/Nov 2025
Q78 · A stone falling from a cliff to a beach 0625/33 Oct/Nov 2025
1 Fig. 1.1 shows a stone falling from a cliff to a beach. cliff stone beach Fig. 1.1 (a) Fig. 1.2 shows the speed-time graph for the stone. 35 B 30 25 speed m / s 20 15 10 5 A 0 0 0.5 1 1.5 2 2.5 3 3.5 4 time / s Fig. 1.2 (i) Determine the speed of the stone at time = 2.0 s. speed = … m / s [1] (ii) Describe the motion of the stone during section AB of the graph in Fig. 1.2. … [1] (iii) Calculate the distance travelled by the stone between time = 0 and time = 3.4 s. distance = … m [3] (b) The weight of the stone is 0.12 N. Calculate the mass of the stone. mass = … kg [3] [Total: 8]
8 marks
Mark scheme: Question Answer Marks 1(a)(i) 19.5 (m / s) B1 1(a)(ii) acceleration or speeding up owtte B1 1(a)(iii) 56 (m) A3 ½ 3.4 33 C2 (distance =) area under graph or ½ b h C1 1(b) 0.012 (kg) A3 0.12 ÷ 9.8 C2 (mass =) weight / gravitational field strength or w / g or w / 9.8 C1
This question in 0625/33 Oct/Nov 2025
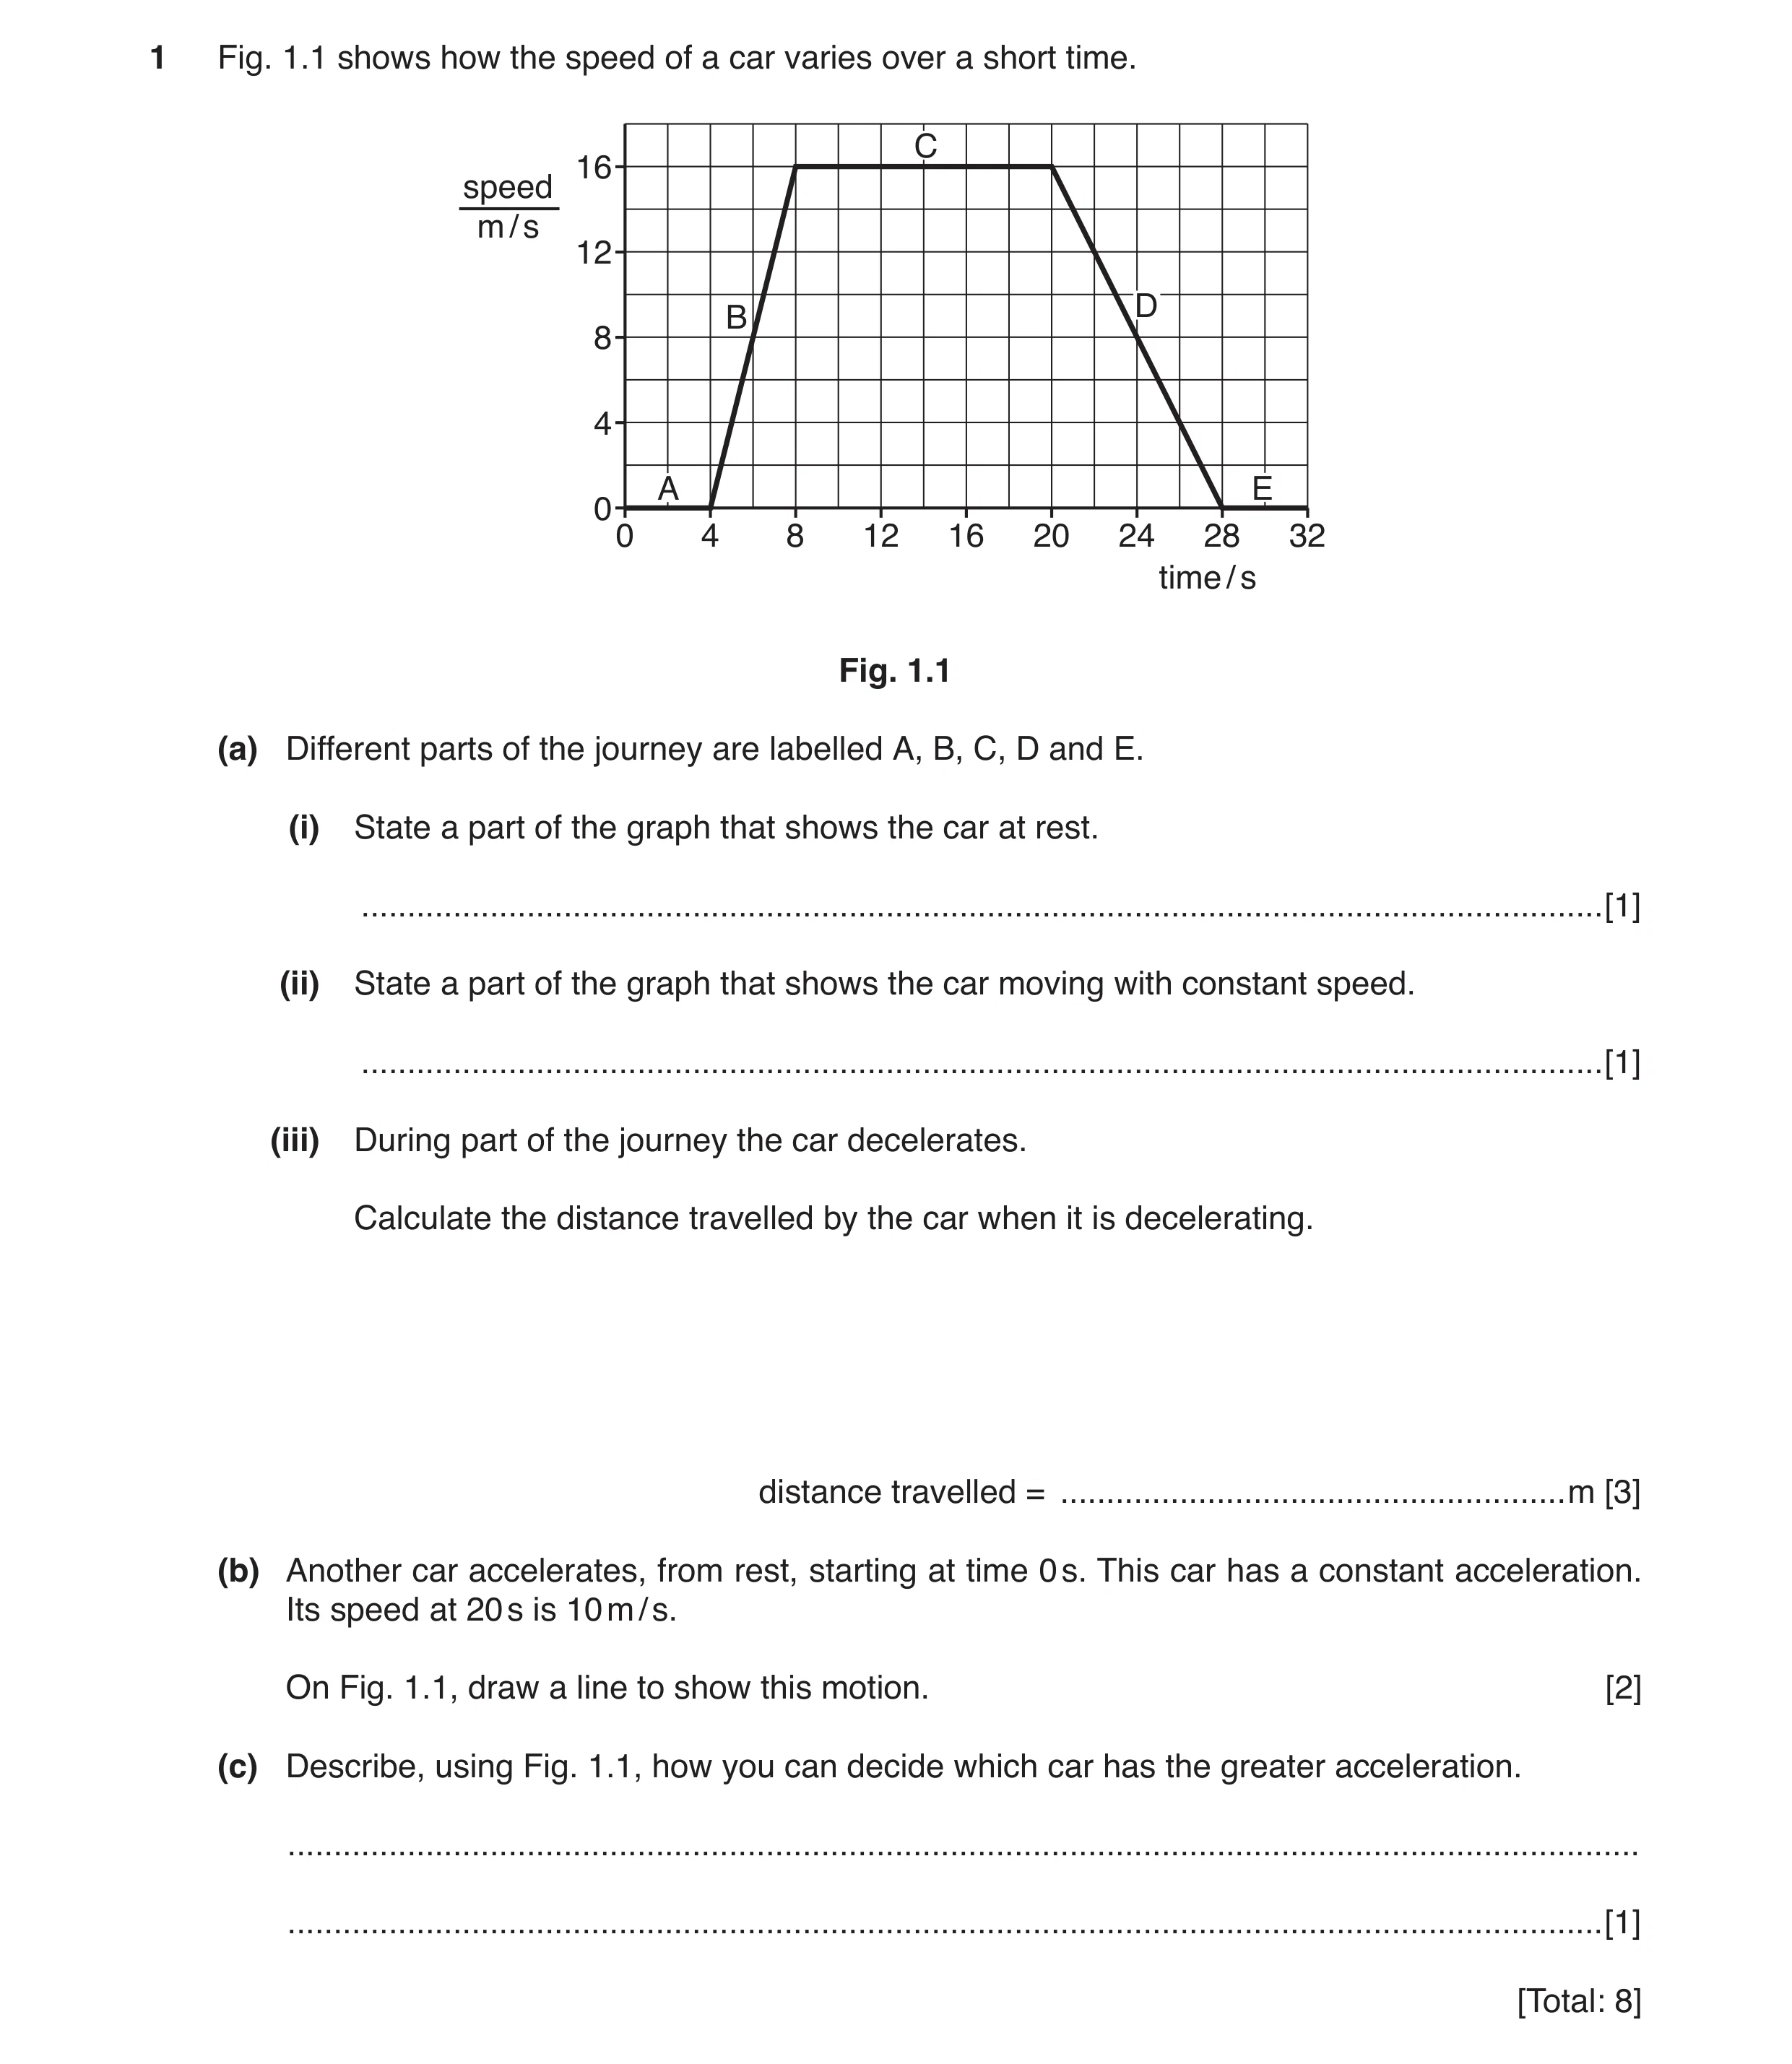 1 / 101
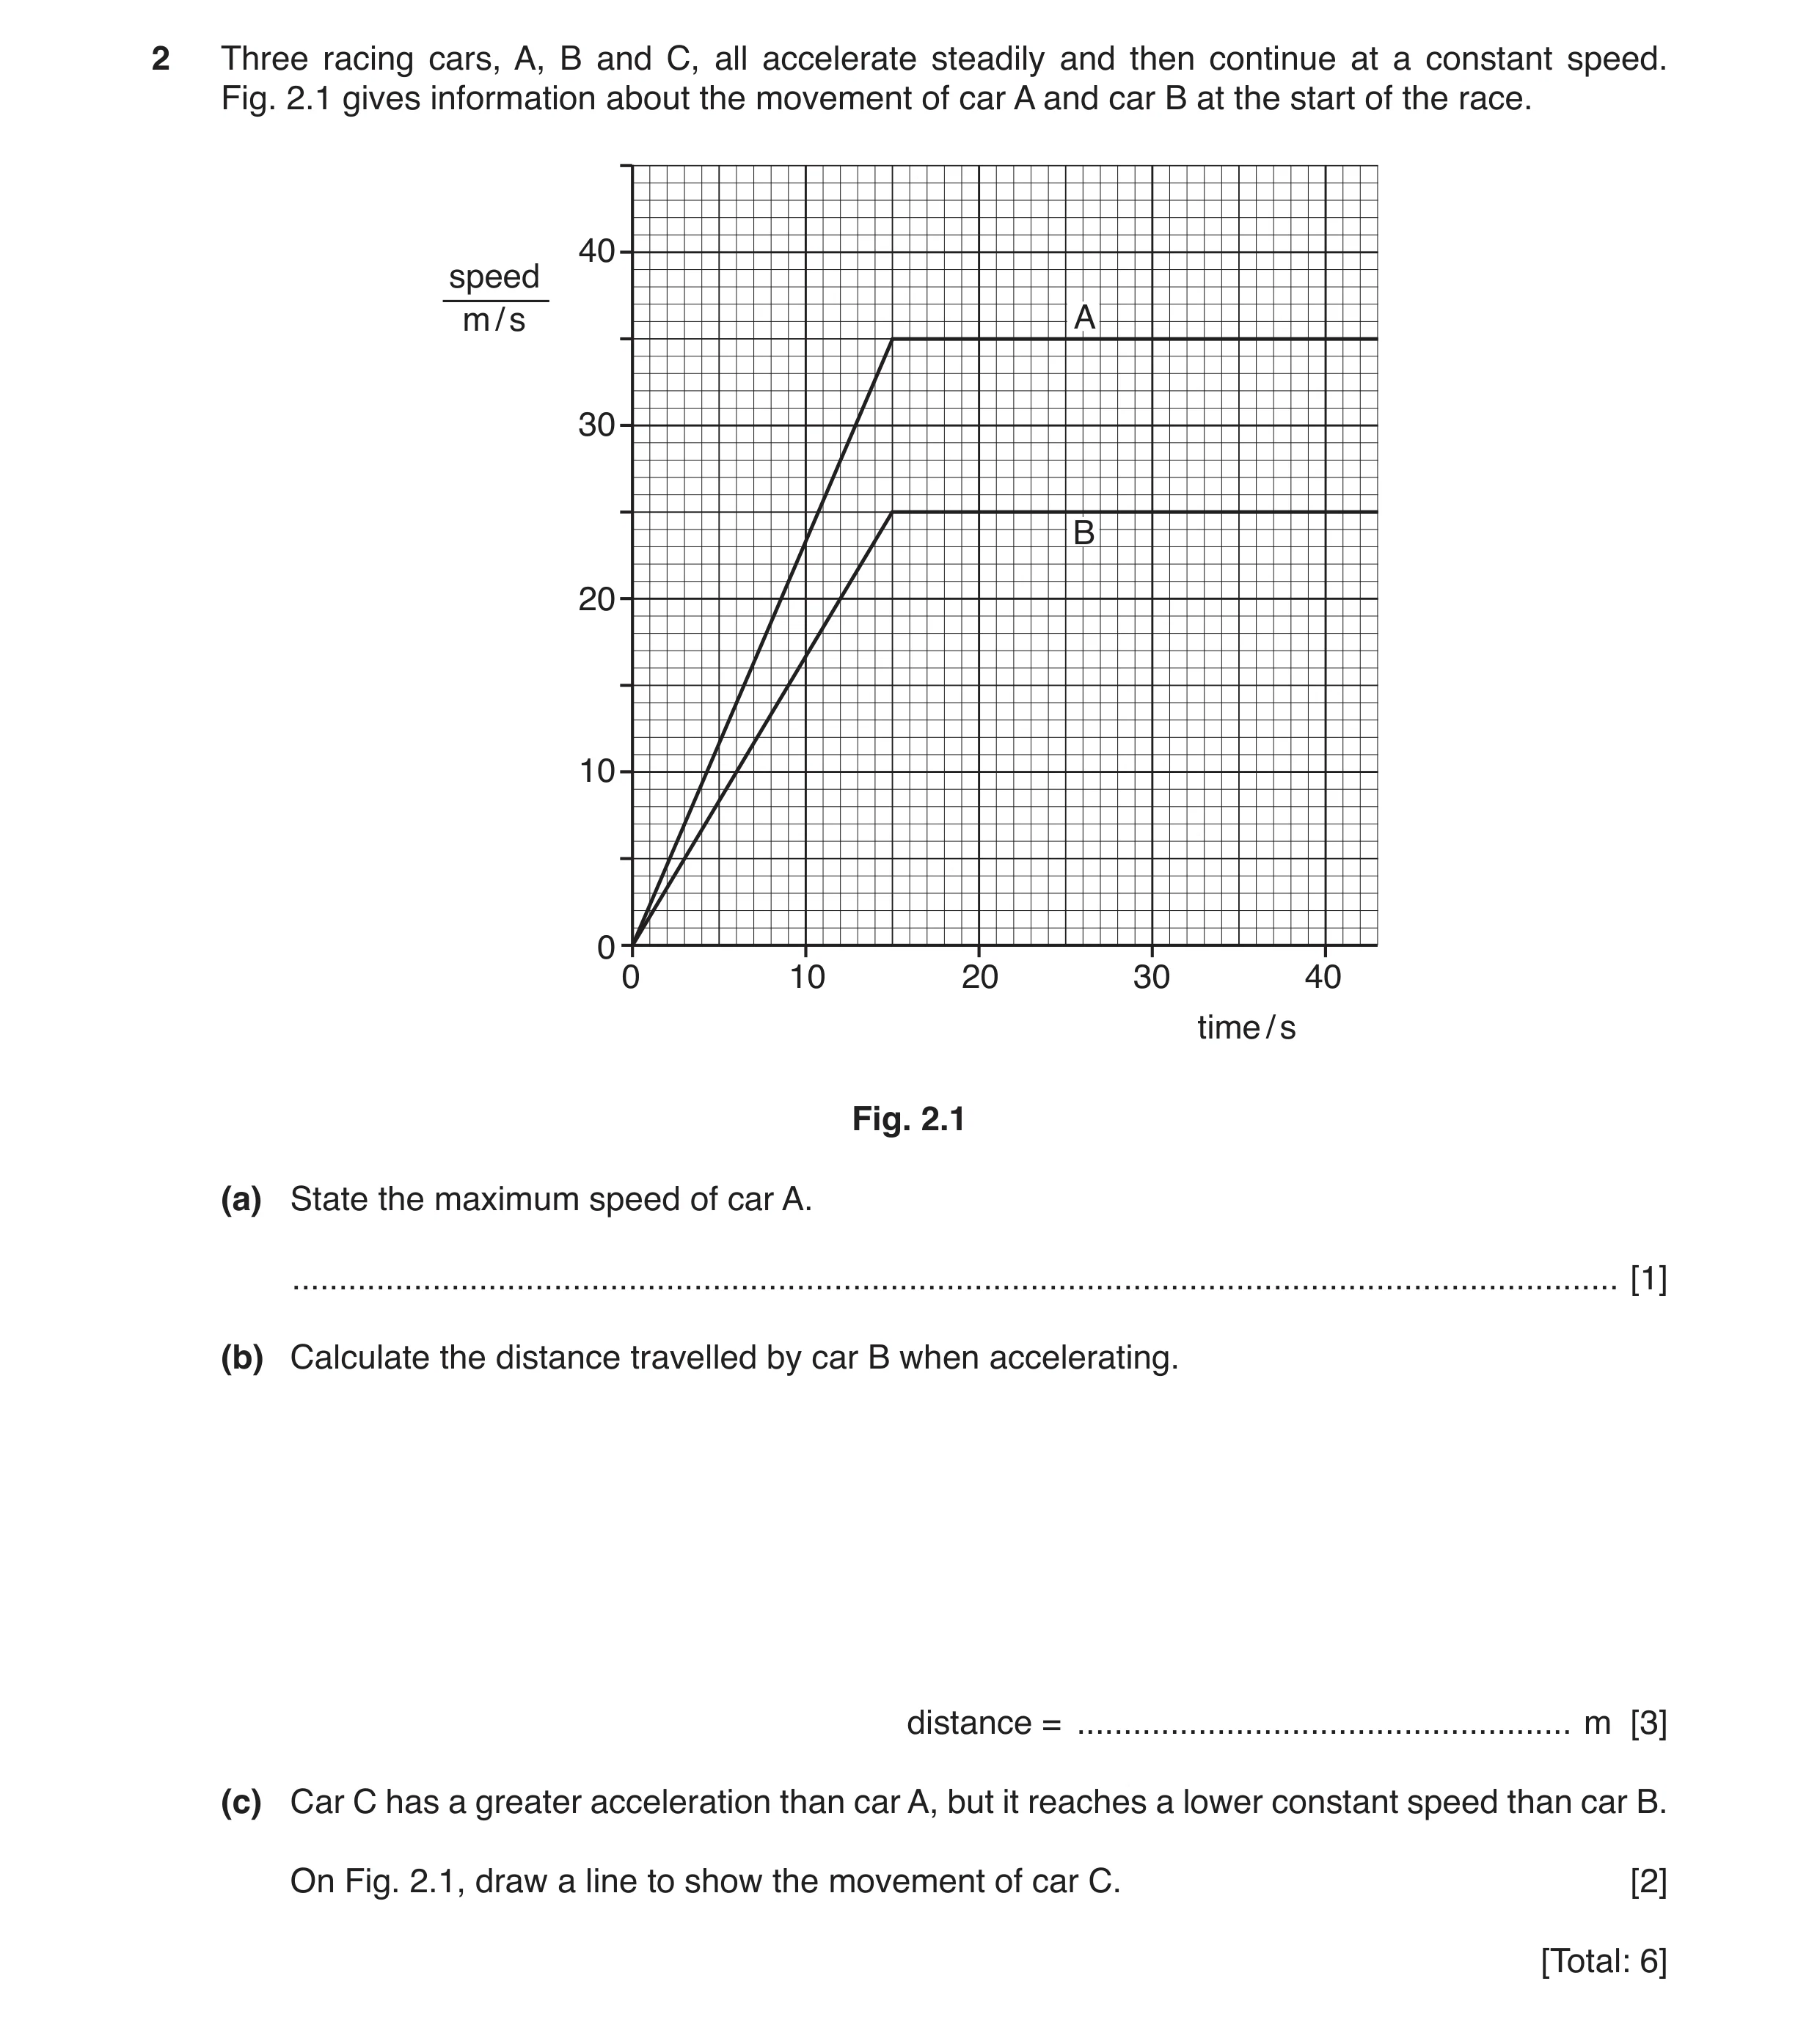 2 / 101
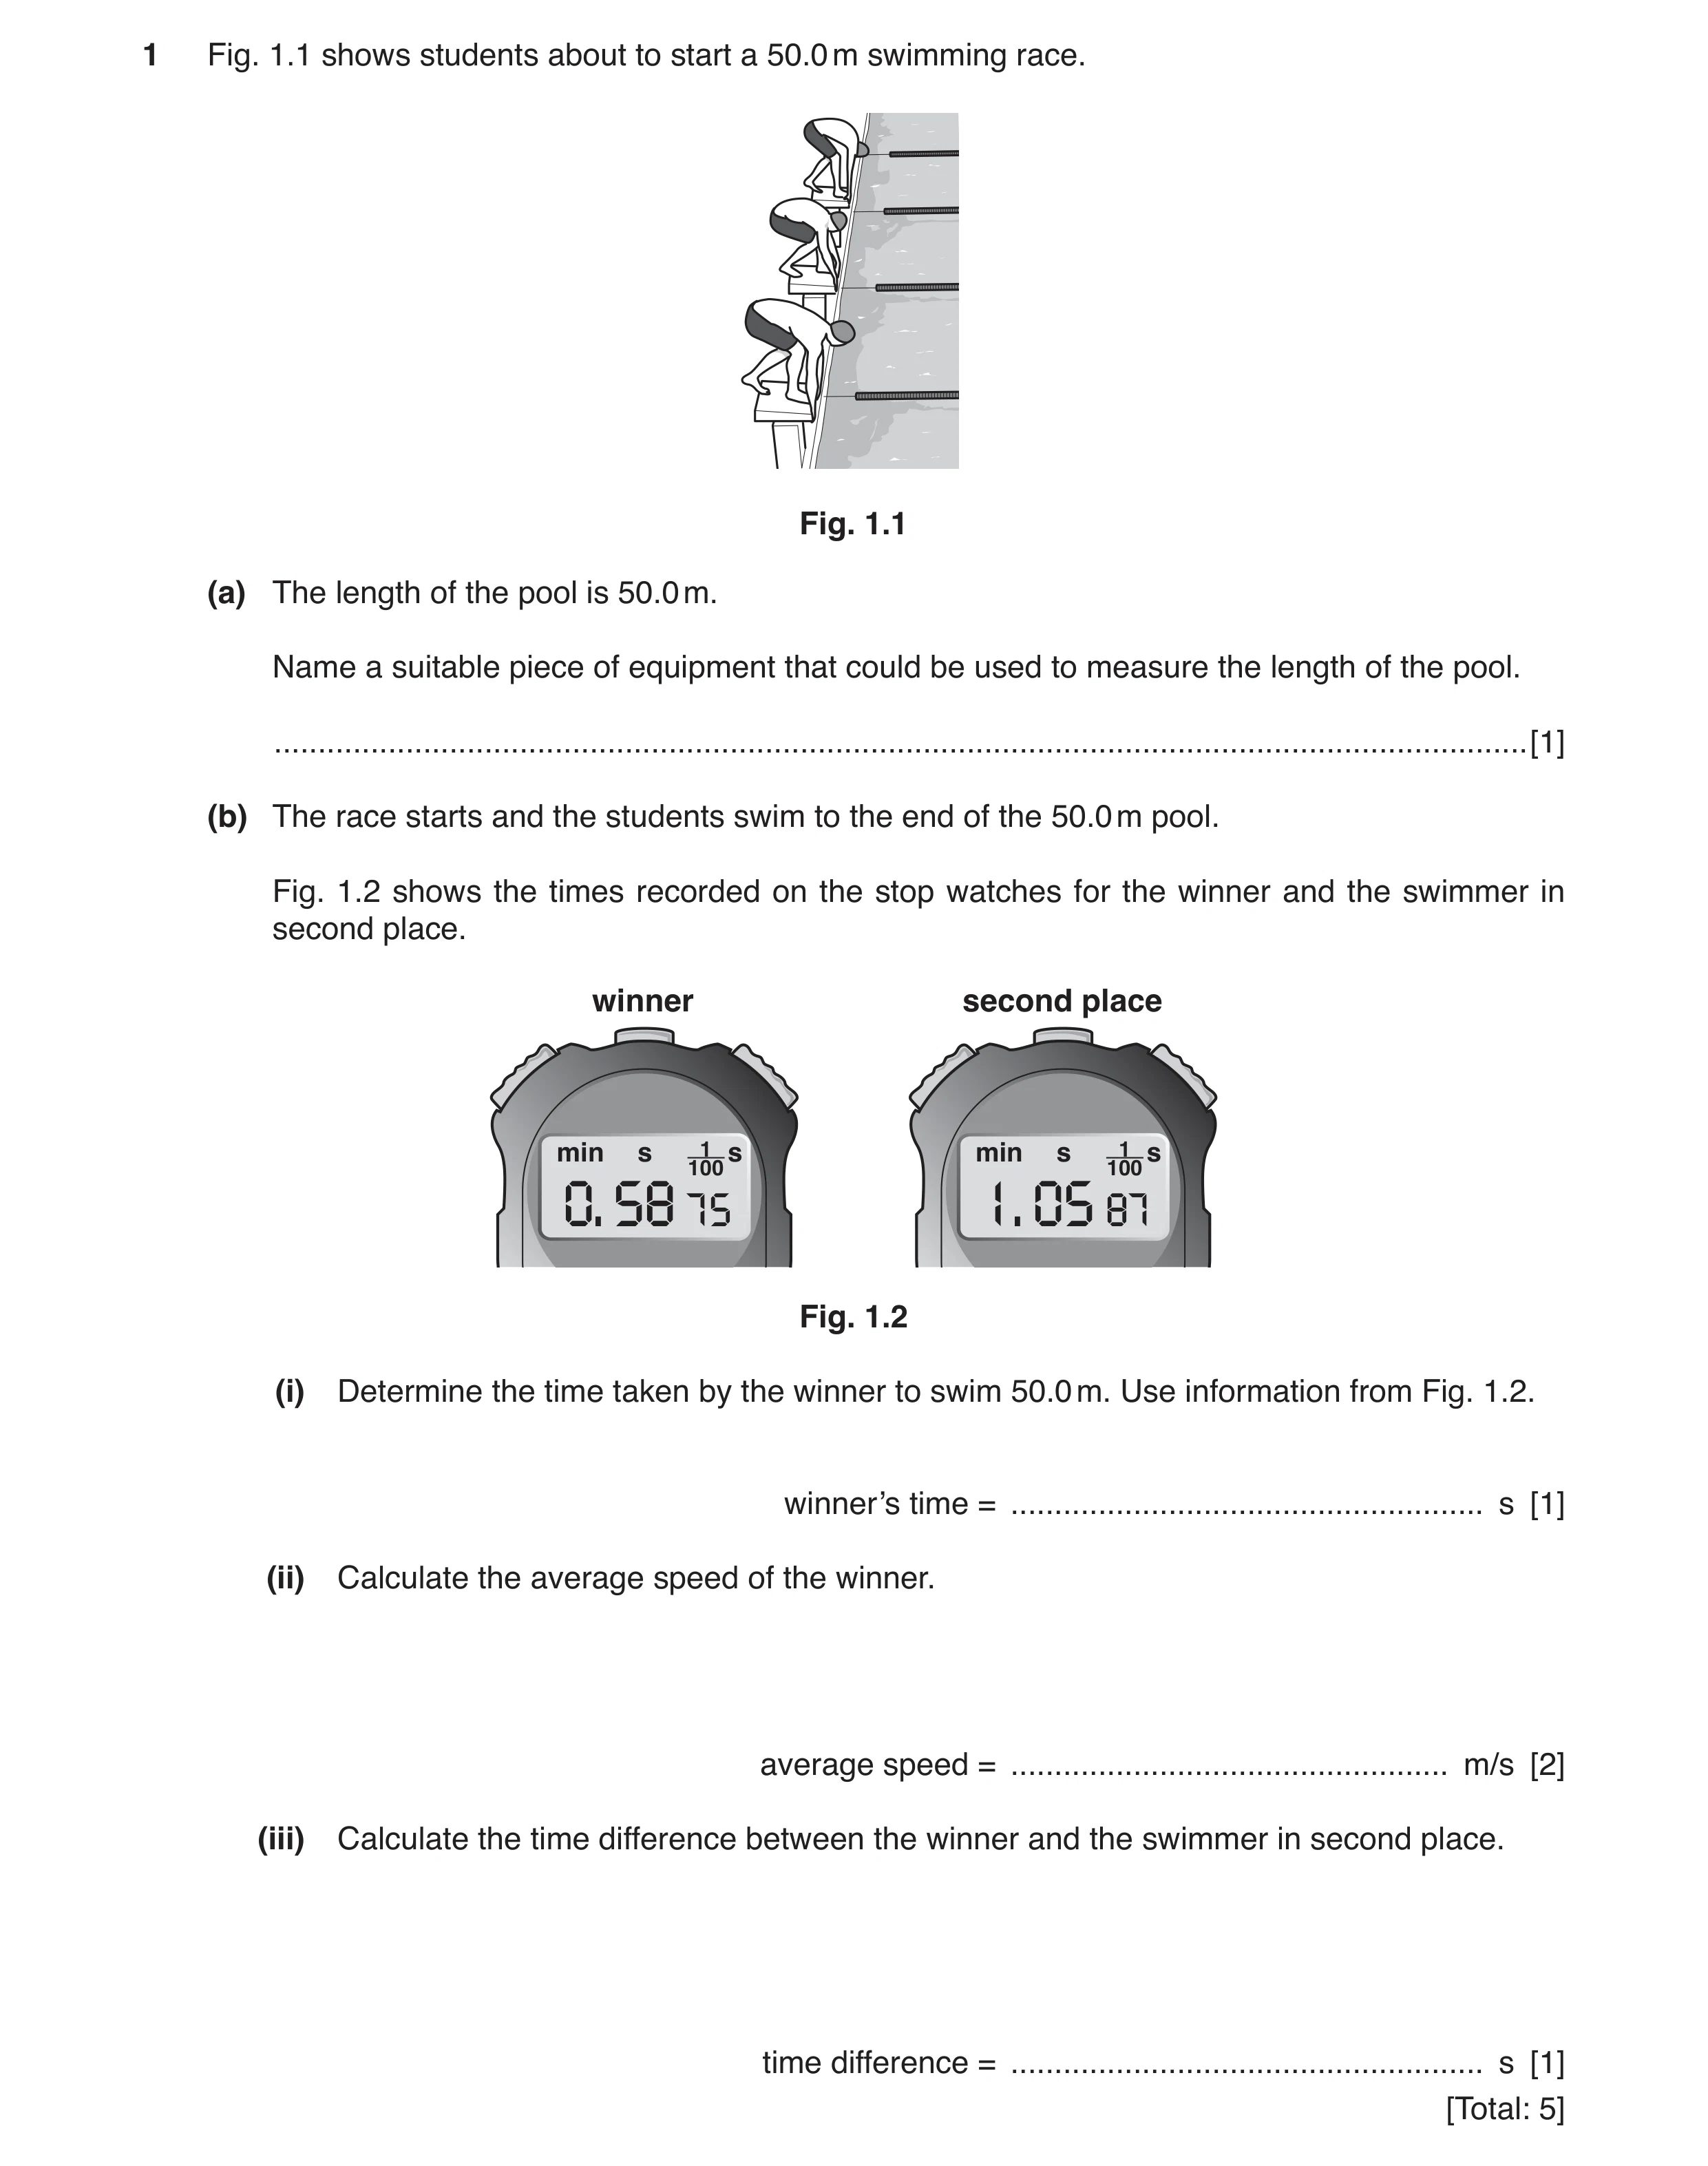 3 / 101
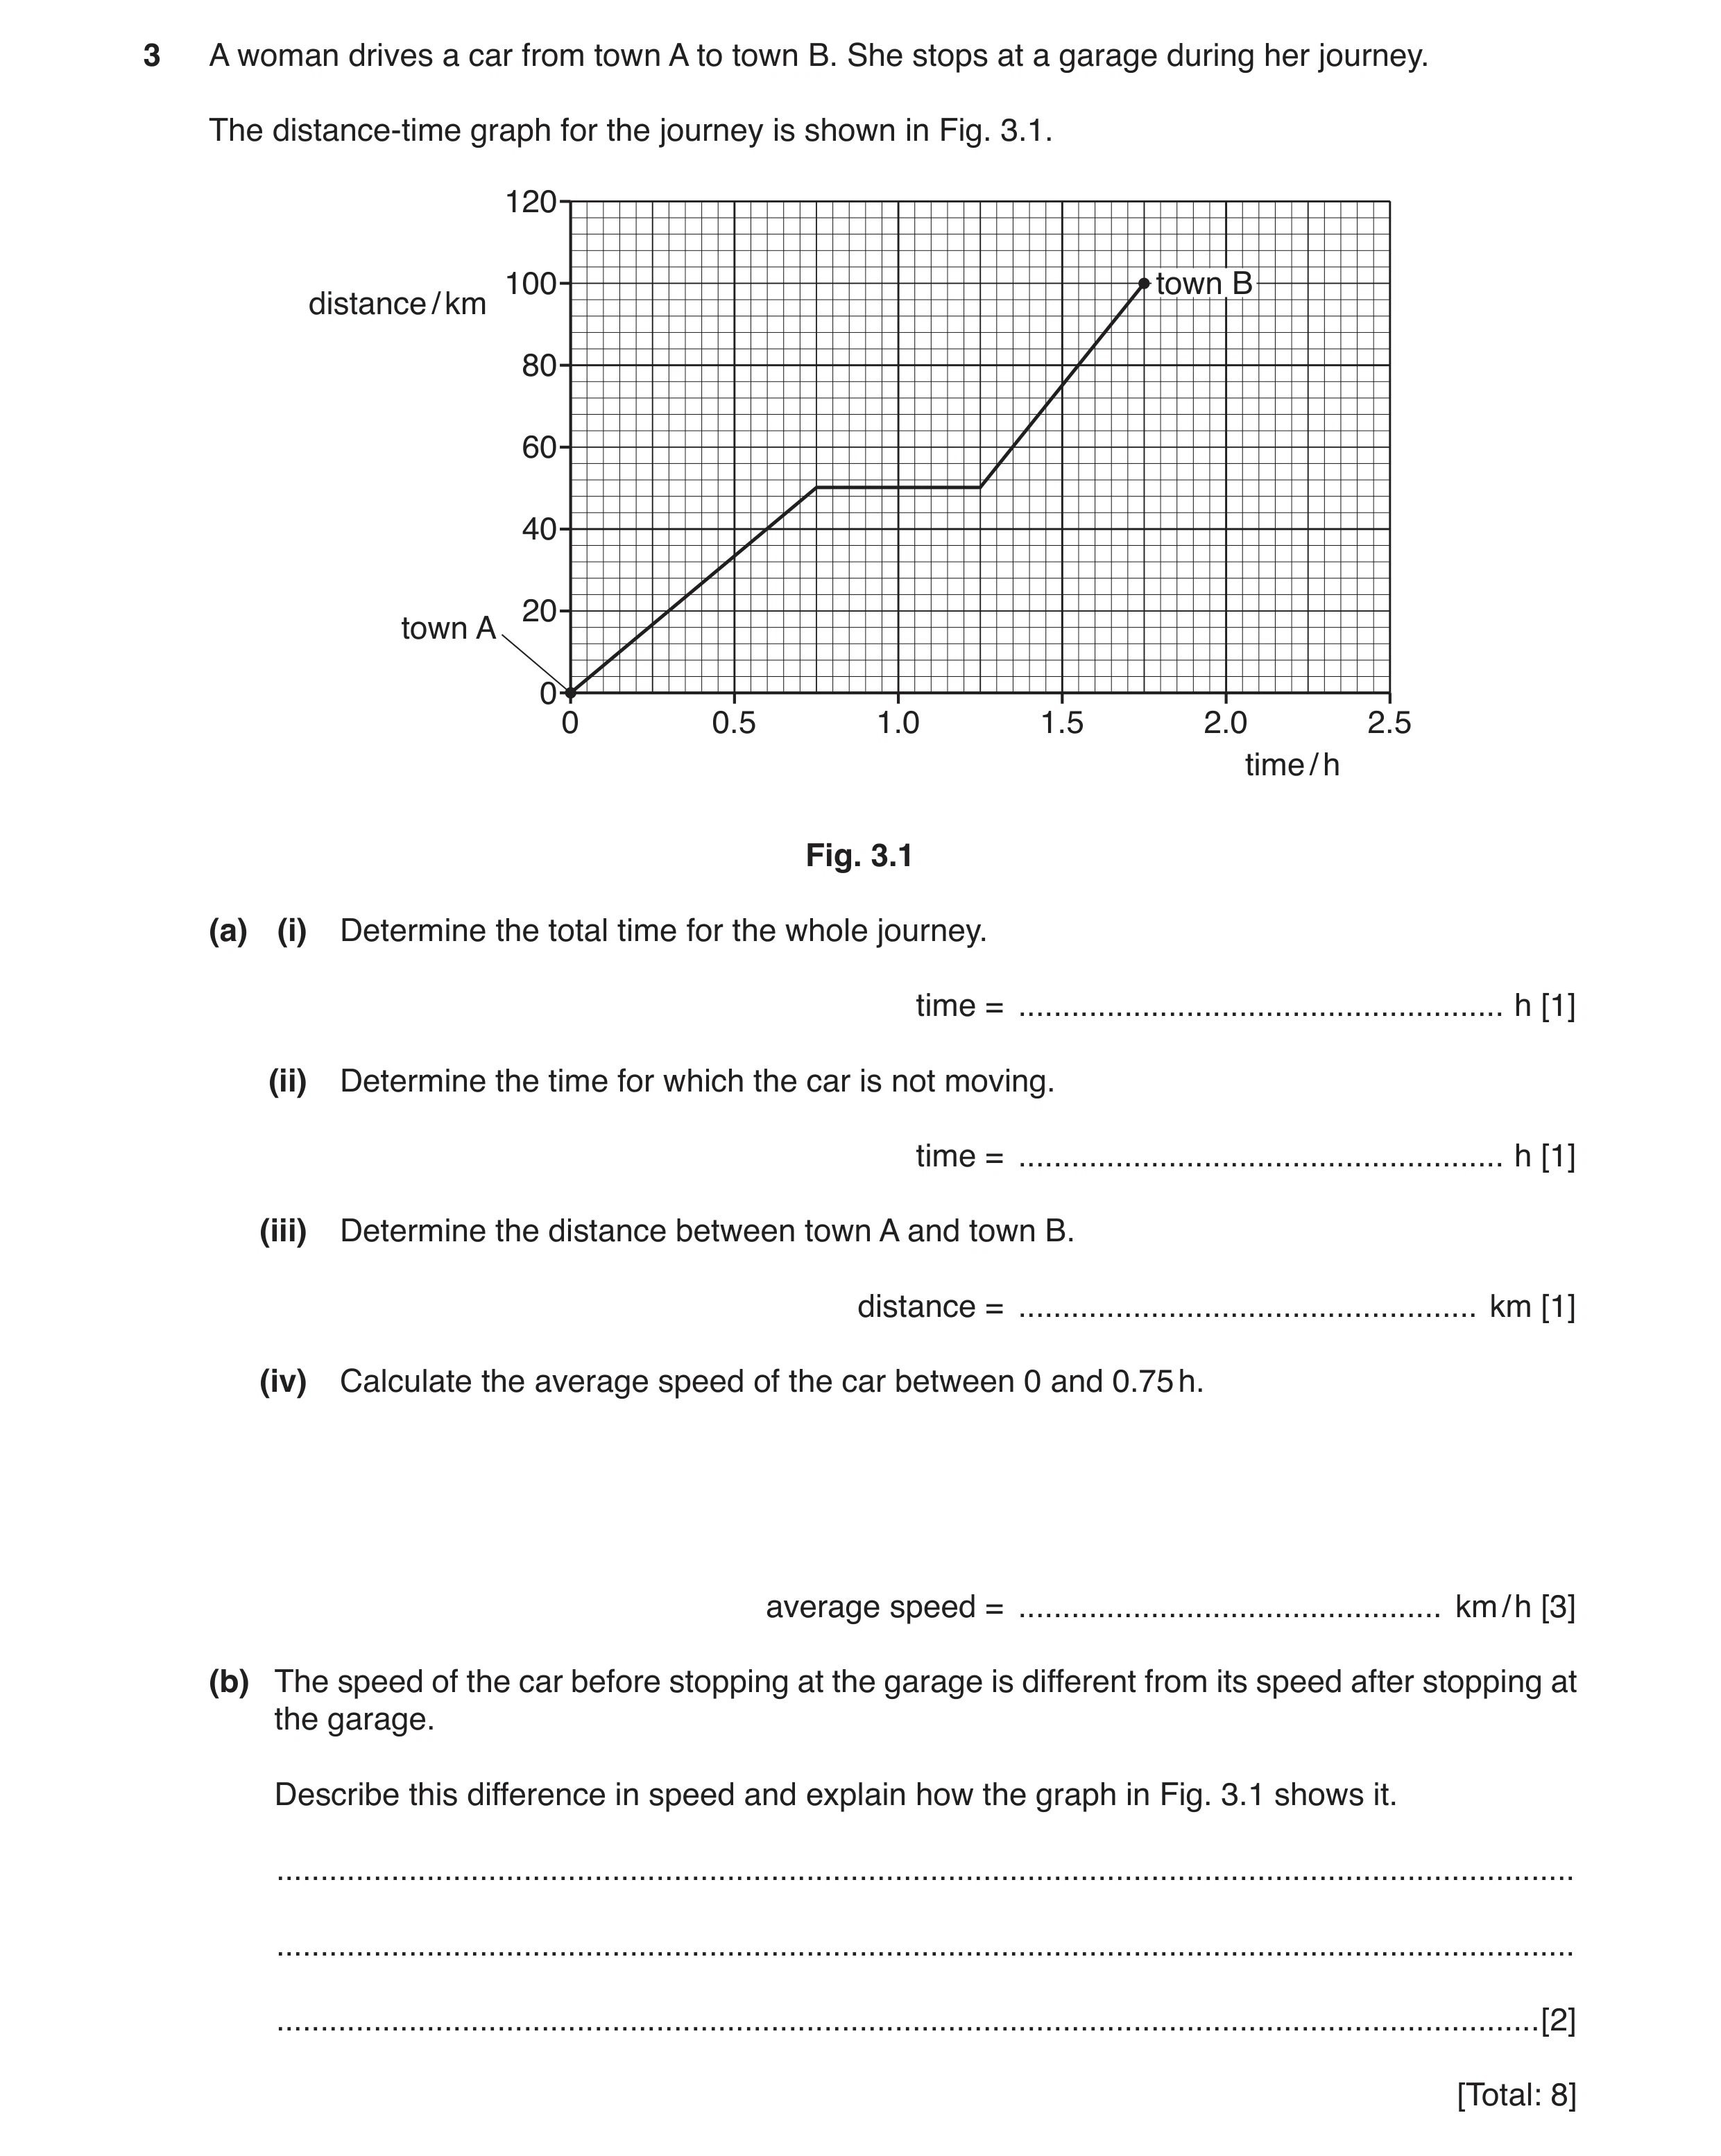 4 / 101
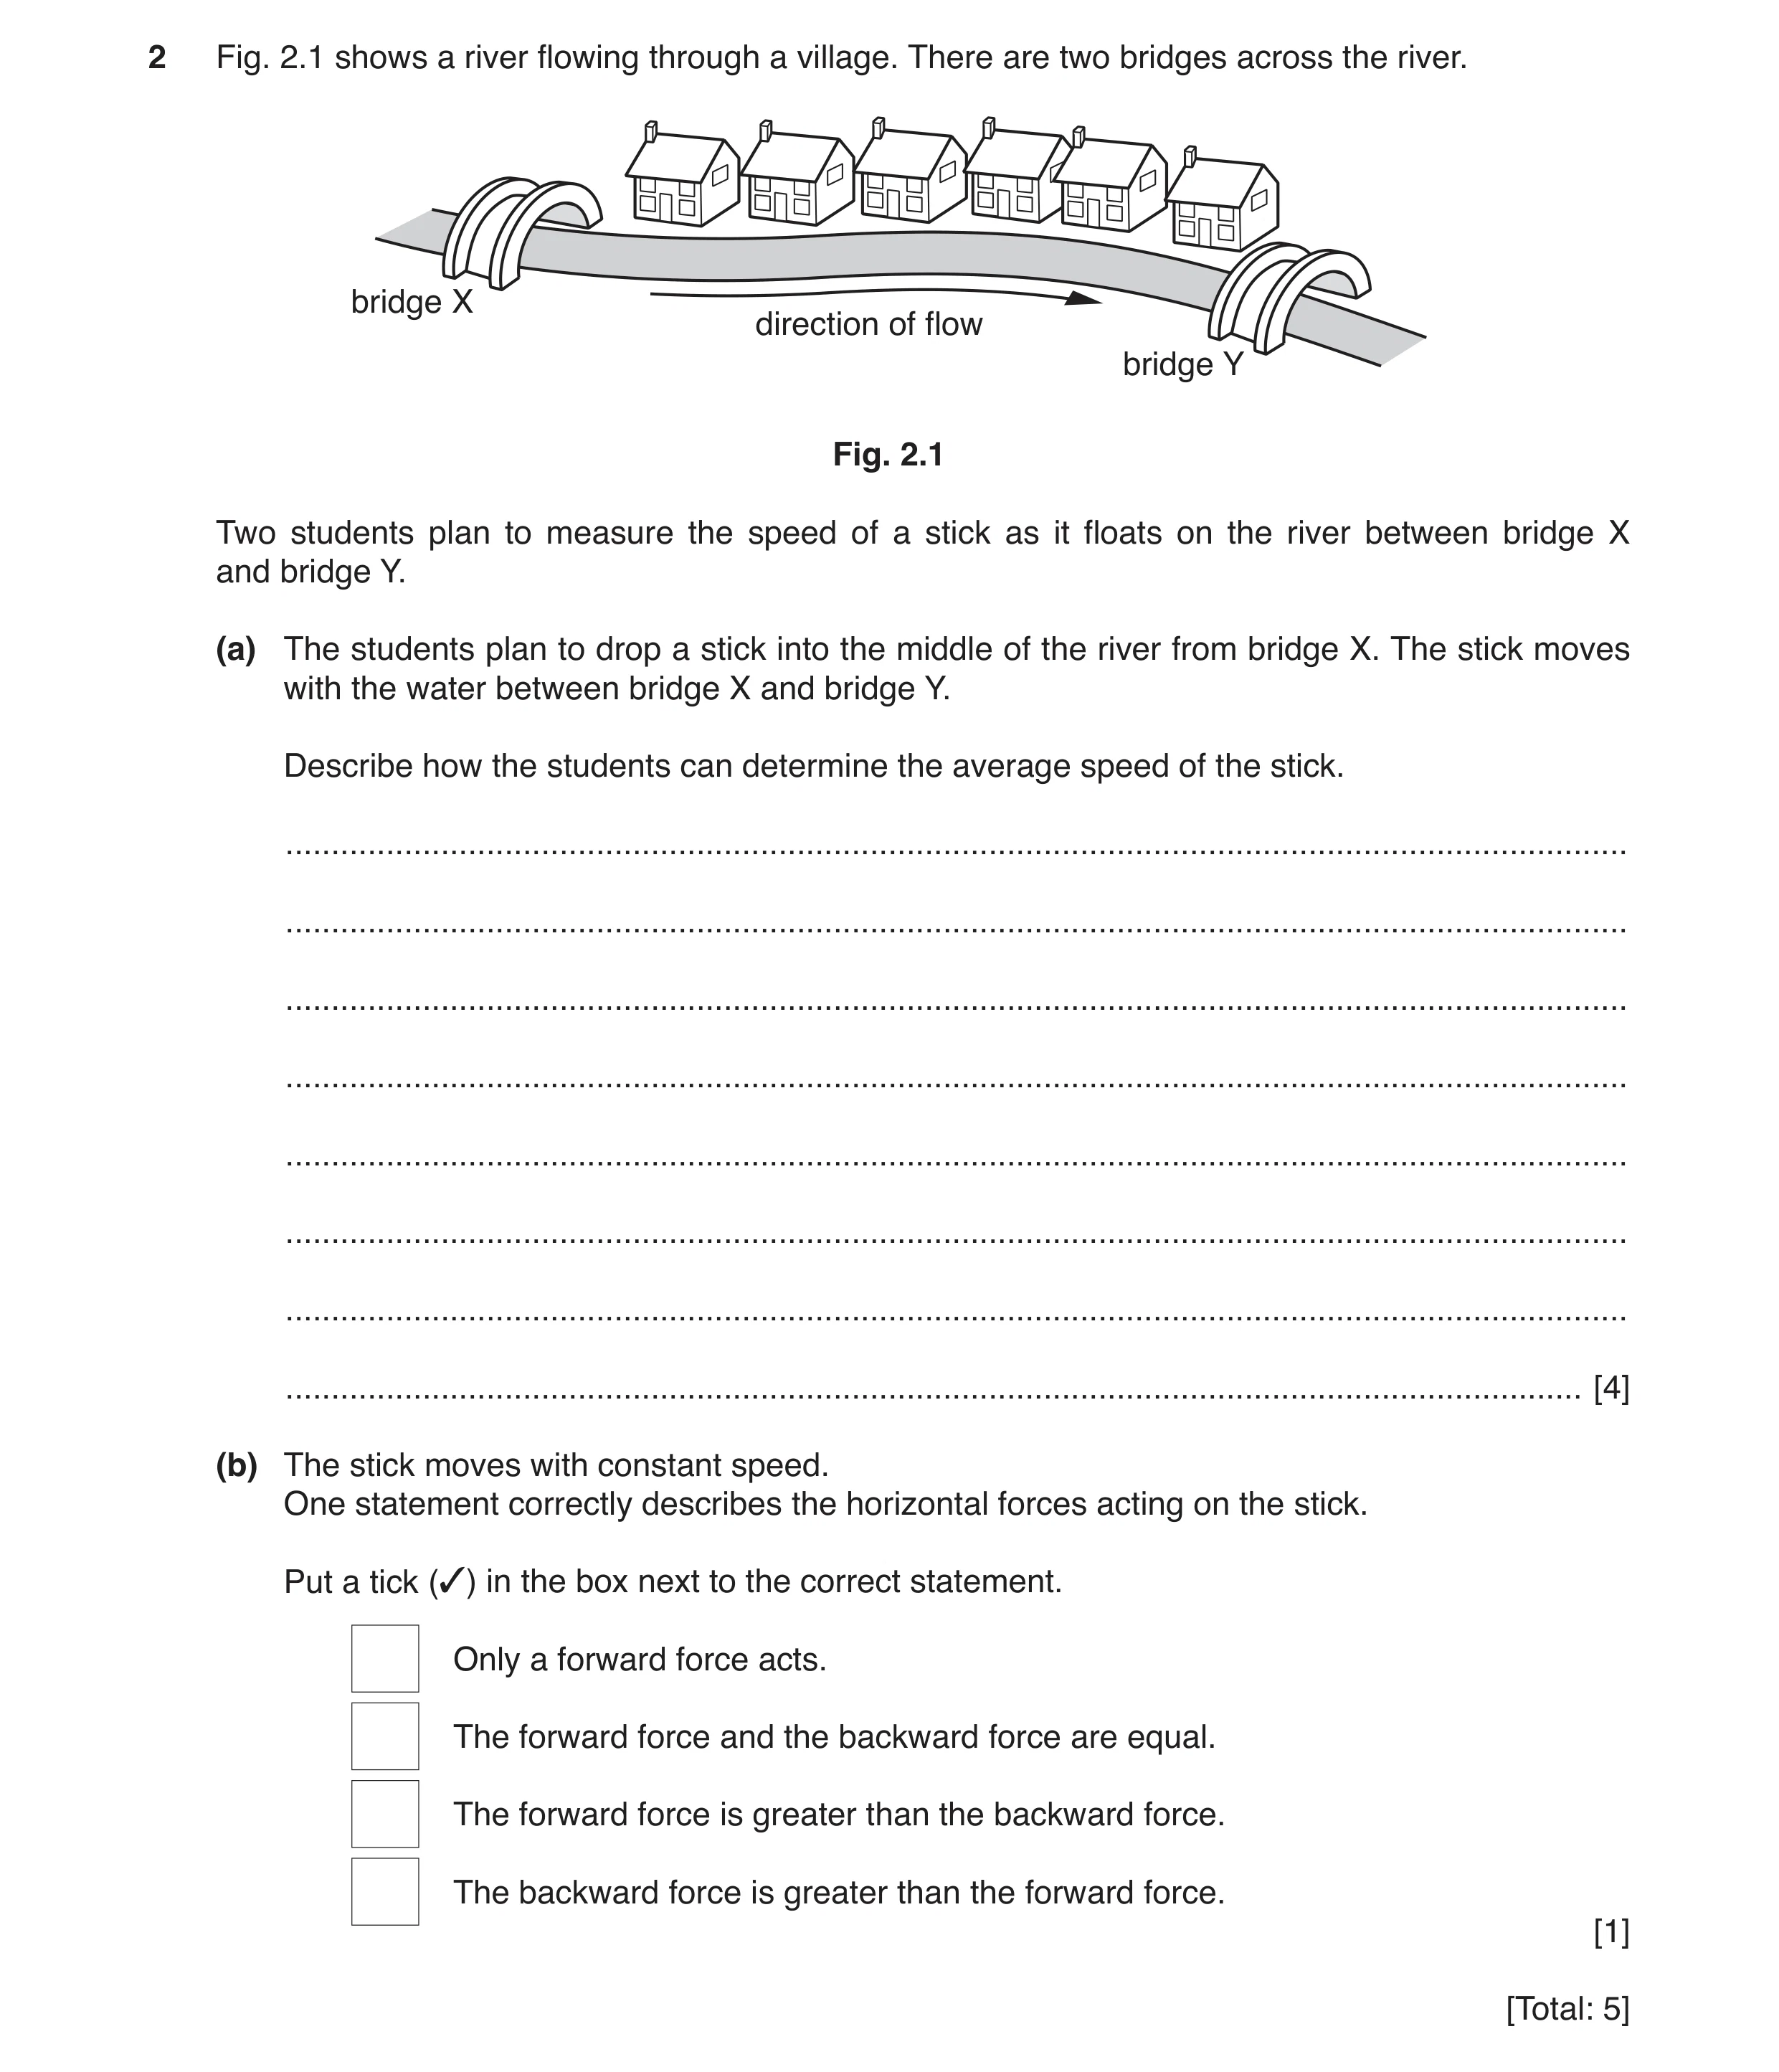 5 / 101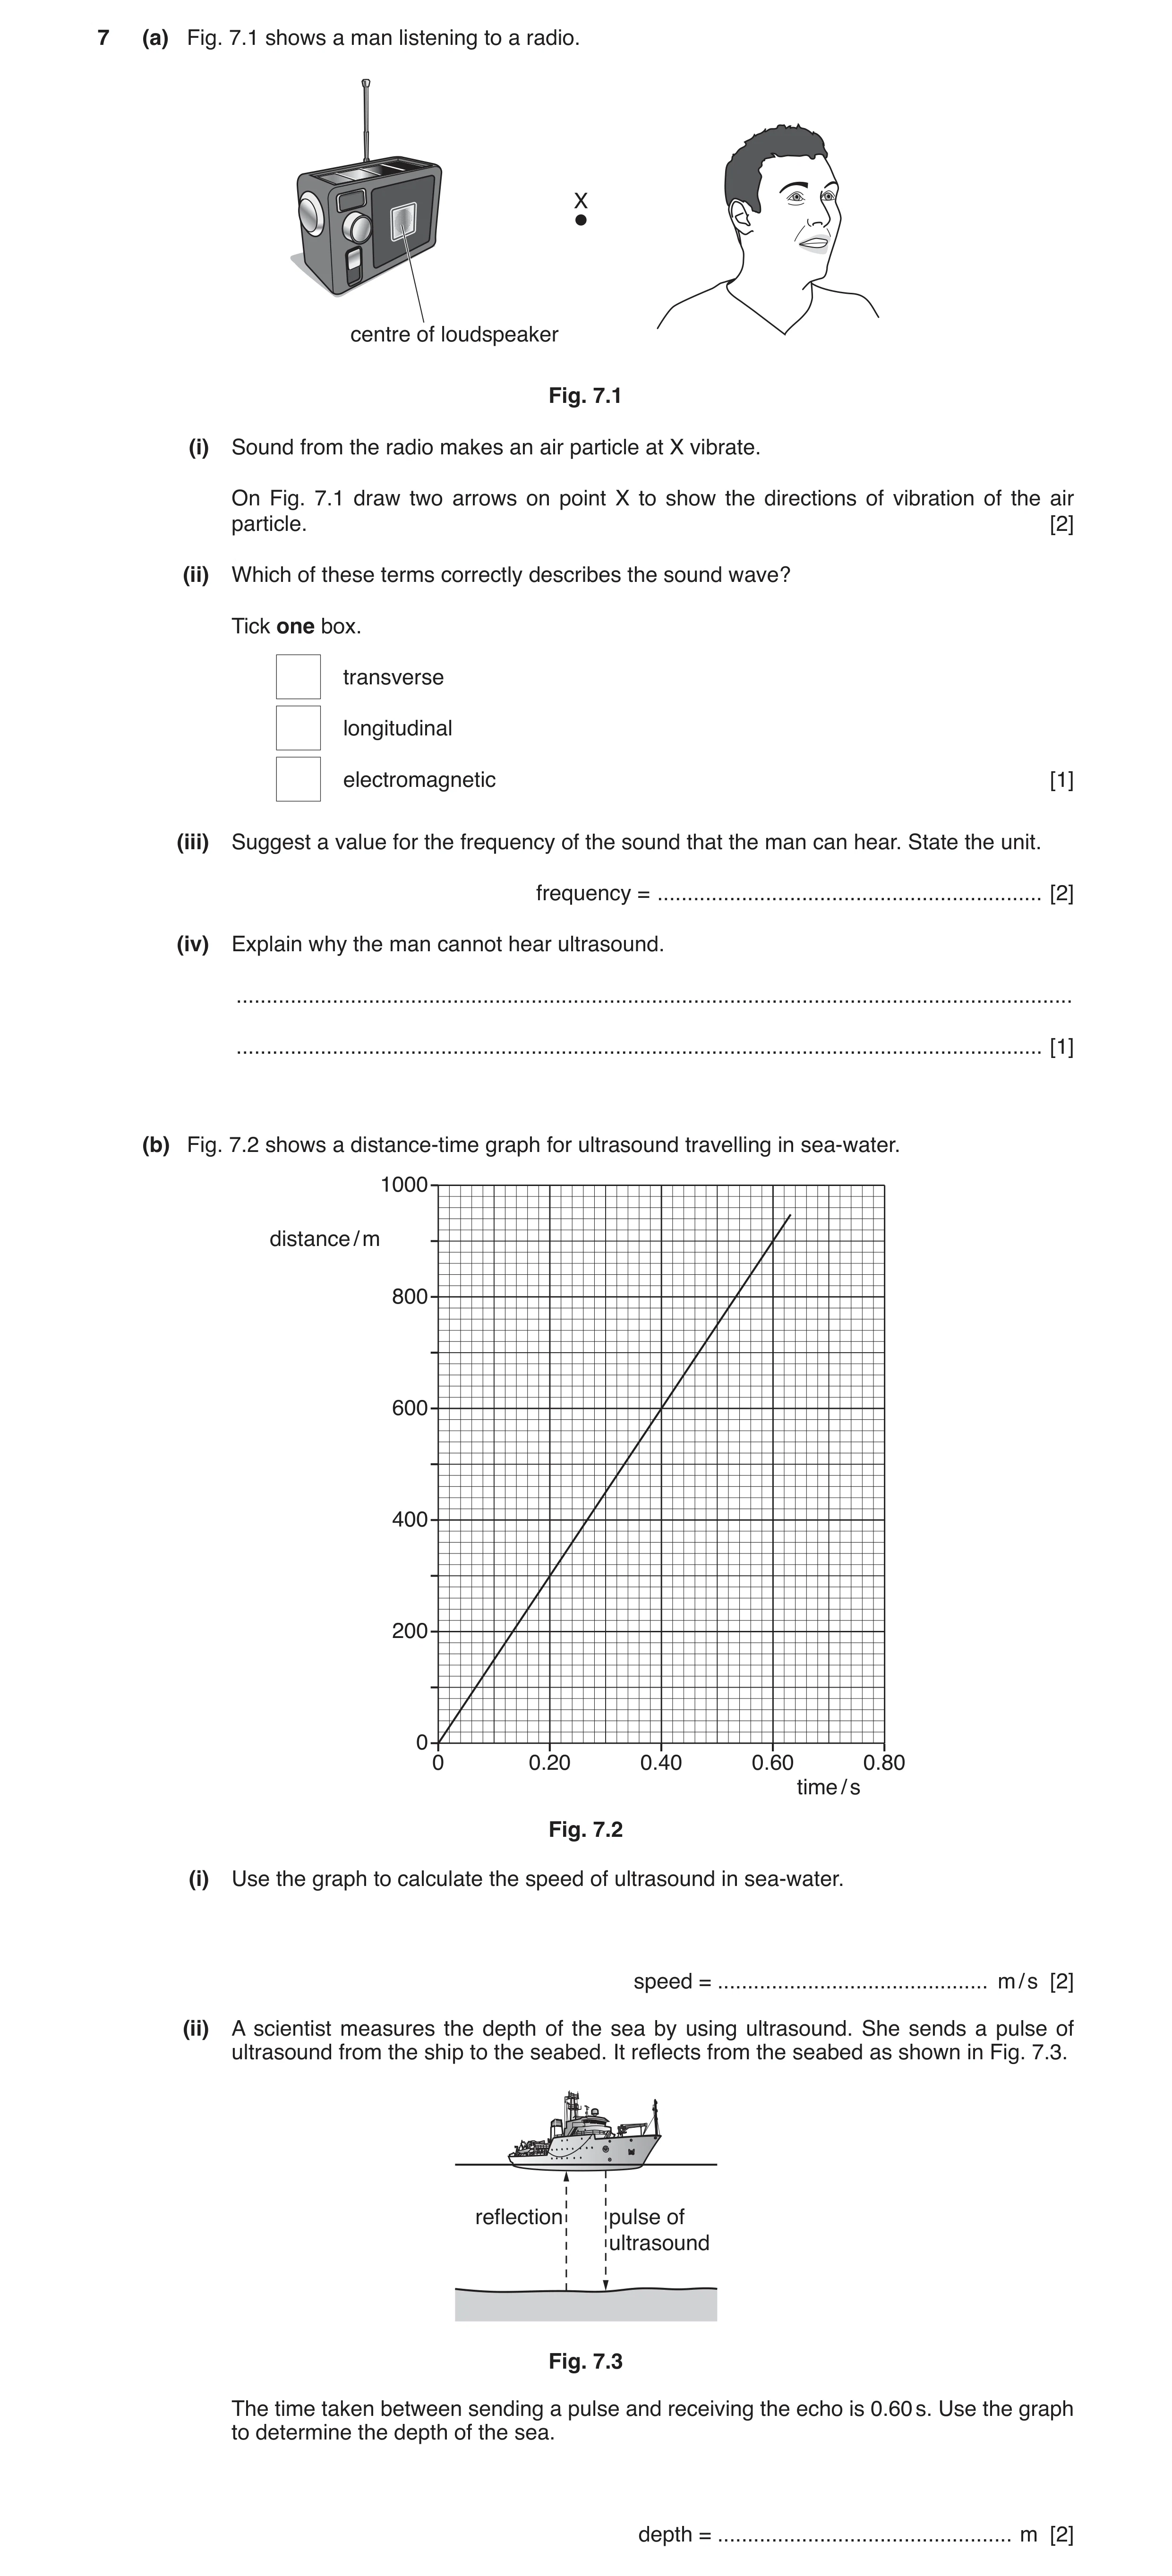
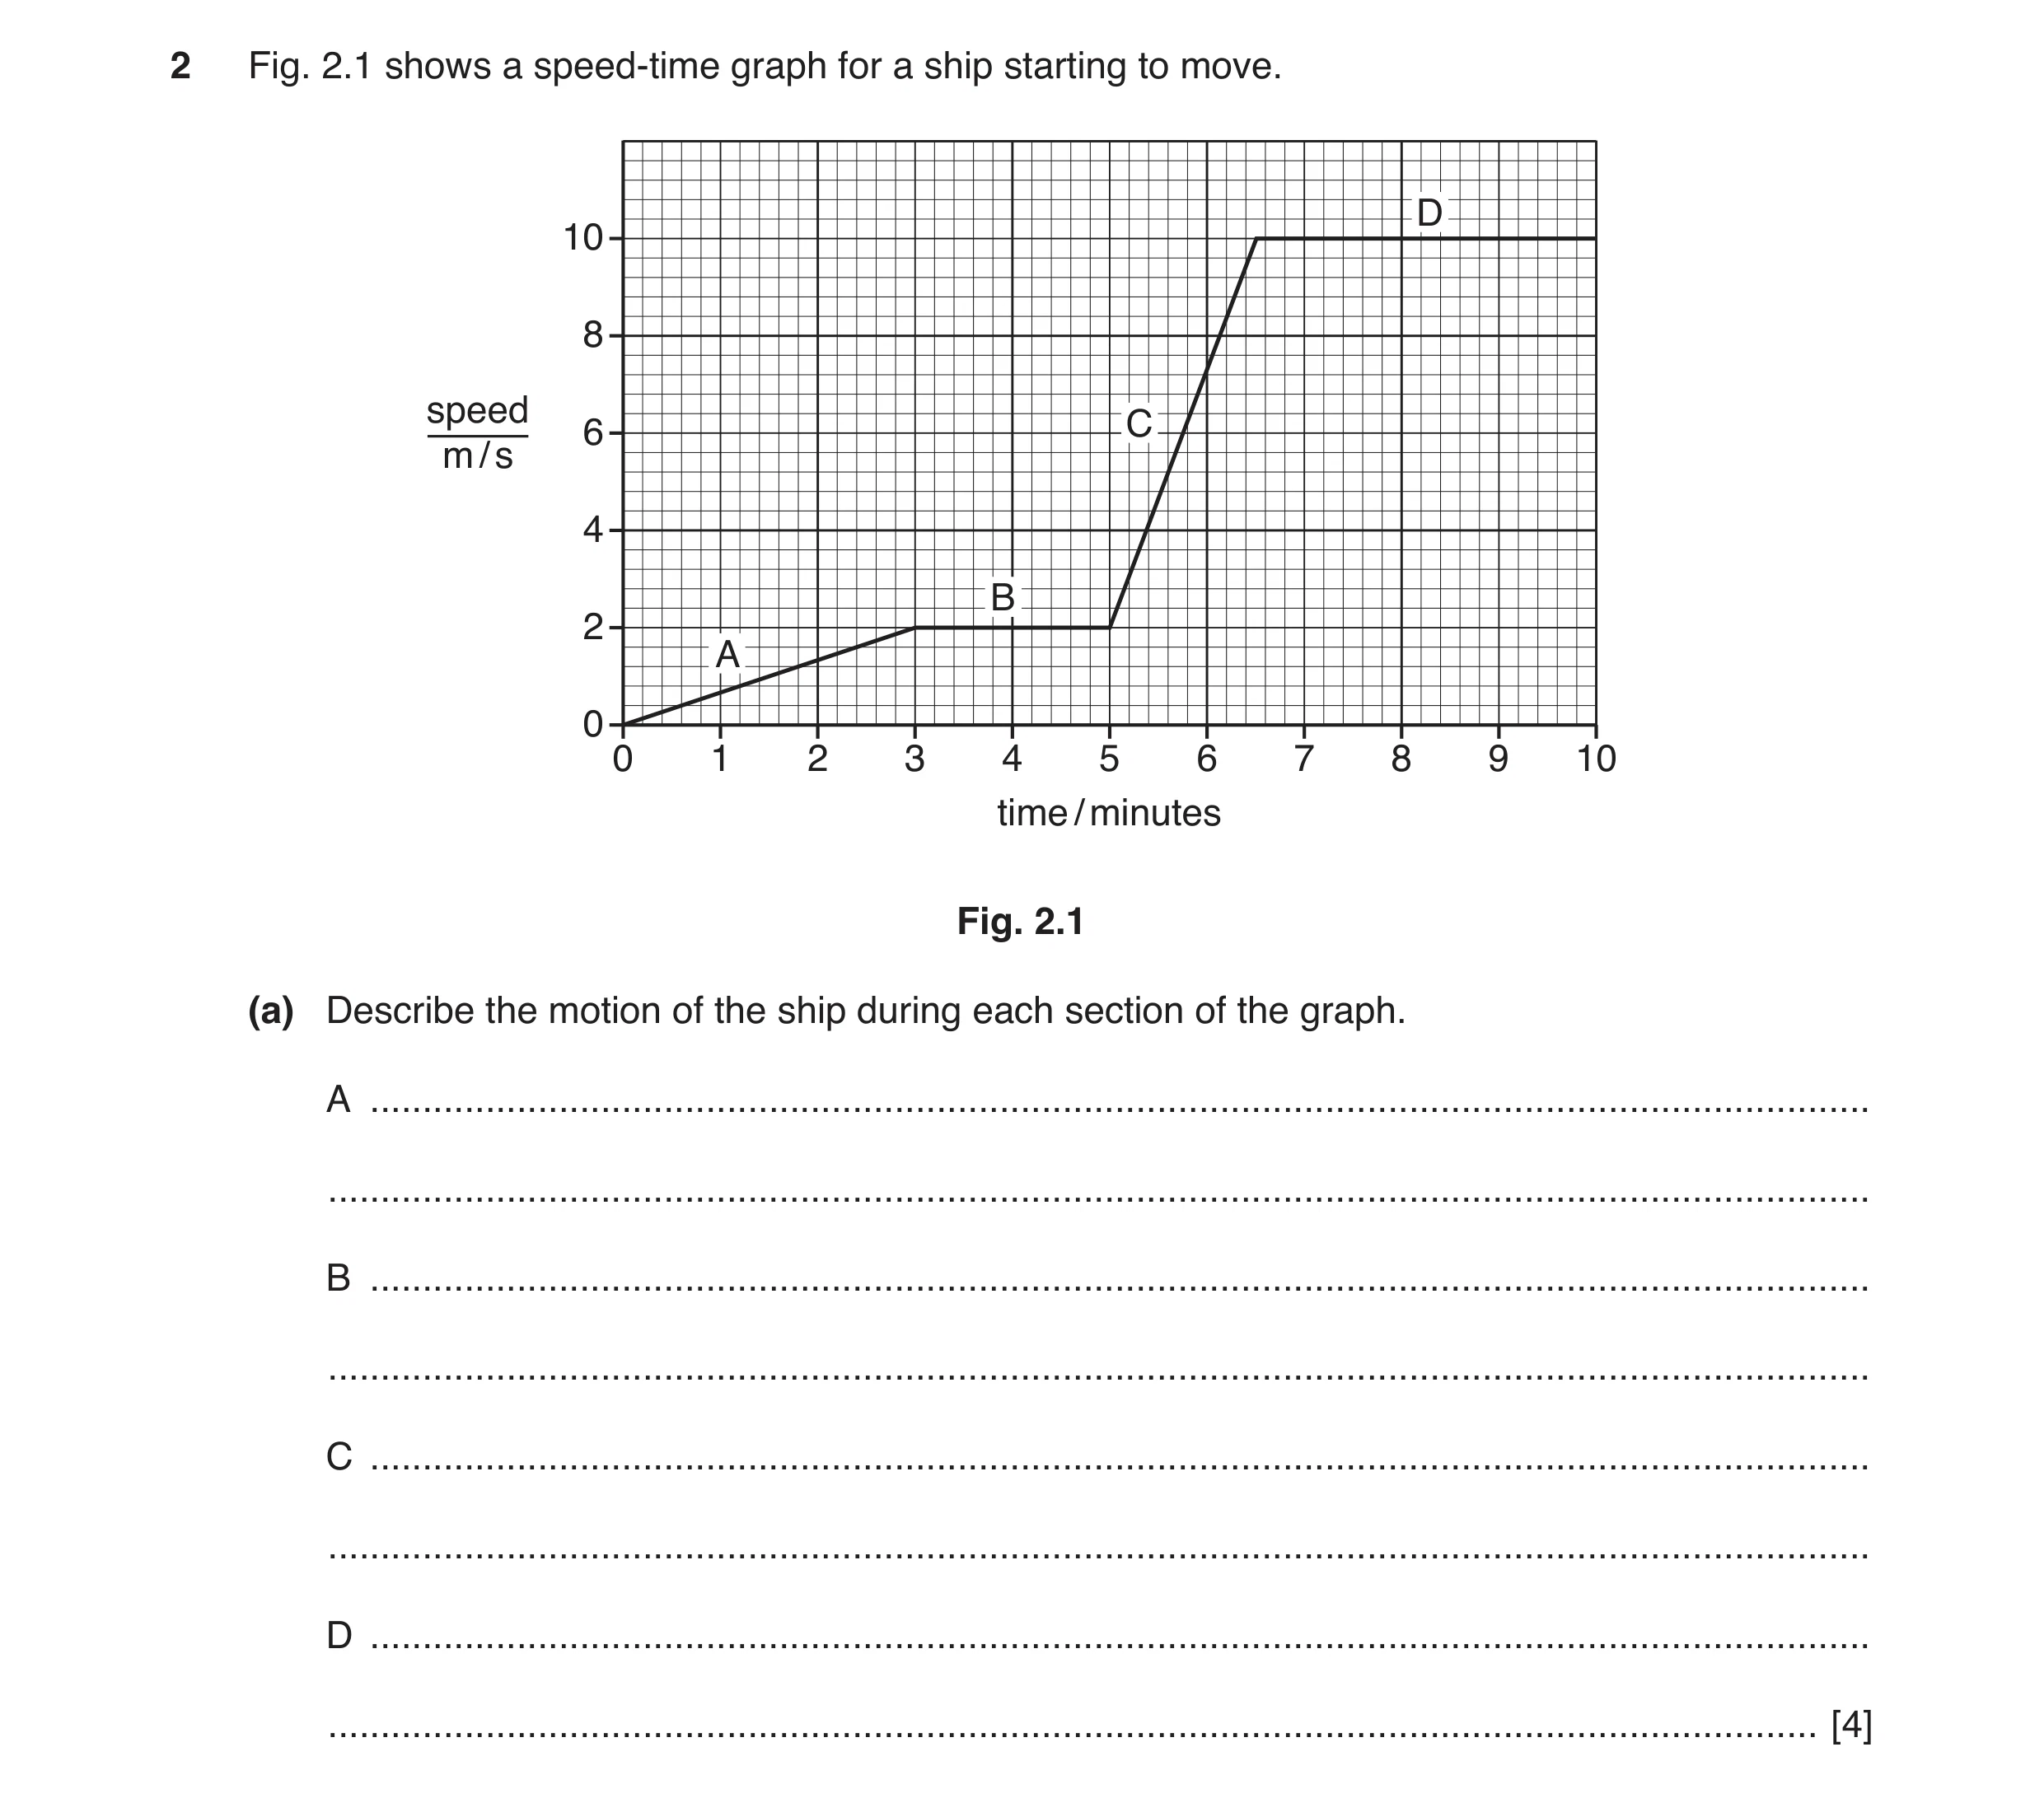 8 / 101
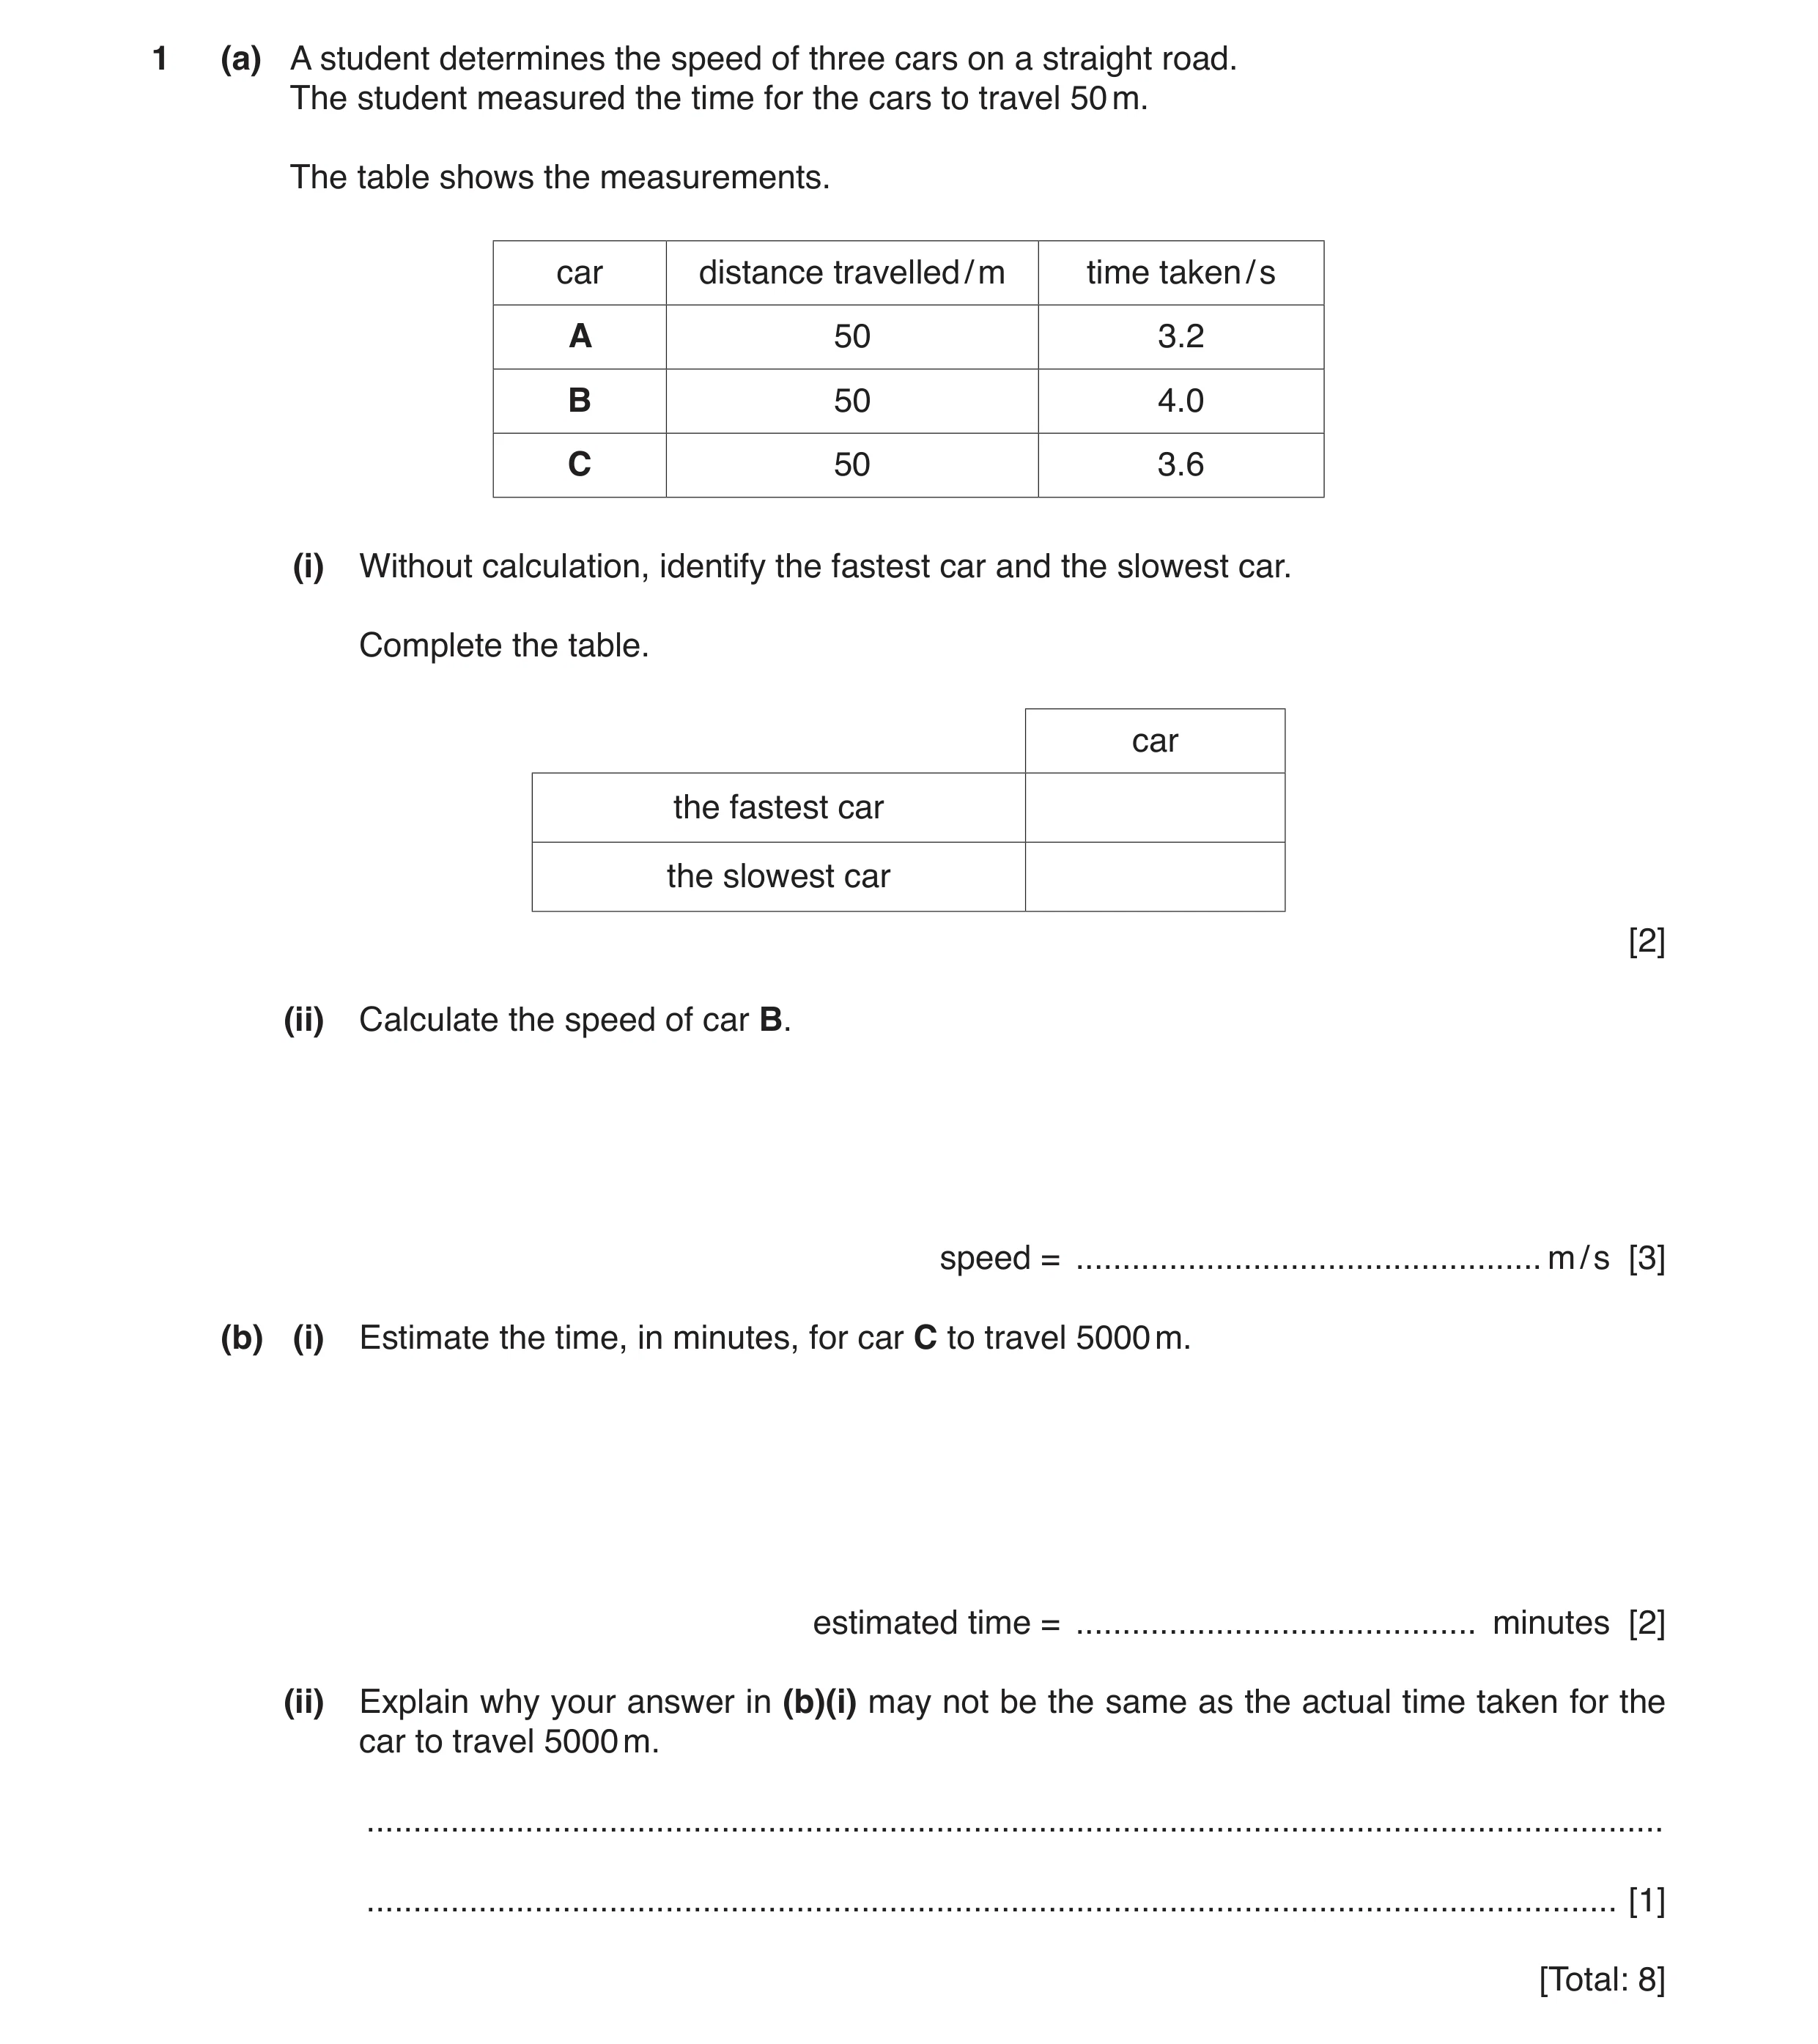 9 / 101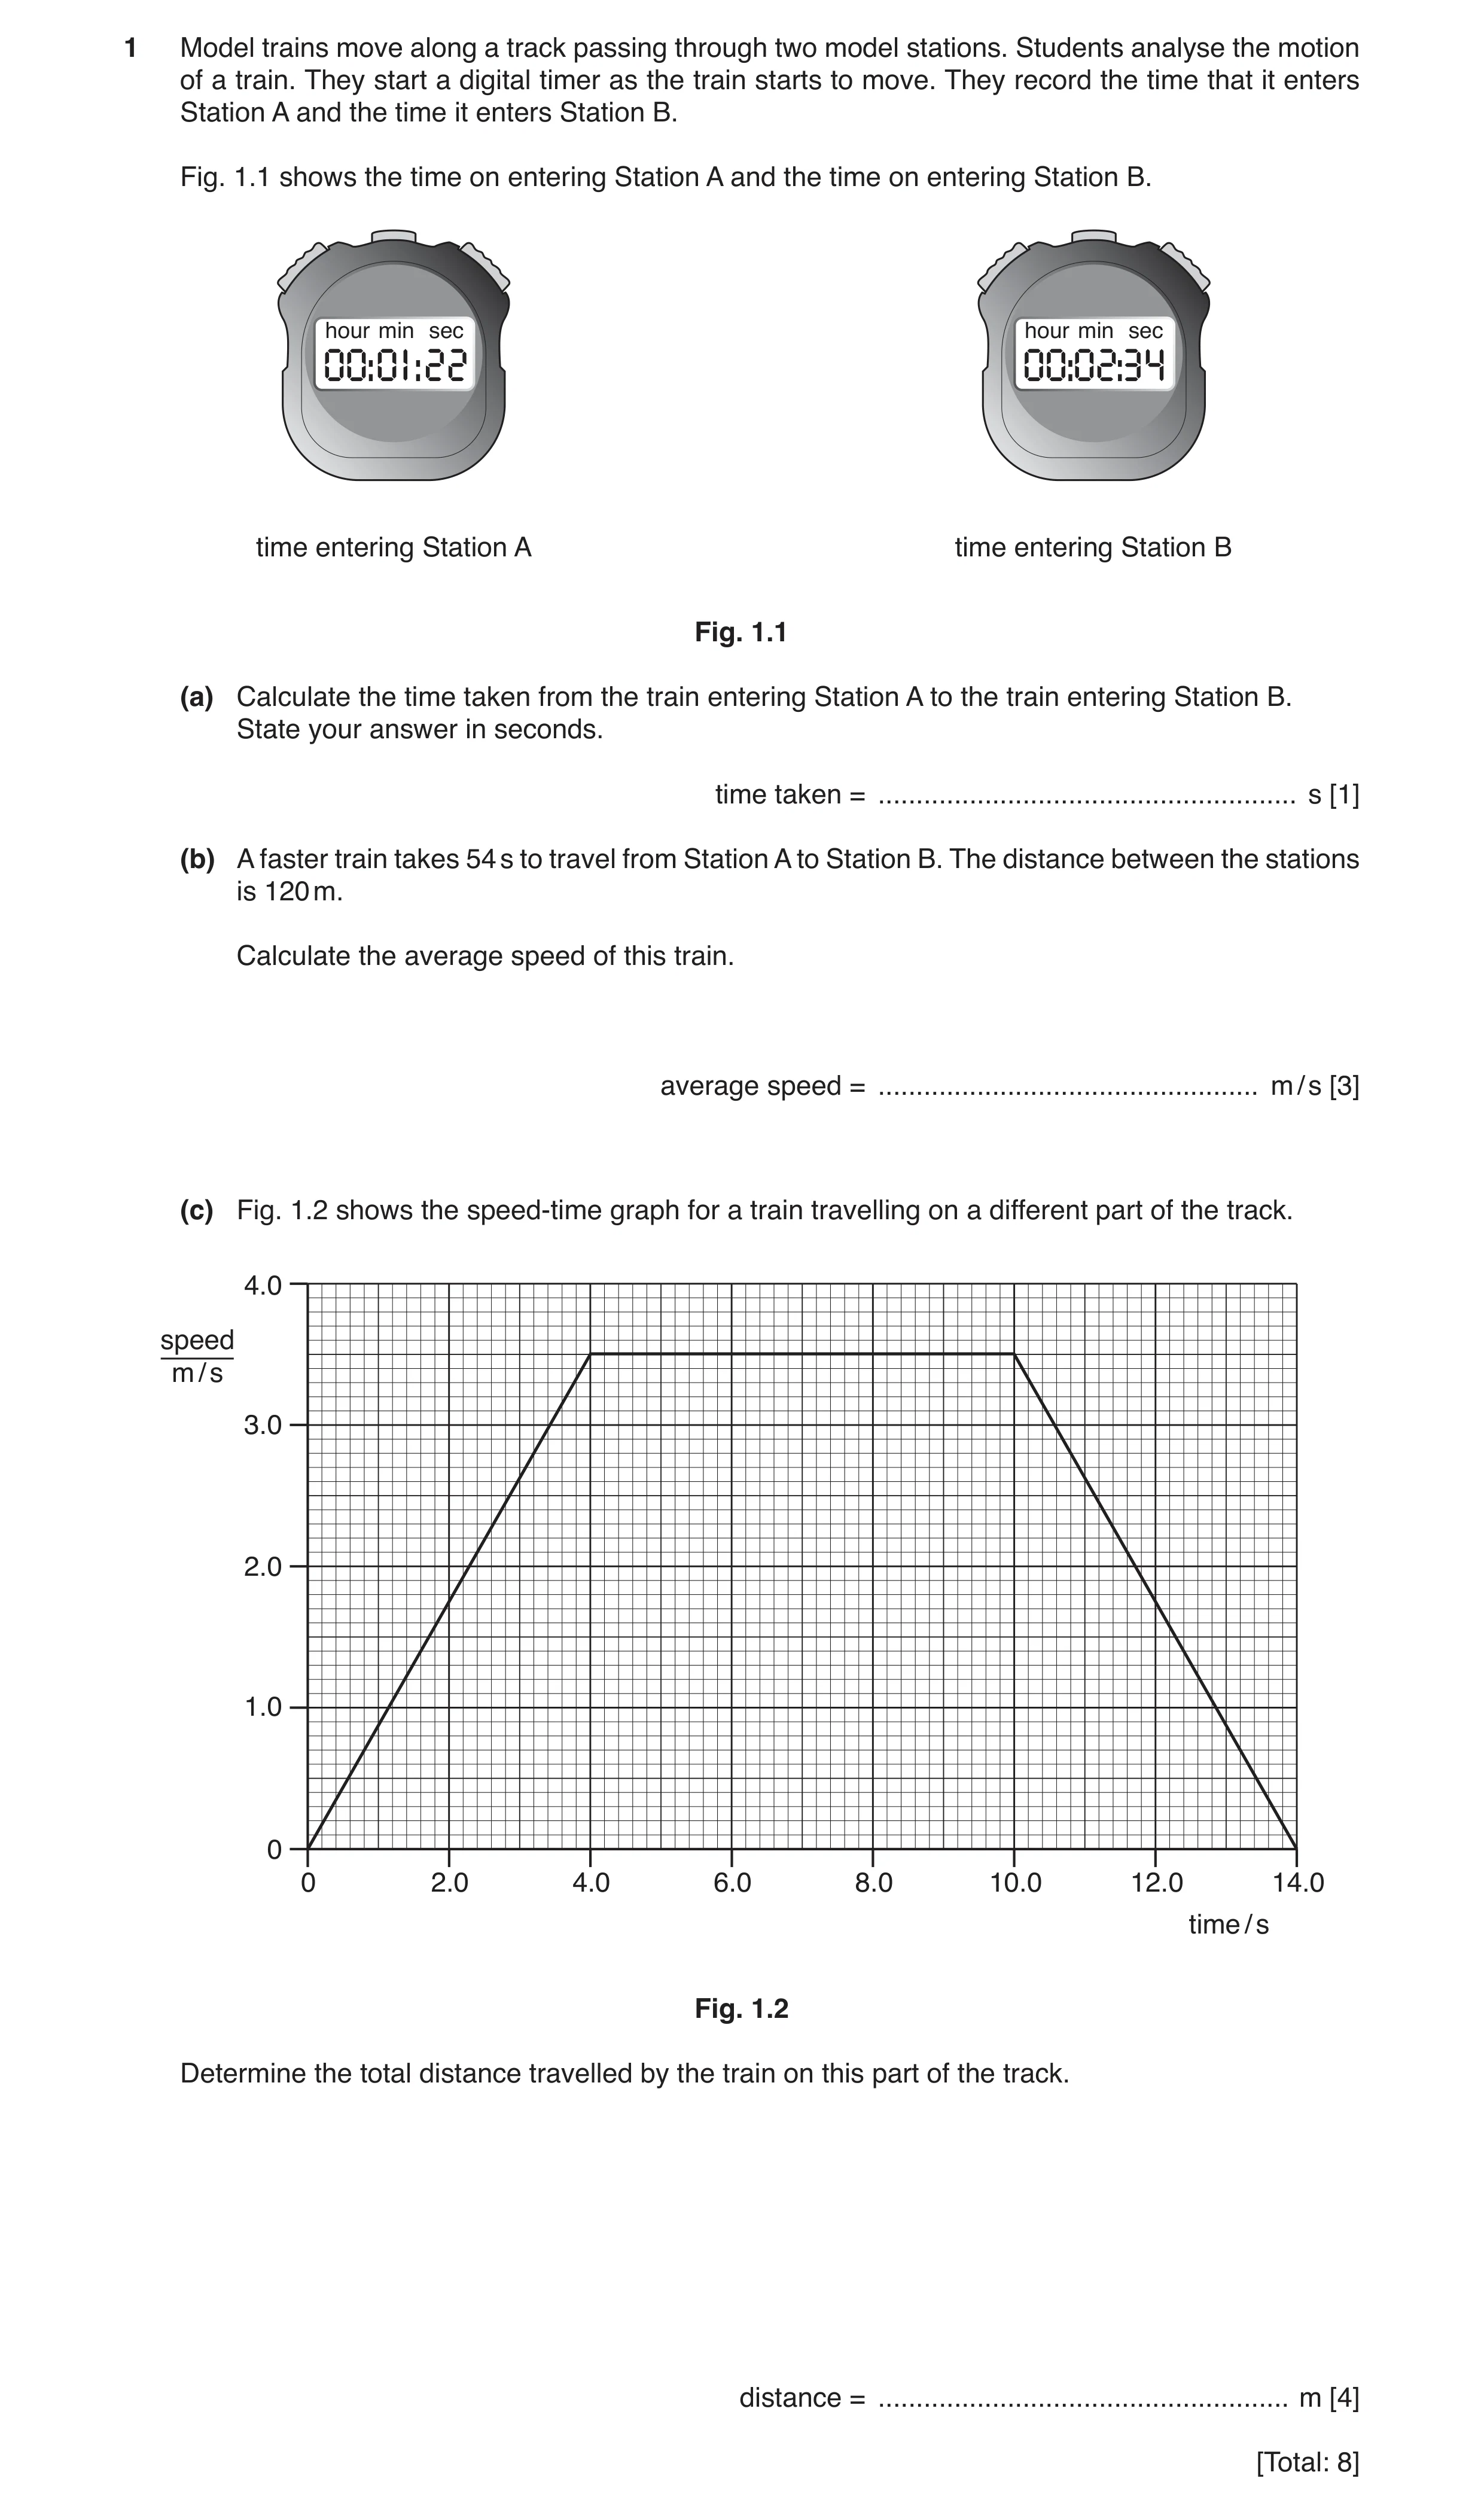
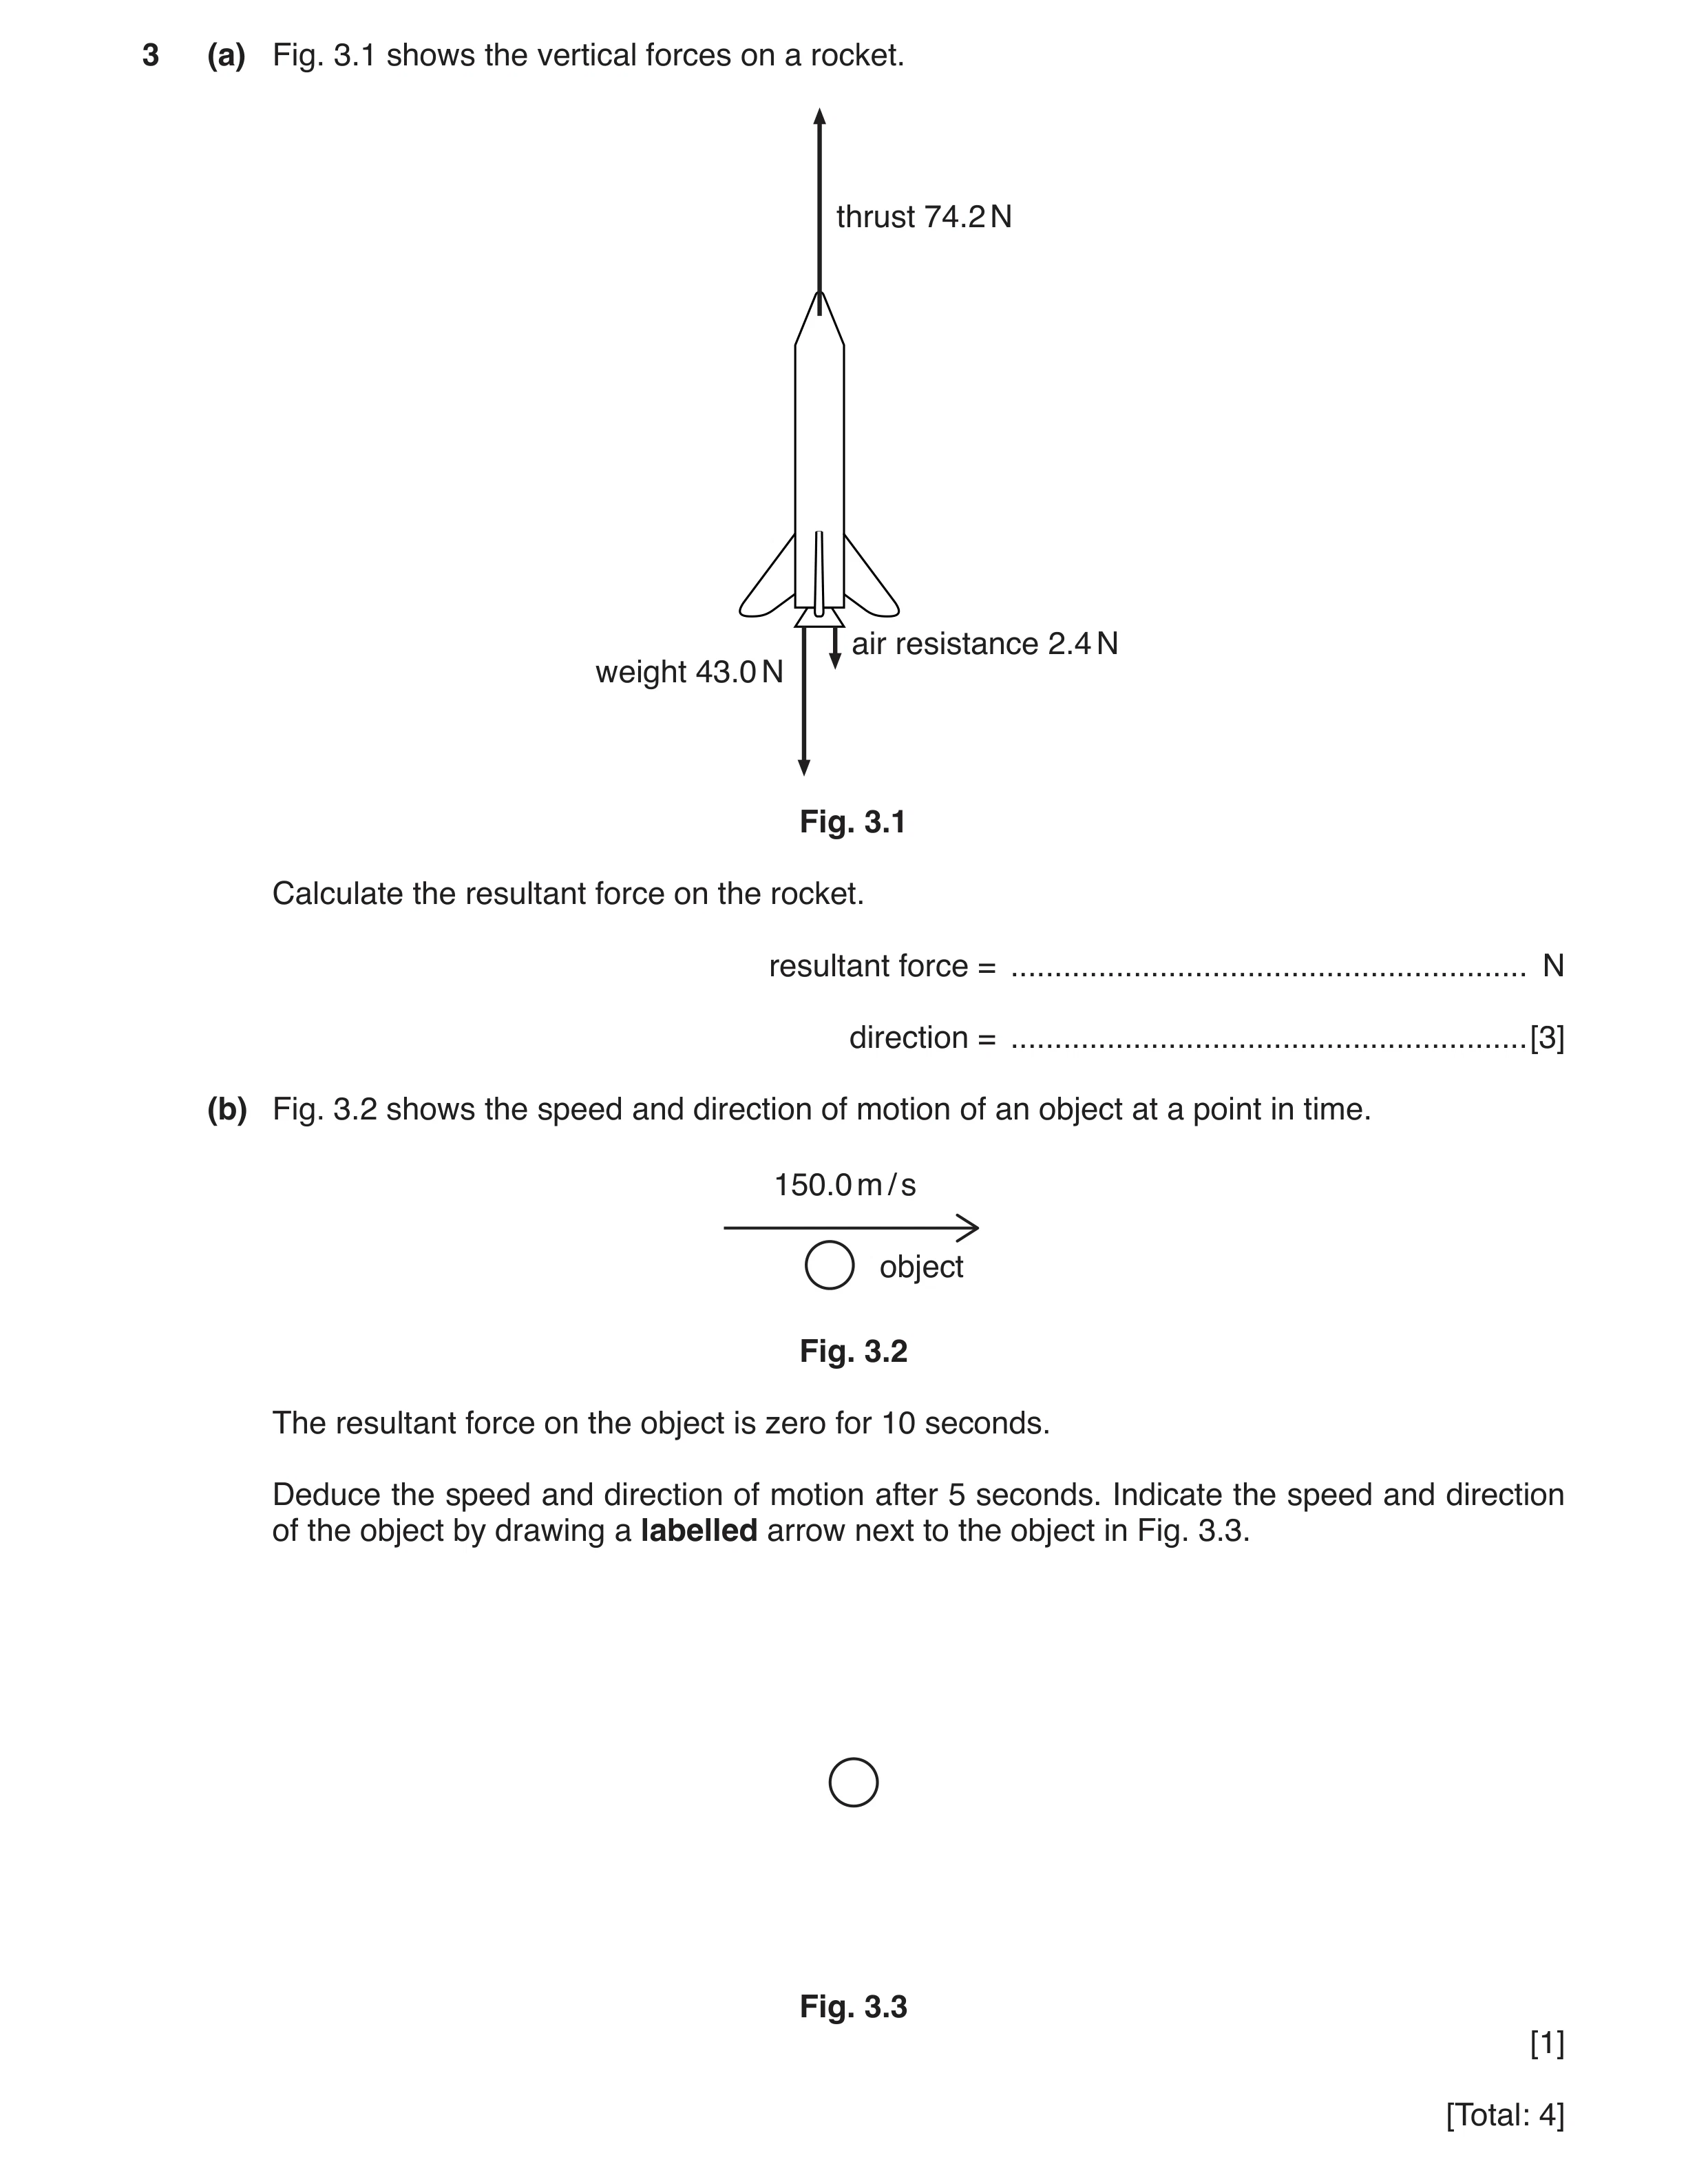 12 / 101
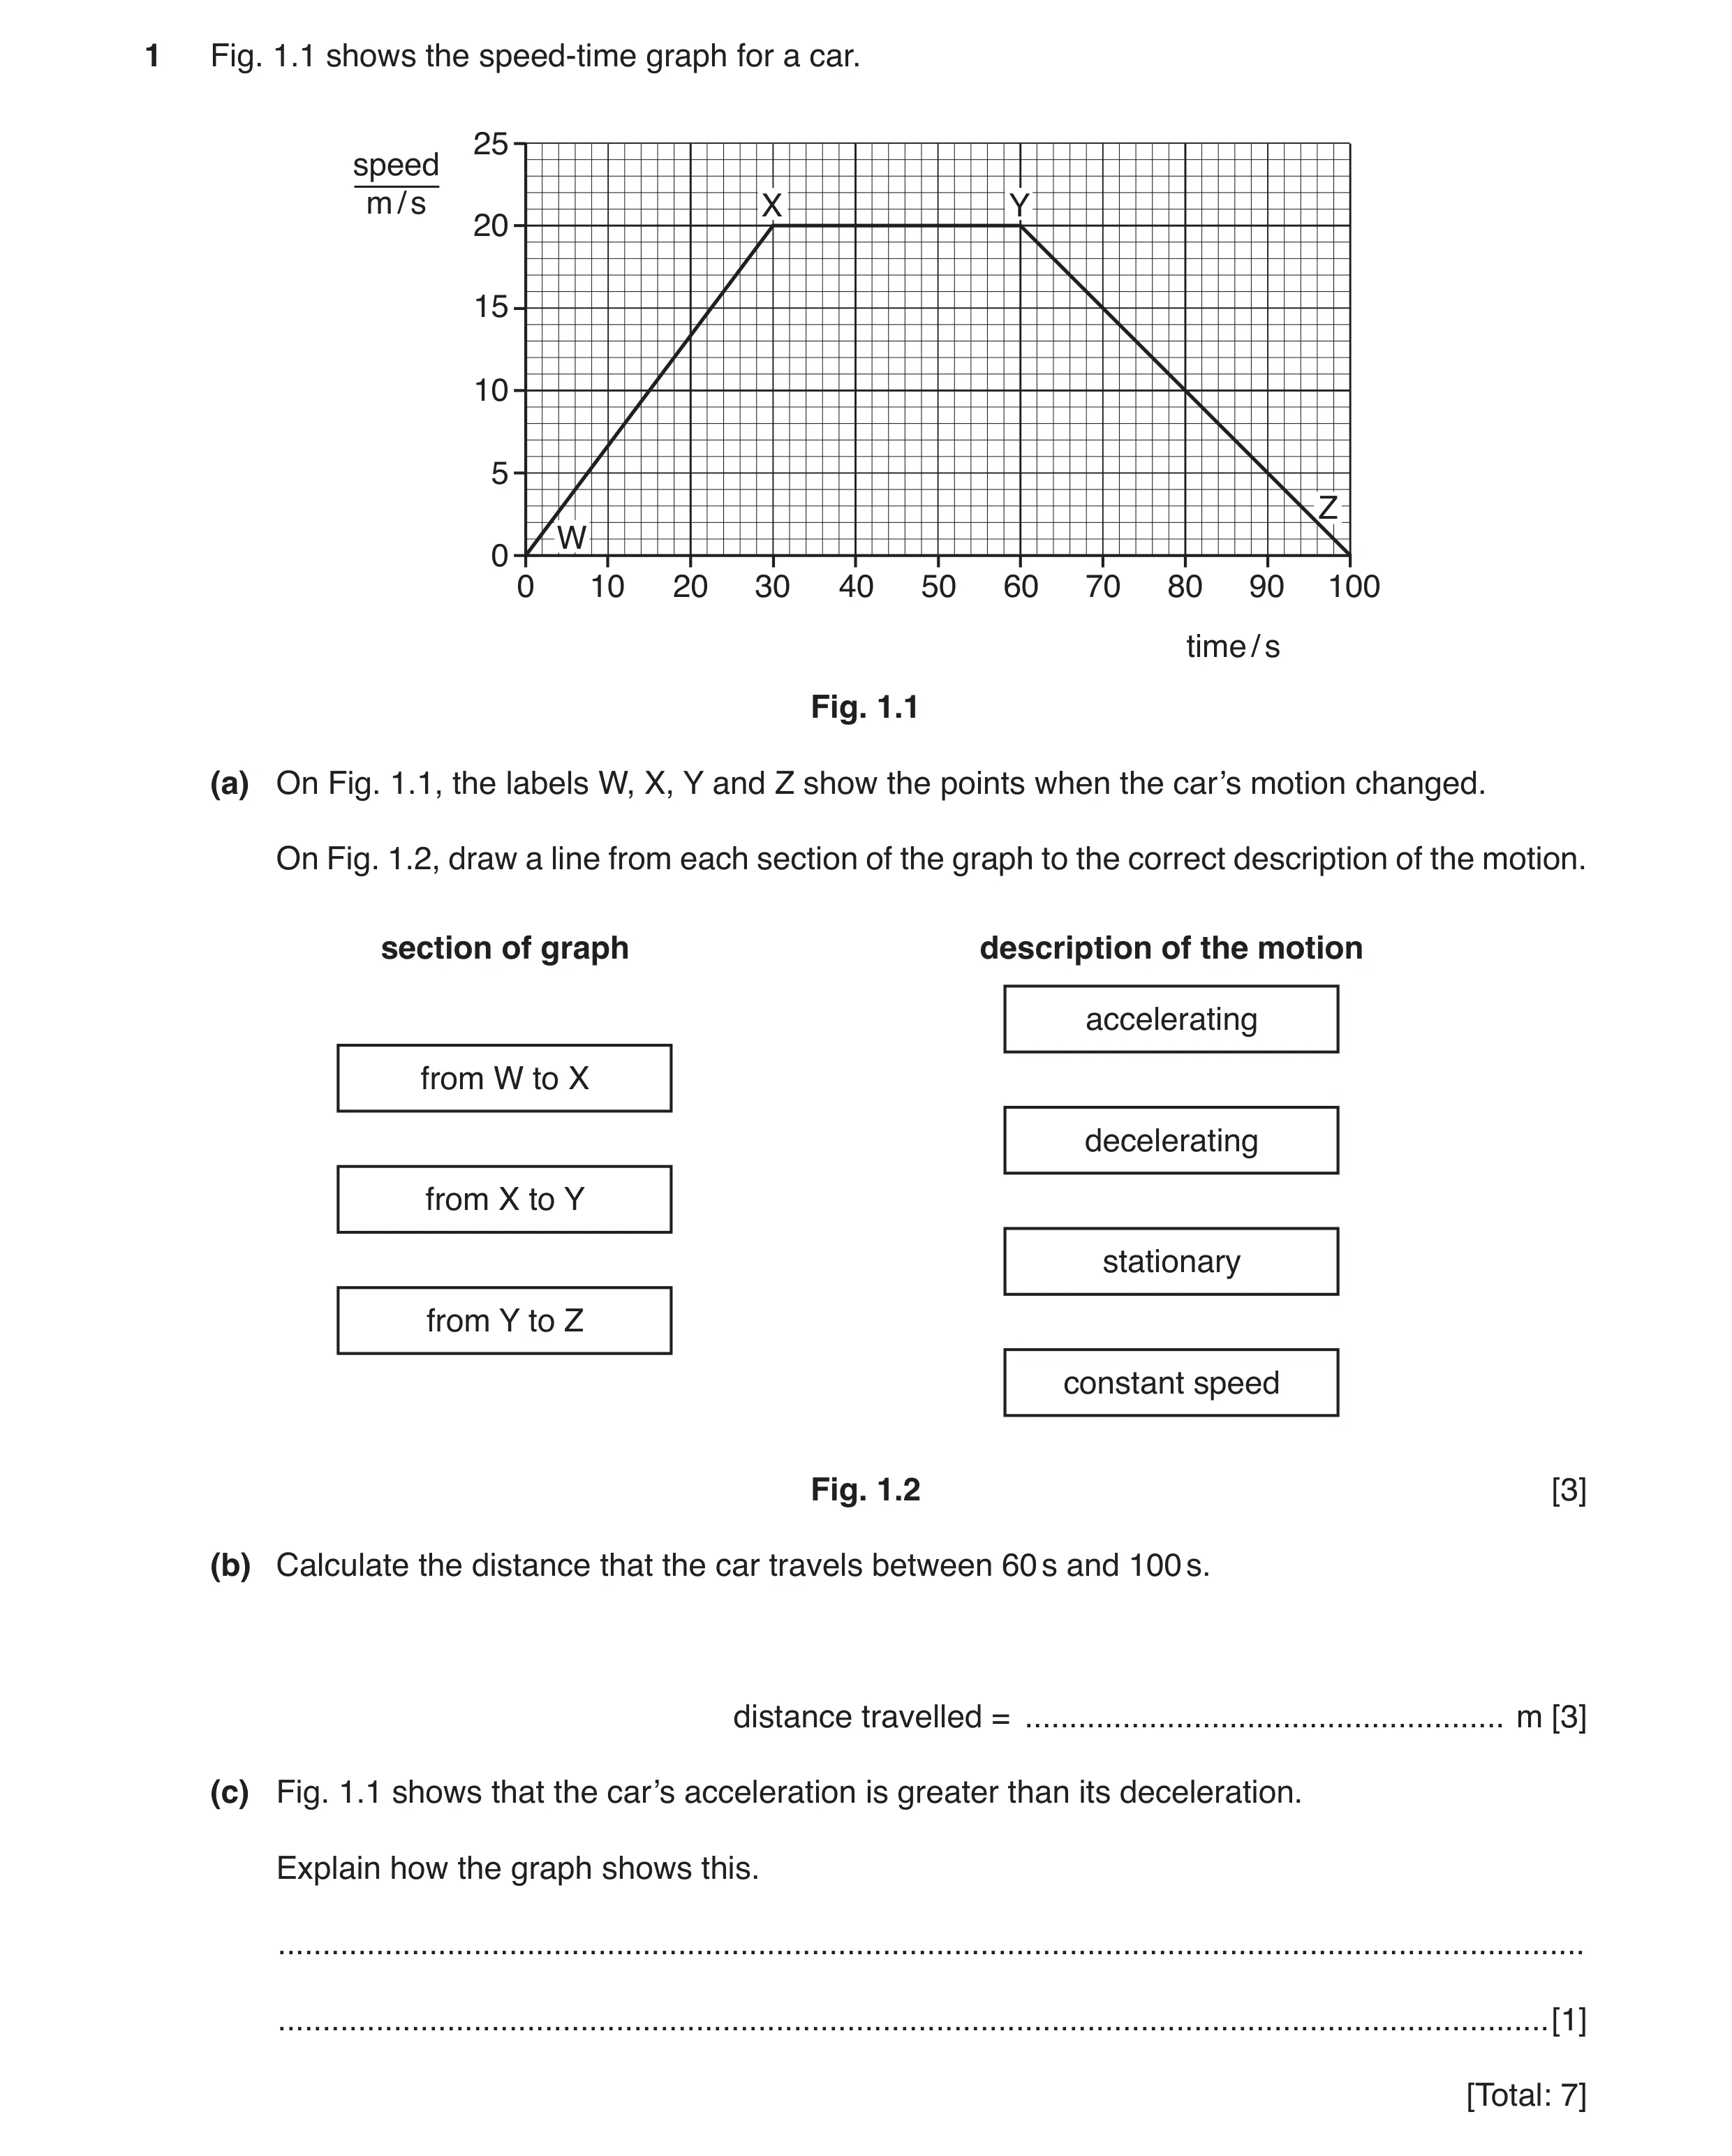 13 / 101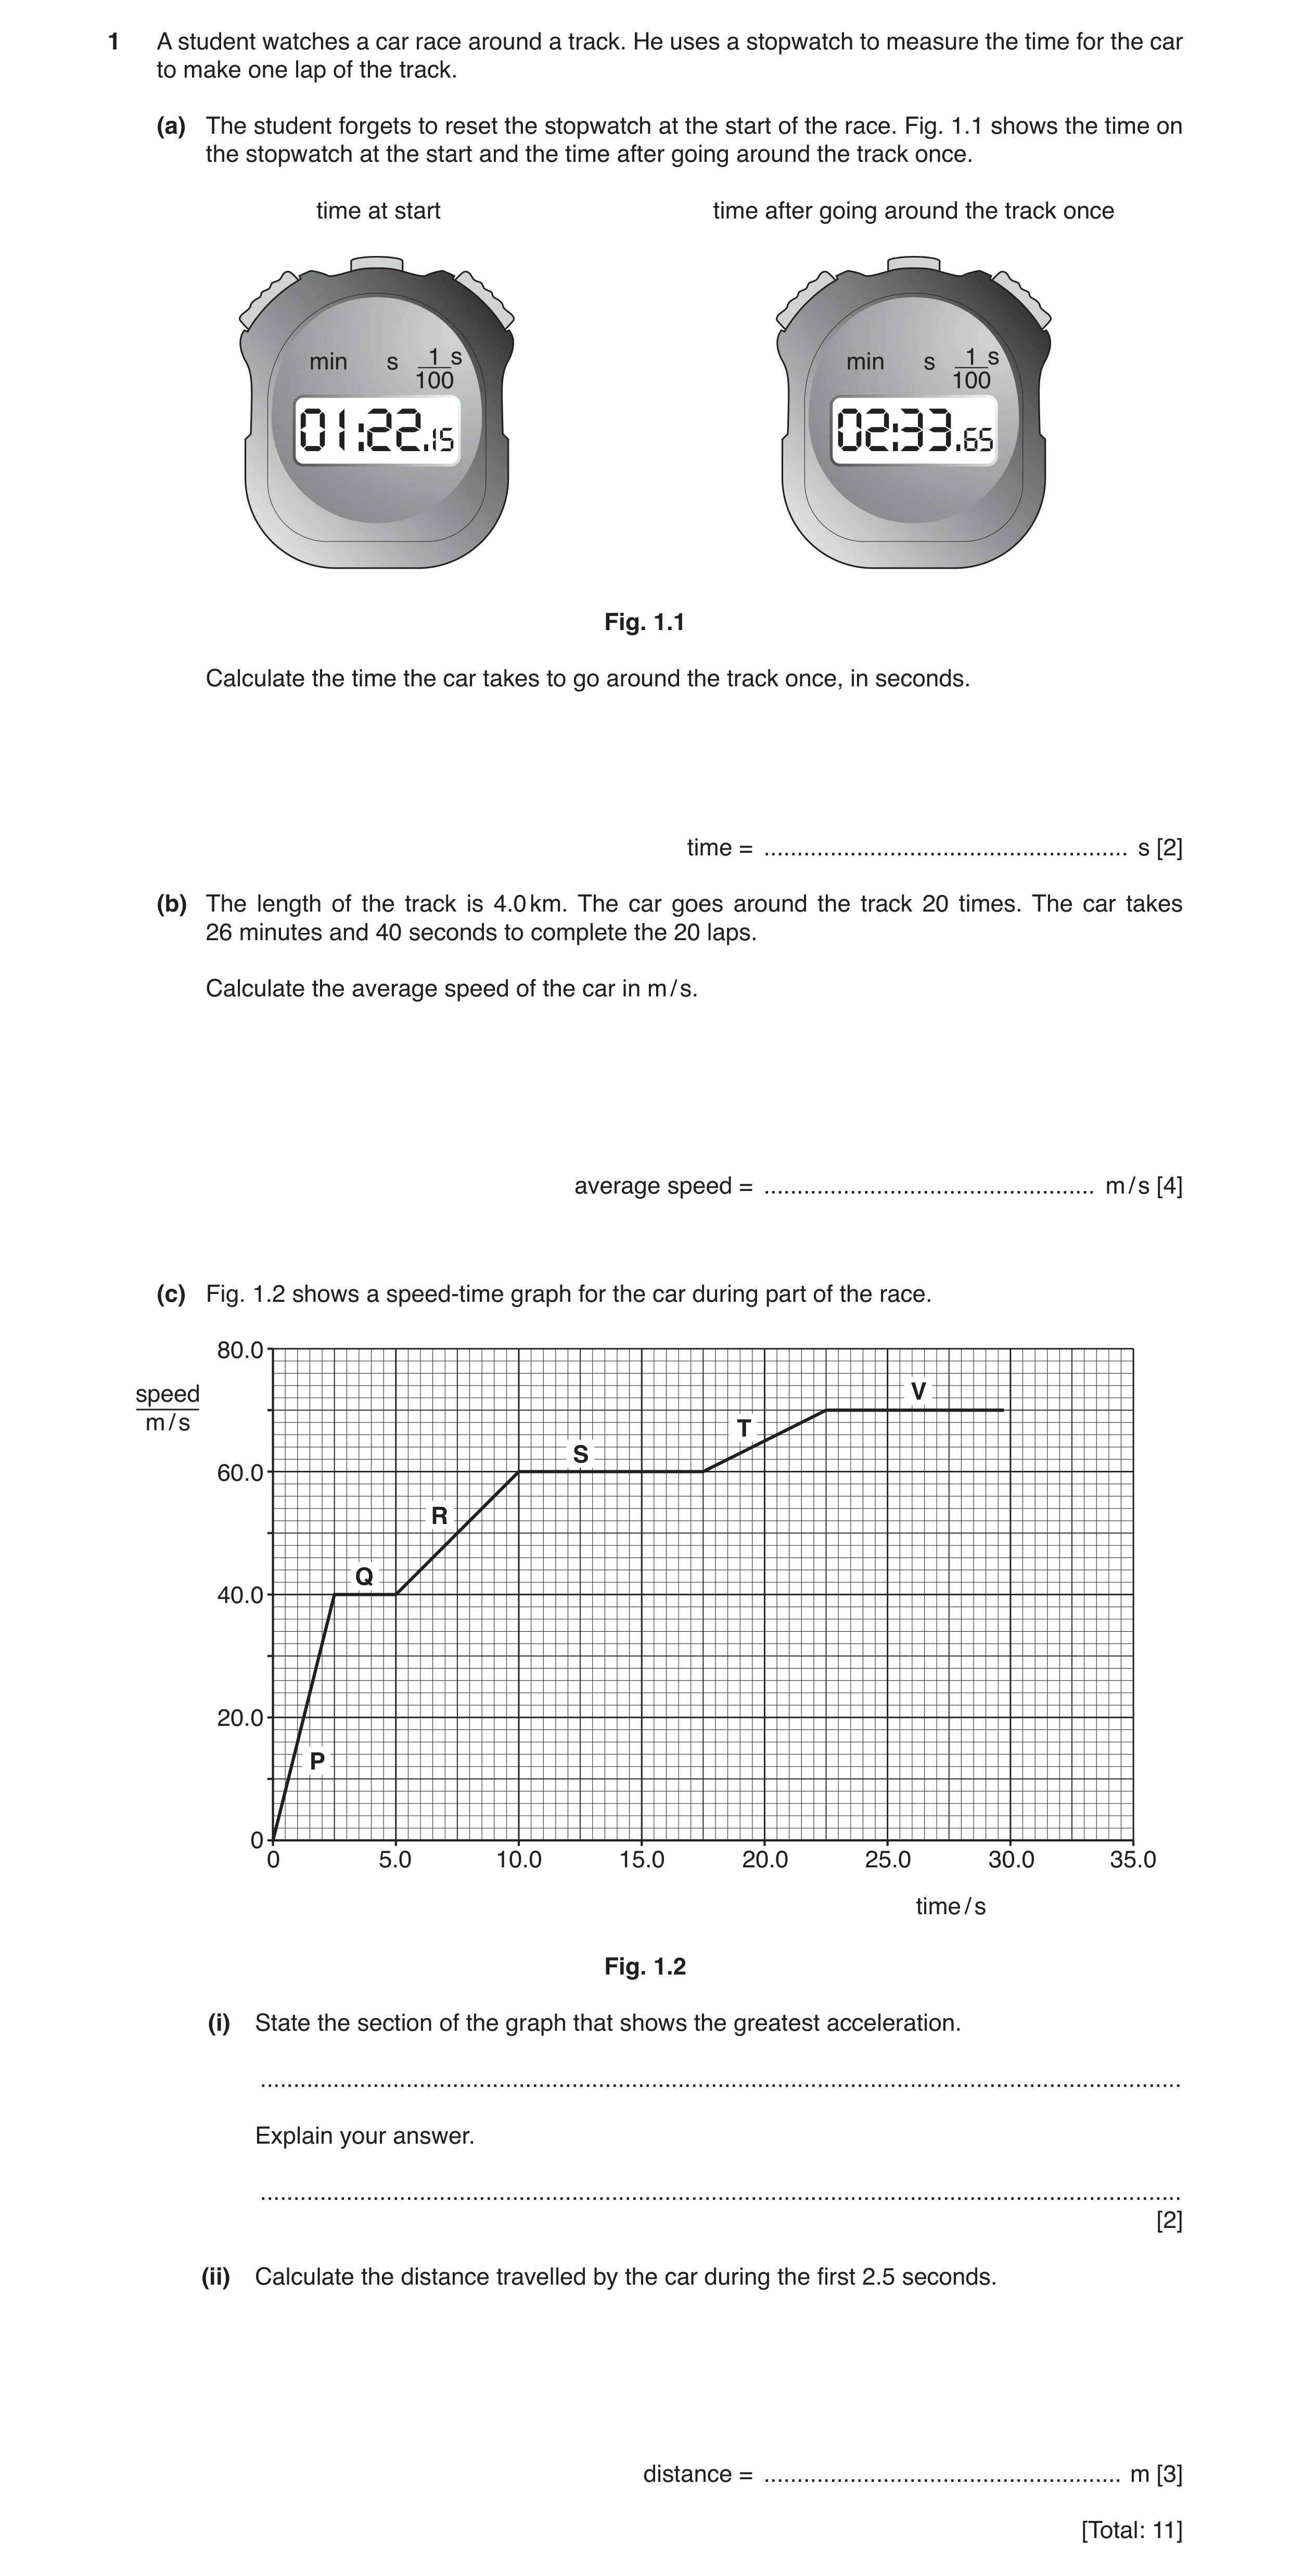
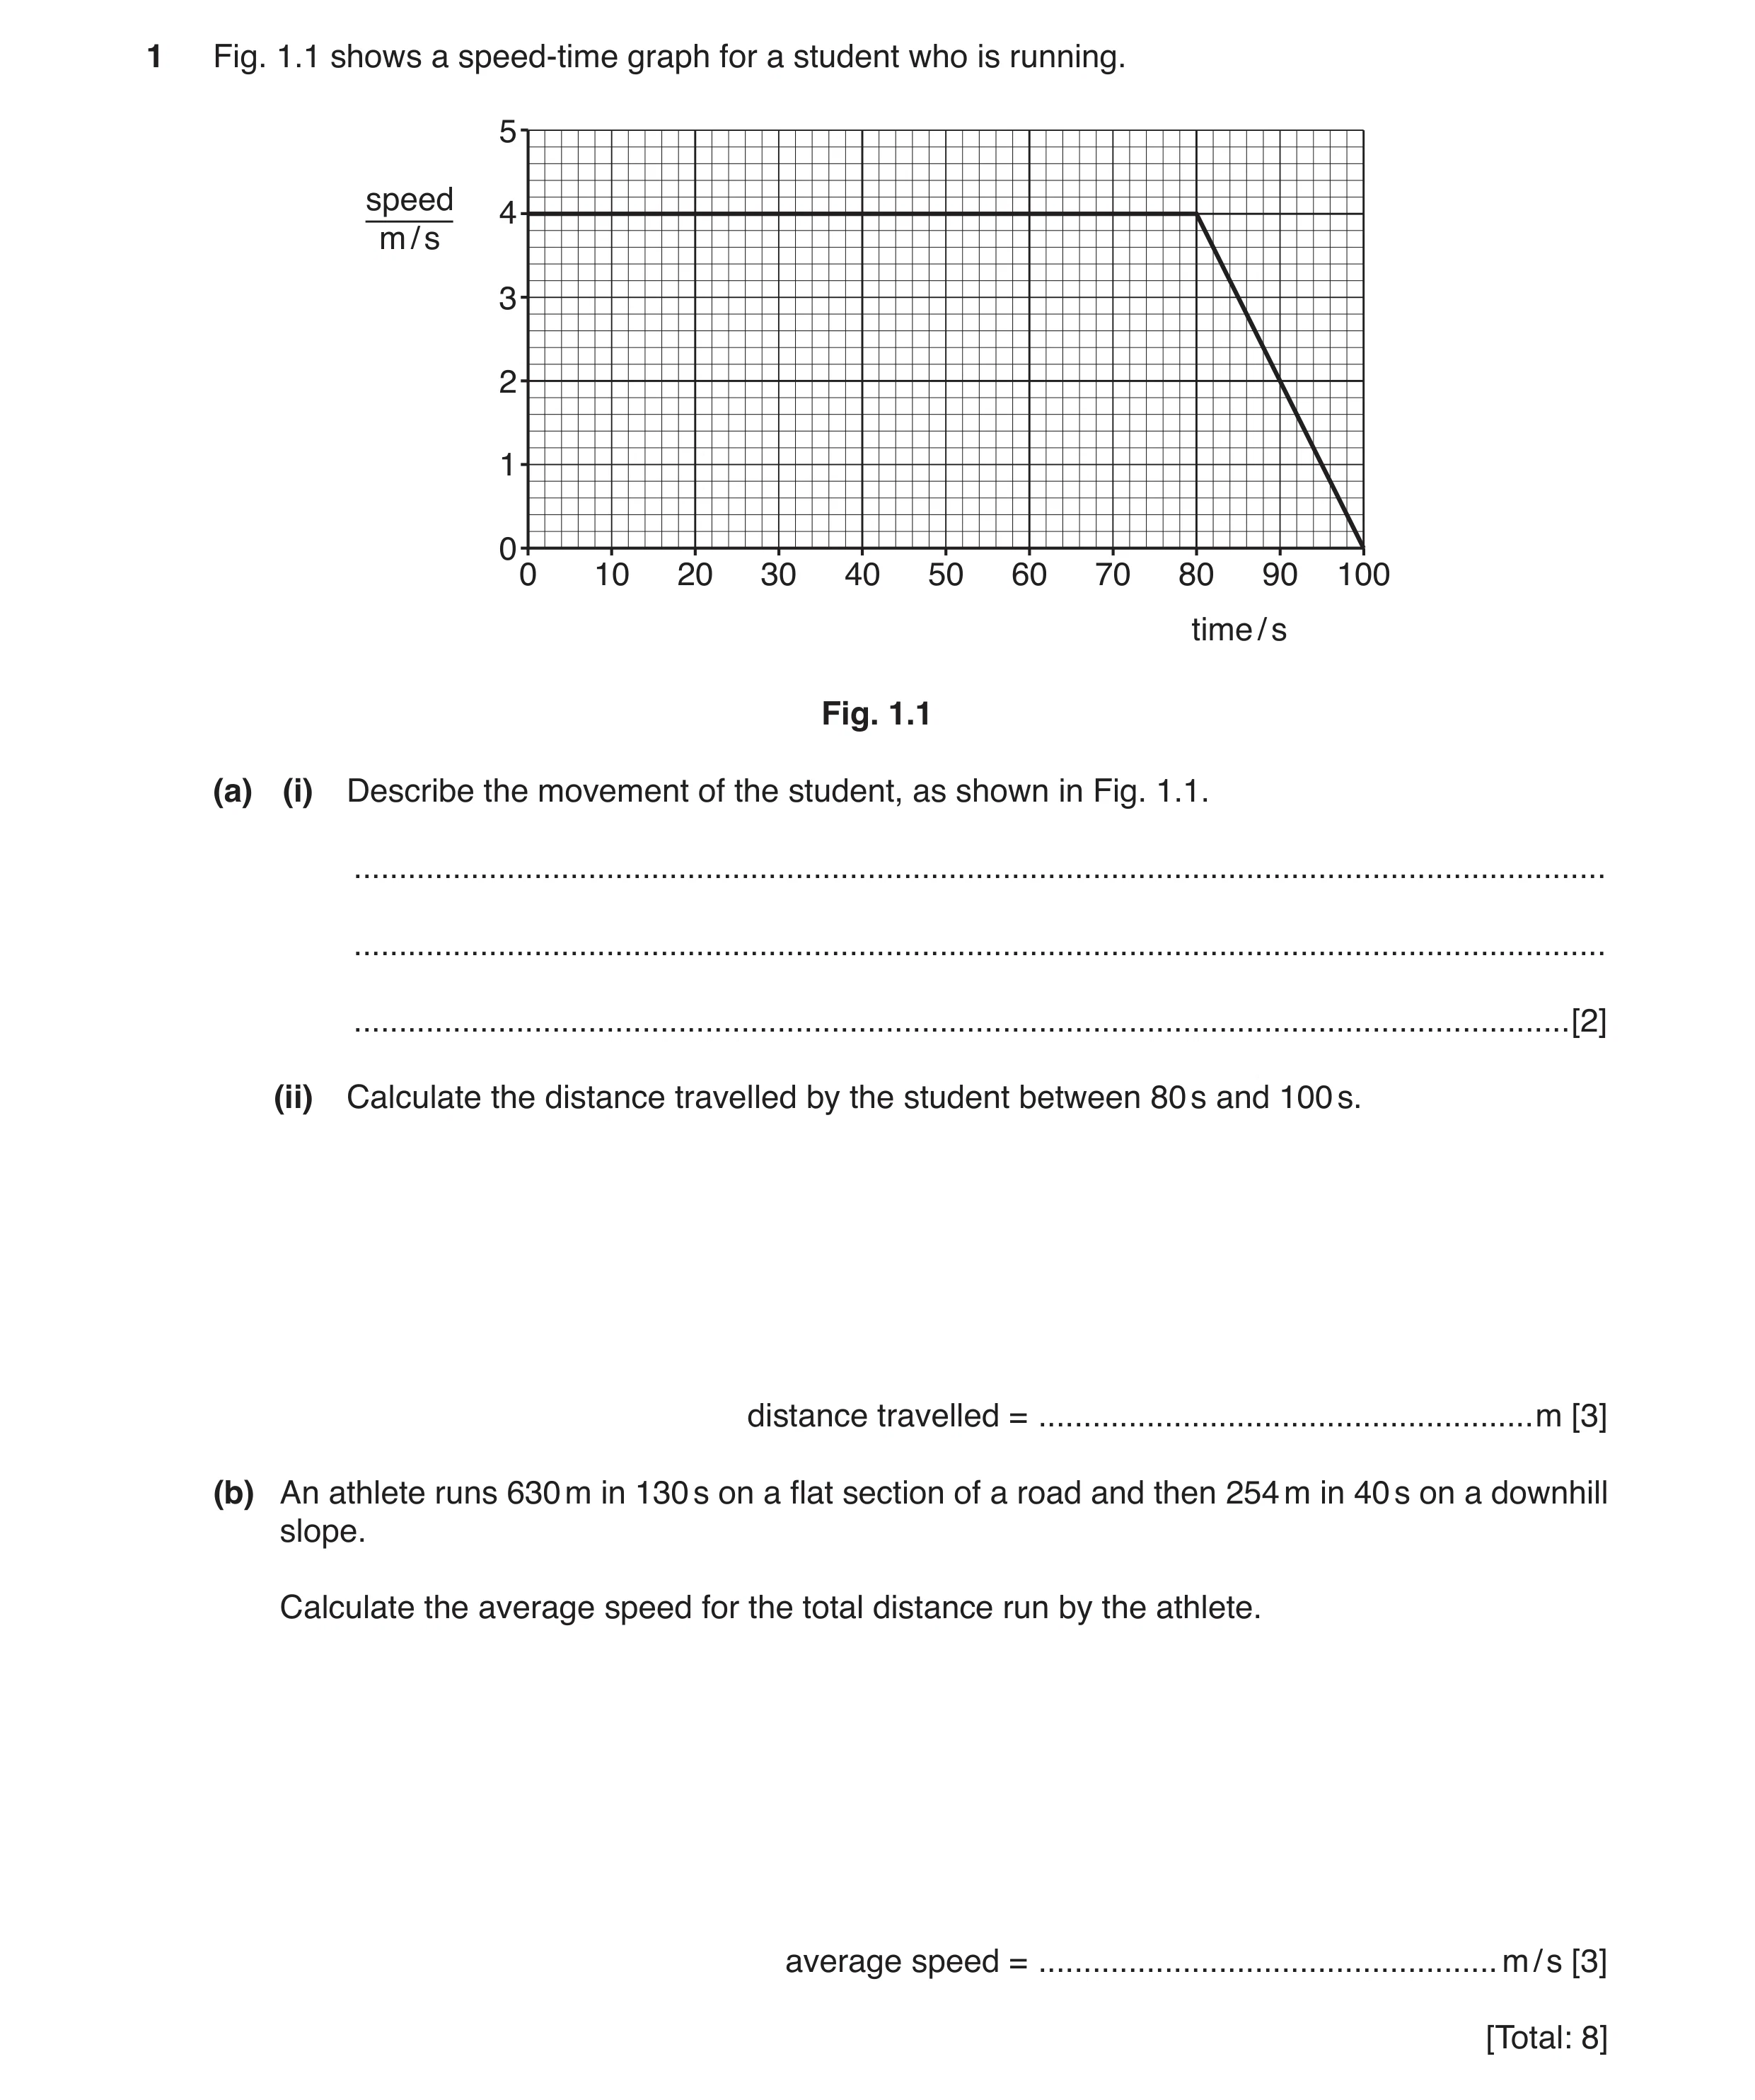 16 / 101
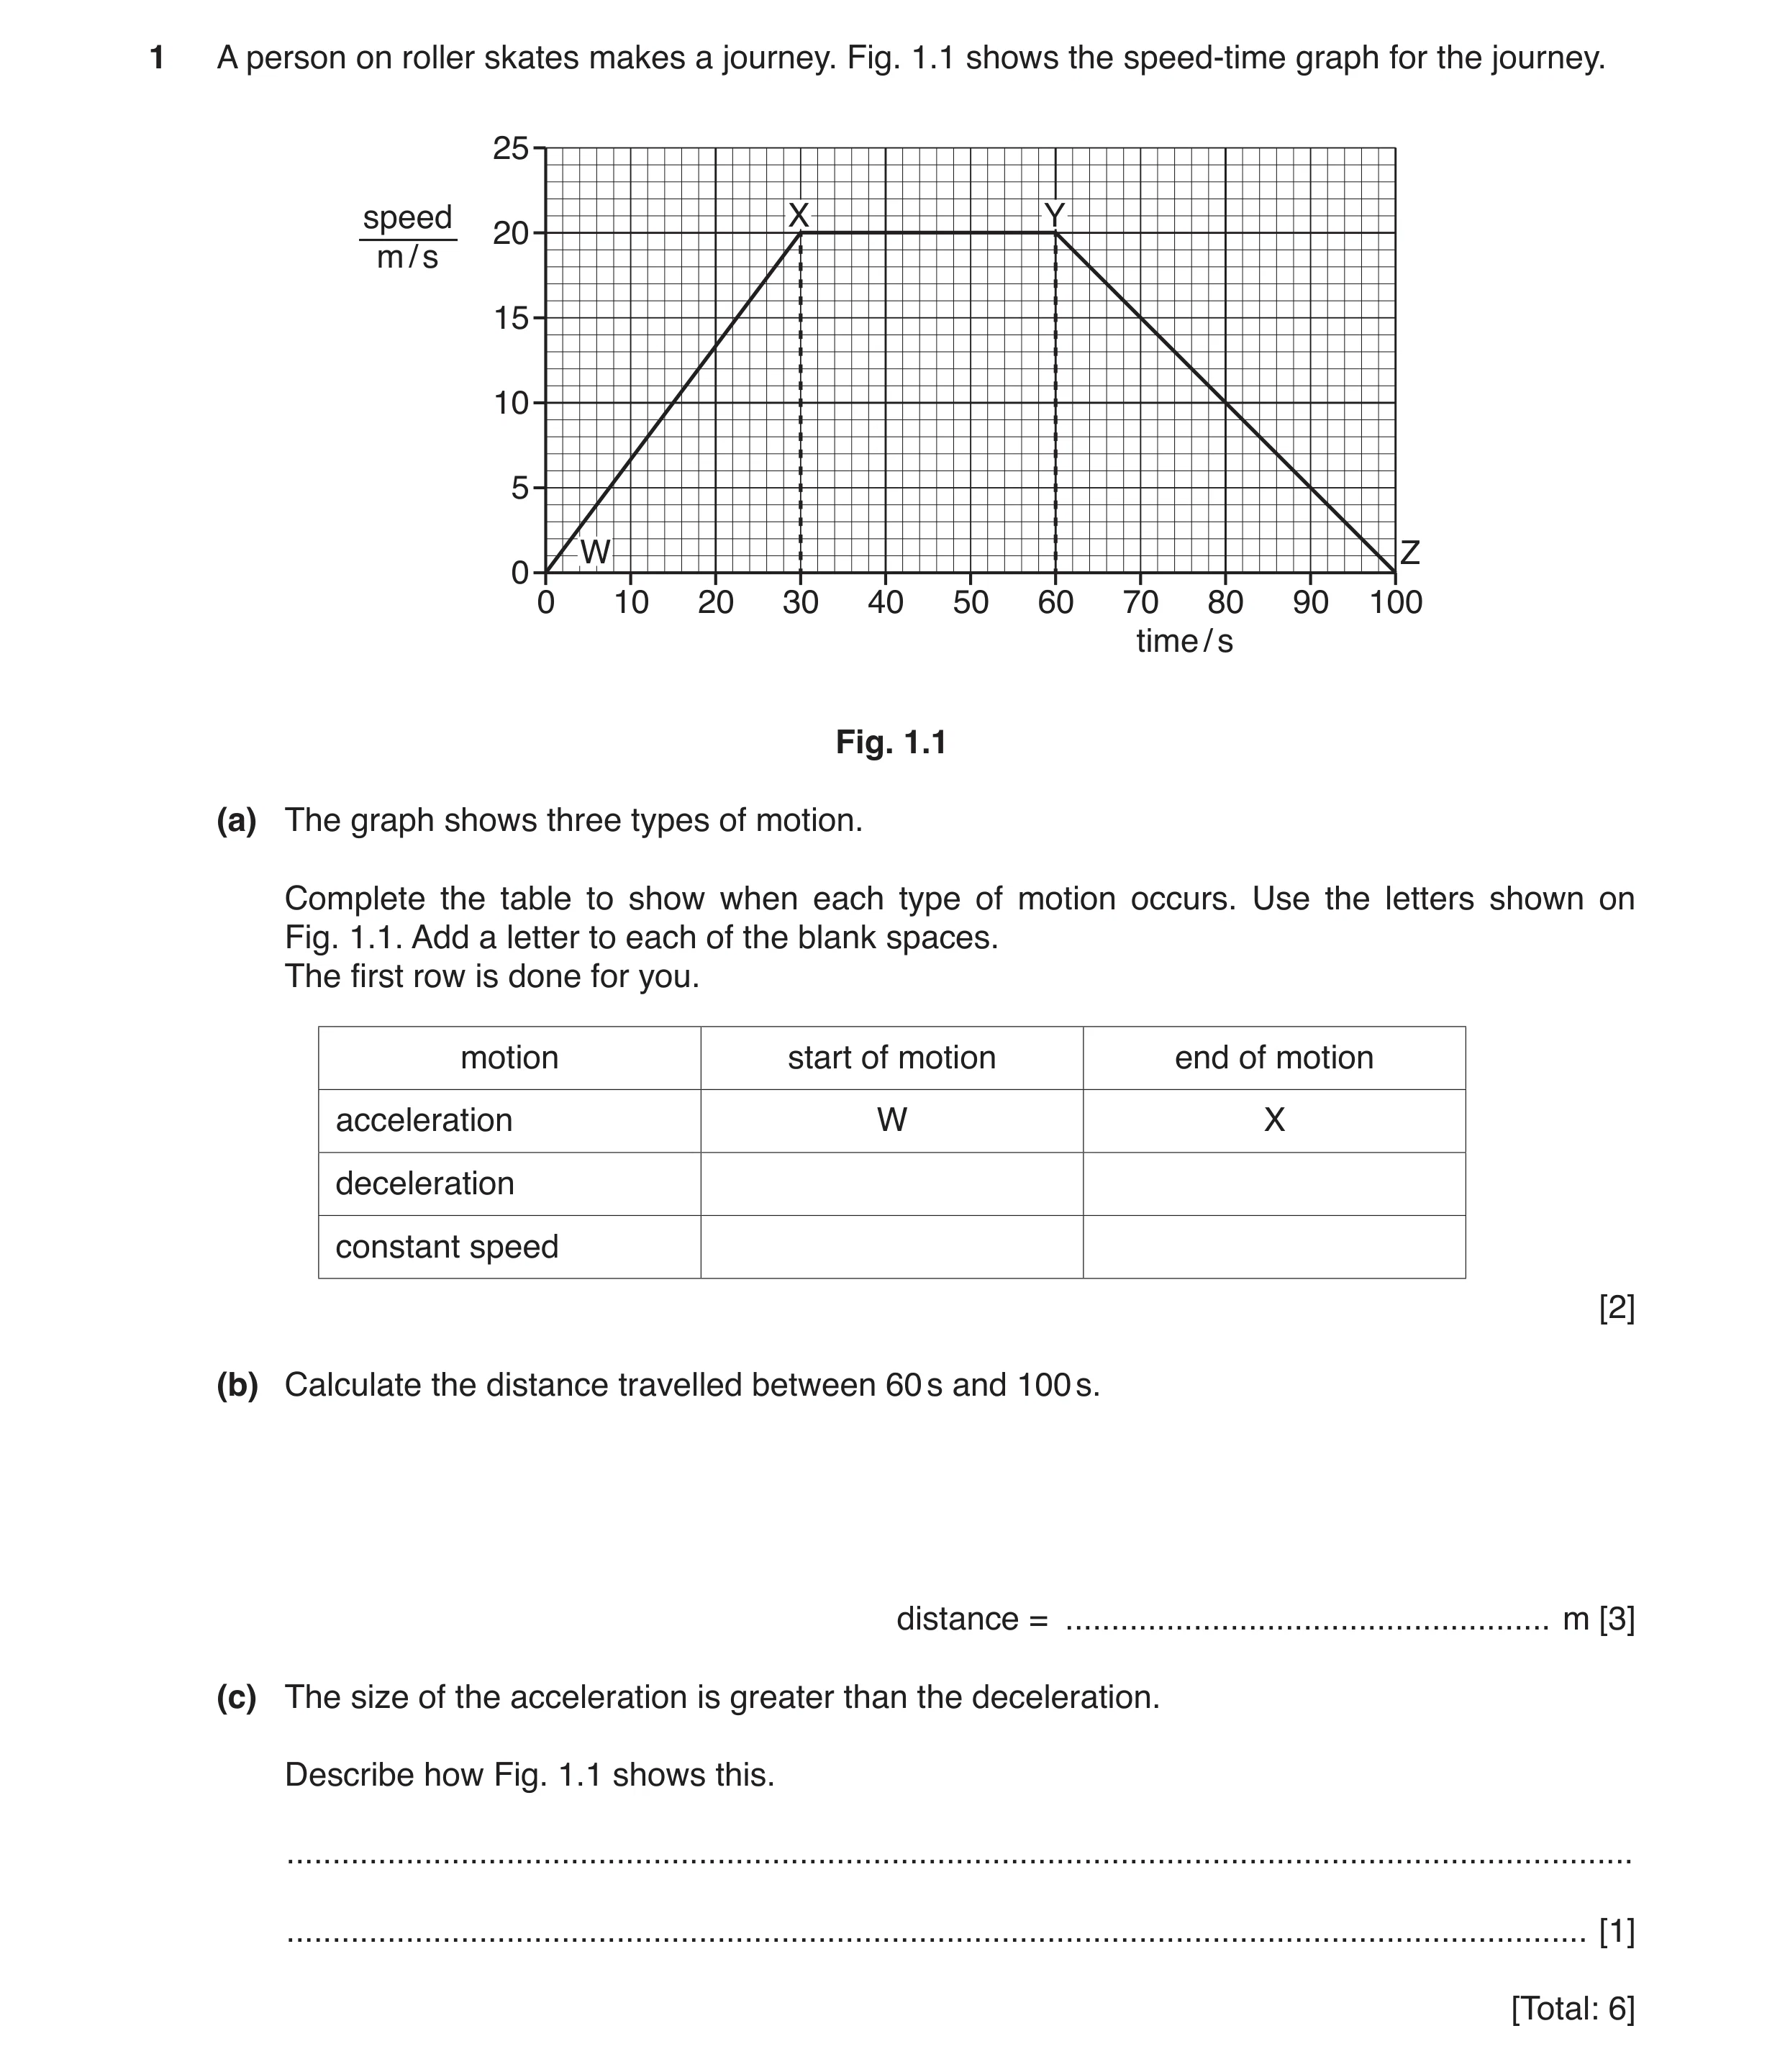 17 / 101
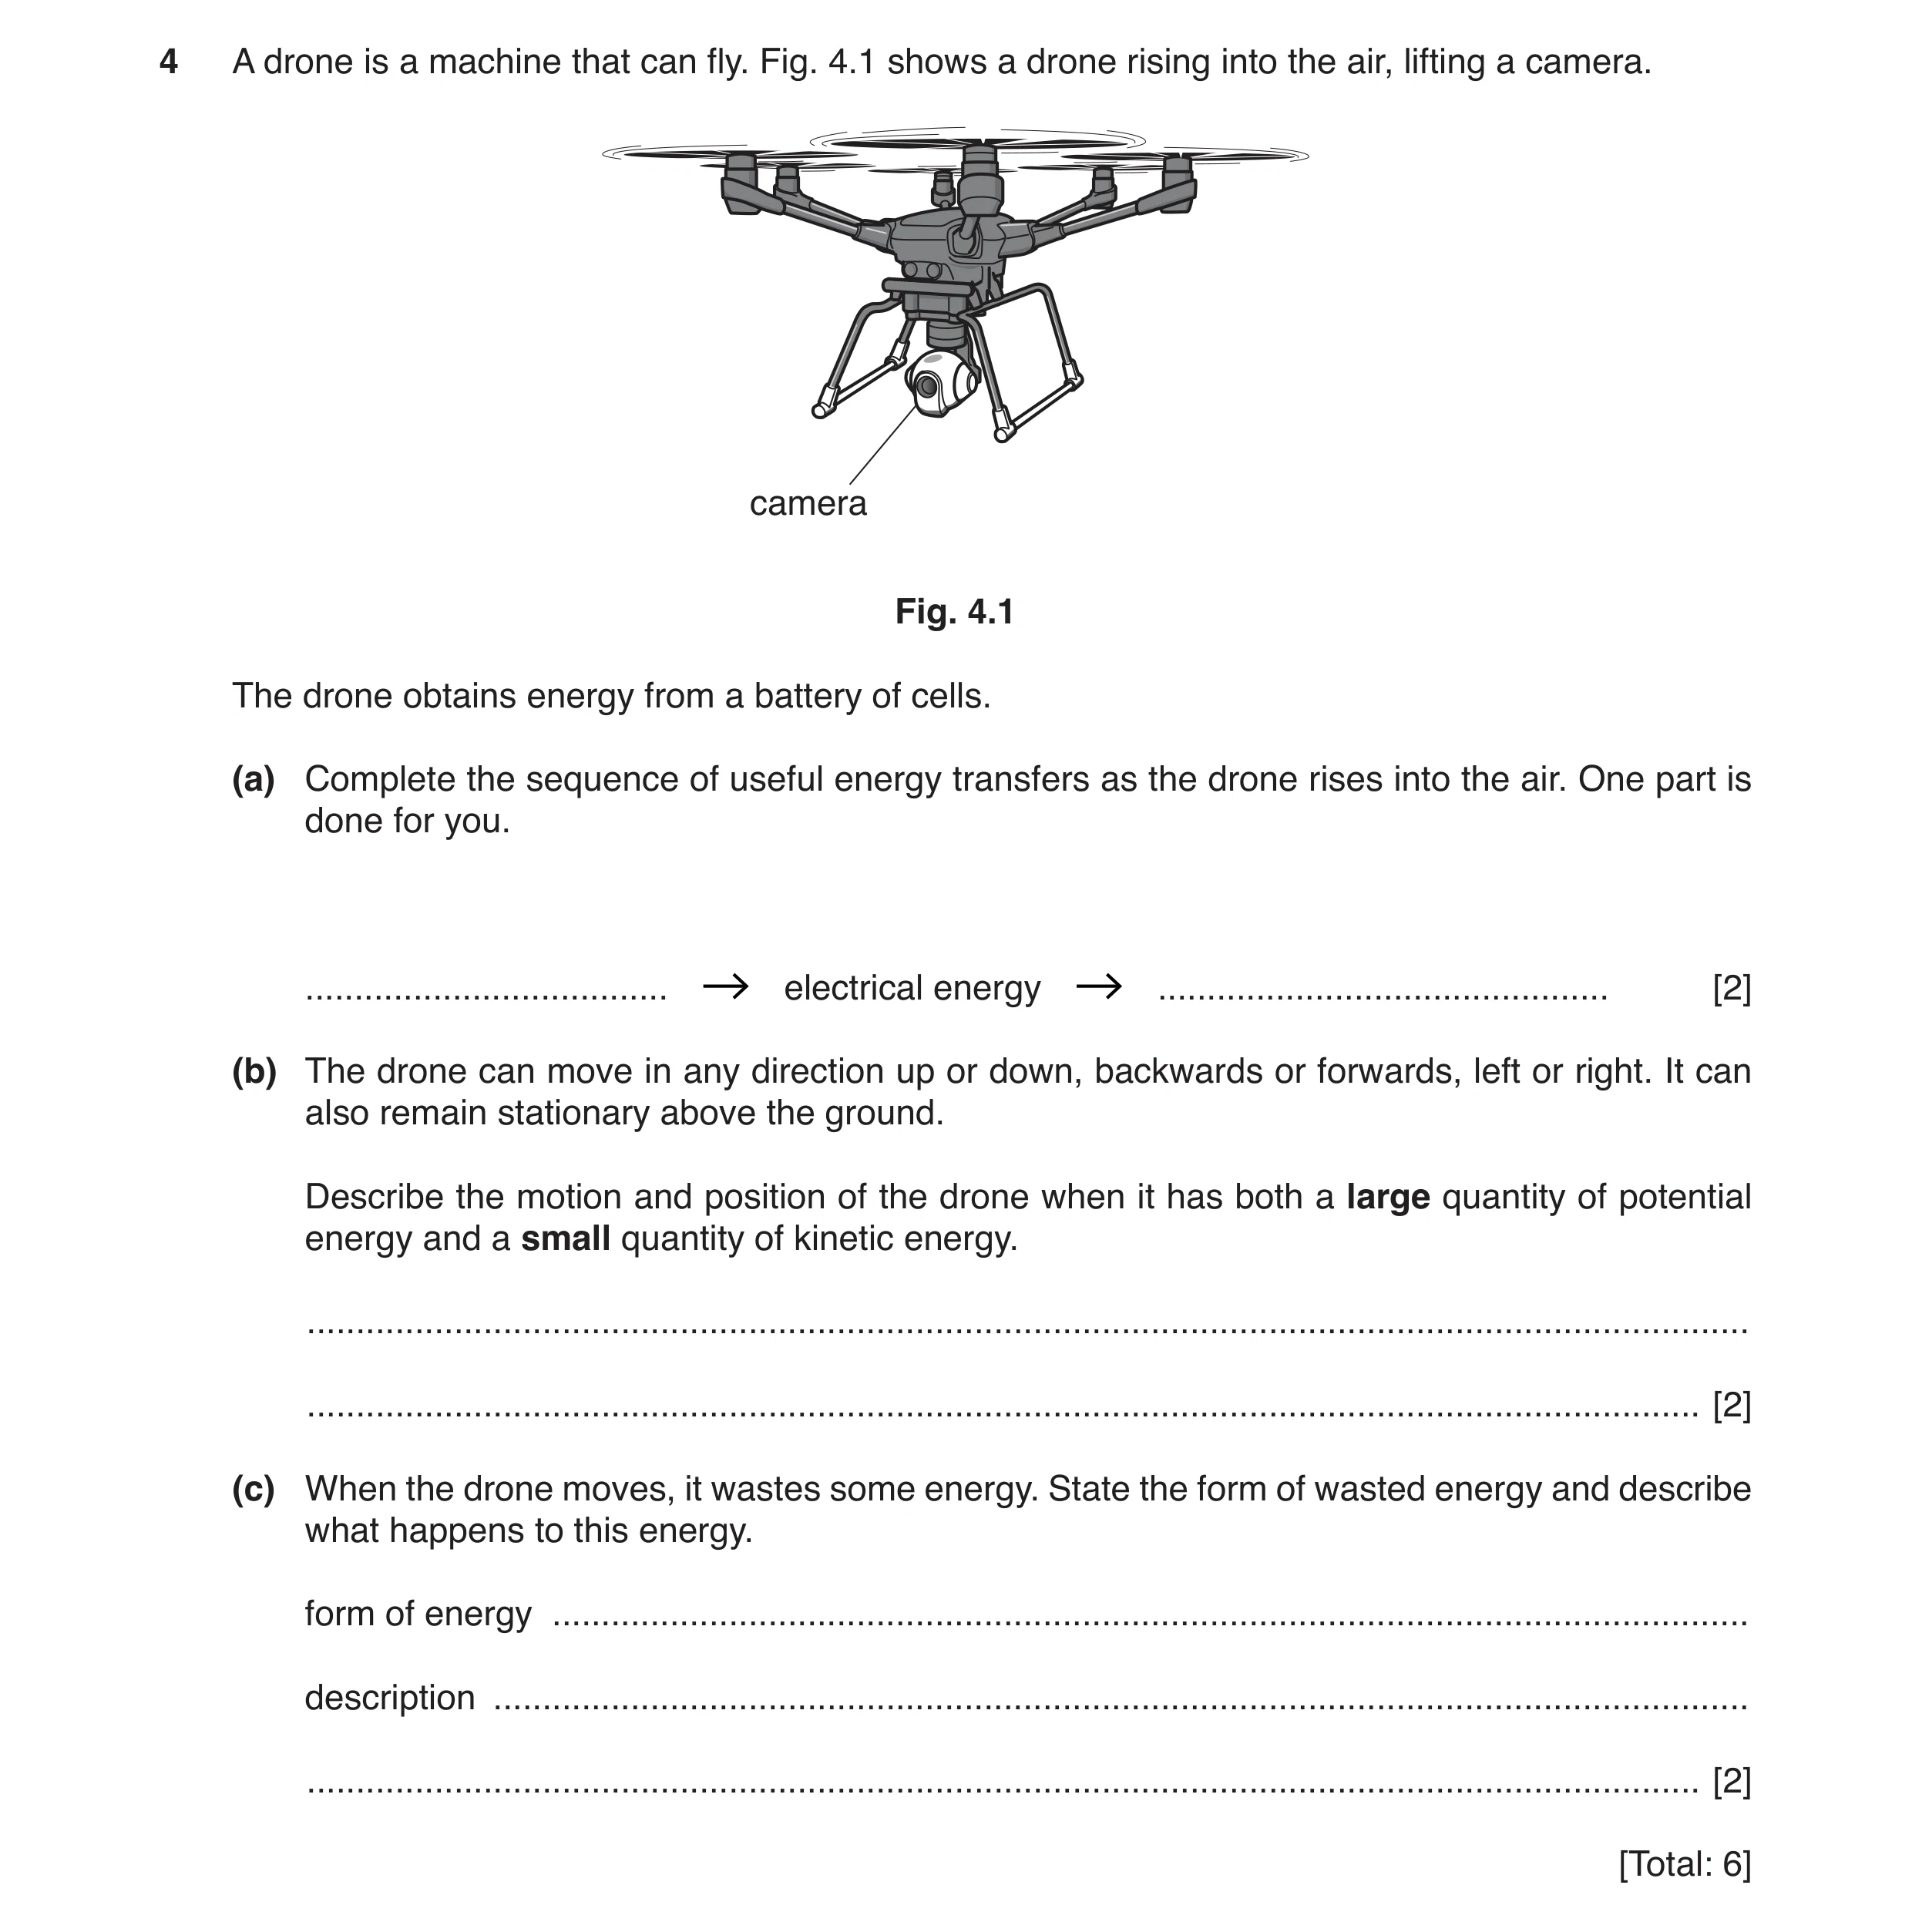 18 / 101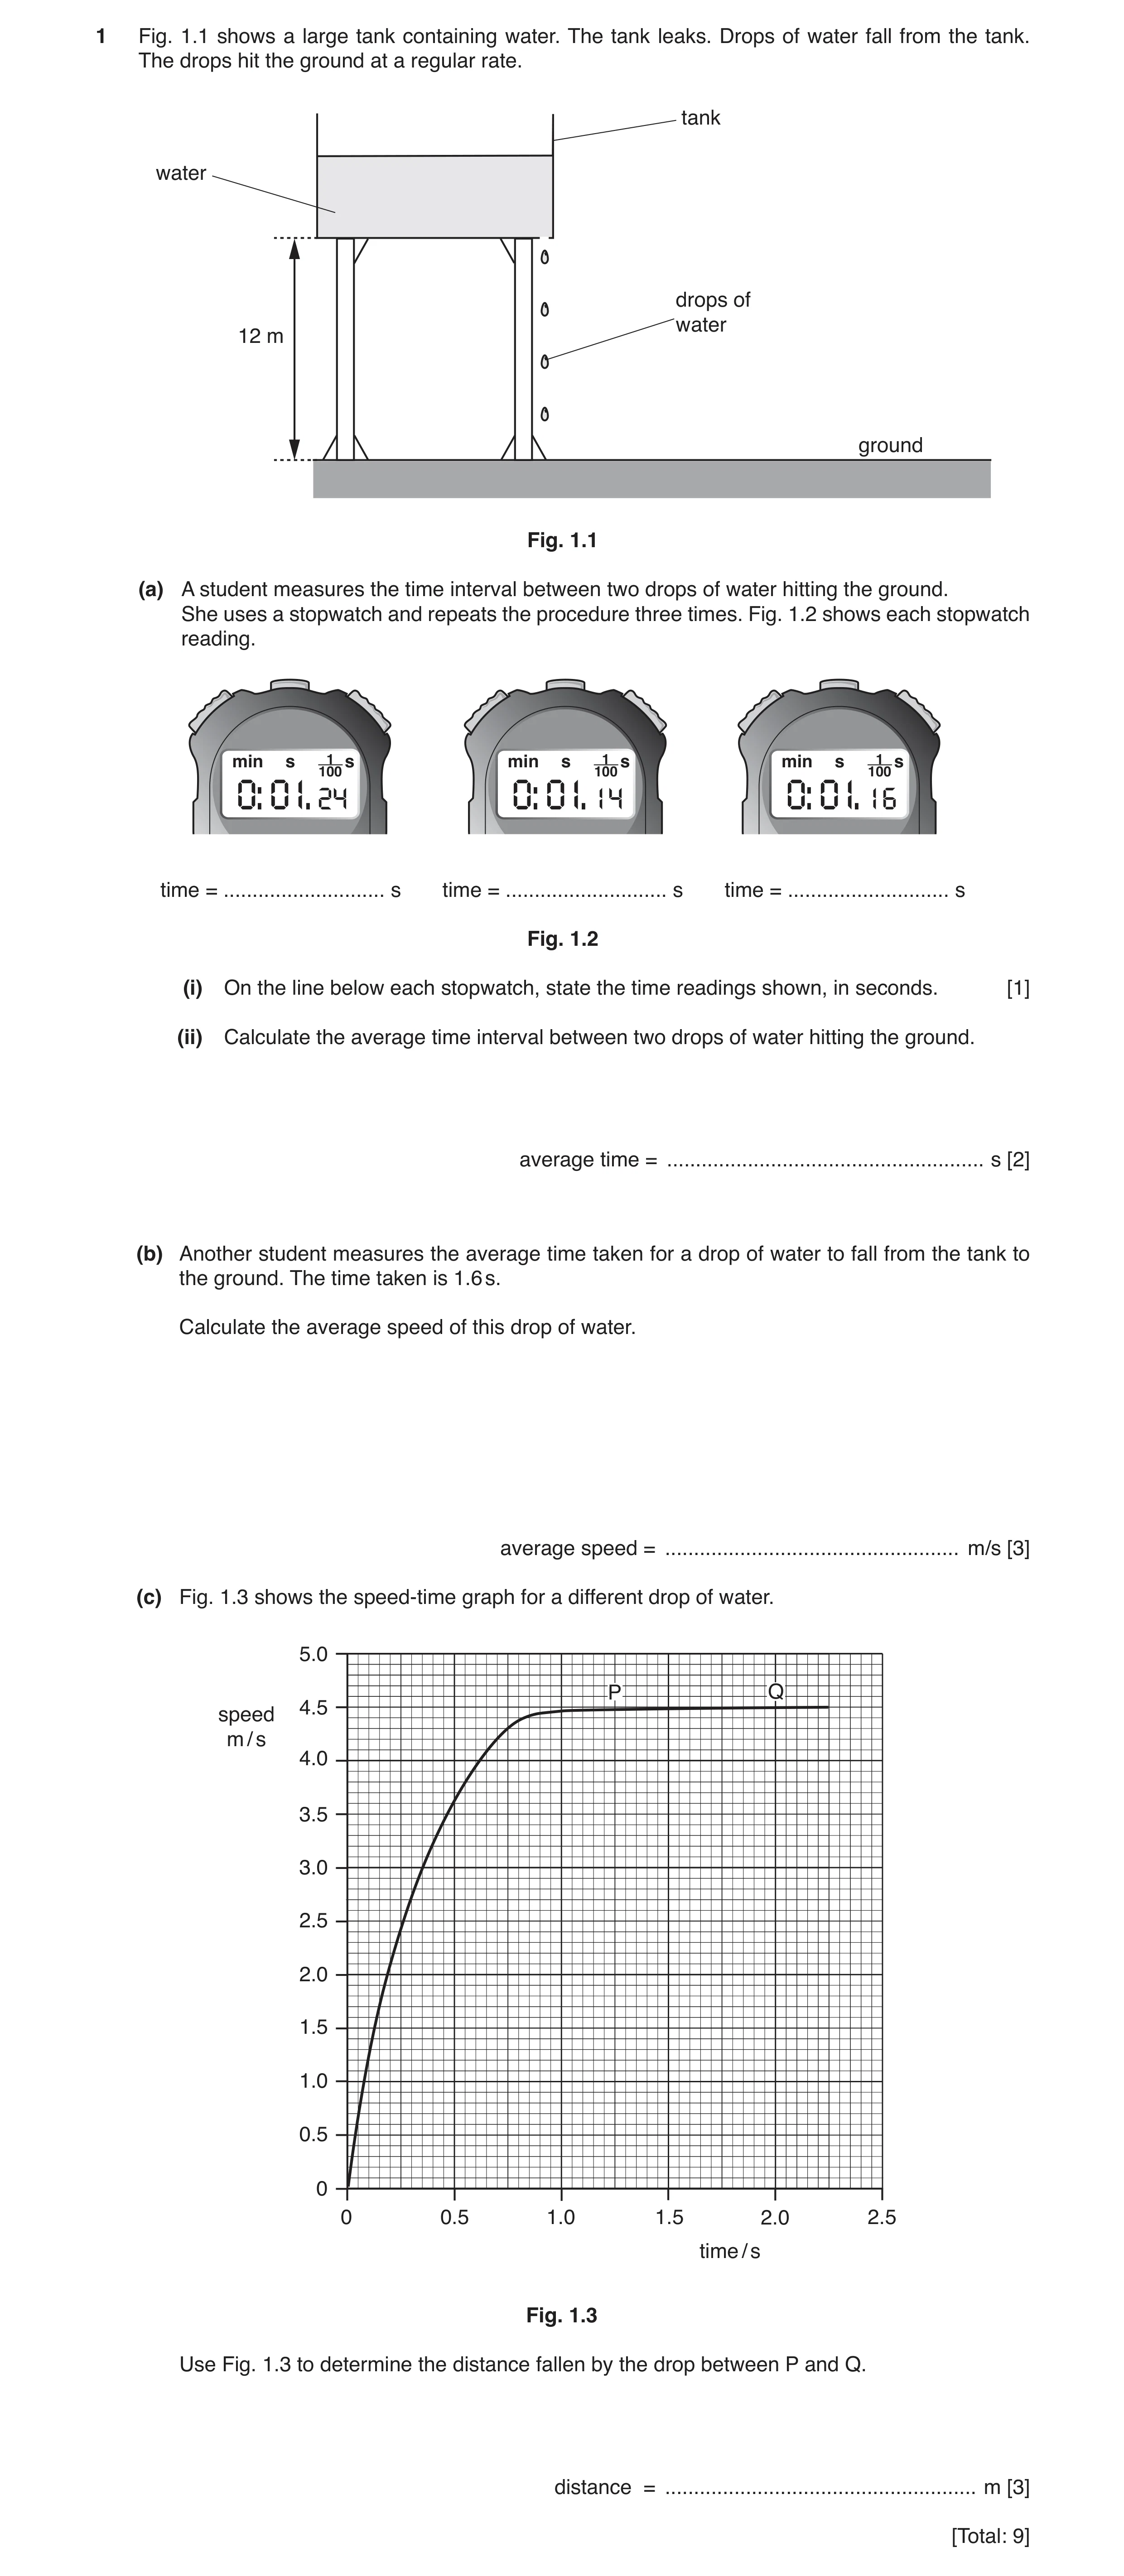
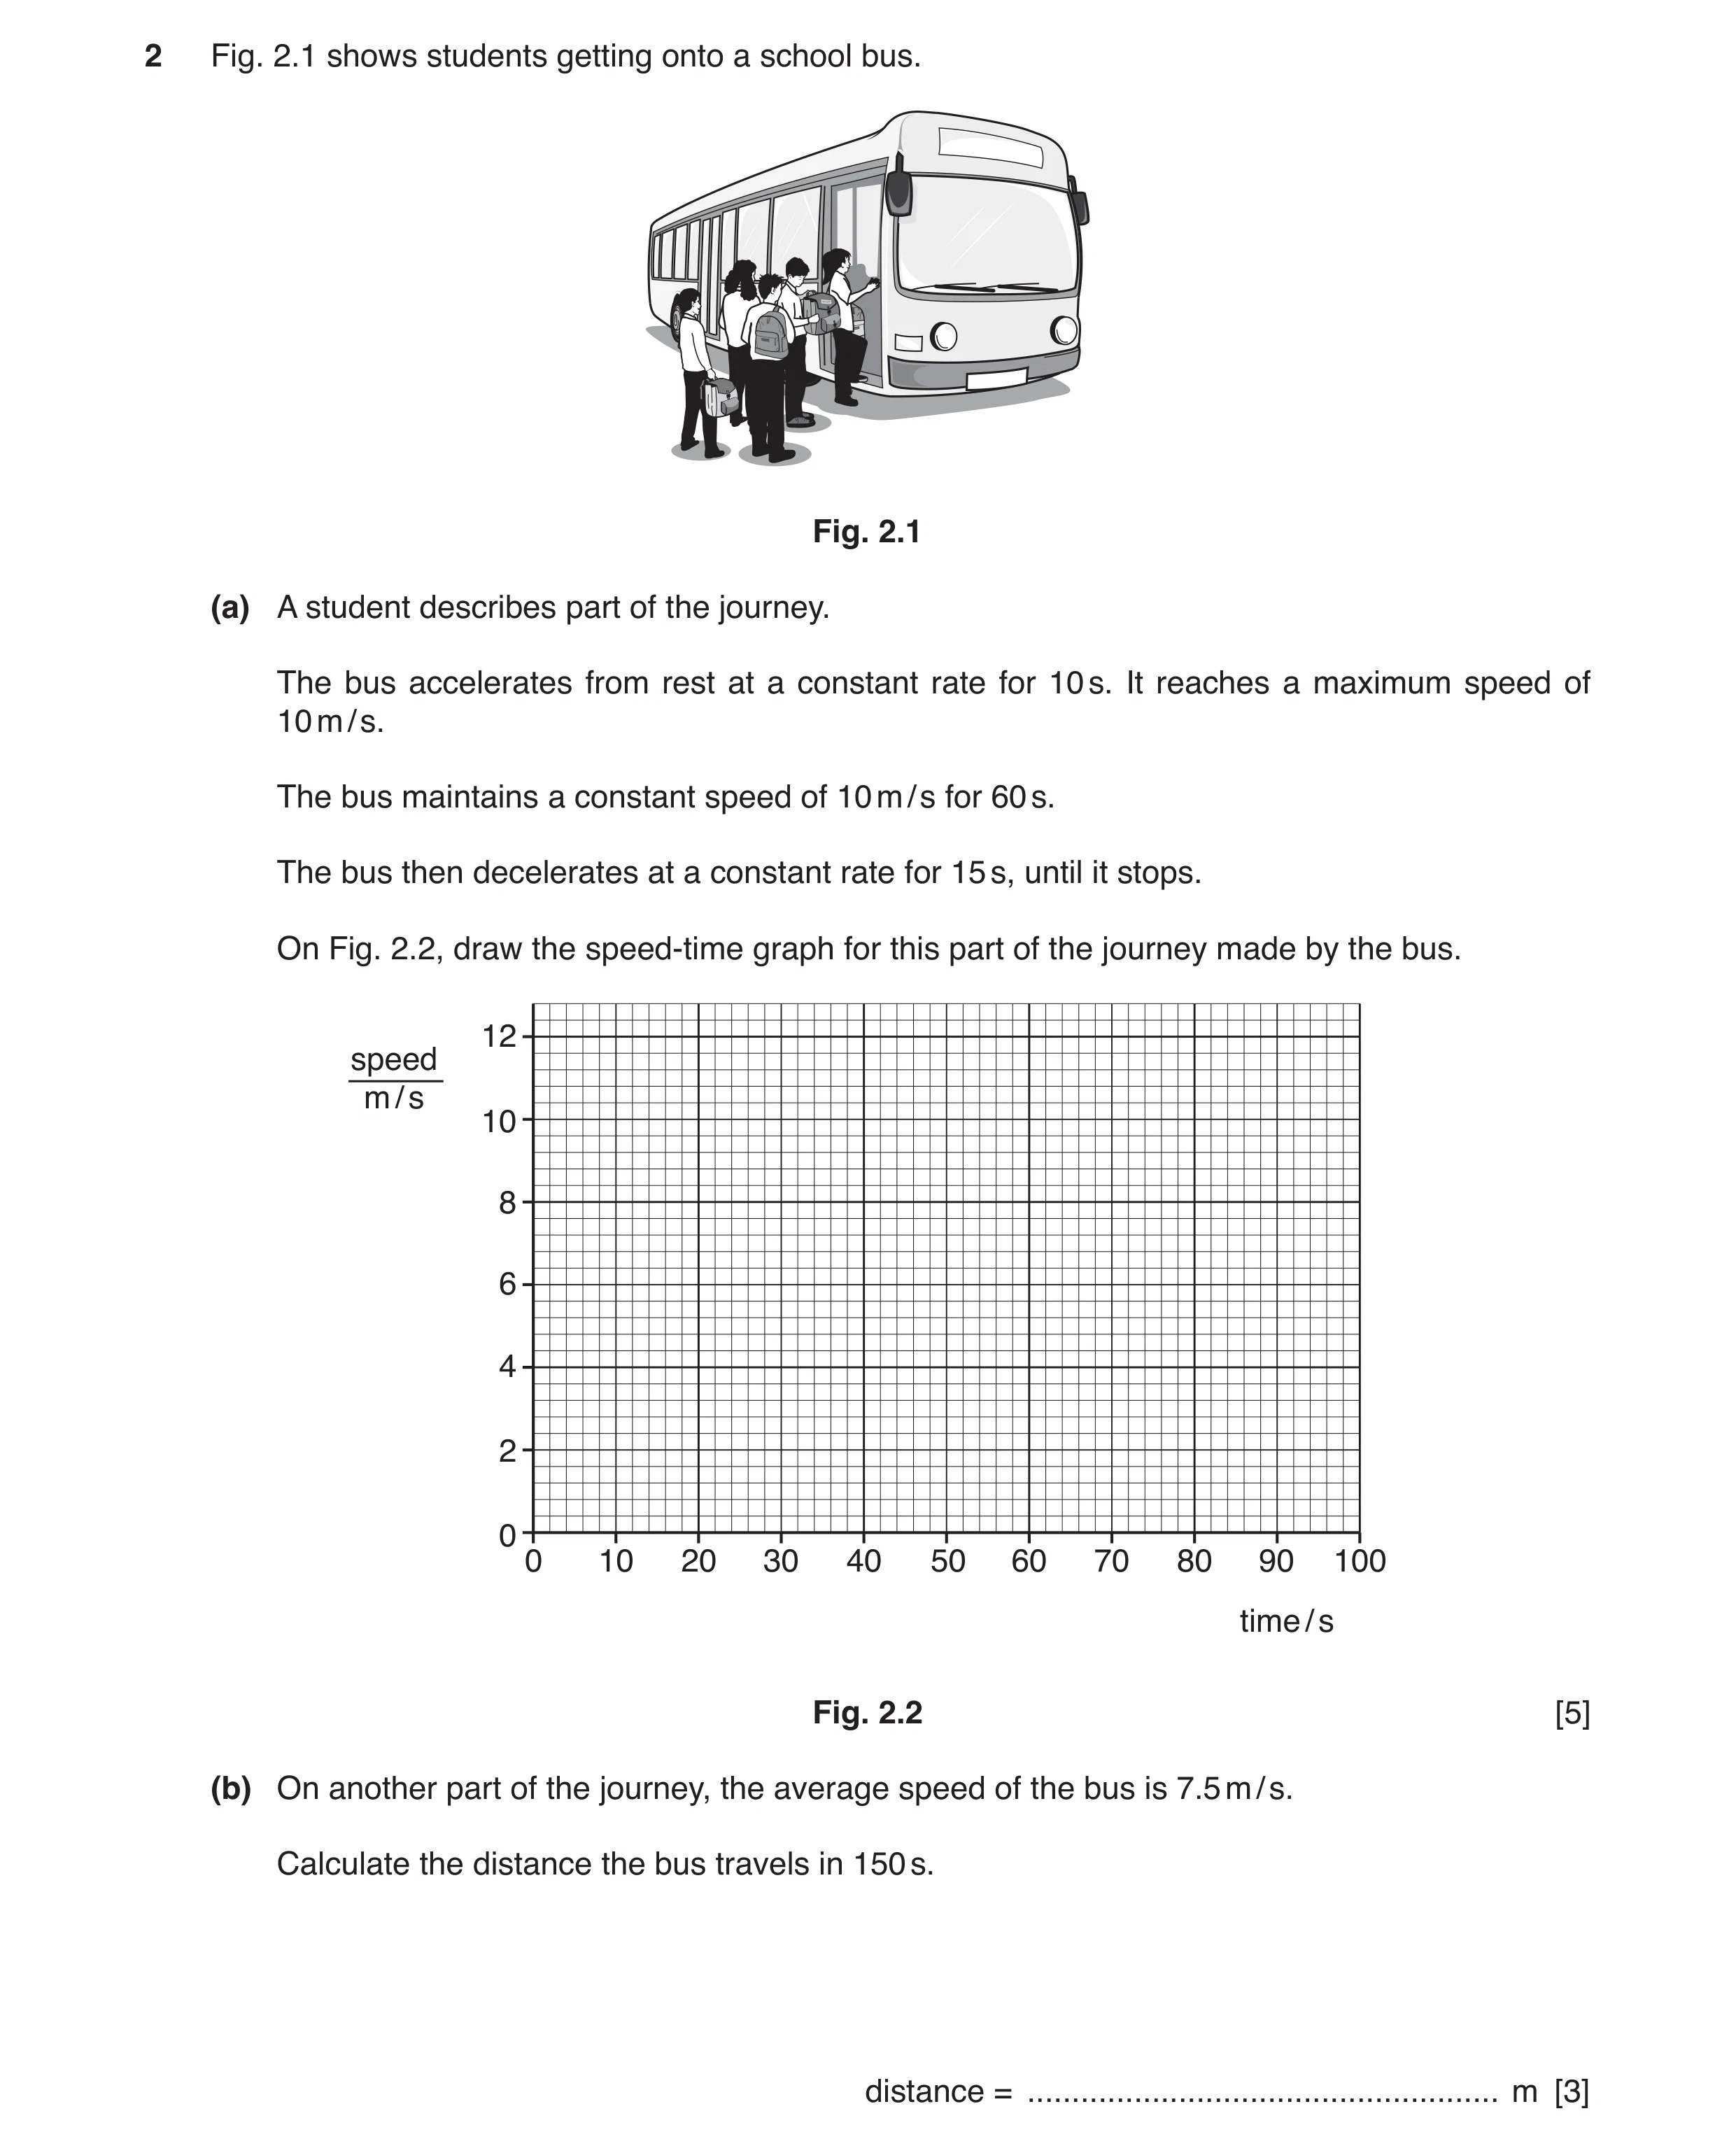 21 / 101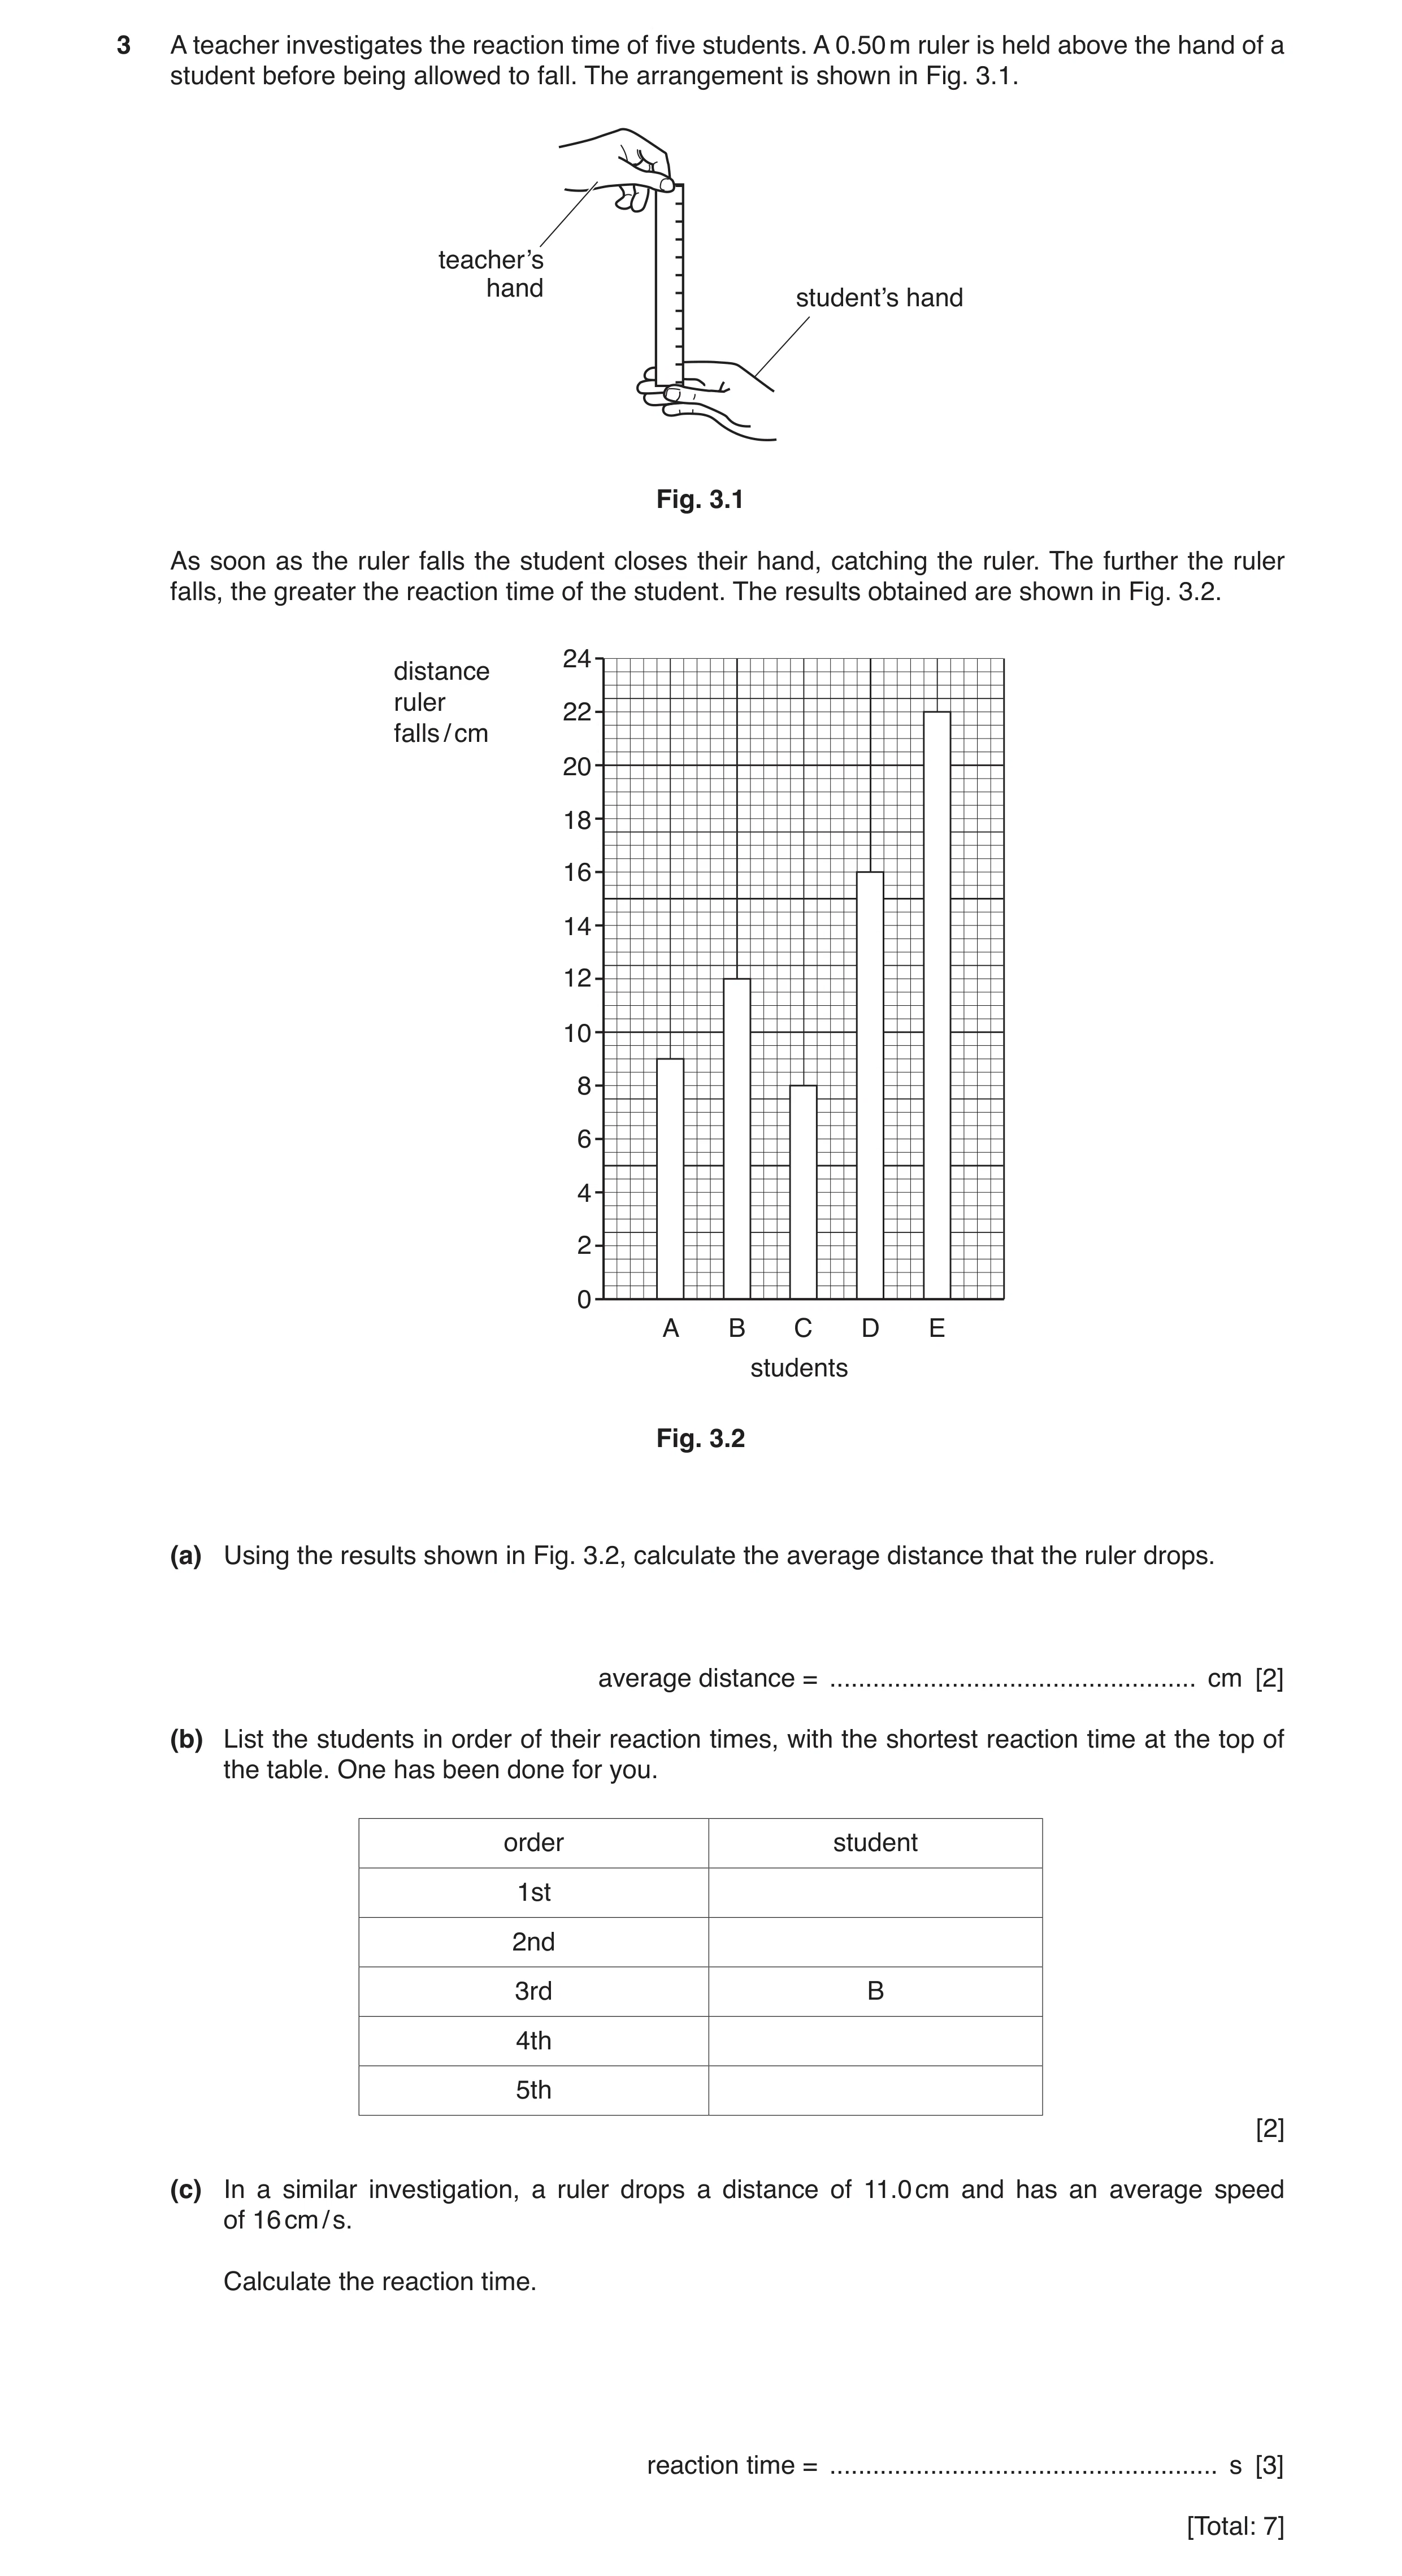
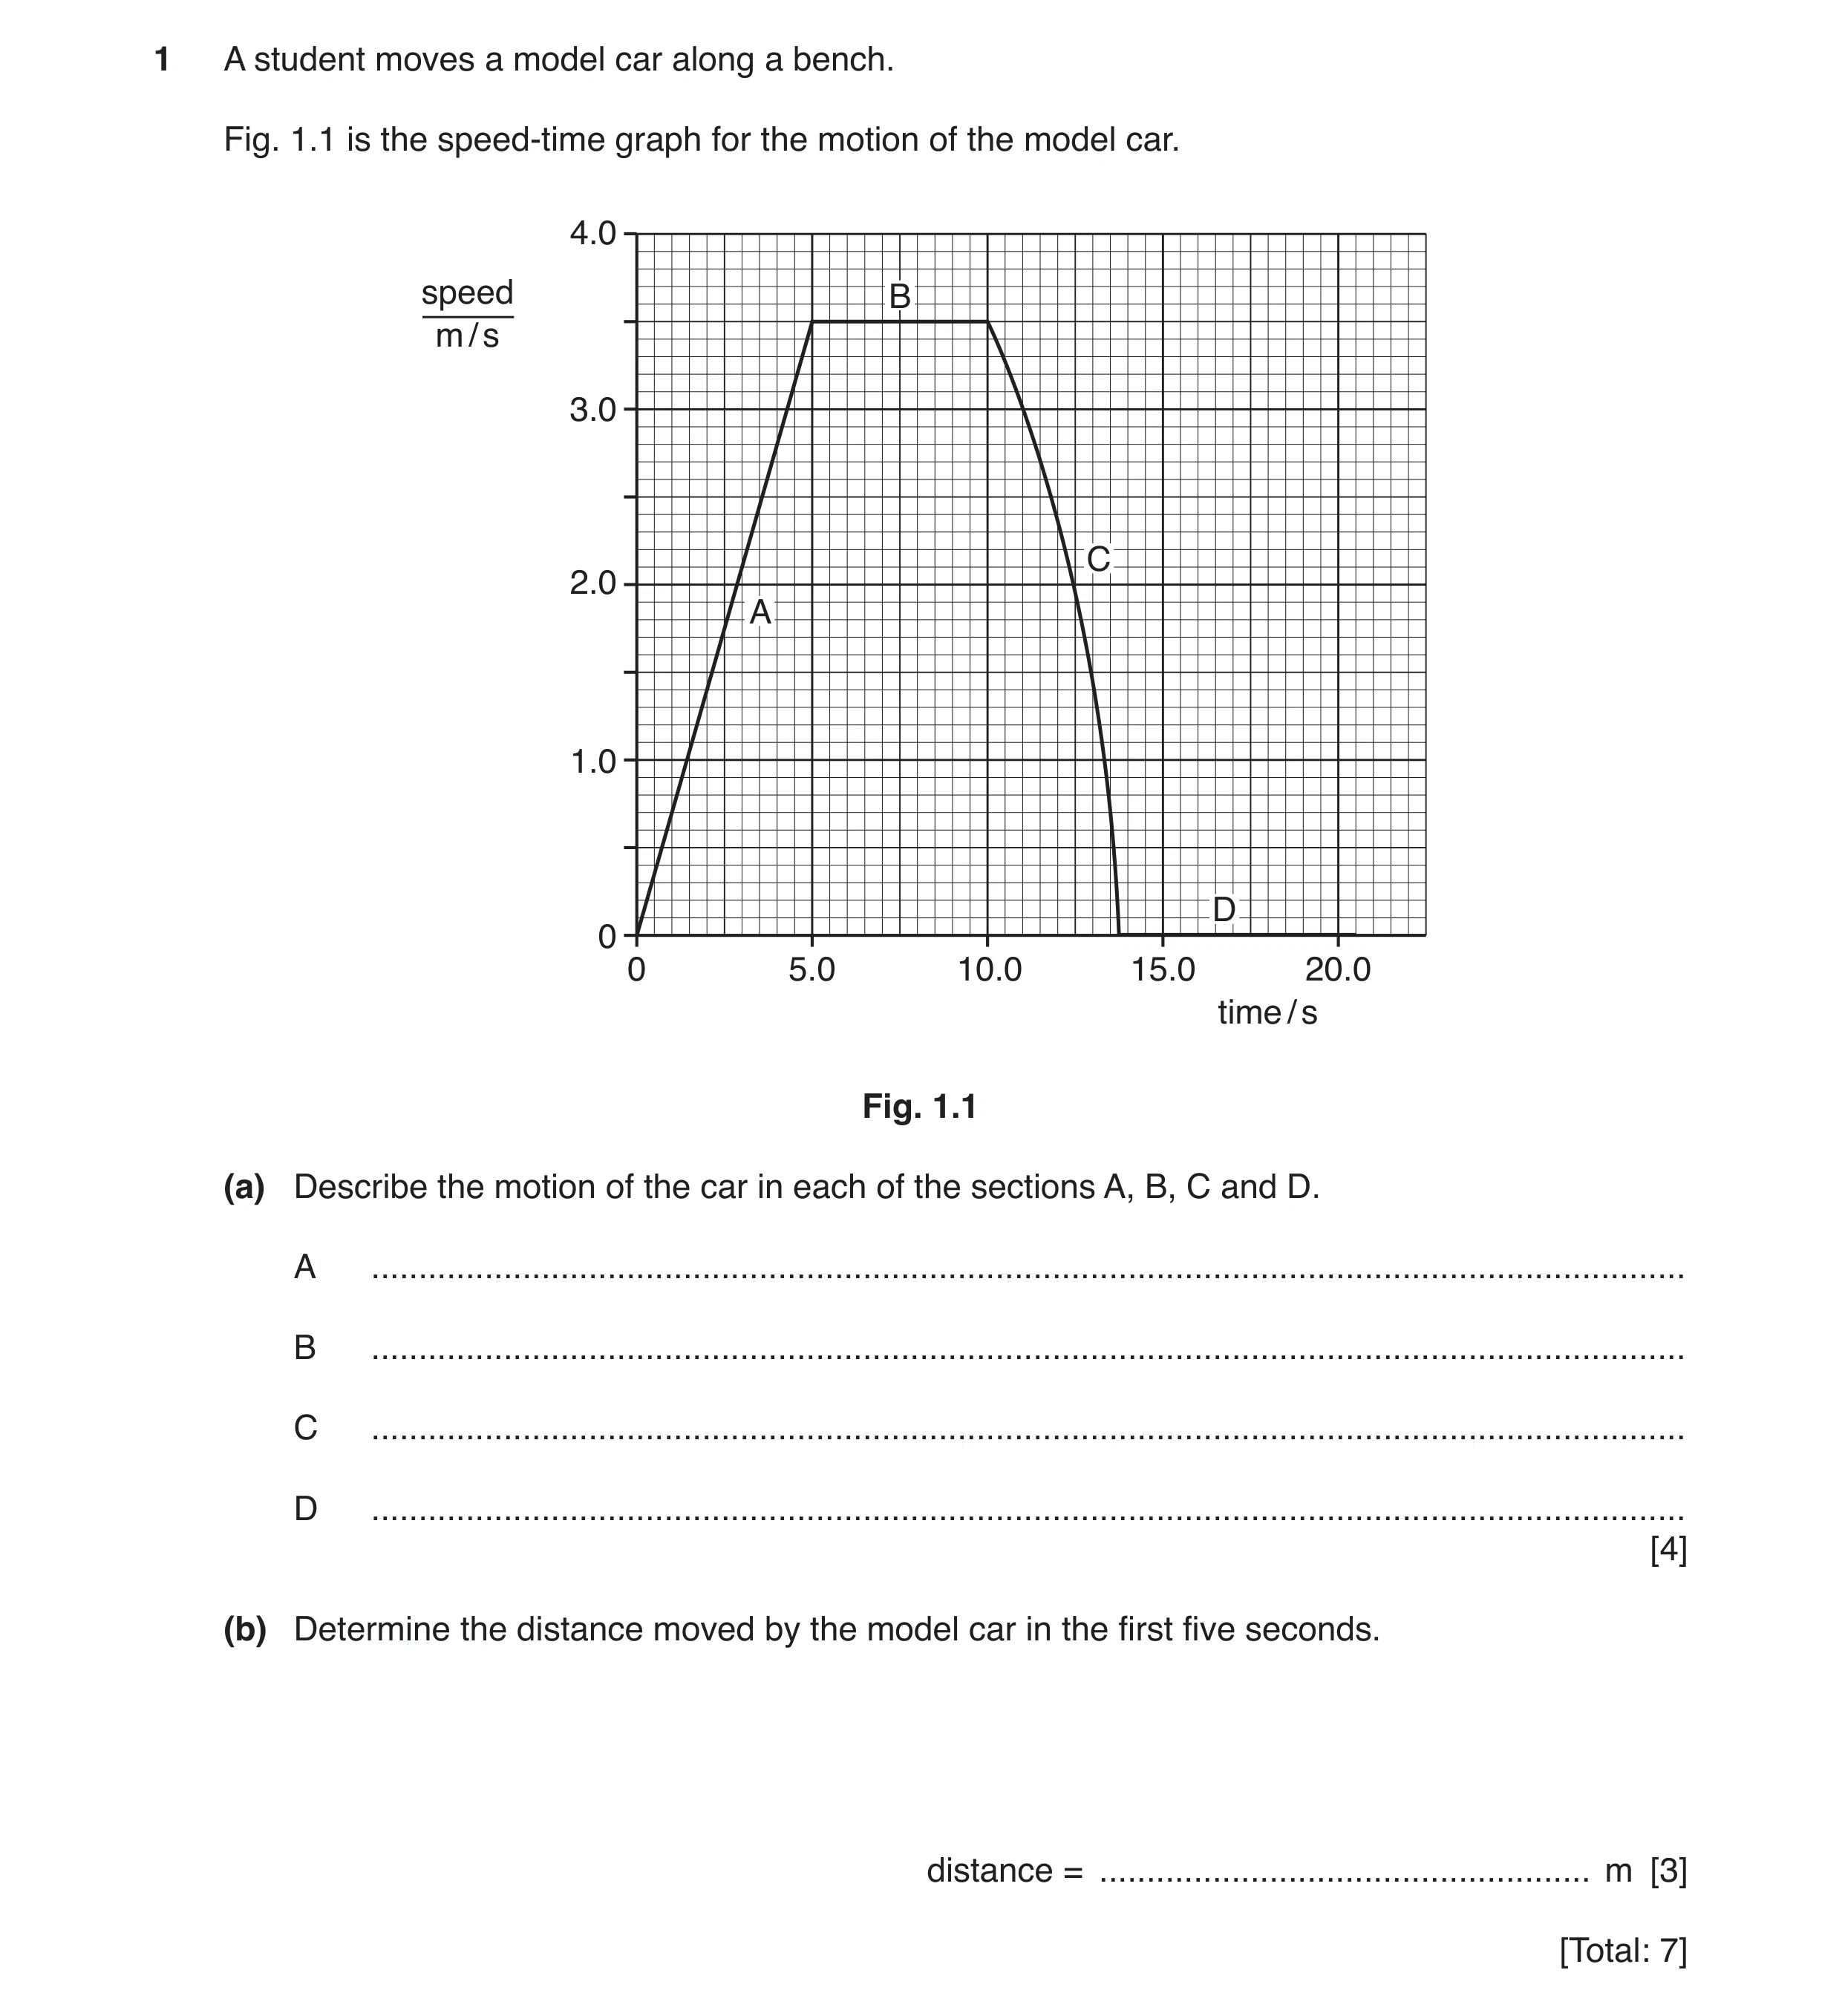 24 / 101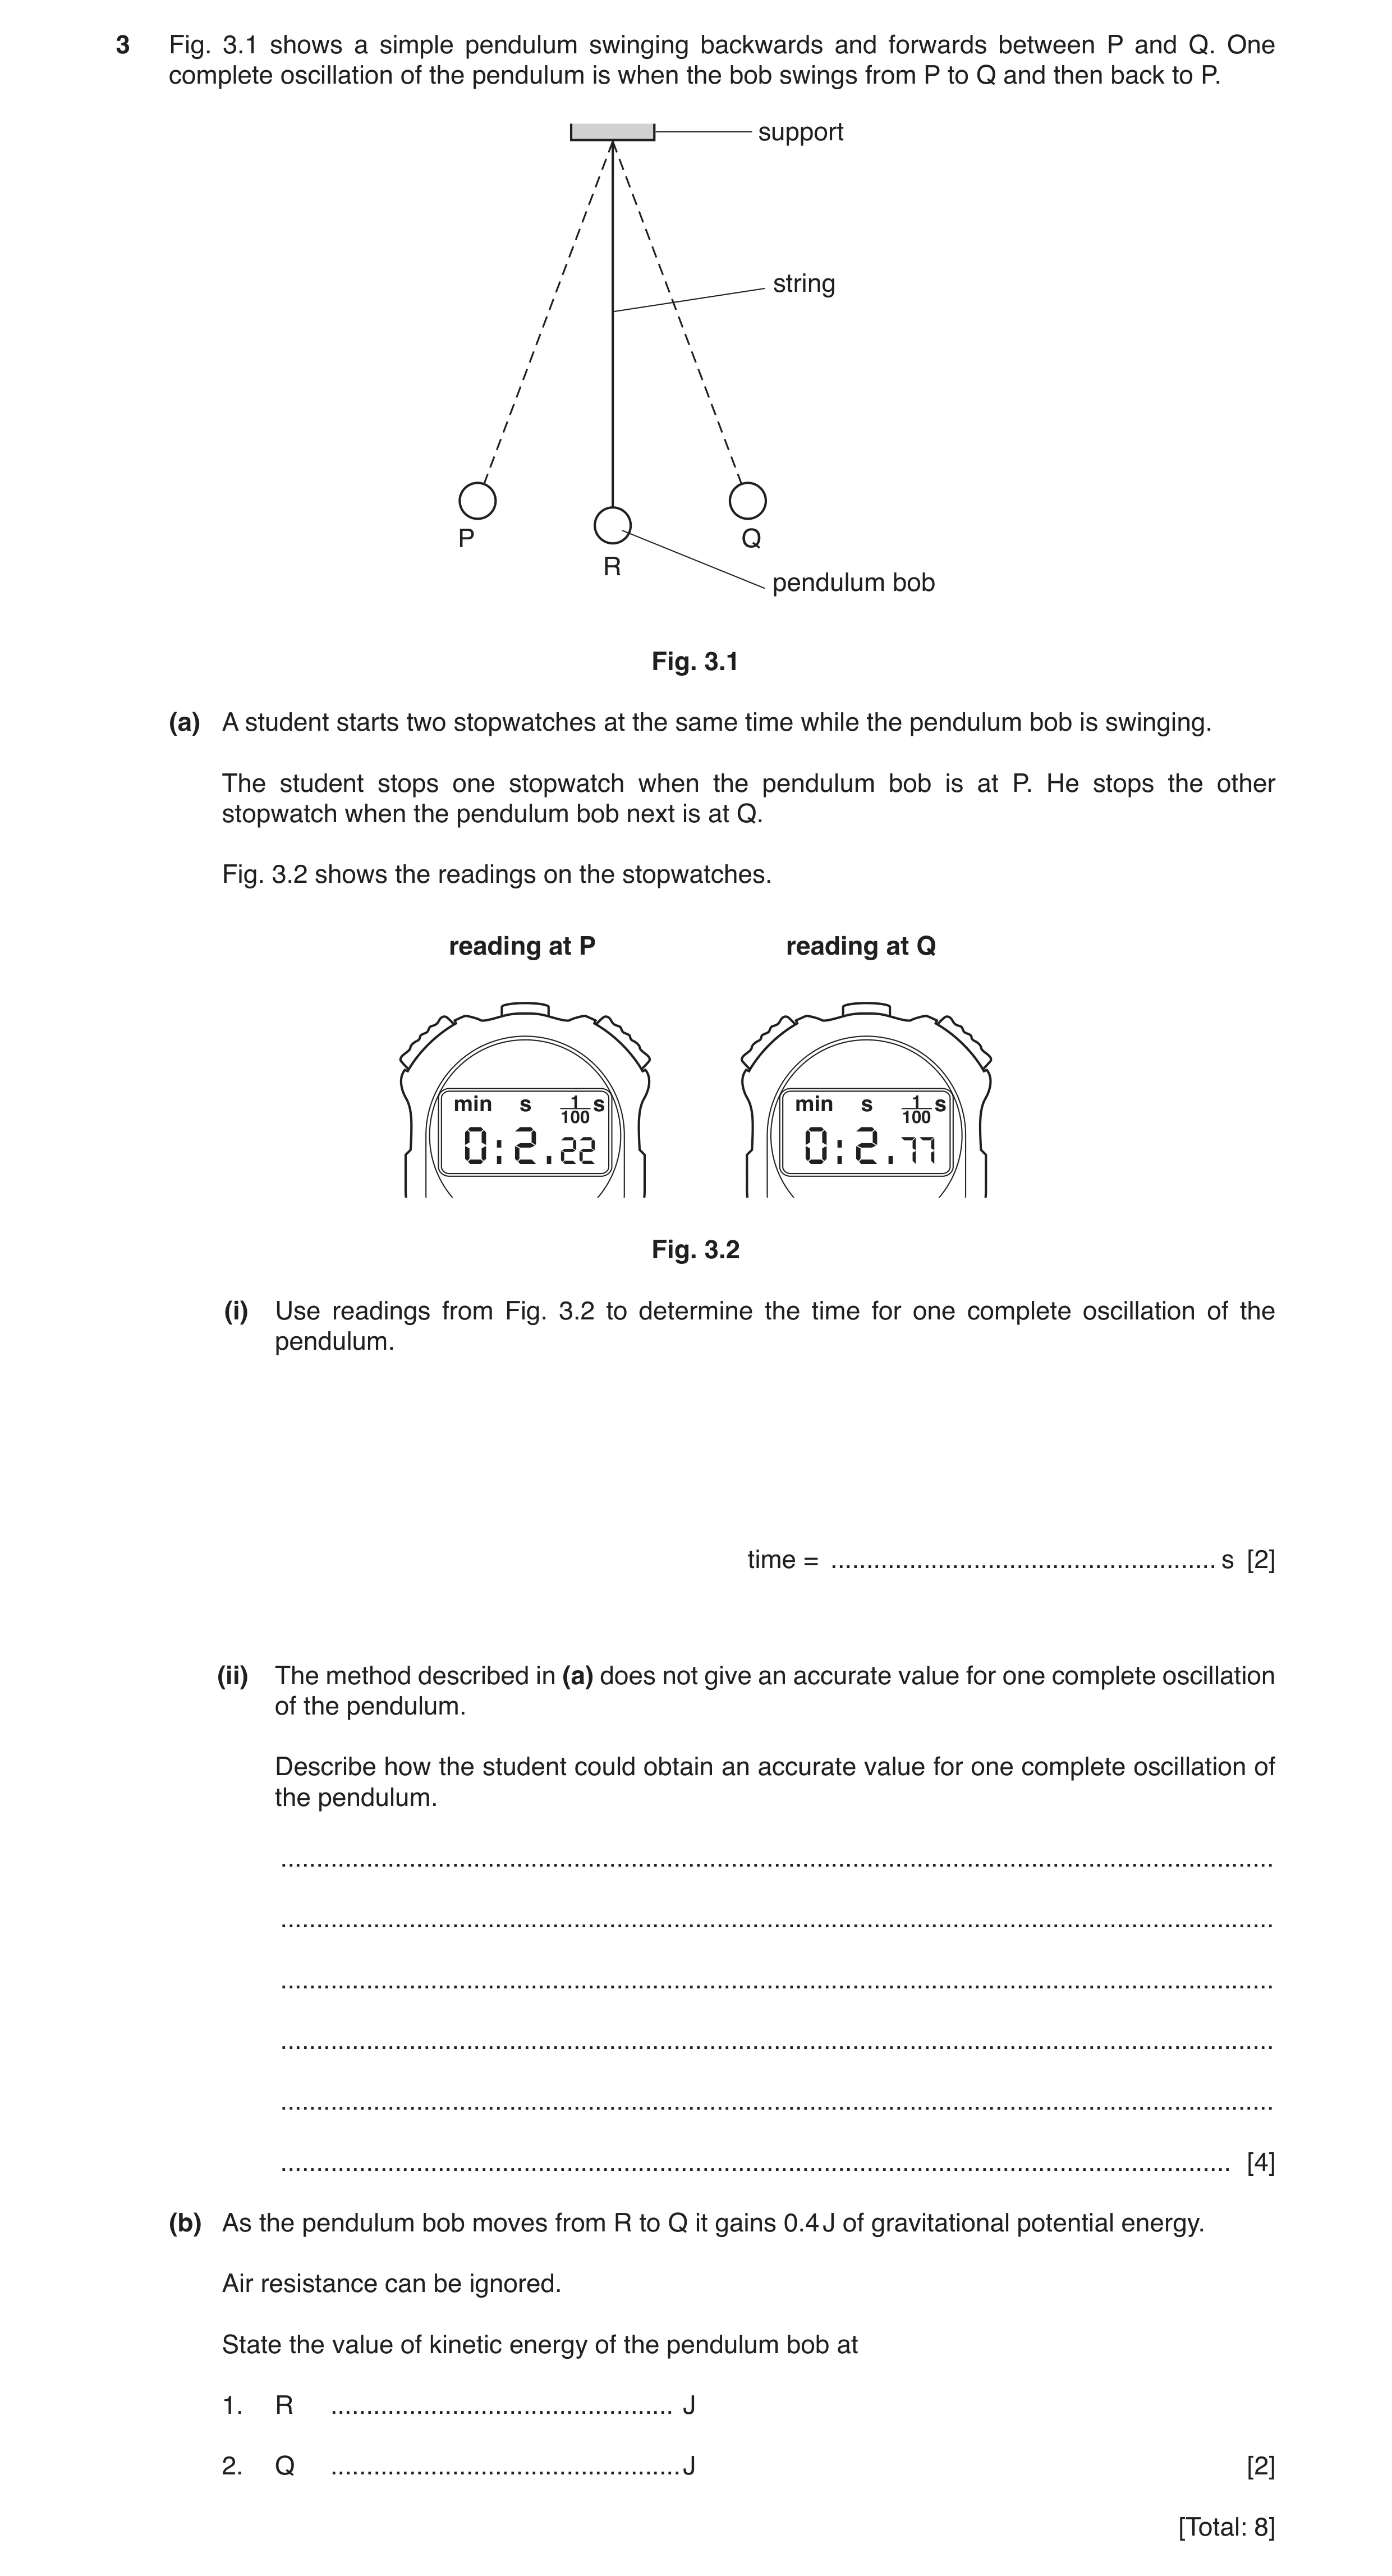
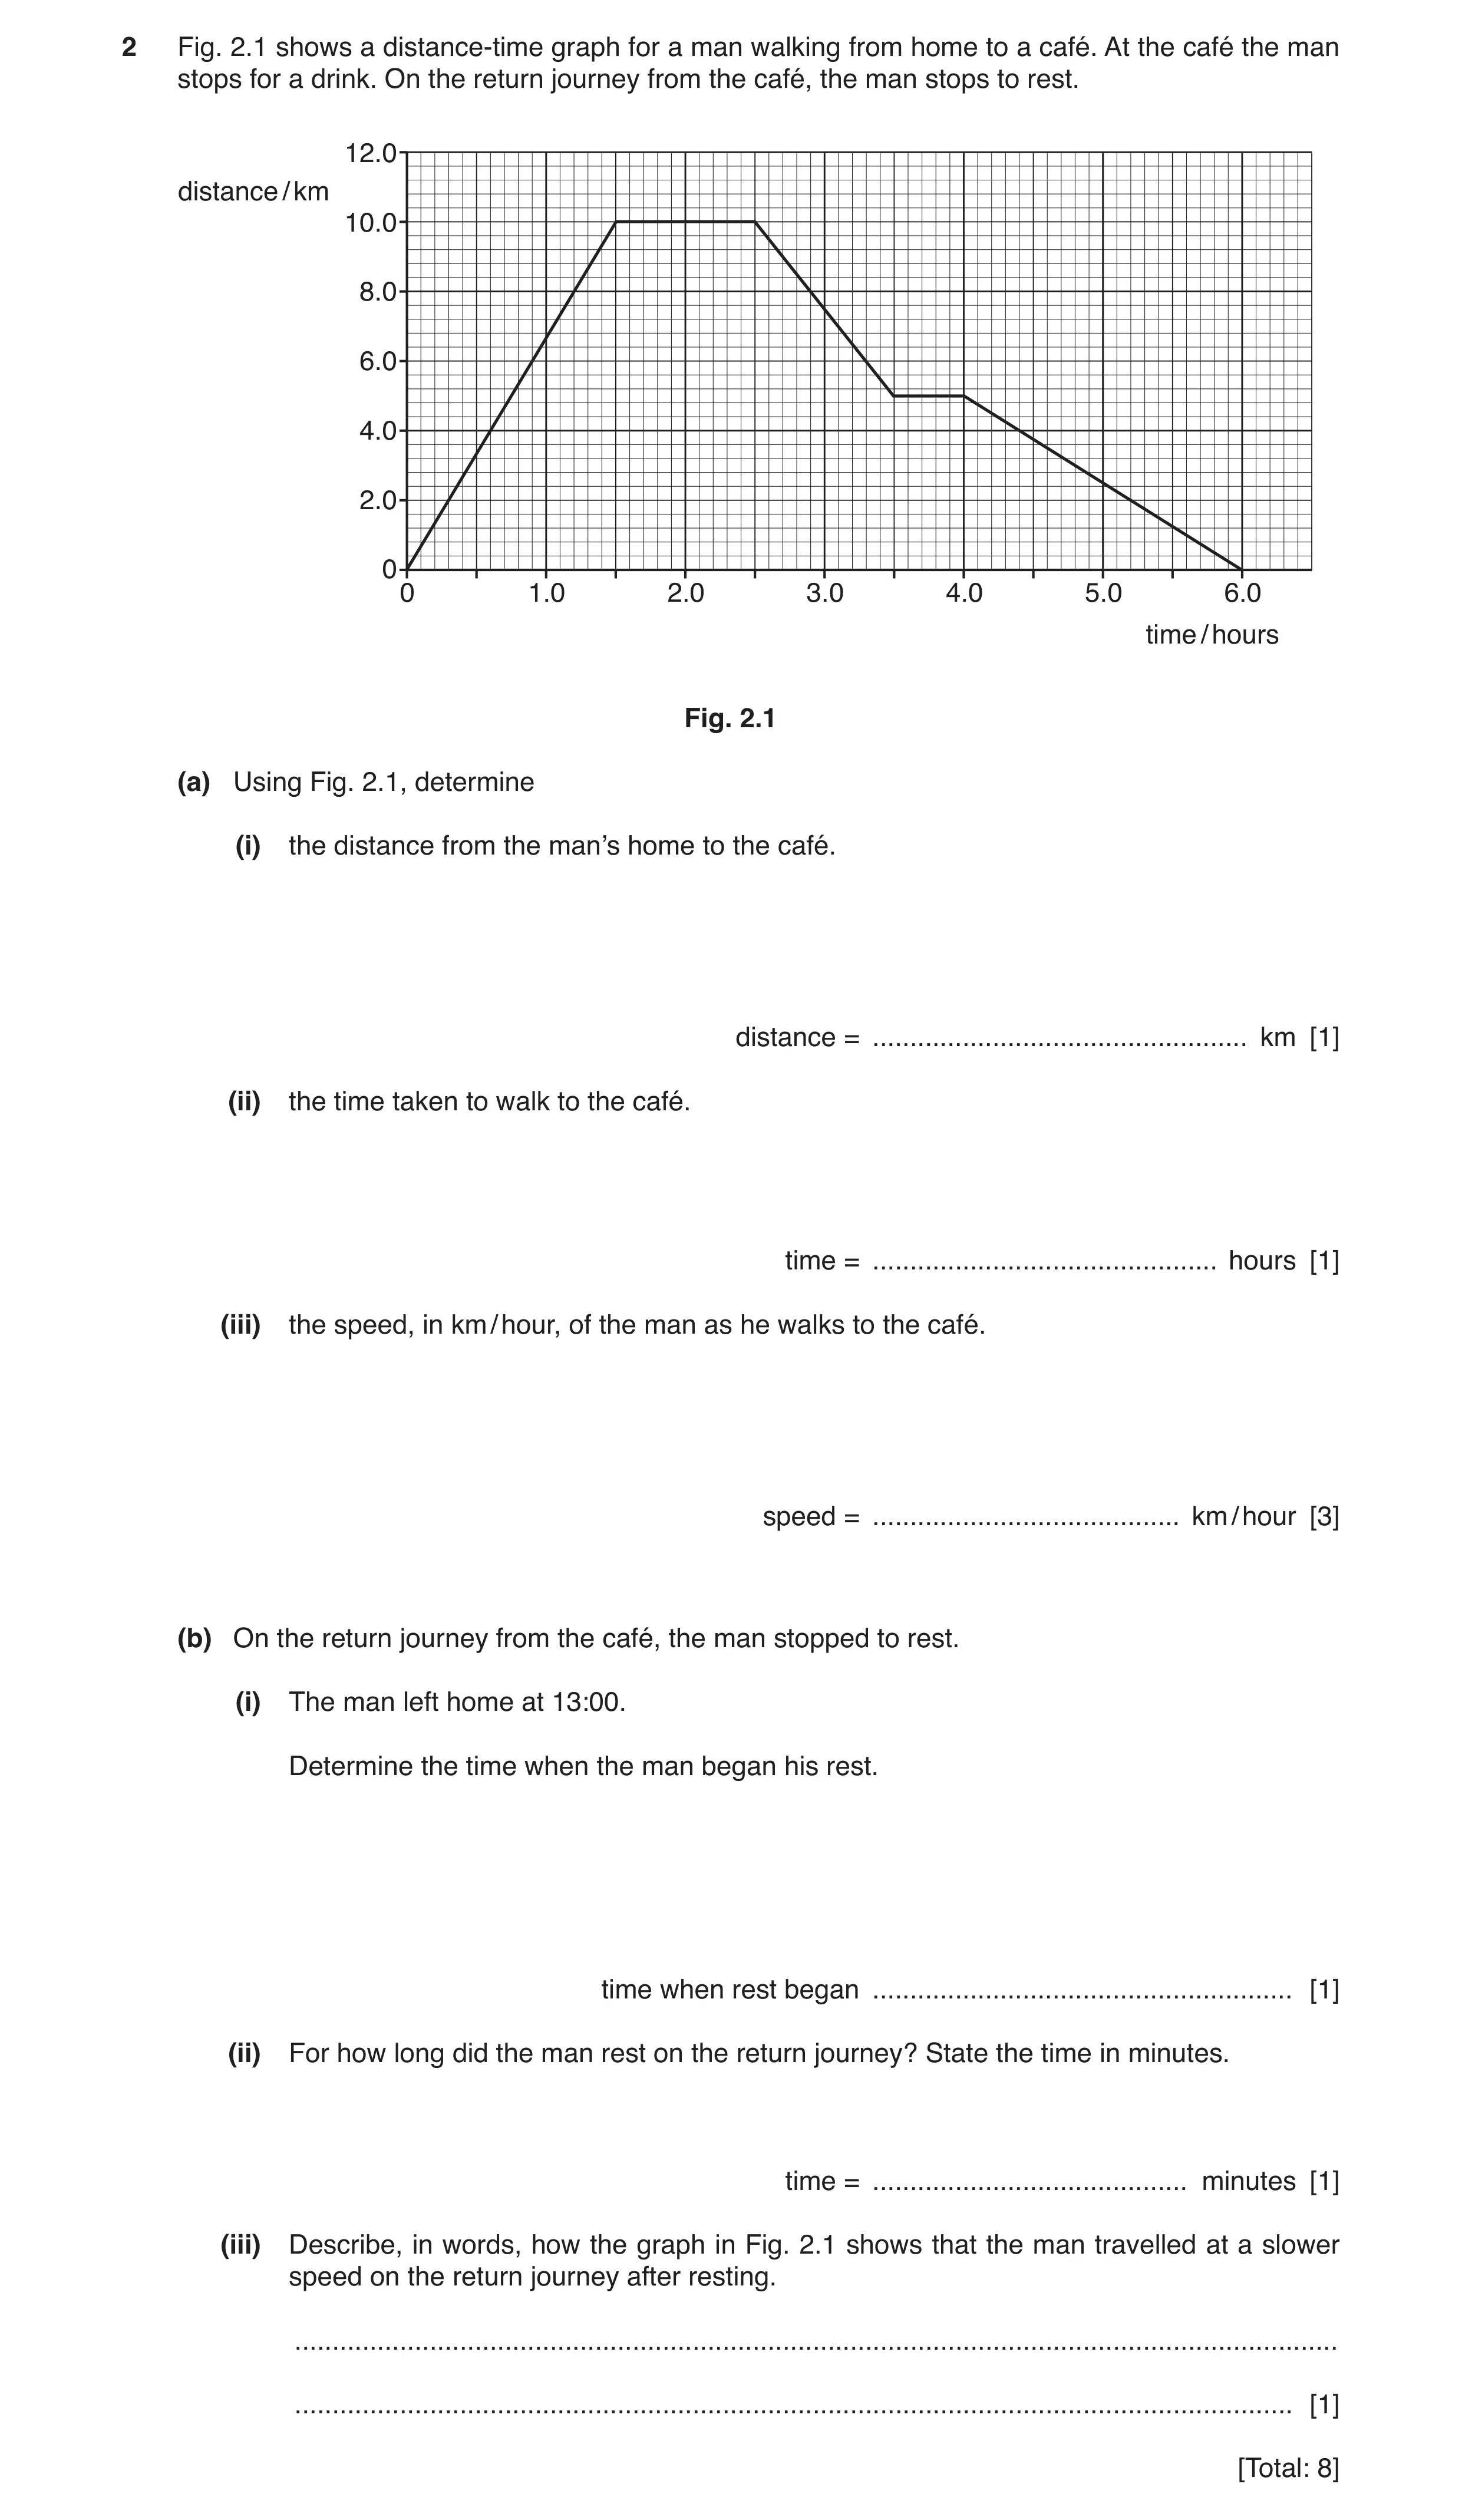
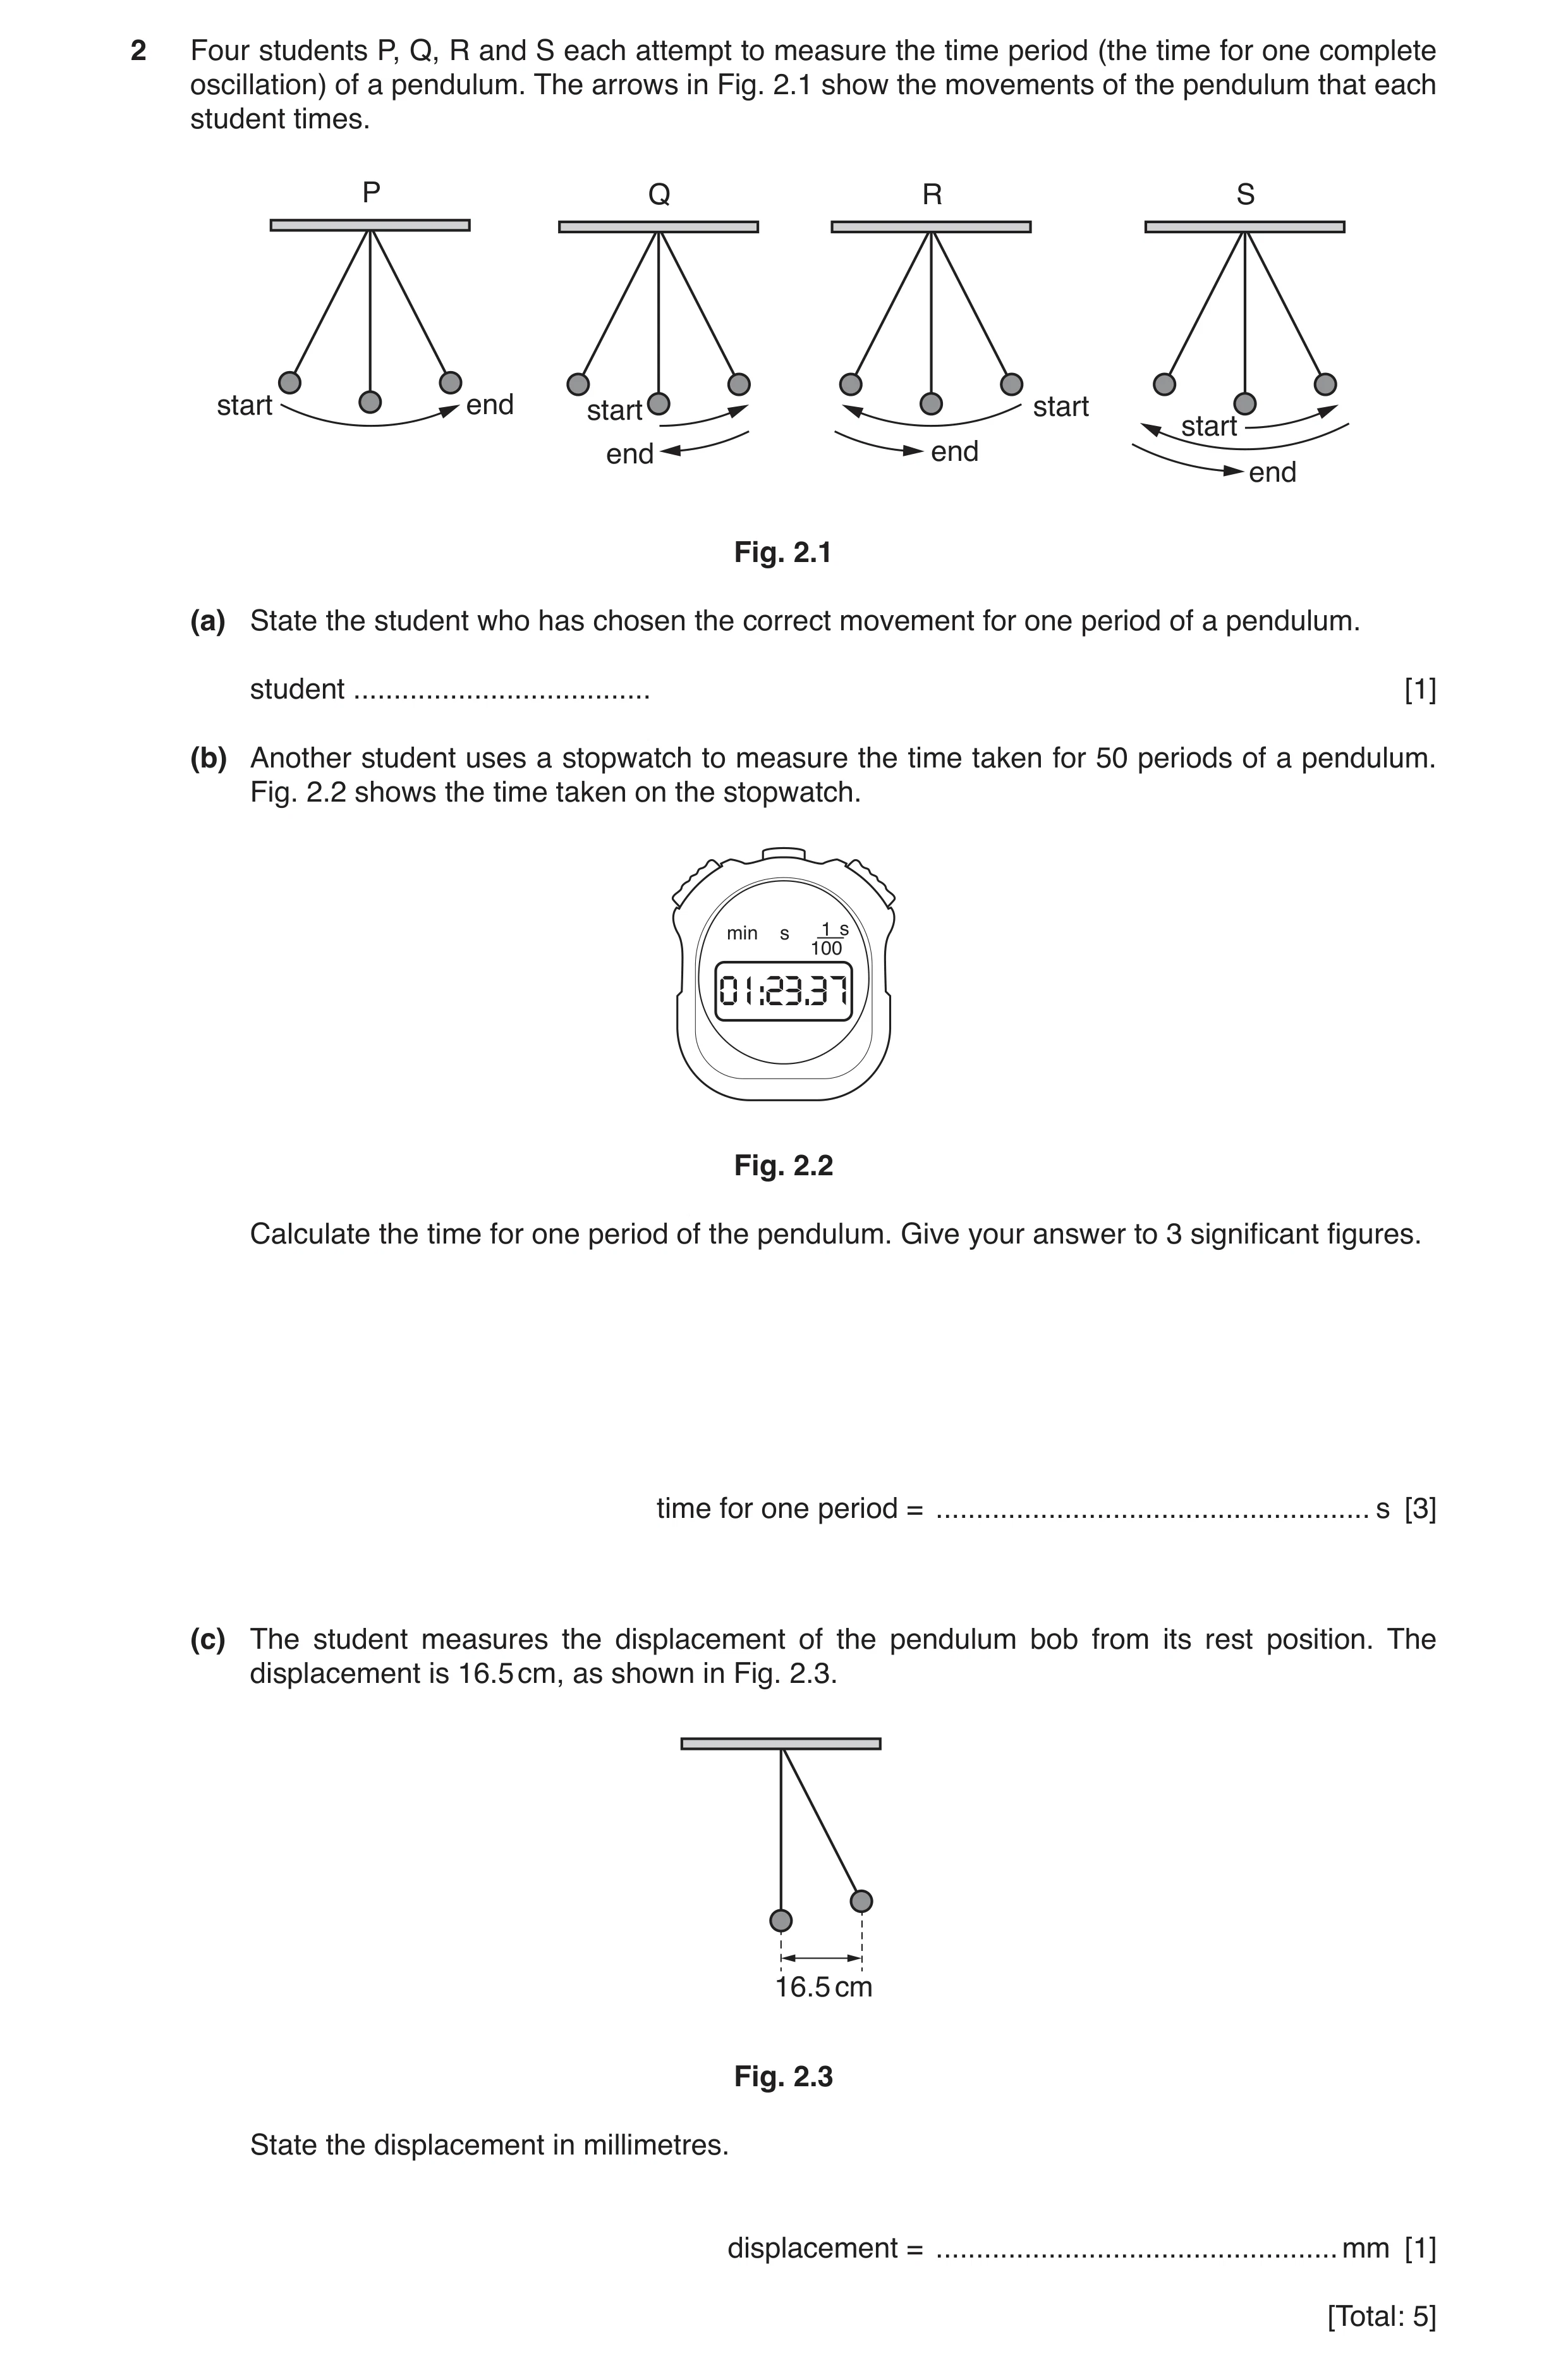
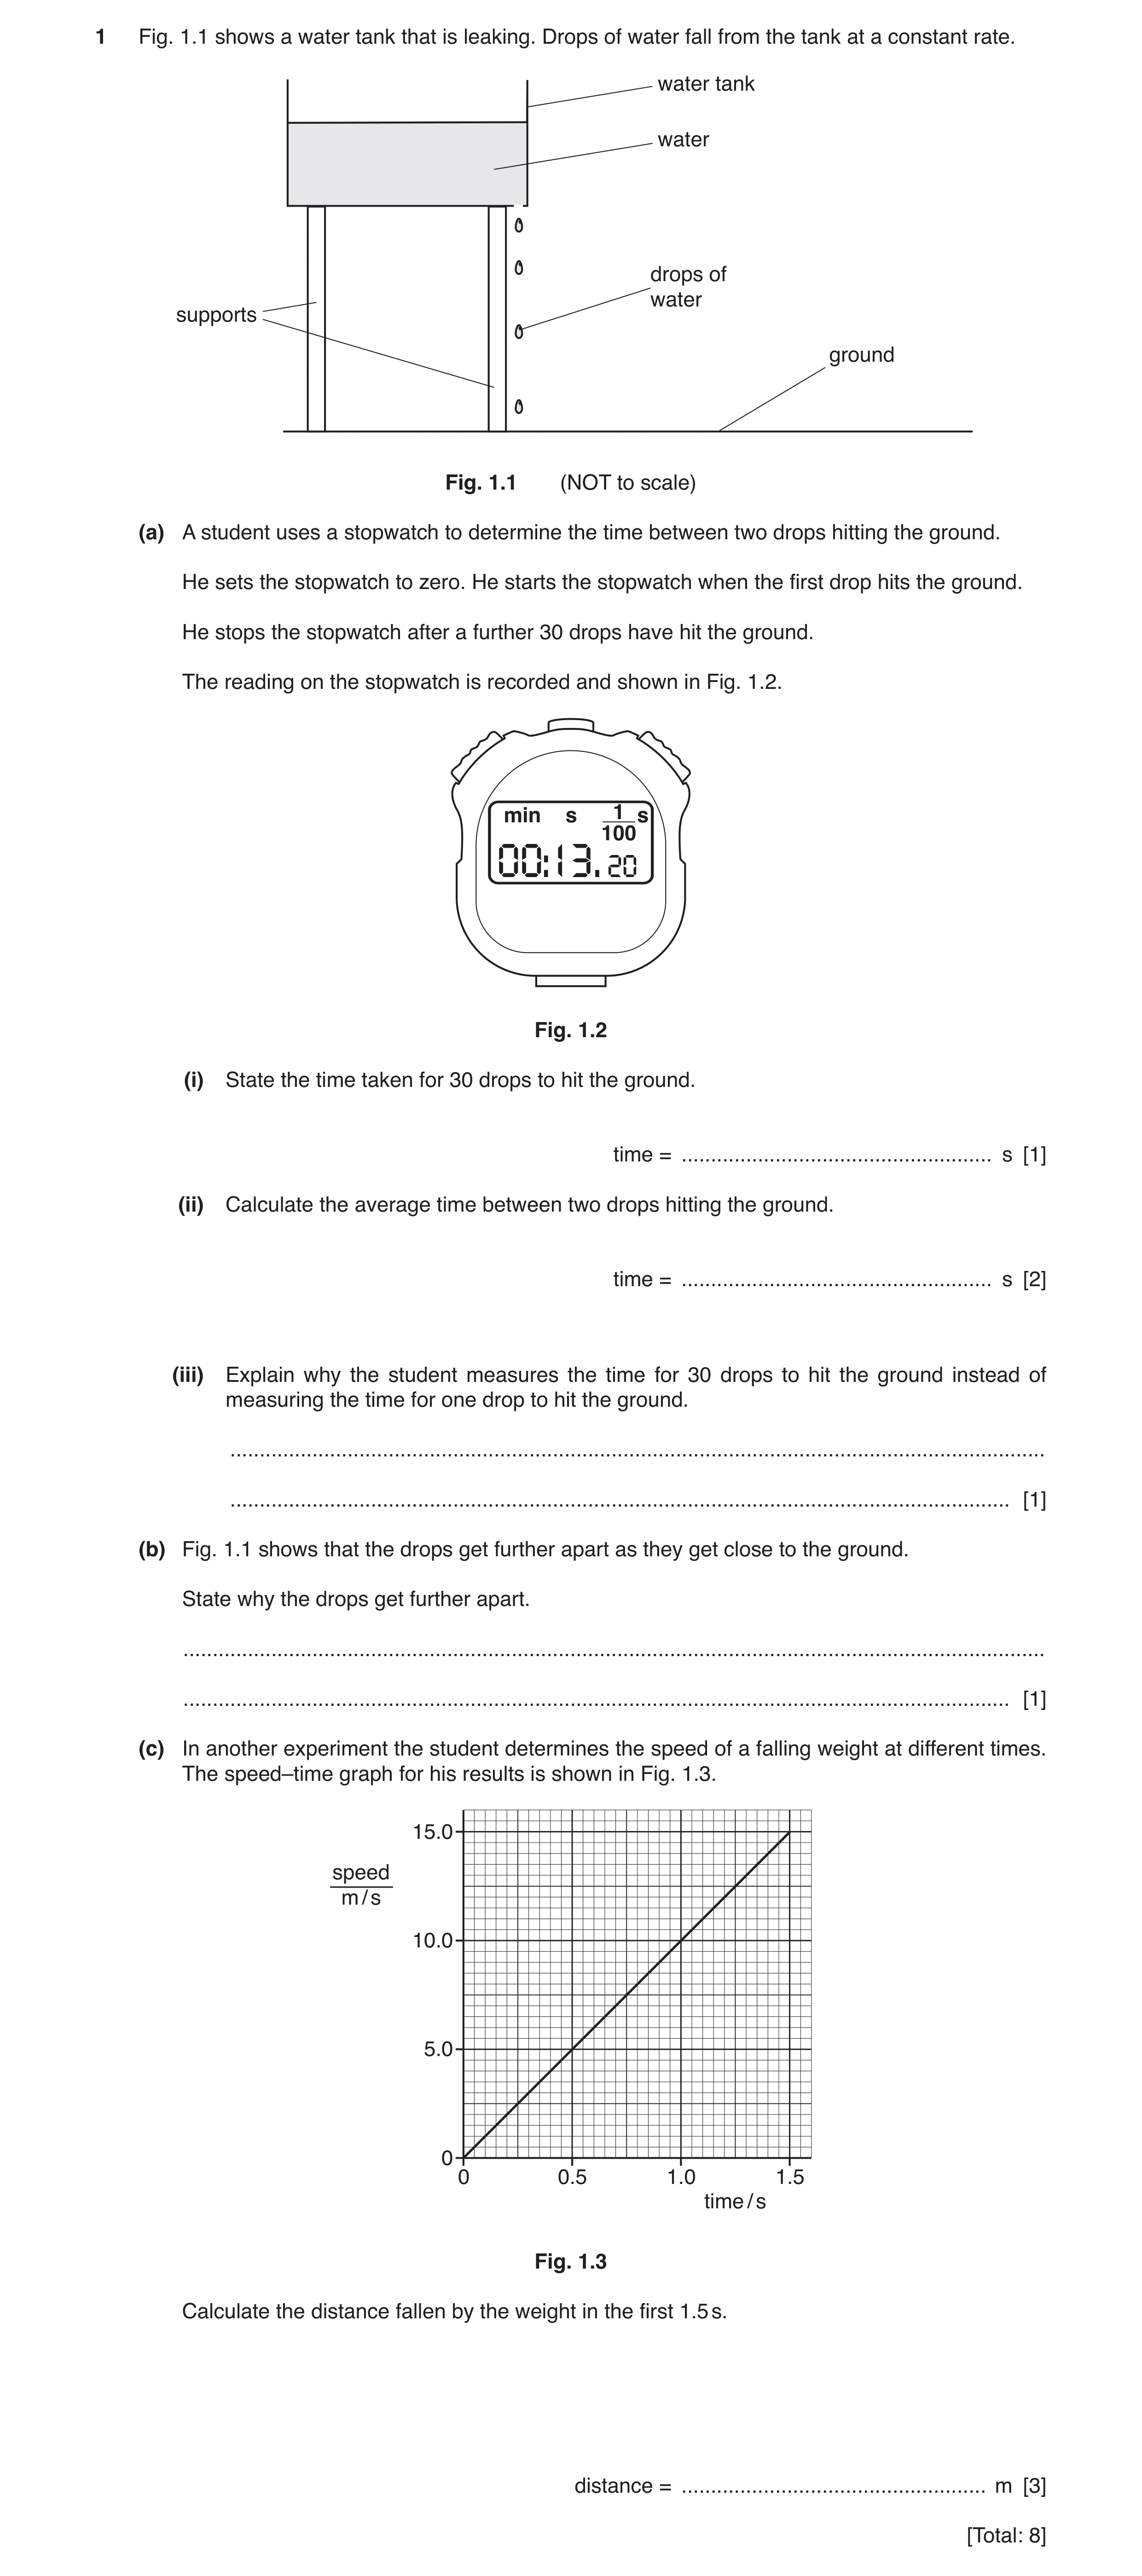
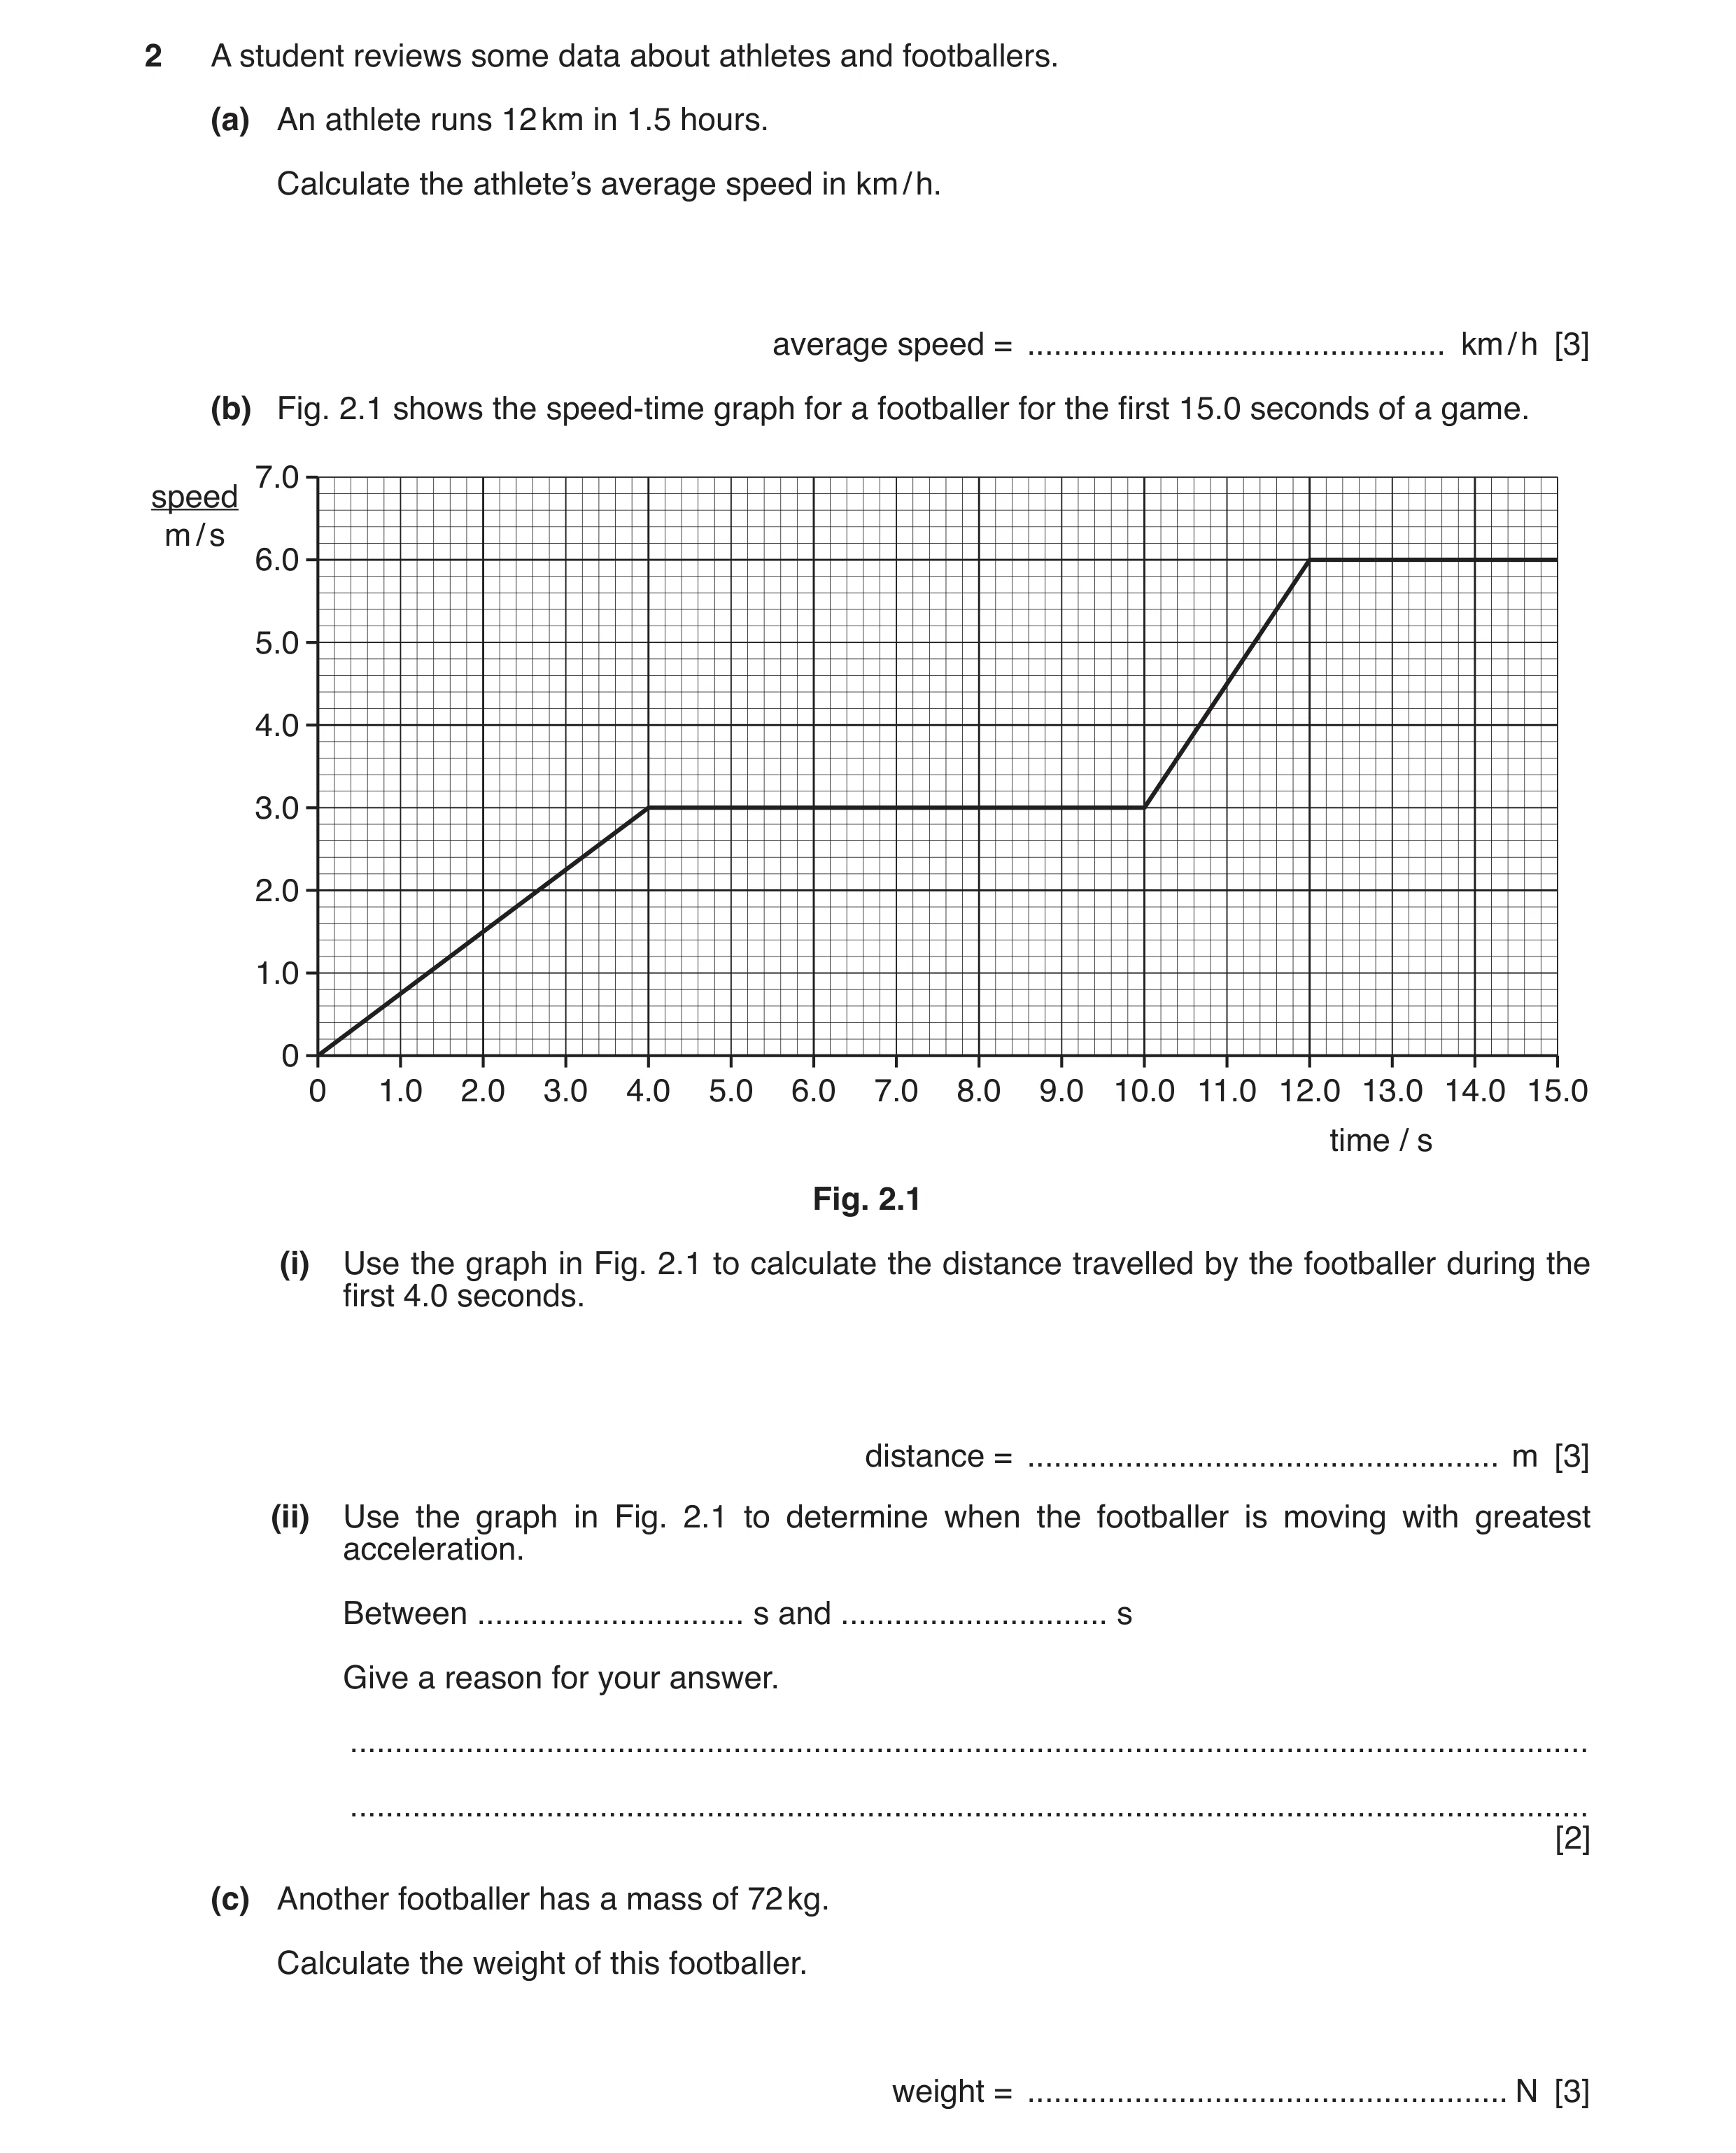 31 / 101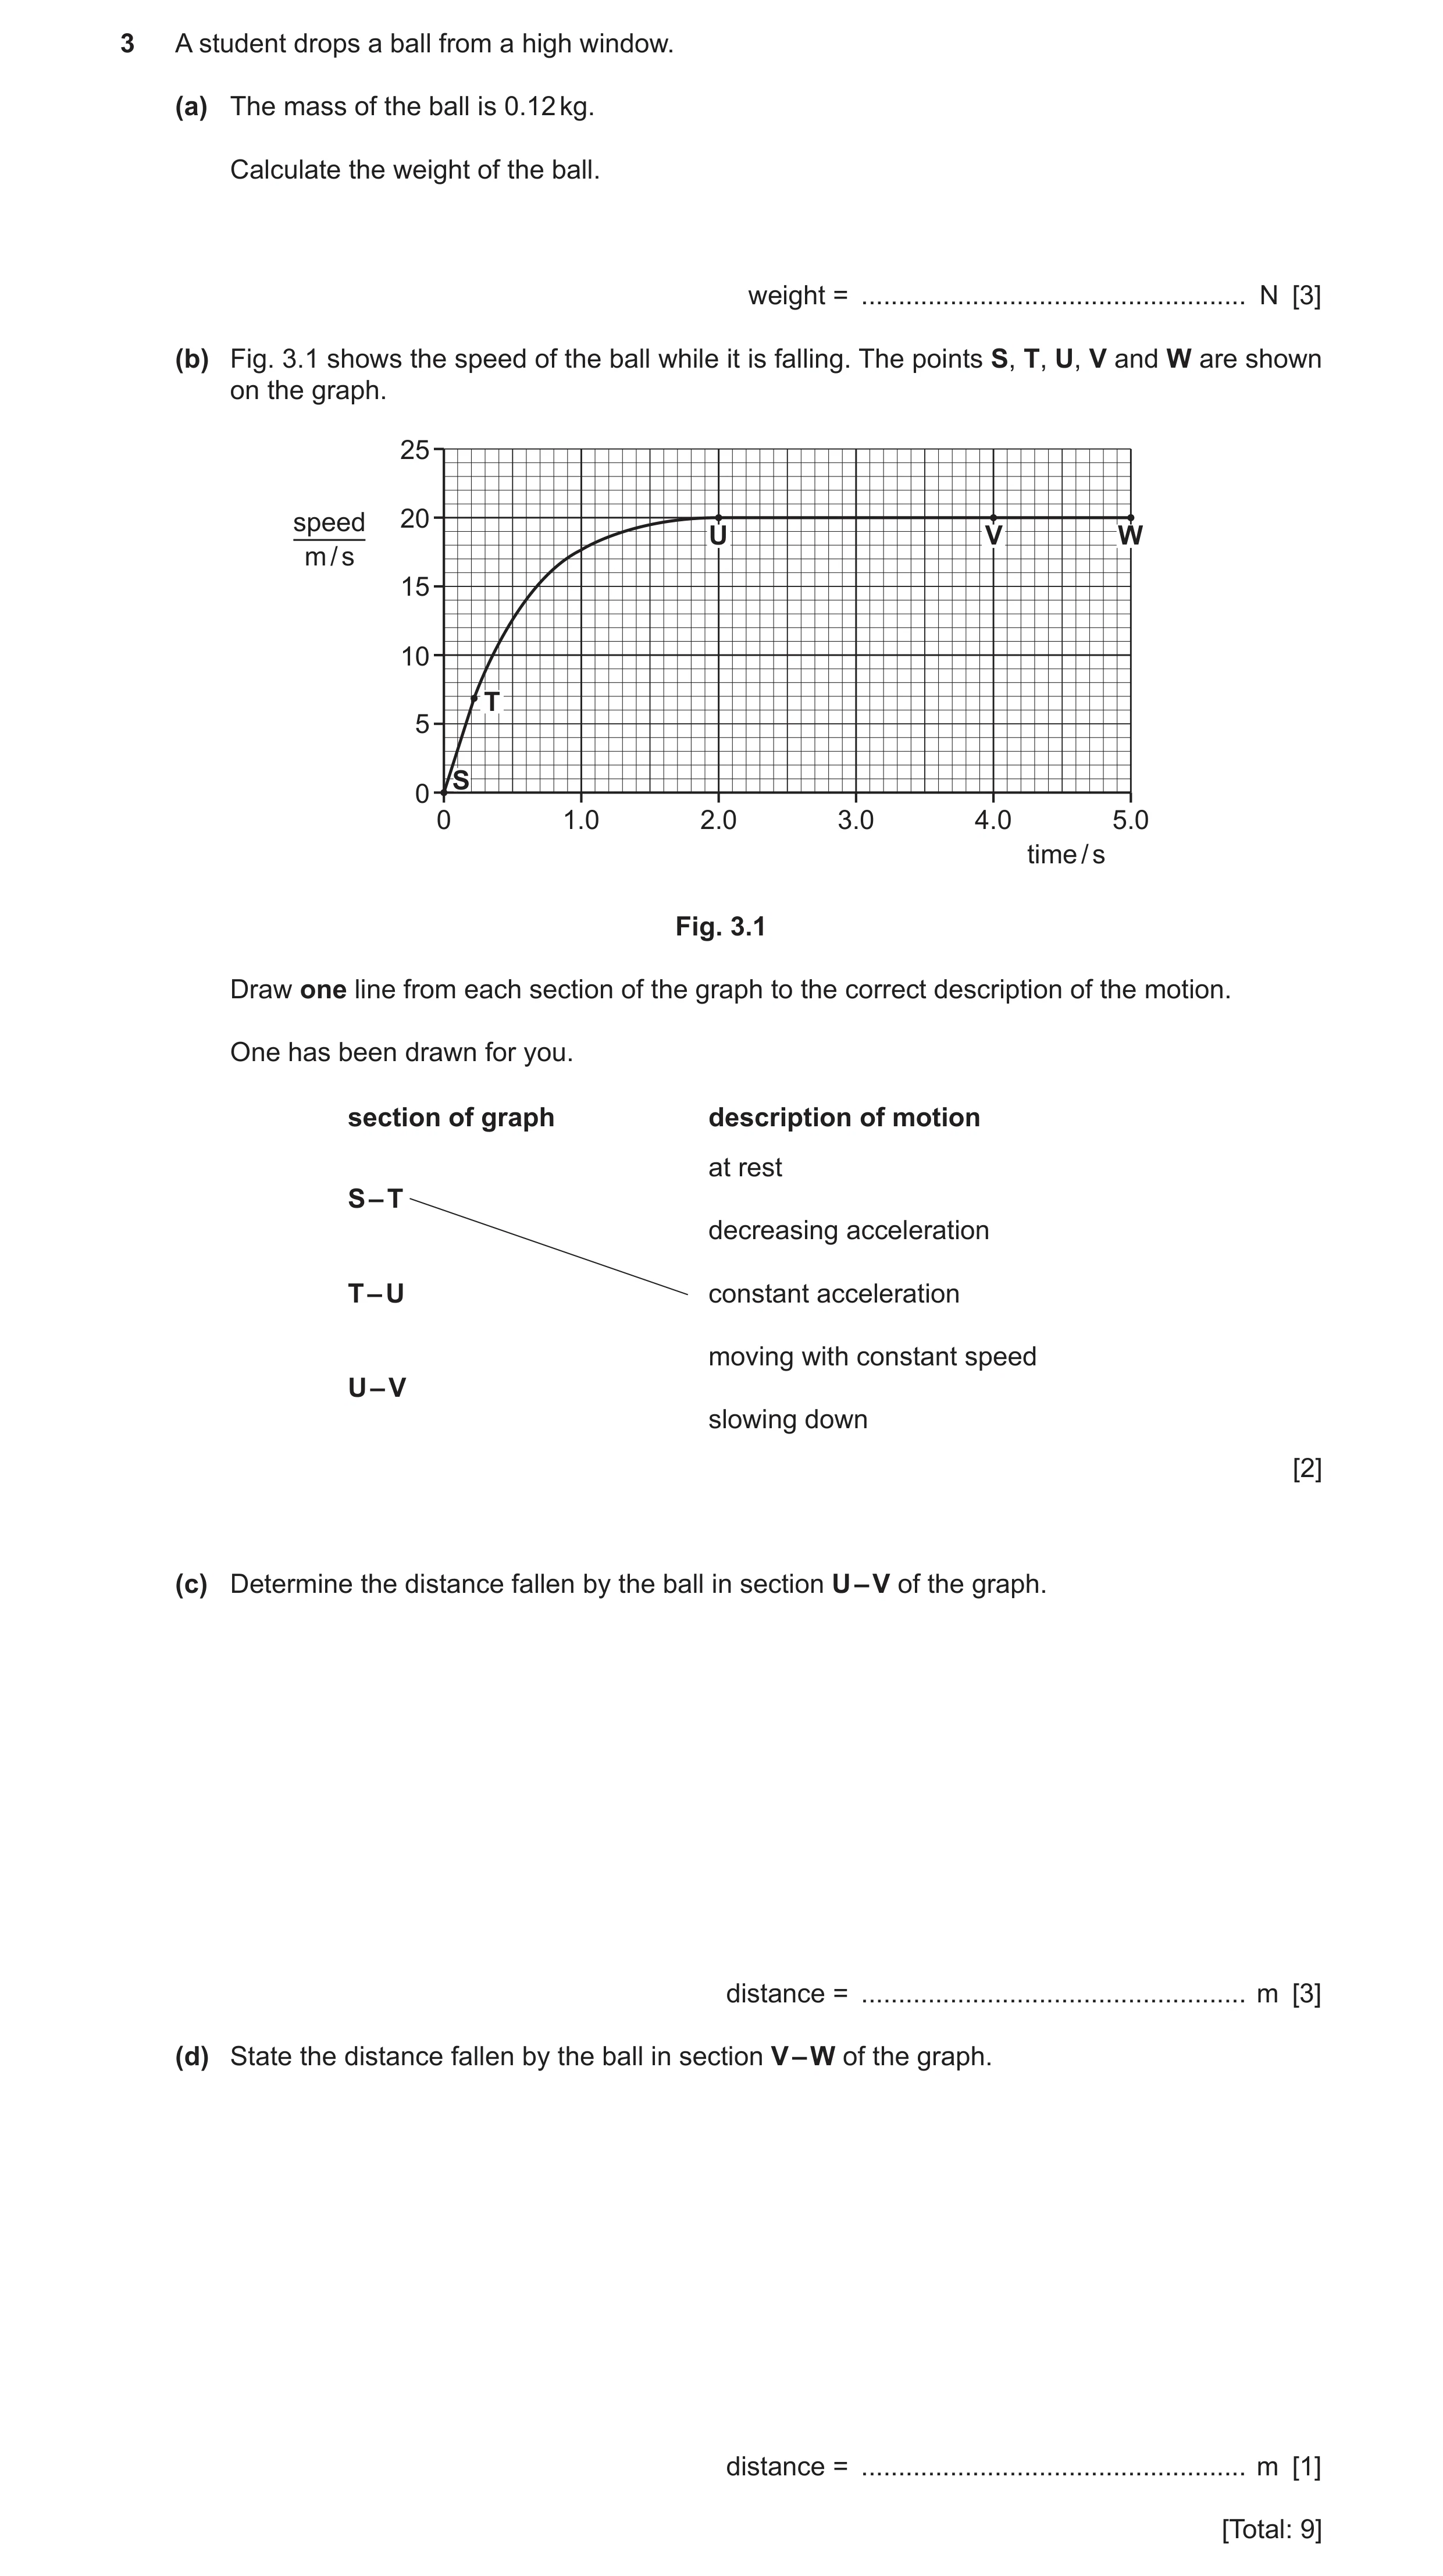
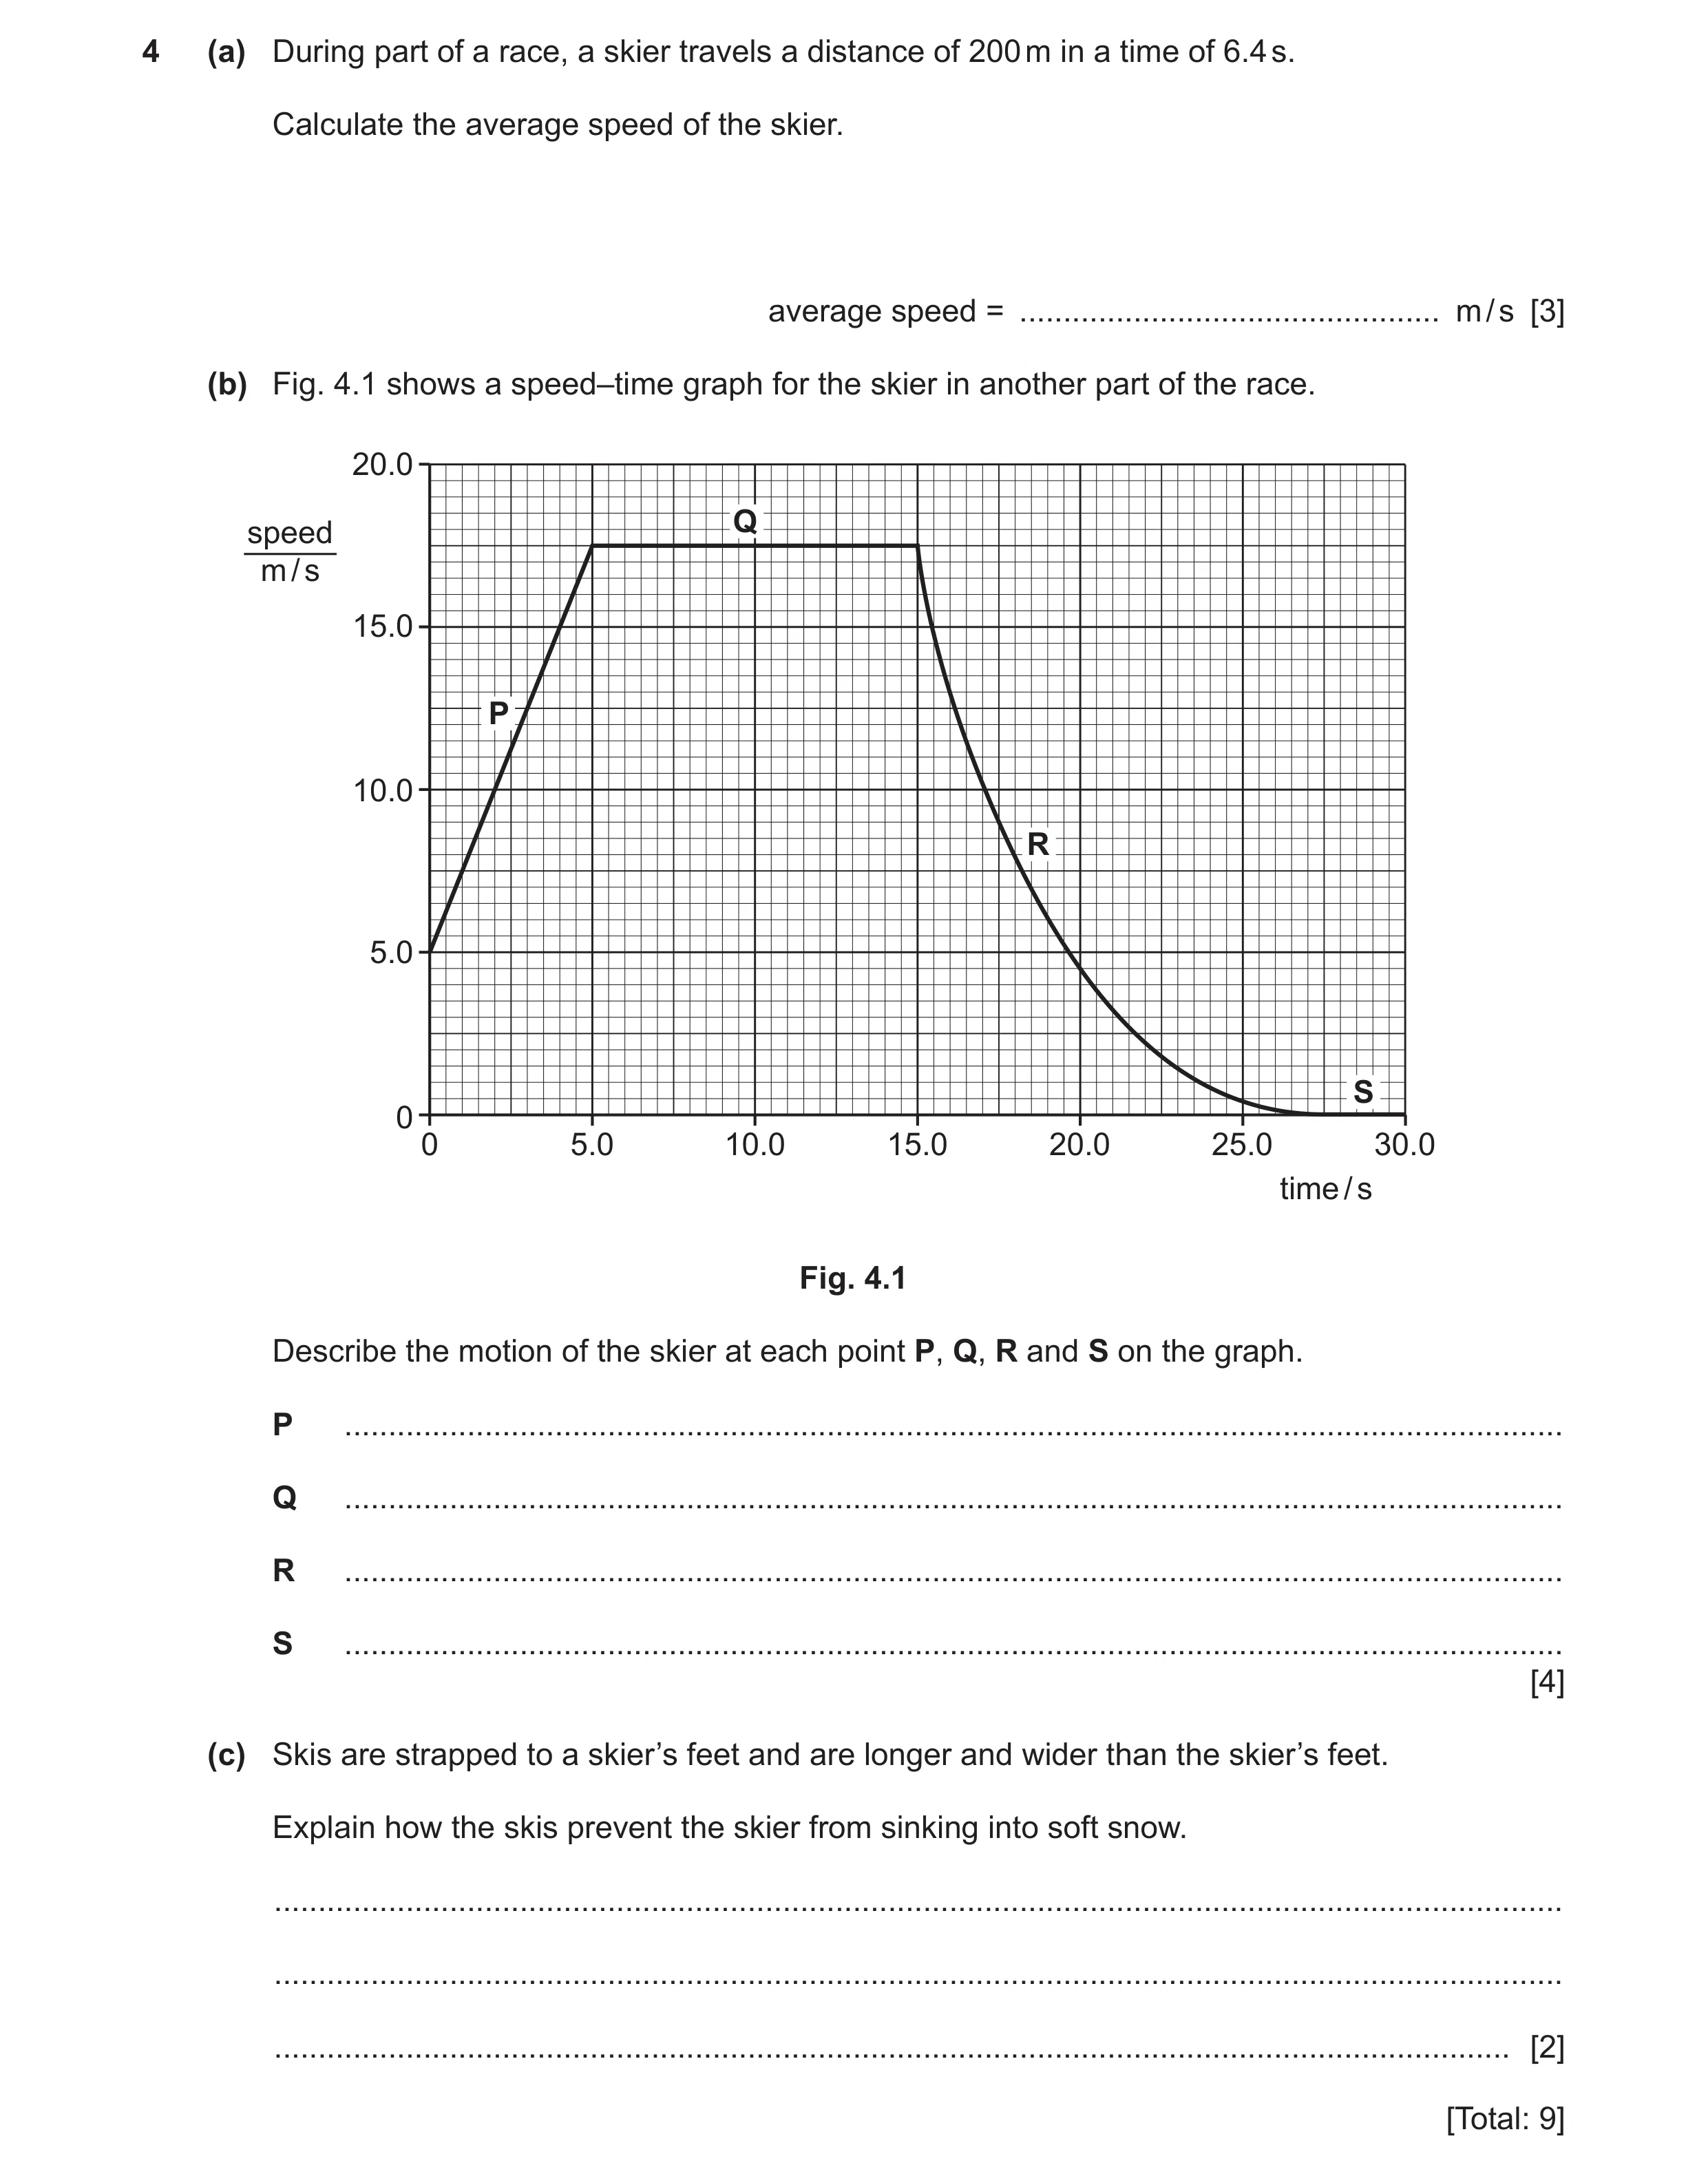 34 / 101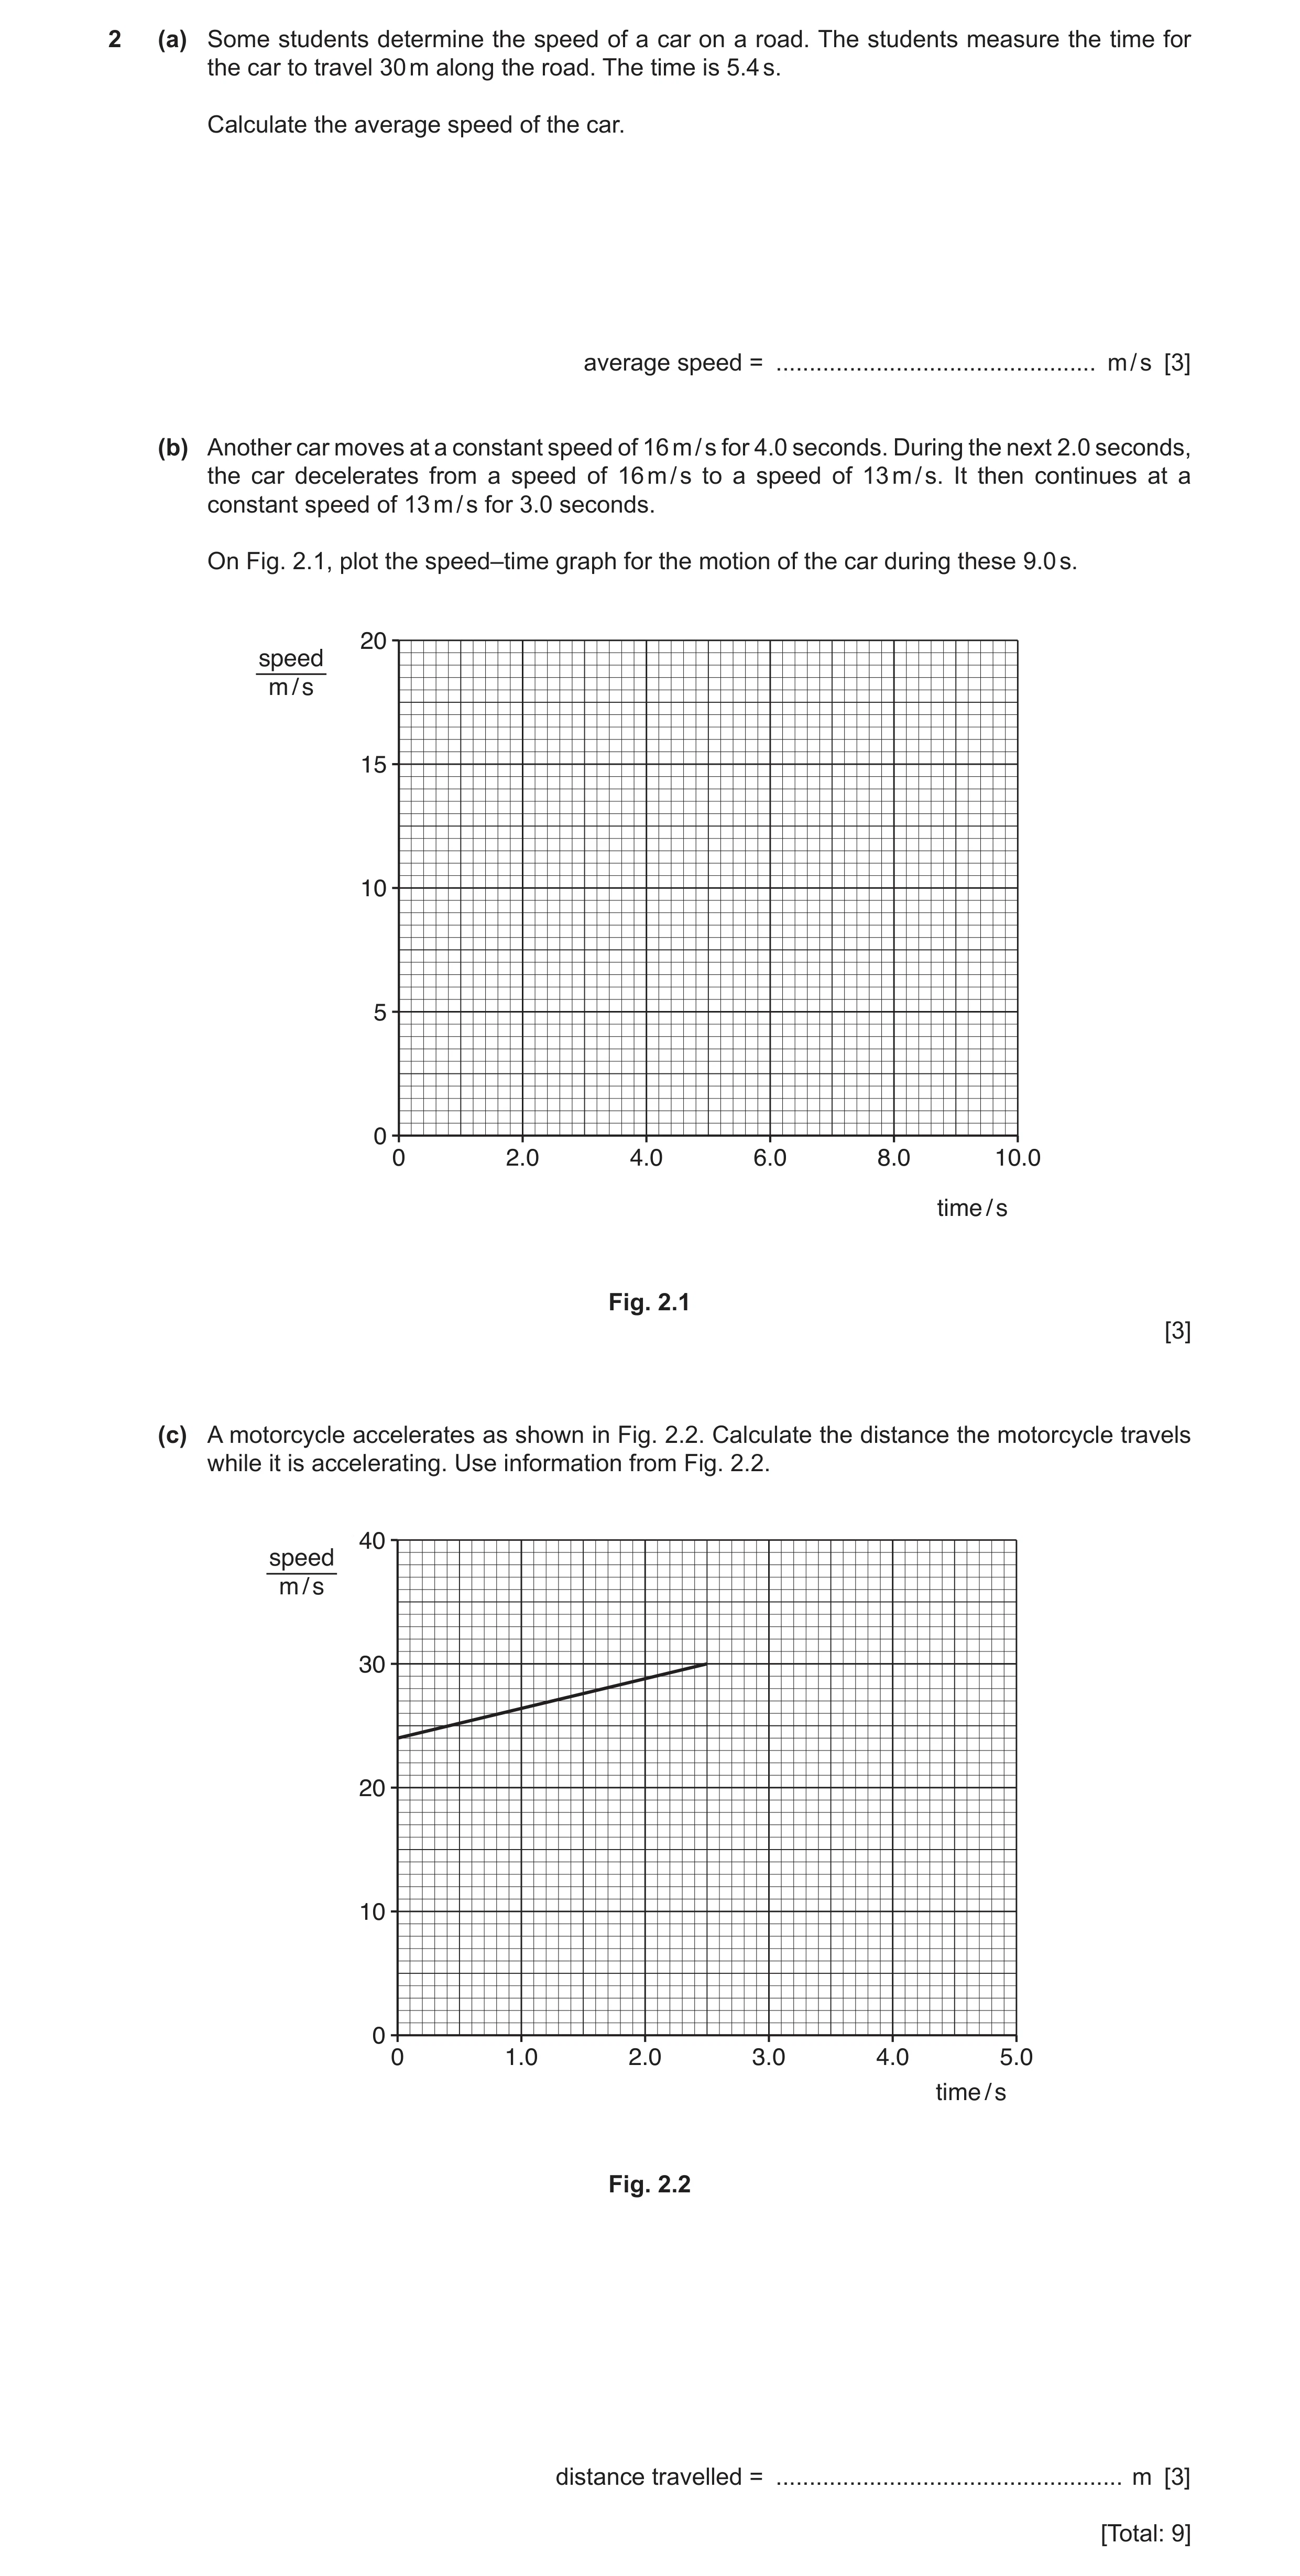
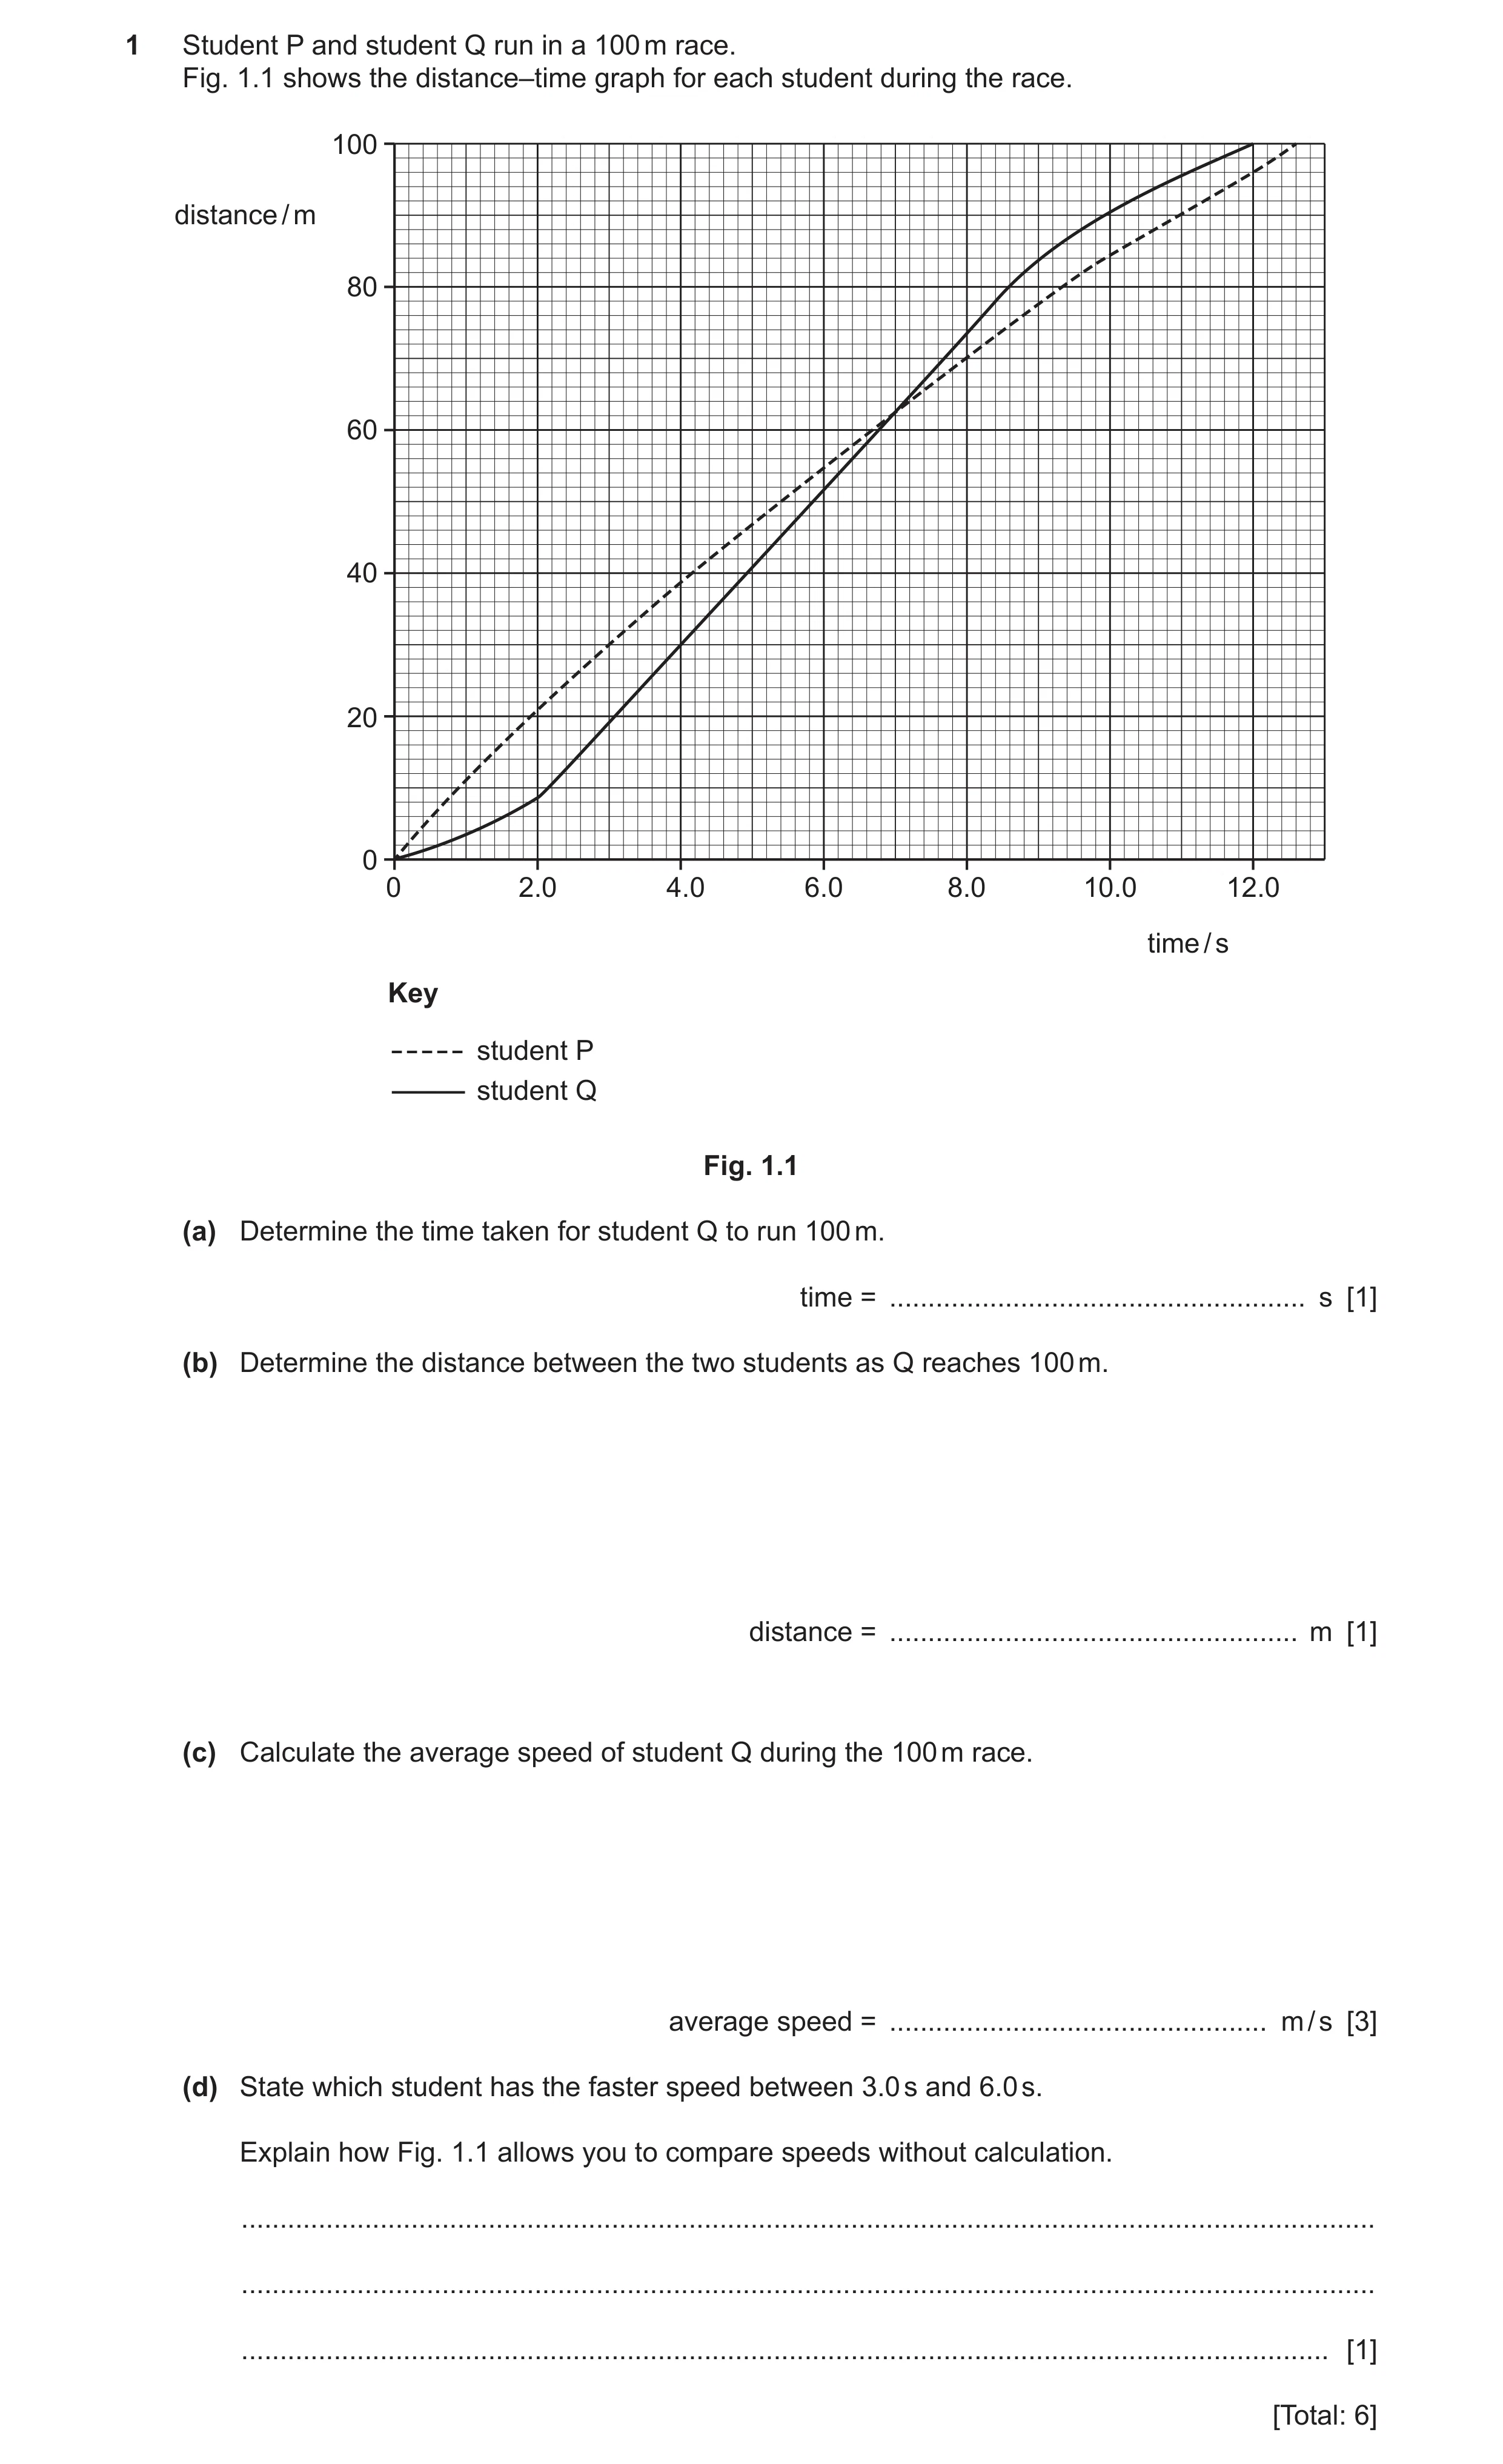
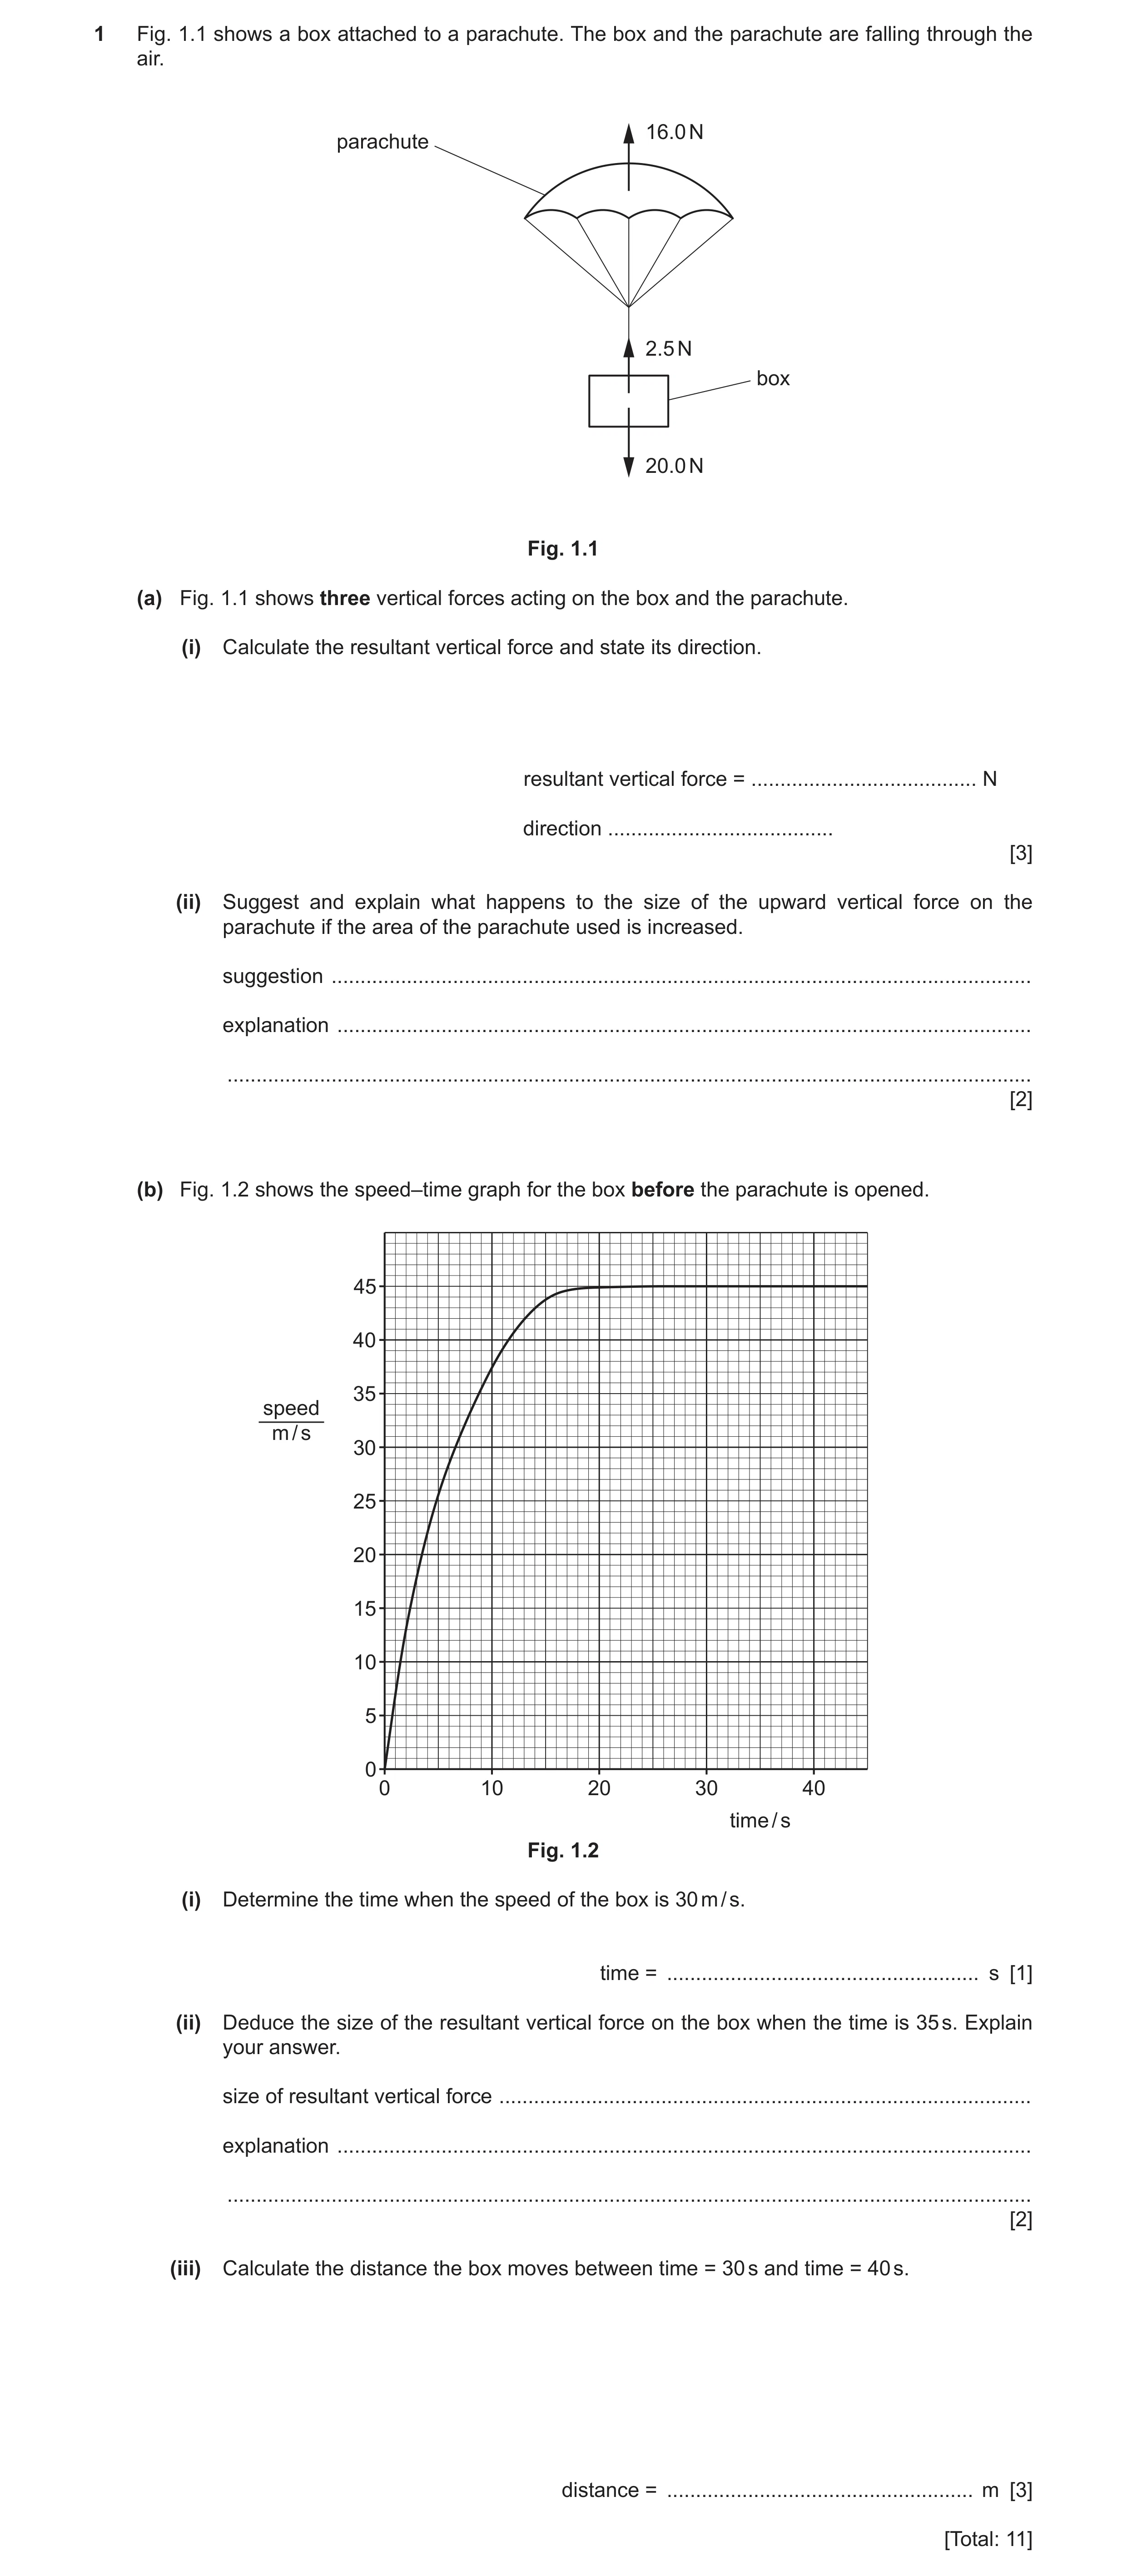
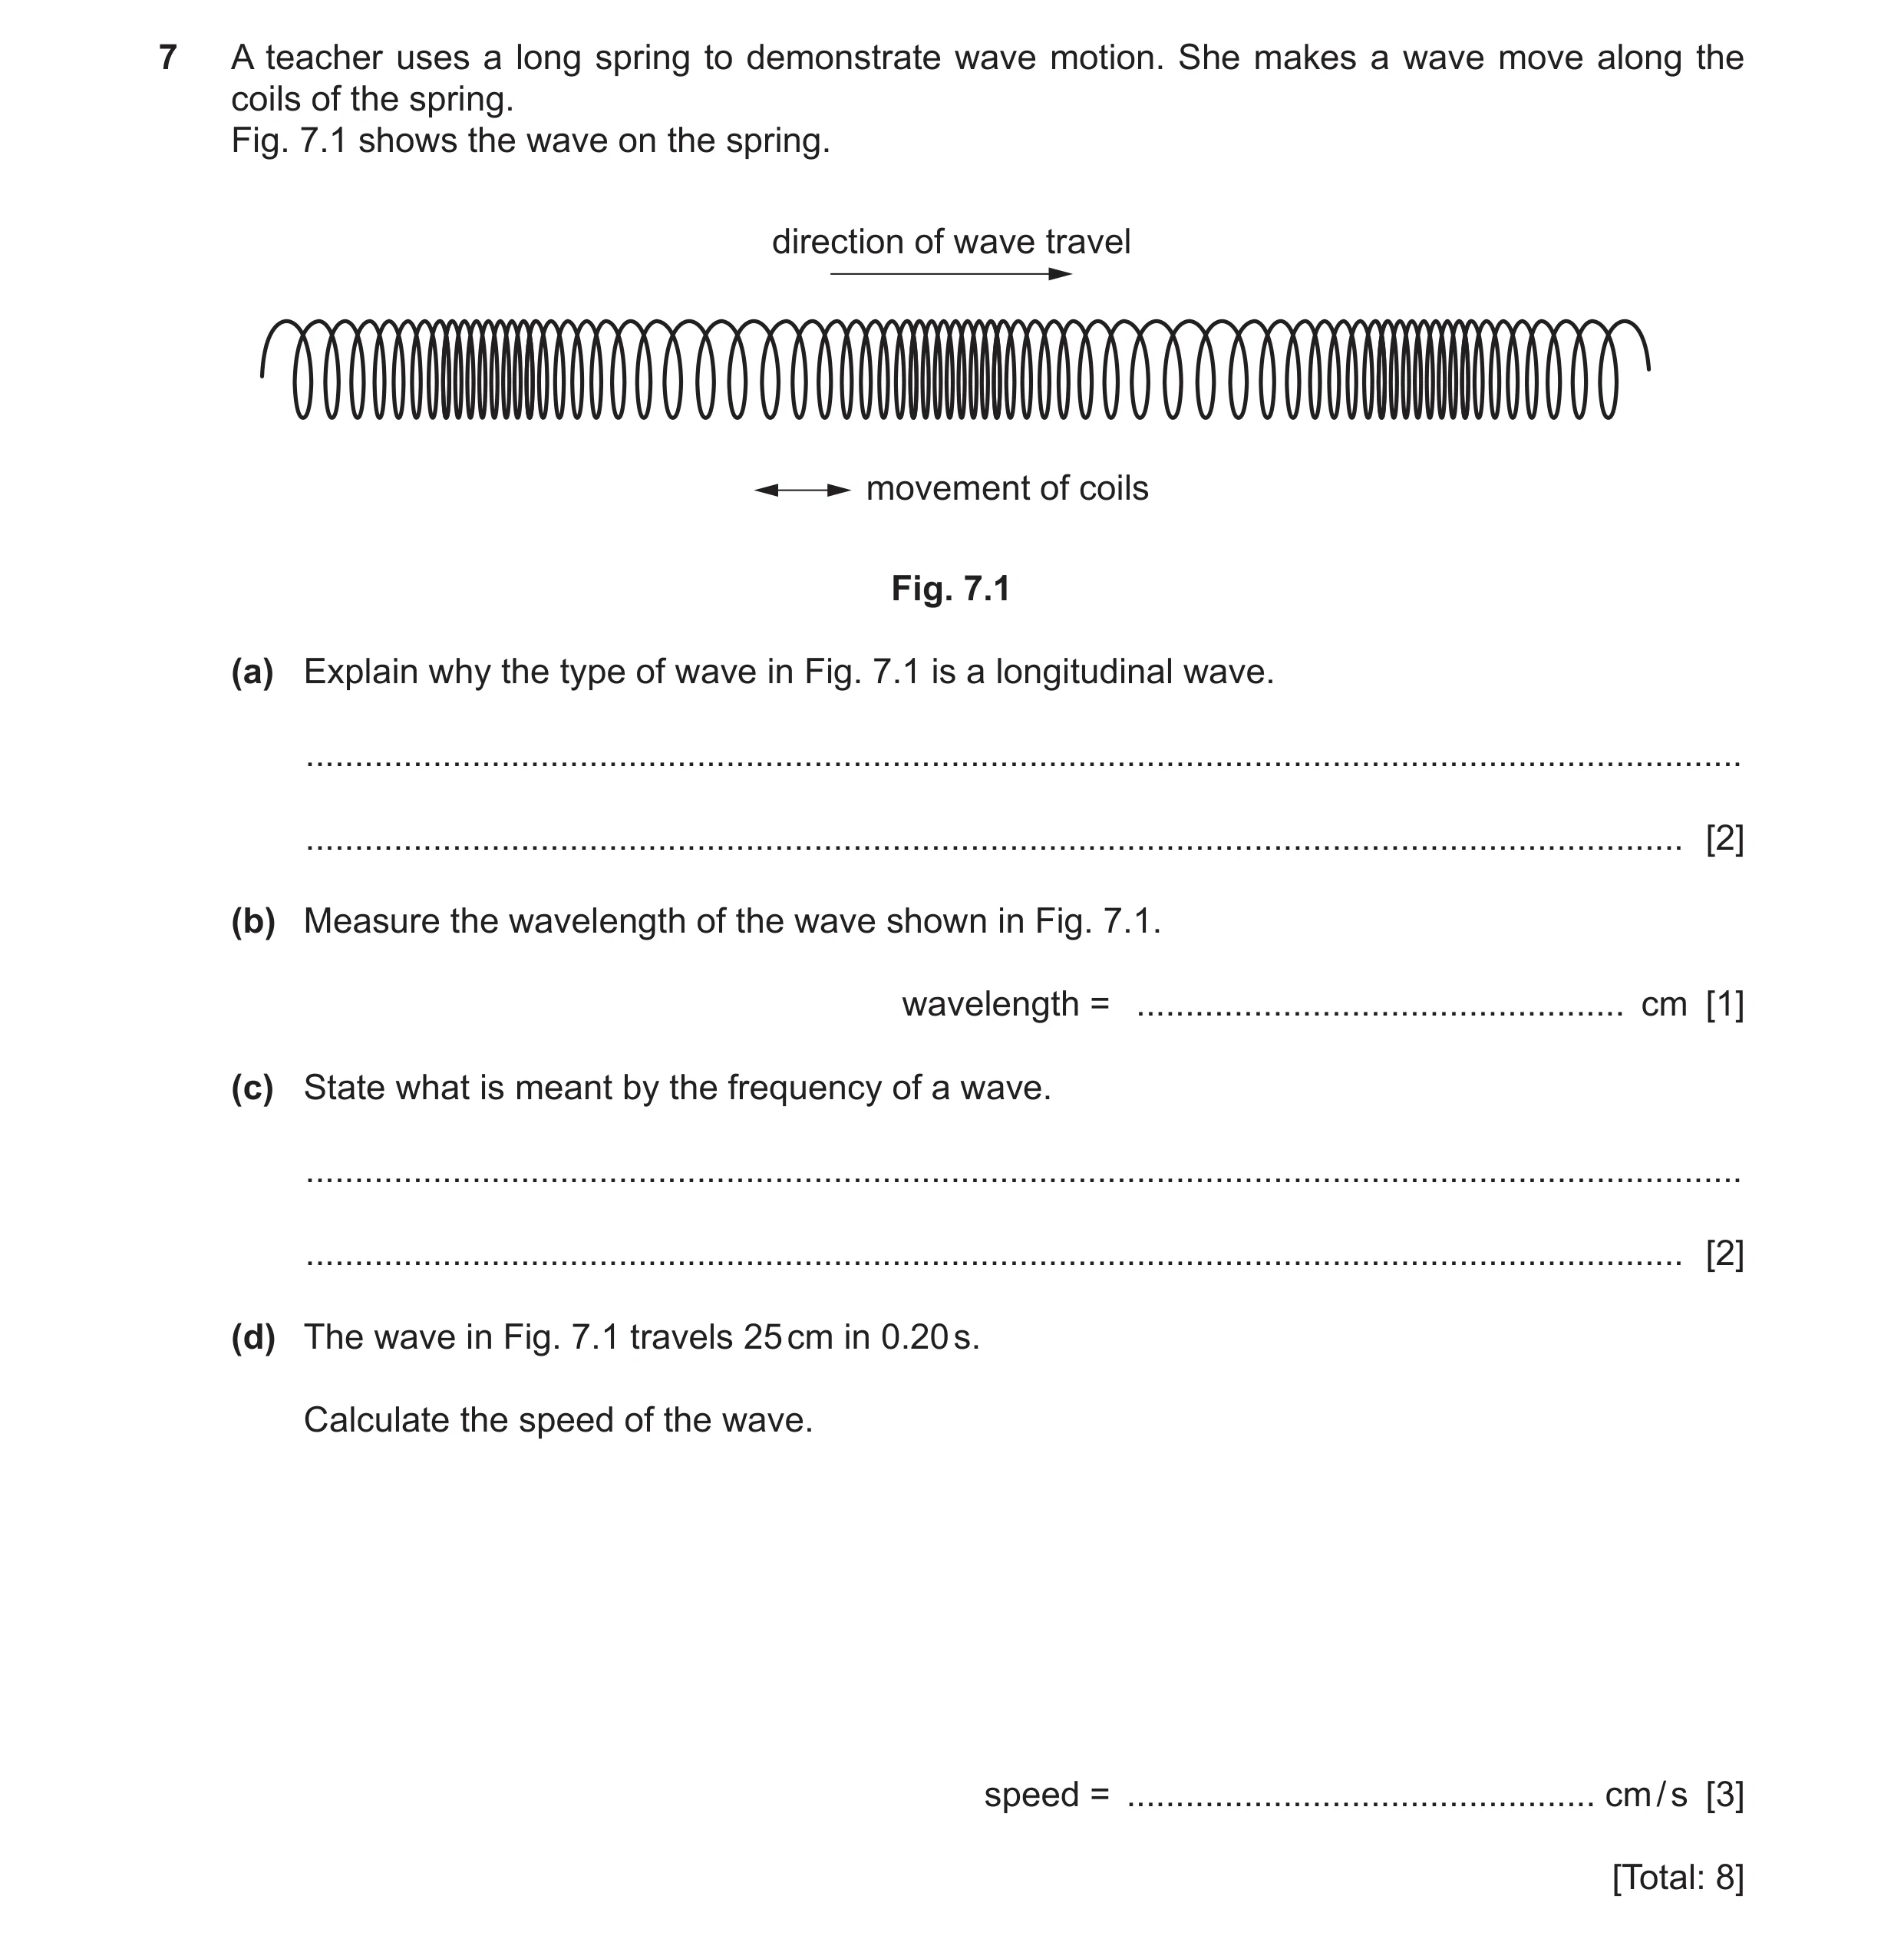 40 / 101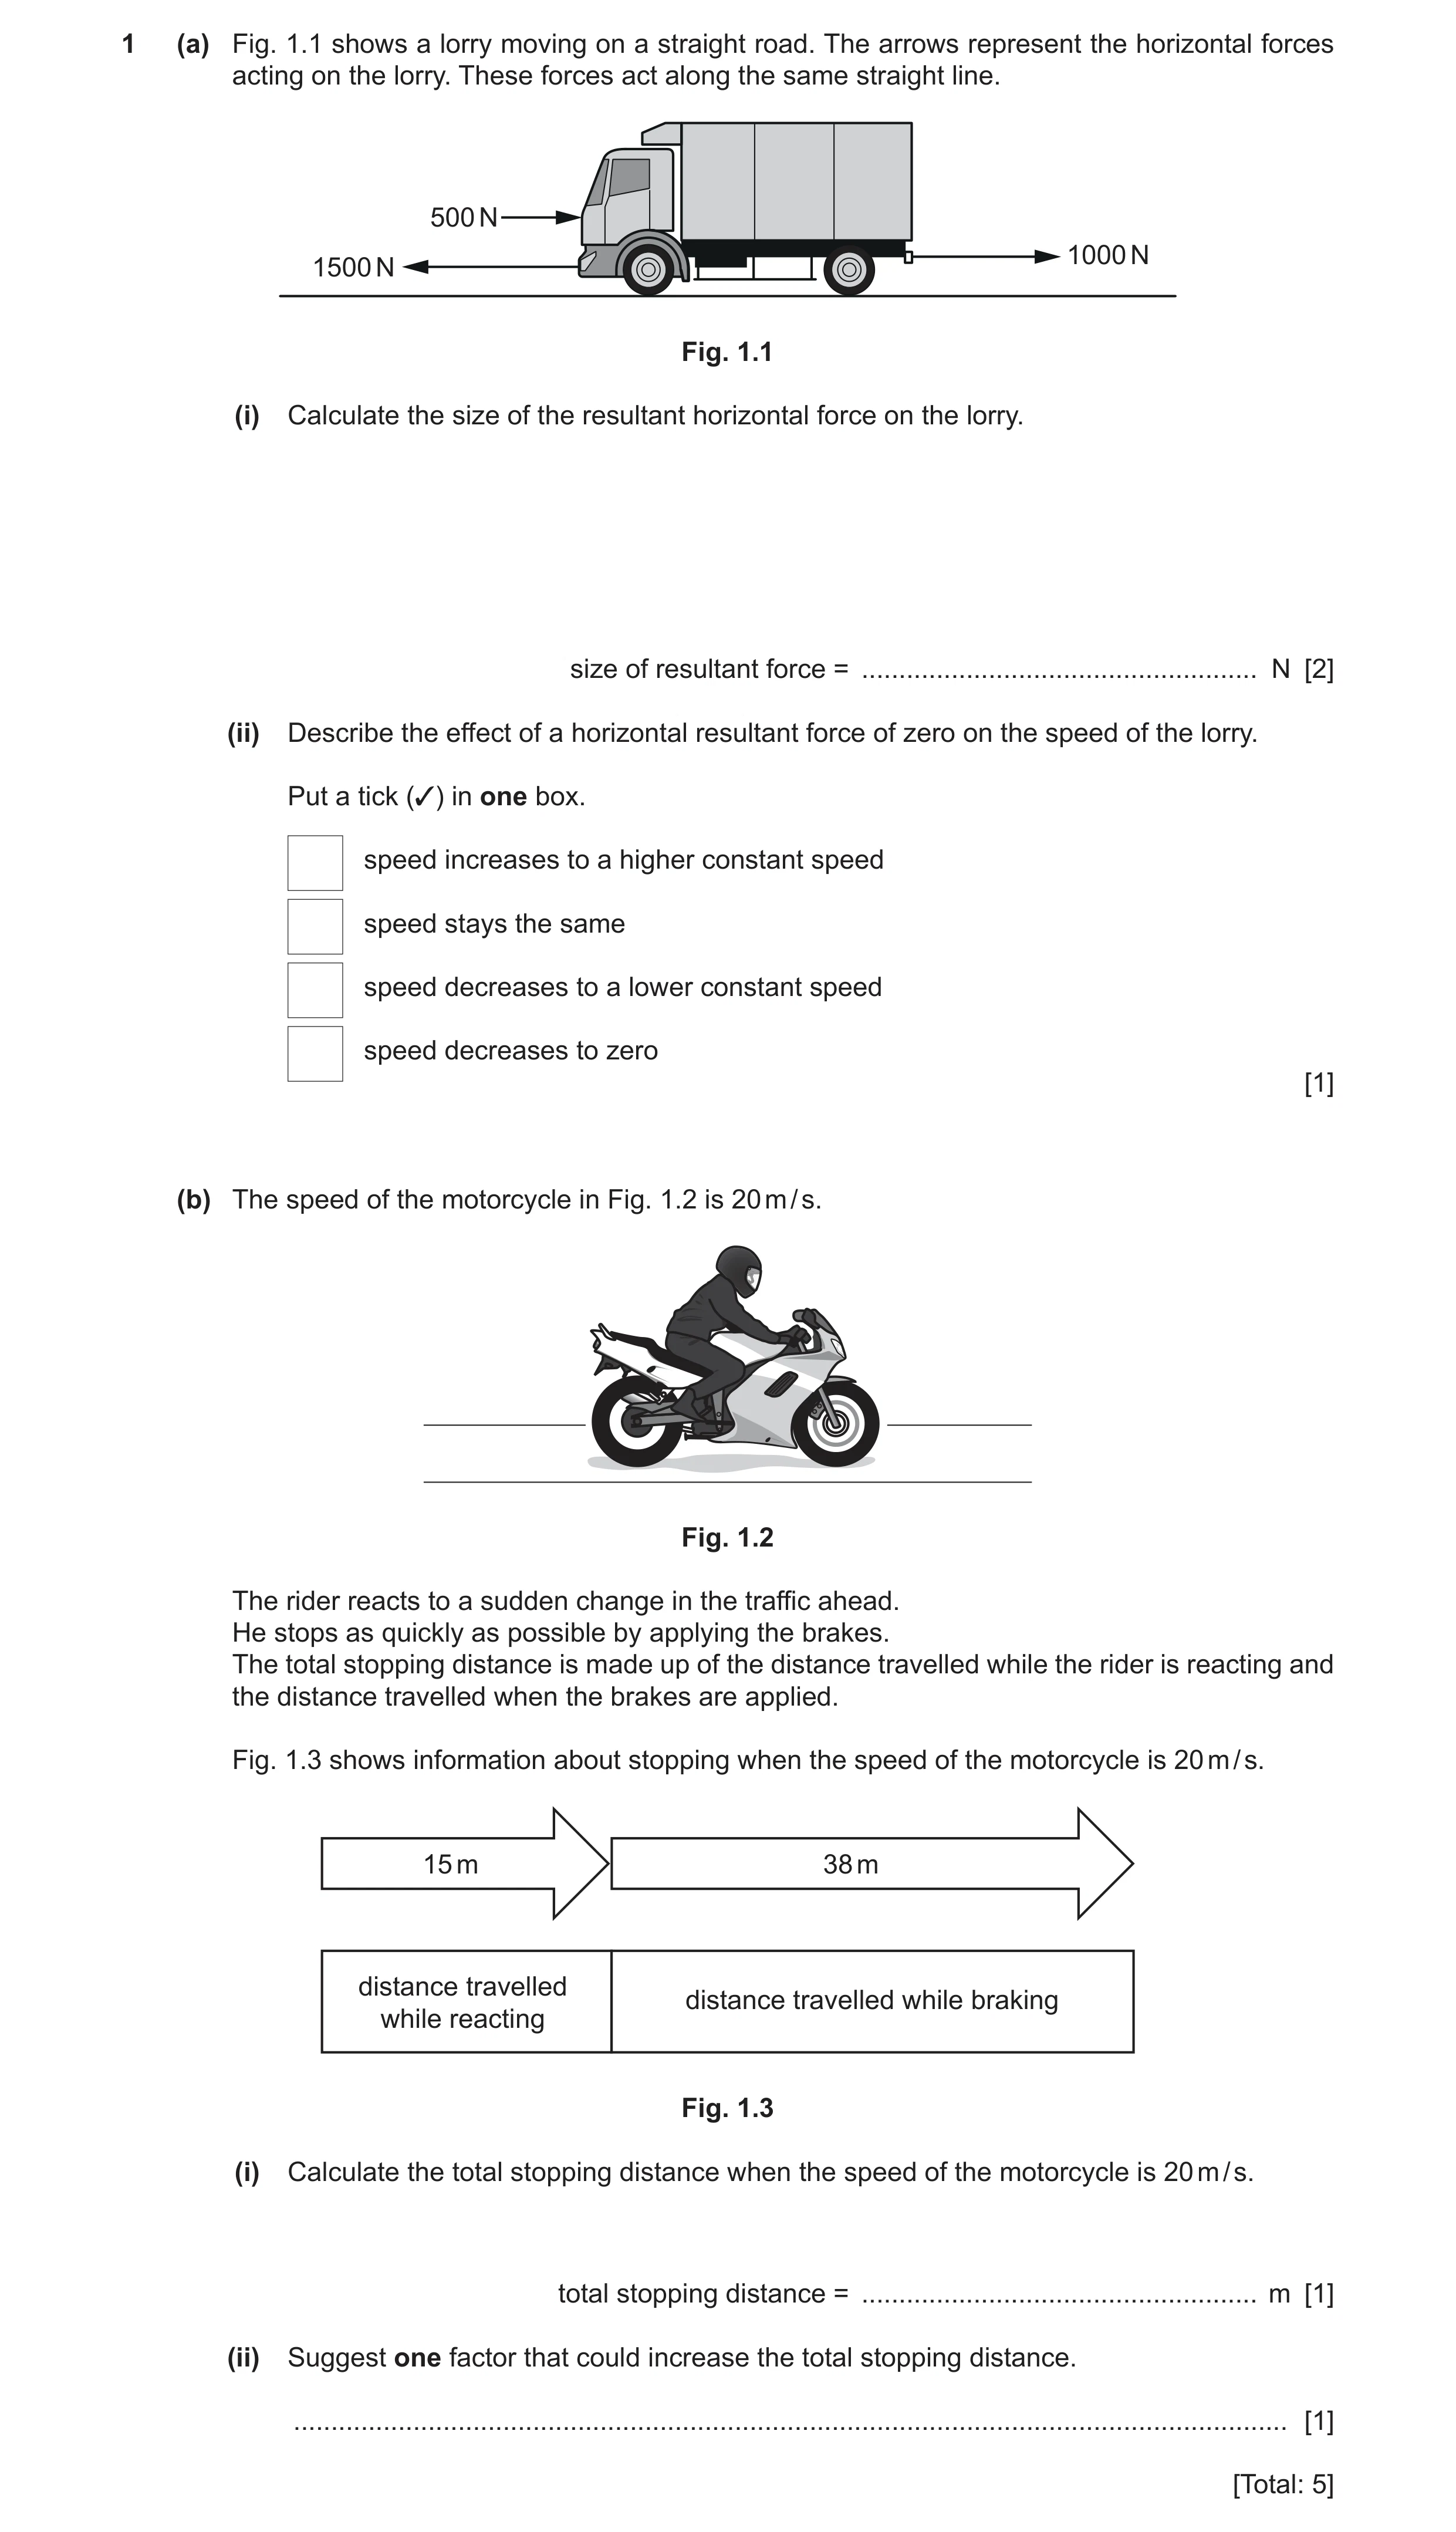
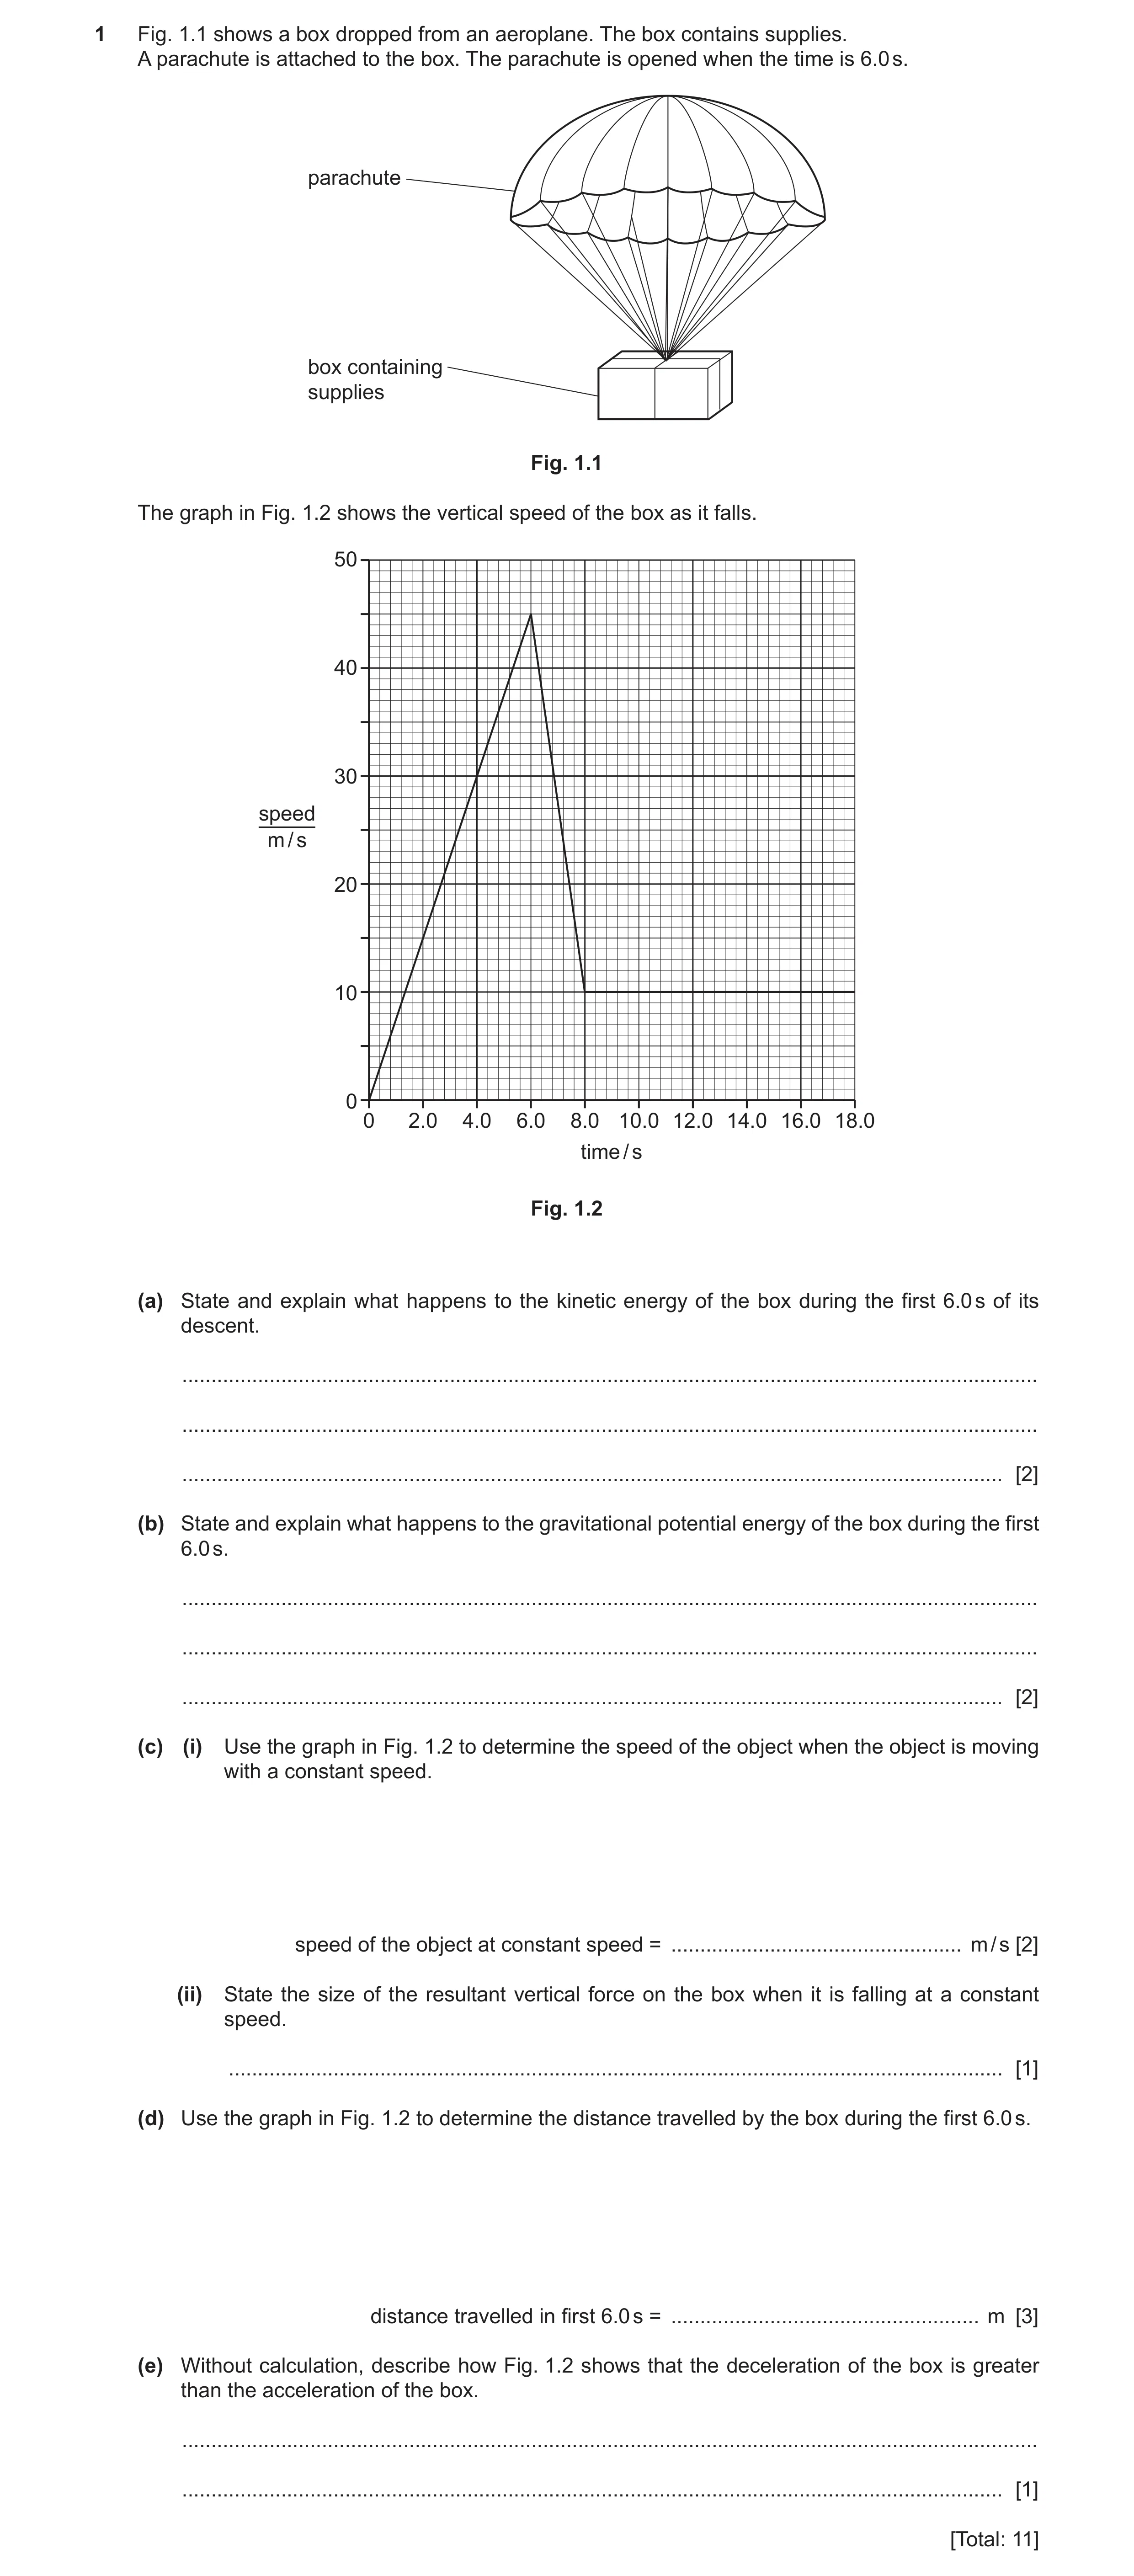
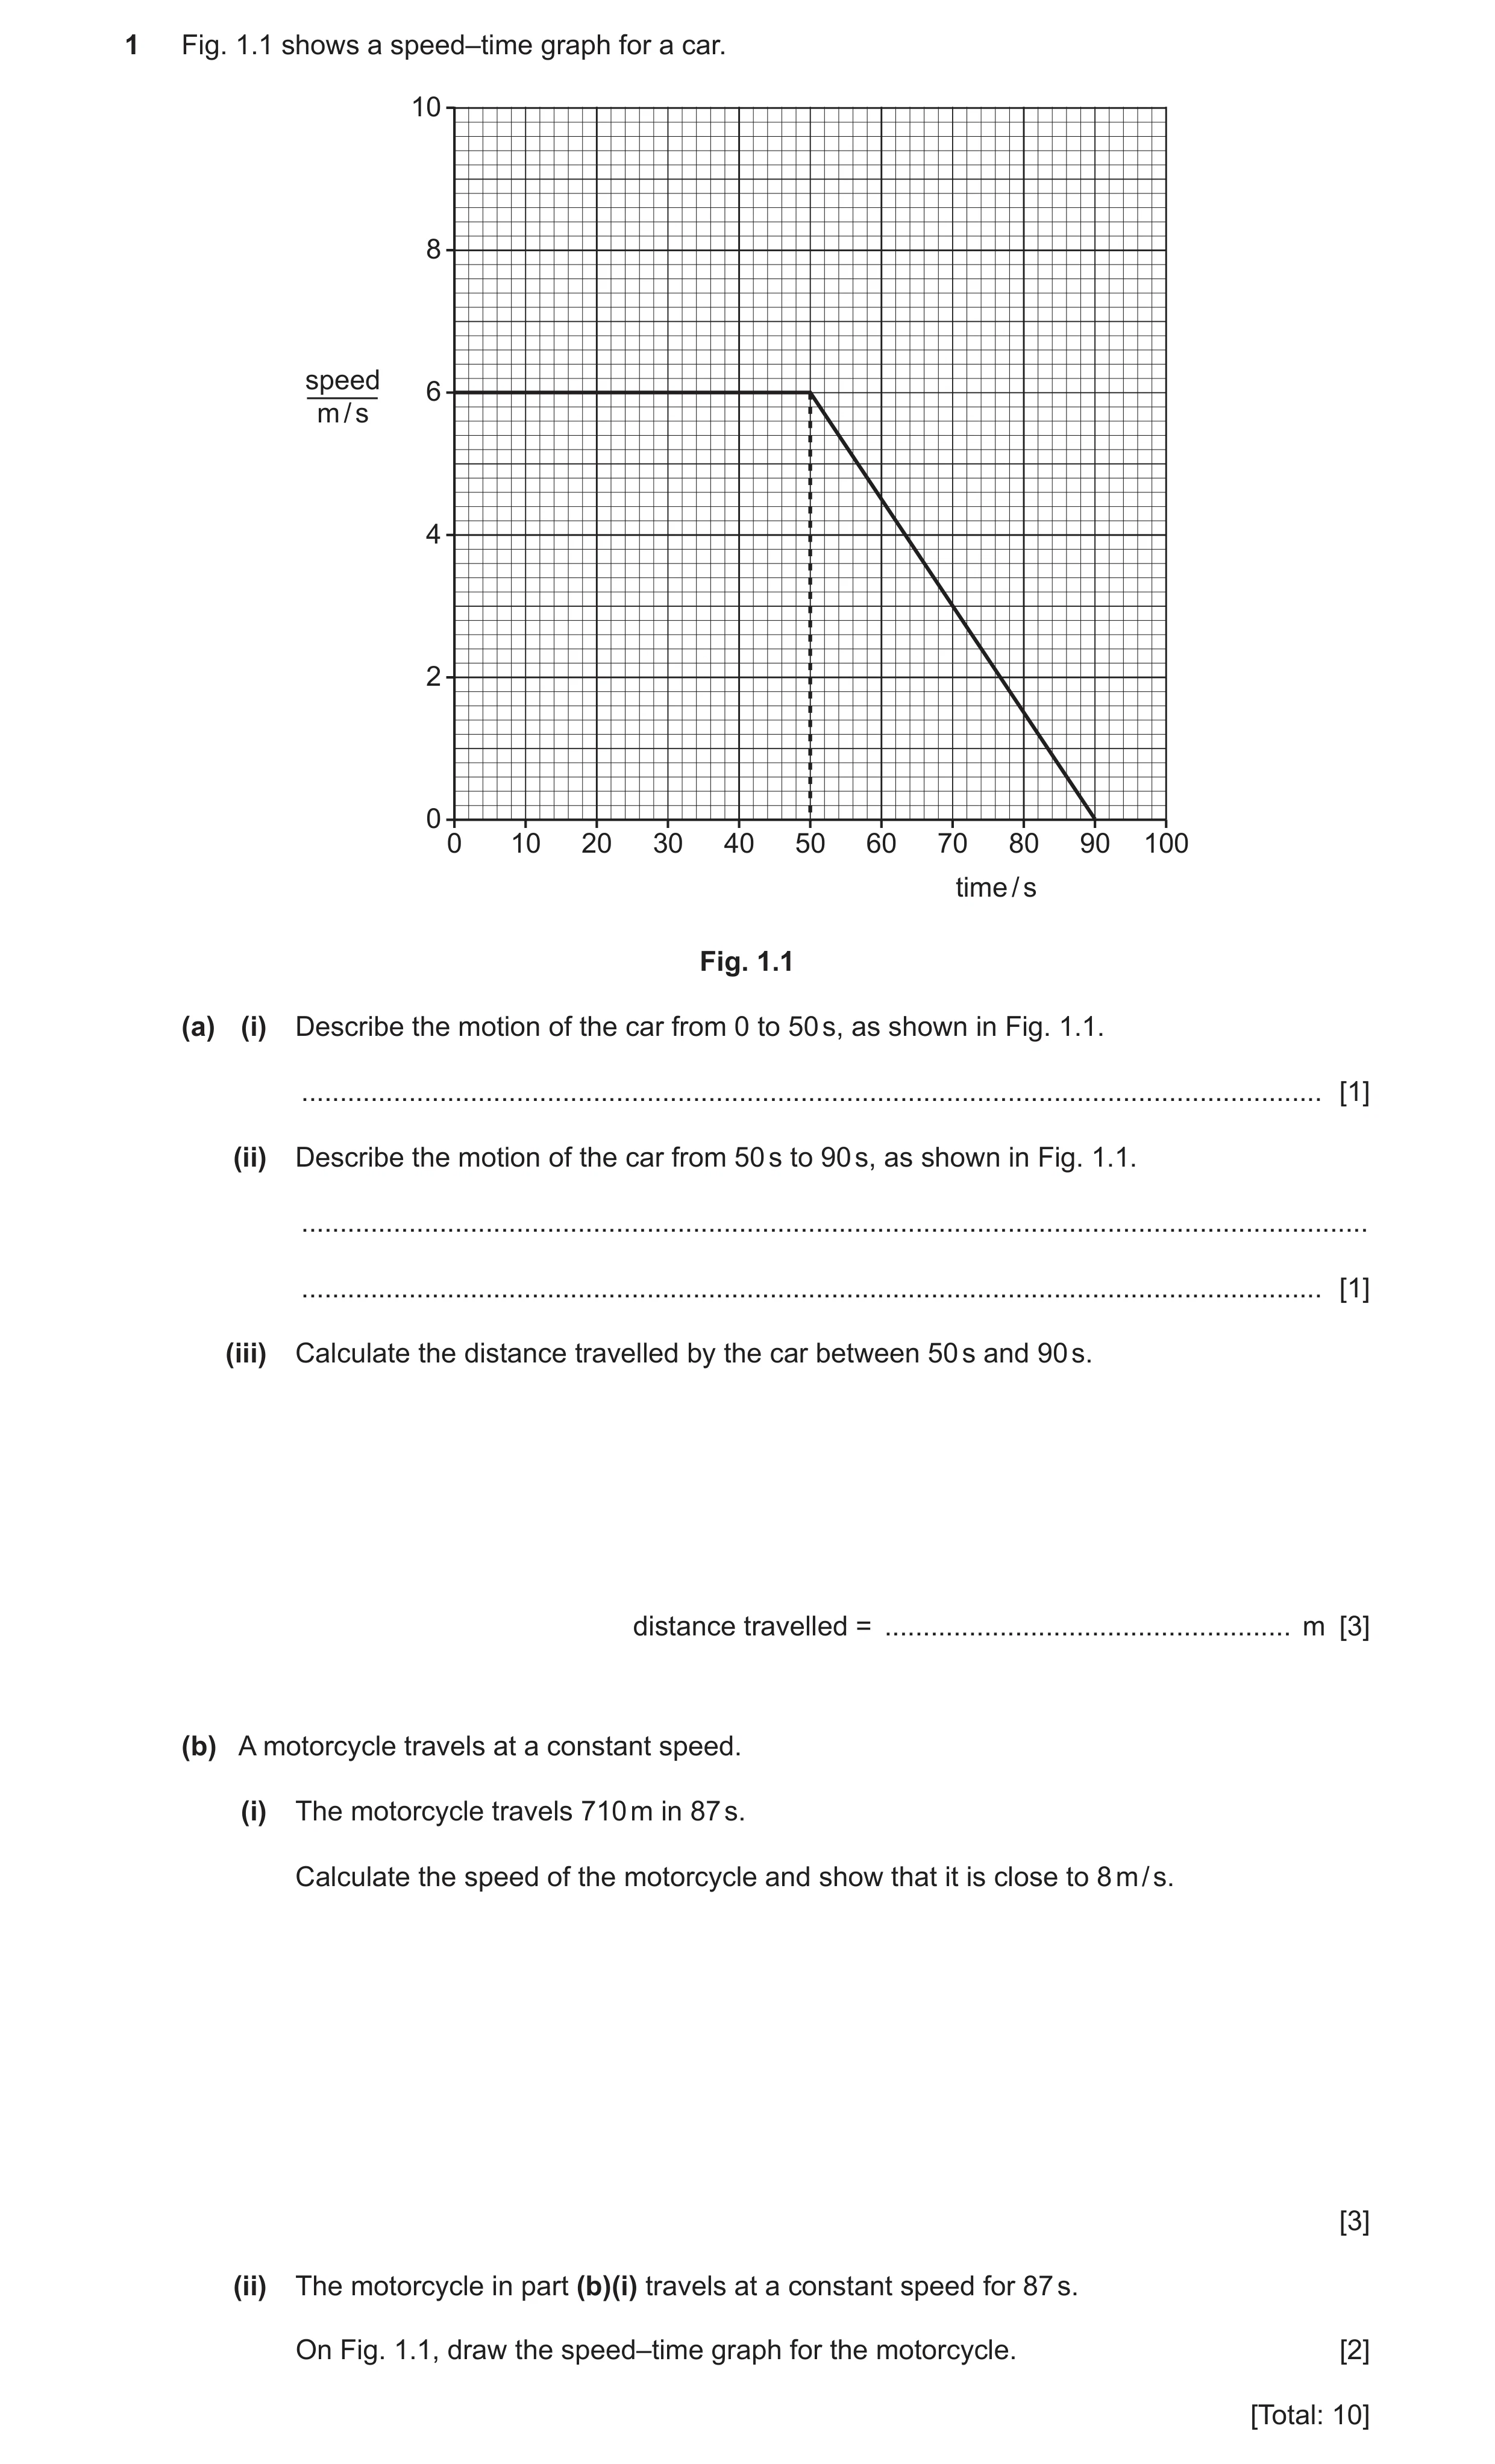
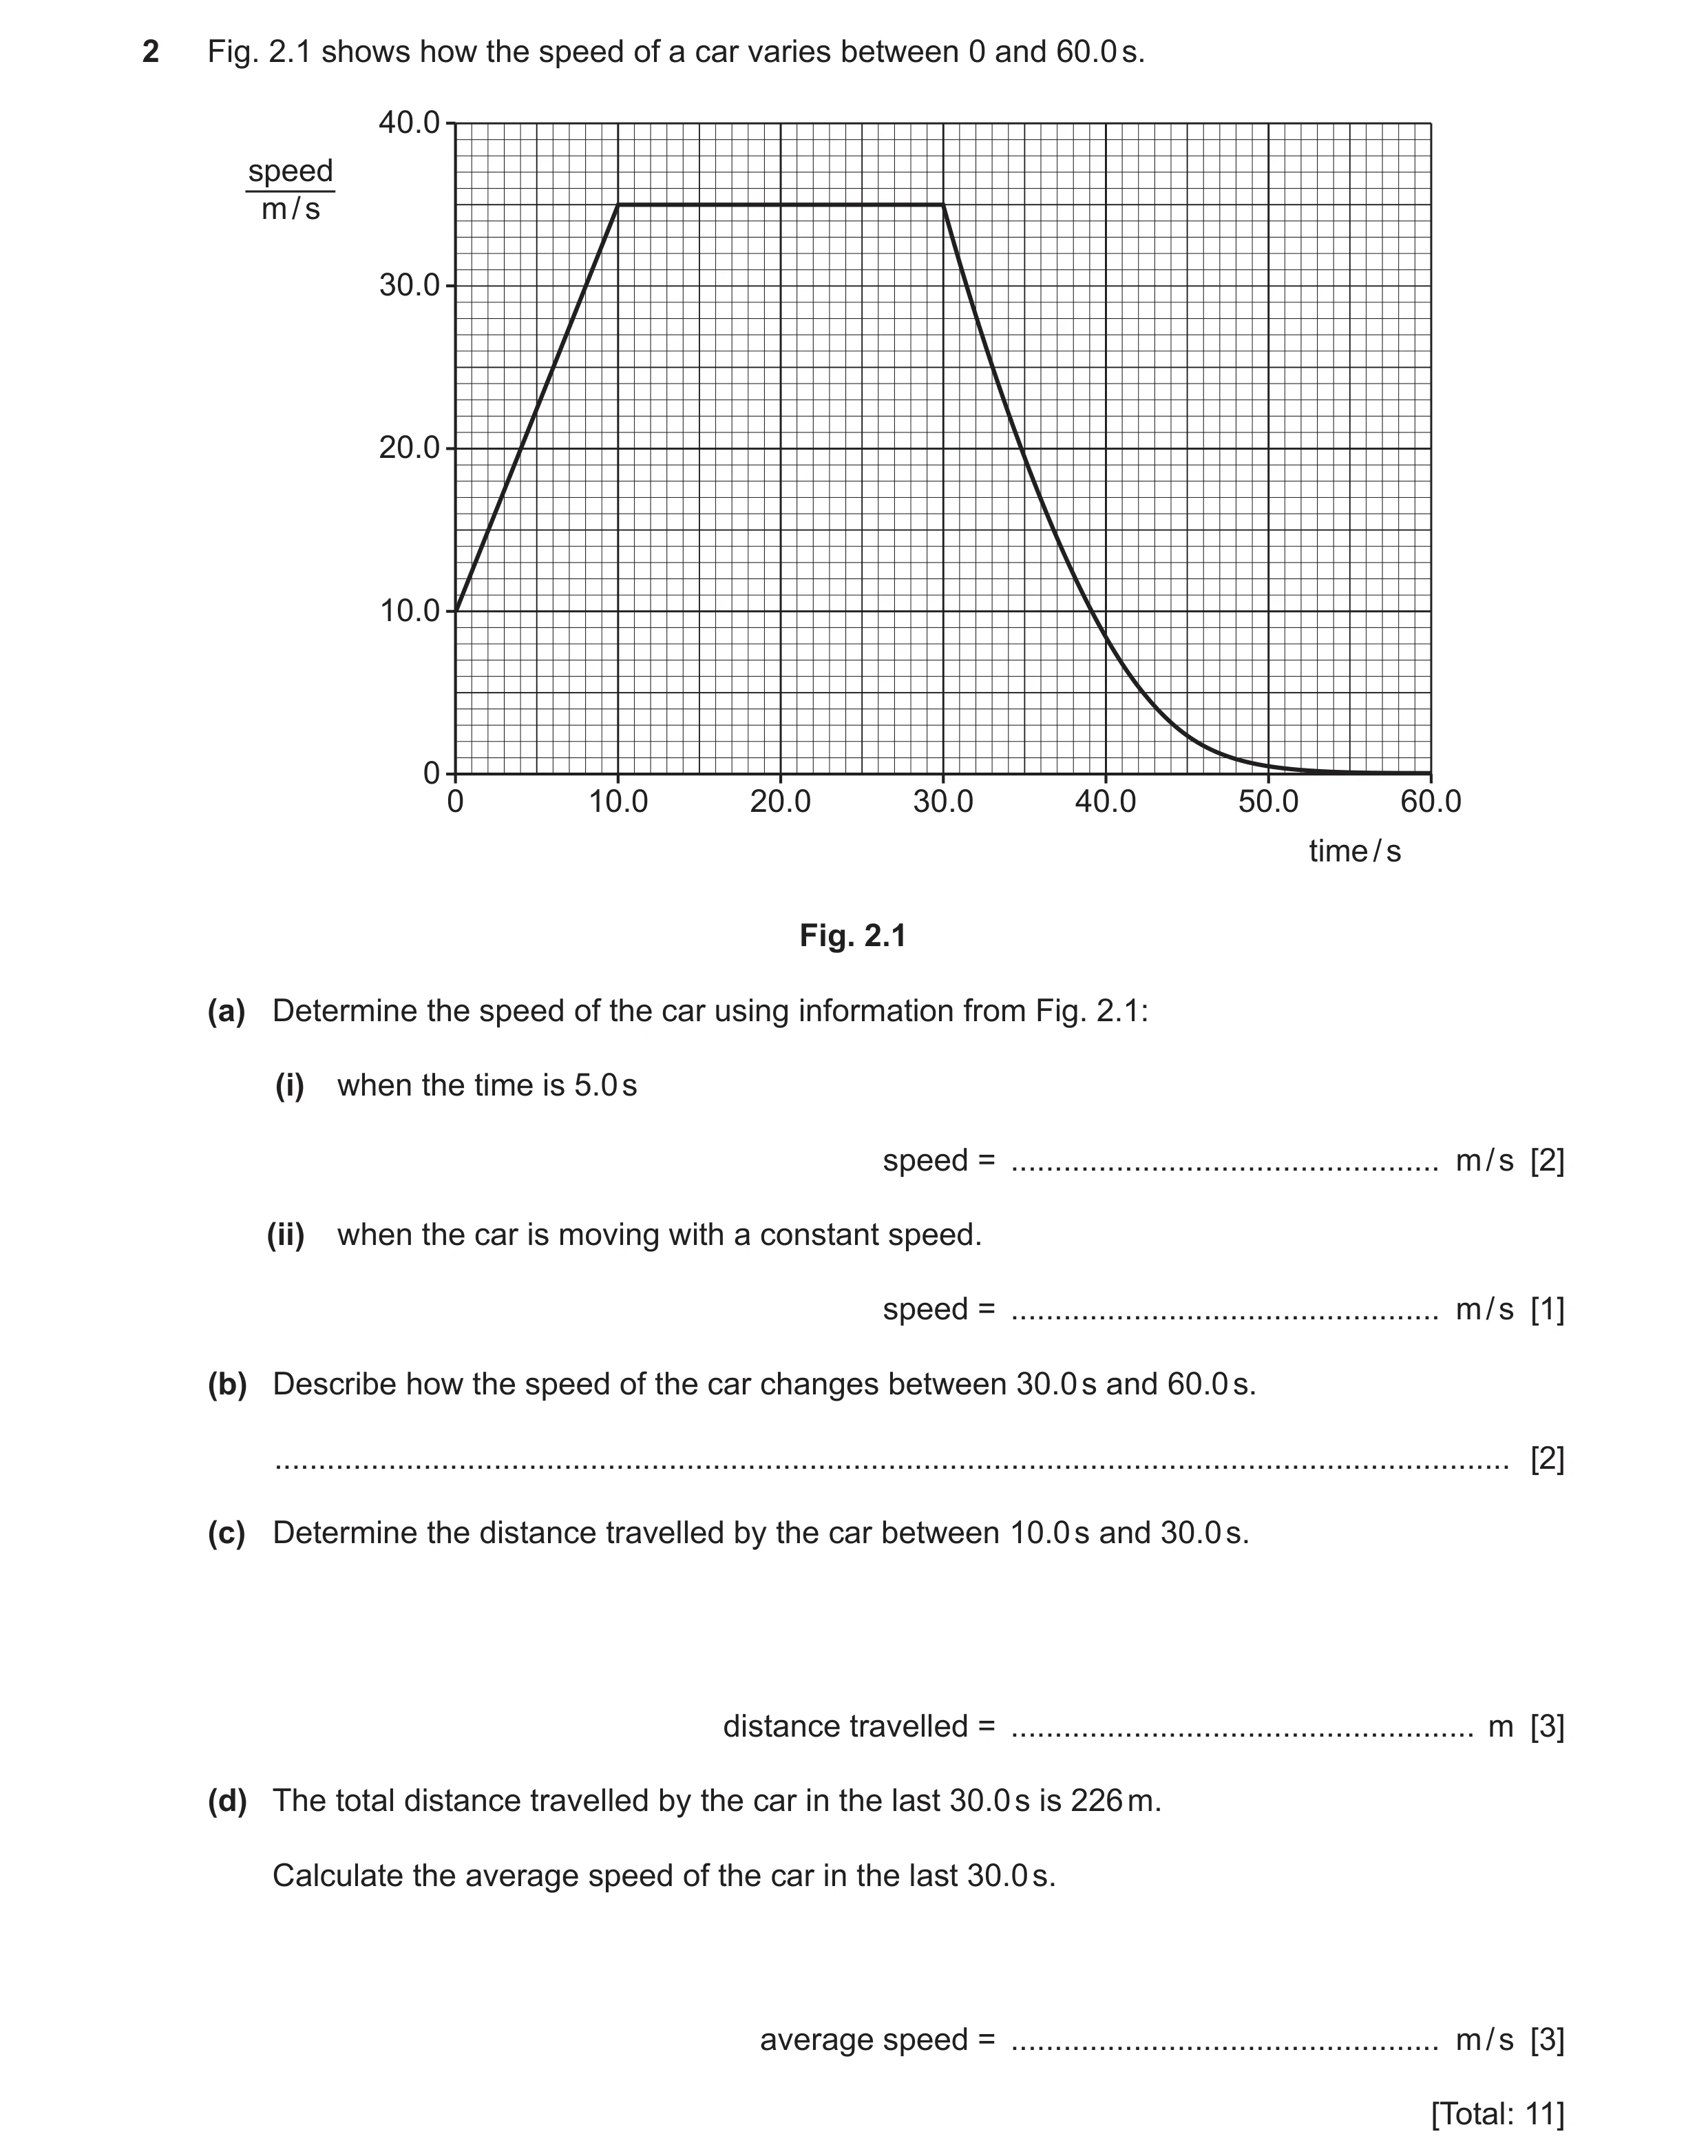 46 / 101
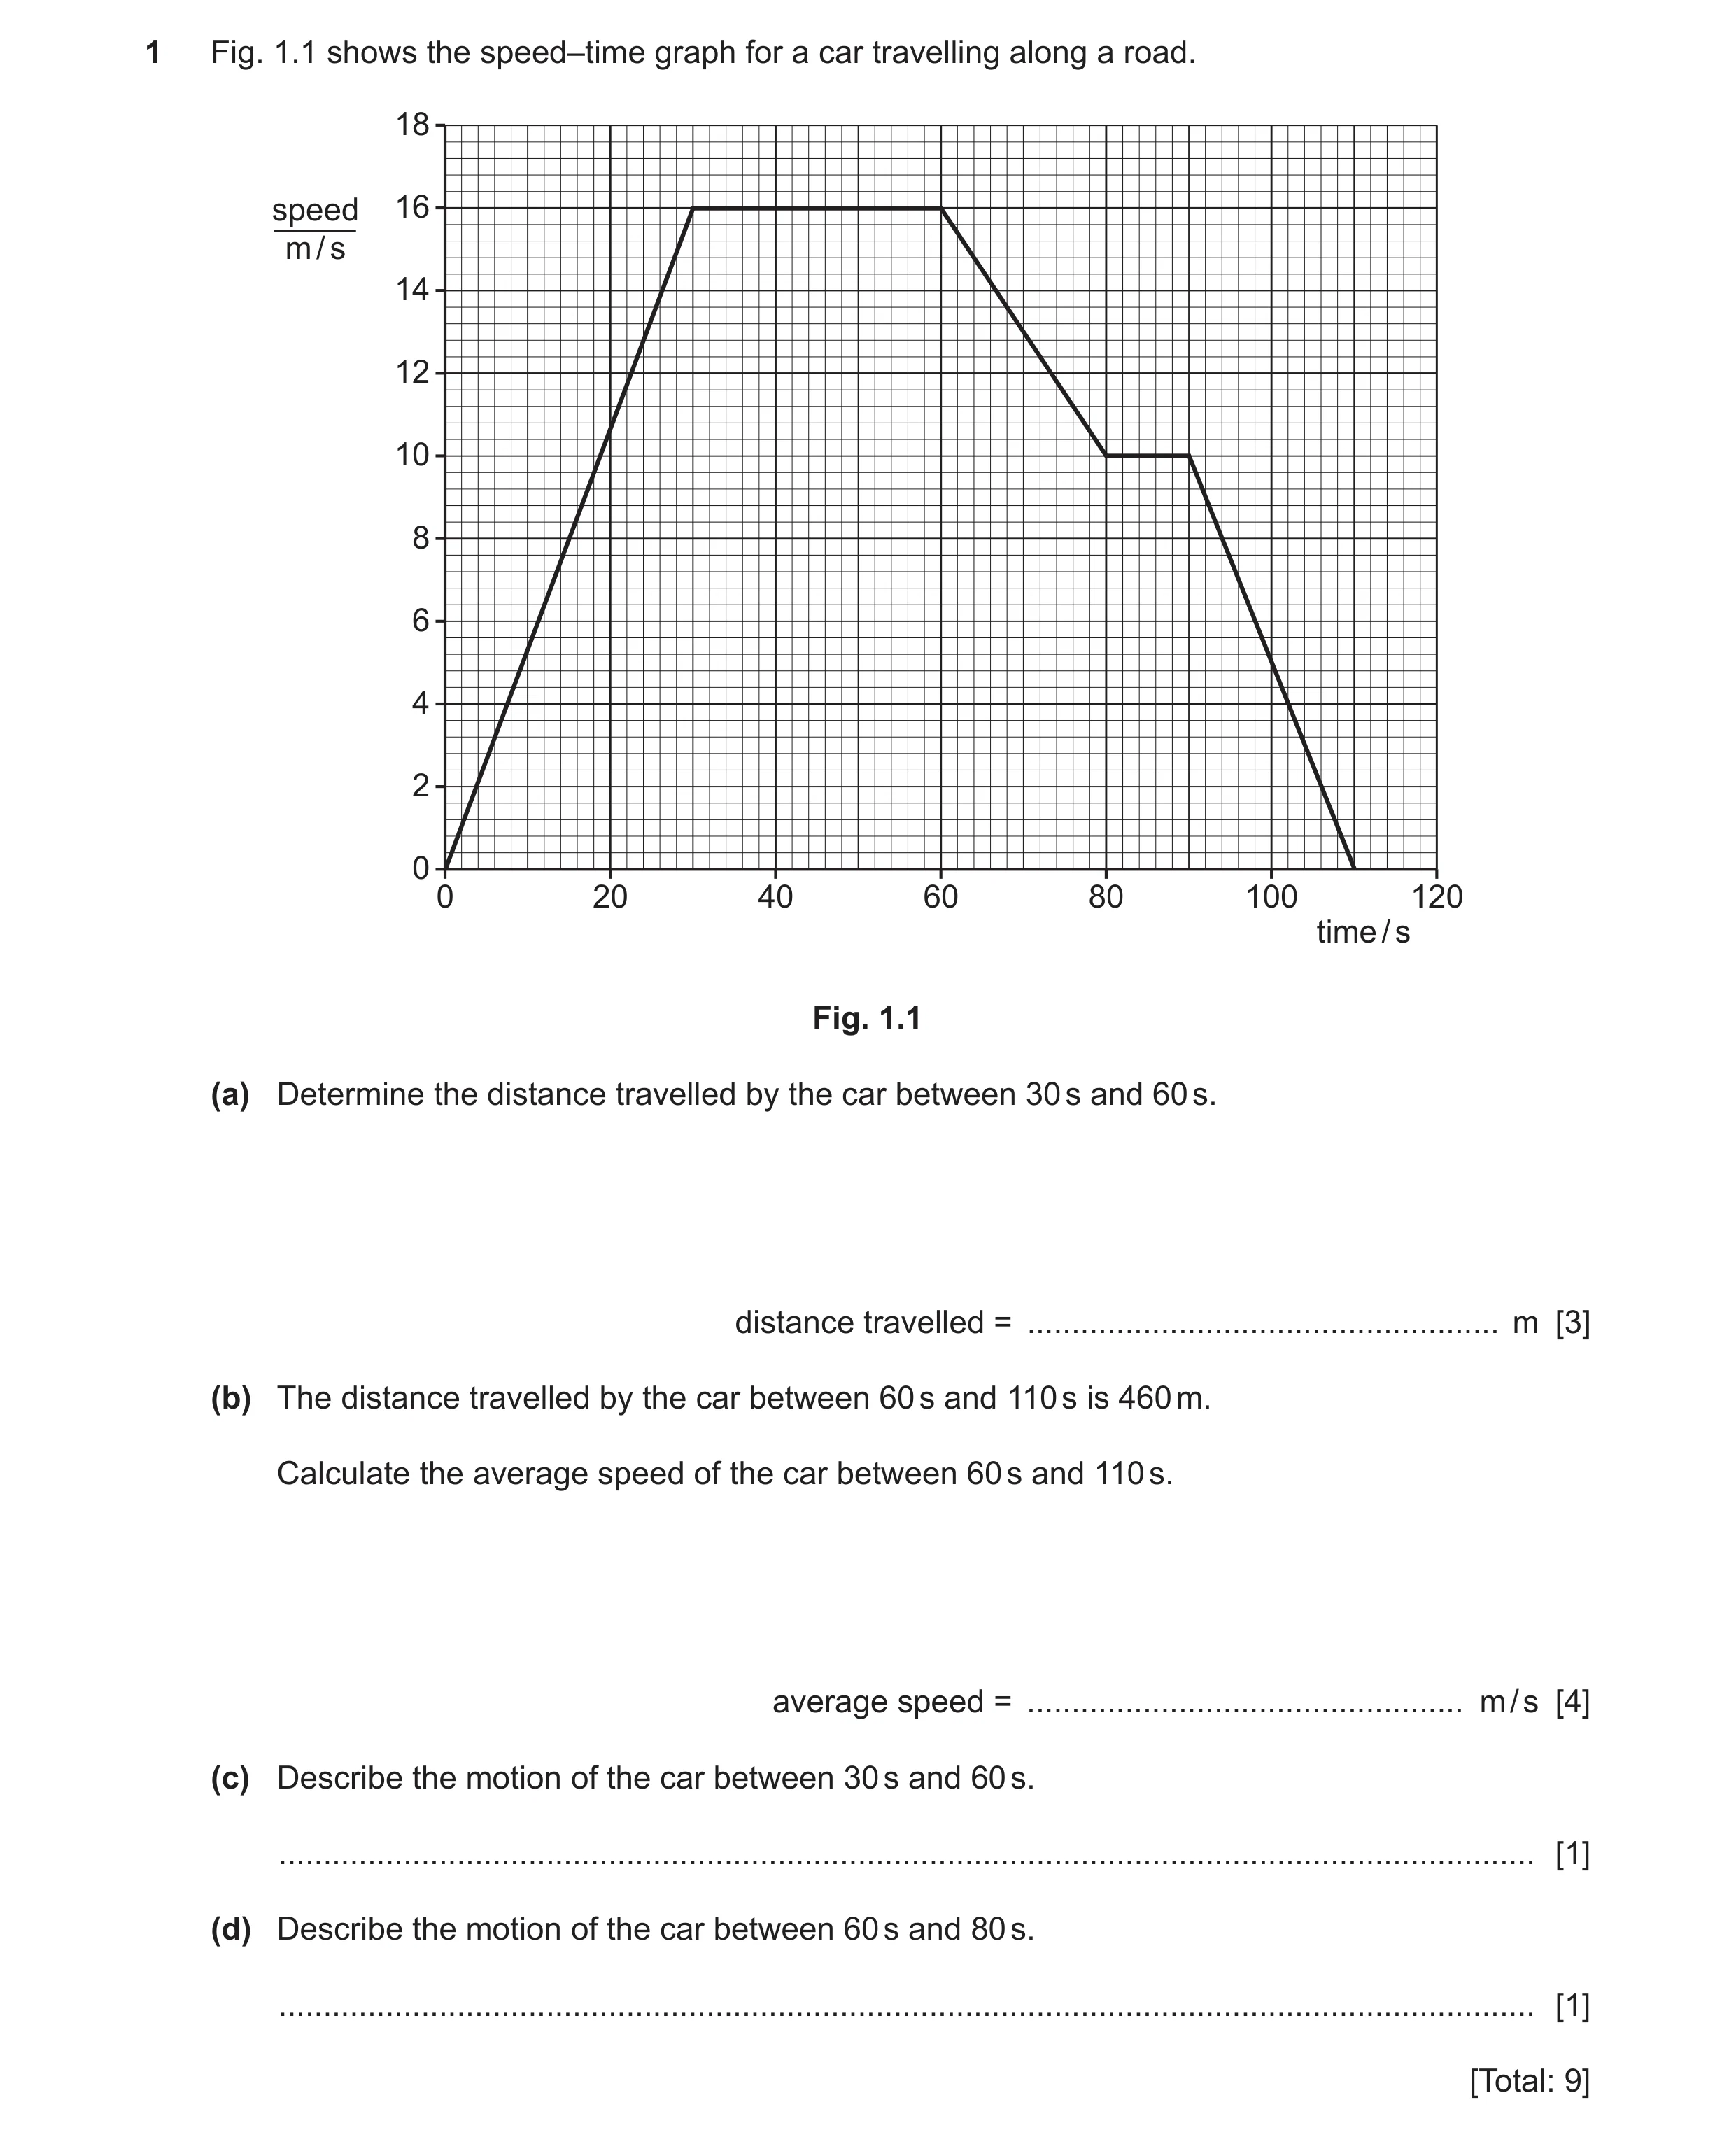 47 / 101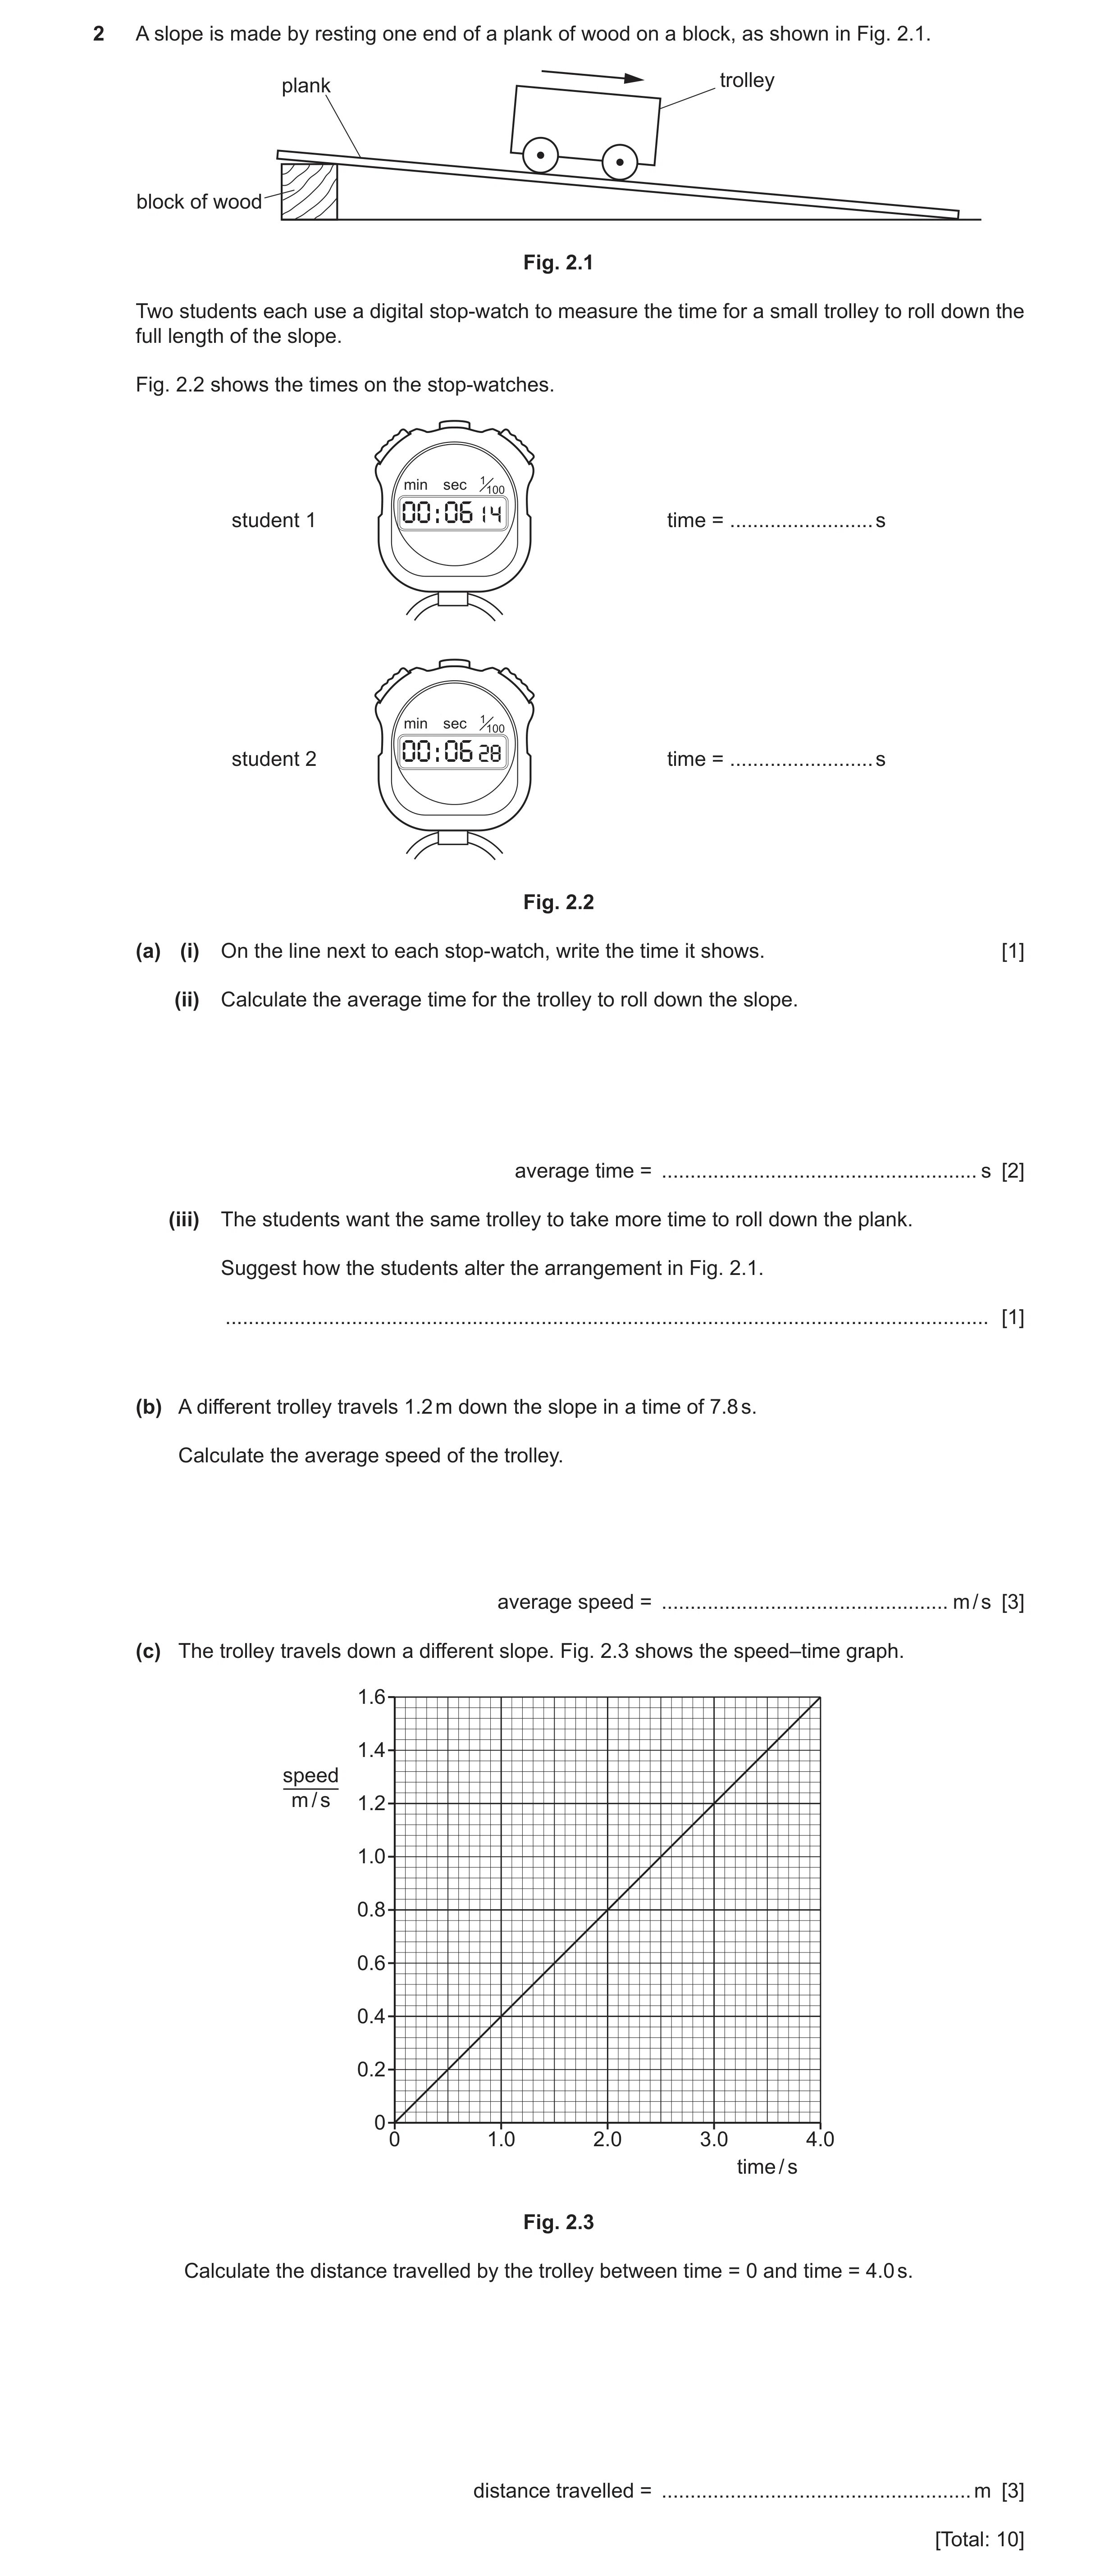
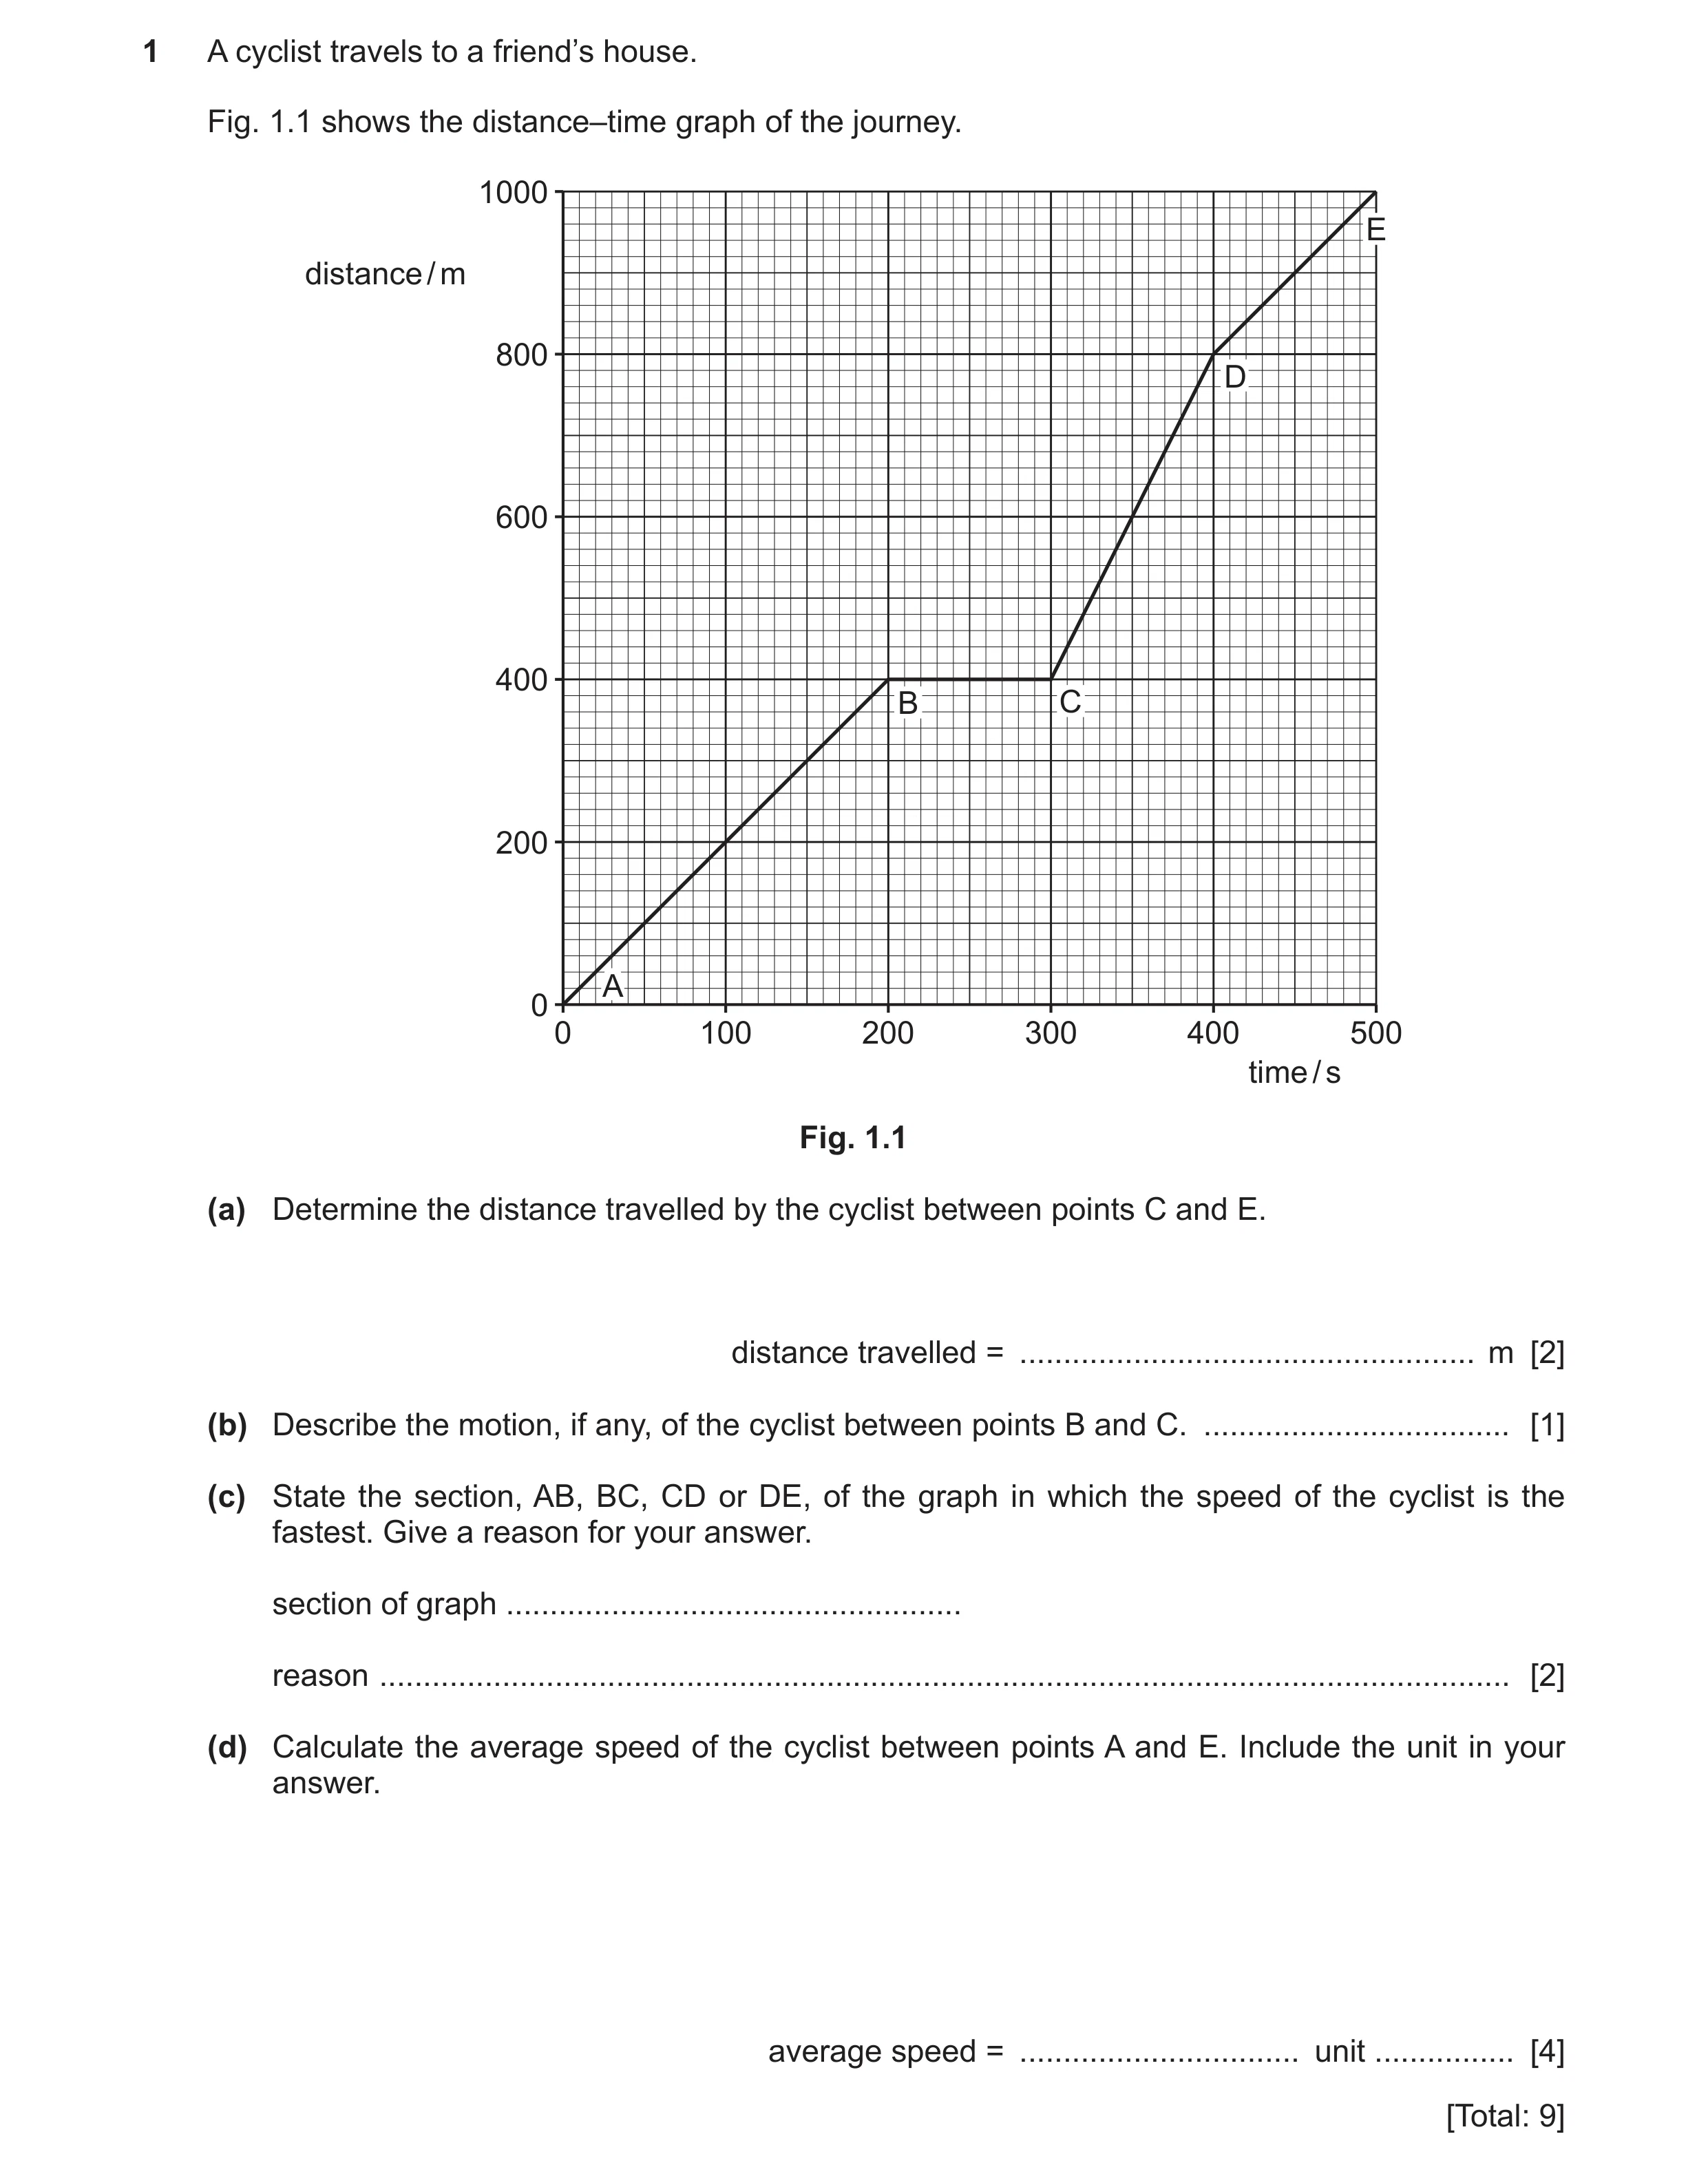 50 / 101
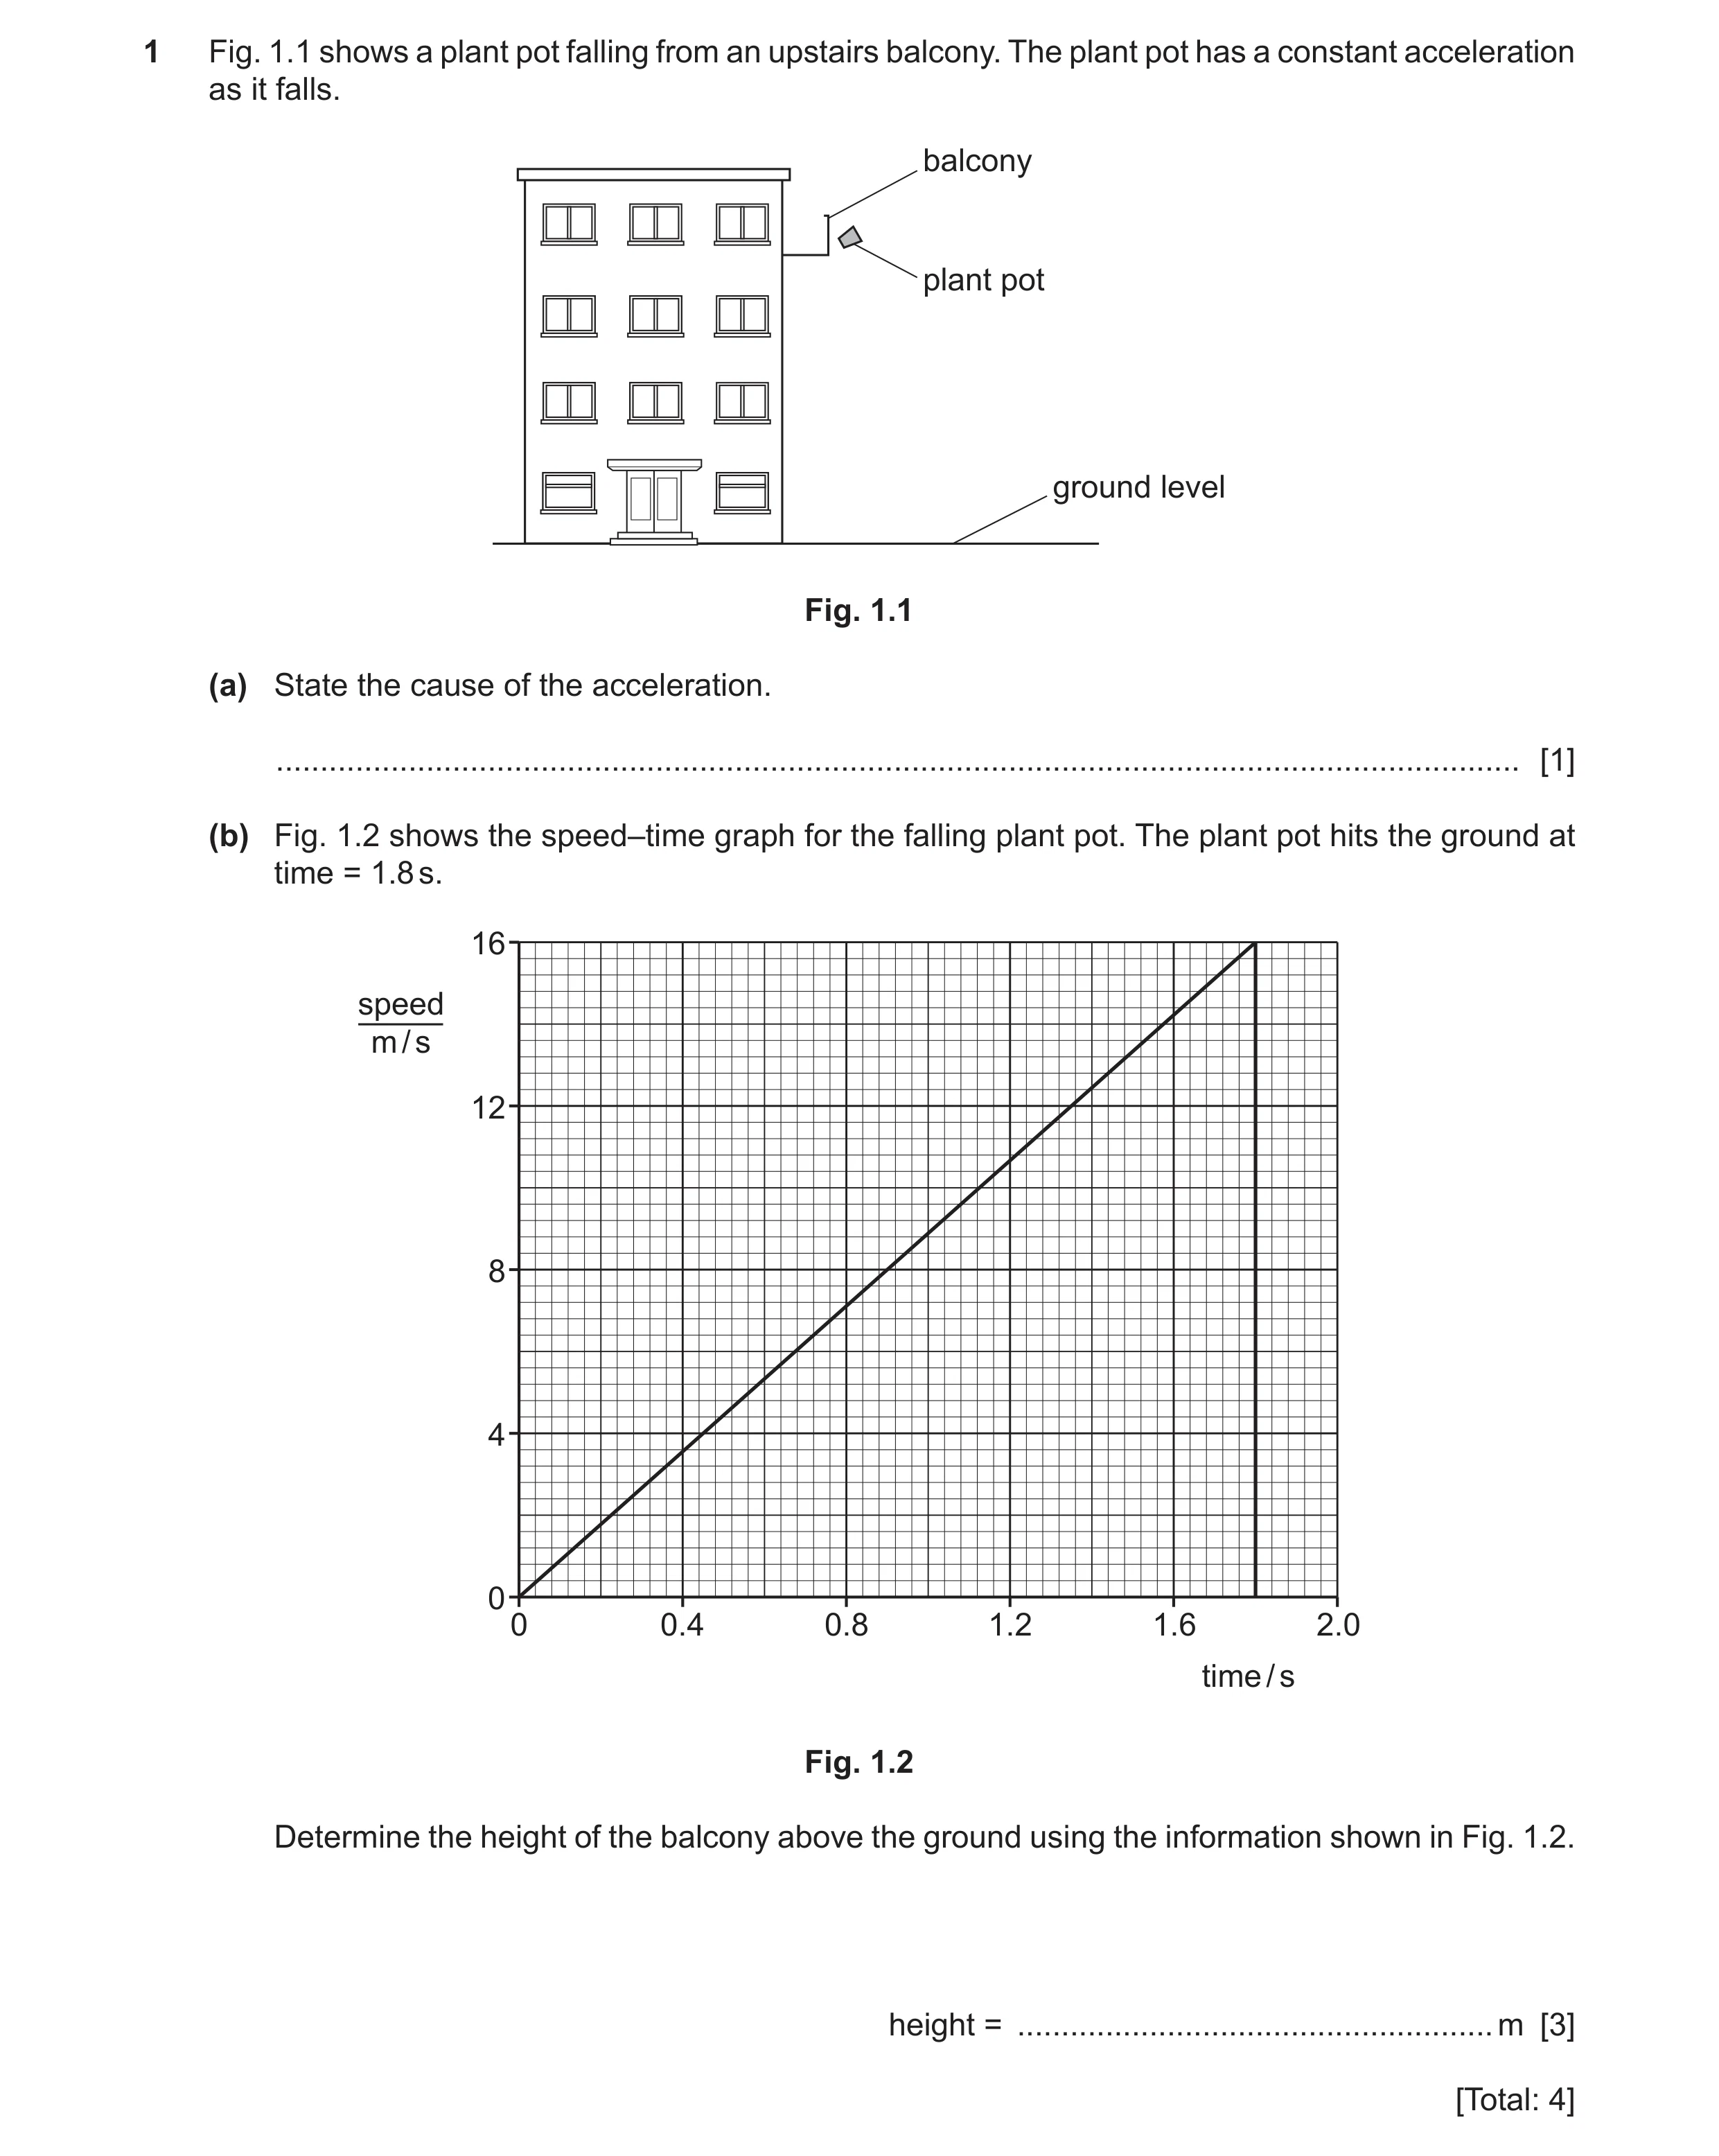 51 / 101
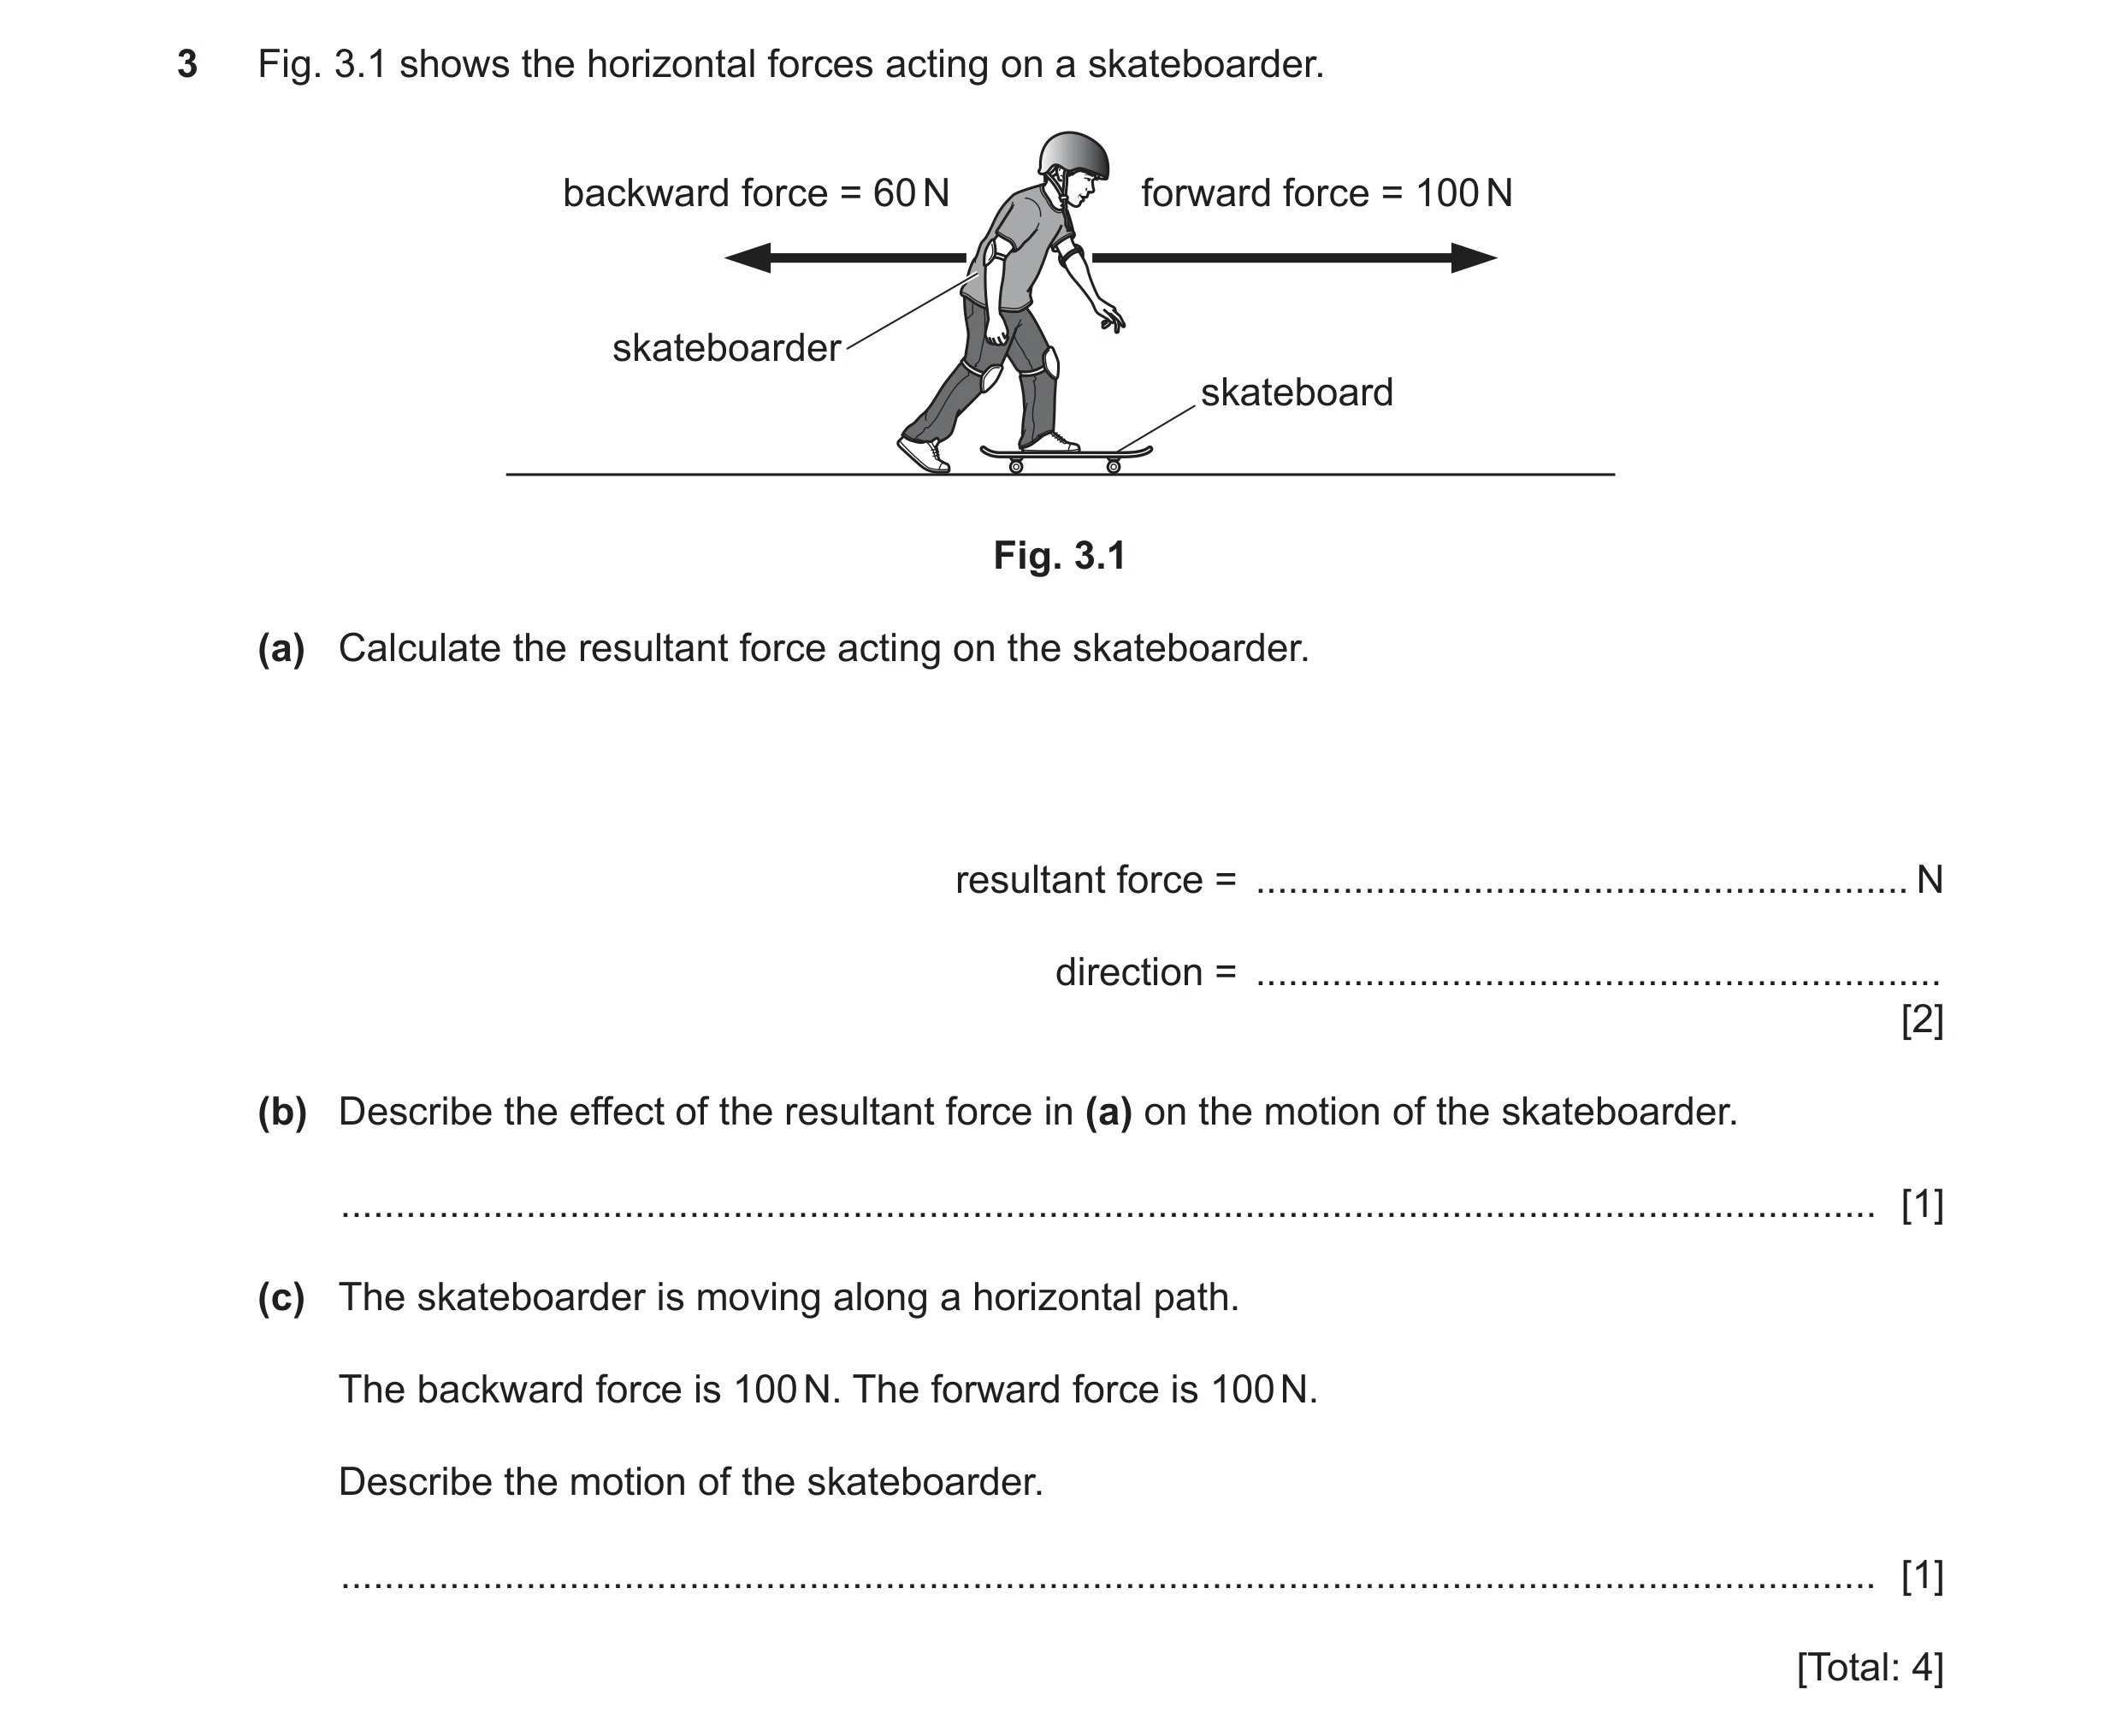 52 / 101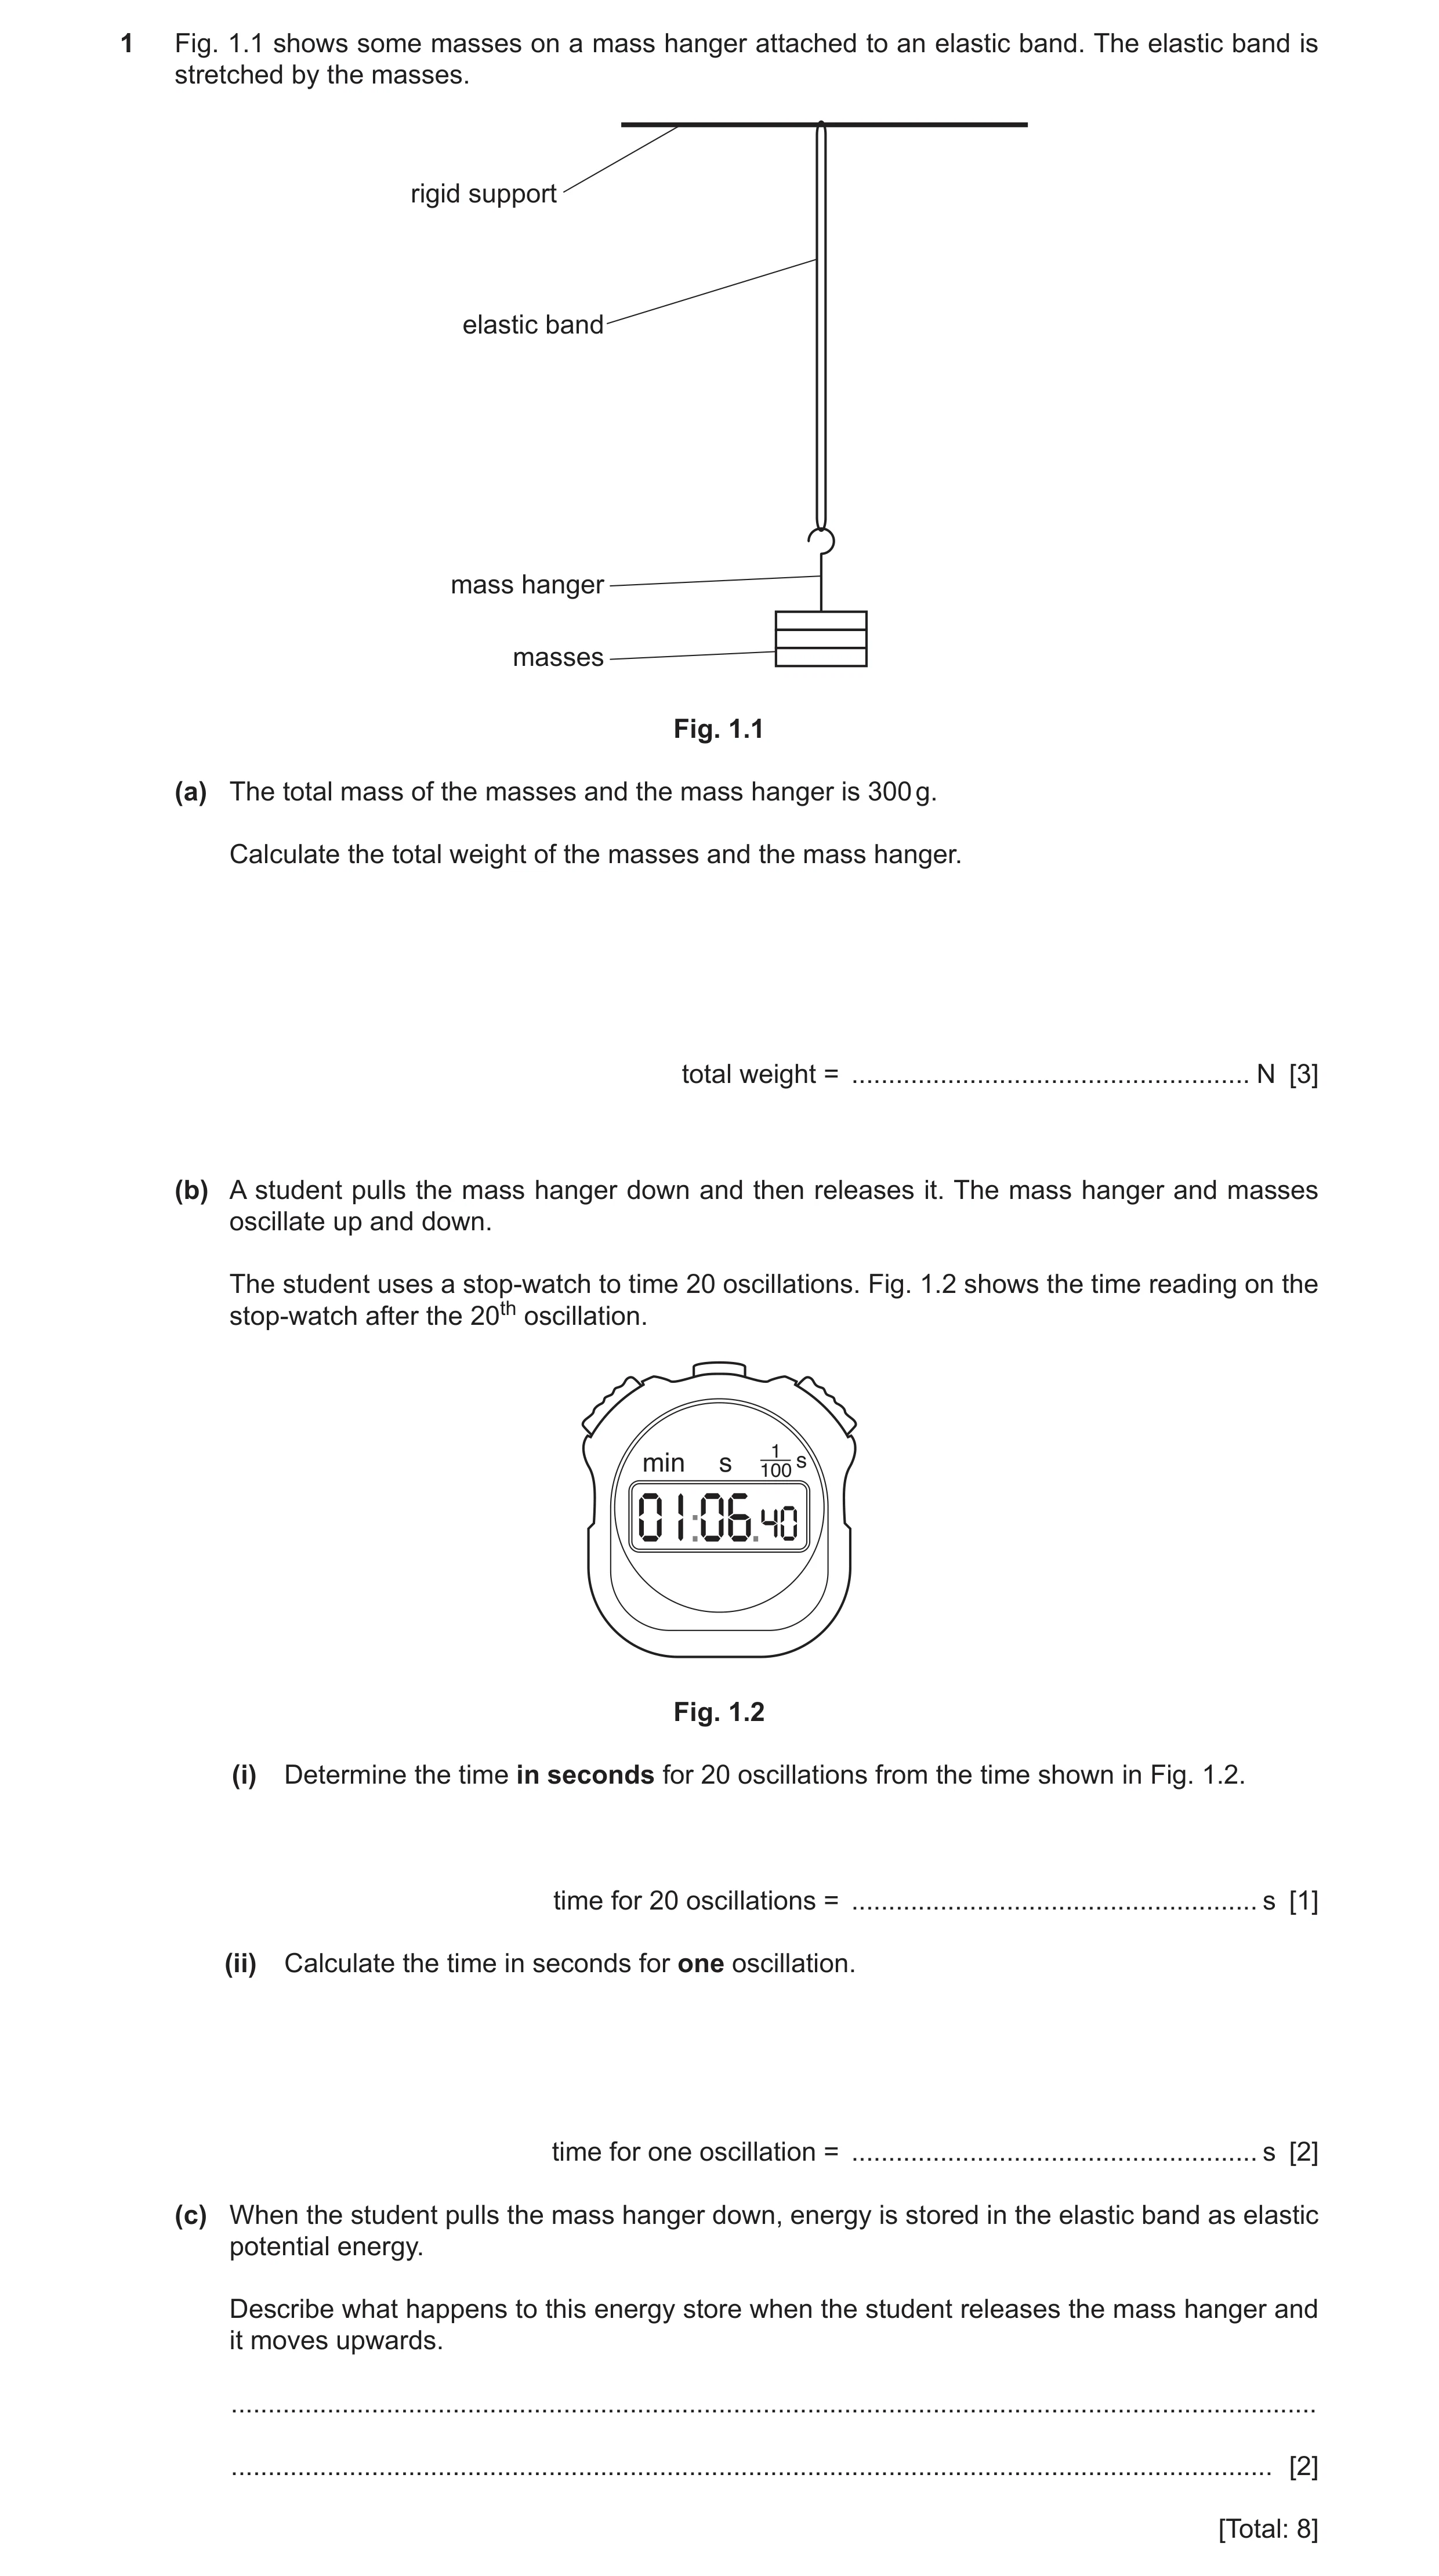
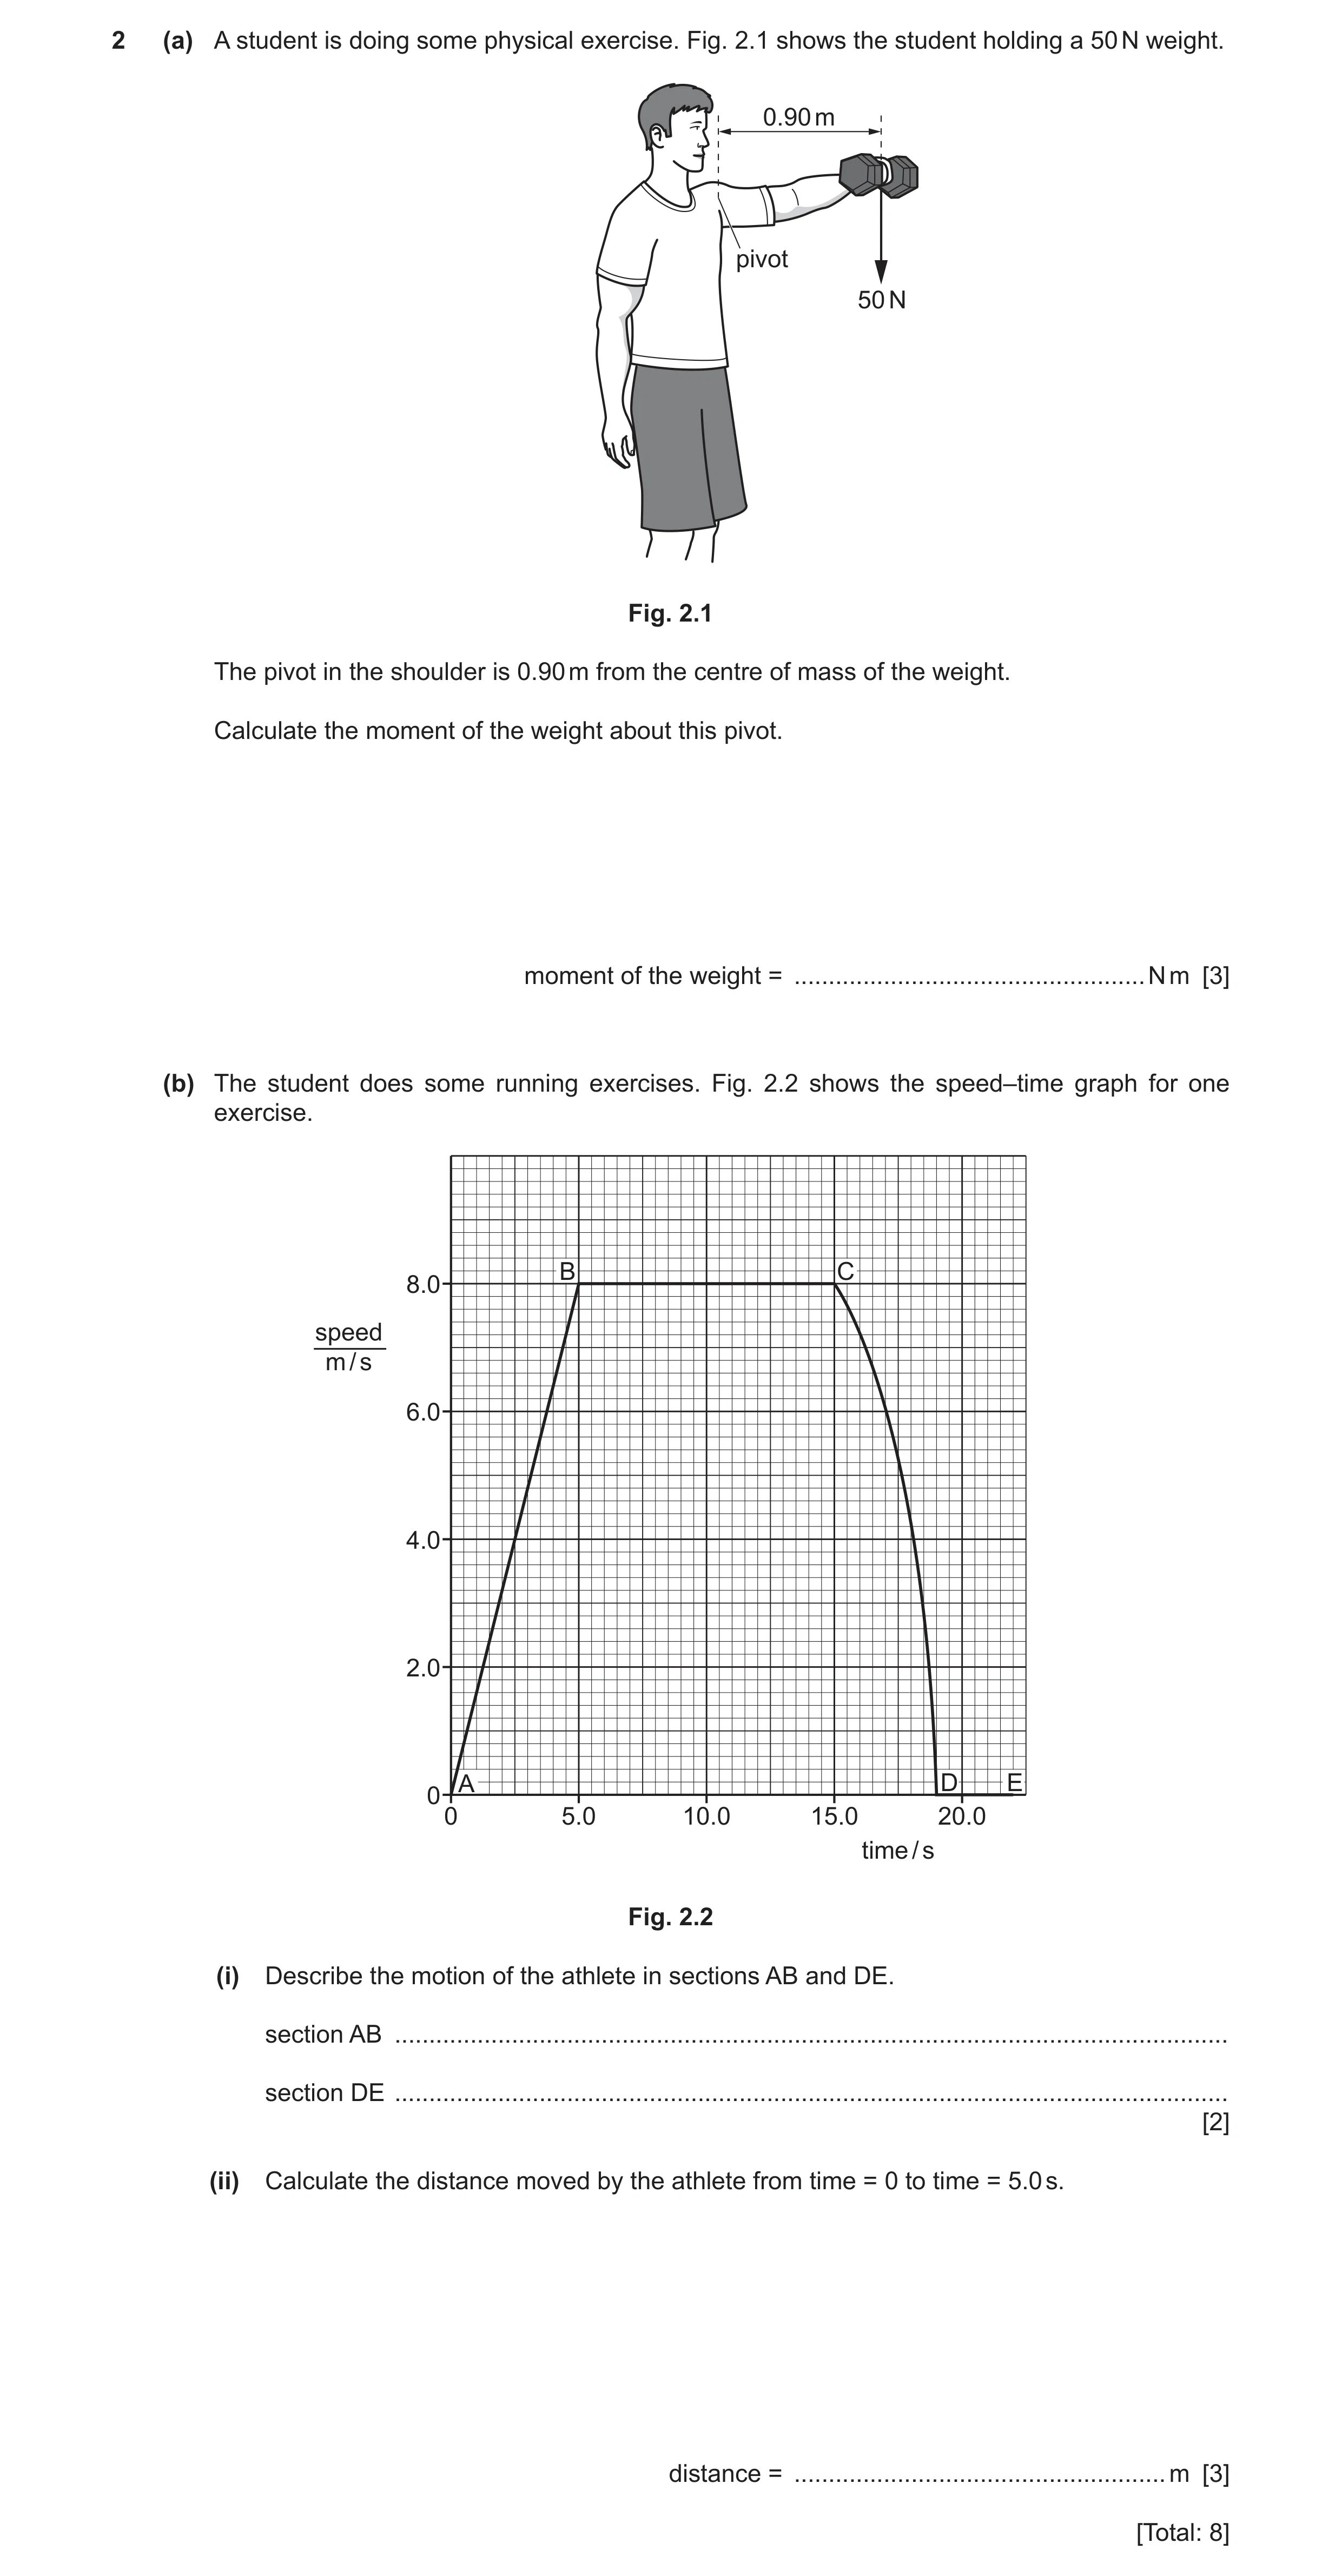
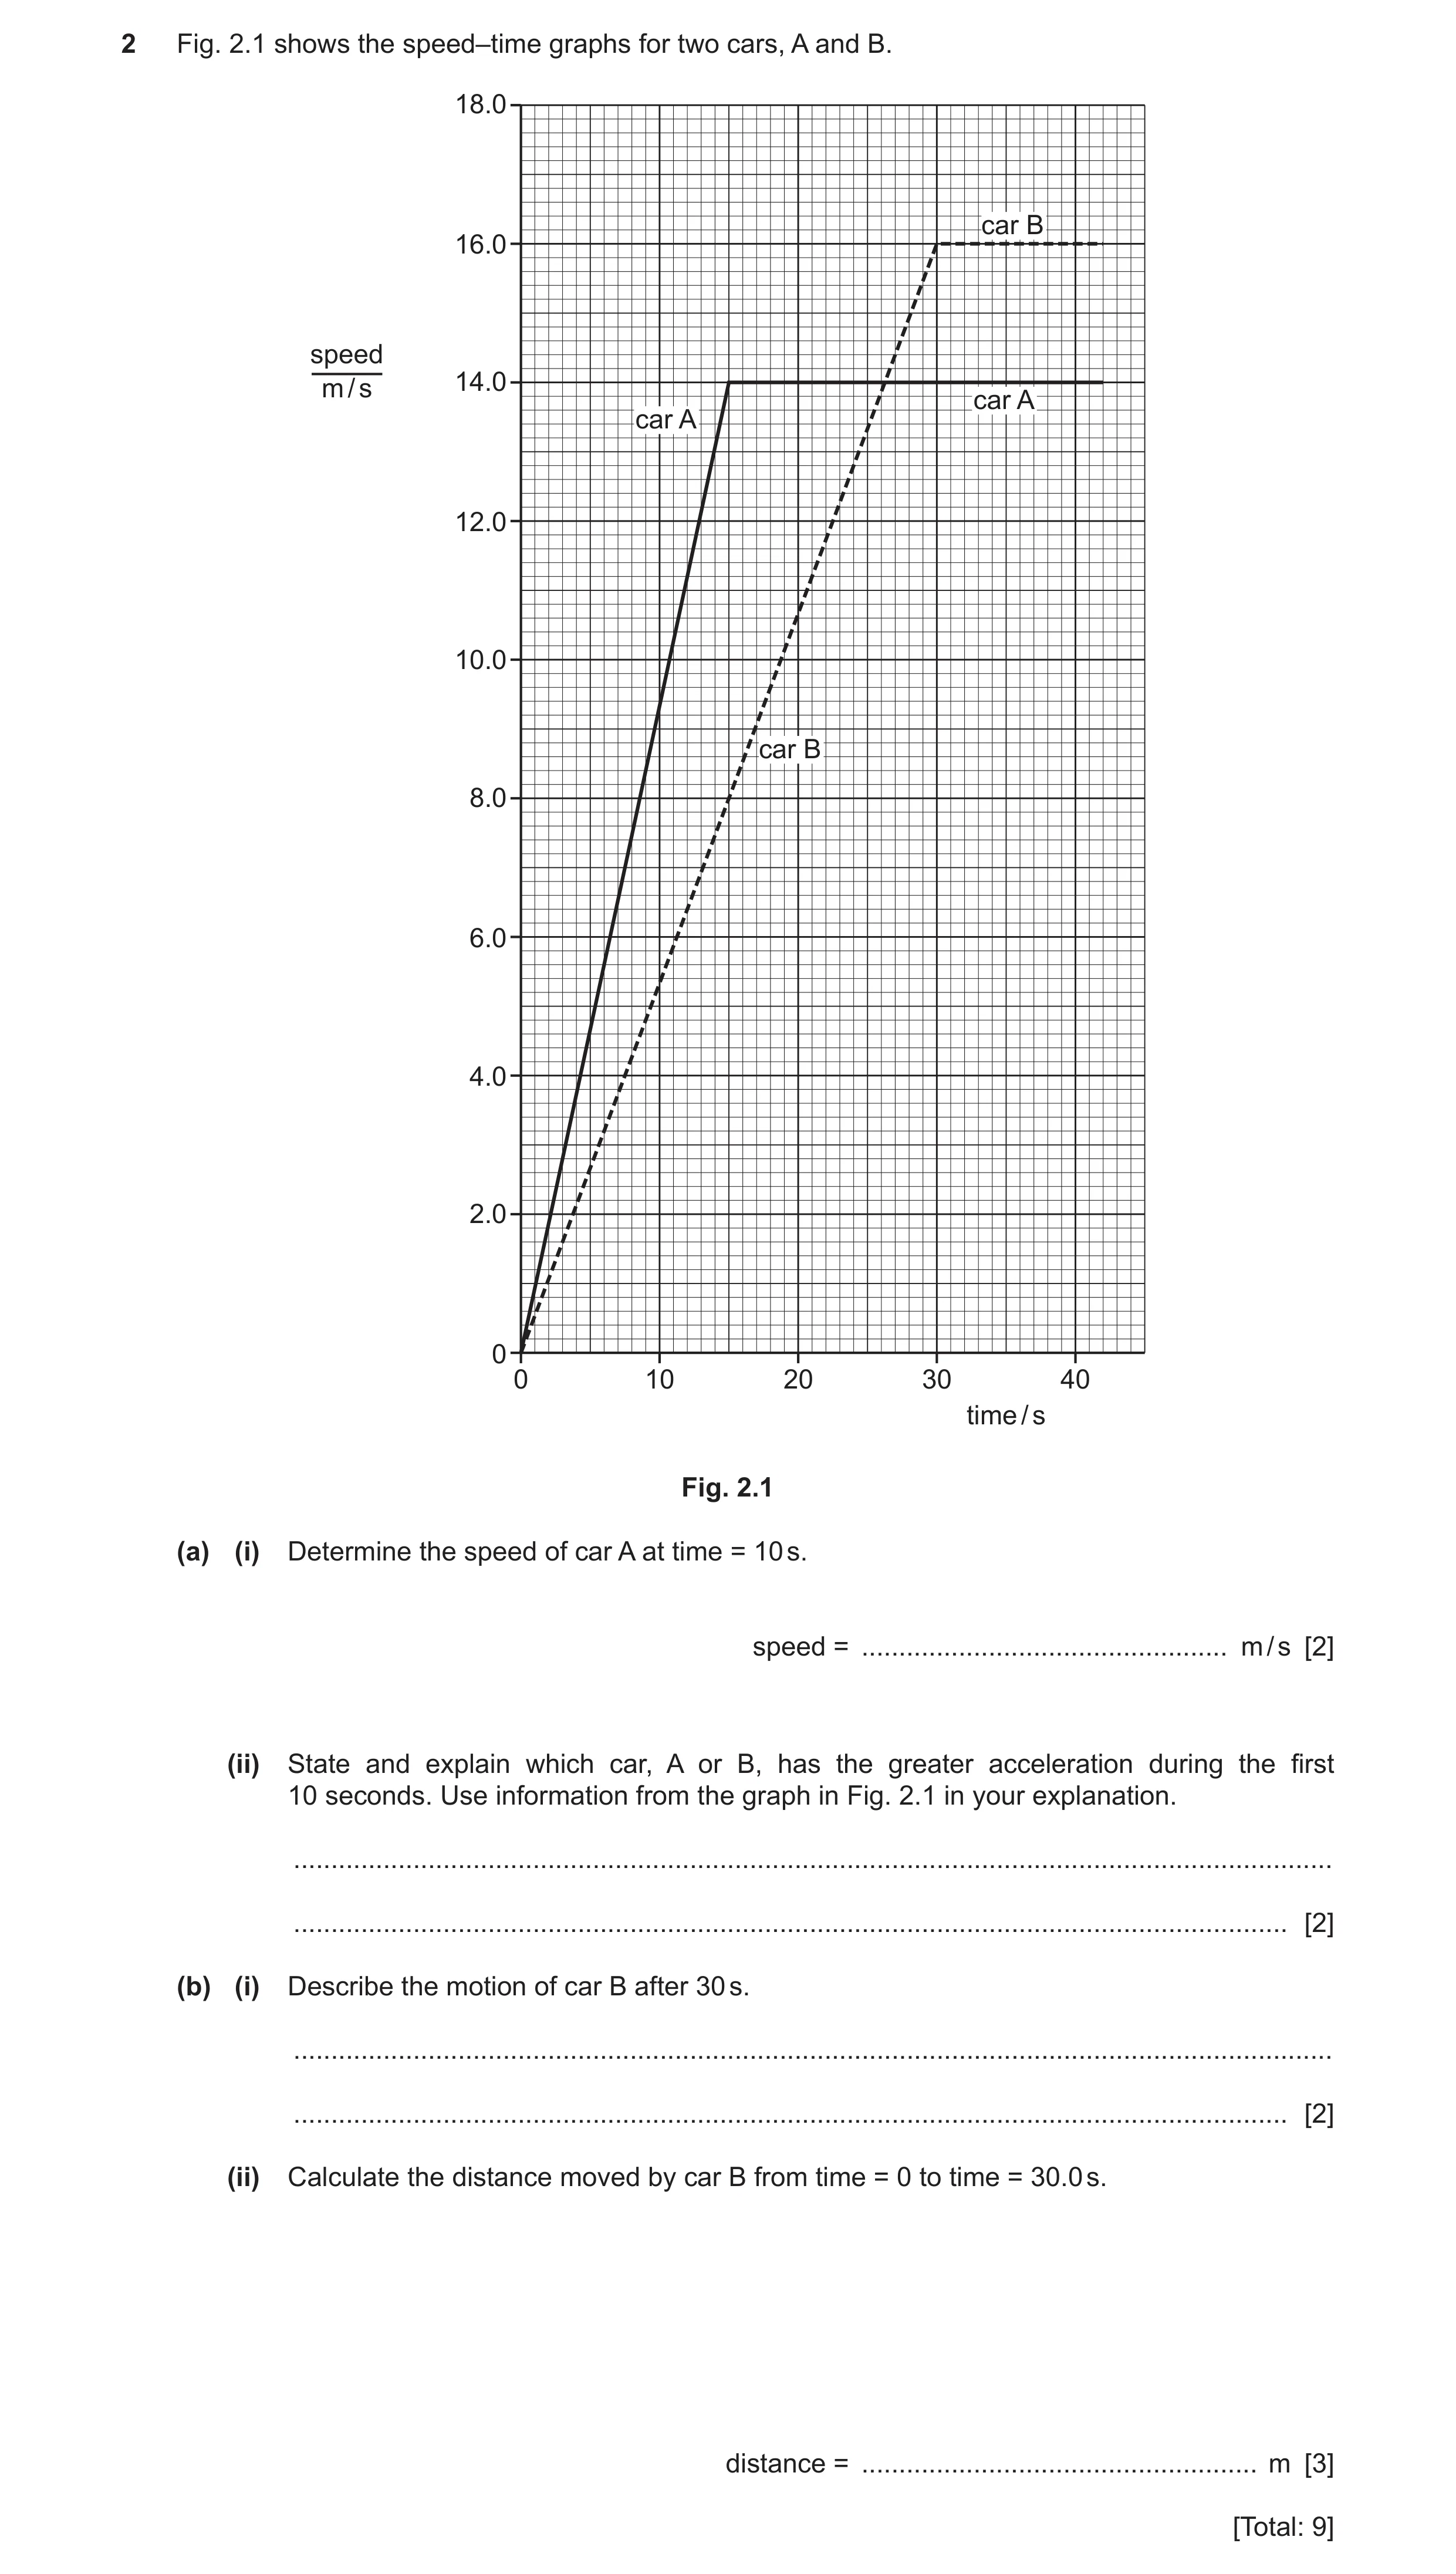
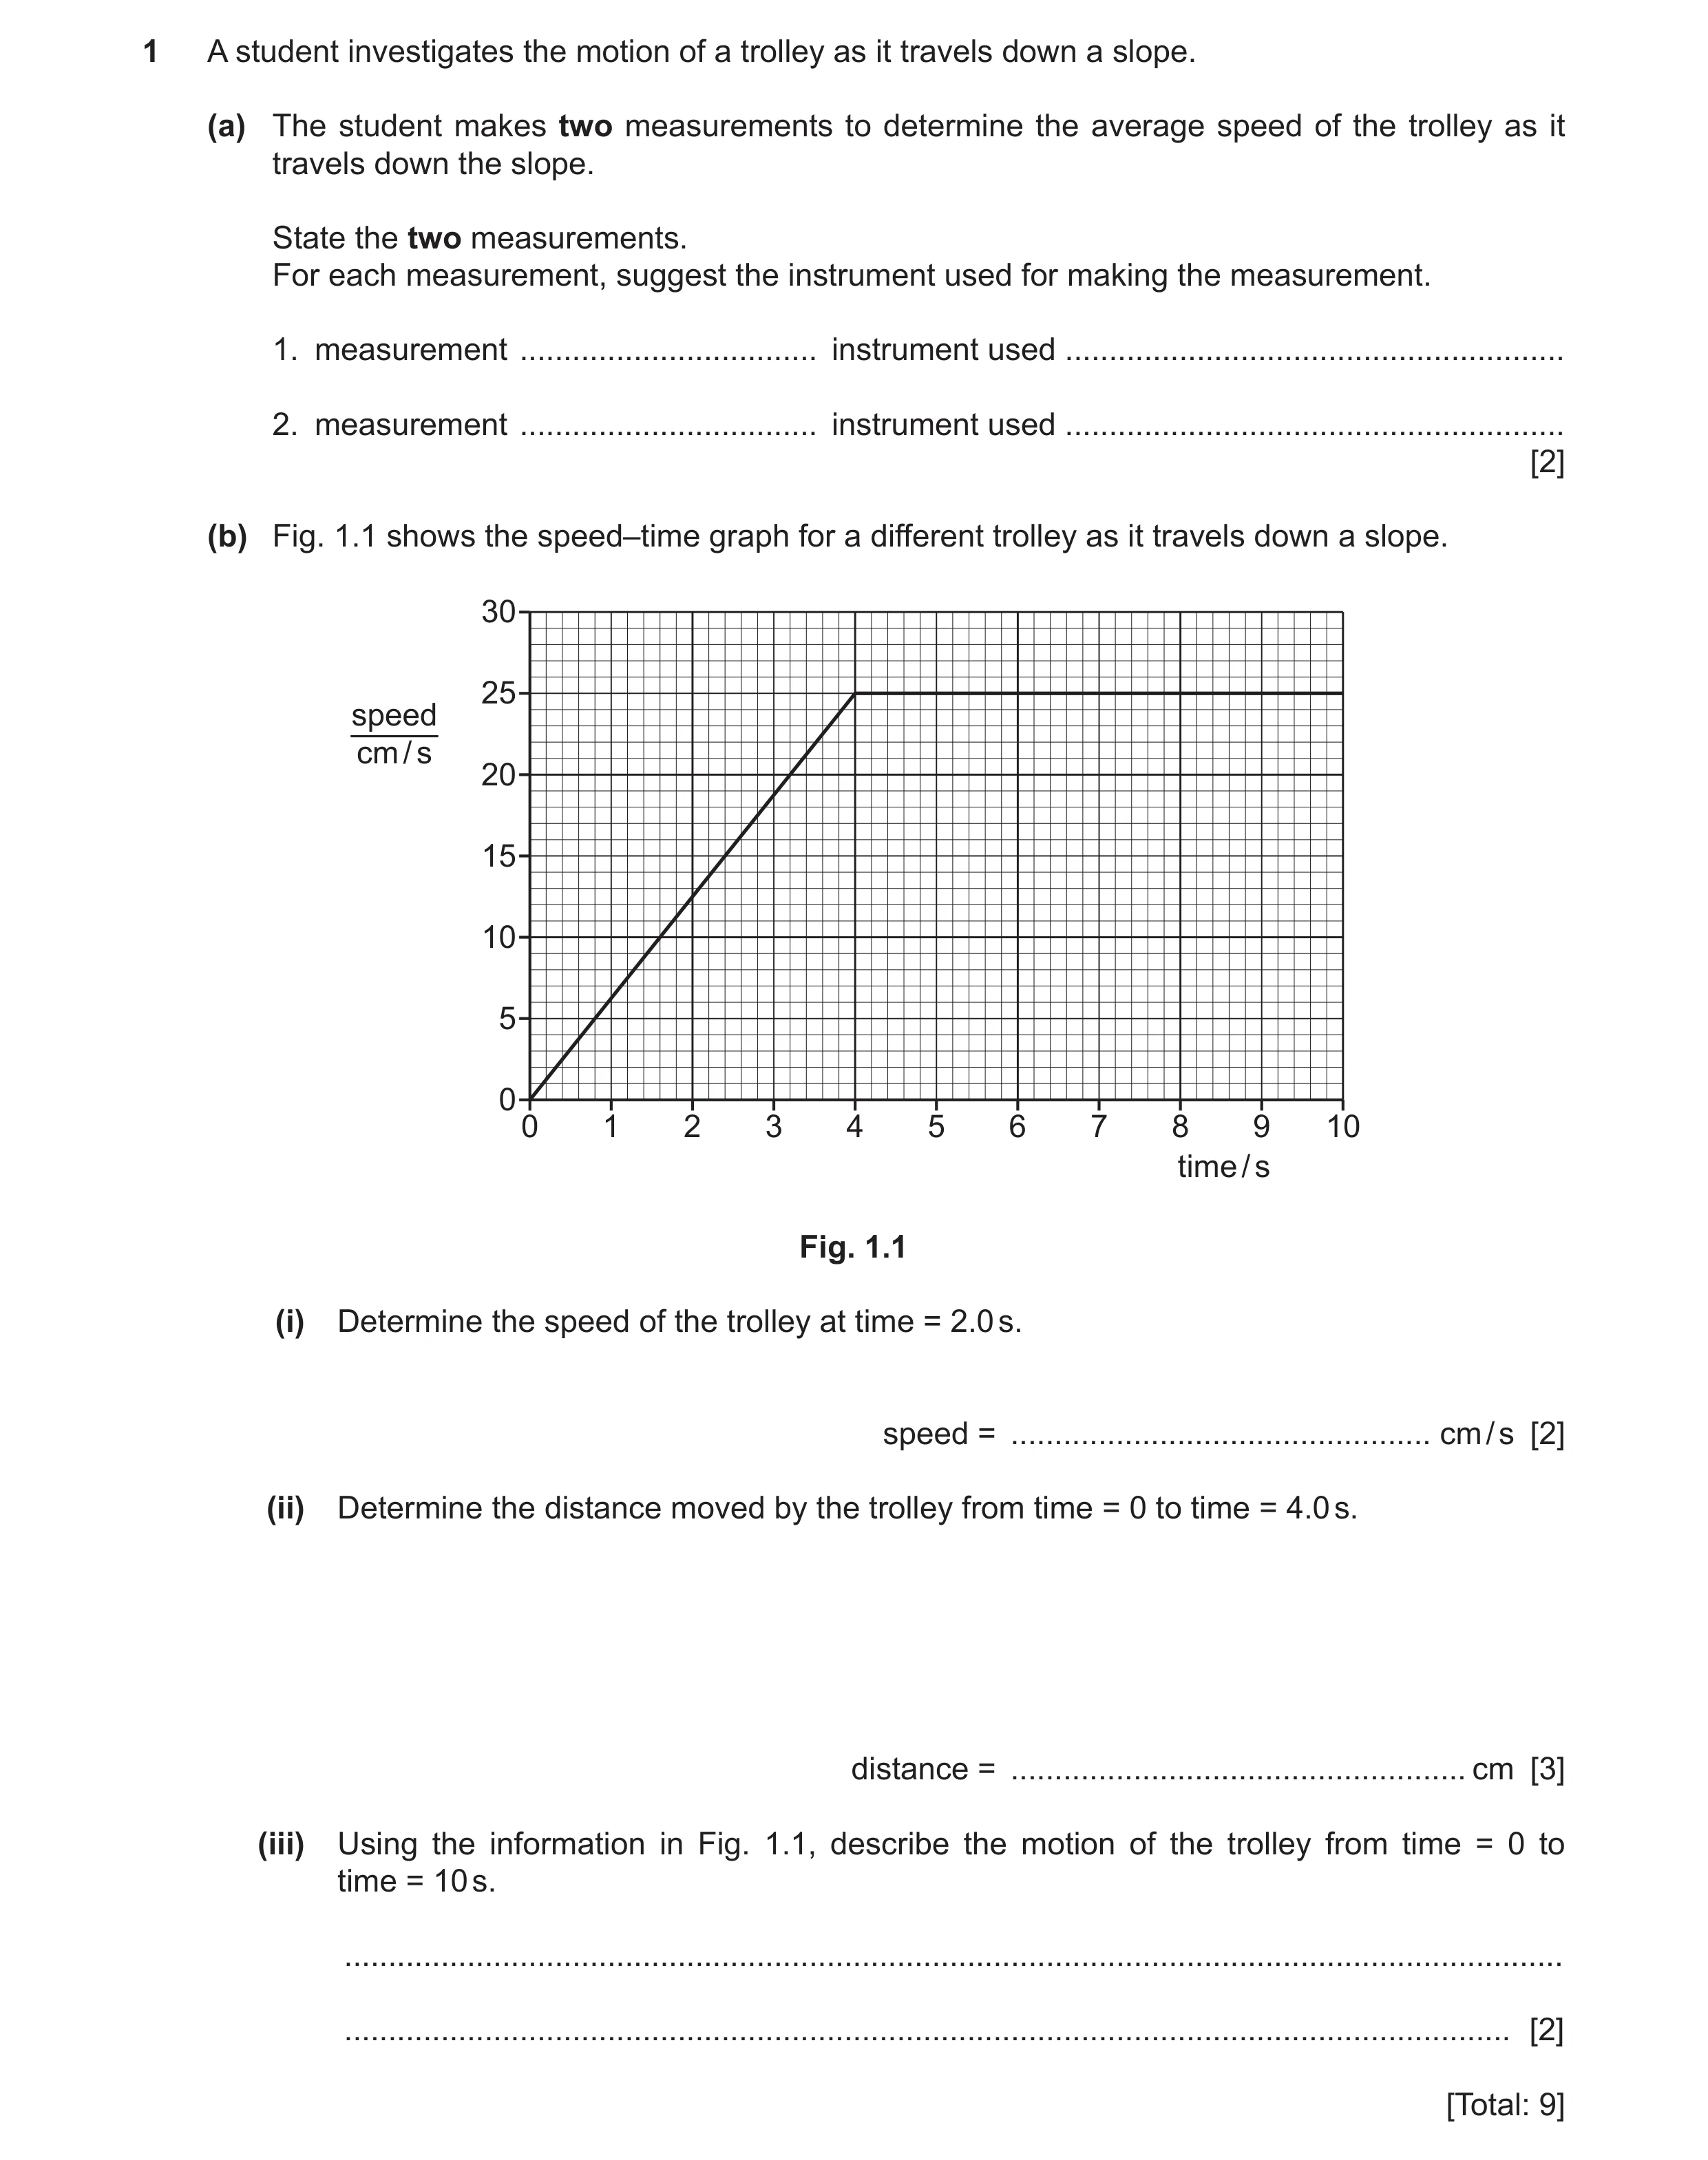 57 / 101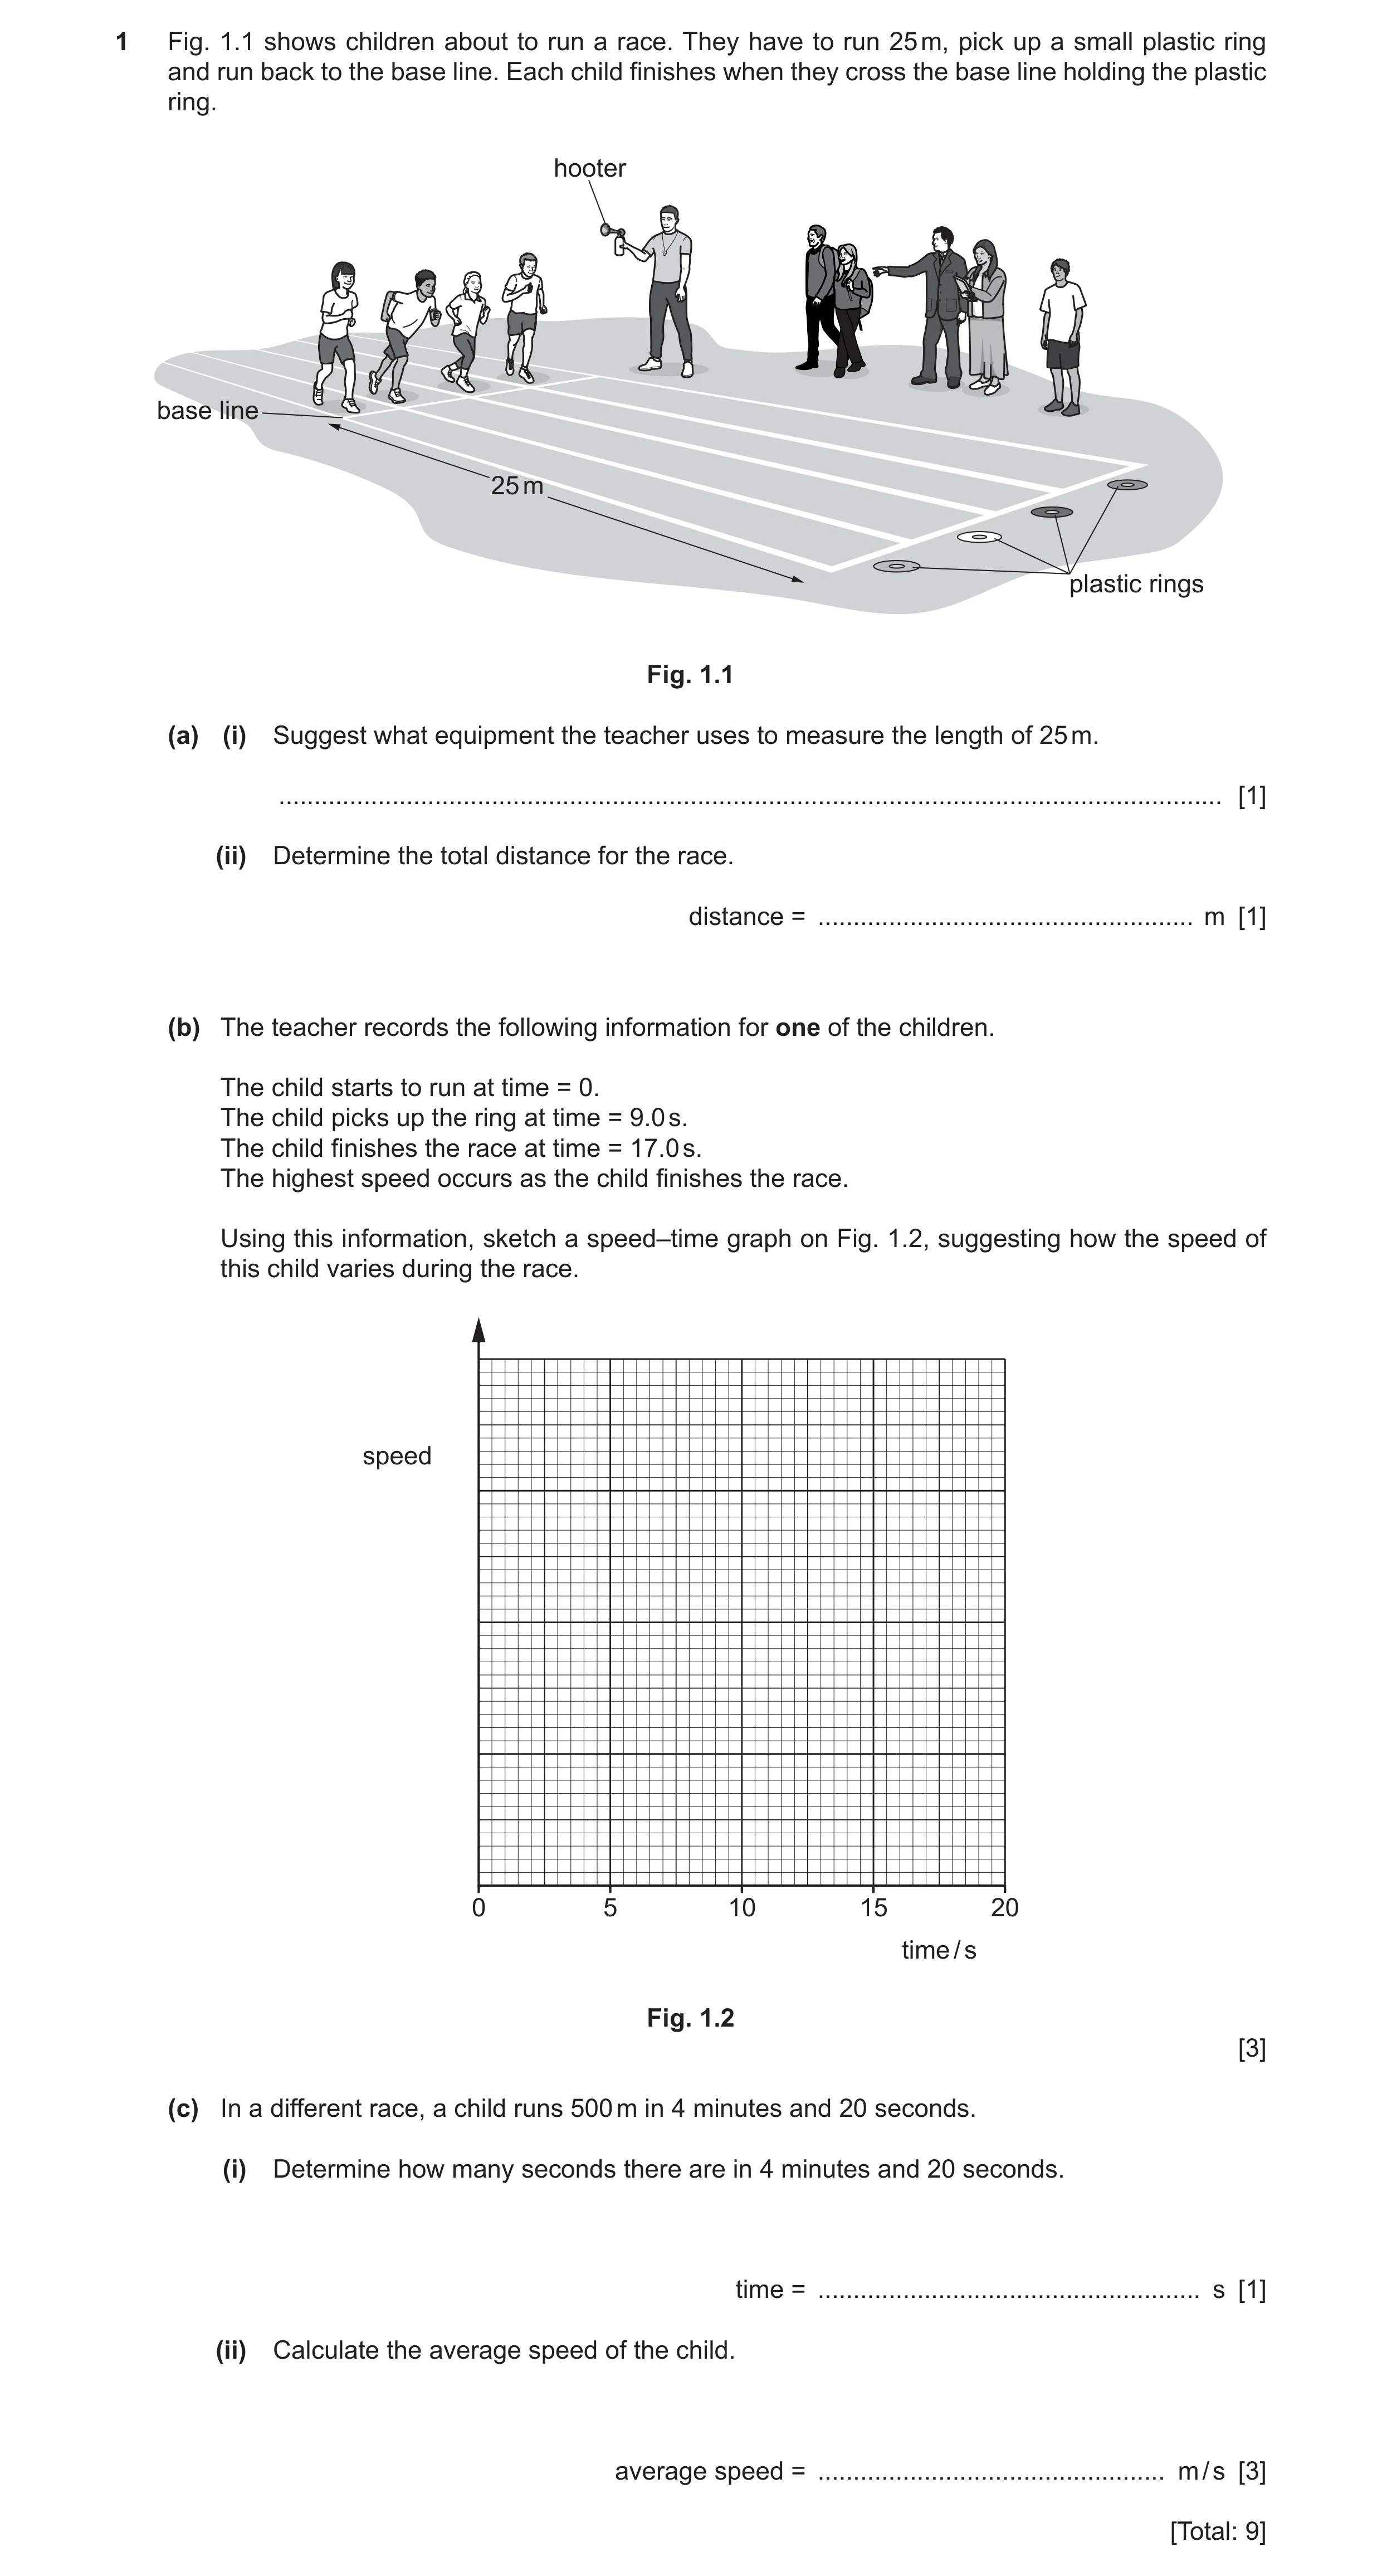
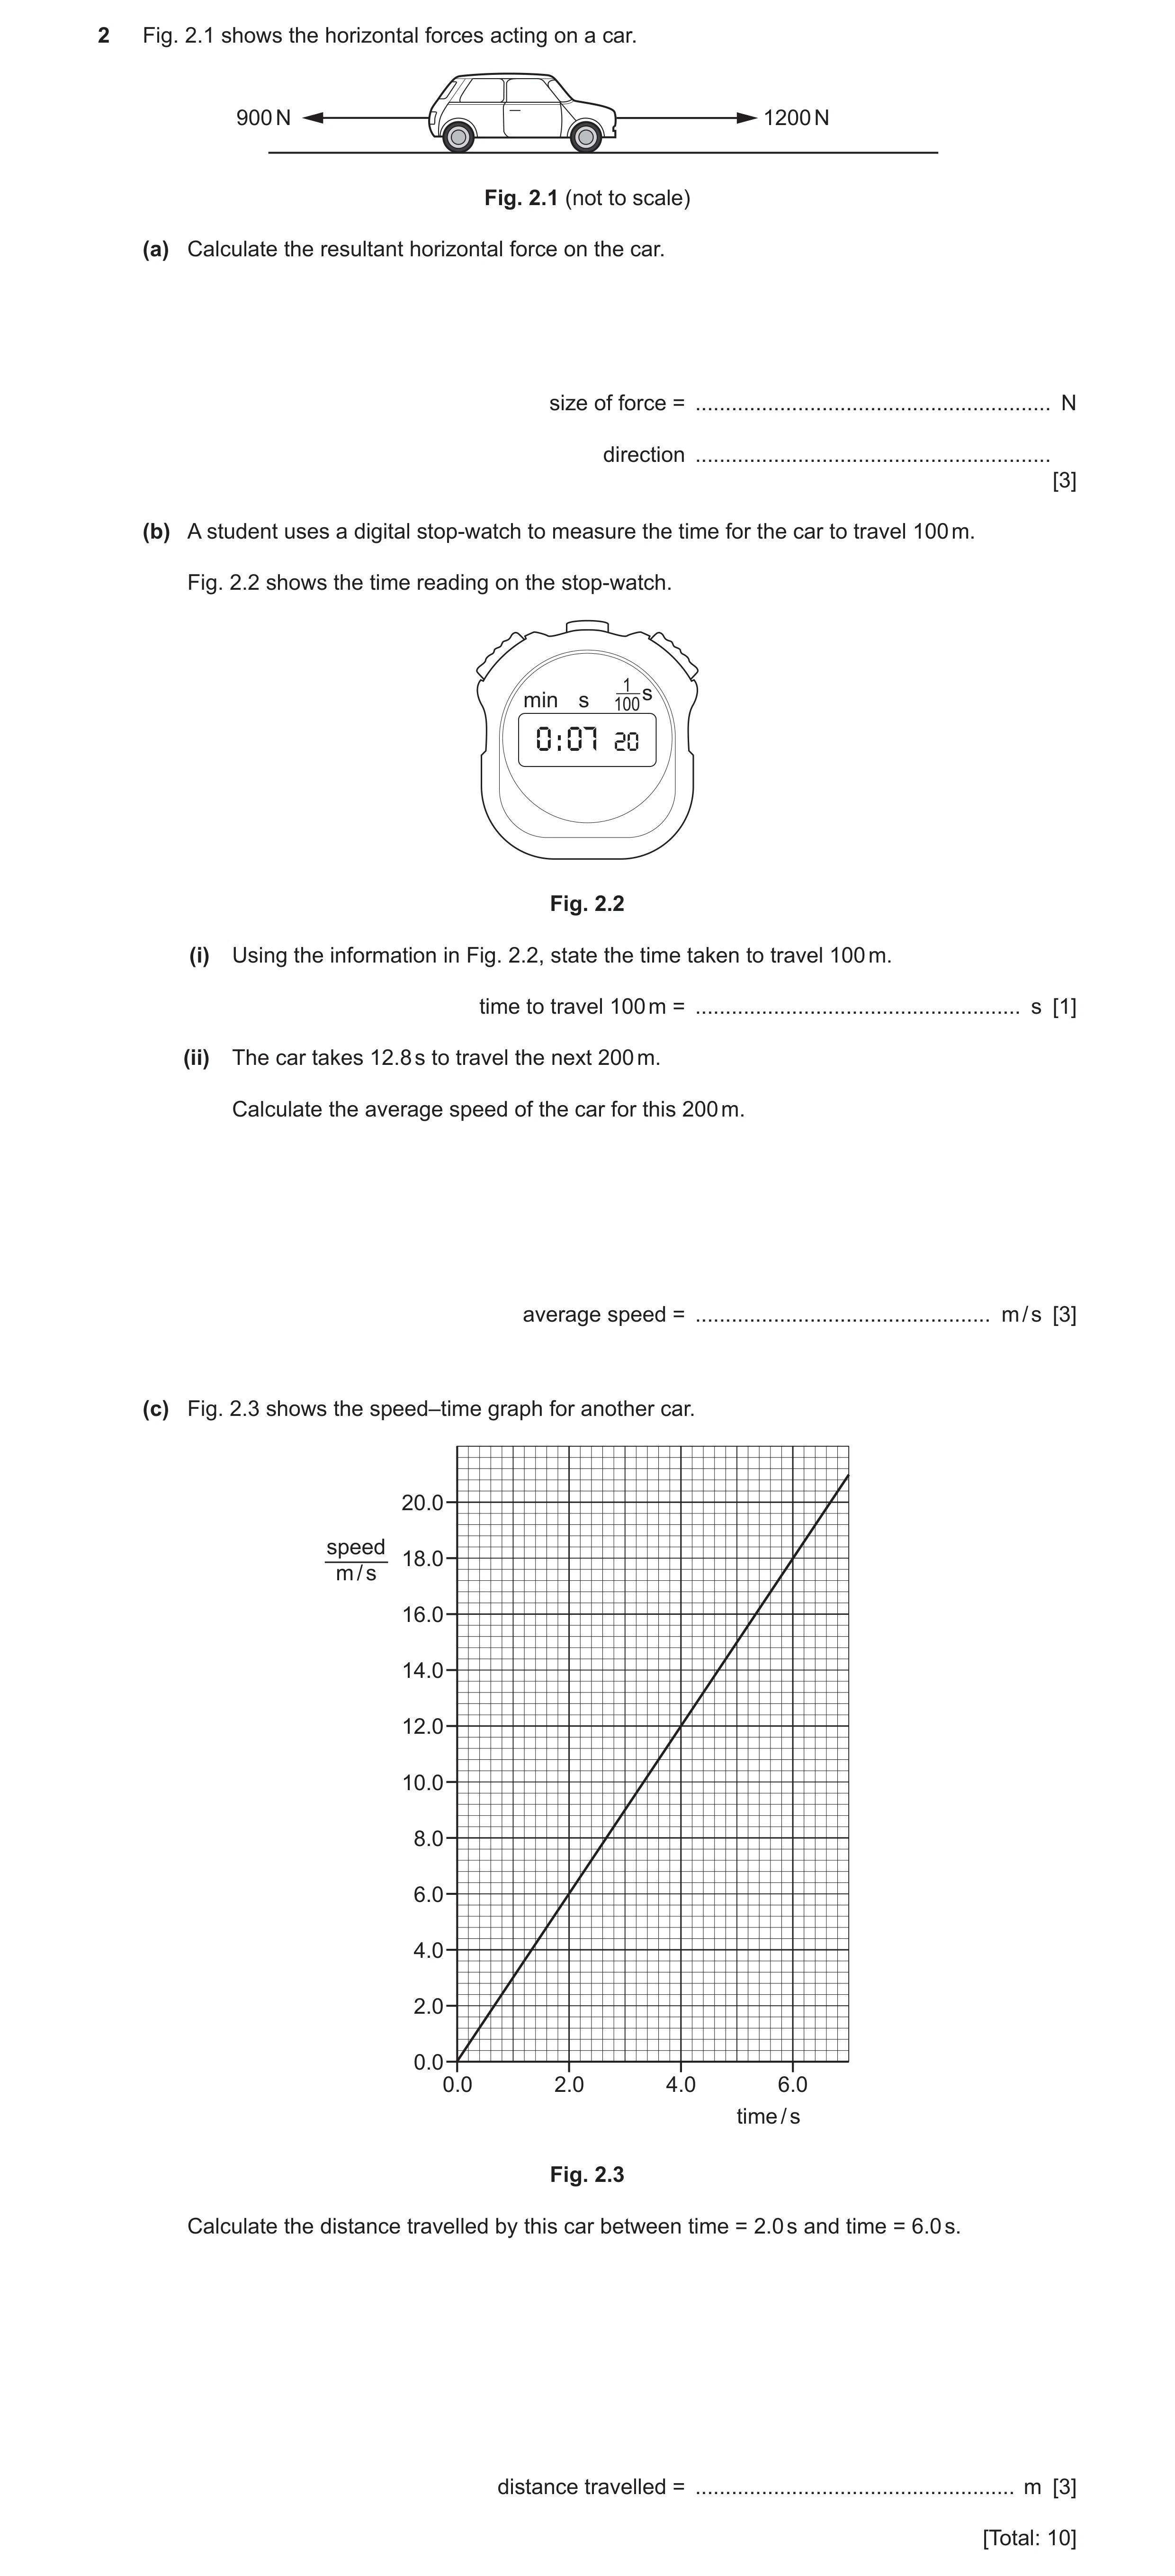
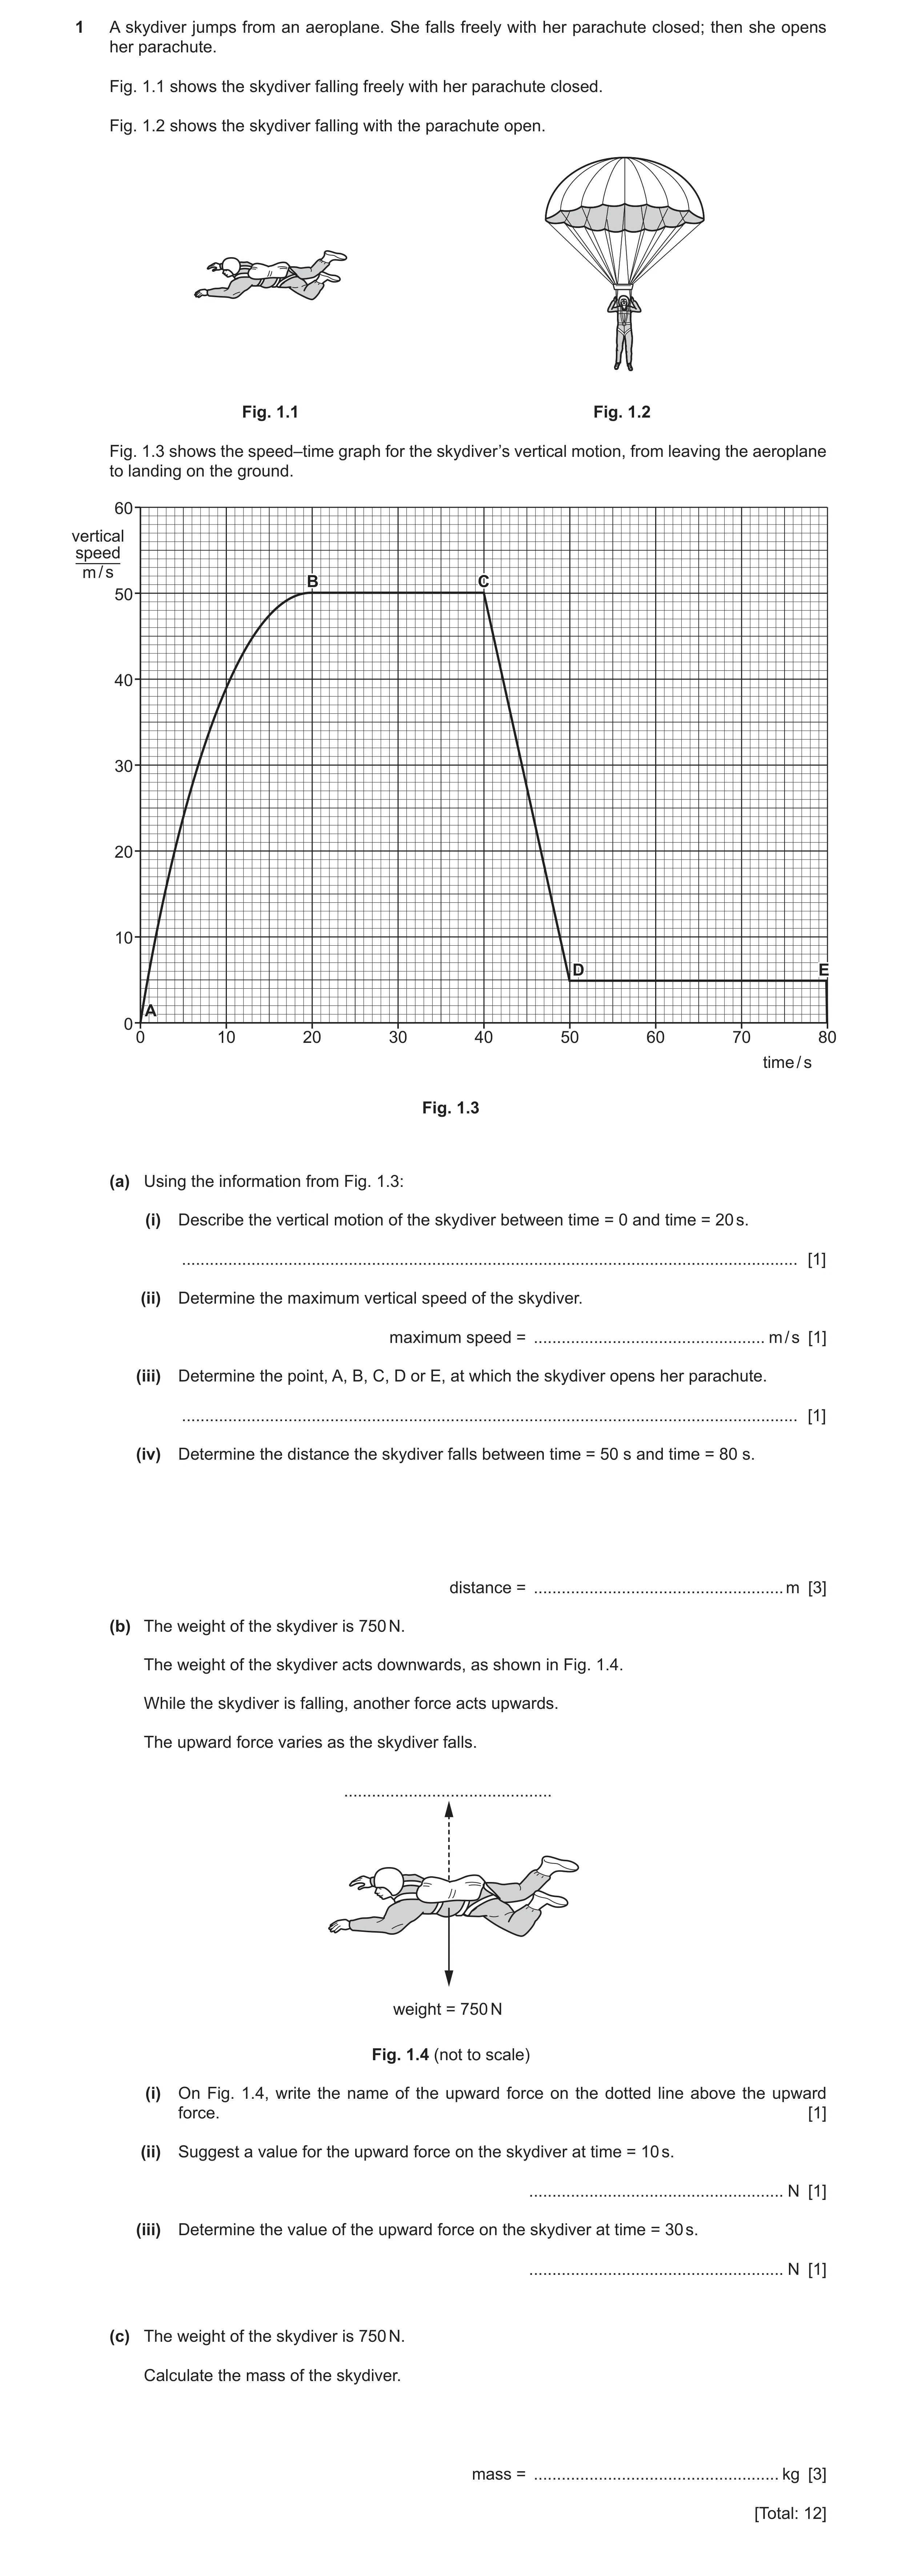
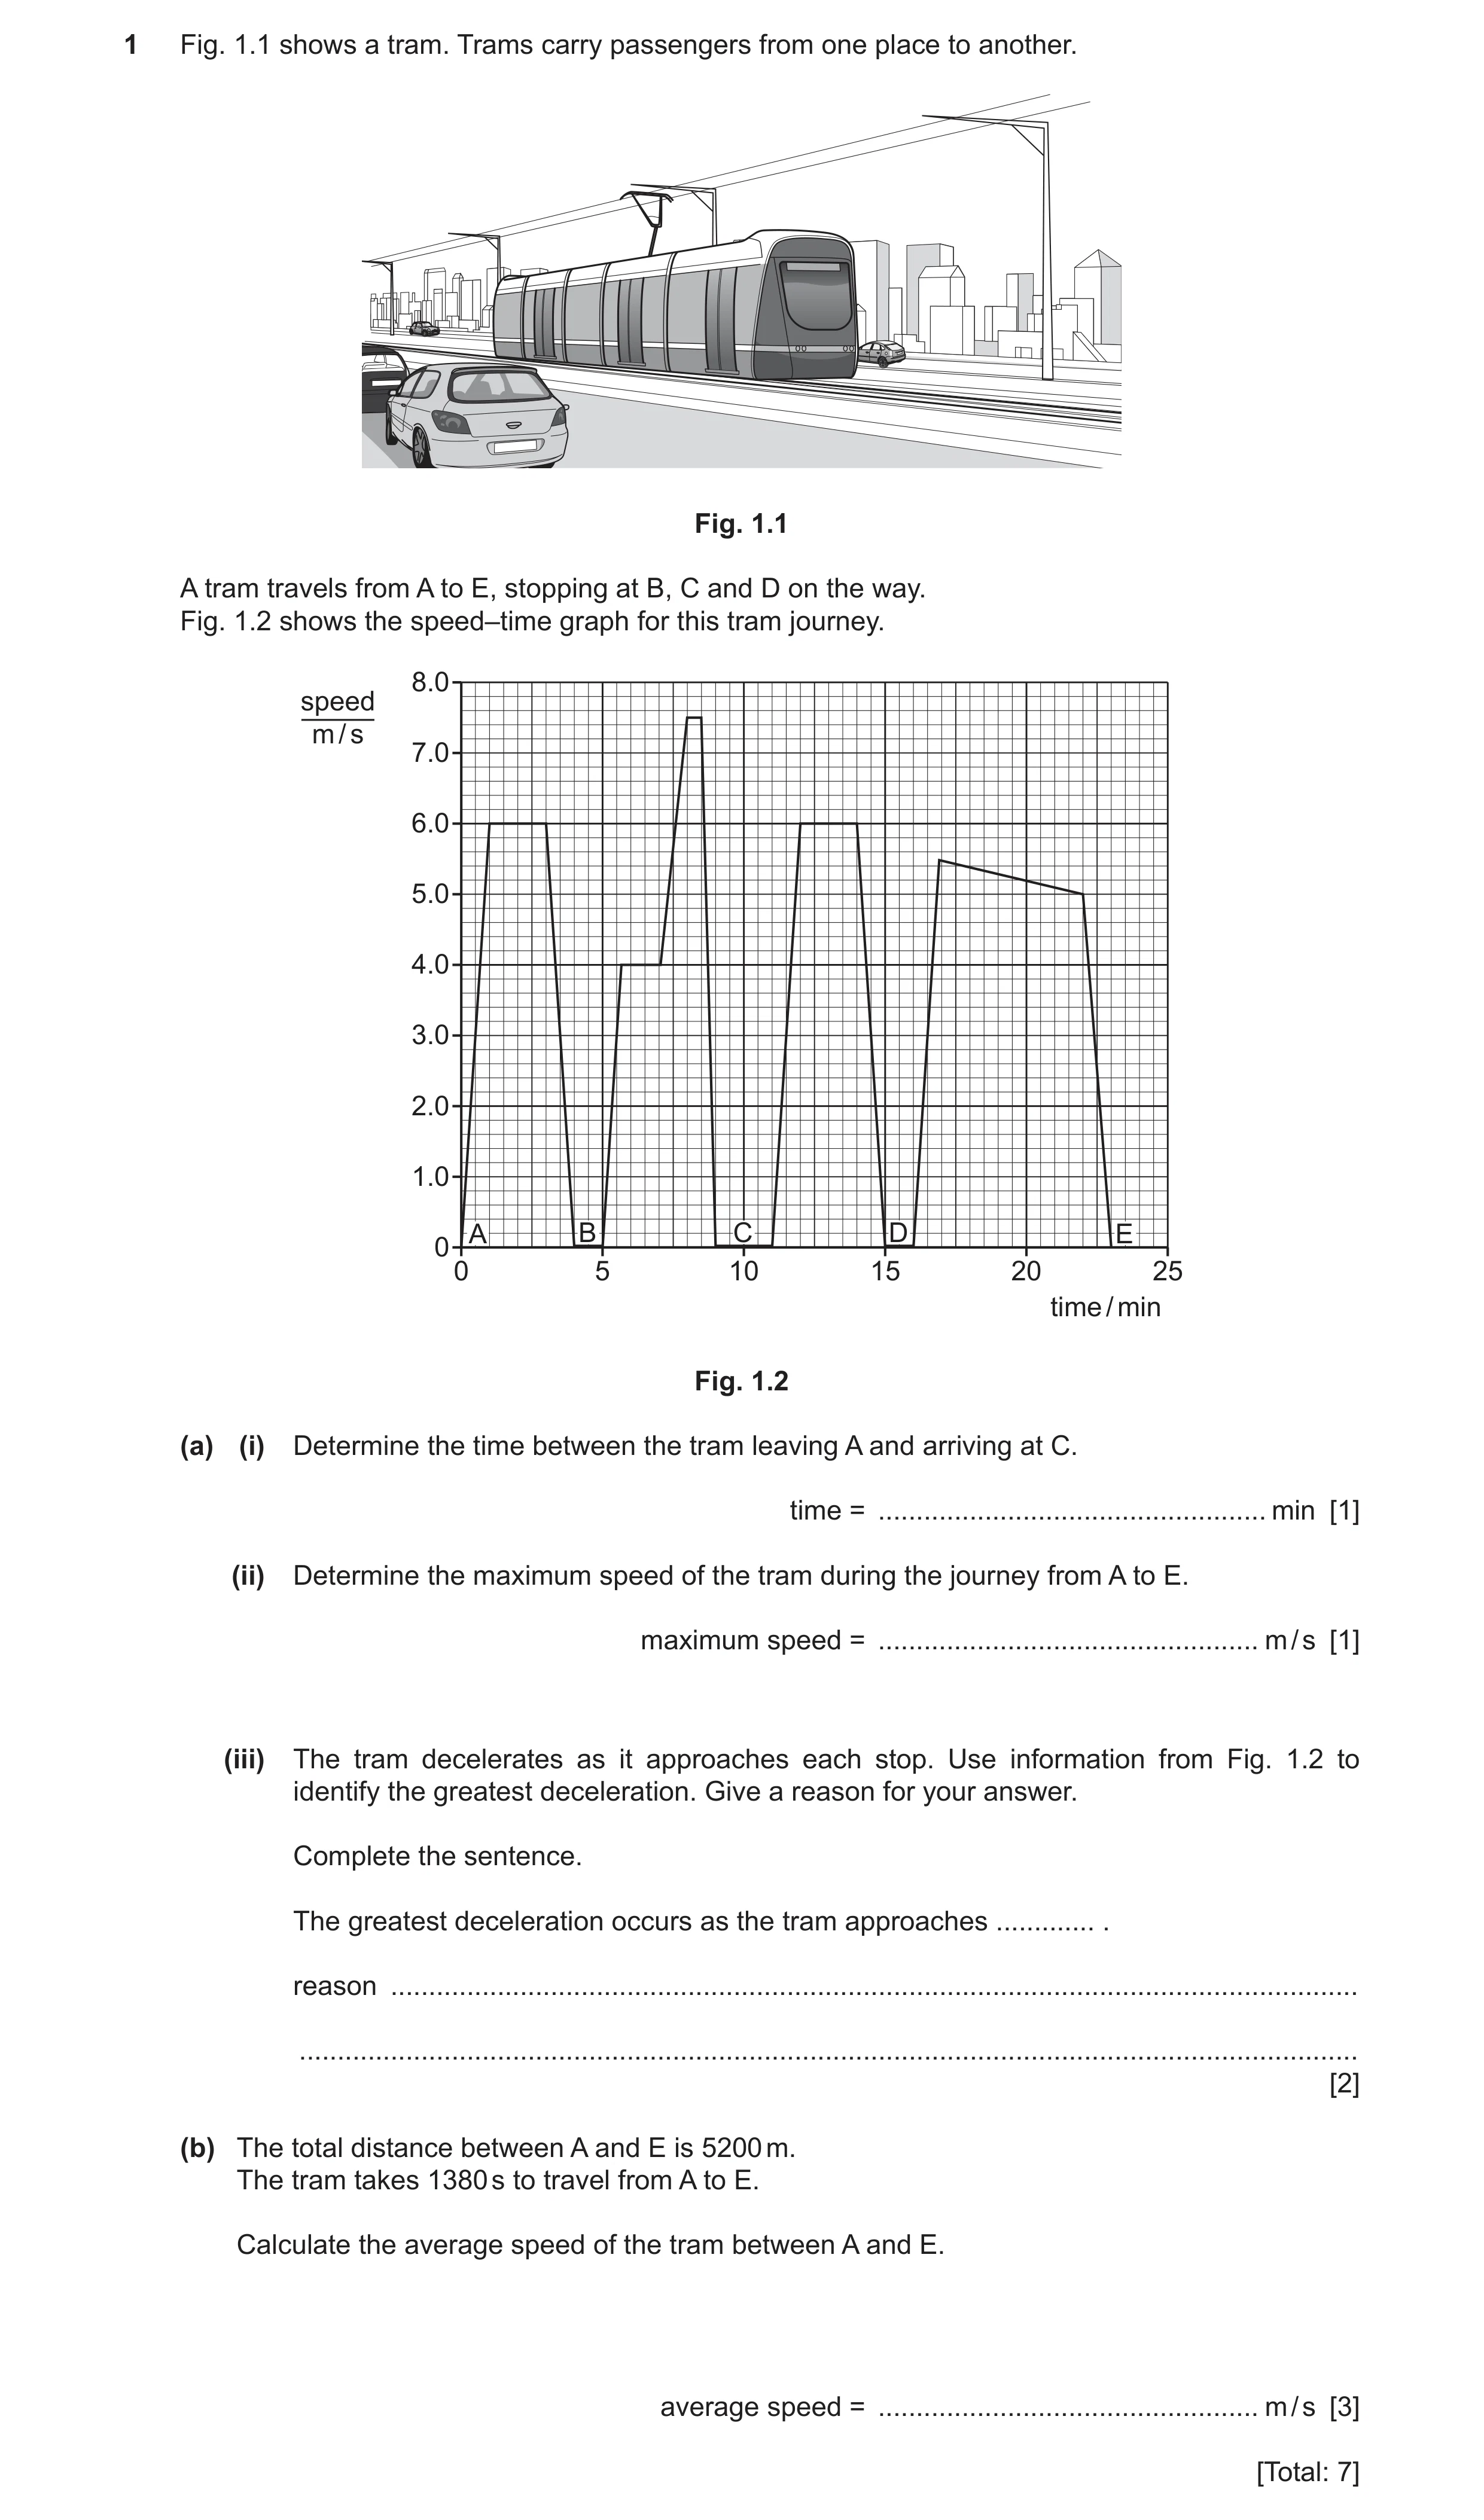
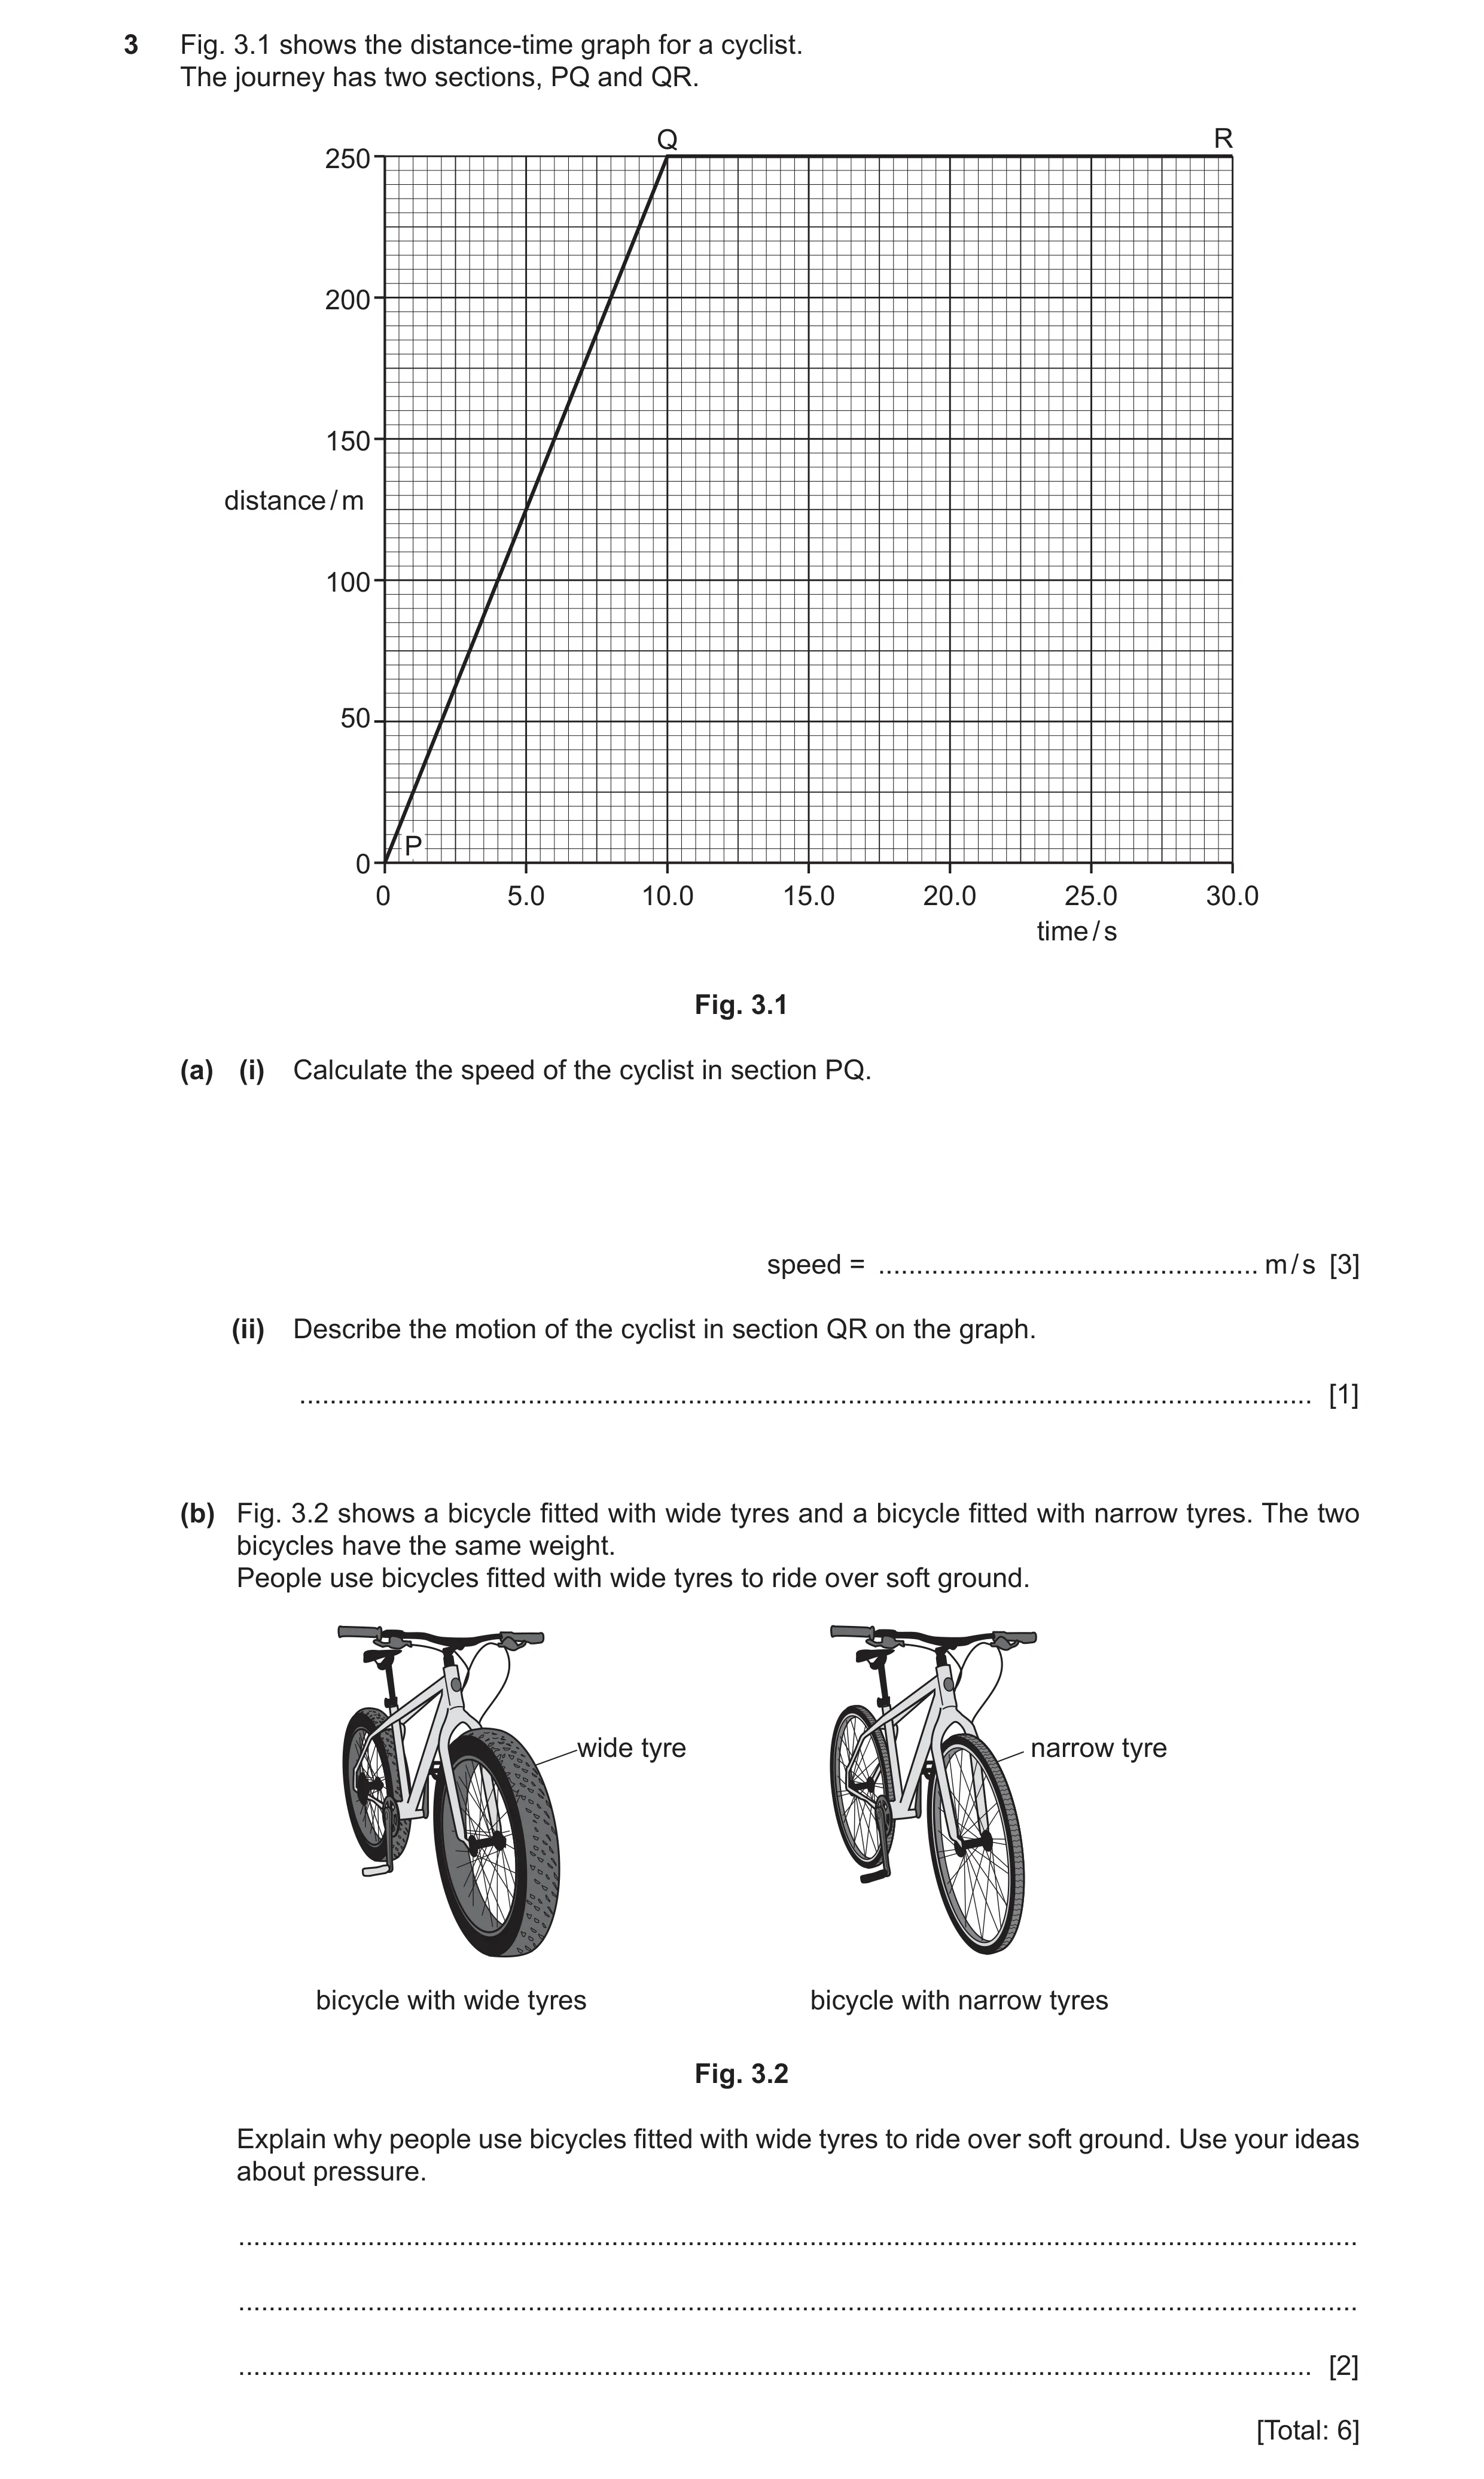
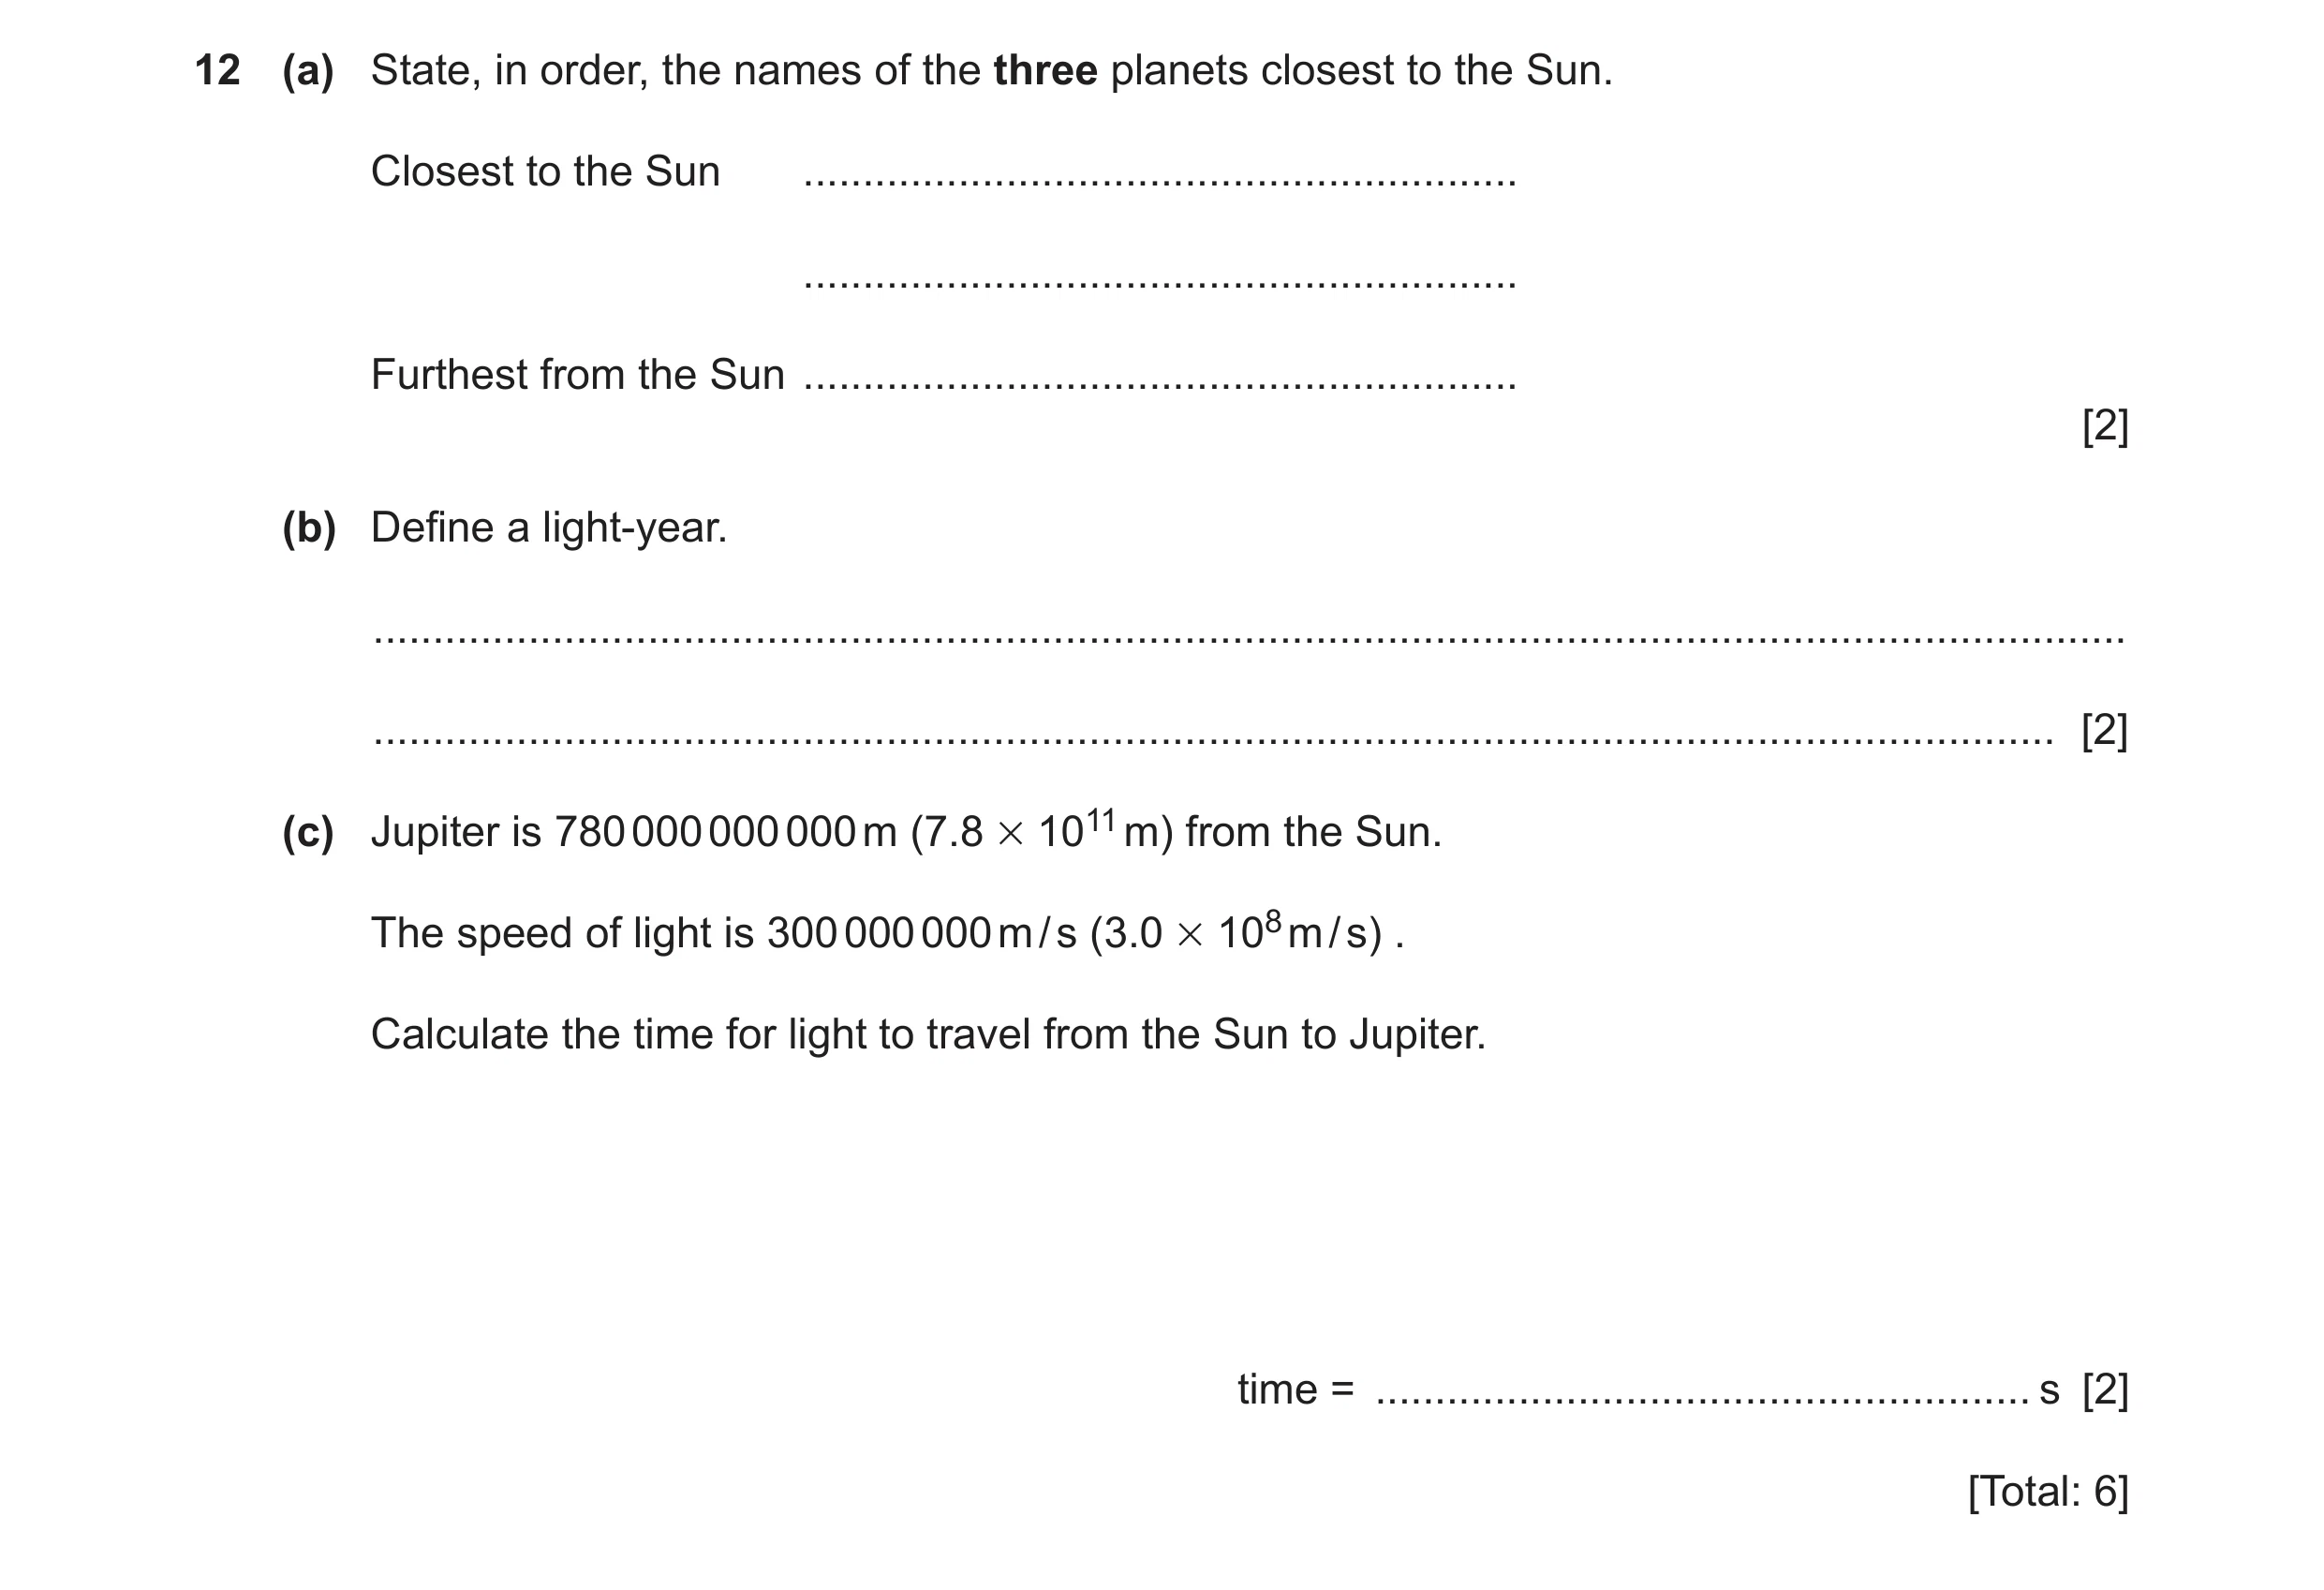 66 / 101
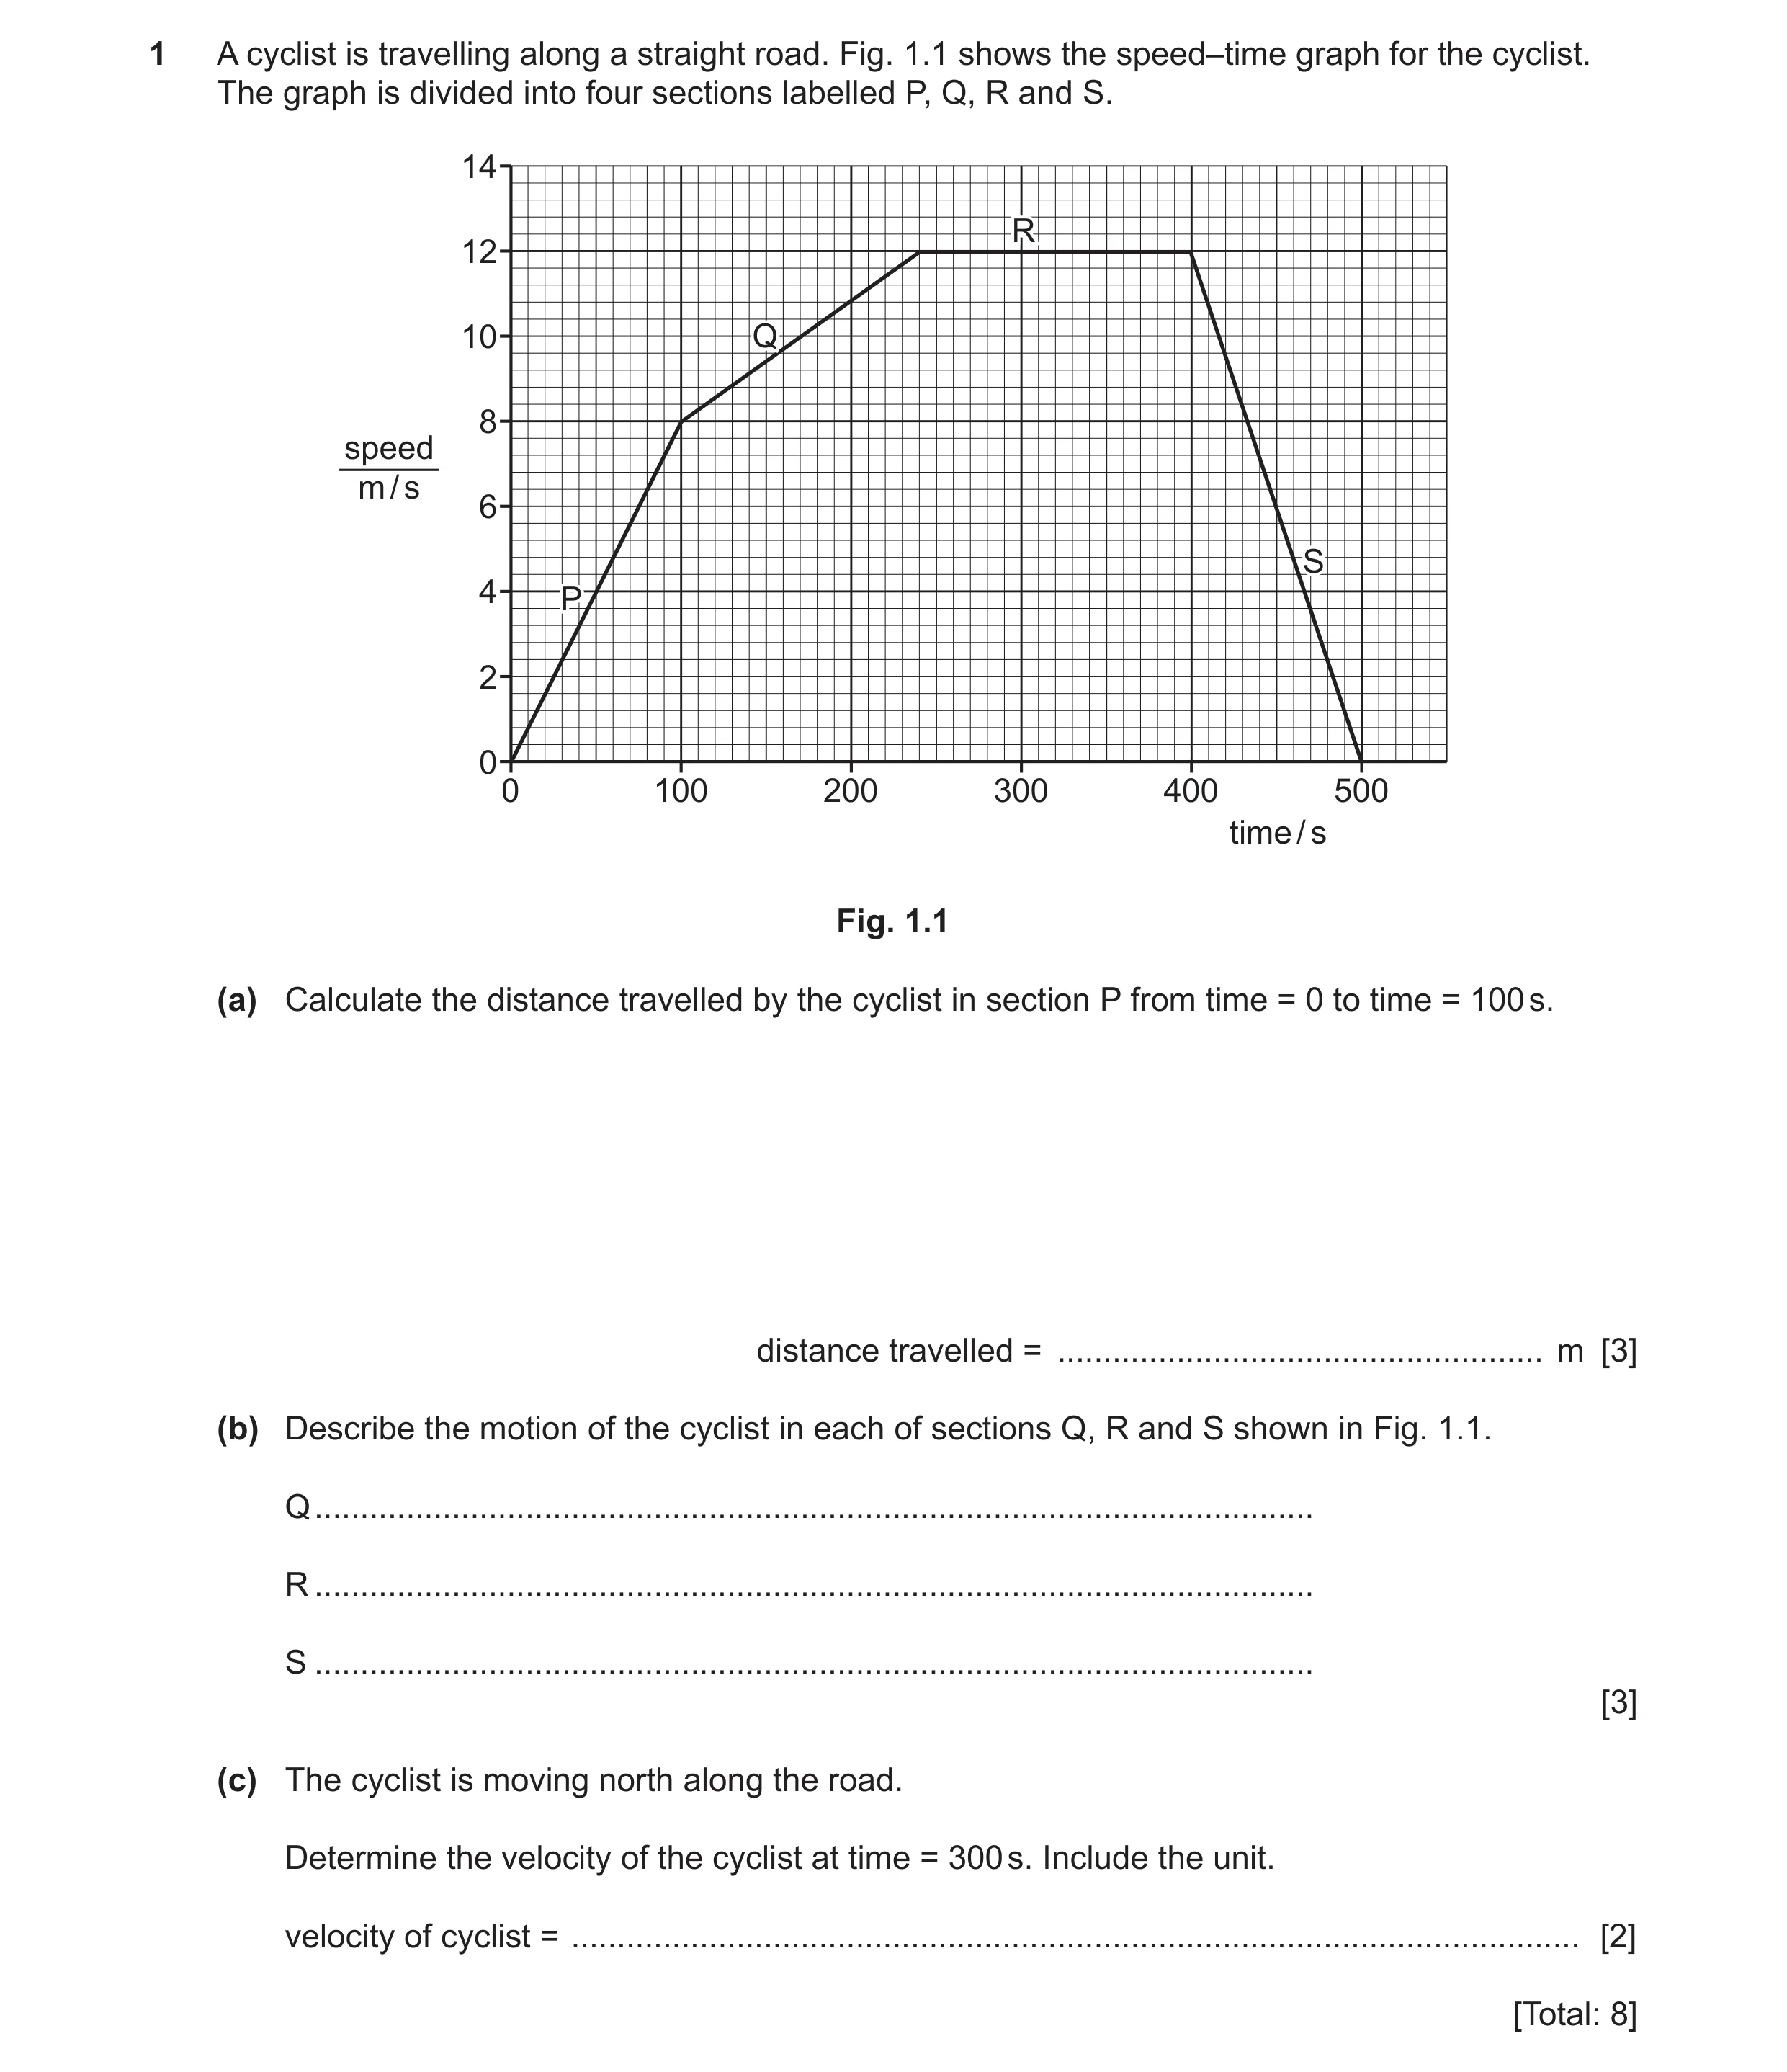 67 / 101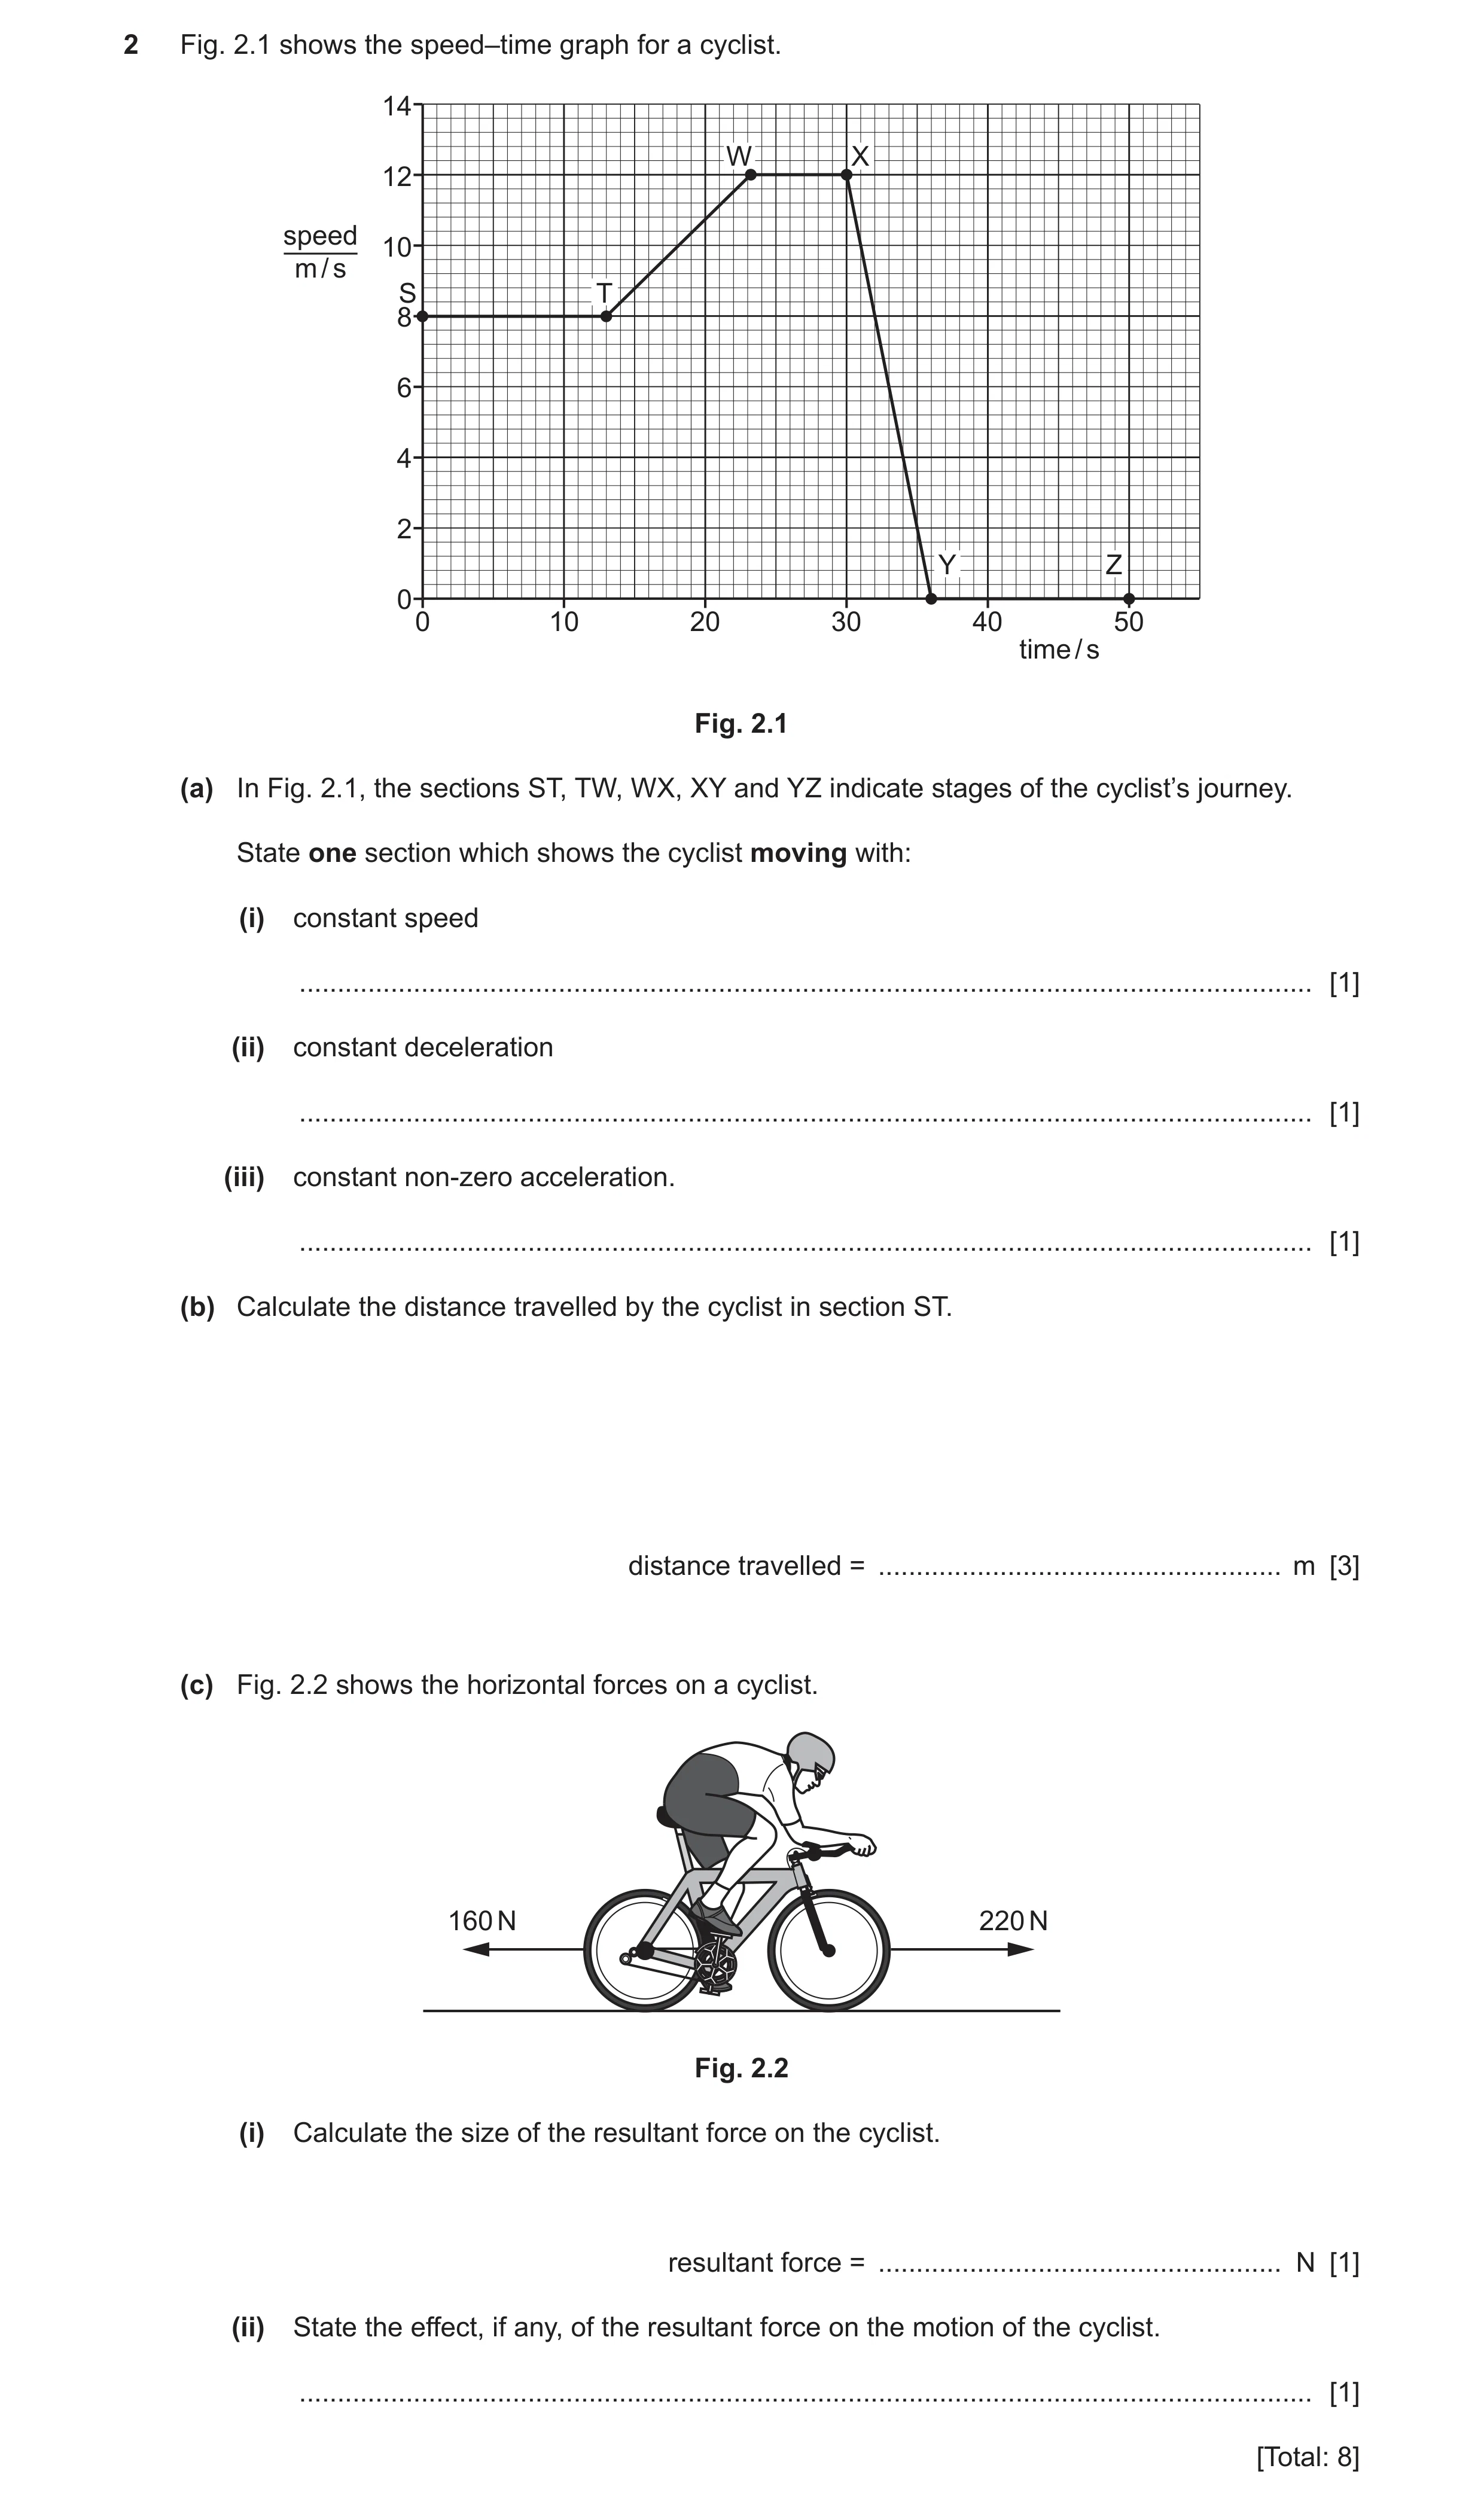
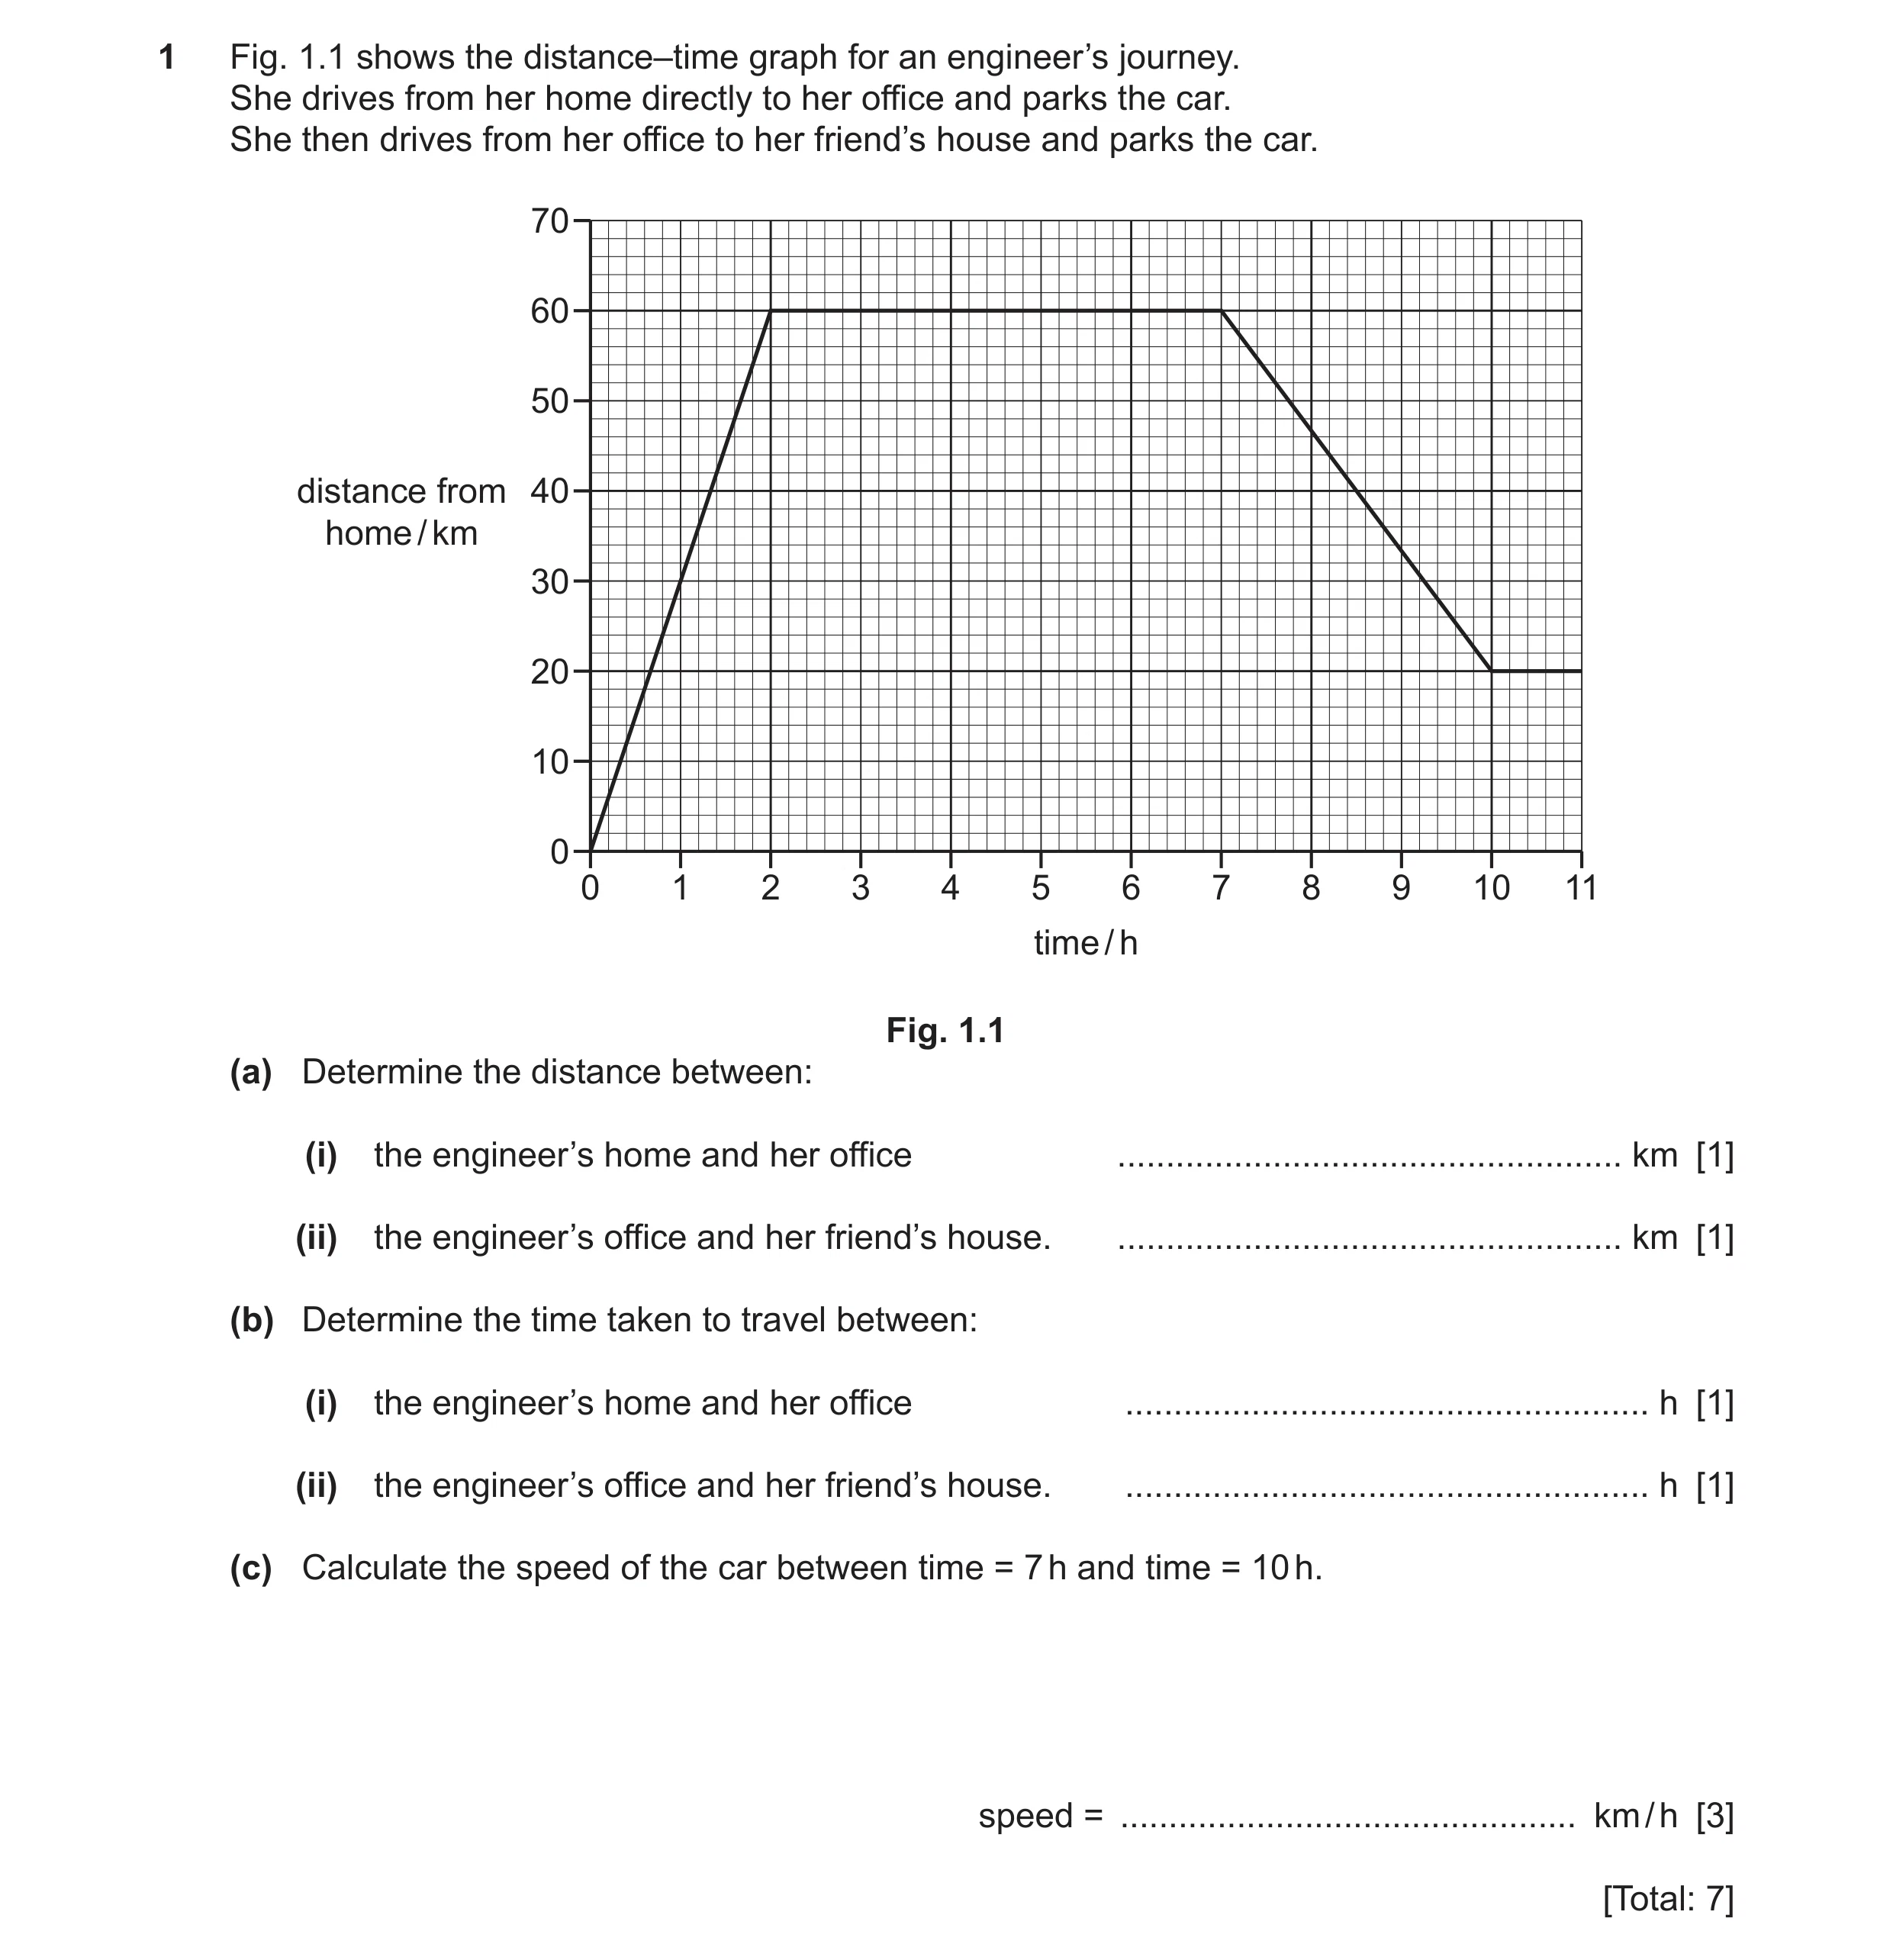 69 / 101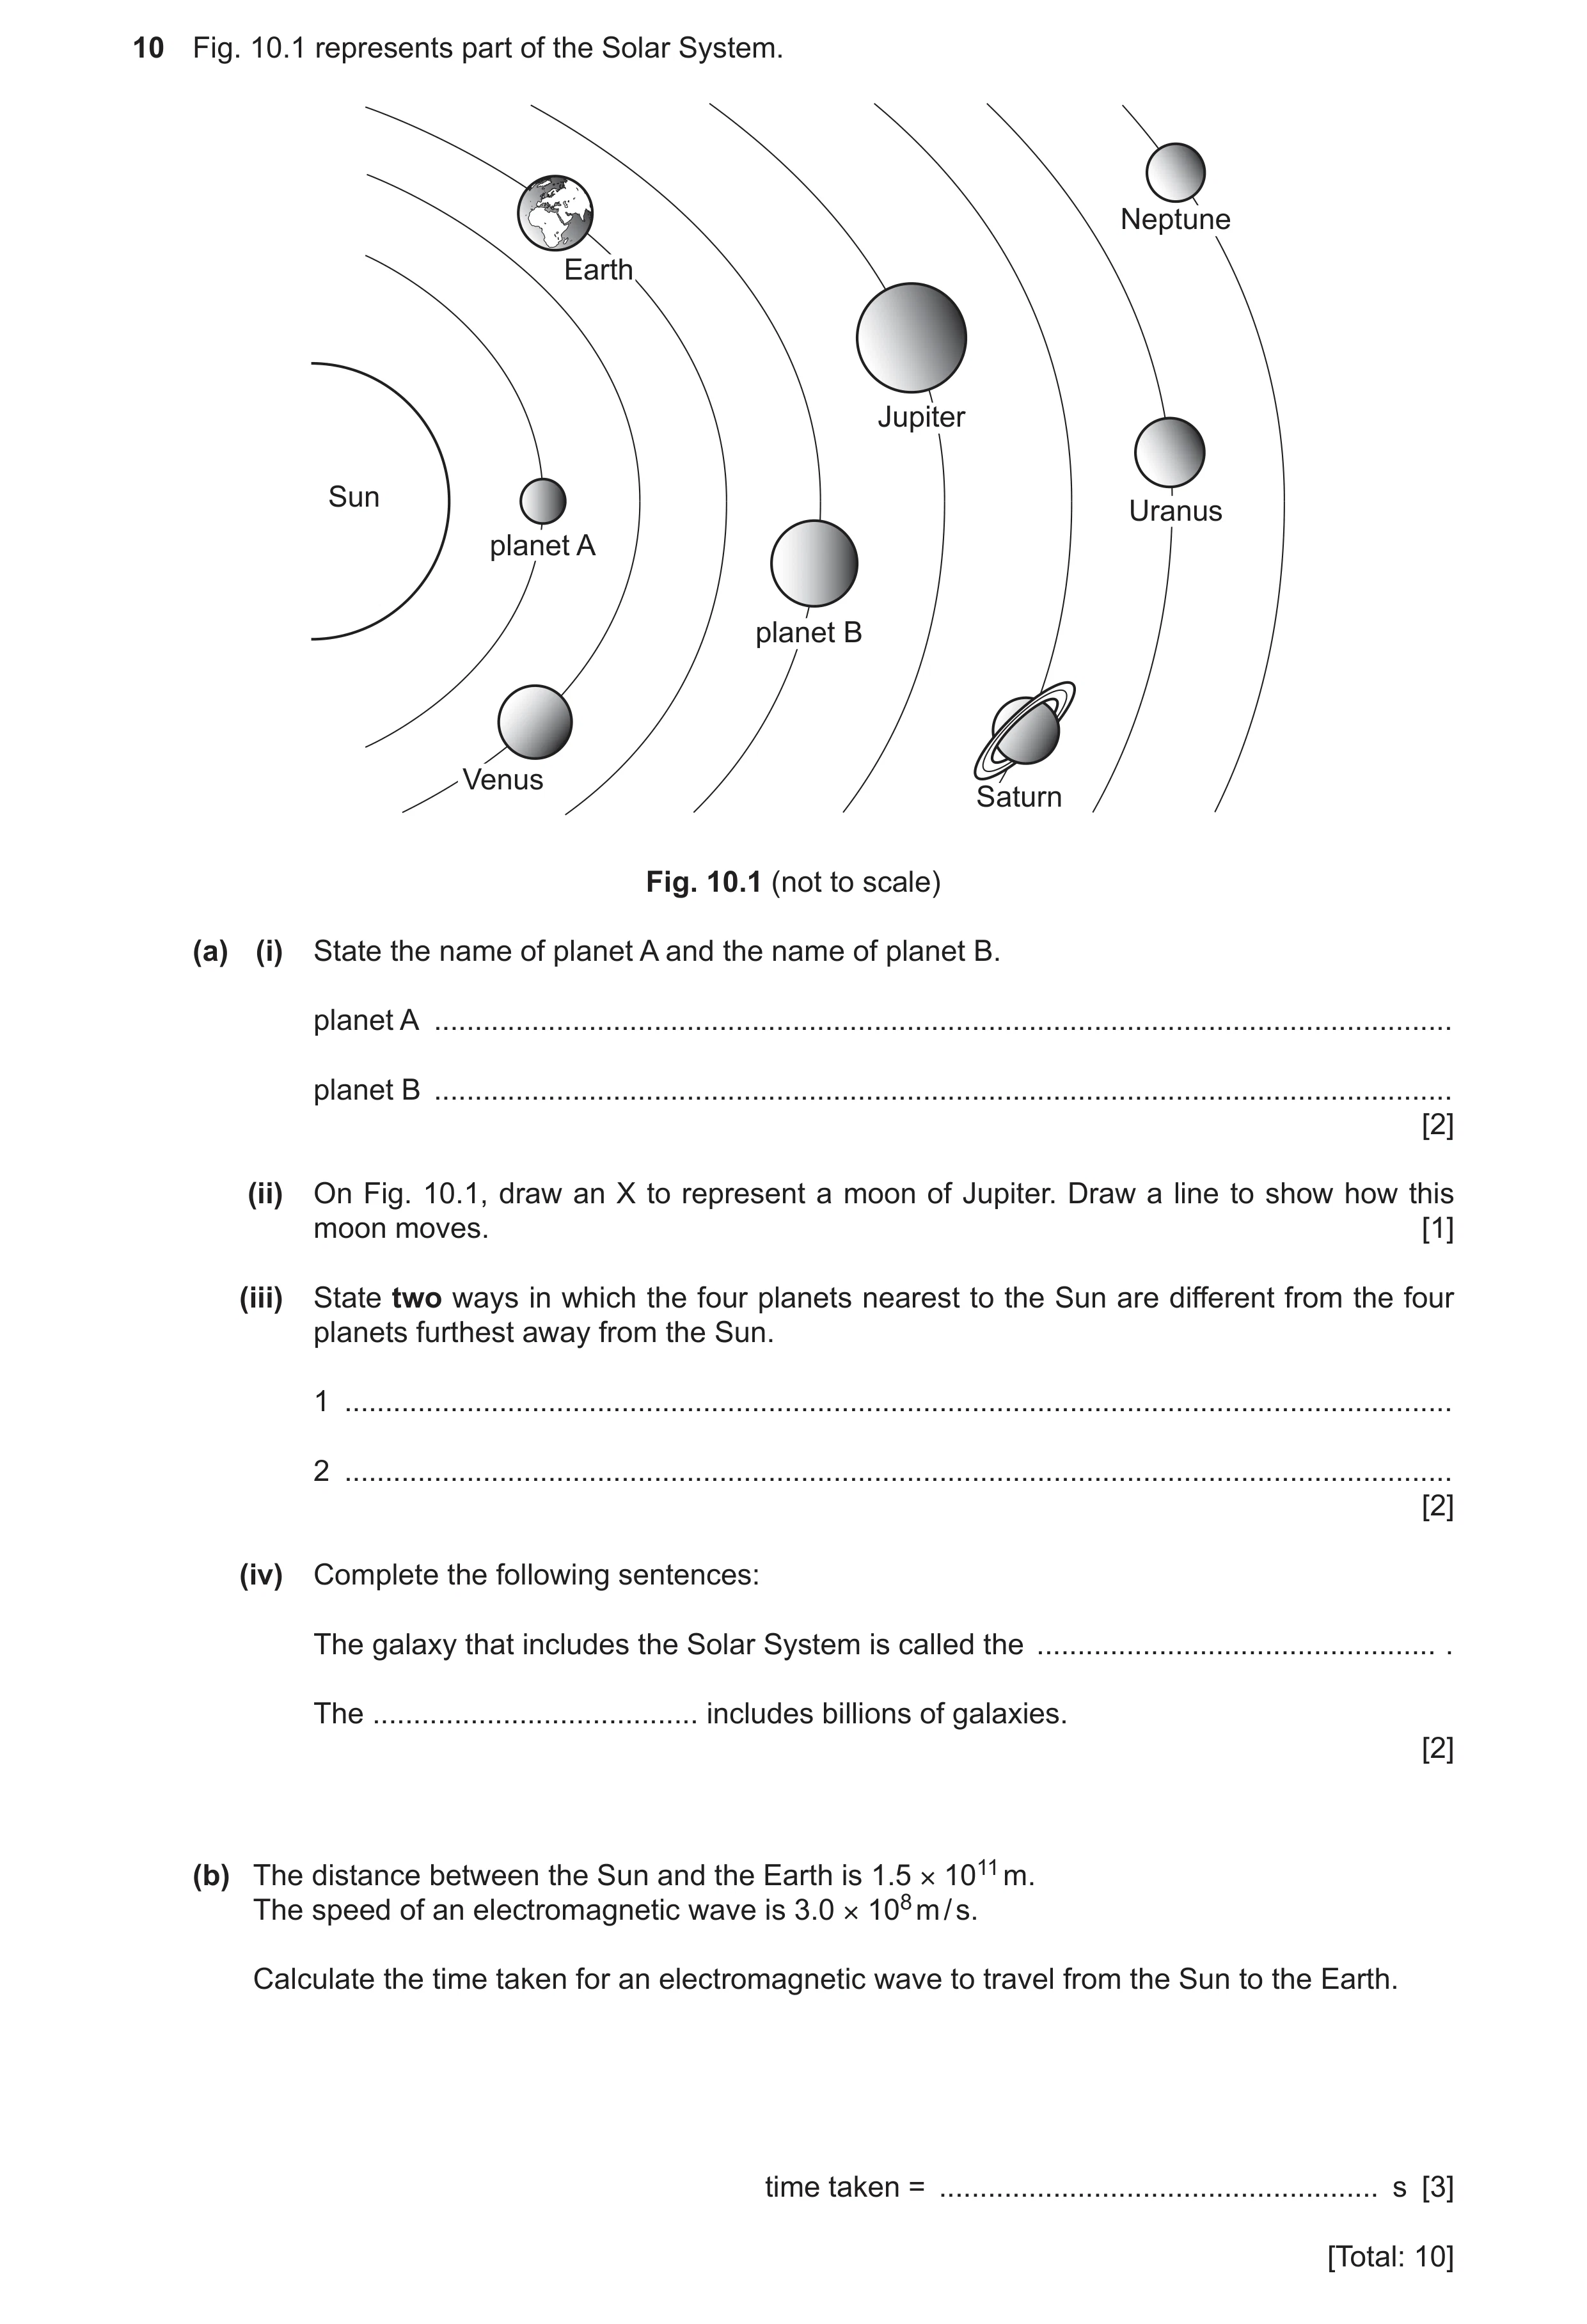
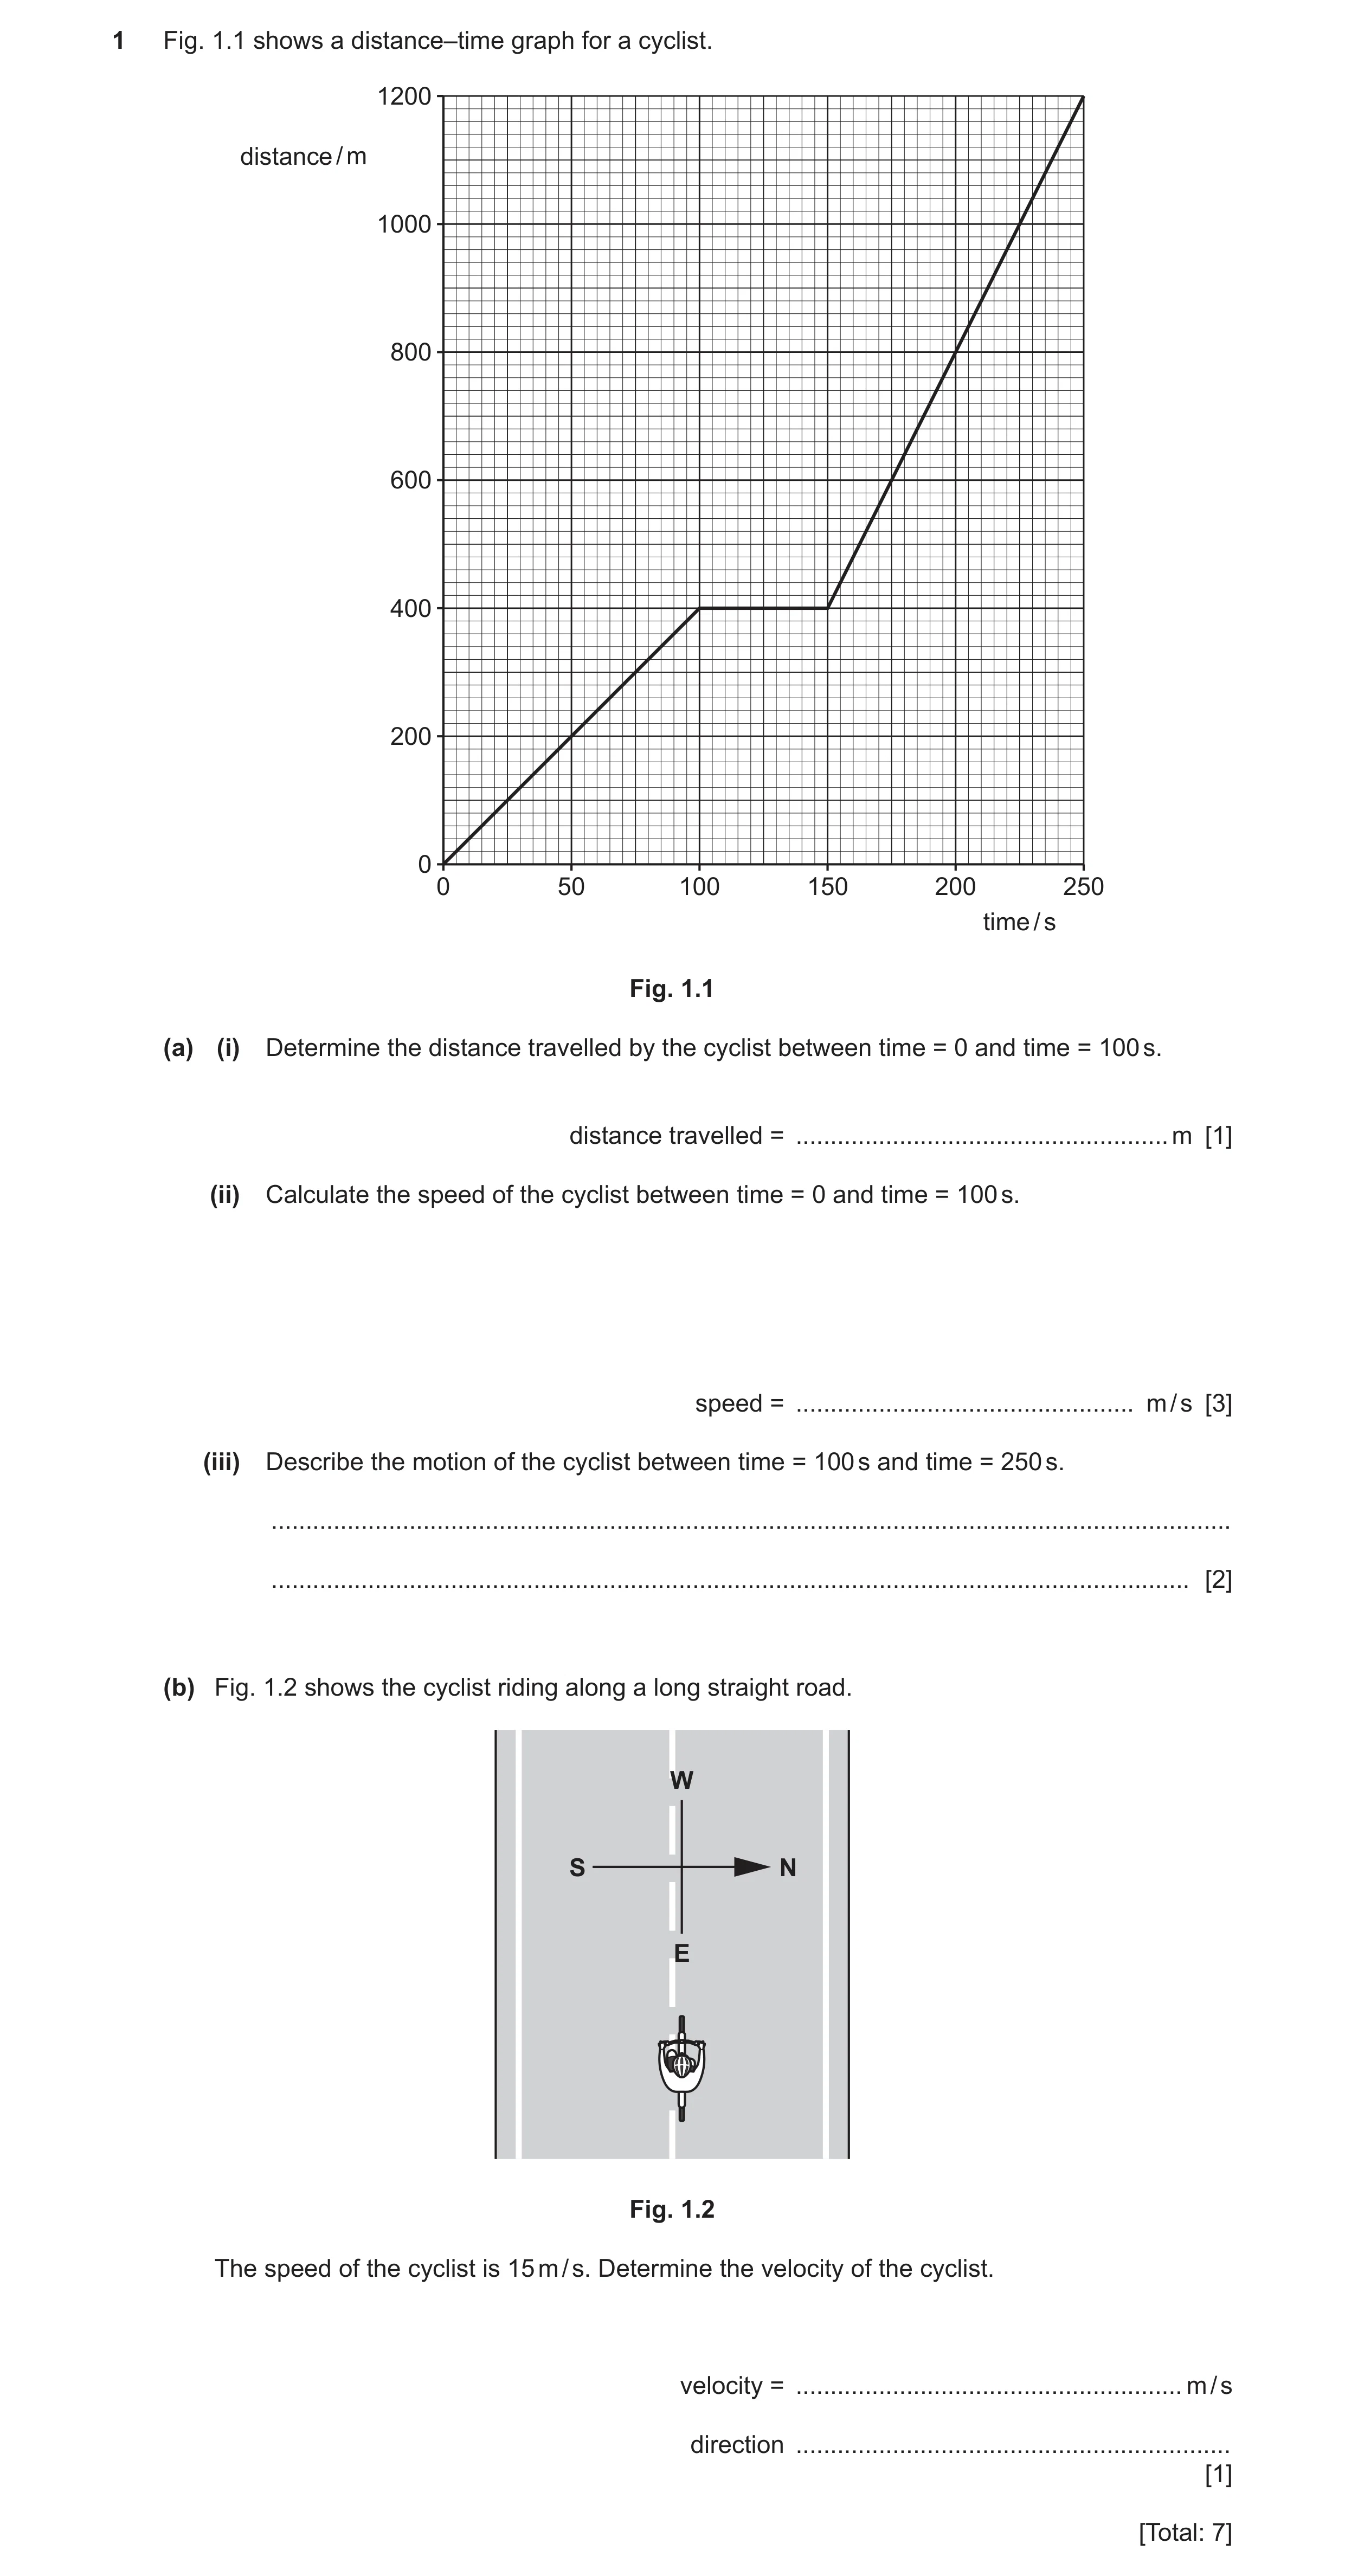
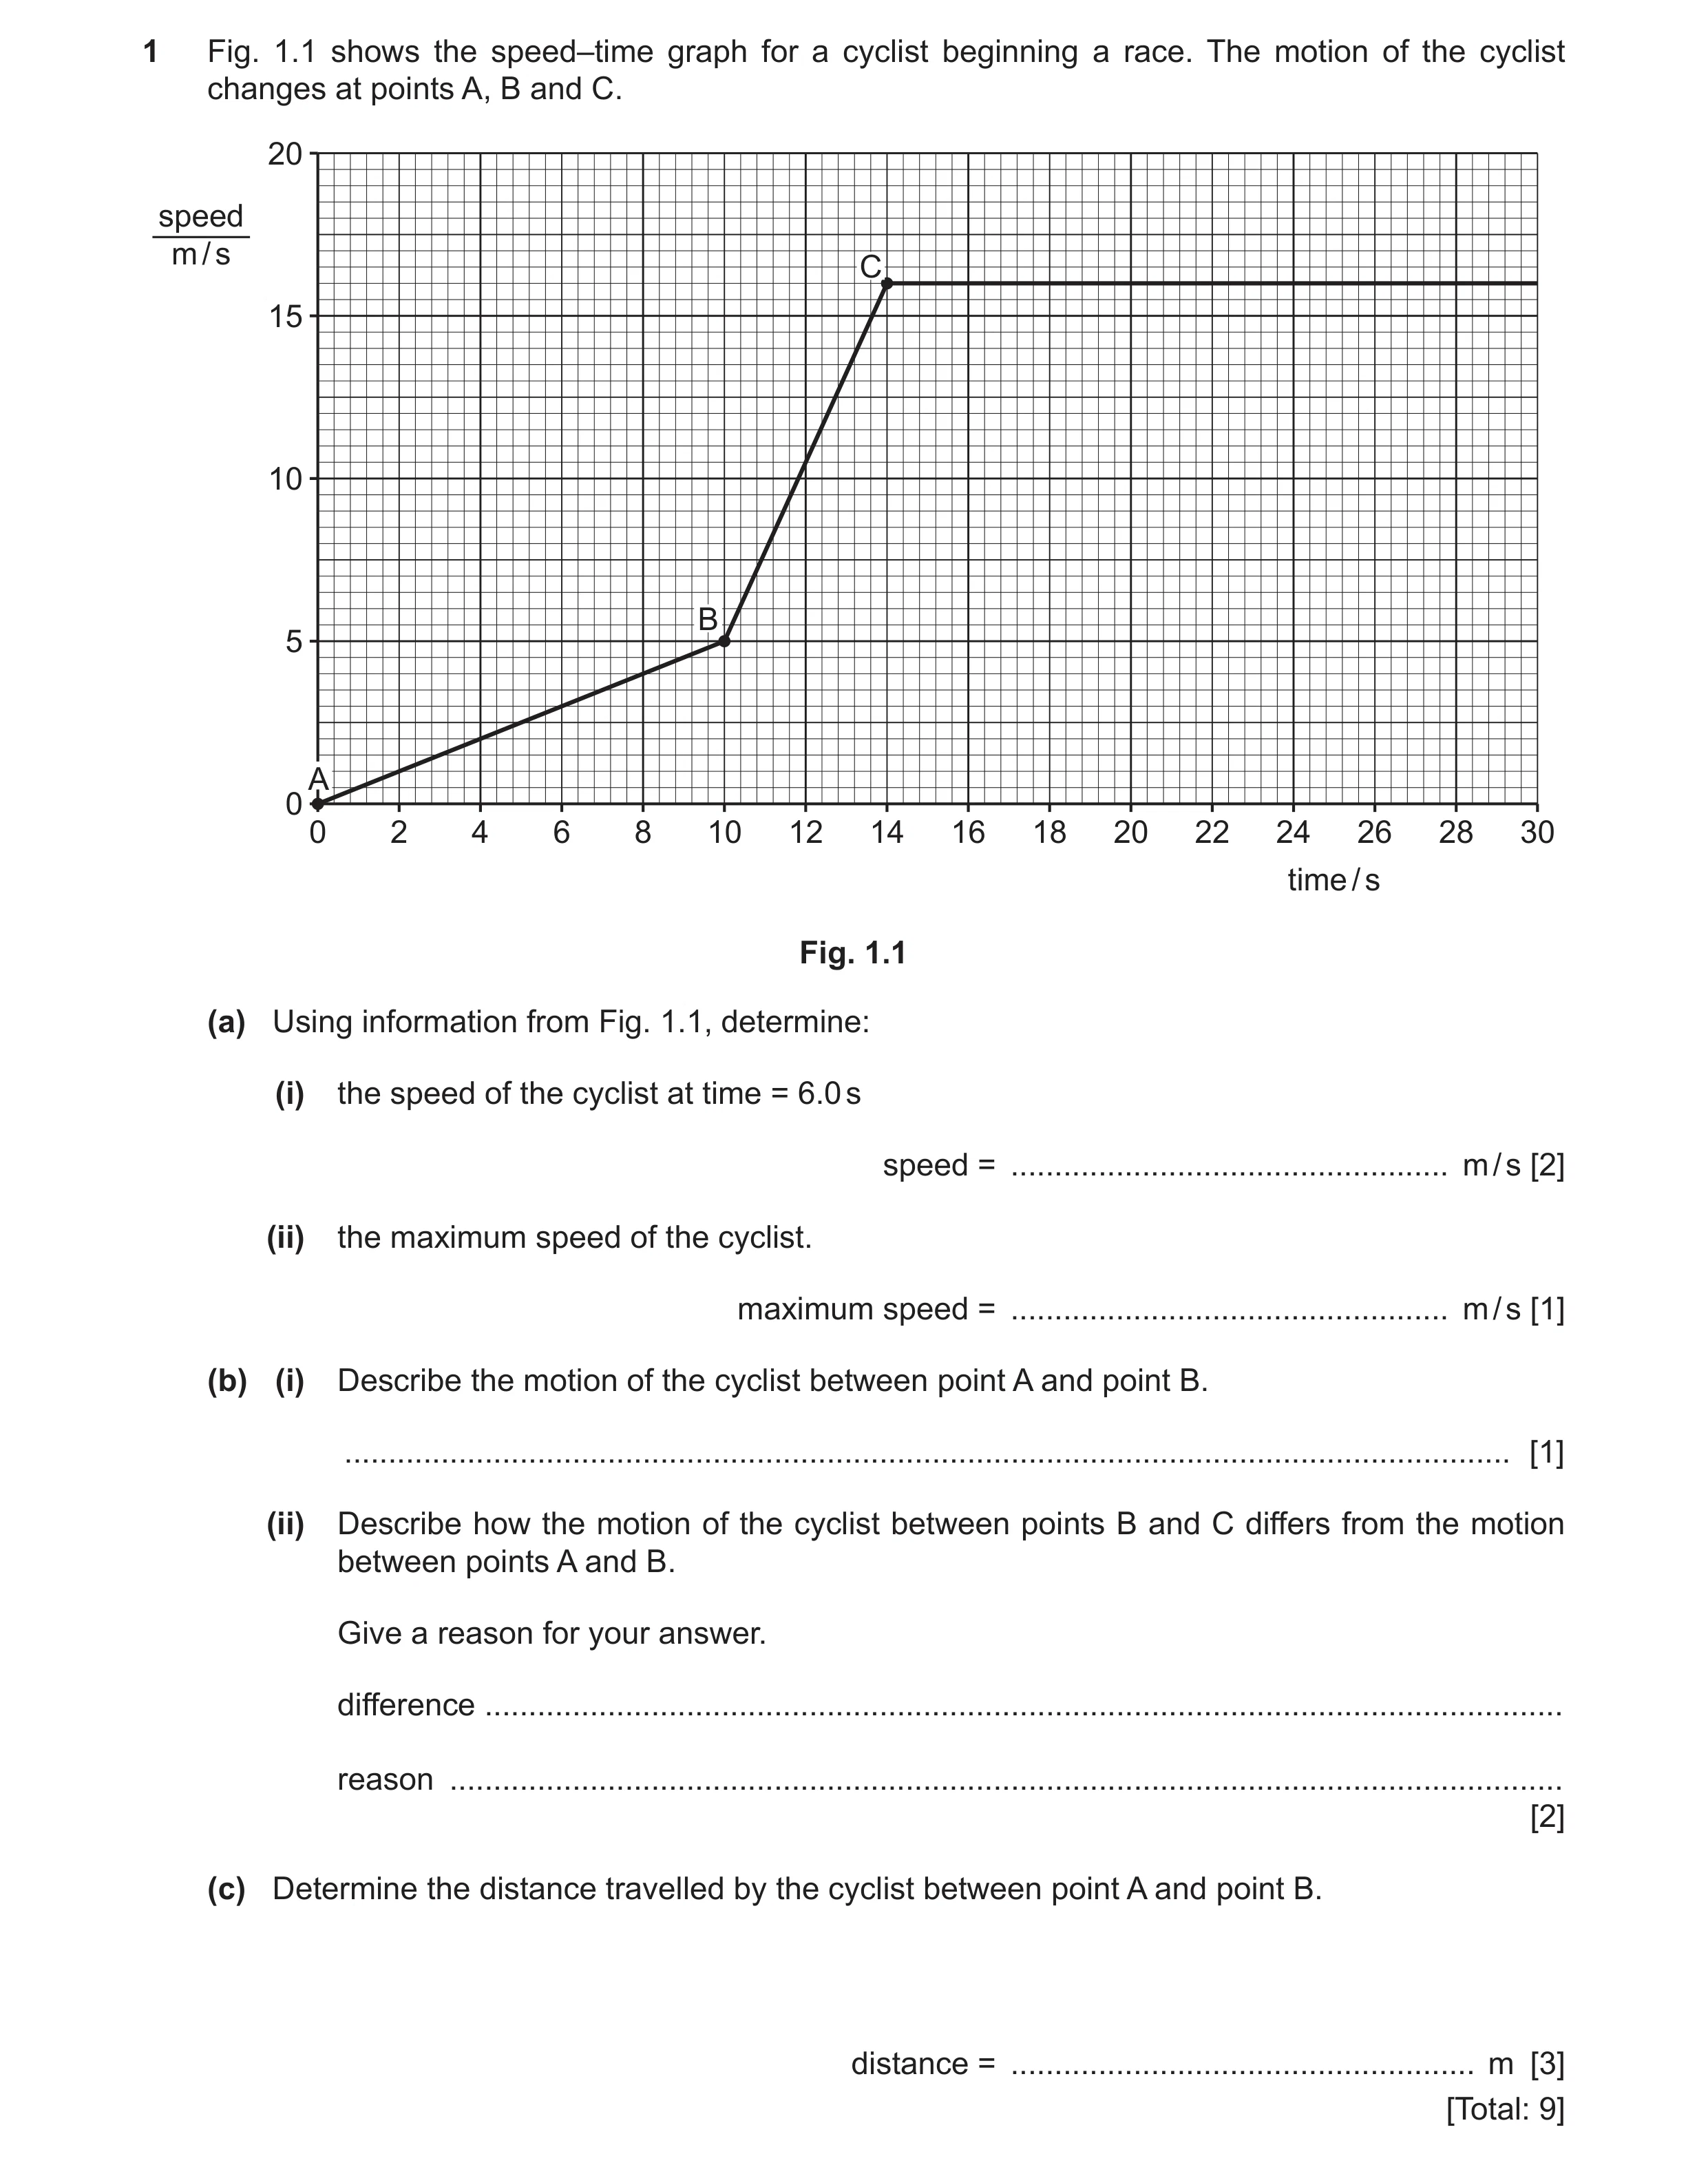 73 / 101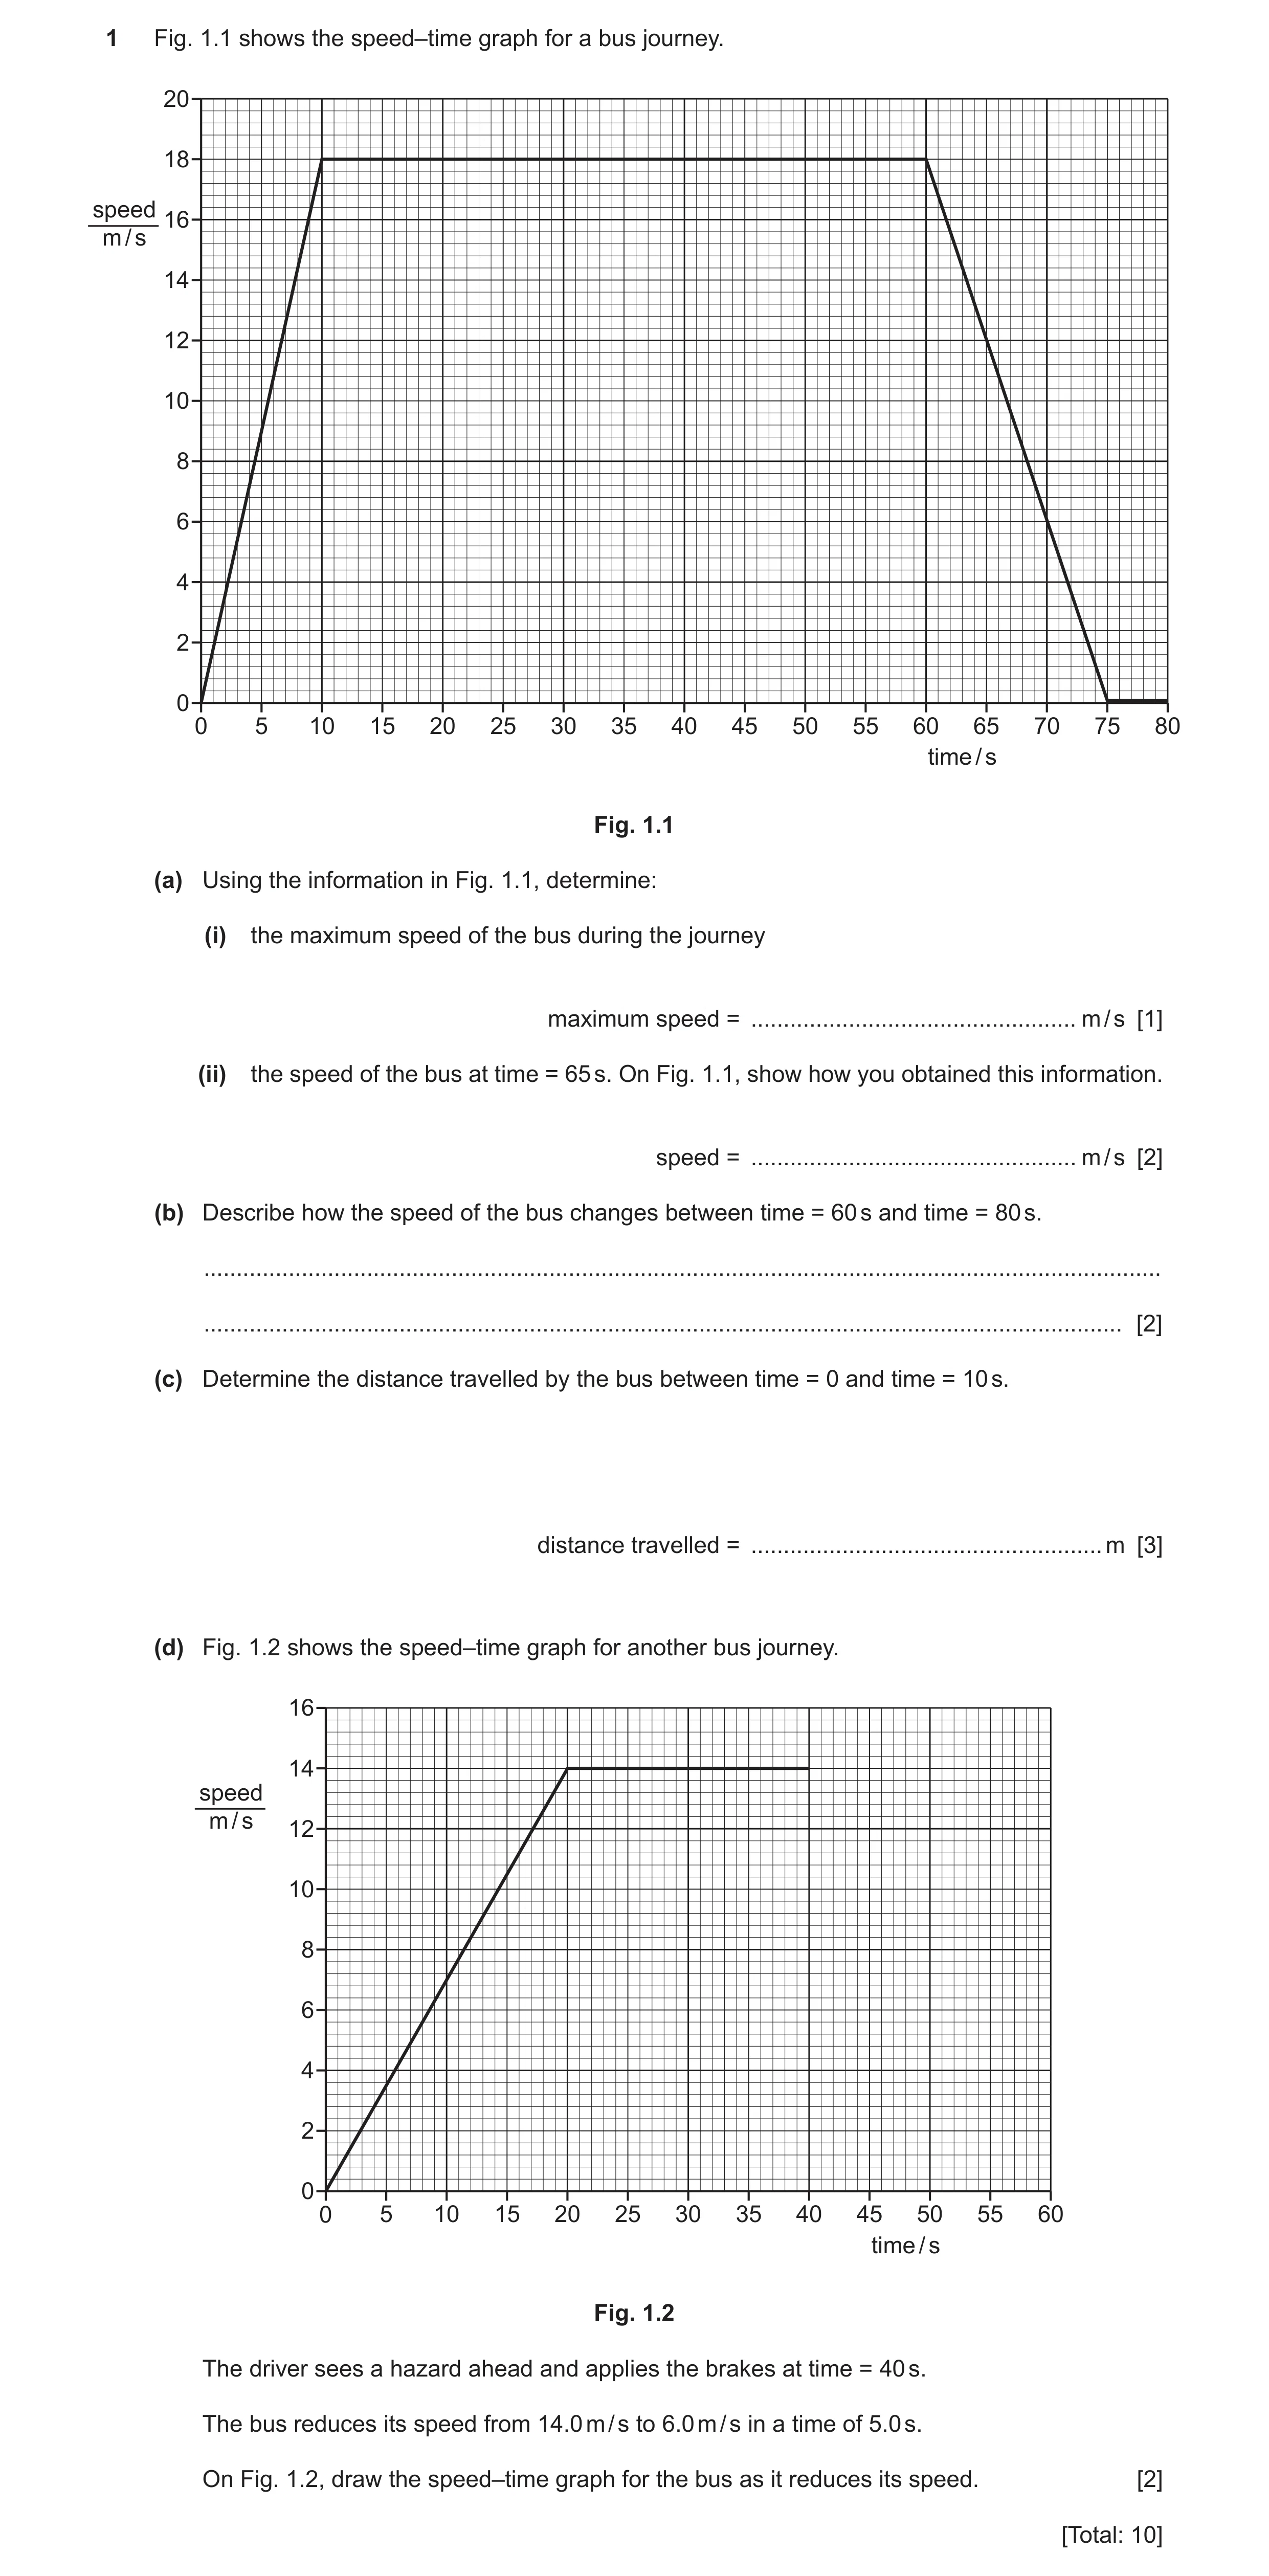
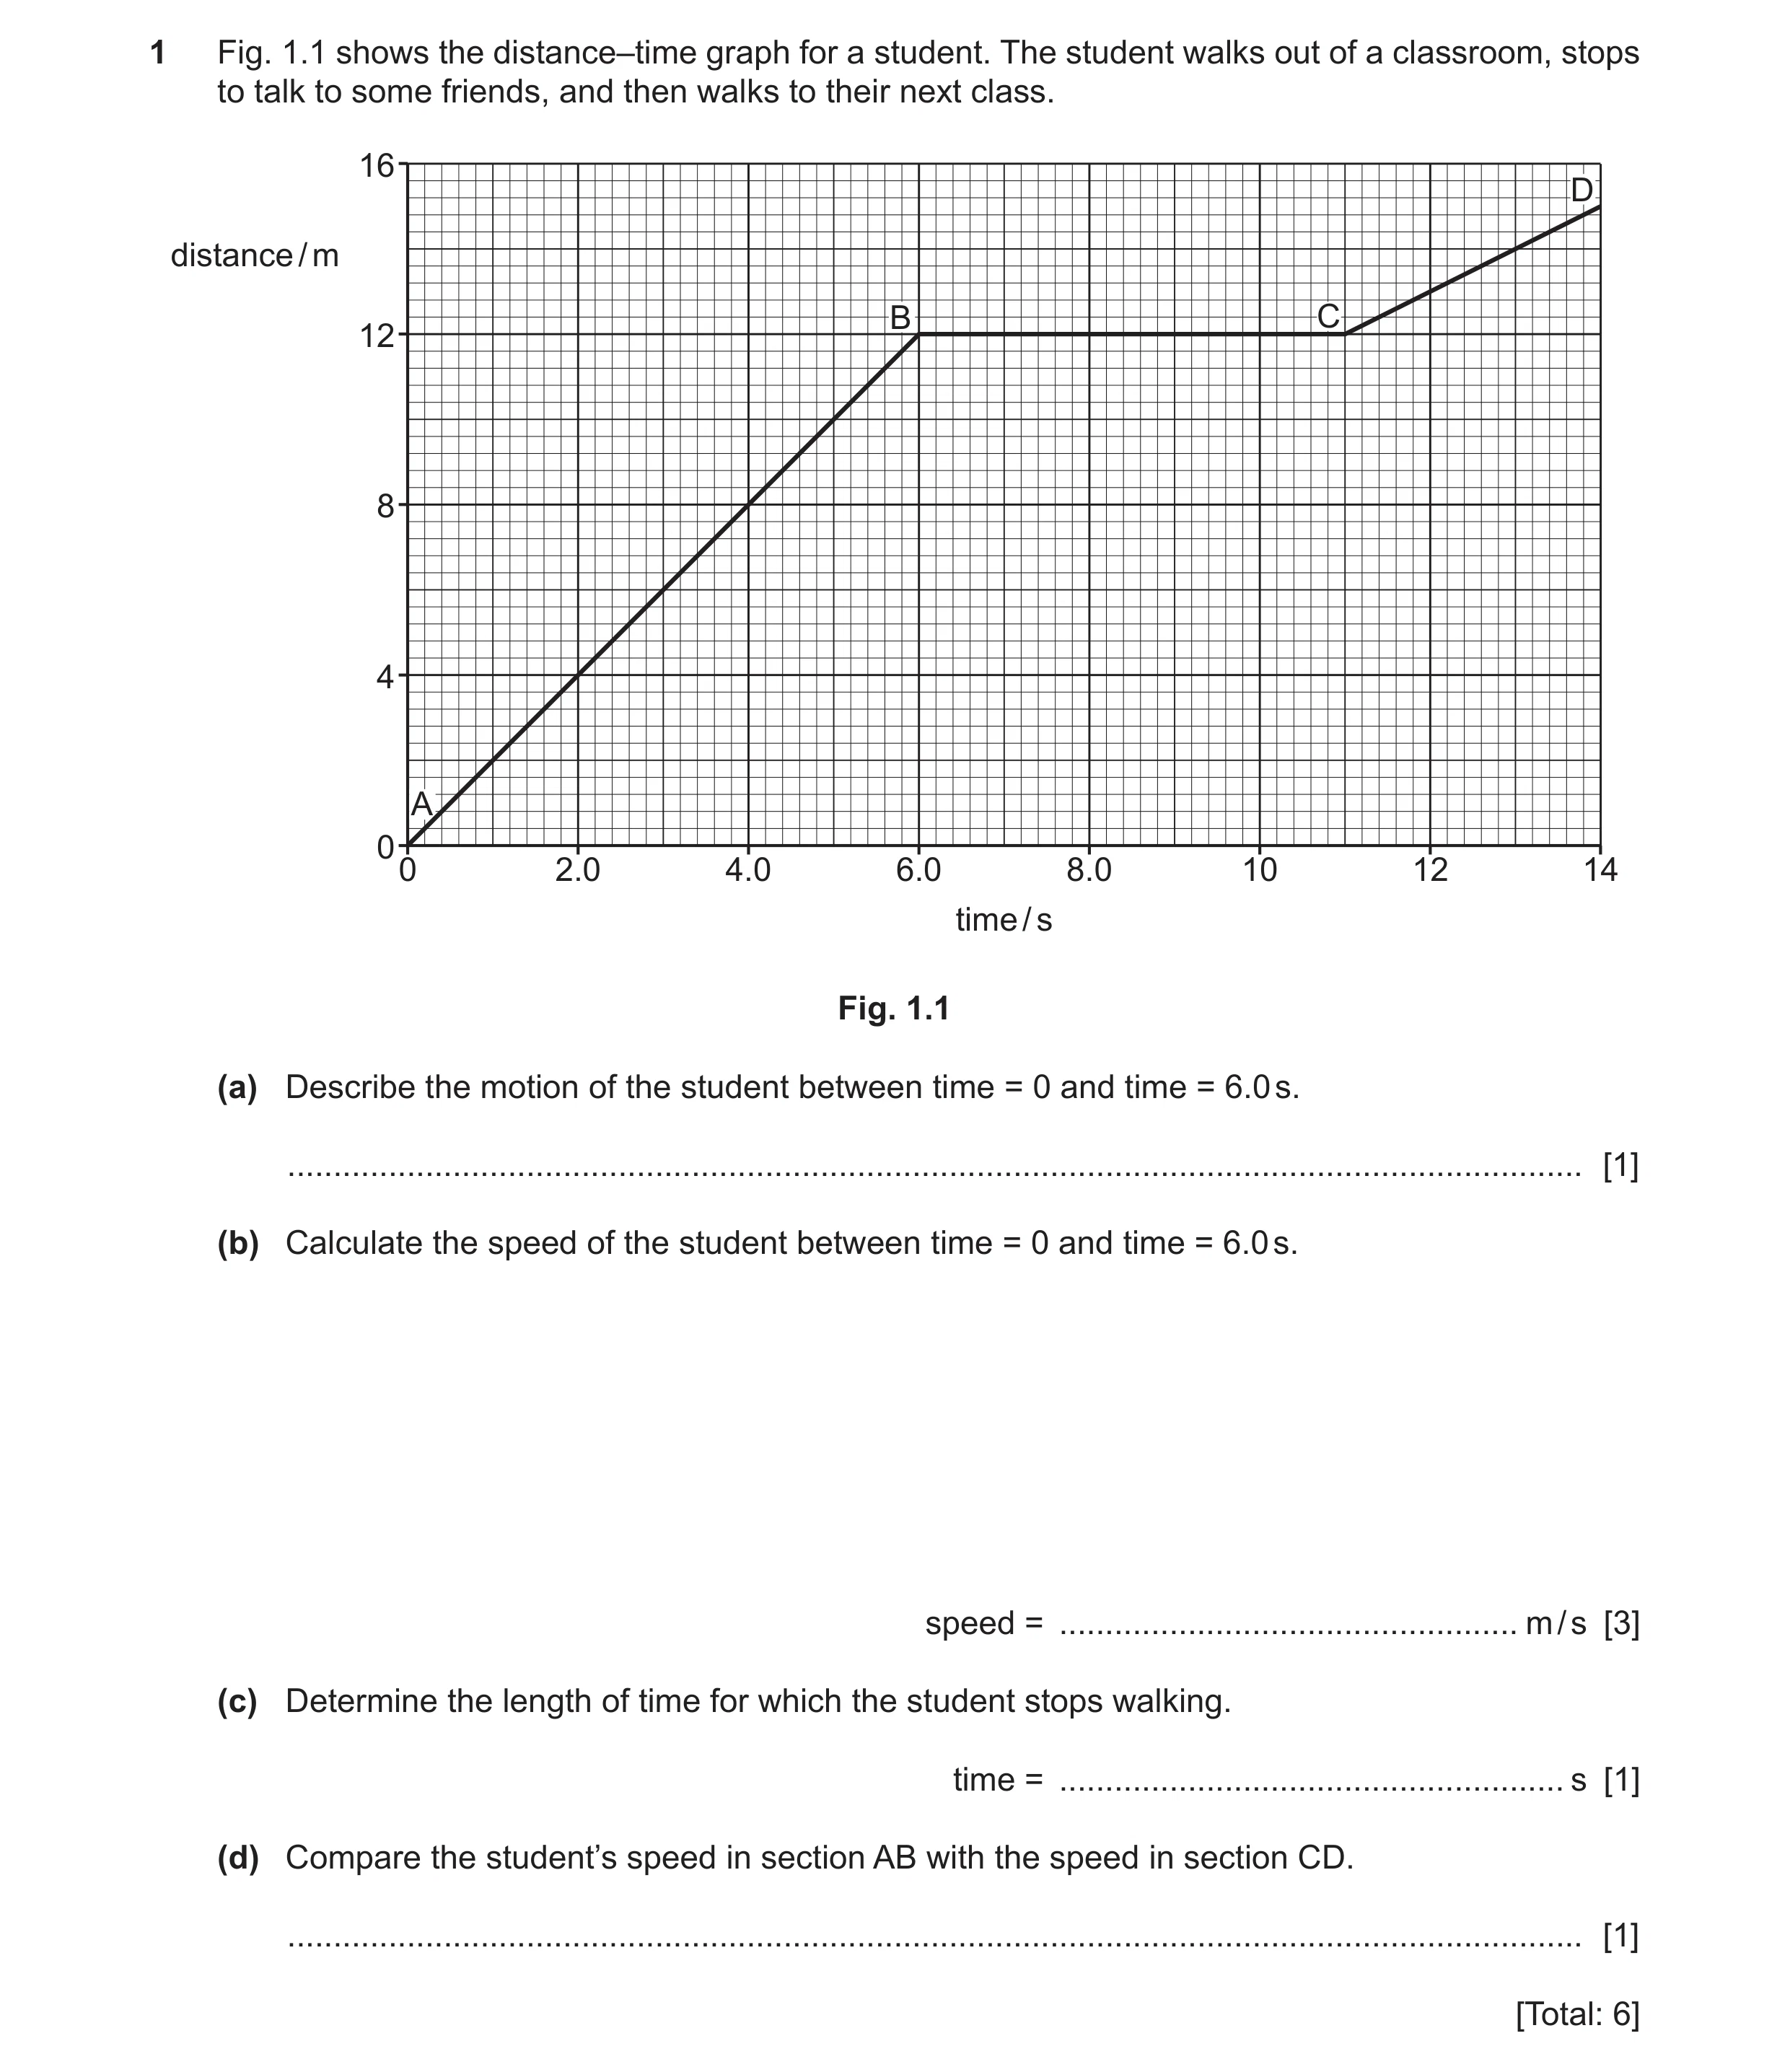 76 / 101
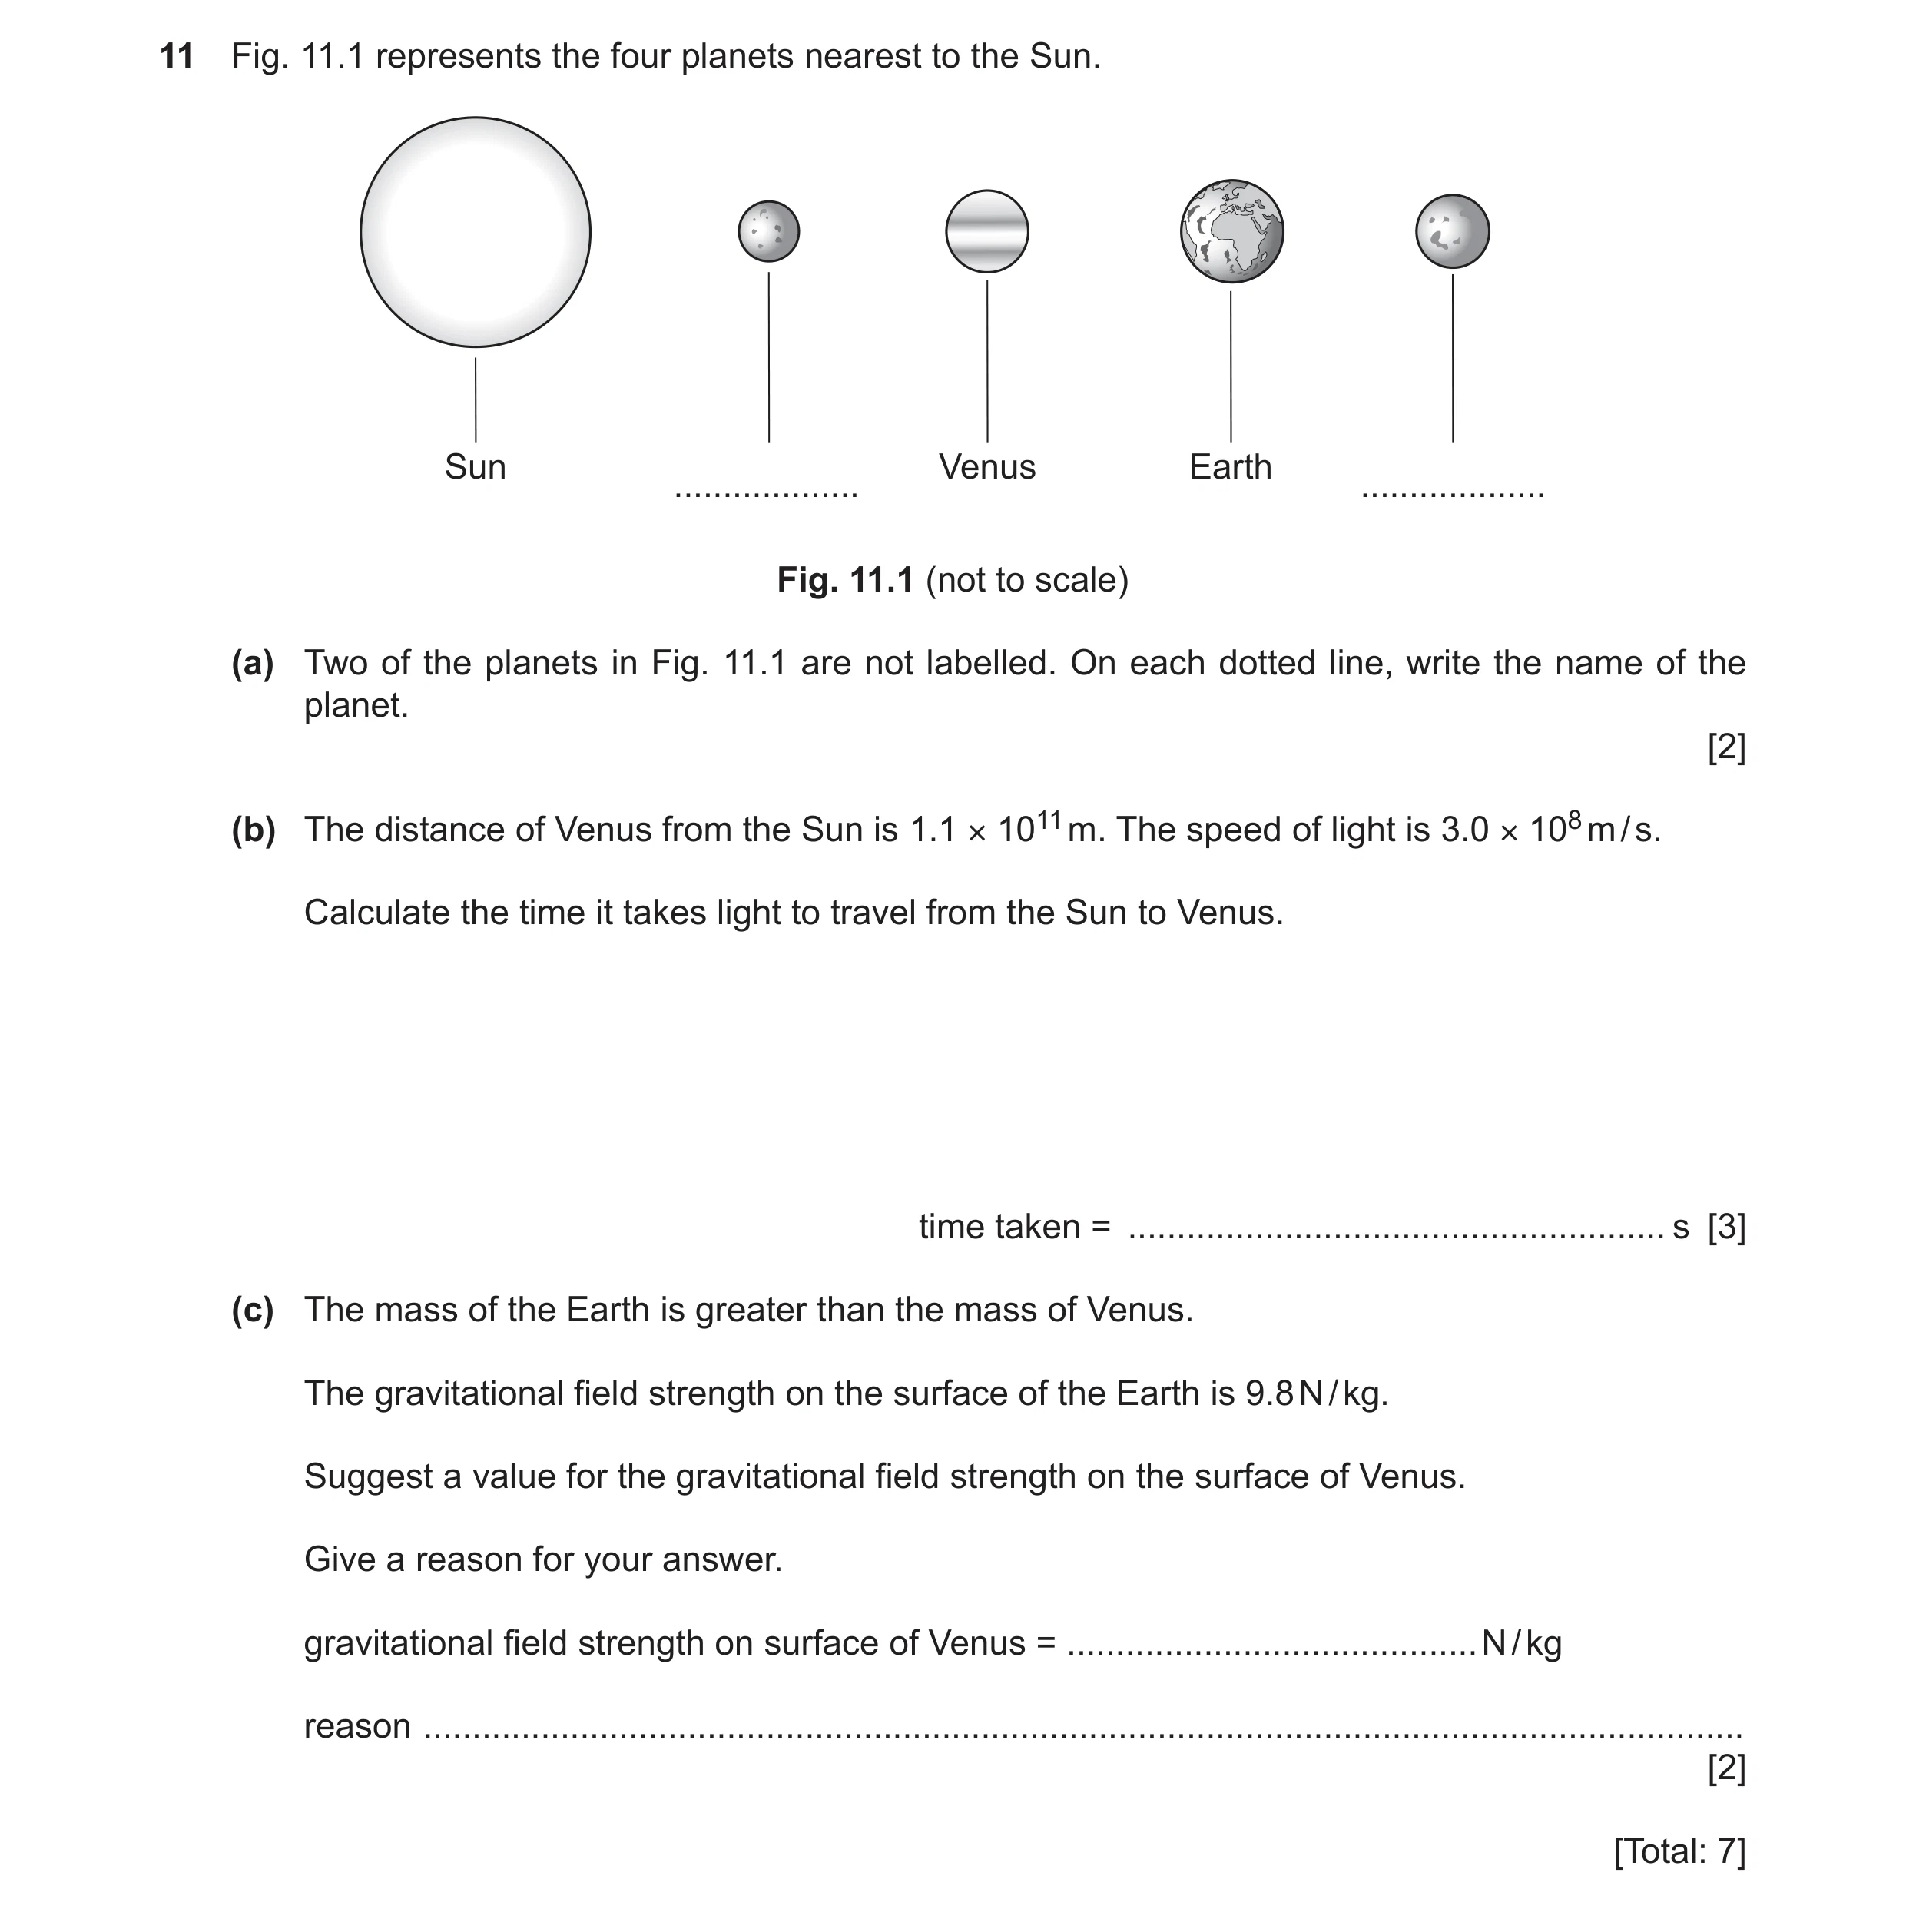 77 / 101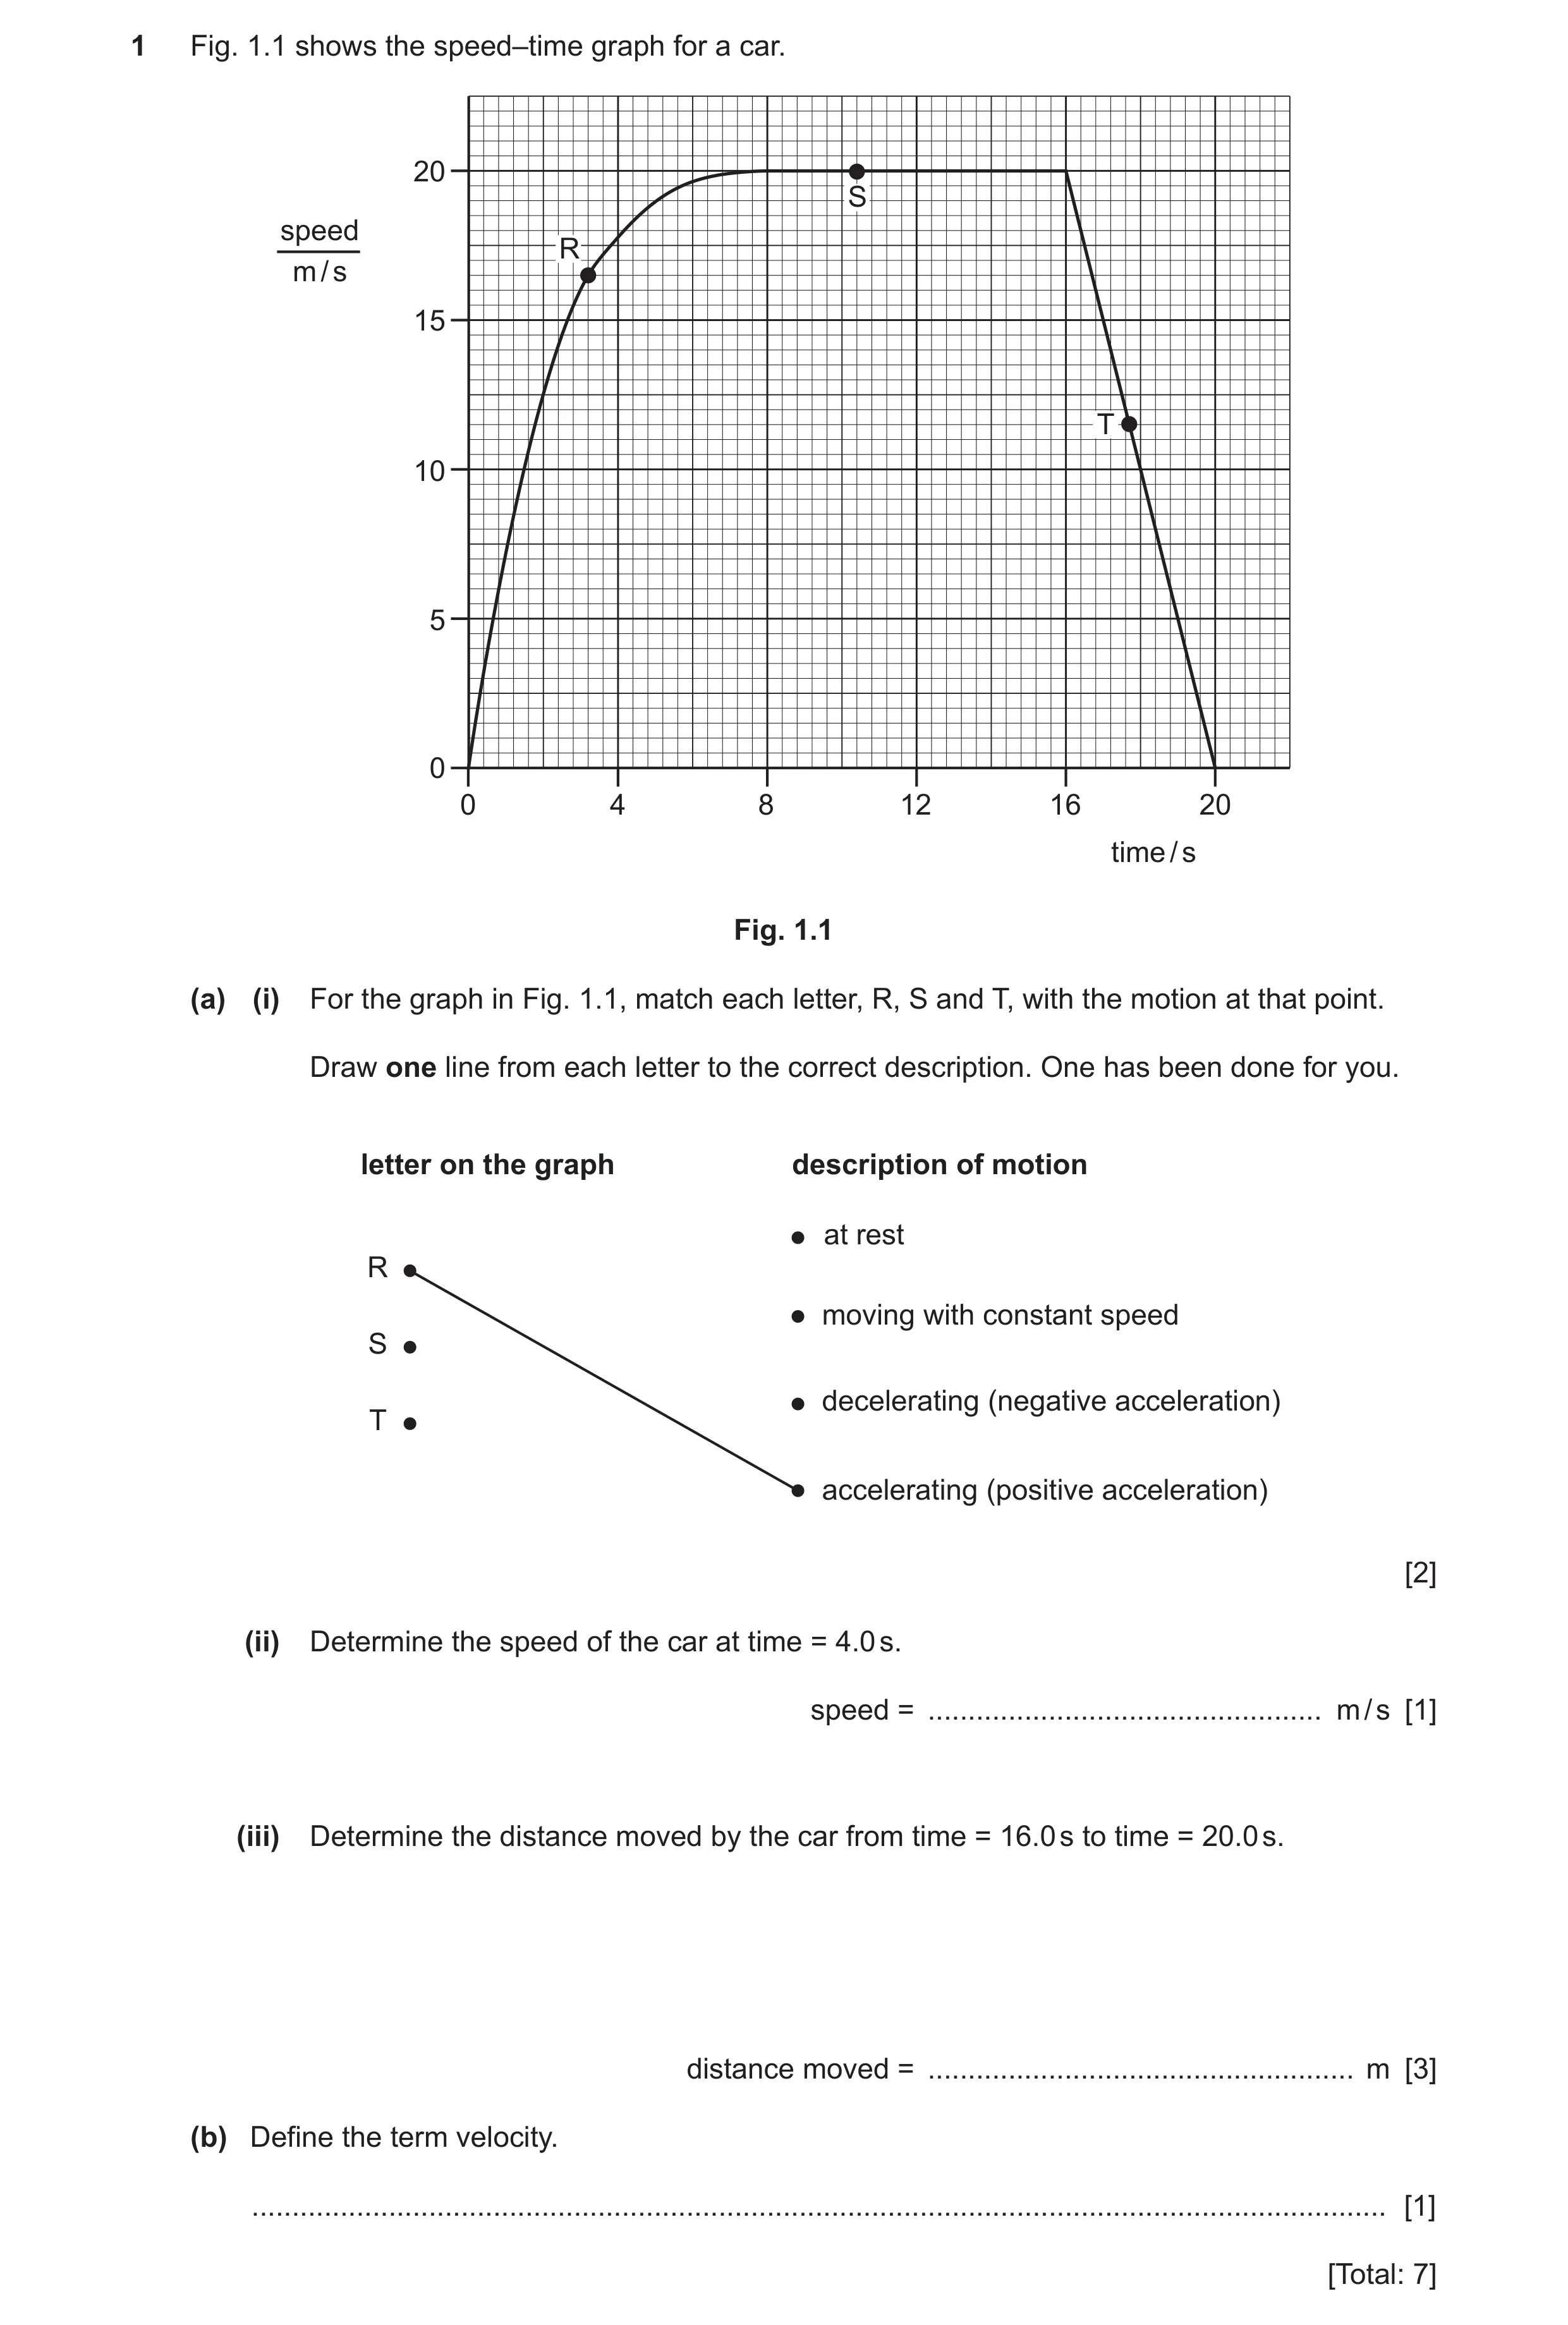
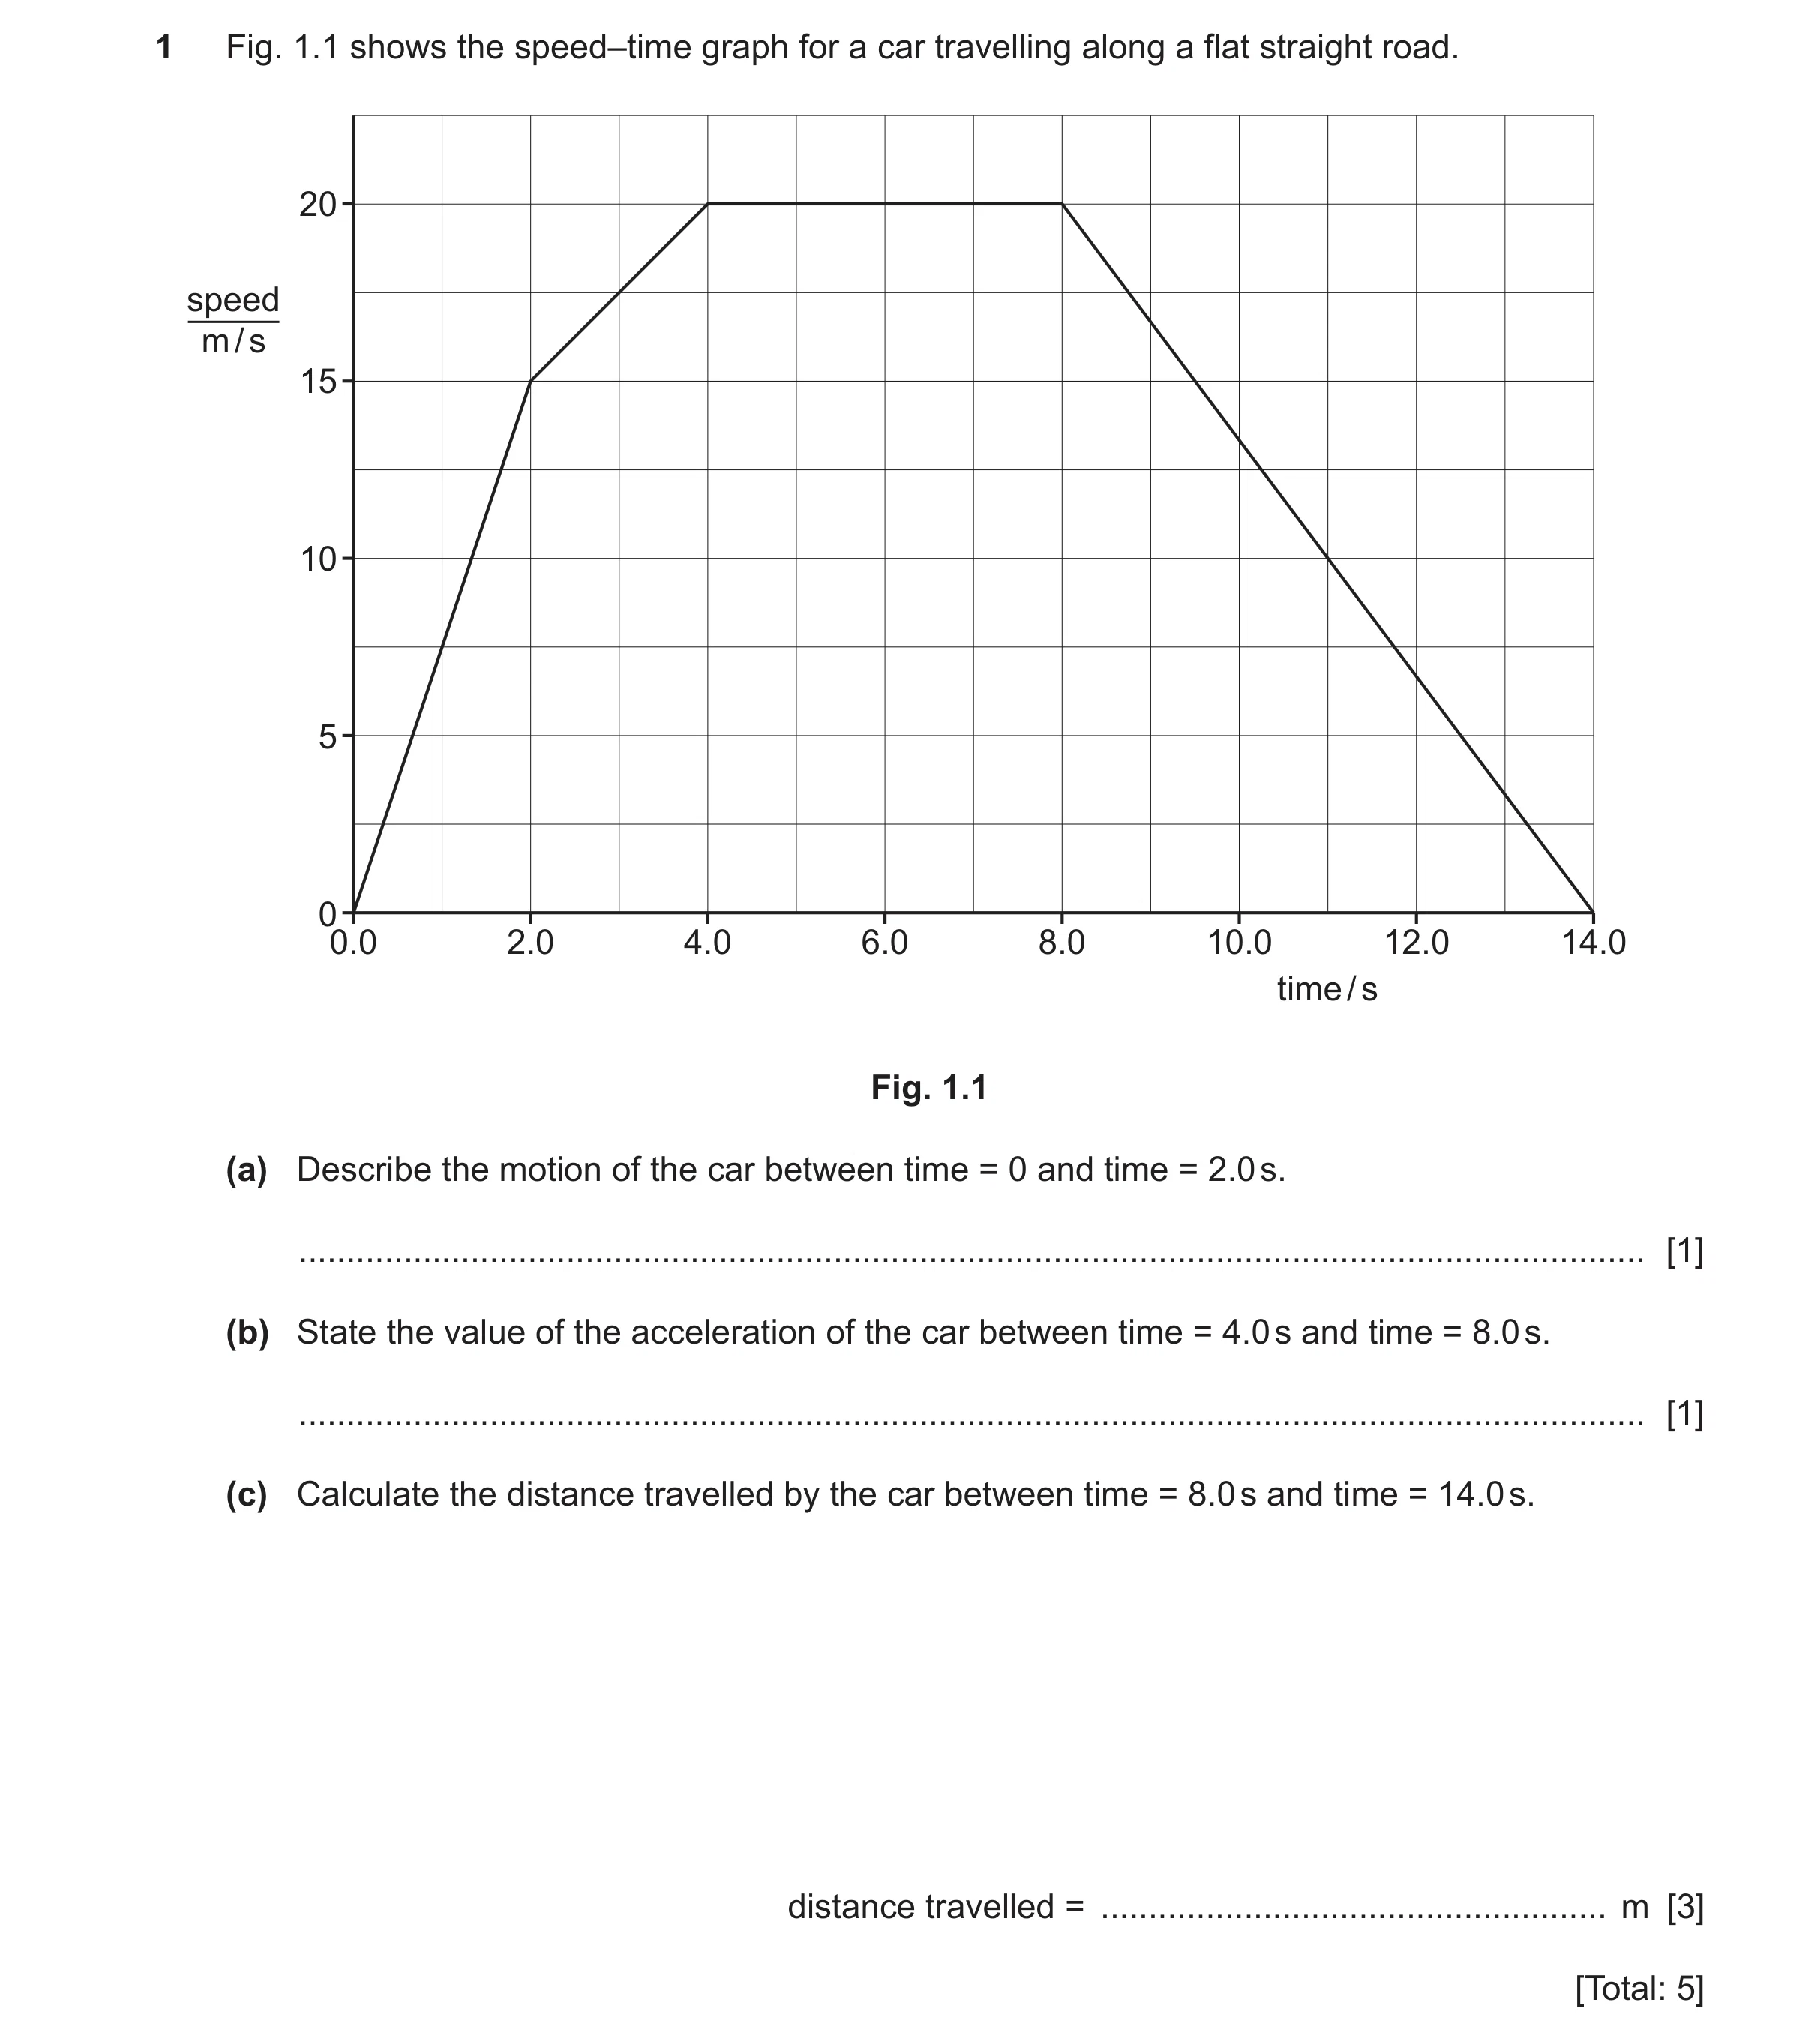 79 / 101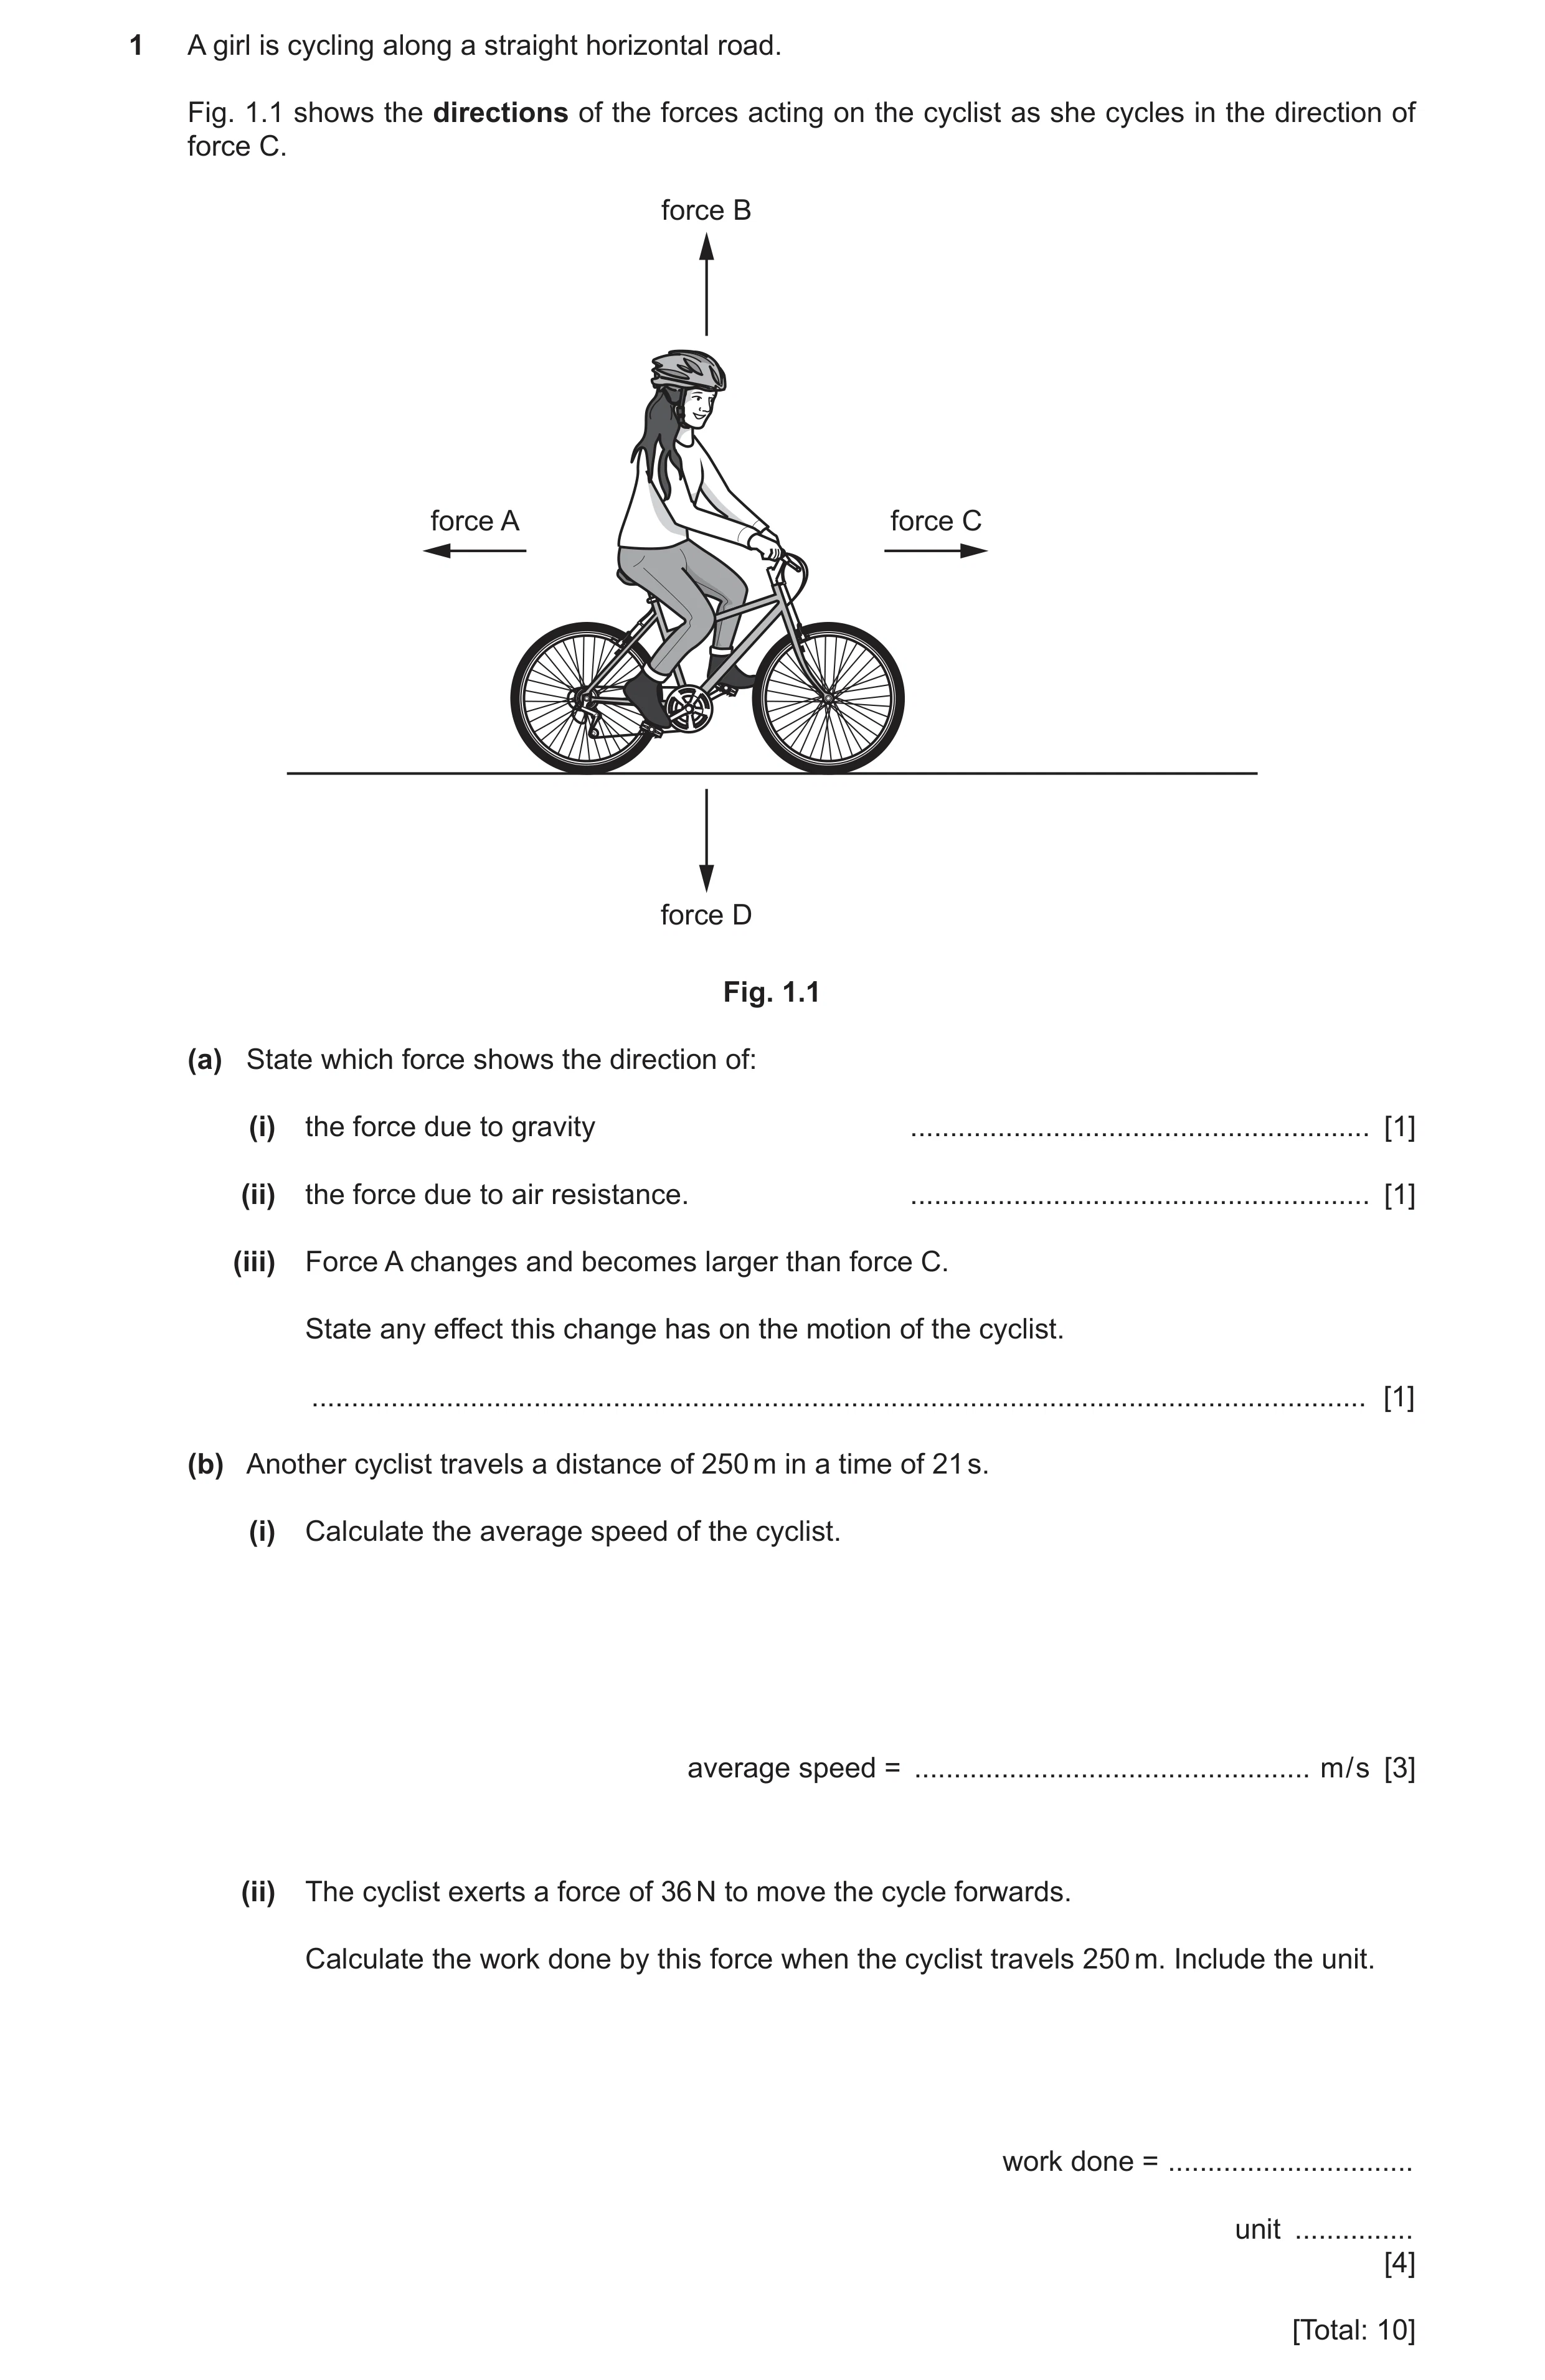
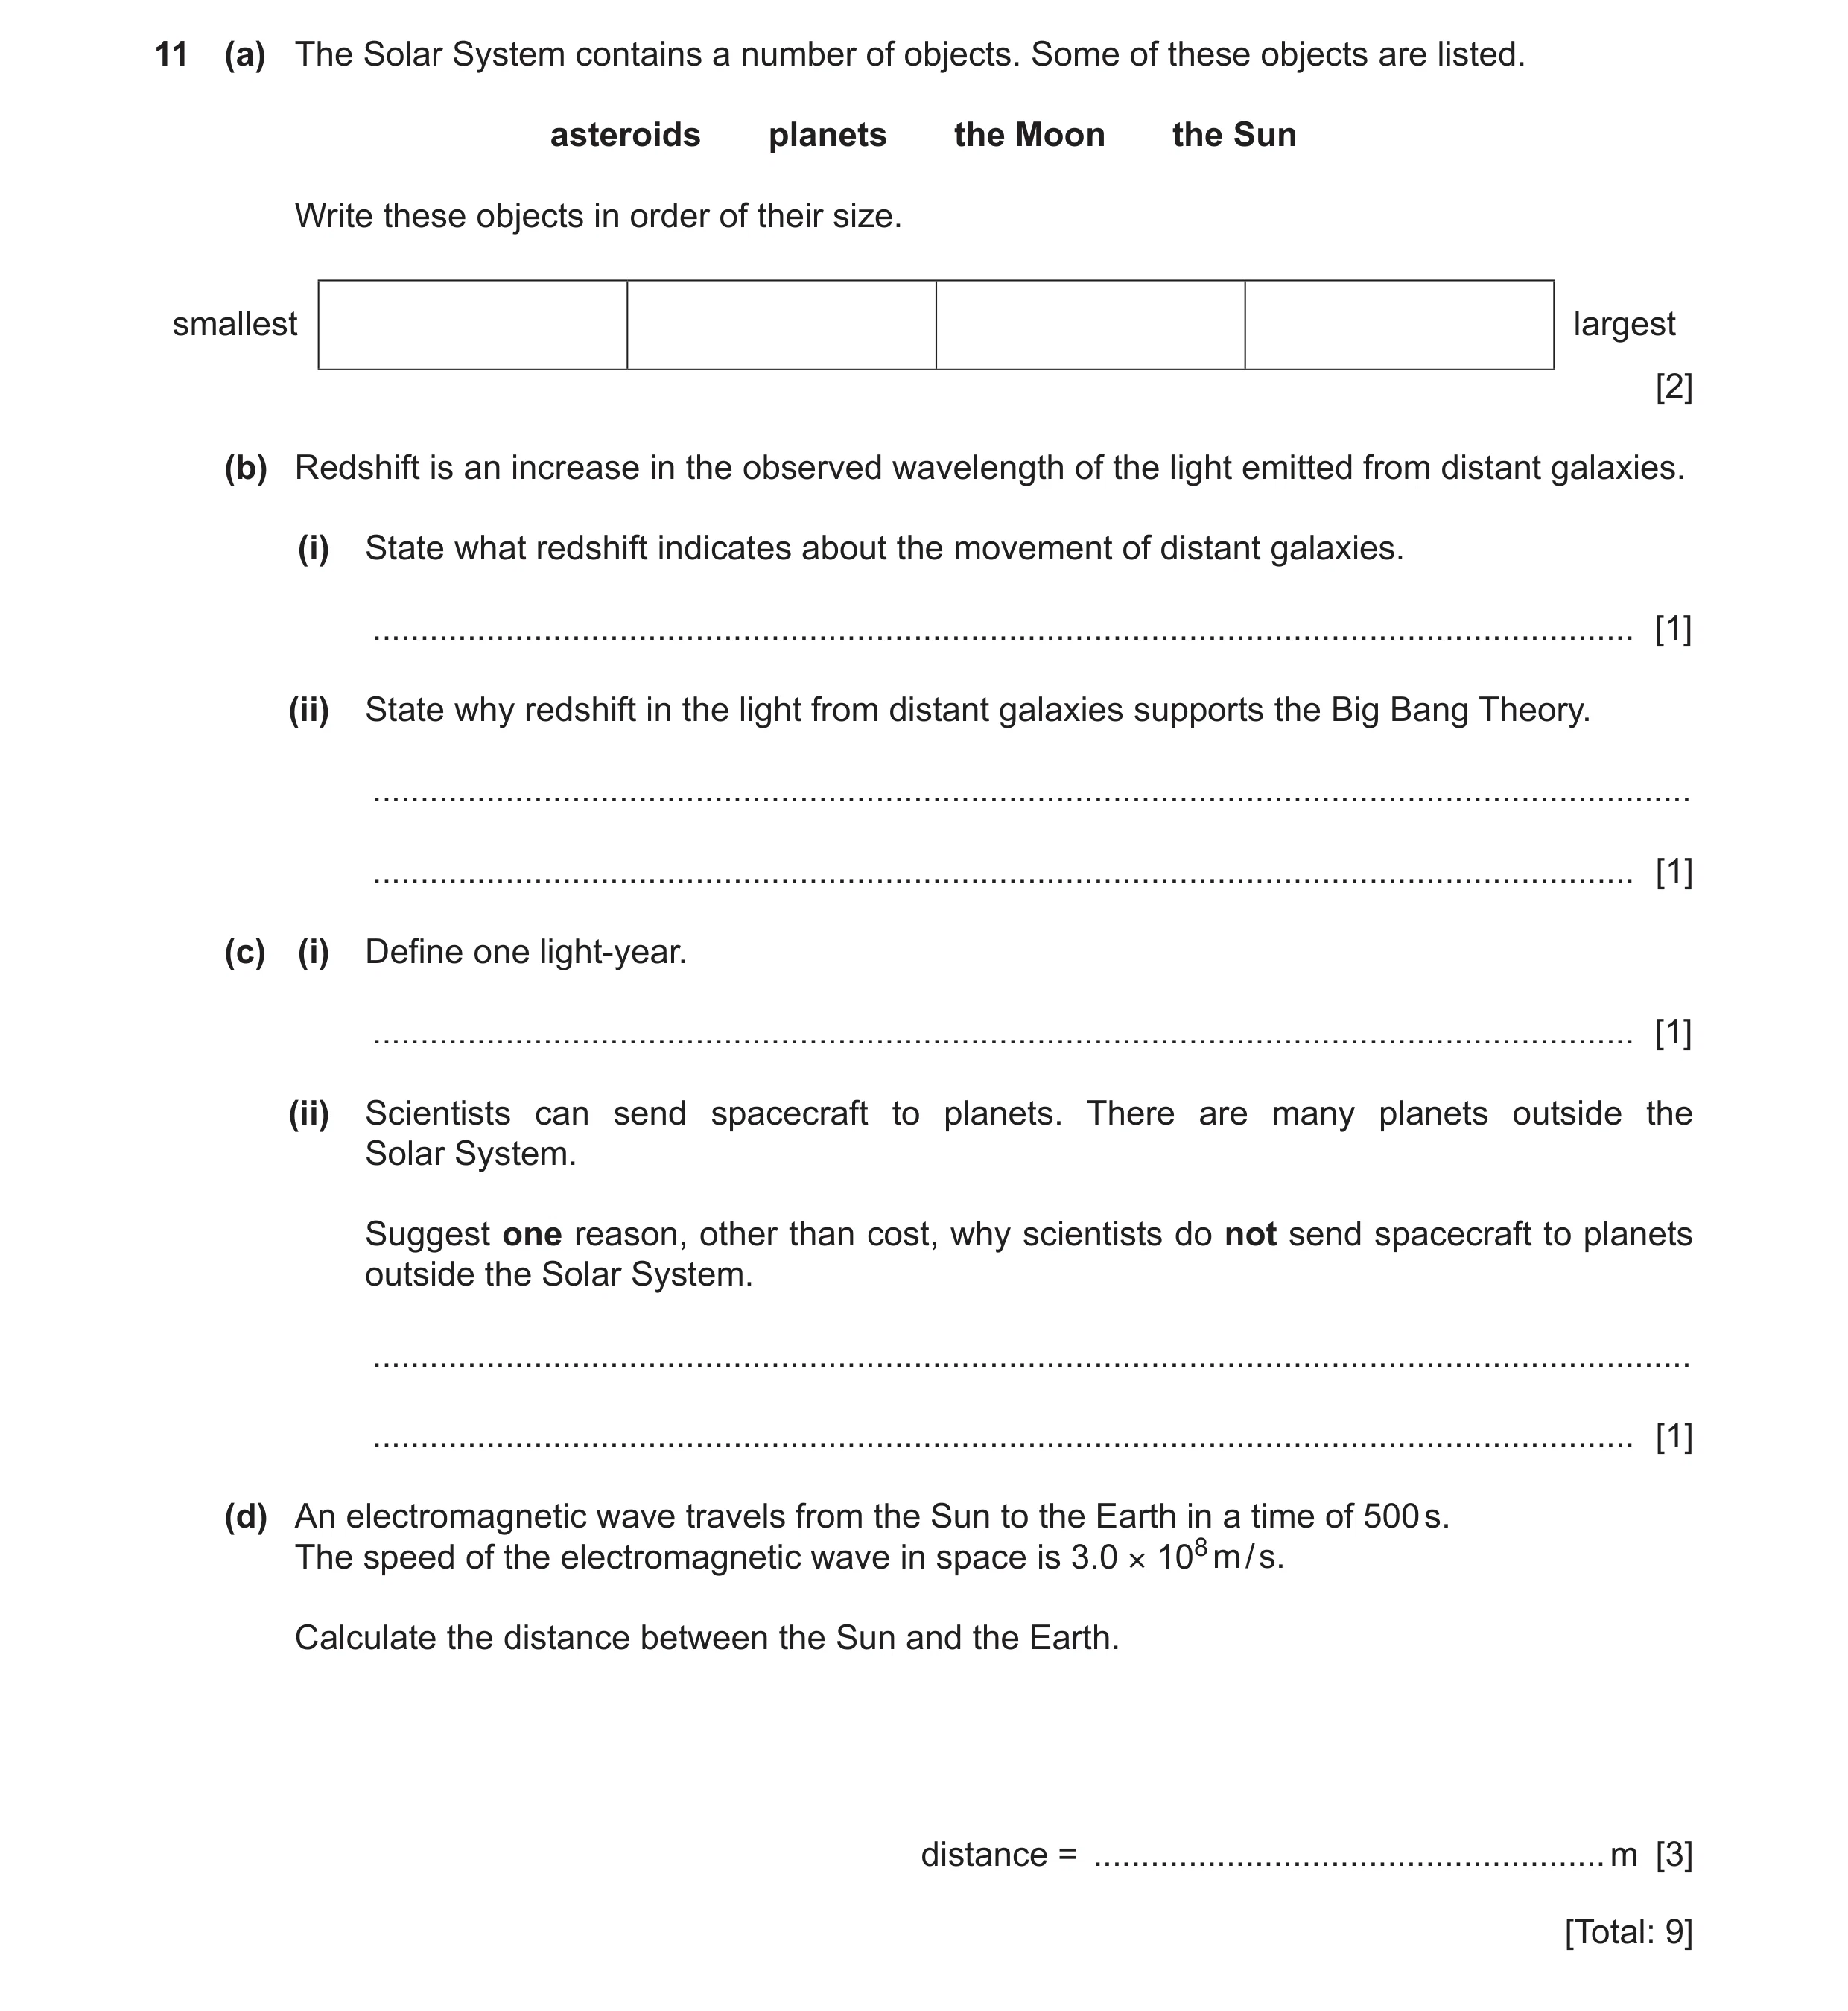 81 / 101
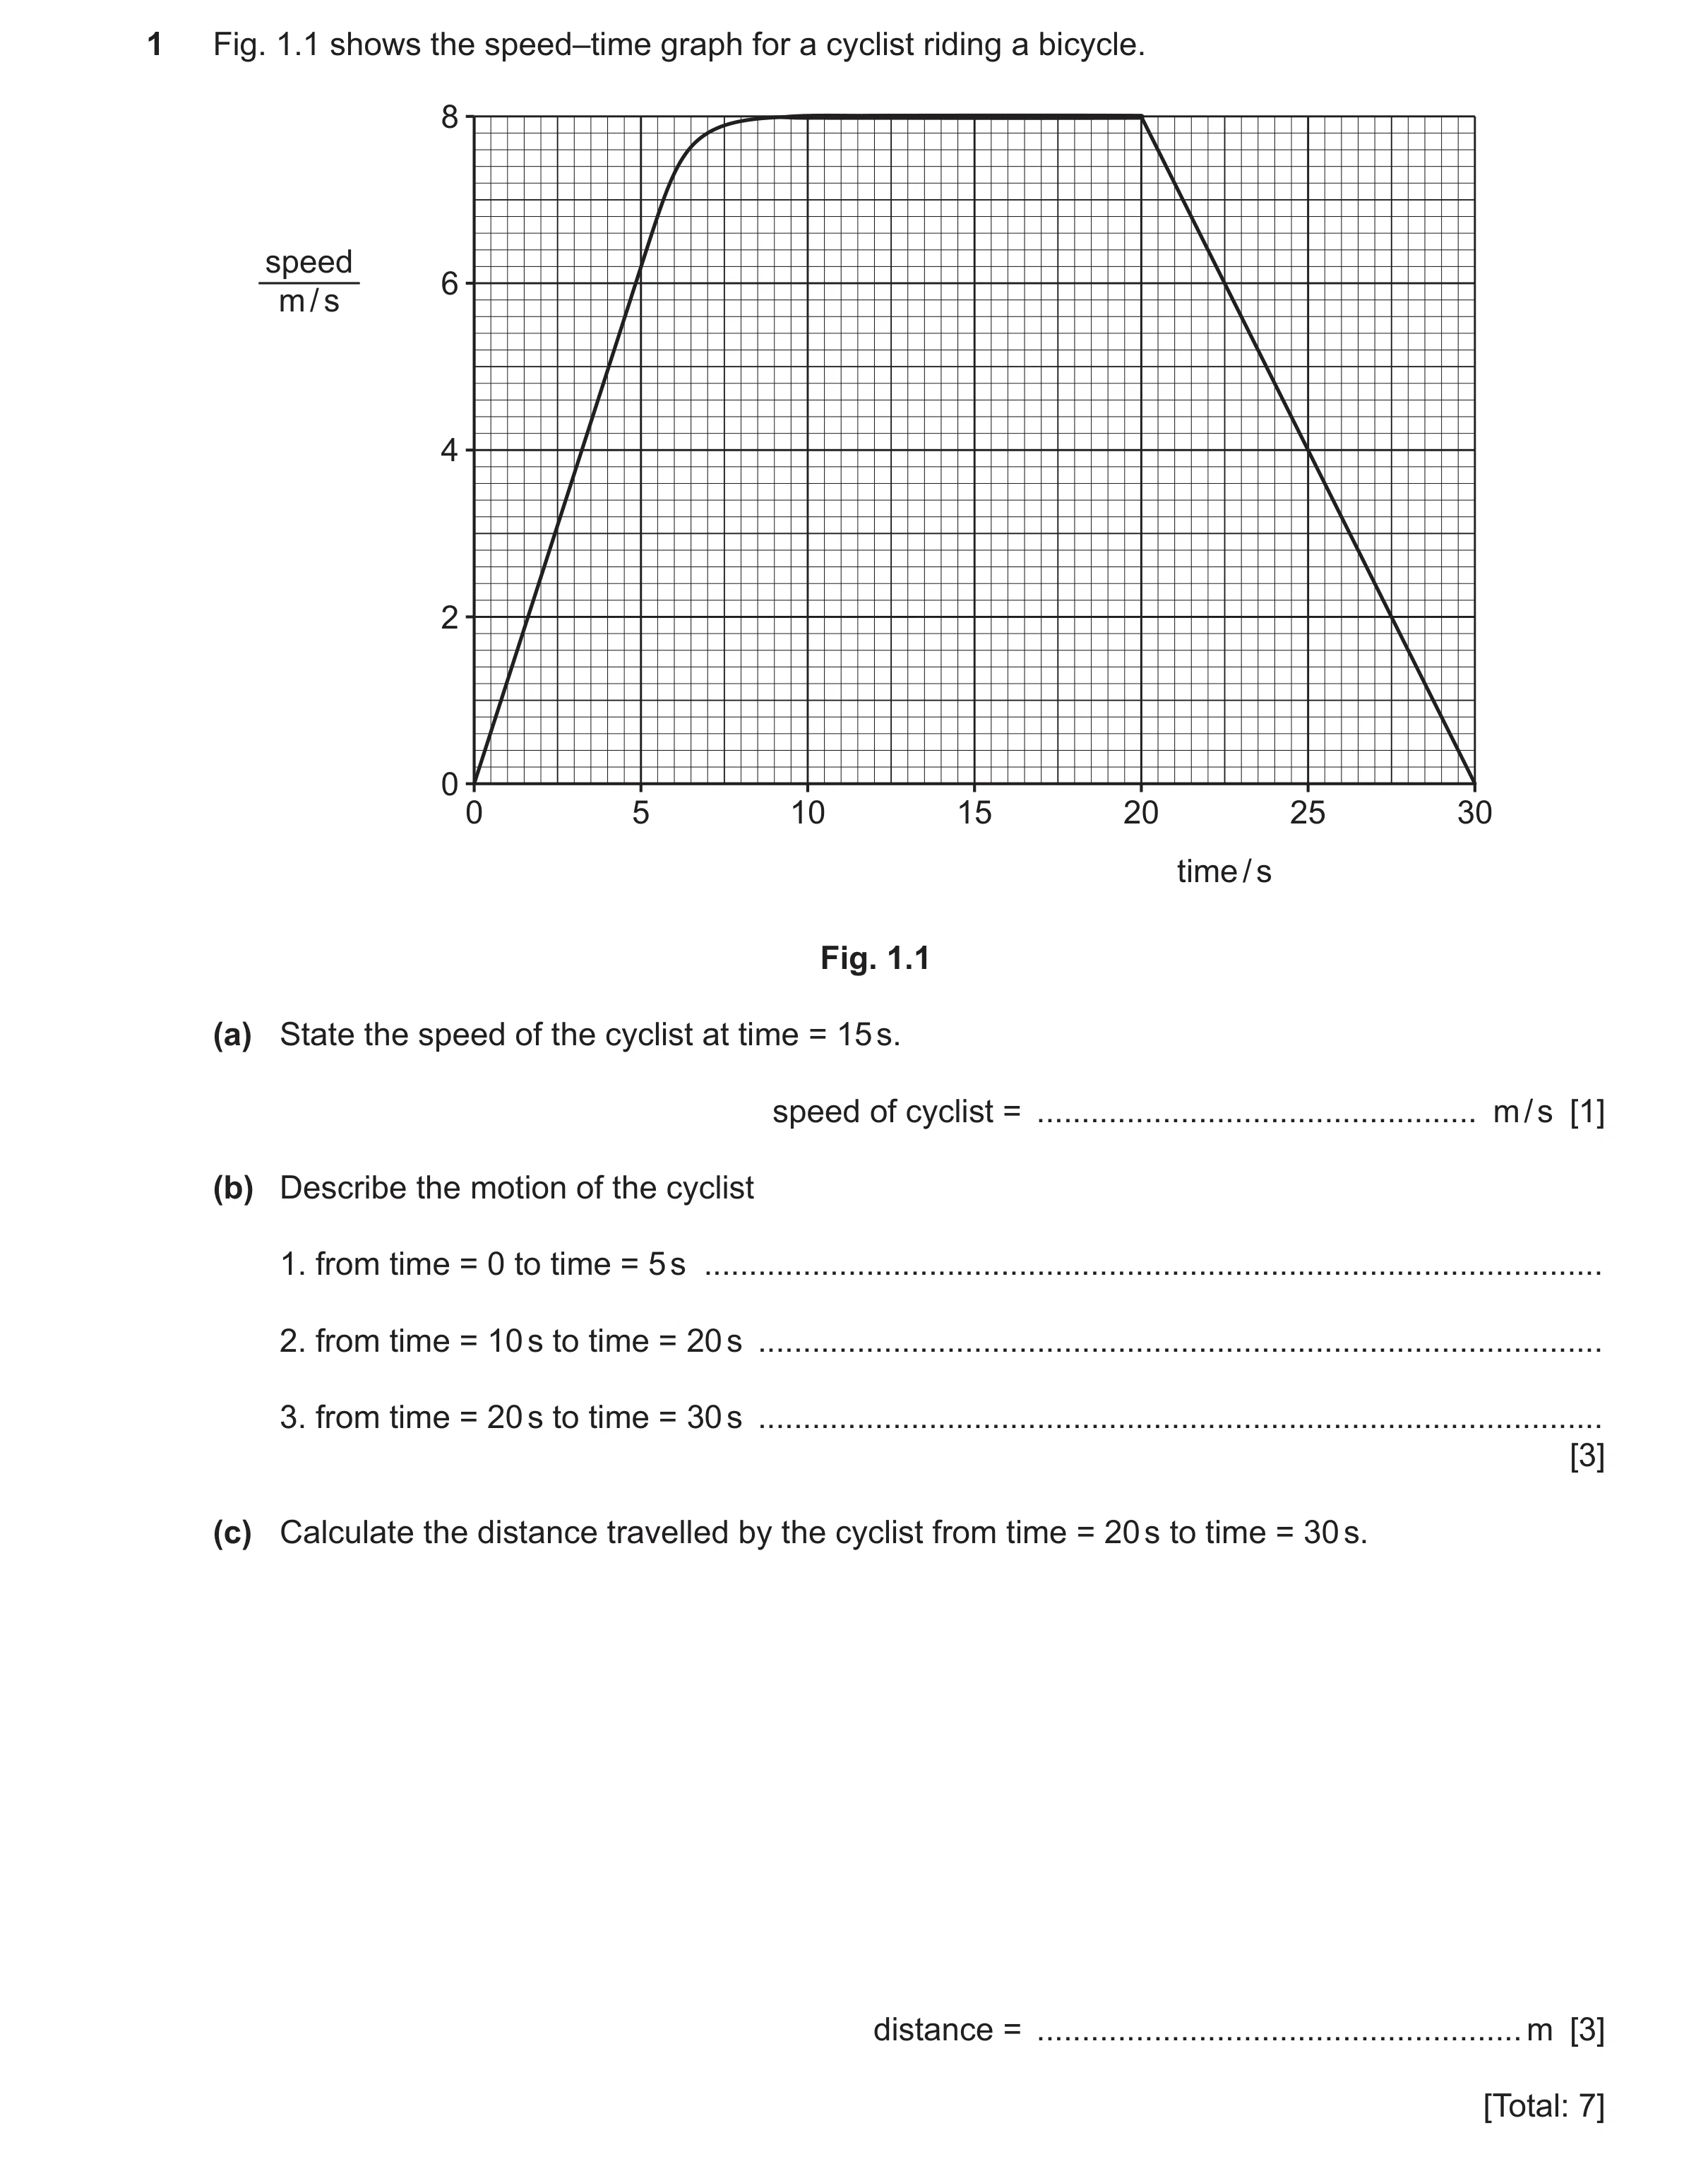 82 / 101
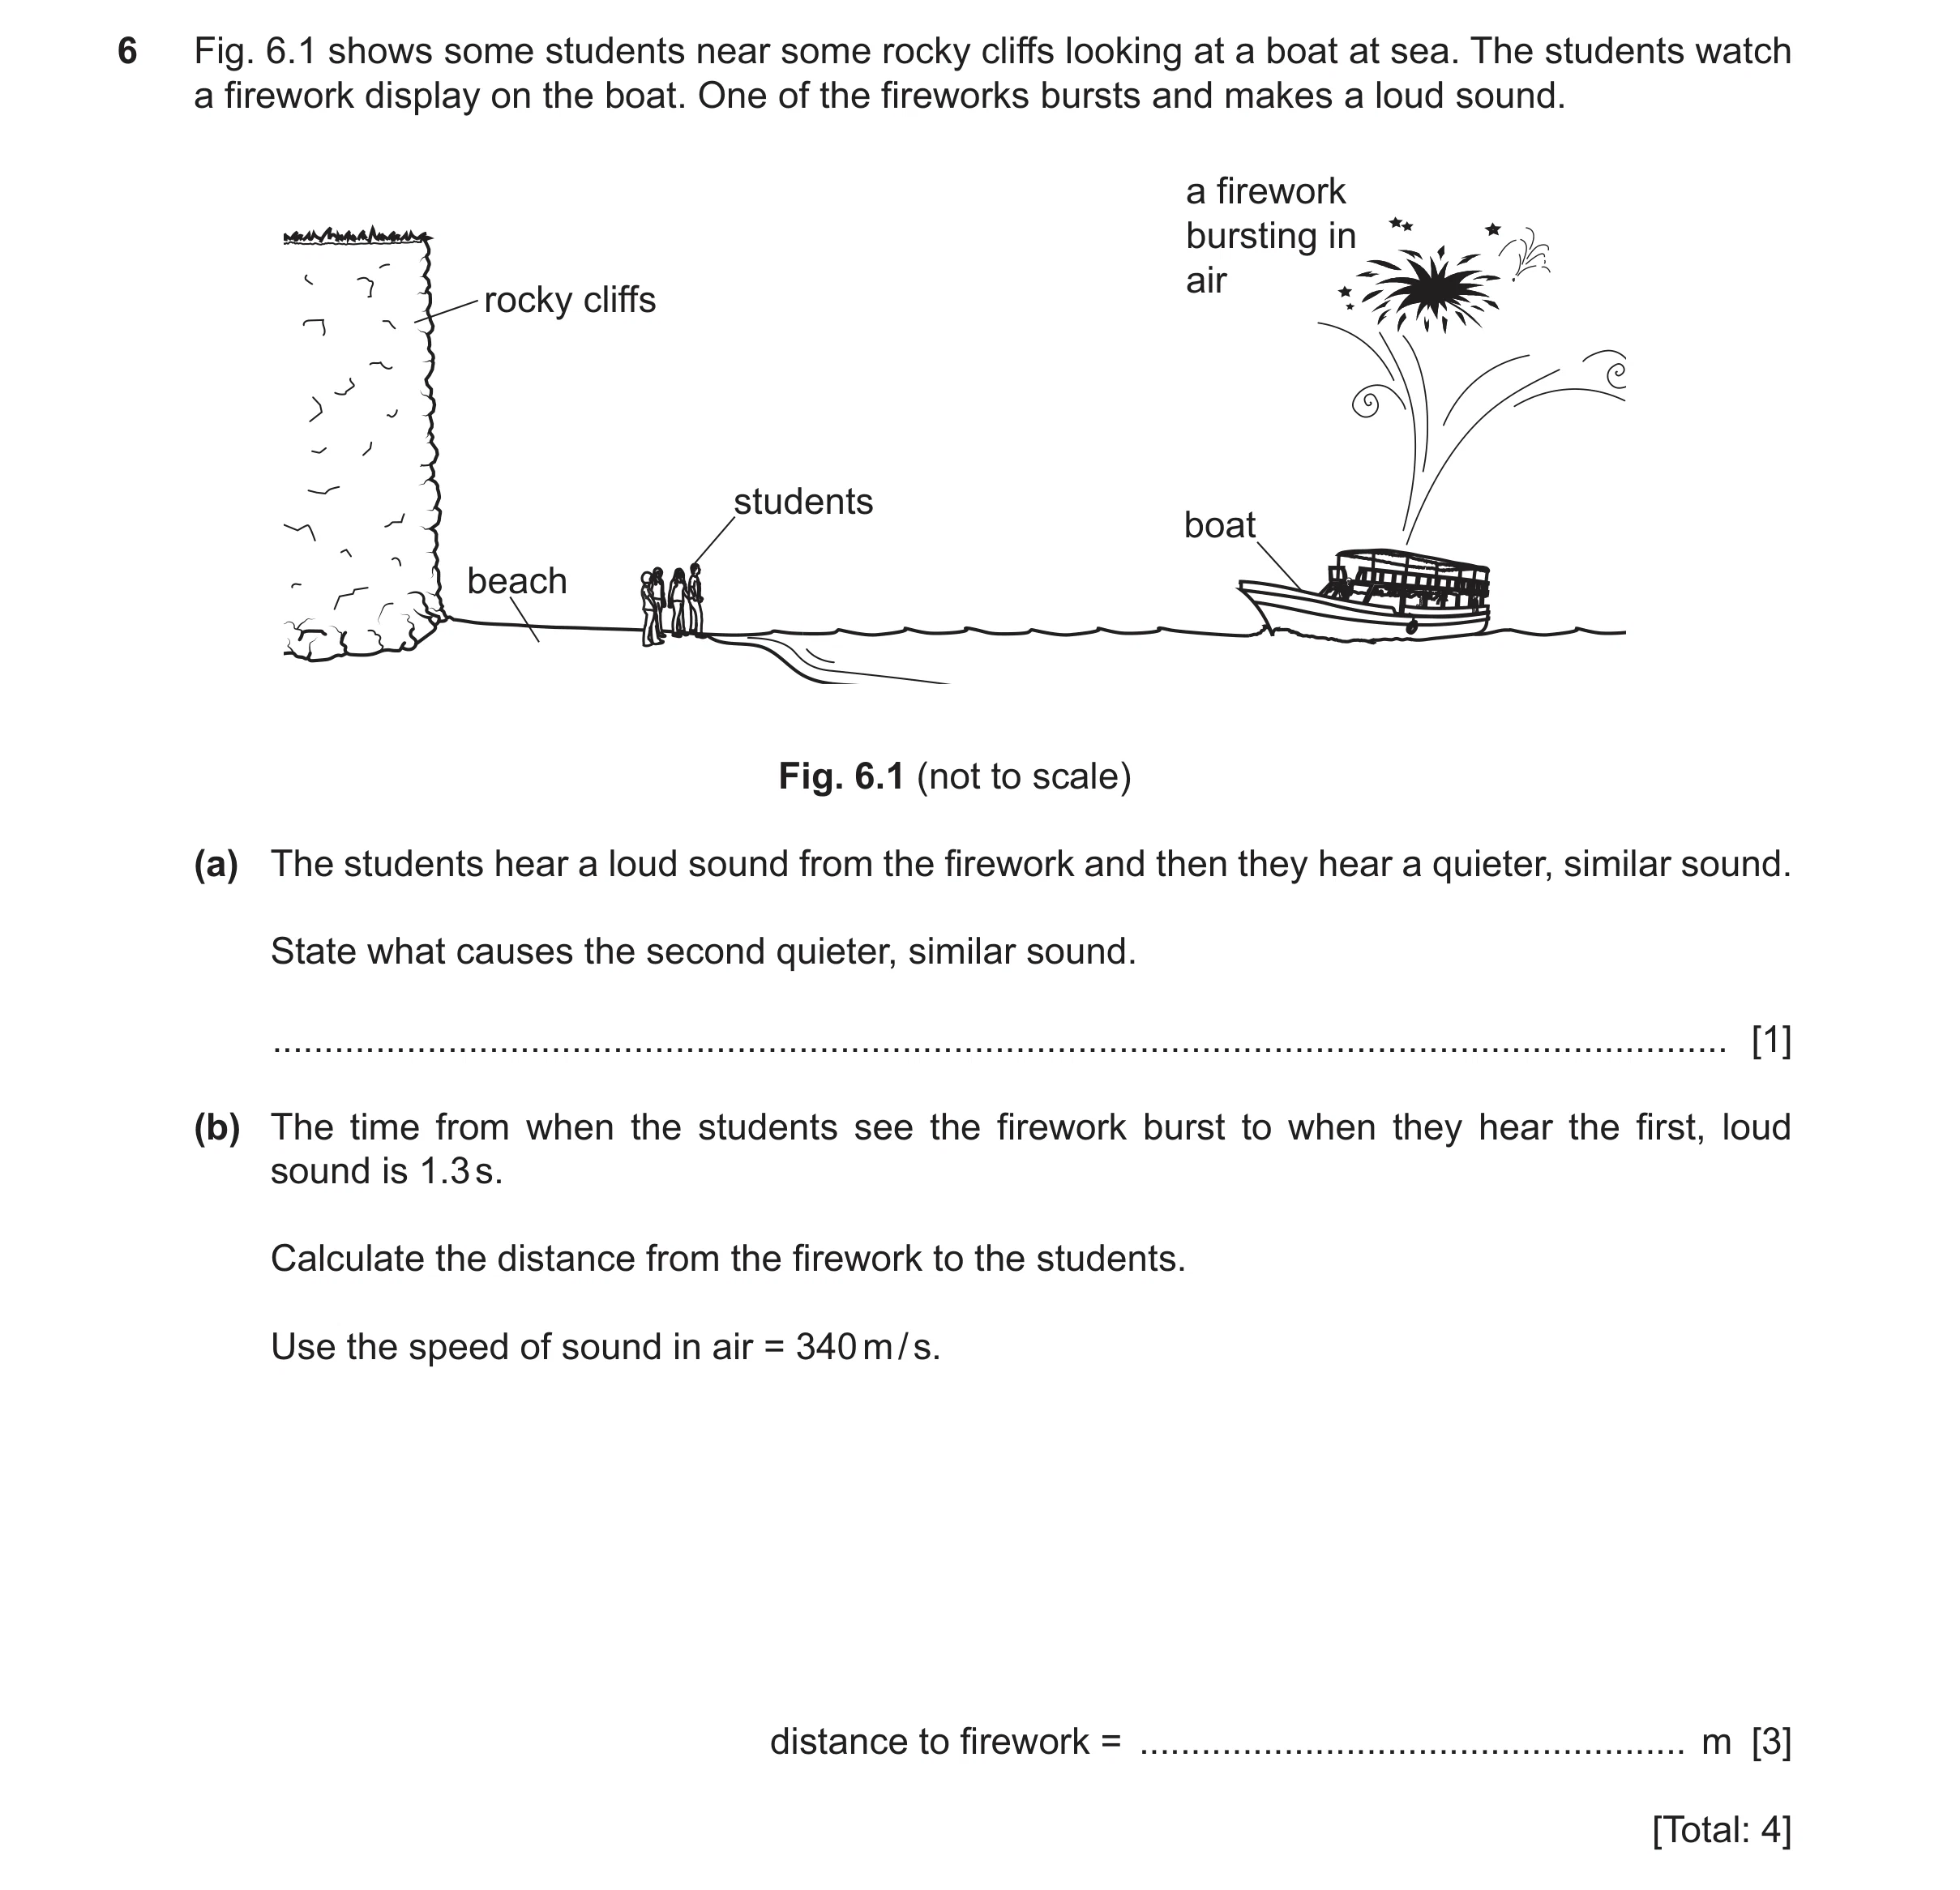 83 / 101
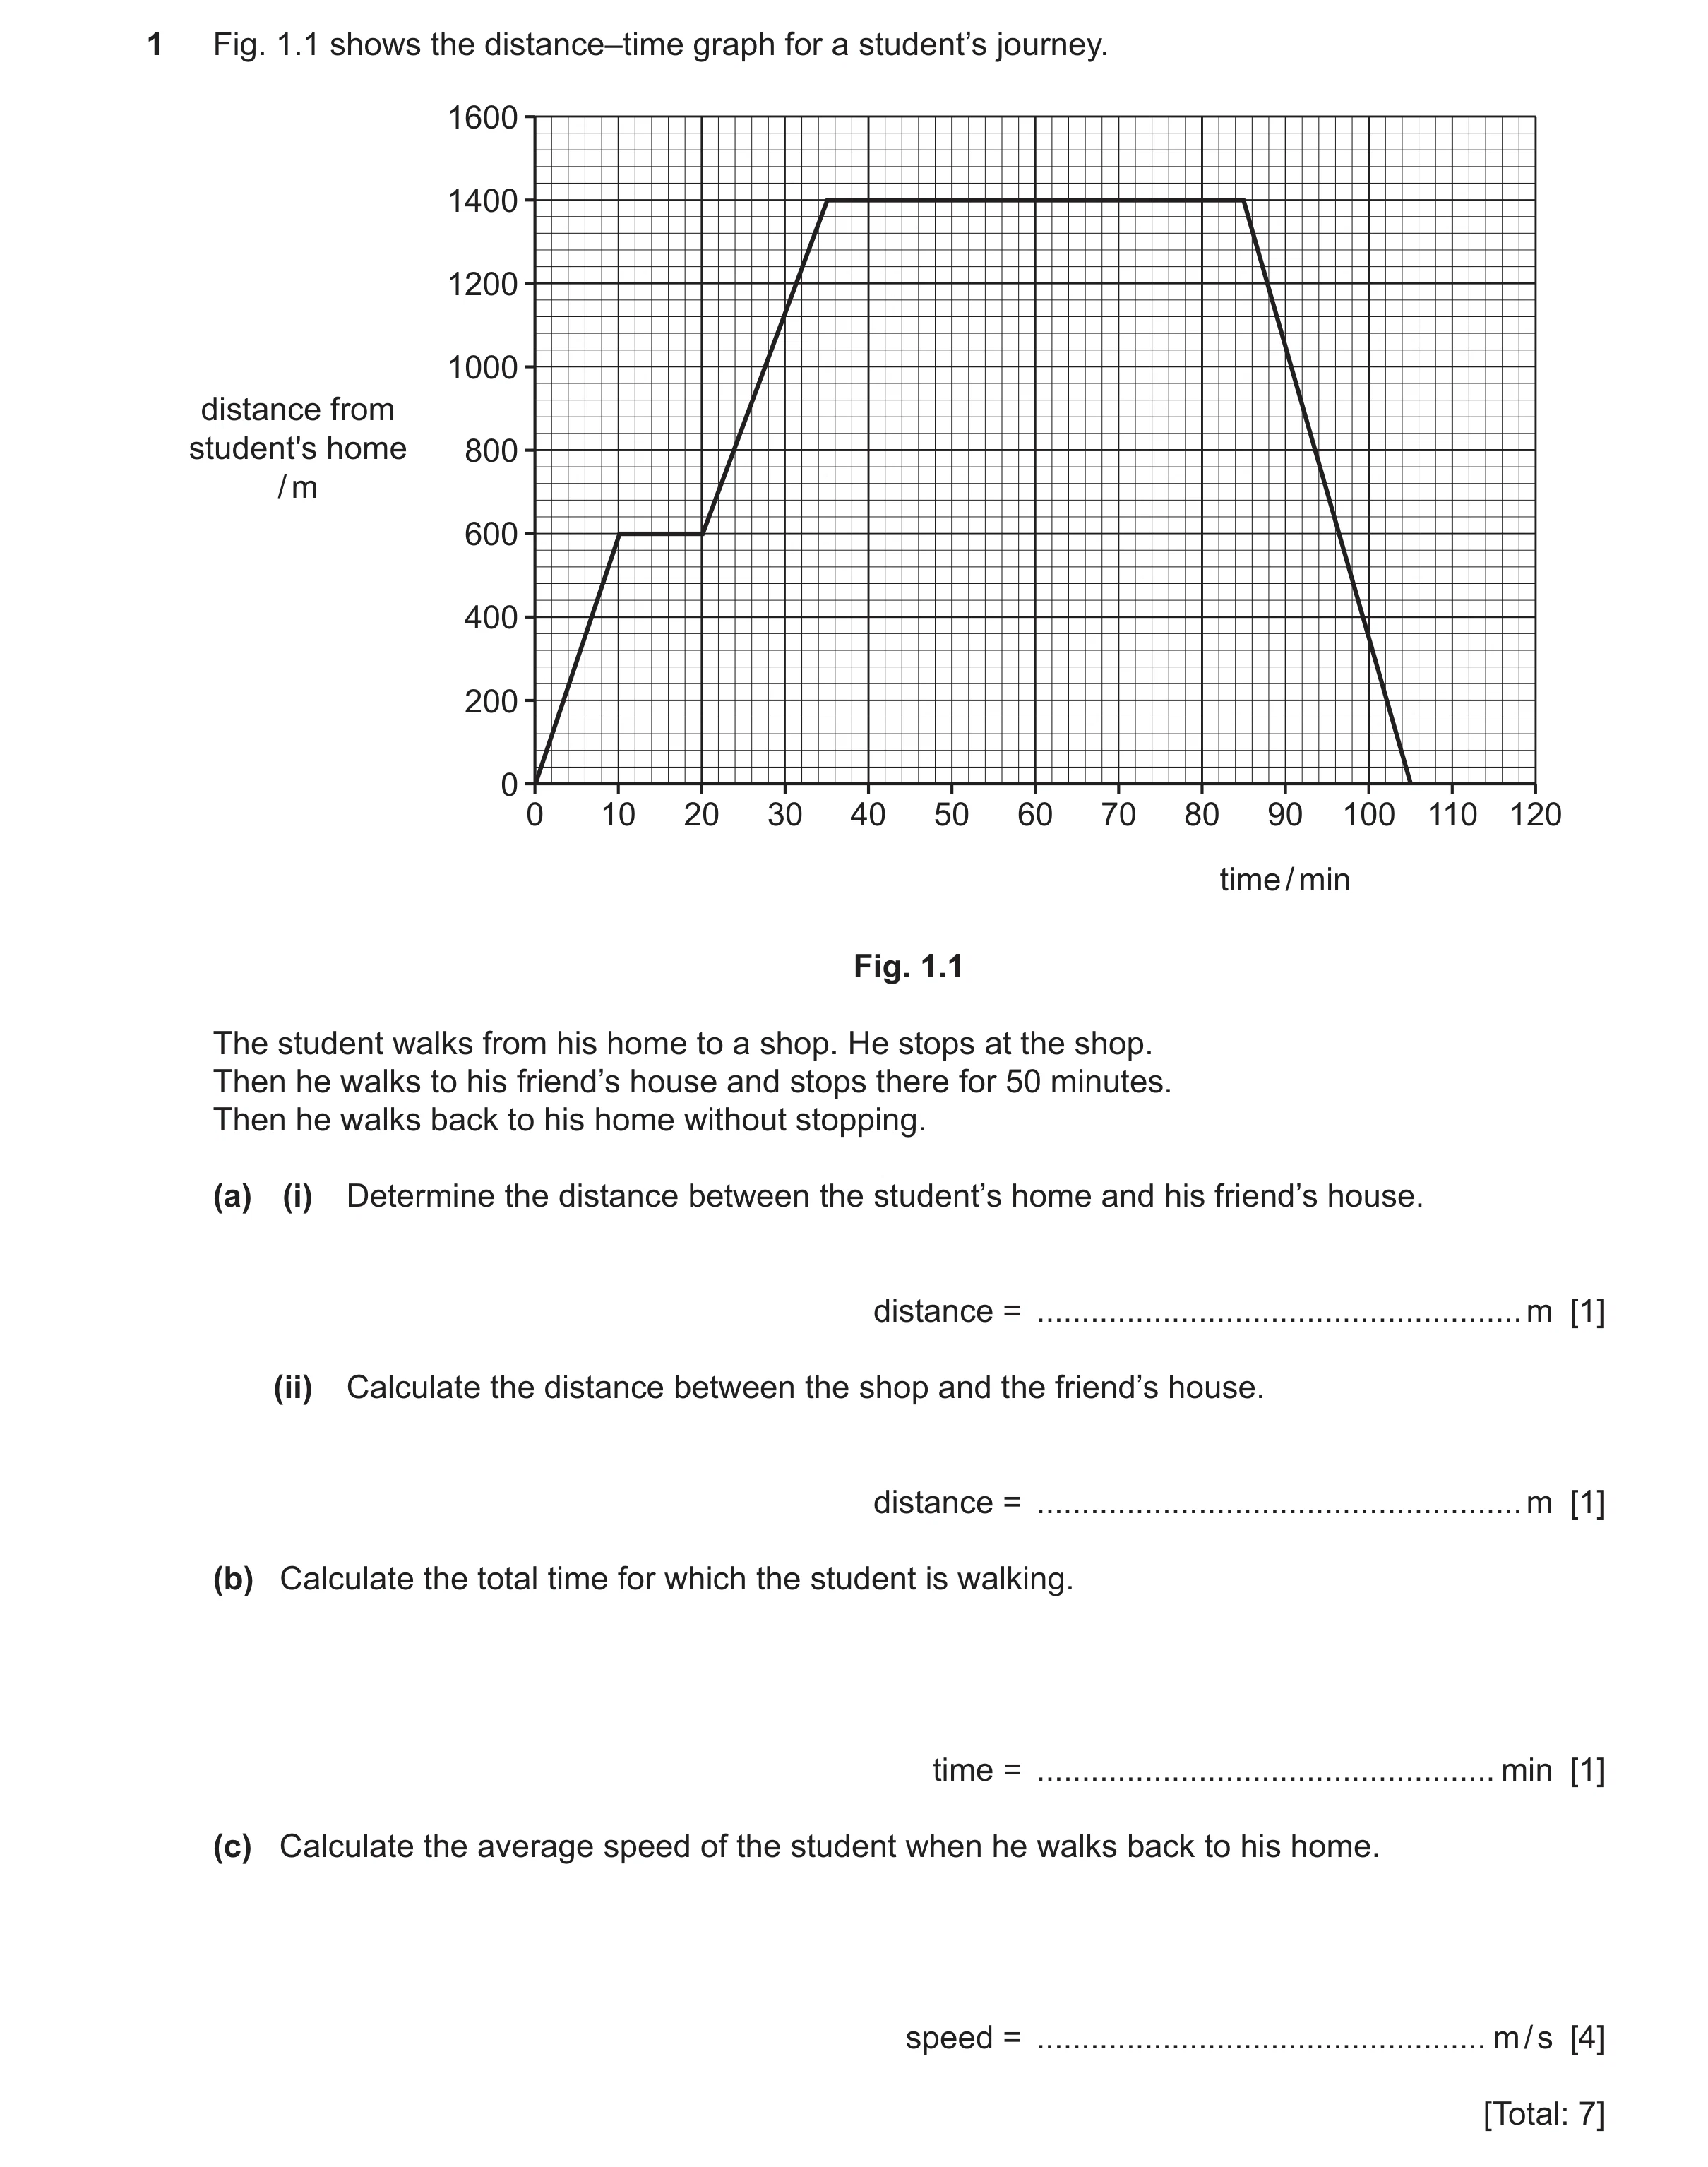 84 / 101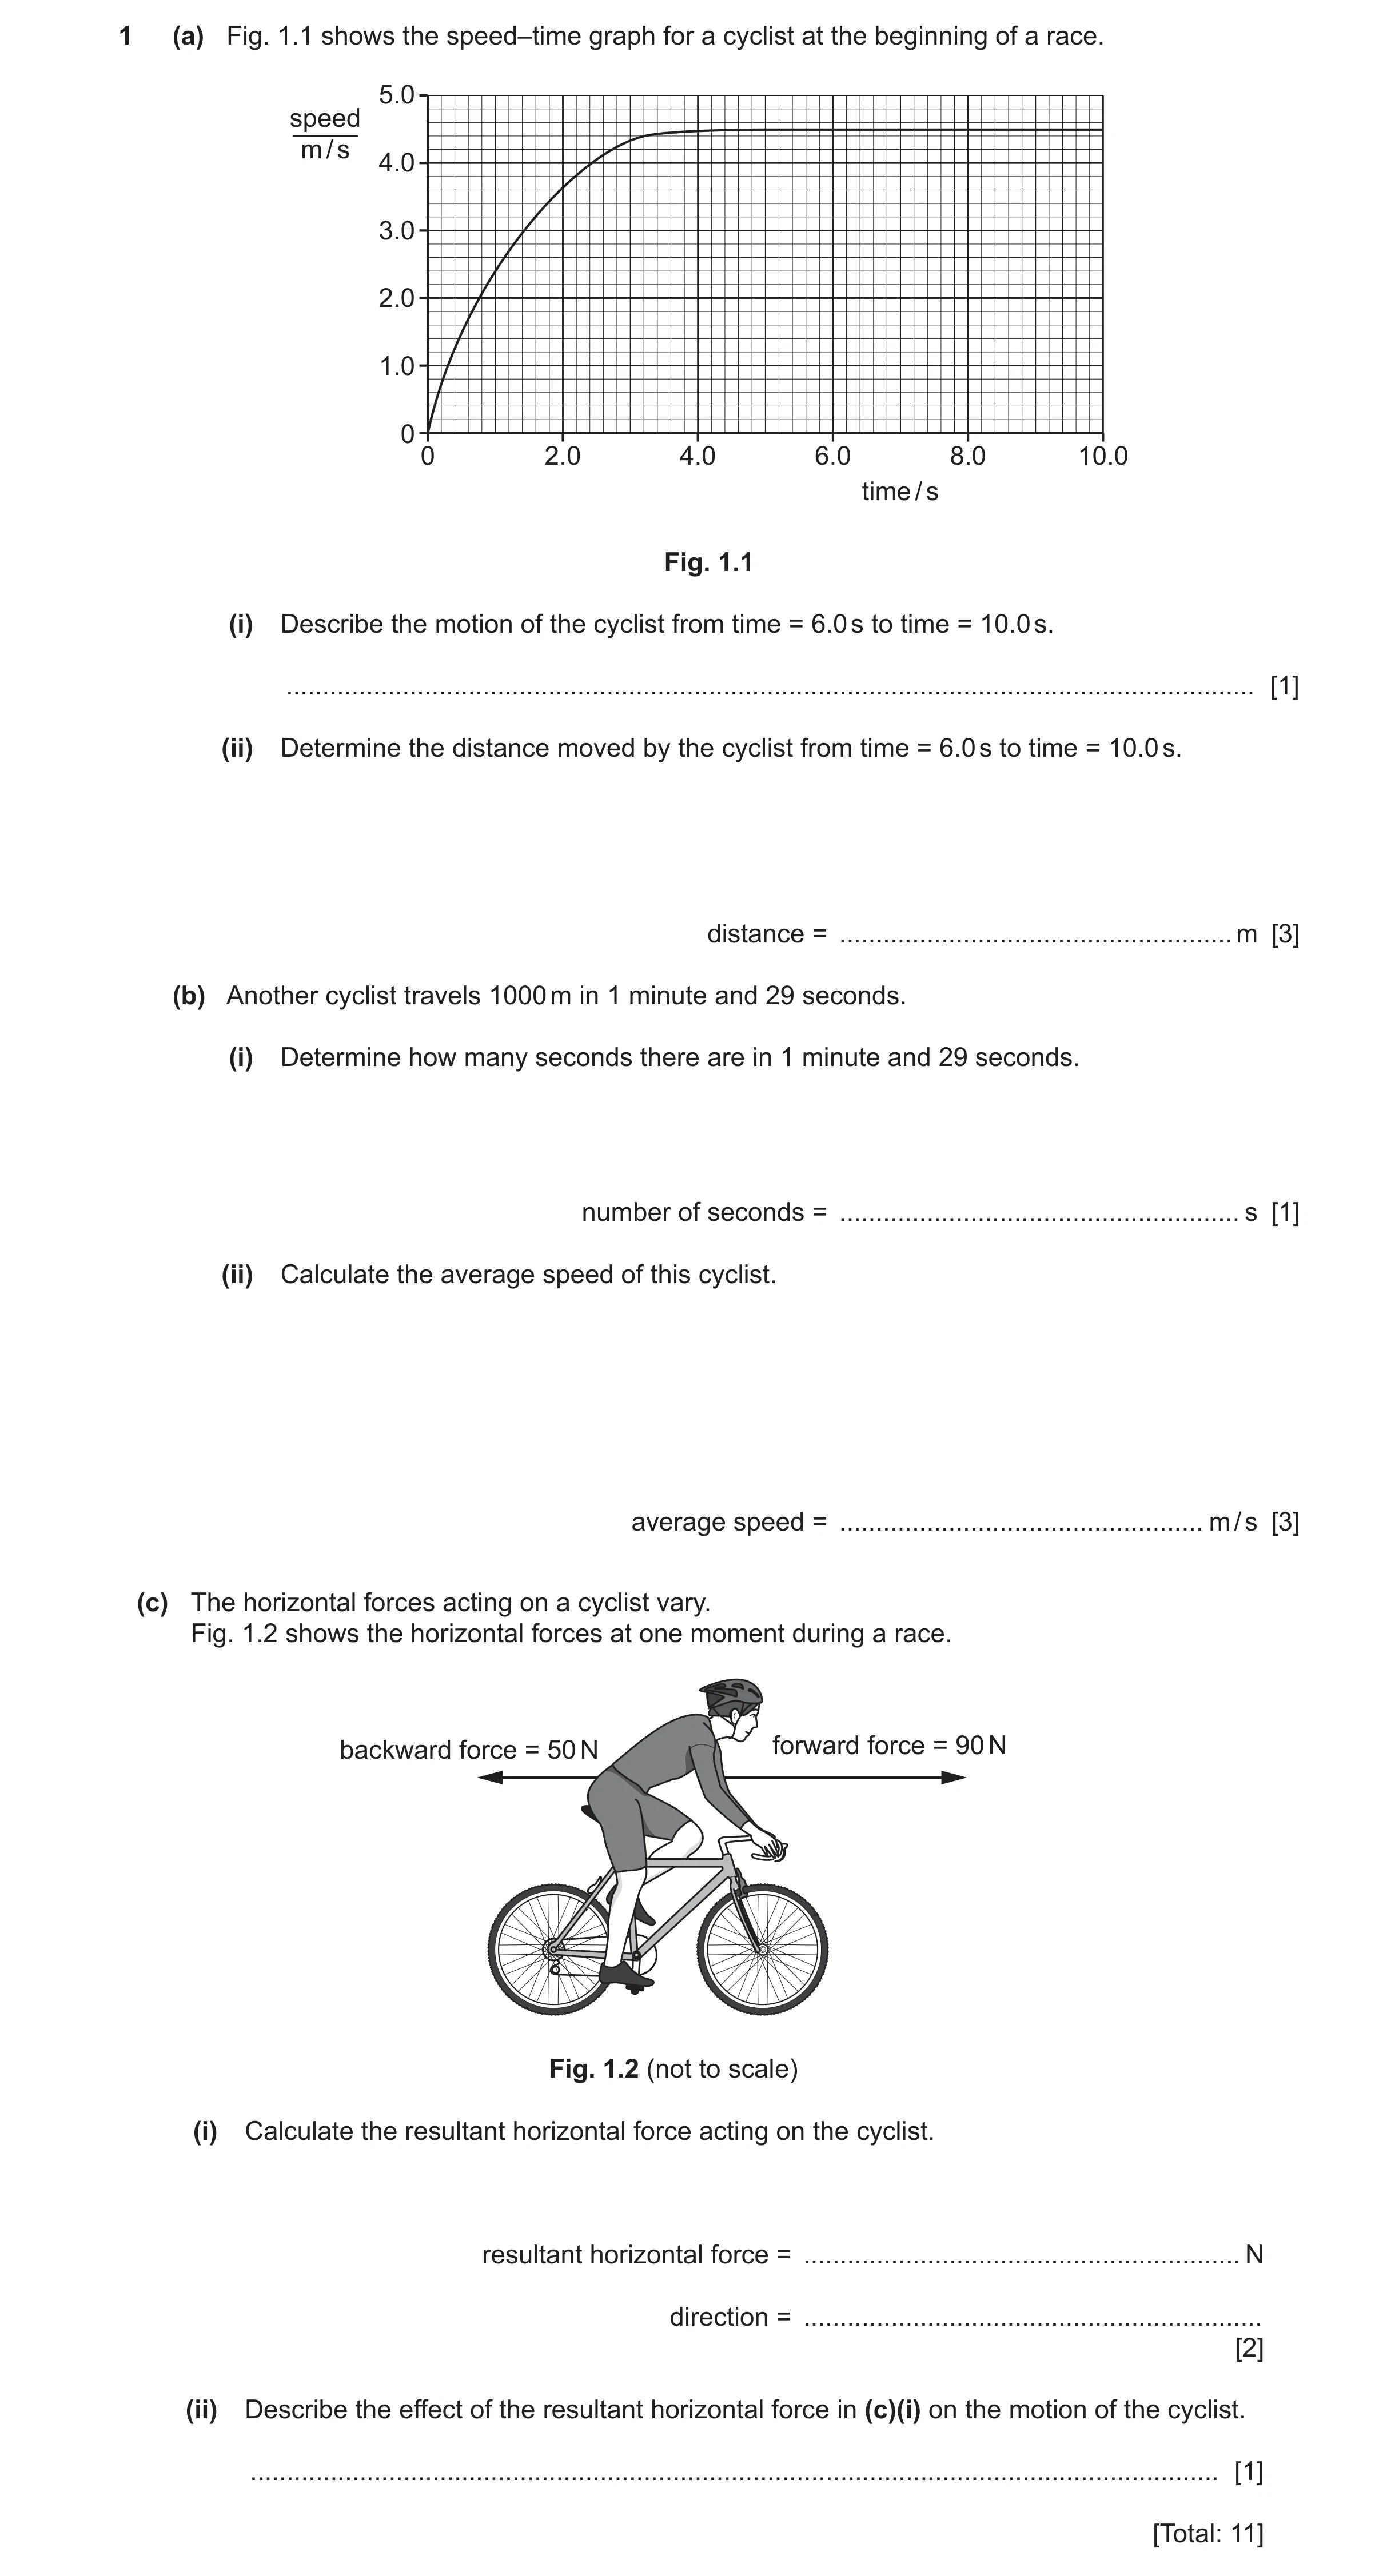
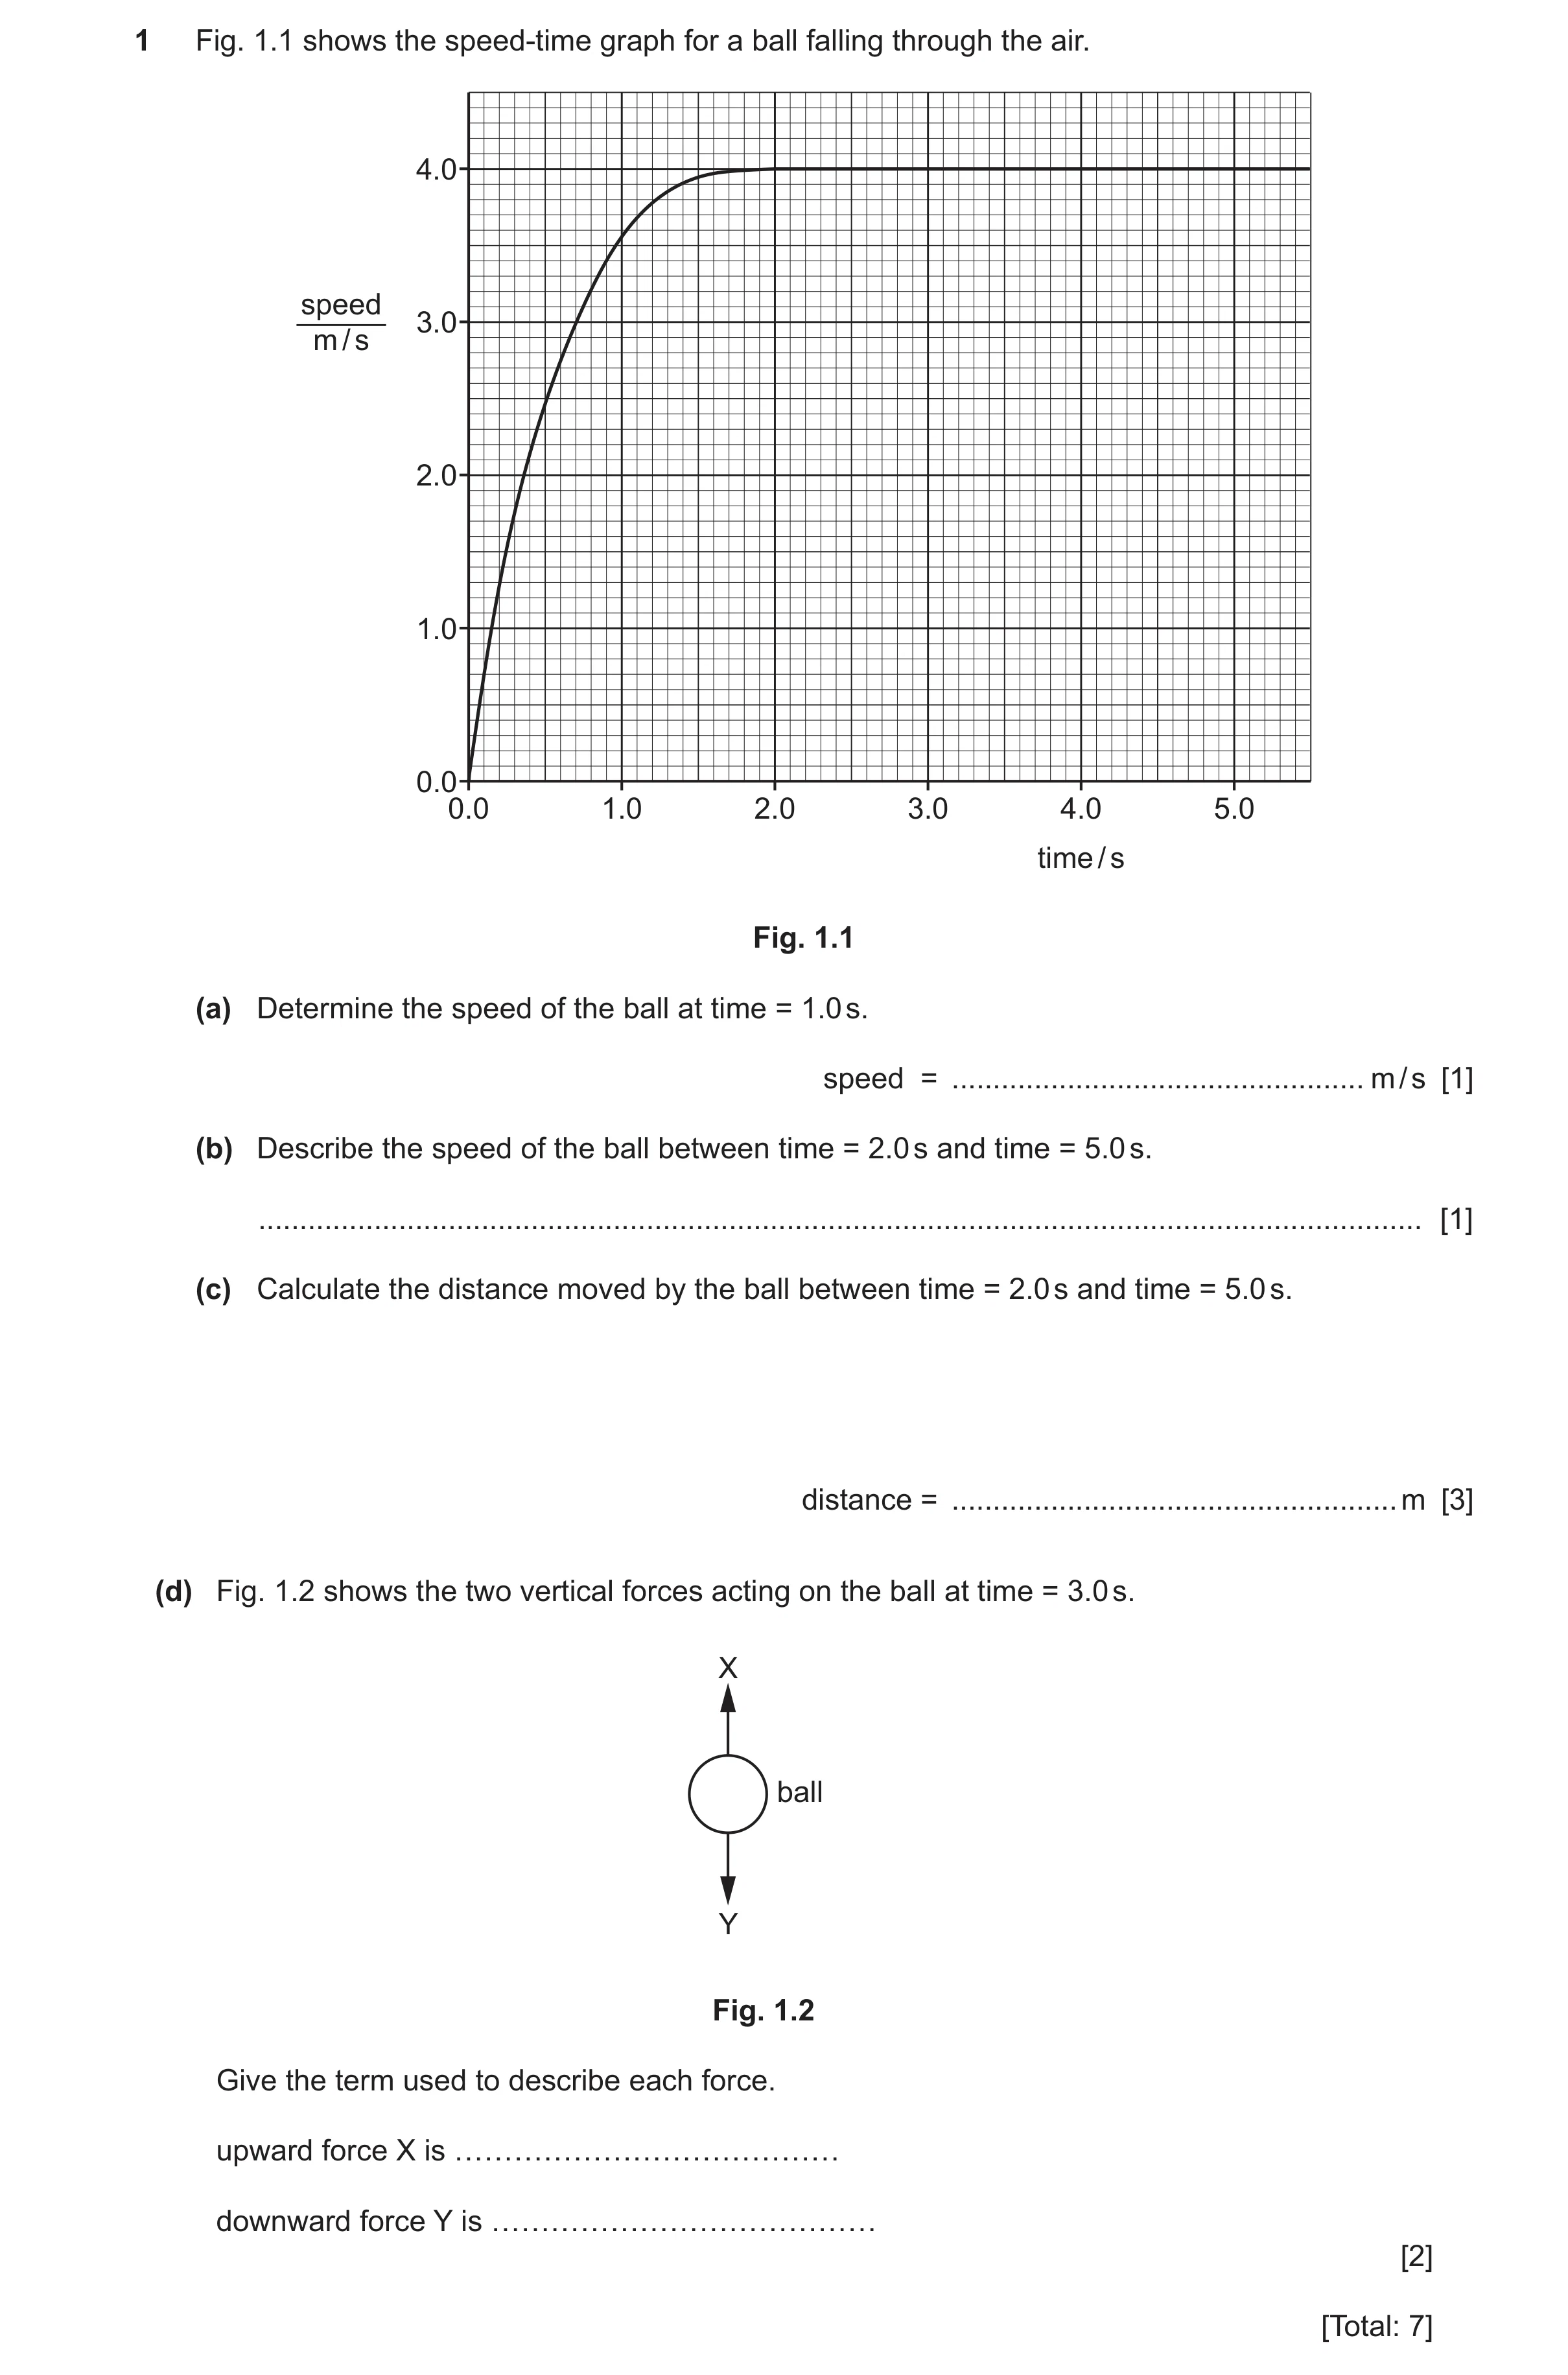
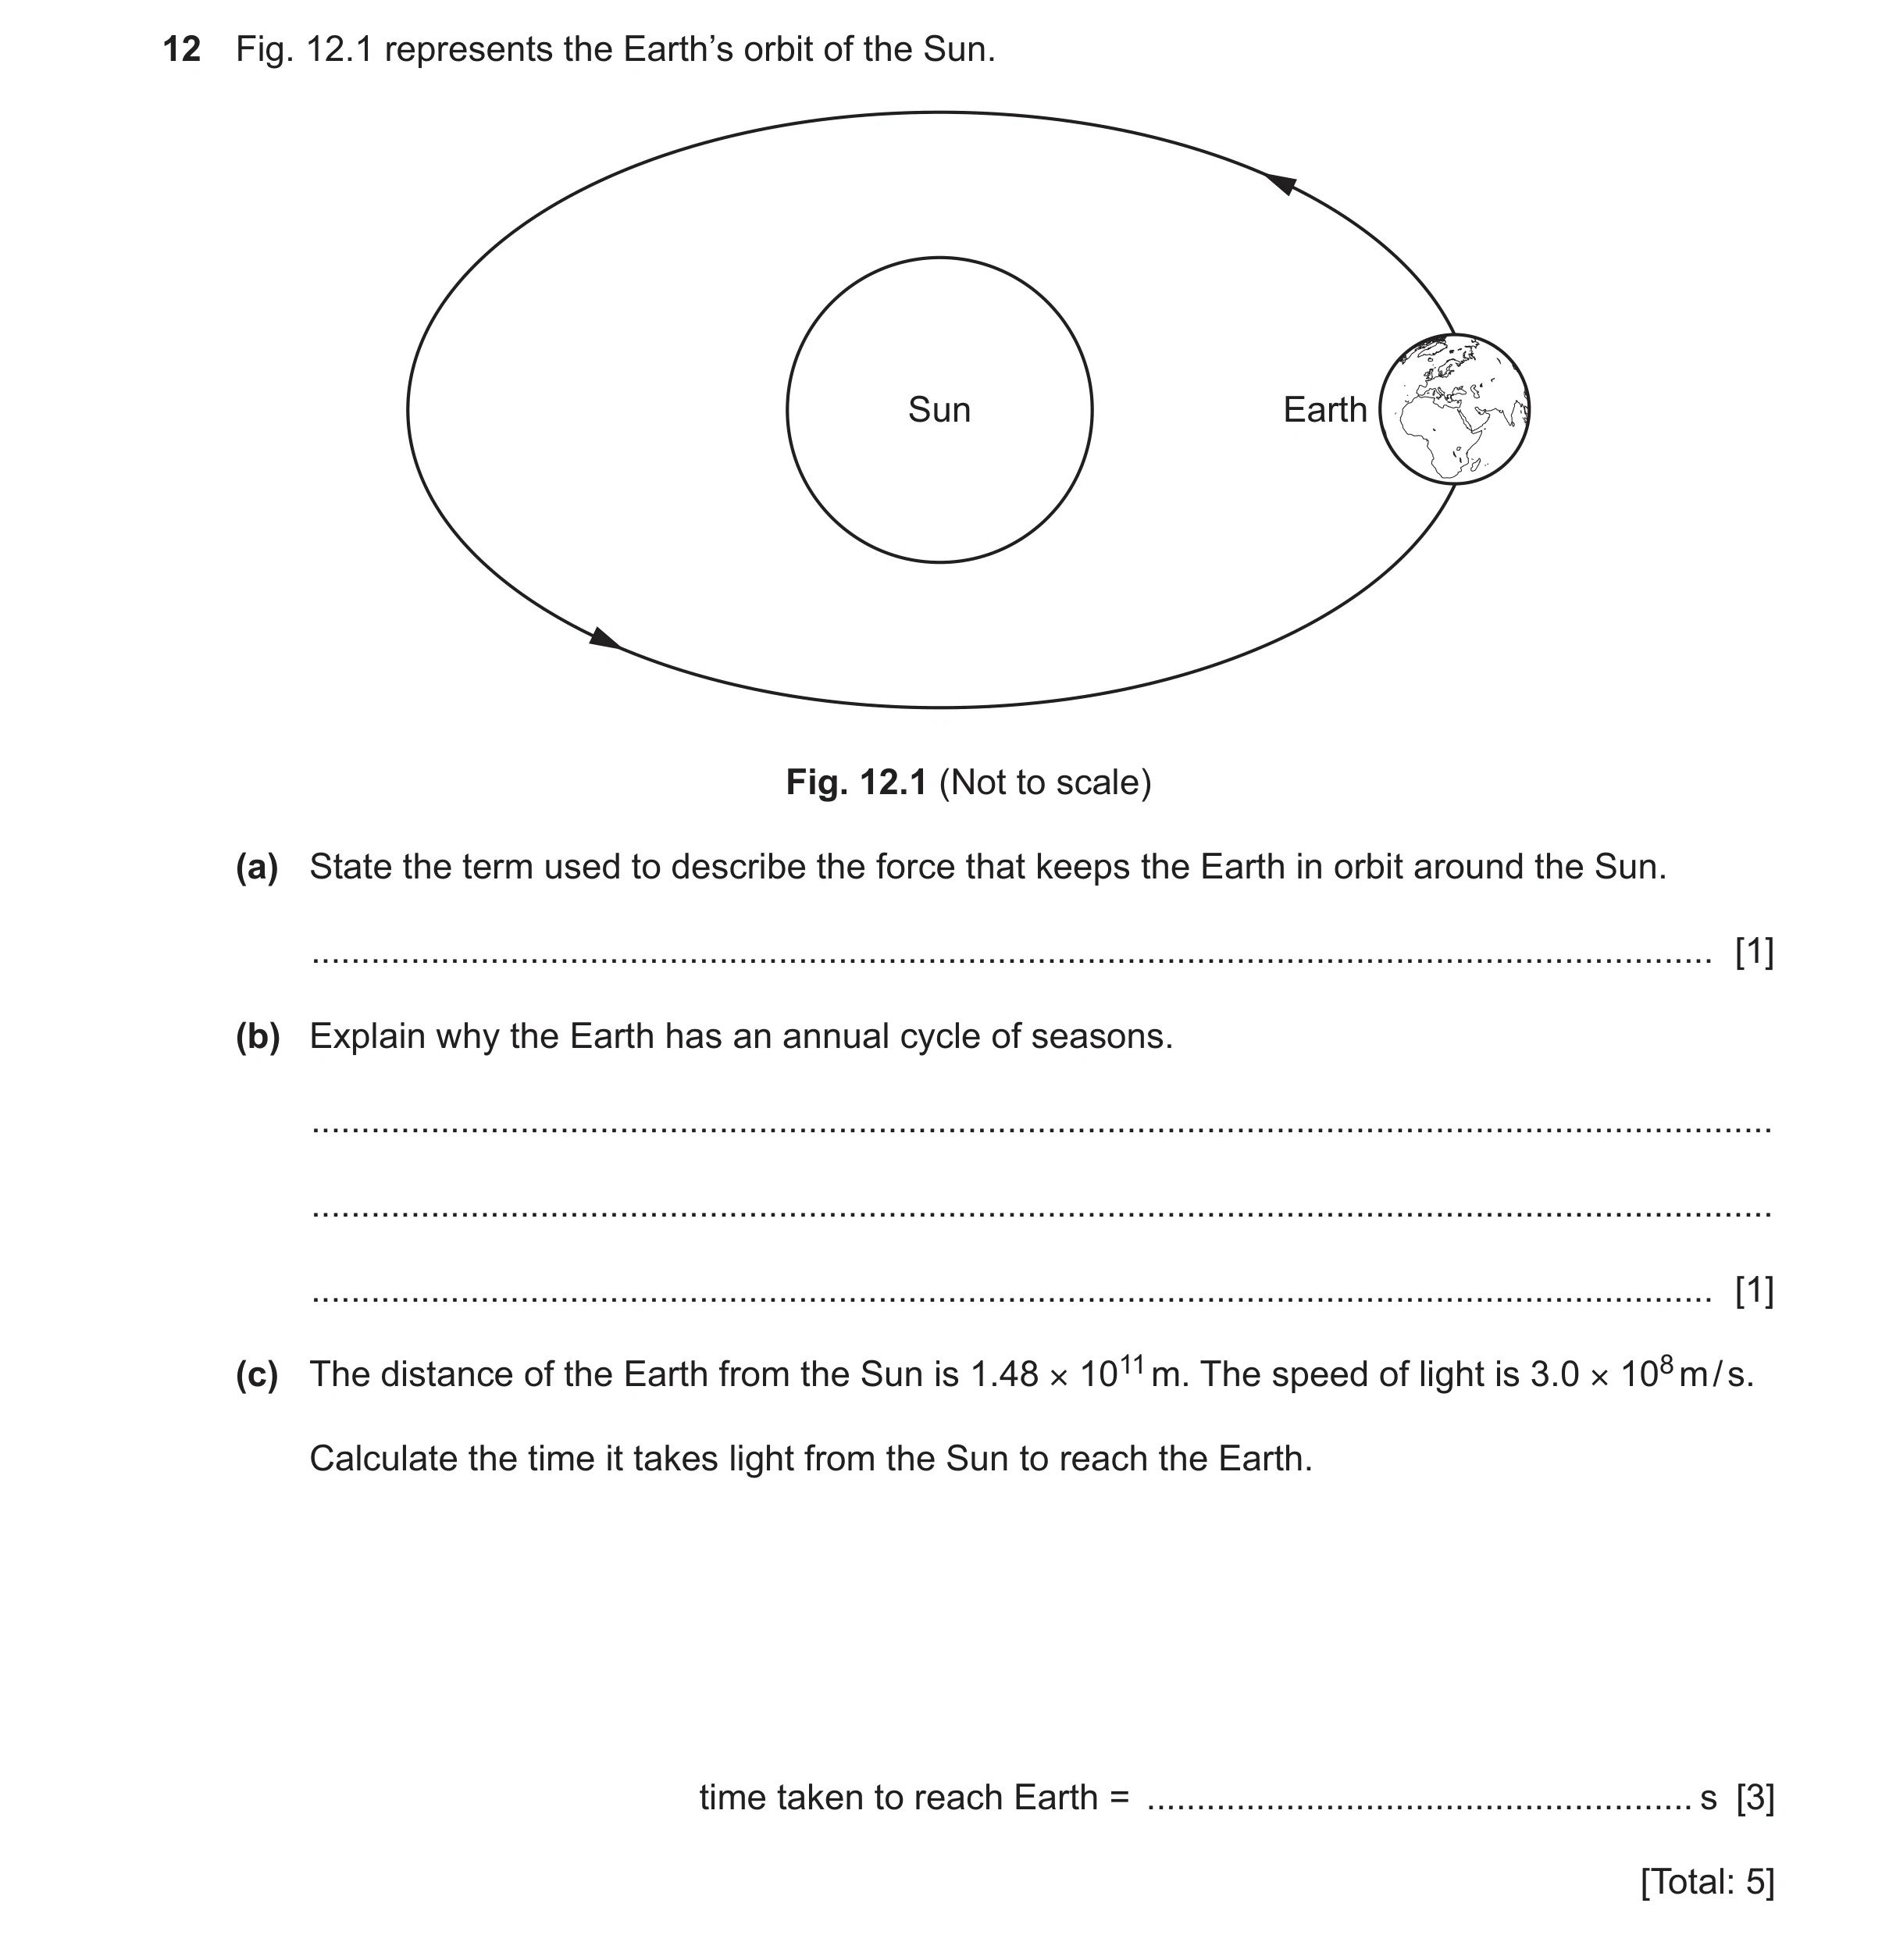 88 / 101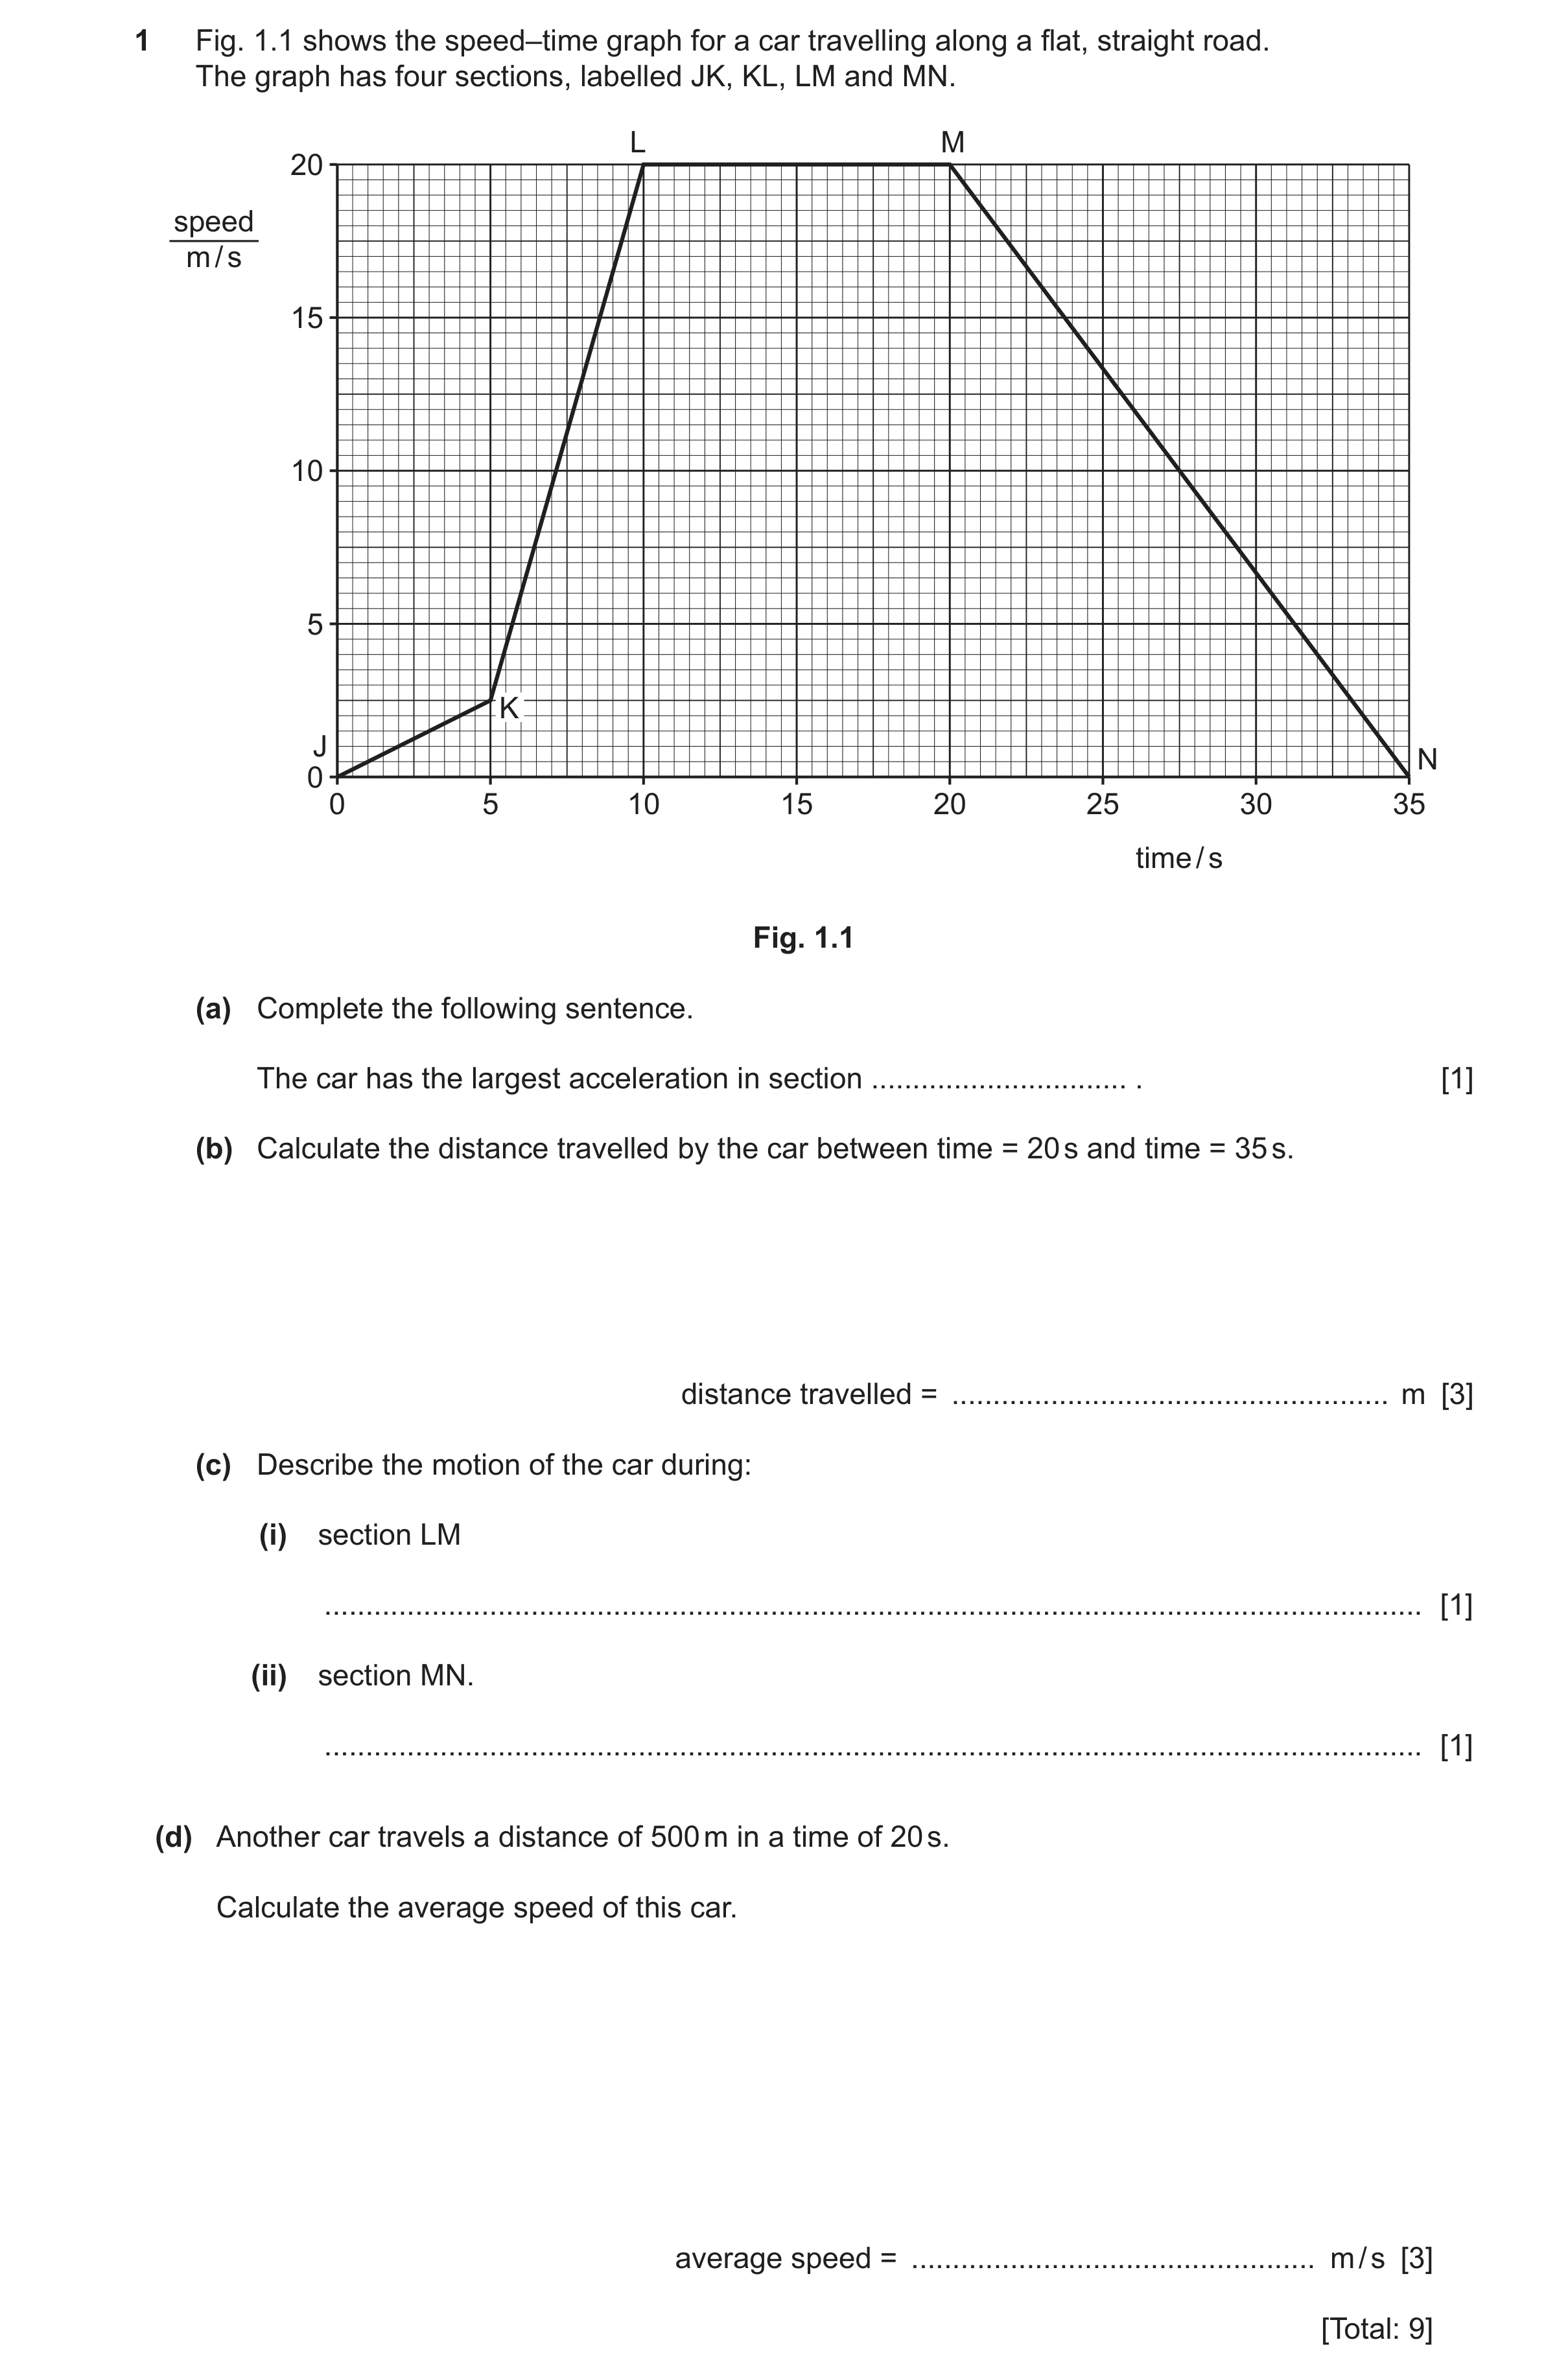
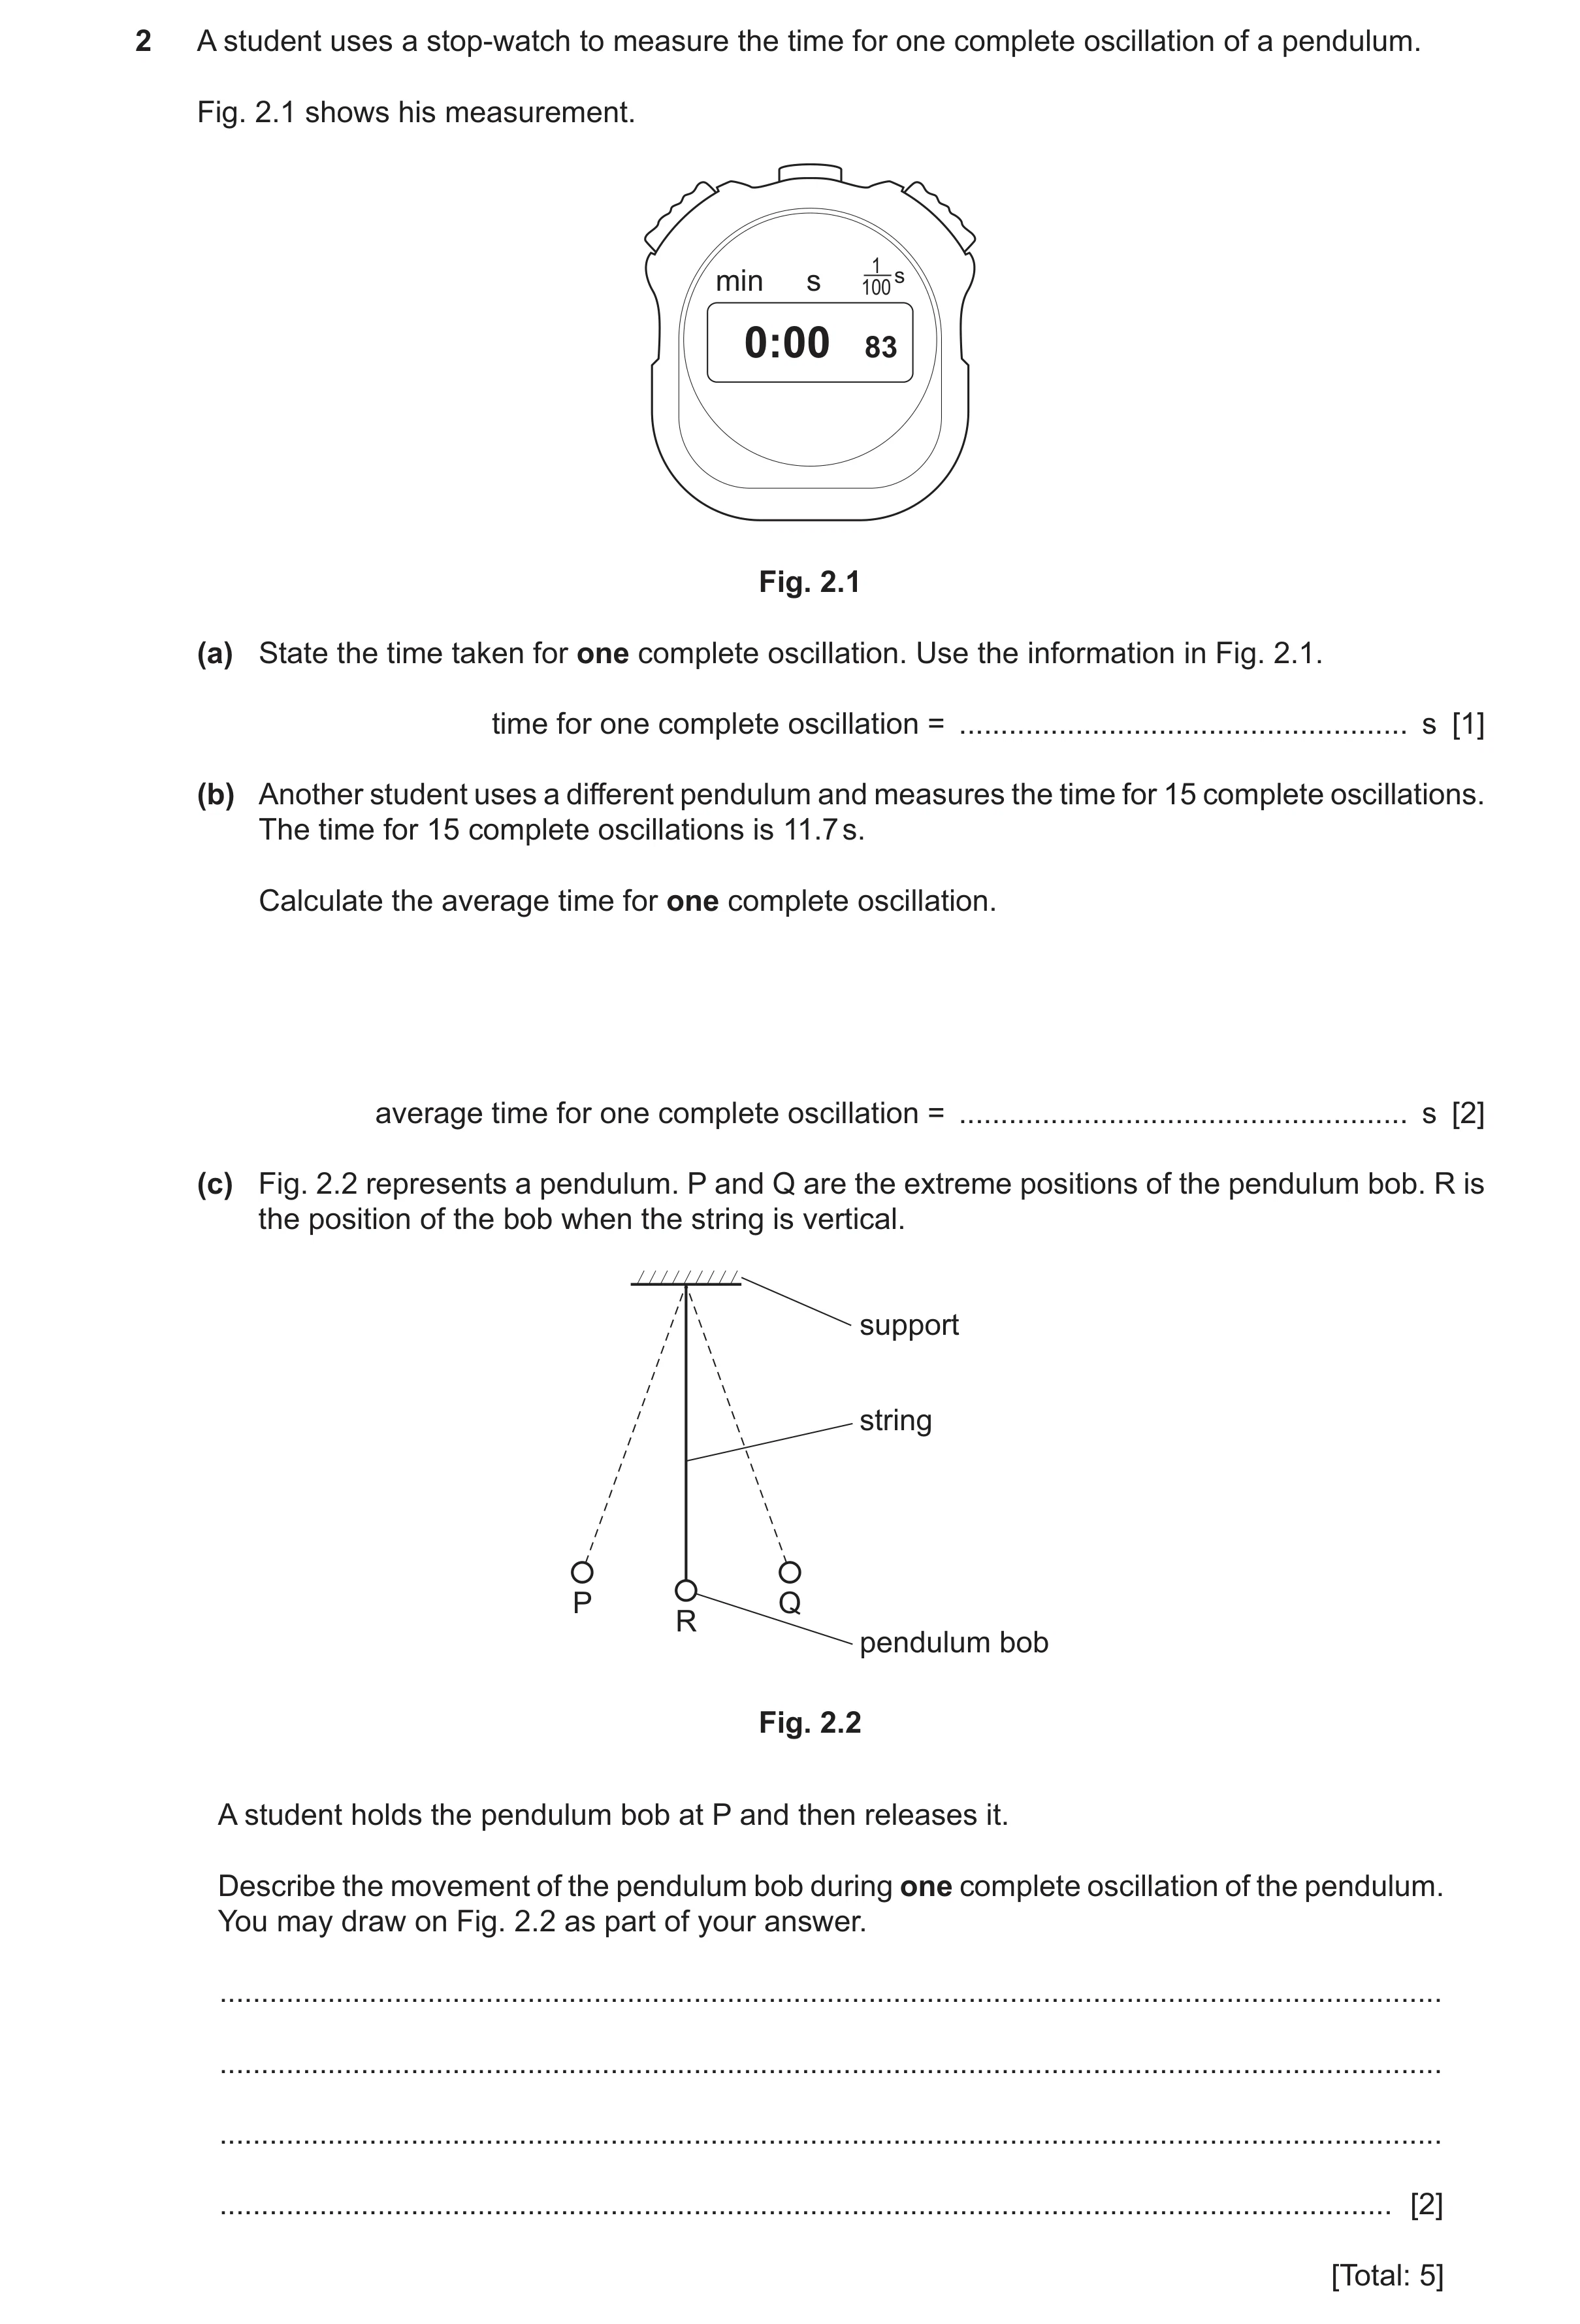
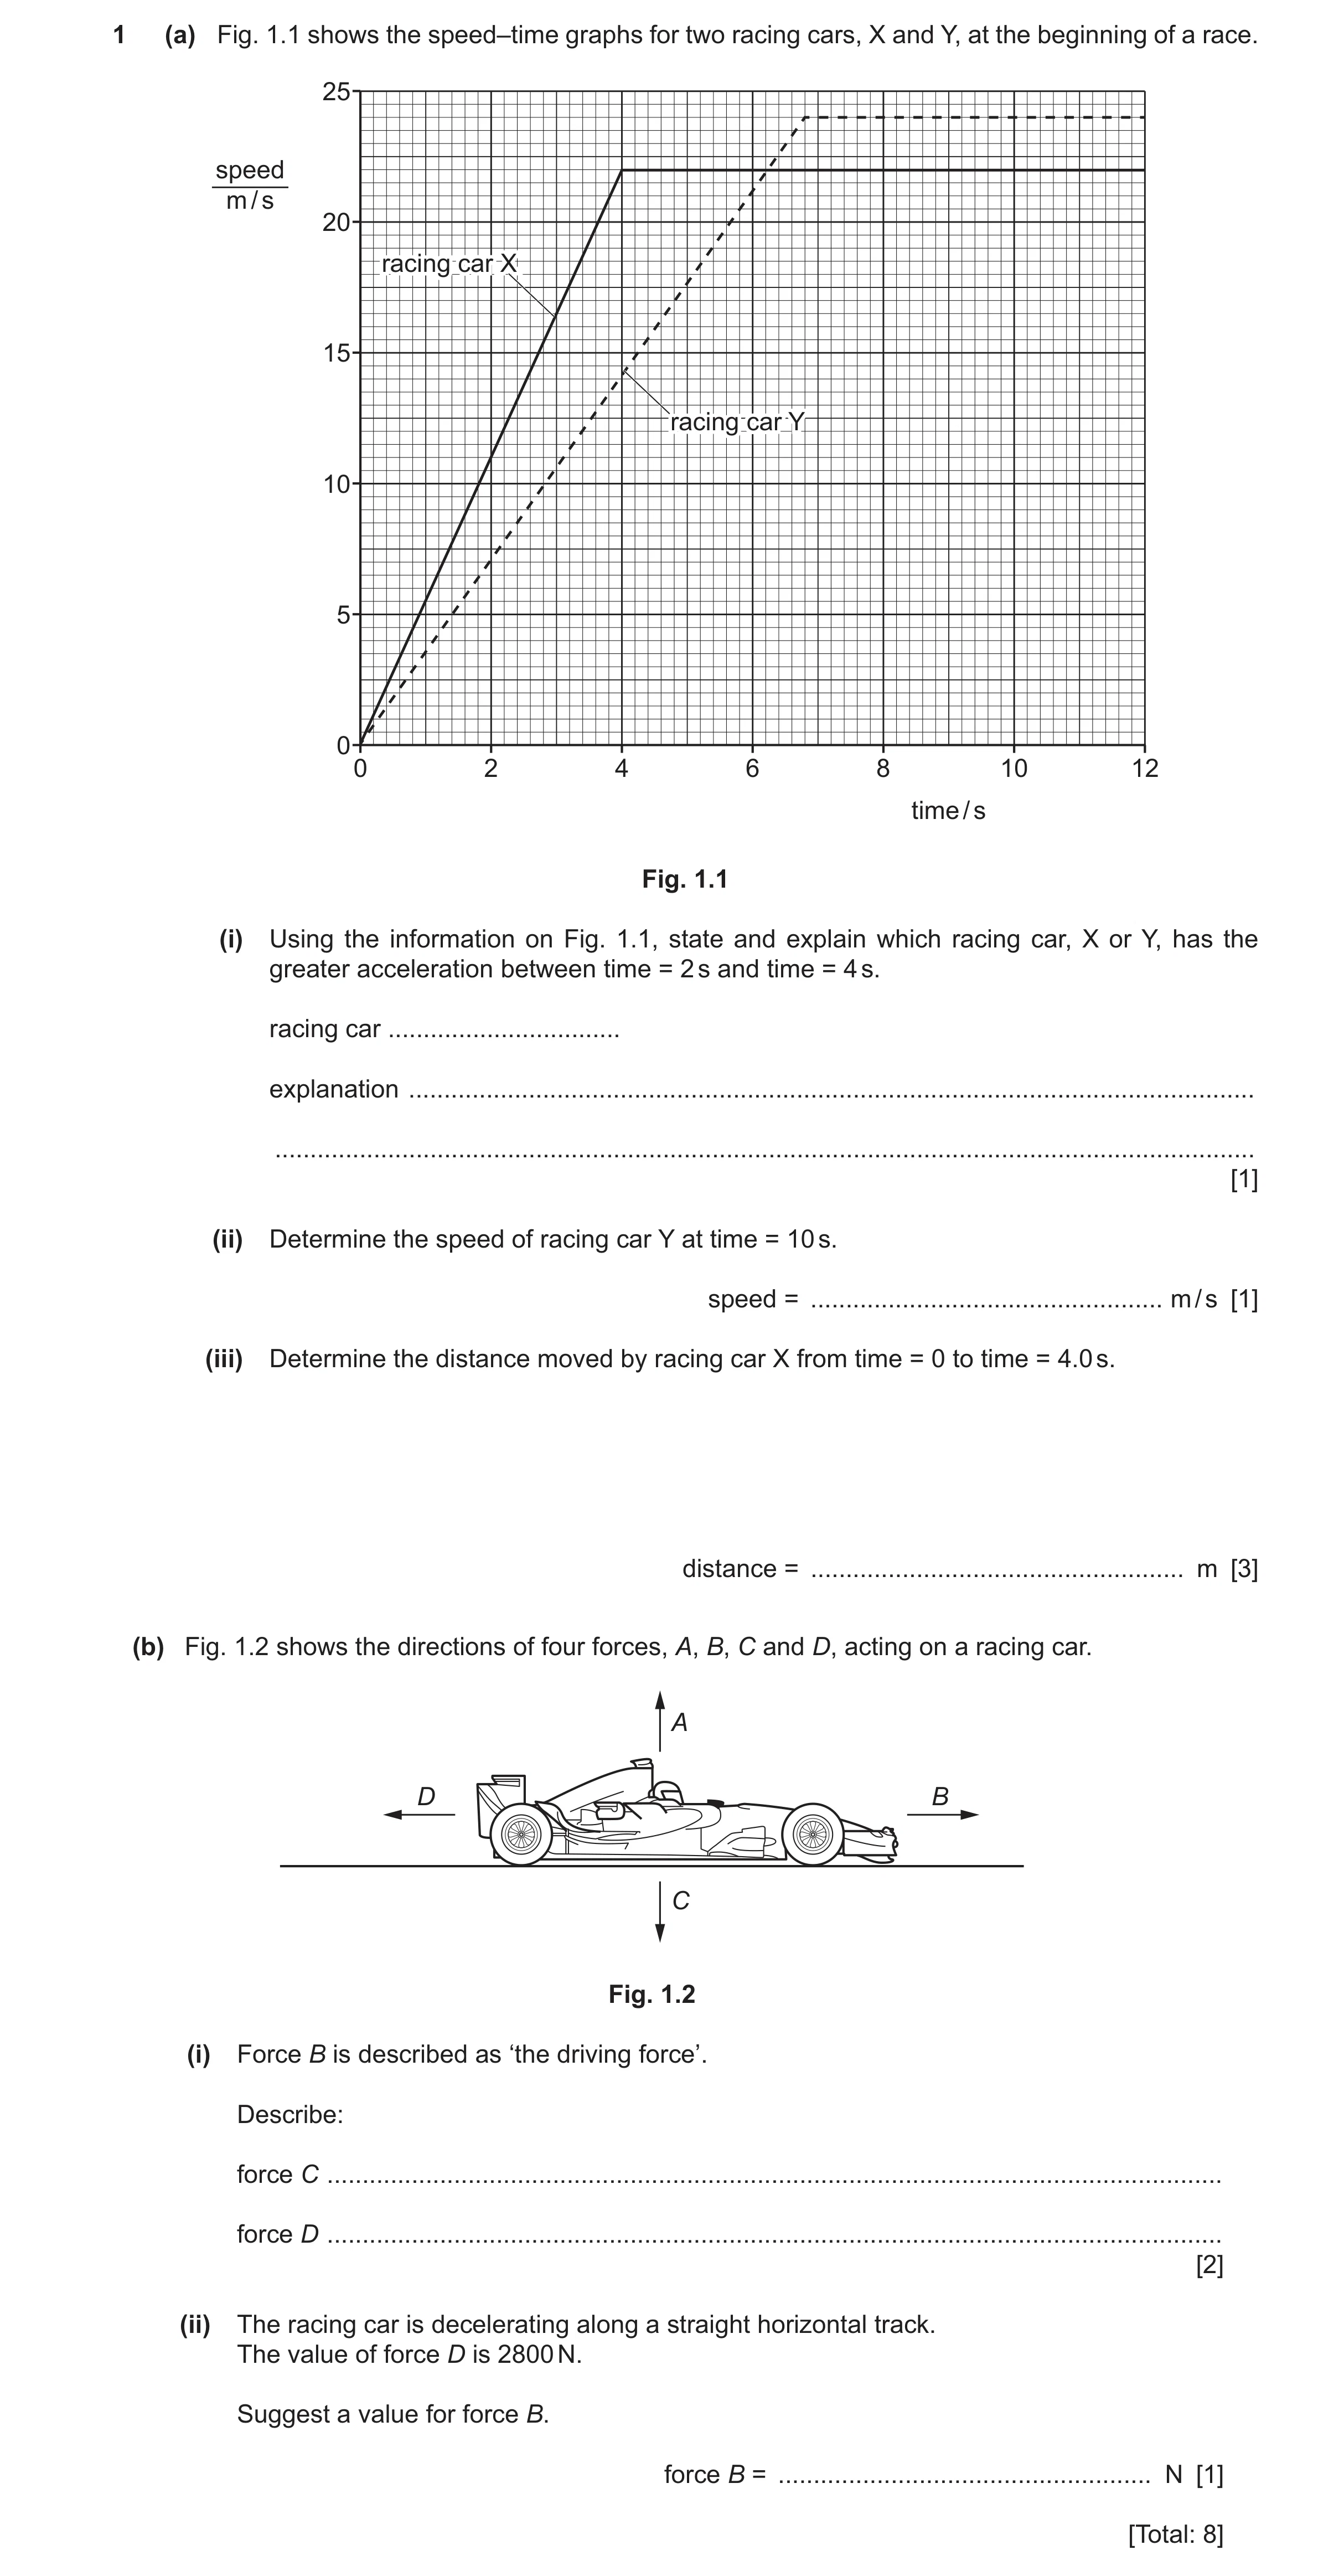
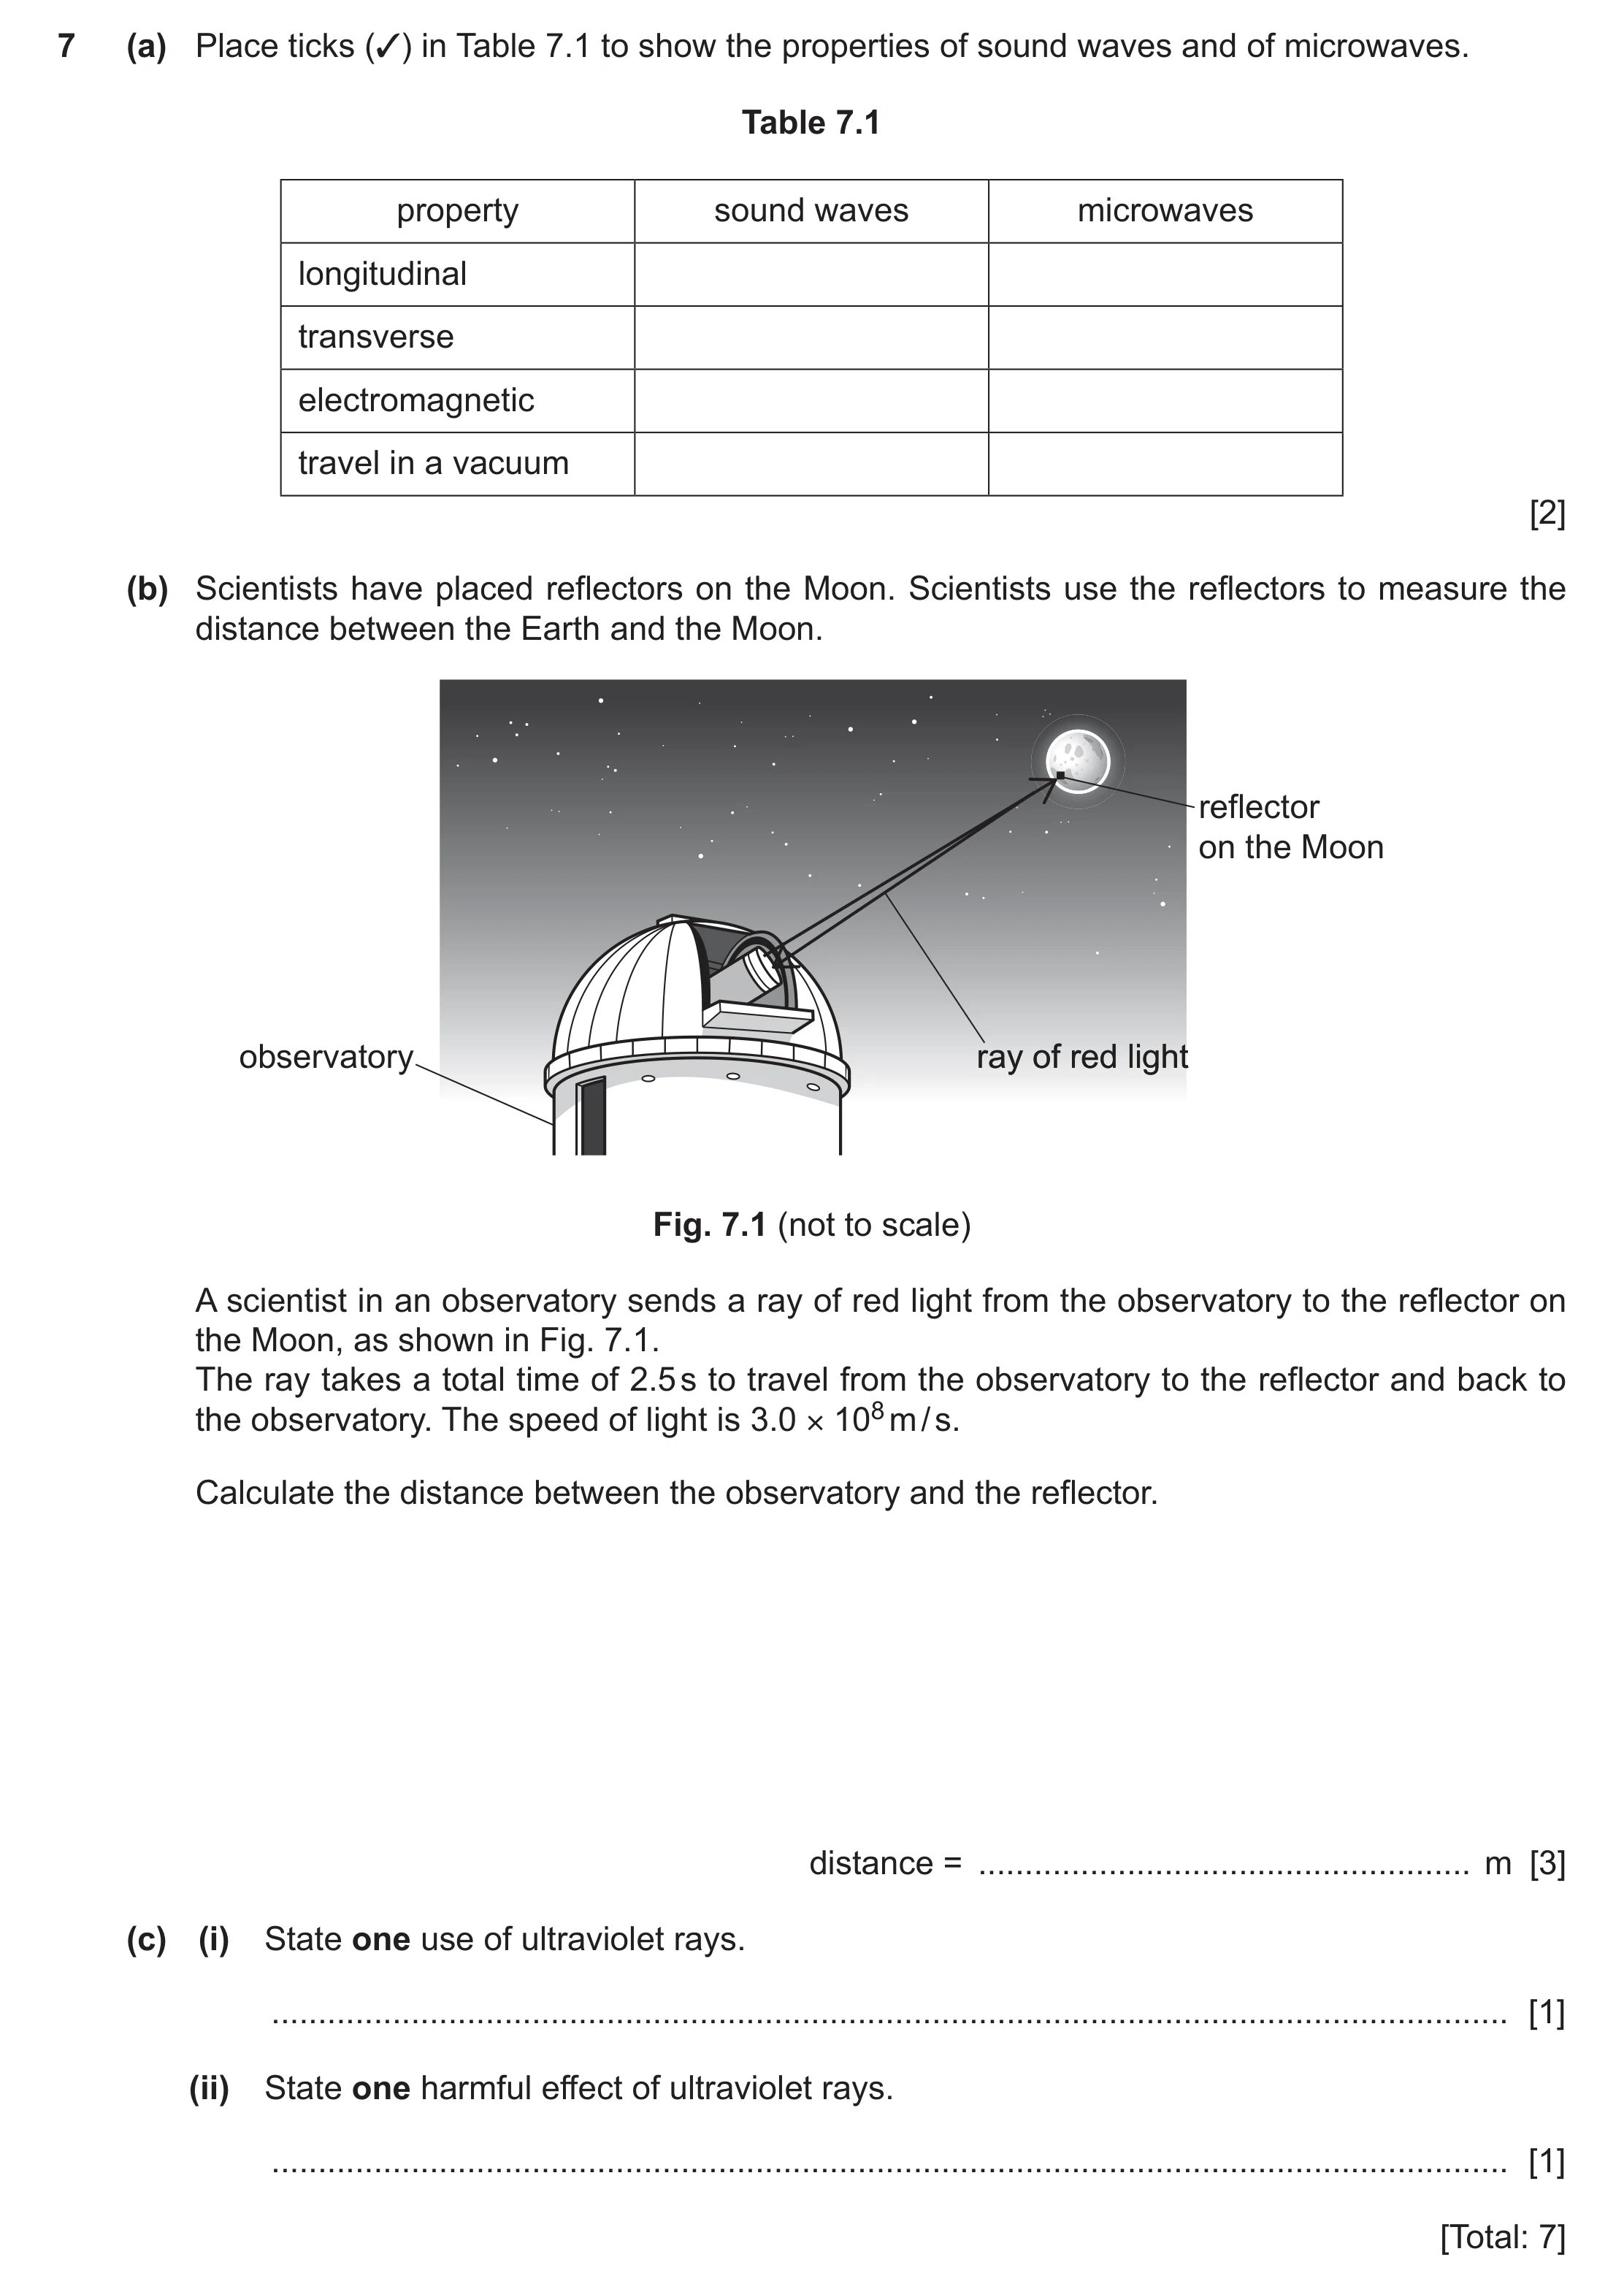 93 / 101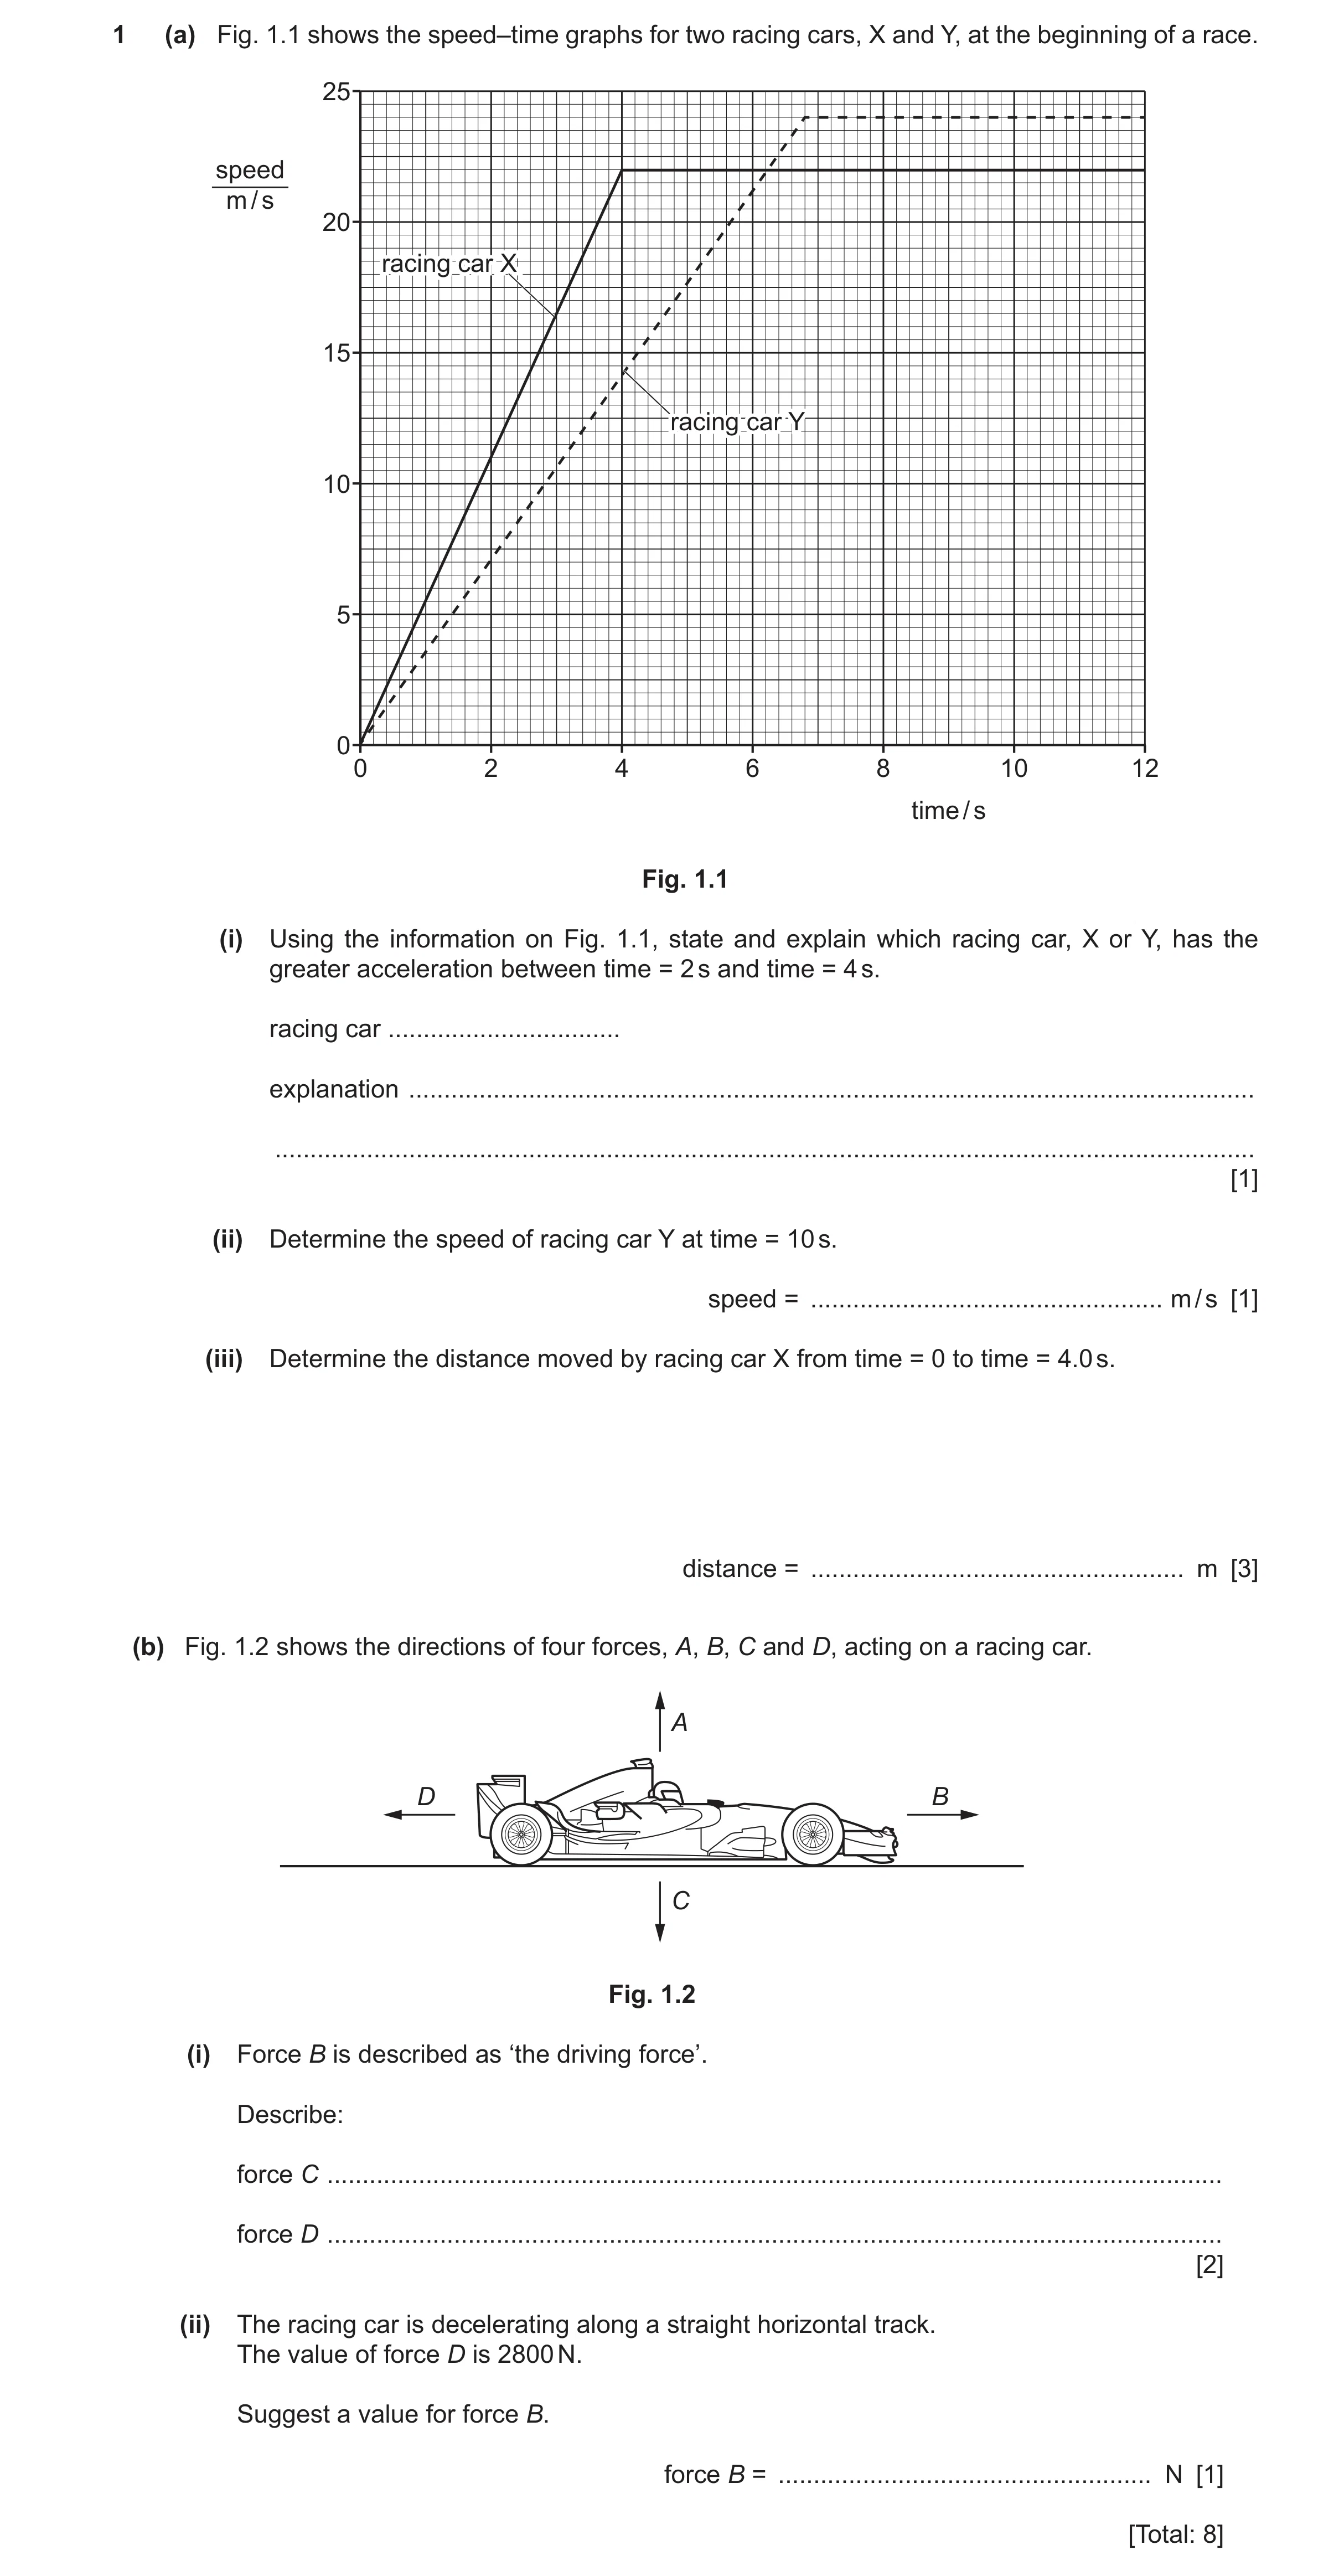
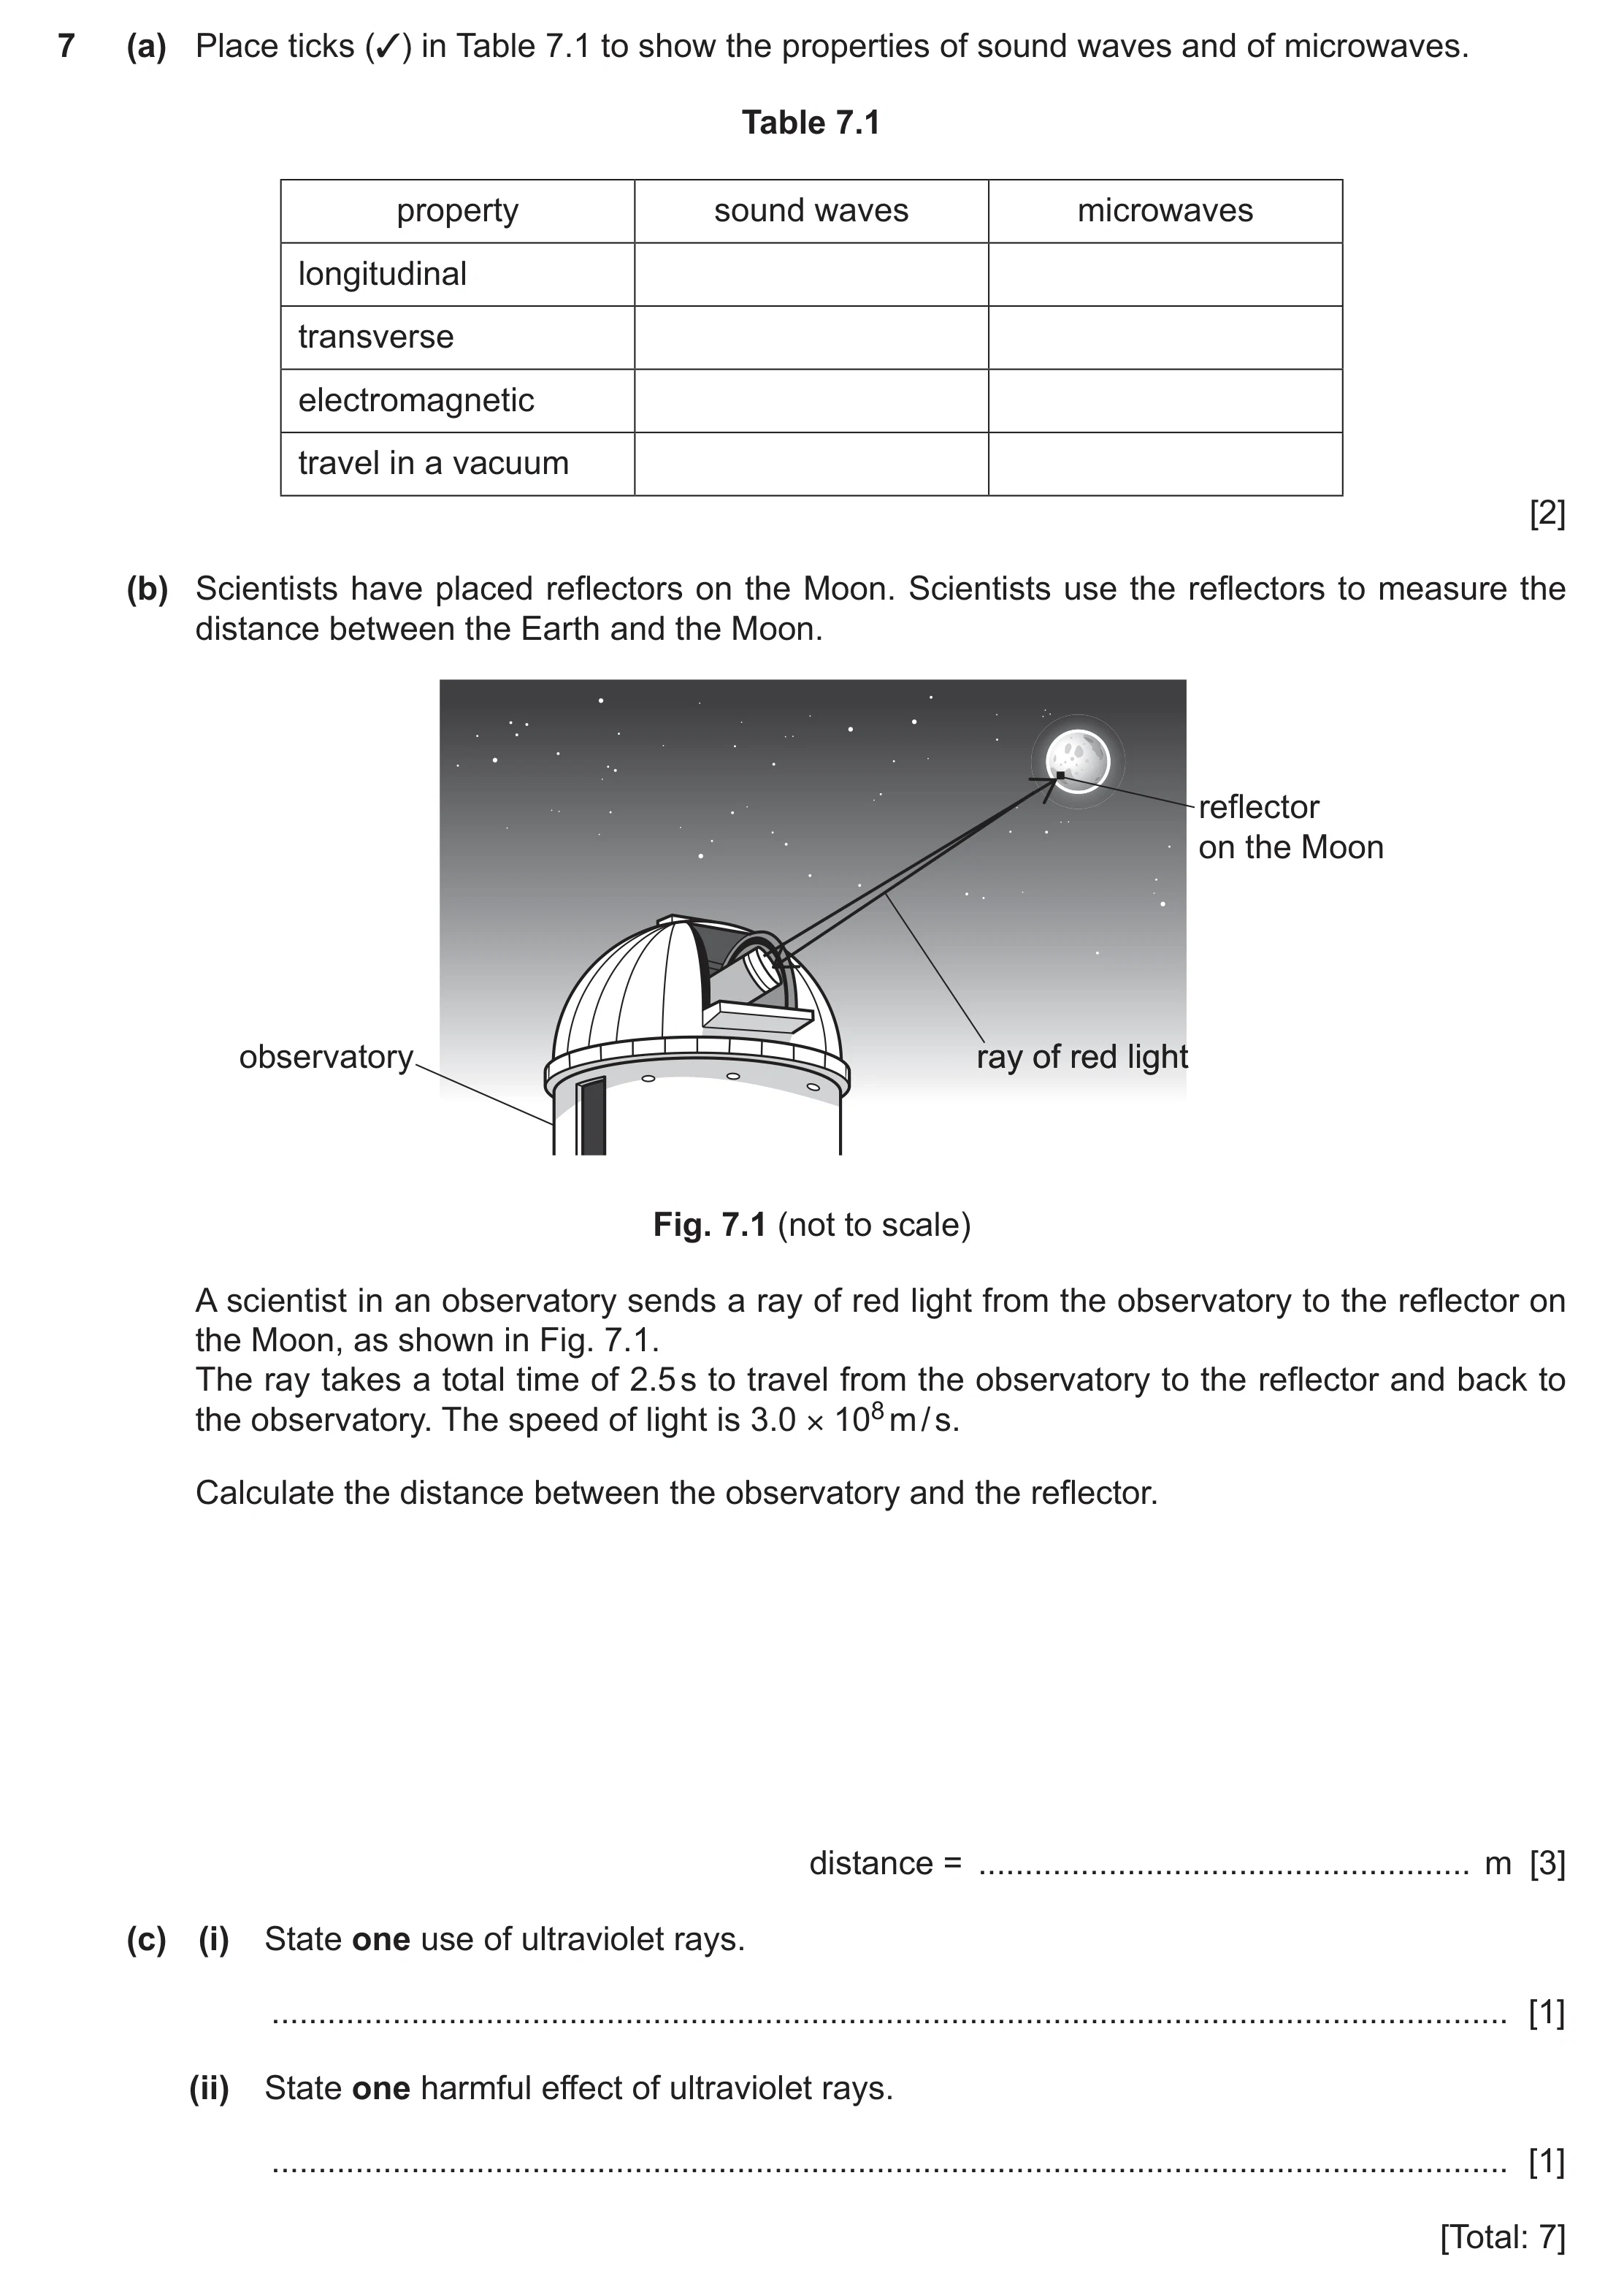 96 / 101
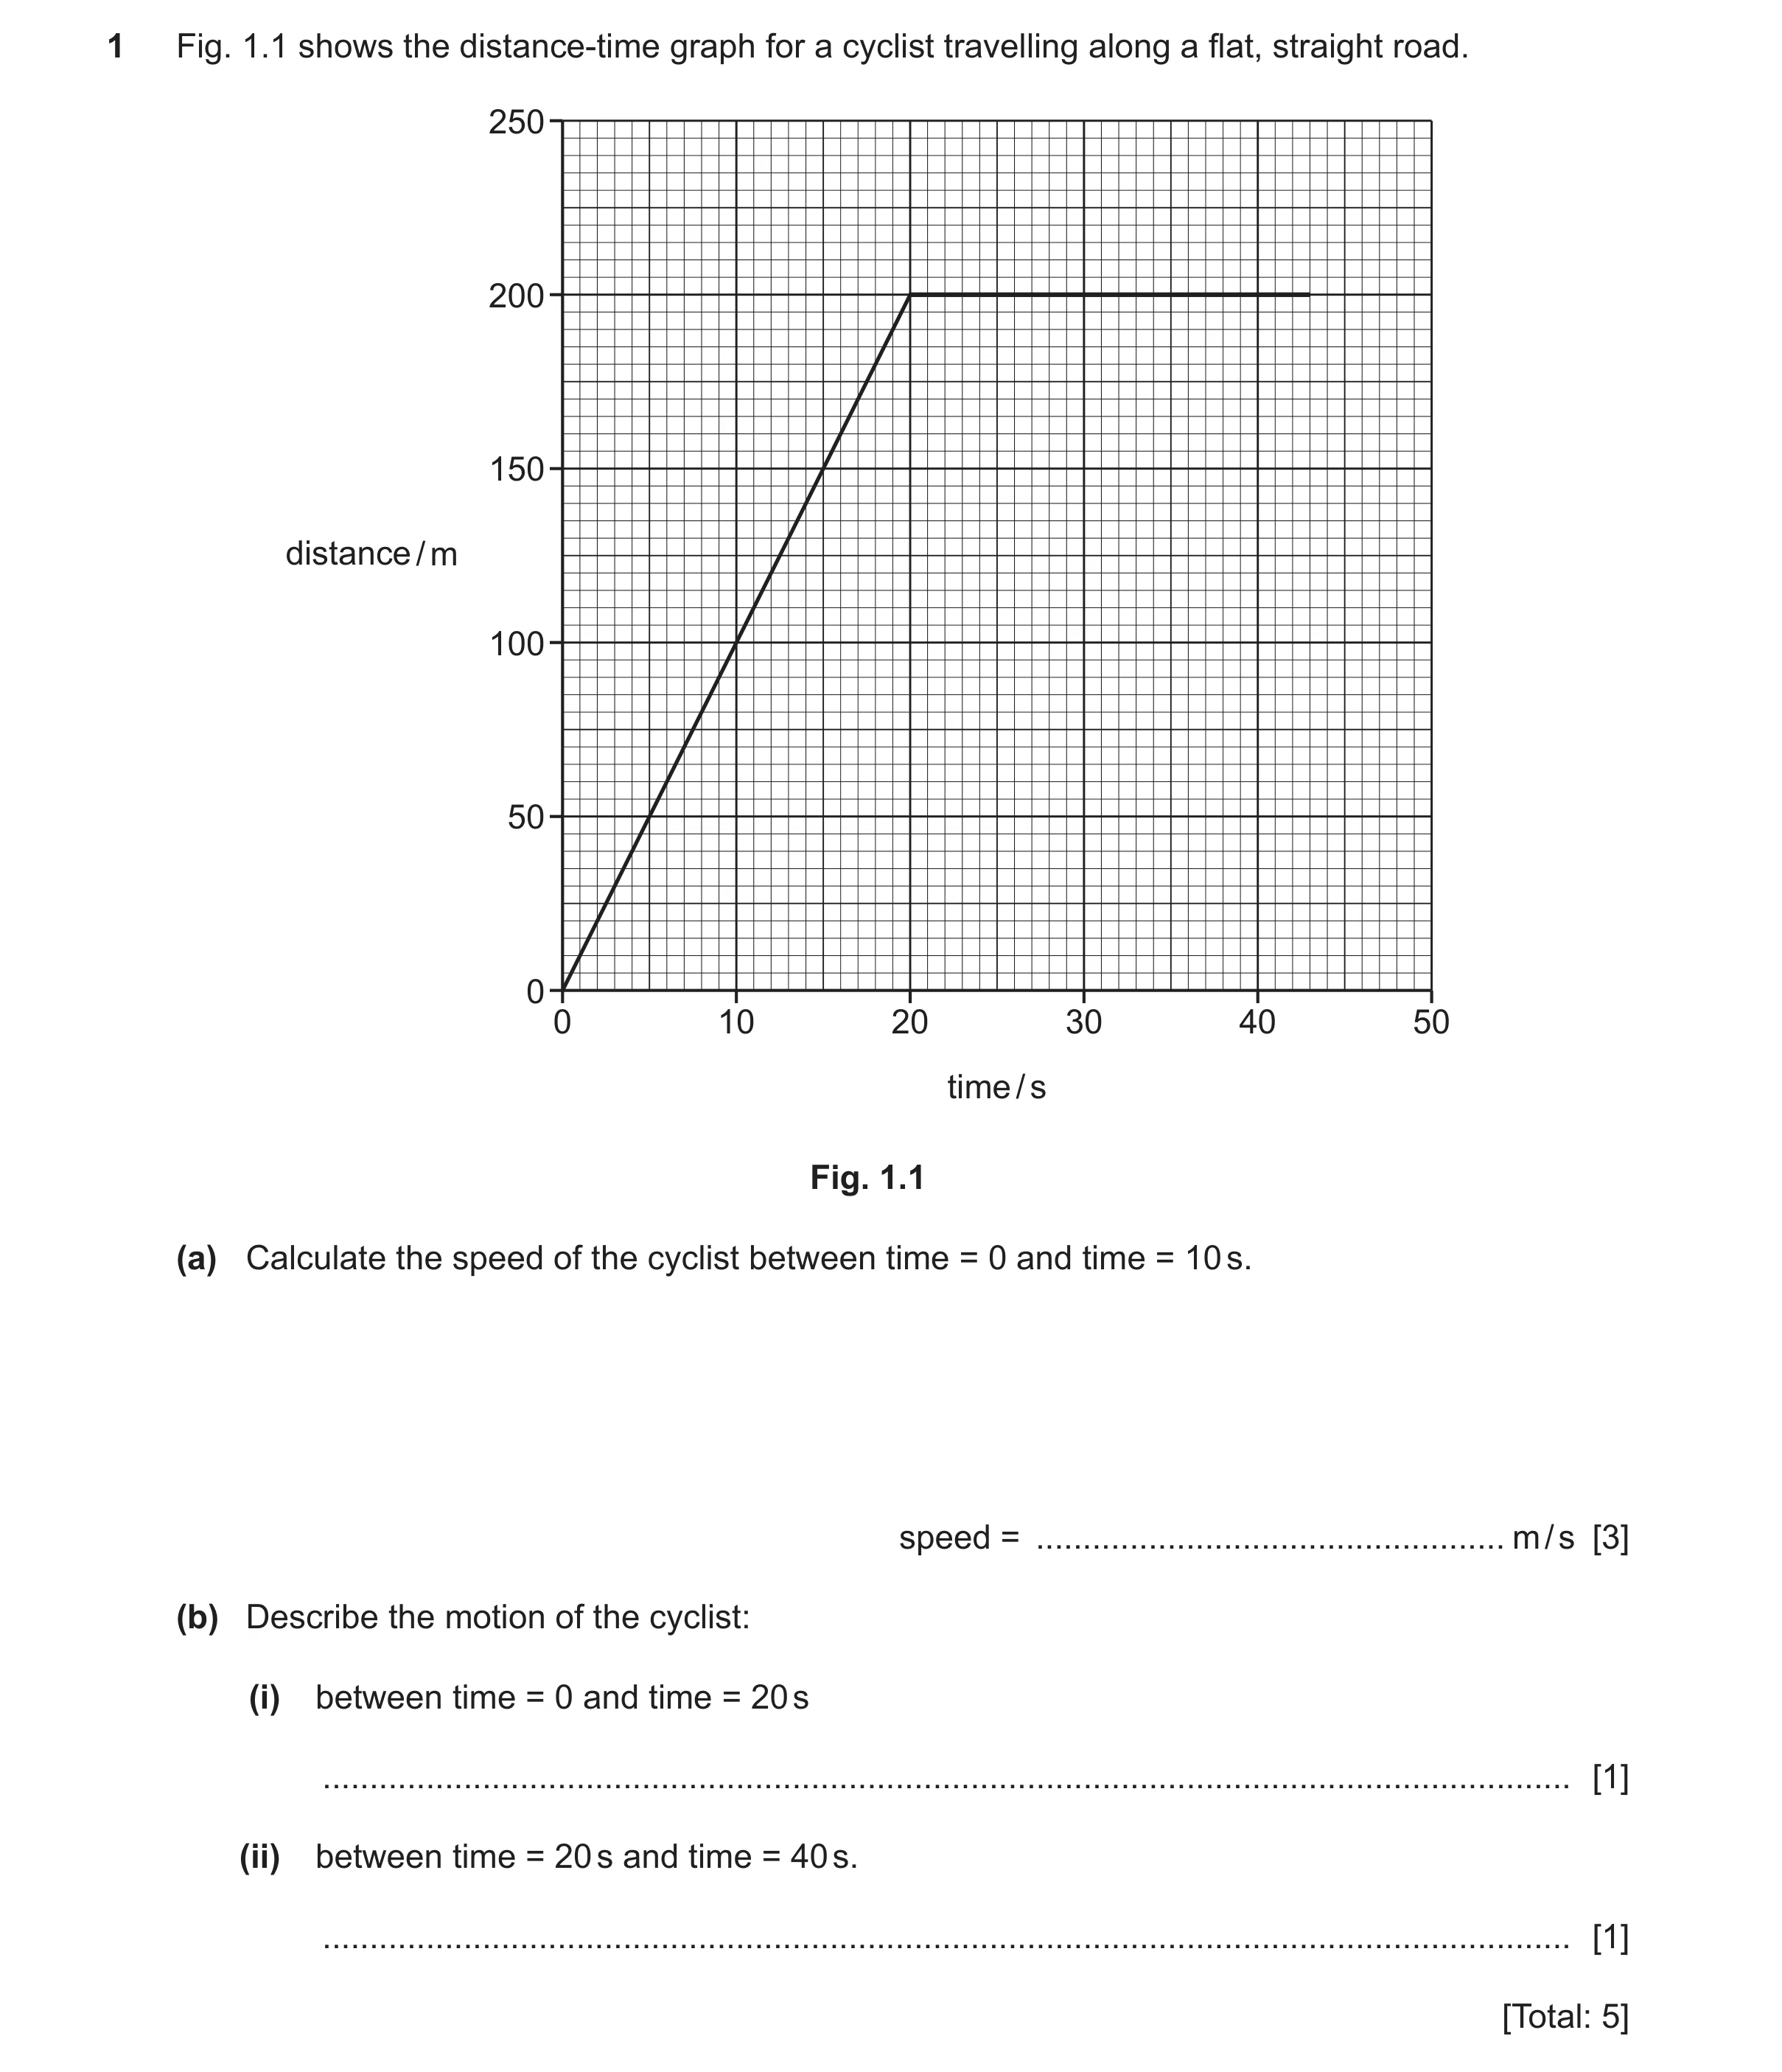 97 / 101
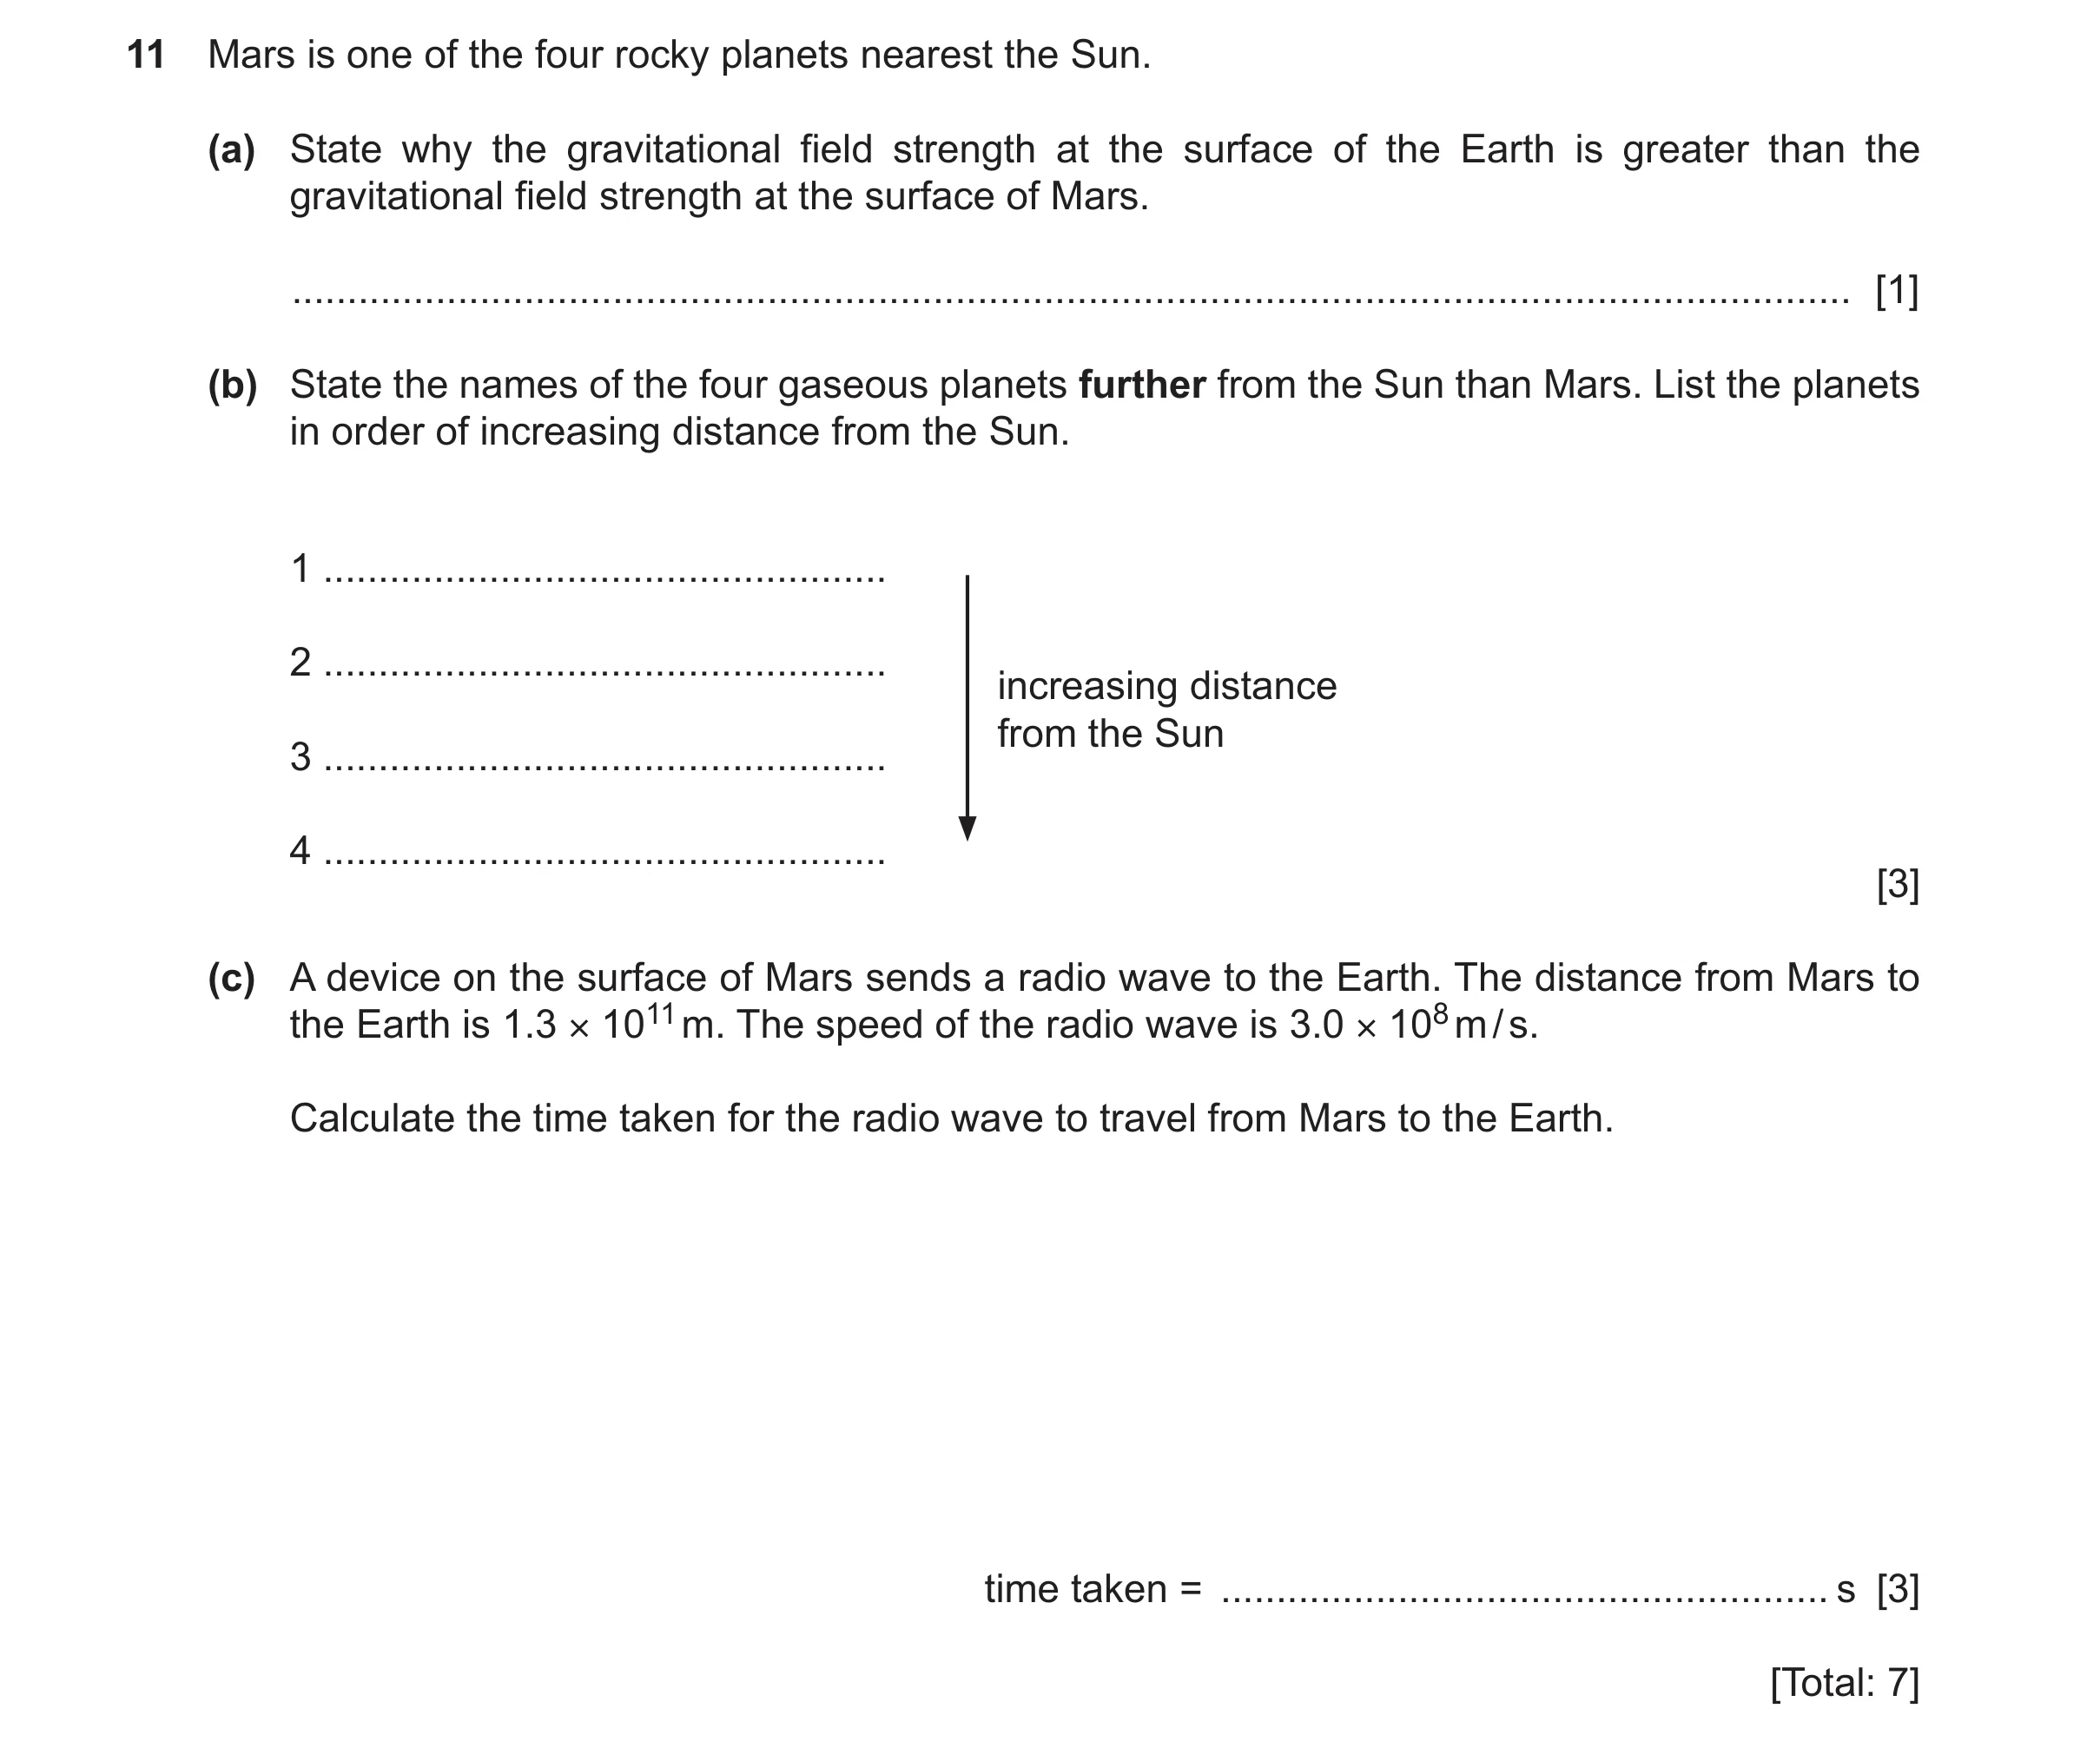 98 / 101
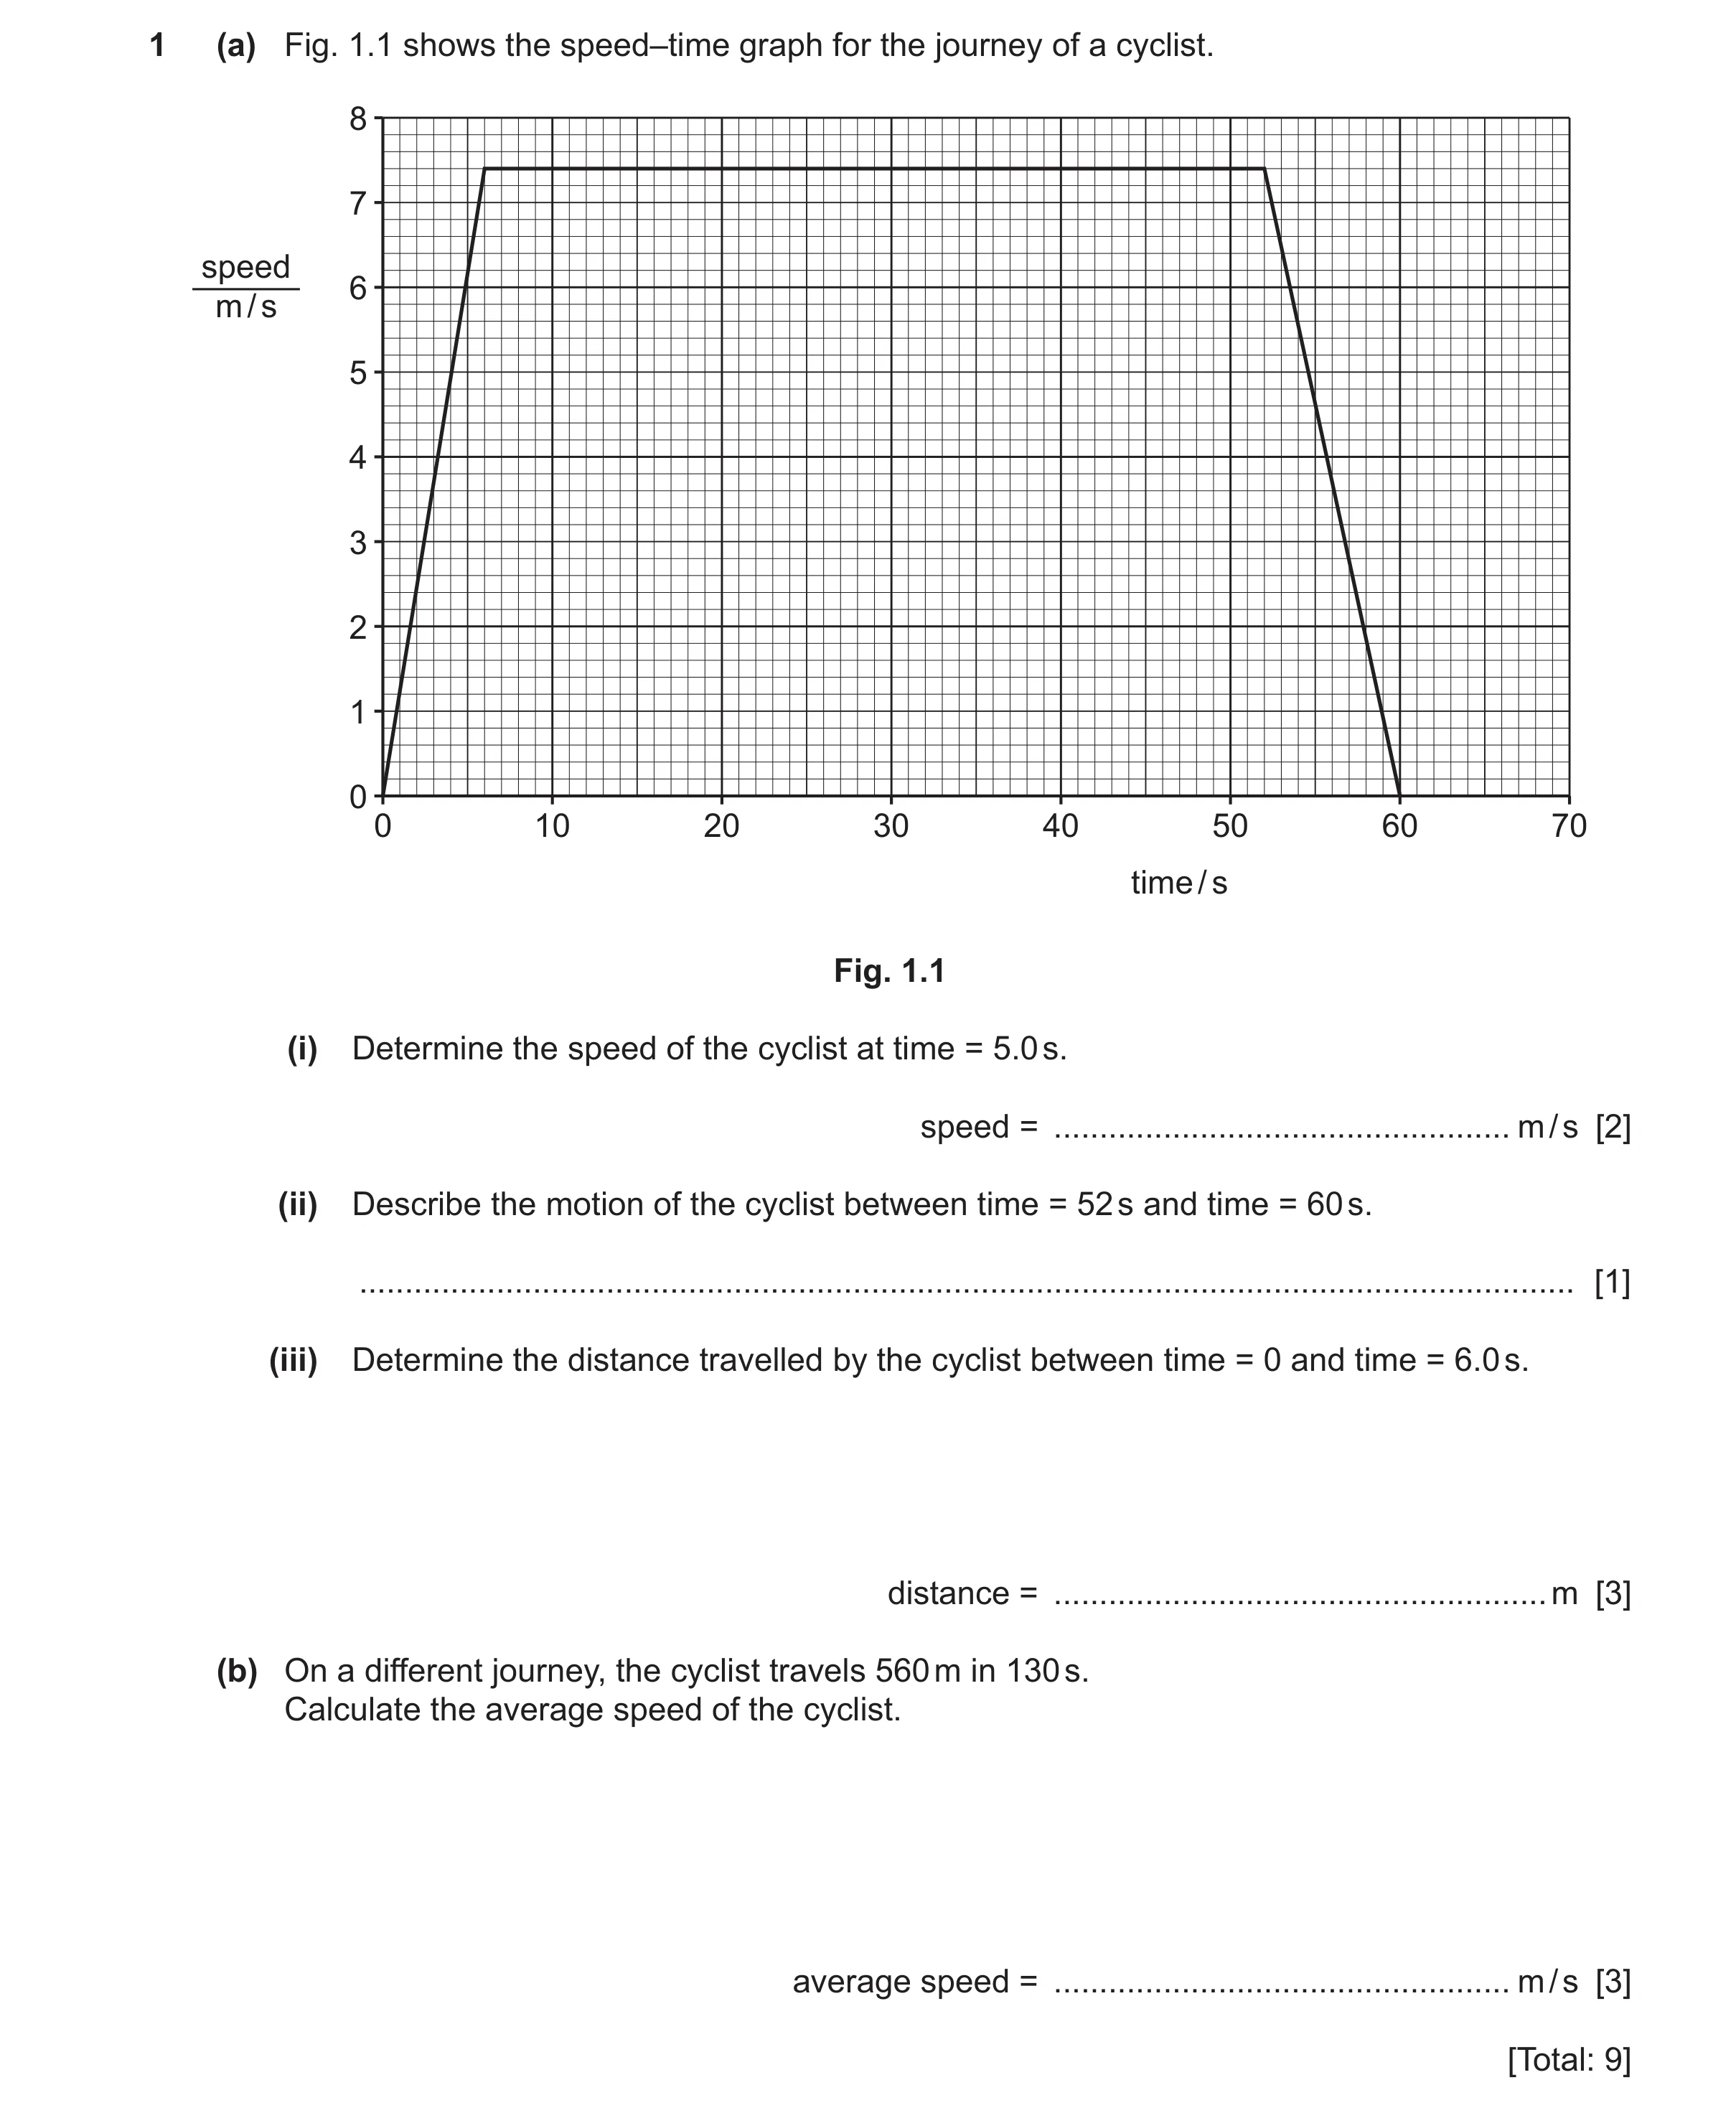 99 / 101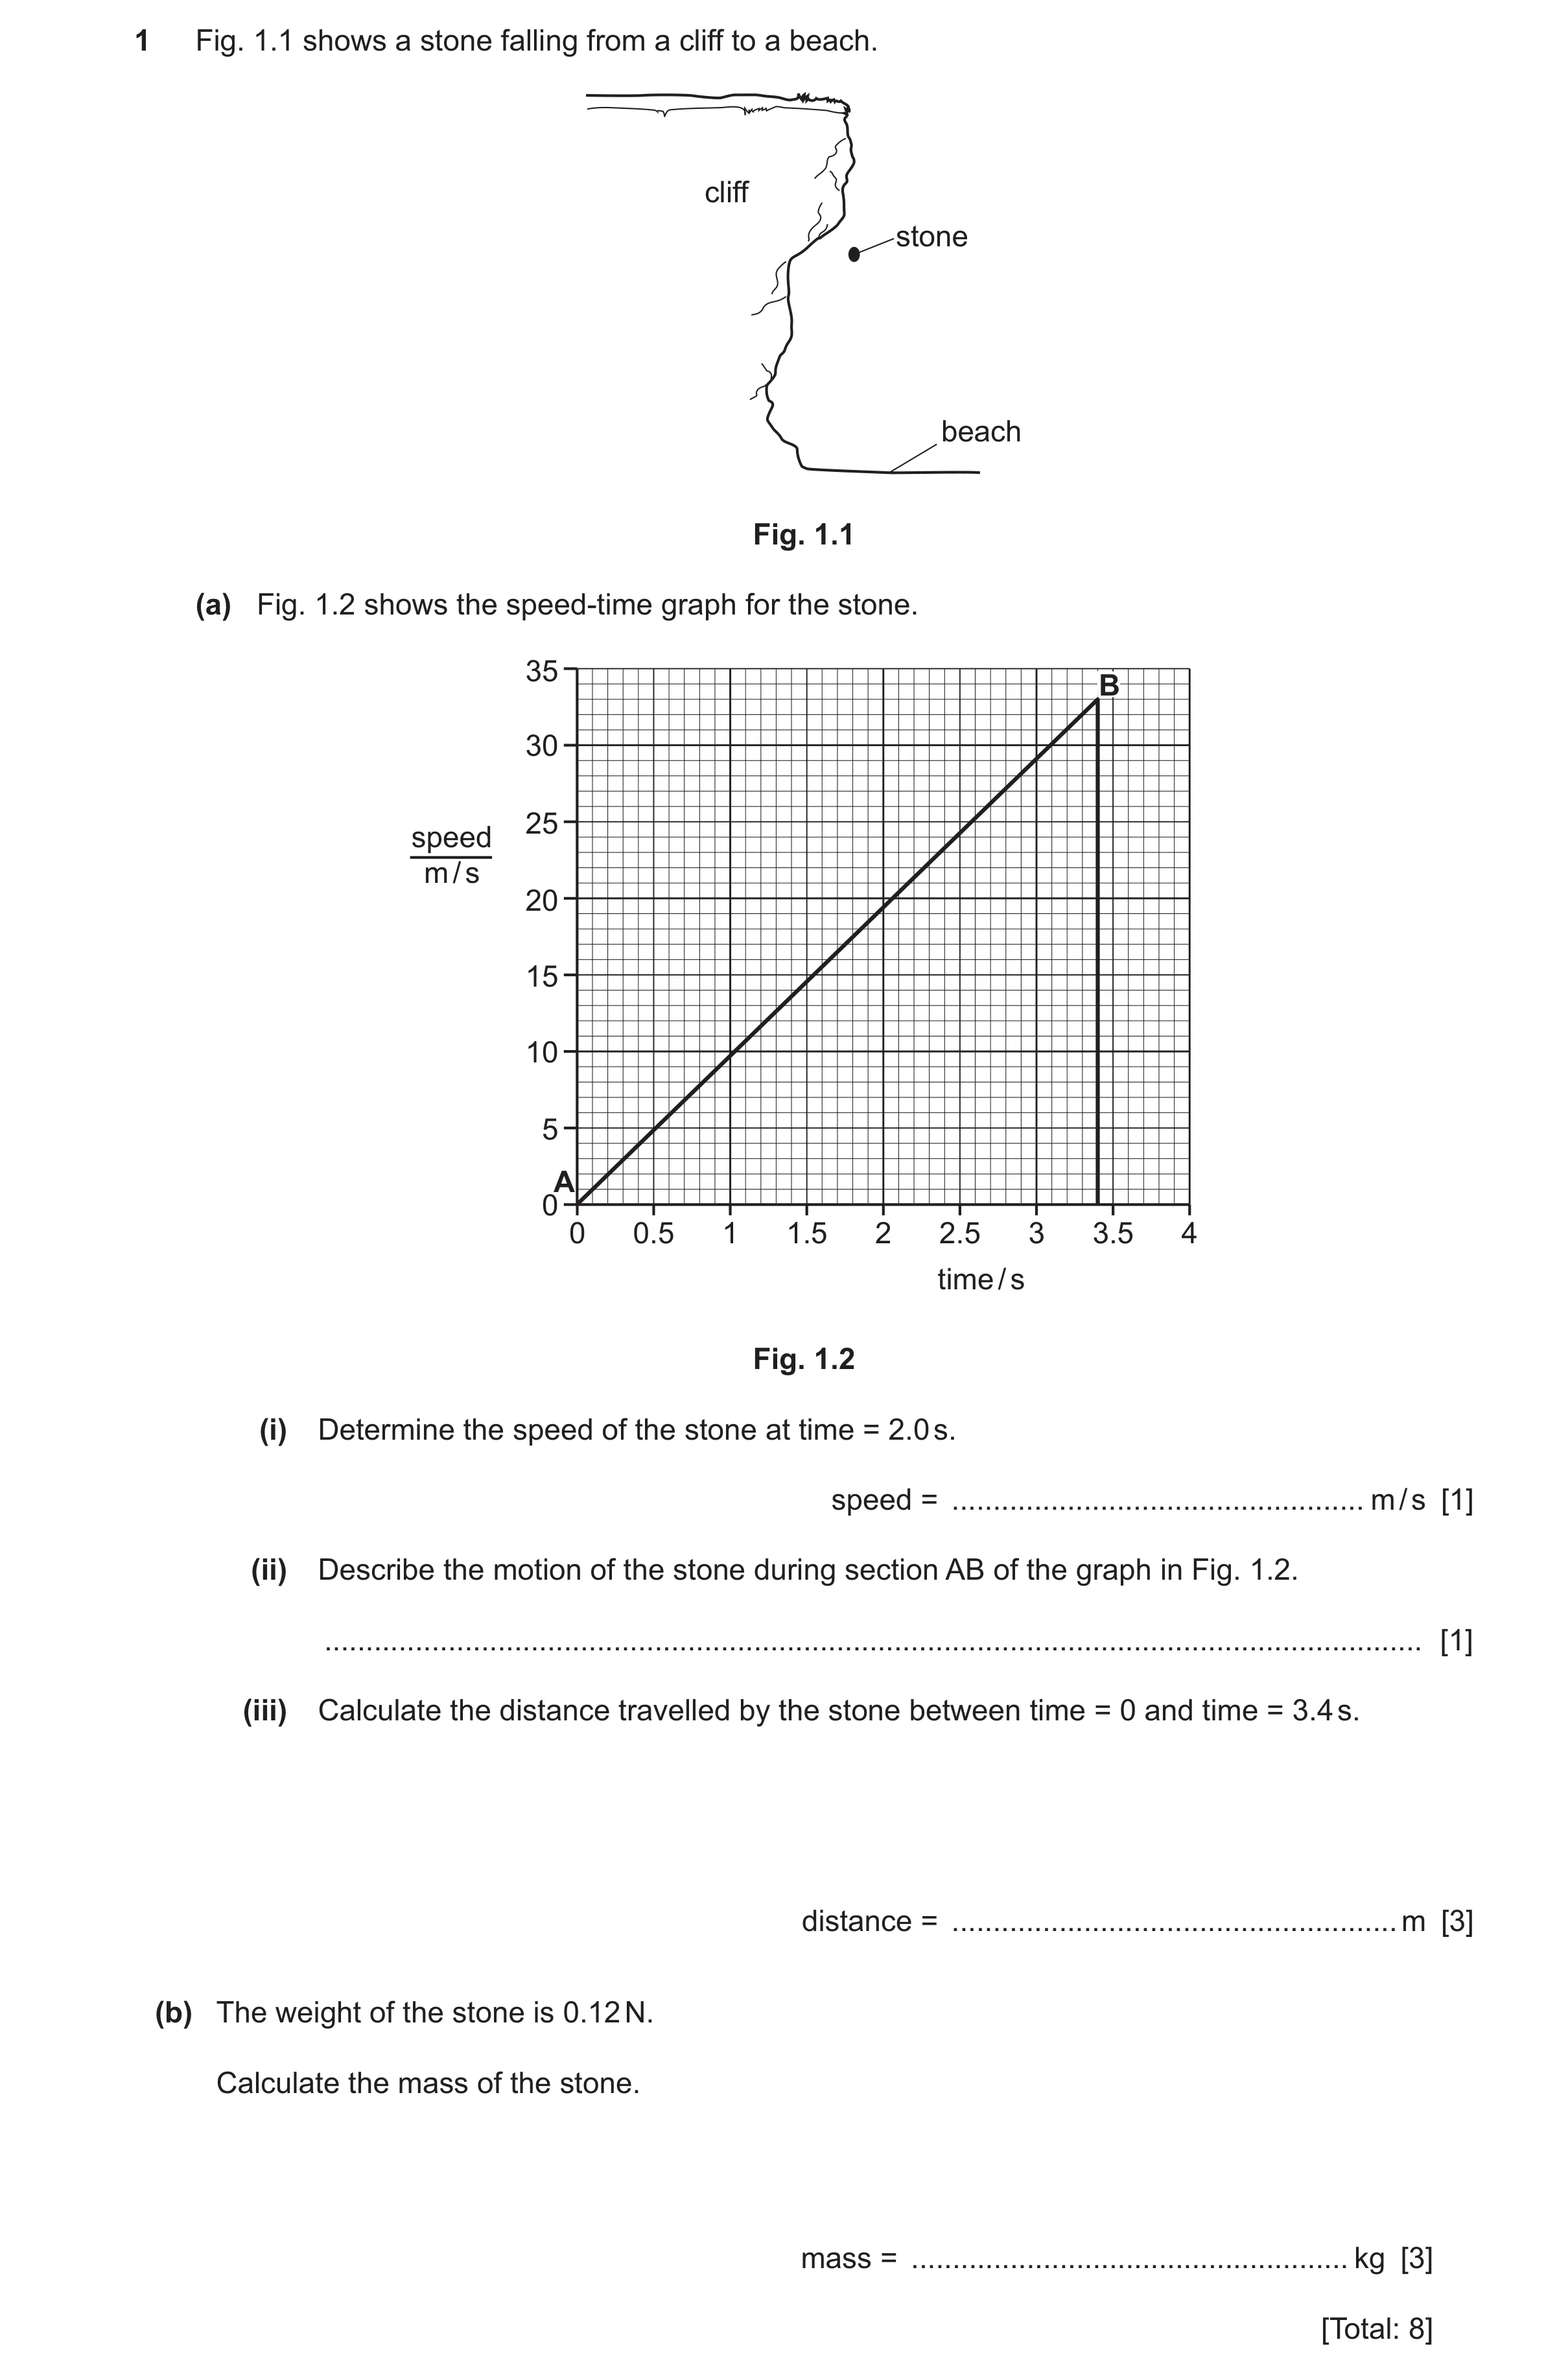
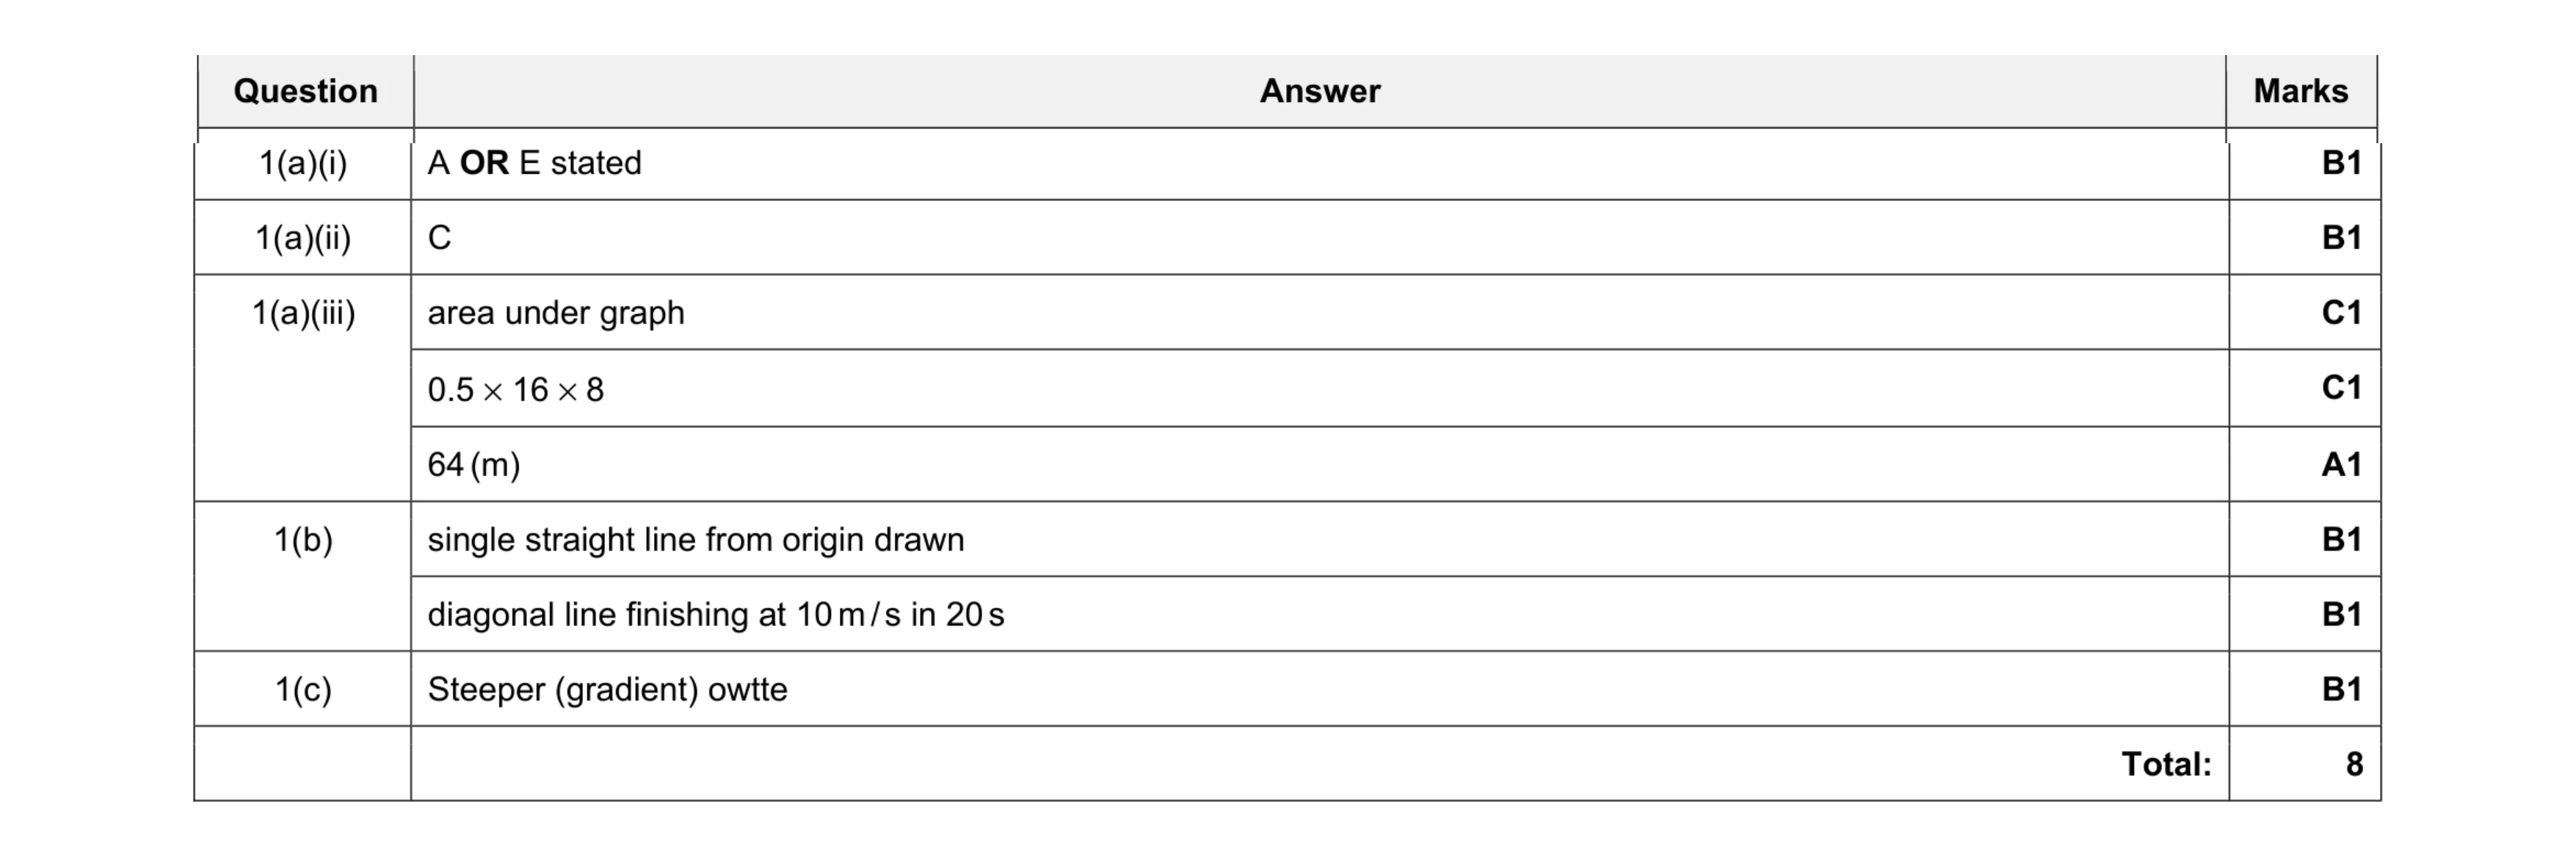 8
8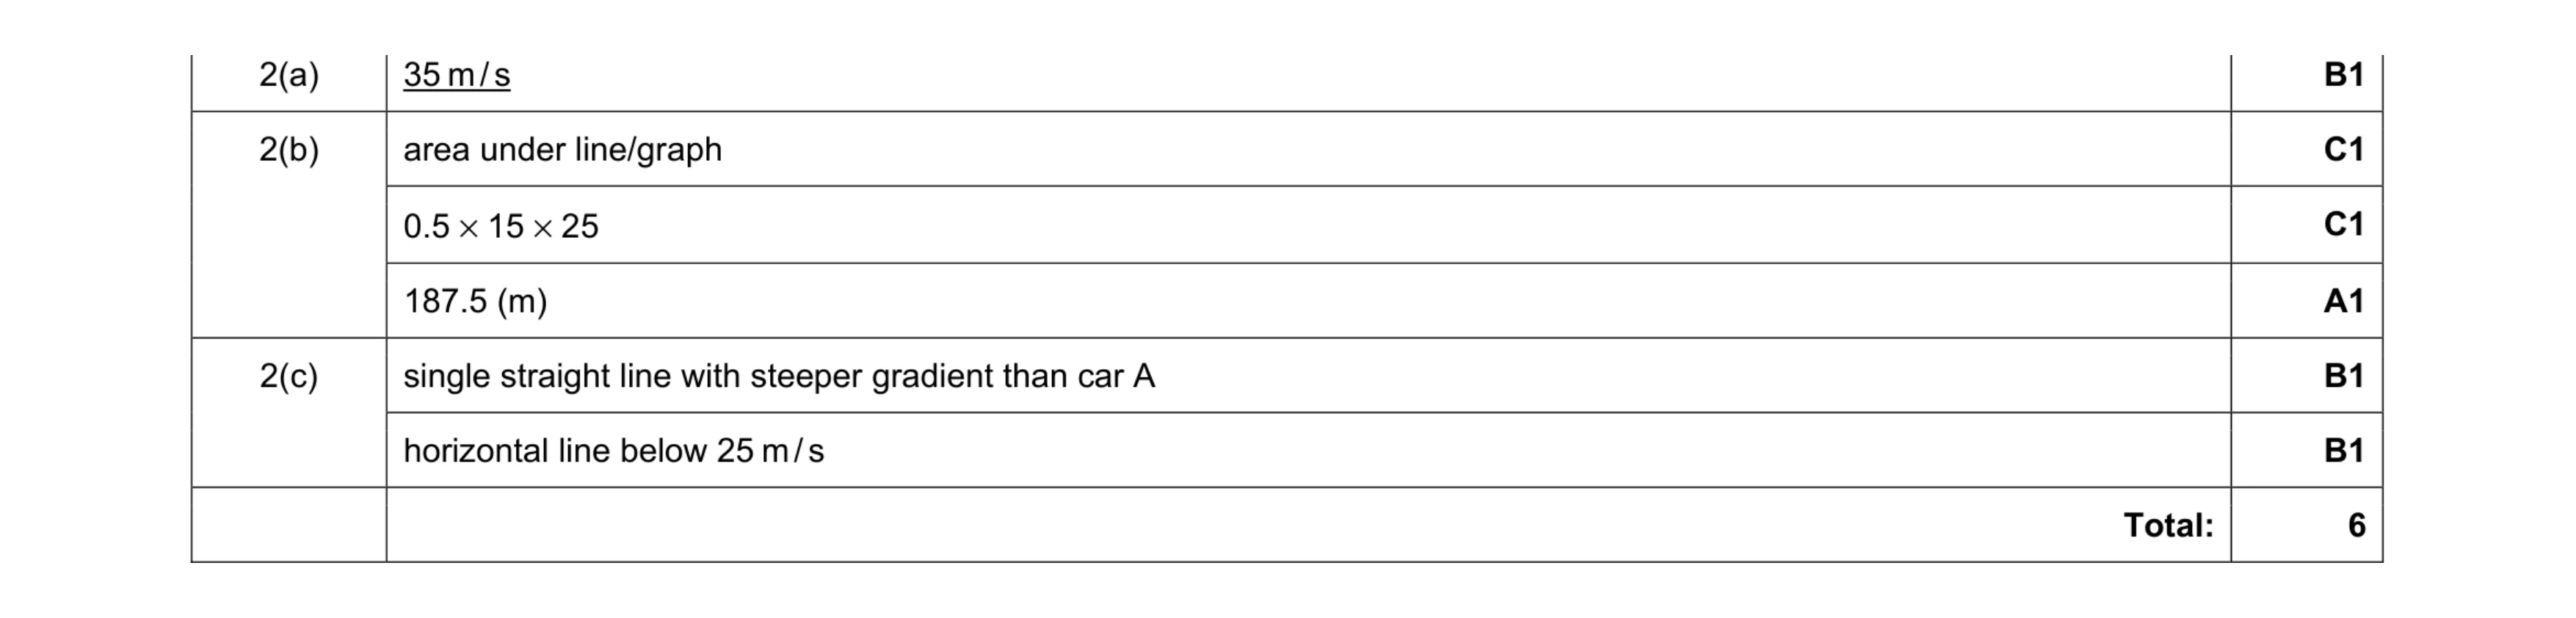 6
6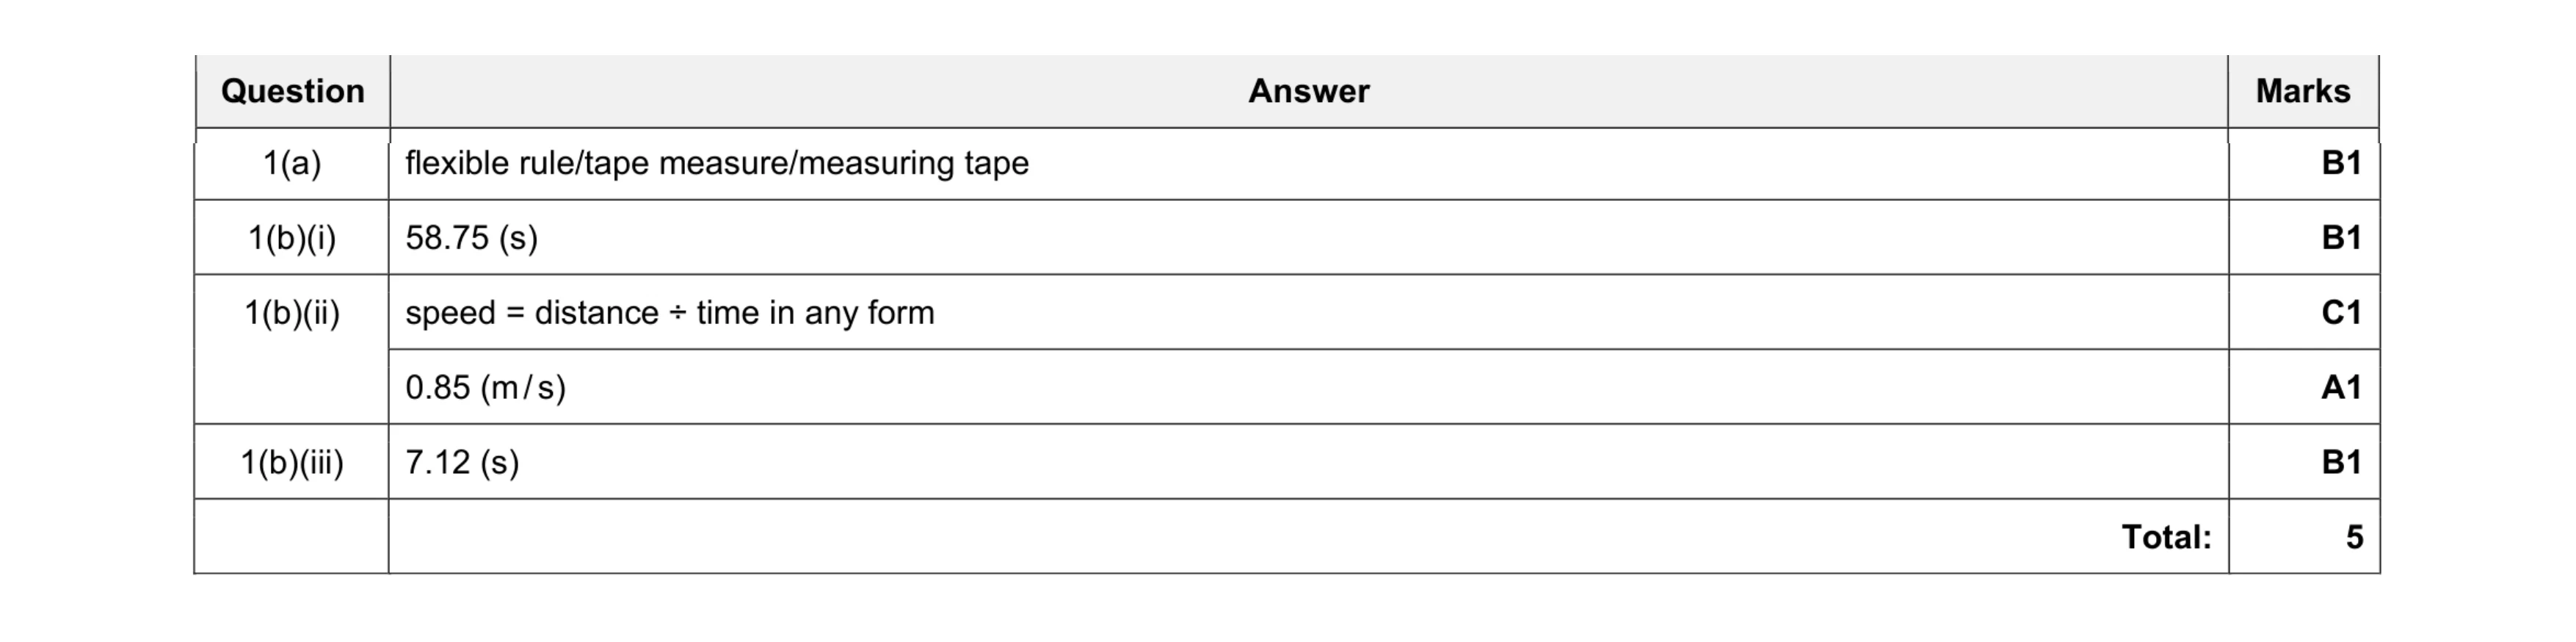 5
5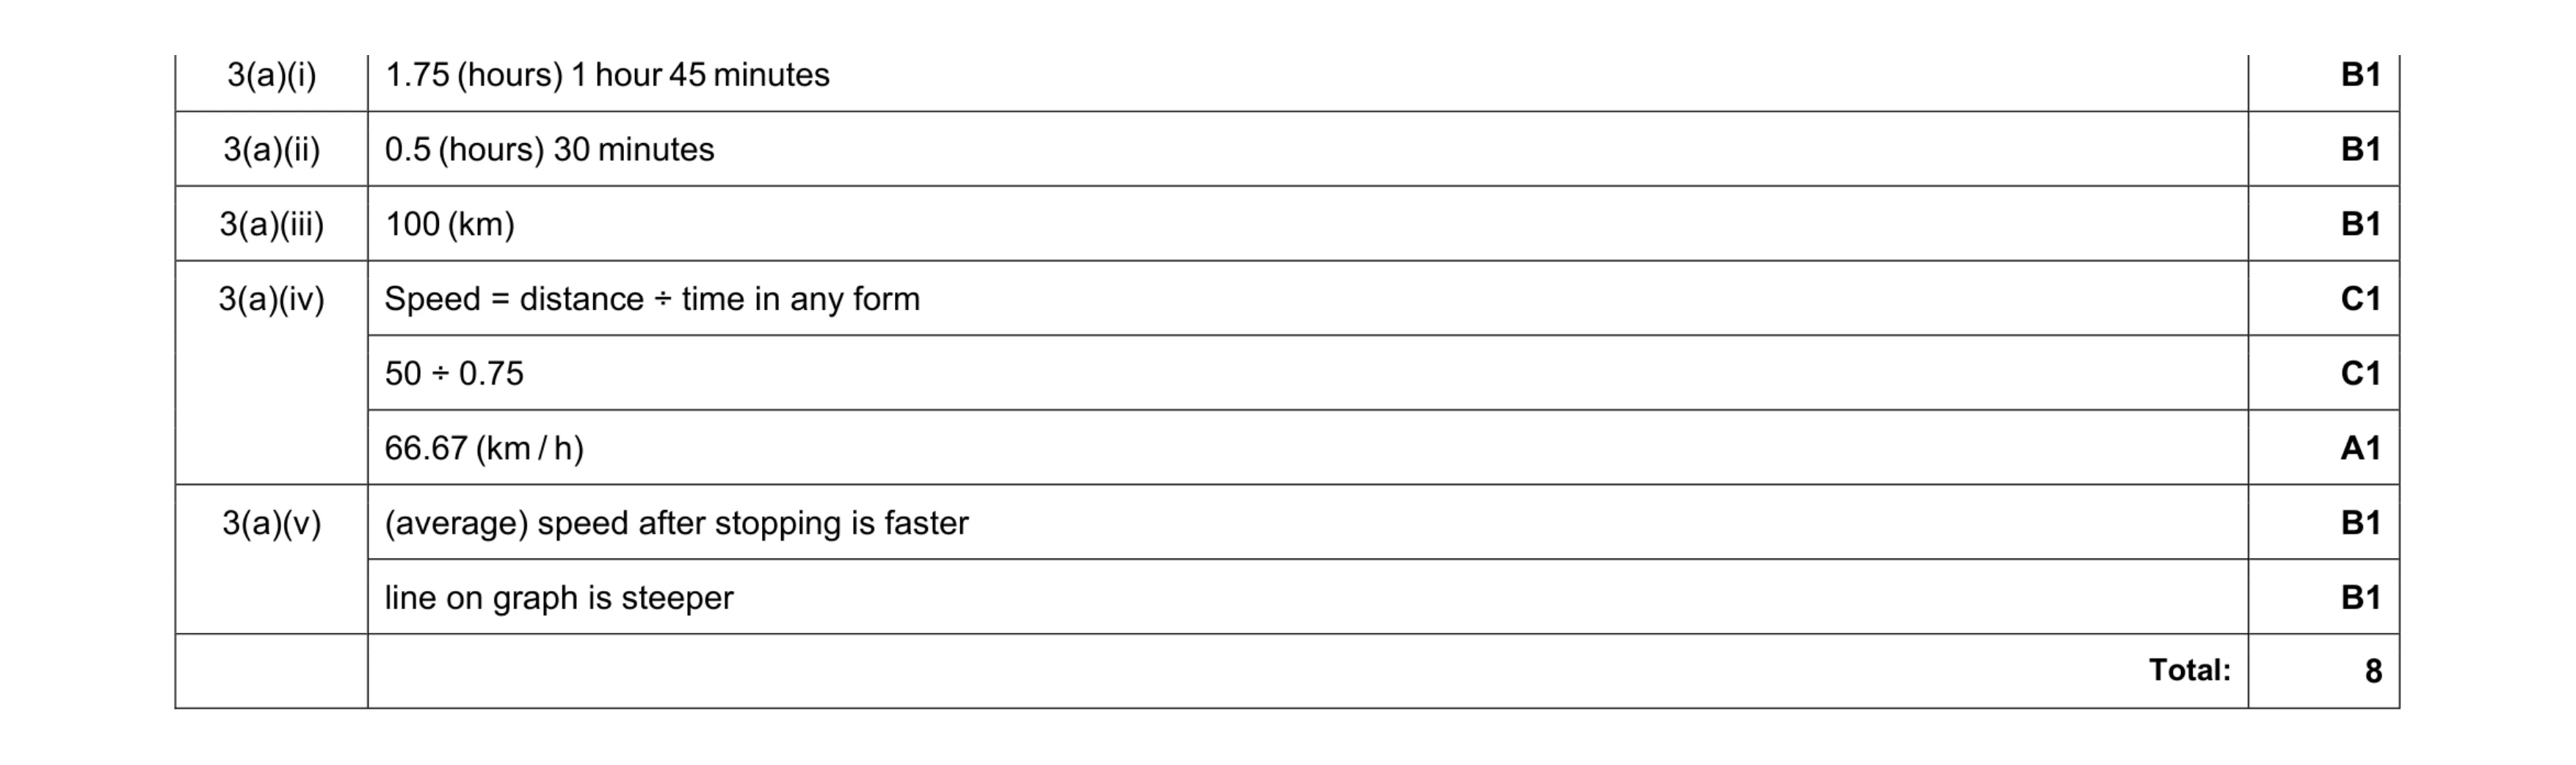 8
8 5
5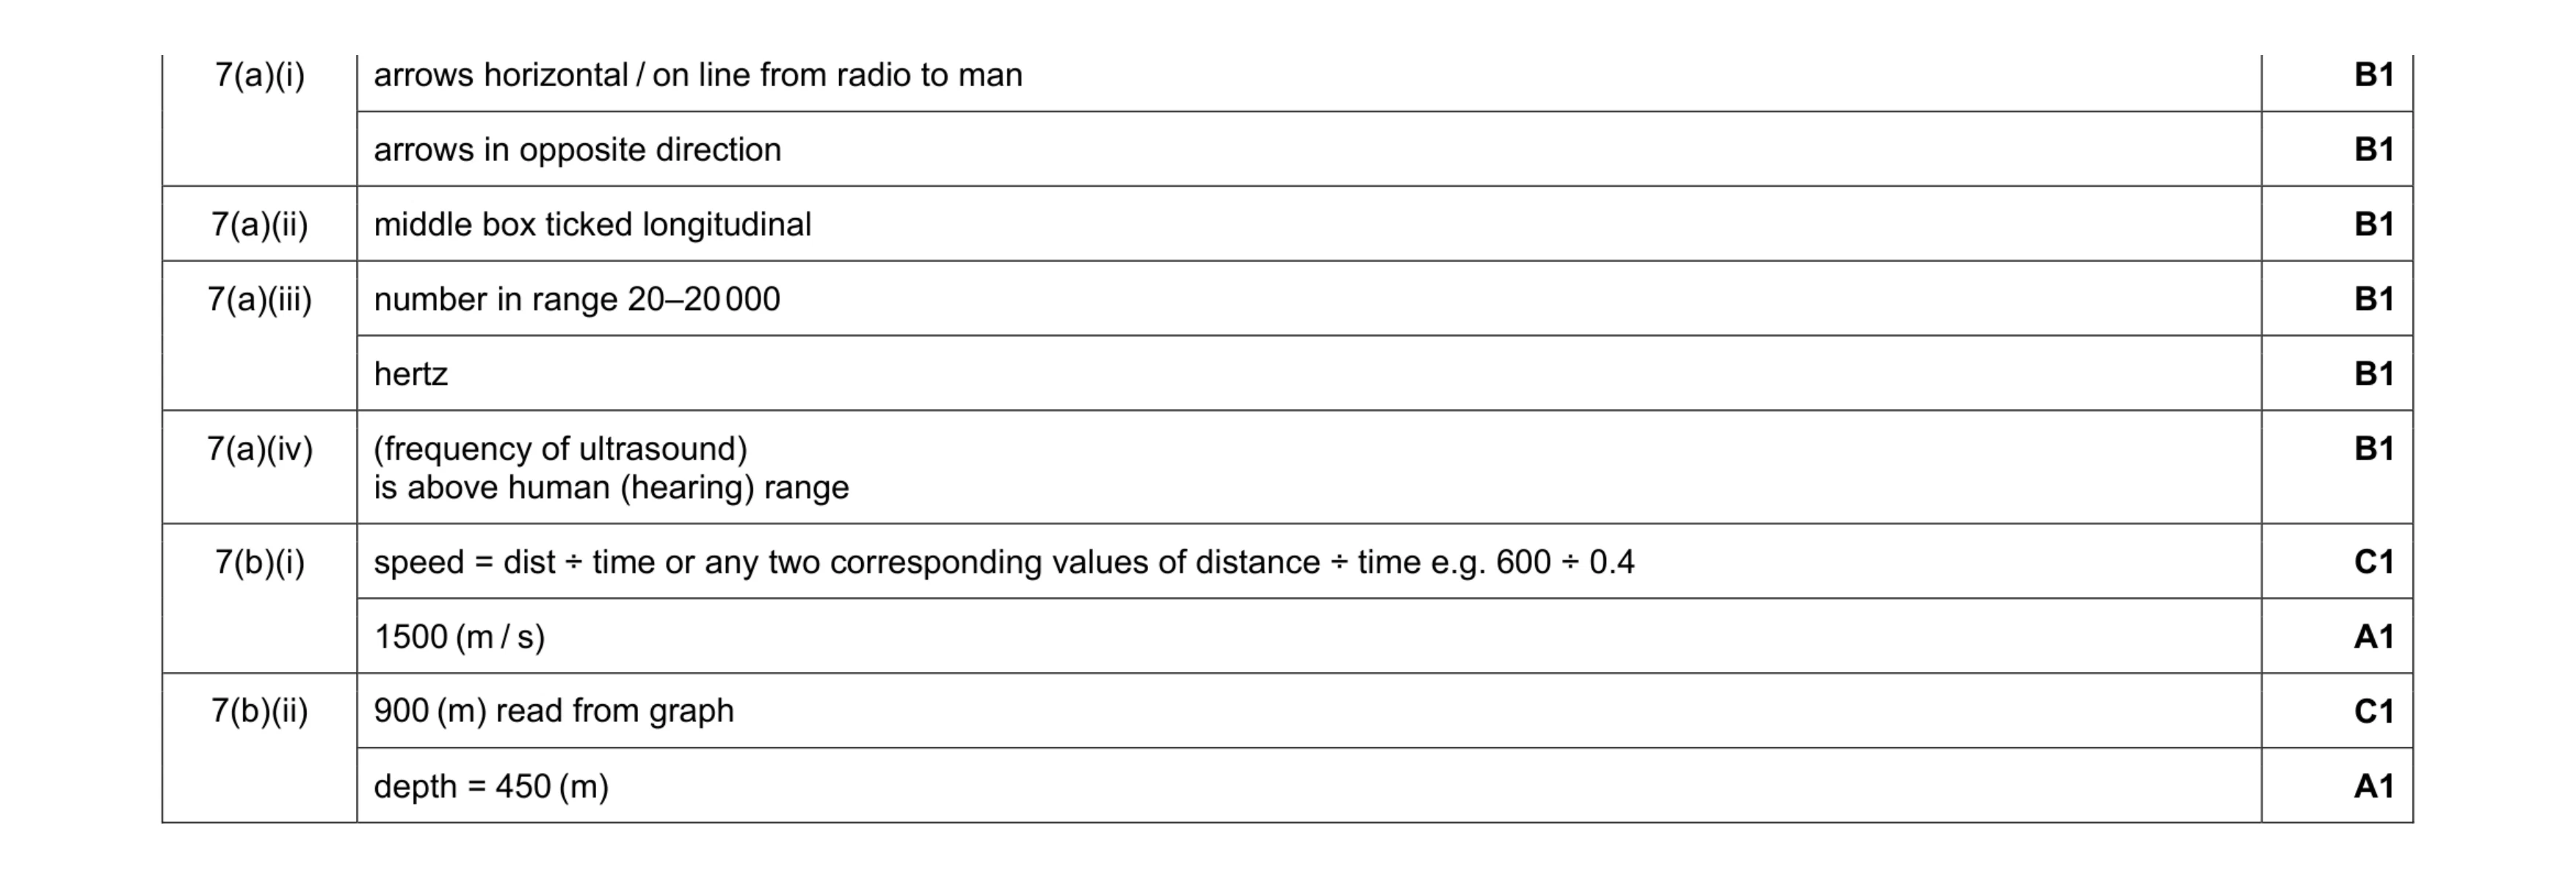 10
10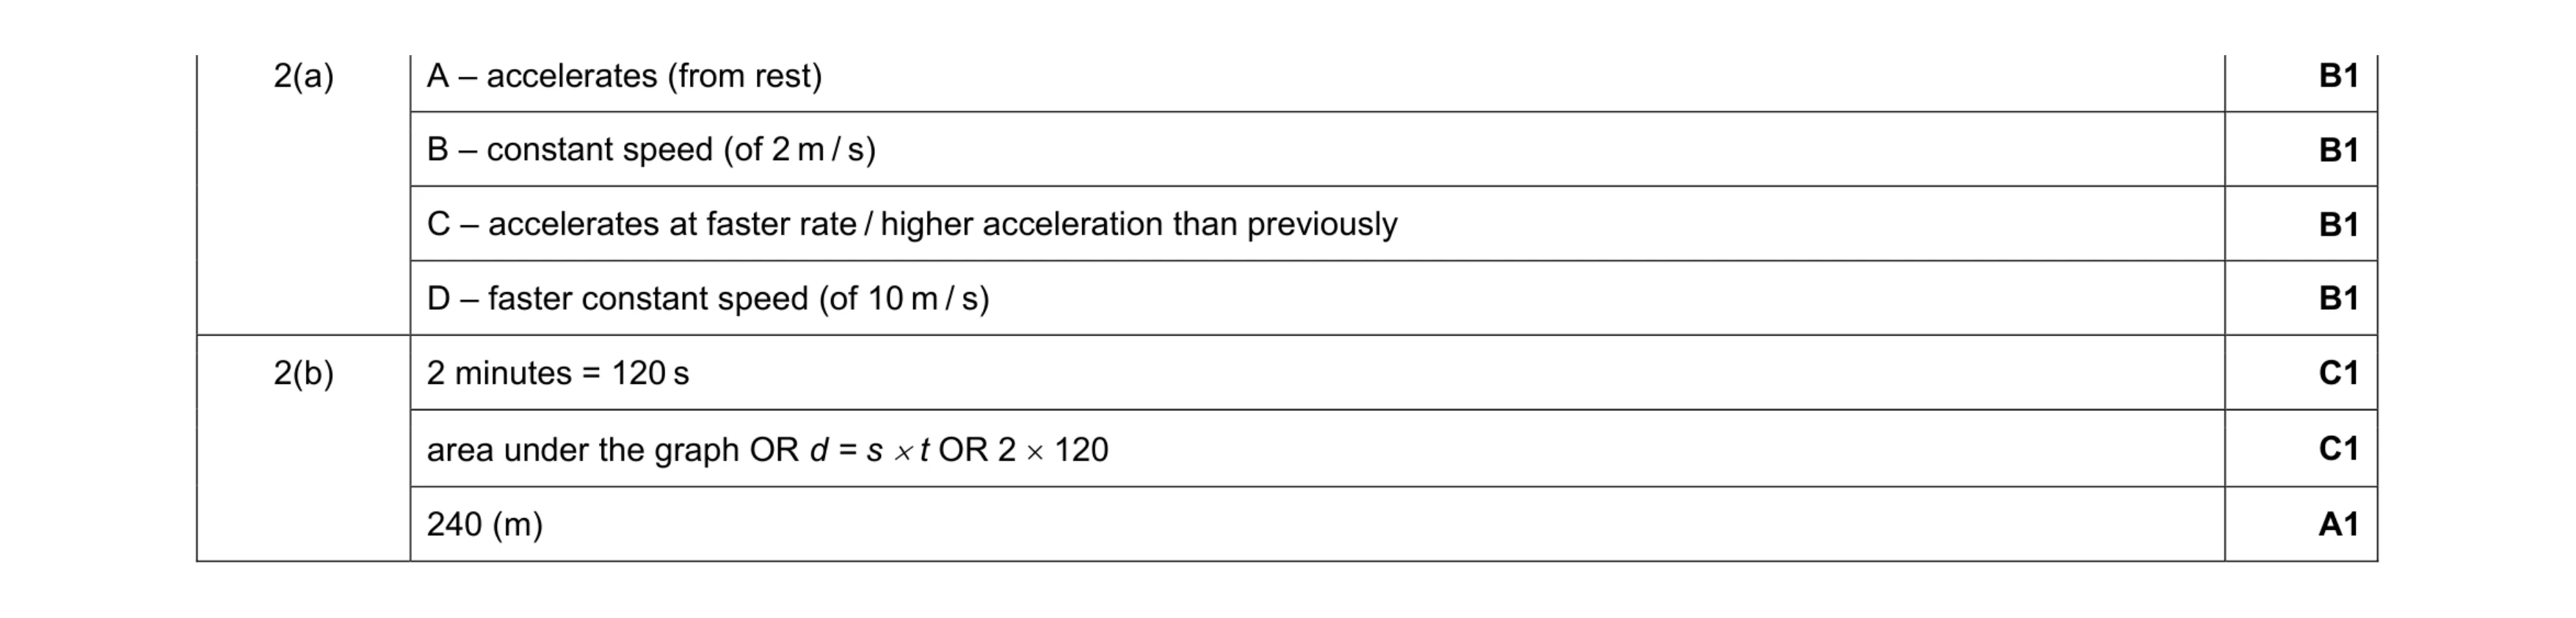 4
4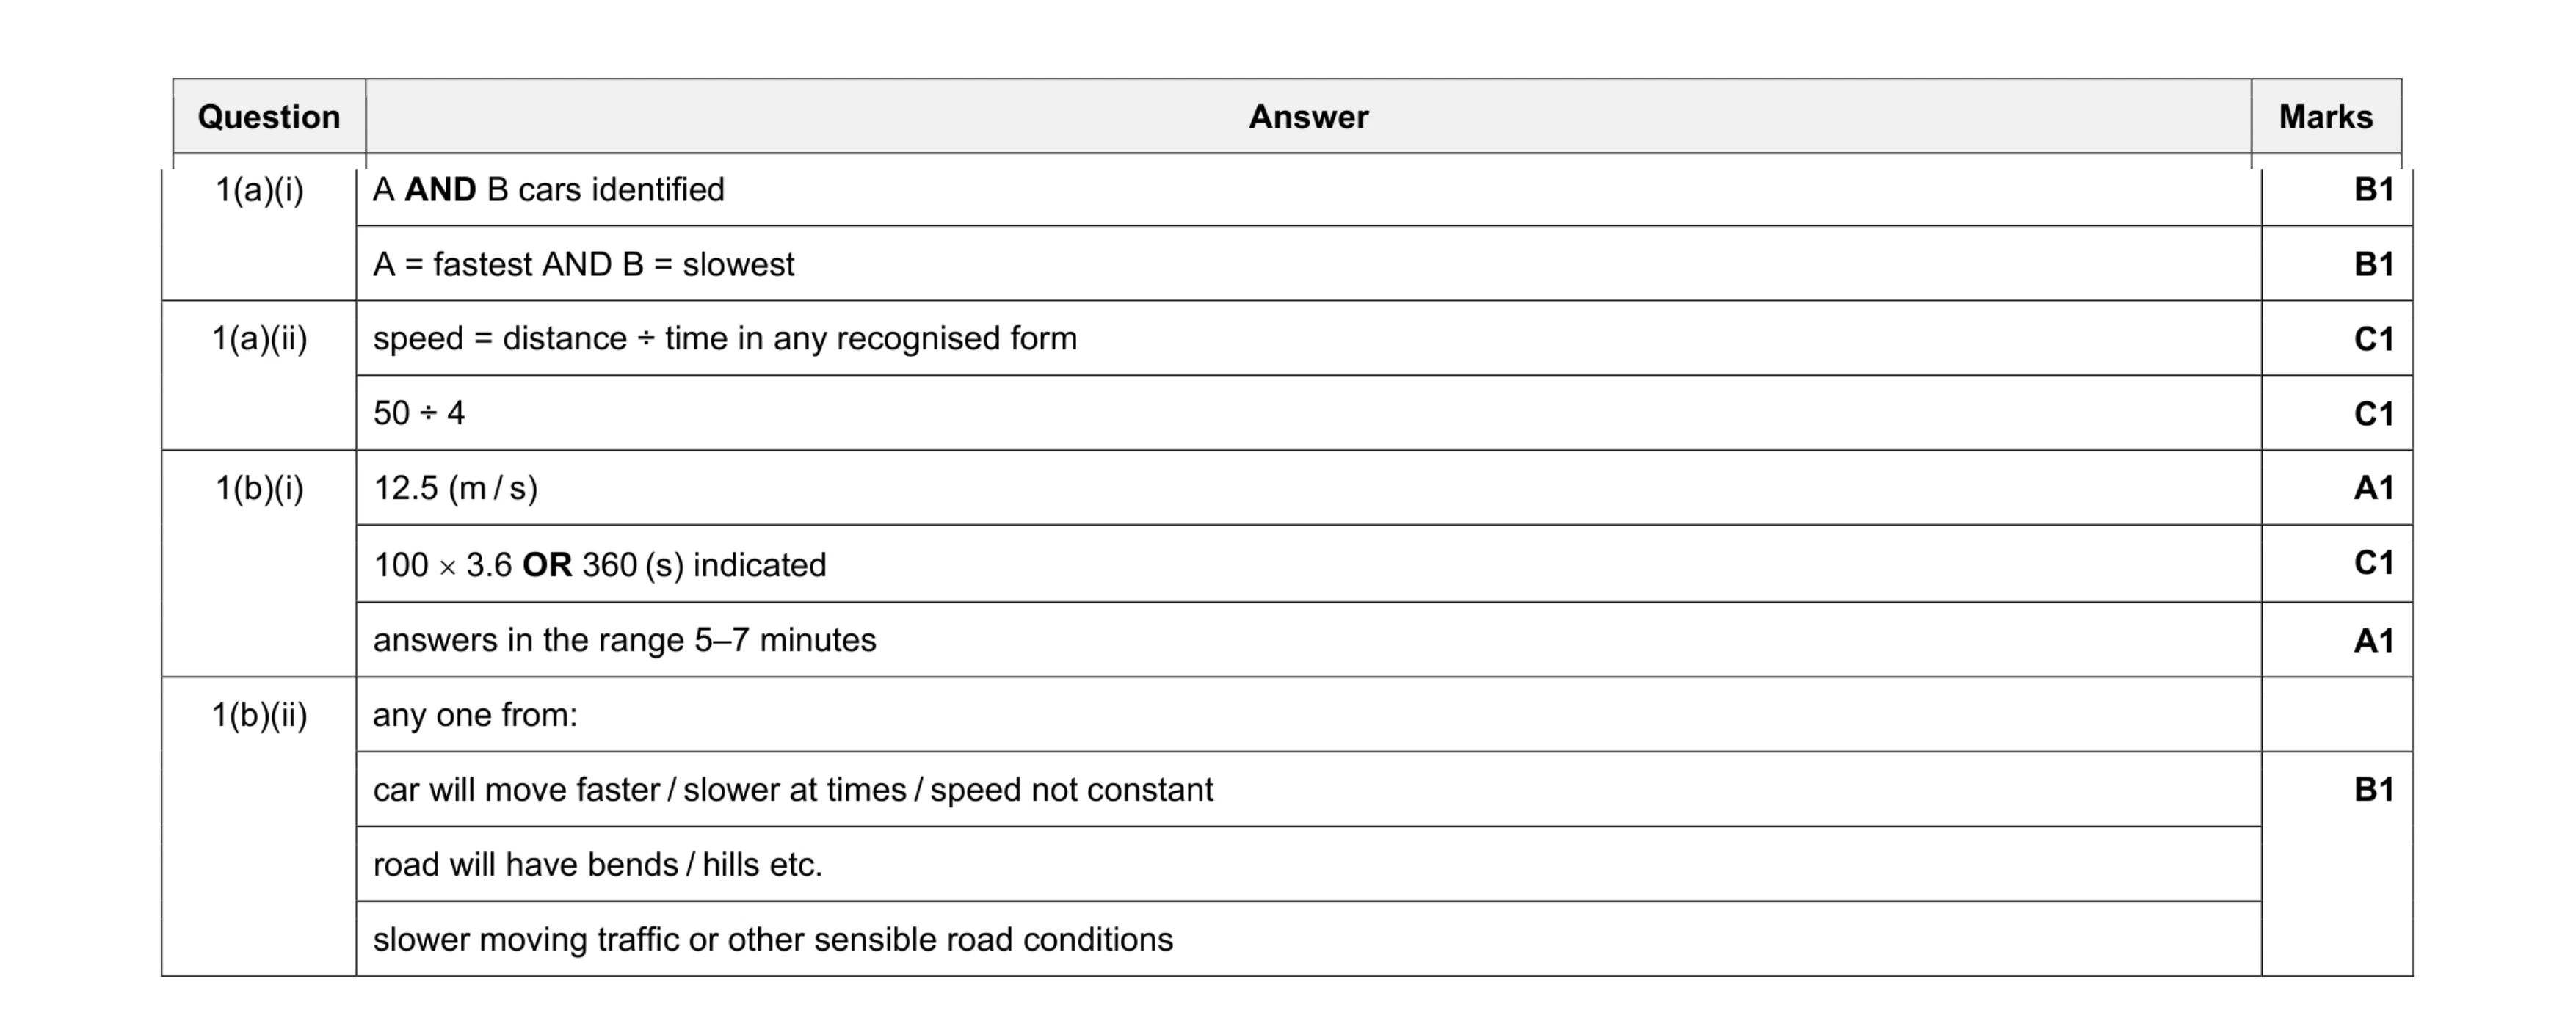 8
8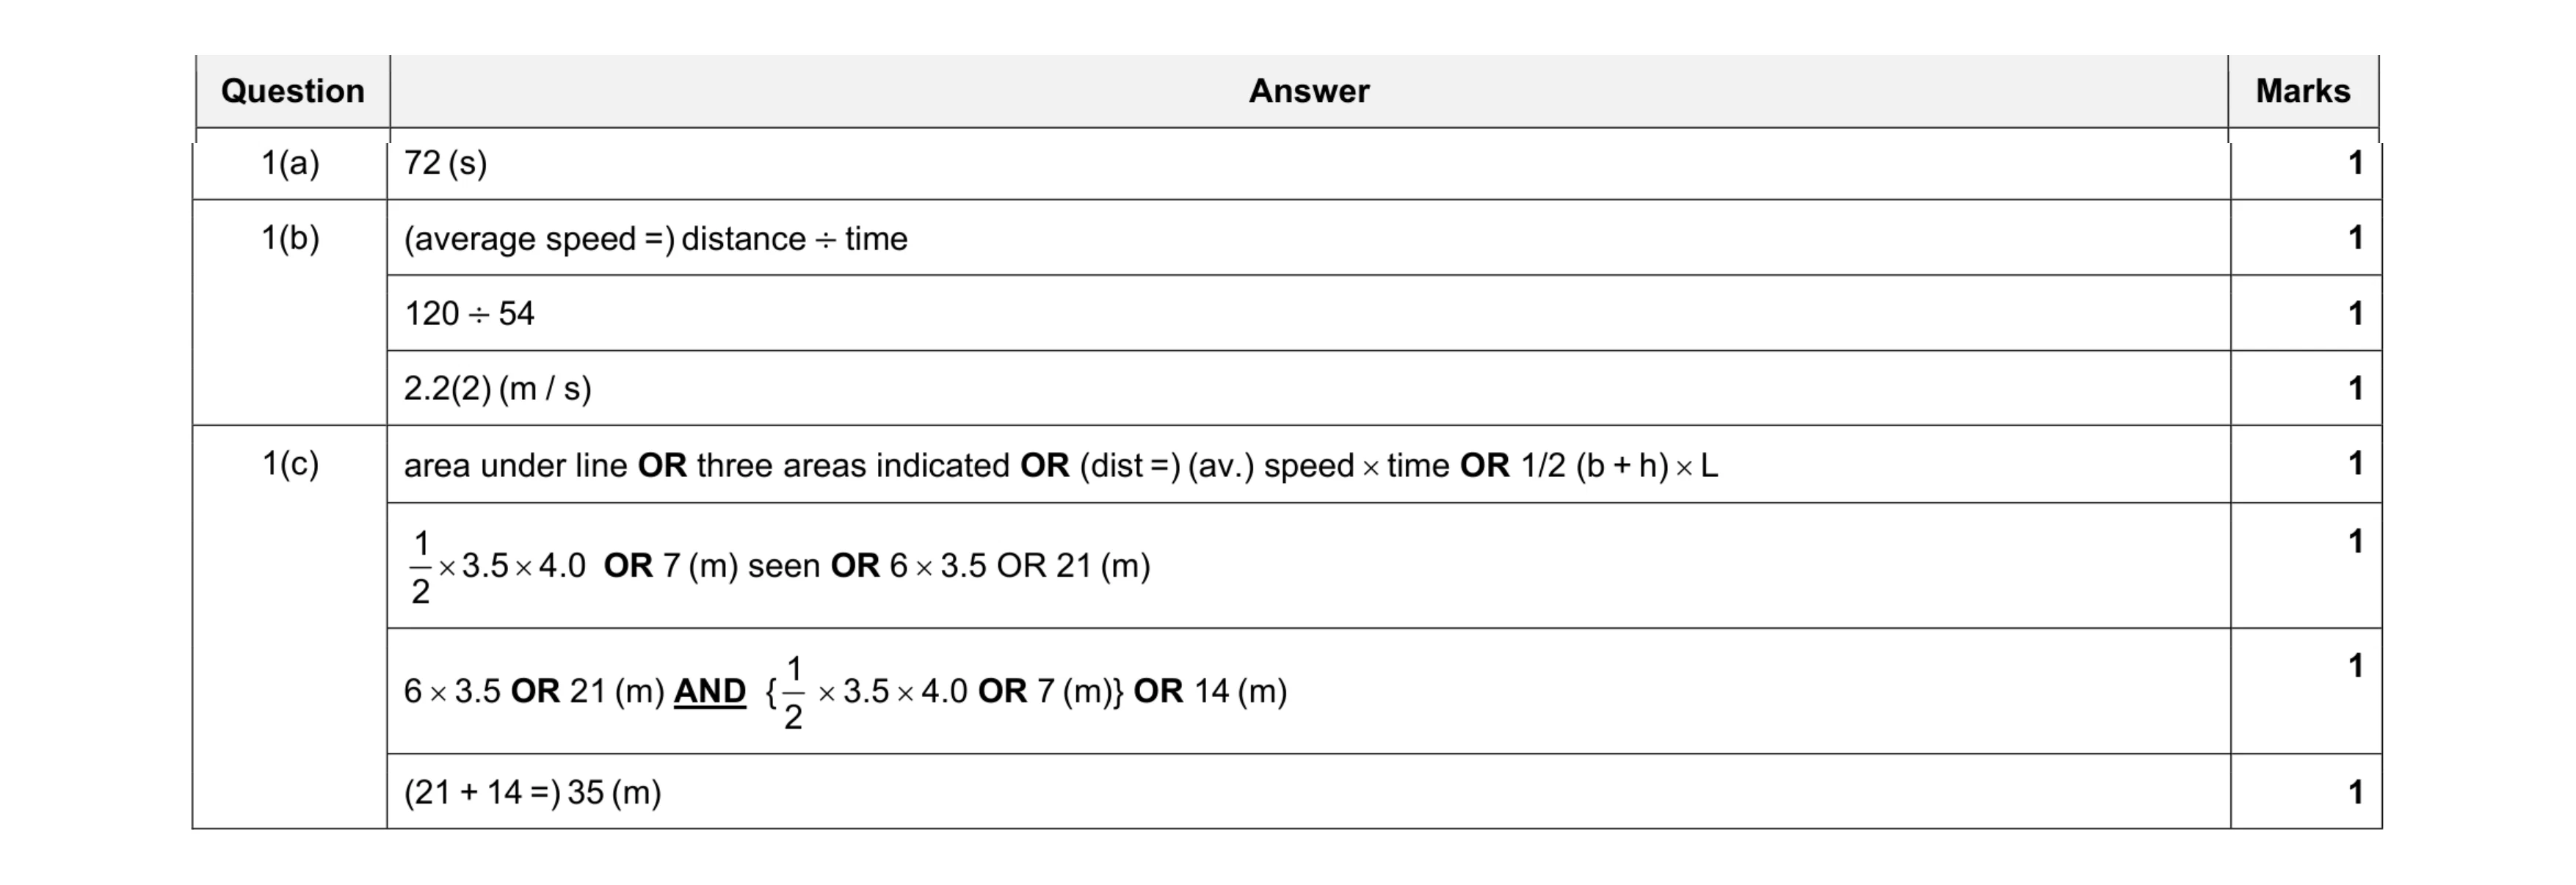 8
8 4
4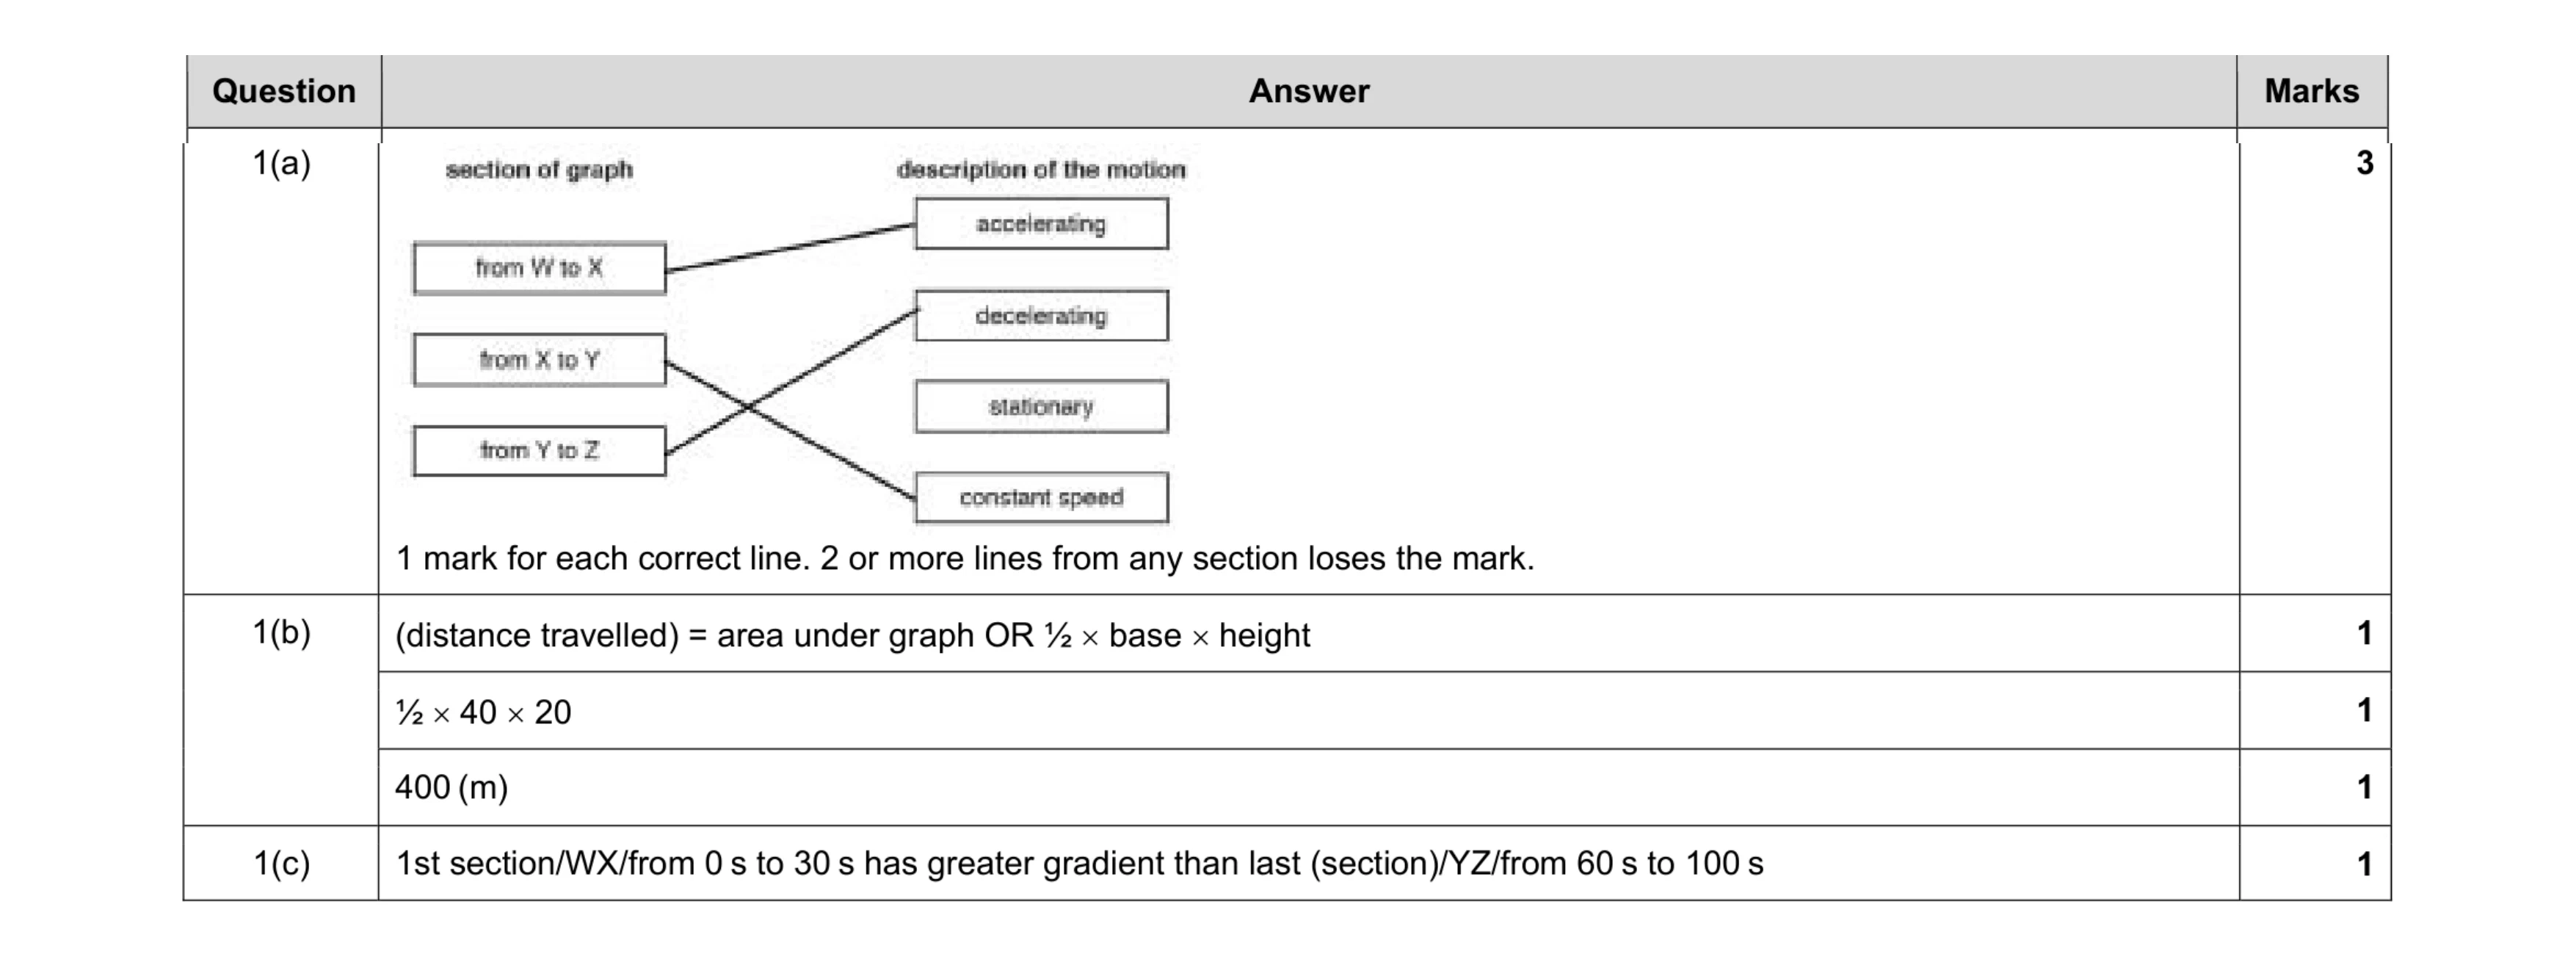 7
7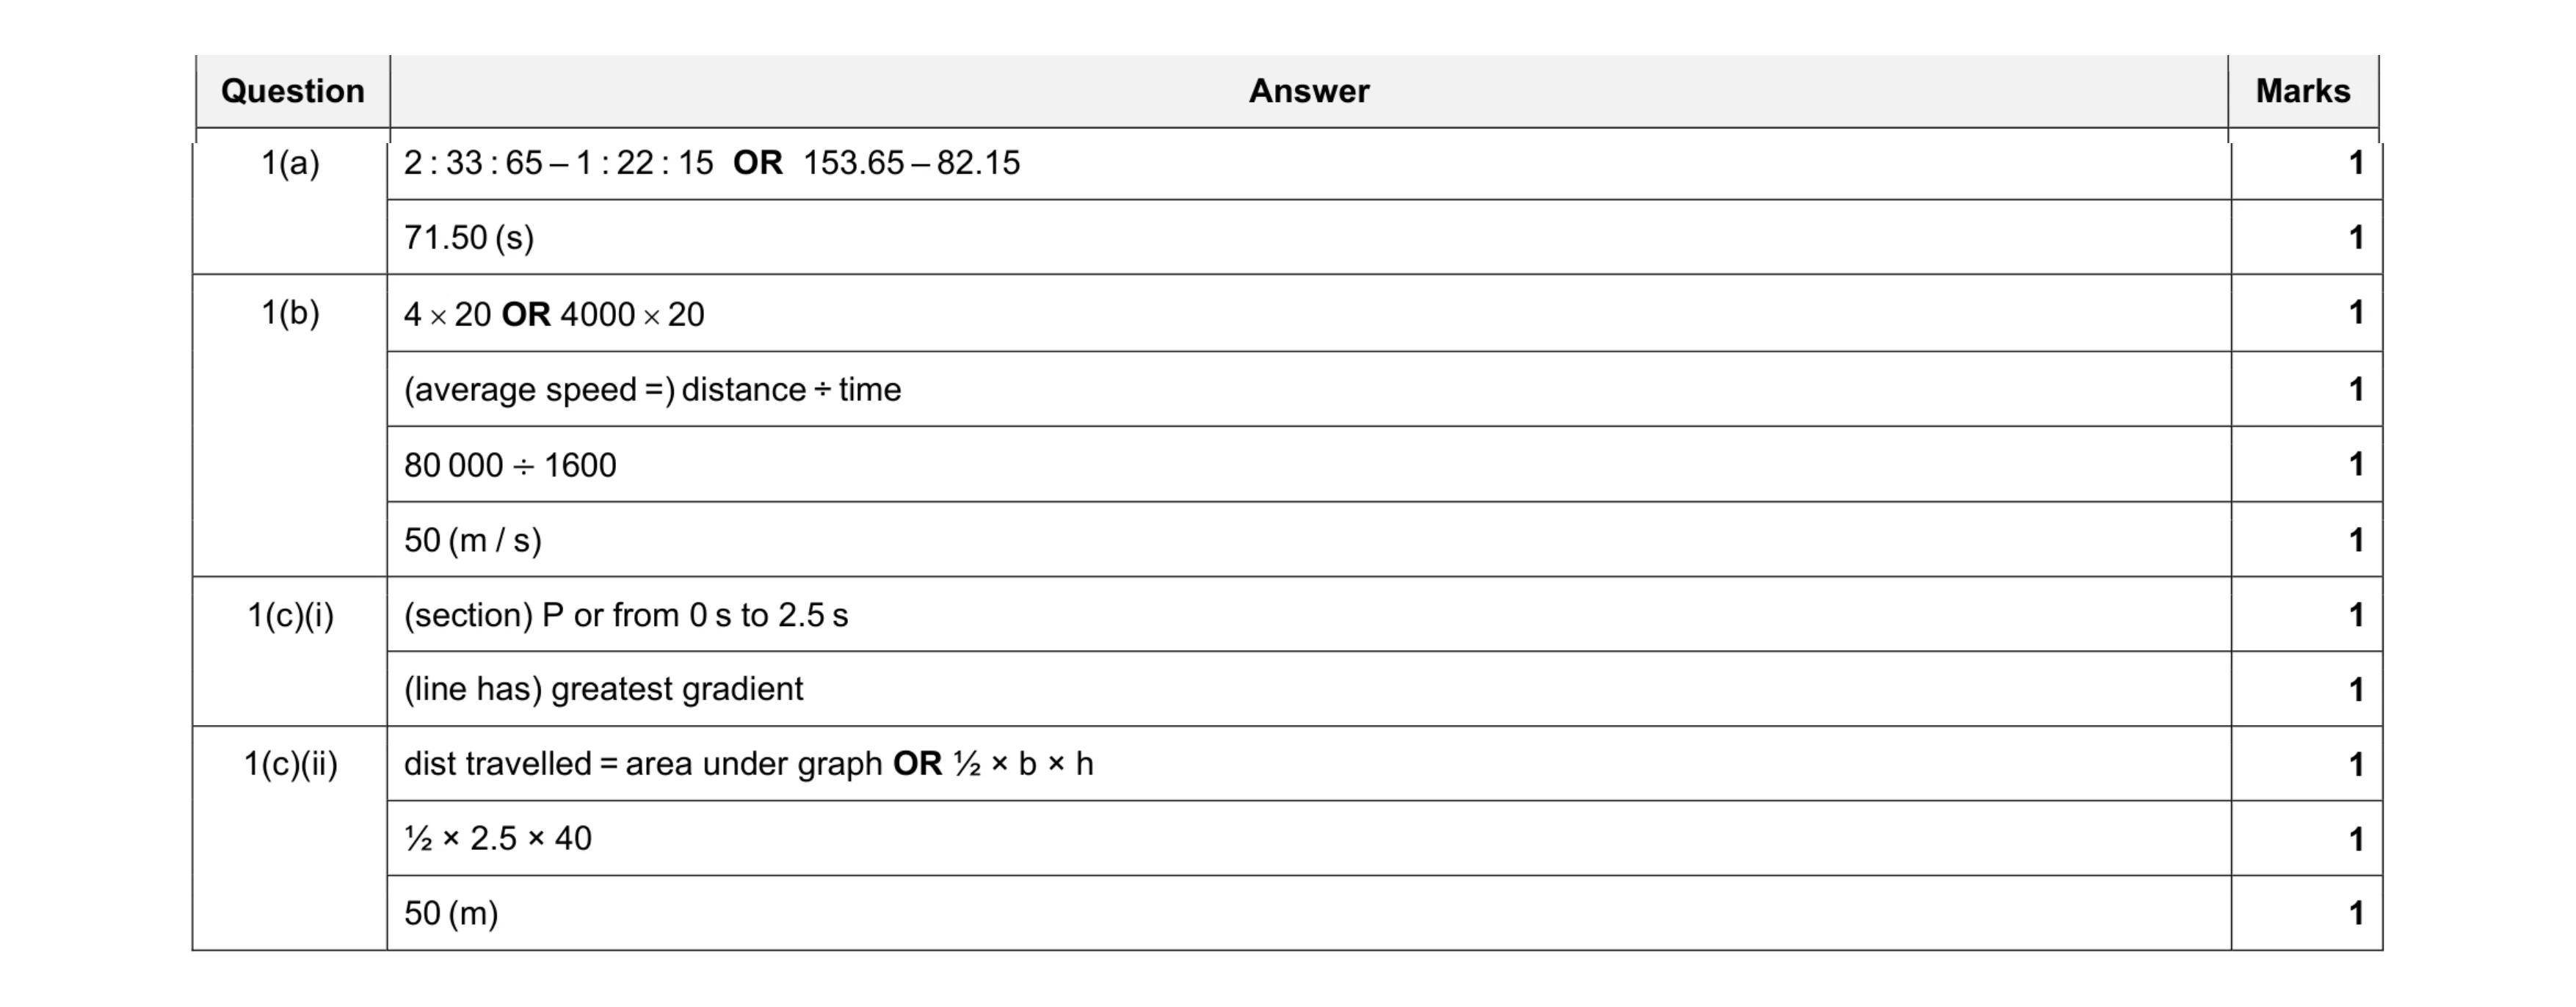 11
11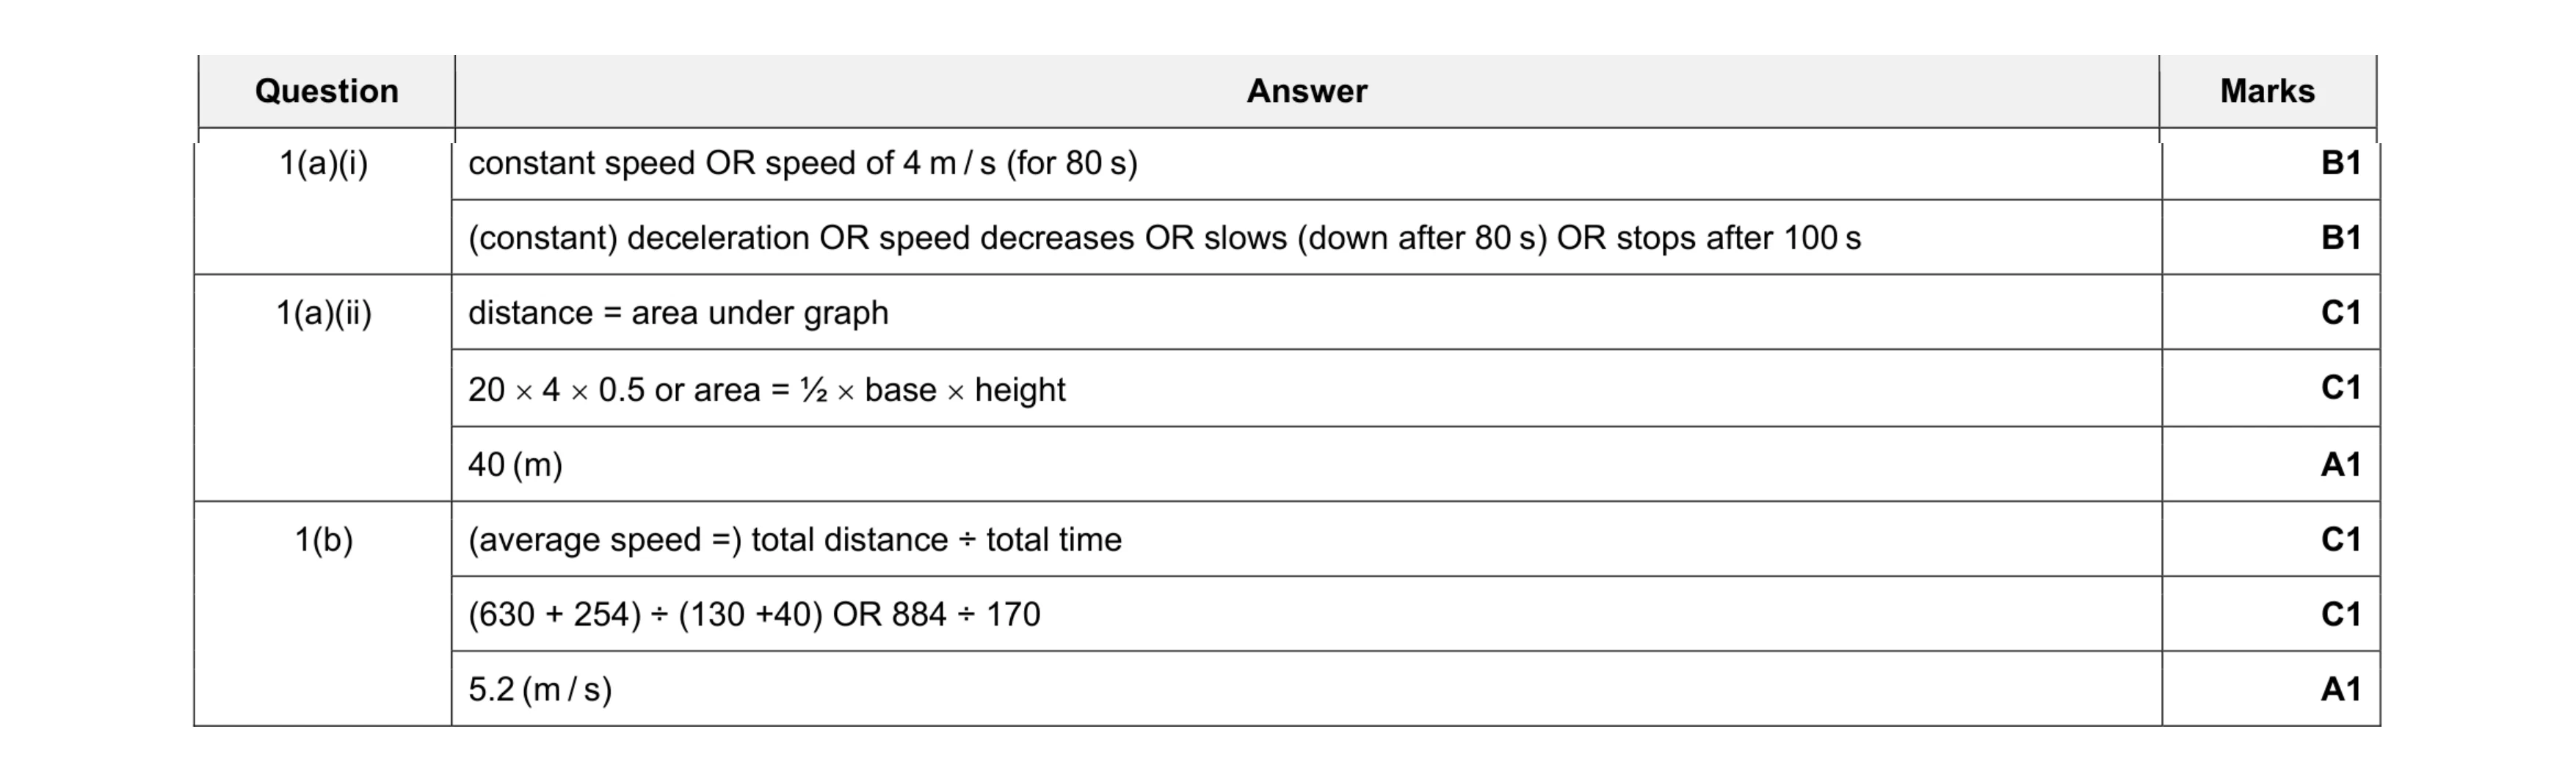 8
8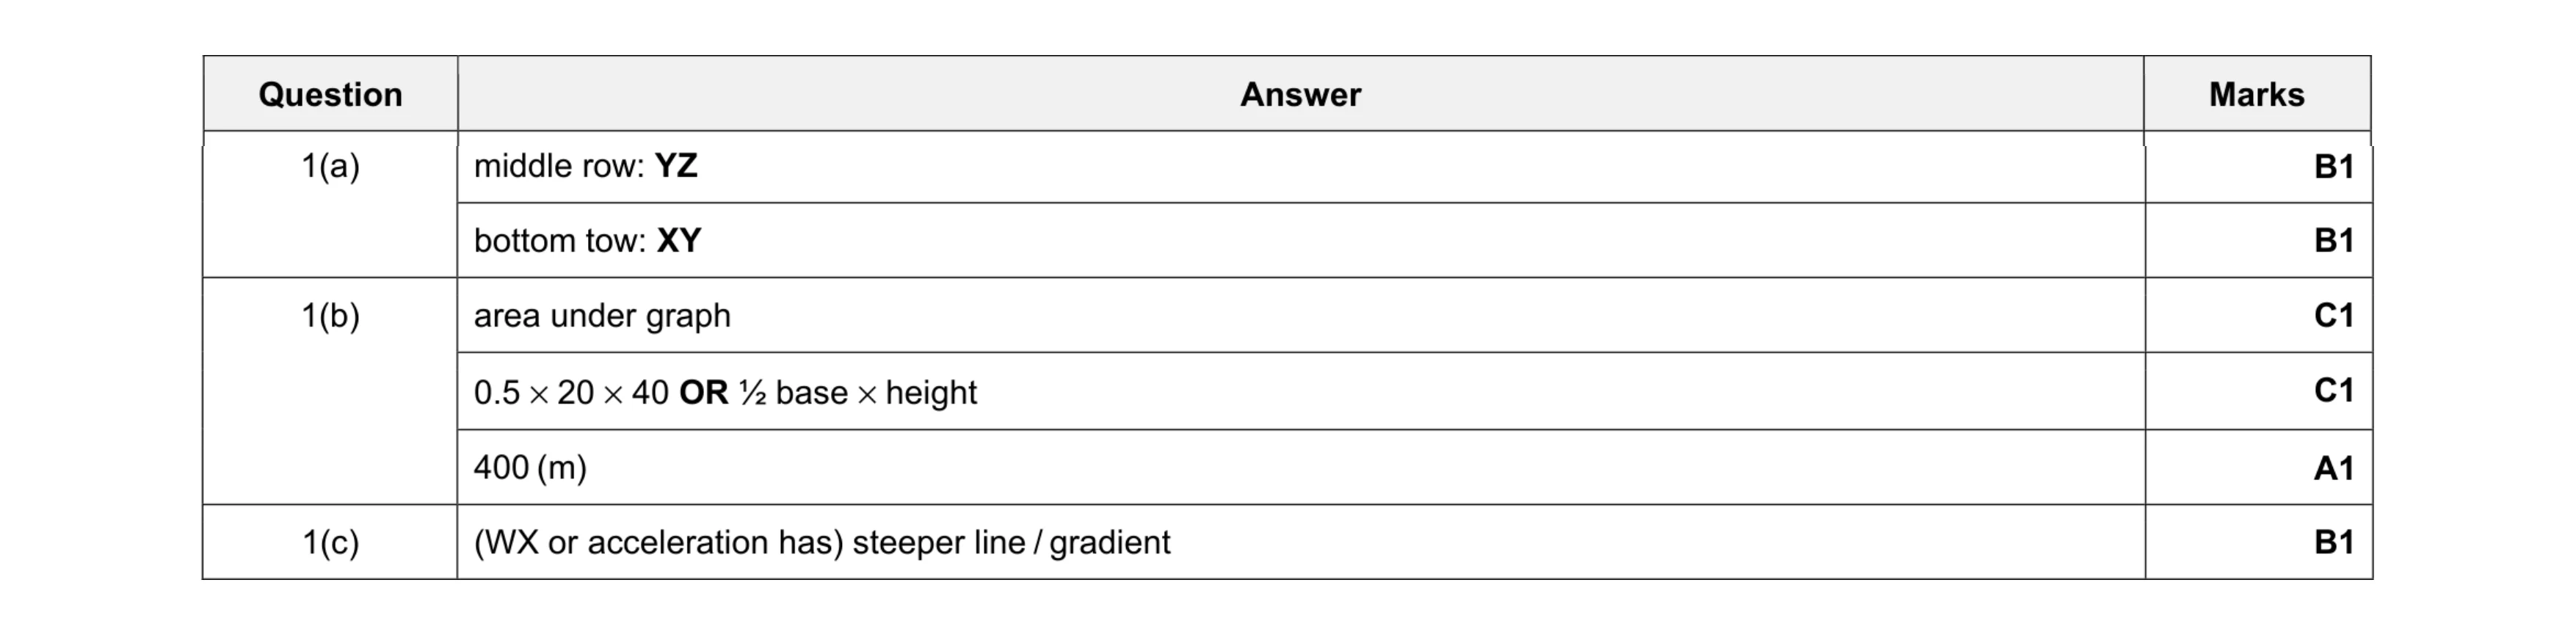 6
6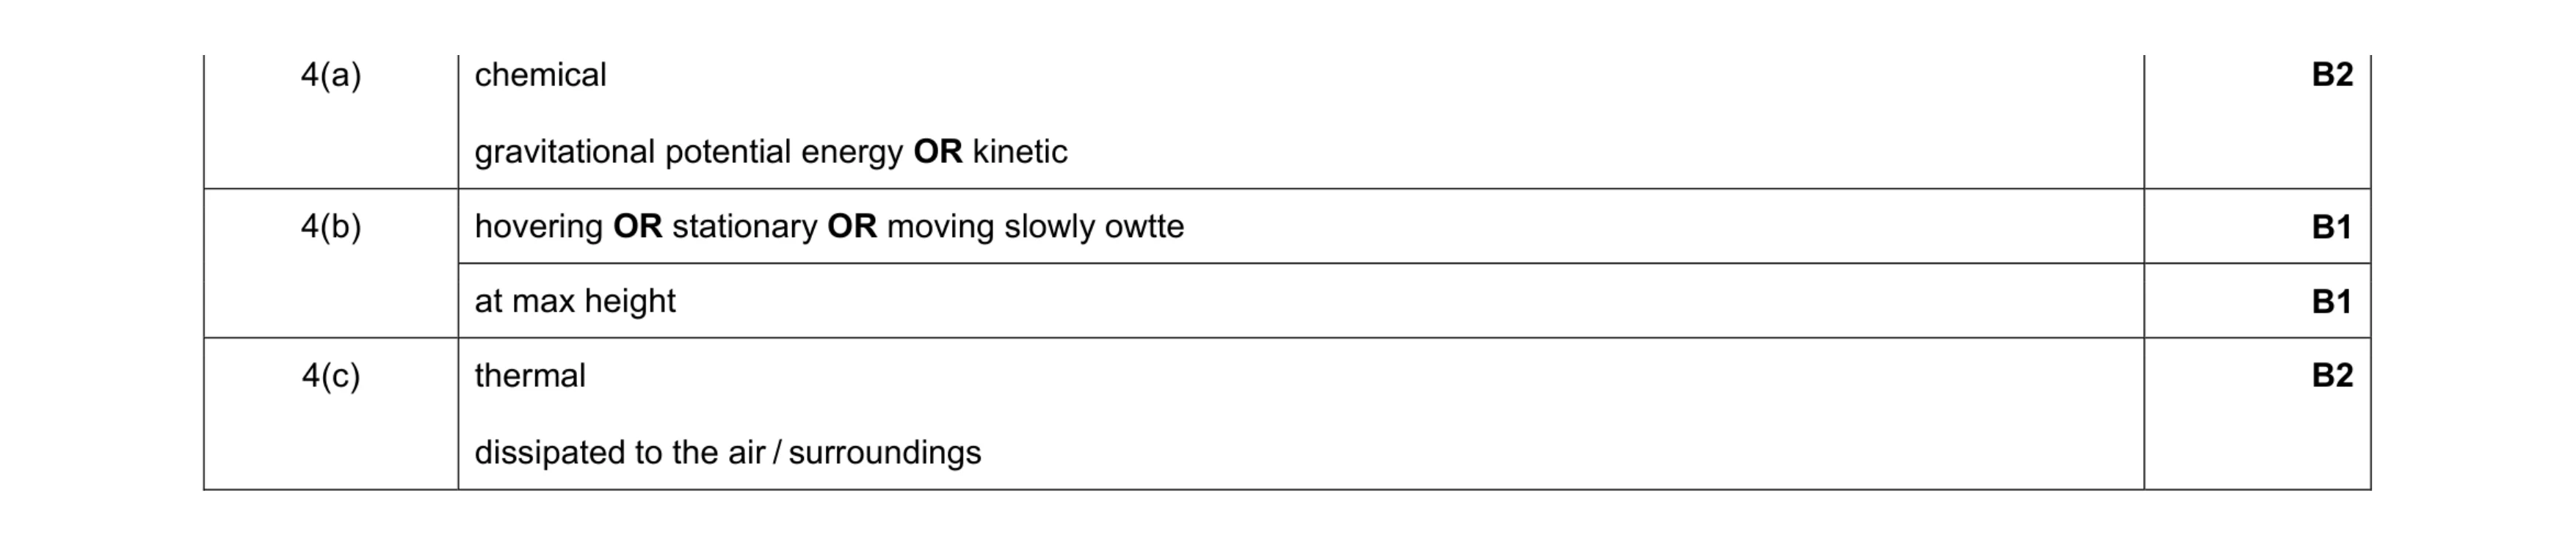 6
6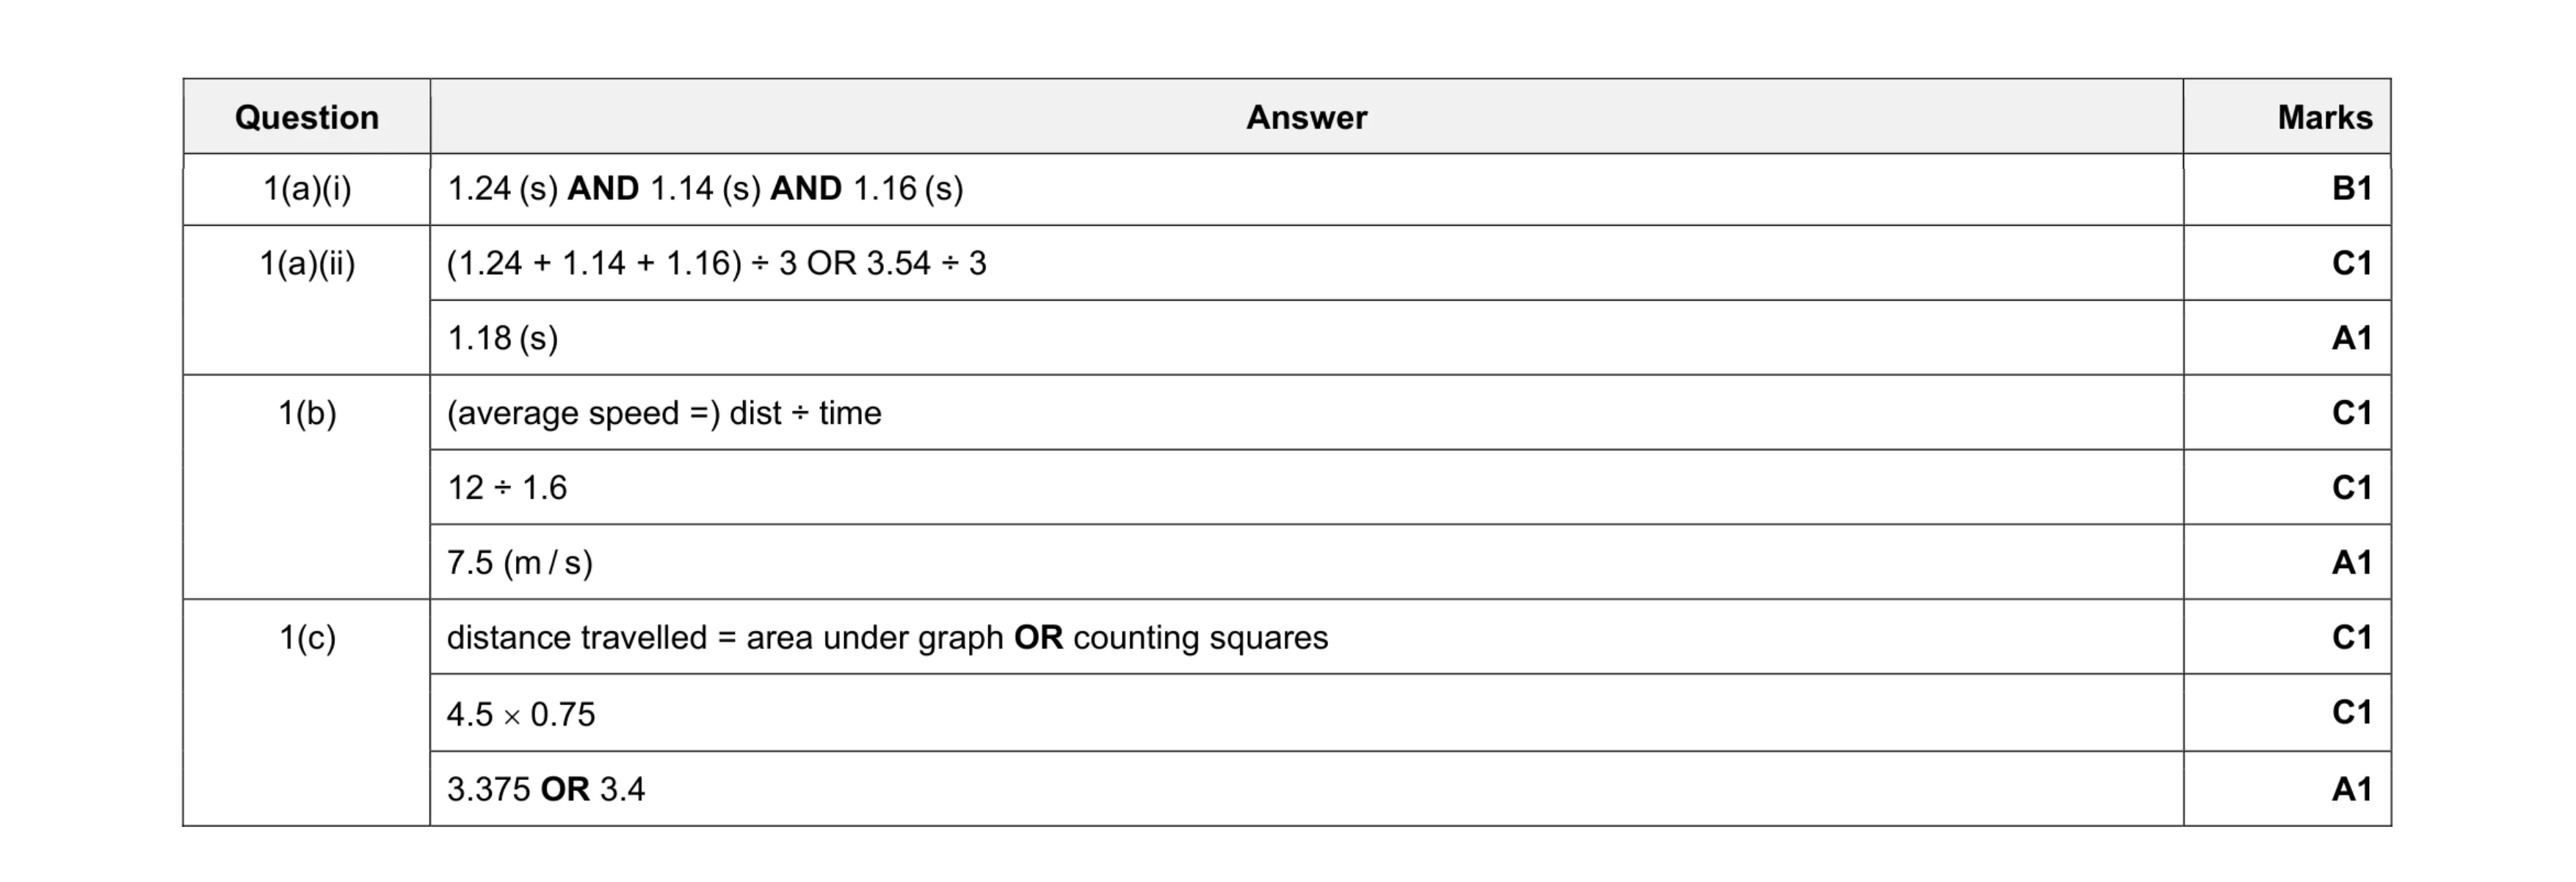 9
9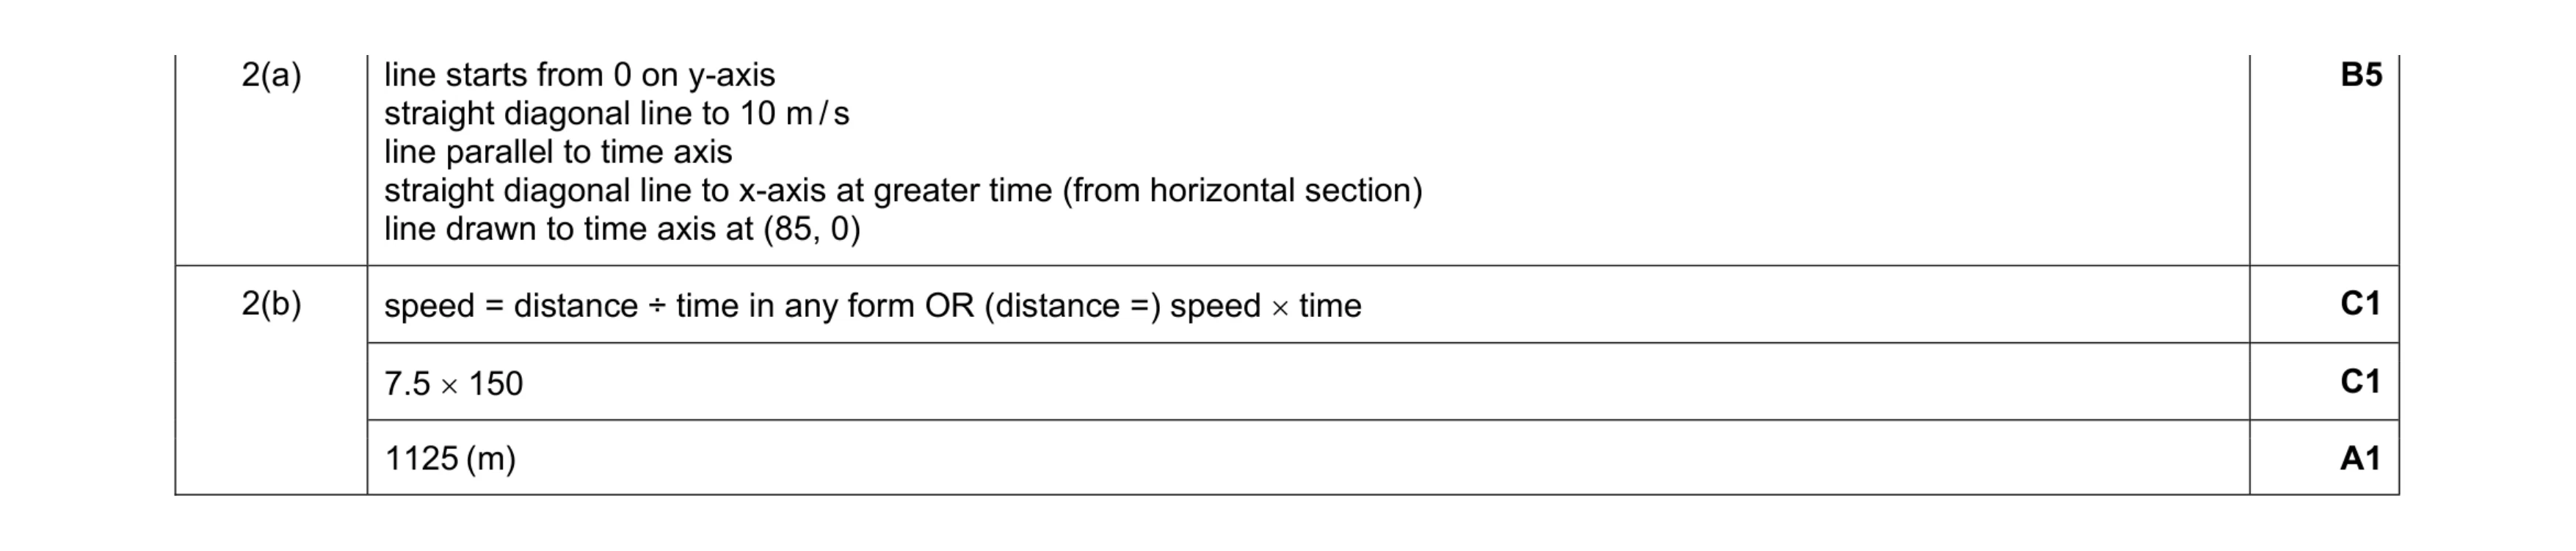 8
8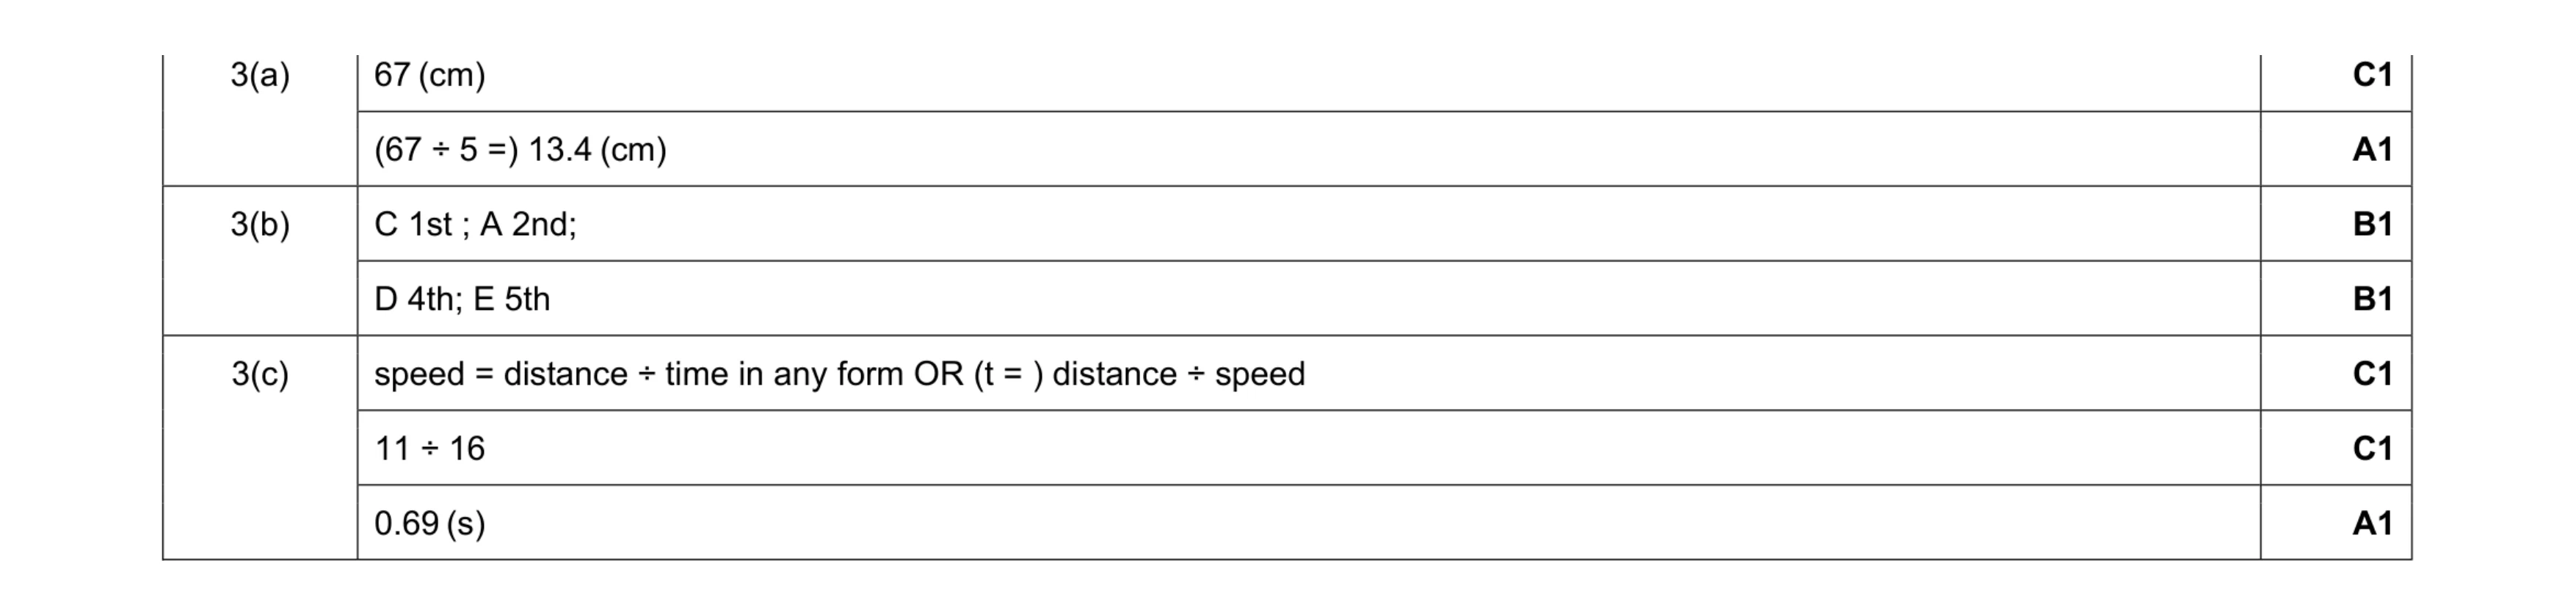 7
7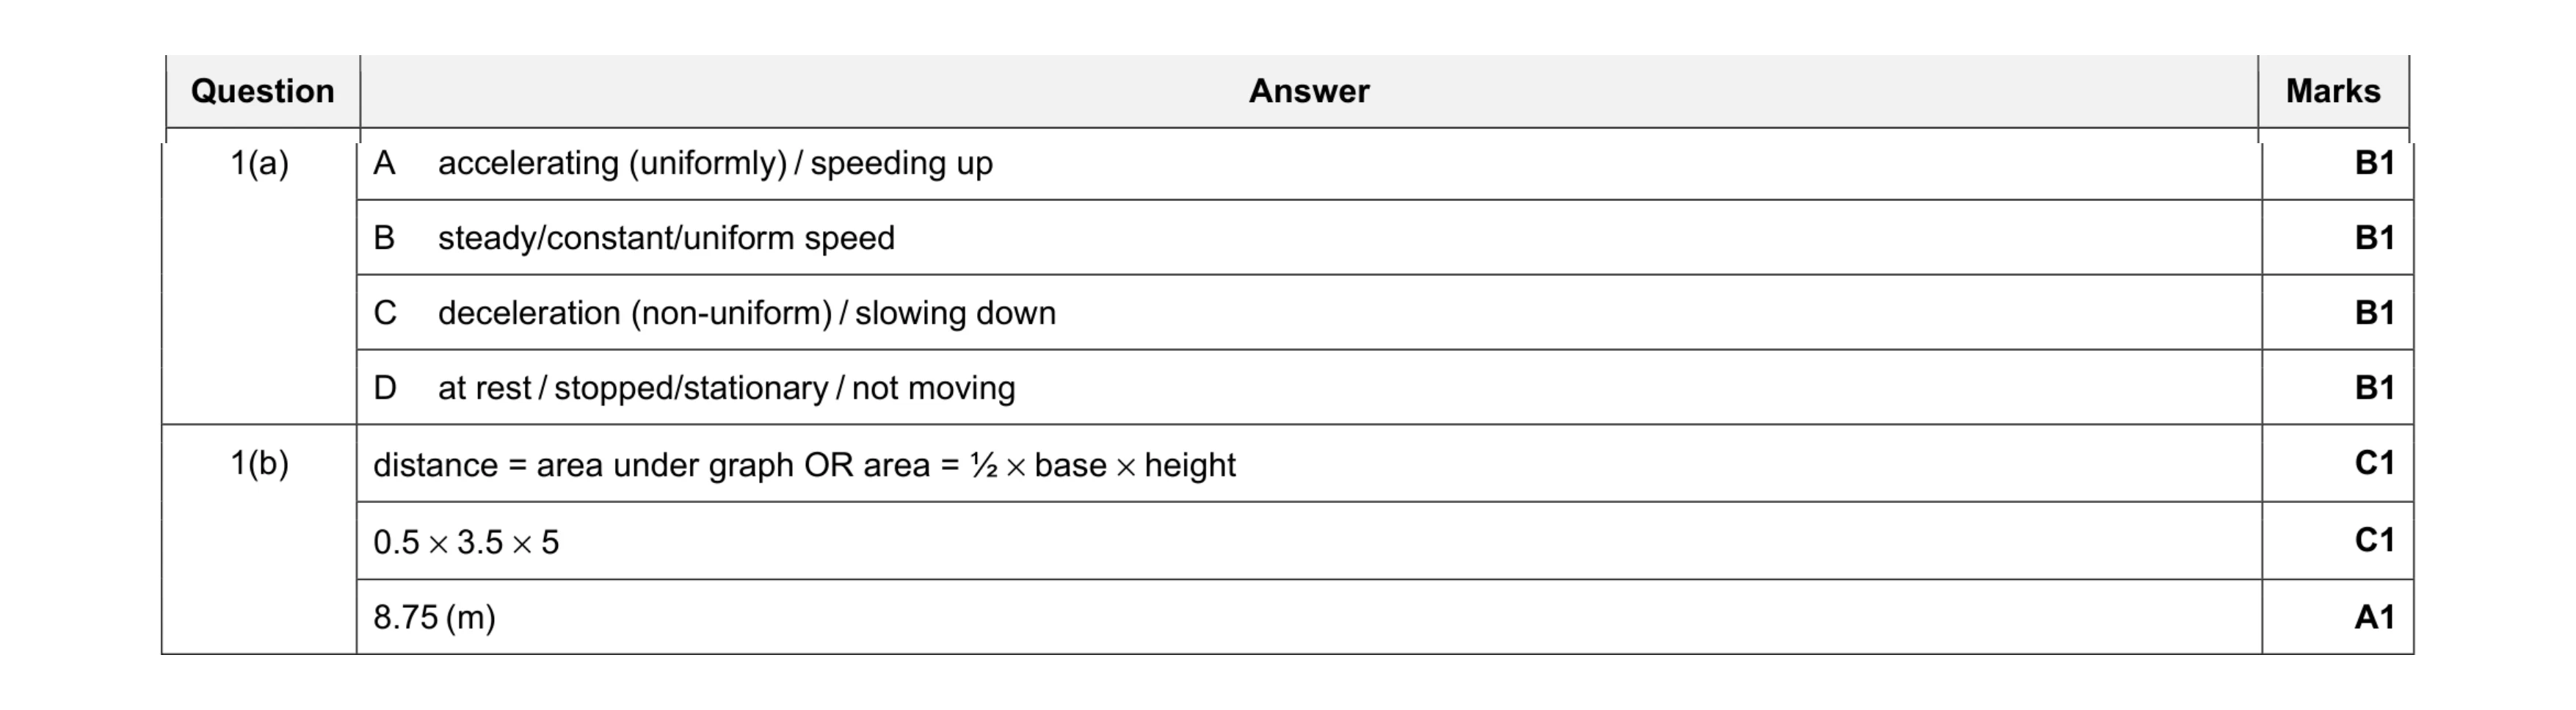 7
7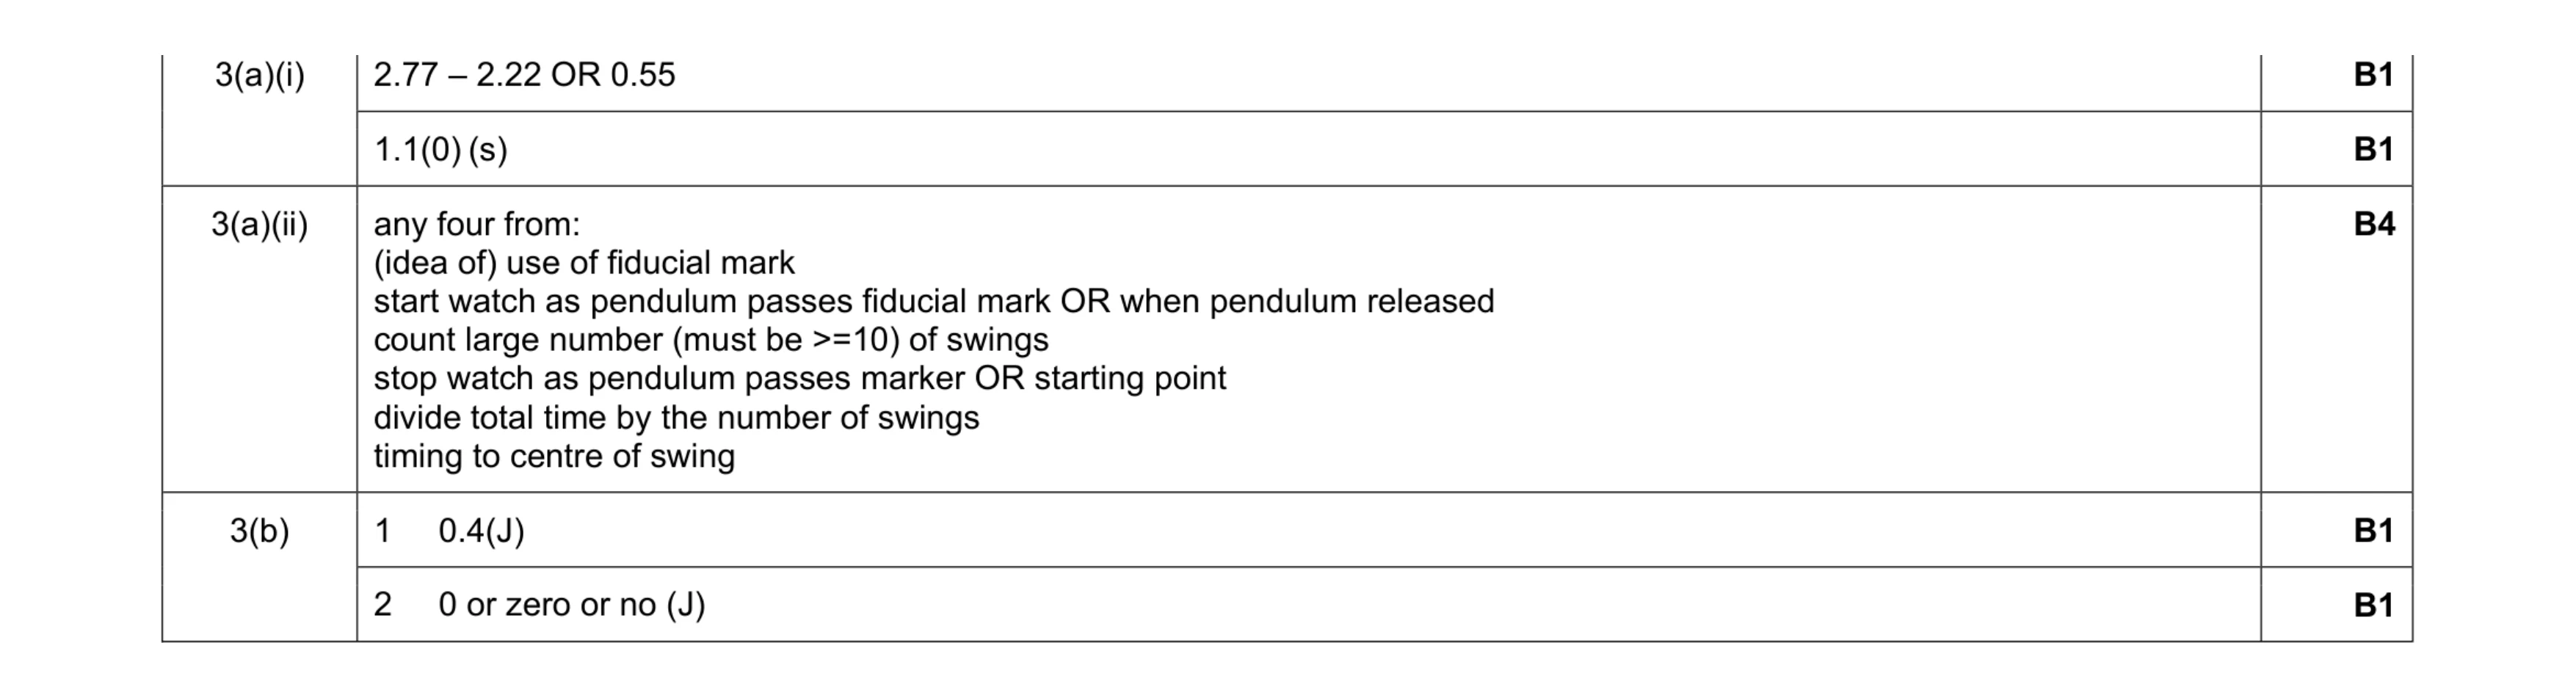 8
8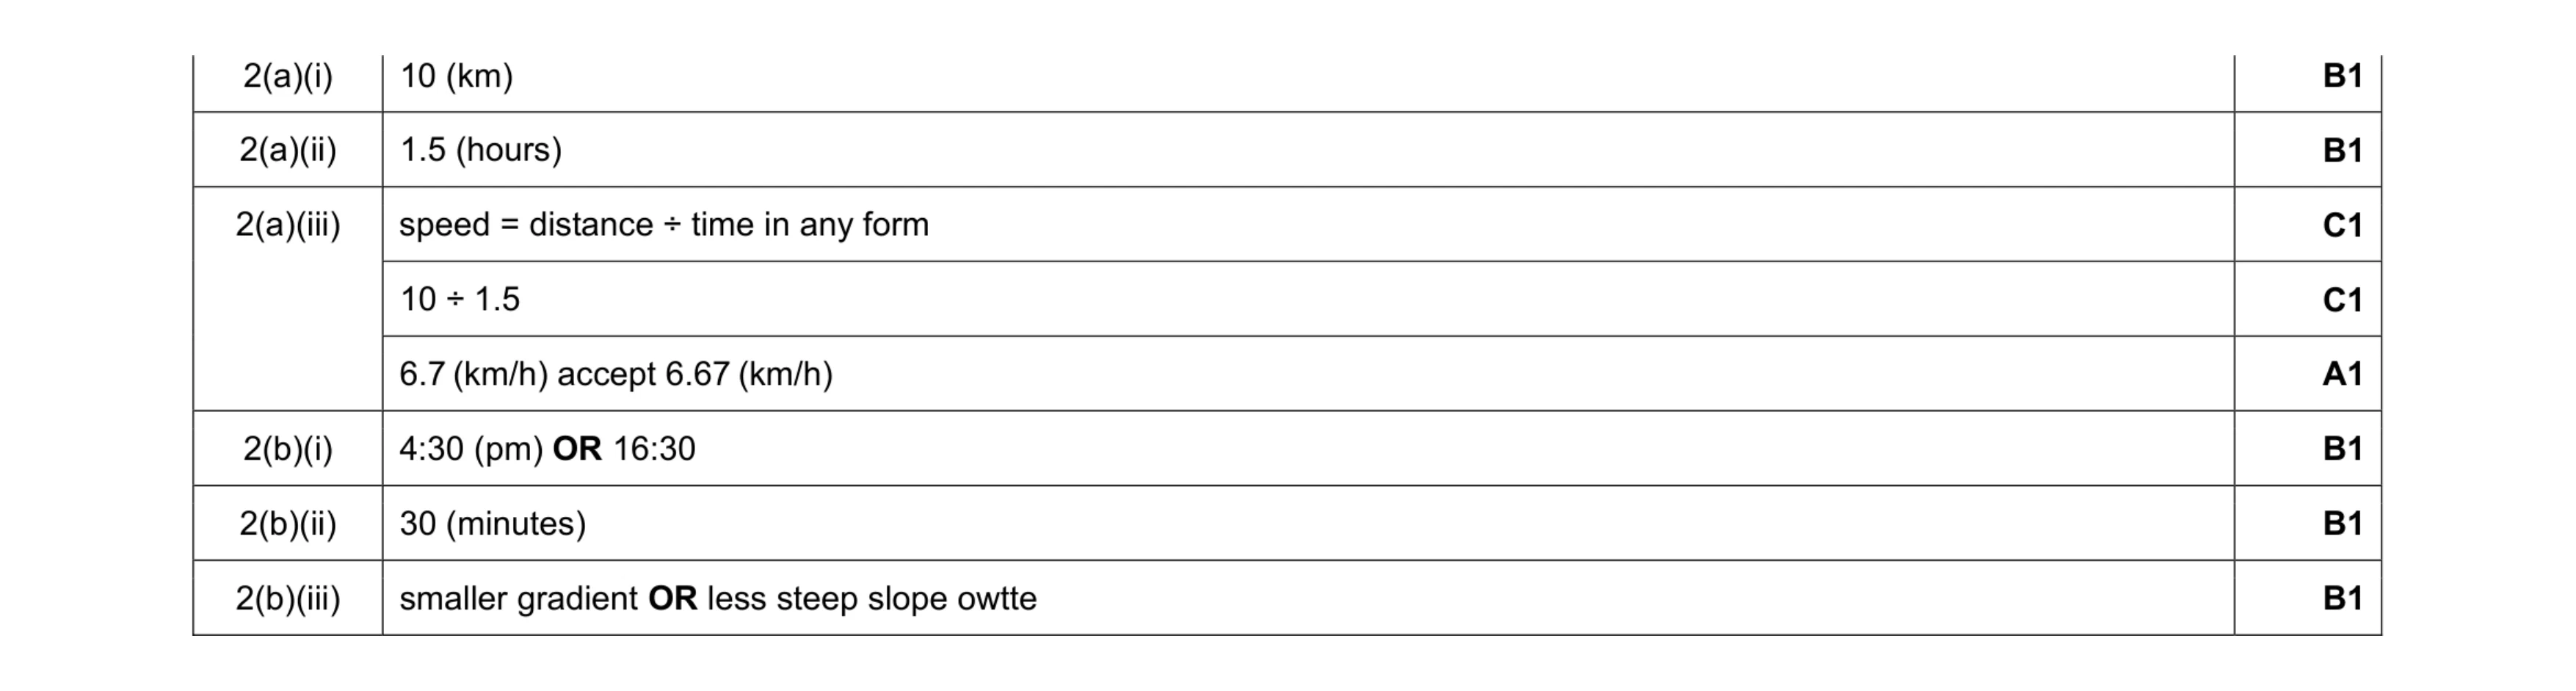 8
8 5
5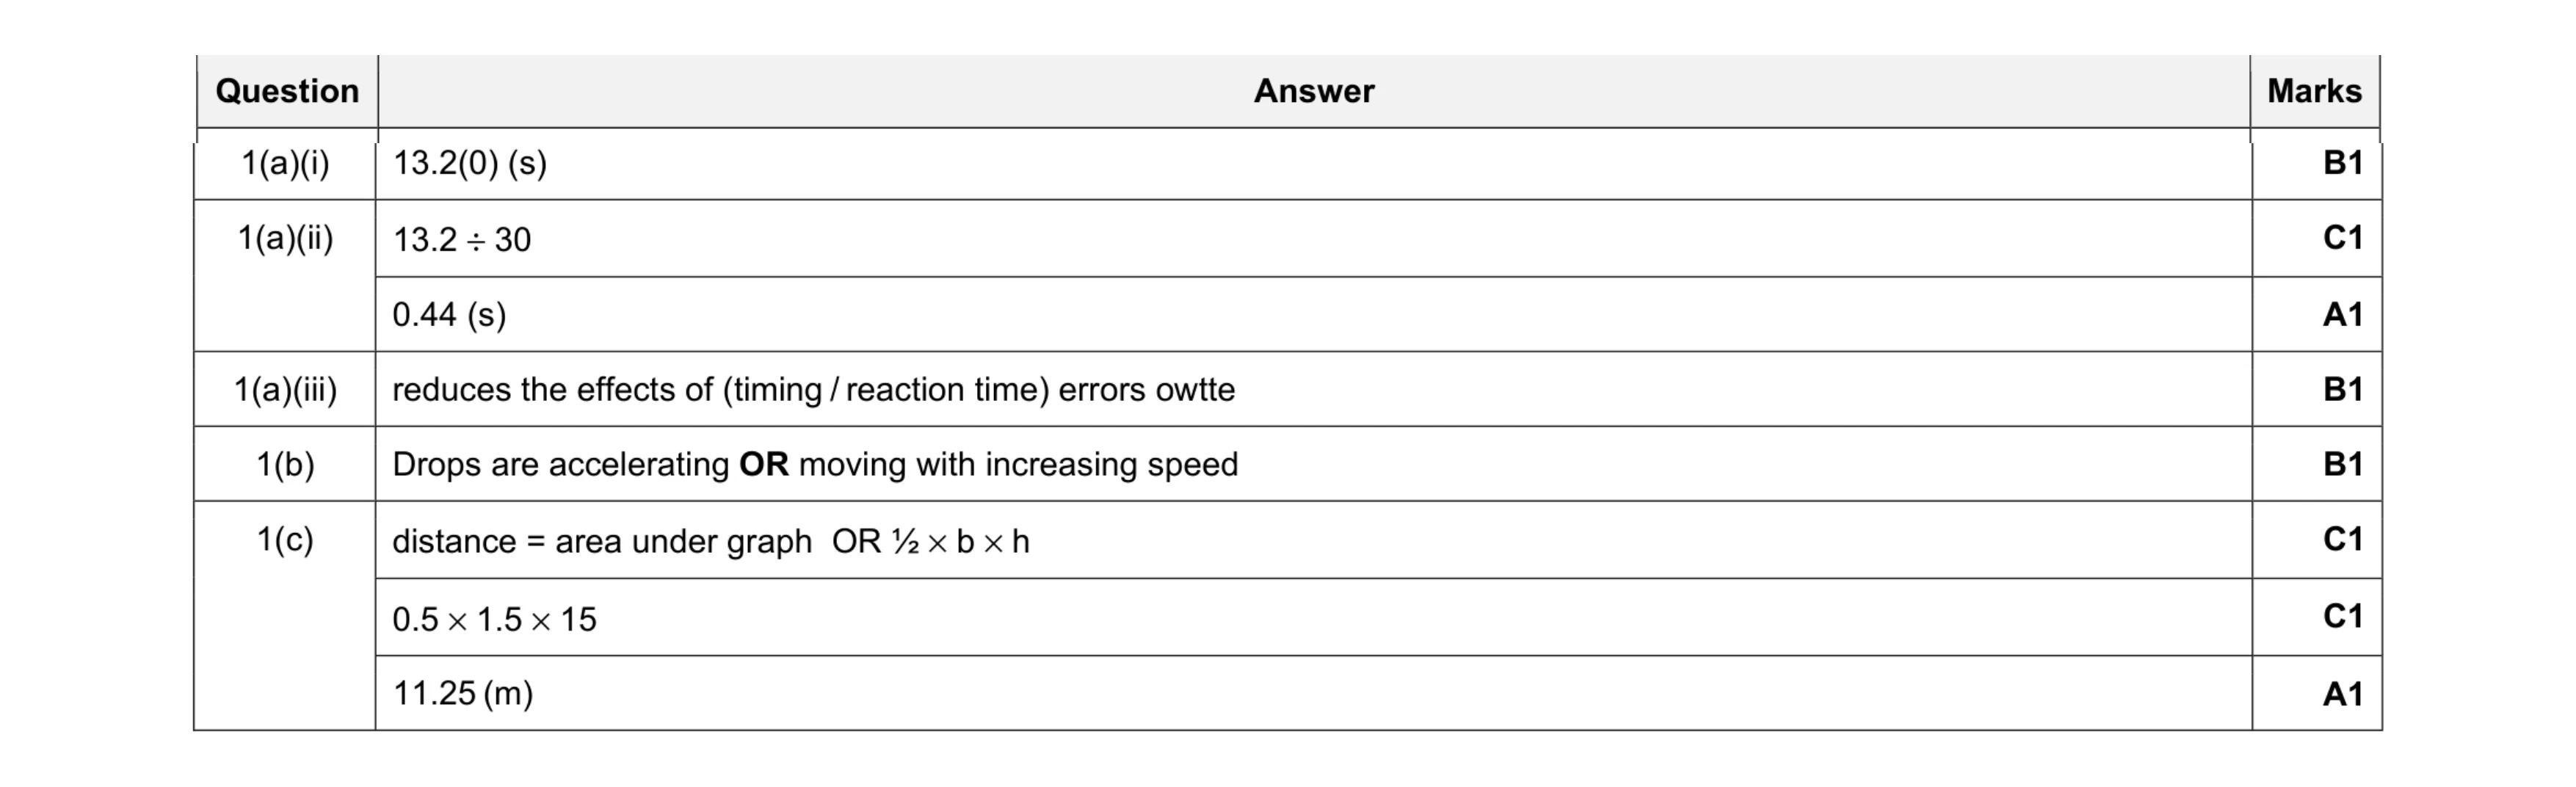 8
8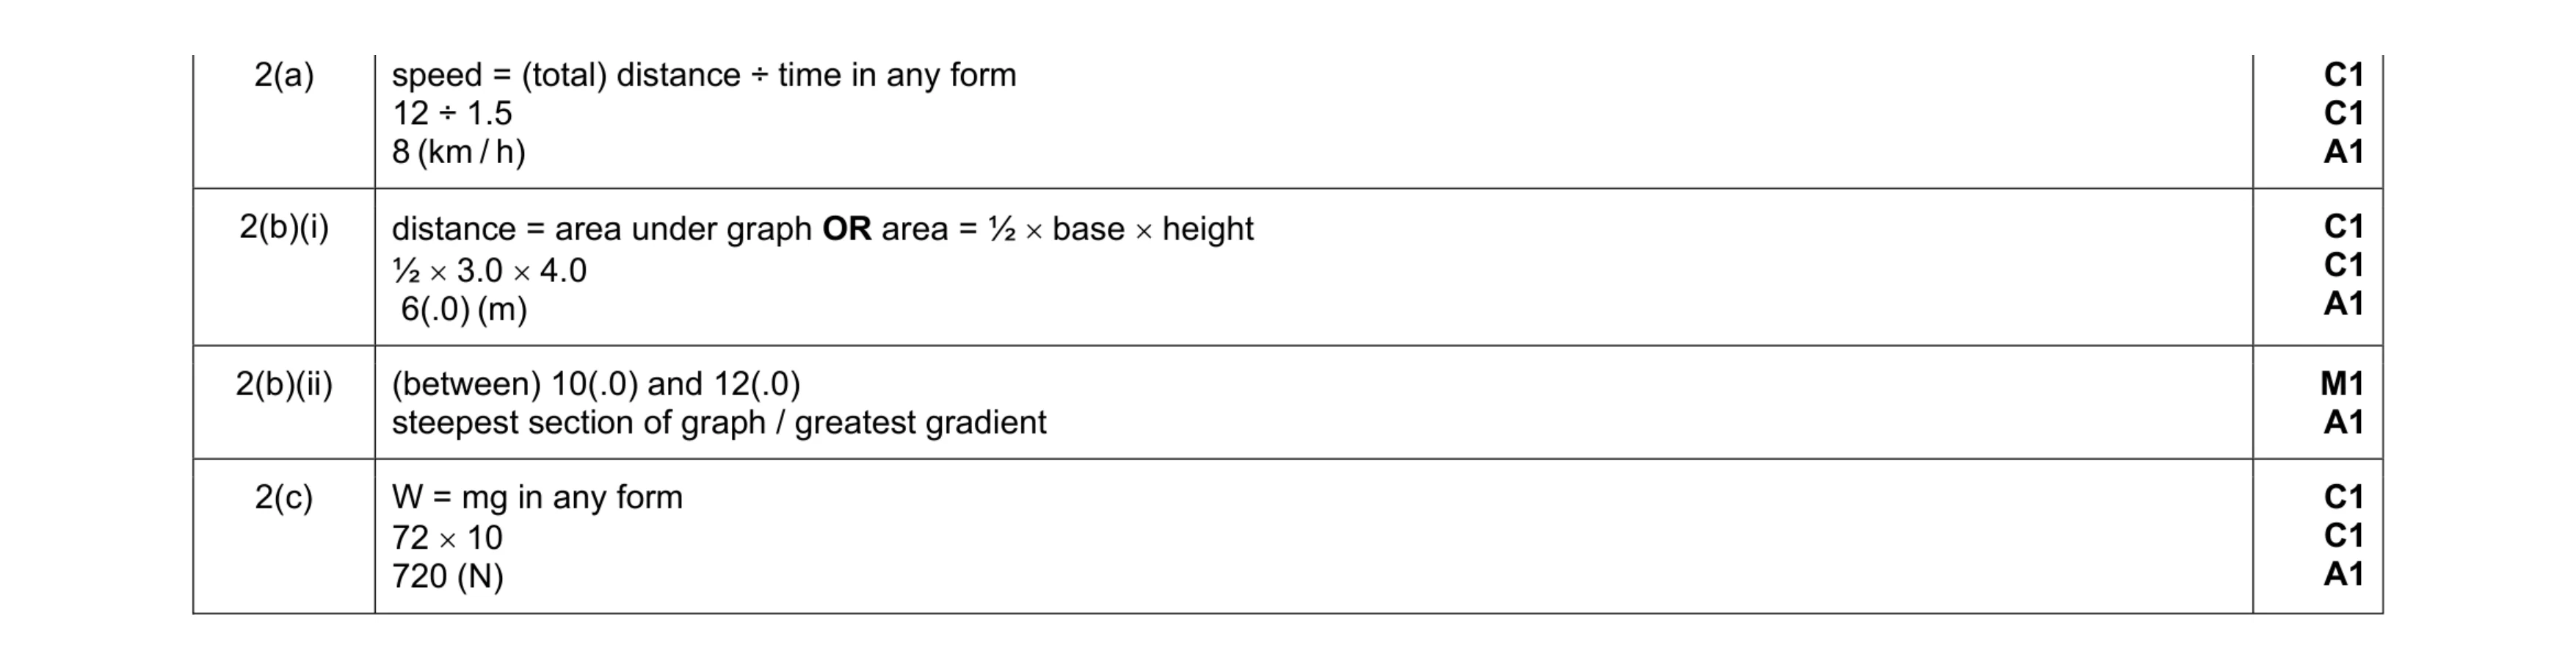 11
11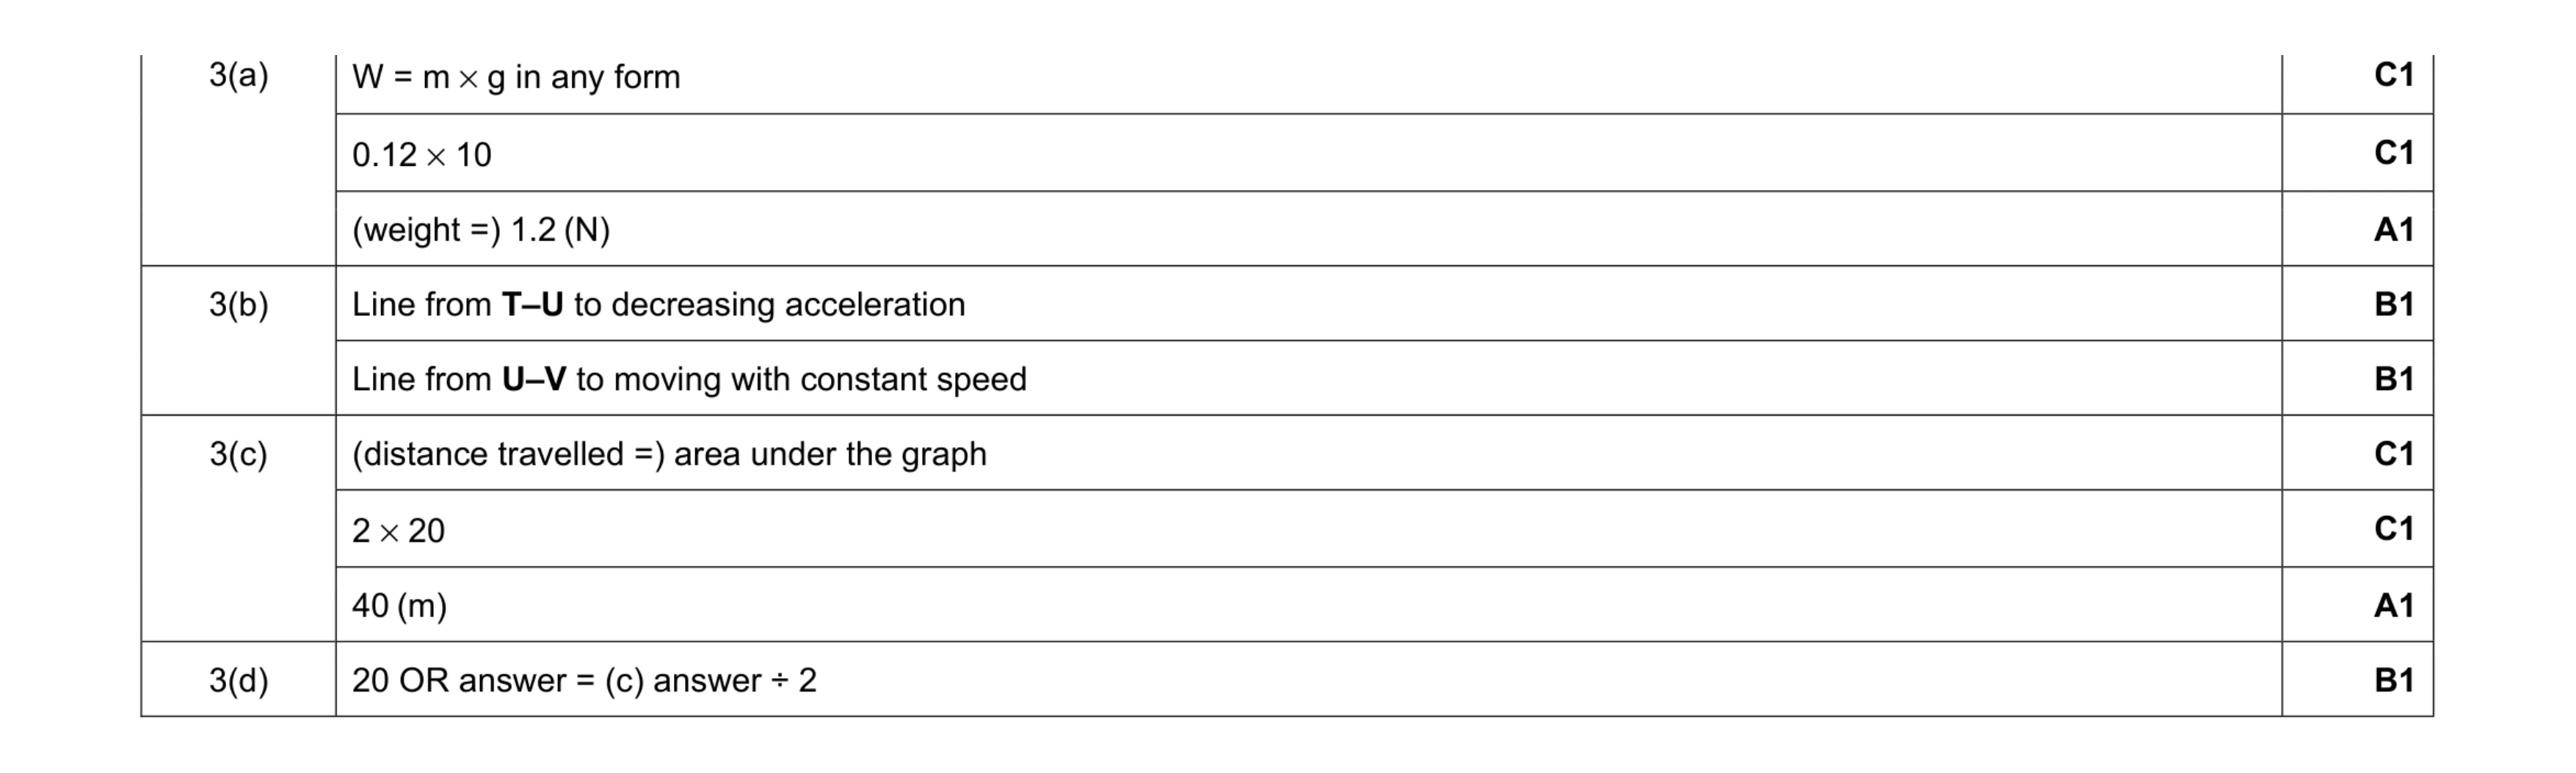 9
9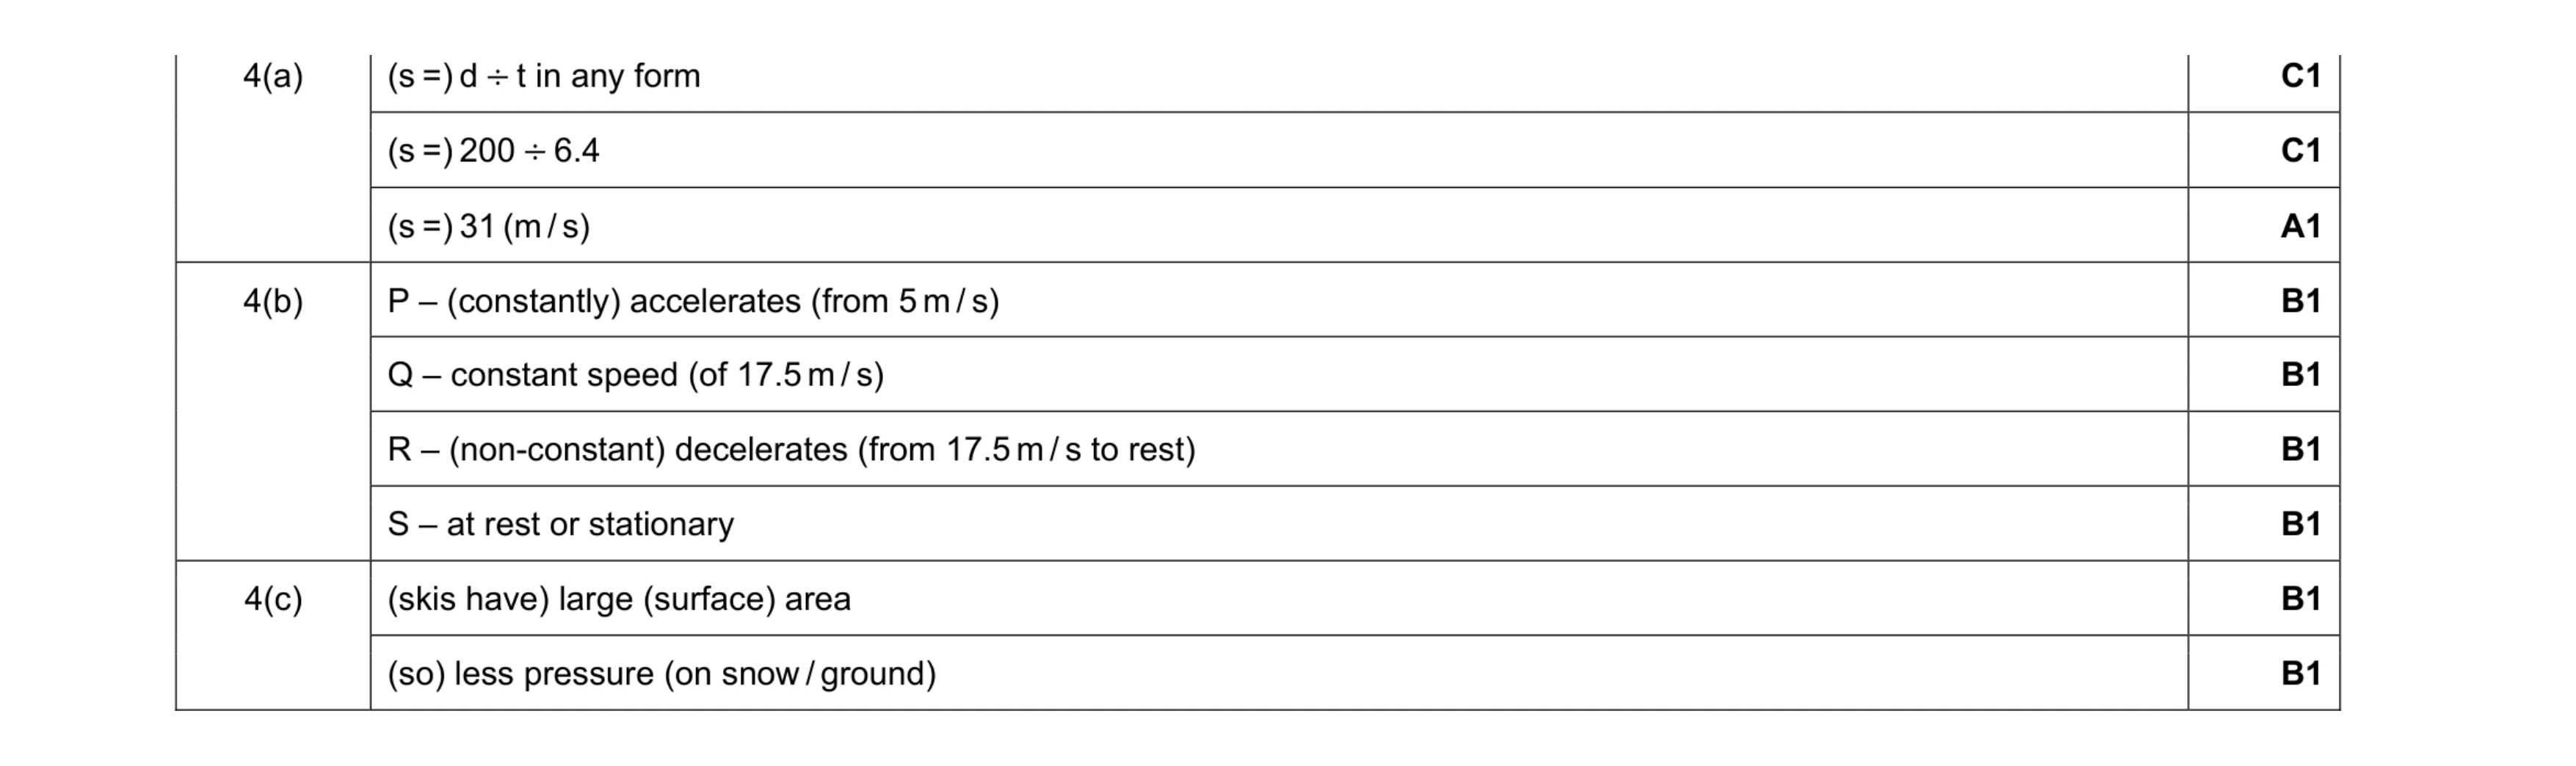 9
9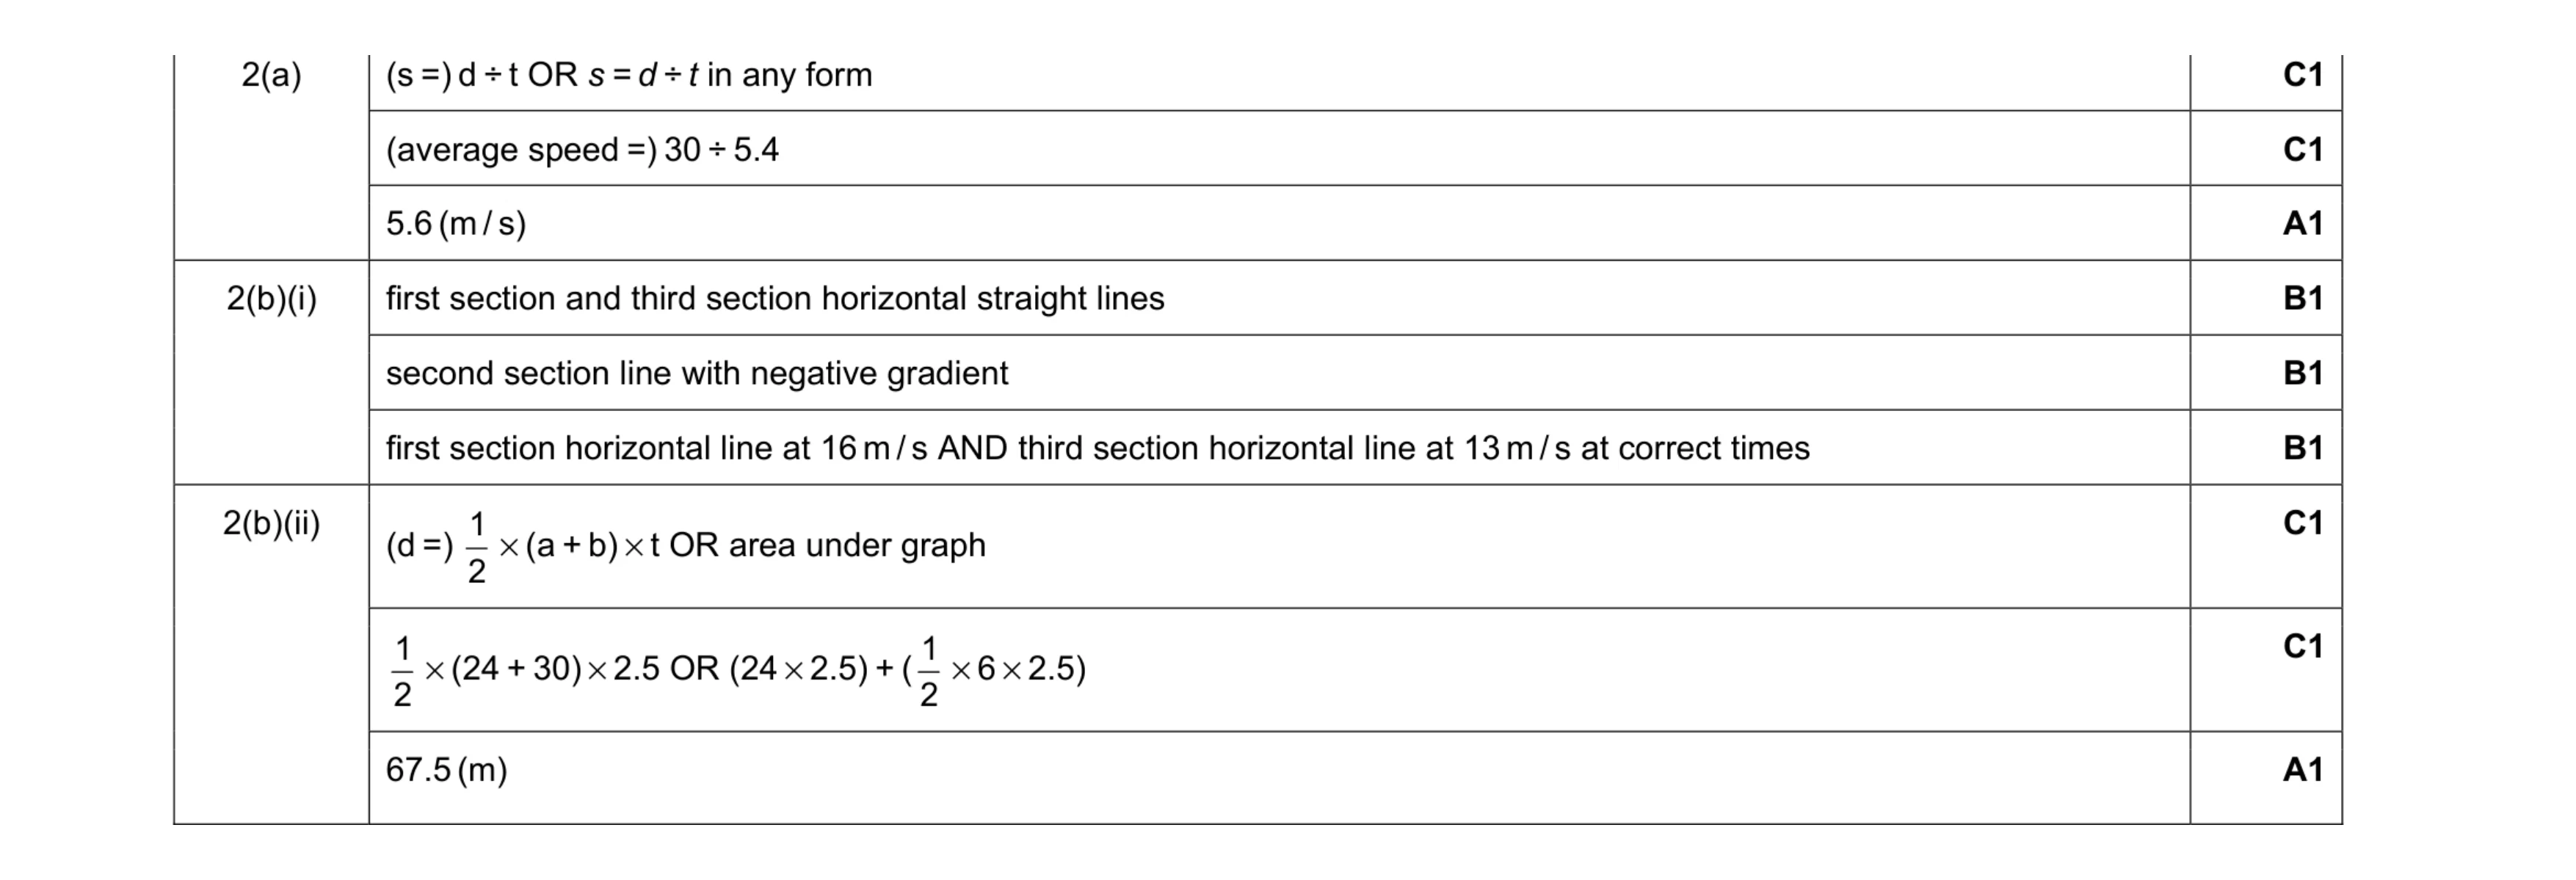 9
9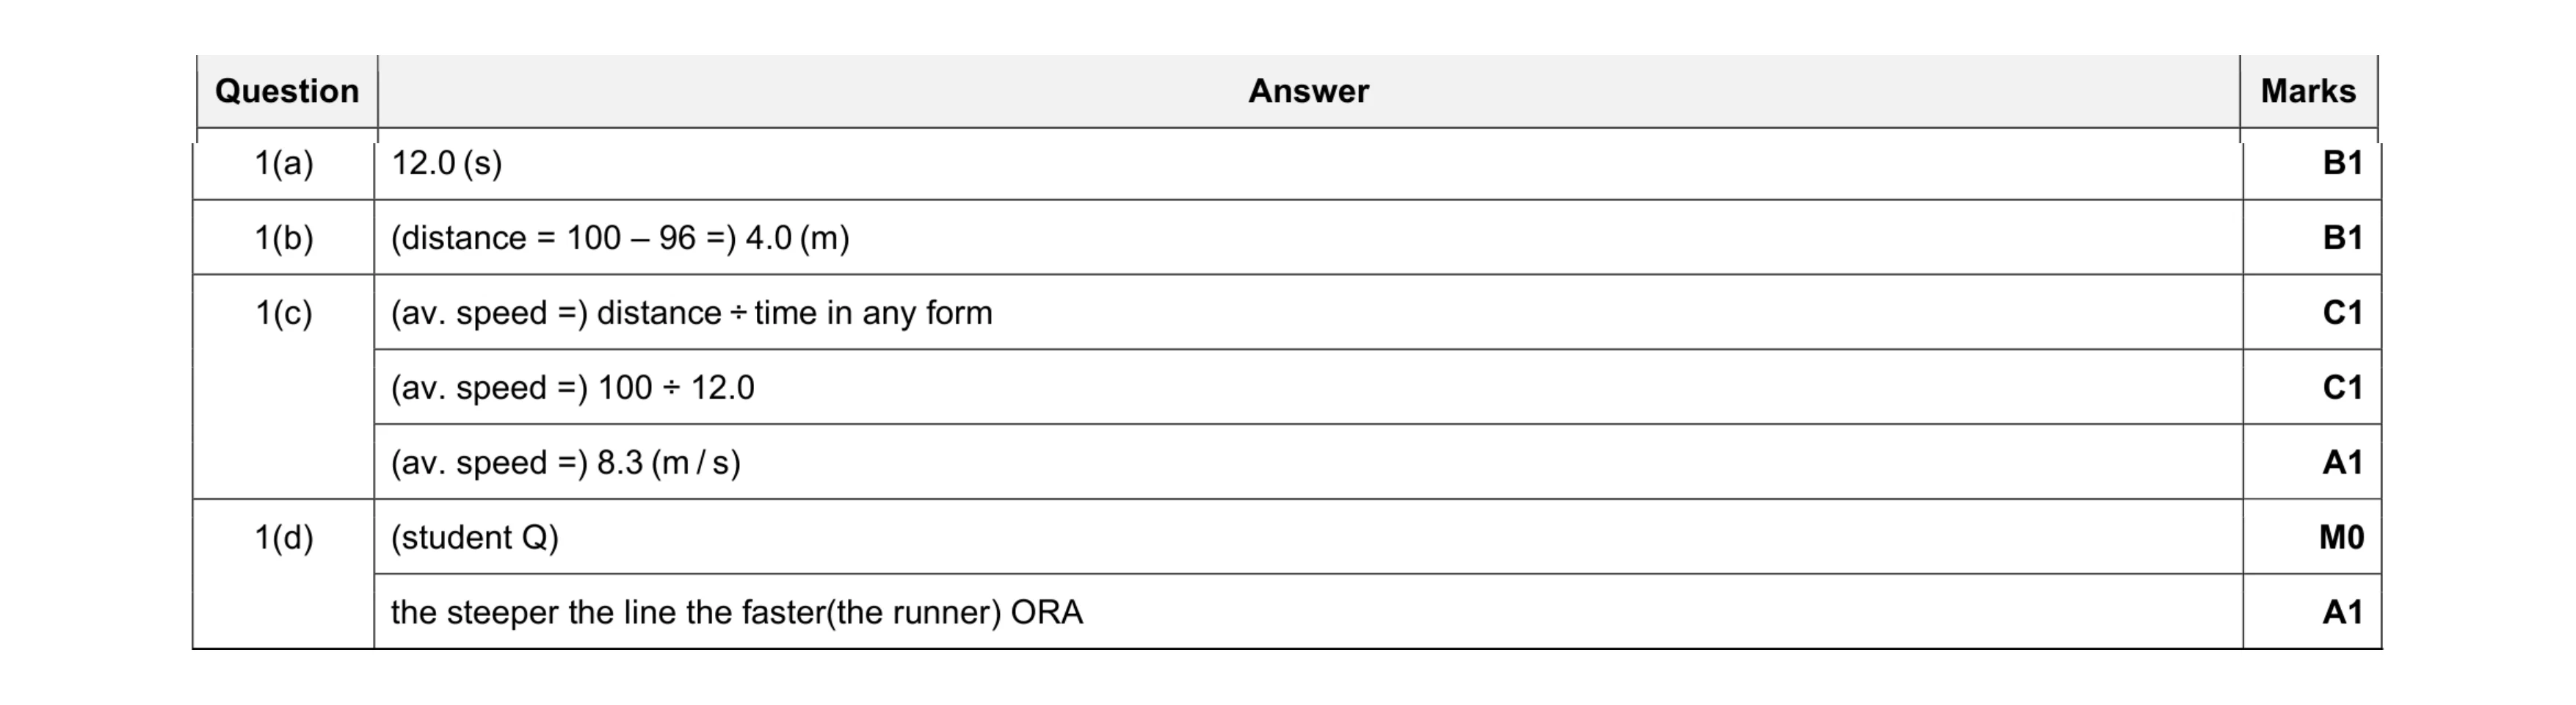 6
6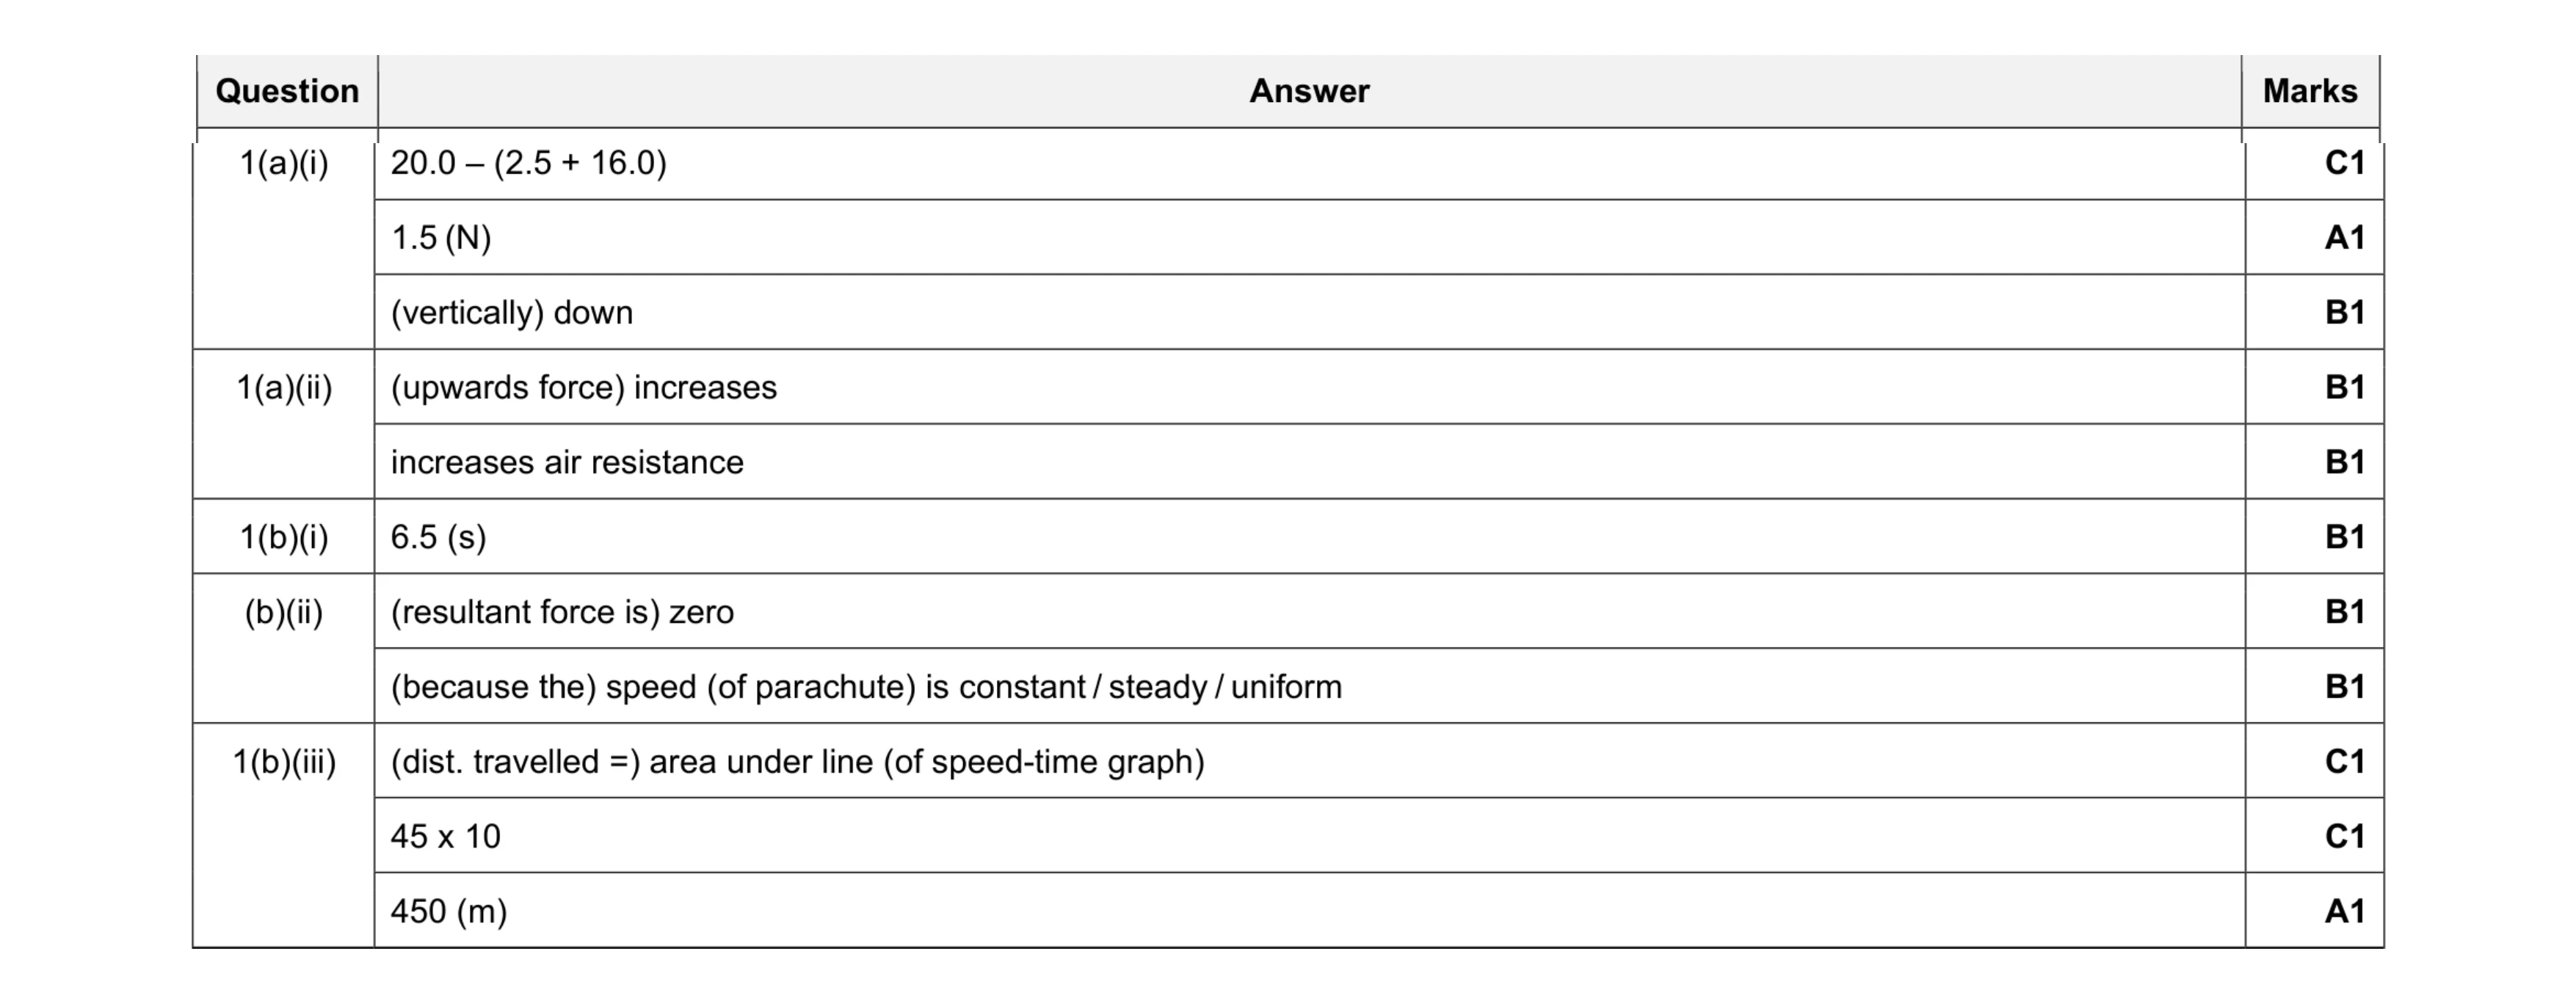 11
11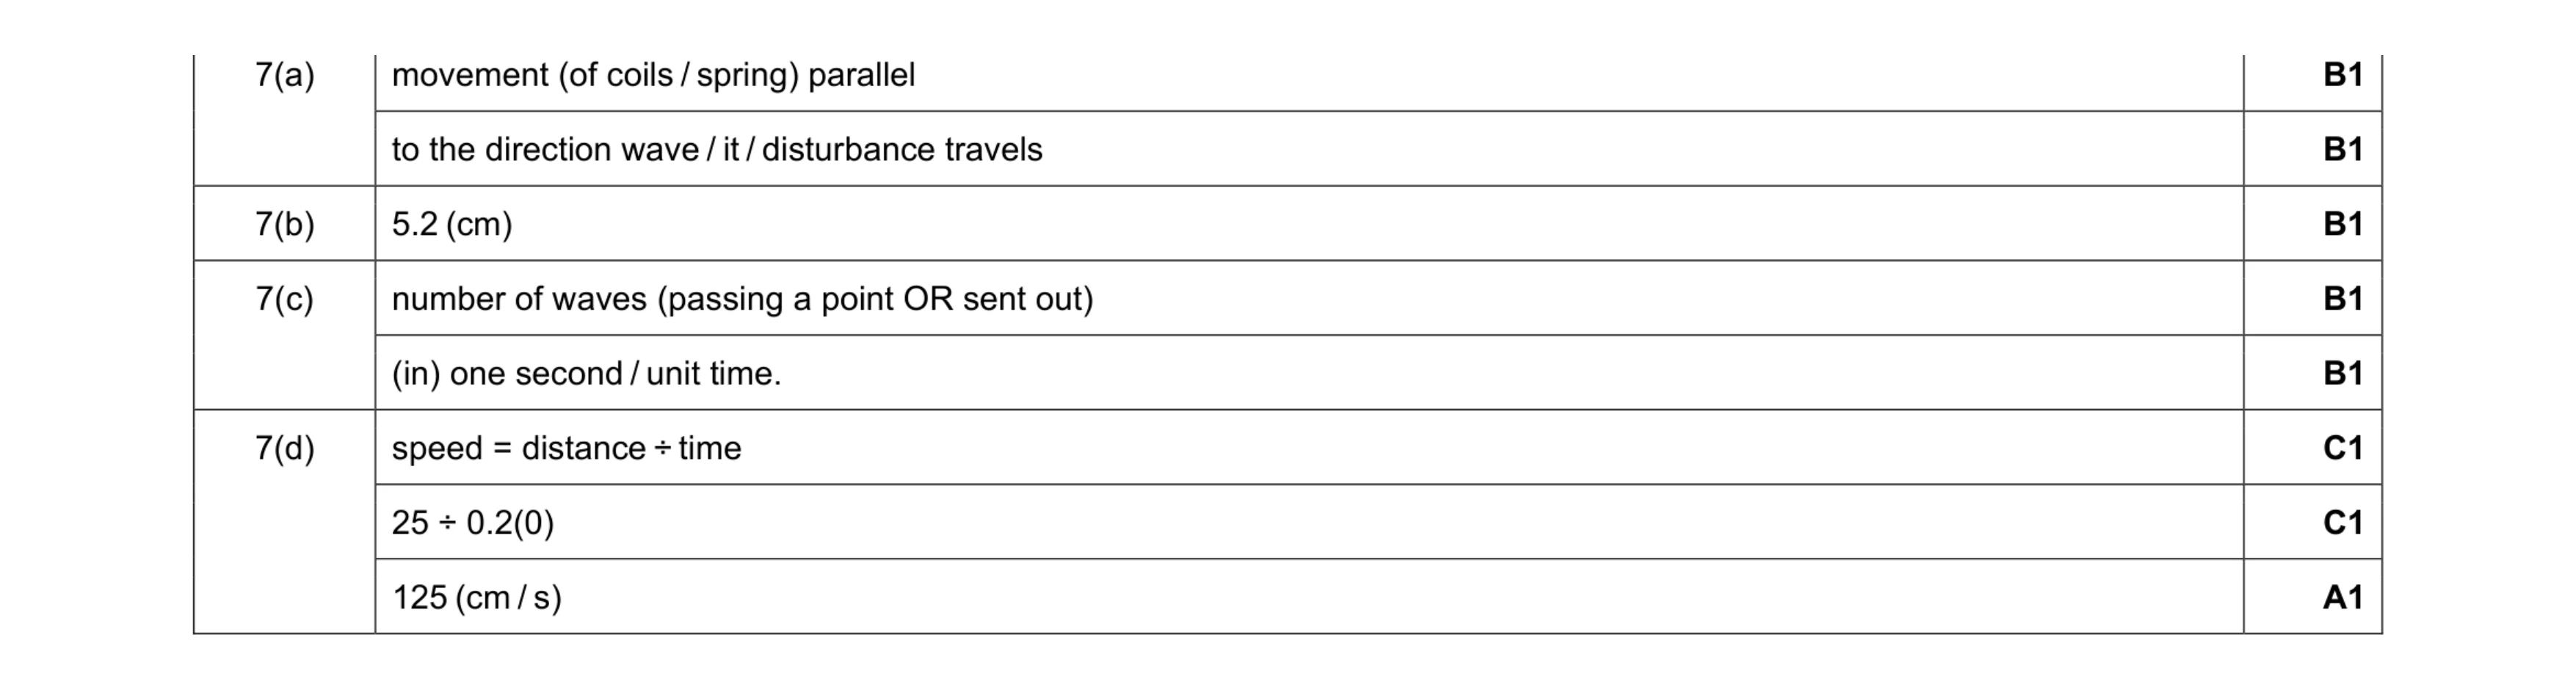 8
8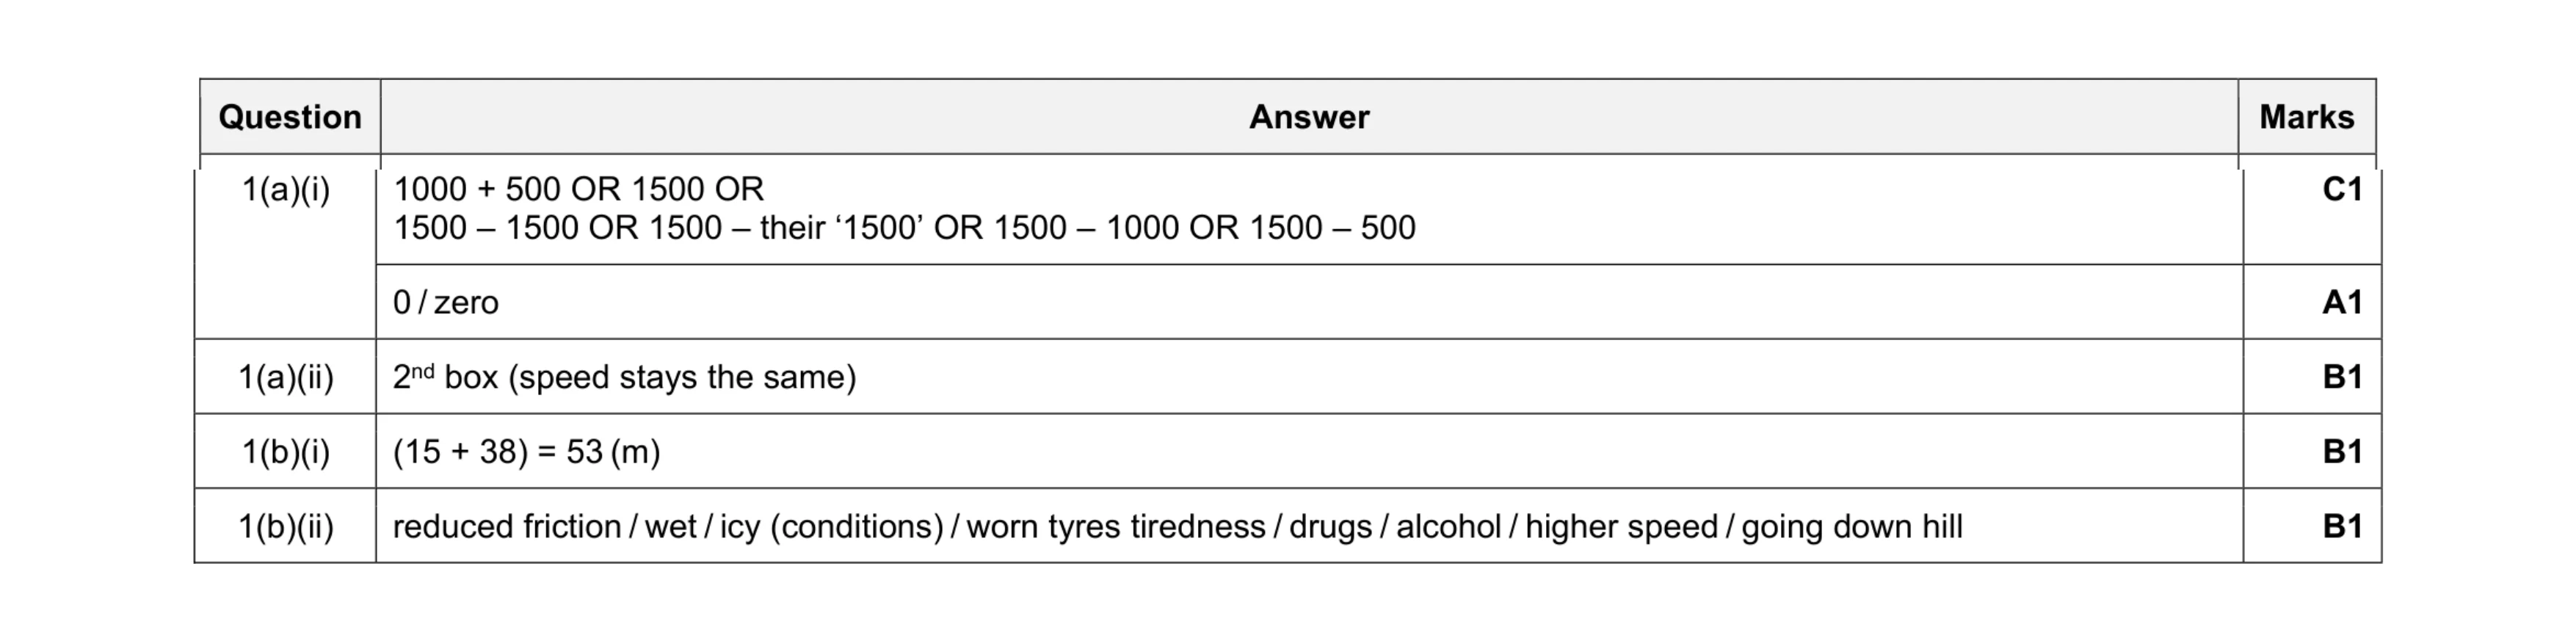 5
5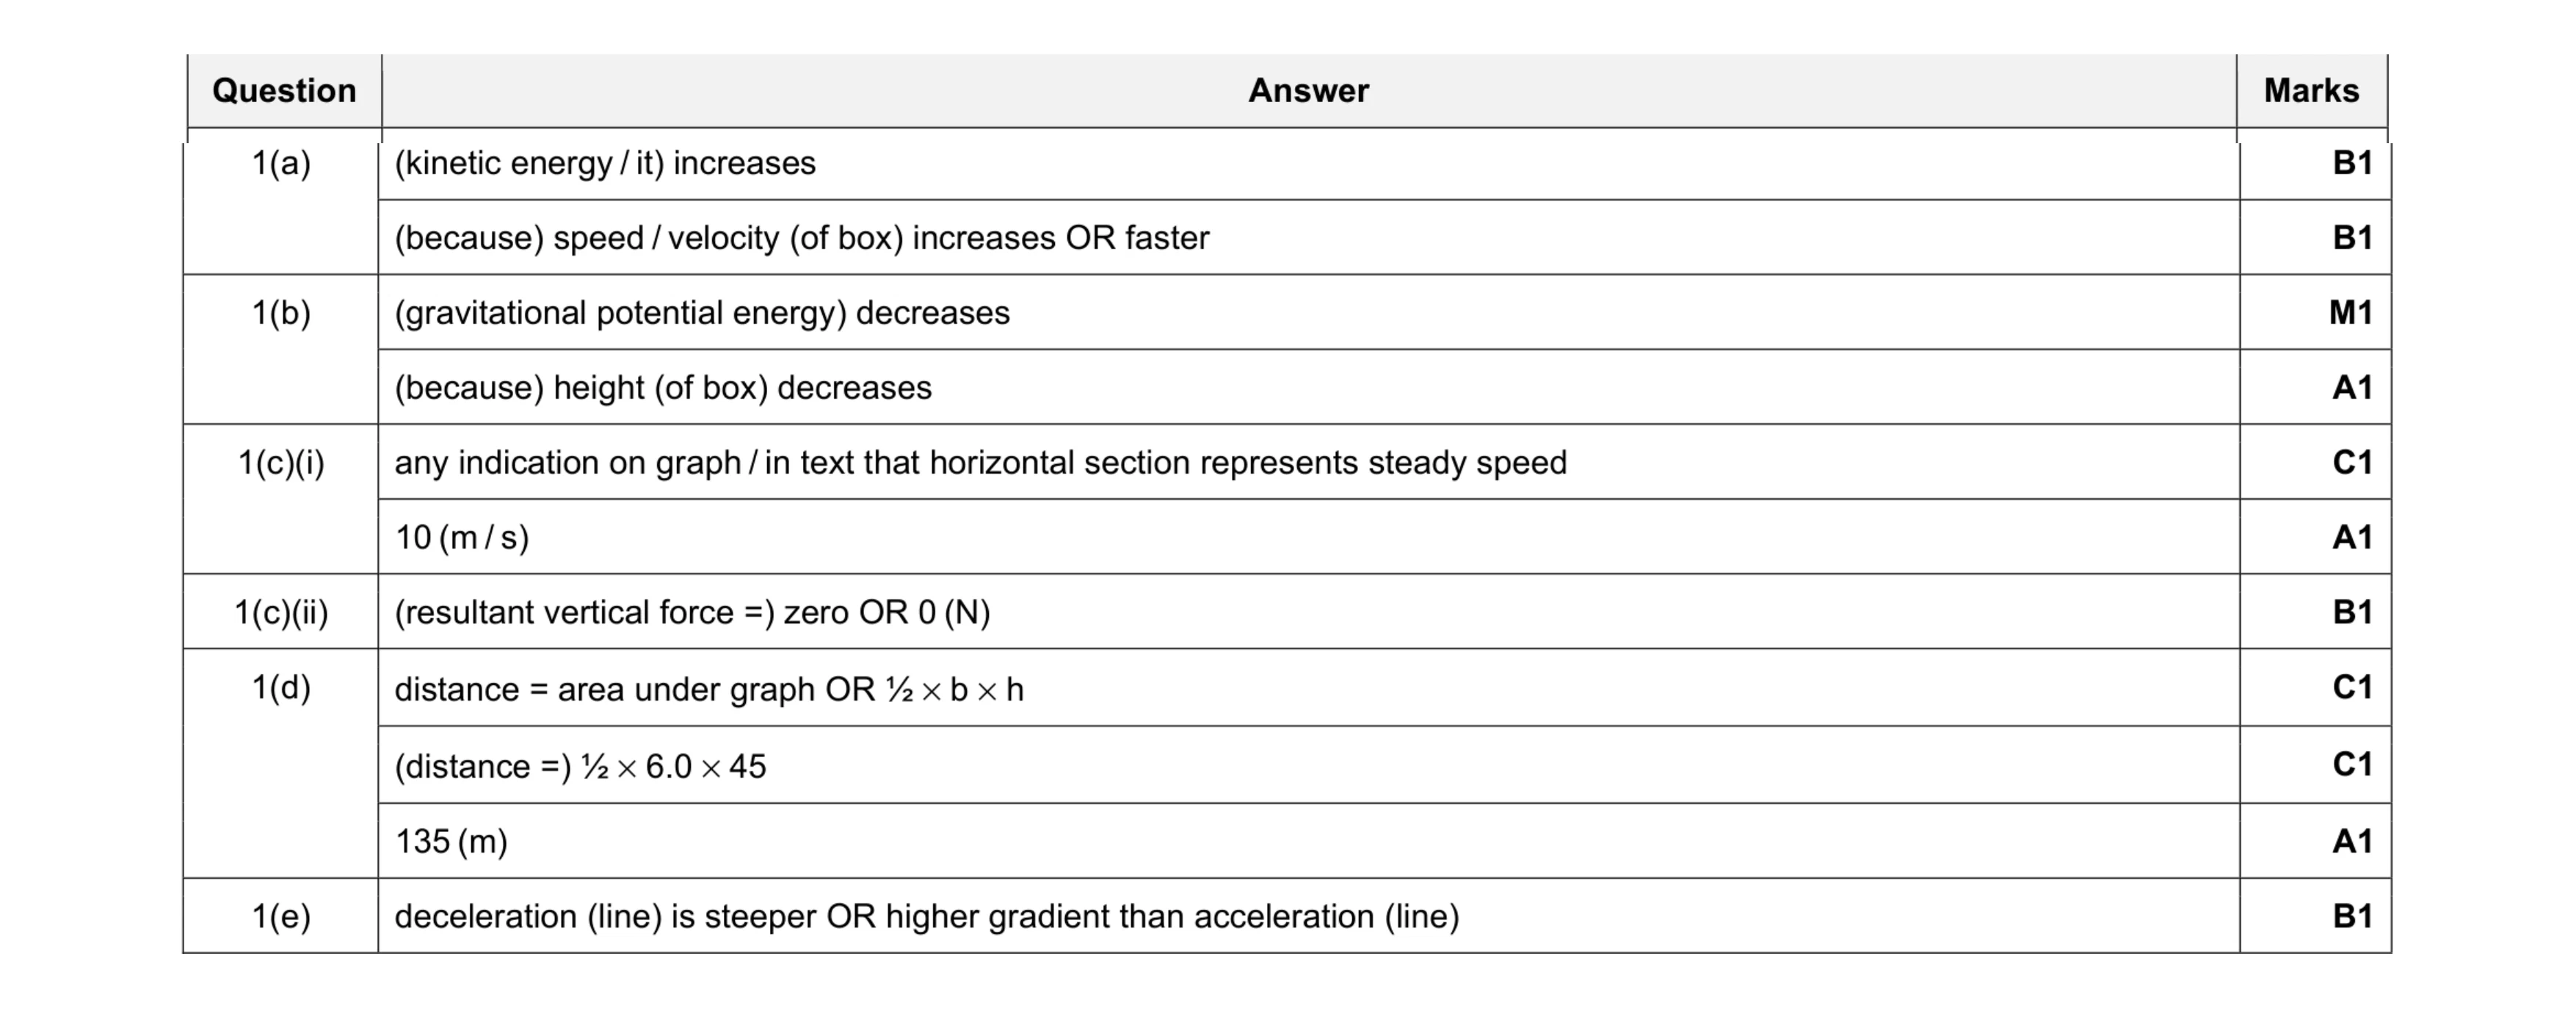 11
11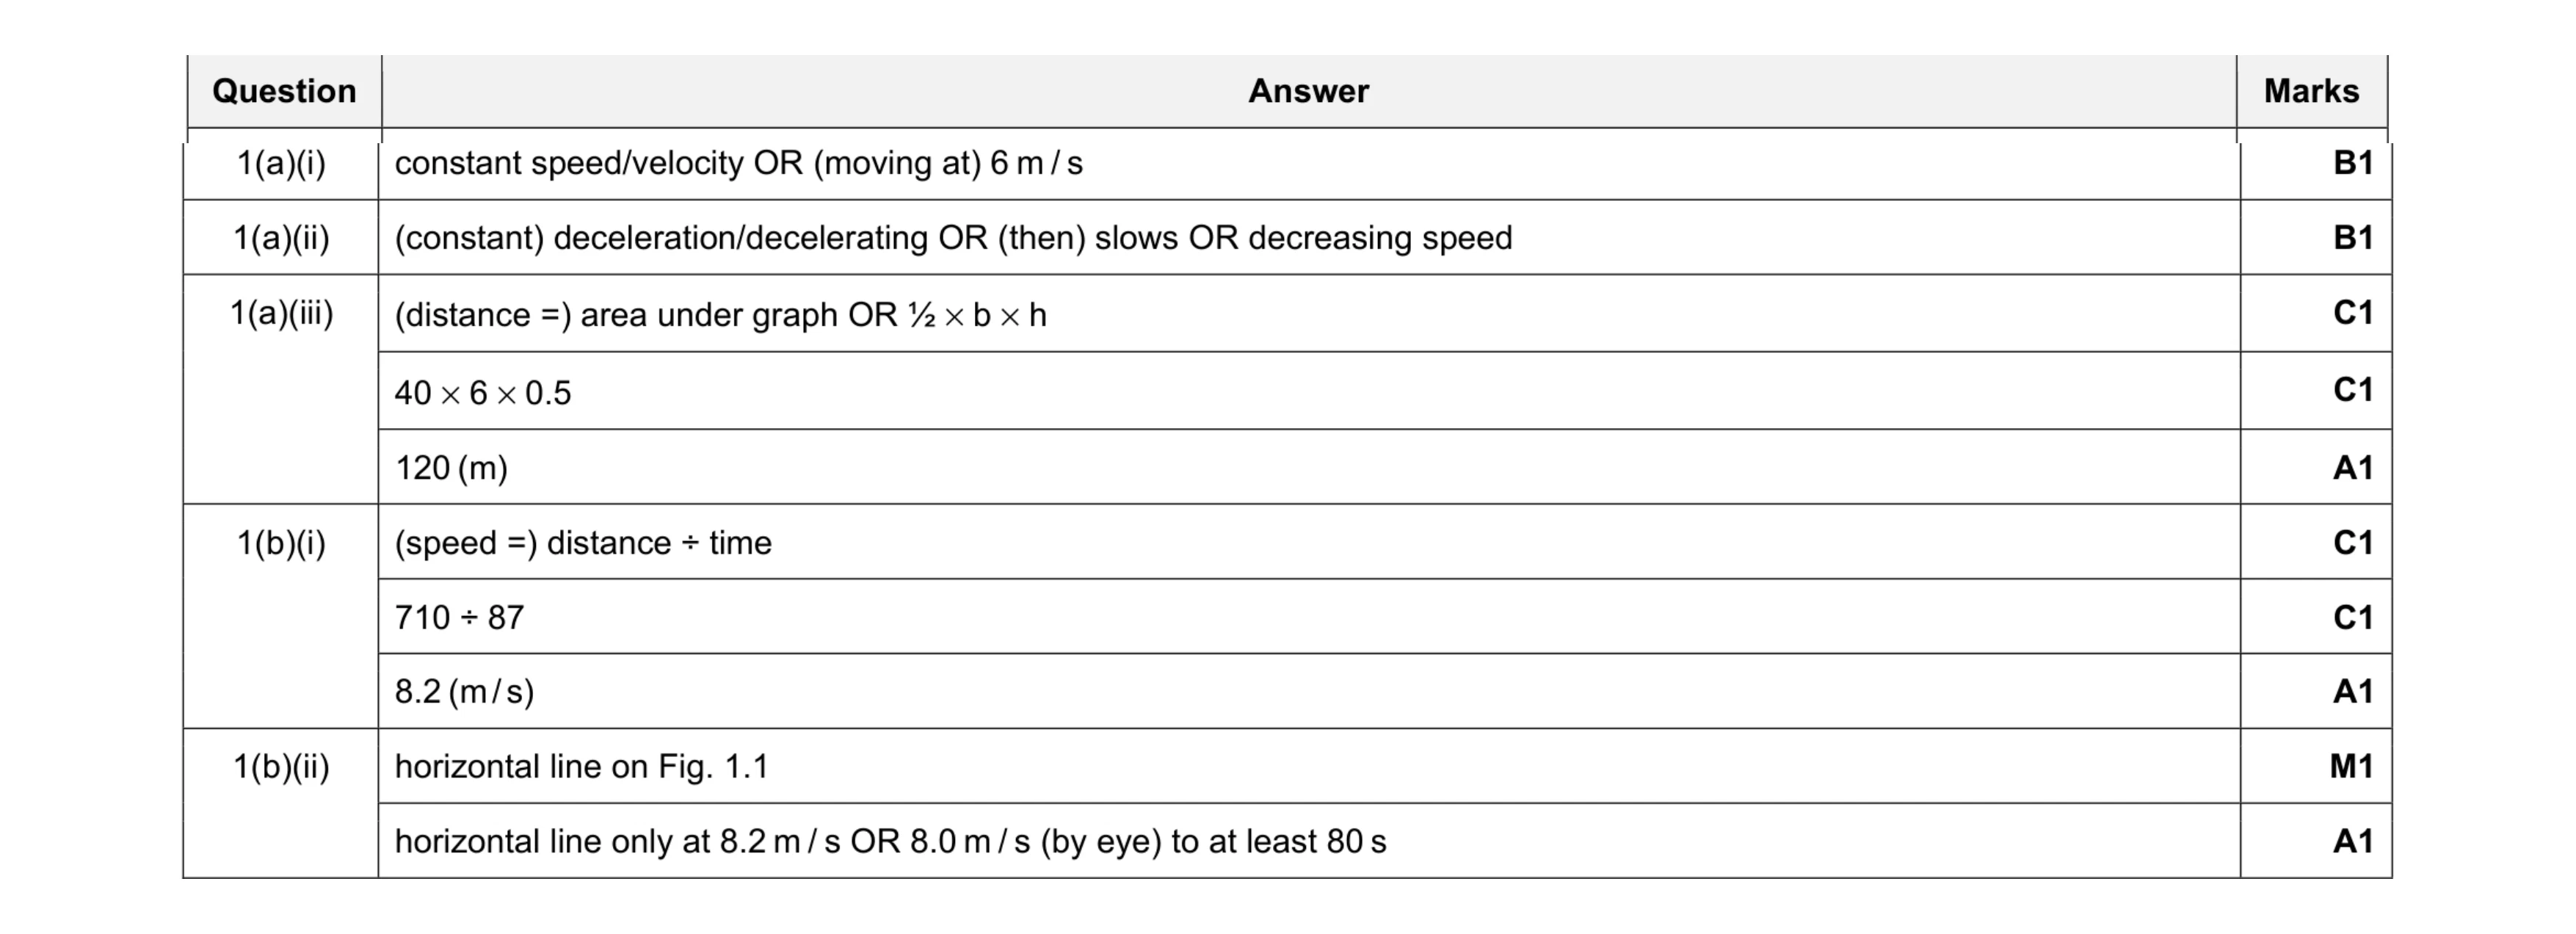 10
10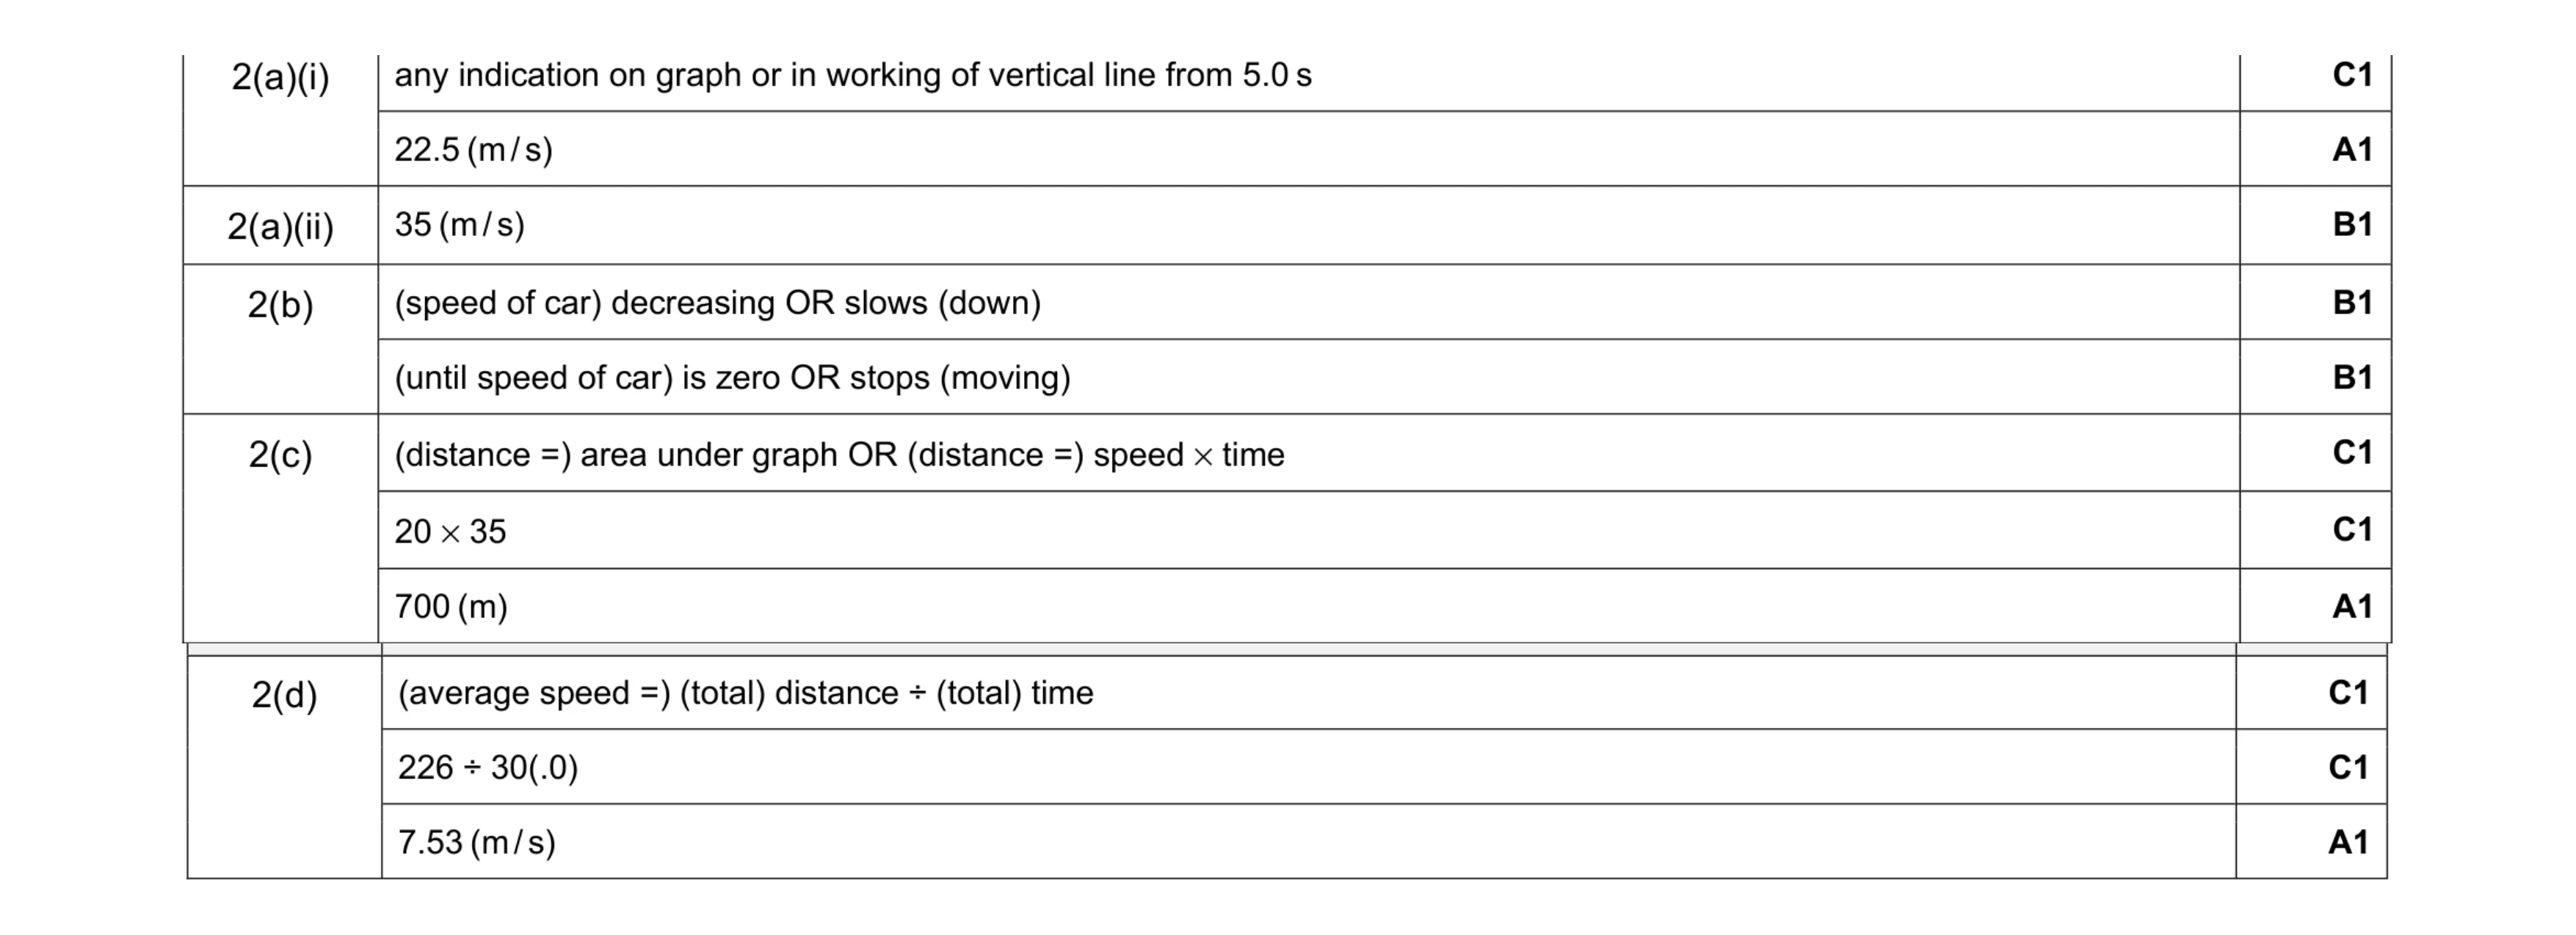 11
11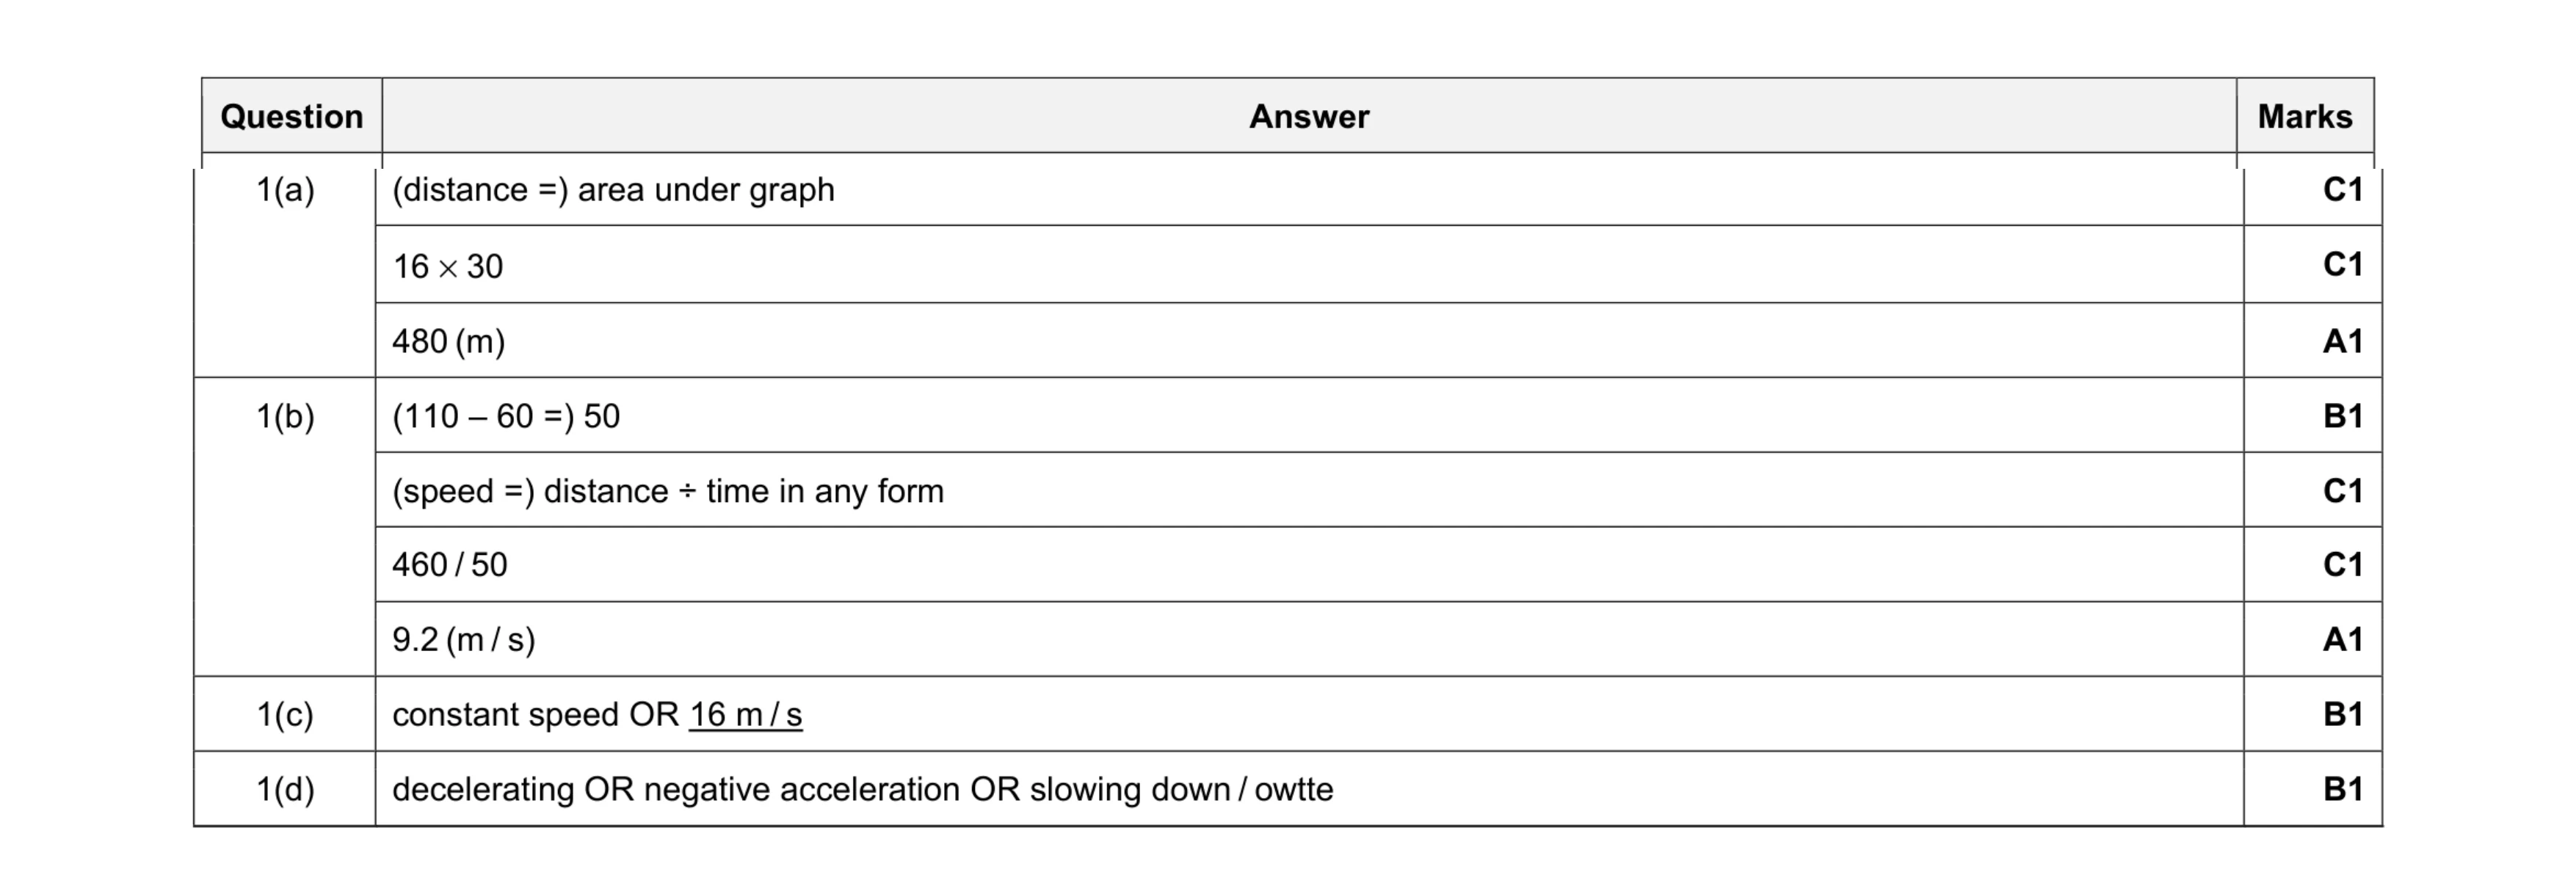 9
9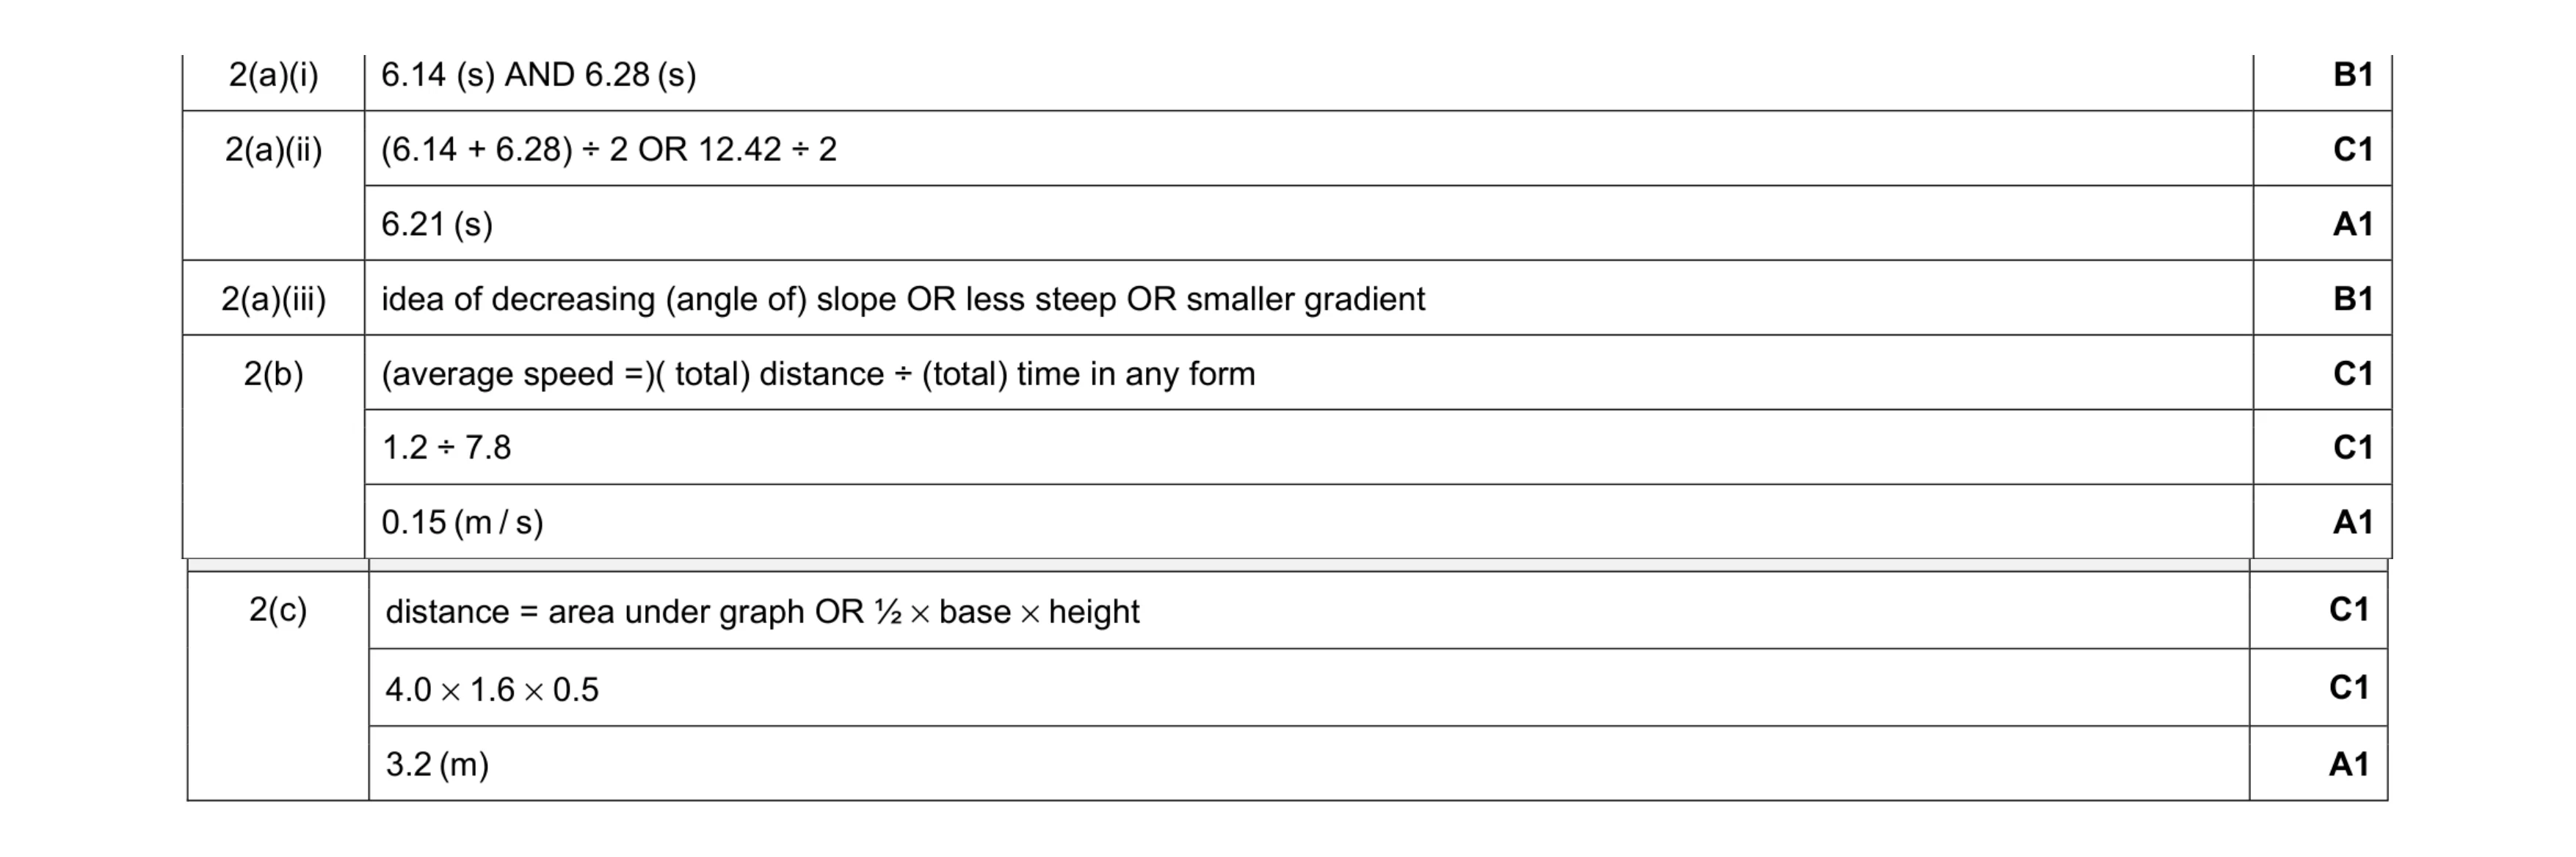 10
10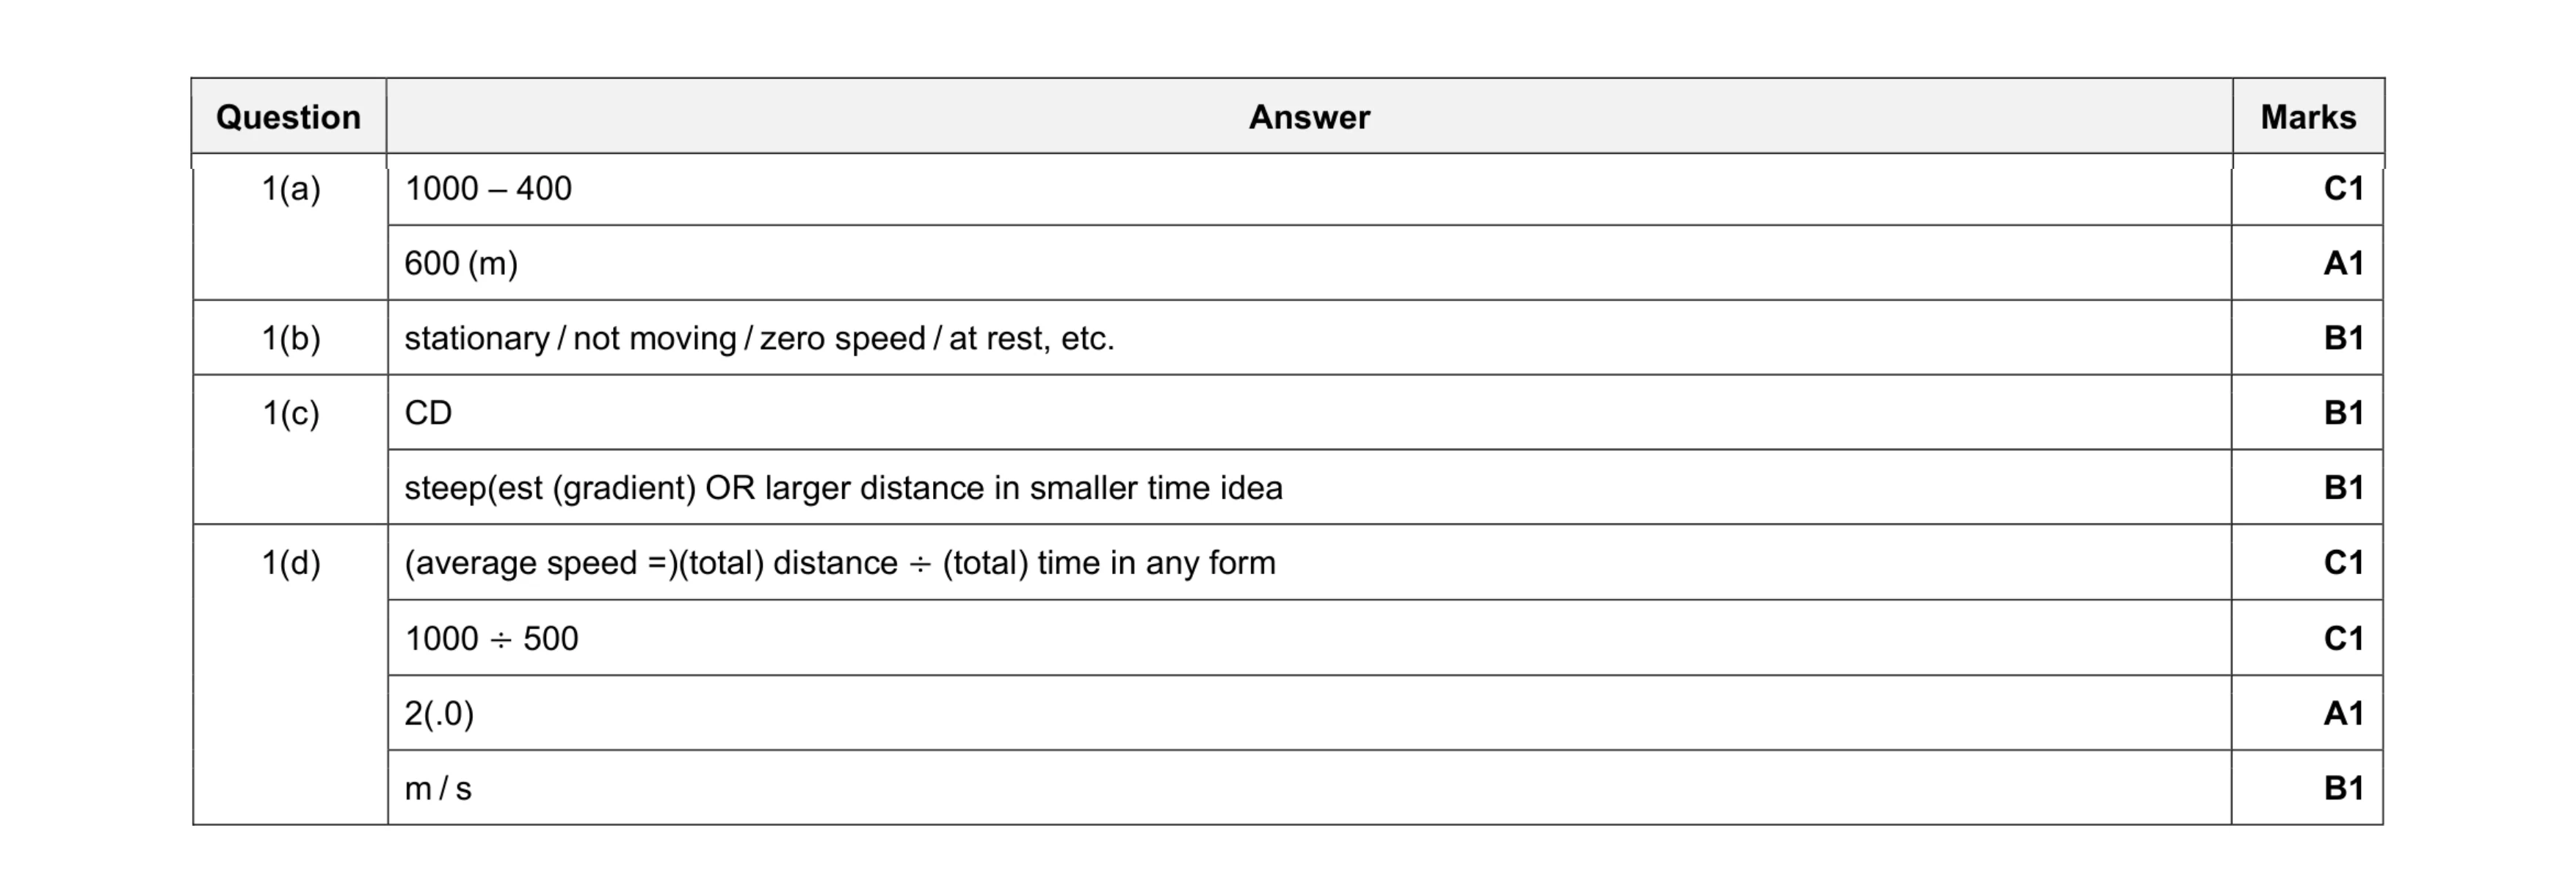 9
9 4
4 4
4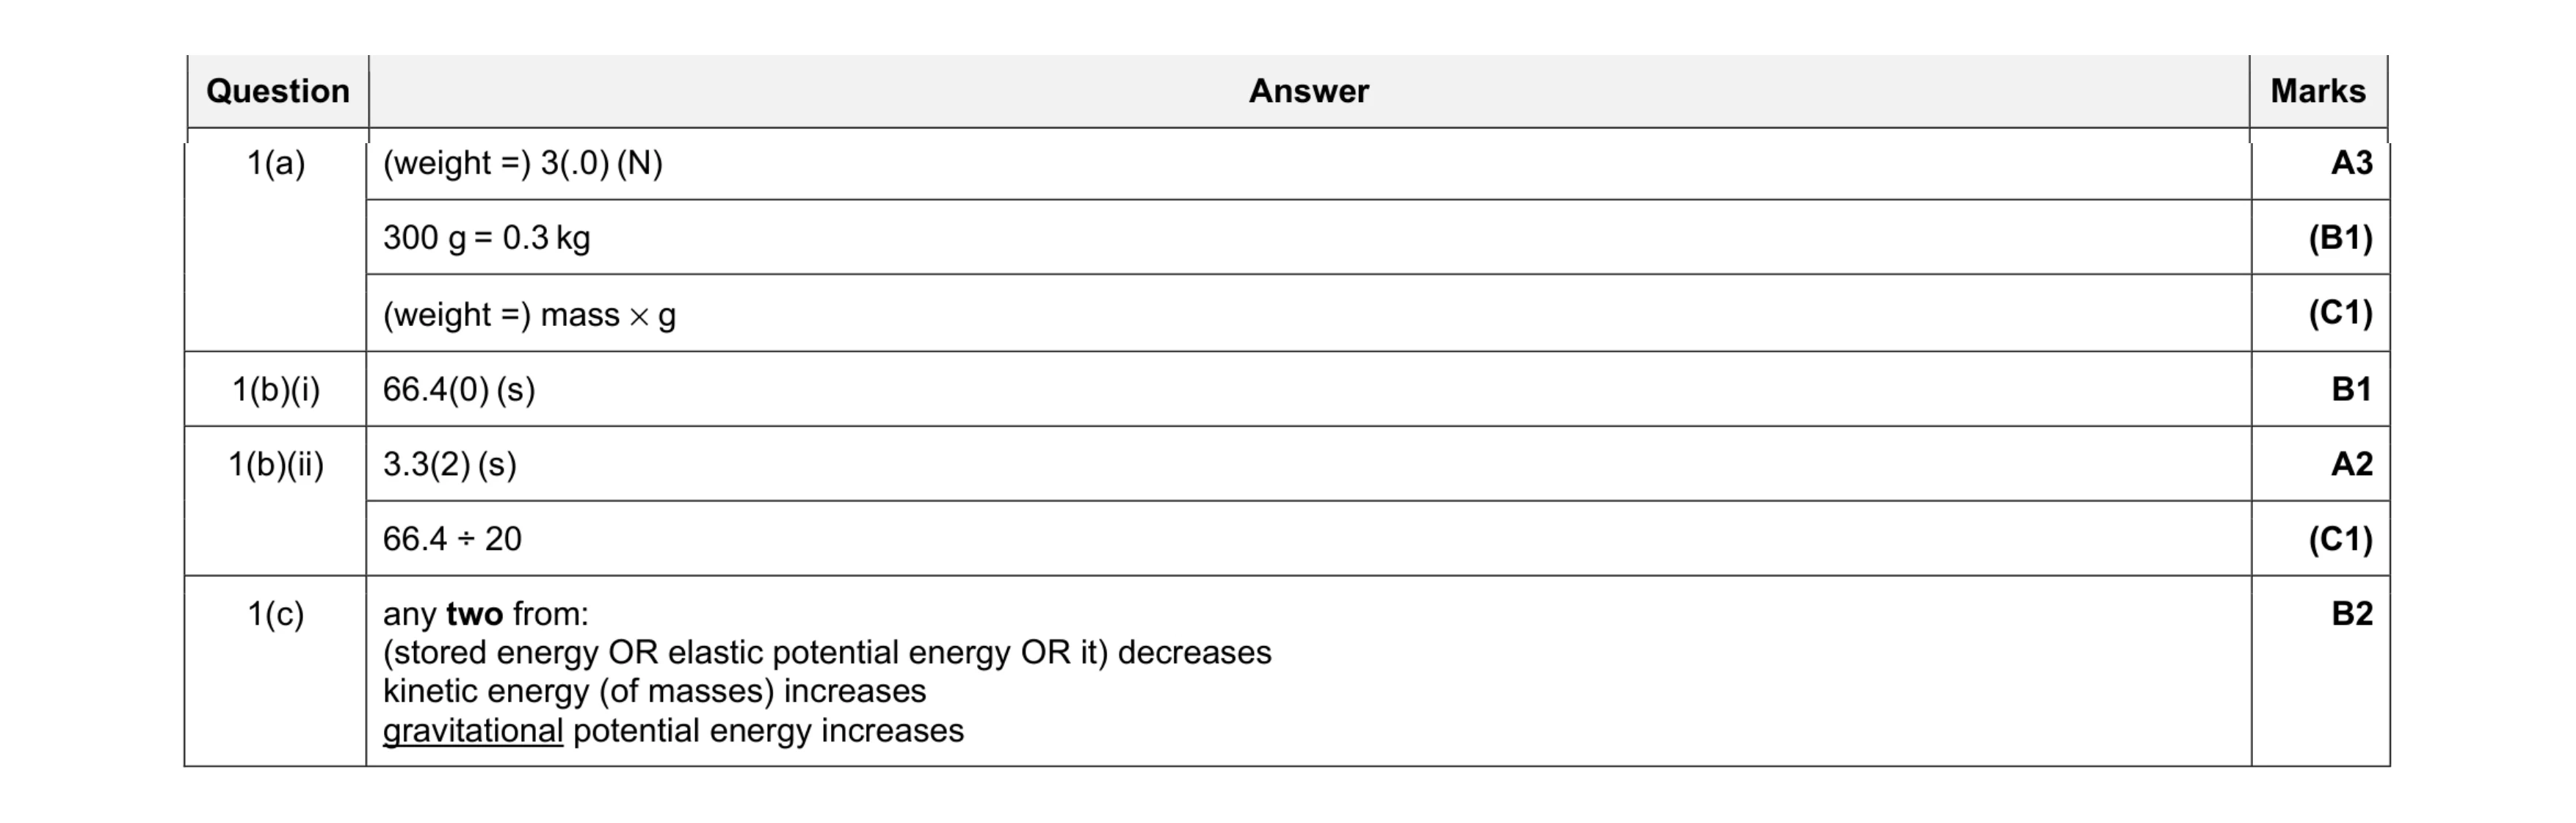 8
8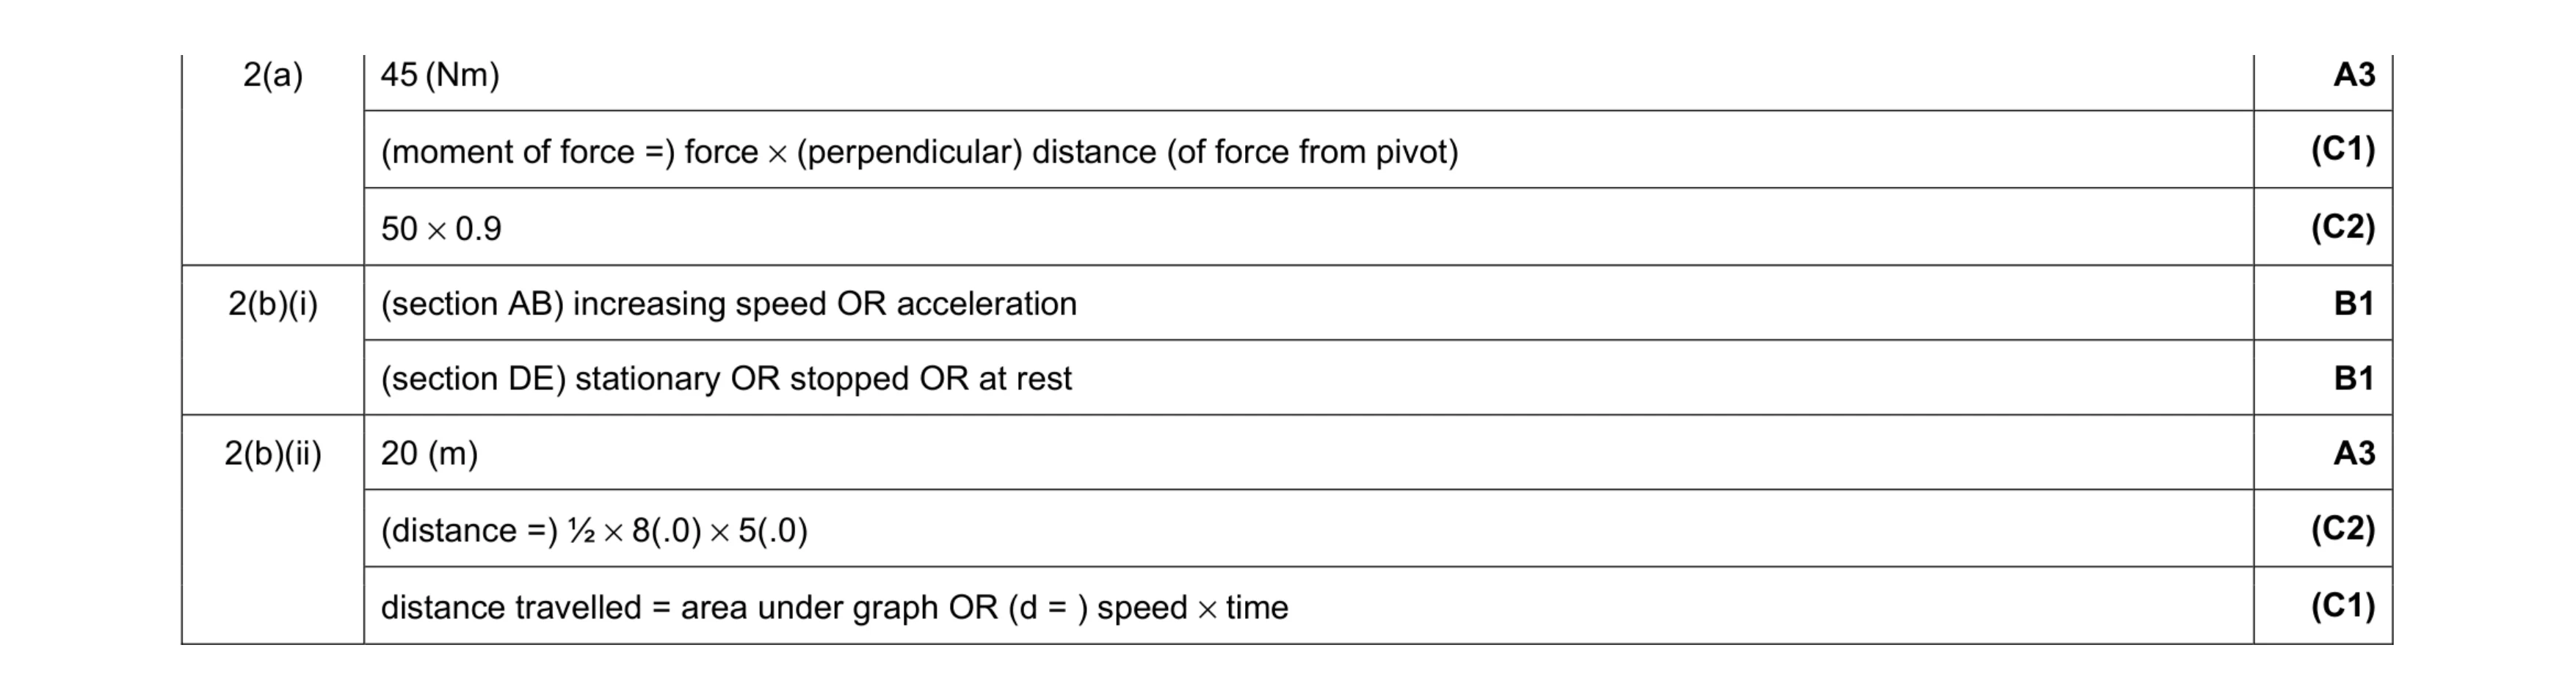 8
8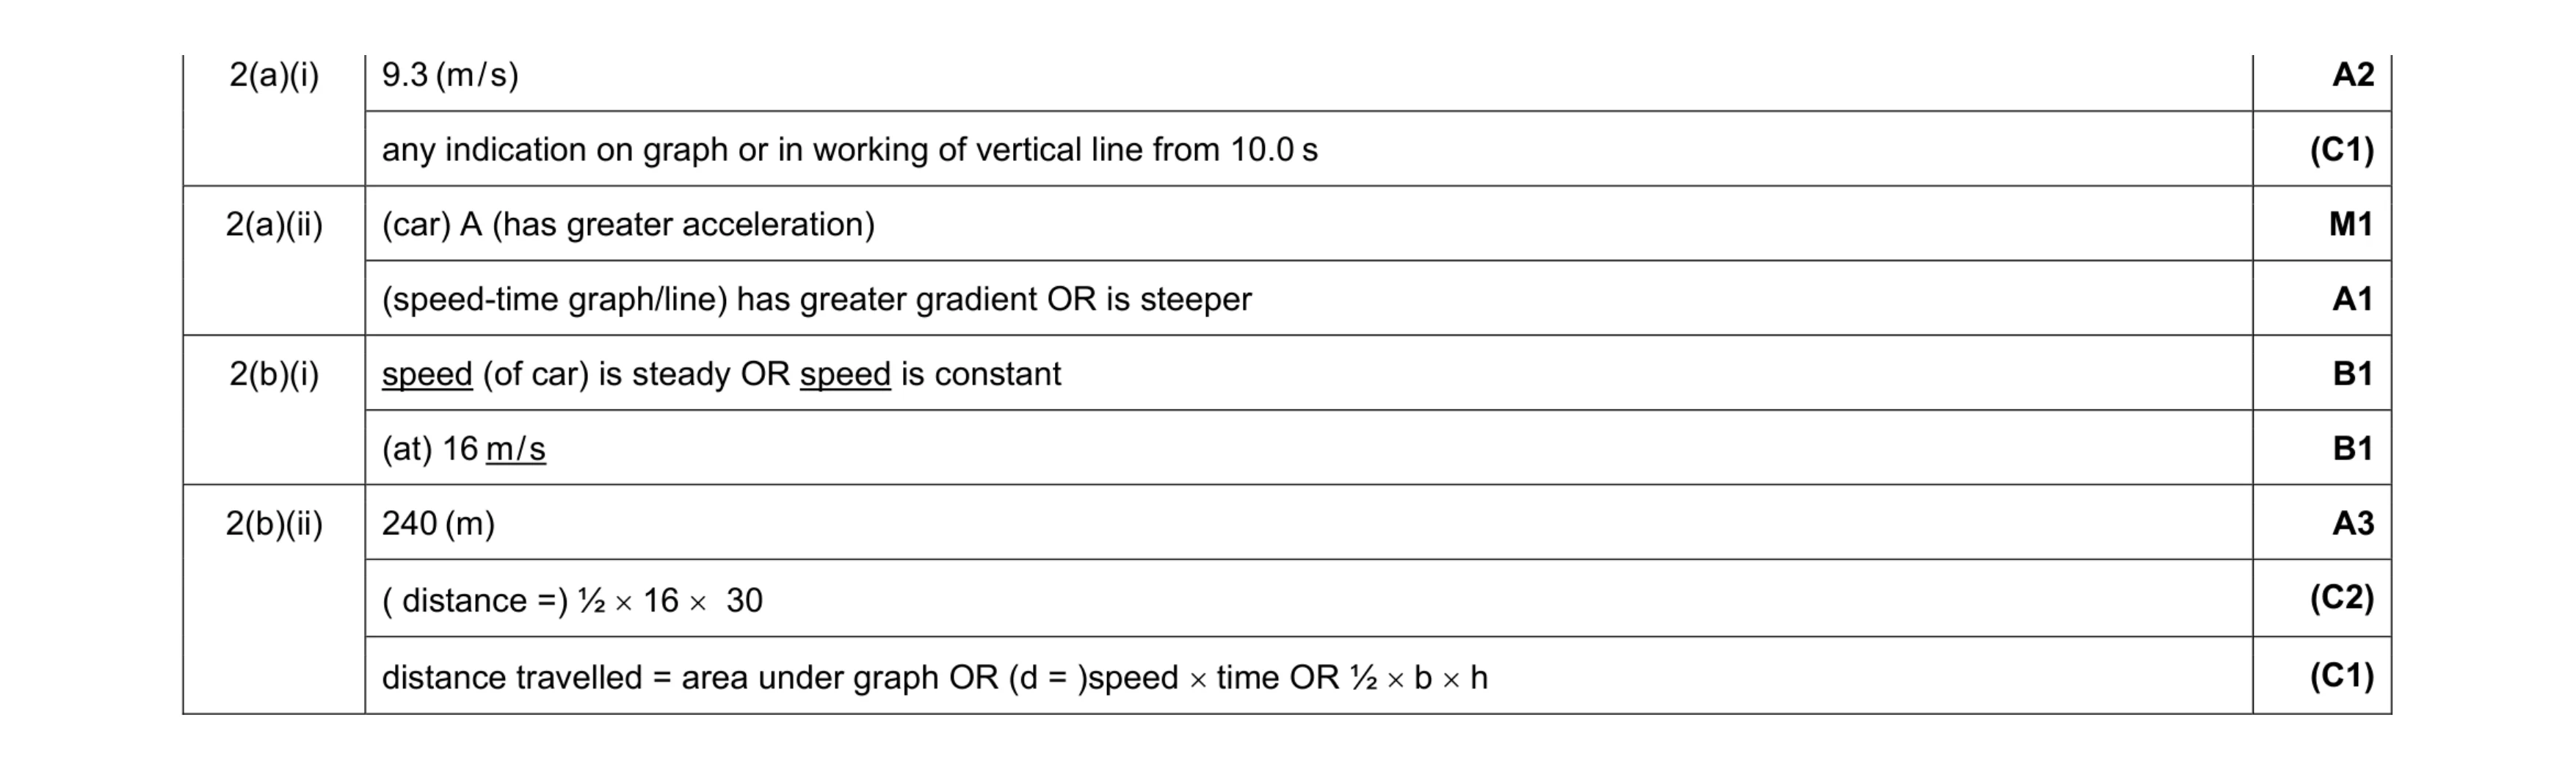 9
9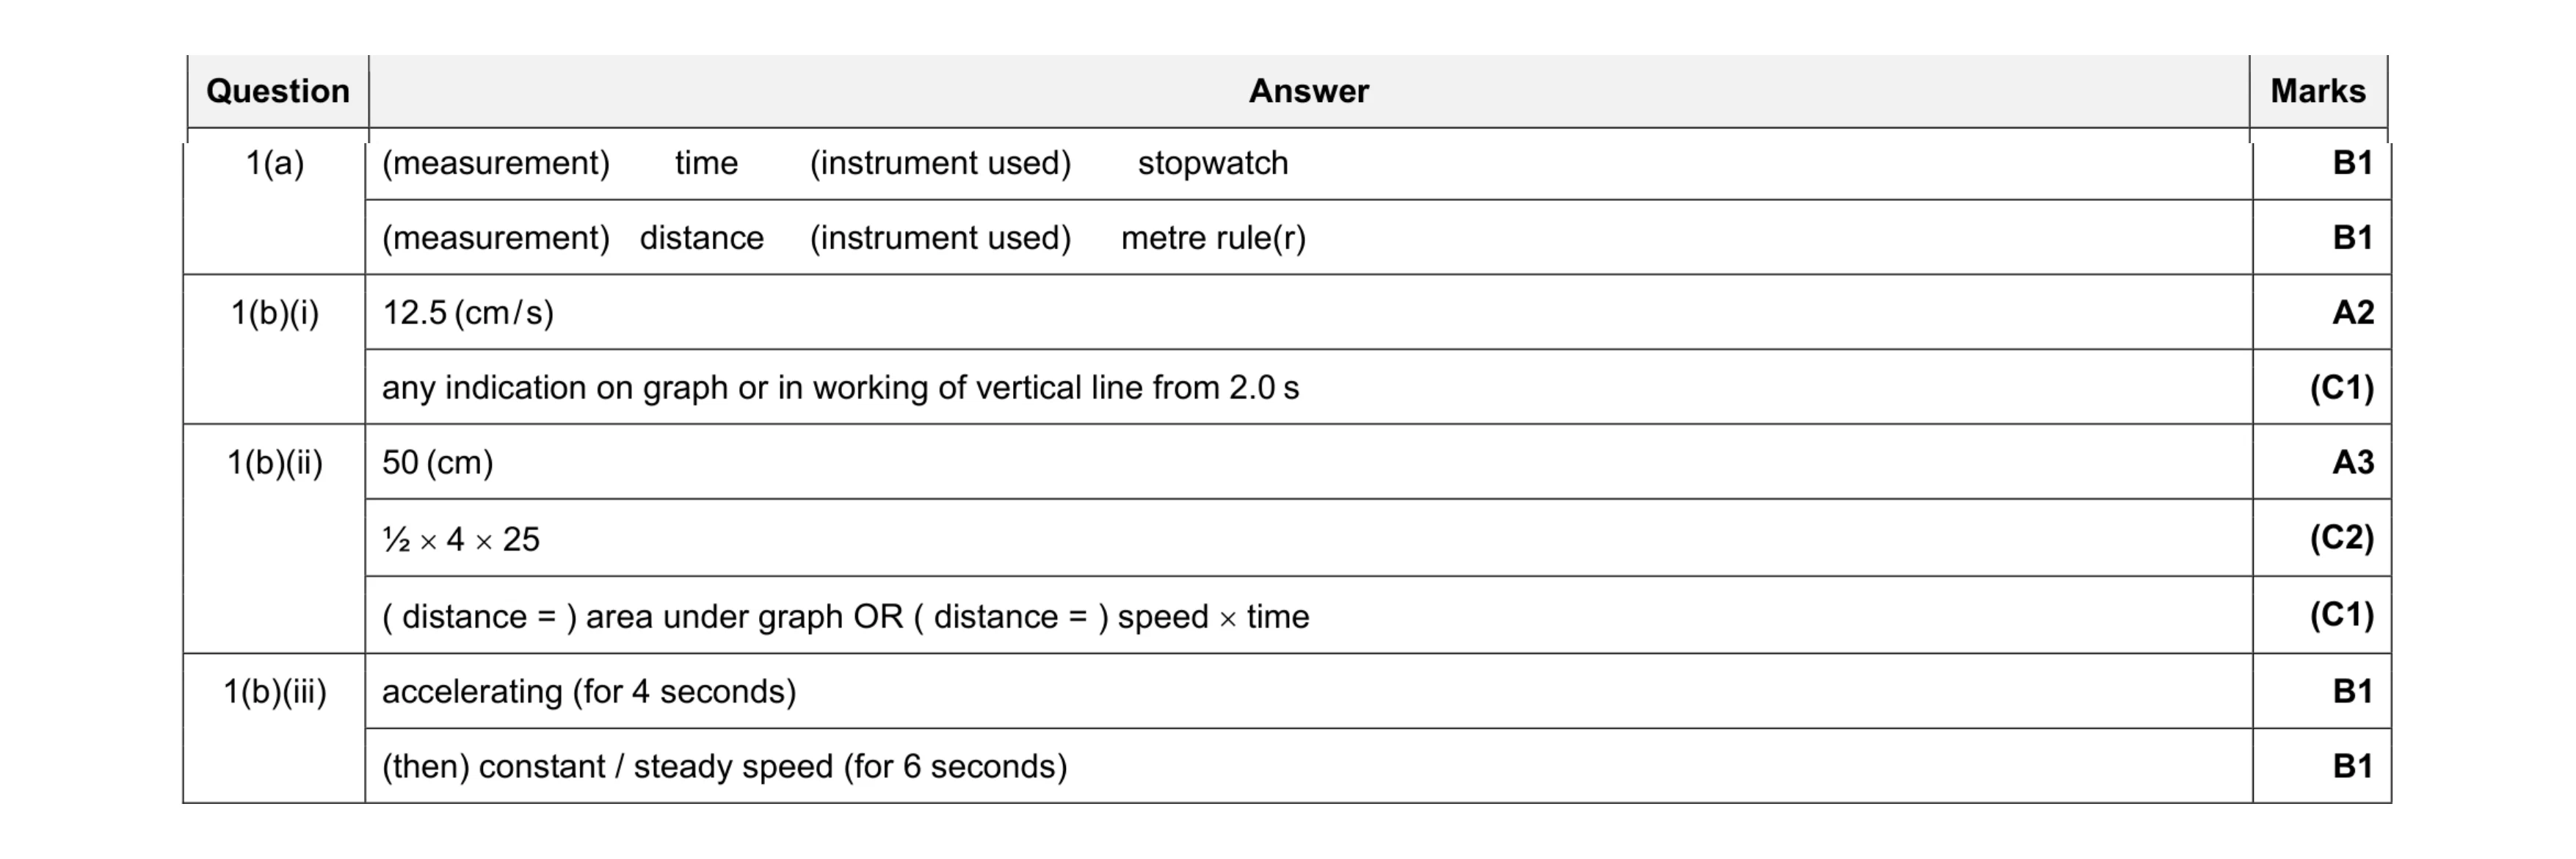 9
9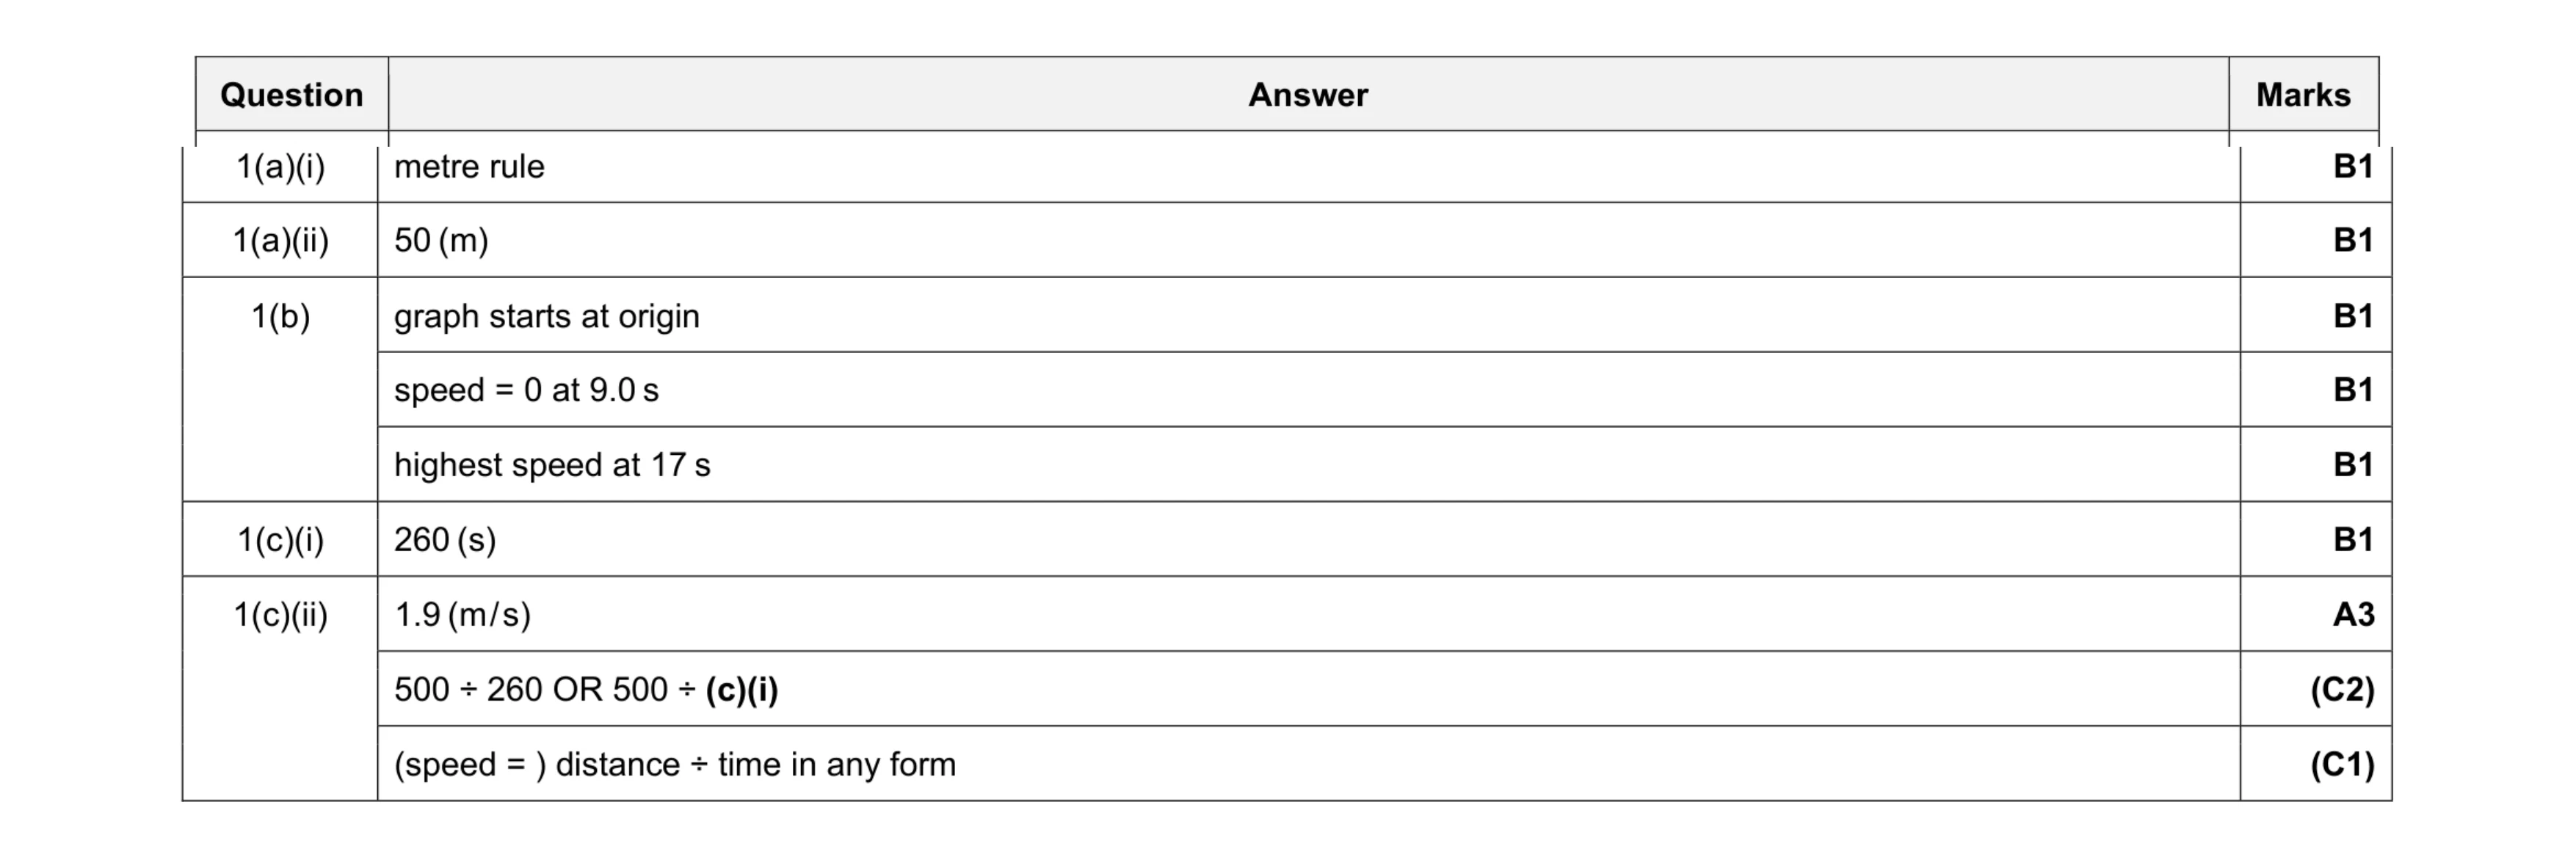 9
9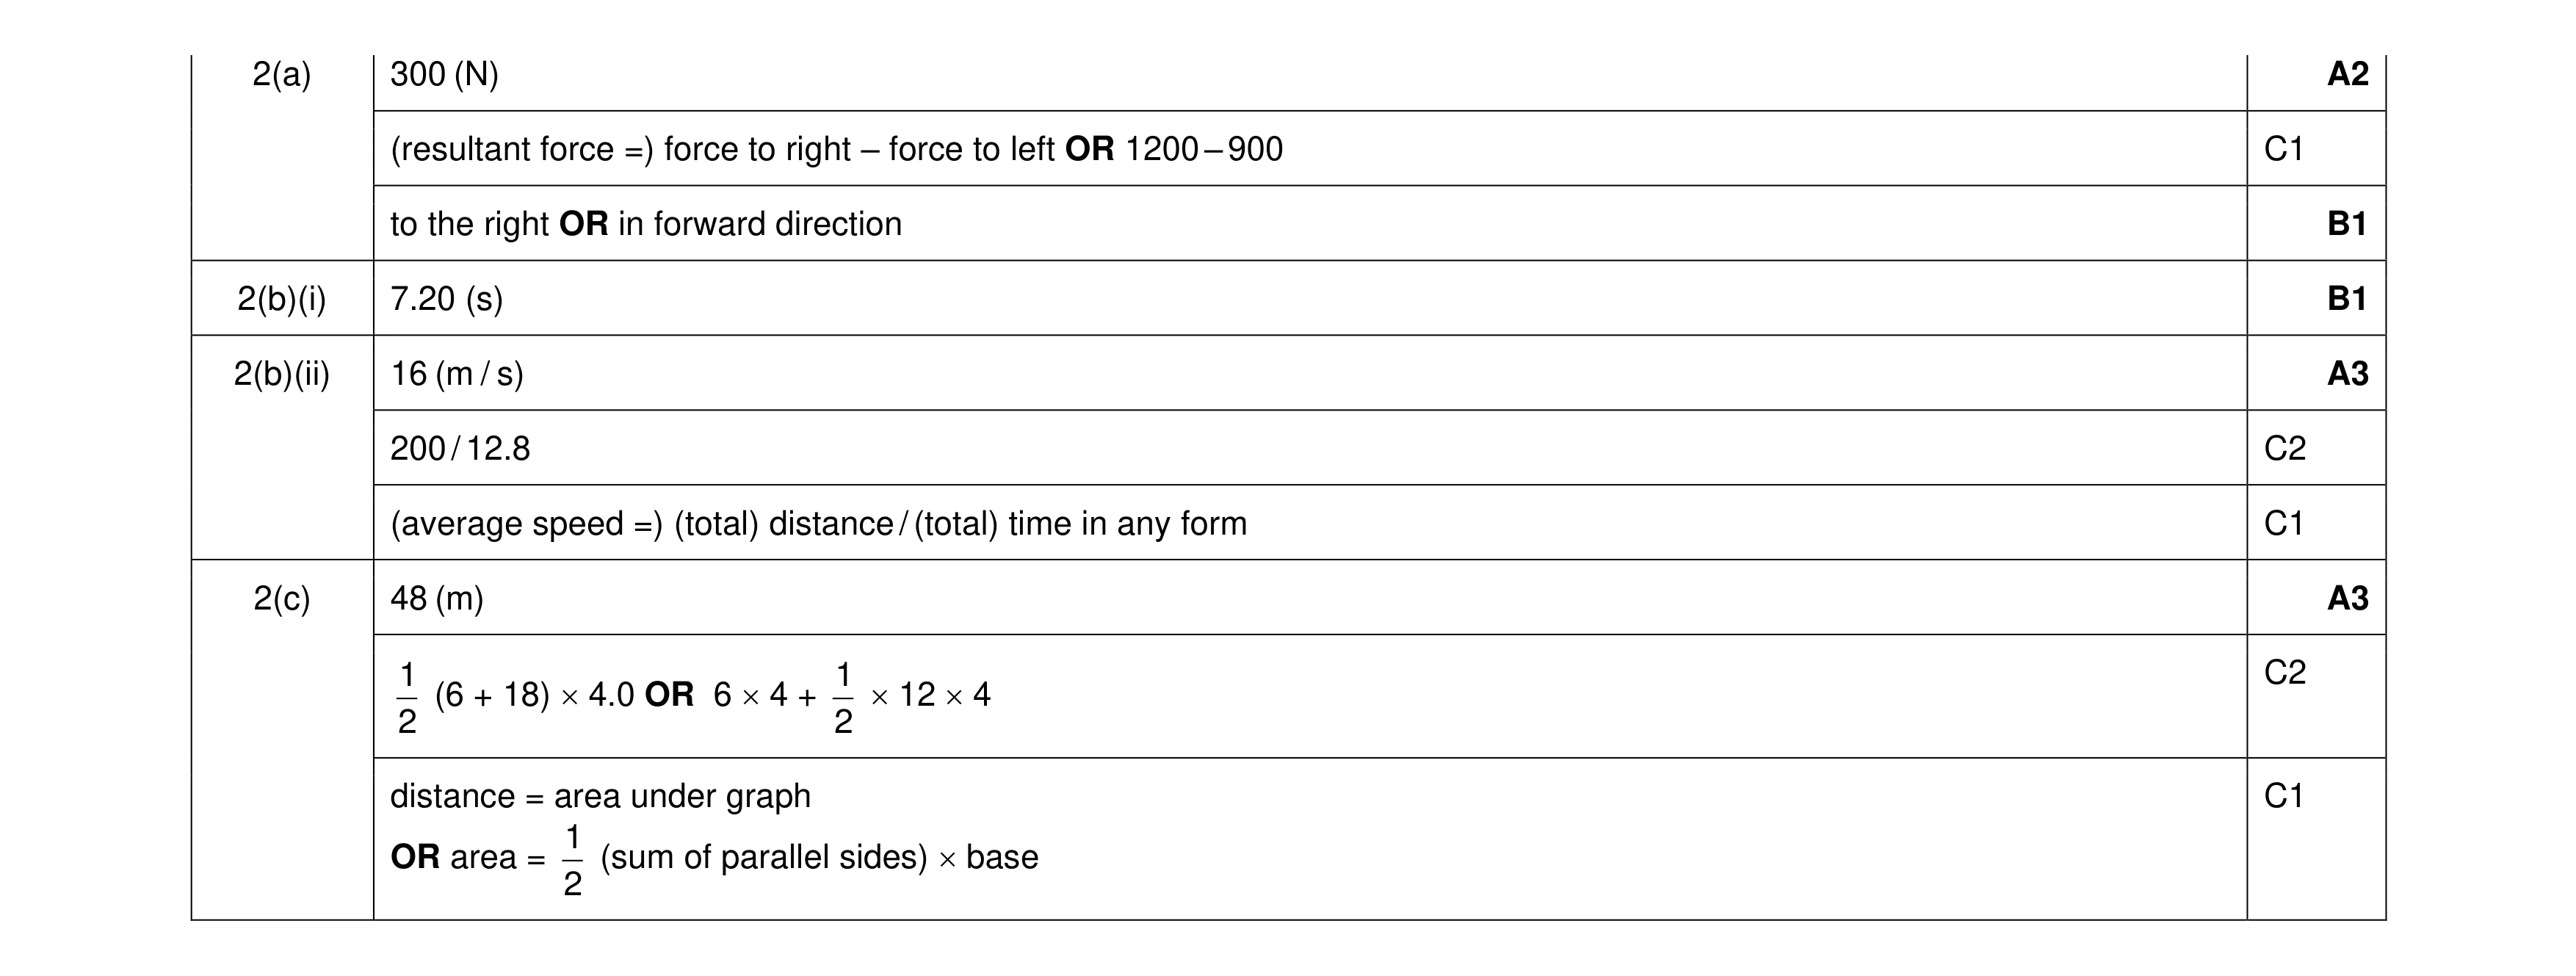 10
10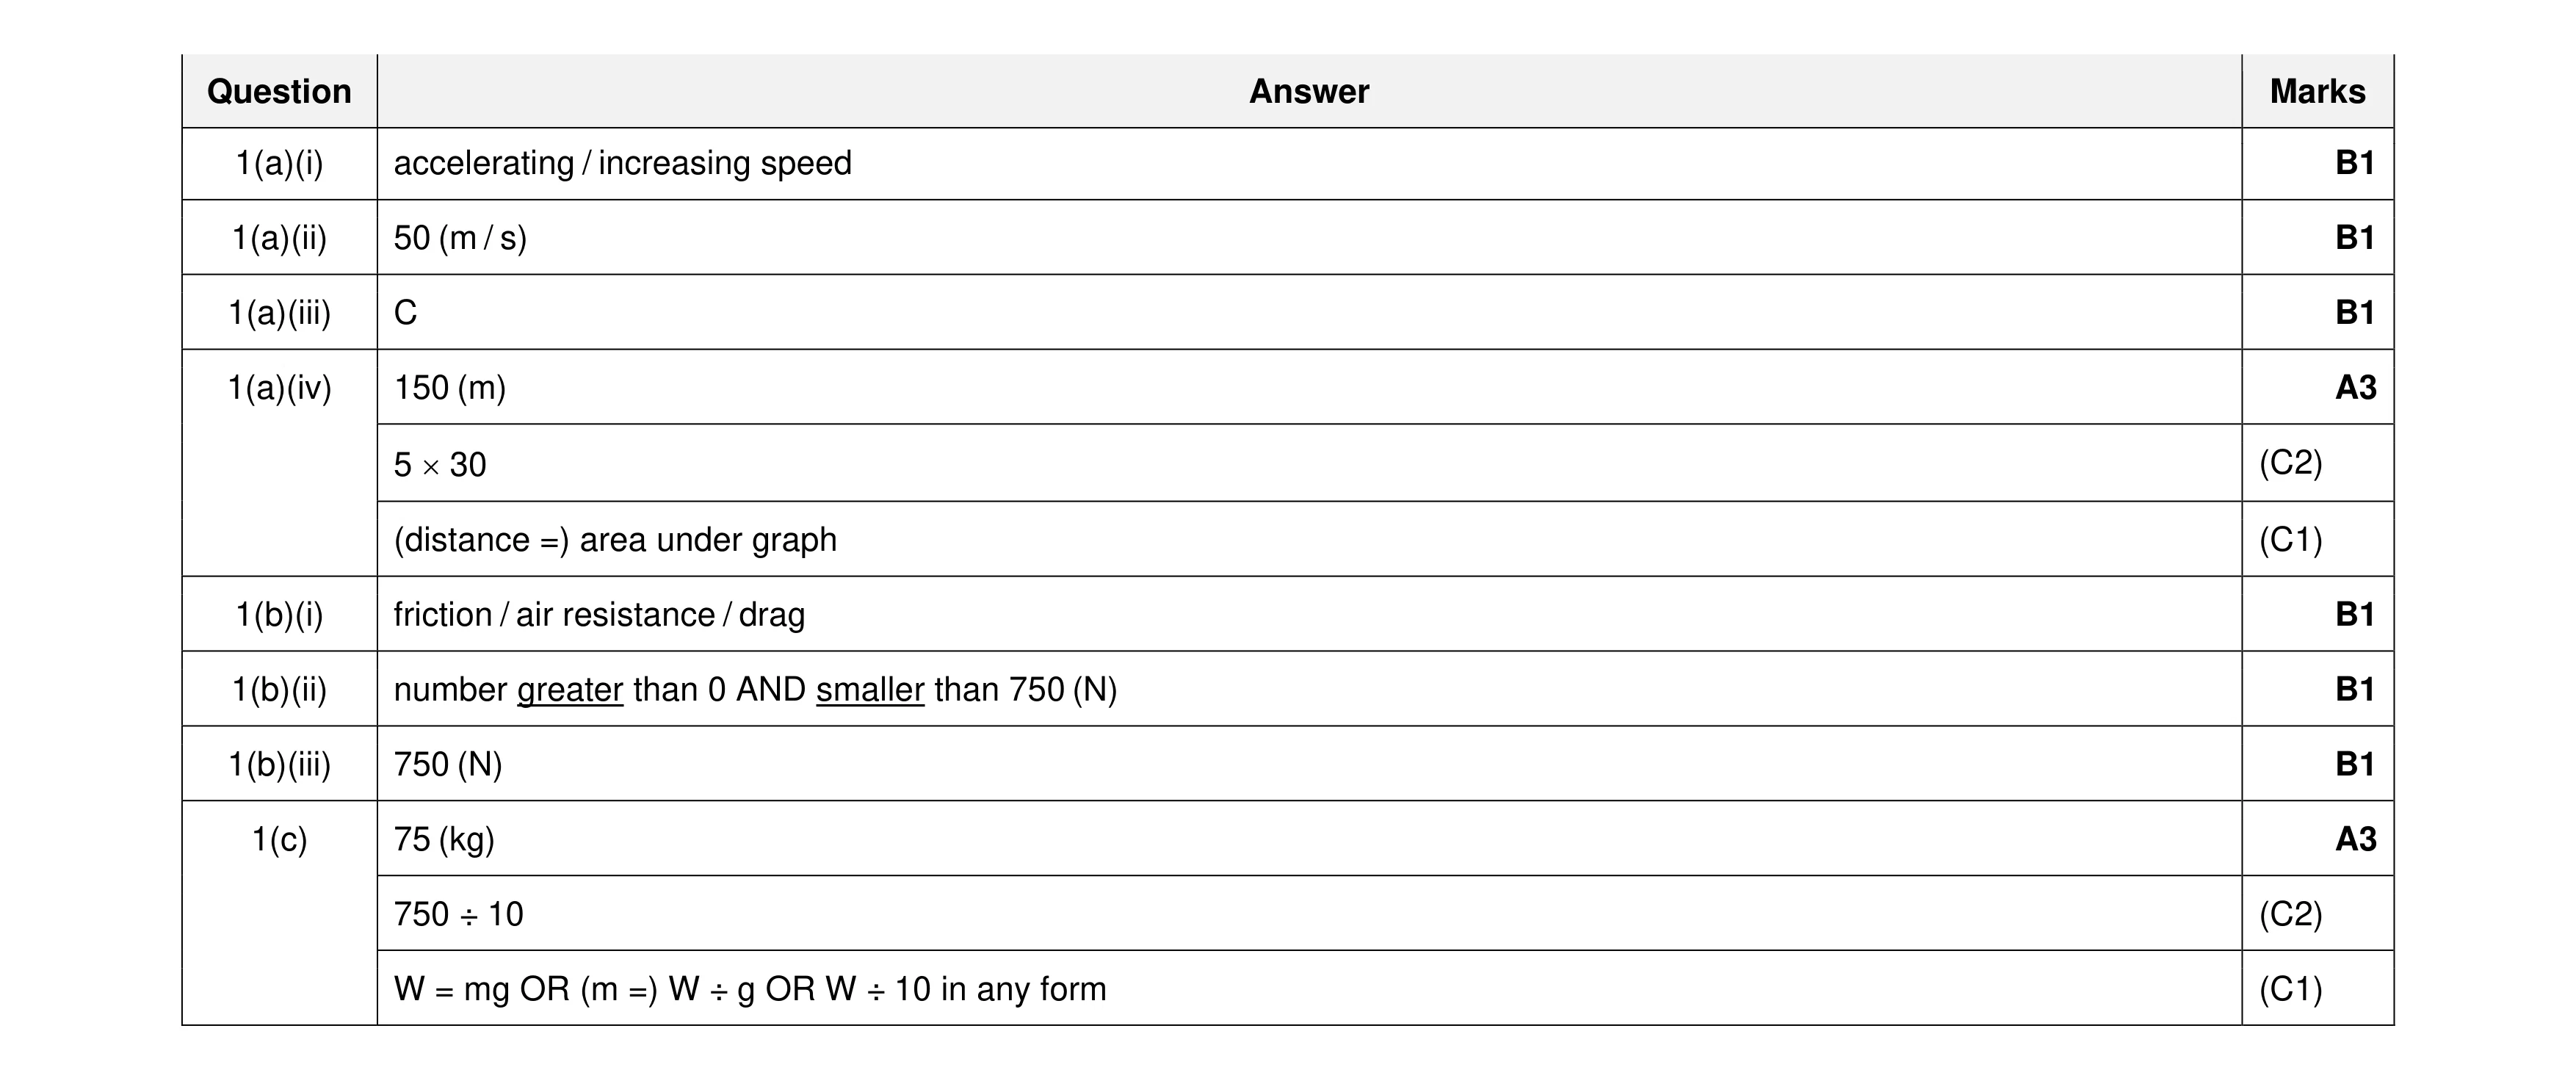 12
12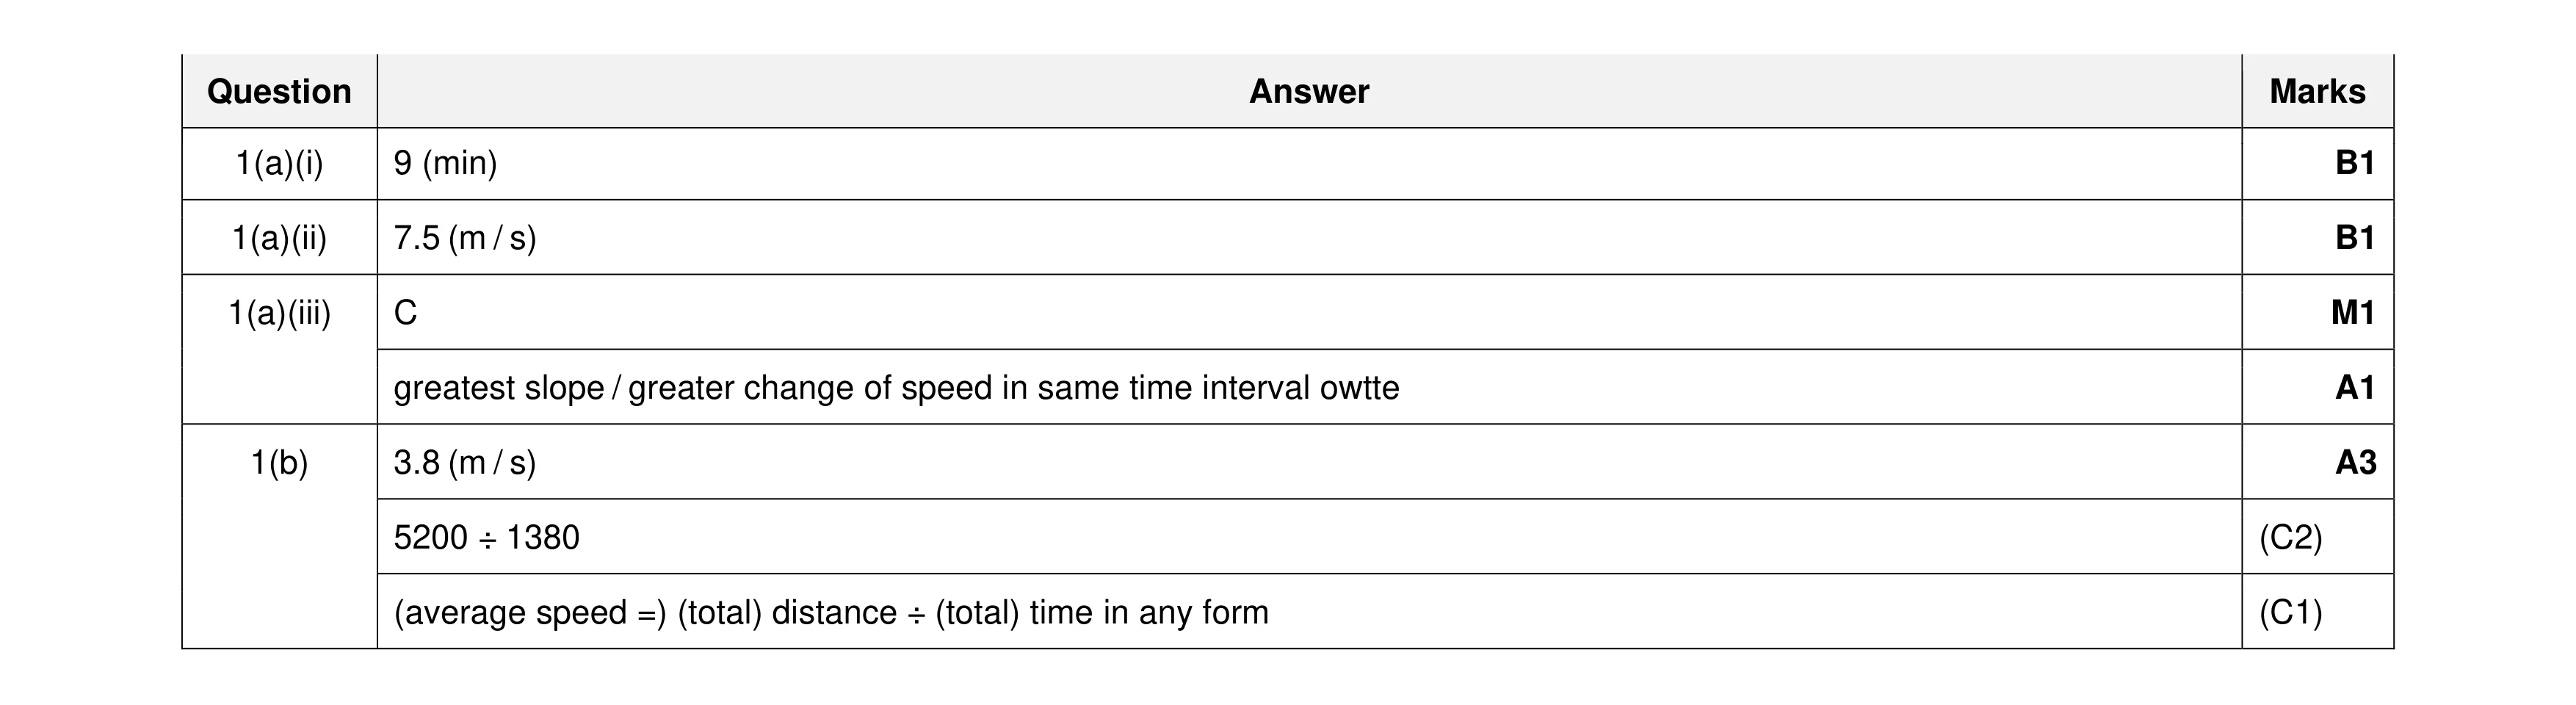 7
7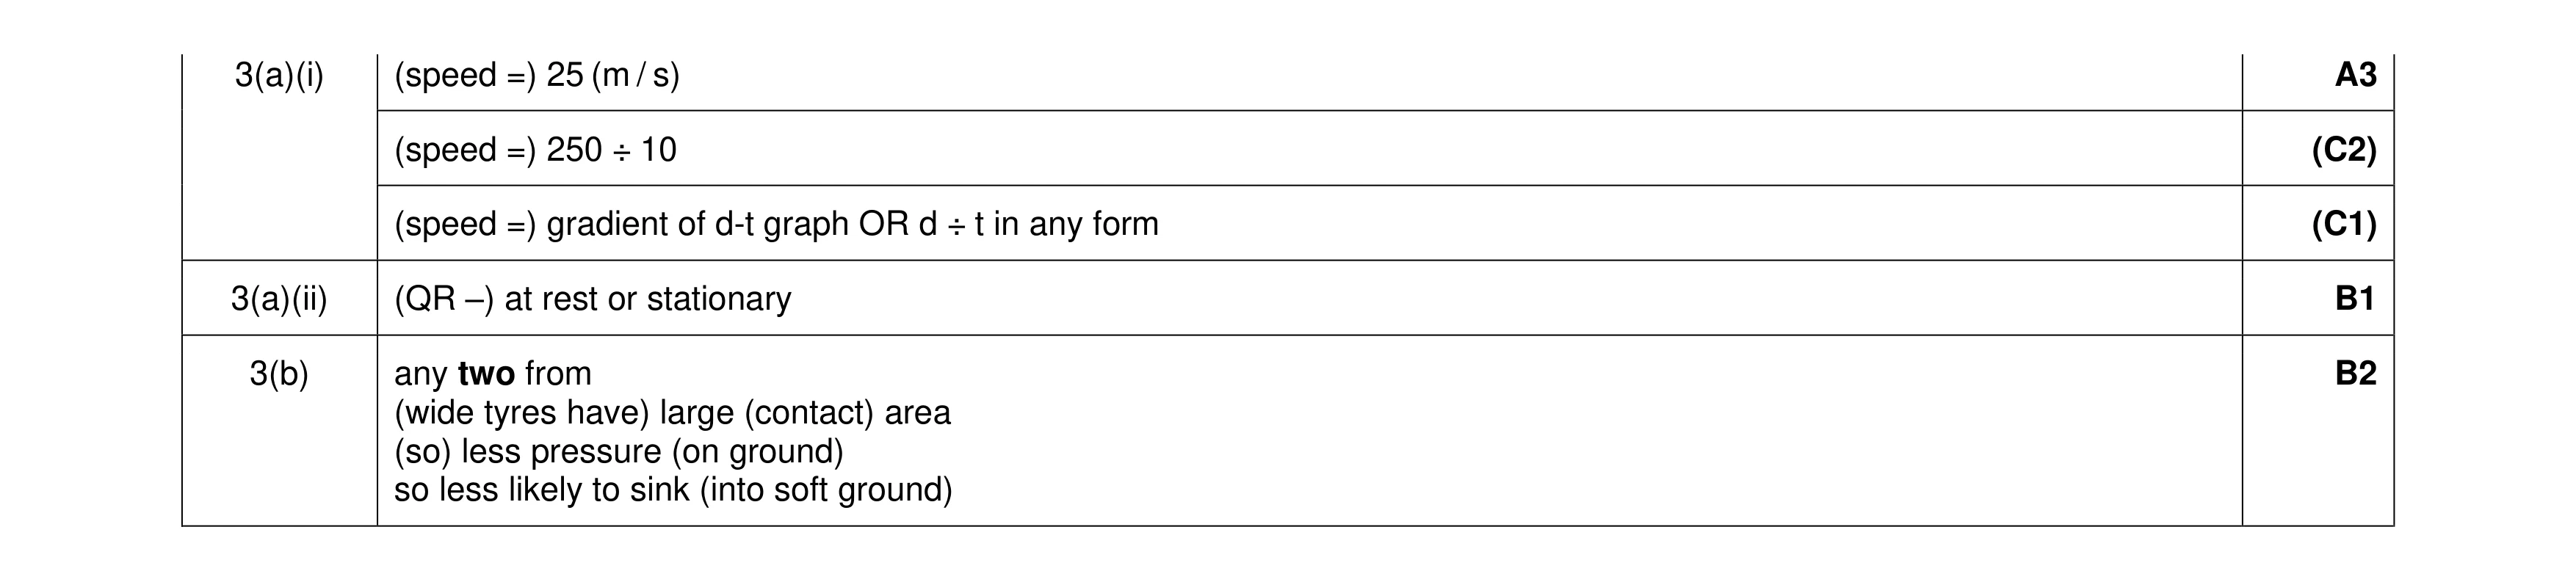 6
6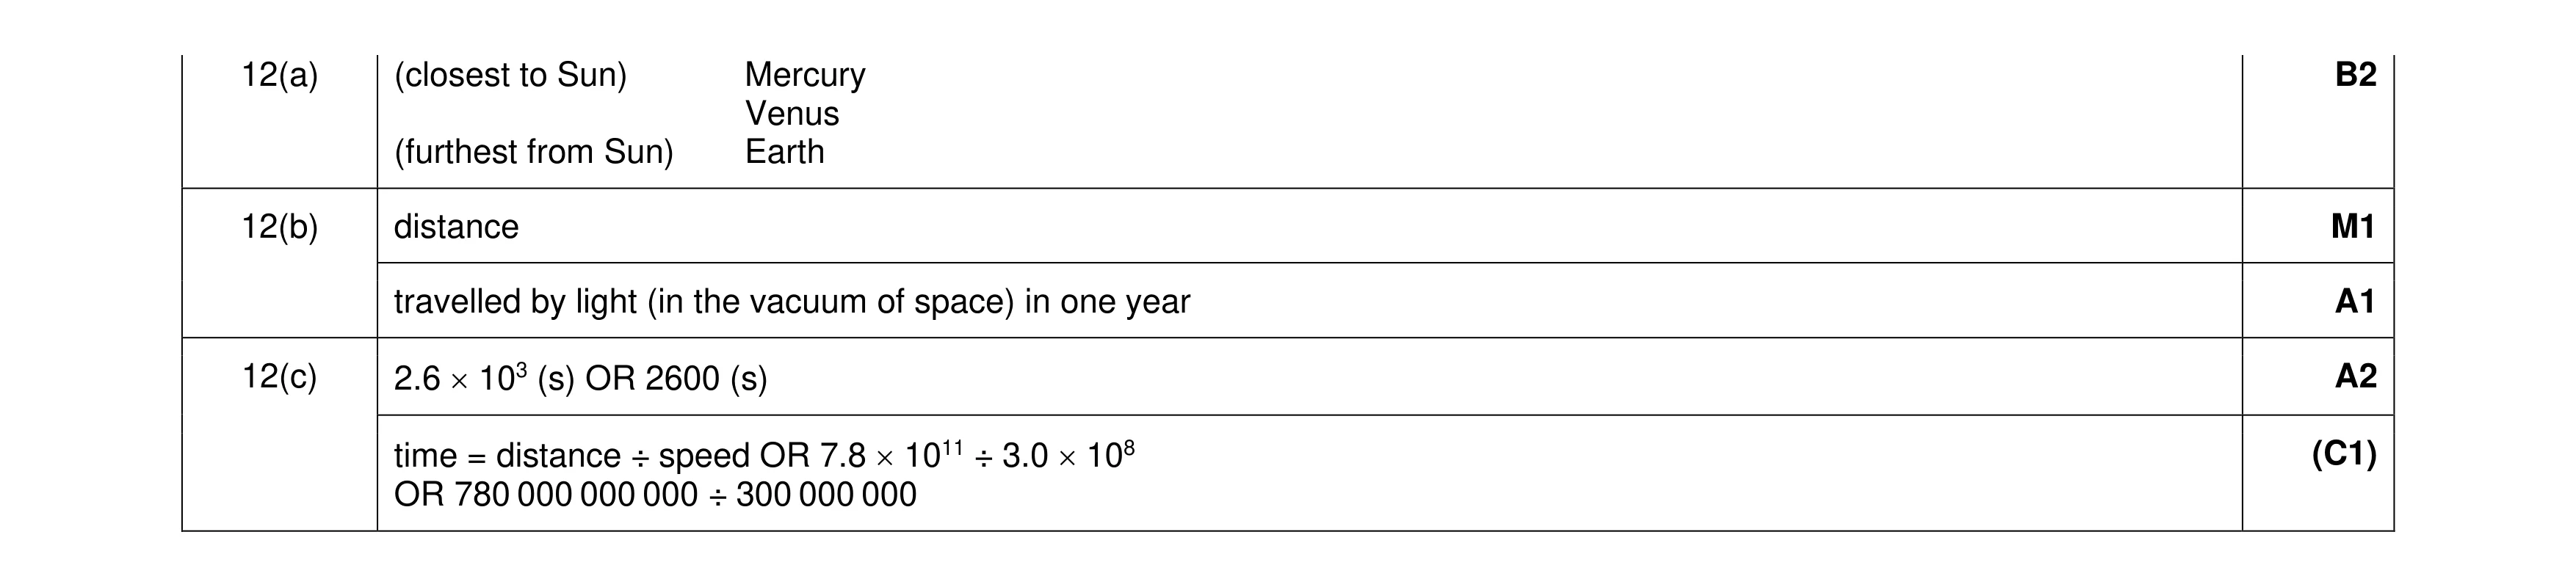 6
6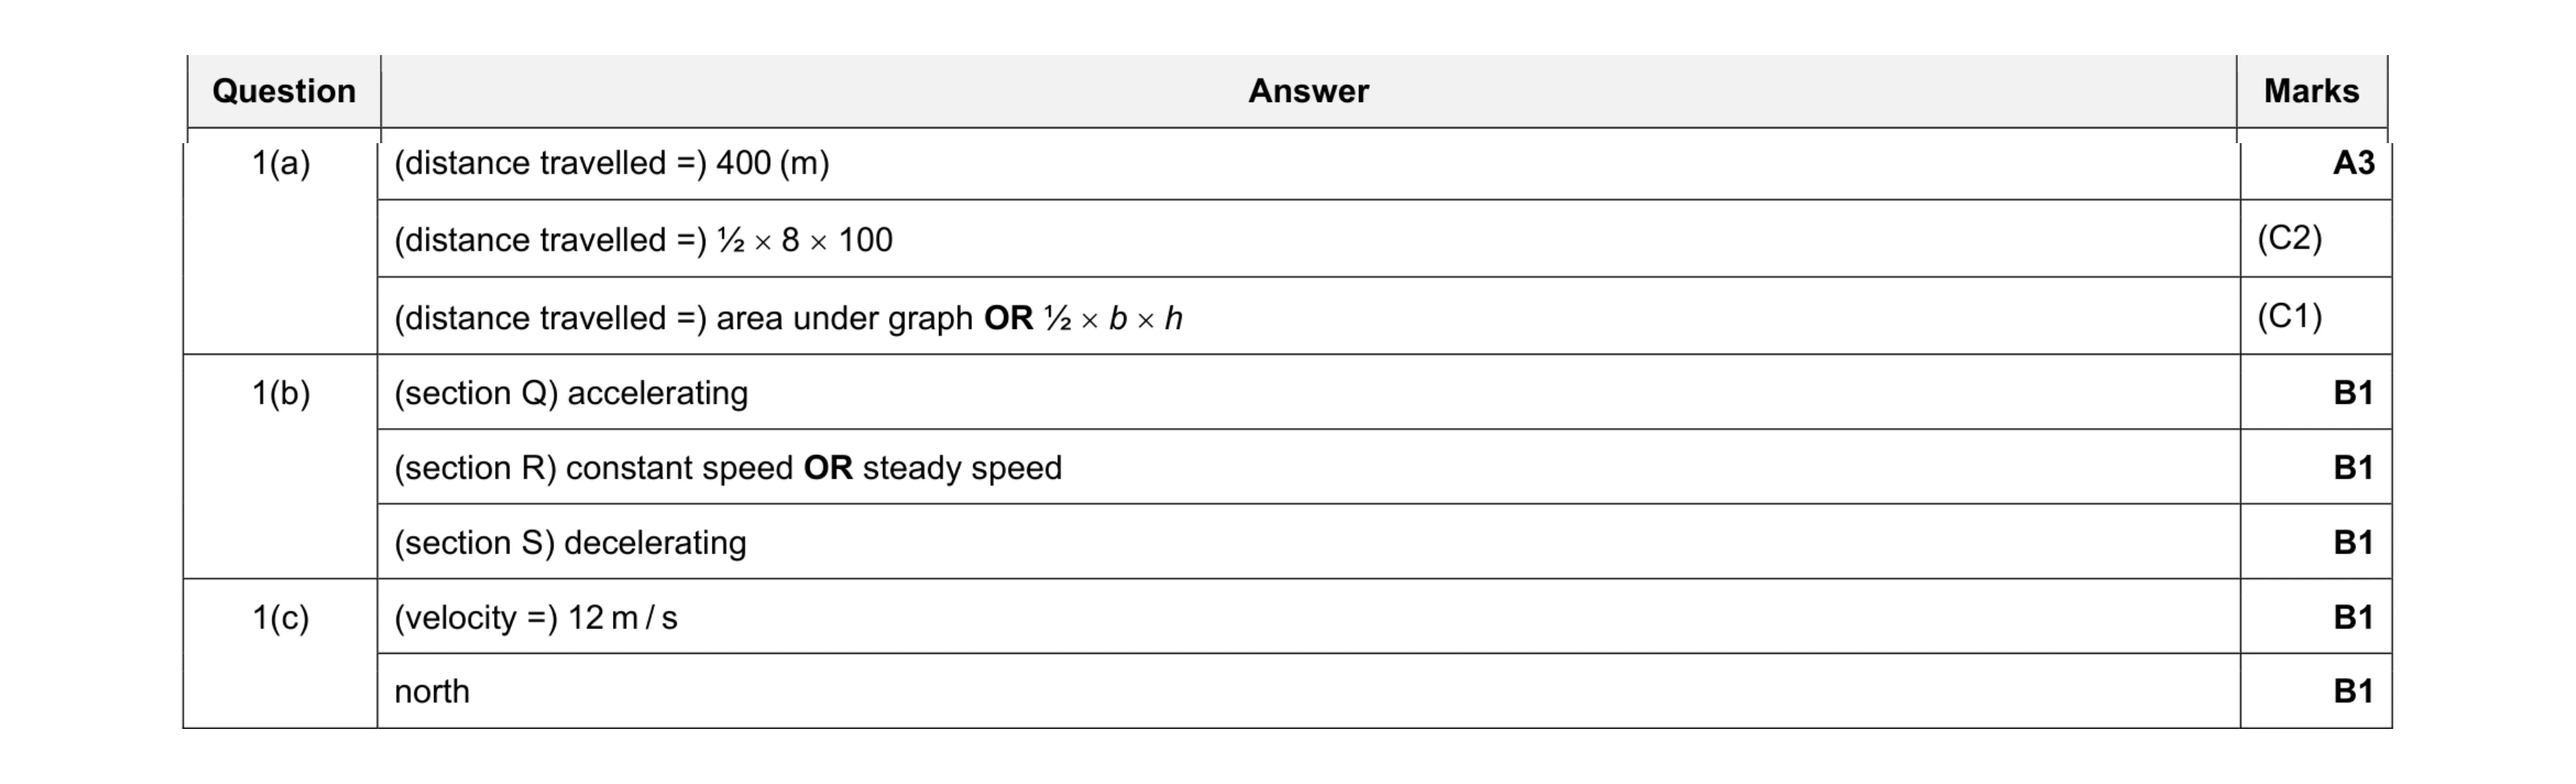 8
8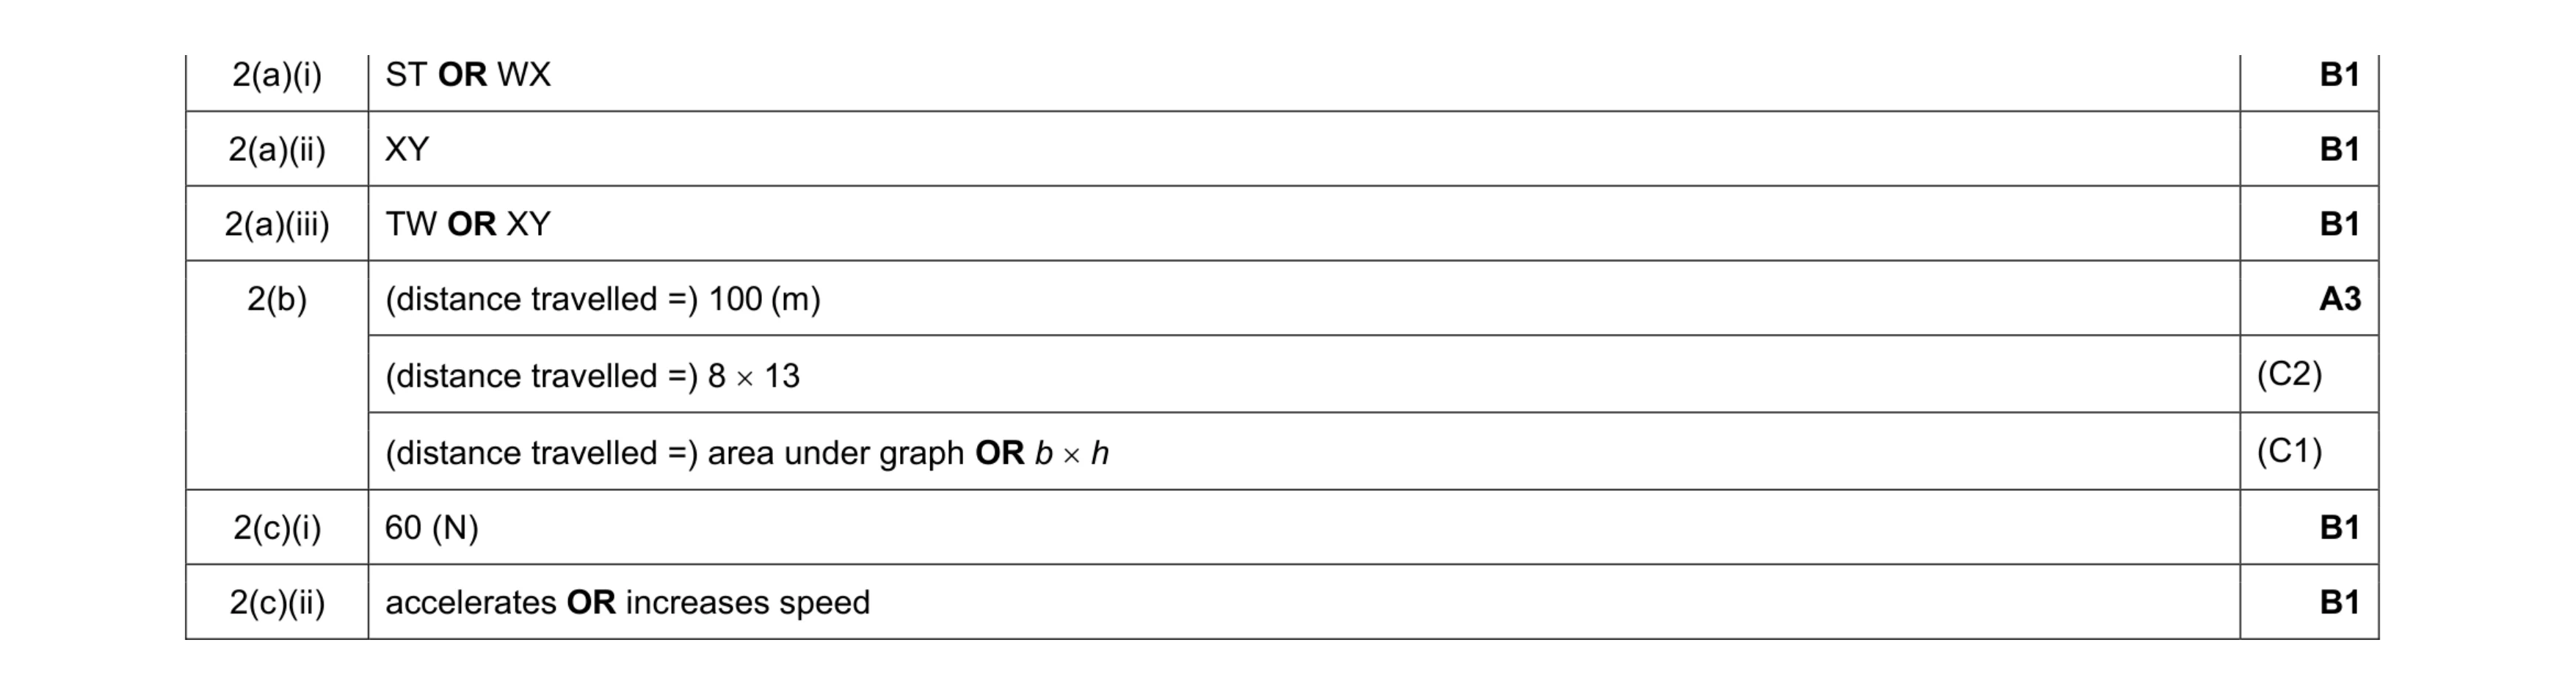 8
8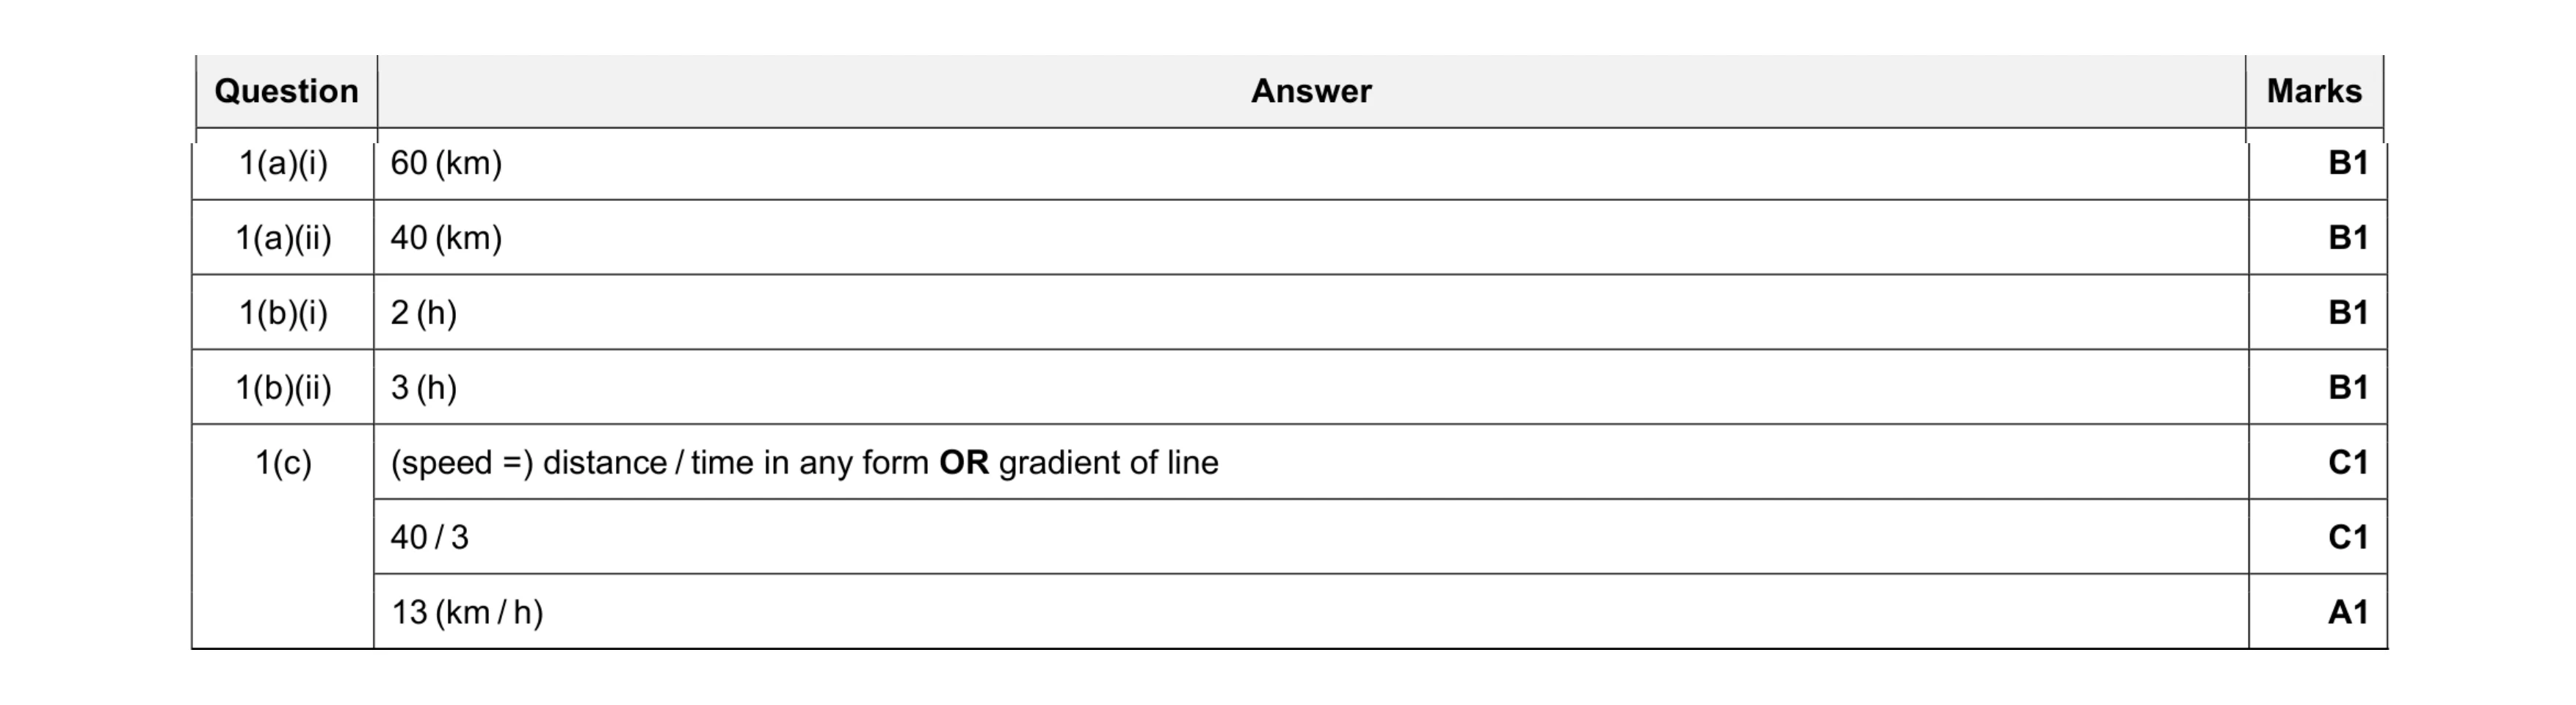 7
7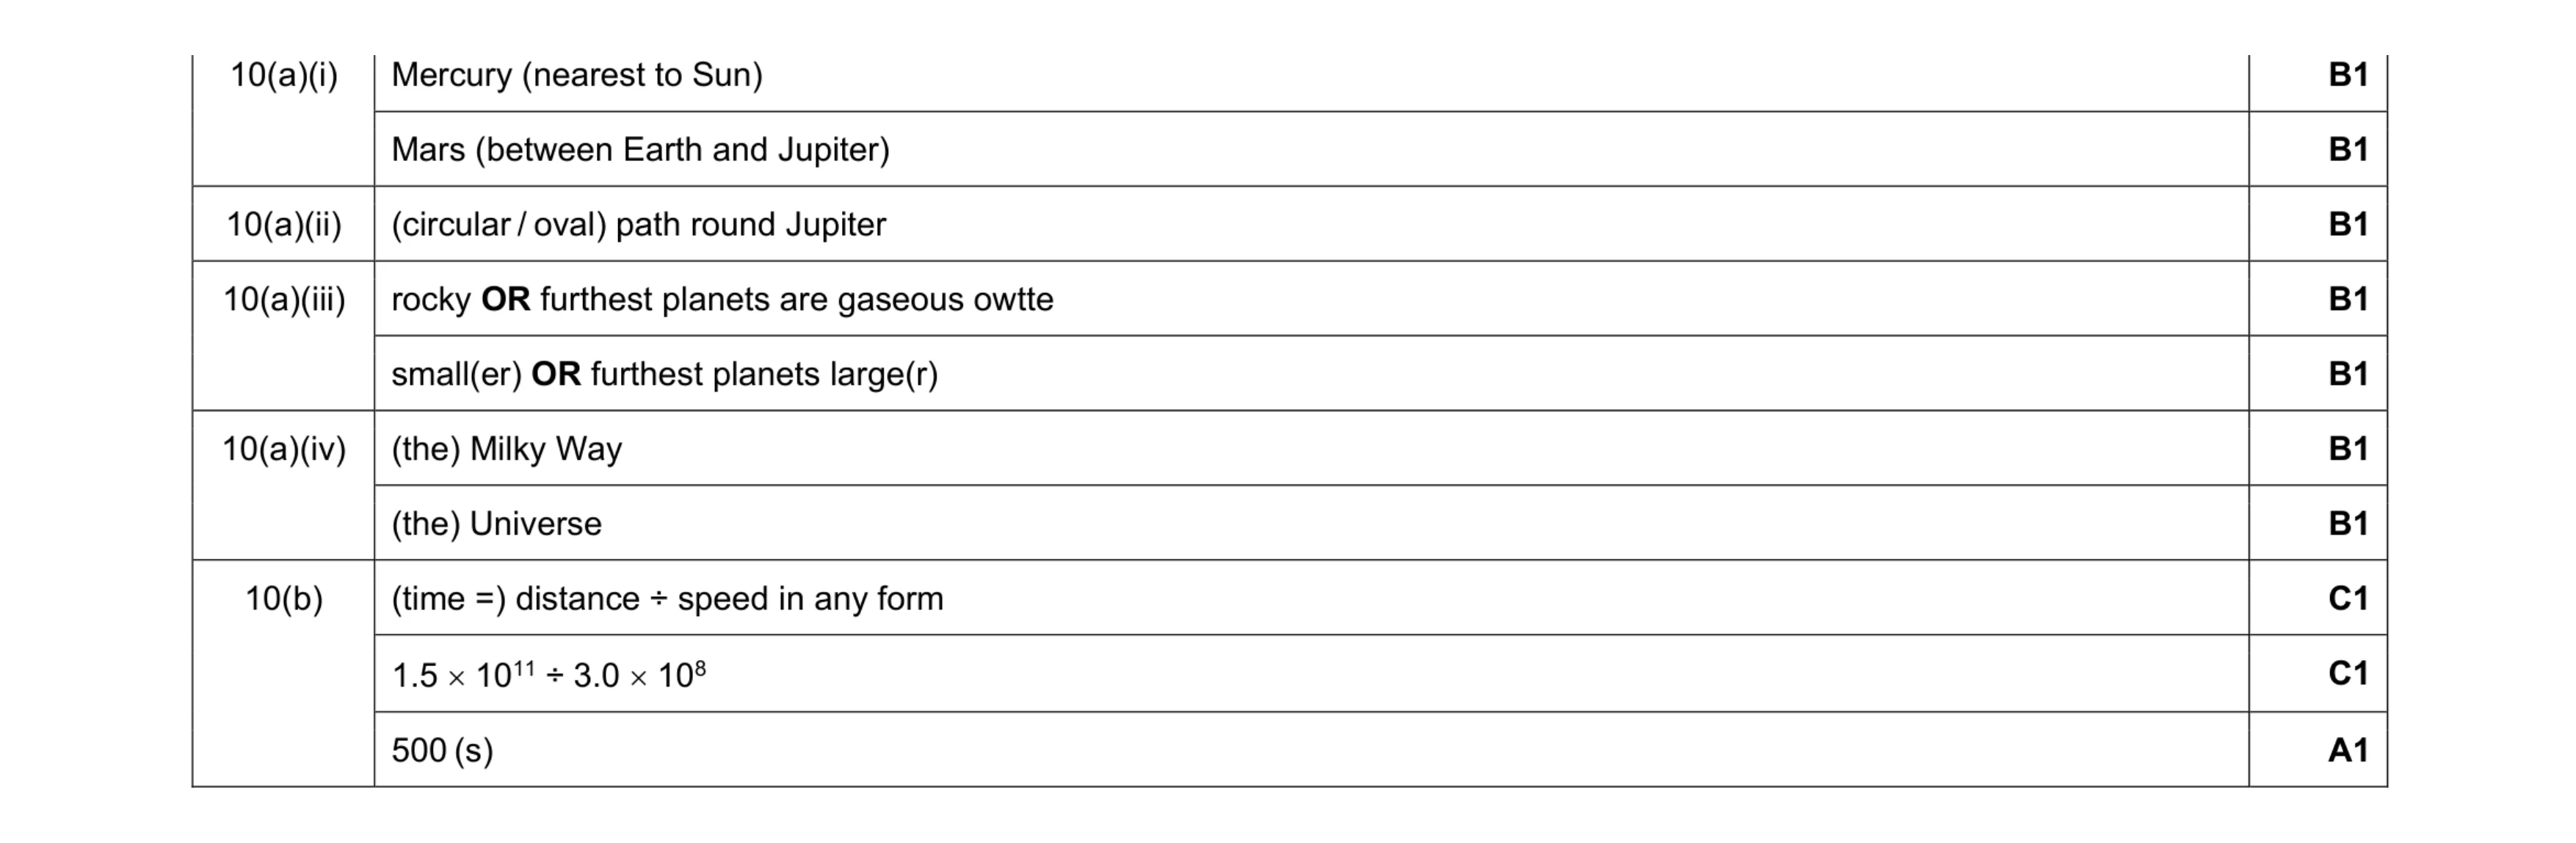 10
10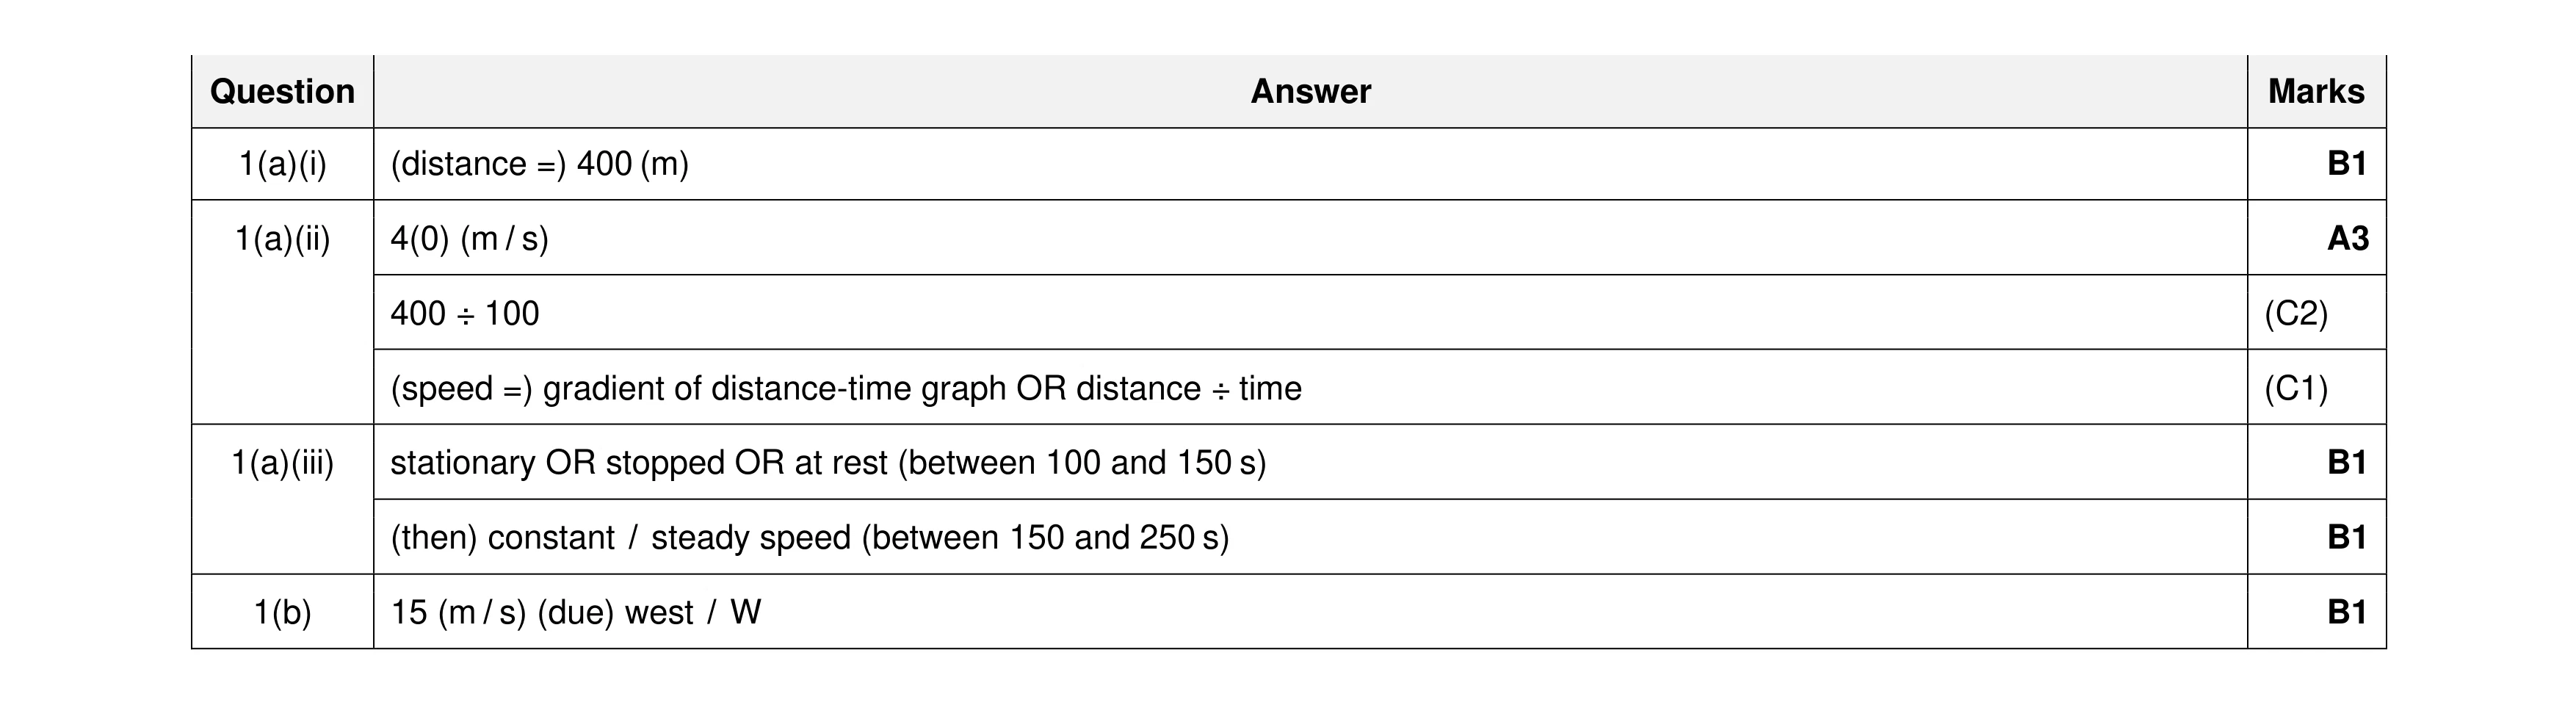 7
7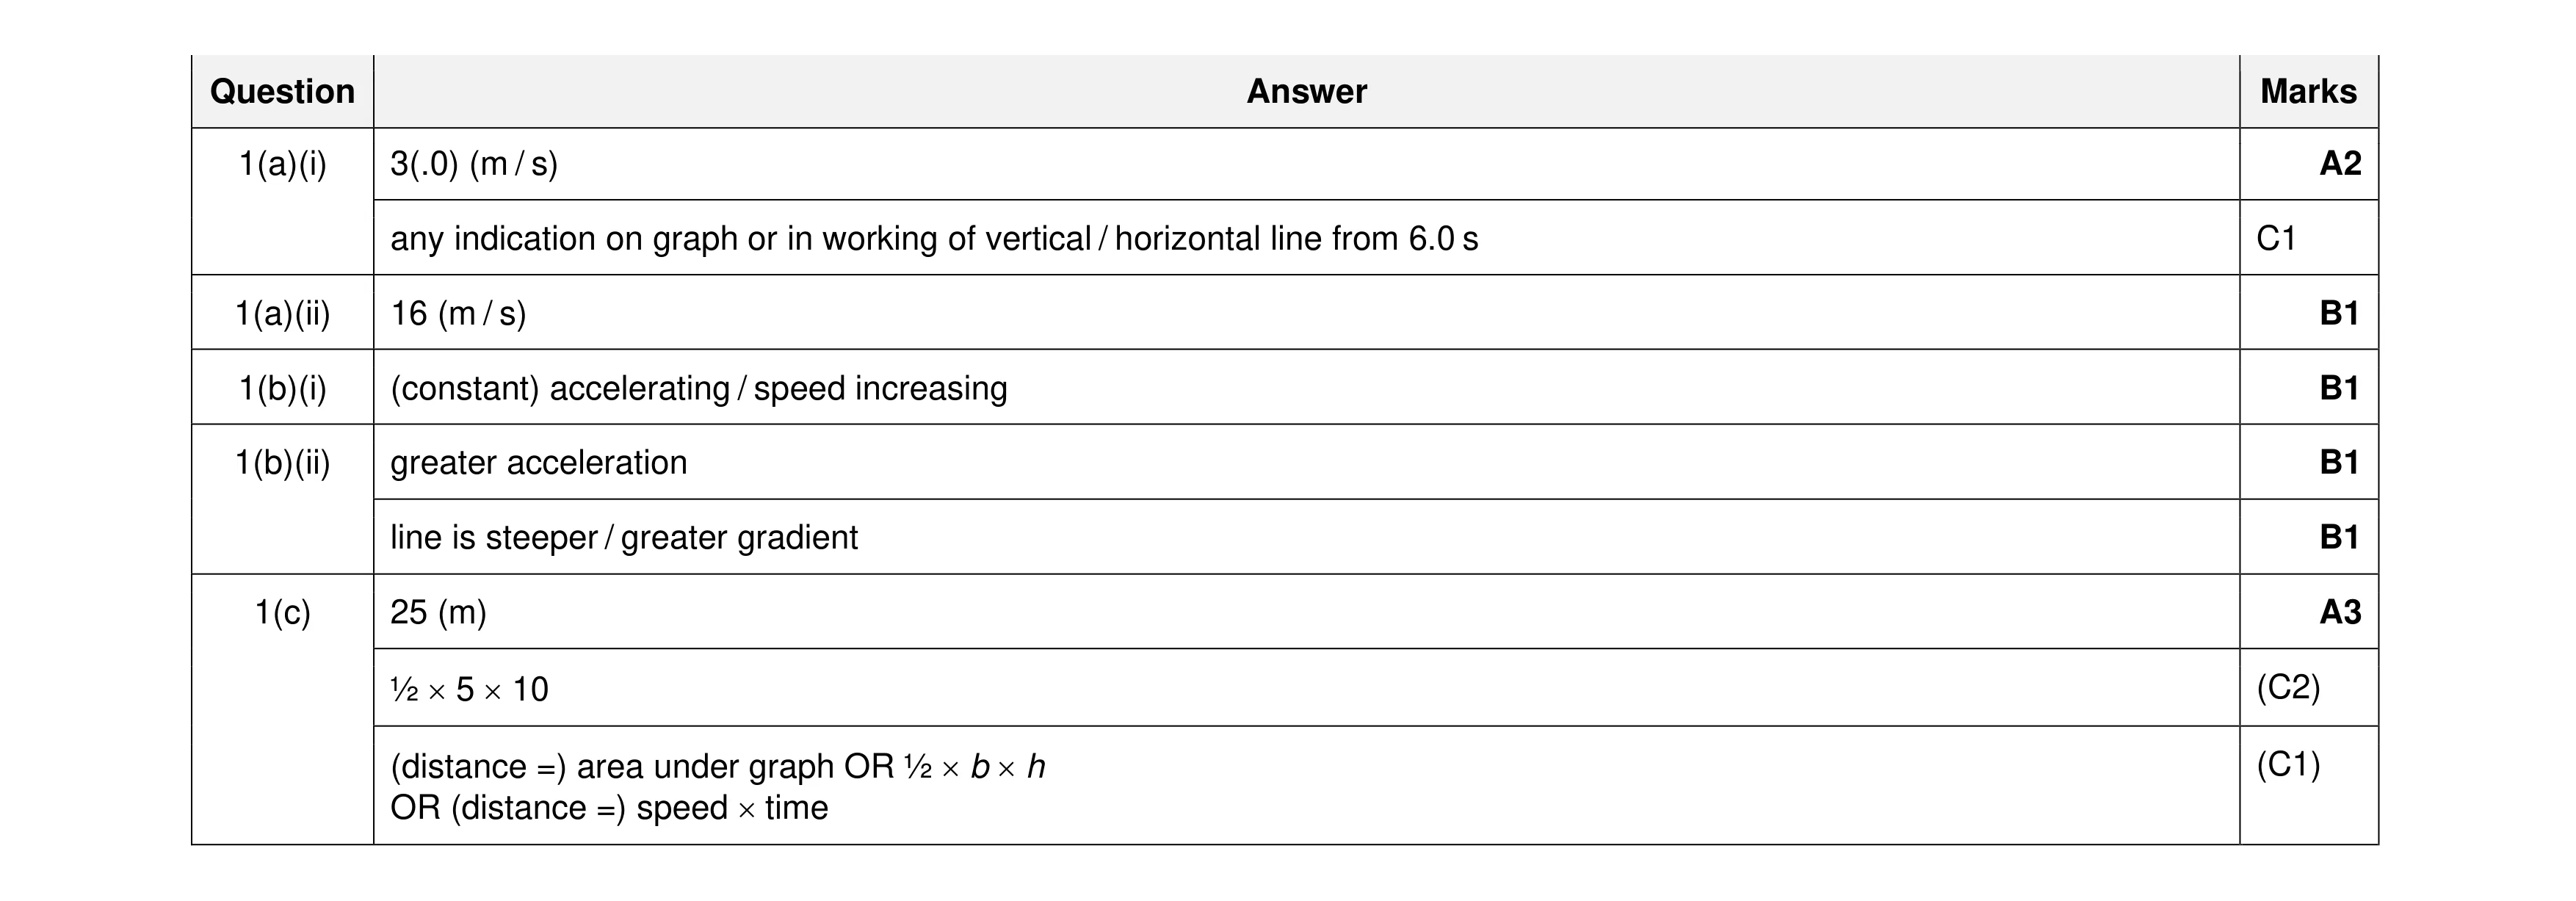 9
9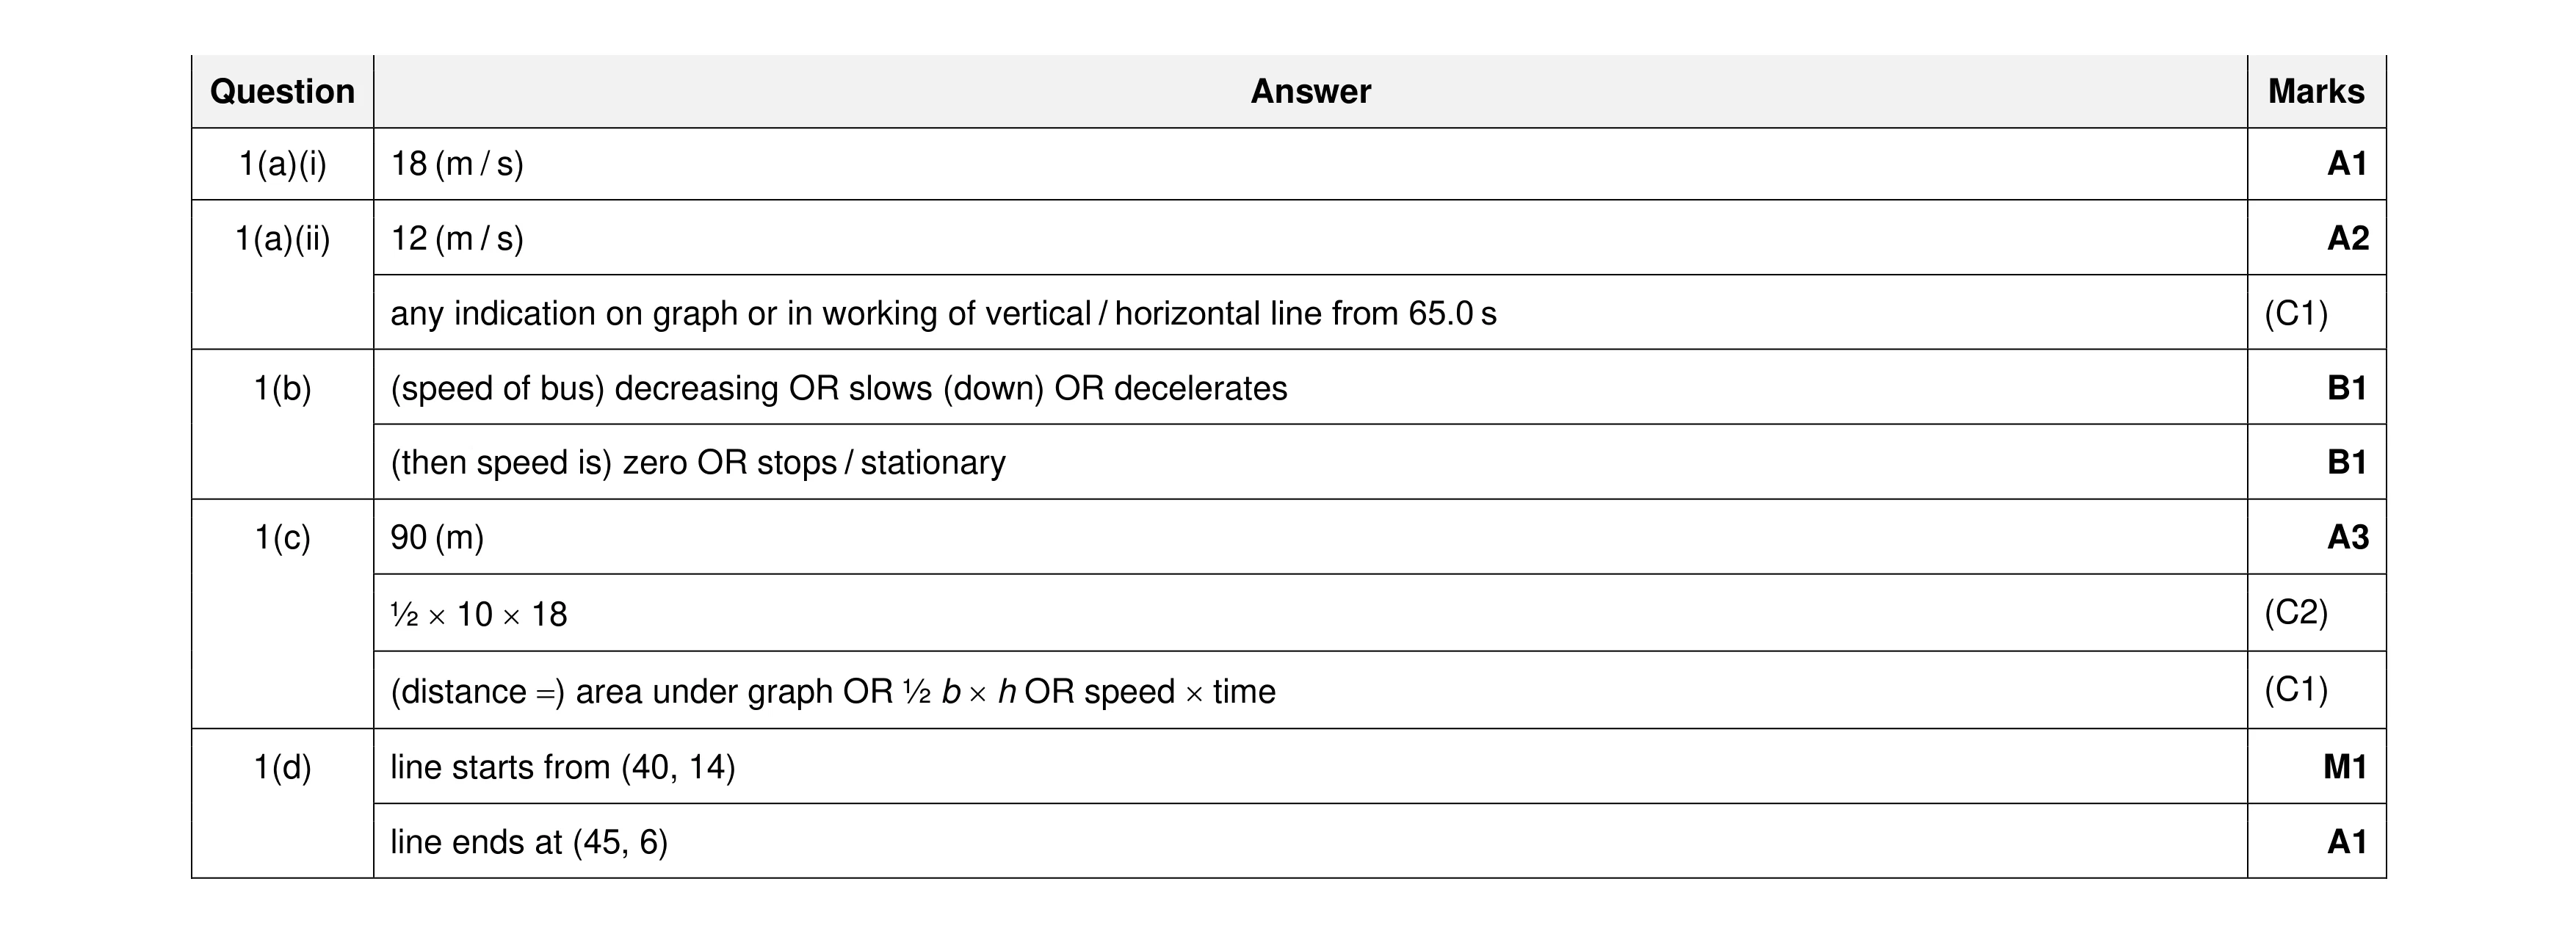 10
10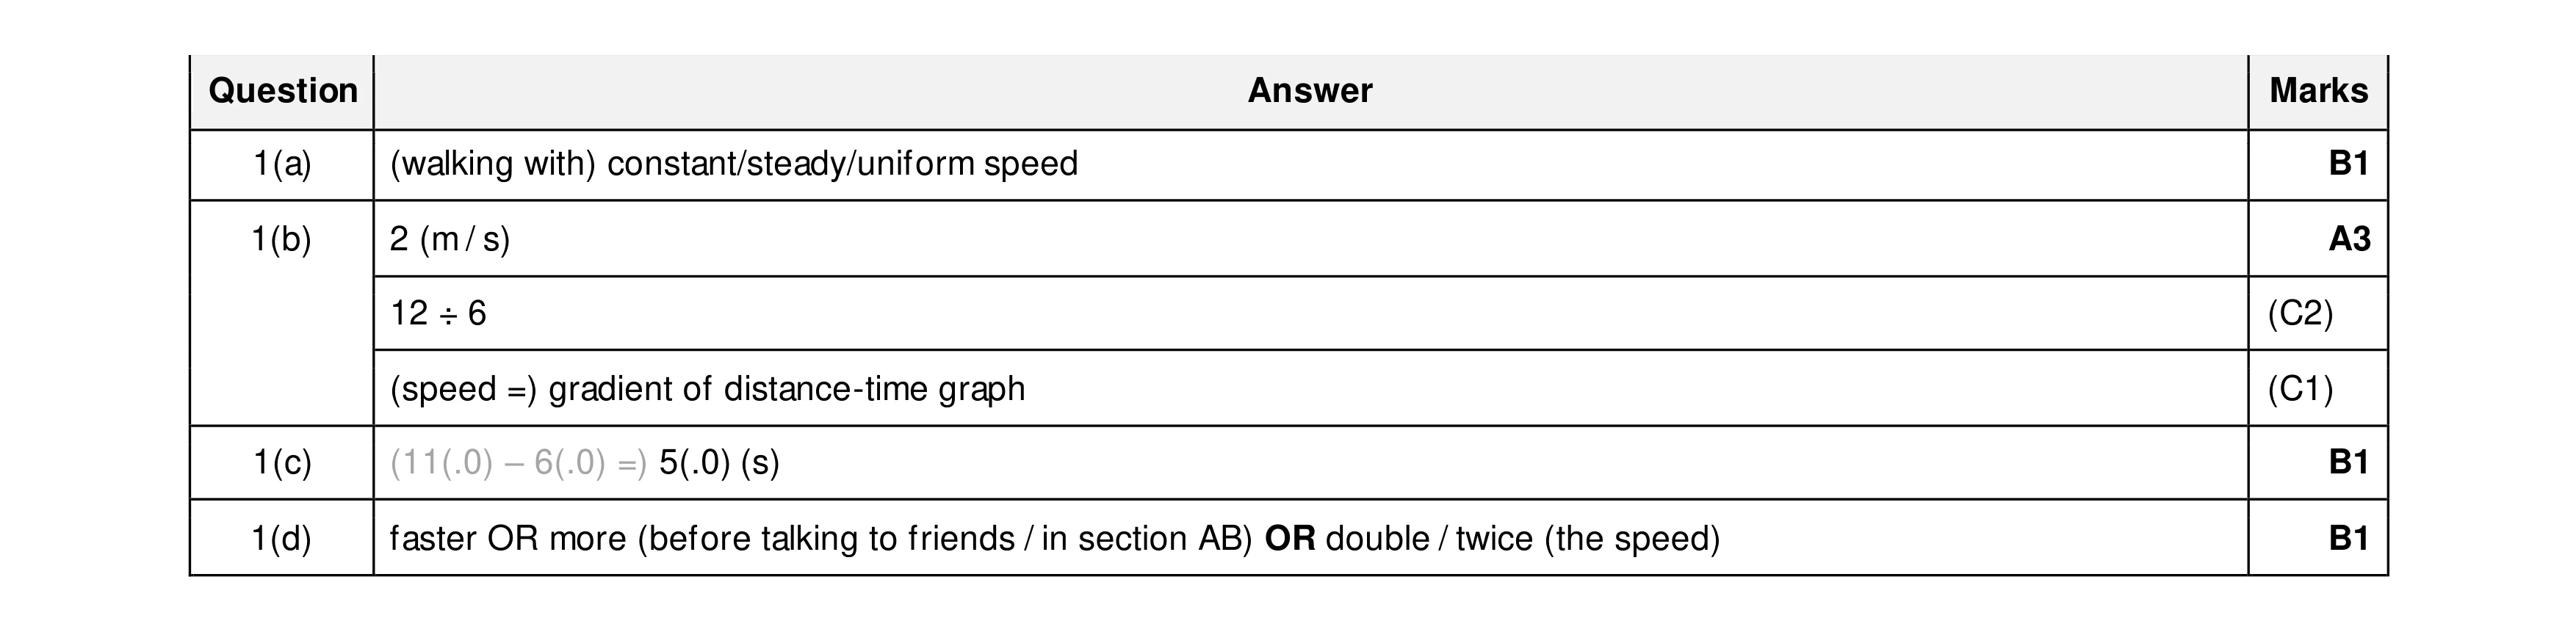 6
6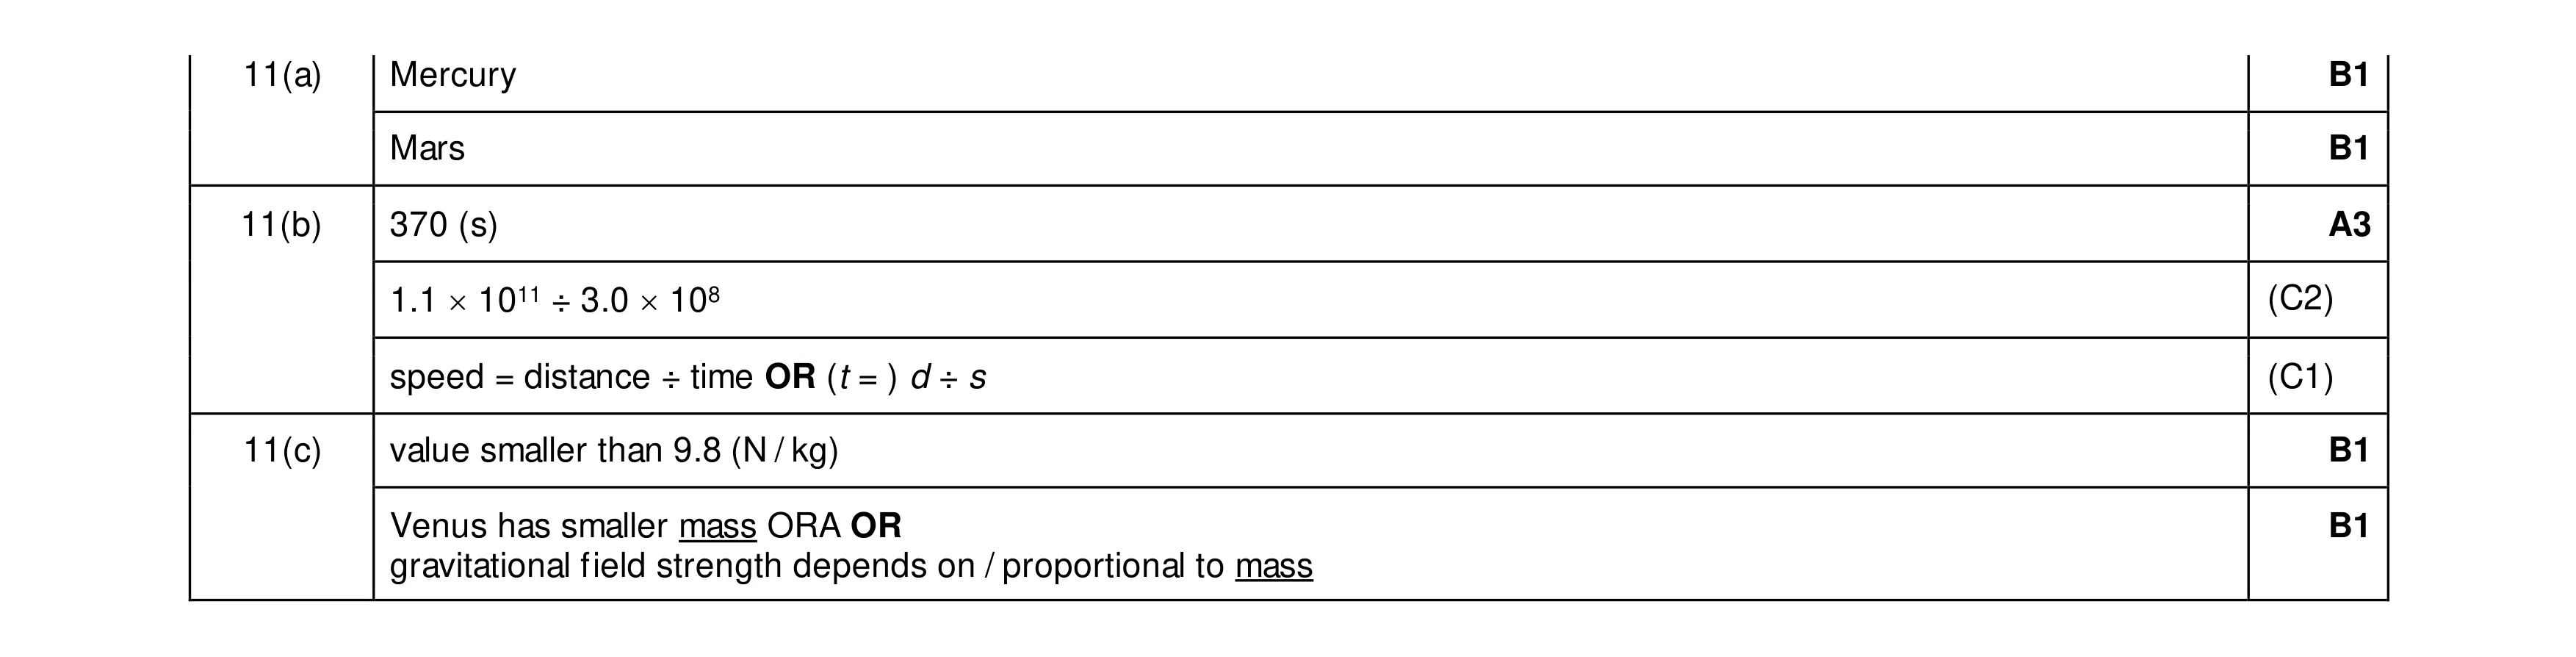 7
7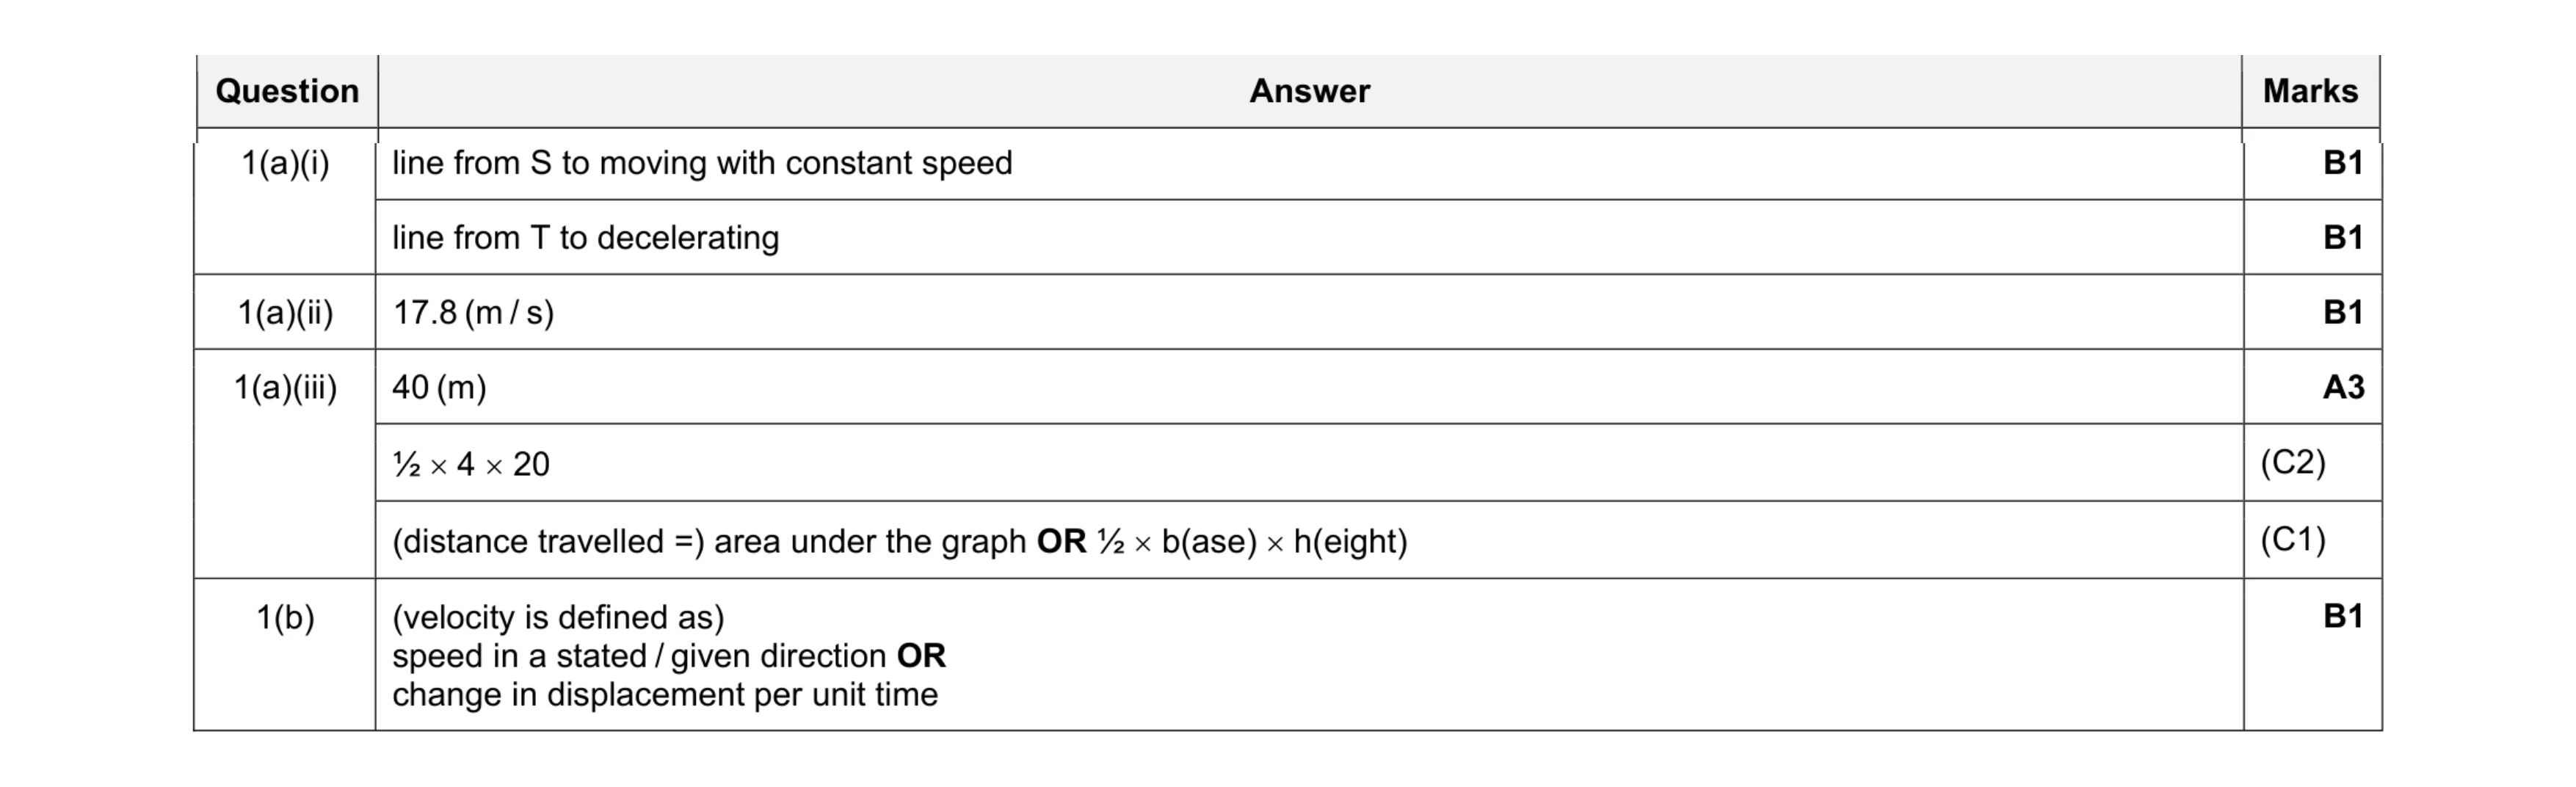 7
7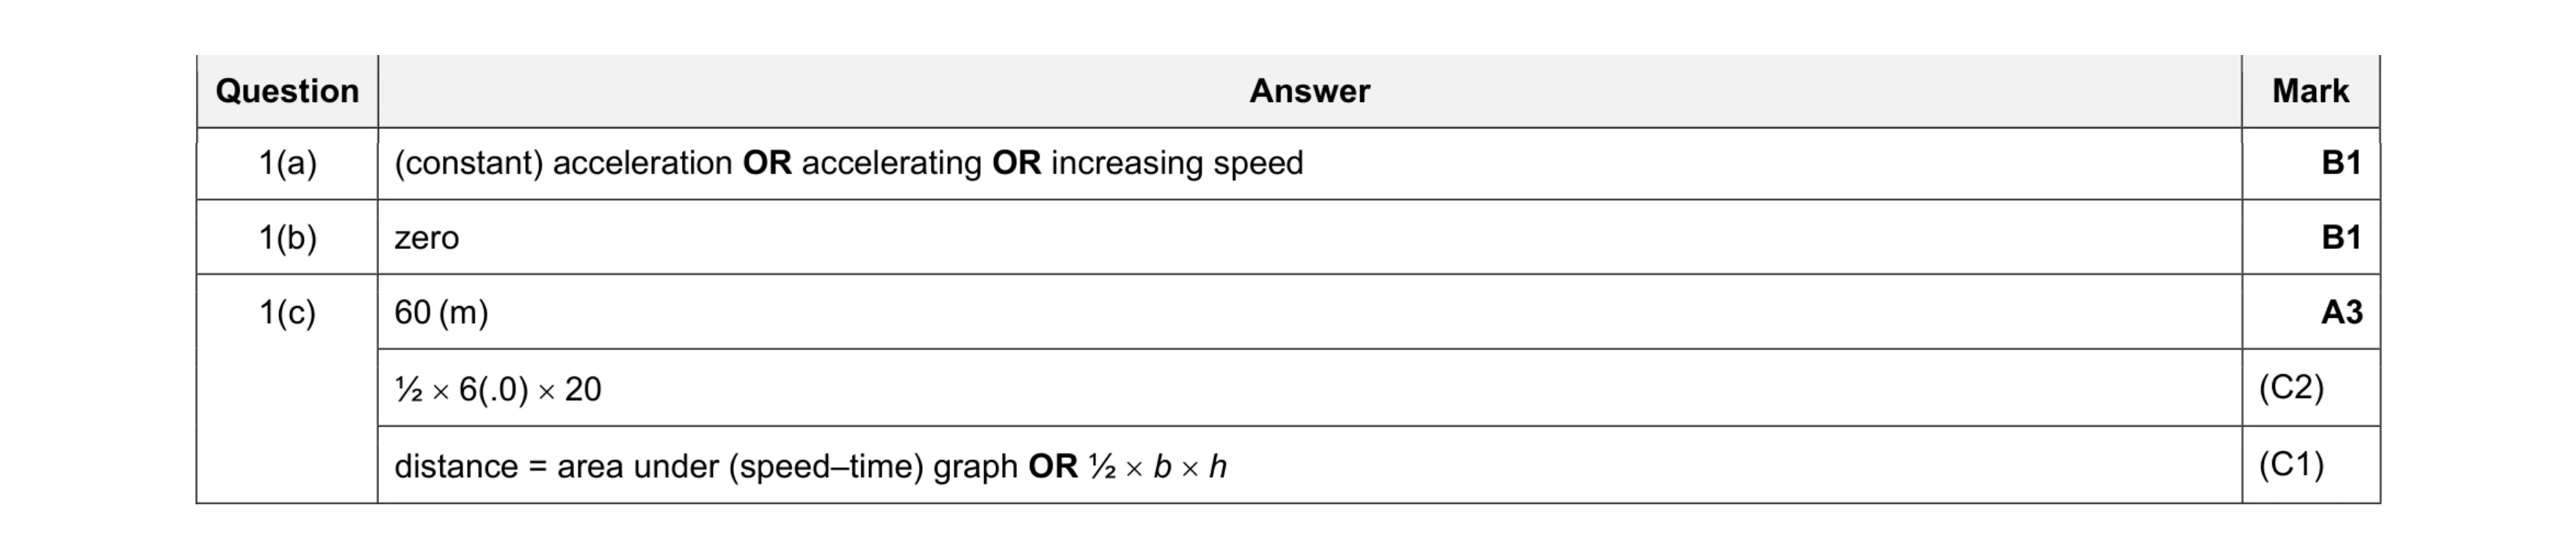 5
5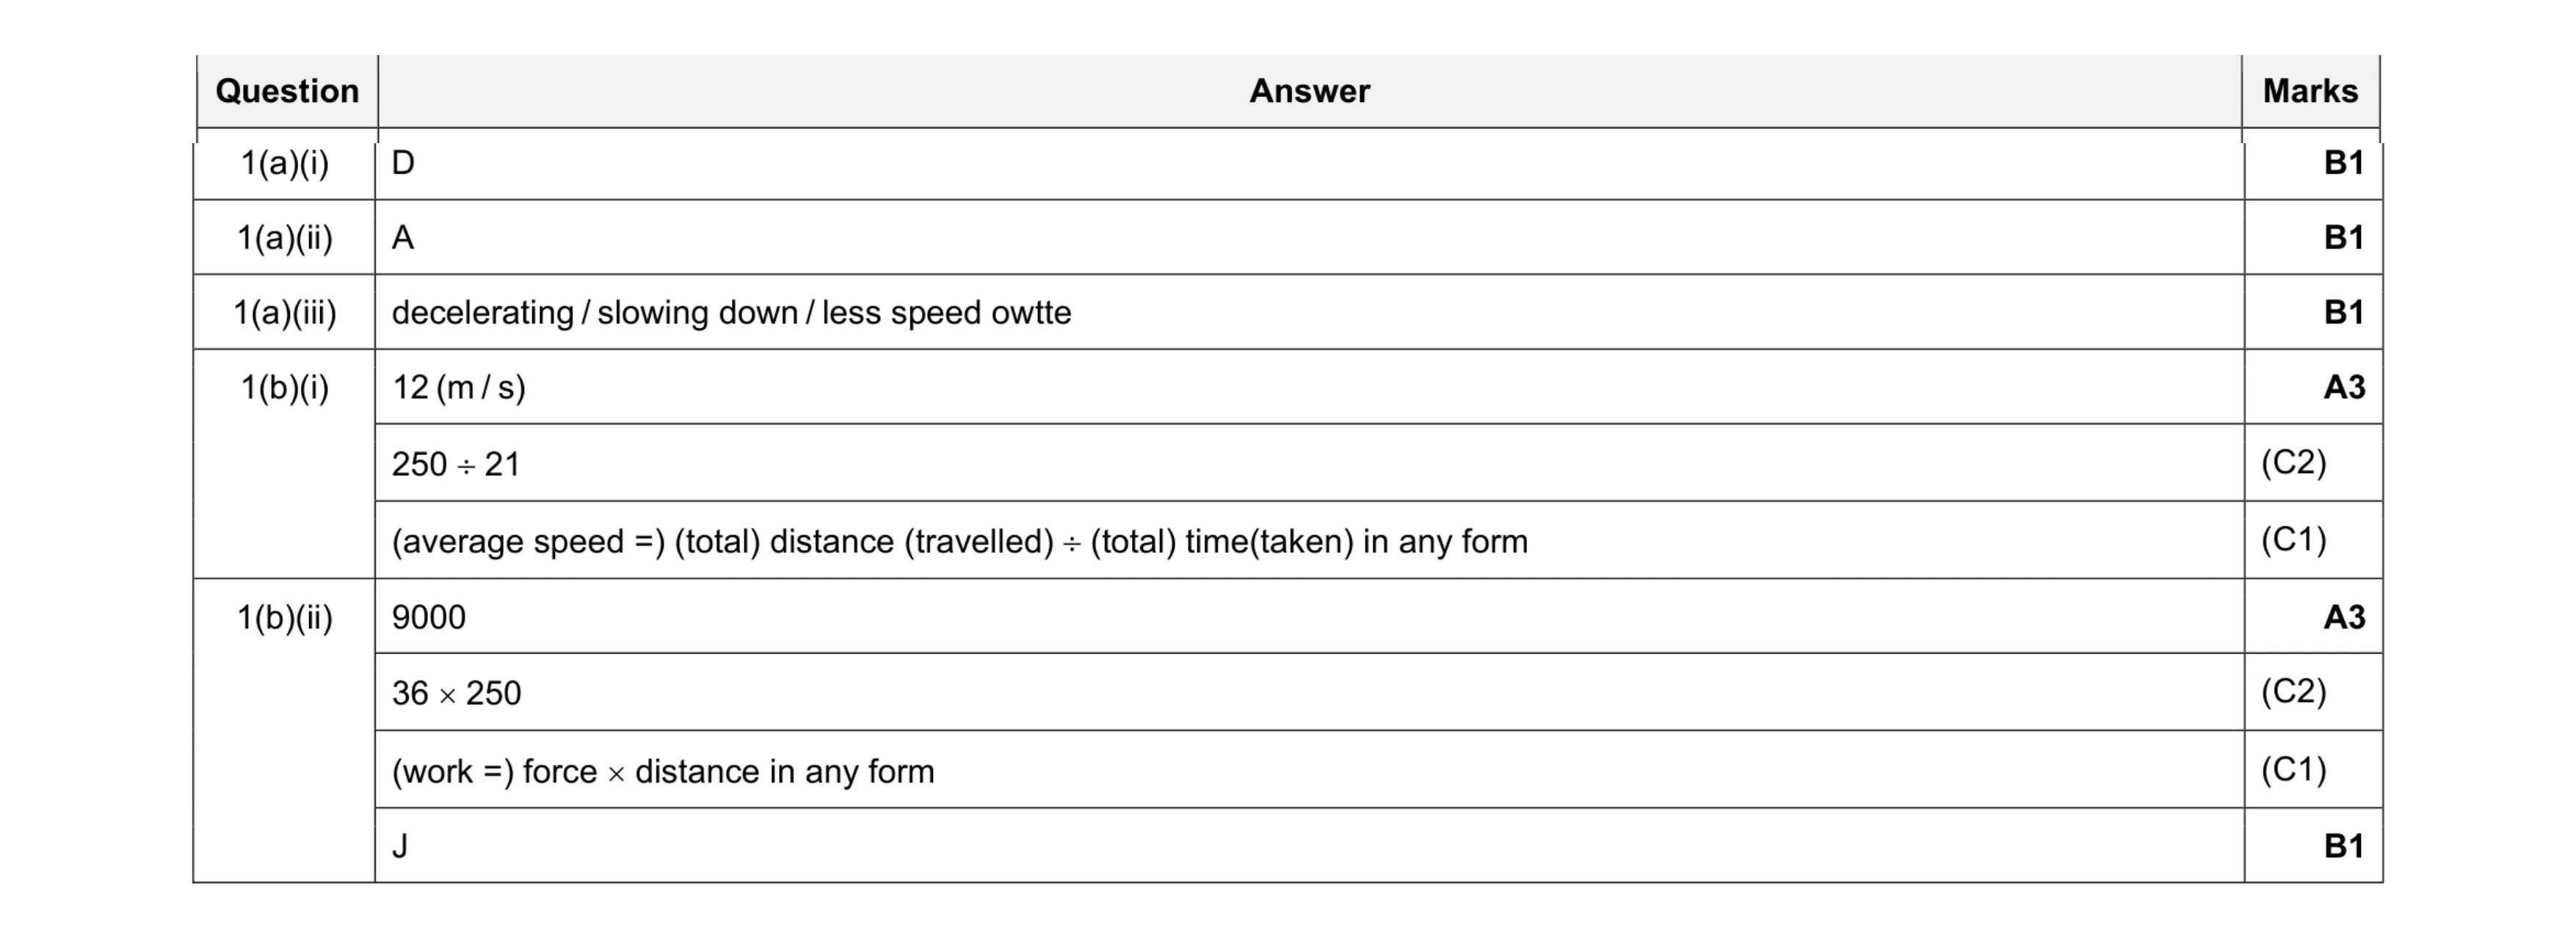 10
10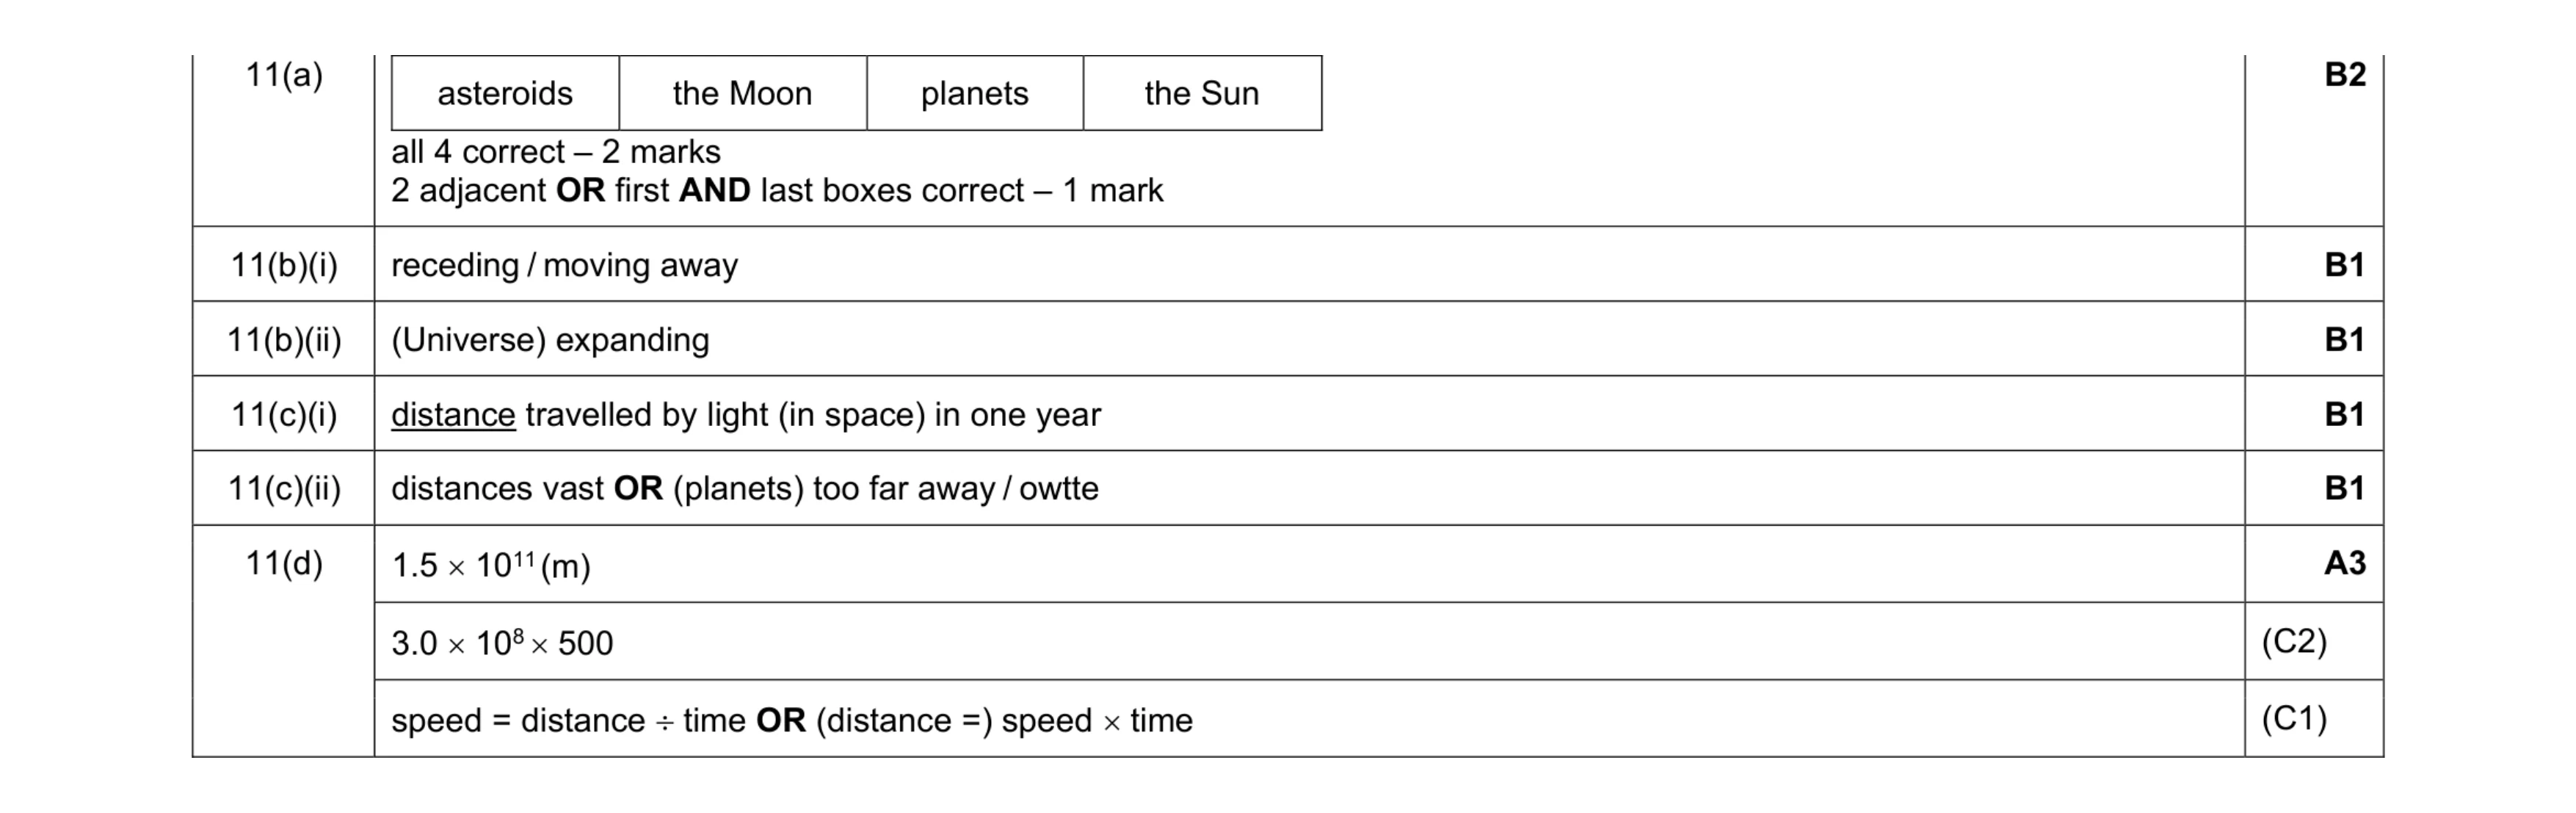 9
9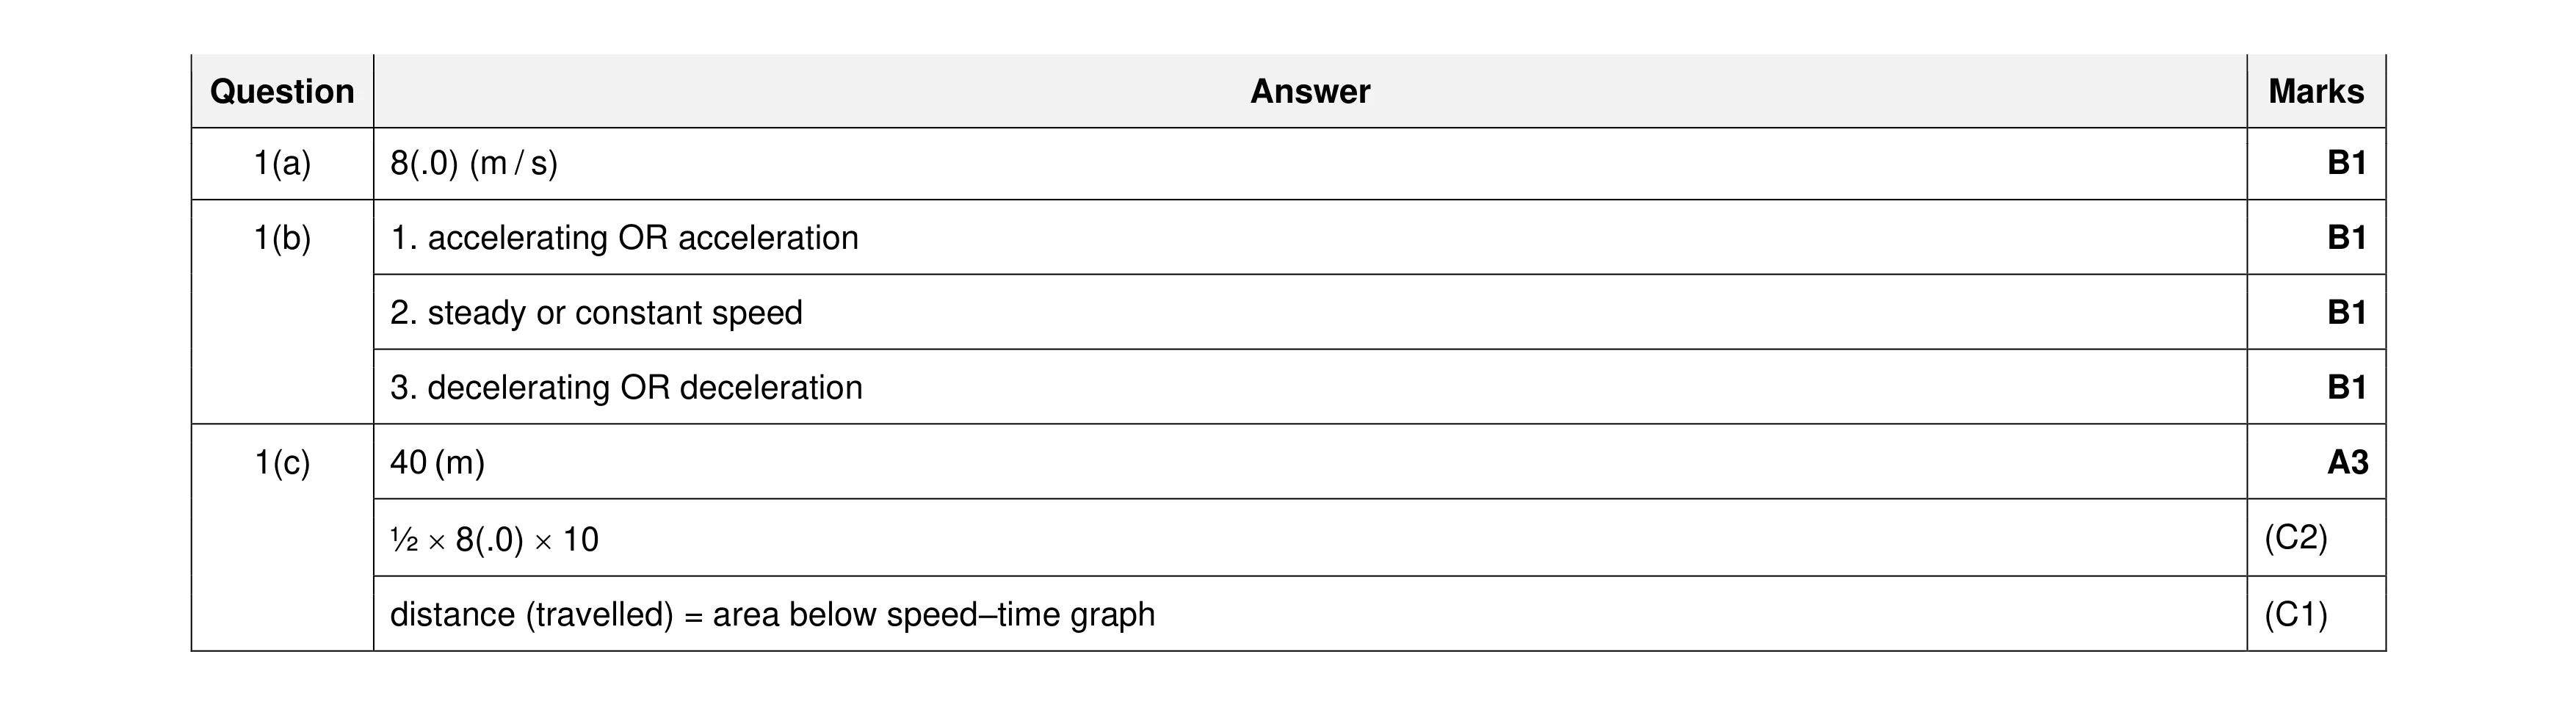 7
7 4
4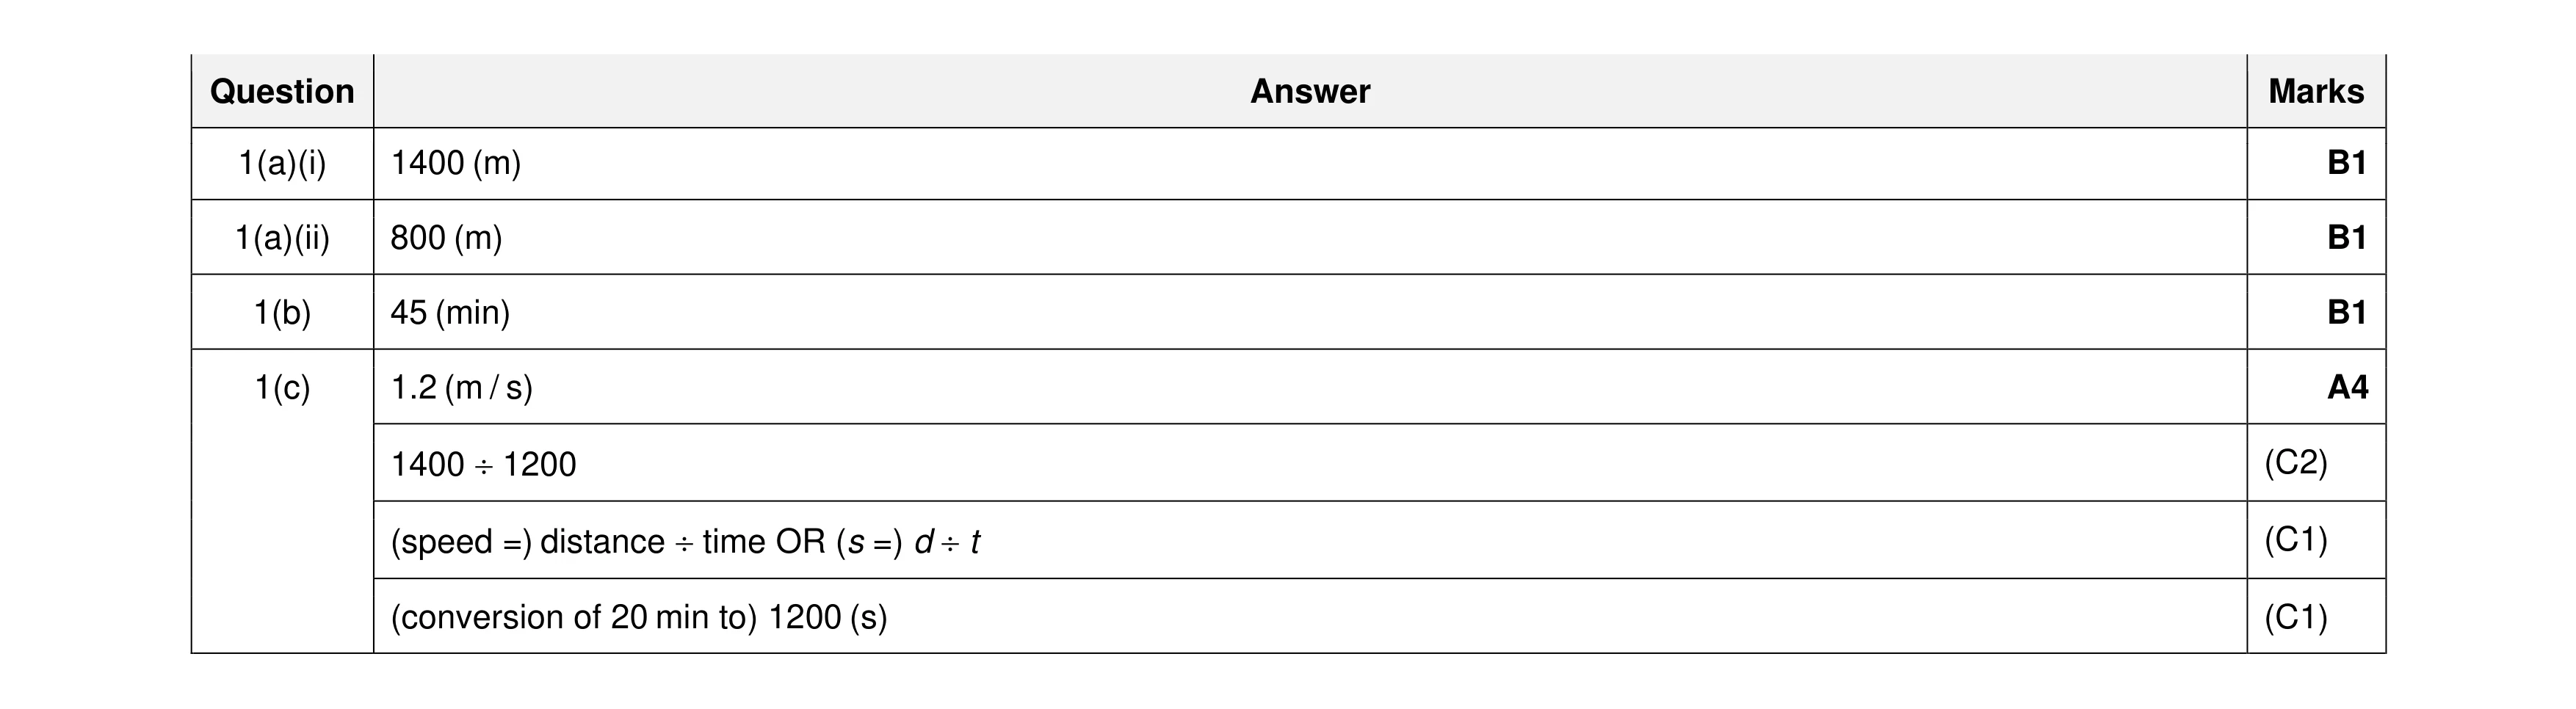 7
7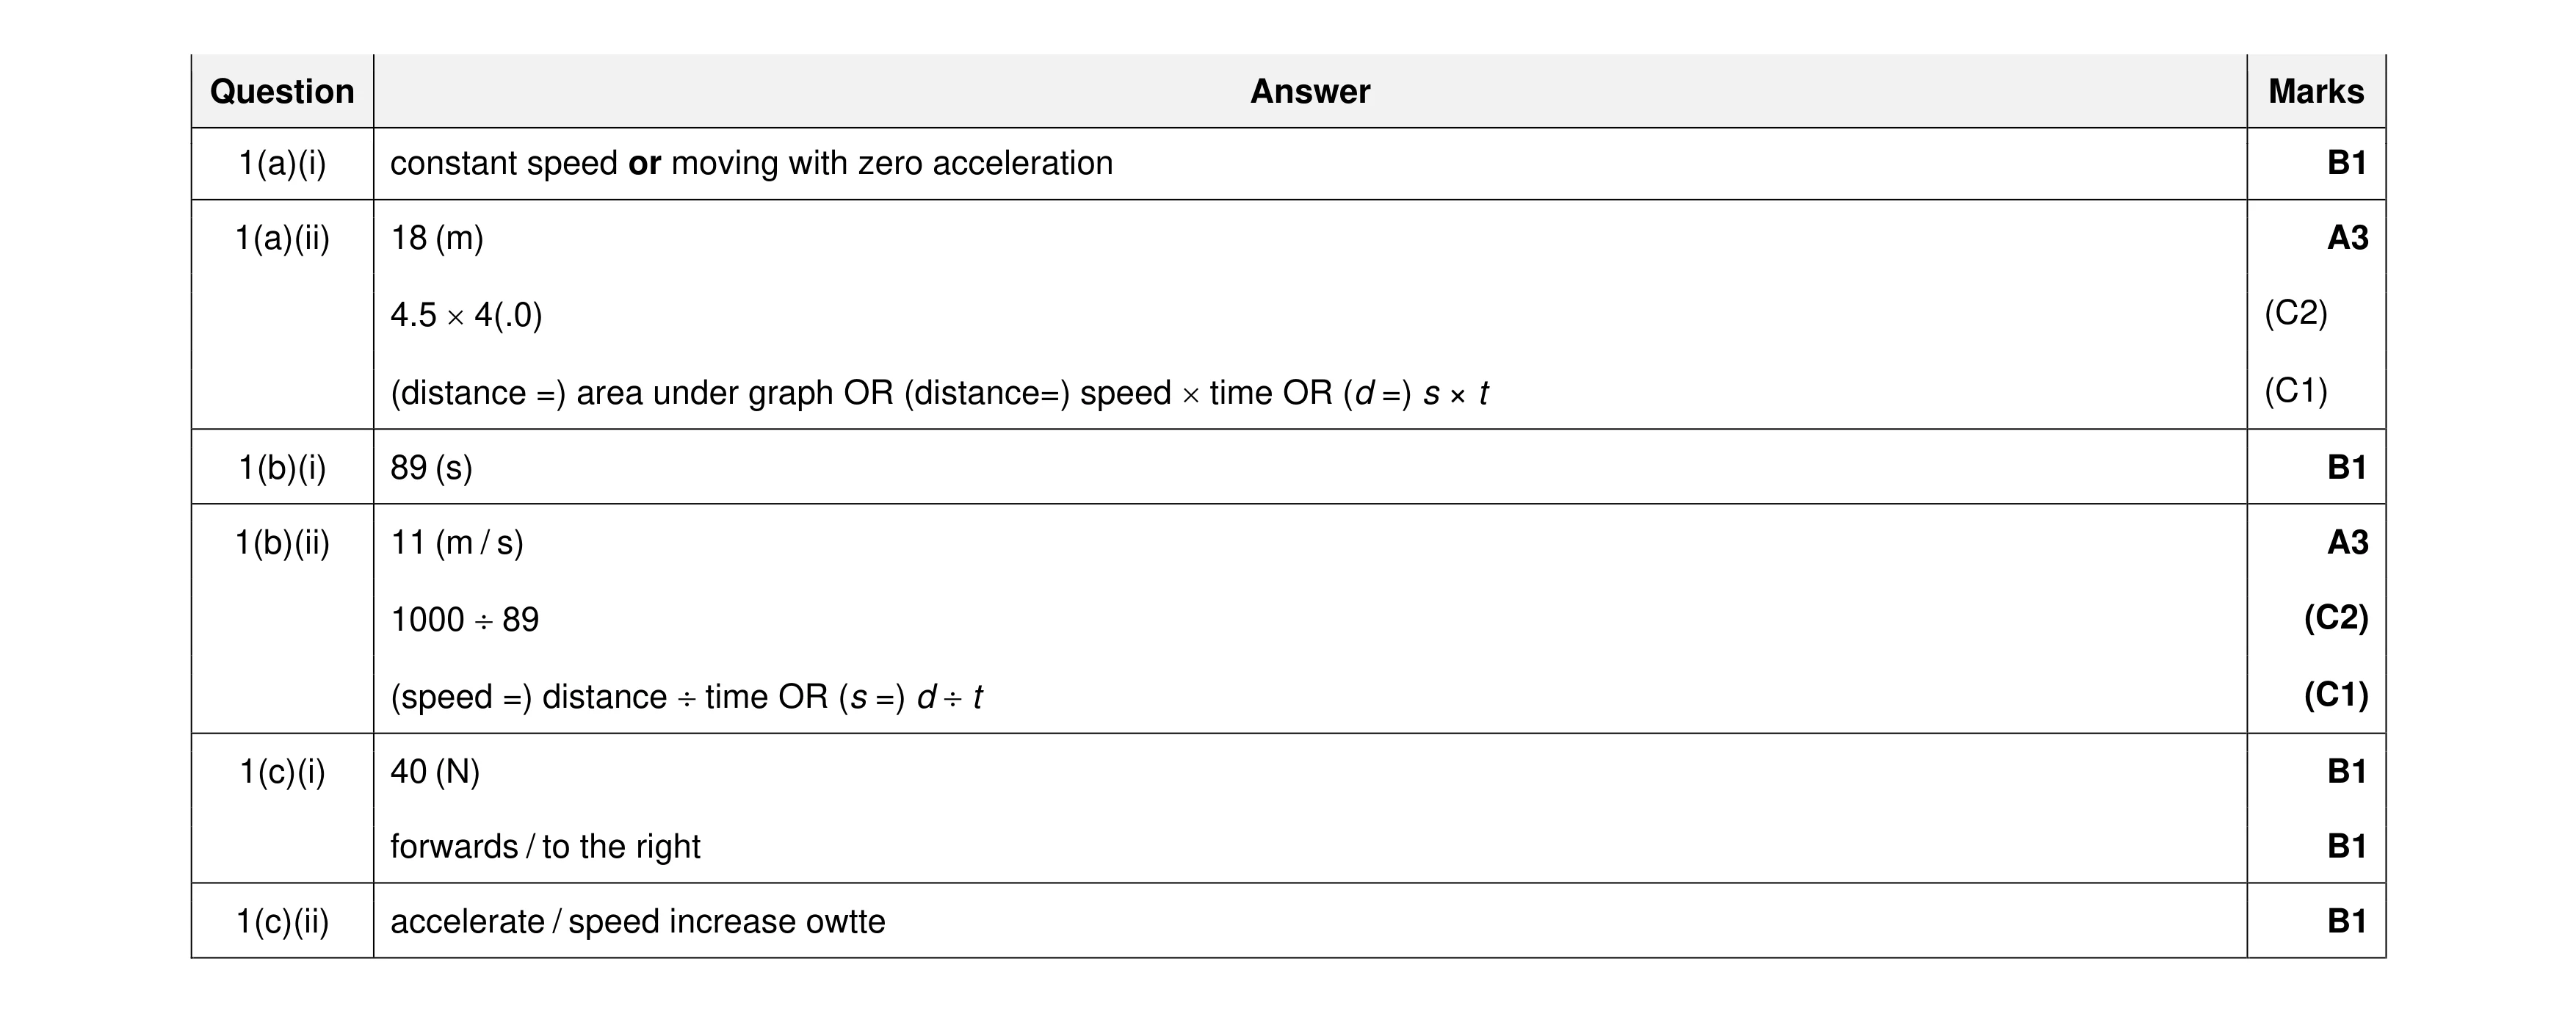 11
11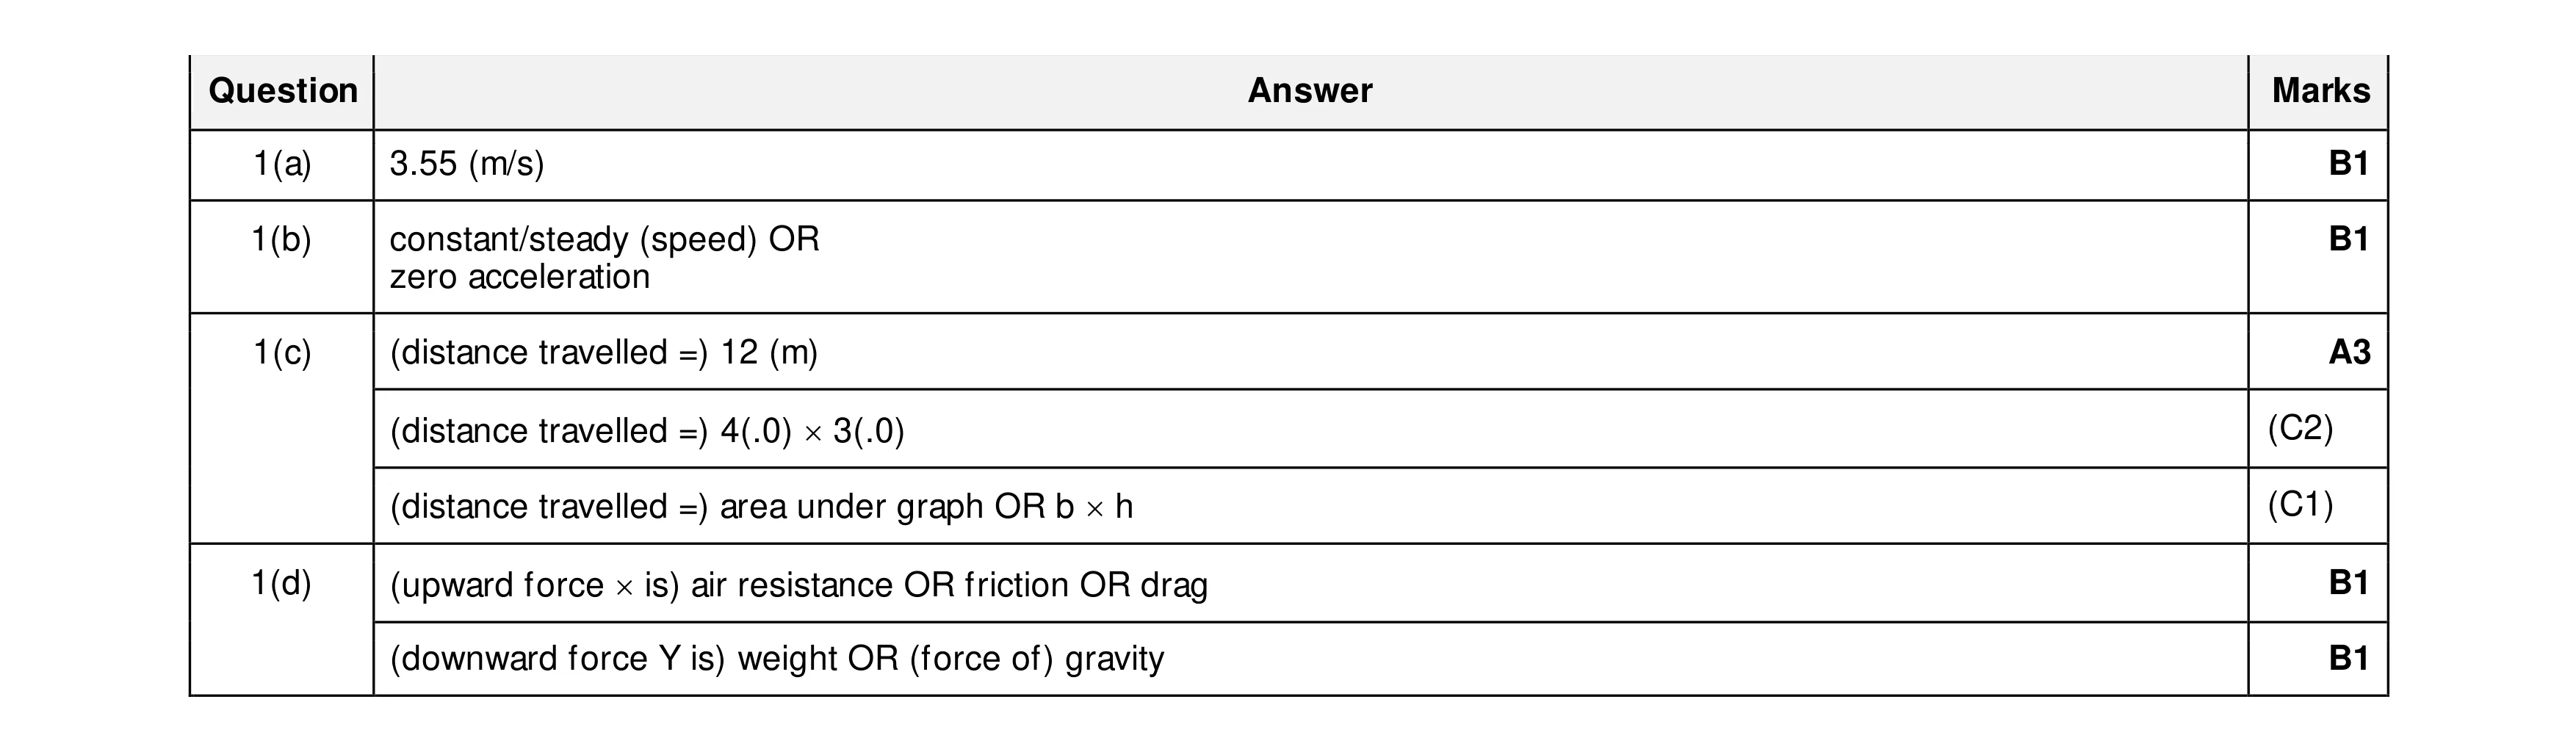 7
7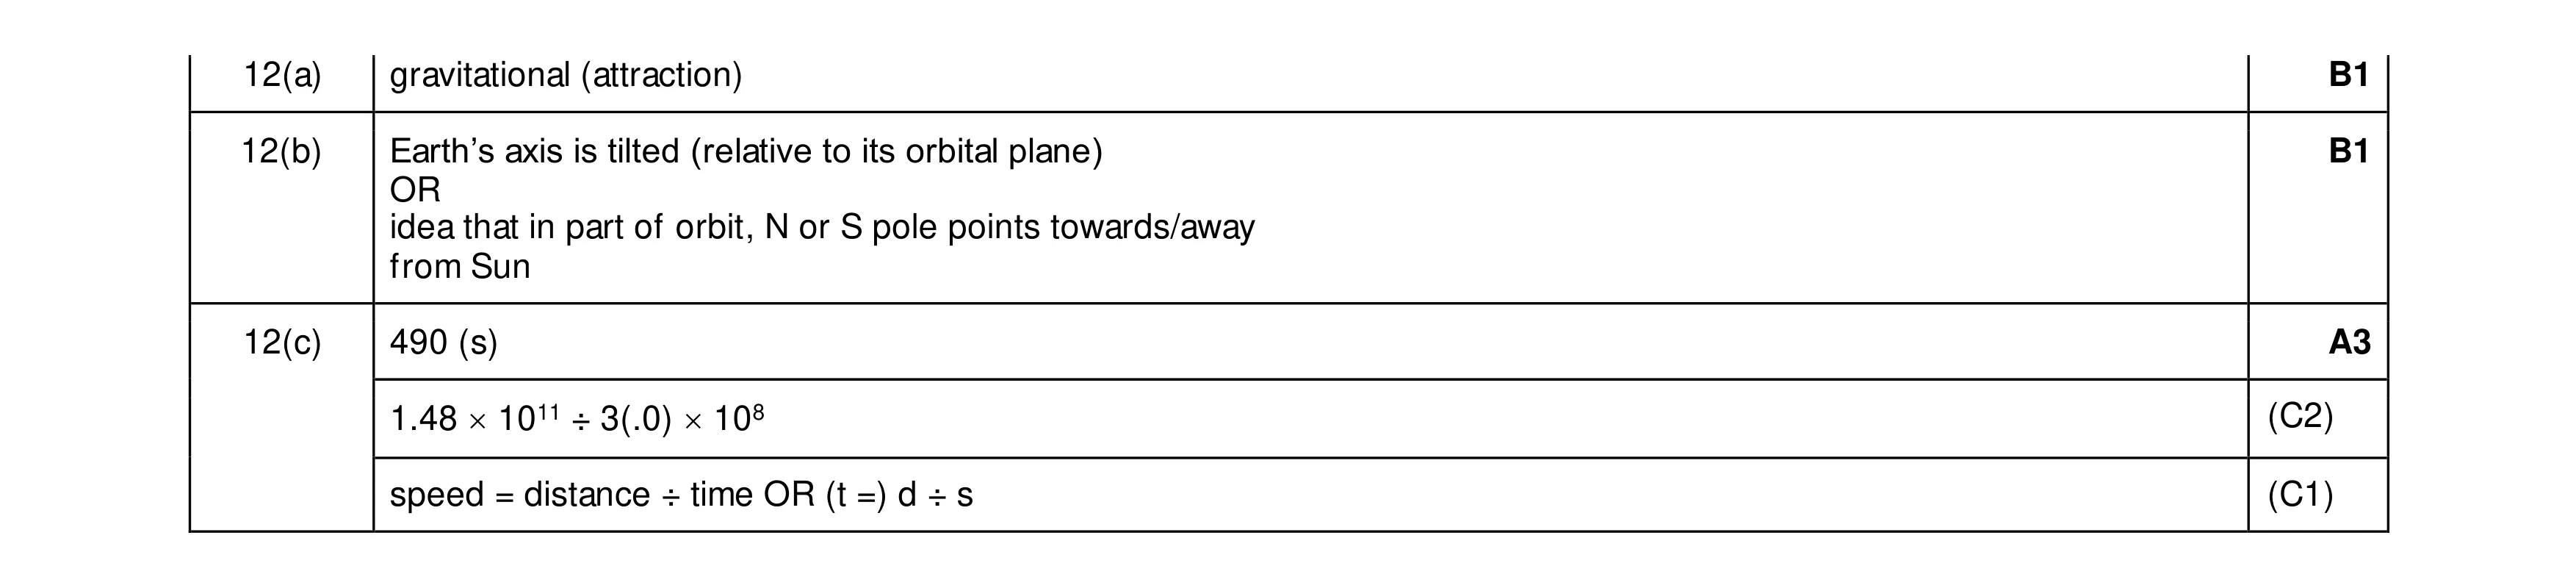 5
5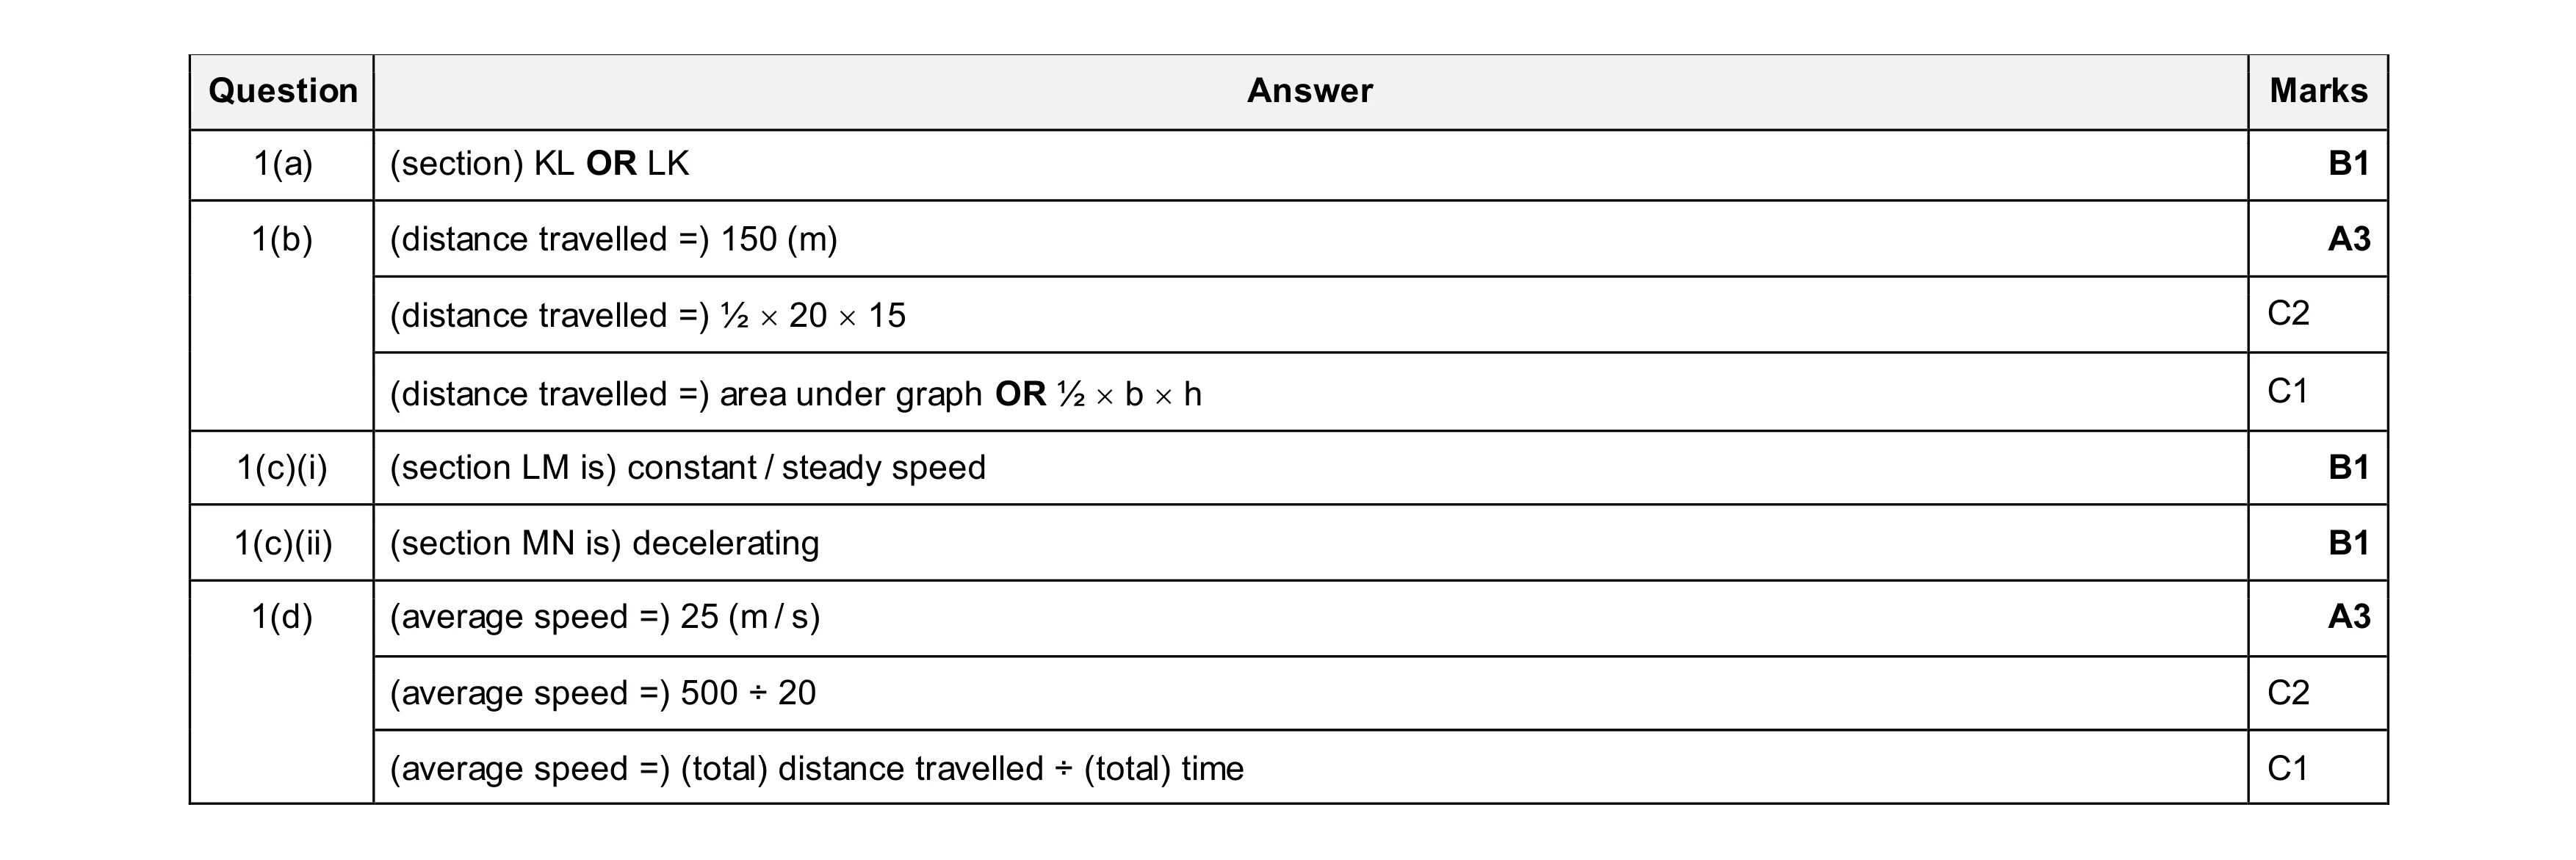 9
9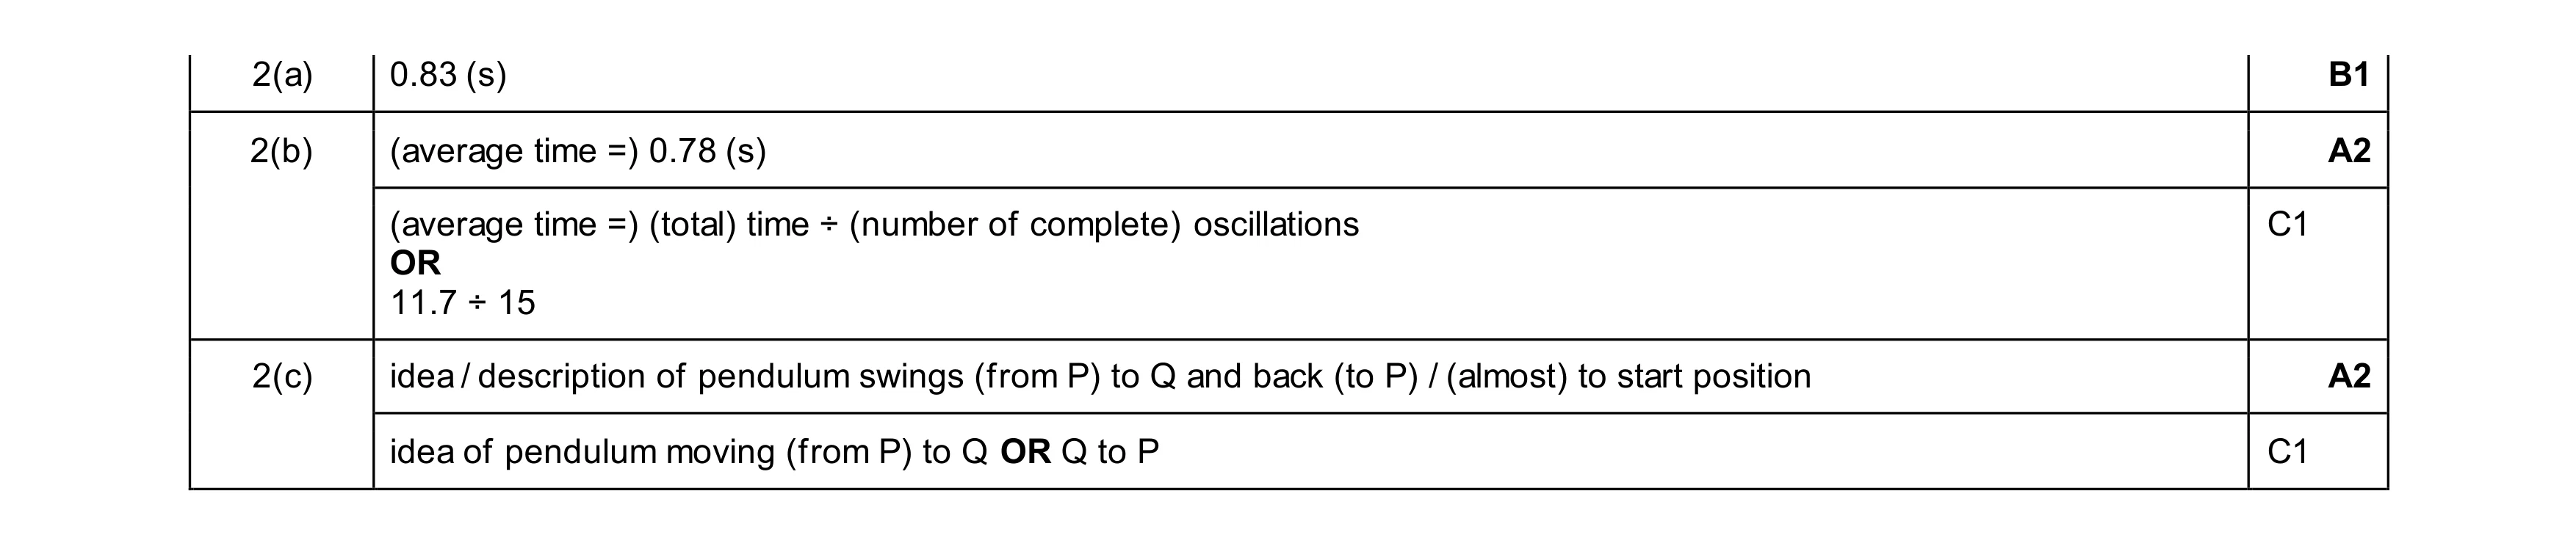 5
5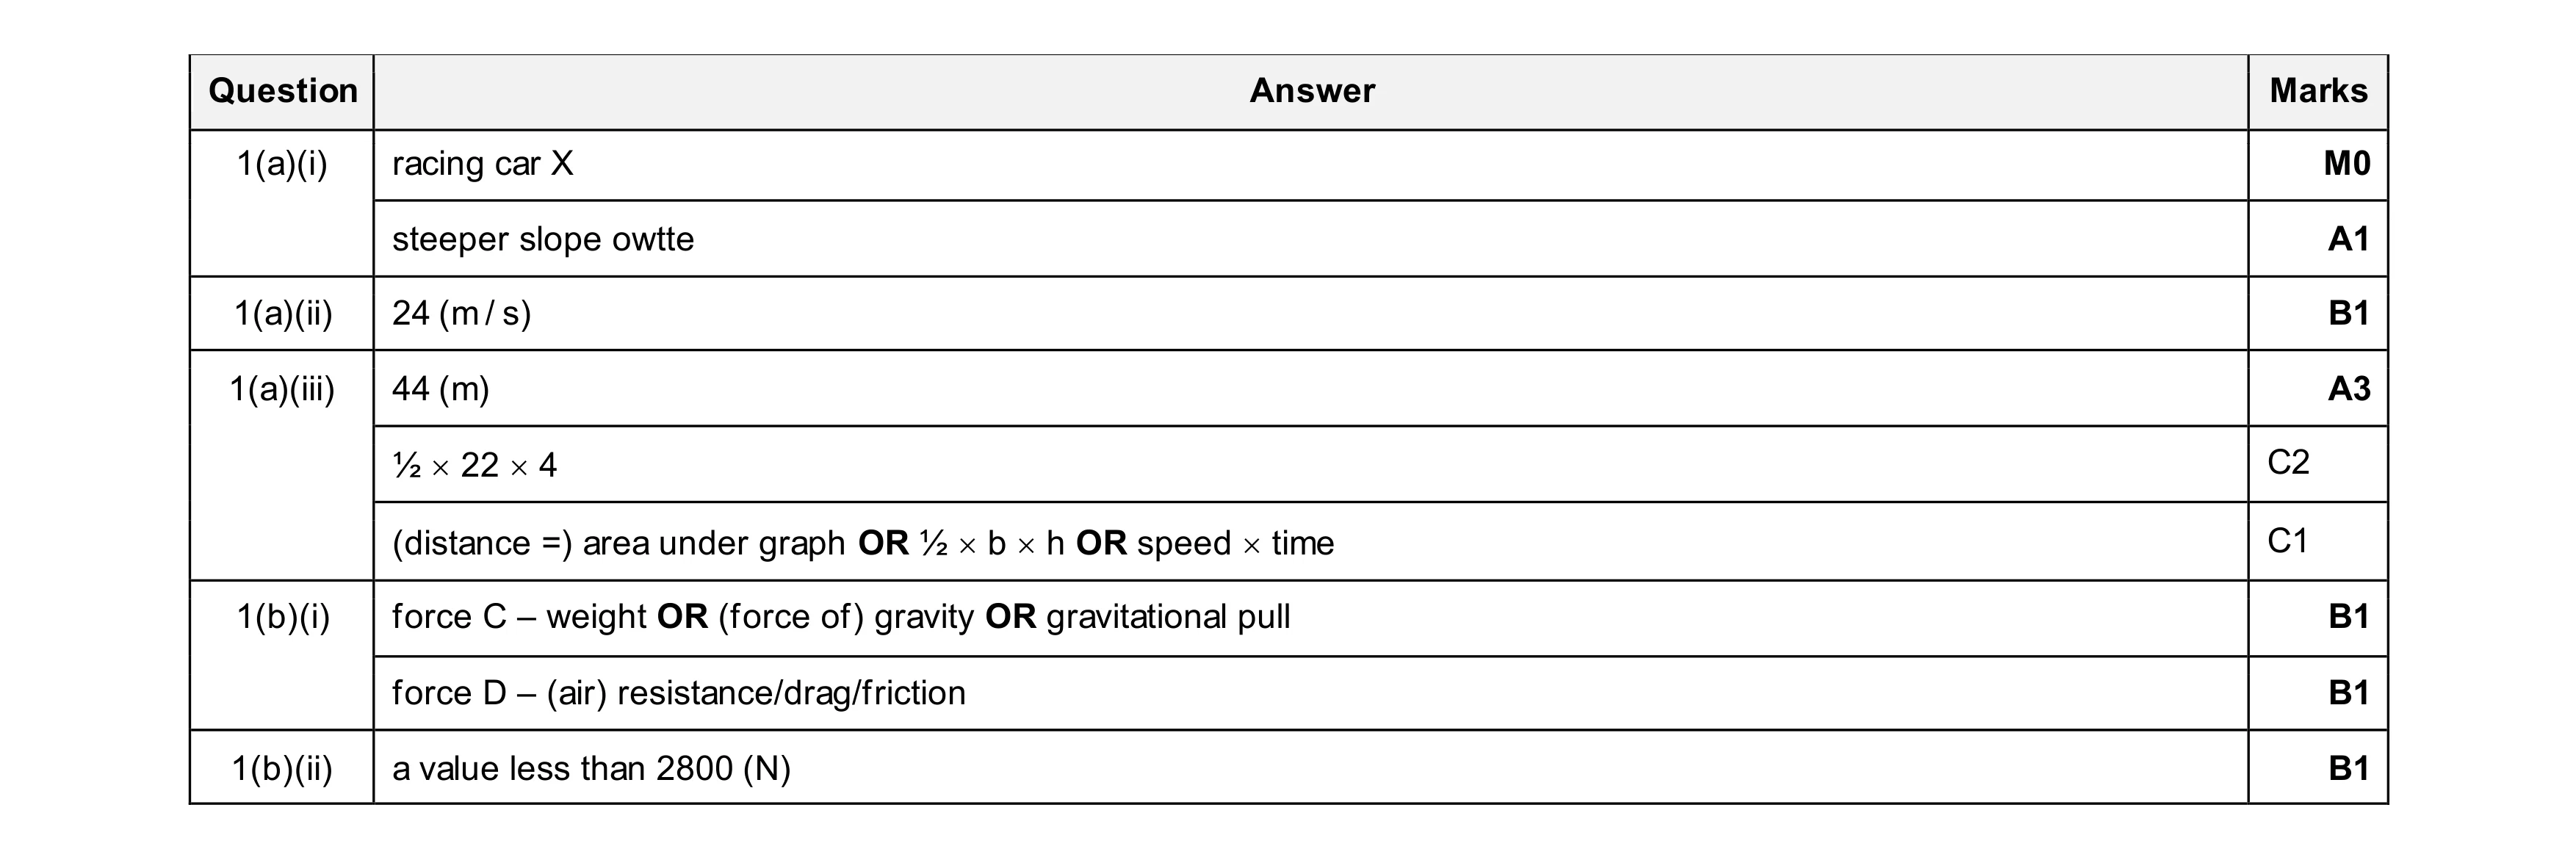 8
8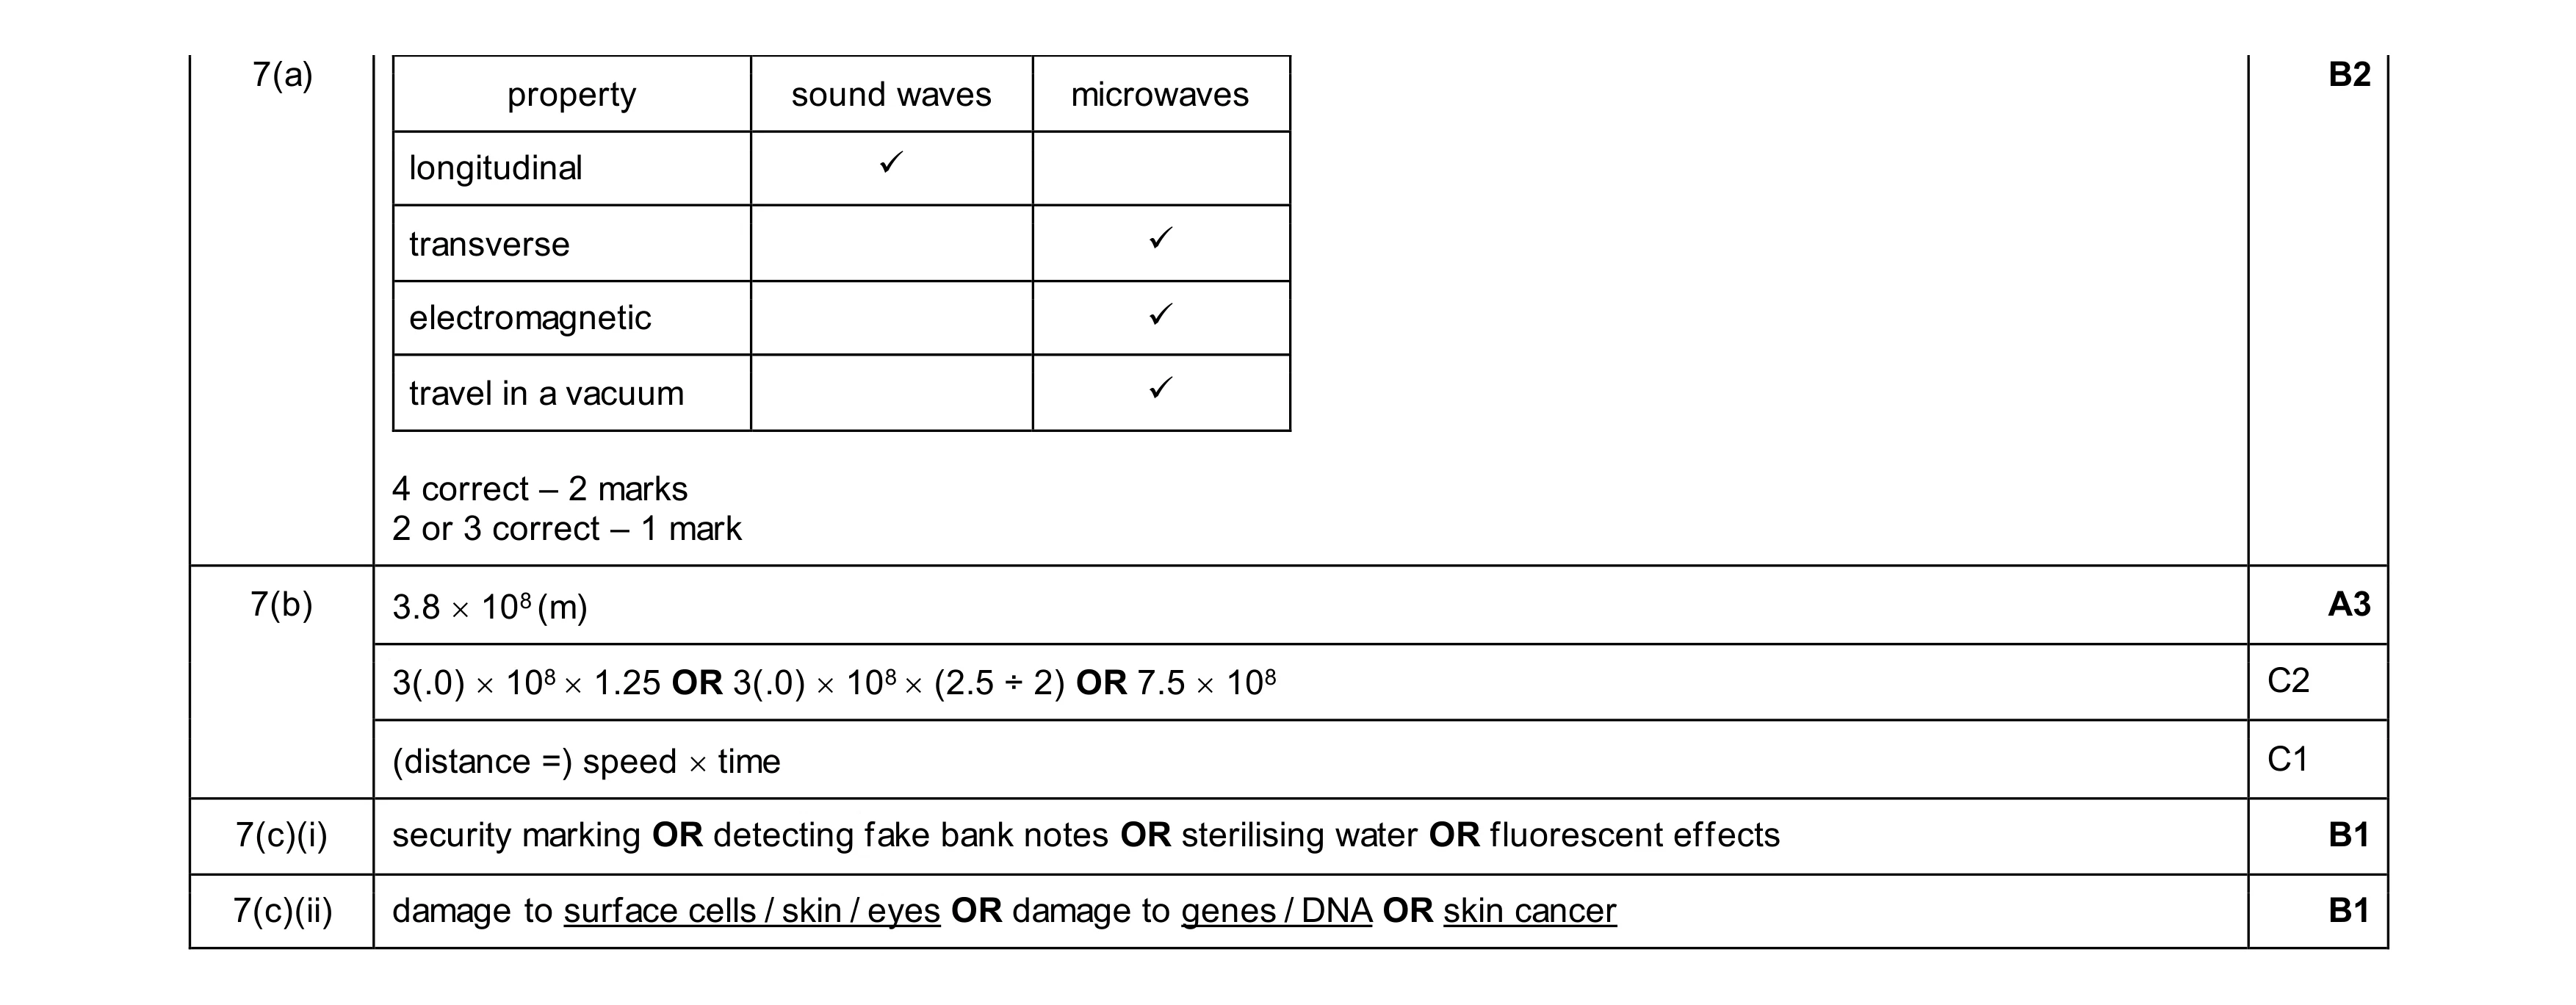 7
7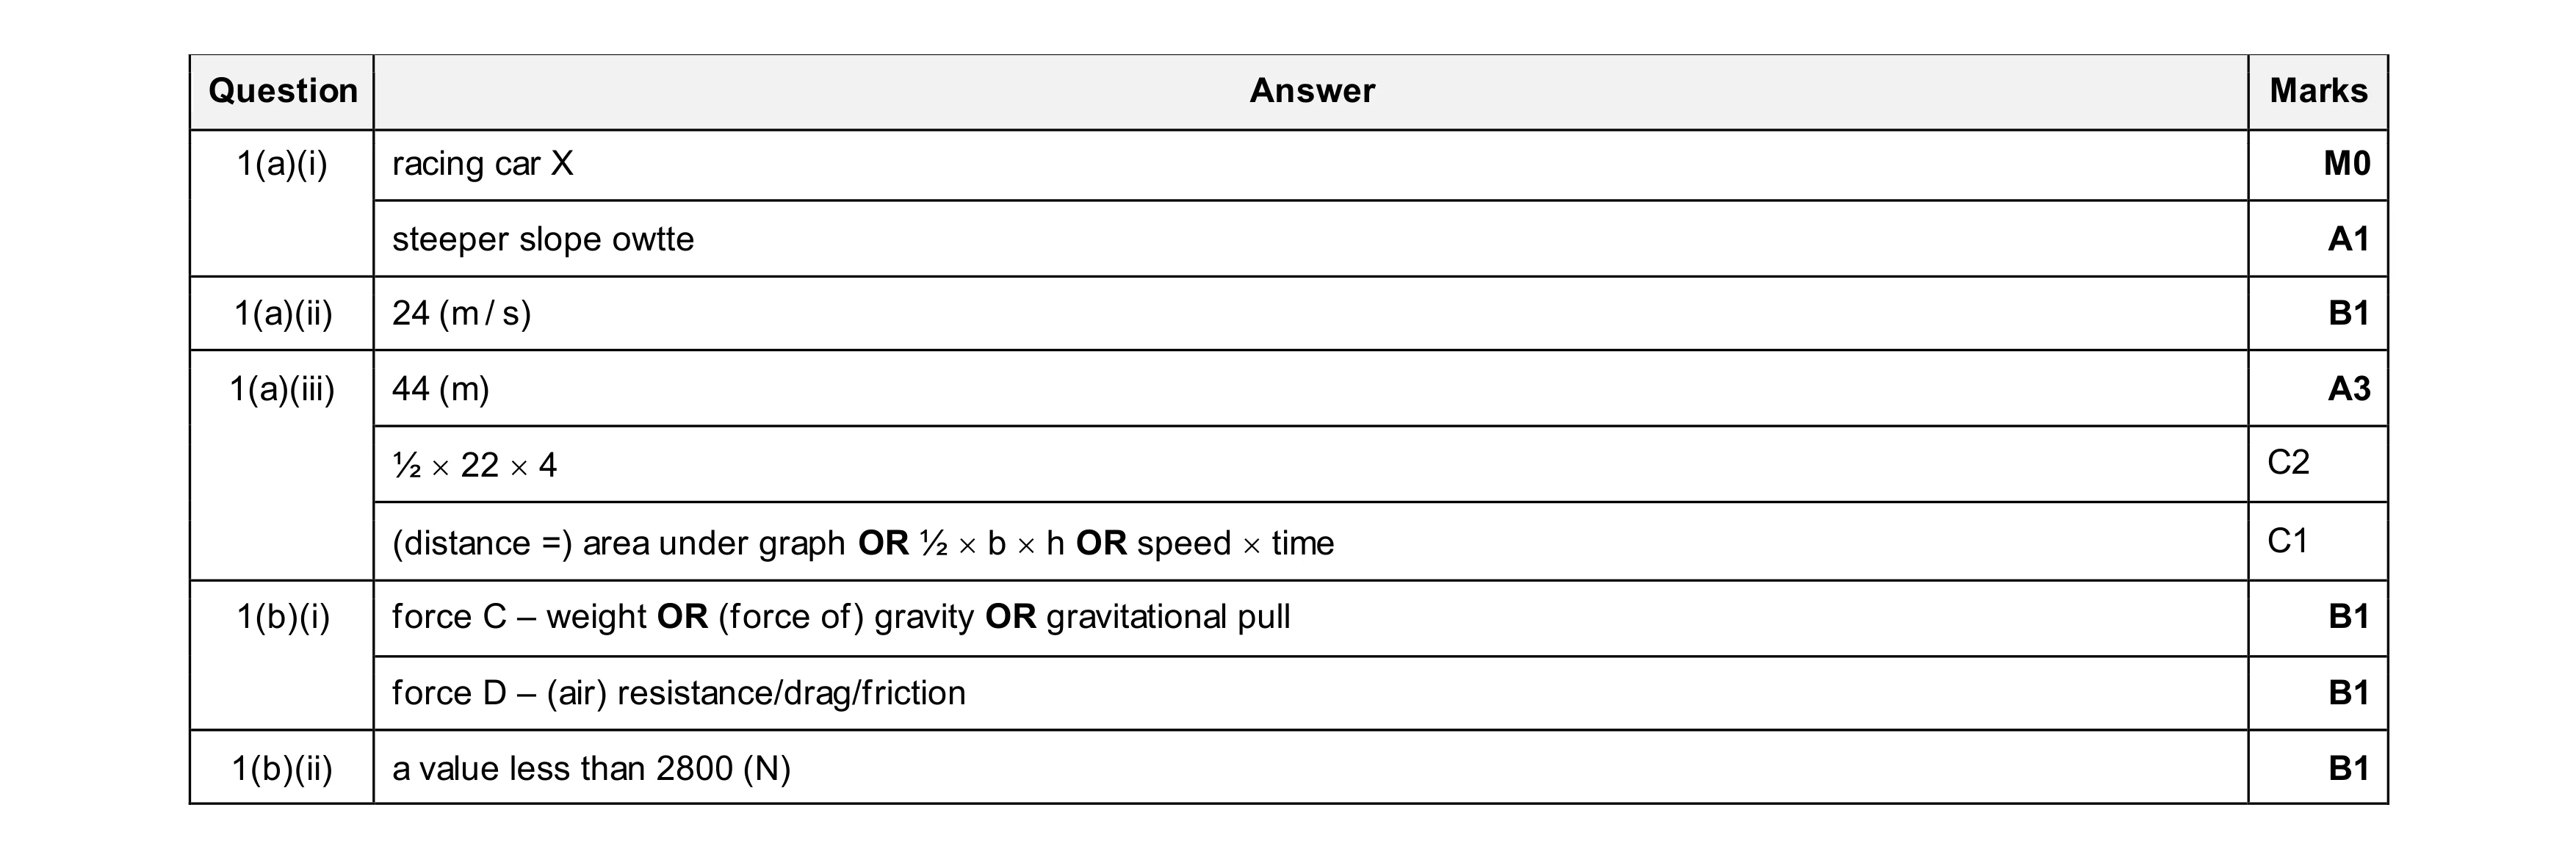 8
8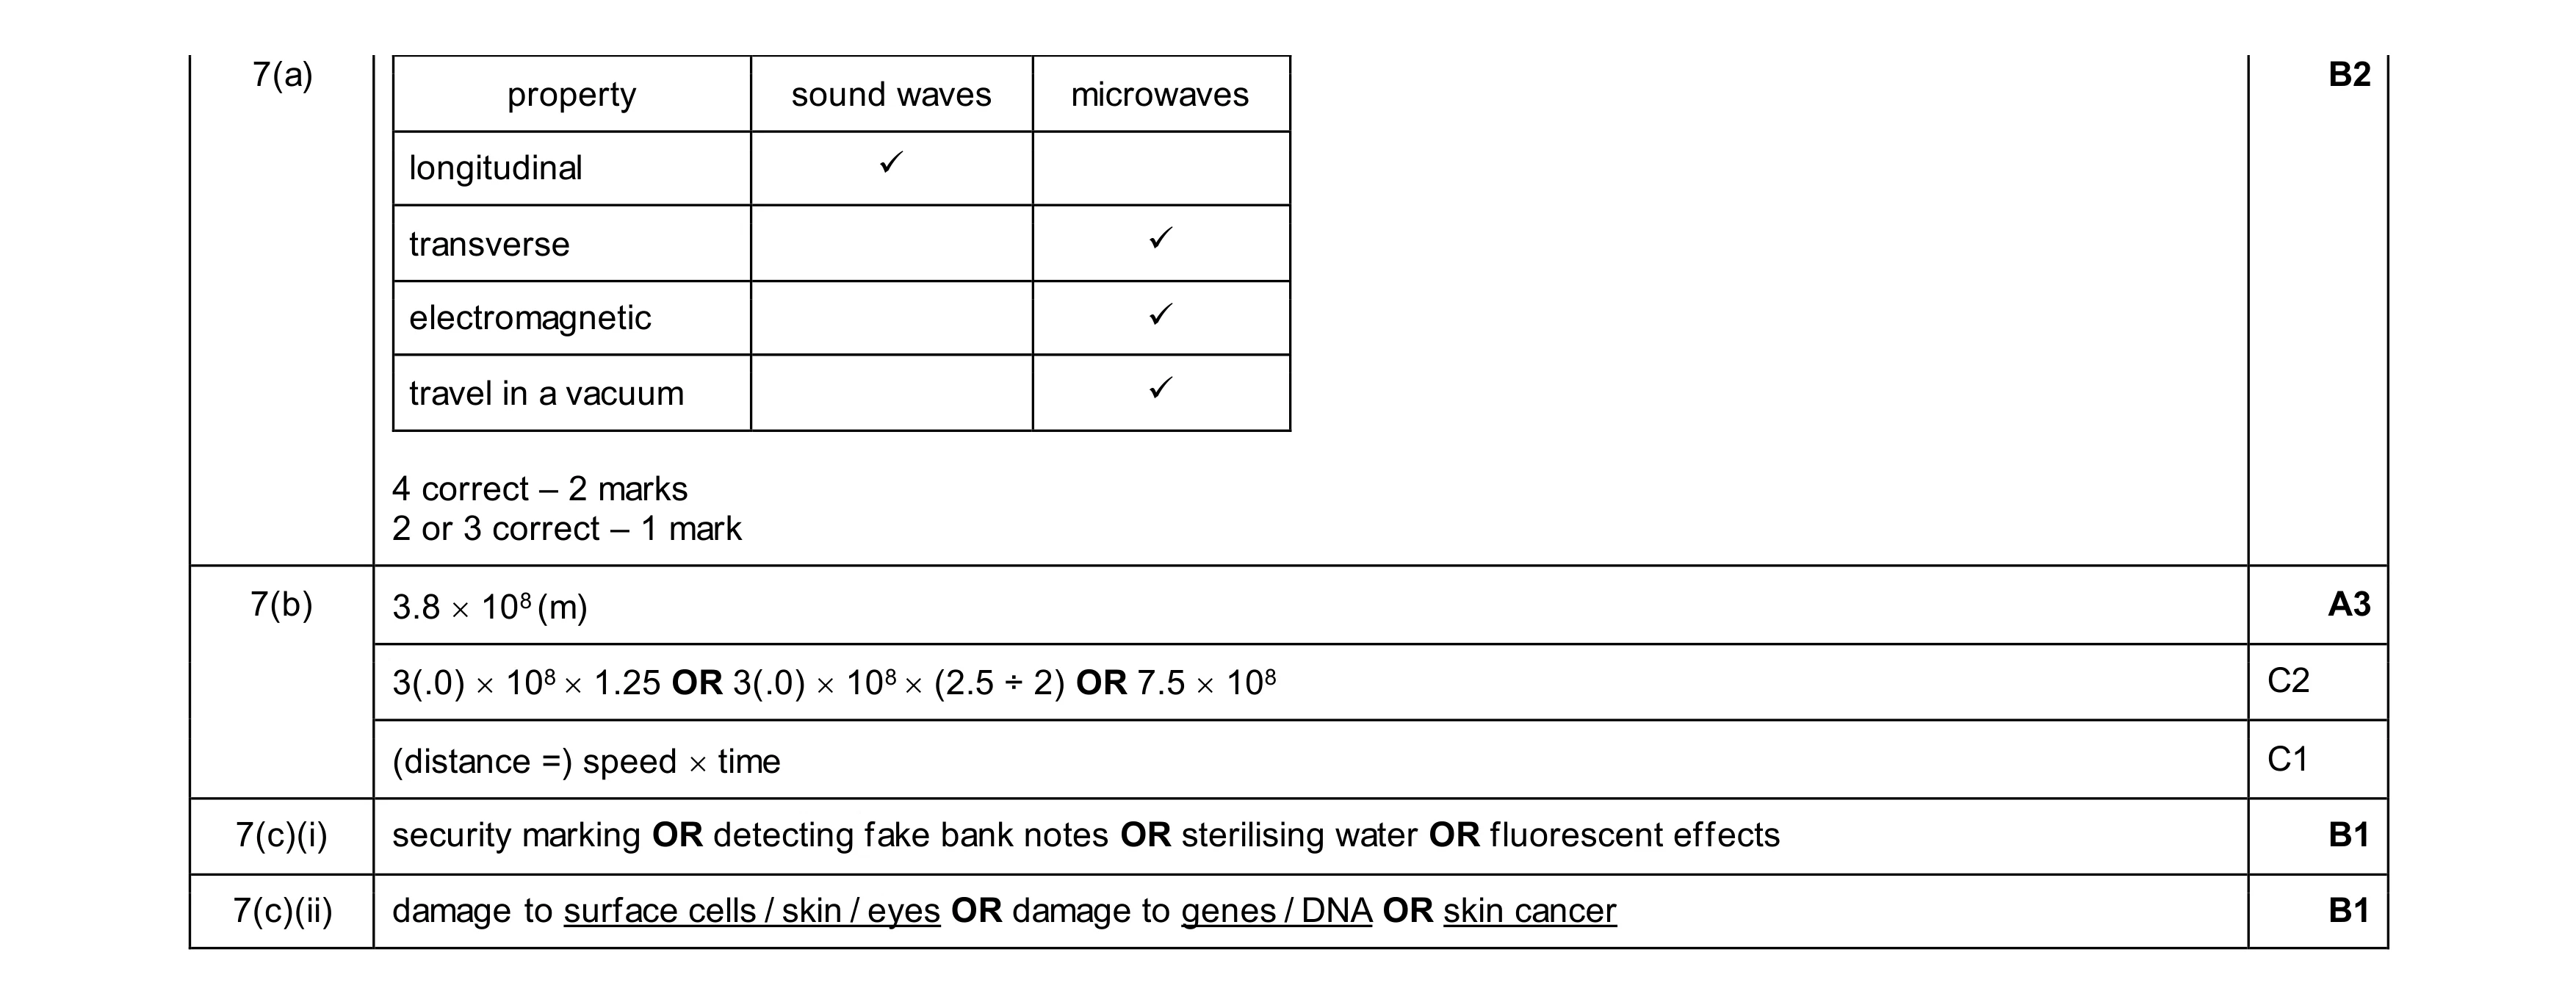 7
7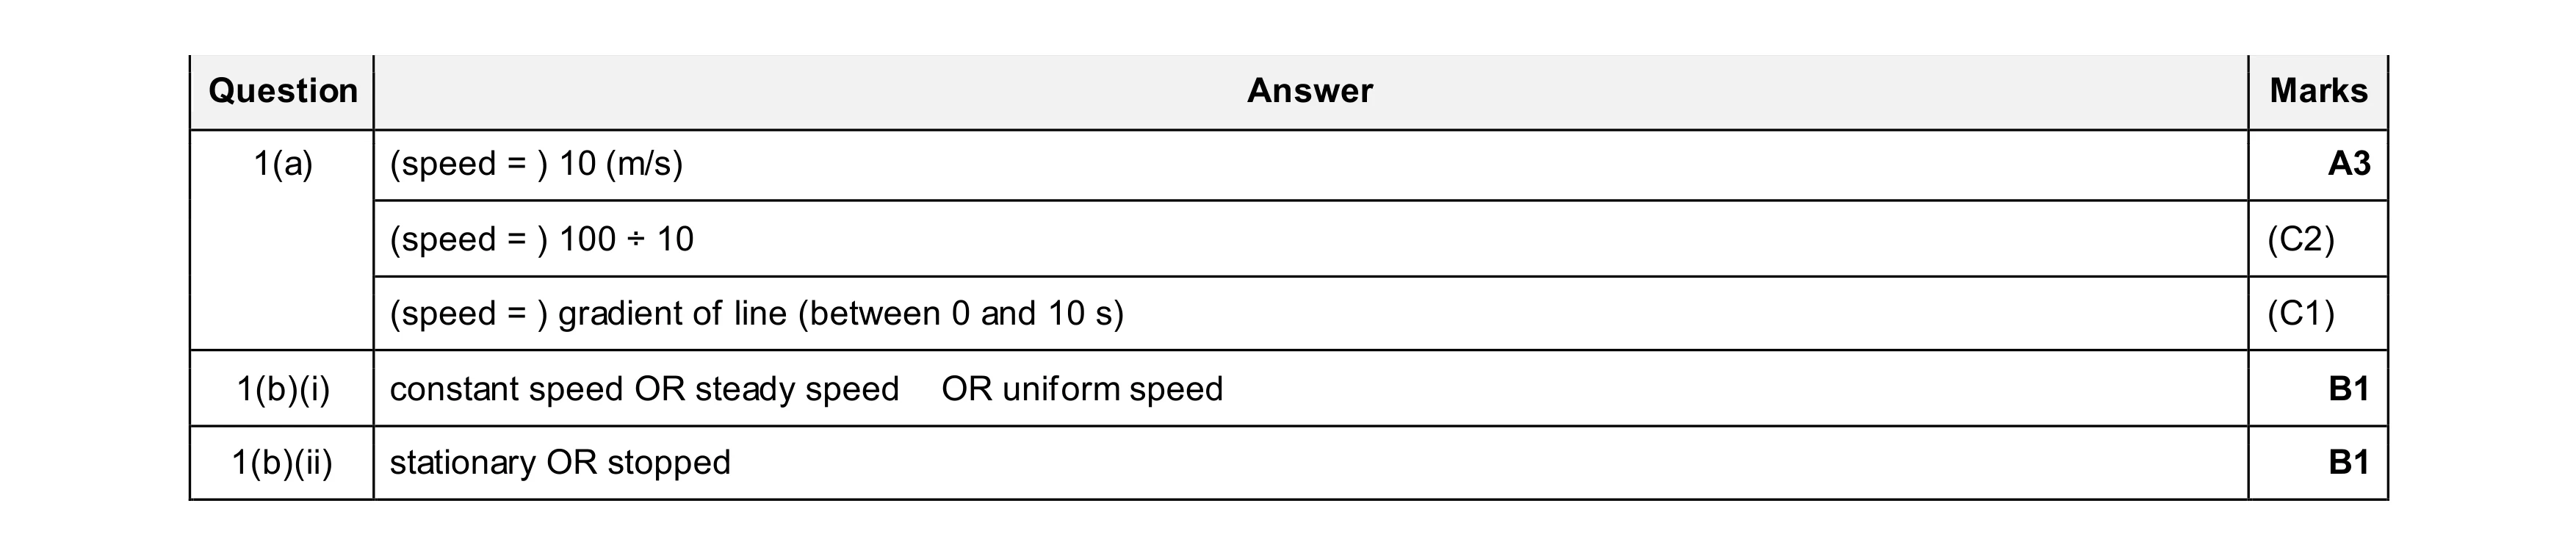 5
5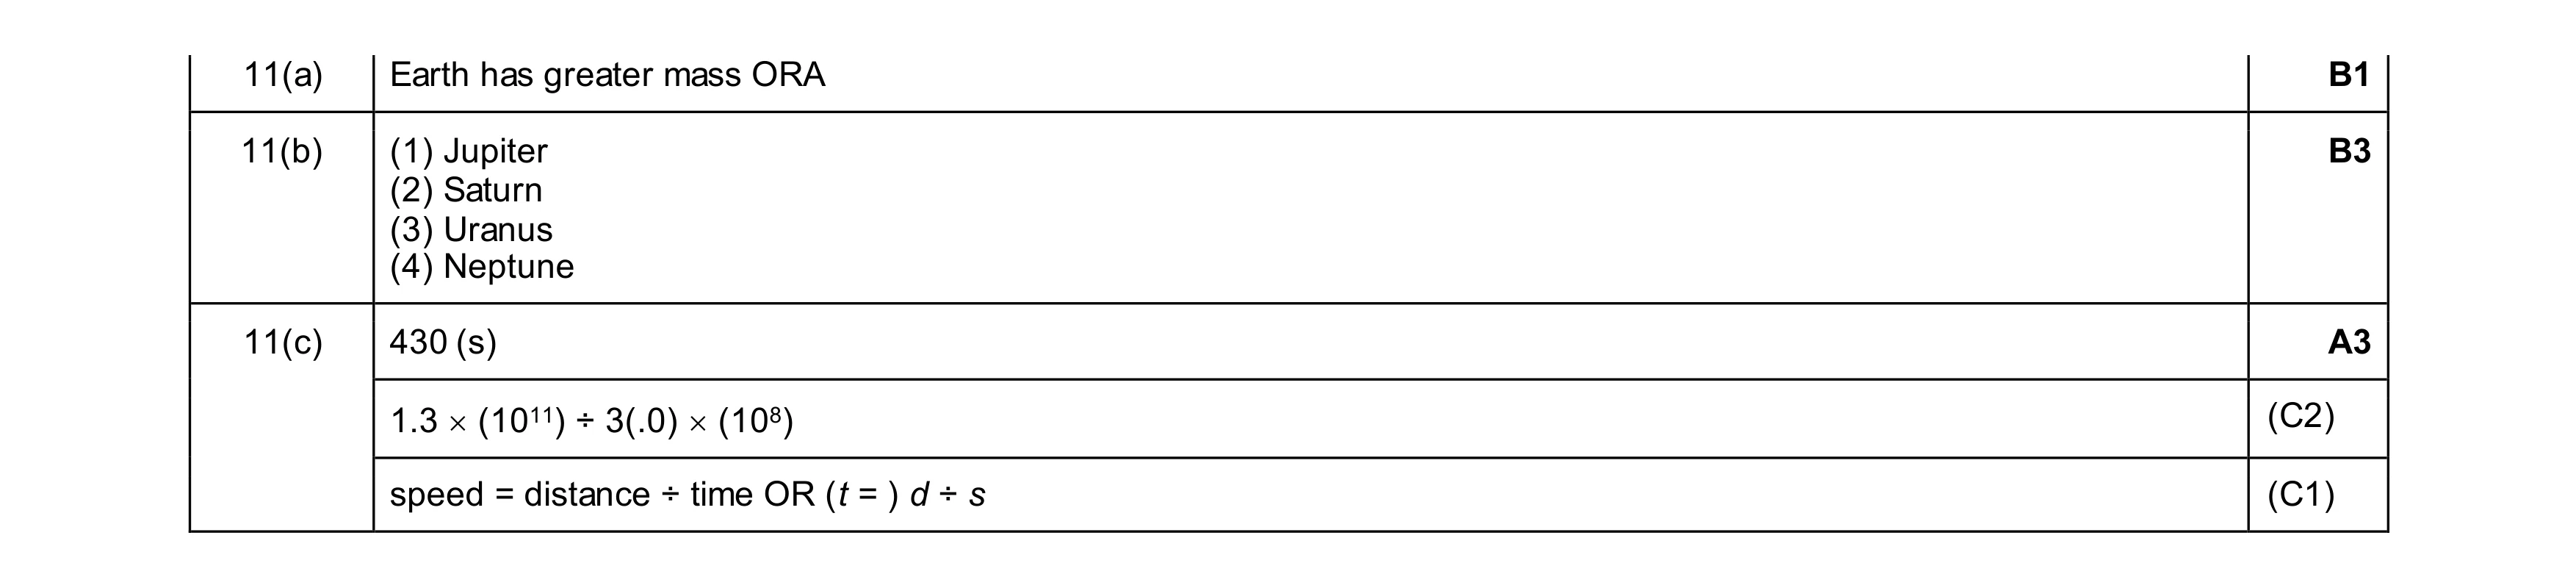 7
7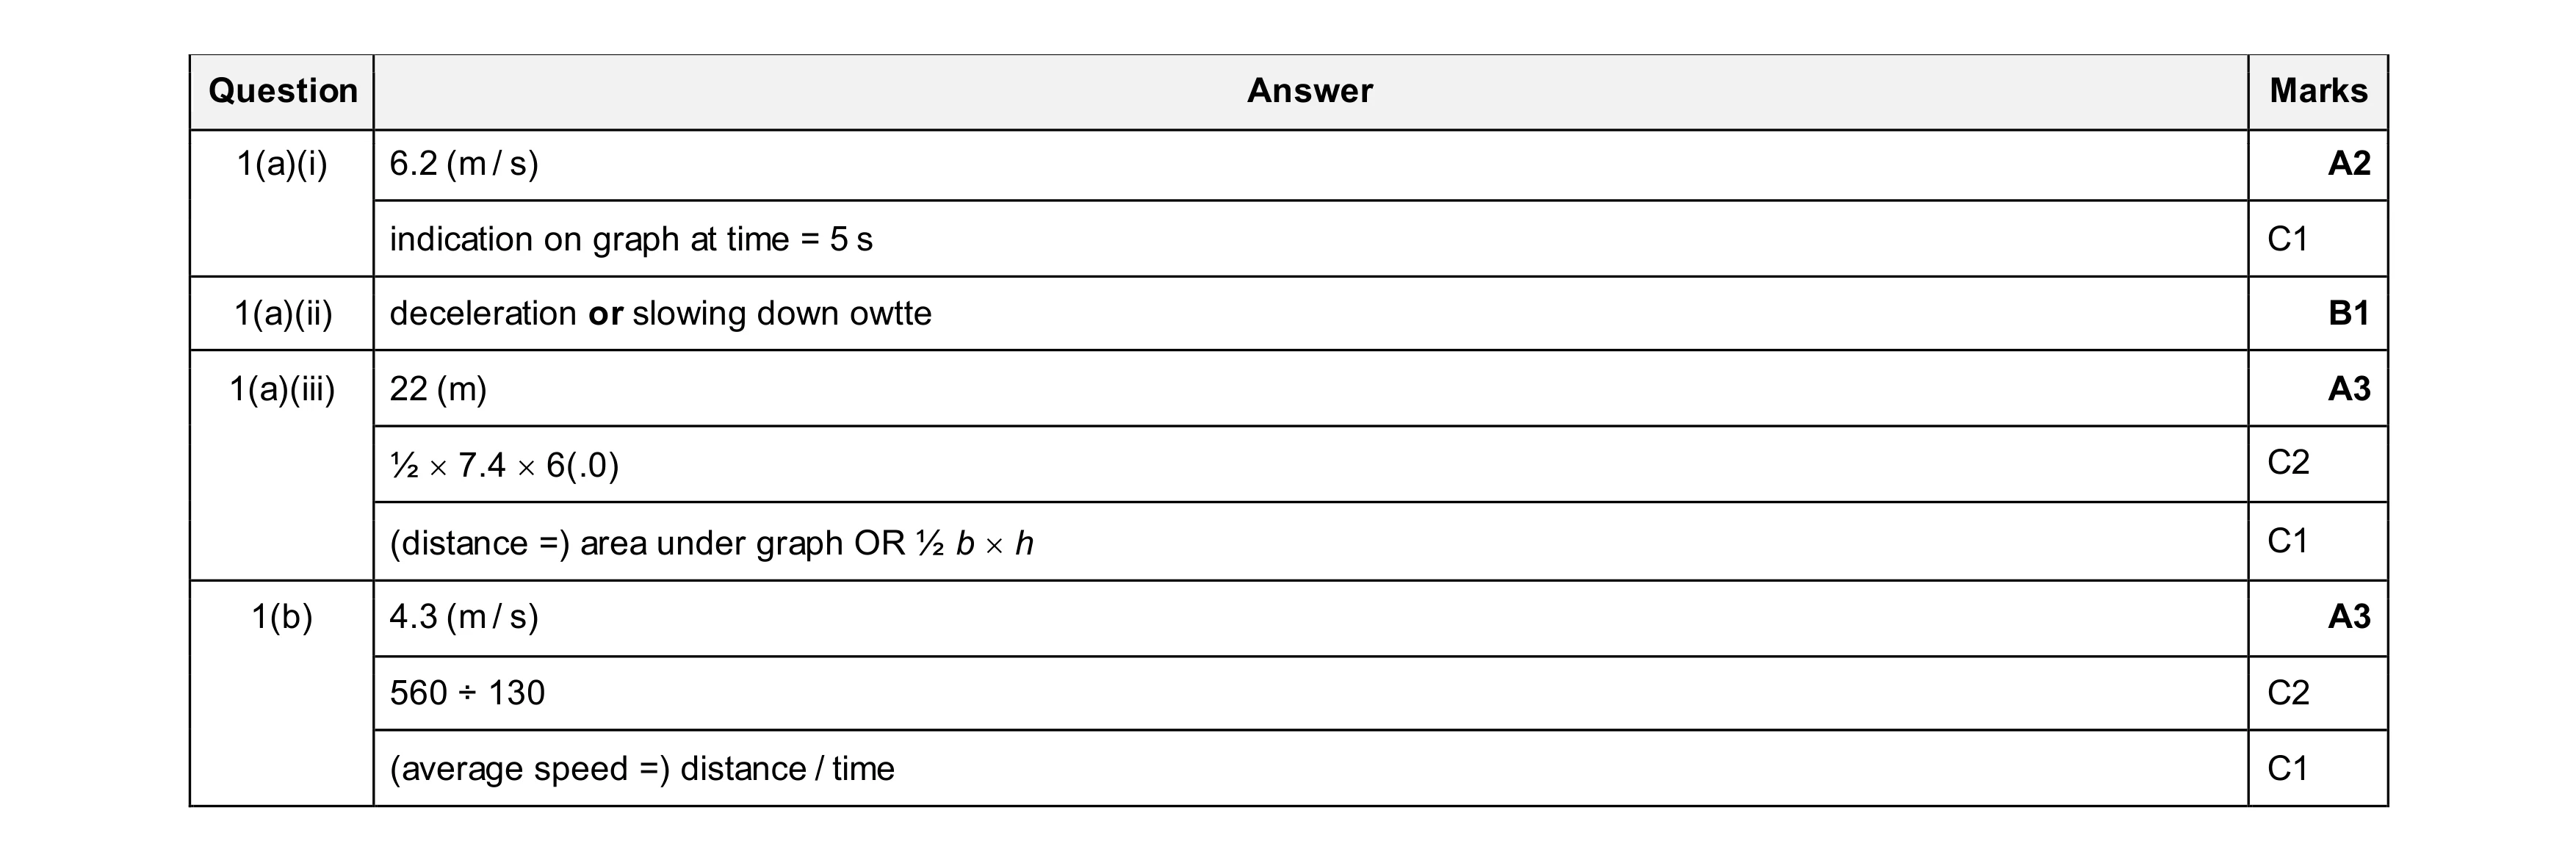 9
9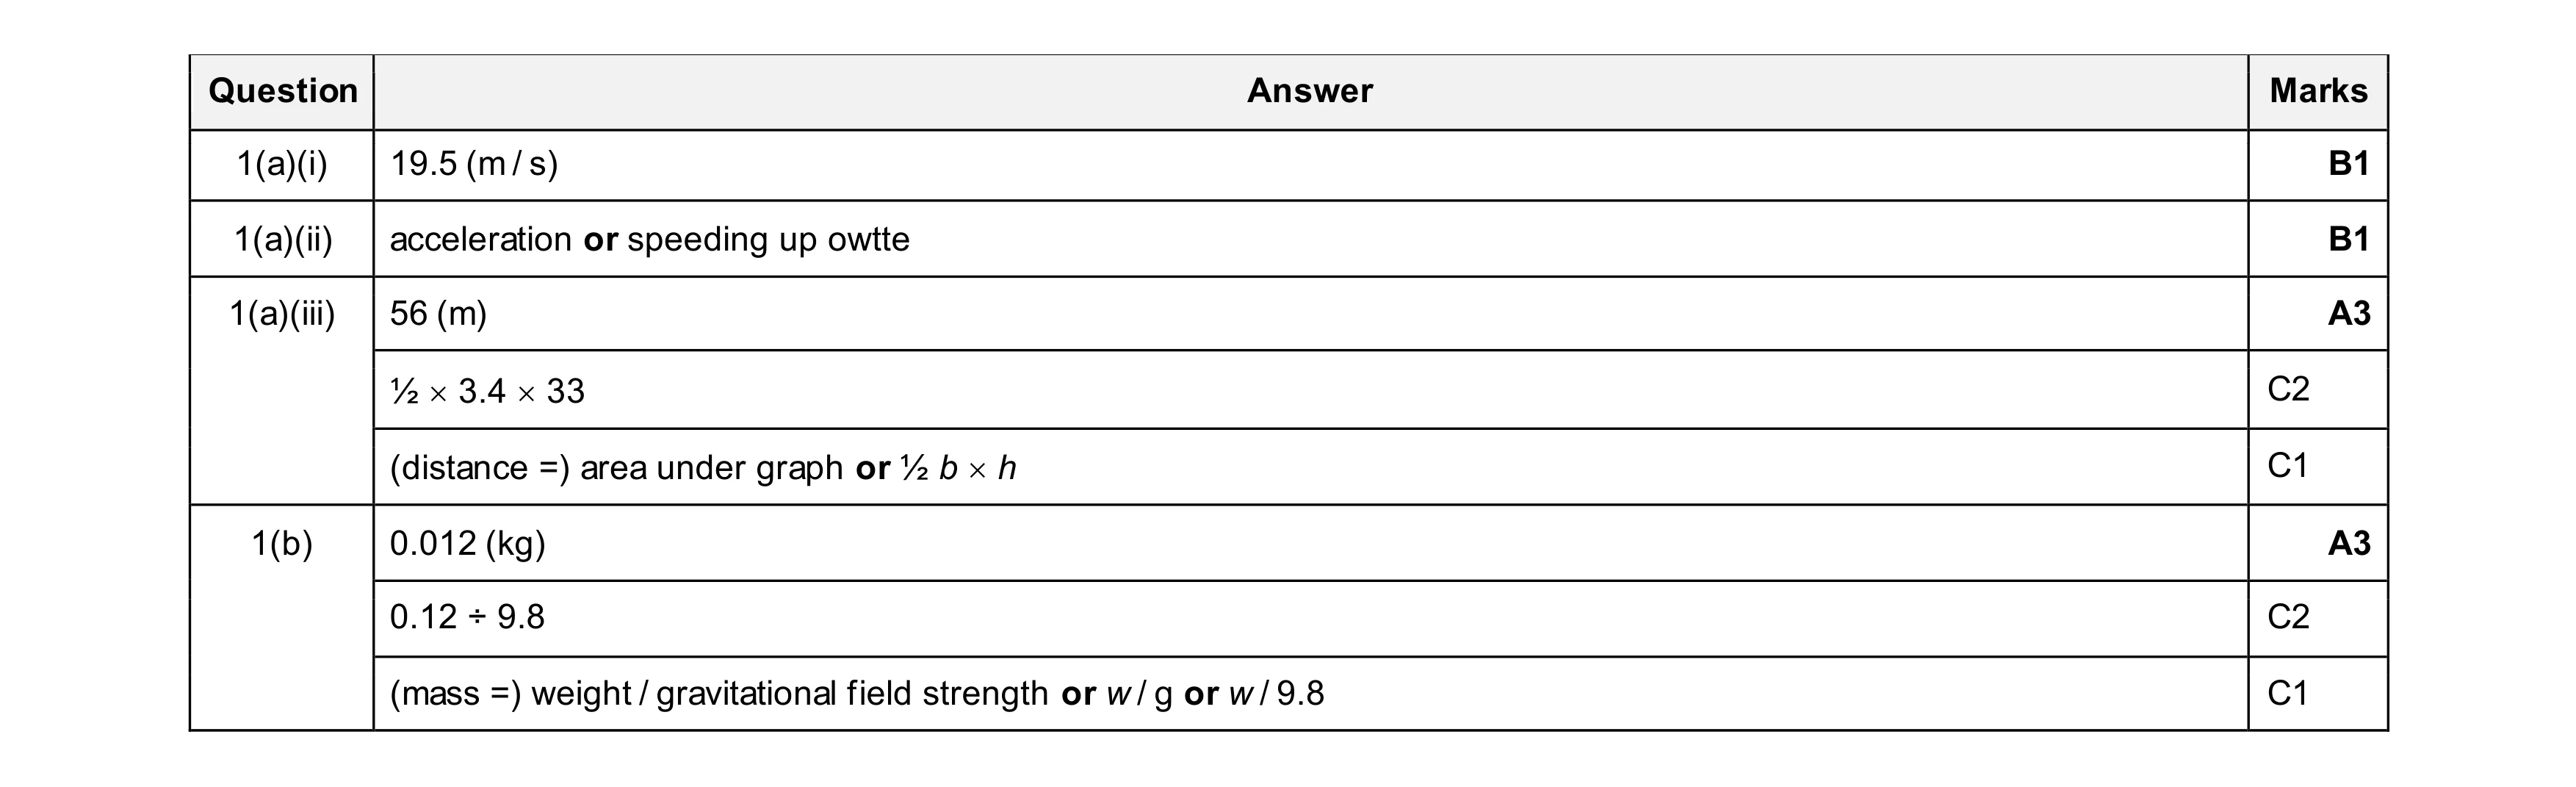 8
8