Questions as text
Q1 · The axes used to plot distance-time graphs 0625/42 Feb/March 2017
1 (a) Fig. 1.1 shows the axes used to plot distance-time graphs. distance 0 0 time Fig. 1.1 On Fig. 1.1, draw graphs for an object that is (i) moving with constant speed, labelling the graph A, (ii) moving with decreasing speed, labelling the graph B. [2] (b) Fig. 1.2 shows the axes used to plot speed-time graphs. speed 0 0 time Fig. 1.2 On Fig. 1.2, draw graphs for an object that is (i) moving with constant acceleration, labelling the graph S, (ii) moving with increasing acceleration, labelling the graph T. [2] (c) A plane is at rest on an airport runway. The brakes of the plane are released and the engine of the plane provides a constant accelerating force. Using the following data, calculate the take-off speed of the plane. Ignore any resistive forces. constant forward force = 56 000 N mass of plane = 16 000 kg time of travel along runway = 16 s speed = … [4] [Total: 8]
8 marks
Mark scheme: 1(a)(i) Constant positive or negative gradient, labelled A B1 1(a)(ii) Decreasing positive or negative gradient, labelled B B1 1(b)(i) Constant positive or negative gradient, labelled S B1 1(b)(ii) Increasing positive or negative gradient, labelled T B1 1(c) F = ma in any form OR (a =) F / m OR 56 000 / 16 000 C1 3.5 (m / s2) C1 a = (v – u) / t in any form OR v – u = at OR v = at OR at OR 3.5 × 16 C1 56 m / s A1 Total: 8
This question in 0625/42 Feb/March 2017
Q2 · The speed-time graph for an ice skater 0625/41 May/June 2017
1 Fig. 1.1 is the speed-time graph for an ice skater. 12 speed m / s 10 8 6 4 2 0 0.0 2.0 4.0 6.0 8.0 10.0 12.0 time t / s Fig. 1.1 (a) Explain what is meant by deceleration. … [1] (b) Use Fig. 1.1 to determine (i) the distance travelled between times t = 3.0 s and t = 6.0 s, distance = … [2] (ii) the deceleration between times t = 3.0 s and t = 6.0 s. deceleration = … [2] (c) (i) State what happens to the size of the deceleration after time t = 6.0 s. … … [1] (ii) State what happens to the resultant force on the skater after time t = 6.0 s. … … [1] [Total: 7]
7 marks
Mark scheme: 1(a) decrease of velocity / speed OR slows / slowing down B1 1(b)(i) Area under graph OR ½ (u +v)t OR ½ × (11 + 5) × 3 OR ½(6 × 3) OR (3 × 5) C1 24 m A1 1(b)(ii) (a =) ∆v / ∆t OR (v – u) / t OR (5 – 11) / (6 – 3) C1 2.0 m / s2 A1 1(c)(i) (deceleration) decreases B1 1(c)(ii) (Resultant force) decreases B1 Total: 7
This question in 0625/41 May/June 2017
Q3 · Acceleration is a vector quantity 0625/43 May/June 2017
1 (a) Acceleration is a vector quantity. Underline the two vector quantities in the list below. energy force frequency impulse mass refractive index [1] (b) A car accelerates uniformly from rest at 2.2 m / s2 for 3.0 s. (i) Calculate the speed of the car at time t = 3.0 s. speed = … [2] (ii) At time t = 3.0 s, it has travelled a distance of 9.9 m. Calculate the average speed of the car during the first 3.0 s of the journey. speed = … [1] (iii) On Fig. 1.1, sketch a distance-time graph for the first 3.0 s of the journey. 10 distance / m 0 0 3.0 time / s Fig. 1.1 [3] [Total: 7]
7 marks
Mark scheme: 1(a) force and impulse underlined B1 1(b)(i) (v =) at OR 2.2 × 3.0 C1 6.6 m / s A1 1(b)(ii) 3.3 m / s B1 1(c) curve/line starts at origin B1 initial gradient zero OR curve passing through (3.0, 9.9) B1 gradient increasing (with time) B1 Total: 7
This question in 0625/43 May/June 2017
Q4 · The speed-time graph for the motion of a car 0625/41 Oct/Nov 2017
1 Fig. 1.1 shows the speed-time graph for the motion of a car. 20 speed m / s 15 10 5 0 0 10 20 30 40 time / s Fig. 1.1 The mass of the car is 1200 kg. (a) Calculate, for the first 20 s of the motion, (i) the distance travelled by the car, distance = … [2] (ii) the acceleration of the car, acceleration = … [2] (iii) the resultant force acting on the car. resultant force = … [2] (b) Describe the motion of the car in the period of time from 25 s to 40 s. … … [1] [Total: 7]
7 marks
Mark scheme: 1(a)(i) C1 130 m A1 1(a)(ii) (a =) (v – u) / t OR (a =) v / t OR 13 / 20 C1 0.65 m / s2 A1 1(a)(iii) (F =) ma OR 1200 × 0.65 C1 = 780 N A1 1(b) Acceleration decreases OR rate of increase of speed decreases OR speed increases at a lower rate B1
This question in 0625/41 Oct/Nov 2017
Q5 · The left-hand column of the table shows some possible speeds of a sound wave 0625/41 Oct/Nov 2017
6 (a) The left-hand column of the table shows some possible speeds of a sound wave. In the right-hand column, write down the medium in which a sound wave has this speed. Choose from solid, liquid or gas. speed of sound wave medium m / s 1500 5000 300 [2] (b) Fig. 6.1 represents a series of compressions and rarefactions of a sound wave. Fig. 6.1 (i) On Fig. 6.1, mark, with the letters X and Y, the mid-points of two rarefactions. [1] (ii) State, in terms of pressure, what is meant by a rarefaction. … … [1] (c) Astronauts set up a mirror on the Moon’s surface. A laser beam is transmitted from the Earth’s surface to the mirror and is then reflected back to Earth. On a certain day, the time between transmitting the beam from a point on the Earth’s surface and receiving the reflected signal at the same point is 2.56 s. The speed of the laser beam is 3.00 × 10⁸ m / s. Calculate the distance between the Earth’s surface and the Moon’s surface. distance = … [3] [Total: 7]
7 marks
Mark scheme: 6(a) 1500 m / s liquid 5000 m / s solid 300 m / s gas B2 6(b)(i) X and Y marked at centres of any two rarefactions B1 6(b)(ii) Area of low pressure or low density (of atoms) or where atoms / molecules far apart B1 6(c) v = = d / t or 2 d / t in any form C1 d = v t / 2 OR 3.0 × 108 × 2.56 / 2 C1 3.84 × 10⁸ m OR 3.84 × 10⁵km A1
This question in 0625/41 Oct/Nov 2017
Q6 · A truck accelerates uniformly along a straight, horizontal road 0625/43 Oct/Nov 2017
1 A truck accelerates uniformly along a straight, horizontal road. The mass of the truck is 2.0 × 10⁴ kg. (a) The speed of the truck increases from rest to 12 m / s in 30 s. Calculate (i) the distance travelled by the truck during this time, distance = … [2] (ii) the resultant force on the truck. resultant force = … [4] (b) To maintain a uniform acceleration, the forward force on the truck must change. Explain why. … … … [2] [Total: 8]
8 marks
Mark scheme: 1(a)(i) C1 180 m A1 1(a)(ii) (a = )∆v / t or 12 / 30 C1 0.40 (m / s2) or 12 / 30 C1 (F = )ma or 2.0 × 104 × 0.40 or 2.0 × 104 × 0.40 × 12 / 30 C1 8000 N A1 1(b) drag / friction / air resistance mentioned C1 drag / friction / air resistance increases (as speed increases) A1
This question in 0625/43 Oct/Nov 2017
Q7 · The speed-time graph for a vehicle accelerating from rest 0625/41 May/June 2018
1 Fig. 1.1 shows the speed-time graph for a vehicle accelerating from rest. 30 25 speed m / s 20 15 10 5 0 0 20 40 60 80 100 120 140 160 time / s Fig. 1.1 (a) Calculate the acceleration of the vehicle at time = 30 s. acceleration = … [2] (b) Without further calculation, state how the acceleration at time = 100 s compares to the acceleration at time = 10 s. Suggest, in terms of force, a reason why any change has taken place. … … … [3] (c) Determine the distance travelled by the vehicle between time = 120 s and time = 160 s. distance = … [3] [Total: 8]
8 marks
Mark scheme: 1(a) Mention of gradient of graph at t = 30 s OR tangent drawn at t = 30 s and triangle drawn 1 Acceleration in range 0.30 to 0.45 m / s2 1 1(b) Acceleration less/at a slower rate 1 Less driving force OR greater resistive force/friction/air resistance/drag 1 Resultant force less 1 1(c) Area under graph 1 Distance = (20 × 40) + (½ × 40 × 10) OR ½ × (30 + 20) × 40 1 1000 m 1
This question in 0625/41 May/June 2018
Q8 · The axes of a distance-time graph for an object moving in a straight line 0625/42 May/June 2018
1 (a) Fig. 1.1 shows the axes of a distance-time graph for an object moving in a straight line. 80 distance / m 60 40 20 0 0 2 4 6 8 10 time / s Fig. 1.1 (i) 1. On Fig. 1.1, draw between time = 0 and time = 10 s, the graph for an object moving with a constant speed of 5.0 m / s. Start your graph at distance = 0 m. 2. State the property of the graph that represents speed. … [2] (ii) Between time = 10 s and time = 20 s the object accelerates. The speed at time = 20 s is 9.0 m / s. Calculate the average acceleration between time = 10 s and time = 20 s. acceleration = … [2] (b) Fig. 1.2 shows the axes of a speed-time graph for a different object. 50 speed m / s 40 30 20 10 0 0 20 40 60 80 100 time / s Fig. 1.2 (i) The object has an initial speed of 50 m / s and decelerates uniformly at 0.35 m / s2 for 100 s. On Fig. 1.2, draw the graph to represent the motion of the object. [2] (ii) Calculate the distance travelled by the object from time = 0 to time = 100 s. distance = … [3] [Total: 9]
9 marks
Mark scheme: 1(a)(i) 1 straight line from (0,0) to (10,50) 1 2 gradient/slope 1 1(a)(ii) a= ∆v ÷ ∆t in any form OR (a=) ∆v ÷ ∆t OR (a =) (9–5) ÷ 10 OR 4 ÷ 10 1 (a =) 0.40 m / s2 1 1(b)(i) straight line down from any point on y-axis to any speed at 100 s 1 from (0,50) to (100,15) 1 1(b)(ii) uses area under graph OR av speed × time OR s=ut + ½ at2 OR v2=u2 + 2as 1 100 × (50 + 15) ÷ 2 OR 100 × 15 + ½ (100 × 35) OR 5000 – ½ × 0.35 × 1002 1 3300 m 1
This question in 0625/42 May/June 2018
Q9 · There is no atmosphere on the Moon 0625/43 May/June 2018
1 There is no atmosphere on the Moon. A space probe is launched from the surface of the Moon. Fig. 1.1 shows the speed-time graph of the space probe. 5000 speed m / s 4000 3000 2000 1000 0 0 100 200 300 time / s Fig. 1.1 (a) Determine the acceleration of the space probe at time = 0. acceleration = … [3] (b) Between time = 0 and time = 150 s, the acceleration of the space probe changes. (i) Without calculation, state how the graph shows this. … … [1] (ii) During this time, the thrust exerted on the space probe by the motor remains constant. State one possible reason why the acceleration changes in the way shown by Fig. 1.1. … … [1] (c) Calculate the distance travelled by the space probe from time = 200 s to time = 300 s. distance = … [3] [Total: 8]
8 marks
Mark scheme: 1(a) C1 accept gradient increases; not gradient decreases C1 values from tangent or line 13 to 14 m / s2 A1 1(b)(i) gradient changes OR graph is curved B1 1(b)(ii) mass of space rocket decreases OR gravitational field strength decreases B1 1(c) area under graph OR (distance =) average speed × time C1 4550 × 100 OR (4100 + 5000) ÷ 2 × 100 C1 4.5/4.55/4.6 × 105 m A1
This question in 0625/43 May/June 2018
Q10 · A train of mass 5.6 × 10⁵ kg is at rest in a station 0625/41 Oct/Nov 2018
1 A train of mass 5.6 × 10⁵ kg is at rest in a station. At time t = 0 s, a resultant force acts on the train and it starts to accelerate forwards. Fig. 1.1 is the distance-time graph for the train for the first 120 s. 5000 distance / m 4000 3000 2000 1000 0 0 20 40 60 80 100 120 time t / s Fig. 1.1 (a) (i) Use Fig. 1.1 to determine: 1. the average speed of the train during the 120 s average speed = … [1] 2. the speed of the train at time t = 100 s. speed = … [2] (ii) Describe how the acceleration of the train at time t = 100 s differs from the acceleration at time t = 20 s. … … … [2] (b) (i) The initial acceleration of the train is 0.75 m / s2. Calculate the resultant force that acts on the train at this time. resultant force = … [2] (ii) At time t = 120 s, the train begins to decelerate. State what is meant by deceleration. … … [1] [Total: 8]
8 marks
Mark scheme: 1(a)(i)1 (4800 / 120 =) 40 m / s B1 1(a)(i)2 (v =) gradient of any part of straight line C1 Value between 50 and 60 m / s A1 1(a)(ii) At t = 20 s, acceleration > zero / acceleration is taking place / greater acceleration than at 100 s B1 At t = 100 s, acceleration = zero / 0 B1 1(b)(i) (F =) ma OR 5.6 × 105 × 0.75 C1 4.2 × 10⁵ N A1 1(b)(ii) Speed / velocity decreases (with time) OR slowing down OR negative acceleration OR Rate of decrease of speed / velocity B1
This question in 0625/41 Oct/Nov 2018
Q11 · A lorry is travelling along a straight, horizontal road 0625/42 Oct/Nov 2018
1 A lorry is travelling along a straight, horizontal road. Fig. 1.1 is the distance-time graph for the lorry. 3000 distance / m 2000 1000 0 0 20 40 60 80 100 120 140 time t / s Fig. 1.1 (a) Using Fig. 1.1, determine: (i) the speed of the lorry at time t = 30 s speed = … [2] (ii) the average speed of the lorry between time t = 60 s and time t = 120 s. average speed = … [2] (b) At time t = 30 s, the total resistive force acting on the lorry is 1.4 × 10⁴ N. (i) Using Fig. 1.1, determine the magnitude of the acceleration of the lorry at time t = 30 s. acceleration = … [1] (ii) Determine the forward force on the lorry due to its engine at time t = 30 s. forward force = … [1] (c) Describe the motion of the lorry between time t = 60 s and time t = 130 s. … … … [2] [Total: 8]
8 marks
Mark scheme: 1(a)(i) (v =) gradient or 1800 / 60 or 900 / 30 C1 30 m / s A1 1(a)(ii) (v = ) d / t or (average speed =) d / t OR (2700 – 1800) / (120 – 60) = 900 / 60 C1 (v =) 15 m / s A1 1(b)(i) 0 (m / s2) B1 1(b)(ii) 1.4 × 10⁴ N B1 1(c) speed / velocity decreases (with time) or negative acceleration or deceleration B1 to zero (speed) / stationary B1
This question in 0625/42 Oct/Nov 2018
Q12 · The distance-time graph for a moving car 0625/43 Oct/Nov 2018
1 Fig. 1.1 is the distance-time graph for a moving car. 500 distance / m 400 300 200 100 0 0 10 20 30 40 50 60 time t / s Fig. 1.1 (a) On Fig. 1.1, mark a point P where the acceleration of the car is zero. [1] (b) Determine: (i) the speed of the car at time t = 15 s speed = … [2] (ii) the average speed of the car between time t = 30 s and time t = 45 s. average speed = … [2] (c) At time t = 45 s, the car starts to decelerate. At time t = 55 s and at a distance of 400 m from the starting point, the car stops. It then remains stationary for 5.0 s. On Fig. 1.1, draw a possible continuation of the distance-time graph. [3] [Total: 8]
8 marks
Mark scheme: 1(a) P marked on line between t = 0 s and t = 30 s B1 1(b)(i) (v =) gradient or 150 / 30 or appropriate division using other points C1 5.0 m / s A1 1(b)(ii) (v =) x / t or (300 – 150) / (45 – 30) or 150 / 15 C1 10 m / s A1 1(c) gradient decreasing B1 smooth transition to horizontal and line not too thick B1 horizontal to (60 s, 400 m) B1
This question in 0625/43 Oct/Nov 2018
Question 13 0625/42 Feb/March 2019
1 (a) Define acceleration. … [1] (b) Fig. 1.1 shows the distance-time graph for the journey of a cyclist. 350 300 distance / m 250 200 150 100 50 0 0 5 10 15 20 25 30 35 40 time / s Fig. 1.1 (i) Describe the motion of the cyclist in the time between: 1. time = 0 and time = 15 s … 2. time = 15 s and time = 30 s … 3. time = 30 s and time = 40 s. … [3] (ii) Calculate, for the 40 s journey: 1. the average speed average speed = … [2] 2. the maximum speed. maximum speed = … [2] [Total: 8]
8 marks
Mark scheme: 1(a) Rate of change of speed OR change of speed / time OR ∆v / t OR (v – u) / t B1 1(b)(i) 1 Acceleration OR increasing speed OR going faster B1 2 Constant speed OR steady speed B1 3 Deceleration OR decreasing speed OR slowing down B1 1(b)(ii) 1 Total distance / total time OR 300 / 40 C1 7.5 m / s A1 2 Change of distance / change of time OR (250 – 70) / (30 – 15) OR 180 / 15 C1 12 m / s A1
This question in 0625/42 Feb/March 2019
Q14 · A rocket is stationary on the launchpad 0625/41 May/June 2019
1 A rocket is stationary on the launchpad. At time t = 0, the rocket engines are switched on and exhaust gases are ejected from the nozzles of the engines. The rocket accelerates upwards. Fig. 1.1 shows how the acceleration of the rocket varies between time t = 0 and time t = tf. acceleration 0 0 tf time t Fig. 1.1 (a) Define acceleration. … … [1] (b) On Fig. 1.2, sketch a graph to show how the speed of the rocket varies between time t = 0 and time t = tf. speed 0 0 tf time t Fig. 1.2 [3] (c) Some time later, the rocket is far from the Earth. The effect of the Earth’s gravity on the motion of the rocket is insignificant. As the rocket accelerates, its momentum increases. (i) State the principle of the conservation of momentum. … … … [2] (ii) Explain how the principle of the conservation of momentum applies to the accelerating rocket and the exhaust gases. … … … … [2] [Total: 8]
8 marks
Mark scheme: 1(a) change of velocity per unit time OR v u t B1 1(b) line starts at origin and is asymptotic to x-axis B1 increasing gradient initially and no decrease B1 constant and clearly positive gradient finally B1 1(c)(i) no external forces OR isolated system B1 sum of momenta / (total) momentum remains constant B1 1(c)(ii) rocket gains (upward) momentum B1 (ejected) gas gains equal (quantity of) momentum in opposite direction OR momentum of gas decreases by equal amount B1
This question in 0625/41 May/June 2019
Q15 · Gas of mass 0.23 g is trapped in a cylinder by a piston 0625/41 May/June 2019
4 Gas of mass 0.23 g is trapped in a cylinder by a piston. The gas is at atmospheric pressure which is 1.0 × 10⁵ Pa. Fig. 4.1 shows the piston held in position by a catch. gas cylinder air at atmospheric pressure piston heater catch Fig. 4.1 The volume of the trapped gas is 1.9 × 10⁻⁴ m3. An electrical heater is used to increase the temperature of the trapped gas by 550 °C. (a) The specific heat capacity of the gas is 0.72 J / (g °C). (i) Calculate the energy required to increase the temperature of the trapped gas by 550 °C. energy = … [2] (ii) The power of the heater is 2.4 W. 1. Calculate how long it takes for the heater to supply the energy calculated in (a)(i). time = … [2] 2. In practice, it takes much longer to increase the temperature of the gas by 550 °C using the heater. Suggest one reason for this. … … … [1] (b) When the temperature of the gas has increased by 550 °C, its pressure is 2.9 × 10⁵ Pa. The catch is then released allowing the piston to move. As the piston moves, the temperature of the gas remains constant. (i) State and explain what happens to the piston. … … … [2] (ii) Determine the volume of the gas when the piston stops moving. volume = … [2] [Total: 9]
9 marks
Mark scheme: 4(a)(i) OR 0.23 × 0.72 × 550 C1 91 J A1 4(a)(ii) 1. t = E / P in any form words, symbols or numbers OR (t =) E / P or 91 / 2.4 C1 38 s A1 2. (thermal) energy is used to increase the temperature of / lost to cylinder / piston / heater / surroundings B1 4(b)(i) it / piston moves to the right / away from heater OR accelerates (to right) M1 pressure (of gas) greater / pressure greater (on left) / resultant force to right A1 4(b)(ii) V2 = p1V1 / p2 in any form OR (V2 =) p1V1 / p2 OR 2.9 × 105 × 1.9 × 10–4 / 1.0 × 10⁵ C1 5.5 × 10⁻⁴ m3 A1
This question in 0625/41 May/June 2019
Q16 · A bus is travelling between points A and D 0625/42 May/June 2019
1 A bus is travelling between points A and D. There are bus stops at A, B, C and D but the bus does not stop at B and C. Fig. 1.1 is a speed-time graph for the bus. B C 40 speed km / h 30 20 10 A D 0 0 1.0 2.0 3.0 4.0 5.0 time / min Fig. 1.1 (a) Describe the motion of the bus between each of the bus stops. Select the appropriate description from the list below. constant acceleration decreasing acceleration increasing acceleration moving backwards at constant speed moving forwards at constant speed stationary 1. between A and B … 2. between B and C … 3. between C and D … [3] (b) The average speed of the bus between A and D is 23 km / h. Calculate the distance between A and D. distance = … [3] (c) The bus stops at D for 1 min and then travels at a constant acceleration for 30 seconds. On Fig. 1.1, sketch a possible graph for this additional motion. Label X when the bus starts to accelerate and label Y for 30 seconds later. [3] [Total: 9]
9 marks
Mark scheme: 1(a) (A and B) decreasing acceleration B1 (B and C) moving forwards at constant speed B1 (C and D) constant acceleration B1 1(b) (average) speed = distance/time OR v = s/t in any form OR (s =) (average) speed × time OR v × t OR area under graph stated or used C1 (s = ) 23 × 2/60 C1 0.77 km round candidates response to 2 sfs A1 1(c) horizontal line starting at t = 2.0 min AND at speed = 0 for 1 minute B1 line of constant positive gradient starting at t >= 2.0 min NOT wrong labels X OR Y B1 for 30 seconds line continuously rising B1
This question in 0625/42 May/June 2019
Q17 · A distance‑time graph for a cyclist travelling between points P and V on a straight road 0625/43 May/June 2019
1 Fig. 1.1 shows a distance‑time graph for a cyclist travelling between points P and V on a straight road. 800 distance / m 600 V S T U 400 R 200 Q P 0 0 100 200 300 400 500 time / s Fig. 1.1 (a) Describe the motion between: Q and R … R and S … S and T. … [3] (b) Calculate the speed between U and V. speed = … [2] (c) After point V, the straight road continues down a steep hill. The cyclist travels down the steep hill. He does not apply the brakes and all resistive forces can be ignored. On Fig. 1.1, sketch a possible motion for the cyclist after V. [1] [Total: 6]
6 marks
Mark scheme: 1(a)(i) constant velocity / speed B1 1(a)(ii) deceleration / negative acceleration B1 1(a)(iii) Stationary B1 1(b) v = gradient OR distance time OR 160 160 100 OR evidence of use of gradient C1 (v =) 1.6 m/s A1 1(c) line curves upwards with increasing gradient NOT vertical B1
This question in 0625/43 May/June 2019
Q18 · A car accelerates from rest at time t = 0 to its maximum speed 0625/41 Oct/Nov 2019
1 A car accelerates from rest at time t = 0 to its maximum speed. Fig. 1.1 is the speed-time graph for the first 25 s of its motion. 40 speed m / s 30 20 10 0 0 5 10 15 20 25 t / s Fig. 1.1 (a) The mass of the car is 2300 kg. For the time between t = 0 and t = 5.0 s, determine: (i) the acceleration of the car acceleration = … [2] (ii) the resultant force acting on the car. resultant force = … [2] (b) Describe the motion of the car between t = 10 s and t = 15 s. Explain how Fig. 1.1 shows this. … … … … [3] (c) Between t = 10 s and t = 15 s, the force exerted on the car due to the engine remains constant. Suggest and explain why the car moves in the way shown by Fig. 1.1. … … … [2] [Total: 9]
9 marks
Mark scheme: 1(a)(i) gradient 3.0 m / s2 C1 A1 1(a)(ii) (F =) ma in any form words, symbols or numbers or (F =) ma or 2300 × 3.0 6900 N C1 A1 1(b) accelerating or speed / velocity increasing at a decreasing rate or acceleration decreasing gradient (of graph is positive and) decreasing B1 B1 B1 1(c) air resistance or friction mentioned or resistive force air resistance or friction or resistive force increases (with speed) B1 B1
This question in 0625/41 Oct/Nov 2019
Q19 · A rocket is launched vertically upwards from the ground 0625/42 Feb/March 2020
1 A rocket is launched vertically upwards from the ground. The rocket travels with uniform acceleration from rest. After 8.0 s, the speed of the rocket is 120 m / s. (a) Calculate the acceleration of the rocket. acceleration = … [2] (b) (i) On Fig. 1.1, draw the graph for the motion of the rocket in the first 8.0 s. 200 speed m / s 150 100 50 0 0 5 10 15 20 25 time / s Fig. 1.1 [1] (ii) Use the graph to determine the height of the rocket at 8.0 s. height = … [2] (iii) From time = 8.0 s to time = 20.0 s, the rocket rises with increasing speed but with decreasing acceleration. From time = 20.0 s to time = 25.0 s, the rocket has a constant speed of less than 200 m / s. On Fig. 1.1, draw the graph for this motion. [3] [Total: 8]
8 marks
Mark scheme: 1(a) (a=)Δv / Δt in any form OR (a=)Δv / Δt OR (a)=120 / 8 C1 (a) = 15 m / s2 A1 1(b)(i) straight line from (0,0) to (8,120) B1 1(b)(ii) (h = A =) ½ × 120 × 8 C1 (h=) 480 m A1 1(b)(iii) rising curve from 8 s to 20 s B1 decreasing gradient from 8 s to 20 s B1 horizontal from 20 s to 25 s AND below 200 m / s, AND above 120 m / s B1
This question in 0625/42 Feb/March 2020
Q20 · An aeroplane of mass 2.5 × 10⁵ kg lands with a speed of 62 m / s, on a horizontal runway… 0625/41 May/June 2020
1 An aeroplane of mass 2.5 × 10⁵ kg lands with a speed of 62 m / s, on a horizontal runway at time t = 0. The aeroplane decelerates uniformly as it travels along the runway in a straight line until it reaches a speed of 6.0 m / s at t = 35 s. (a) Calculate: (i) the deceleration of the aeroplane in the 35 s after it lands deceleration = … [2] (ii) the resultant force acting on the aeroplane as it decelerates force = … [2] (iii) the momentum of the aeroplane when its speed is 6.0 m / s. momentum = … [2] (b) At t = 35 s, the aeroplane stops decelerating and moves along the runway at a constant speed of 6.0 m / s for a further 15 s. On Fig. 1.1, sketch the shape of the graph for the distance travelled by the aeroplane along the runway between t = 0 and t = 50 s. You are not required to calculate distance values. distance 0 0 35 50 time / s Fig. 1.1 [3] (c) As the aeroplane decelerates, its kinetic energy decreases. Suggest what happens to this energy. … … [1] [Total: 10]
10 marks
Mark scheme: 1(a)(i) (a =) (v – u) / t OR (62 – 6.0) / 35 OR 56 / 35 C1 1.6 m / s2 A1 1(a)(ii) (F =) ma OR Δp / Δt OR 2.5 × 105 × 1.6 OR (62 × 2.5 × 105 – 6.0 × 2.5 × 105) / 35 C1 4.0 × 10⁵ N A1 1(a)(iii) (p =) mv OR 2.5 × 105 × 6.0 C1 1.5 × 10⁶ kg m / s A1 1(b) curve of decreasing gradient from (0,0) to a point along dashed line B1 straight line of positive gradient after t = 35 s B1 gradient not zero at t = 35 s OR no change of gradient (at t = 35 s) B1 1(c) thermal energy AND in something specific (e.g. brakes / air / tyres) OR kinetic energy of air B1
This question in 0625/41 May/June 2020
Q21 · The speed–time graph of a person on a journey 0625/42 May/June 2020
1 Fig. 1.1 shows the speed–time graph of a person on a journey. On the journey, he walks and then waits for a bus. He then travels by bus. He gets off the bus and waits for two minutes. He then walks again. His journey takes 74 minutes. 50 speed km / h 40 30 20 10 0 0 10 20 30 40 50 60 70 80 time / min Fig. 1.1 (a) For the whole journey calculate: (i) the distance travelled distance = … [3] (ii) the average speed. average speed = … [2] (b) State and explain which feature of a speed–time graph shows acceleration. … … [2] (c) State and explain the acceleration of the person at time = 40 minutes. … … [2] [Total: 9]
9 marks
Mark scheme: 1(a)(i) s = vt in any form OR (s =) vt OR relates distance to area (under graph) C1 any one of: 5 × 20 / 60 OR 40 × 20 / 60 OR 6 × 22 / 60 C1 (s = 1.667 + 13.333 + 2.2 =) 17 km A1 1(a)(ii) average speed = candidate’s (i) / time C1 (average speed = 17 × 60 / 74 =) 14 km / h A1 1(b) gradient B1 (gradient =) change of speed / time B1 1(c) 0 B1 (constant) gradient = 0 OR speed constant B1
This question in 0625/42 May/June 2020
Question 22 0625/42 May/June 2020
2 Fig. 2.1 shows a train. Fig. 2.1 The total mass of the train and its passengers is 750 000 kg. The train is travelling at a speed of 84 m / s. The driver applies the brakes and the train takes 80 s to slow down to a speed of 42 m / s. (a) Calculate the impulse applied to the train as it slows down. impulse = … [3] (b) Calculate the average resultant force applied to the train as it slows down. force = … [2] (c) Suggest how the shape of the train helps it to travel at high speeds. … … [1] (d) The train took 80 s to reduce its speed from 84 m / s to 42 m / s. Explain why, with the same braking force, the train takes more than 80 s to reduce its speed from 42 m / s to zero. … … [1] (e) On a wet day, the train travels a greater distance before it stops along the same track. The train has the same speed of 84 m / s before the brakes are applied. Suggest a reason for this. … … [1] [Total: 8]
8 marks
Mark scheme: 2(a) impulse OR Δp = m(v – u) in any form C1 (impulse =) 750 000 (84 – 42) C1 (impulse =) 3.2 × 10⁷ N s or m kg / s A1 2(b) Ft = impulse OR Δp in any form OR (F =) (impulse OR Δp) / t C1 (F = 3.2 x 10⁷ / 80 =) 3.9 ×10⁵ N A1 2(c) reduces drag / air resistance (experienced by the train) / more streamlined B1 2(d) less drag / air resistance (at slower speeds) B1 2(e) (maximum) friction (force) between rails and train reduced / train may slide B1
This question in 0625/42 May/June 2020
Question 23 0625/43 May/June 2020
1 (a) Define acceleration. … … [1] (b) Fig. 1.1 shows two speed–time graphs, A and B, and two distance–time graphs, C and D. speed speed A B 0 0 0 time 0 time distance distance C D 0 0 0 time 0 time Fig. 1.1 Describe the motion shown by: (i) graph A … … [2] (ii) graph B … … [2] (iii) graph C … … [1] (iv) graph D. … … [1] [Total: 7]
7 marks
Mark scheme: 1(a) rate of change of velocity OR change in speed per unit time / s B1 1(b)(i) deceleration C1 constant deceleration A1 1(b)(ii) acceleration C1 increasing acceleration A1 1(b)(iii) decreasing speed / velocity OR deceleration B1 1(b)(iv) constant speed B1
This question in 0625/43 May/June 2020
Q24 · A vertical tube contains a liquid 0625/41 Oct/Nov 2020
2 A vertical tube contains a liquid. A metal ball is held at rest by a thread just below the surface of the liquid, as shown in Fig. 2.1. thread metal ball tube liquid Fig. 2.1 (not to scale) The diameter of the tube is much greater than the diameter of the ball. The ball is released and it accelerates downwards uniformly for a short period of time. (a) Describe what happens to the velocity of the ball in the short period of time as it accelerates downwards uniformly. … … [2] (b) The ball reaches terminal velocity. Describe and explain the motion of the ball from when it is released until it reaches terminal velocity. … … … … [3] (c) The metal ball has a mass of 2.1 g. It falls a distance of 0.80 m between being released and reaching the bottom of the tube. (i) Calculate the gravitational potential energy transferred from the ball as it falls. gravitational potential energy transferred = … [2] (ii) When the ball reaches the bottom of the tube, it has a speed of 1.2 m / s. Calculate the kinetic energy of the ball at the bottom of the tube. kinetic energy = … [3] (iii) Explain why the value calculated in (c)(i) is different from that calculated in (c)(ii). … … [1] [Total: 11]
11 marks
Mark scheme: 2(a) it / velocity / speed changes / increases (with time) C1 it / velocity / speed increases at constant rate / steadily A1 2(b) any three from: • (initial) acceleration caused by weight / force of gravity • acceleration decreases • drag / resistance force increases (with speed) • (finally / at terminal velocity) no acceleration / constant speed • (finally / at terminal velocity) no resultant force B3 2(c)(i) (GPE =) mg (Δ) h (in any form) or 0.0021 × 10 × 0.80 or 2.1 × 10 × 0.80 or 17 (J) C1 0.017 J A1 2(c)(ii) (KE =) 1 2 mv 2 (in any form) C1 1 2 × 0.0021 × 1.22 or 1 2 × 2.1 × 1.22 or 1.5 (J) C1 1.5 × 10⁻³ J A1 2(c)(iii) (work done against) friction / drag / resistance or thermal energy generated or (displaced) liquid gains gravitational potential energy B1
This question in 0625/41 Oct/Nov 2020
Q25 · A sky-diver jumps out of a hot-air balloon, which is 4000 m above the ground 0625/42 Oct/Nov 2020
1 A sky-diver jumps out of a hot-air balloon, which is 4000 m above the ground. At time = 30 s, she opens her parachute. Fig. 1.1 is the speed-time graph of her fall. 60 speed m / s 40 20 0 0 10 20 30 40 50 4.0 time / s Fig. 1.1 (a) (i) Label with the letter X the point on the graph where the sky-diver opens her parachute. [1] (ii) Label with the letters Y and Z the two parts of the graph where the sky-diver falls at terminal velocity. [1] (b) Describe, in terms of the forces acting on the sky-diver, her motion between leaving the balloon and opening her parachute. … … … … … … [4] (c) Calculate the average speed of the sky-diver in the first 4.0 s of her fall. average speed = … [2] [Total: 8]
8 marks
Mark scheme: 1(a)(i) X near (30,60) B1 1(a)(ii) Y AND Z near any horizontal section of graph B1 1(b) any two from: • weight OR force of / due to gravity acts down • (force of / due to) air resistance / drag / friction acts up / opposes motion • initially / up to 10 s: resultant force is downward OR downward force is greater than upward force • resultant force causes acceleration • air resistance increases as speed increases / she accelerates B1 any two from: • acceleration (down) initially / for first 10 s • acceleration decreases as air resistance increases / resultant force decreases • zero acceleration / constant speed / terminal velocity reached when upwards force = downwards force OR when no / zero resultant OR when forces balanced OR when downward force = air resistance • terminal velocity / constant speed reached after (about) 10 s OR at 60 m / s B2 1(c) (average speed =) {initial speed + final speed} / 2 words, symbols or numbers OR (average speed =) distance (from area) / time words, symbols or numbers C1 (average speed = 40 / 2 =) 20 m / s OR (av speed = 80 / 4 = ) 20 m / s A1
This question in 0625/42 Oct/Nov 2020
Q26 · A trolley travelling down a ramp 0625/43 Oct/Nov 2020
1 (a) Fig. 1.1 shows a trolley travelling down a ramp. tape trolley P ramp x Fig. 1.1 The trolley has a piece of paper tape attached to it. The tape passes through a machine which makes a dot on the tape every 0.02 s. Fig. 1.2 shows a section of the tape. Fig. 1.2 (i) State how the dots on the tape show that the trolley was moving with constant speed. … [1] (ii) When the trolley reaches the point P, the ramp is tilted so that the angle x is greater. Describe and explain the change in motion of the trolley. description … … explanation … … [2] (b) Another trolley is released from the top of the ramp. Fig. 1.3 shows the speed–time graph for this trolley. 1.5 speed m / s 1.0 0.5 0 0 0.5 1.0 1.5 time / s Fig. 1.3 Using Fig. 1.3, calculate the distance travelled by the trolley in the first 0.5 s. distance = … [2] (c) Fig. 1.4 shows a metal ball at rest in a tube of liquid. metal ball X liquid tube Fig. 1.4 The ball is released and reaches terminal velocity at point X. Explain the motion of the ball as it falls from rest until it reaches point X. Use ideas of force and acceleration in your answer. … … … … … [3] [Total: 8]
8 marks
Mark scheme: 1(a)(i) same distance travelled in same time / 0.02 s / dots equally spaced B1 1(a)(ii) trolley accelerates OR trolley increases speed / velocity B1 a resultant force is acting on the trolley B1 1(b) distance = area under graph, in any form C1 (distance = 0.5 0.75 2 × =) 0.19 m A1 1(c) any three from • initially velocity increases or the metal ball is accelerating OR (downwards) resultant force • resistance (of liquid) has increased (as velocity increases) • downwards force (on metal ball) = upwards force (on metal ball) (at point X) • (metal ball) travels at constant velocity / speed B3
This question in 0625/43 Oct/Nov 2020
Q27 · A cliff edge with water below it 0625/43 Oct/Nov 2020
2 Fig. 2.1 shows a cliff edge with water below it. ball cliff 115 m water Fig. 2.1 A ball falls over the edge of the cliff. The mass of the ball is 160 g. The height of the cliff is 115 m. (a) Calculate the vertical speed of the ball as it hits the water. Air resistance can be ignored. speed = … [3] (b) Calculate the vertical momentum of the ball as it hits the water. momentum = … [2] [Total: 5]
5 marks
Mark scheme: 2(a) PE lost = KE gained, in any form C1 v2 = 2gh or 0.16 × 10 × 115 = 0.5 × 0.16 × v2 C1 (speed =) 48 m / s A1 2(b) momentum = mv C1 (momentum=) 7.7 kg m / s or 7.7 N s A1
This question in 0625/43 Oct/Nov 2020
Q28 · Speed is a scalar quantity 0625/43 Oct/Nov 2020
3 (a) (i) Speed is a scalar quantity. State one other scalar quantity. … [1] (ii) Velocity is a vector quantity. State one other vector quantity. … [1] (b) Fig. 3.1 shows a model car travelling at constant speed on a flat circular track. car circular track Fig. 3.1 The speed of the car is 0.30 m / s. In one complete revolution around the track, the car travels 3.9 m. (i) Calculate the time taken for the car to complete one revolution around the track. time = … [2] (ii) On Fig. 3.1, draw and label with the letter F an arrow to show the resultant force acting on the car. [1] (iii) The speed of the car increases and at point P on Fig. 3.2 the car does not stay on the track. P Fig. 3.2 1. Suggest, in terms of the force acting on the car, why the car does not stay on the track at point P. … … [1] 2. On Fig. 3.2, draw and label an arrow with the letter S to show the direction of motion of the car as it leaves the track at point P. [1] [Total: 7]
7 marks
Mark scheme: 3(a)(i) One other scalar quantity B1 3(a)(ii) One other vector quantity B1 3(b)(i) v = d ÷ t in any form OR (t= ) d ÷ v OR 3.9 ÷ 0.3 C1 (t =) 13 s A1 3(b)(ii) inward arrow labelled F towards centre of circle B1 3(b)(iii) 1 frictional / inward force / resultant force insufficient (at higher speed) B1 2 tangential arrow at P in either direction, labelled S B1
This question in 0625/43 Oct/Nov 2020
Q29 · A skydiver of mass 76 kg is falling vertically in still air 0625/41 May/June 2021
1 A skydiver of mass 76 kg is falling vertically in still air. At time t = 0, the skydiver opens his parachute. Fig. 1.1 is the speed–time graph for the skydiver from t = 0. 60 speed m / s 40 20 0 0 1 2 3 4 5 6 t / s Fig. 1.1 (a) Using Fig. 1.1, determine: (i) the deceleration of the skydiver immediately after the parachute opens deceleration = … [2] (ii) the force due to air resistance acting on the skydiver immediately after the parachute opens. force = … [3] (b) Explain, in terms of the forces acting on the skydiver, his motion between t = 0 and t = 6.0 s. … … … … [3] (c) Explain why opening the parachute cannot reduce the speed of the skydiver to zero. … … … [2] [Total: 10]
10 marks
Mark scheme: 1(a)(i) any value from 35 to 43 m / s2 A2 (a =) (v – u) / t in any form or gradient (of line) or (58 – 50) / 0.20 or equivalent values from the graph C1 1(a)(ii) 3800 N A3 (F =) ma in any form or Δp / Δt in any form or 76 × candidate’s 1(a)(i) or 760 seen C1 76 × candidate’s 1(a)(i) evaluated or 76 × (candidate’s 1(a)(i) + 10) or 76 × (candidate’s 1(a)(i))+ 760 C1 1(b) (deceleration because) upward force greater than weight or upward resultant force B1 air resistance decreases (with decreasing speed / with time) or deceleration decreases or resultant (upward) force decreases B1 (until / finally) weight equals air resistance or forces balance or at terminal / constant velocity / speed B1 1(c) at zero speed there is no air resistance B1 weight / downwards force is (still) acting or there is (now) a resultant force (downwards at zero speed) B1 OR forces balance at a speed greater than zero (B1) speed cannot decrease / no deceleration once forces balance (B1)
This question in 0625/41 May/June 2021
Q30 · A sealed weather balloon which is stationary in still air 0625/42 May/June 2021
1 (a) Fig. 1.1 shows a sealed weather balloon which is stationary in still air. weather balloon instruments Fig. 1.1 State whether the overall density of the balloon and its instruments is greater than, less than, or the same as the density of the surrounding air. … [1] (b) At night, the gas inside the balloon cools. The pressure of the air outside the balloon remains the same. (i) State whether the balloon rises, falls or remains stationary. … [1] (ii) Explain your answer. … … … [2] (c) An object is released from the balloon. It starts at rest and eventually reaches a constant speed. (i) On the axes of Fig. 1.2, sketch a speed–time graph to show this motion. speed 0 0 time Fig. 1.2 [3] (ii) State the values of the initial acceleration and the final acceleration of the object. initial acceleration … final acceleration … [2] [Total: 9]
9 marks
Mark scheme: 1(a) same (as density of surrounding air) B1 1(b)(i) falls B1 1(b)(ii) volume decreases B1 density increases B1 1(c)(i) starts at origin B1 finishes horizontal by eye B1 gradient decreasing smoothly to 0 B1 1(c)(ii) 10 m / s2 (down) B1 0 ignore any unit B1
This question in 0625/42 May/June 2021
Q31 · A car travels at constant speed v on a horizontal, straight road 0625/43 May/June 2021
3 A car travels at constant speed v on a horizontal, straight road. The driver sees an obstacle on the road ahead. (a) The distance travelled in the time between the driver seeing the obstruction and applying the brakes is the thinking distance. Explain why the thinking distance is directly proportional to v. … … [1] (b) When the brakes are applied, the car decelerates uniformly to rest. The frictional force applied by the brakes is constant. The distance travelled between first applying the brakes and the car stopping is the braking distance. Explain why the braking distance is proportional to v 2. … … … … [3] (c) The car is travelling at 22 m / s. (i) The thinking distance is 15 m. Calculate the time taken to travel the thinking distance. time = … [2] (ii) The car has a mass of 1400 kg. The time taken for the car to stop after the brakes are applied is 2.1 s. Calculate the force required to stop the car in this time. force = … [2] [Total: 8]
8 marks
Mark scheme: 3(a) thinking time is constant B1 3(b) kinetic energy B1 kinetic energy = ½ mv2 B1 work done (to lose KE) = Fd (so stopping distance is proportional to v2) B1 OR (alternative route) time to decelerate is proportional to v (B1) d = average v × t = ½ v × t (B1) d is proportional to v2 (B1) 3(c)(i) 0.68 s A2 t = d/v OR 15/22 in any form C1 3(c)(ii) 15 000 N A2 Ft = change in momentum OR F × 2.1 = 1400 × 22 in any form OR F = ma OR (F = )(1400 × 22)/2.1) C1
This question in 0625/43 May/June 2021
Q32 · A train of mass 1.8 × 10⁵ kg is at rest in a station 0625/41 Oct/Nov 2021
4 A train of mass 1.8 × 10⁵ kg is at rest in a station. At time t = 0, the train begins to accelerate along a straight, horizontal track and reaches a speed of 20 m / s at t = 15 s. The train continues at a speed of 20 m / s for 10 s. At t = 25 s, the driver applies the brakes and the resistive force on the train causes it to decelerate uniformly to rest in a further 24 s. Fig. 4.1 is an incomplete distance–time graph for this journey. 600 distance / m 400 200 0 0 10 20 30 40 50 t / s Fig. 4.1 (a) Complete Fig. 4.1 by drawing: (i) a line to represent the motion of the train between t = 15 s and t = 25 s [1] (ii) a curve to represent the motion of the train between t = 0 and t = 15 s. [1] (b) Calculate the kinetic energy of the train between t = 15 s and t = 25 s. kinetic energy = … [3] (c) While the train decelerates to rest, it does work against the resistive force and its kinetic energy decreases. (i) Define work done. … … [2] (ii) Using Fig. 4.1, determine the distance moved by the train while it decelerates. distance moved = … [1] (iii) Calculate the resultant force acting on the train while it decelerates. resultant force = … [2] [Total: 10]
10 marks
Mark scheme: 4(a)(i) straight line begins at (15 s, 120 m) and continues to end of given line B1 4(a)(ii) curve with increasing gradient from origin to beginning of candidate’s (a)(i) B1 4(b) (Ek =) ½mv2 in any form C1 ½ × 1.8 × 105 × 202 C1 3.6 × 10⁷ J A1 4(c)(i) (work done =) force × distance (moved in the direction of the force) C1 (work done =) force × distance moved in the direction of the force A1 4(c)(ii) 240 m c.a.o. B1 4(c)(iii) 3.6 × 10⁷ / 240 or kinetic energy / distance or (a =) 20 / 24 or Δv / t in any form or 0.83 or (F =) ma in any form C1 1.5 × 10⁵ N A1
This question in 0625/41 Oct/Nov 2021
Q33 · A space rocket accelerating away from a launch pad 0625/42 Oct/Nov 2021
1 Fig. 1.1 shows a space rocket accelerating away from a launch pad. Fig. 1.1 Fig. 1.2 is a speed–time graph for the first 30 s of the rocket’s flight. 2000 speed m / s 1500 1000 500 0 0 10 20 30 time / s Fig. 1.2 (a) Describe how the acceleration of the rocket changes between time = 10 s and time = 30 s. … [1] (b) By drawing a tangent to the graph, determine the acceleration of the rocket at time = 25 s. acceleration = … [2] (c) Determine the distance travelled by the rocket between time = 0 and time = 10 s. distance = … [2] [Total: 5]
5 marks
Mark scheme: 1(a) (acceleration) increases B1 1(b) tangent drawn at 25 s M1 78 to 82 m / s2 A1 1(c) (distance =) area under graph (stated or correct area clearly shown on graph) OR (400 x 10) / 2 OR (b x h) ÷ 2 C1 2000 m A1
This question in 0625/42 Oct/Nov 2021
Q34 · A ship sails in a straight line between two ports 0625/43 Oct/Nov 2021
1 A ship sails in a straight line between two ports. Fig. 1.1 shows the speed–time graph of the ship for the first 100 minutes of its journey between the two ports. 20 speed 15 m / s 10 5 0 0 20 40 60 80 100 time / min Fig. 1.1 (a) Calculate the maximum acceleration during the first 100 minutes of the ship’s journey. maximum acceleration = … [2] (b) Calculate the total distance travelled by the ship between time = 42 min and time = 100 min. distance travelled = … [3] (c) At a time not shown on the graph, the acceleration of the ship is 0.0087 m / s2. The total mass of the ship and its passengers is 2.3 × 10⁷ kg. (i) Calculate the resultant force on the ship. force = … [2] (ii) Explain why the force on the ship due to the ship’s engine is greater than the value you calculated in (c)(i). … … [1] [Total: 8]
8 marks
Mark scheme: 1(a) 0.0069 m / s2 A2 (acceleration =) gradient of graph or Δv / Δt in any form OR ( ) 15 7.5 60 42 60 − − C1 1(b) 48 000 m or 48 km A3 area under graph C1 ( ) ( ) ( ) 1 18 7.5 60 7.5 18 60 15 40 60 2 × × + × × + × × C1 1(c)(i) (force =) 2.0 × 10⁵ N A2 (F =) ma OR 2.3 × 107 × 0.0087 in any form C1 1(c)(ii) there is a backward / drag force OR water resistance B1
This question in 0625/43 Oct/Nov 2021
Q35 · A car of mass m is travelling along a straight, horizontal road at a constant speed v 0625/41 May/June 2022
1 A car of mass m is travelling along a straight, horizontal road at a constant speed v. At time t = 0, the driver of the car sees an obstruction in the road ahead of the car and applies the brakes. The car does not begin to decelerate at t = 0. (a) Explain what is meant by deceleration. … … … [2] (b) Suggest one reason why the car does not begin to decelerate at t = 0. … … [1] (c) Fig. 1.1 is the distance–time graph for the car from t = 0. 60 distance / m 40 20 0 0 1 2 3 4 5 time / s Fig. 1.1 (i) State the property of a distance–time graph that corresponds to speed. … [1] (ii) Using Fig. 1.1, determine the initial speed v of the car. v = … [2] (d) When the car is decelerating, there is a constant resistive force F on the car due to the brakes. F The deceleration of the car is greater than and is not constant. m Explain why: F (i) the deceleration of the car is greater than m … … [1] (ii) the deceleration is not constant. … … … [2] [Total: 9]
9 marks
Mark scheme: 1(a) negative acceleration or decrease in velocity B1 change in velocity per unit time or rate of change of velocity B1 1(b) delay in applying brakes or (human) reaction time or foot not removed from accelerator B1 1(c)(i) gradient or slope B1 1(c)(ii) 20.5 m / s ⩽ answer ⩽ 23.5 m / s A2 the coordinates at one point on curve (e.g. (0.50, 11)) and (upper) time coordinate ⩽ 1.0 s C1 1(d)(i) air resistance / air friction acts on the car B1 1(d)(ii) air resistance / resultant / resistive force decreases and as speed decreases / car decelerates A2 air resistance / resultant / resistive force decreases / changes C1
This question in 0625/41 May/June 2022
Q36 · Water stored in a reservoir behind a hydroelectric dam 0625/41 May/June 2022
2 Fig. 2.1 shows water stored in a reservoir behind a hydroelectric dam. reservoir 150 m generator turbine Fig. 2.1 (not to scale) (a) State the form of the energy stored in the water in the reservoir that is used to generate electricity. … [1] (b) The turbine is 150 m below the level of the water in the reservoir. Atmospheric pressure is 1.0 × 10⁵ Pa. The density of water is 1000 kg / m3. (i) Calculate the total pressure in the water at the turbine. pressure = … [3] (ii) The turbine has a cross-sectional area of 3.5 m2. Calculate the force exerted on the turbine by the water. force = … [2] (c) The water flows to the turbine through a pipe of constant cross-sectional area. Explain why the kinetic energy of the water in the pipe remains constant as it flows through the pipe. … … … [2] [Total: 8]
8 marks
Mark scheme: 2(a) gravitational potential energy B1 2(b)(i) 1.6 106 Pa A3 (p =) h g (in any form) or 150 1000 10 or 1.5 106 C1 1.5 106 or 1.0 105 + {150 1000 10} or 1.0 105 + 1.5 106 or 1.6 10N C1 2(b)(ii) 5.6 106 N A2 (F =) pA (in any form) or 1.6 106 3.5 C1 Question Answer Marks 2(c) speed (of water) remains constant B1 otherwise density would decrease or gaps would appear in the water or volume / density does not change or liquids incompressible or water enters / leaves at constant rate or quantity of water remains constant B1
This question in 0625/41 May/June 2022
Q37 · An object of mass 2.0 kg on a bench 0625/42 May/June 2022
2 Fig. 2.1 shows an object of mass 2.0 kg on a bench. This object is connected by a cord, passing over a pulley, to an object of mass 3.0 kg. card cord pulley 2.0 cm 2.0 kg object F bench 3.0 kg object Fig. 2.1 The 2.0 kg object is released from rest and accelerates at 4.0 m / s2. (a) Calculate the resultant force acting on the 2.0 kg object. force = … [2] (b) Calculate the upward force F exerted by the cord on the 3.0 kg object. force F = … [3] (c) The objects have a constant acceleration. (i) Show that the speed of the objects 0.80 s after release is 3.2 m / s. [2] (ii) A card, of width 2.0 cm, is fixed to the 2.0 kg object. As the 2.0 kg object moves to the left, the card passes through a beam of light that is perpendicular to the card. Using the speed given in (c)(i), calculate the time taken for the card to pass through the beam of light. time = … [2] [Total: 9]
9 marks
Mark scheme: 2(a) A2 (F =) ma in any form C1 Question Answer Marks 2(b) (F = 30 – 12 =) 18 N A3 resultant force on 3 kg mass (3 4 =) 12 (N) C1 (weight of 3 kg mass = 3 10) = 30 (N) C1 2(c)(i) (v =) 4.0 0.80 (= 3.2 m / s) A2 ()v = at in any form C1 2(c)(ii) (t = 0.020 / 3.2 =) 0.0063 s OR 6.3 10–3 s A2 (t =) d / v in any form C1
This question in 0625/42 May/June 2022
Q38 · Water in a river moving parallel to the river bank at 4.0 m / s and a canoe travelling in… 0625/42 May/June 2022
3 (a) Fig. 3.1 shows water in a river moving parallel to the river bank at 4.0 m / s and a canoe travelling in the river. river bank canoe travels at 2.5 m / s 38° relative to the water water moving at 4.0 m / s river bank Fig. 3.1 The canoe travels at 2.5 m / s relative to the water and heads at an angle of 38° to the river bank. Draw a scale diagram to determine the canoe’s resultant velocity and state the scale you used. scale … magnitude of resultant velocity … direction of resultant velocity (angle from the river bank) … [4] (b) The mass of the canoeist is 65 kg. Calculate her kinetic energy when travelling on still water at 2.5 m / s. energy = … [2] [Total: 6]
6 marks
Mark scheme: 3(a) scale at least 2 cm : 1 m / s stated B1 2.5 m / s AND 4.0 m / s vectors correctly drawn by eye AND correct resultant M1 magnitude of resultant velocity = 2.3 – 2.8 m / s inclusive A1 direction 35° – 40° inclusive (downstream) A1 3(b) (E = ½ 65 2.52 =) 200 J A2 (E =) ½ mv2 in any form C1
This question in 0625/42 May/June 2022
Q39 · A battery provides energy to an electric car 0625/43 May/June 2022
1 A battery provides energy to an electric car. (a) The electric car has an acceleration of 2.9 m / s2 when it moves from rest. The combined mass of the car and its driver is 1600 kg. (i) Calculate the time taken to reach a speed of 28 m / s. time = … [2] (ii) Calculate the force required to produce this acceleration. force = … [2] (iii) Calculate the kinetic energy of the car when its speed is 28 m / s. kinetic energy = … [2] (b) The time taken for the car battery to be recharged from zero charge to full charge is 8.3 h. The charge is delivered to the battery by a charger with a current of 32 A. Calculate the charge supplied by the charger. charge = … [3] (c) Under ideal conditions, the car can travel a maximum distance of 390 km when the battery is fully charged. Suggest why, in normal use, the car needs to be recharged after travelling less than 390 km. … … [1] [Total: 10]
10 marks
Mark scheme: 1(a)(i) 9.7 s A2 (a =) v t in any form OR 28 (–0)/2.9 C1 1(a)(ii) 4600 N A2 (F =) ma in any form OR 1600 2.9 C1 1(a)(iii) 630 000 J / 6.3 105 J A2 (KE =) ½ mv 2 in any form OR 2 1600 28 2 C1 1(b) 960 000 C / 9.6 105 C A3 (Q =) It in any form OR 32 8.3 60 60 C1 (t s =) 8.3 60 60 C1 1(c) any one explicit example of a variation from ideal conditions such as: (repeated) acceleration / deceleration / use of brakes / varying speed motion uphill / uneven road surface cold weather / headwind B1
This question in 0625/43 May/June 2022
Q40 · An aeroplane accelerates along a horizontal runway before take-off 0625/43 Oct/Nov 2022
1 An aeroplane accelerates along a horizontal runway before take-off. The aeroplane accelerates for 35 s. The speed of the aeroplane when it takes off is 72 m / s. Fig. 1.1 shows how the speed of the aeroplane varies between time t = 0 and t = 35 s. 72 speed m / s 0 0 35 t / s Fig. 1.1 (a) Define acceleration. … … [1] (b) (i) Calculate the average acceleration of the aeroplane between t = 0 and t = 35 s. acceleration = … [1] (ii) The combined mass of the aeroplane, its passengers and its fuel on take-off is 1.1 × 10⁵ kg. Calculate the average resultant force on the aeroplane between t = 0 and t = 35 s. force = … [2] (iii) The force provided by the engines of the aeroplane is constant. Give one possible explanation for the change in acceleration of the aeroplane between t = 0 and t = 35 s. … … [1] (iv) On Fig. 1.2, sketch a graph to show how the acceleration of the aircraft varies between t = 0 and t = 35 s. acceleration 0 0 35 t / s Fig. 1.2 [3] [Total: 8]
8 marks
Mark scheme: Question Answer Marks 1(a) v − u B1 change of velocity per unit time or t 1(b)(i) (72 / 35 =) 2.1 m / s2 A1 1(b)(ii) 230 000 N OR 230 kN A2 F = ma OR (F =) ma OR 110 000 2.1 C1 1(b)(iii) any one from: B1 • (increase / change in) air resistance • (increase / change in) wind 1(b)(iv) any three from: B3 • initial acceleration highest value AND horizontal line • curved or straight line downwards • curved or straight line downwards AND line not reaching zero by 35 s • horizontal line before and up to 35 s.
This question in 0625/43 Oct/Nov 2022
Q41 · A boat crosses a river 0625/42 Feb/March 2023
1 (a) A boat crosses a river. The boat points at right angles to the river bank and it travels at a speed of 3.5 m / s relative to the water. A river current acts at right angles to the direction the boat points. The river current has a speed of 2.5 m / s. By drawing a scale diagram or by calculation, determine the speed and direction of the boat relative to the river bank. speed = … direction relative to the river bank = … [4] (b) Speed is a scalar quantity and velocity is a vector quantity. State the names of one other scalar quantity and one other vector quantity. scalar quantity … vector quantity … [2] [Total: 6]
6 marks
Mark scheme: Question Answer Marks 1(a) A2 speed = 4.3 m / s speed = 4.3 m / s (C1) correct vector triangle or rectangle drawn use of Pythagoras’ theorem e.g. a2 + b2 = c2 OR (speed =) 2.5 2 + 3.5 2 ( ) A2 direction = 54° or 55° direction = 54° or 55° (C1) resultant velocity vector (including arrow) use of trigonometry to find angle e.g. tan = 3.5 / 2.5 1(b) a scalar quantity B1 distance, time, mass, energy, temperature a vector quantity B1 force, weight, acceleration, momentum, electric field strength, gravitational field strength
This question in 0625/42 Feb/March 2023
Q42 · Sound waves have compressions and rarefactions 0625/42 Feb/March 2023
6 (a) Sound waves have compressions and rarefactions. Explain what is meant by compression and rarefaction. compression … … rarefaction … … [2] (b) We can see light from the Sun but we cannot hear any sound from it. State the reason for this. … … [1] (c) During a thunderstorm, an observer sees the lightning almost immediately but hears the sound of the thunder several seconds later. The thunder and lightning are produced at the same time. The sound of the thunder is heard 9.0 s after the lightning is seen. The speed of sound in air is 340 m / s. Calculate the distance from the thunderstorm to the observer. distance = … [2] (d) In a lightning strike, there is a current of 3.0 × 10⁴ A for 48 ms. Calculate the charge that flows. charge = … [3] [Total: 8]
8 marks
Mark scheme: 6(a) (region where) particles are close(r) together (than normal) OR (region where) there is a great(er) pressure (than normal) B1 (region where) particles are further / far apart (than normal) OR (region where) there is a low(er) pressure (than normal) B1 6(b) light does not need a medium to travel through OR sound needs a medium to travel through (and there is no medium B1 between Sun and Earth) 6(c) 3100 m OR 3.1 km A2 v = s / t OR (s =) vt OR 340 9 (C1) 6(d) 1400 C A3 I = Q / t OR (Q = )I t OR 3.0 104 48 10–3 (C1) (t =) 48 10–3 OR (t =) 4.8 10–2 OR (t =) 0.048 SEEN (C1)
This question in 0625/42 Feb/March 2023
Q43 · A straight section of a river where the water is flowing from right to left at a speed of… 0625/41 May/June 2023
1 Fig. 1.1 shows a straight section of a river where the water is flowing from right to left at a speed of 0.54 m / s. river current 0.54 m / s P swimmer Fig. 1.1 (not to scale) A swimmer starts at point P and swims at a constant speed of 0.72 m / s relative to the water and at right angles to the current. (a) (i) Determine, relative to the river bank, both the magnitude and direction of the swimmer’s velocity. magnitude of velocity = … direction of velocity … [4] (ii) After 1.5 minutes, the swimmer reaches point Q. Calculate the distance between P and Q. distance = … [3] (b) When the swimmer is crossing the river, his actions produce a constant forward force on his body. Explain why he moves at a constant speed. … … … … [2] [Total: 9]
9 marks
Mark scheme: 1(a)(i) (magnitude of velocity =) 0.90 m / s A2 use of Pythagoras’ theorem e.g. a2 + b2 = c2 OR (speed =) 2 2 0.54 0.72 OR correct vector triangle or rectangle drawn C1 (direction of velocity =) 53° (to riverbank) A2 use of trigonometry to find angle e.g. tan = 0.72 / 0.54 OR (only) angle with horizontal identified on the diagram C1 1(a)(ii) (distance =) 81 m A3 v = s / t OR (s =) vt OR (s =) 0.9(0) 90 C1 (time =) 1.5 60 (= 90) OR (time =) 90 C1 1(b) friction (of water backwards) OR resistance (on swimmer backwards) B1 (friction / resistance) balances forward force OR (there is) no resultant force B1
This question in 0625/41 May/June 2023
Q44 · A motorcyclist accelerating along a straight horizontal section of track 0625/41 May/June 2023
2 Fig. 2.1 shows a motorcyclist accelerating along a straight horizontal section of track. Fig. 2.1 The motorcyclist and motorcycle have a combined mass of 240 kg. (a) On the straight horizontal section of the track, the motorcyclist accelerates from rest at 7.2 m / s2. (i) The motorcyclist reaches the end of the straight section of track in 5.3 s. Calculate the speed of the motorcyclist at the end of the straight section. speed = … [2] (ii) Calculate the resultant force on the motorcyclist and motorcycle on the straight section of track. resultant force = … [2] (b) At the end of the straight section, the track remains horizontal but bends to the right, as shown in Fig. 2.1. When the motorcyclist reaches the bend, she travels around the bend in a circular path at a constant speed. (i) Velocity is a vector quantity. State how a vector quantity differs from a scalar quantity. … … [1] (ii) Describe what happens to the velocity of the motorcyclist as she travels around the bend at constant speed. … … [1] (iii) Explain why there must be a resultant force on the motorcyclist as she travels around the bend. … … … [2] [Total: 8]
8 marks
Mark scheme: 2(a)(i) (speed =) 38 m / s A2 a = ∆v / ∆t OR (∆v =) a∆t OR (∆v =) 7.2 5.3 C1 2(a)(ii) (resultant force = ) 1 700 N A2 F = ma OR (F =) ma OR (F =) 240 7.2 C1 2(b)(i) (vector) has direction (as well as magnitude) OR scalar does not have direction B1 Question Answer Marks 2(b)(ii) (velocity) changes (as direction of motion changes) OR direction (of velocity) changes B1 2(b)(iii) any two from: because there is an acceleration / change in velocity / change in direction / change in momentum (which needs a resultant force) motorcyclist accelerates / changes momentum (because velocity / direction changes) (resultant) force is perpendicular to the motion (of the motorcycle) OR a ∝ F B2
This question in 0625/41 May/June 2023
Q45 · A car accelerates uniformly in a straight line from rest at time t = 0 0625/42 Oct/Nov 2023
1 A car accelerates uniformly in a straight line from rest at time t = 0. At t = 3.2 s, the speed of the car is 13.0 m / s. (a) (i) Calculate the acceleration of the car. acceleration = … [2] (ii) Explain in words what is meant by the term acceleration. … … [1] (b) The car travels at 13.0 m / s from t = 3.2 s to t = 12.0 s. (i) Plot the speed–time graph for the car from t = 0 to t = 12.0 s. 14.0 speed 12.0 m / s 10.0 8.0 6.0 4.0 2.0 0 0 2.0 4.0 6.0 8.0 10.0 12.0 14.0 16.0 t / s [2] (ii) Determine the distance travelled by the car between t = 0 and t = 3.2 s. distance = … [2] (c) The car decelerates from 13.0 m / s to 0 m / s at a constant deceleration. The mass of the car is 1350 kg. The car travels 13 m in 2.0 s as it decelerates. Show that the work done by the car as it decelerates is approximately 1.1 × 10⁵ J. [4] (d) On another day, the car in (c) travels a longer distance while it decelerates from 13.0 m / s to 0 m / s. The deceleration is constant. Suggest and explain what causes the stopping distance to increase. suggestion … … explanation … … [2] [Total: 13]
13 marks
Mark scheme: Question Answer Marks 1(a)(i) 4.1 m / s2 A2 (a =) (∆)v / (∆)t OR 13(.0) / 3.2 C1 1(a)(ii) (acceleration is) change / increase in velocity per unit time OR rate of change of velocity B1 1(b)(i) straight line joining (0,0) and (3.2,13.0) B1 horizontal line from 3.2 s to 12.0 s B1 1(b)(ii) 21 m A2 area under speed-time graph (between 0 s and 3.2 s) C1 OR average velocity time 1(c) (W =) F d B1 F = ma OR F(∆)t = m∆v B1 F= (1350 13) ÷ 2 OR 8775 (N) OR (F=) 1350 6.5 B1 W = 8775 13.0 (= 1.1 105 J) OR 114 075 (J) B1 1(d) any sensible suggestion that increases the stopping distance B1 explanation (to match suggestion) B1
This question in 0625/42 Oct/Nov 2023
Q46 · Information about three planets in the Solar System 0625/42 Oct/Nov 2023
9 Table 9.1 gives information about three planets in the Solar System. Table 9.1 planet mass average orbital gravitational field strength at surface / 1024 kg distance period N / kg from Sun / days / 106 km Earth 5.97 149.6 365.2 9.8 Jupiter 1898 778.6 4331 23.1 X 4.87 108.2 224.7 8.9 (a) State the name of planet X. … [1] (b) Describe the relationship shown in Table 9.1 between the mass of a planet and the gravitational field strength at its surface. … … [1] (c) Explain why ‘distance from Sun’ in Table 9.1 is an average value. … … [1] (d) Show that the average orbital speed of the Earth is approximately 30 km / s. [3] [Total: 6]
6 marks
Mark scheme: 9(a) Venus B1 9(b) The larger the mass (of the planet), the larger the gravitational field strength (at the surface) B1 9(c) orbit of planets is elliptical / is not circular owtte B1 9(d) correct conversion of T into seconds i.e. 365.2 (24 60 60) OR 3.2 107 B1 (v =) {2r} / T B1 2 149.6 106 / 365.2 24 60 60 B1
This question in 0625/42 Oct/Nov 2023
Q47 · A speed–time graph for the first 5 minutes of a bus journey 0625/42 Feb/March 2024
1 (a) Fig. 1.1. is a speed–time graph for the first 5 minutes of a bus journey. 10.0 speed m / s 7.5 5.0 2.5 0 0 1.0 2.0 3.0 4.0 5.0 t / min Fig. 1.1 Describe the motion between: 1. t = 0.90 min and t = 2.9 min … 2. t = 2.9 min and t = 3.5 min … 3. t = 3.5 min and t = 4.5 min … [3] (b) Another bus travels at a speed of 8.9 m / s. The brakes apply a constant force and the bus stops in a distance of 23 m. This bus has a mass of 18 000 kg. (i) Calculate the kinetic energy of the bus before the brakes are applied. kinetic energy = … [2] (ii) Calculate the force applied to stop the bus. force = … [3] [Total: 8]
8 marks
Mark scheme: Question Answer Marks 1(a) constant speed B1 constant / uniform deceleration B1 stationary B1 1(b)(i) 7.1 105 J OR 710 000 J OR 710 kJ A2 EK= ½mv2 OR (EK= ) ½mv2 OR ½ 18 000 (8.9)2 (C1) 1(b)(ii) 31 000 N OR 31 kN A3 W = Fd OR (F =) W / d OR 710 000 / 23 (C1) F = 710 000 / 23 (C1)
This question in 0625/42 Feb/March 2024
Q48 · A long tube contains oil 0625/41 May/June 2024
1 A long tube contains oil. A small ball is held at rest at the surface of the oil. At time t = 0, the ball is released and begins to fall vertically through the oil. Fig. 1.1 shows the ball falling through the oil. oil ball Fig. 1.1 As the ball begins to fall through the oil, it accelerates. (a) Define acceleration. … … [1] (b) The mass of the ball is 0.0075 kg. Calculate the resultant force acting on the ball when it is accelerating downwards at 2.8 m / s2 . resultant force = … [2] (c) As the ball falls, its speed v is recorded. Fig. 1.2 is the speed–time graph for the falling ball. 0.06 v m / s 0.04 0.02 0 0 0.01 0.02 0.03 0.04 t / s Fig. 1.2 (i) Describe what happens to the acceleration between t = 0 and t = 0.040 s. Explain why this happens. … … … … [4] (ii) By drawing a tangent on Fig. 1.2, determine a value for the acceleration of the ball at t = 0.010 s. acceleration = … [3] [Total: 10]
10 marks
Mark scheme: 1(a) (acceleration is) rate of change in velocity OR change in velocity per unit time OR (a =) ∆v / ∆t B1 1(b) 0.021 N A2 F = ma OR (F =) ma OR 0.0075 2.8 C1 1(c)(i) any four from: (acceleration) decreases (acceleration decreases) to zero (at approximately 0.03 s) resistive force increases / resistance increases (as speed / velocity increases) resultant force (downwards) decreases (until) terminal velocity / constant speed (is reached) (when) resistive force = weight OR resultant force is zero OR forces are balanced B4 1(c)(ii) tangent drawn at t = 0.010 s M1 1.2 m / s2 ⩽ acceleration ⩽ 1.8 m / s2 A2 (a =) gradient of tangent OR (a =) {y / x} C1
This question in 0625/41 May/June 2024
Q49 · The Sun is one of many billions of stars in the Milky Way 0625/41 May/June 2024
9 The Sun is one of many billions of stars in the Milky Way. The Sun emits a very large quantity of energy as electromagnetic radiation. (a) State the three regions of the electromagnetic spectrum in which the Sun emits the most energy. 1 … 2 … 3 … [2] (b) Electromagnetic radiation from the Sun travels at a speed of 3.0 × 10⁸ m / s. The radiation takes 500 s to reach the Earth. Calculate the distance from the Sun to the Earth. distance = … [2] (c) Approximately 4.6 billion years ago, the Sun formed from an interstellar cloud of gas and became a stable star. (i) Describe and explain what happens as an interstellar cloud of gas forms a protostar. … … … [2] (ii) Describe and explain what happens as a protostar becomes a stable star. … … … … [3] [Total: 9]
9 marks
Mark scheme: 9(a) ultraviolet AND visible light AND infrared only A2 any two from: ultraviolet; visible light; infrared and no more than one incorrect addition C1 9(b) 1.5 1011 m A2 v = s / t OR (s =) vt OR 3.0 108 500 OR 1.5 10N C1 9(c)(i) any two from: cloud / nebula / it collapses due to (internal) gravitational attraction (internal) temperature increases B2 Question Answer Marks 9(c)(ii) any three from: (nuclear) fusion / nuclear reactions (in the star) forces are balanced gravitational force is inwards outwards force is due to high temperature B3
This question in 0625/41 May/June 2024
Question 50 0625/42 May/June 2024
2 (a) Define acceleration. … … [1] (b) A train has a total mass of 520 000 kg. The train accelerates at 1.1 m / s2. (i) Calculate the time taken for the train to increase its speed from 15 m / s to 28 m / s. time = … [2] (ii) Calculate the force required to produce an acceleration of 1.1 m / s2 for this train. force = … [2] (iii) The train uses electric motors. Explain why the force on the train due to the motors is greater than the value calculated in (ii). … … [1] [Total: 6]
6 marks
Mark scheme: 2(a) B1 2(b)(i) 12 s A2 (t =) v / a OR 13 / 1.1 C1 2(b)(ii) 570 000 N A2 F = ma OR (F =) ma OR (F =) 520 000 1.1 C1 2(b)(iii) (additional force is needed to overcome) friction OR air resistance OR drag B1
This question in 0625/42 May/June 2024
Q51 · The Solar System includes the Sun and planets 0625/42 May/June 2024
10 (a) The Solar System includes the Sun and planets. State two other types of natural object that orbit the Sun. 1 … 2 … [2] (b) State the shape of the orbits of the planets. … [1] (c) Fig. 10.1 shows the orbit of an object around the Sun. At point A, the object is closest to the Sun. At point B, the object is furthest away from the Sun. A B Sun Fig. 10.1 State and explain the energy transfer as the object travels from point A to point B. statement … … explanation … … [2] (d) Jupiter is 7.8 × 10¹¹ m from the Sun. The speed of light in a vacuum is 3.0 × 10⁸ m / s. Calculate the time taken for light from the Sun to reach Jupiter. time = … [2] [Total: 7]
7 marks
Mark scheme: 10(a) any two from: minor planets OR dwarf planets comets asteroids B2 10(b) elliptical B1 10(c) kinetic energy (store) decreases AND potential energy (store) increases (as object moves from A to B) B1 energy is conserved B1 10(d) 2.6 103 s A2 v = s / t OR (t =) s / v OR 7.8 1011 / 3.0 108 C1
This question in 0625/42 May/June 2024
Q52 · A ball of mass 130 g is launched from the ground at an initial velocity of 14 m / s… 0625/43 May/June 2024
1 A ball of mass 130 g is launched from the ground at an initial velocity of 14 m / s vertically upwards. It decelerates until it is at rest momentarily at a height h above the ground. (a) Define deceleration. … … [2] (b) The acceleration of free fall is 9.8 m / s2. Show that the time taken for the ball to reach height h is 1.4 s. Ignore the effect of air resistance. [1] (c) Calculate h. Ignore the effect of air resistance. h = … [3] (d) The ball is dropped from the top of a tall building. Describe and explain the motion of the ball as it falls. Consider the effect of air resistance in your answer. … … … … [3] [Total: 9]
9 marks
Mark scheme: 1(a) (deceleration is) decrease in velocity per unit time OR rate of decrease in velocity OR negative rate of change of velocity OR –v / t A2 negative acceleration OR change in velocity per unit time OR rate of change of velocity C1 1(b) a = v / ()t AND (t =) 14 / 9.8 OR (t =) ∆v / a = 14 / 9.8 B1 1(c) 10 m A3 (initial) Ek of ball = (maximum) Ep gained OR ½ mv2 = mgh C1 (h =) Ep / mg OR (h =) ½ v2 / g OR (h =) 12.74 / (0.13 9.8) (= 10 m) OR (h =) (½ 196) / 9.8 C1 1(d) any three from: (ball) accelerates (accelerates) at 9.8 m / s2 initially OR (accelerates) due to force of gravity air resistance / resistive force increases (with speed / velocity) resultant force (downwards) decreases acceleration decreases terminal velocity is reached when acceleration is zero OR terminal velocity is reached when resultant force is zero B3
This question in 0625/43 May/June 2024
Q53 · A drag car is a racing car that is powered by a rocket engine 0625/41 Oct/Nov 2024
2 A drag car is a racing car that is powered by a rocket engine. A drag car accelerates uniformly from rest until it reaches the finishing line. The engine is then switched off and a parachute opens. The car decelerates until it stops. Fig. 2.1 shows a drag car decelerating after a race. parachute drag car Fig. 2.1 This drag car has a mass of 1400 kg. Fig. 2.2 is the speed–time graph for the car during a race on a straight horizontal track. 160 140 speed 120 m / s 100 80 60 40 20 0 0 4 8 12 16 20 24 time / s Fig. 2.2 The car reaches its maximum speed of 130 m / s at a time of 6.5 s. (a) (i) Calculate the maximum momentum of the car during the race. maximum momentum = … [2] (ii) State the feature of Fig. 2.2 that represents the distance travelled by the car. … … [1] (iii) Determine the distance travelled by the car in the first 6.5 s. distance = … [2] (b) The parachute opens at 6.5 s and the car decelerates. Describe how Fig. 2.2 shows that, after 6.5 s: (i) the car decelerates … … [1] (ii) the deceleration of the car is not constant. … … [1] (c) Describe the energy transfer that takes place as the car slows down. … … [2] [Total: 9]
9 marks
Mark scheme: 2(a)(i) 1.8 105 kg m / s OR 1.8 105 N s A2 p = mv OR (p =) mv OR 1400 130 C1 2(a)(ii) (scaled) area under the (graph) line B1 2(a)(iii) 420 m A2 ½vmaxt OR ½ 130 6.5 OR ½bh C1 2(b)(i) gradient is negative OR speed decreases B1 2(b)(ii) gradient is changing OR line / graph / it is a curve / curved B1 2(c) (from) kinetic (energy store) B1 to internal / thermal (energy store as final store) B1
This question in 0625/41 Oct/Nov 2024
Q54 · A train has a maximum speed of 200 km / h 0625/42 Feb/March 2025
4 A train has a maximum speed of 200 km / h. It accelerates from rest with constant acceleration of 0.70 m / s2. (a) (i) Define acceleration. … … [1] (ii) Show that the maximum speed of the train is approximately 56 m / s. [2] (iii) Calculate the time taken for the train to reach its maximum speed. time = … [2] (b) (i) The train has a total mass of 440 000 kg. Calculate the force which causes the acceleration of the train. force = … [2] (ii) The train travels into a headwind. The force of this headwind opposes the motion of the train. State and explain the effect of this force on the motion of the train. statement … explanation … … [1] [Total: 8]
8 marks
Mark scheme: 4(a)(i) (acceleration is) rate of change in velocity OR B1 (acceleration is) change in velocity per unit time OR (acceleration is) change in velocity per second 4(a)(ii) 200 km = 200 000 m OR 1000 seen B1 division by {60 60} seen OR division by 3600 seen B1 4(a)(iii) 80 s OR 79 s A2 (t =) ∆v / a OR 56 / 0.7(0) C1 4(b)(i) 310 000 N OR 3.11 0 5 N A2 F = ma OR 440 000 0.7 ( 0 ) C1 4(b)(ii) (statement:) reduces acceleration OR lower (maximum) velocity B1 AND (explanation:) resultant/net force decreases
This question in 0625/42 Feb/March 2025
Q55 · Circle the vector quantities in the list 0625/41 May/June 2025
1 (a) Circle the vector quantities in the list. acceleration mass speed time velocity [1] (b) Fig. 1.1 shows the speed–time graph for a train travelling from station A to station B. 60 speed m / s 50 40 30 20 10 0 0 100 200 300 400 500 600 time / s Fig. 1.1 (i) State the maximum speed of the train. maximum speed = … [1] (ii) Describe the motion of the train between station A and station B. … … … [2] (iii) Calculate the distance between station A and station B. distance = … [3] (iv) On a different day, the train takes 650 s to travel between station A and station B. Suggest one change to the motion of the train that leads to this longer journey time. … … [1] [Total: 8]
8 marks
Mark scheme: Question Answer Marks 1(a) (only) acceleration AND velocity circled B1 1(b)(i) 56 m / s B1 braille: 55 m / s 1(b)(ii) accelerates OR speed increases B1 AND (then) constant speed AND (then) decelerates OR speed decreases constant acceleration OR constant deceleration B1 1(b)(iii) 26 000 m OR 26 km A3 braille: 26 125 m (distance =) area under the speed–time graph OR C1 (distance =) average speed time taken 0.5 80 56 AND 56 400 AND 0.5 50 56 C1 OR 1 400 + 530 56 2 braille: 0.5 100 55 AND 55 400 AND 0.5 50 55 OR 1 {400 + 550} 55 2 1(b)(iv) any one from: B1 • lower acceleration OR less acceleration • lower deceleration OR less deceleration • lower maximum speed OR lower average speed OR lower constant speed
This question in 0625/41 May/June 2025
Q56 · A speed–time graph for an ice skater 0625/42 May/June 2025
1 Fig. 1.1 is a speed–time graph for an ice skater. 12 speed m / s 10 8 6 4 2 0 0 2 4 6 8 10 12 time t / s Fig. 1.1 (a) Describe the motion of the skater between t = 0 and t = 3.0 s. … [1] (b) Calculate the distance travelled by the skater between t = 0 and t = 3.0 s. distance = … [2] (c) (i) State what is meant by deceleration. … [1] (ii) Draw a tangent to the graph at t = 9.0 s. Use the tangent to calculate the deceleration of the skater at t = 9.0 s. deceleration = … [3] [Total: 7]
7 marks
Mark scheme: Question Answer Marks 1(a) constant speed OR uniform speed B1 1(b) 33 m A2 (distance =) area under graph OR bh OR speed time OR 11 3 C1 1(c)(i) (rate of) decrease of velocity OR decrease in velocity (per unit time) OR negative acceleration B1 1(c)(ii) tangent drawn at 9.0 s on graph M1 0.50–0.70 m / s2 A2 correct method of gradient calculation using any two correct pairs of co-ordinates (± ½ a small square) from their tangent C1
This question in 0625/42 May/June 2025
Q57 · A car travels at a speed of 20 m / s 0625/43 May/June 2025
1 A car travels at a speed of 20 m / s. The driver applies the brakes when he sees a red traffic light. Fig. 1.1 shows the speed–time graph for the car. 25 speed m / s 20 15 10 5 0 0 1 2 3 4 5 time / s Fig. 1.1 (a) Determine the speed of the car at time = 2.0 s. speed of the car = … [1] (b) Calculate the distance travelled by the car between time = 0 and time = 4.0 s. distance travelled = … [3] (c) Calculate the deceleration of the car between time = 0.5 s and time = 4.0 s. deceleration = … [3] [Total: 7]
7 marks
Mark scheme: Question Answer Marks 1(a) 11.5 m / s B1 1(b) 45 m A3 (distance =) area under graph OR ½ bh (+ bh) C1 {0.5 20} + ½ {20 3.5} OR {10 + 35} OR [{0.5 + 4} ÷ 2] 20 C1 1(c) 5.7 m / s2 A3 (deceleration =) ()v ÷ t OR deceleration = gradient C1 (0 –) 20 ÷ {4(.0) - 0.5} OR 20 ÷ 3.5 C1
This question in 0625/43 May/June 2025
Q58 · Define a light-year in words 0625/43 May/June 2025
10 (a) Define a light-year in words. … [1] (b) It takes light 490 s to travel from the Sun to the Earth. Calculate the distance from the Sun to the Earth. distance = … [2] (c) Fig. 10.1 is a scatter graph showing how the speed of galaxies moving away from the Earth varies with their distances from the Earth. 3 speed of galaxy best-fit line 104 km / s 2 1 0 0 20 40 60 80 100 120 distance of galaxy from Earth / 1020 km Fig. 10.1 A scientist draws a best-fit line on the scatter graph. Use this best-fit line to determine a value for the Hubble constant. Hubble constant = … [3] (d) The speed of a receding galaxy can be estimated using redshift. Describe what is meant by redshift. … … … … [2] [Total: 8]
8 marks
Mark scheme: 10(a) distance travelled (in the vacuum of space) by light in one year B1 10(b) 1.5 1011 m A2 9.5 1015 (m) OR (c =) 3(.0) 108 (m / s) OR 3(.0) 10N 490 C1 10(c) 2.5 10–18 per second A3 (Hubble’s constant =) gradient OR (H0 =) v ÷ d C1 2.5 104(– 0) ÷ {100 1020 (– 0)} C1 10(d) electromagnetic radiation / light from (distant) galaxies B1 (observed) increase in wavelength (compared to wavelength measured on the Earth) B1
This question in 0625/43 May/June 2025
Q59 · A train travels with a constant velocity of 56 m / s on a horizontal track 0625/41 Oct/Nov 2025
1 A train travels with a constant velocity of 56 m / s on a horizontal track. The mass of the train is 440 000 kg. (a) State the difference between the velocity of the train and its speed. … … [1] (b) Calculate the kinetic energy stored in the moving train. kinetic energy = … [2] (c) (i) The train has a uniform deceleration of 1.2 m / s2. Calculate the constant braking force which brings the train to rest. force = … [2] (ii) Calculate the distance travelled by the train as it comes to rest. distance = … [3] [Total: 8]
8 marks
Mark scheme: Question Answer Marks 1(a) the velocity is the speed in a particular direction OR velocity has a direction OR velocity is 56 m / s in a certain direction B1 velocity is a vector OR speed is a scalar 1(b) 6.9 108 J OR 690 000 000 J OR 690 MJ A2 (KE =) ½ mv2 OR 0.5 440 000 (56)2 C1 1(c)(i) 5.3 105 N OR 530 000 N A2 (F =) ma OR 440 000 1.2 C1 1(c)(ii) 1300 m OR 1.3 km A3 1(c)(ii) (d =) W / F C1 OR (∆)t = ∆v / a OR 56 / 1.2 OR (∆) t = change of momentum / force (distance =) 6.9 108 / 530 000 C1 OR (distance =) average velocity time taken OR 1.3 10N
This question in 0625/41 Oct/Nov 2025
Q60 · State the difference between a scalar quantity and a vector quantity 0625/42 Oct/Nov 2025
1 (a) (i) State the difference between a scalar quantity and a vector quantity. … … [1] (ii) In the list below, draw a line under each of the quantities that is a scalar quantity. acceleration mass momentum electric field strength energy temperature [2] (b) A tennis player throws a tennis ball into the air. The mass of the tennis ball is 5.8 × 10⁻² kg. The tennis ball leaves the tennis player’s hand and reaches a maximum height of 5.0 m above the point of release. (i) Show that the initial velocity of the tennis ball is 9.9 m / s upwards. [3] (ii) Calculate the momentum of the tennis ball as it leaves the tennis player’s hand. momentum = … [2] [Total: 8]
8 marks
Mark scheme: Question Answer Marks 1(a)(i) scalar has magnitude (size) only OR vector has (magnitude and) direction B1 1(a)(ii) mass, energy and temperature B2 all correct and no additional quantities 2 marks 2 correct and no additional quantities 1 mark 1(b)(i) decrease in kinetic energy = increase in gravitational (potential) energy OR B1 ½ mv2 = mg()h v2 = 2gh OR v2 = 2 9.8 5.0 OR v2 =98 B1 v = √98 OR 9.899 B1 1(b)(ii) 0.57 kg m / s (upwards) OR 0.57 Ns (upwards) A2 (momentum = ) mv OR 5.8 10-2 9.9 C1
This question in 0625/42 Oct/Nov 2025
Q61 · Fill in the gaps in the description of how an accretion model explains the formation of… 0625/42 Oct/Nov 2025
10 (a) Fill in the gaps in the description of how an accretion model explains the formation of the Solar System. The planets nearest the Sun are small and … The planets furthest from the Sun are large and … All the planets were formed when a cloud of gas and dust collapsed due to … The rotation of material in the cloud forms an … [4] (b) The time taken for light to travel from the Moon to the Earth is 1.3 s. Calculate the distance of the Moon from the Earth. Give your answer in m. distance = … m [3] (c) The Whirlpool galaxy is 2.3 × 10⁷ light‑years from the Earth. The current value of the Hubble constant is 2.2 × 10⁻¹⁸ per second. Calculate the speed at which the Whirlpool galaxy is moving away from the Earth. speed = … [3] [Total: 10]
10 marks
Mark scheme: 10(a) rocky B1 gaseous B1 gravitational force B1 accretion disc B1 10(b) 3.9 108 (m) A3 (speed of light =) 3.0 108 C1 (s =) vt OR (s =) 3.0 108 1.3 C1 10(c) 4.8 105 m / s OR 4.8 102 km / s A3 (1 light-year =) 9.5 1015 (m) OR 9.5 1012 (km) OR 4.8 10N C1 (v =) H0 d OR (v =) 2.2 10-18 2.3 107 9.5 1015 C1
This question in 0625/42 Oct/Nov 2025
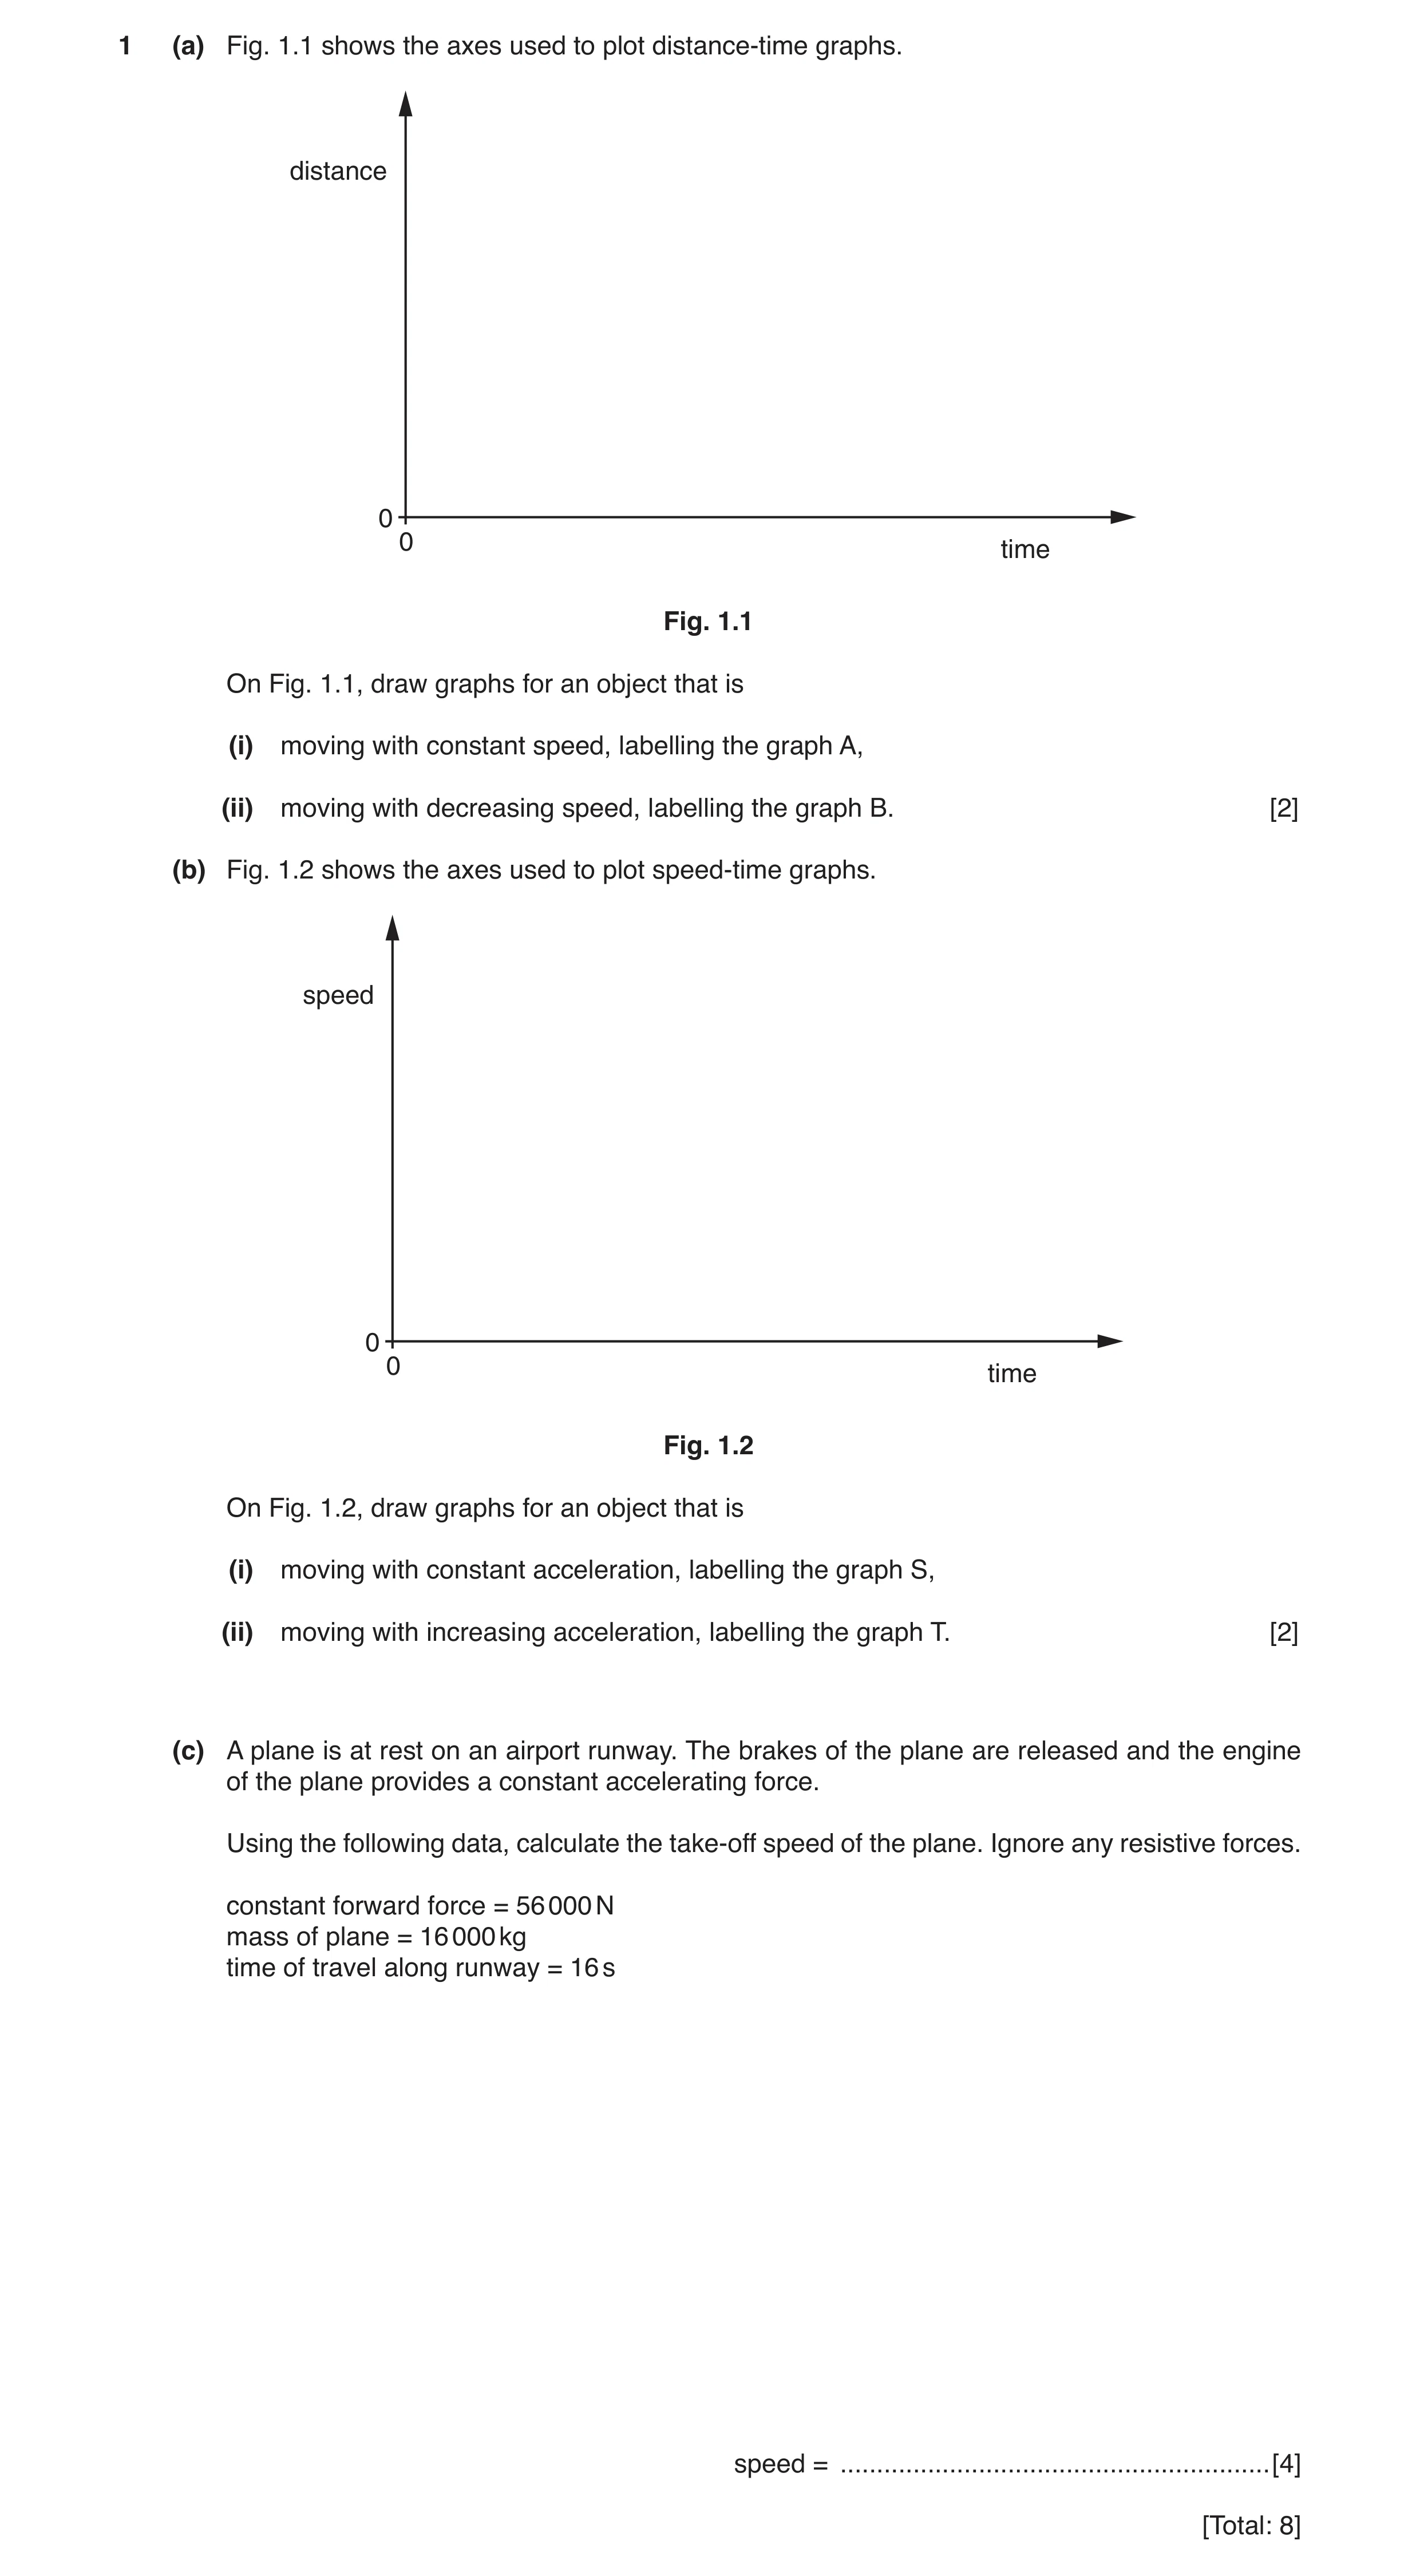
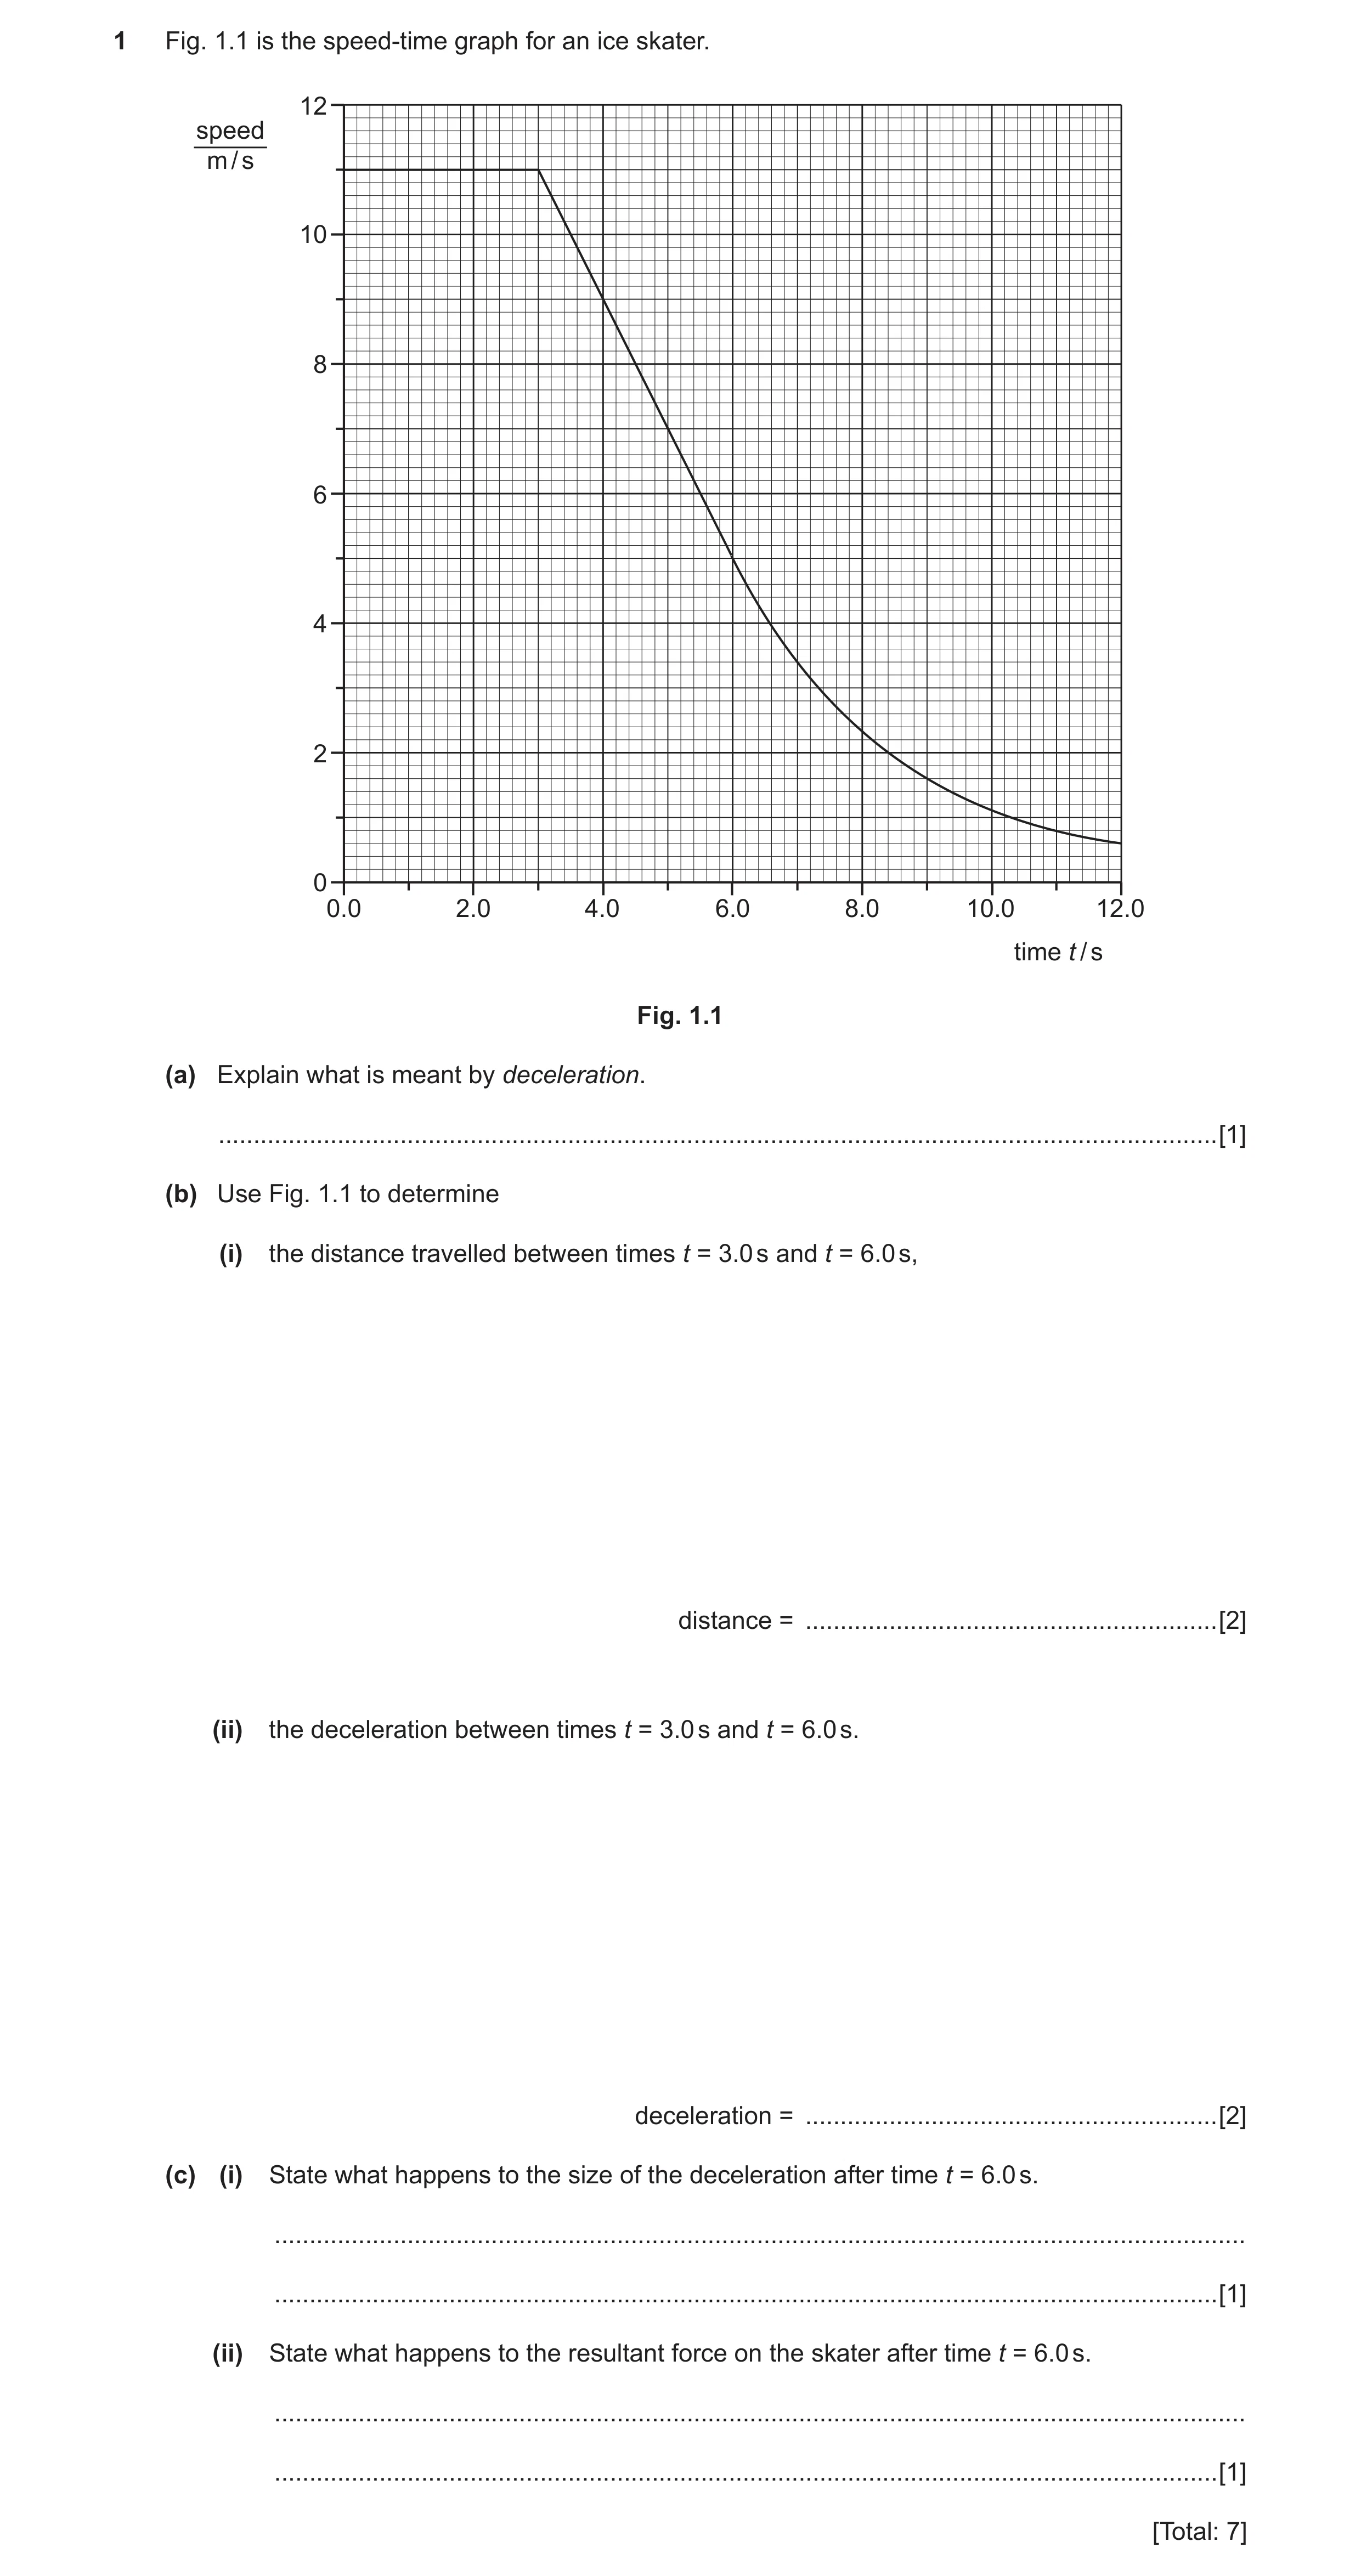
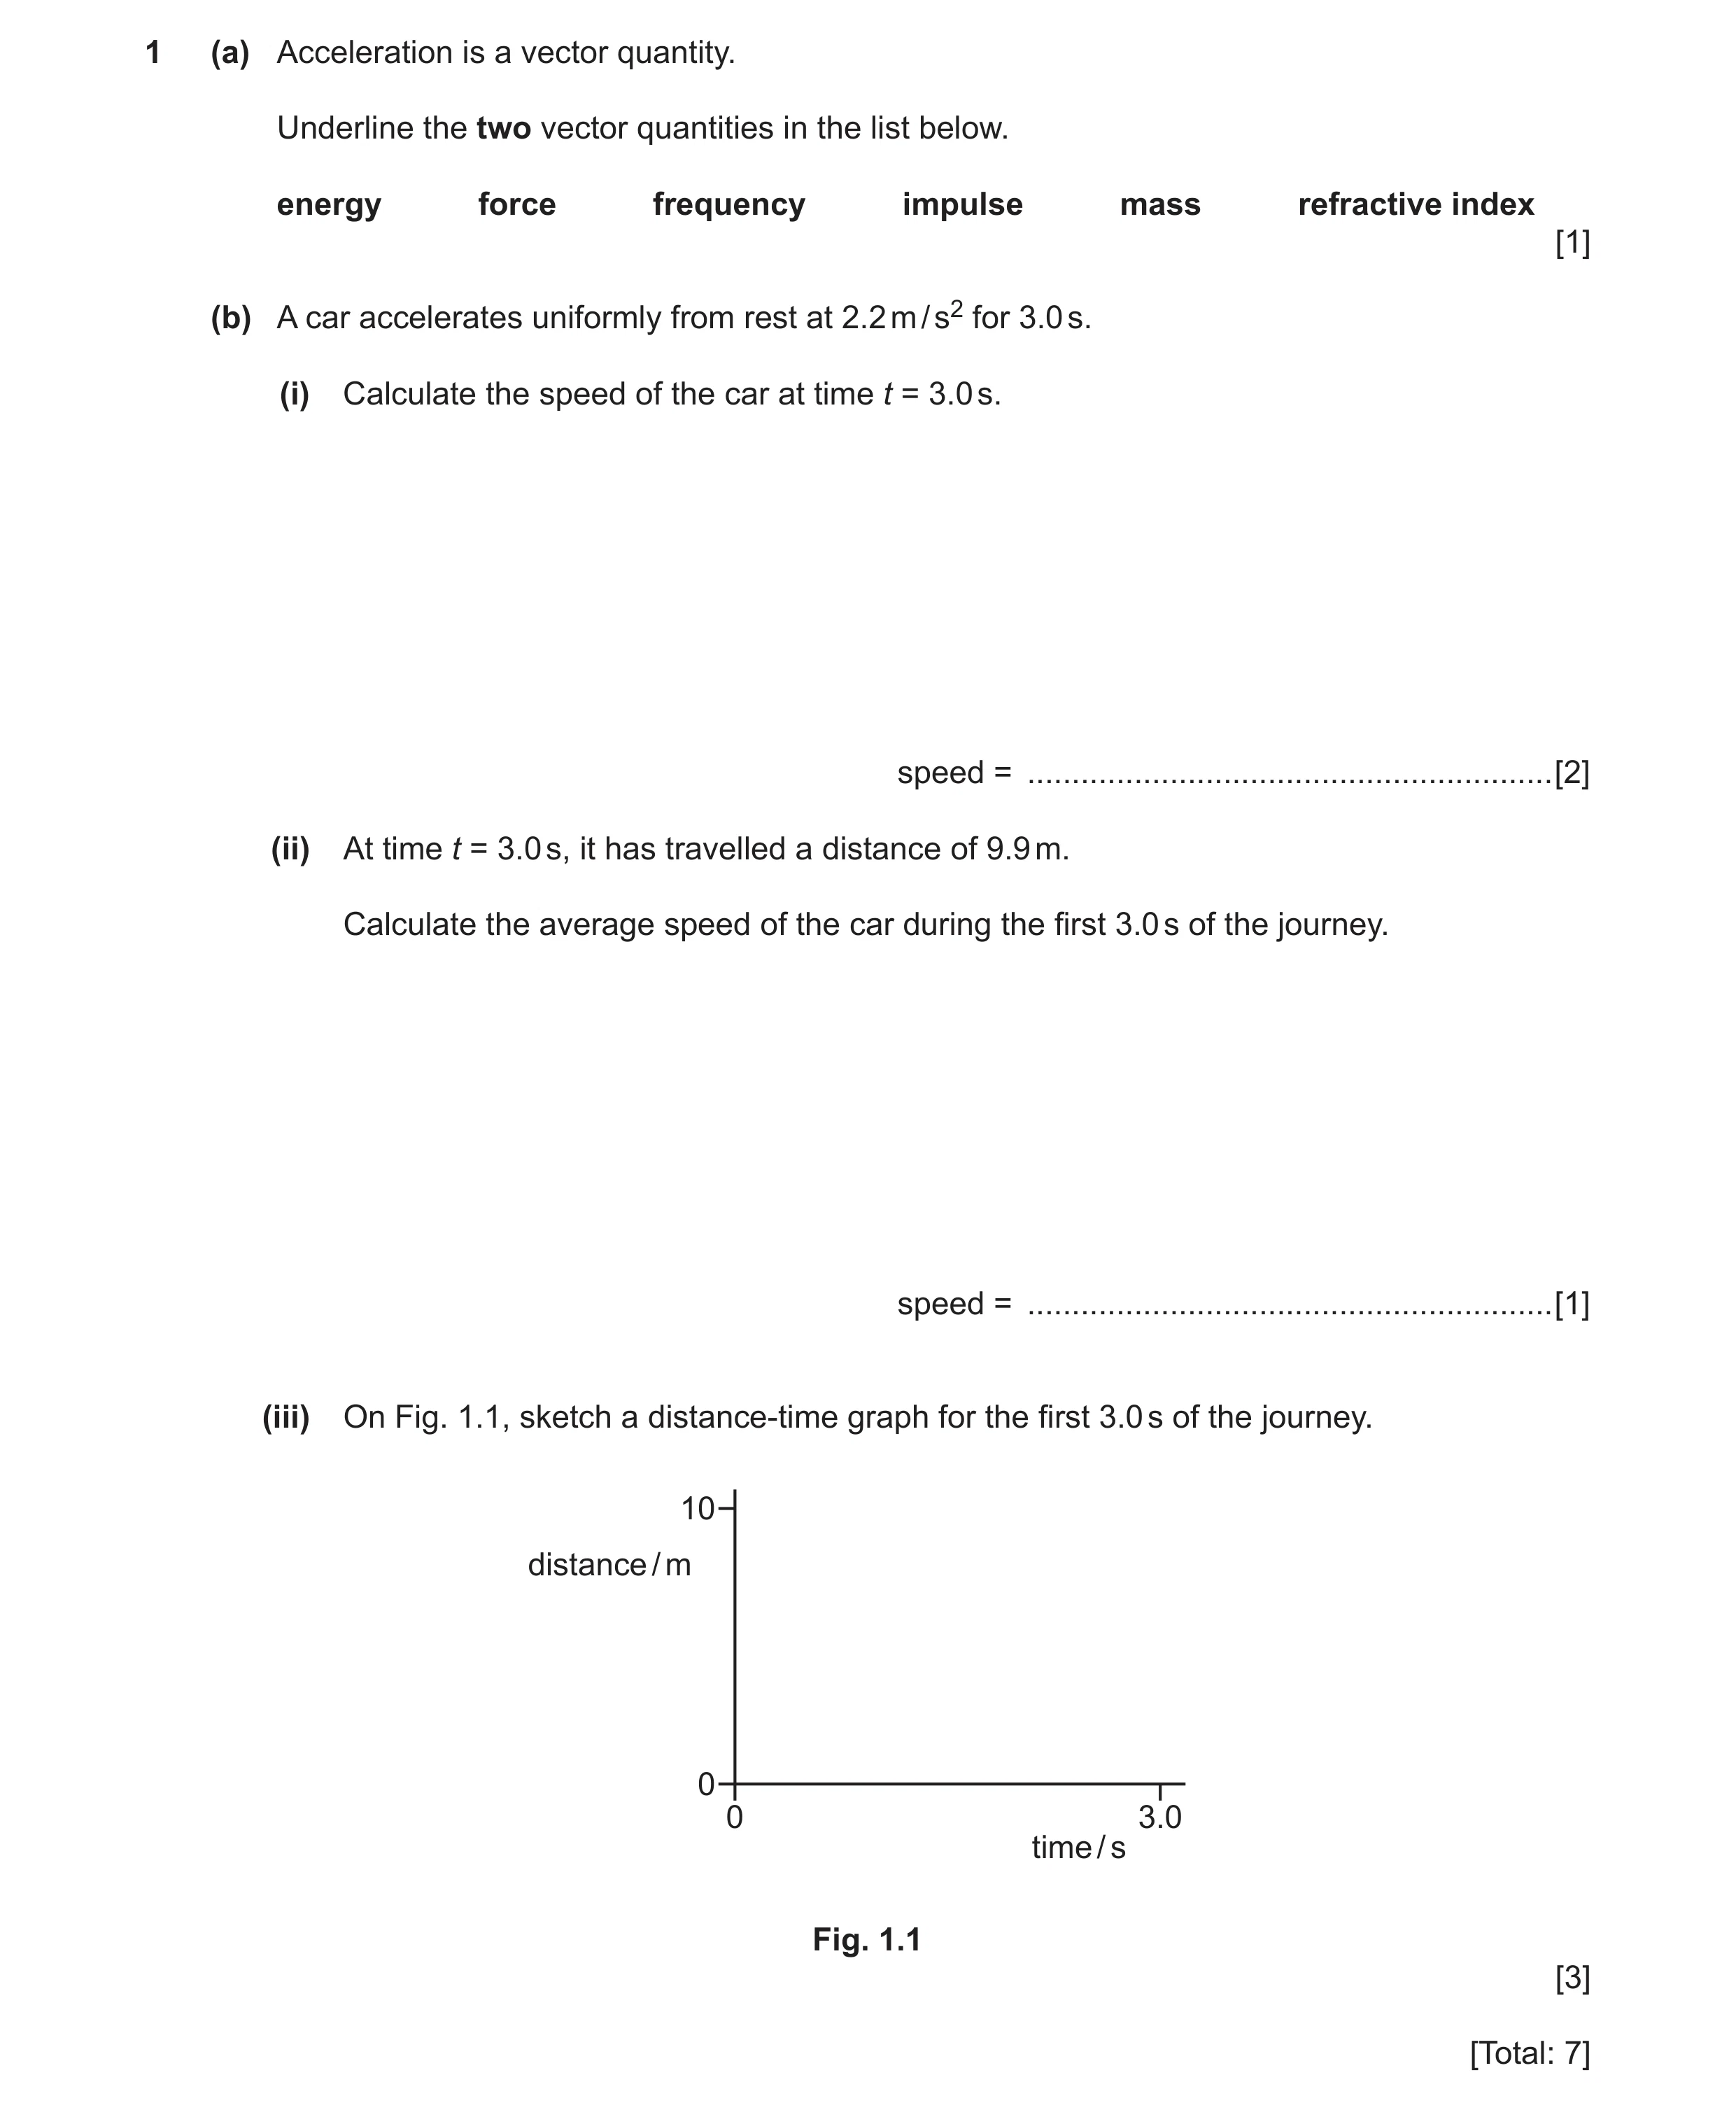 4 / 78
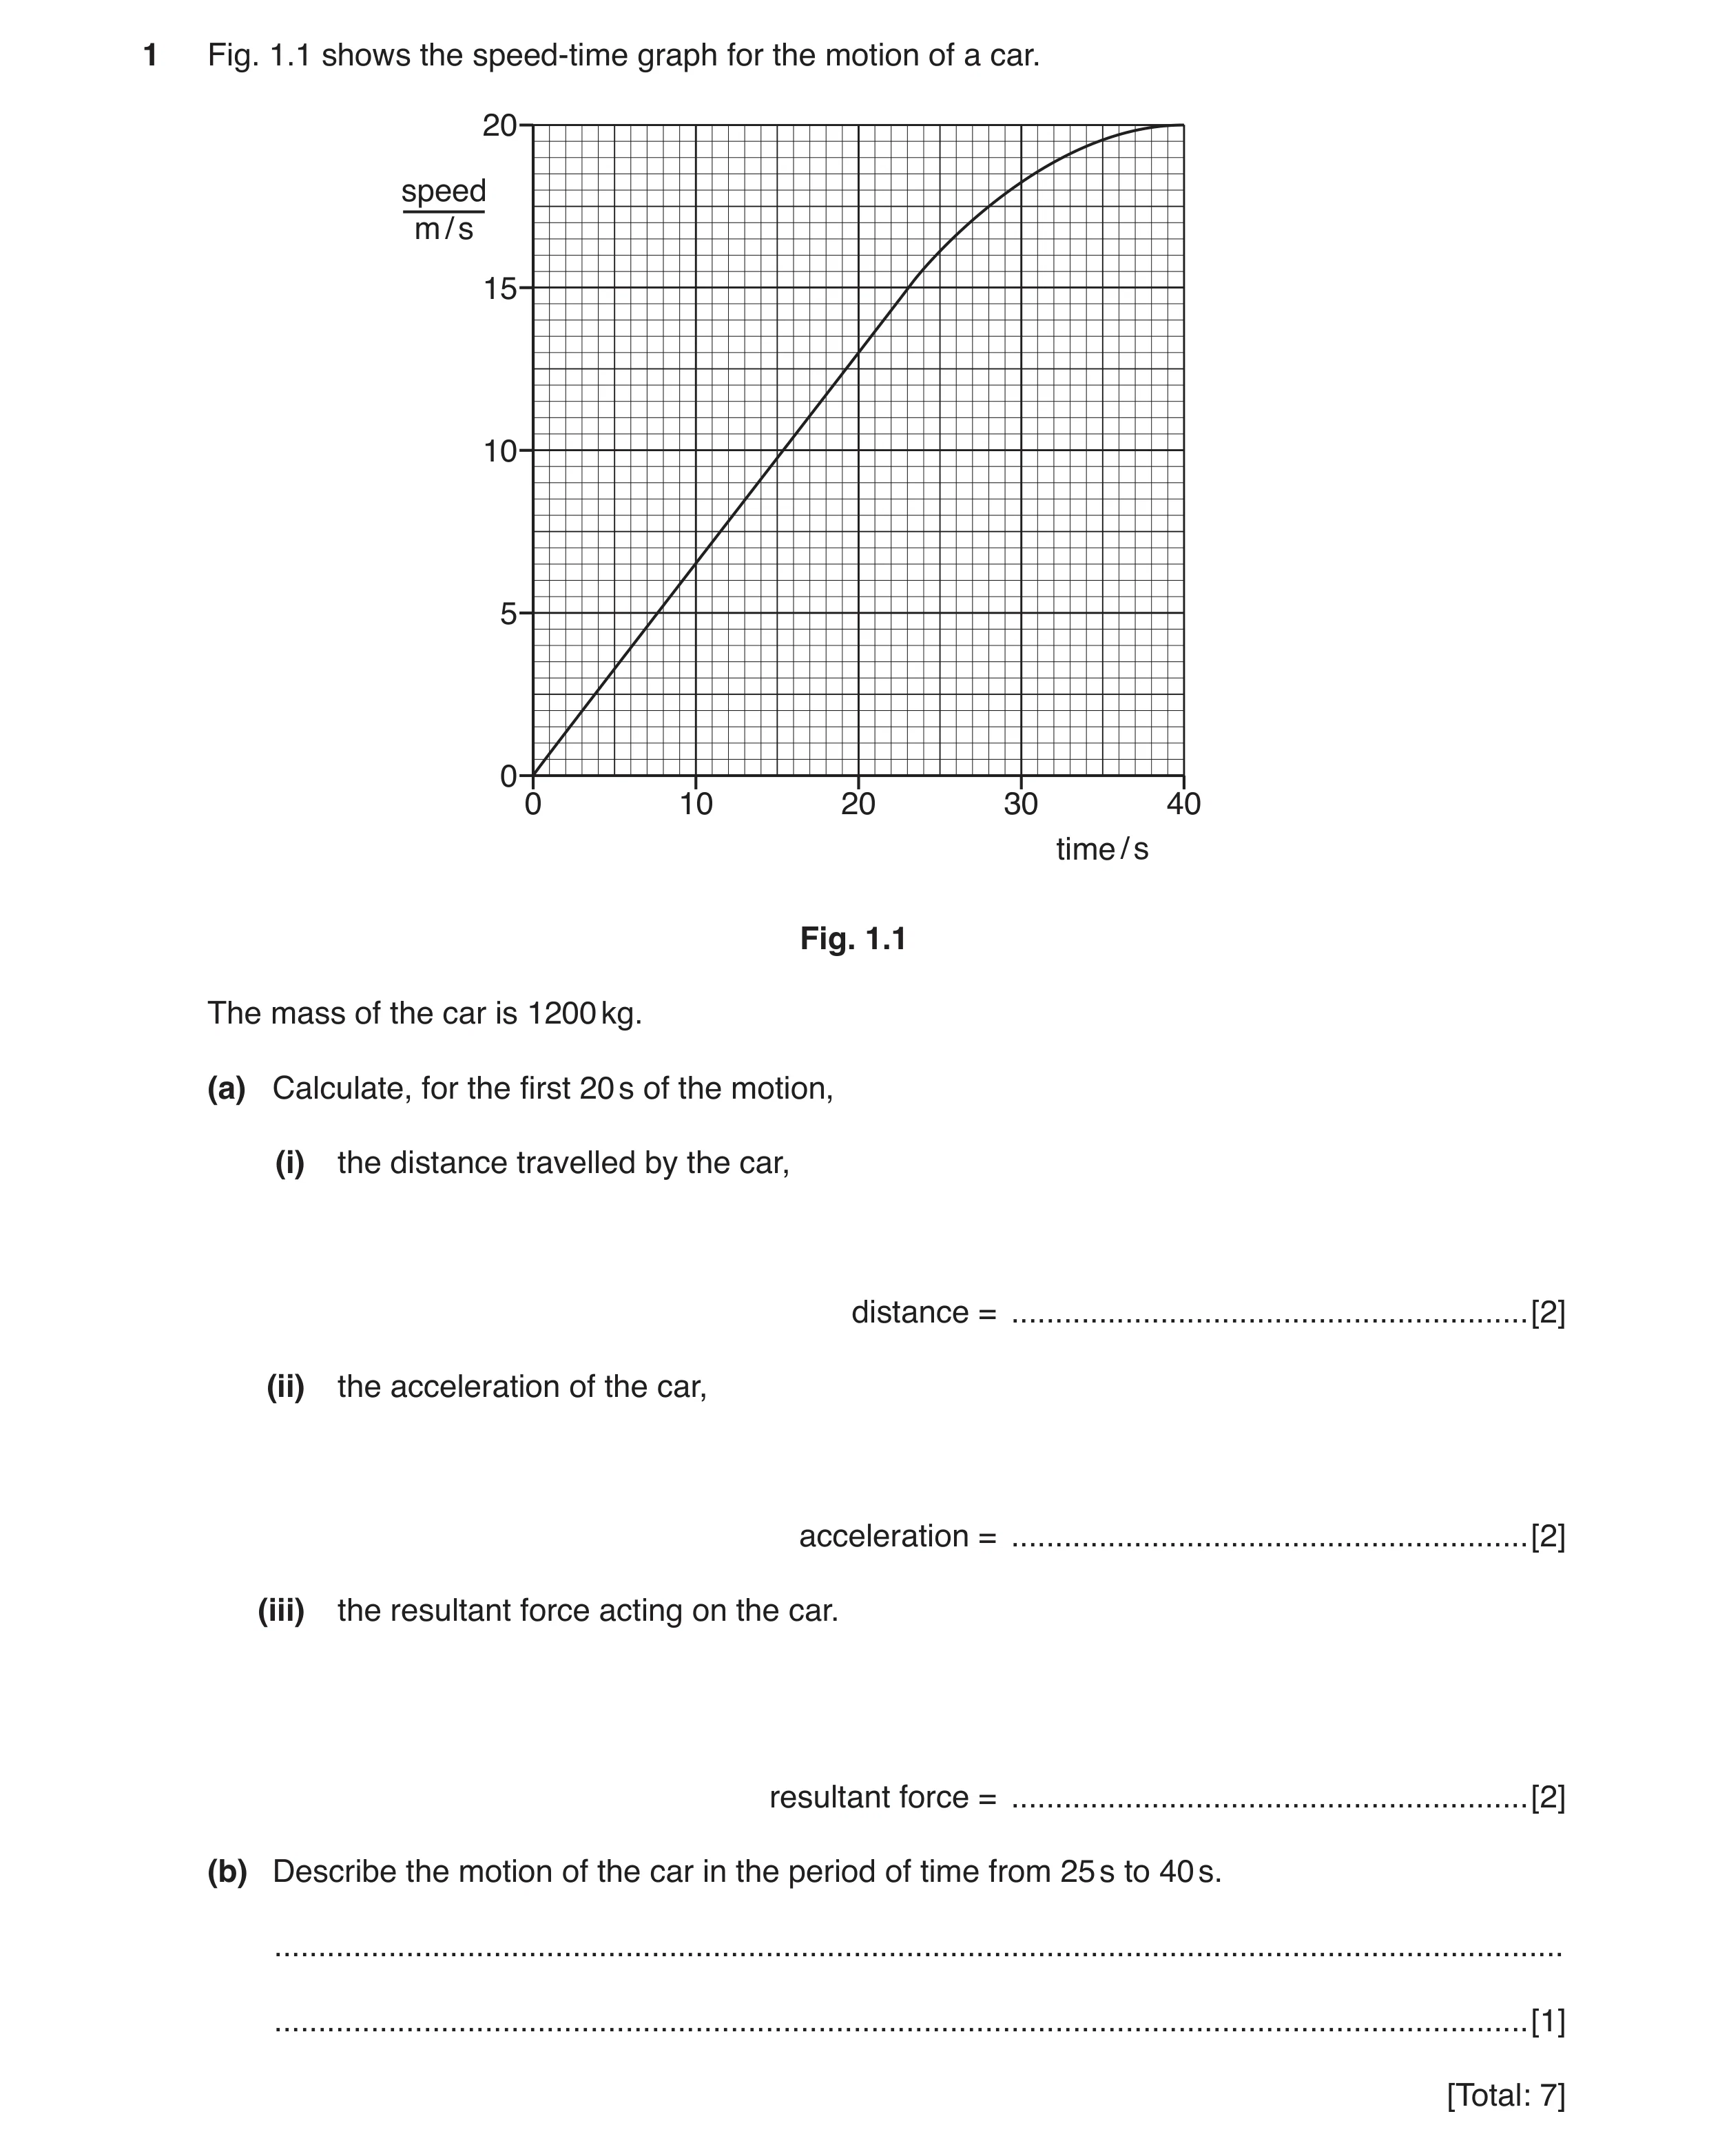 5 / 78
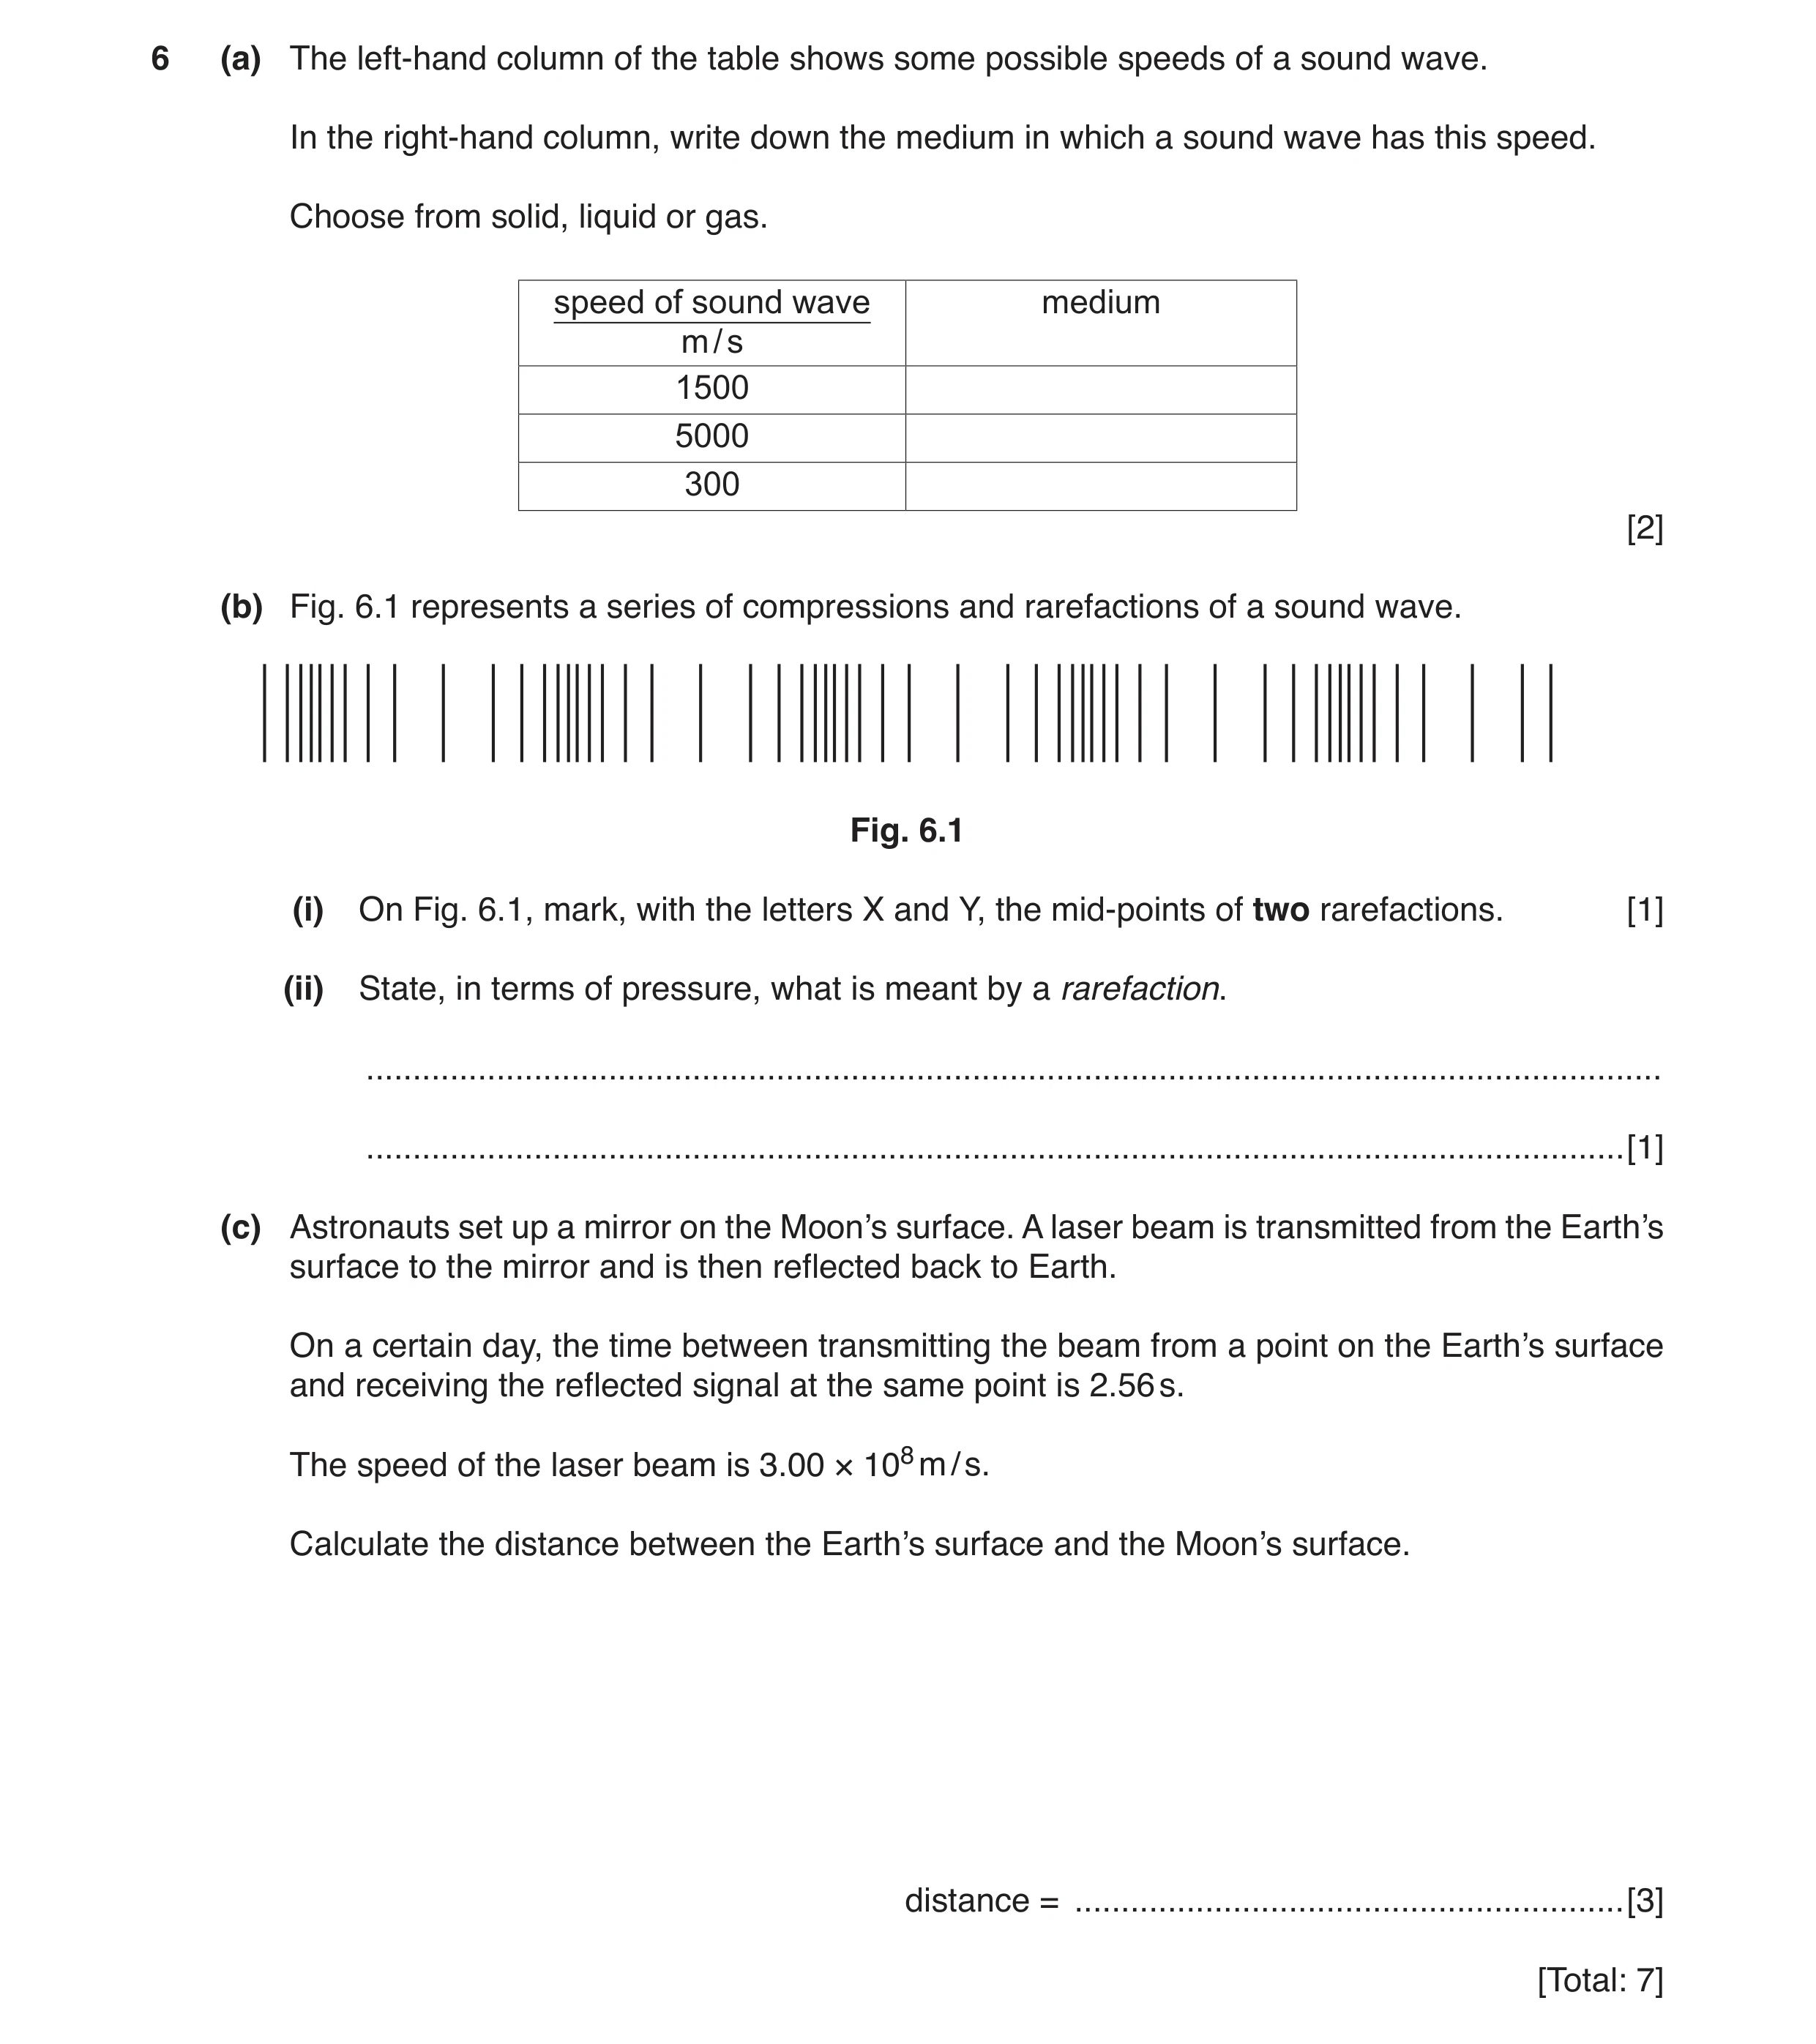 6 / 78
 7 / 78
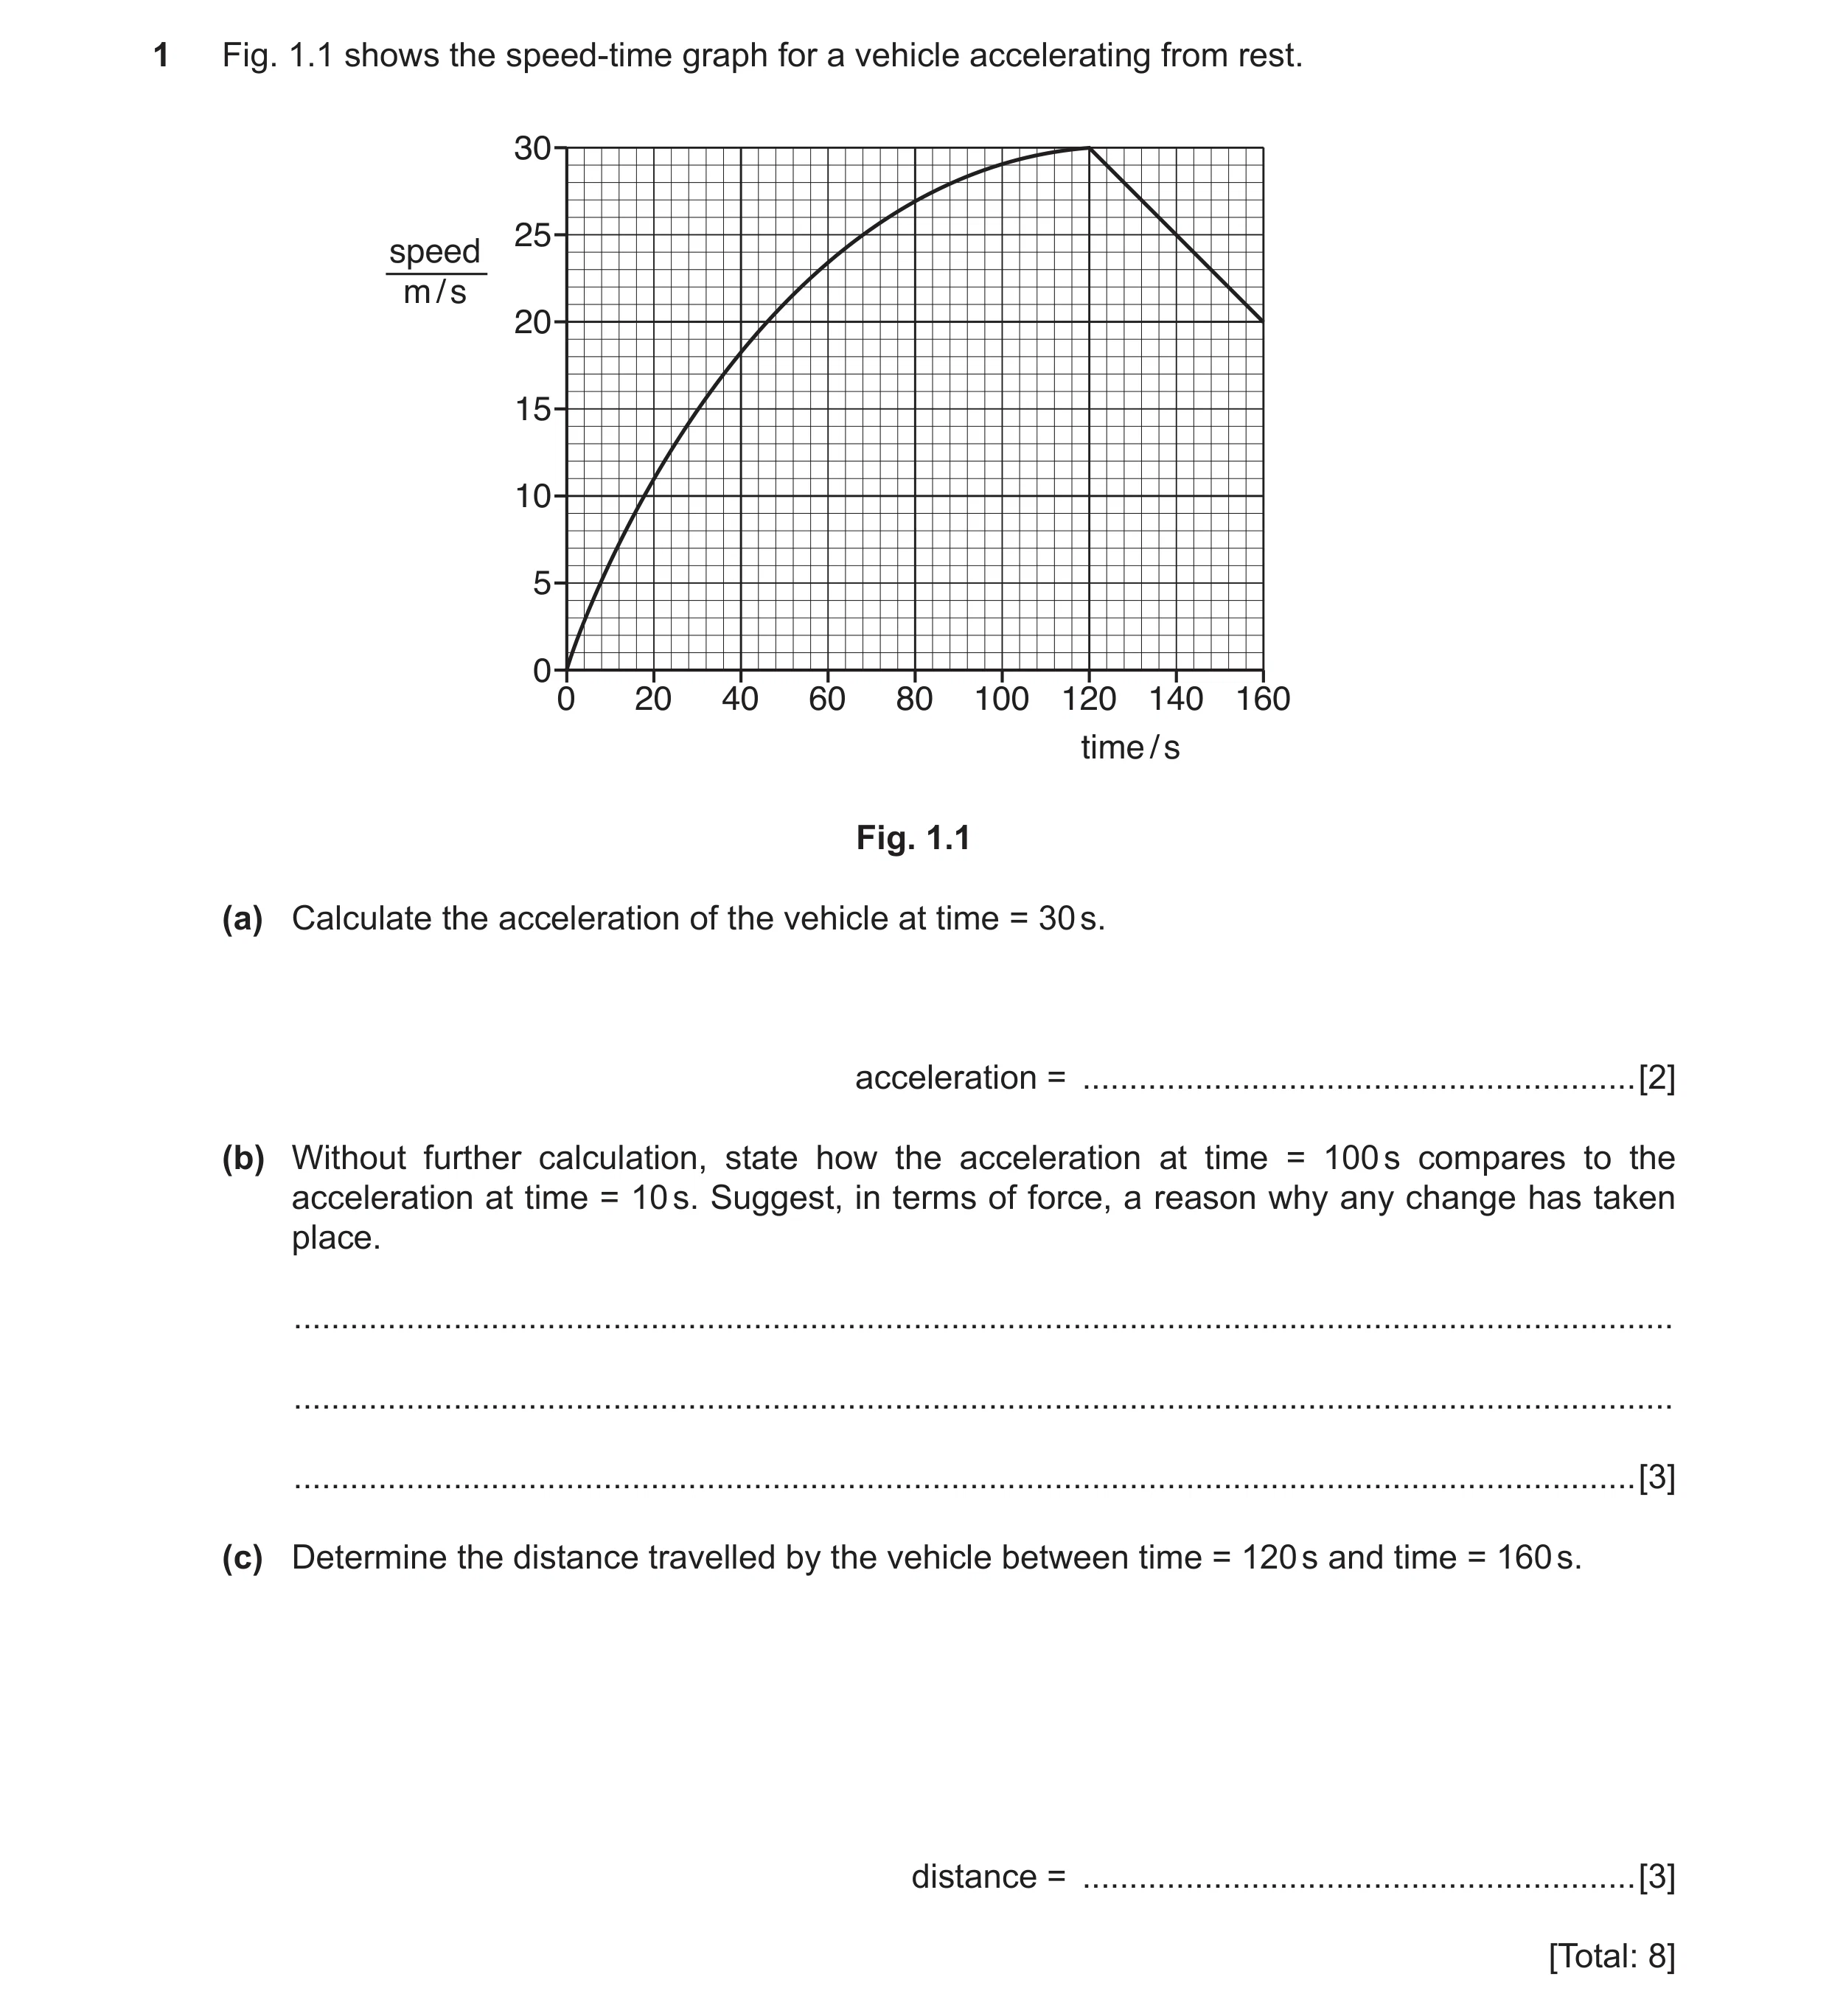 8 / 78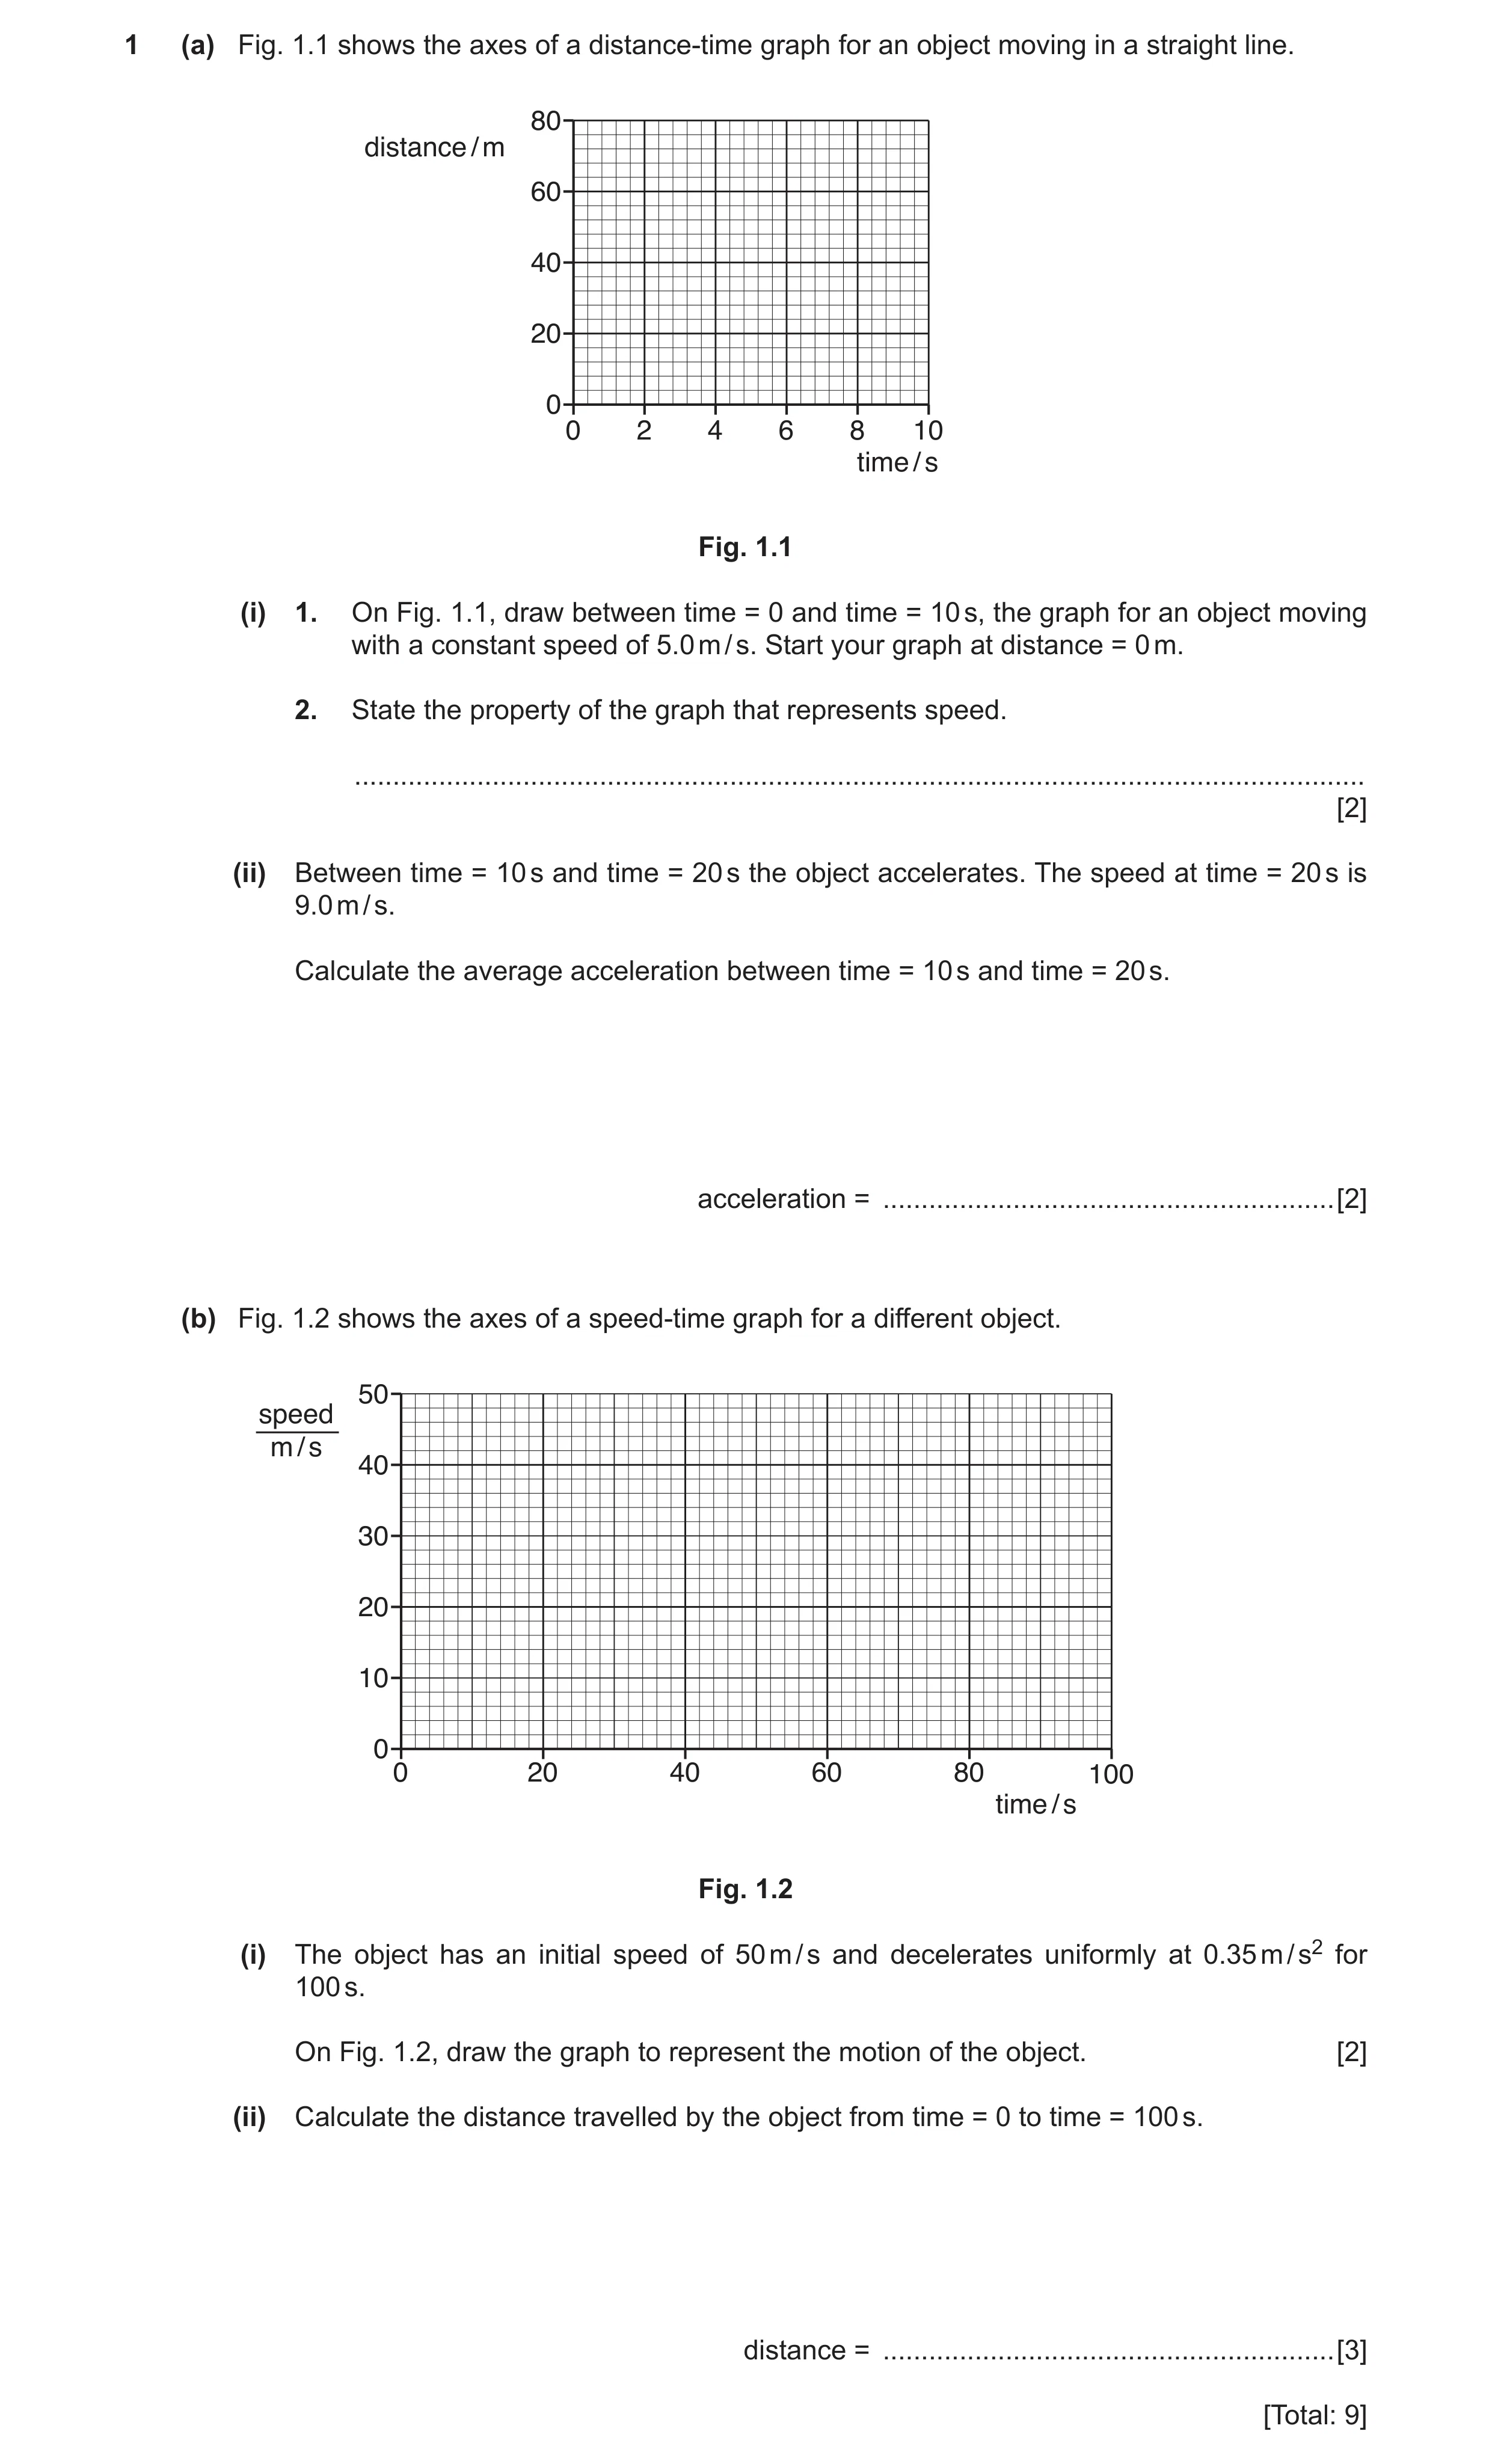
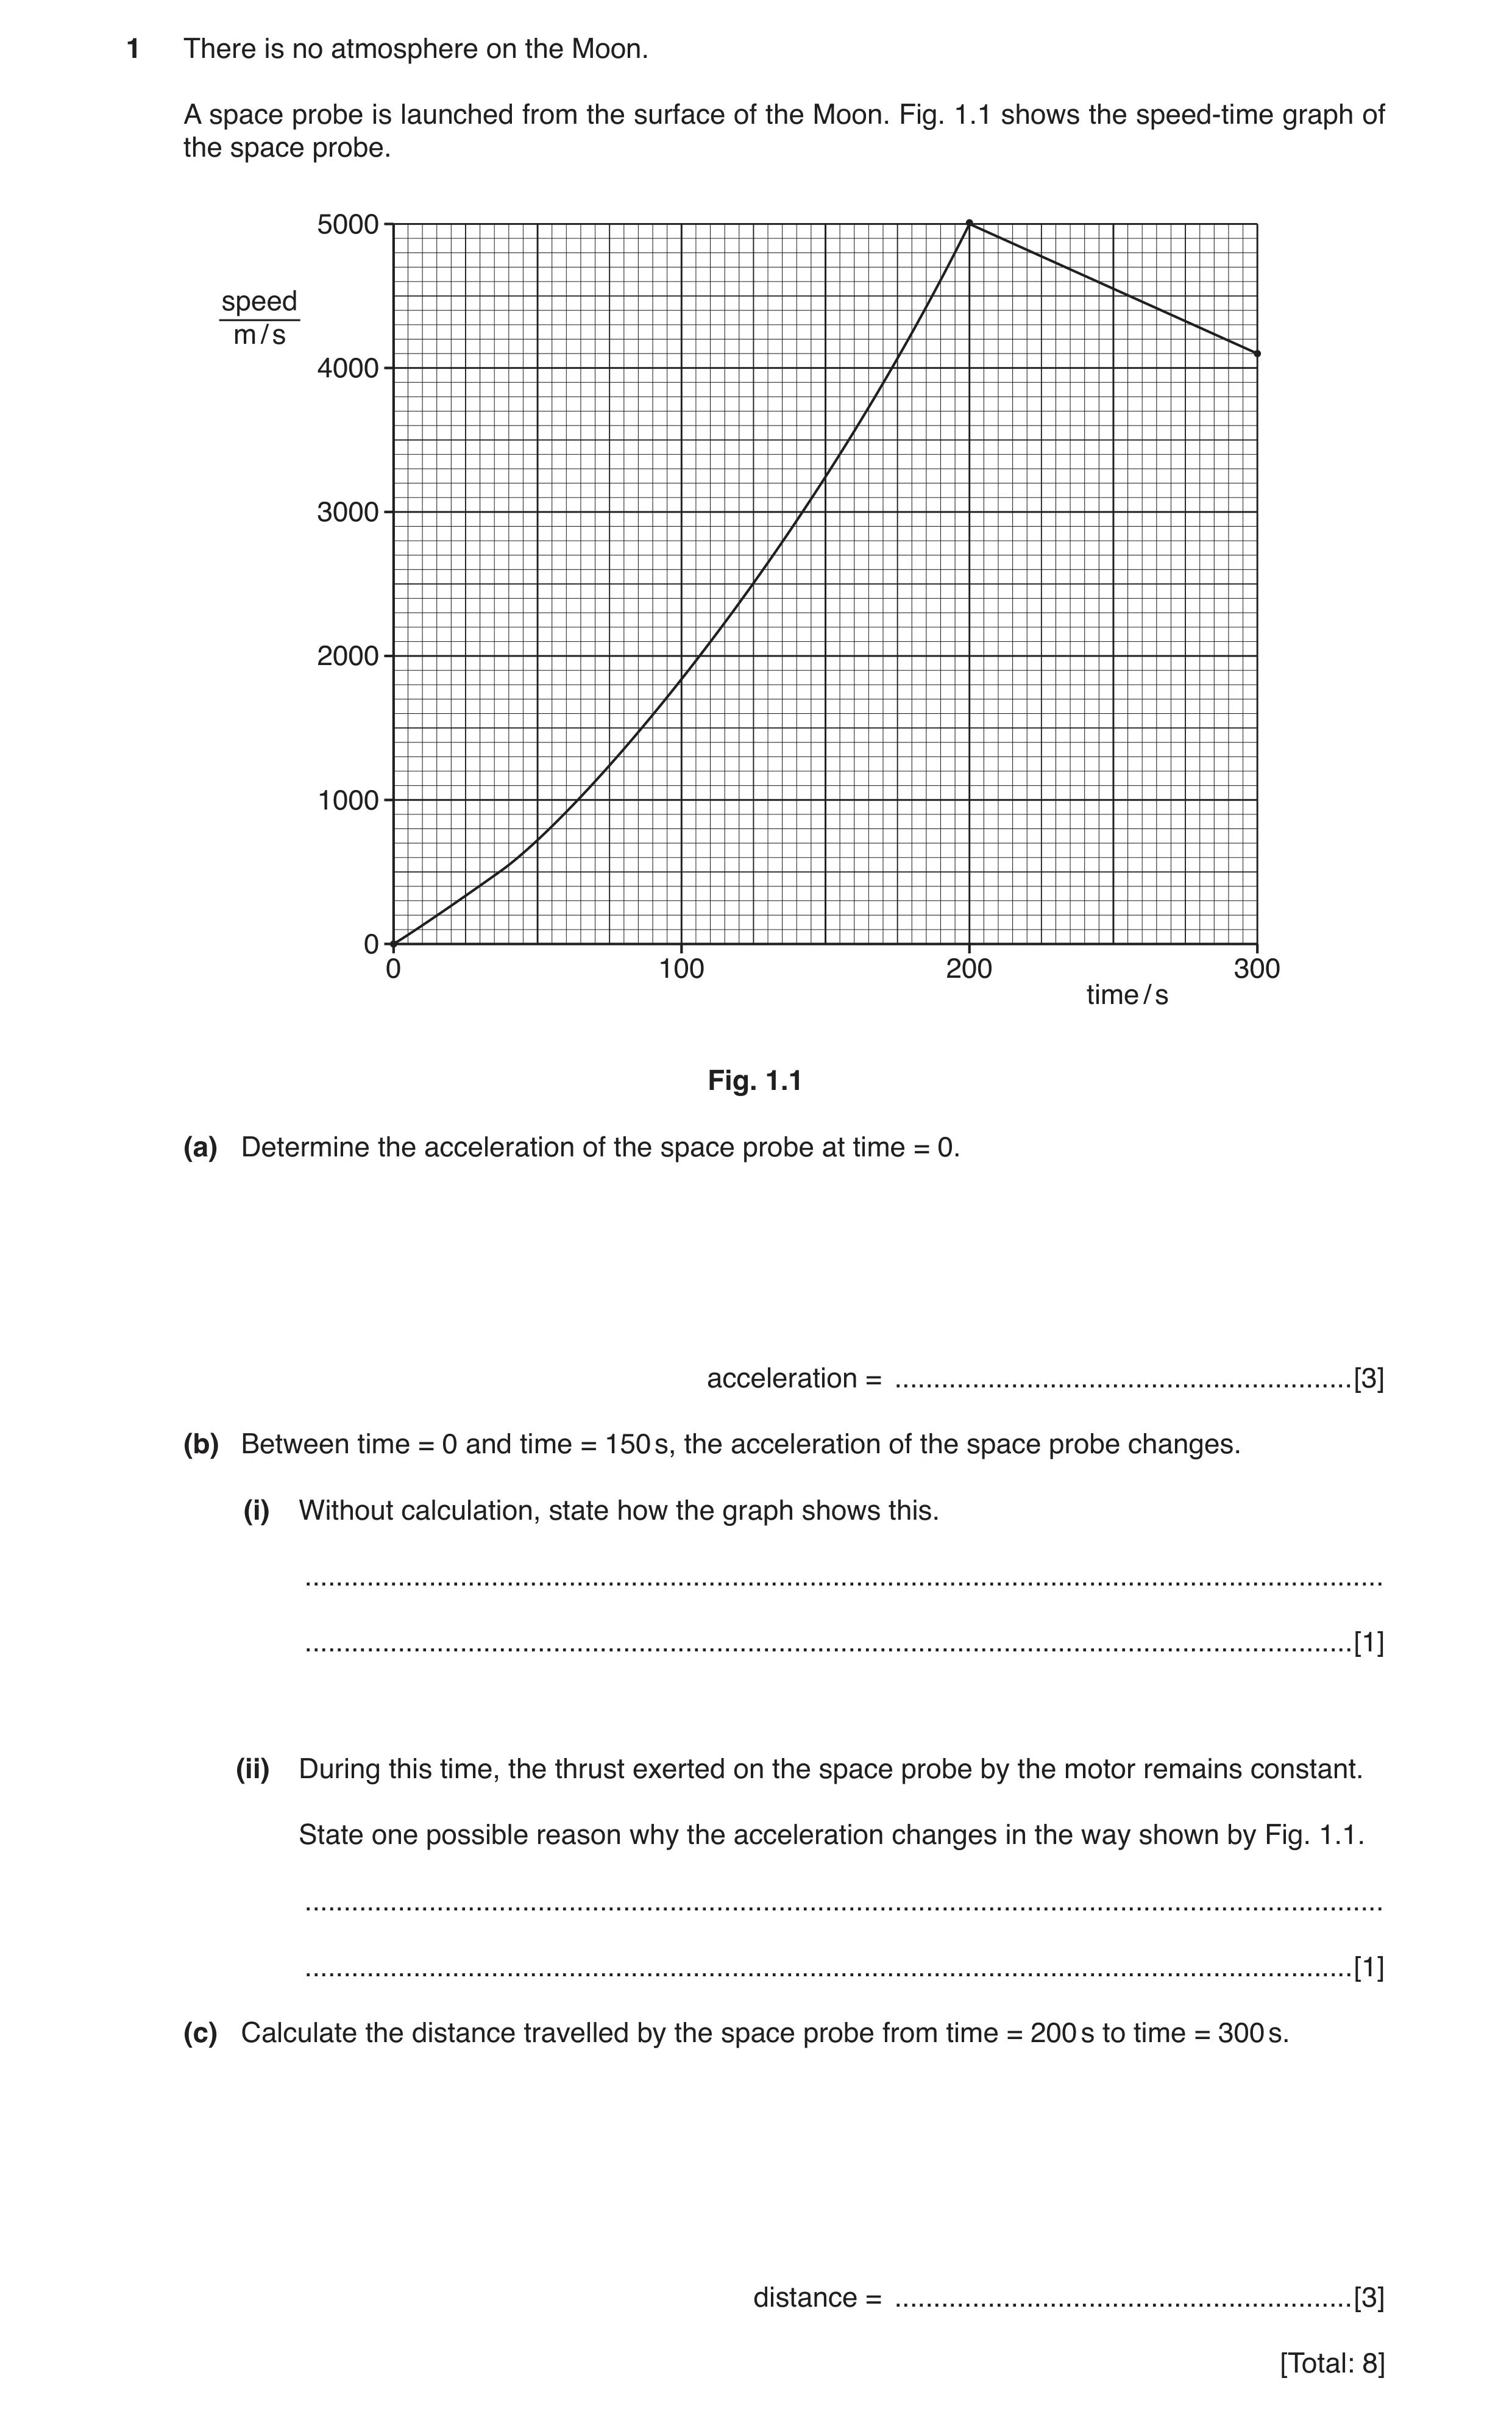
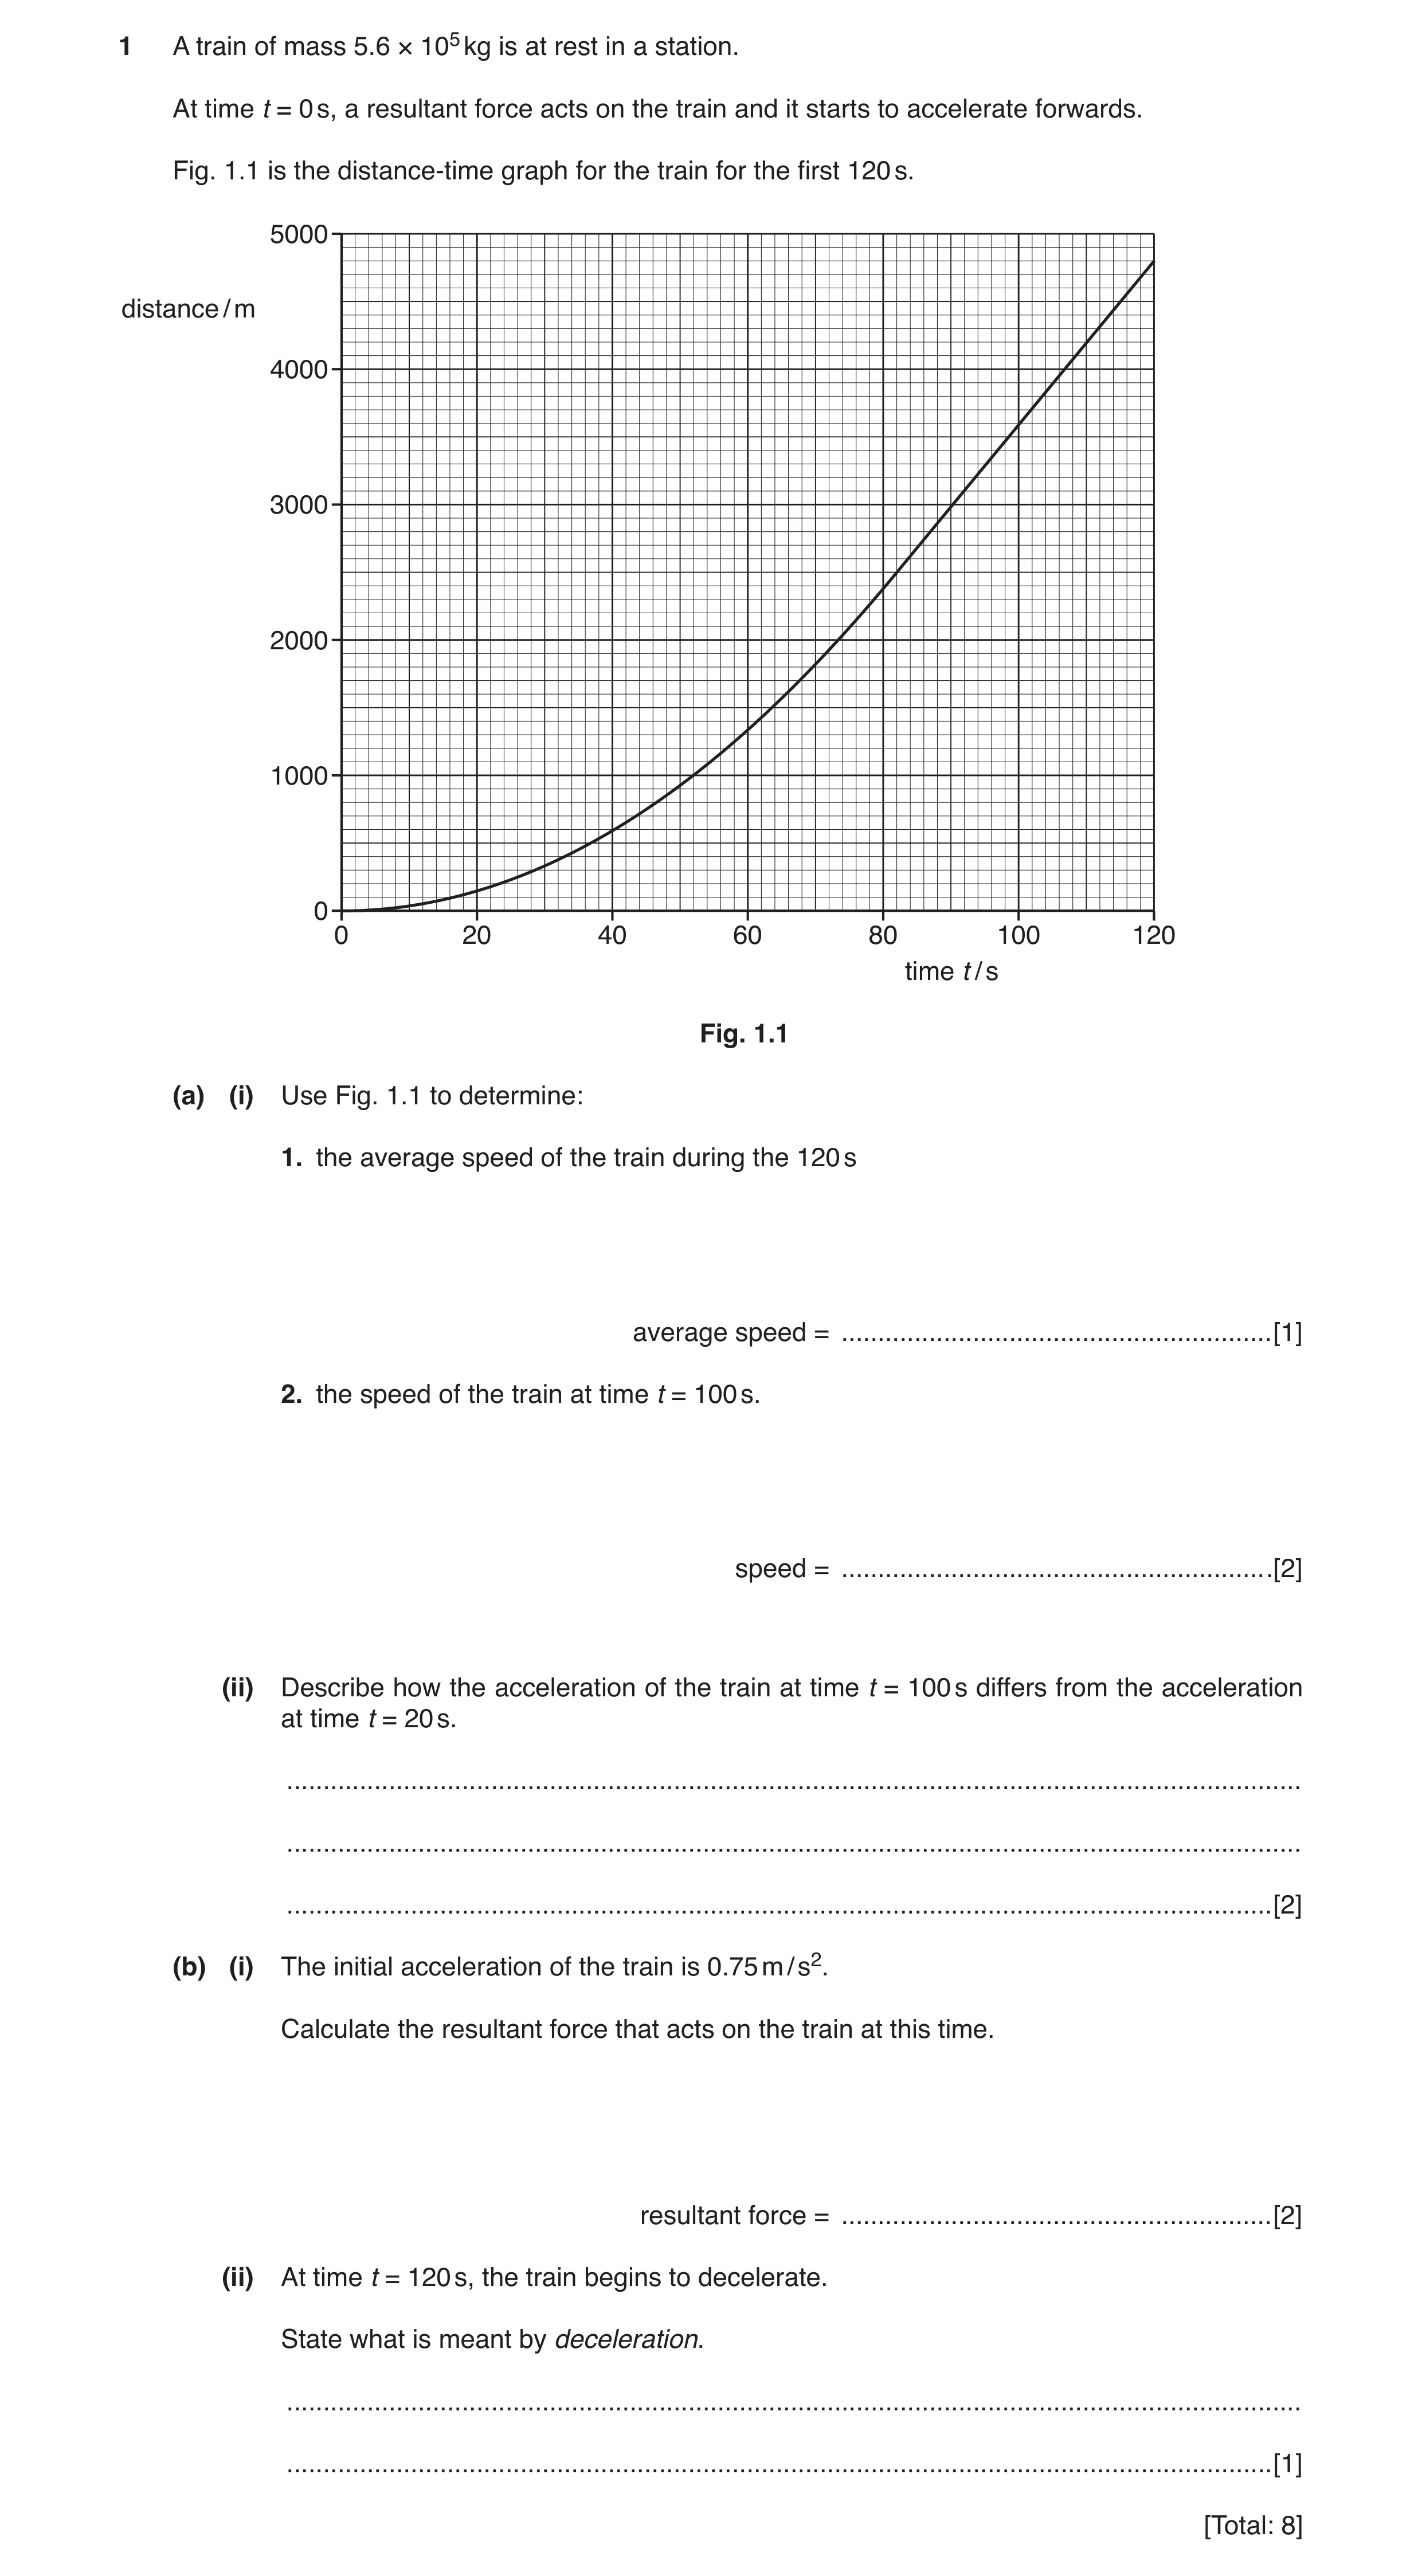
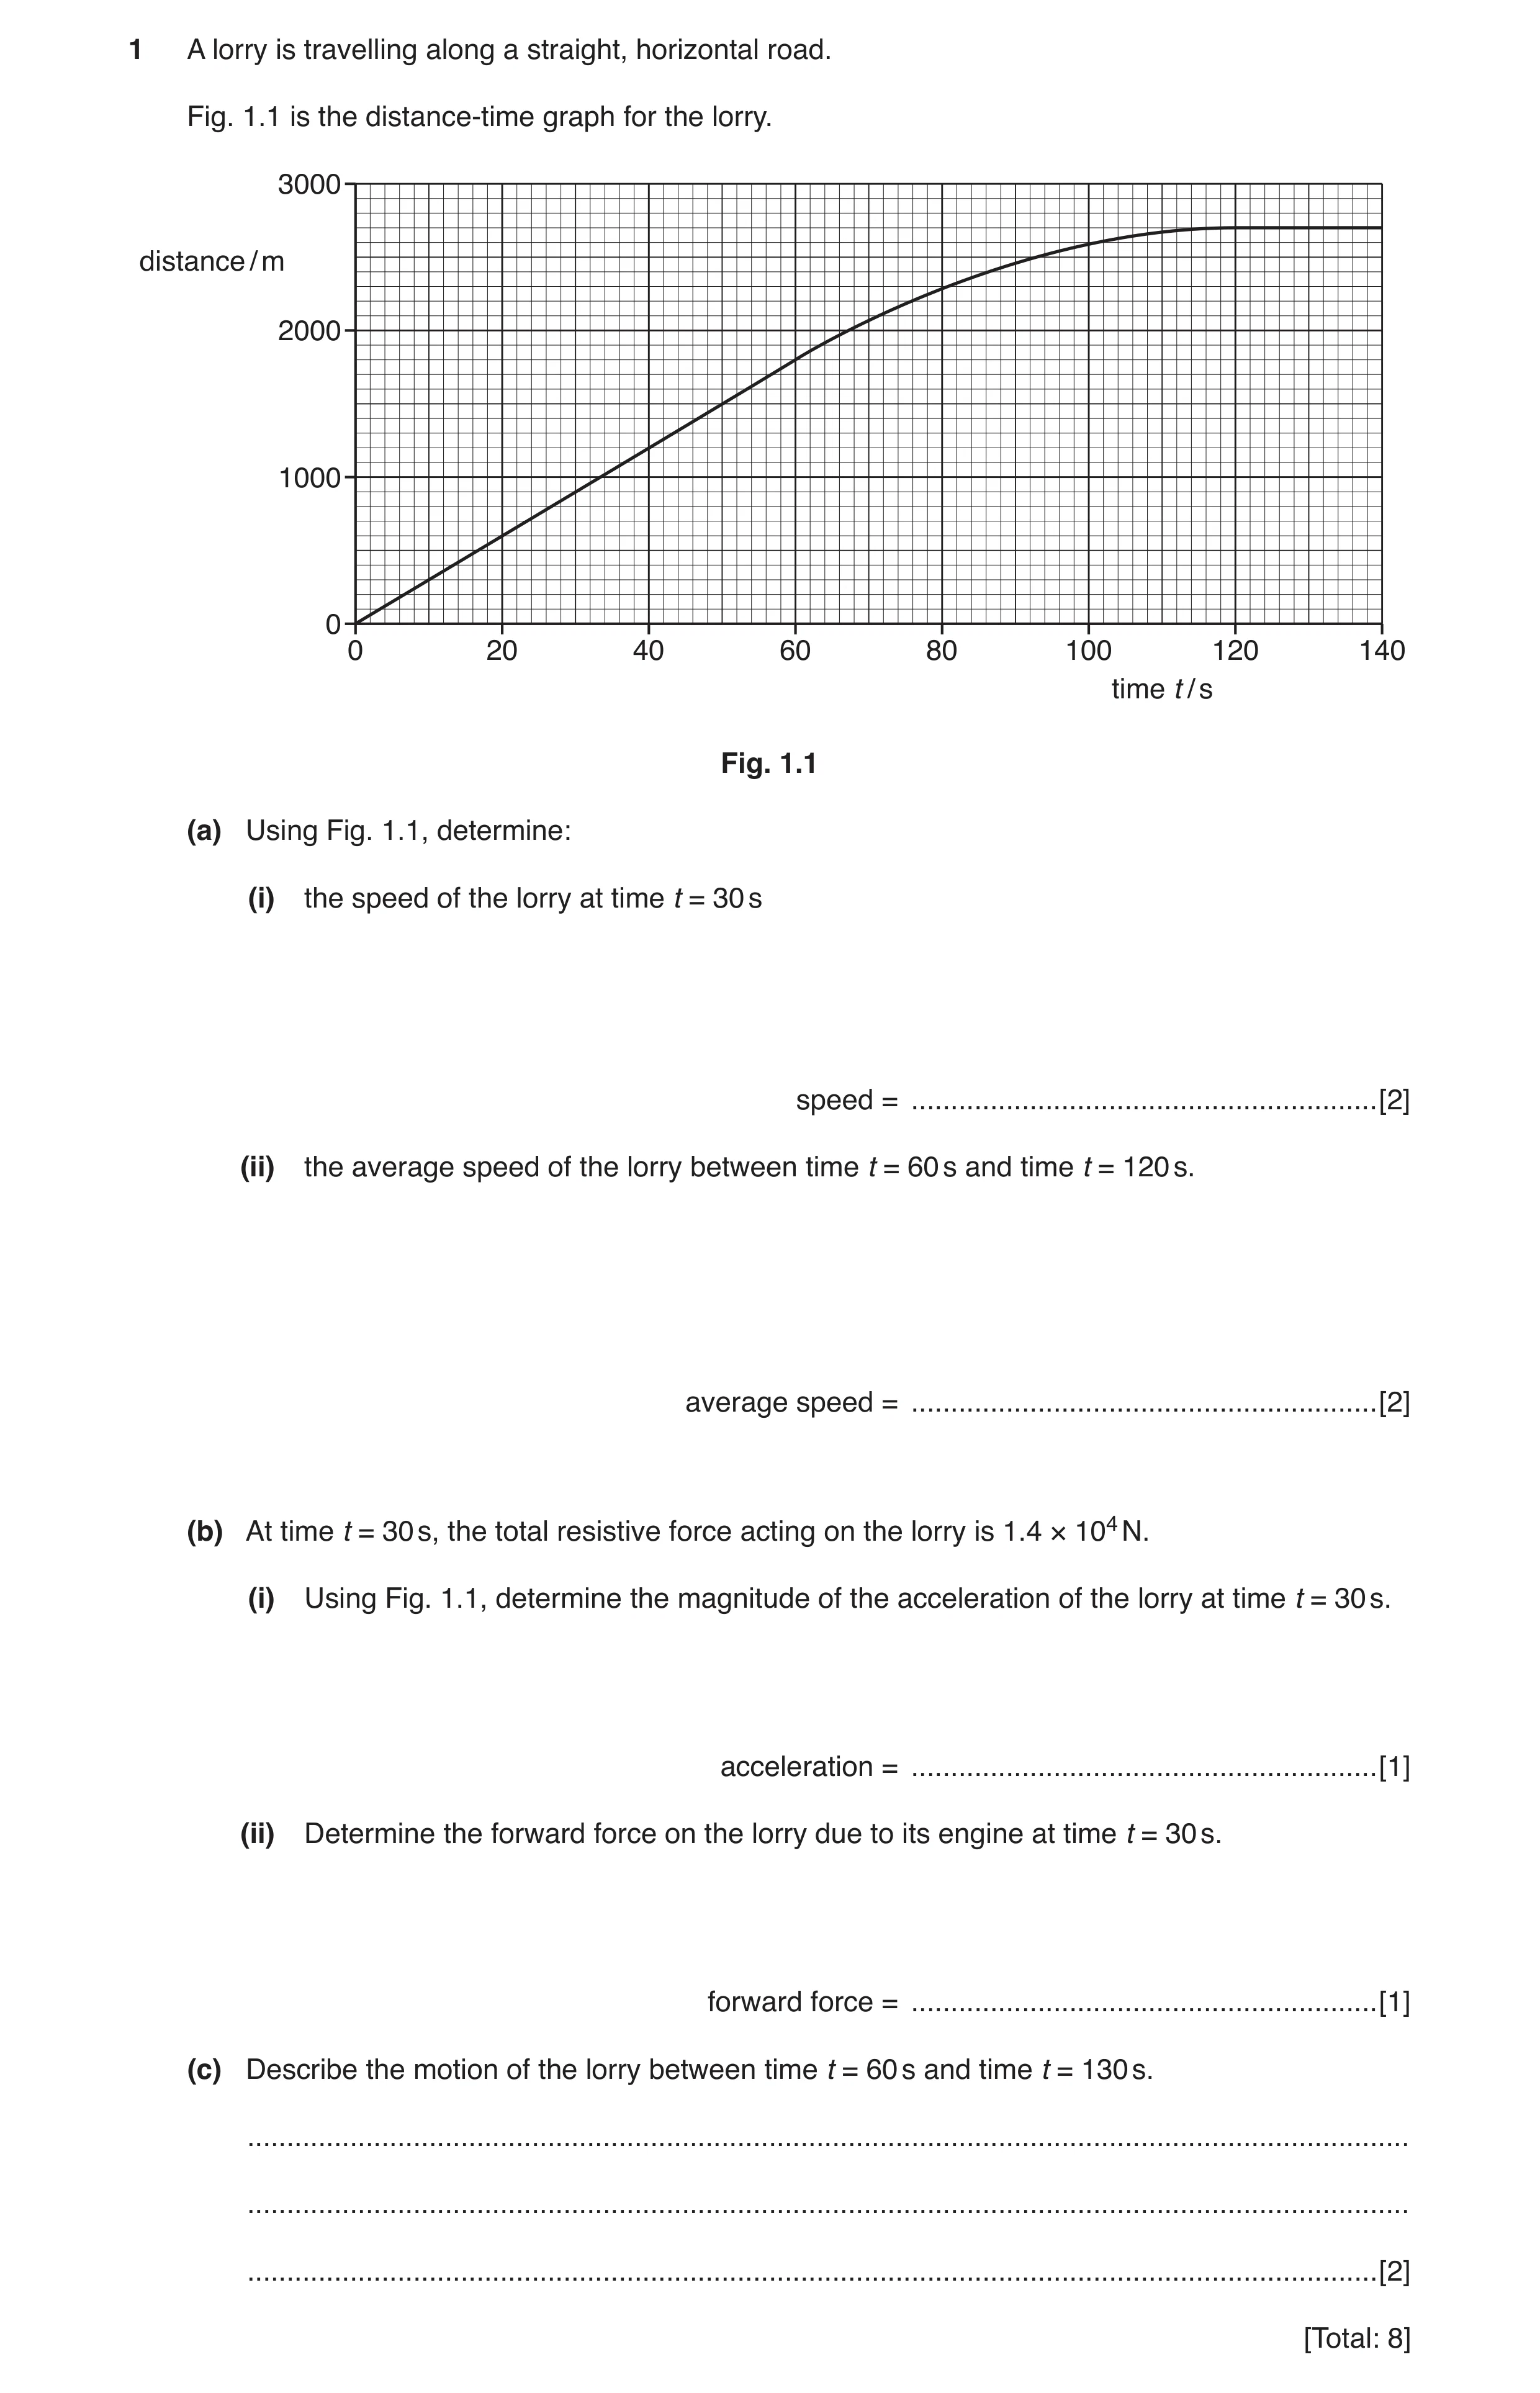
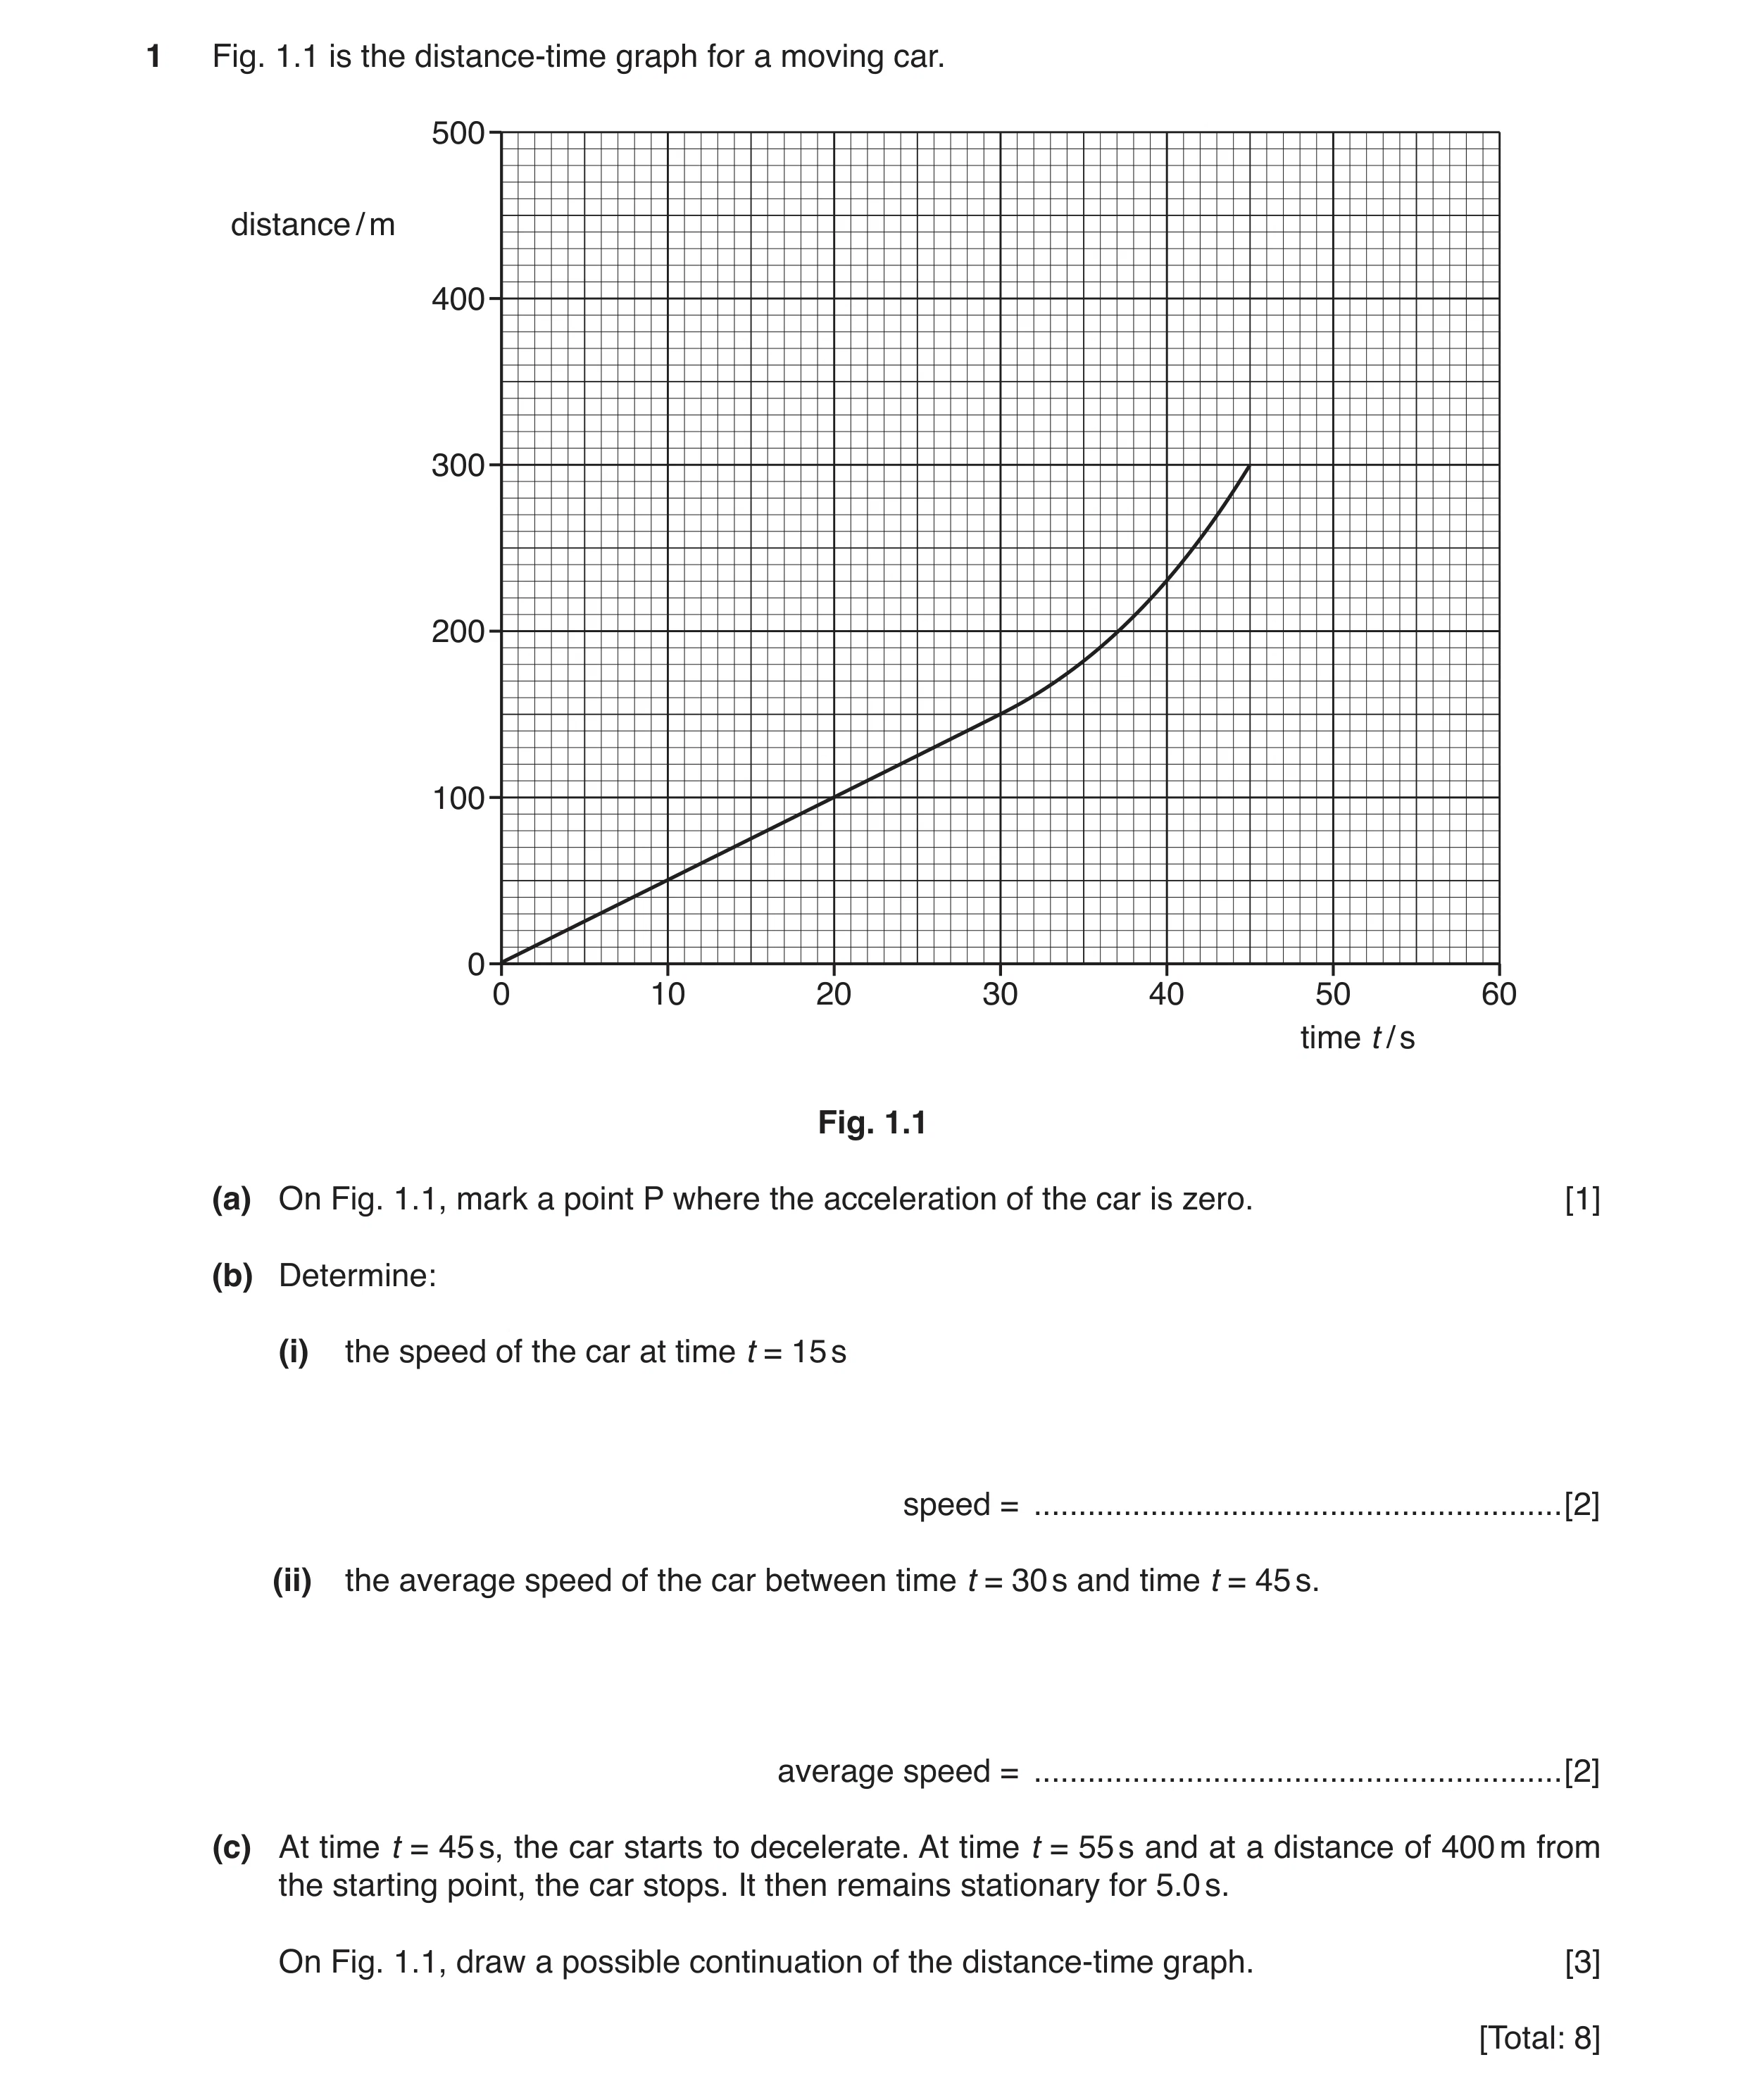 14 / 78
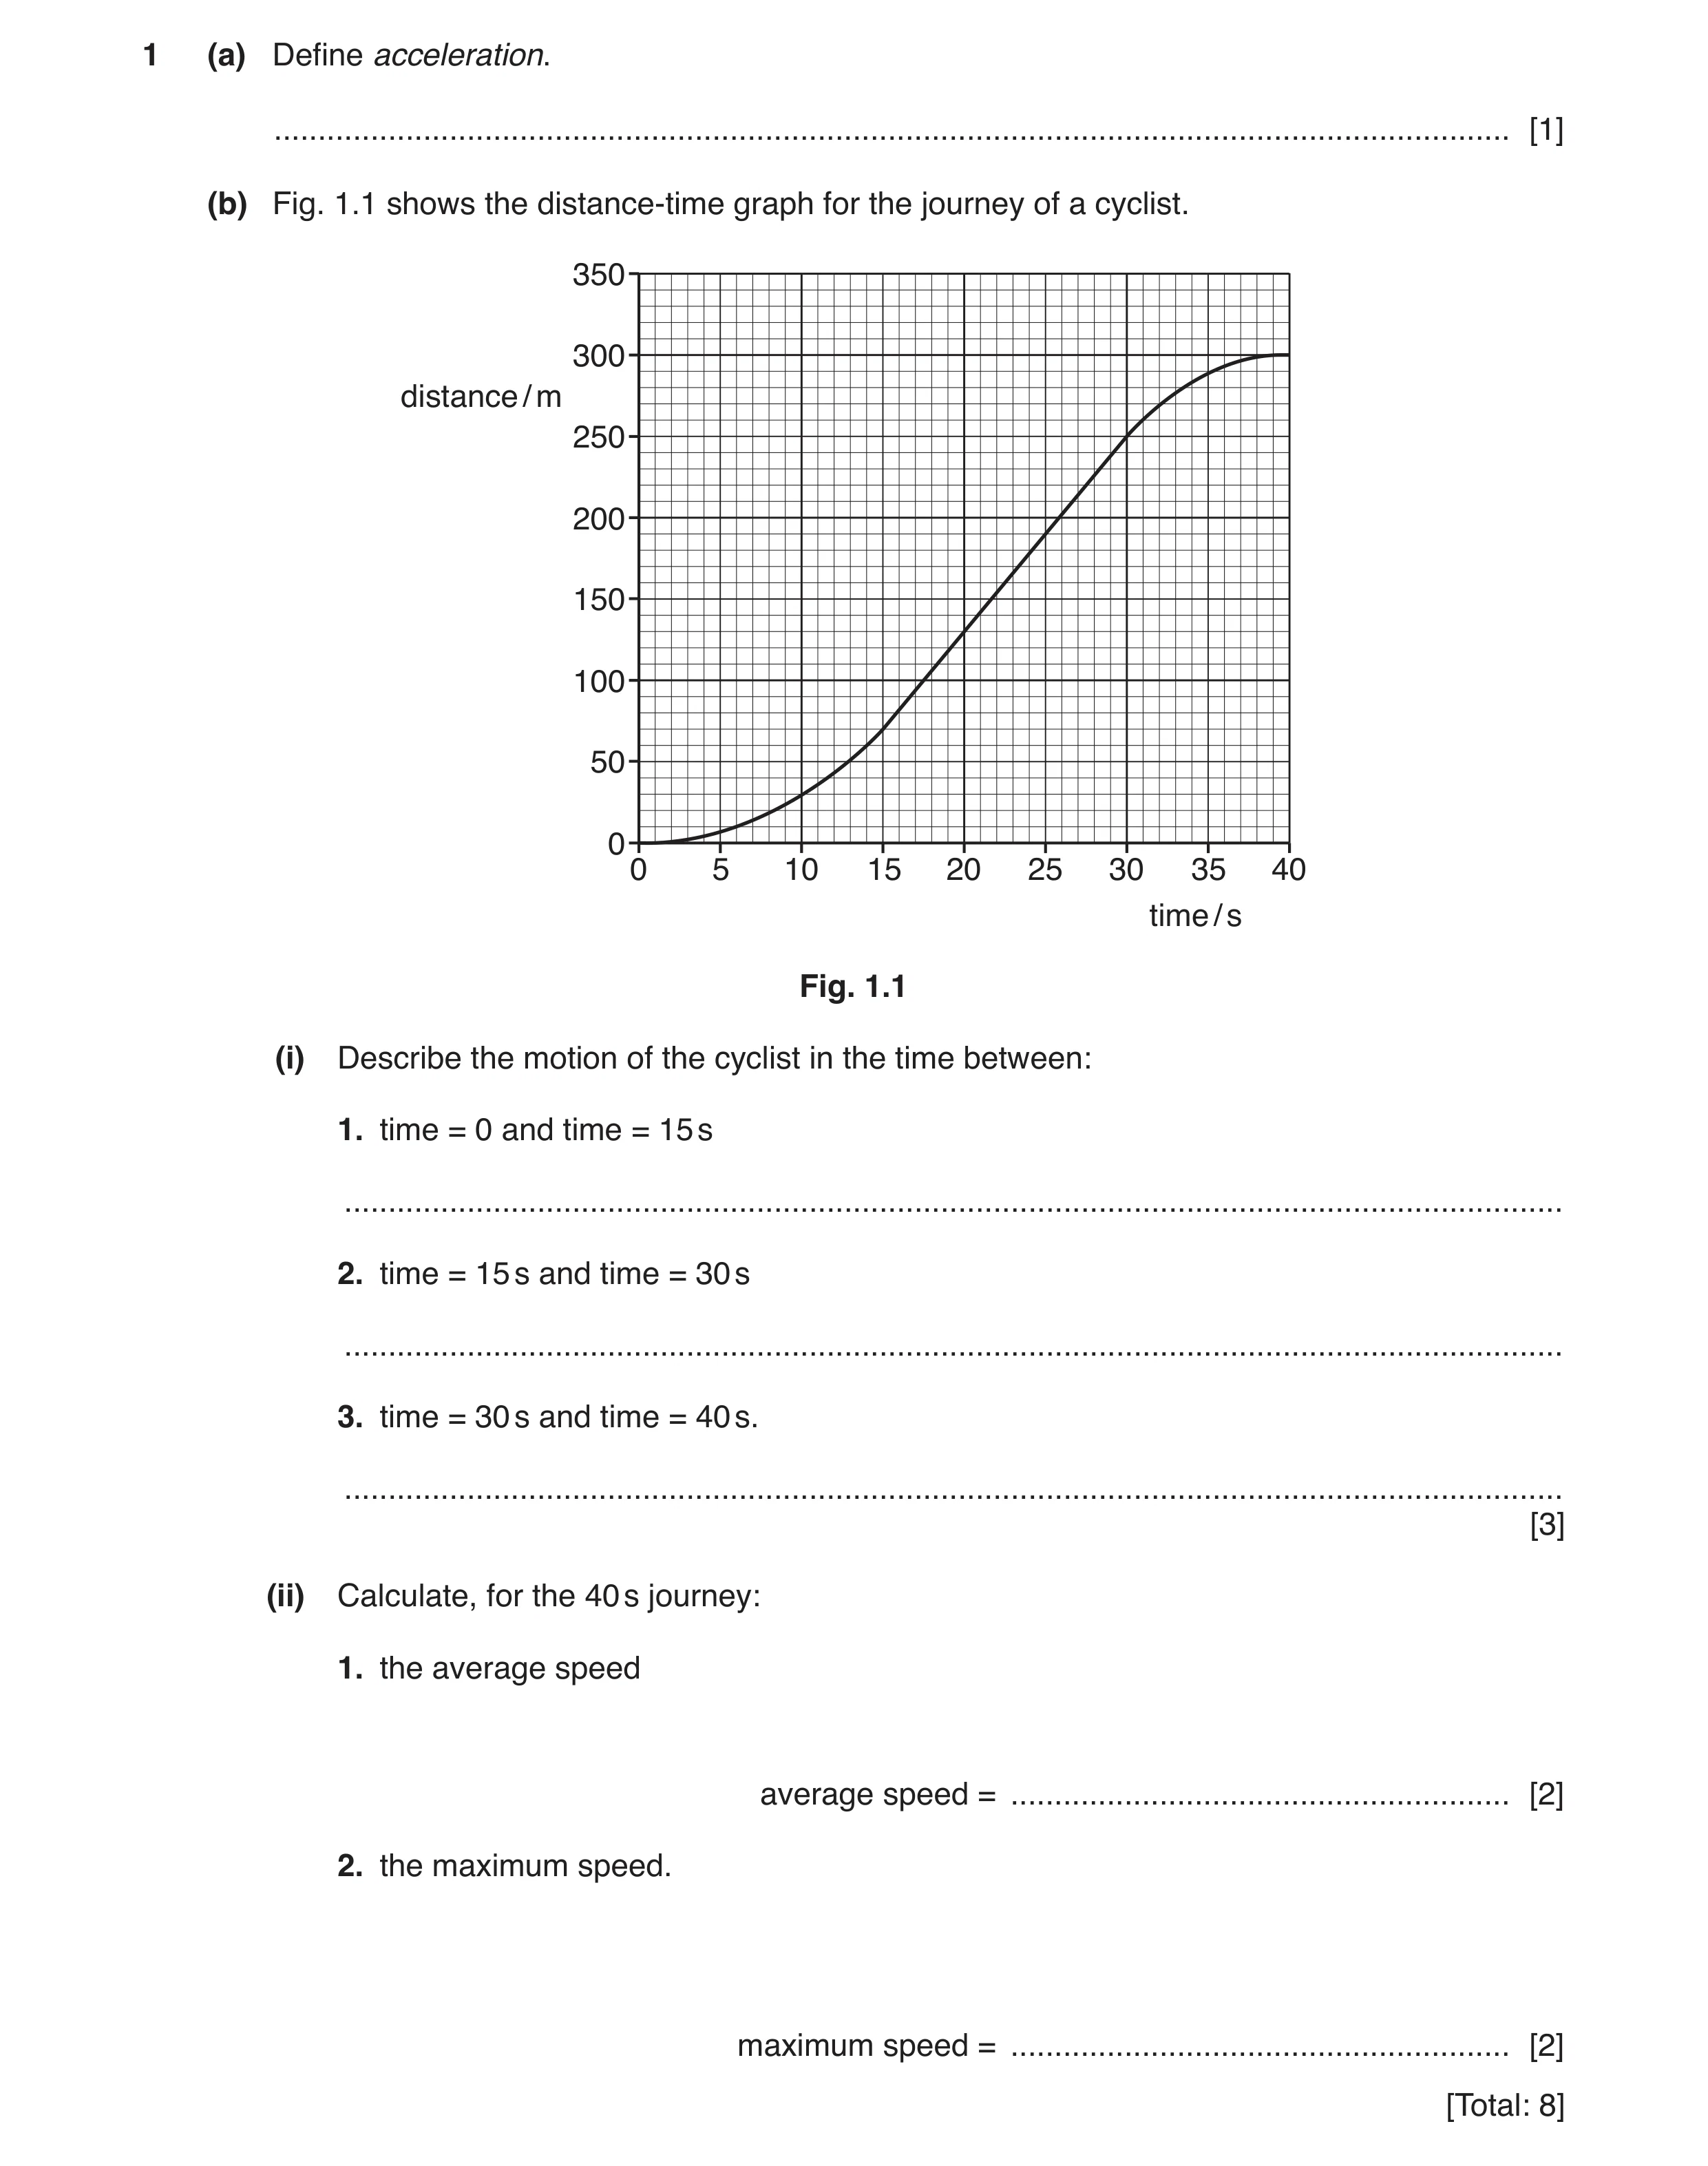 15 / 78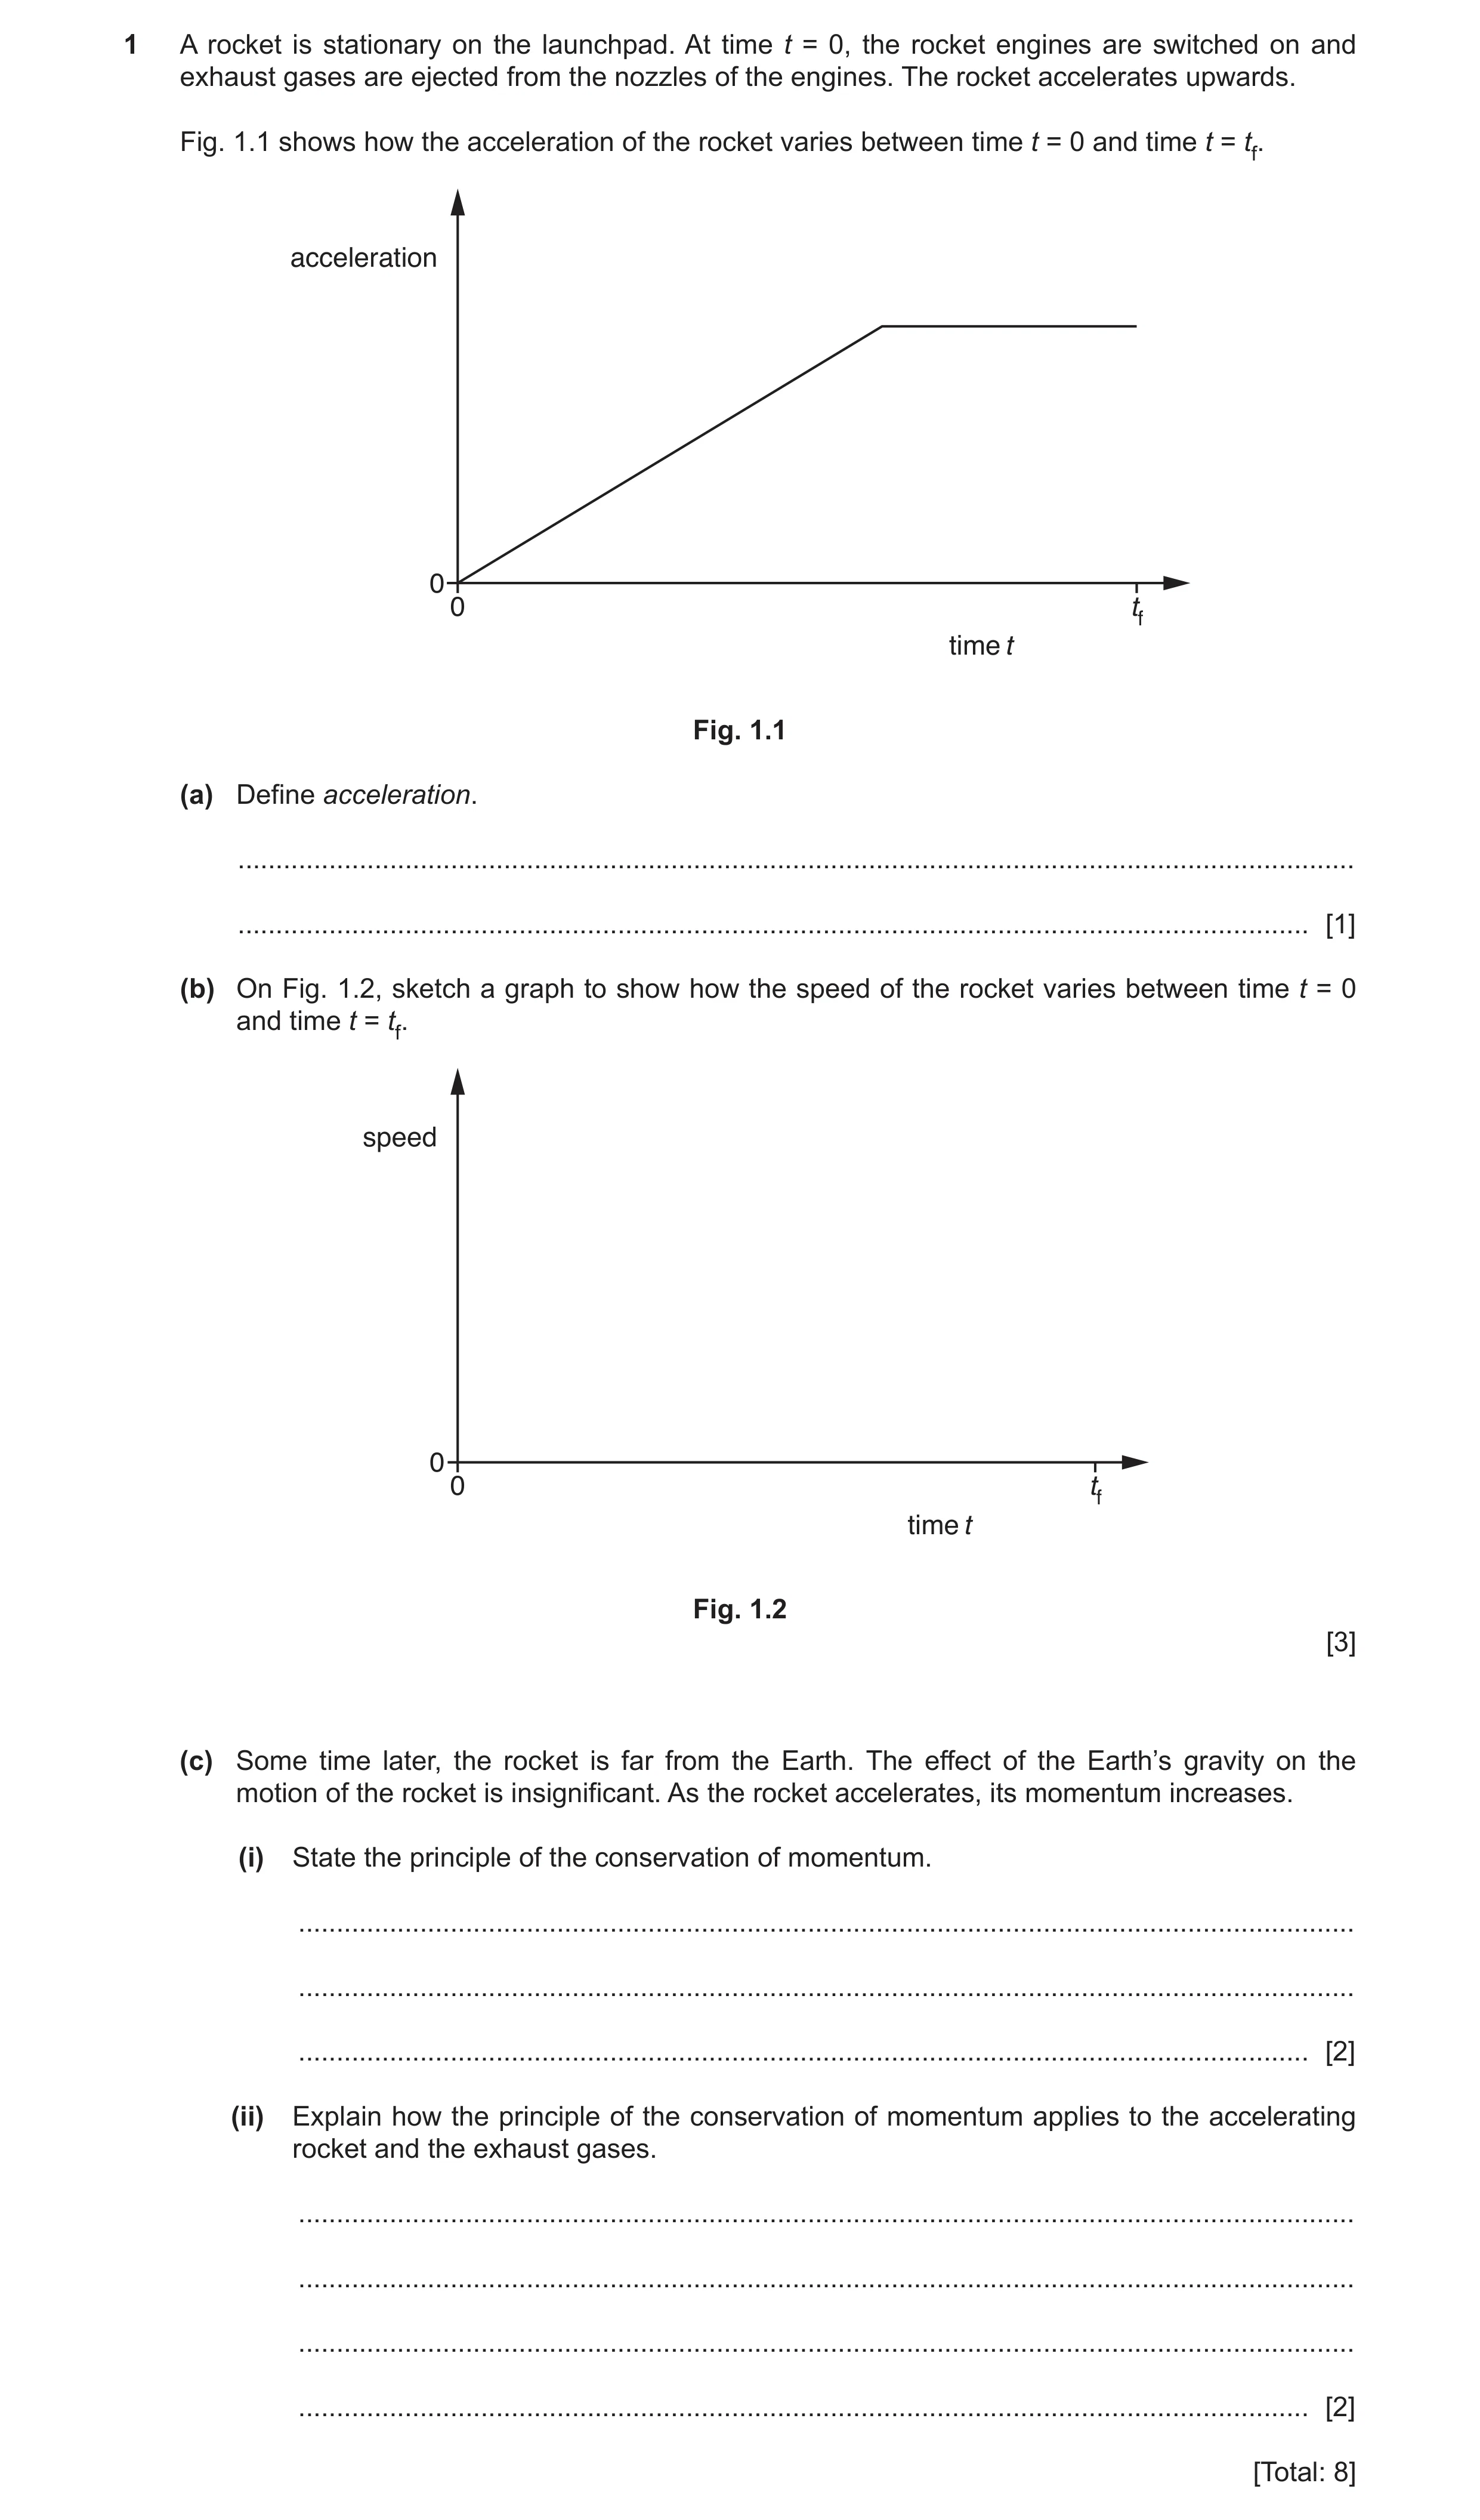
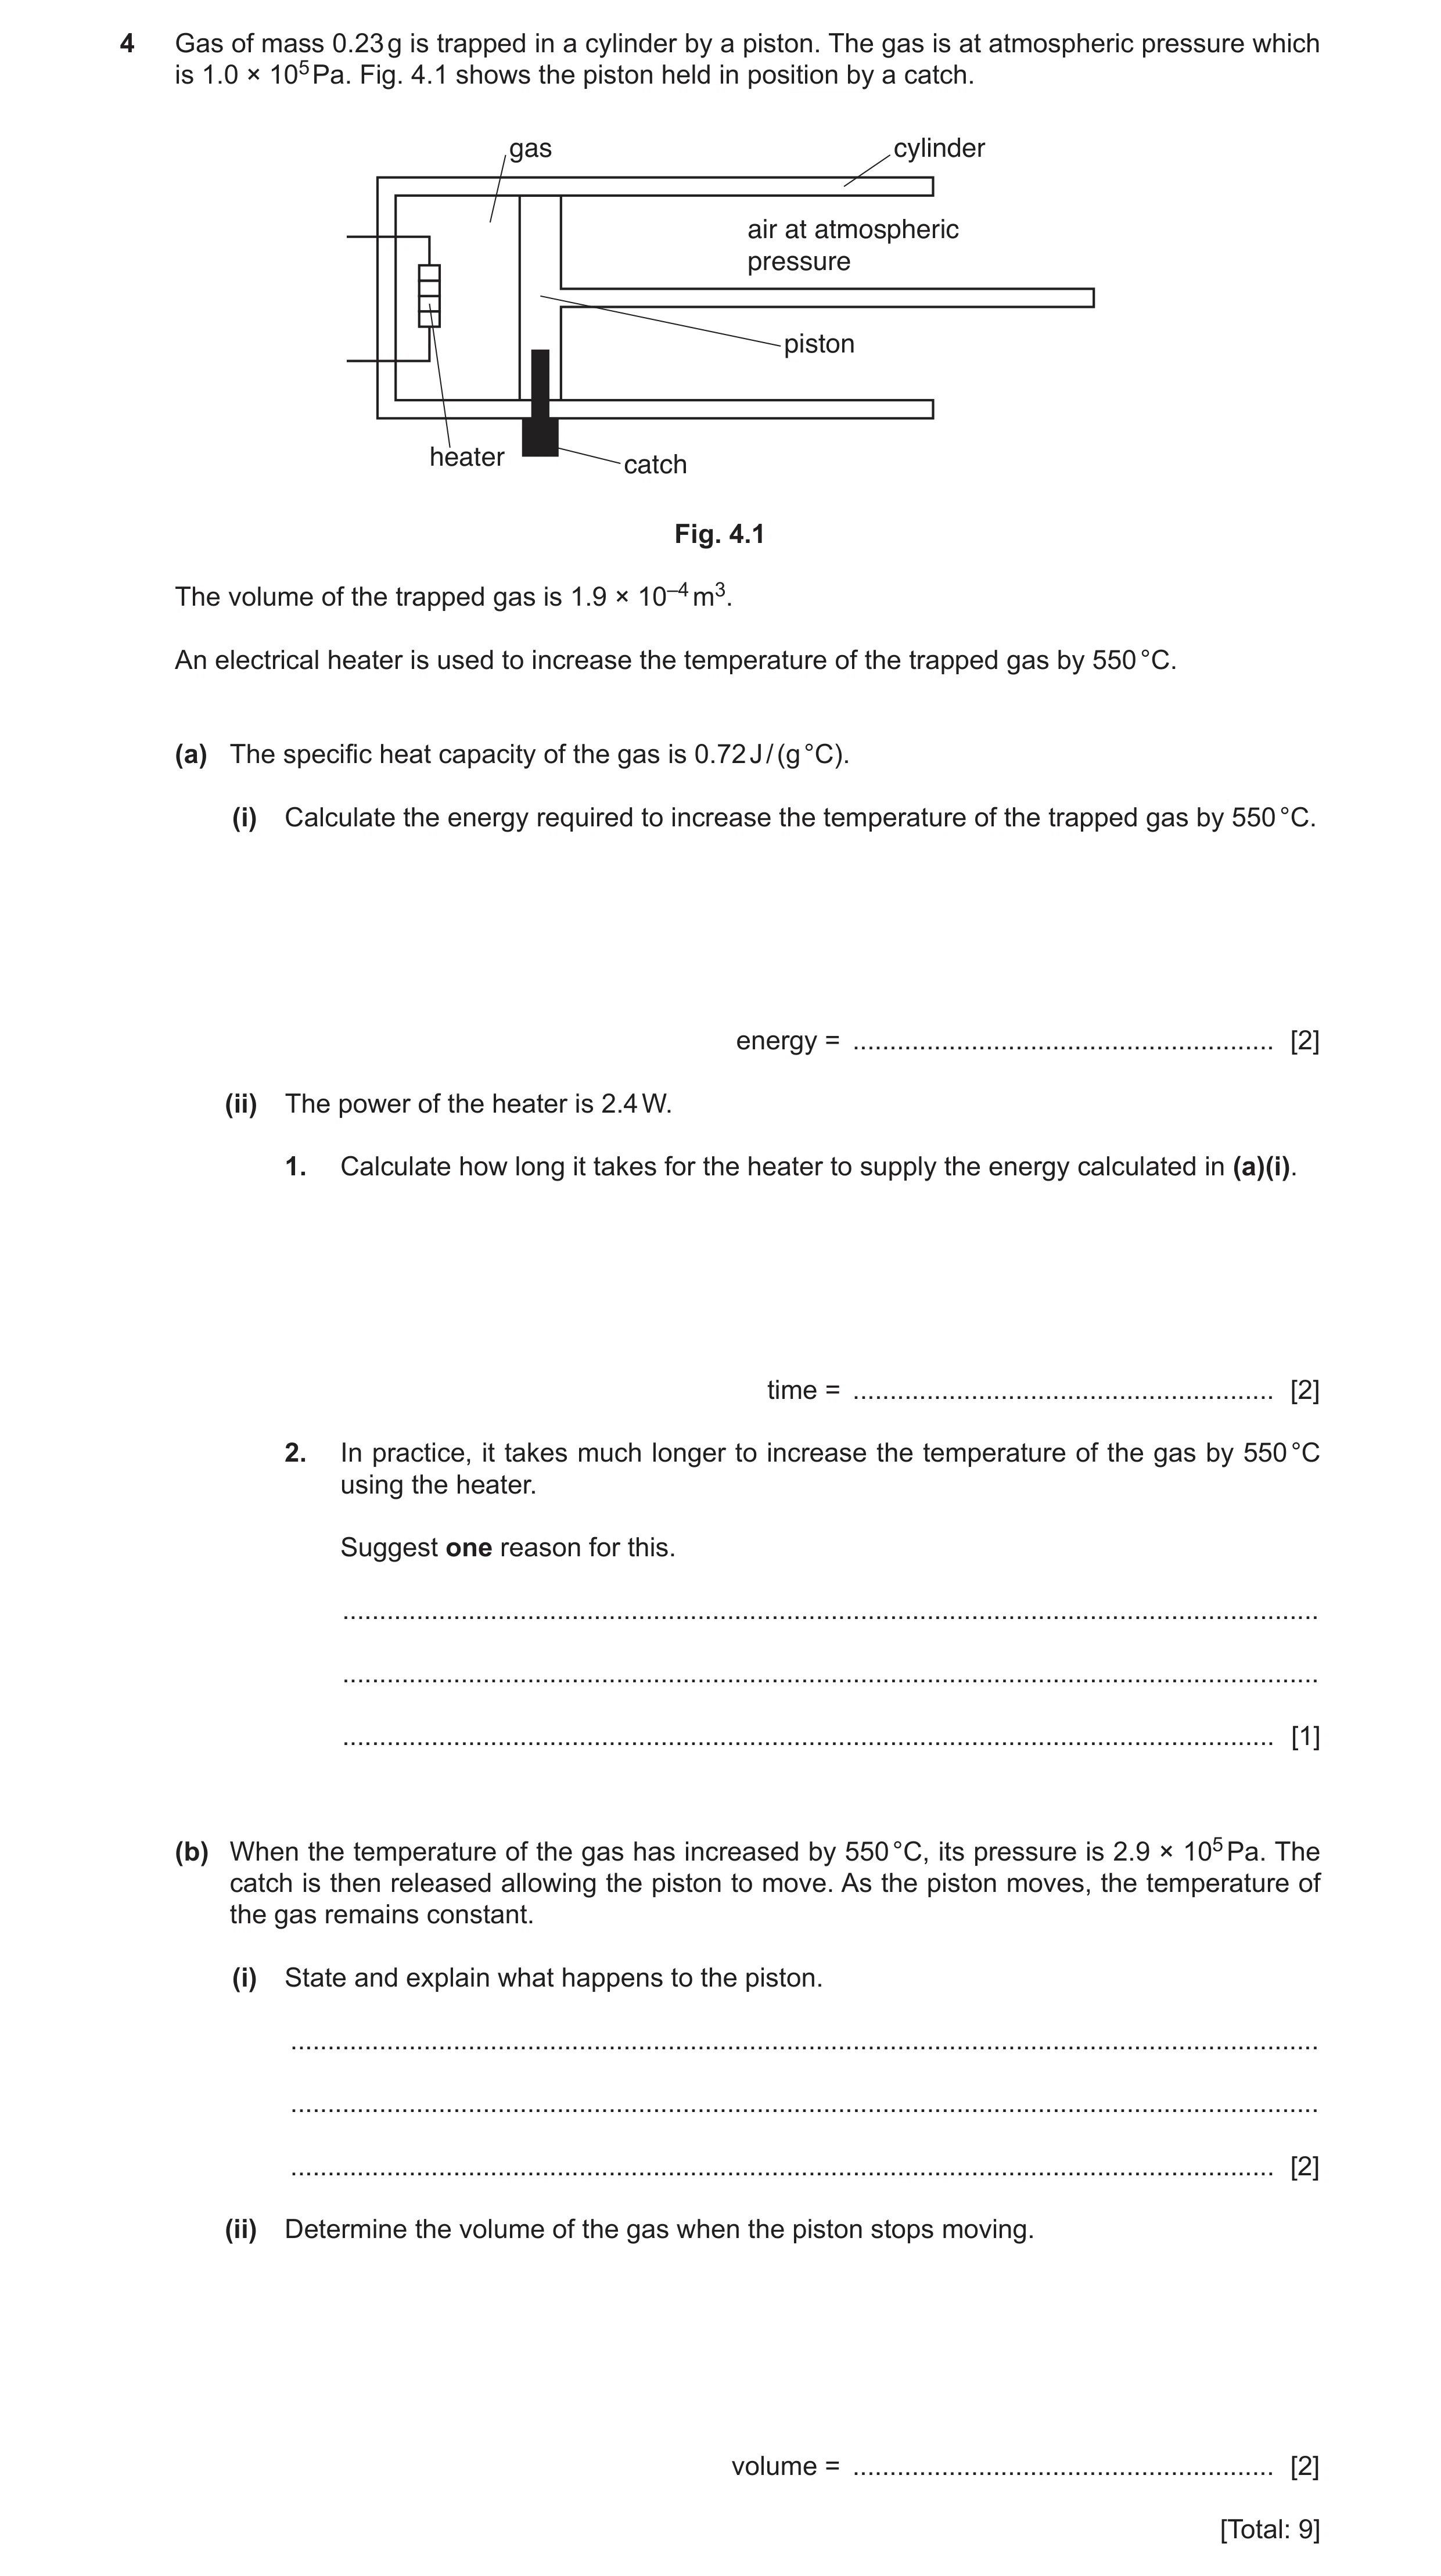
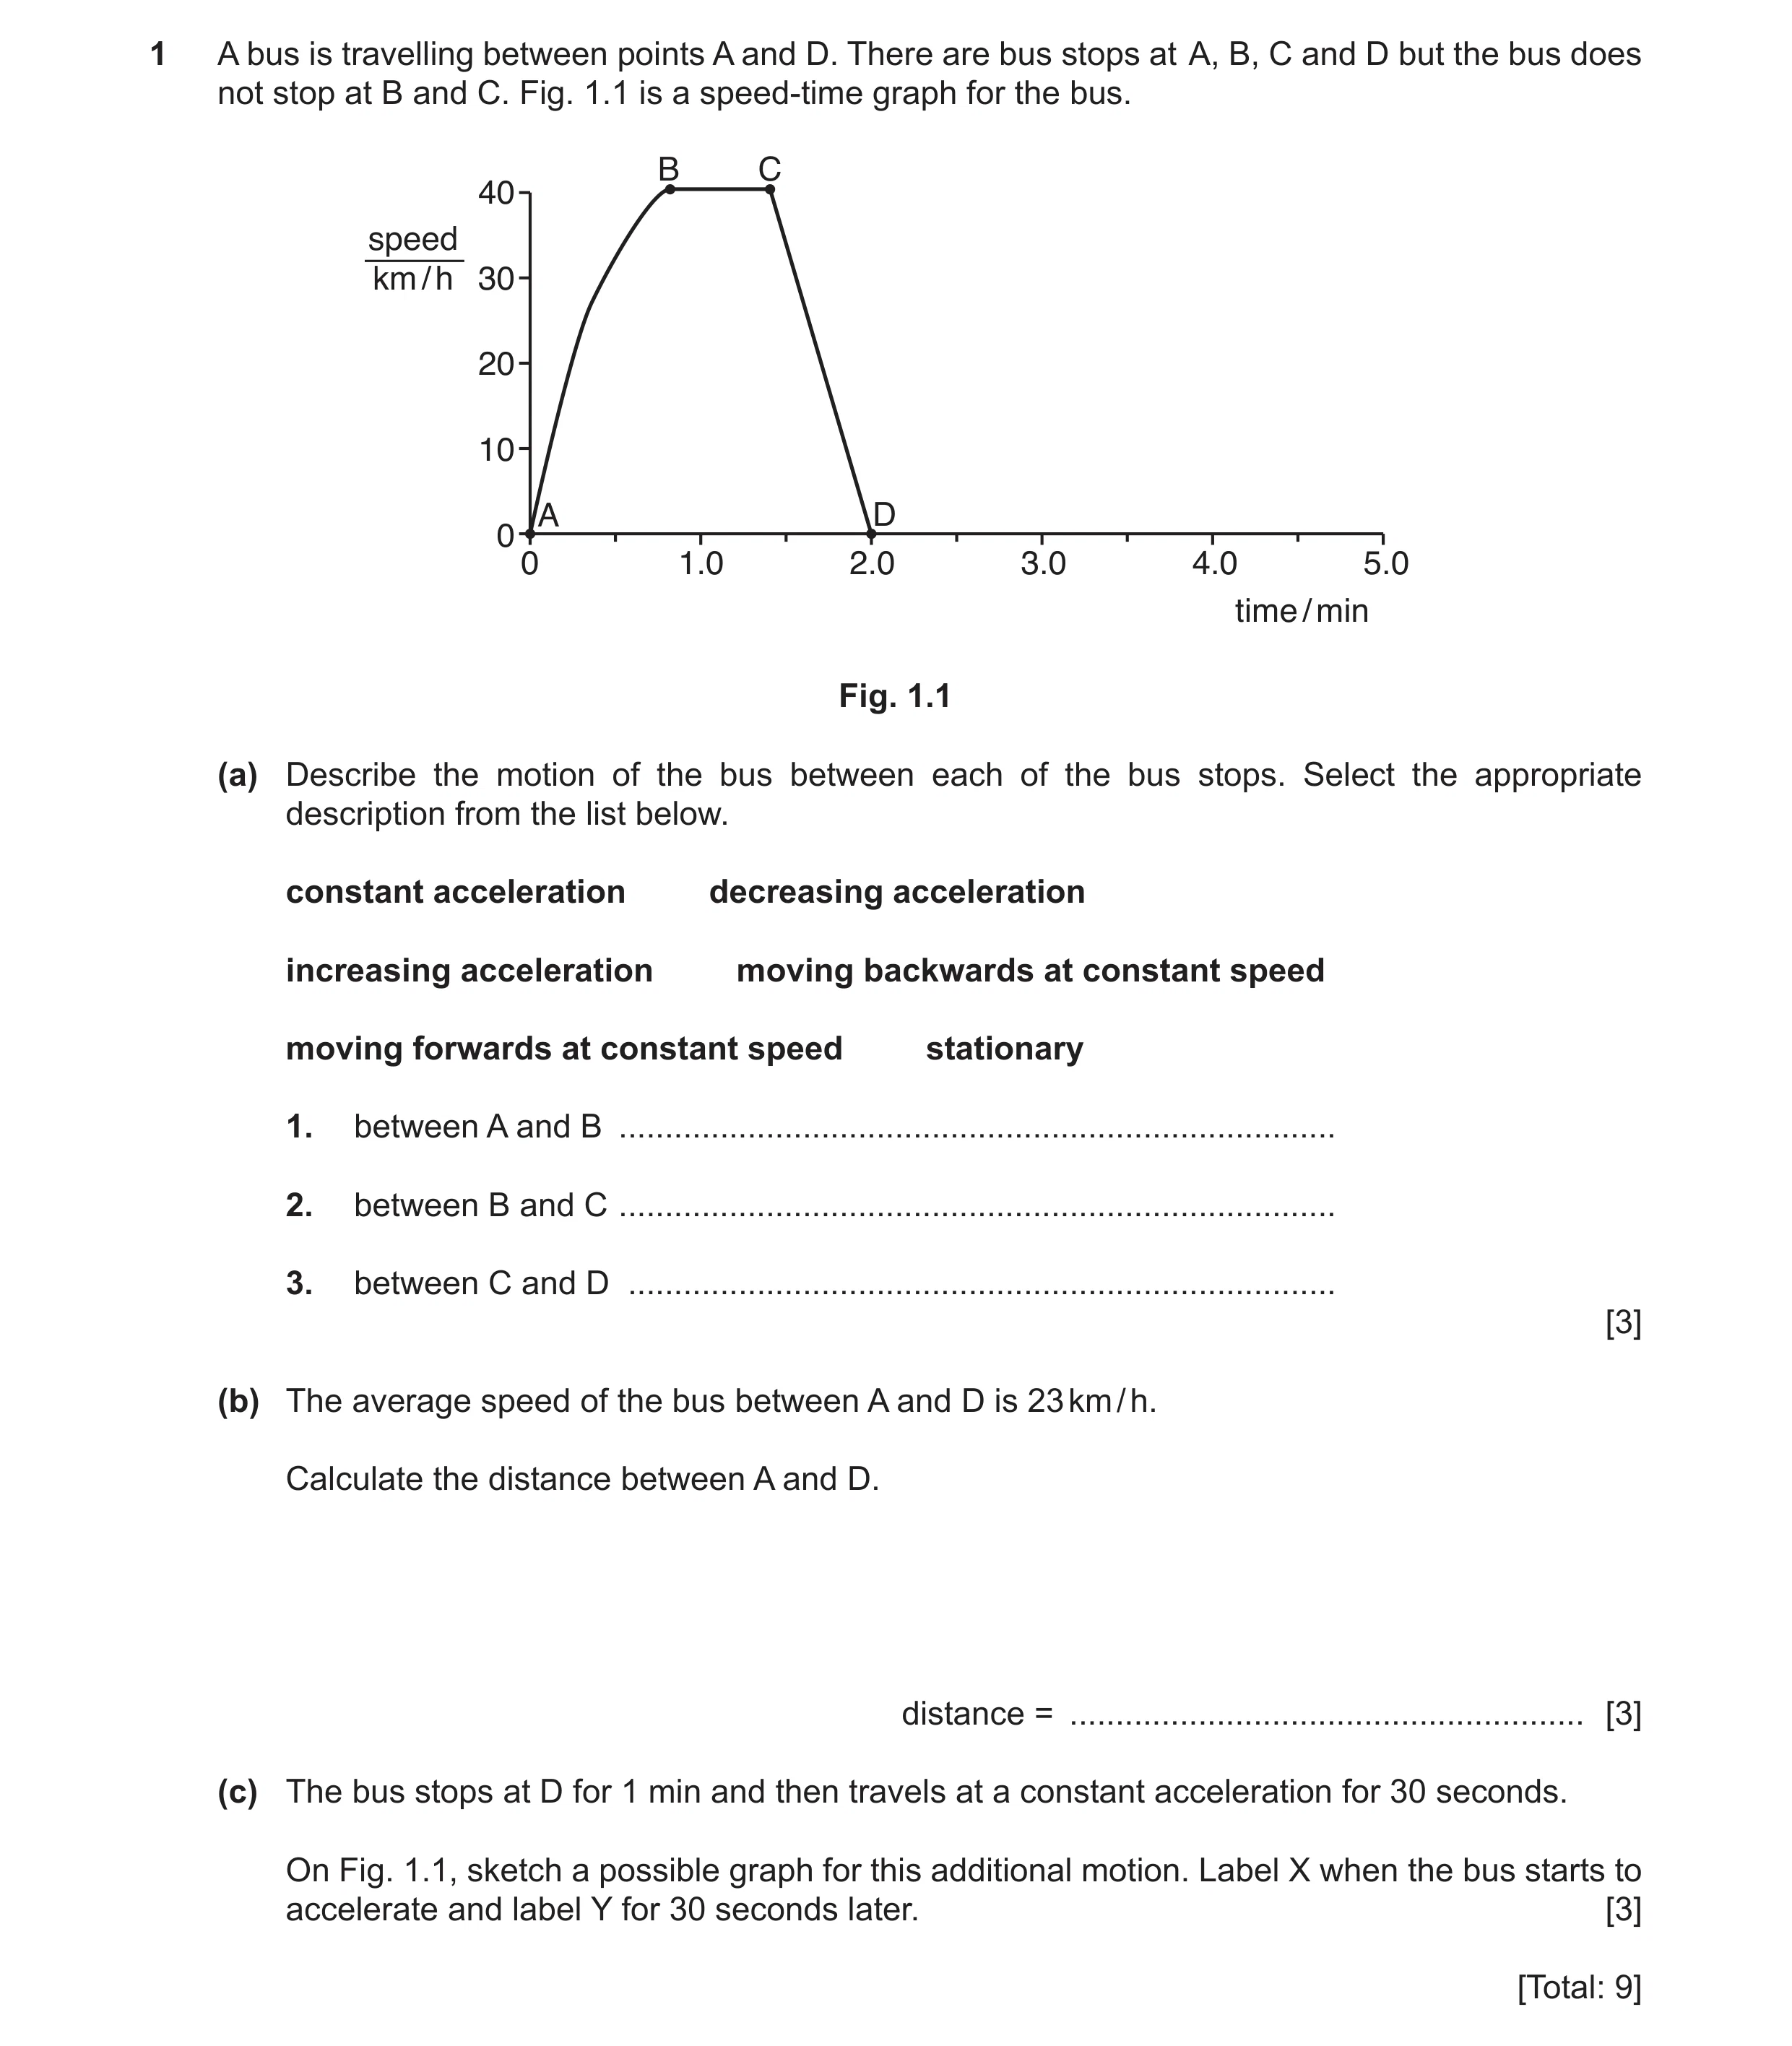 19 / 78
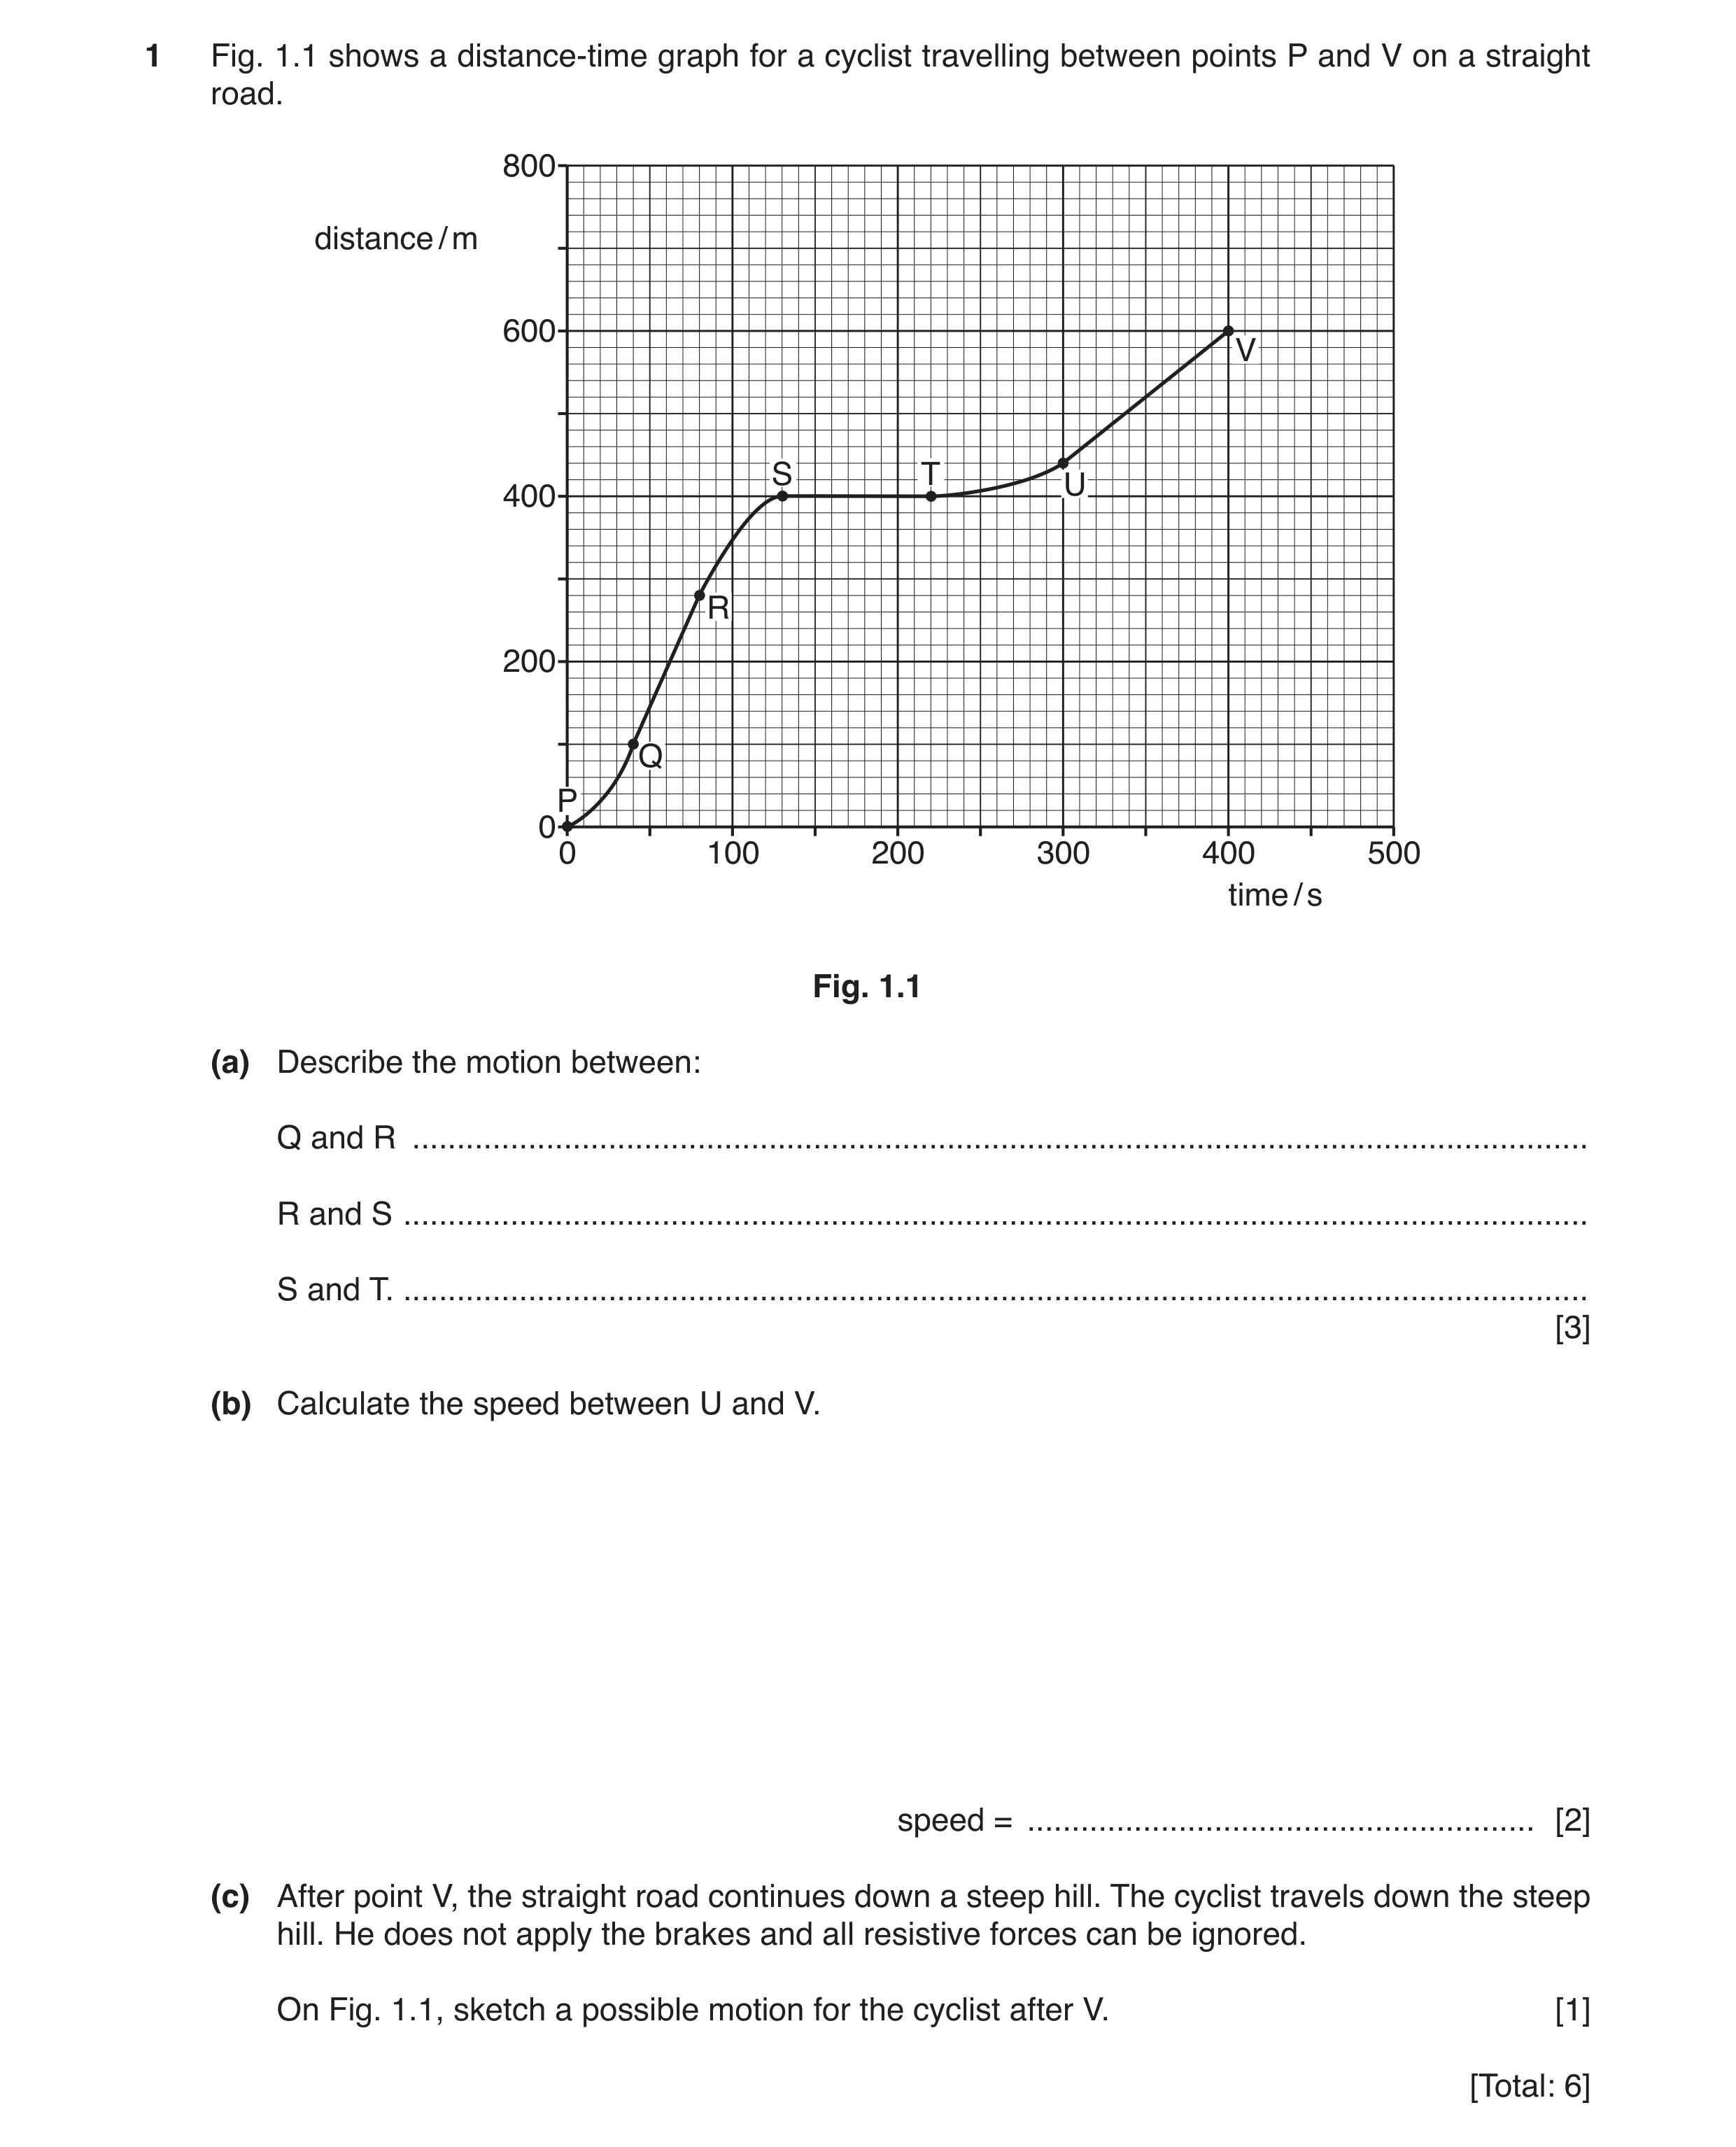 20 / 78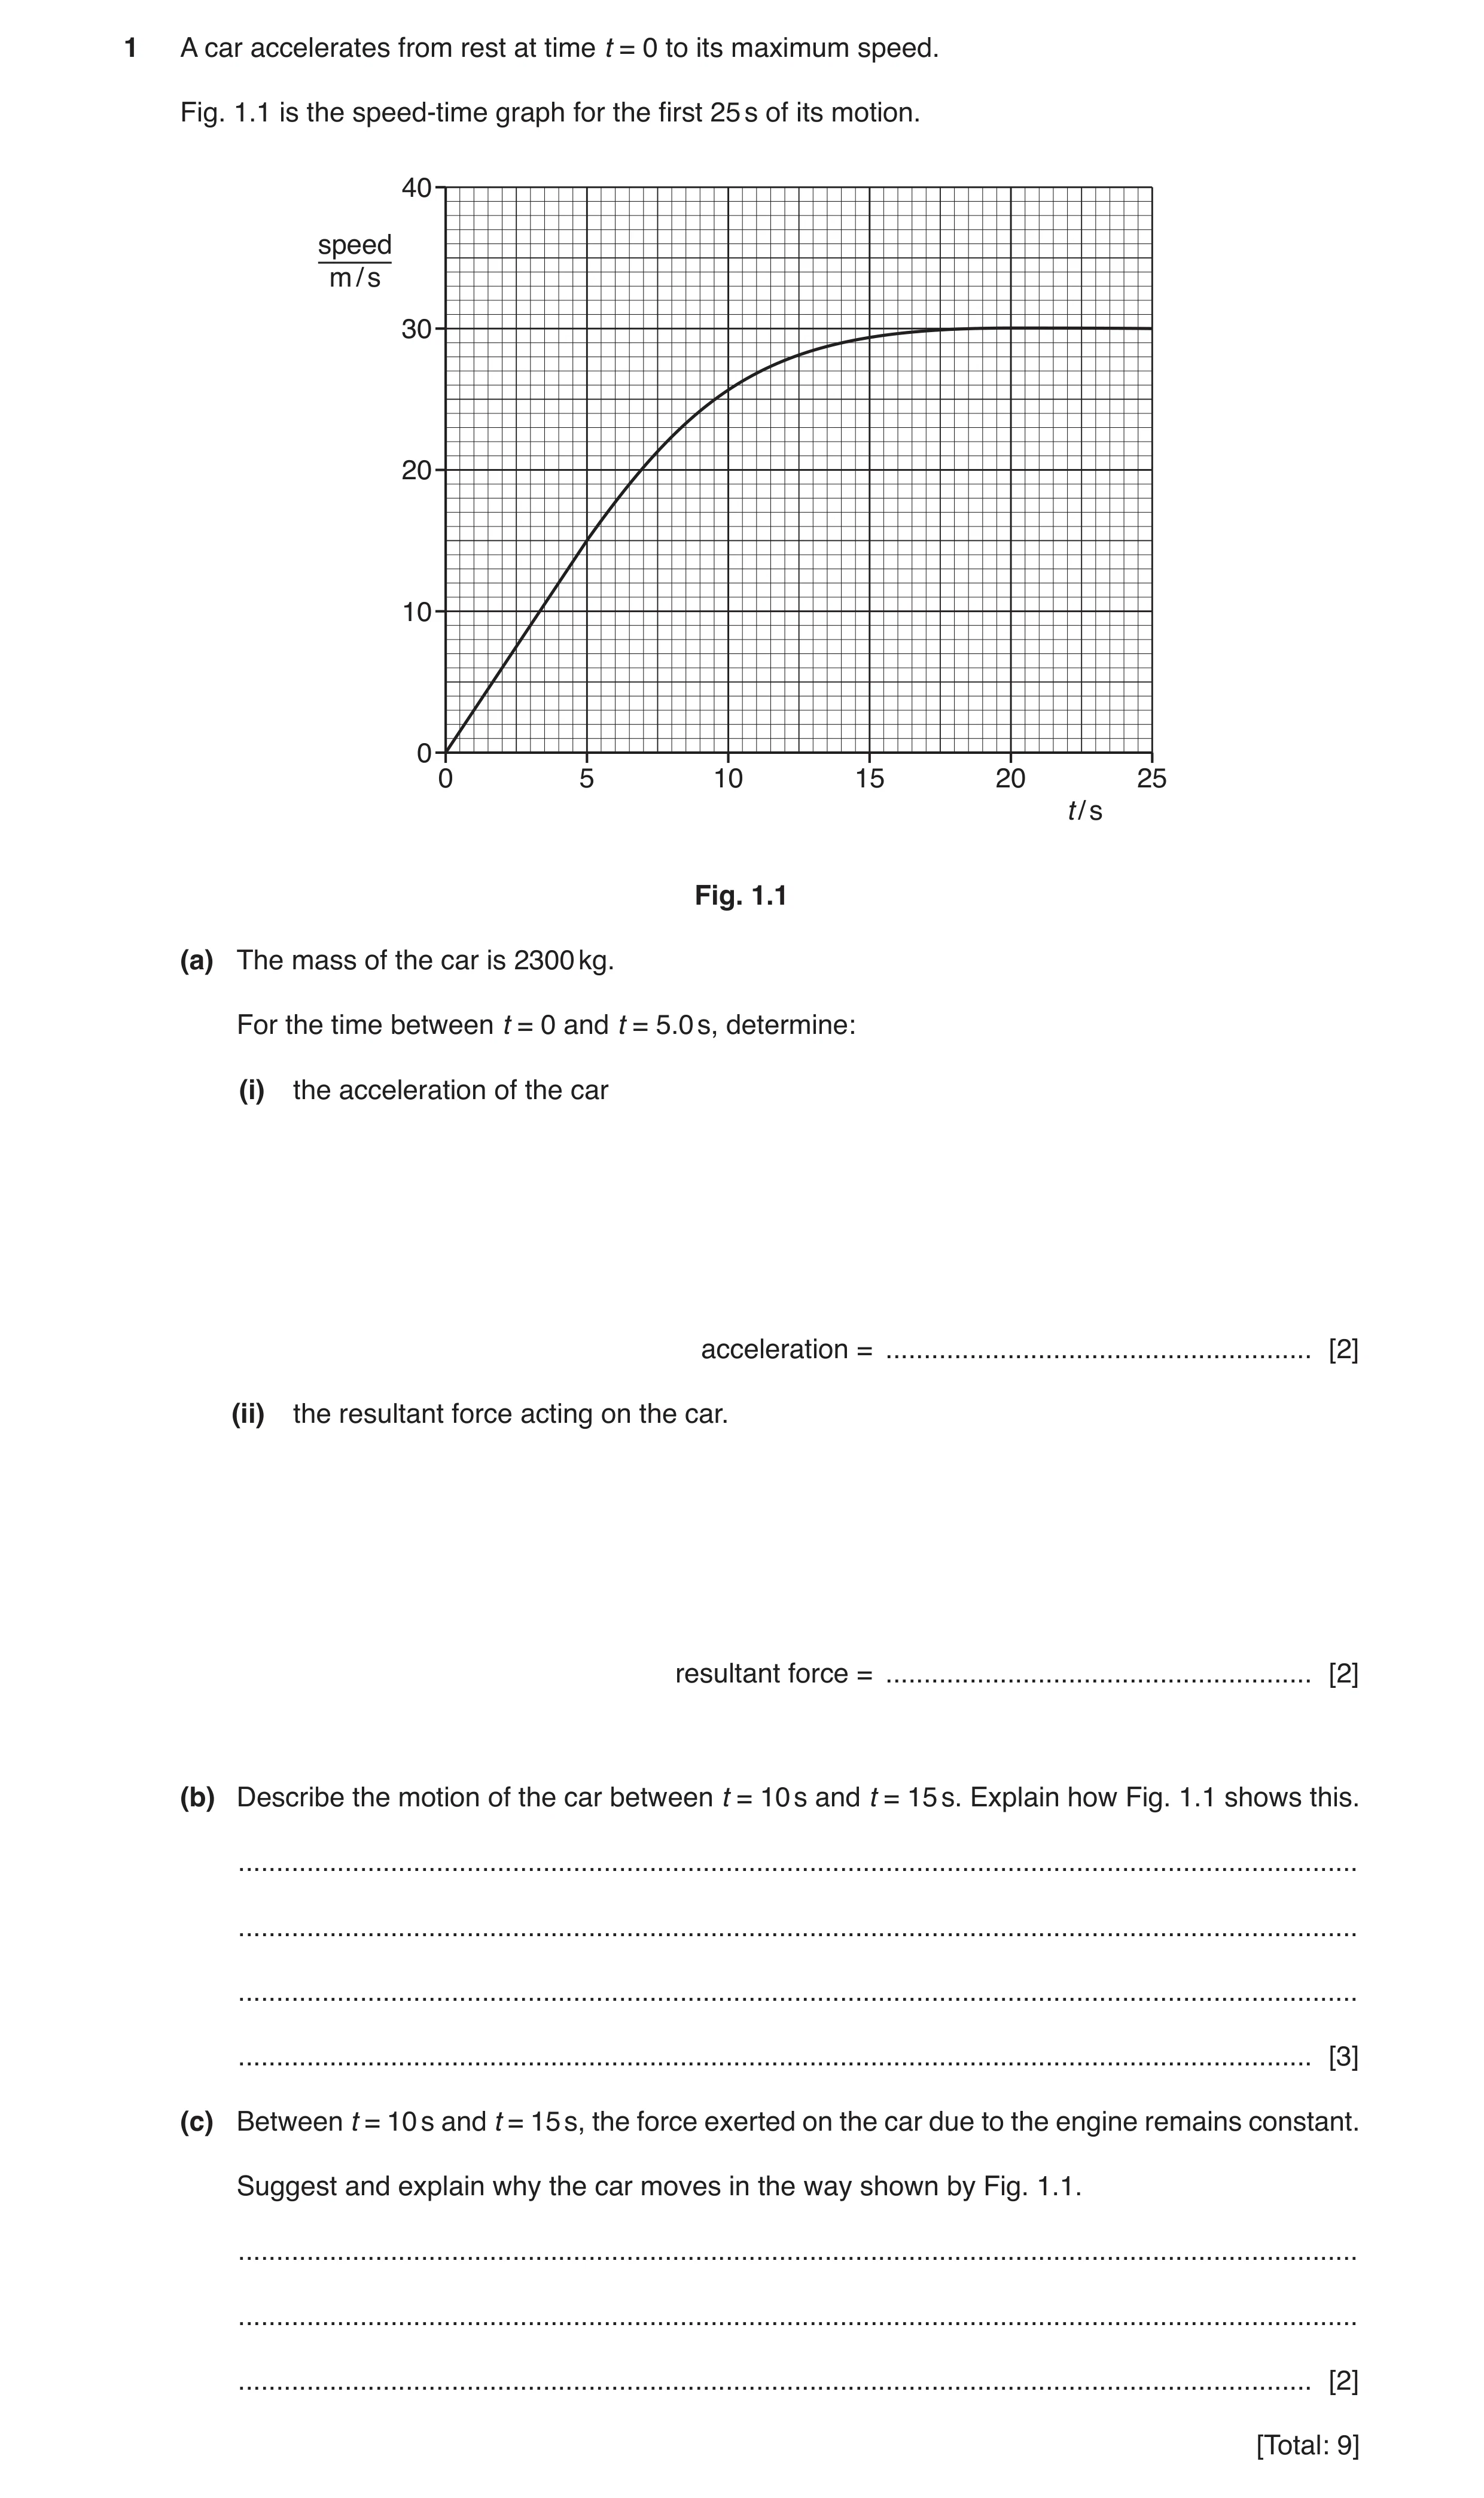
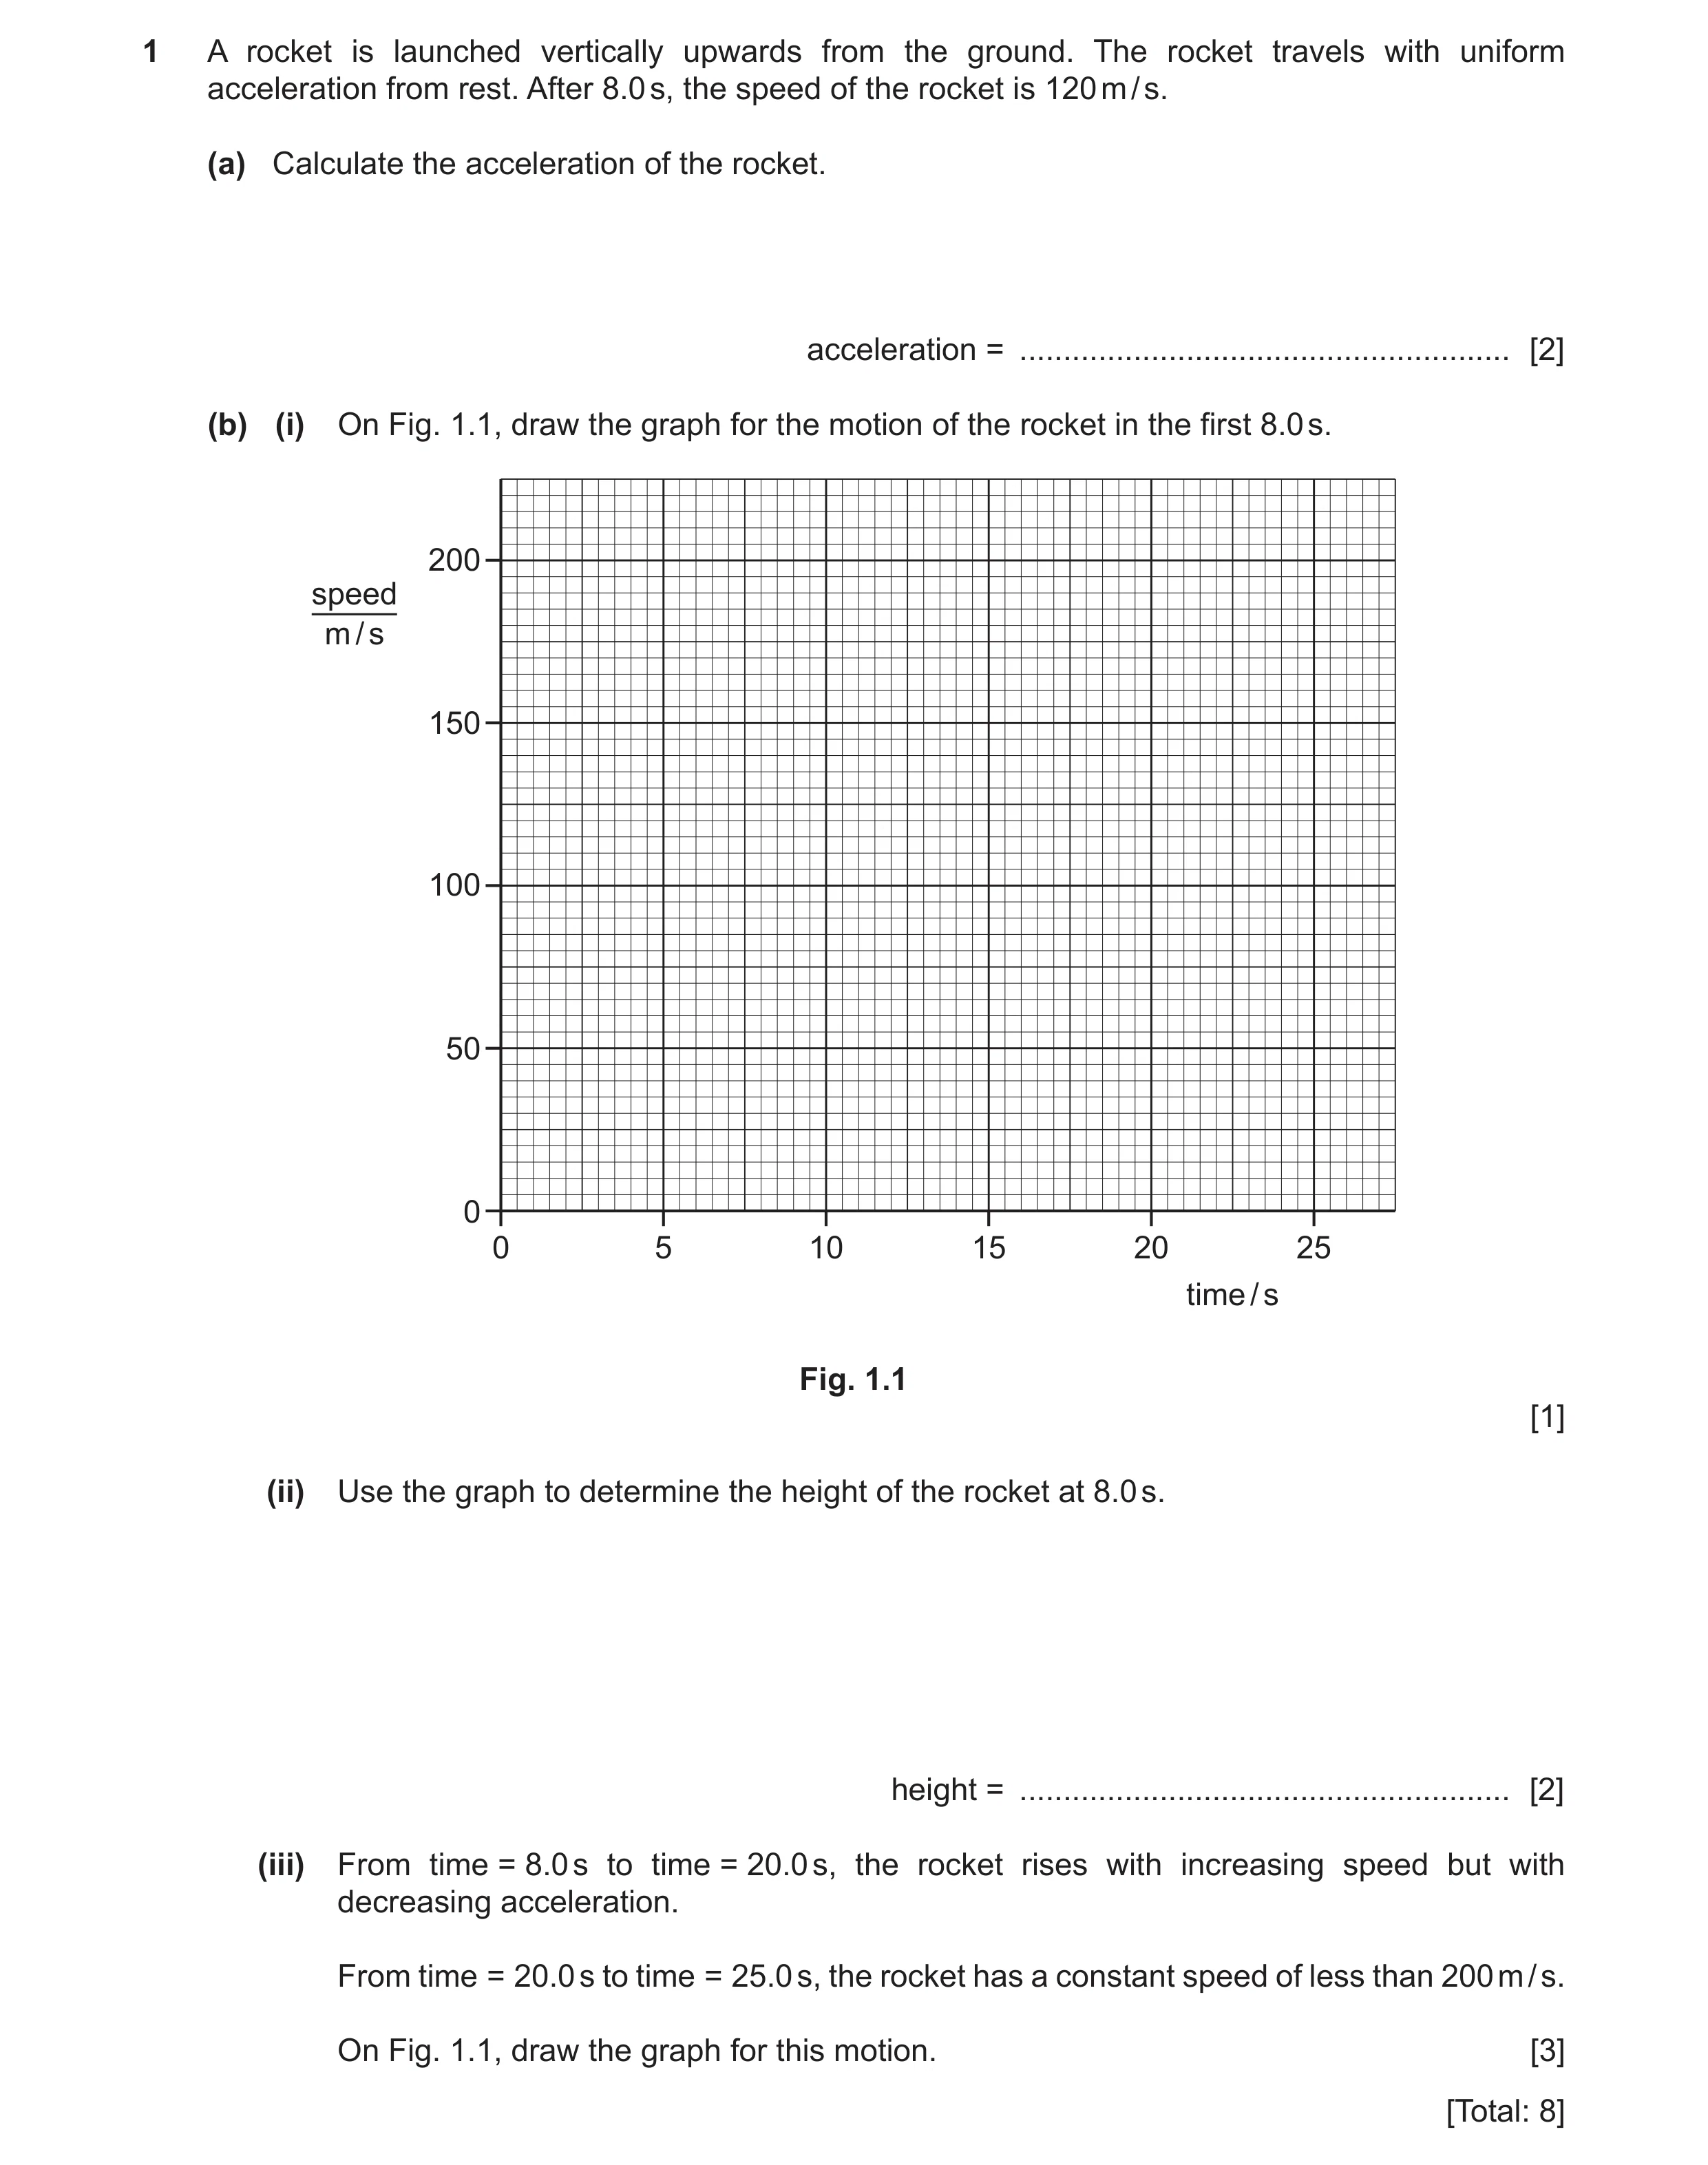 23 / 78
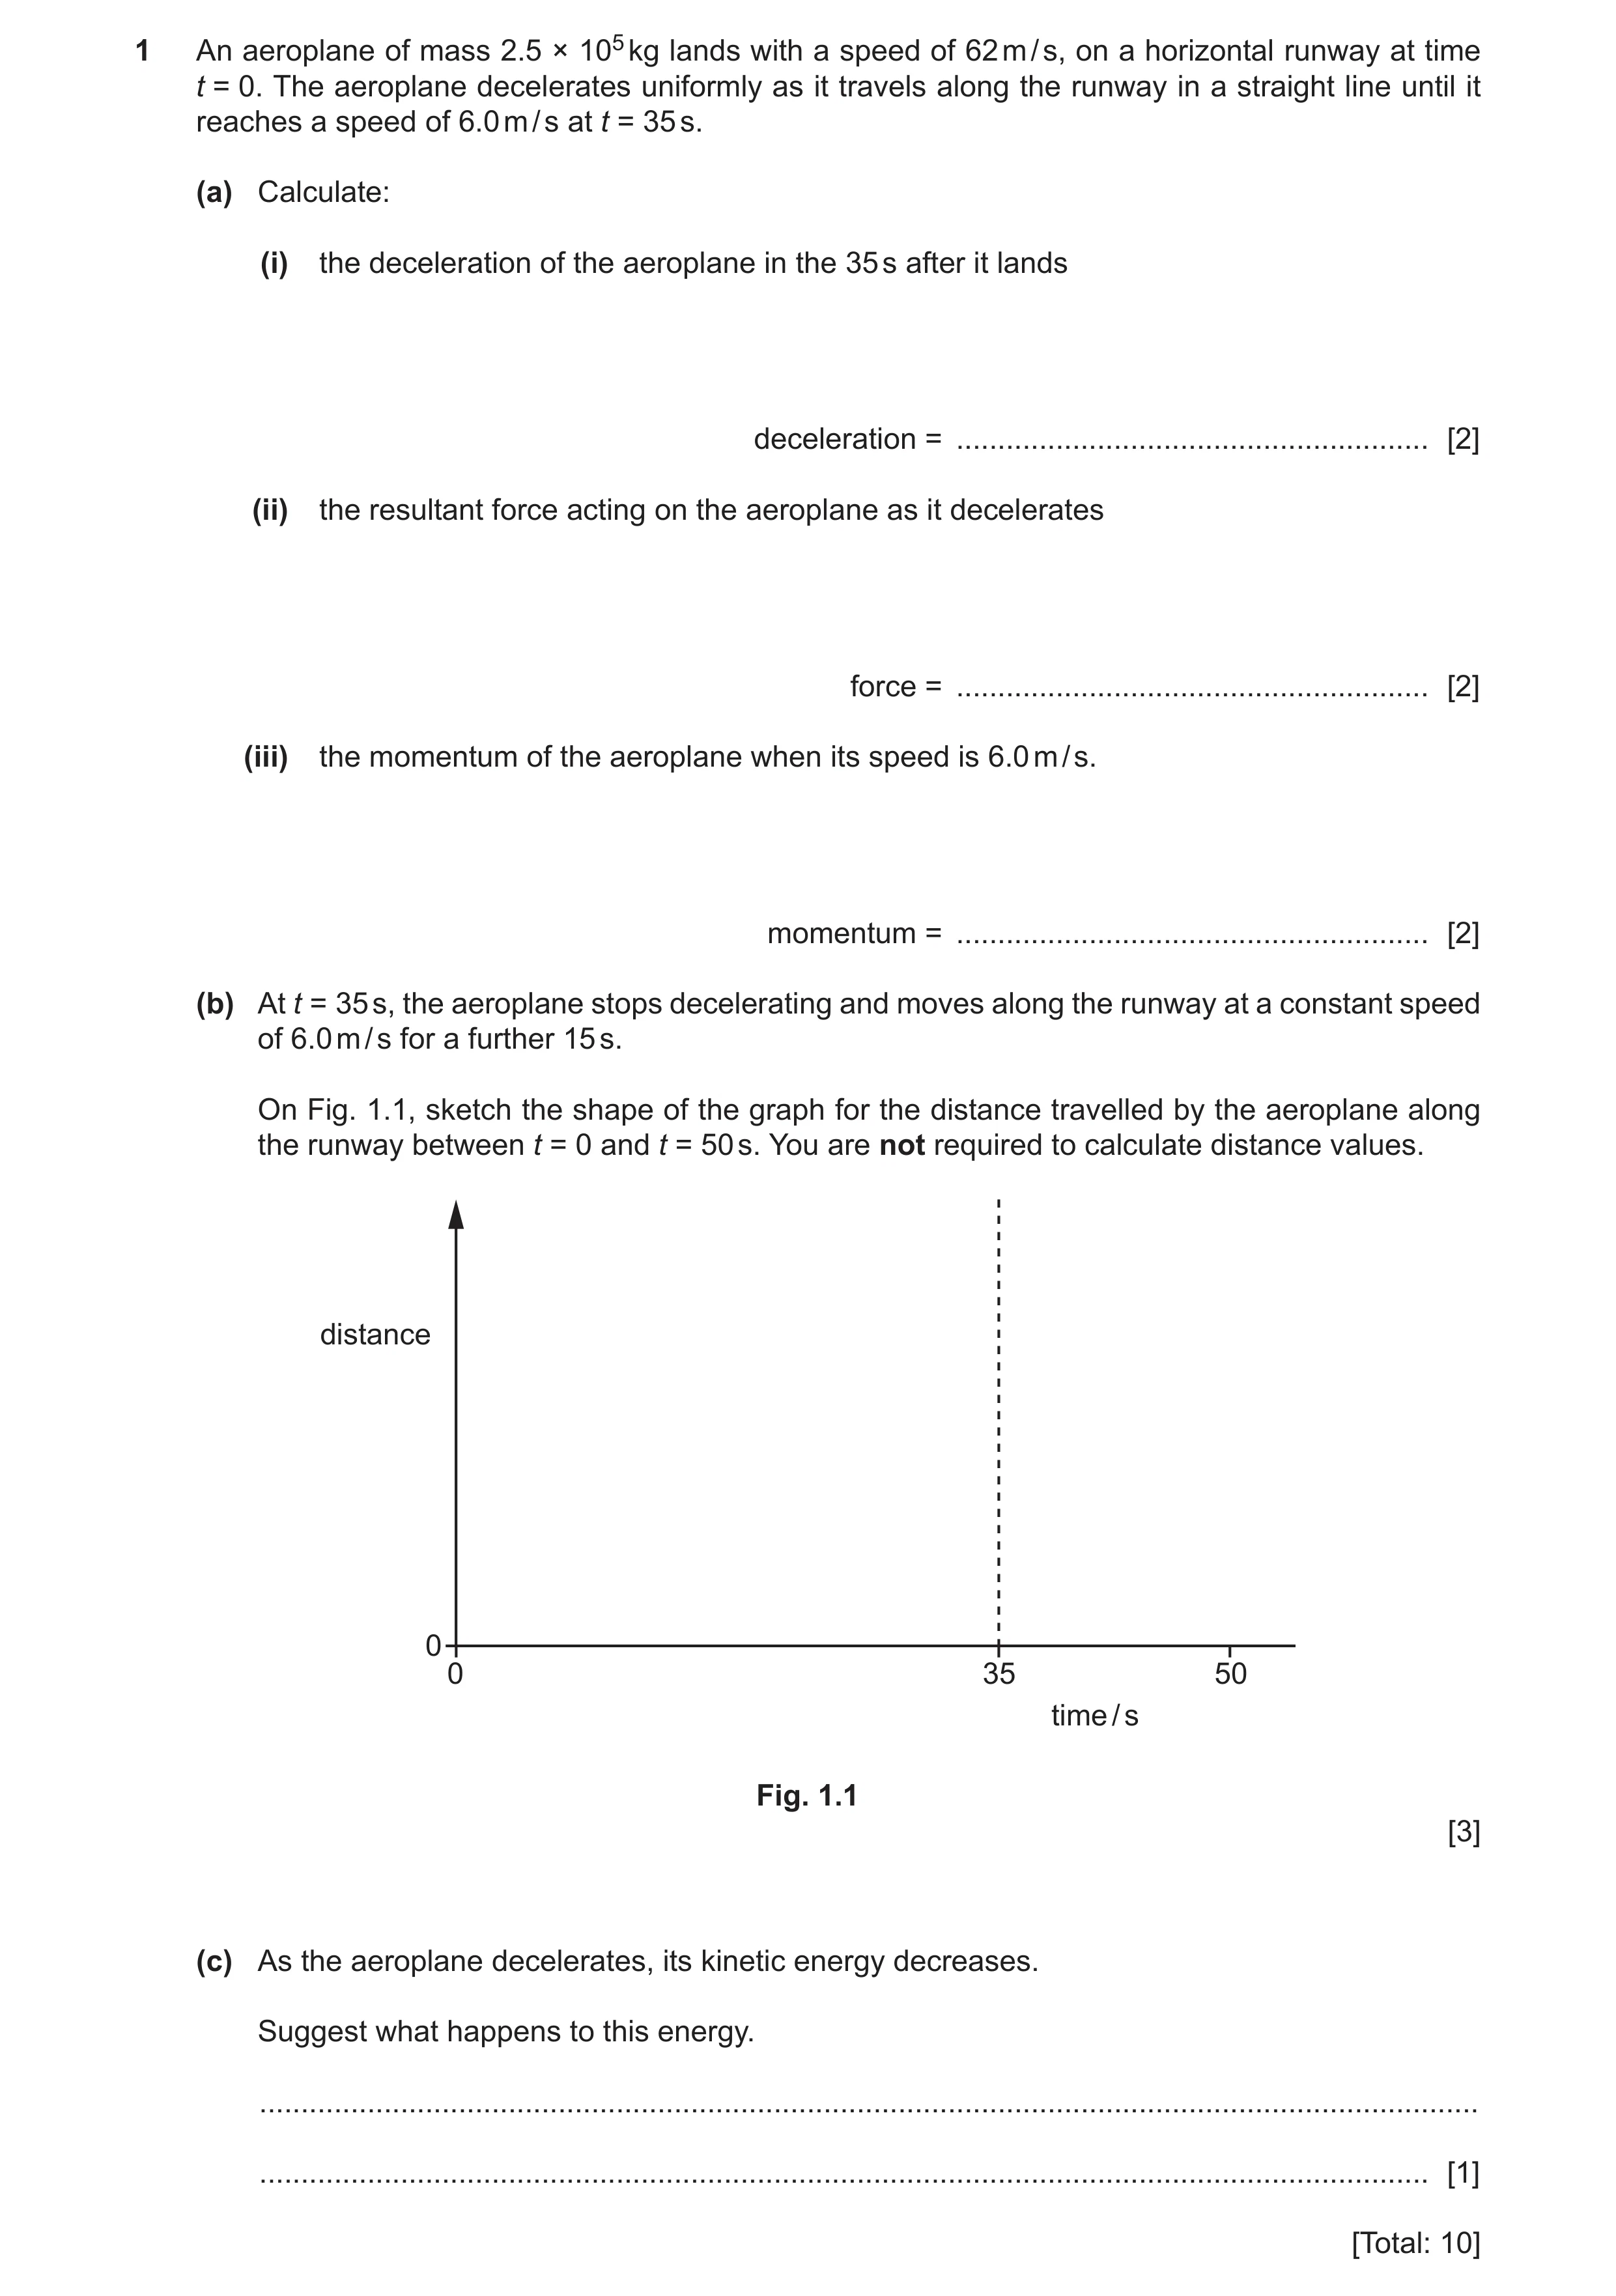 24 / 78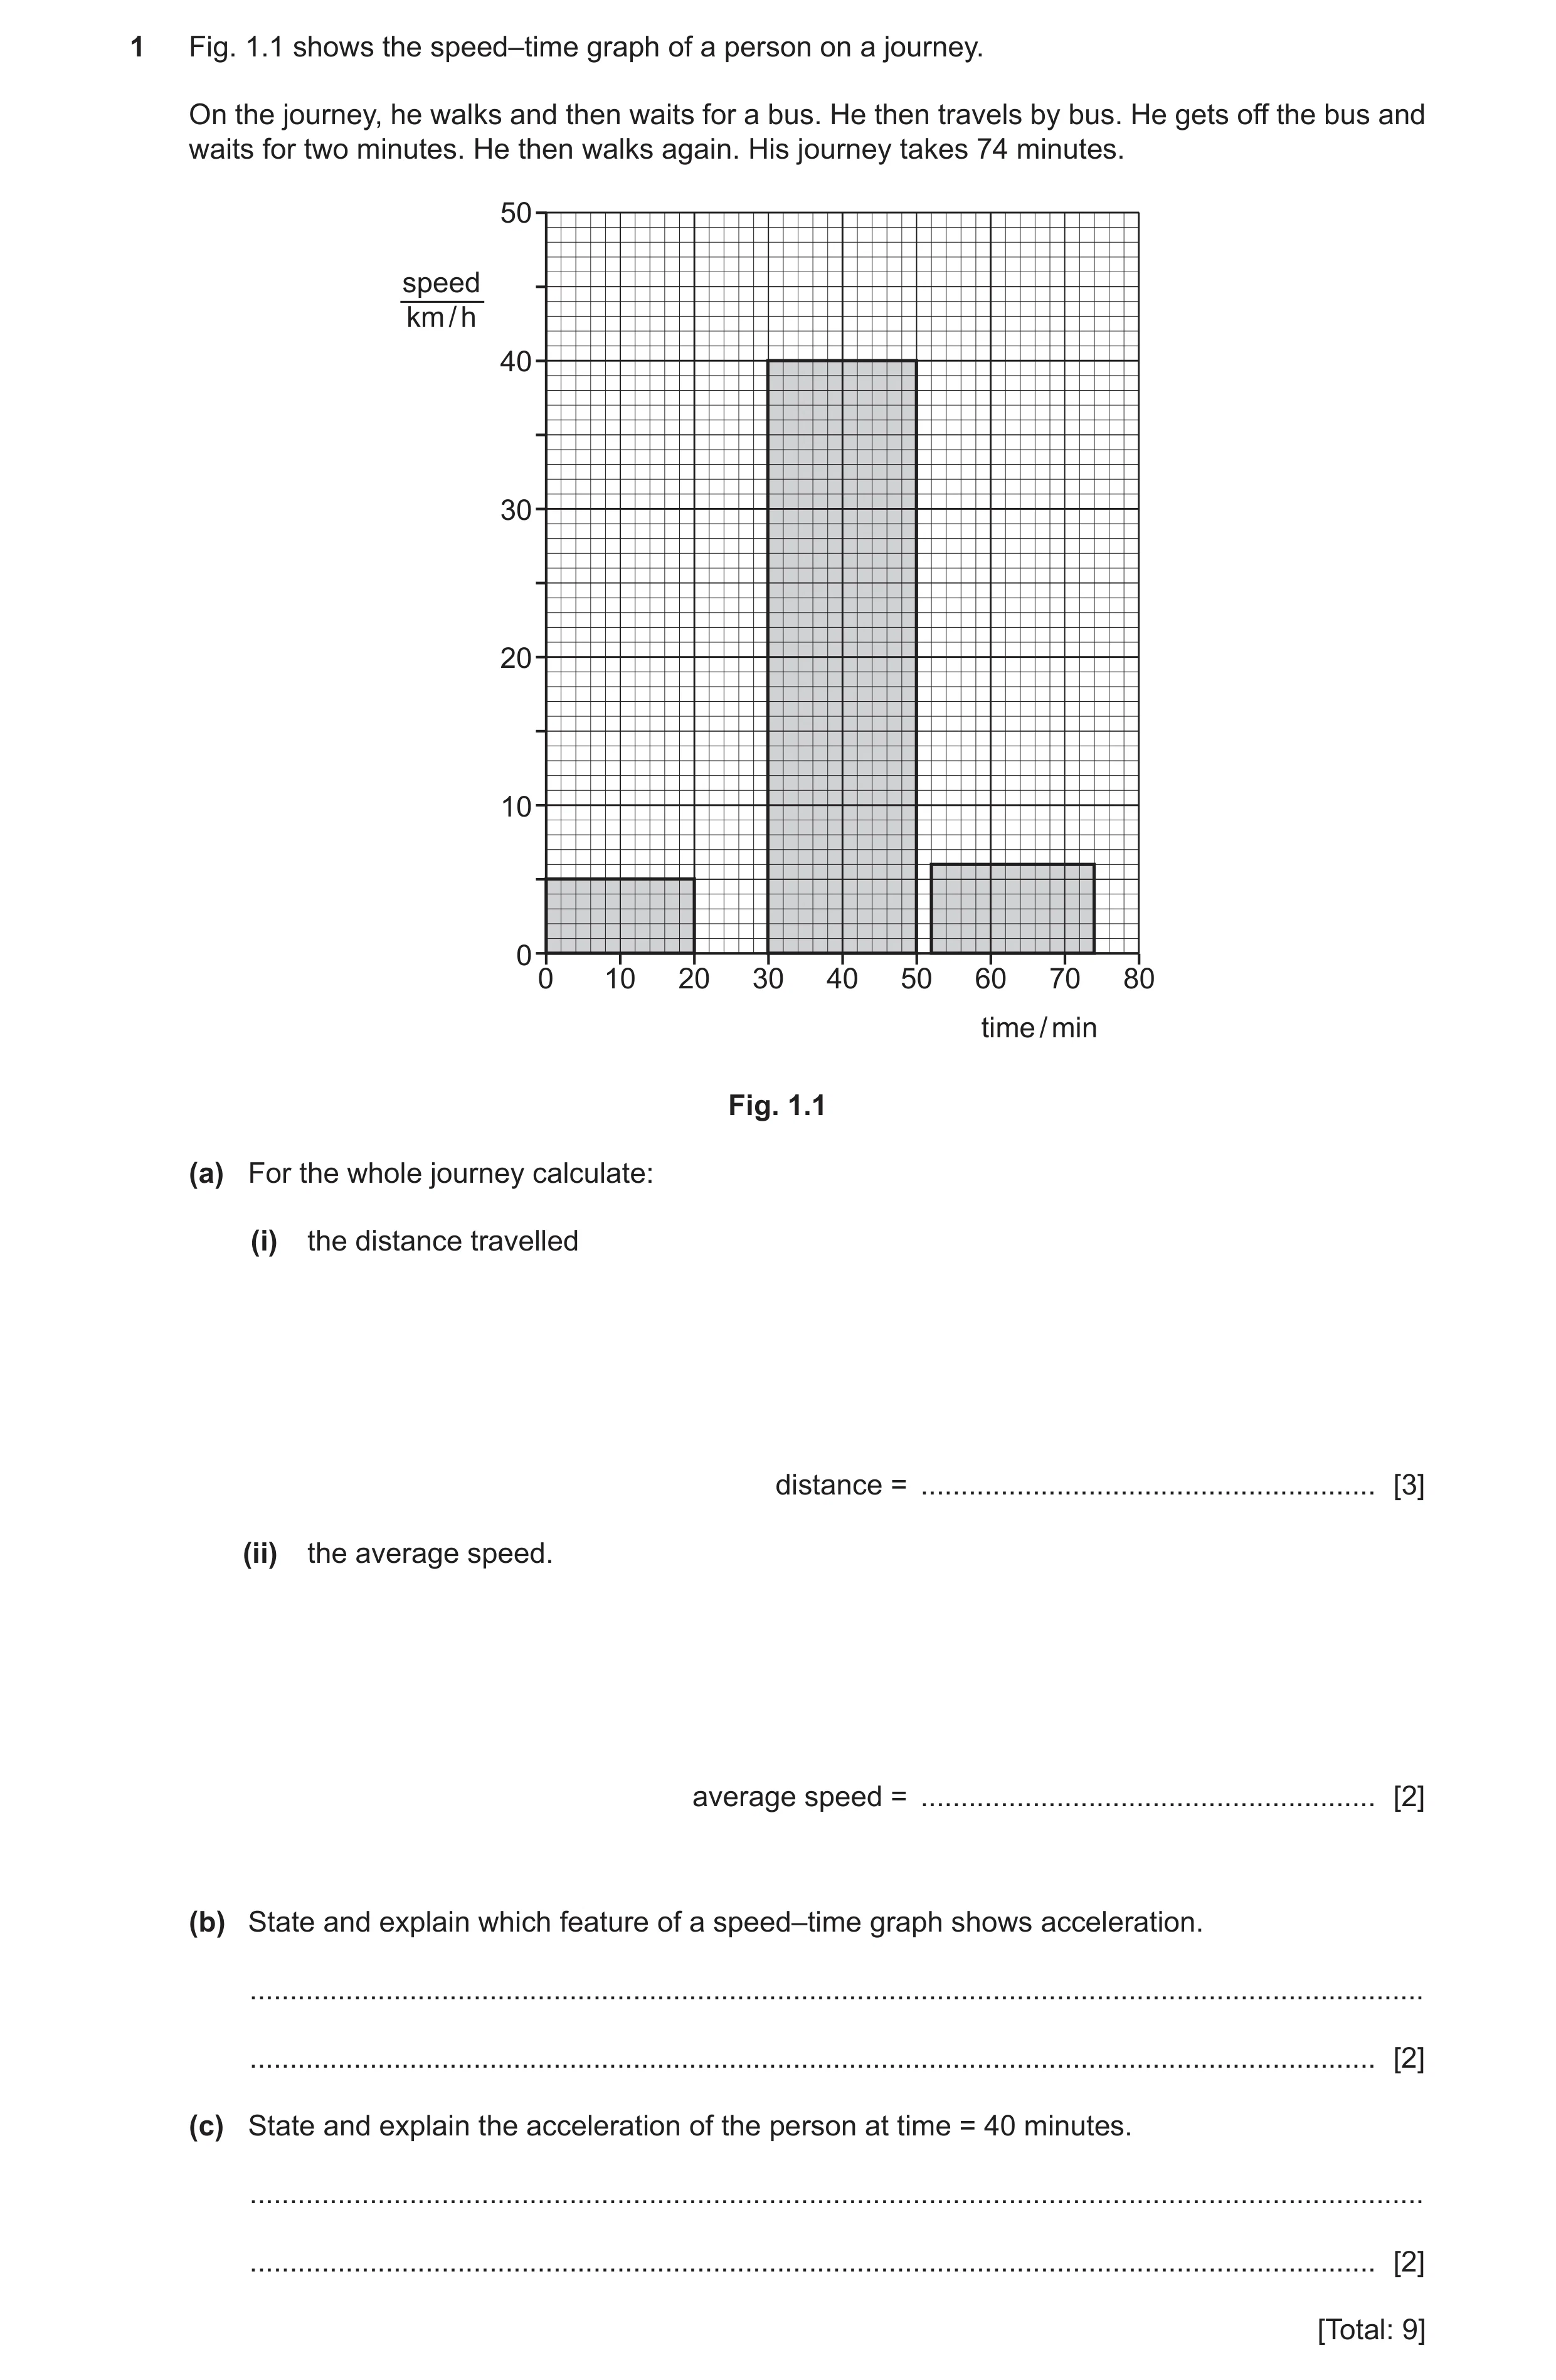
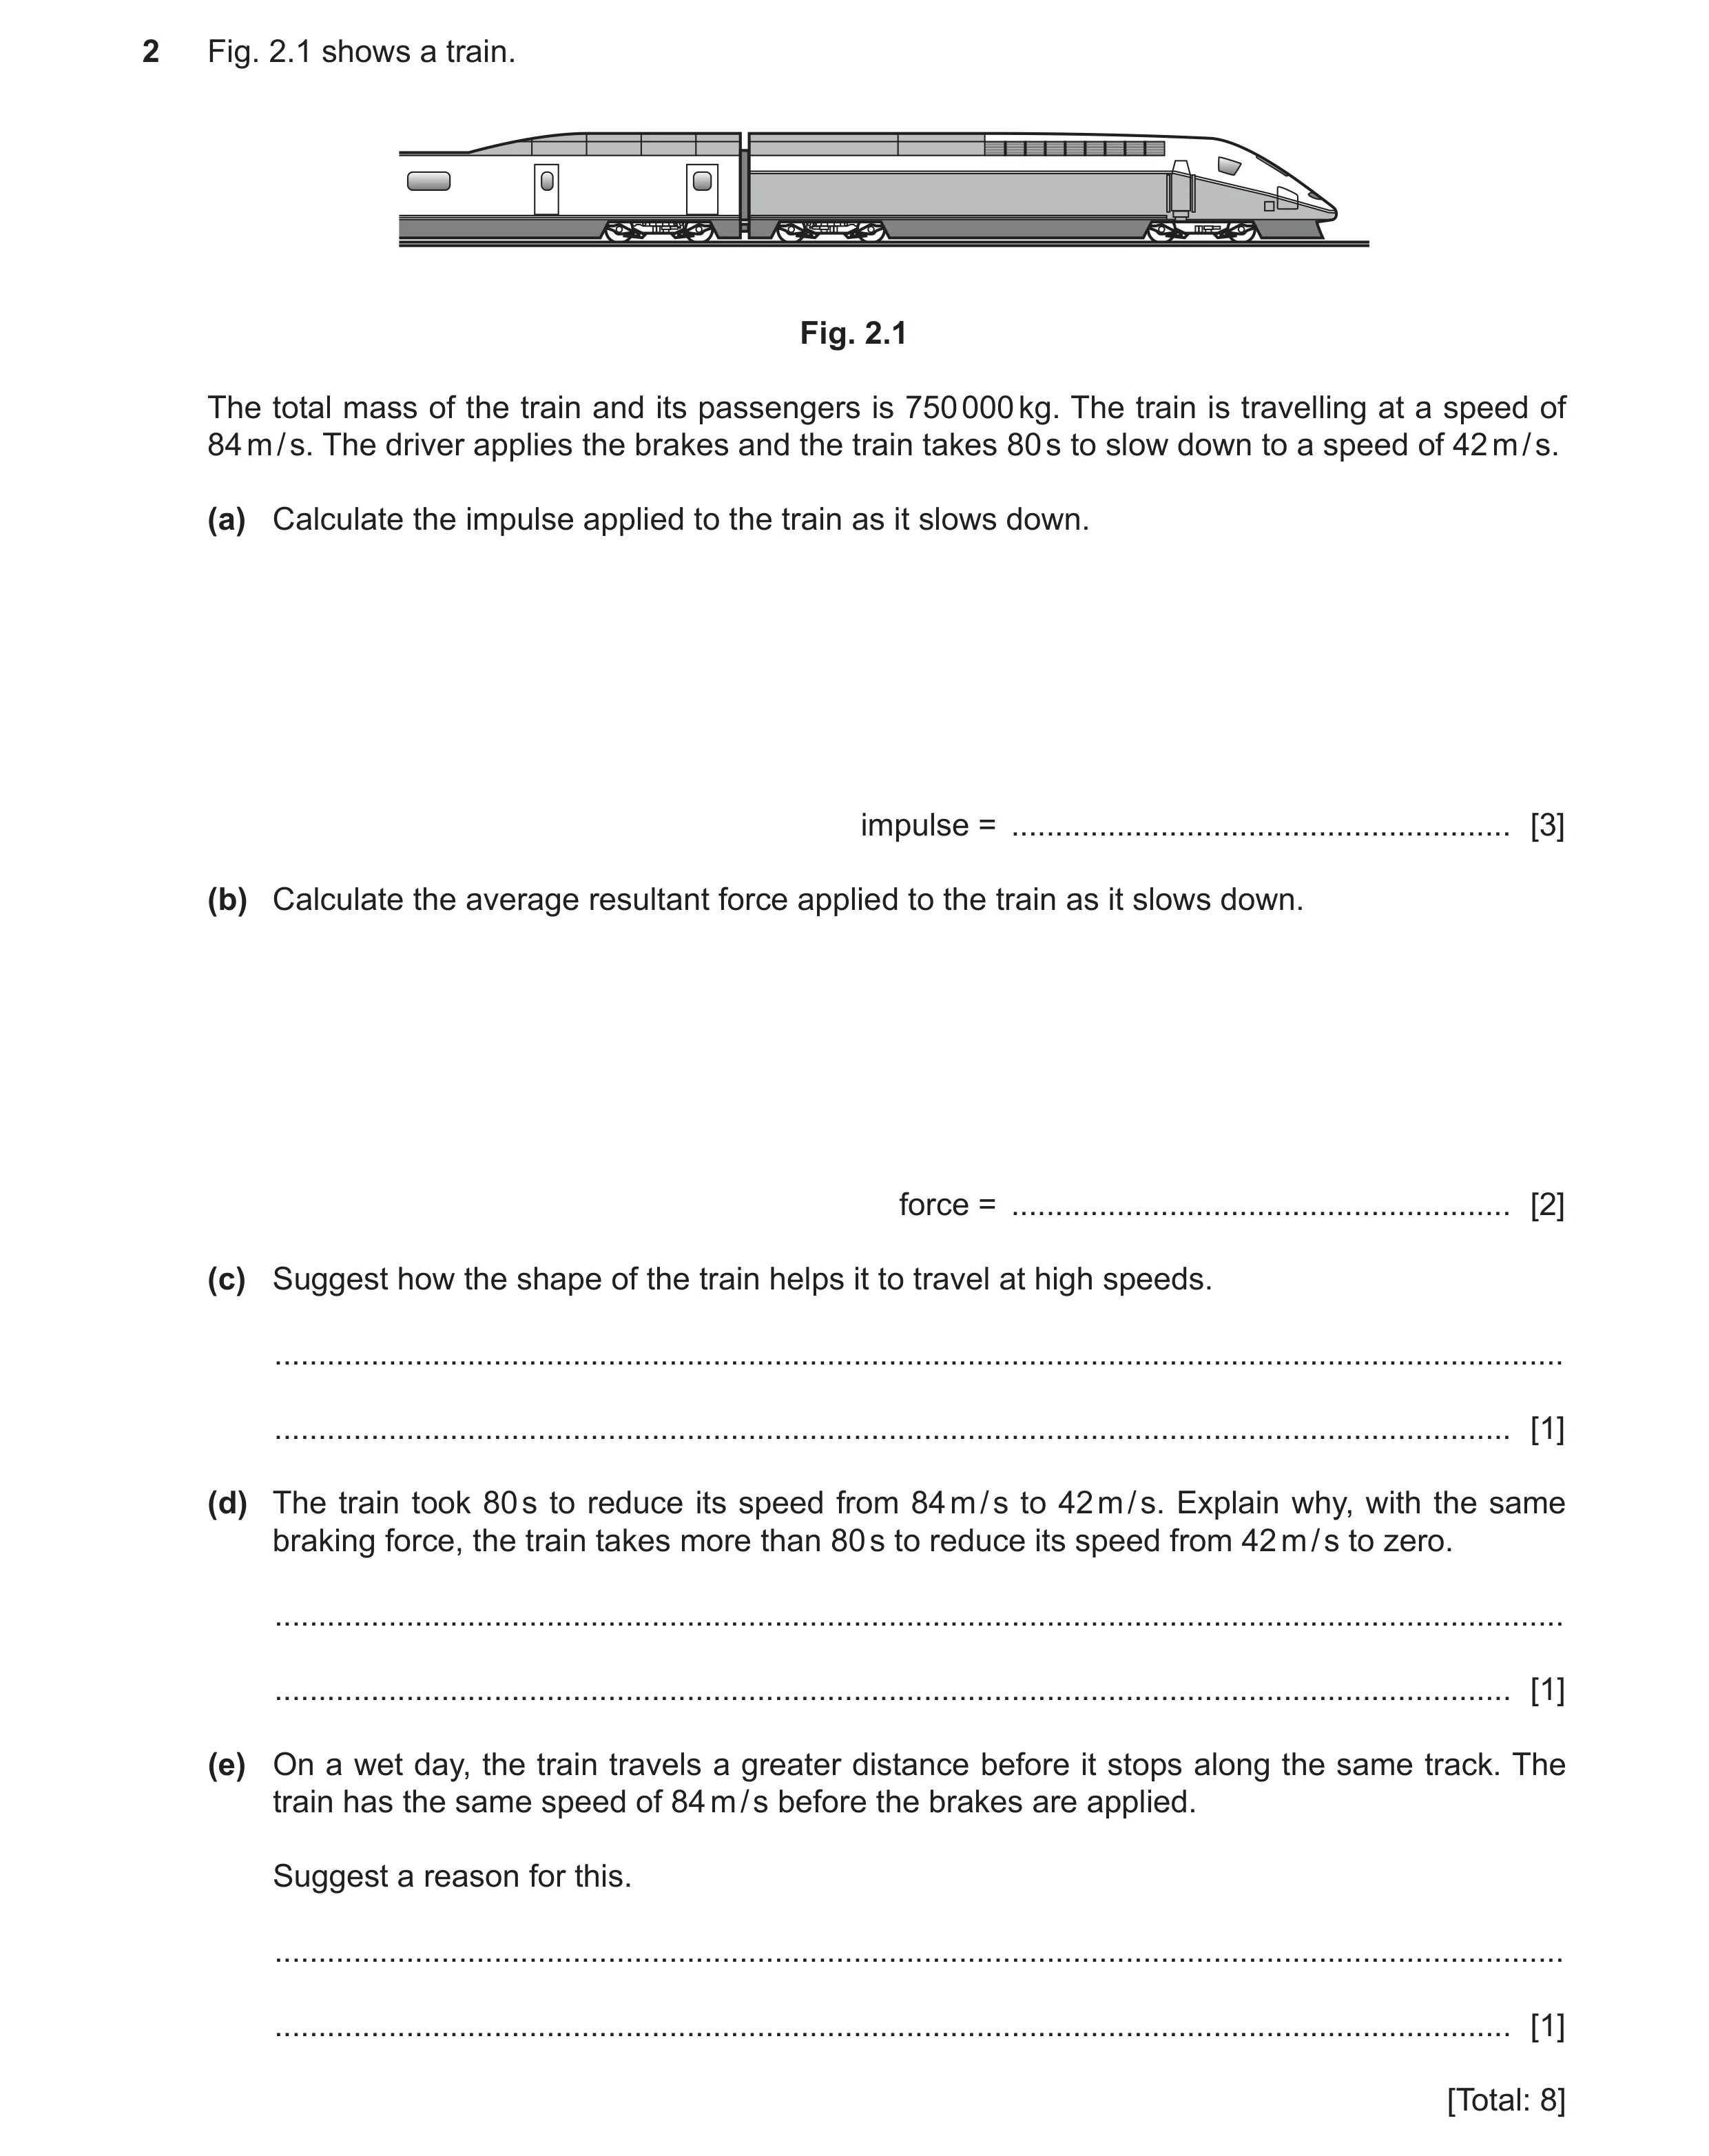 27 / 78
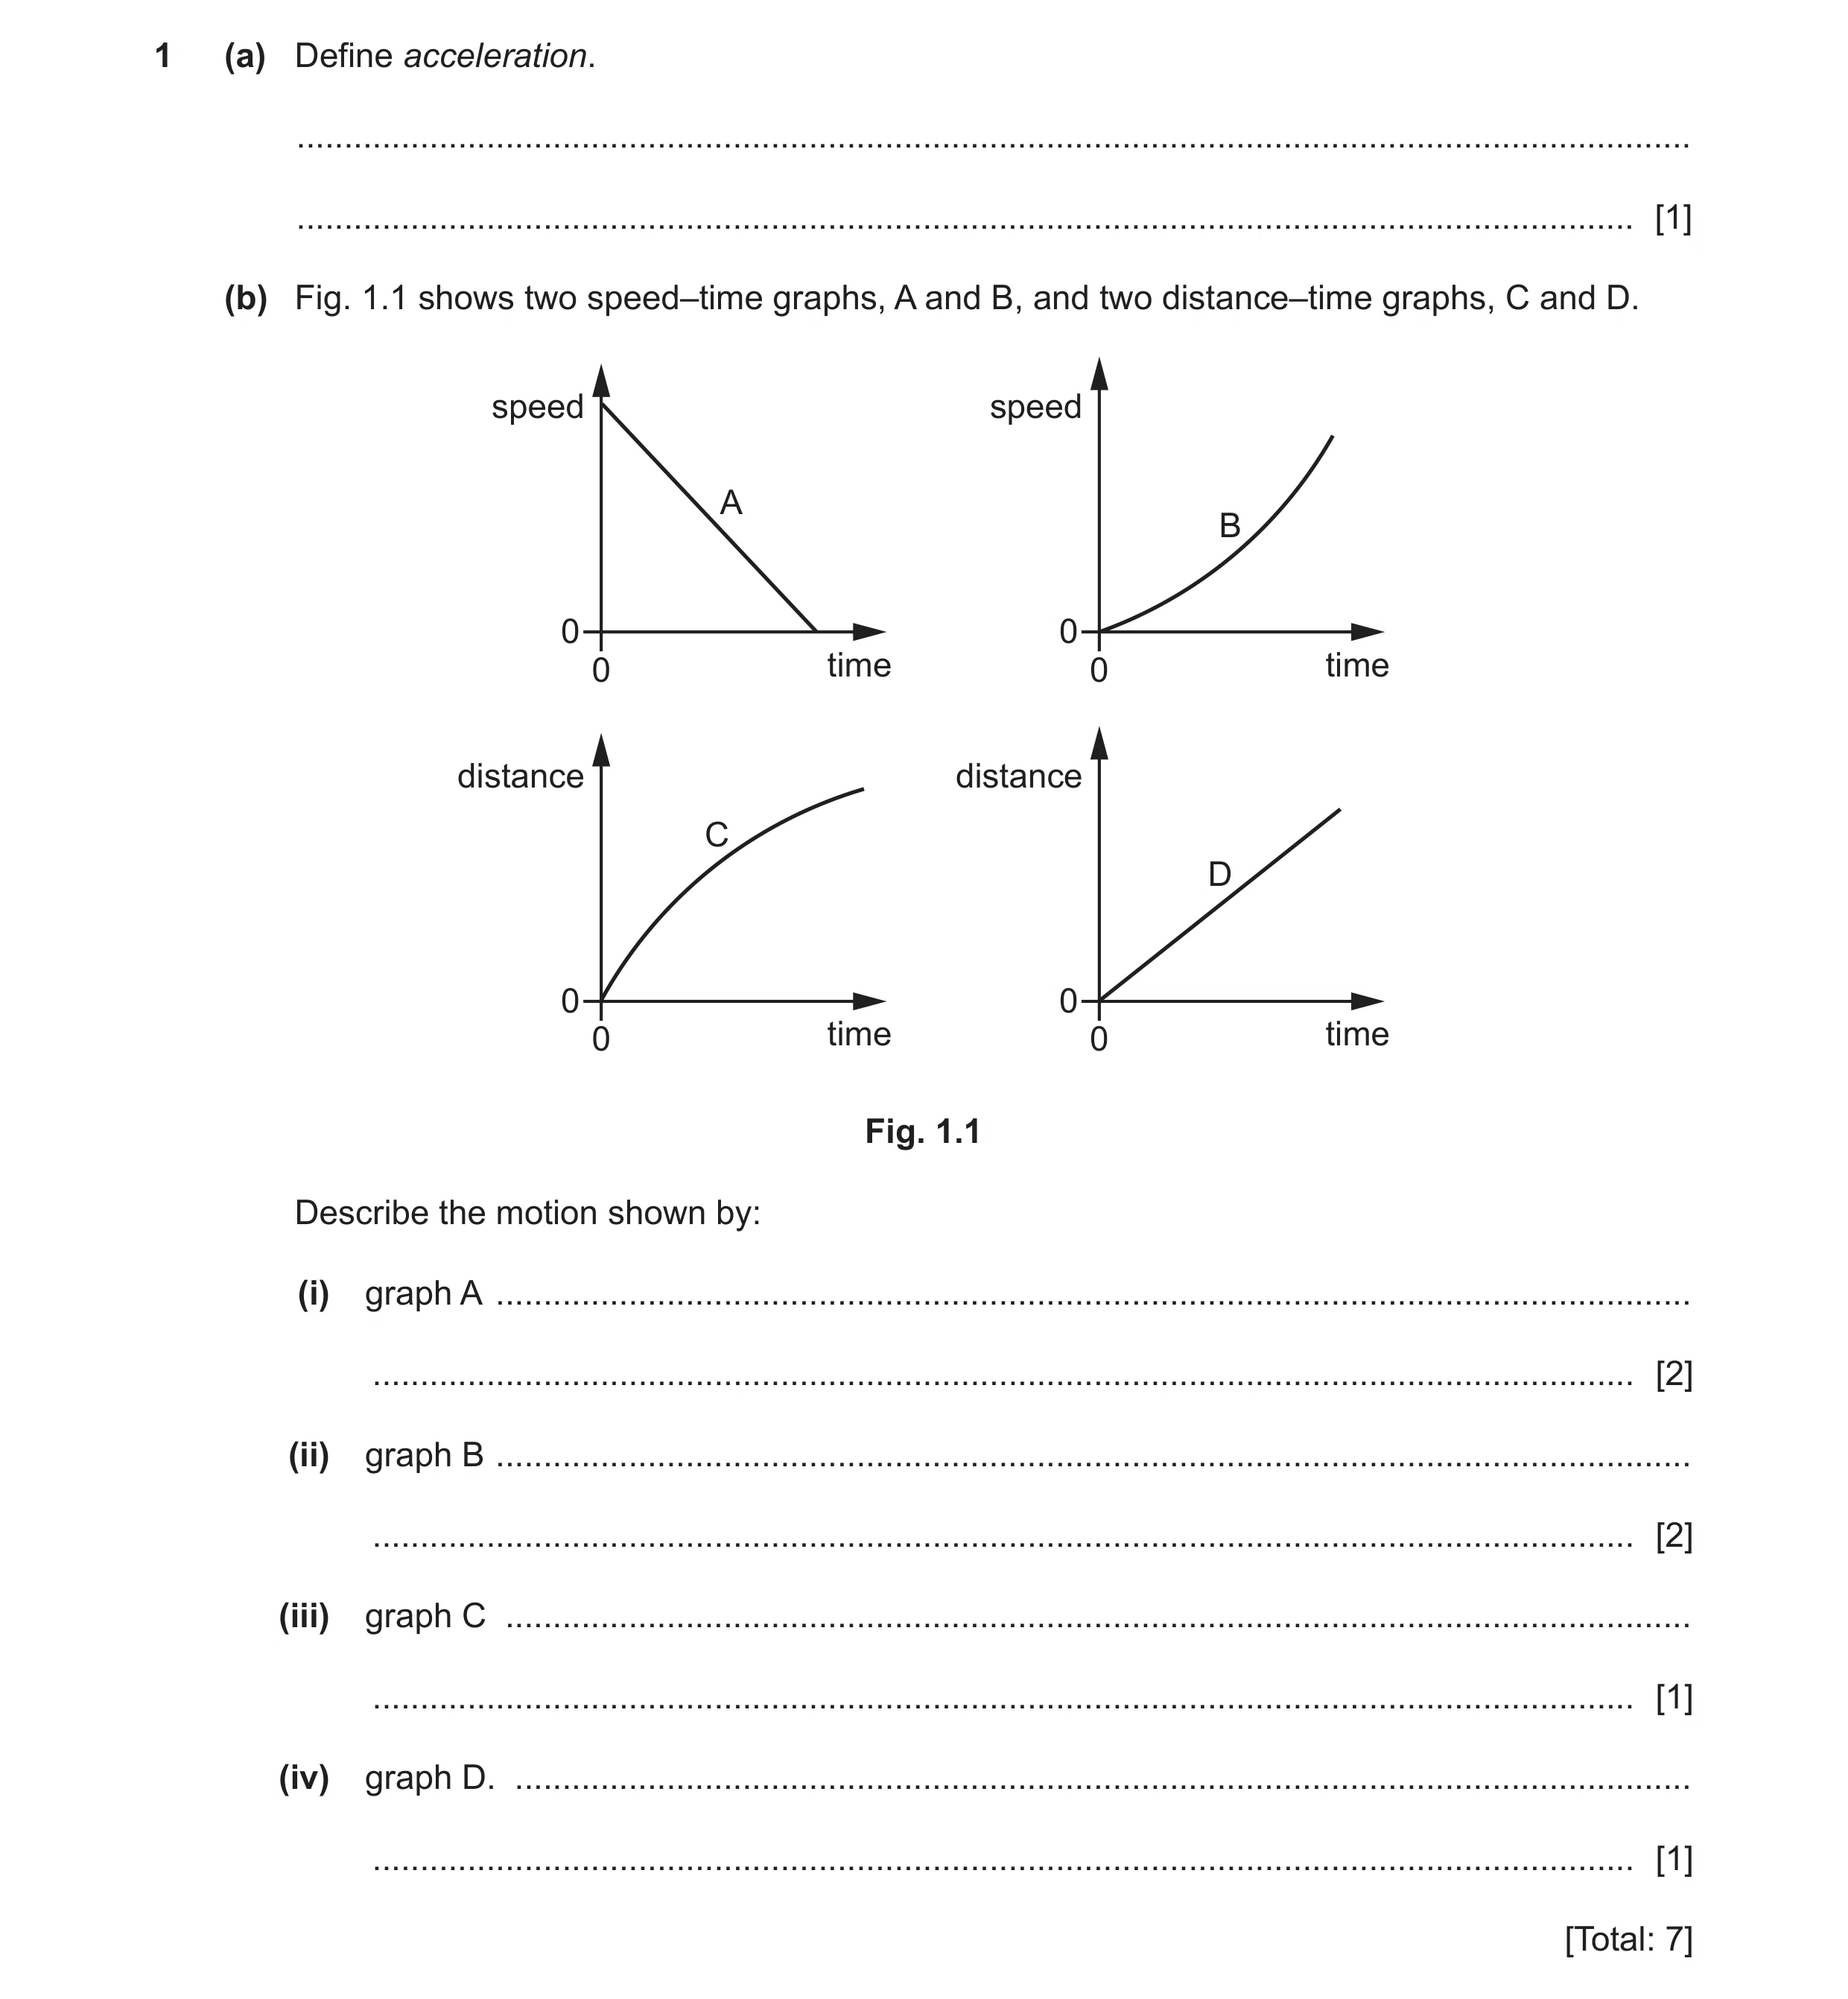 28 / 78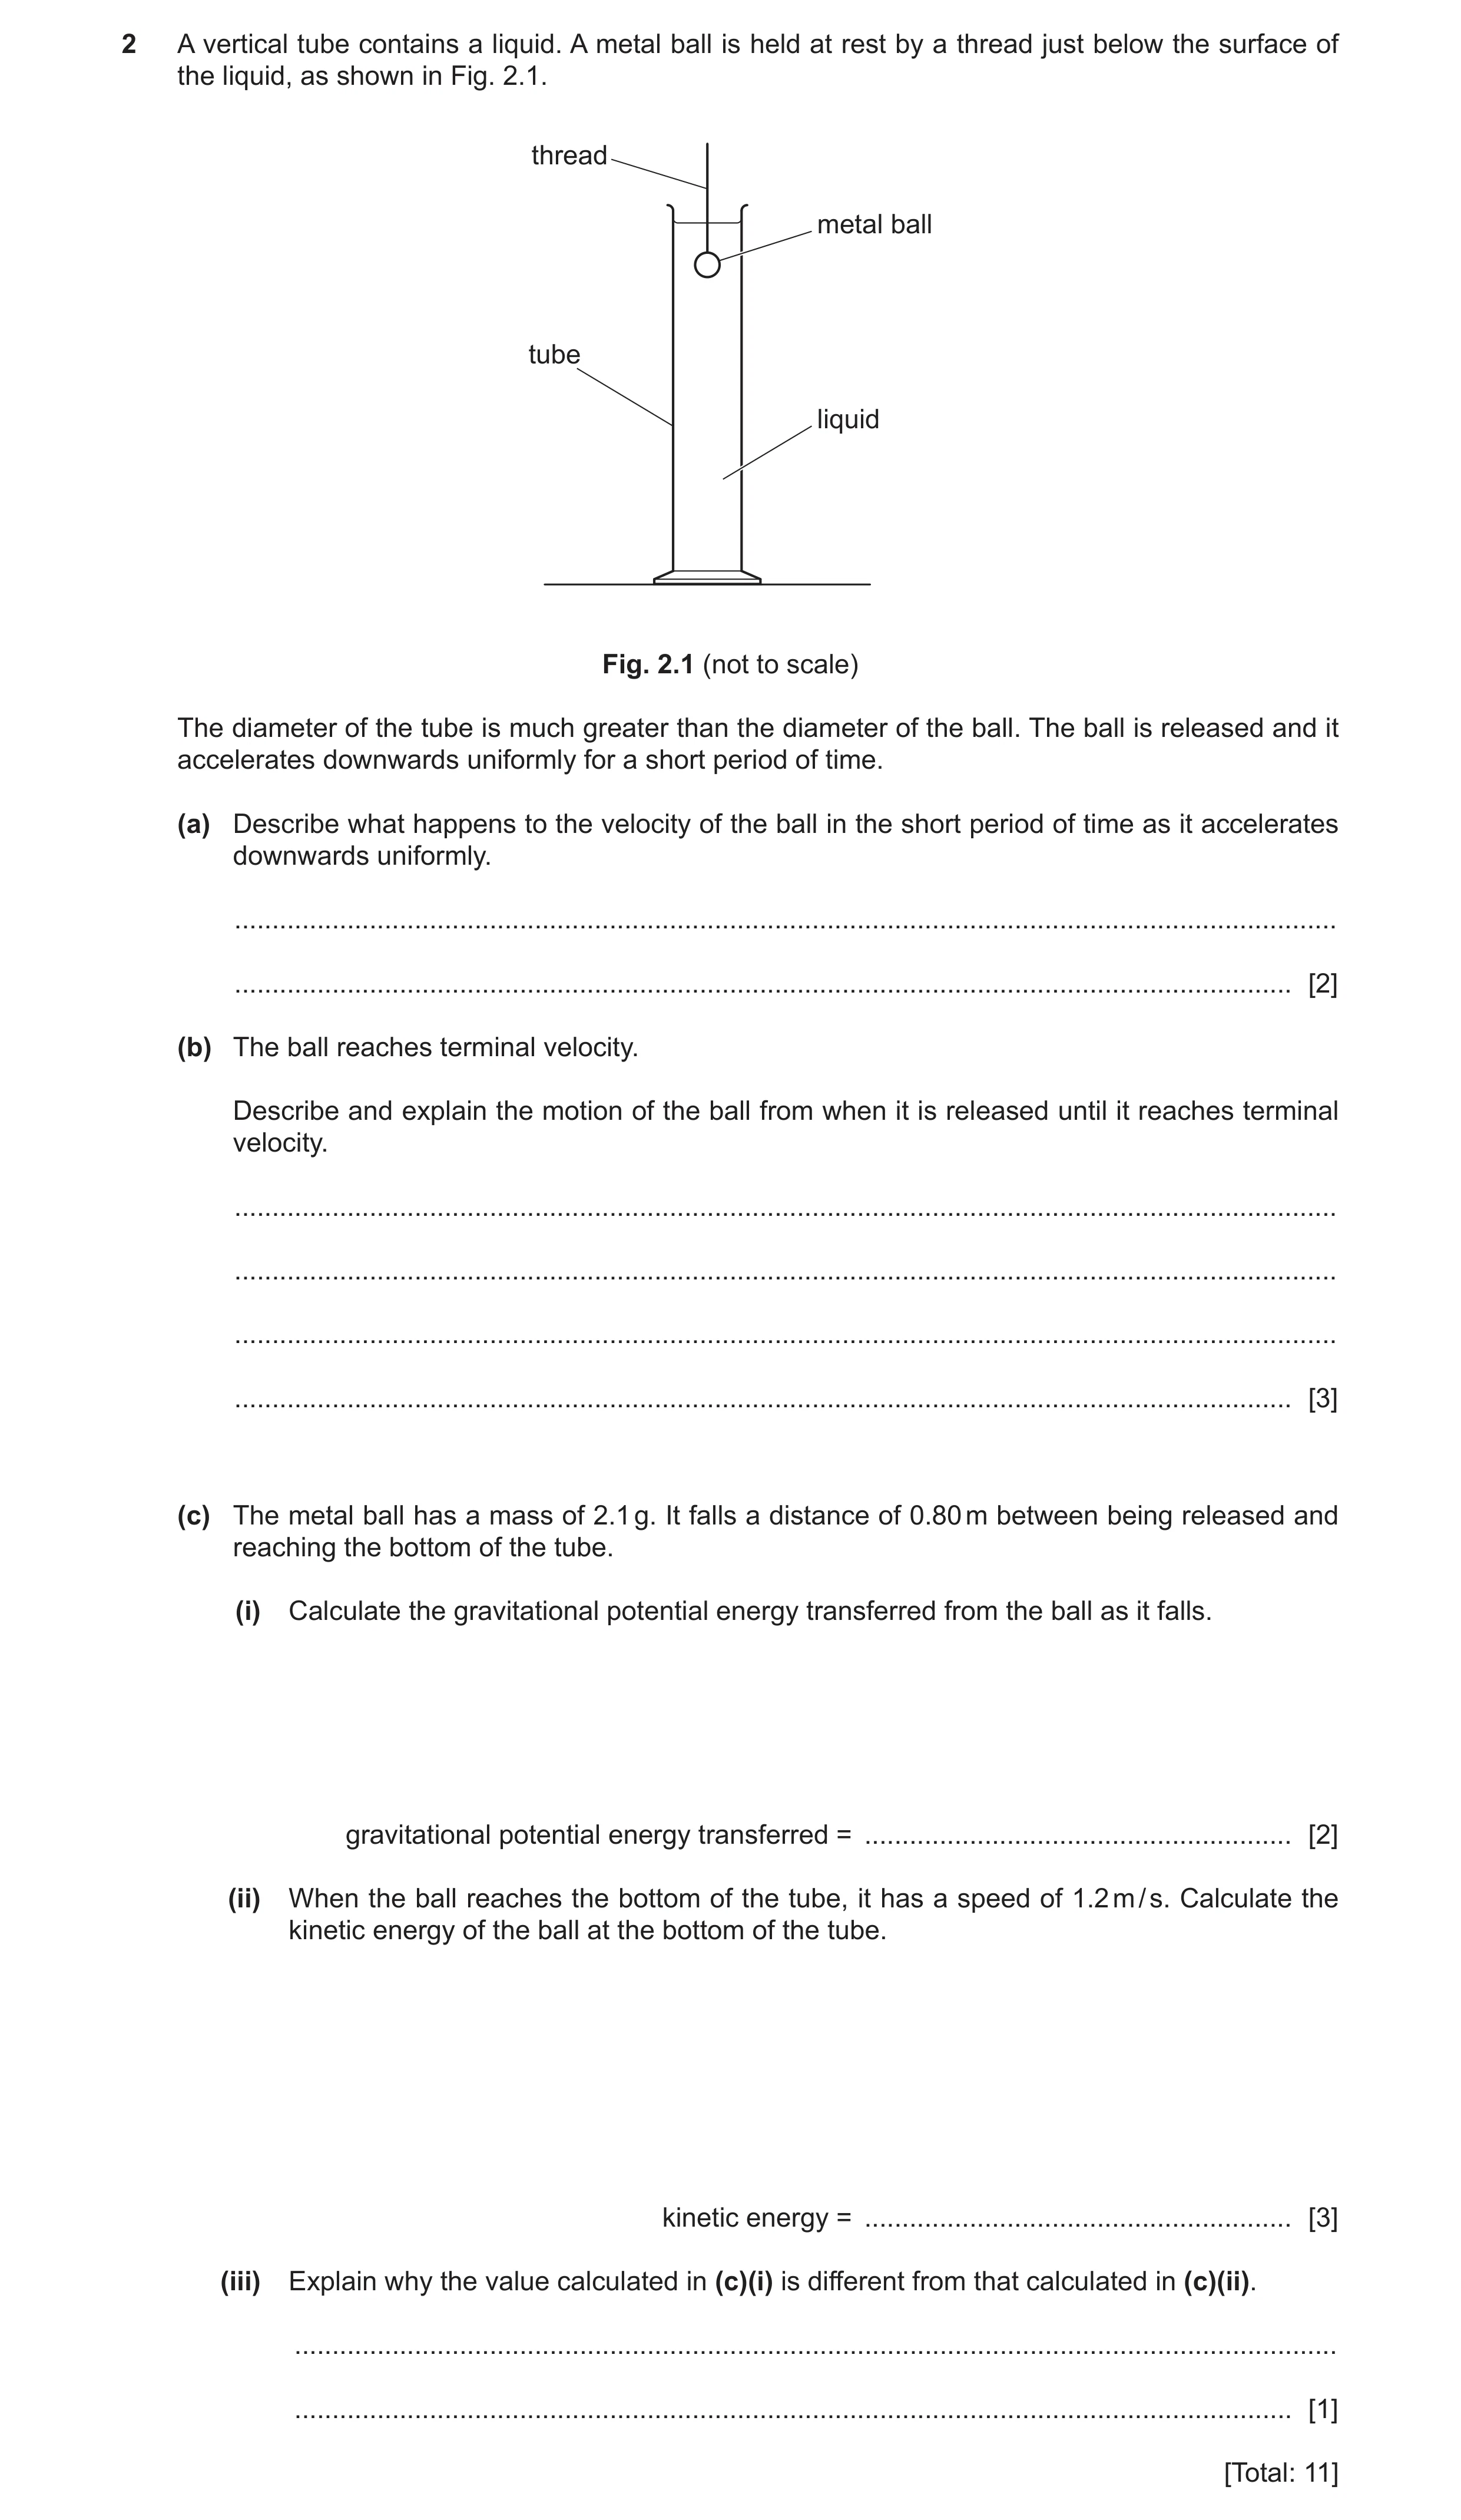
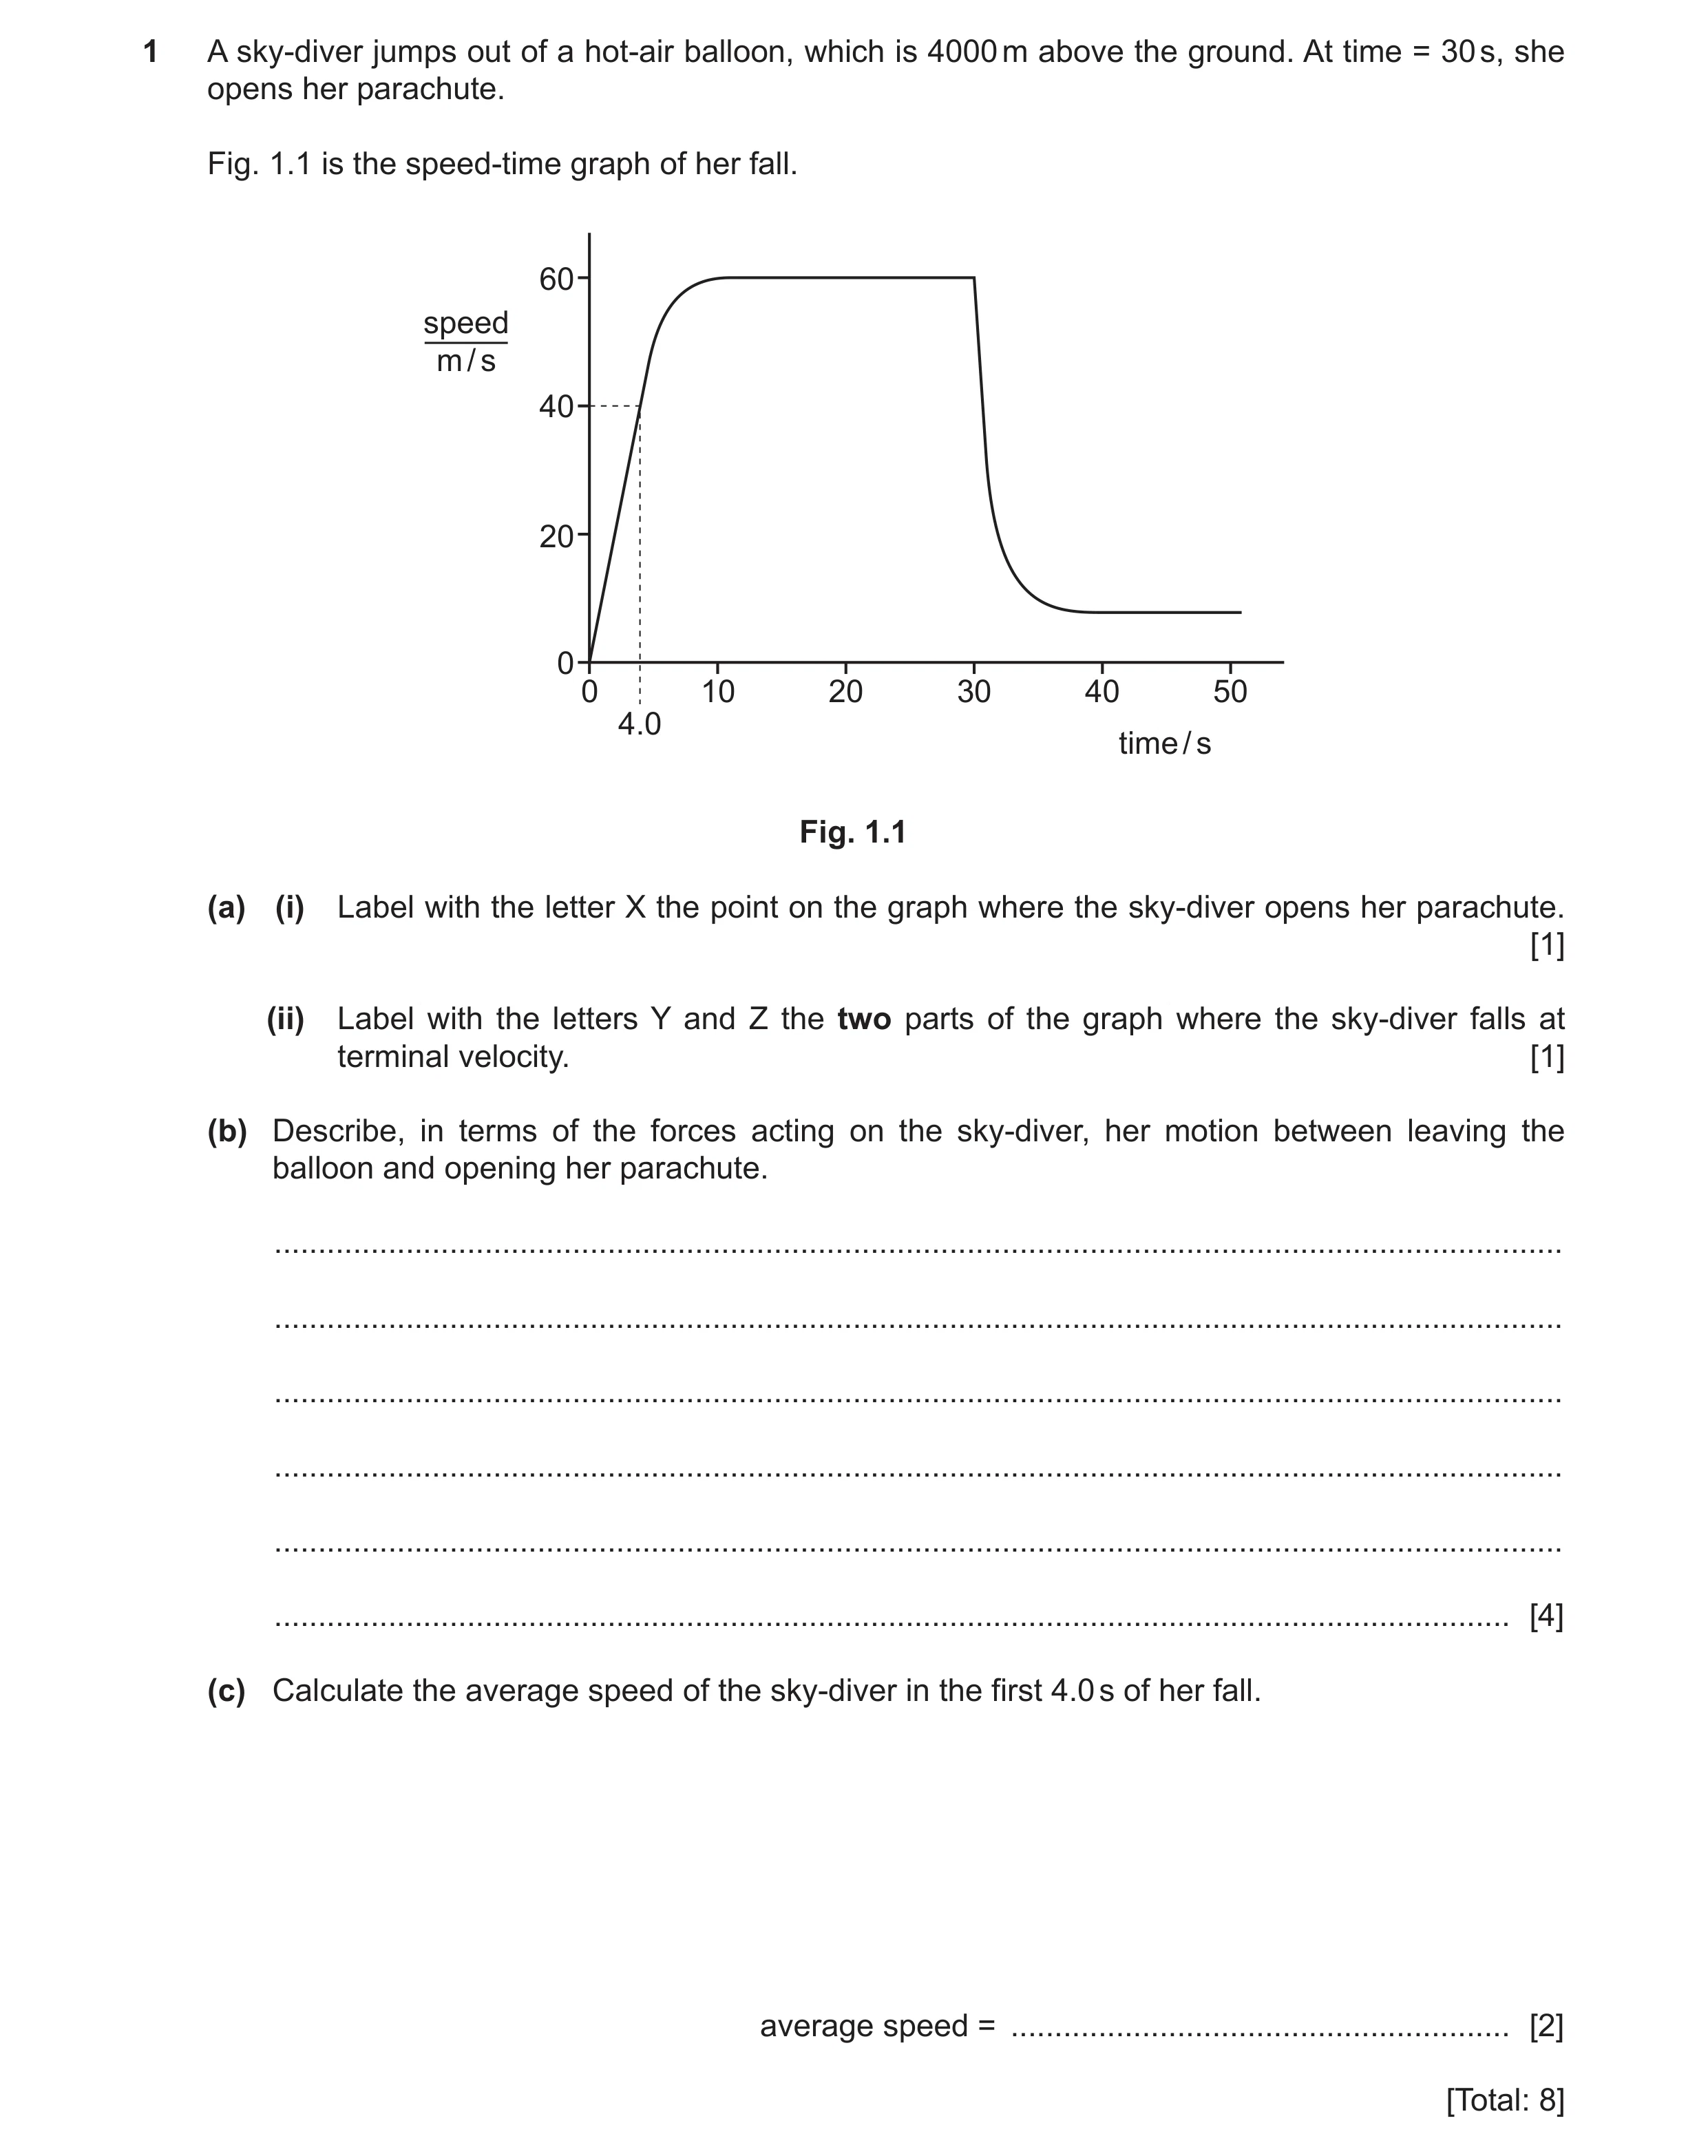 31 / 78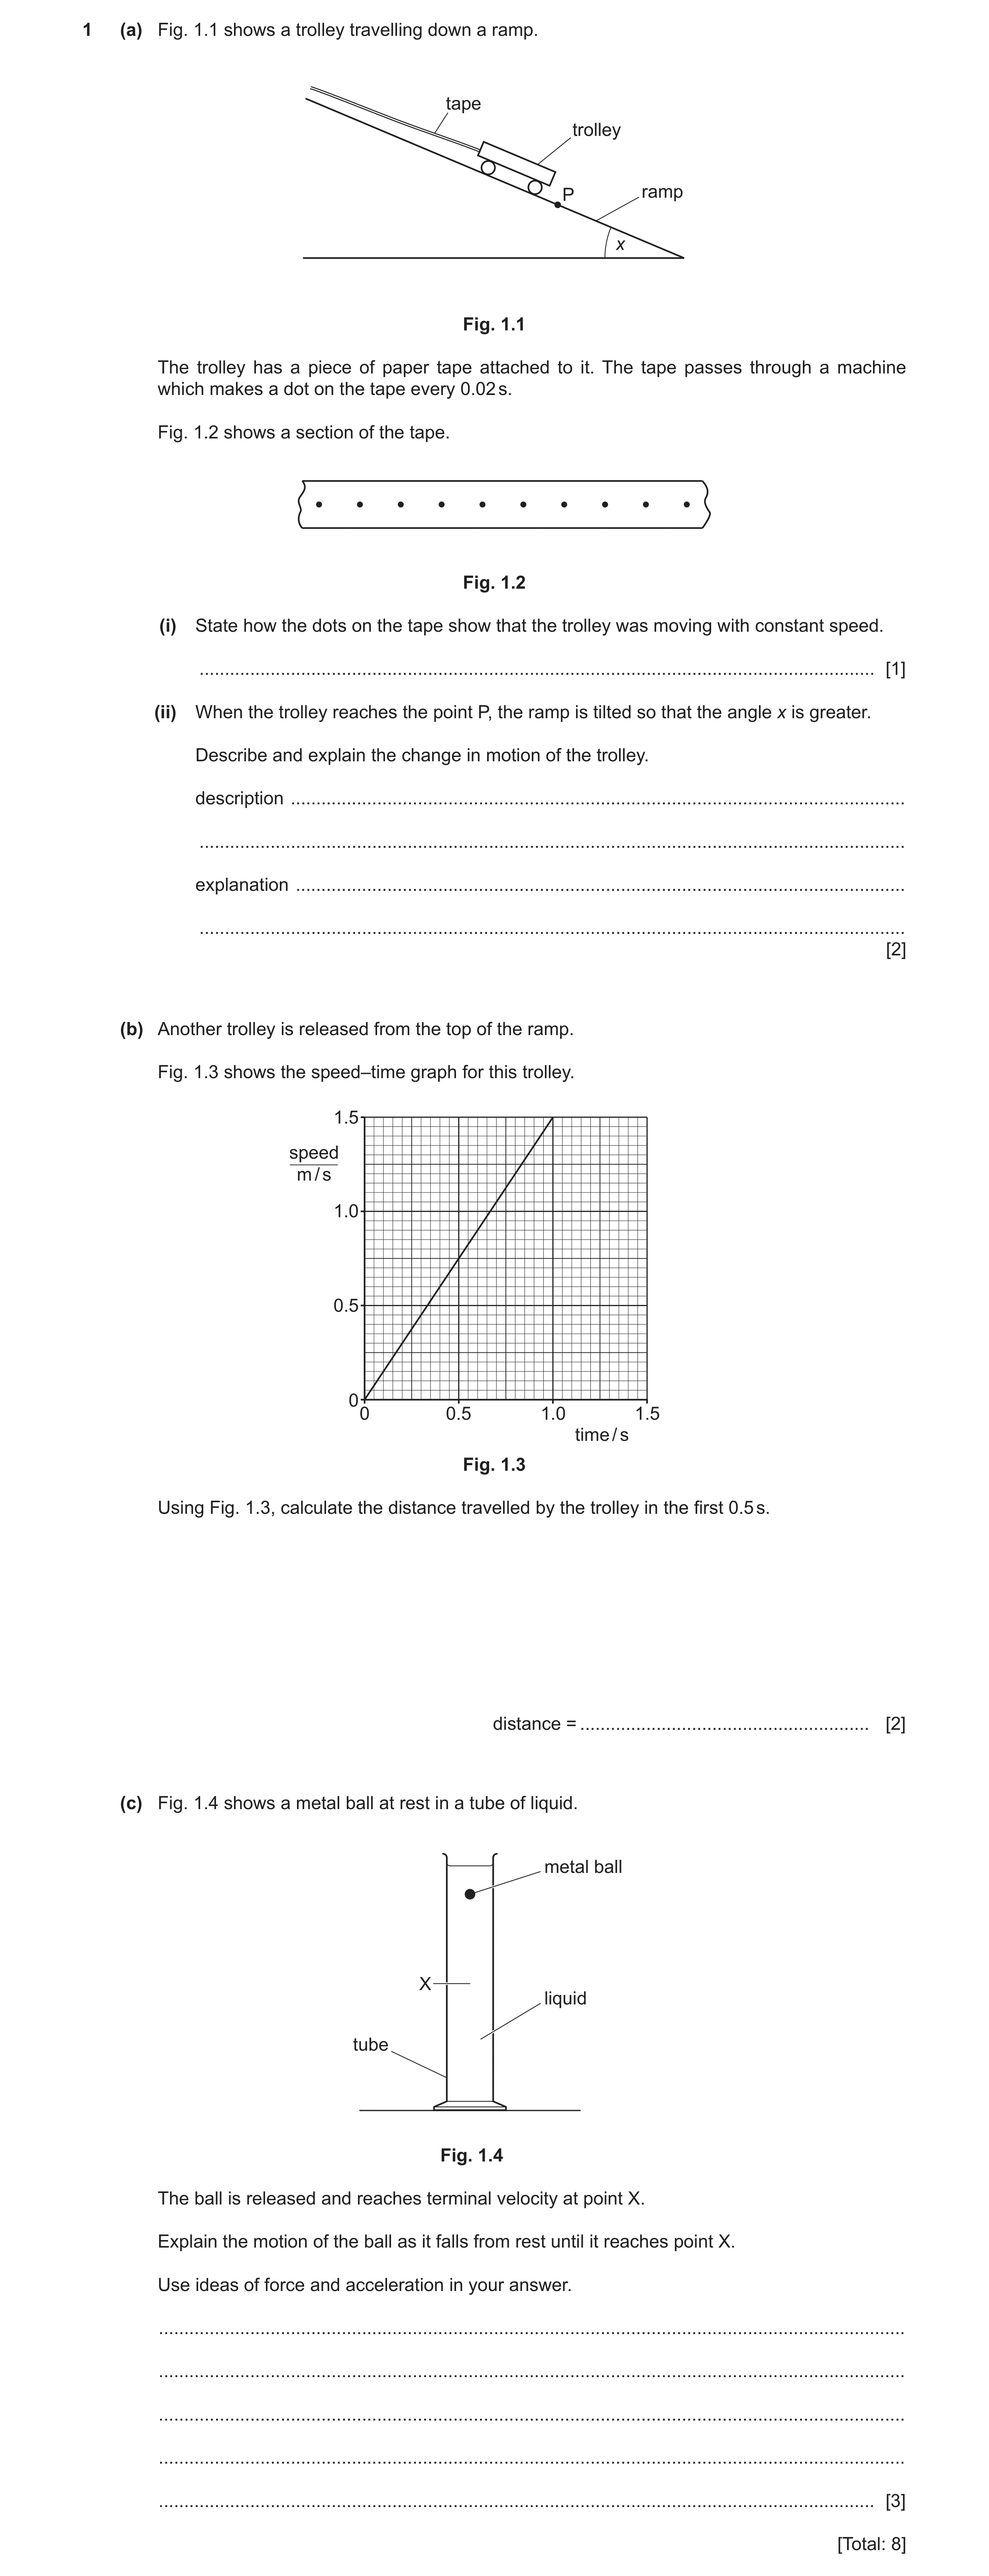
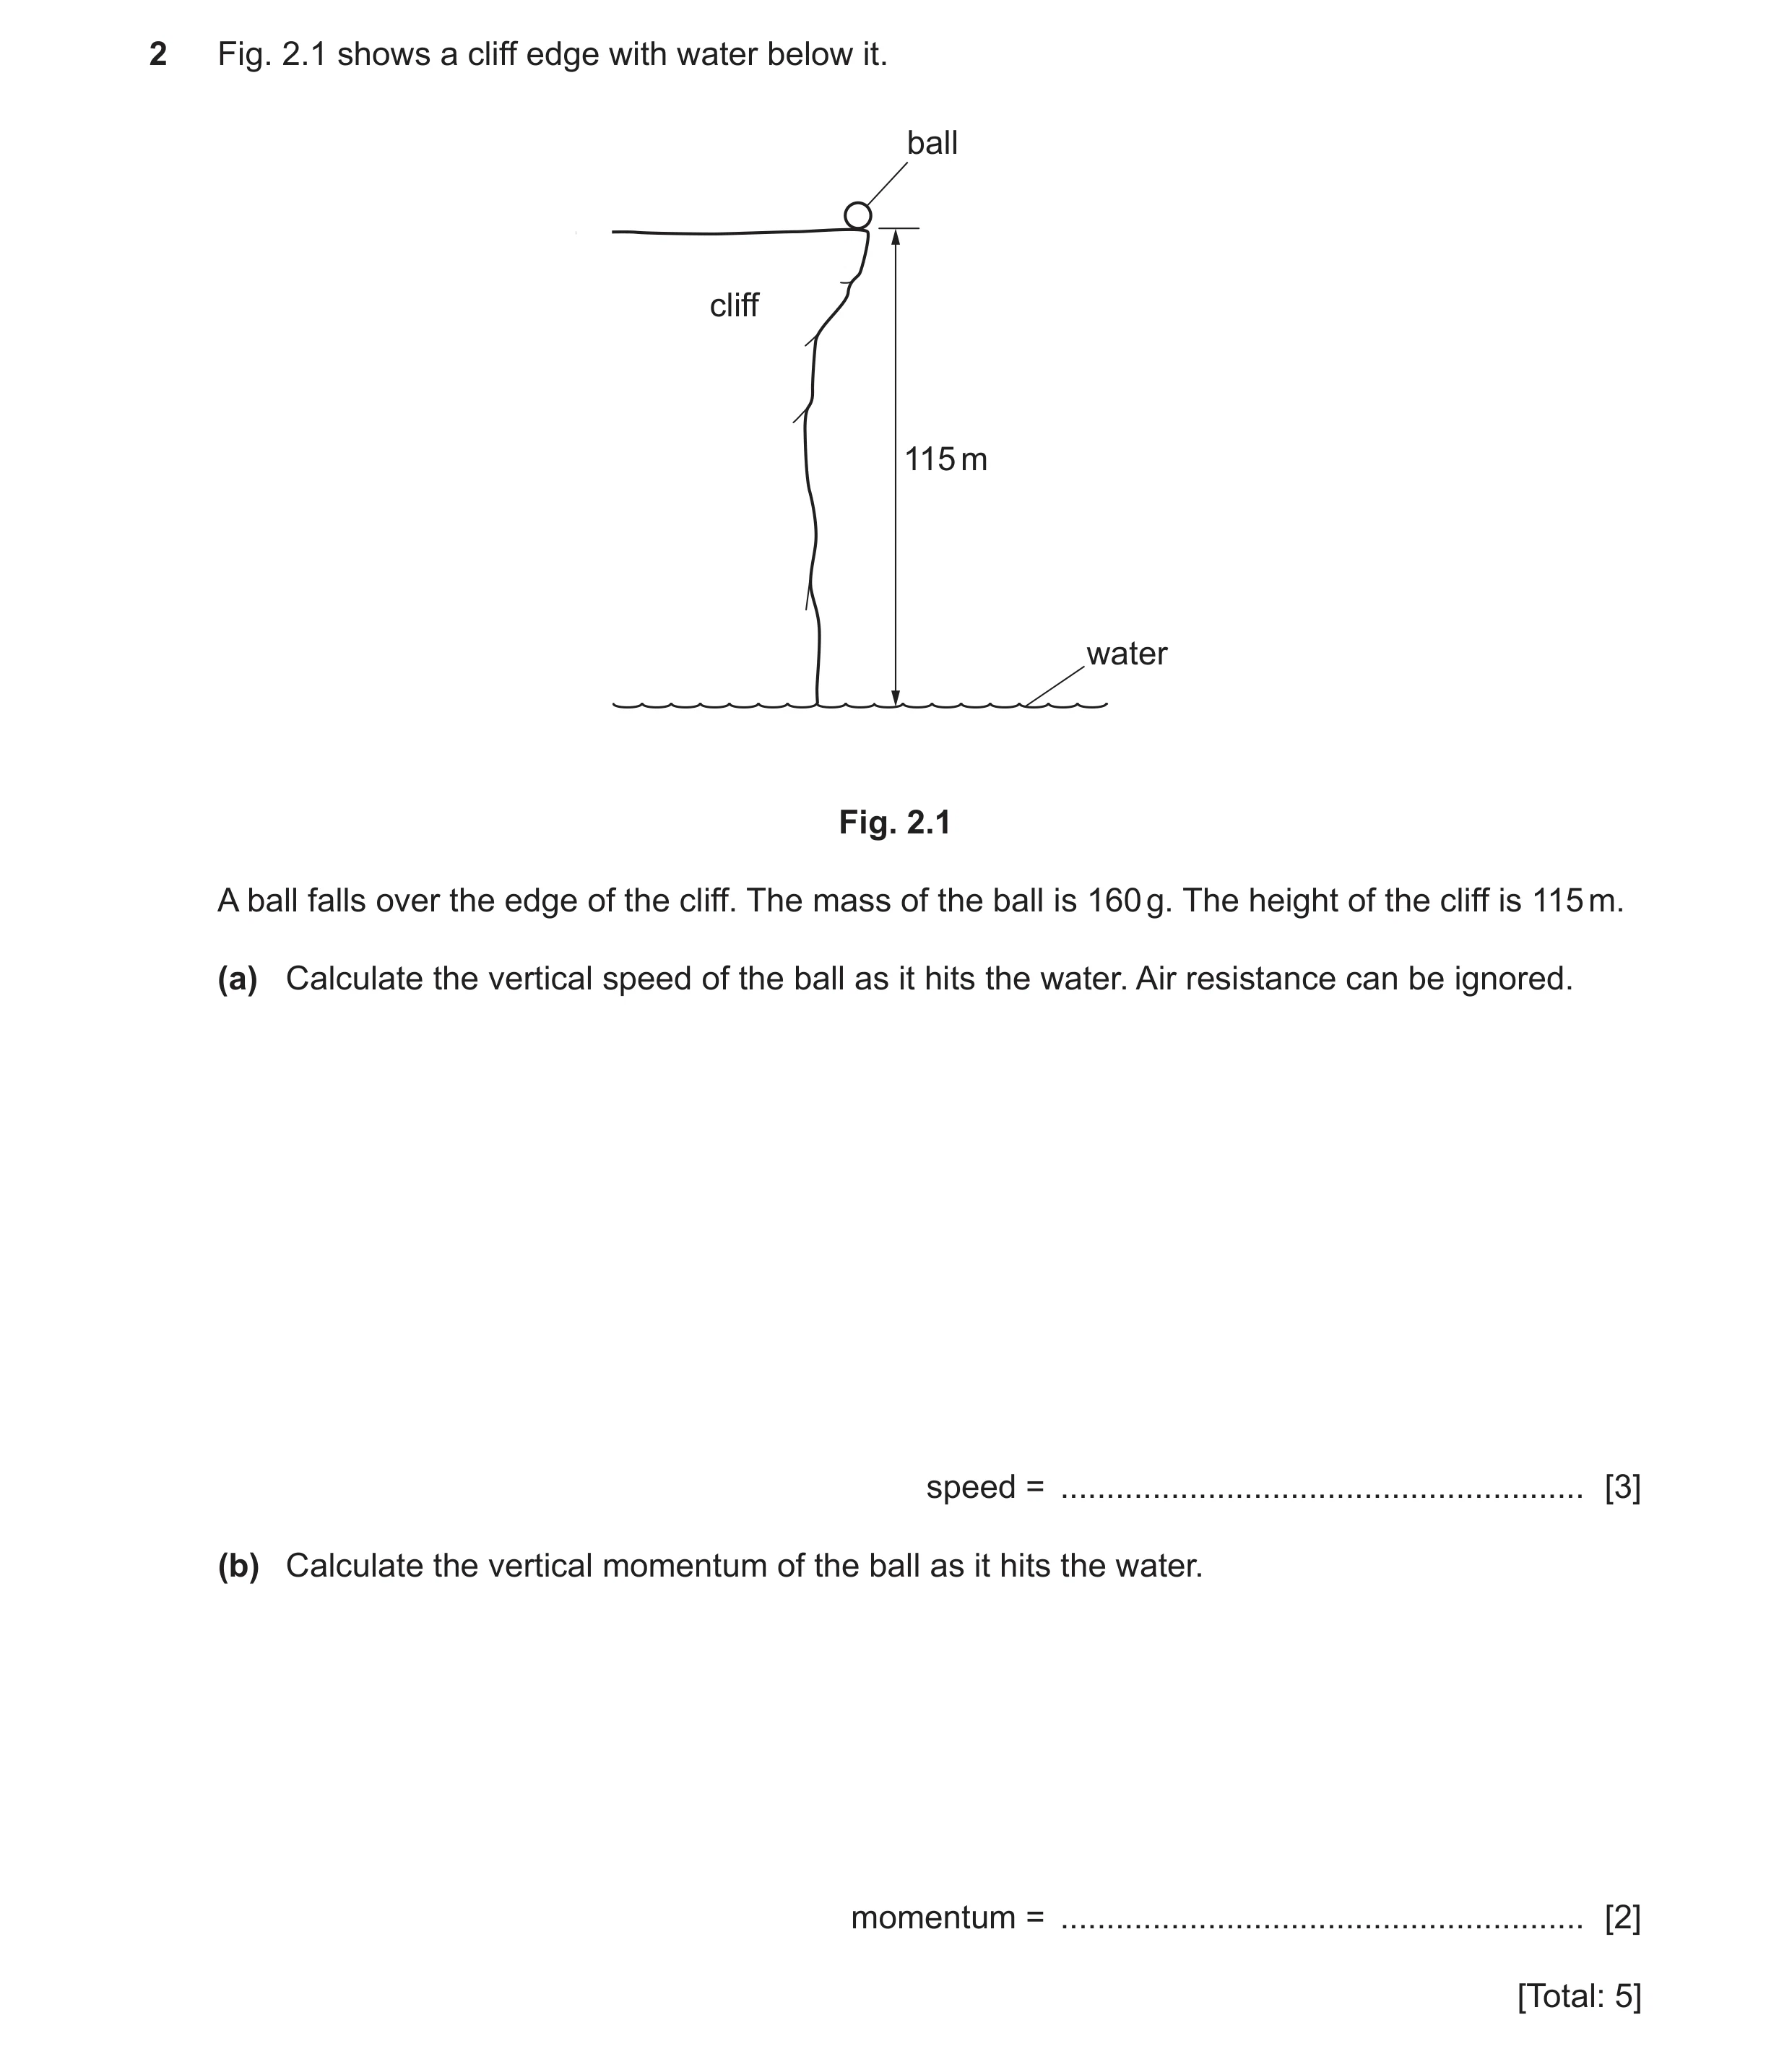 34 / 78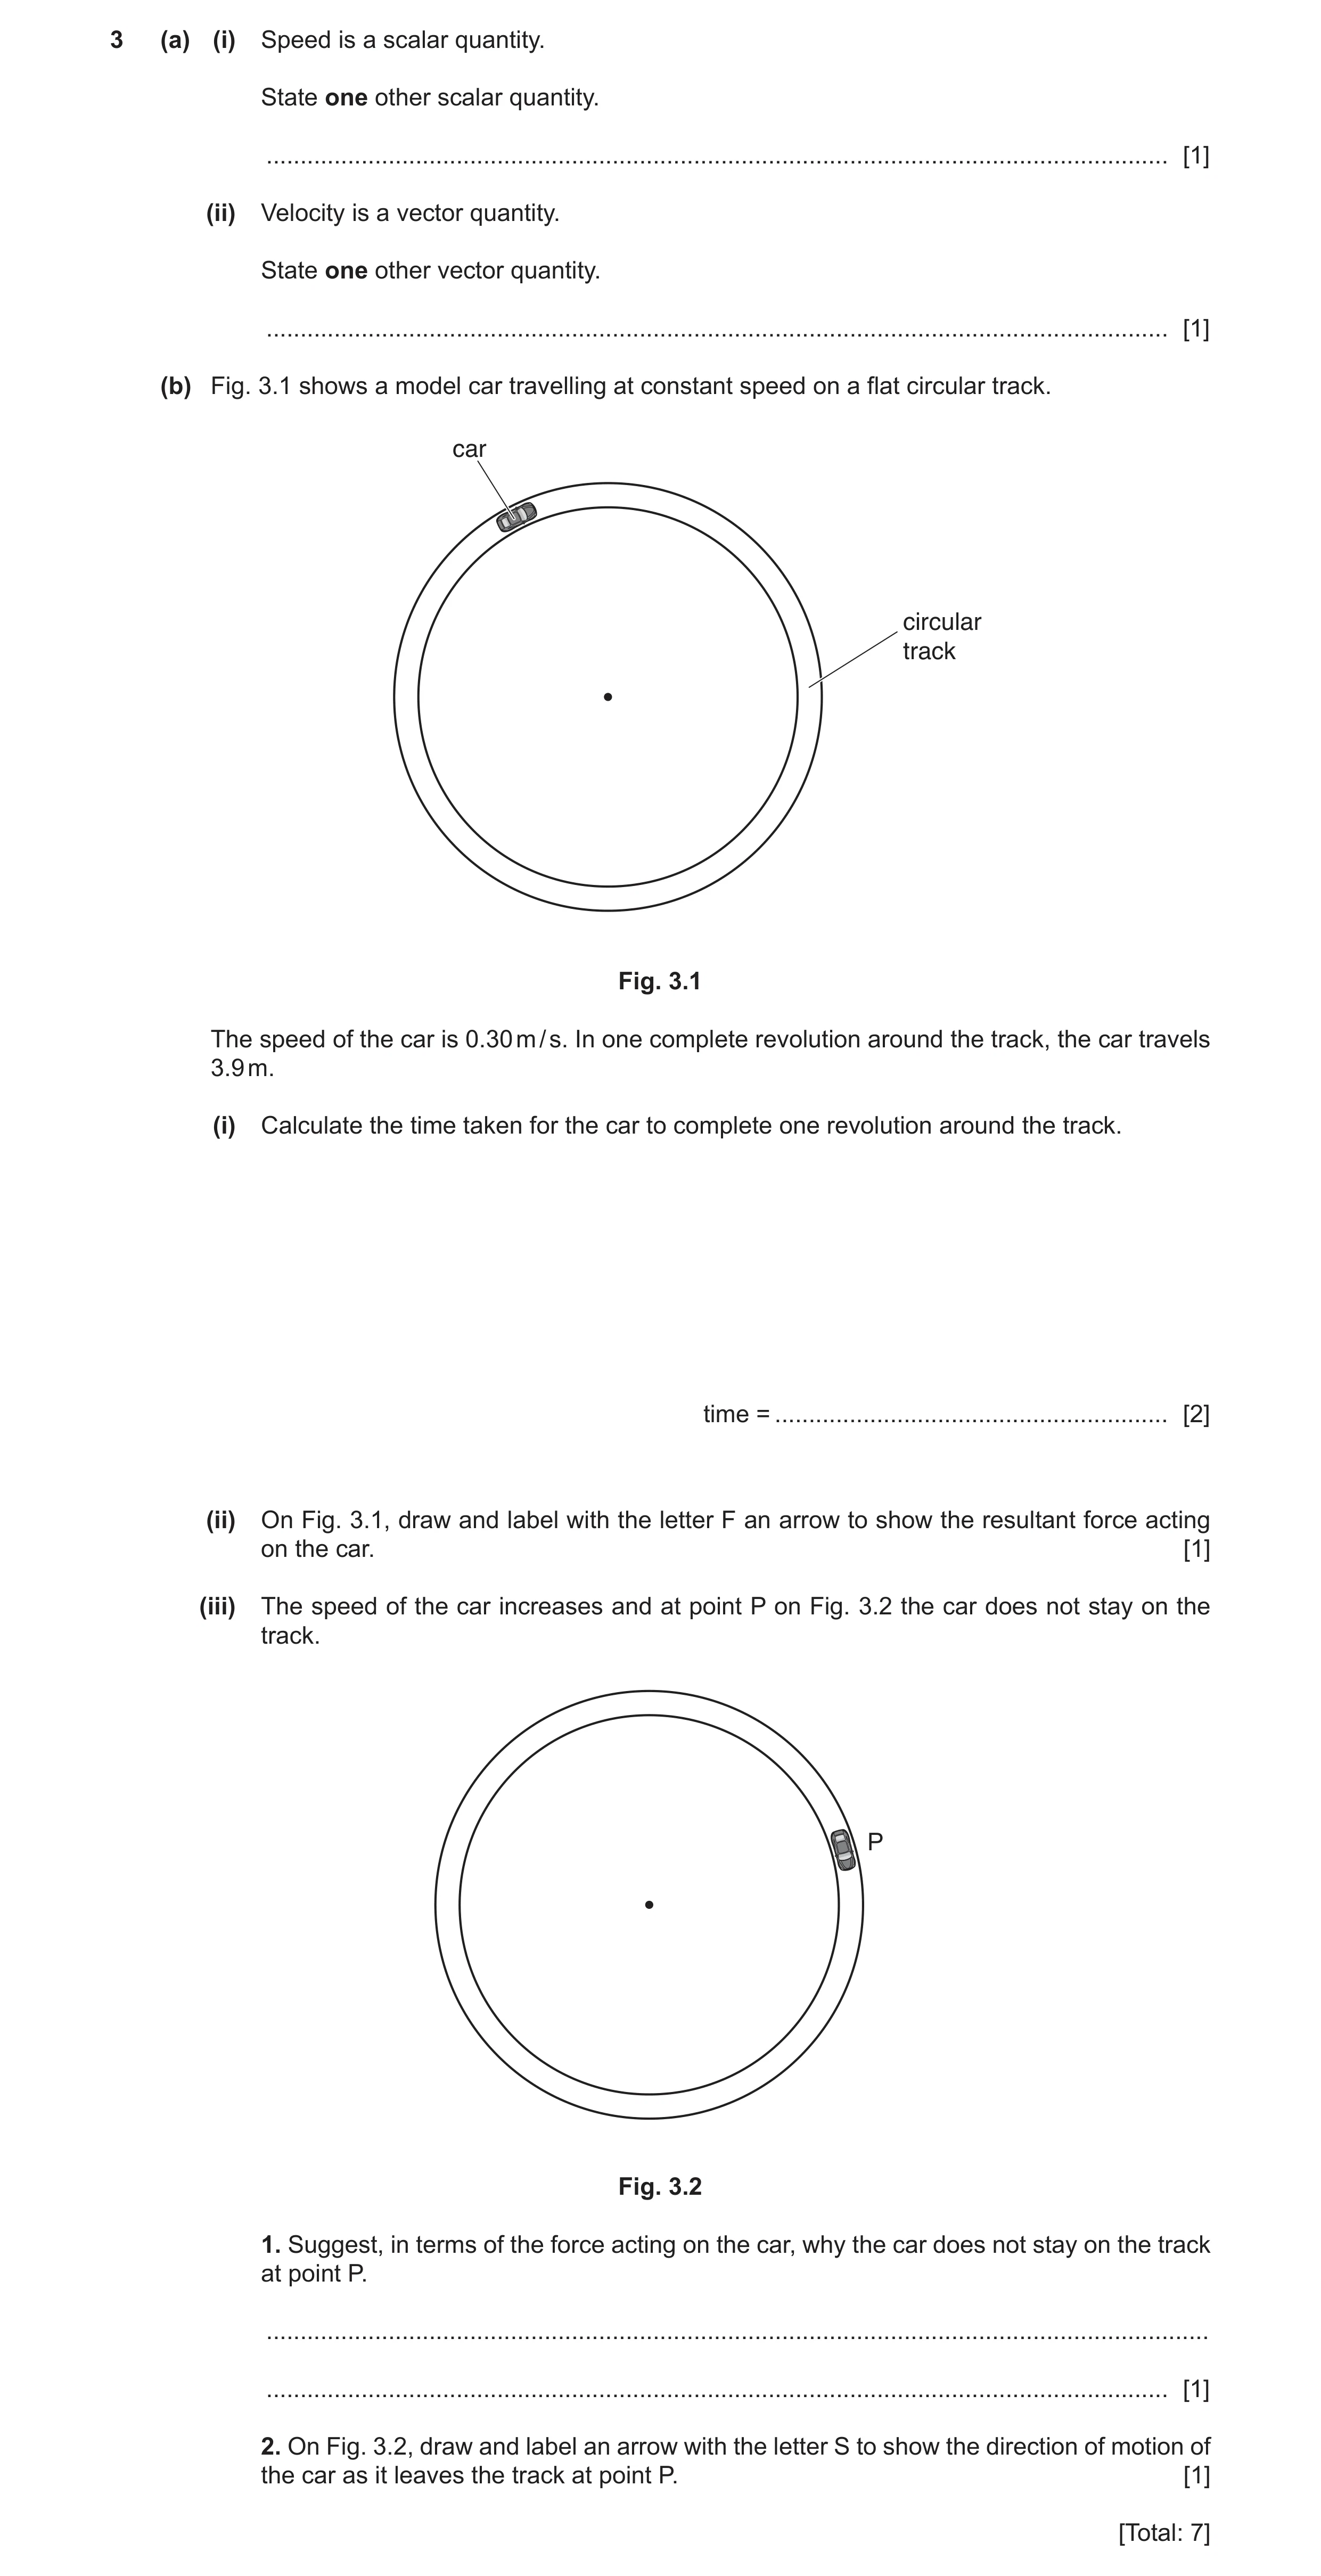
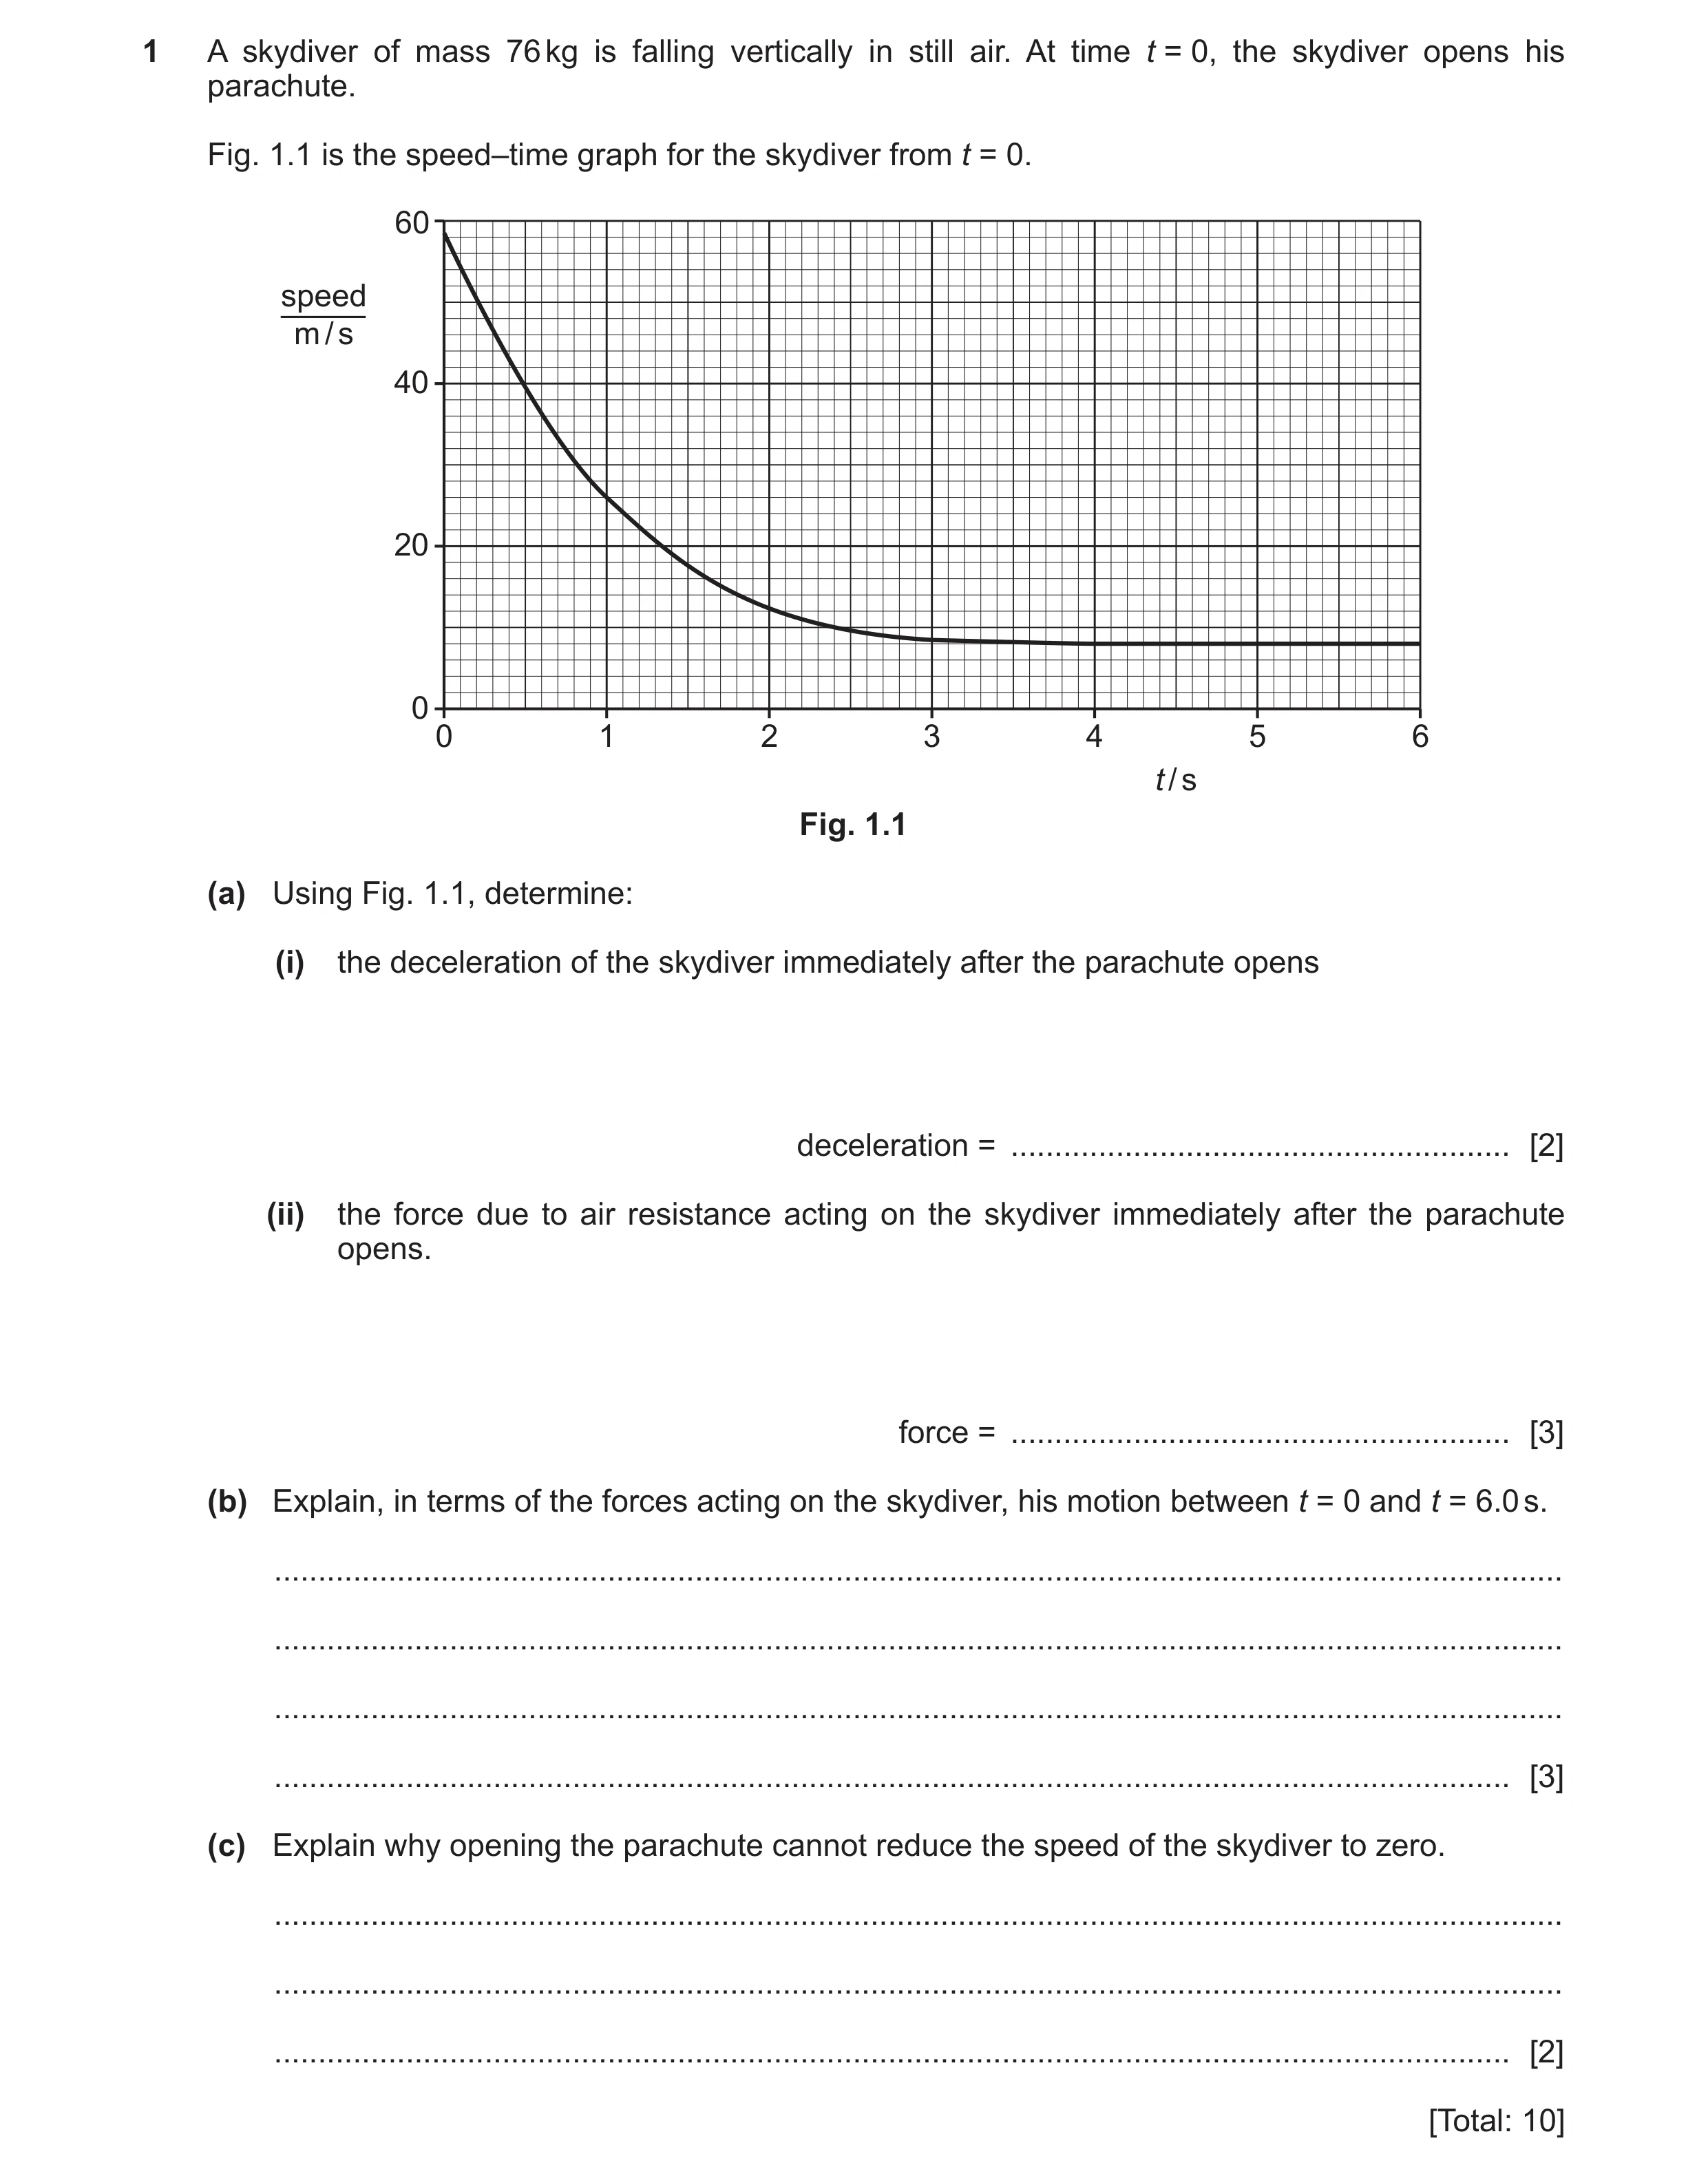 37 / 78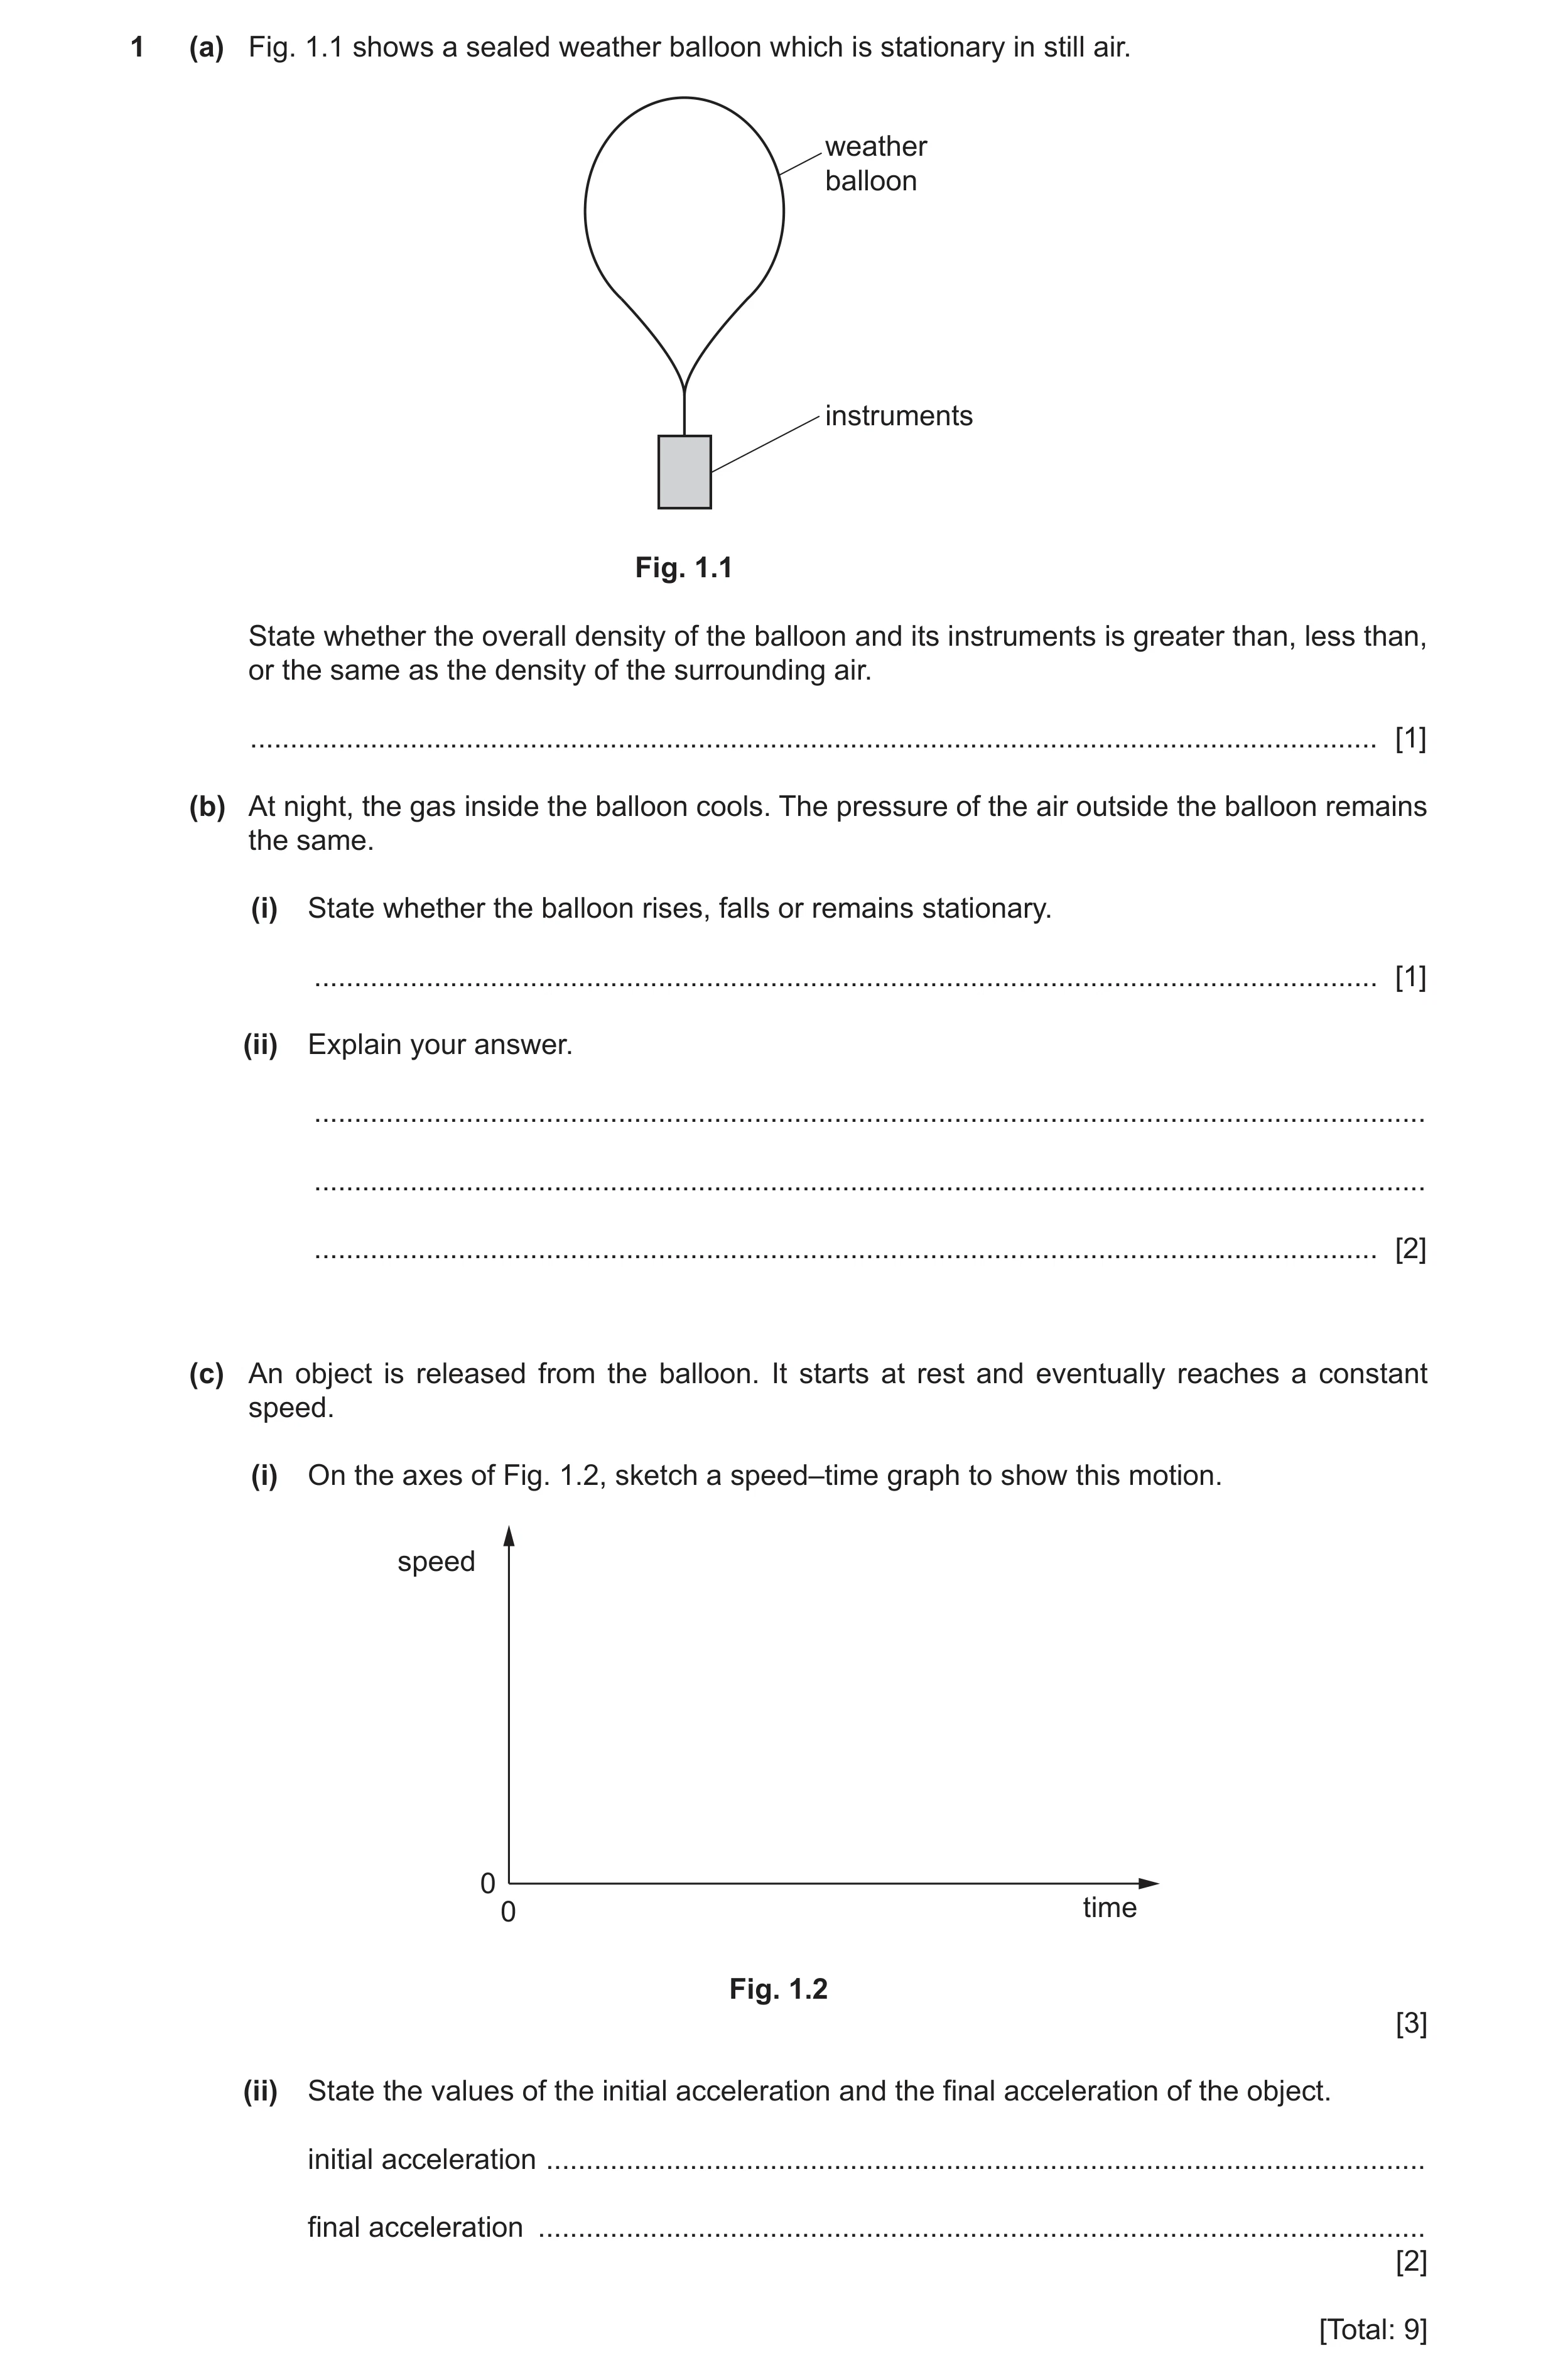
 40 / 78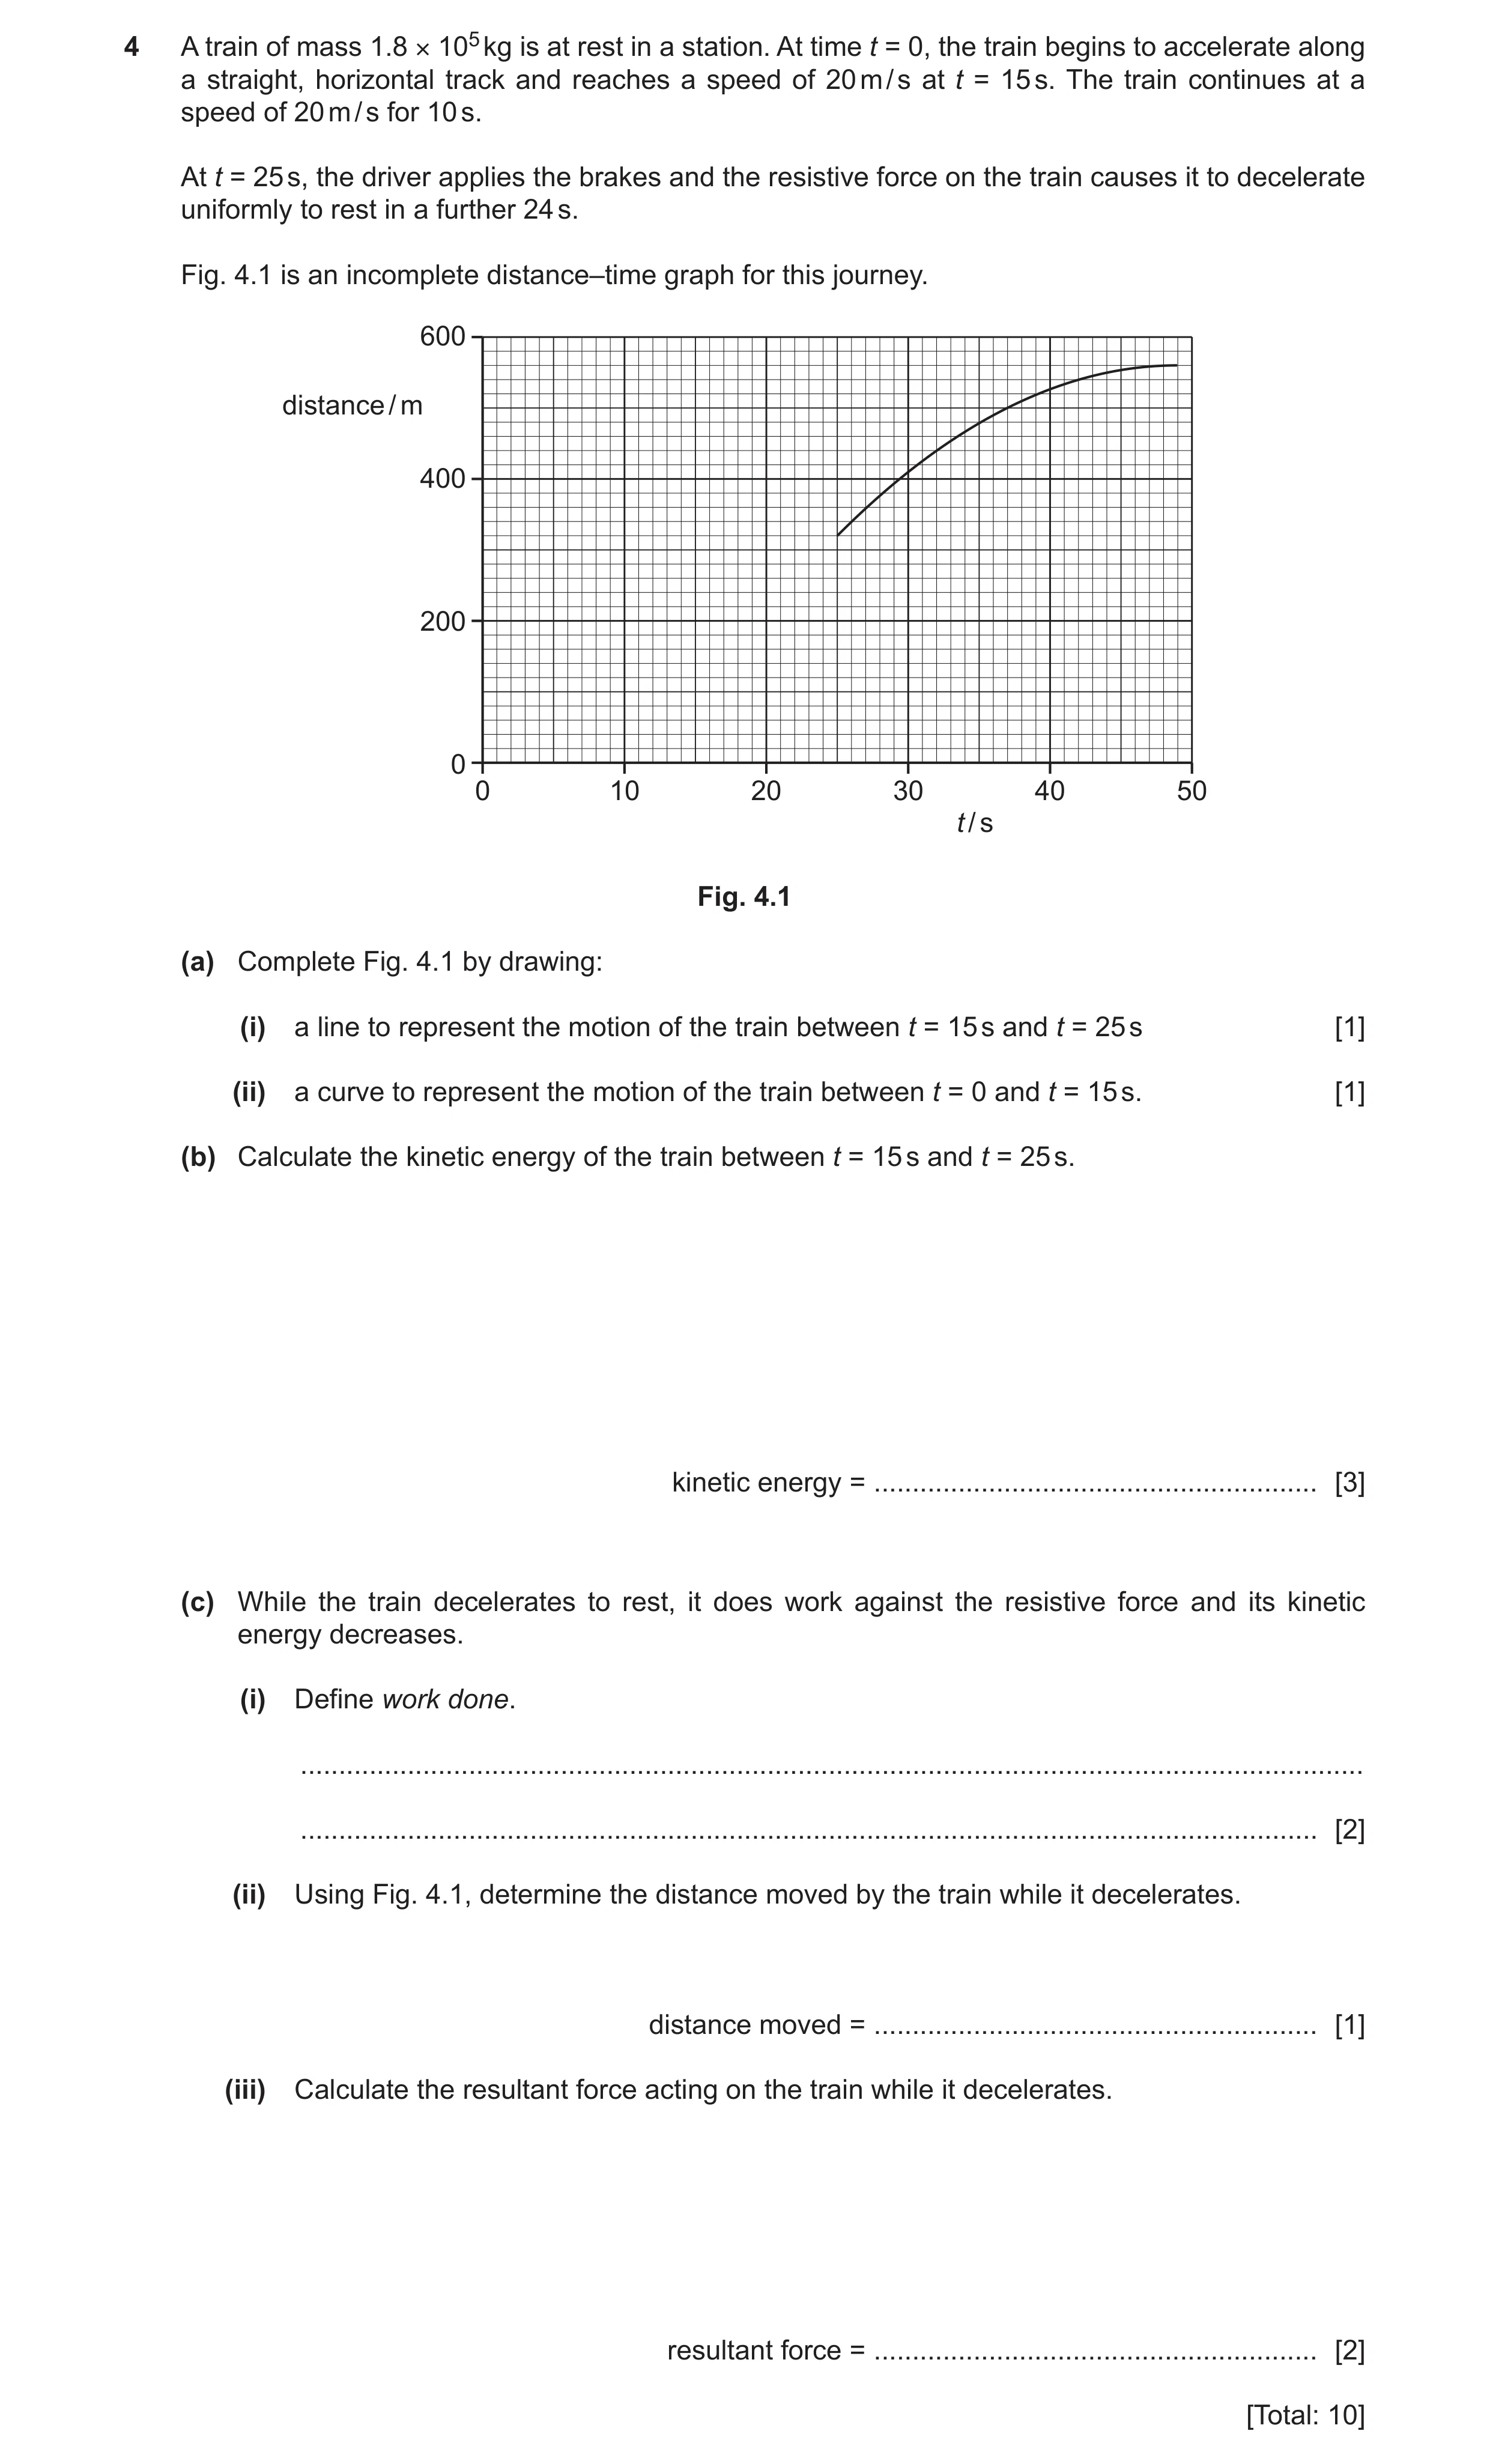
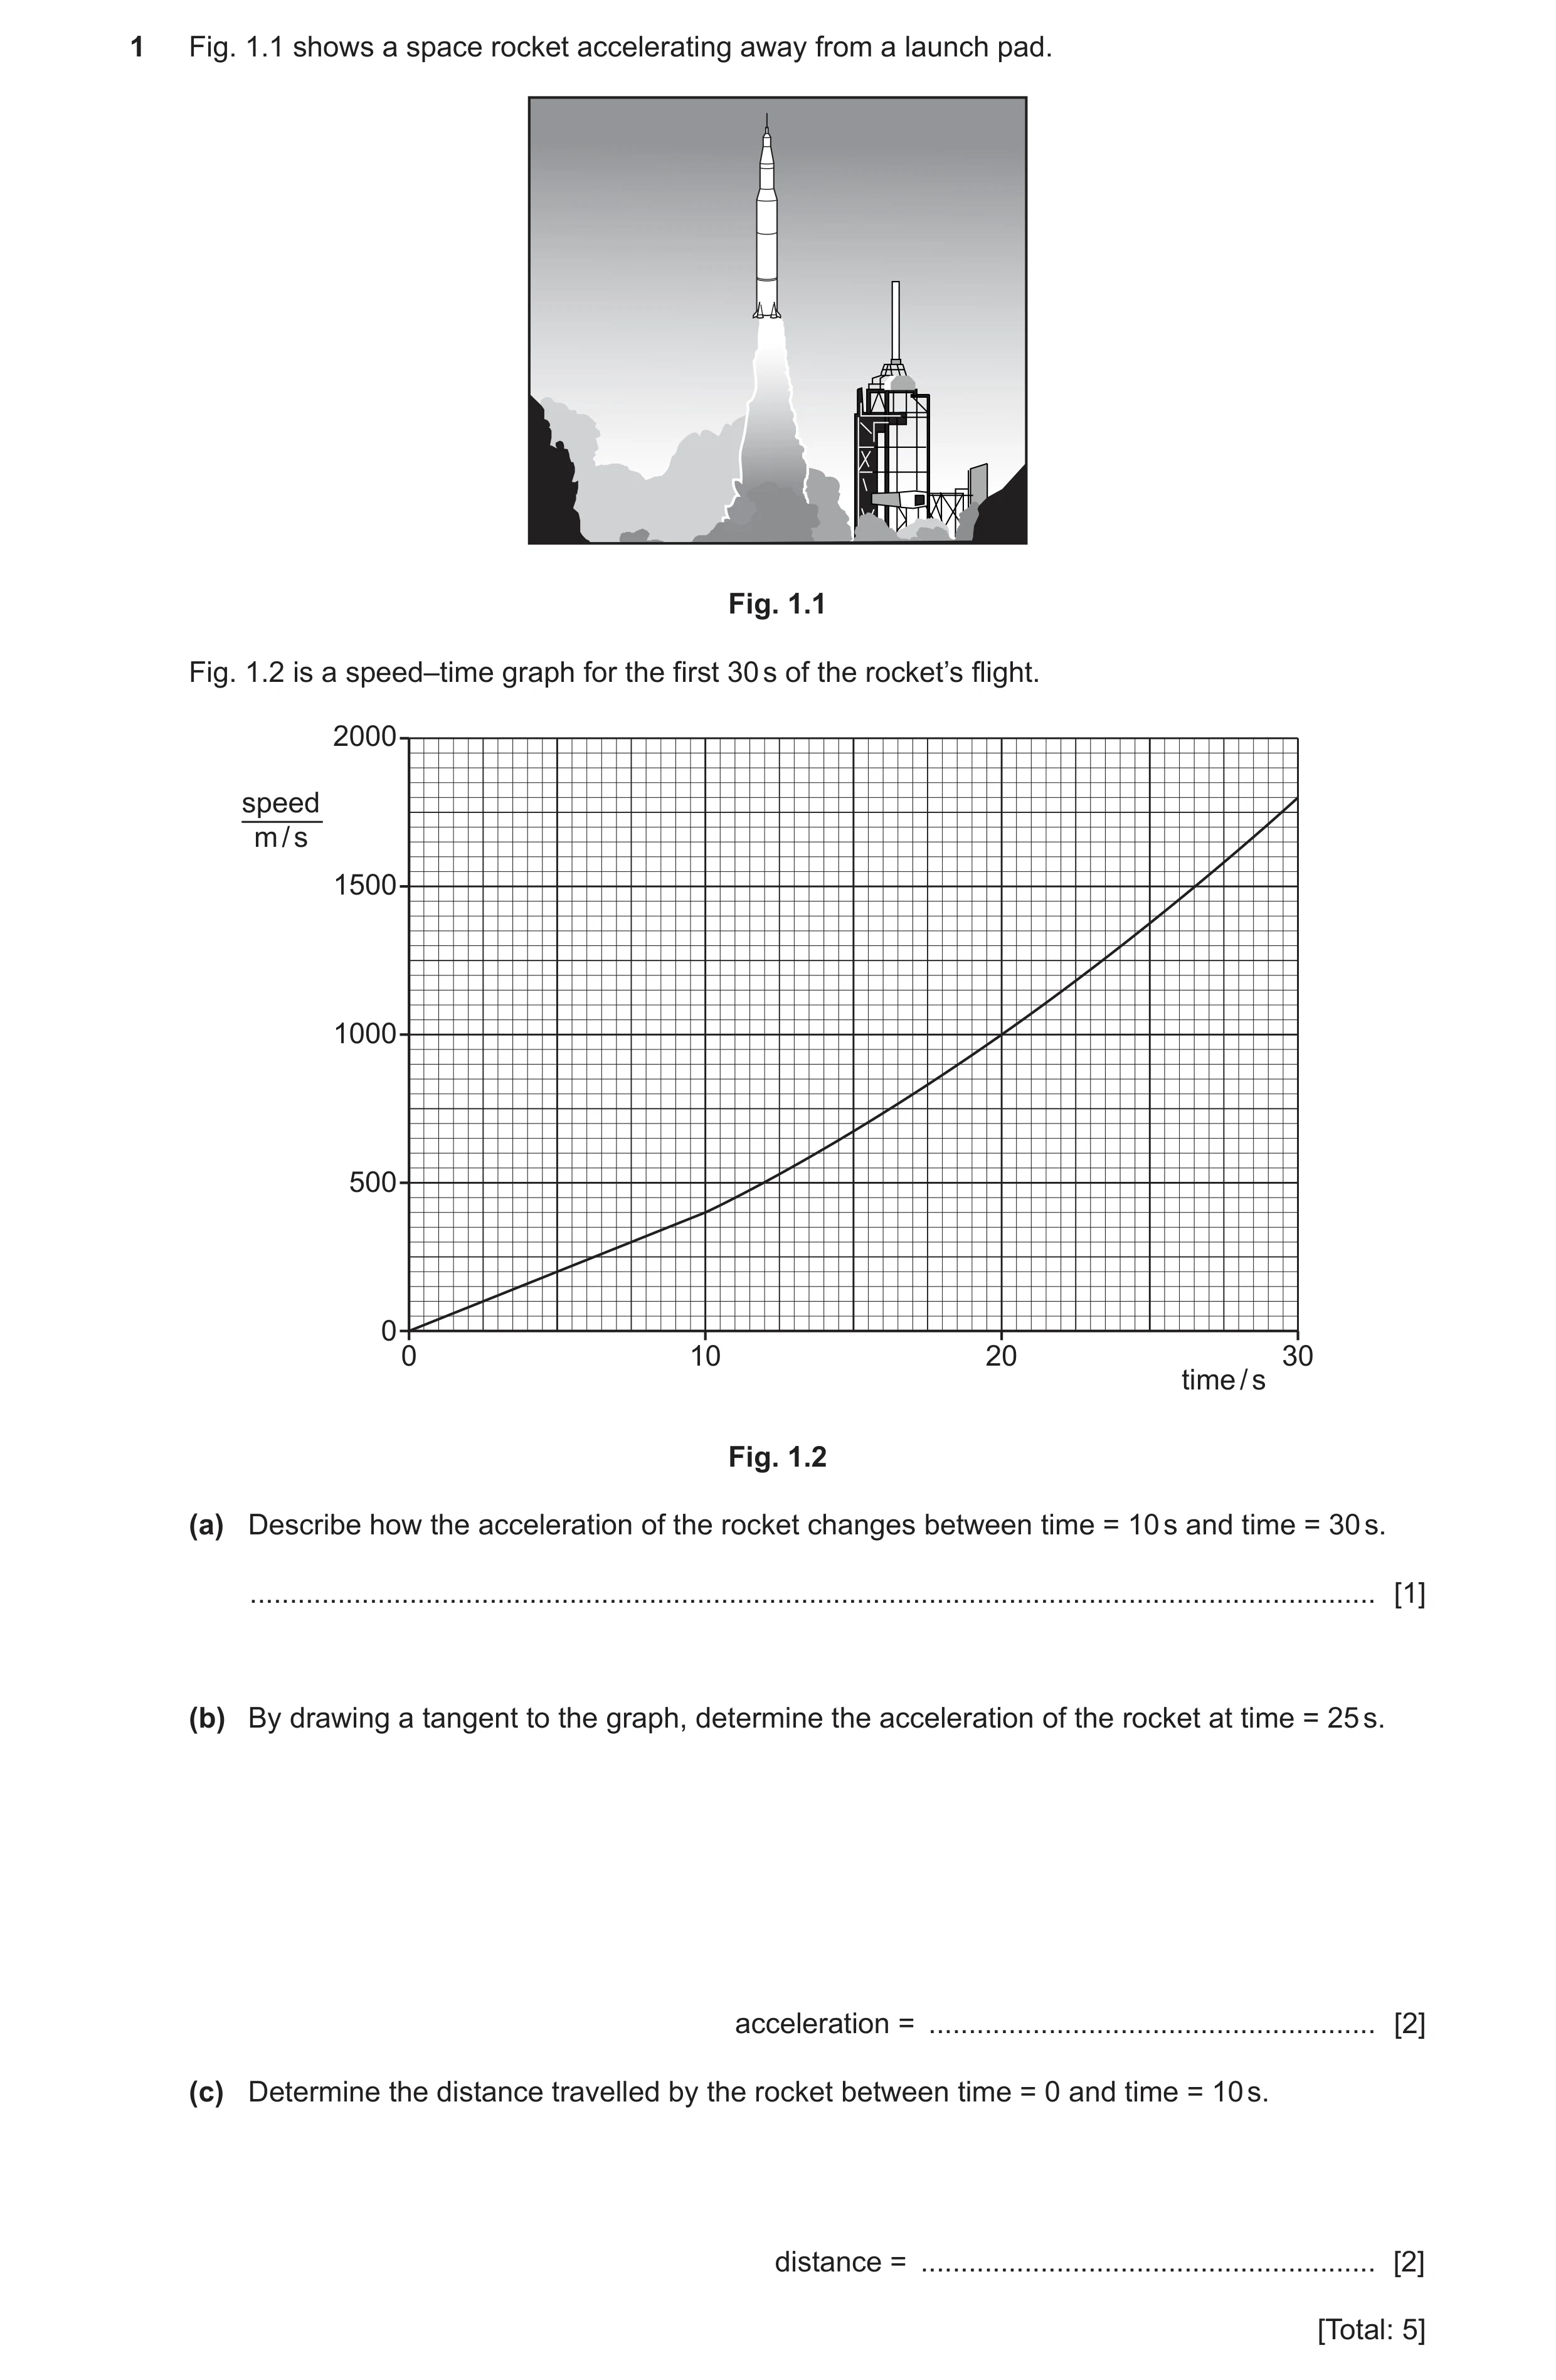
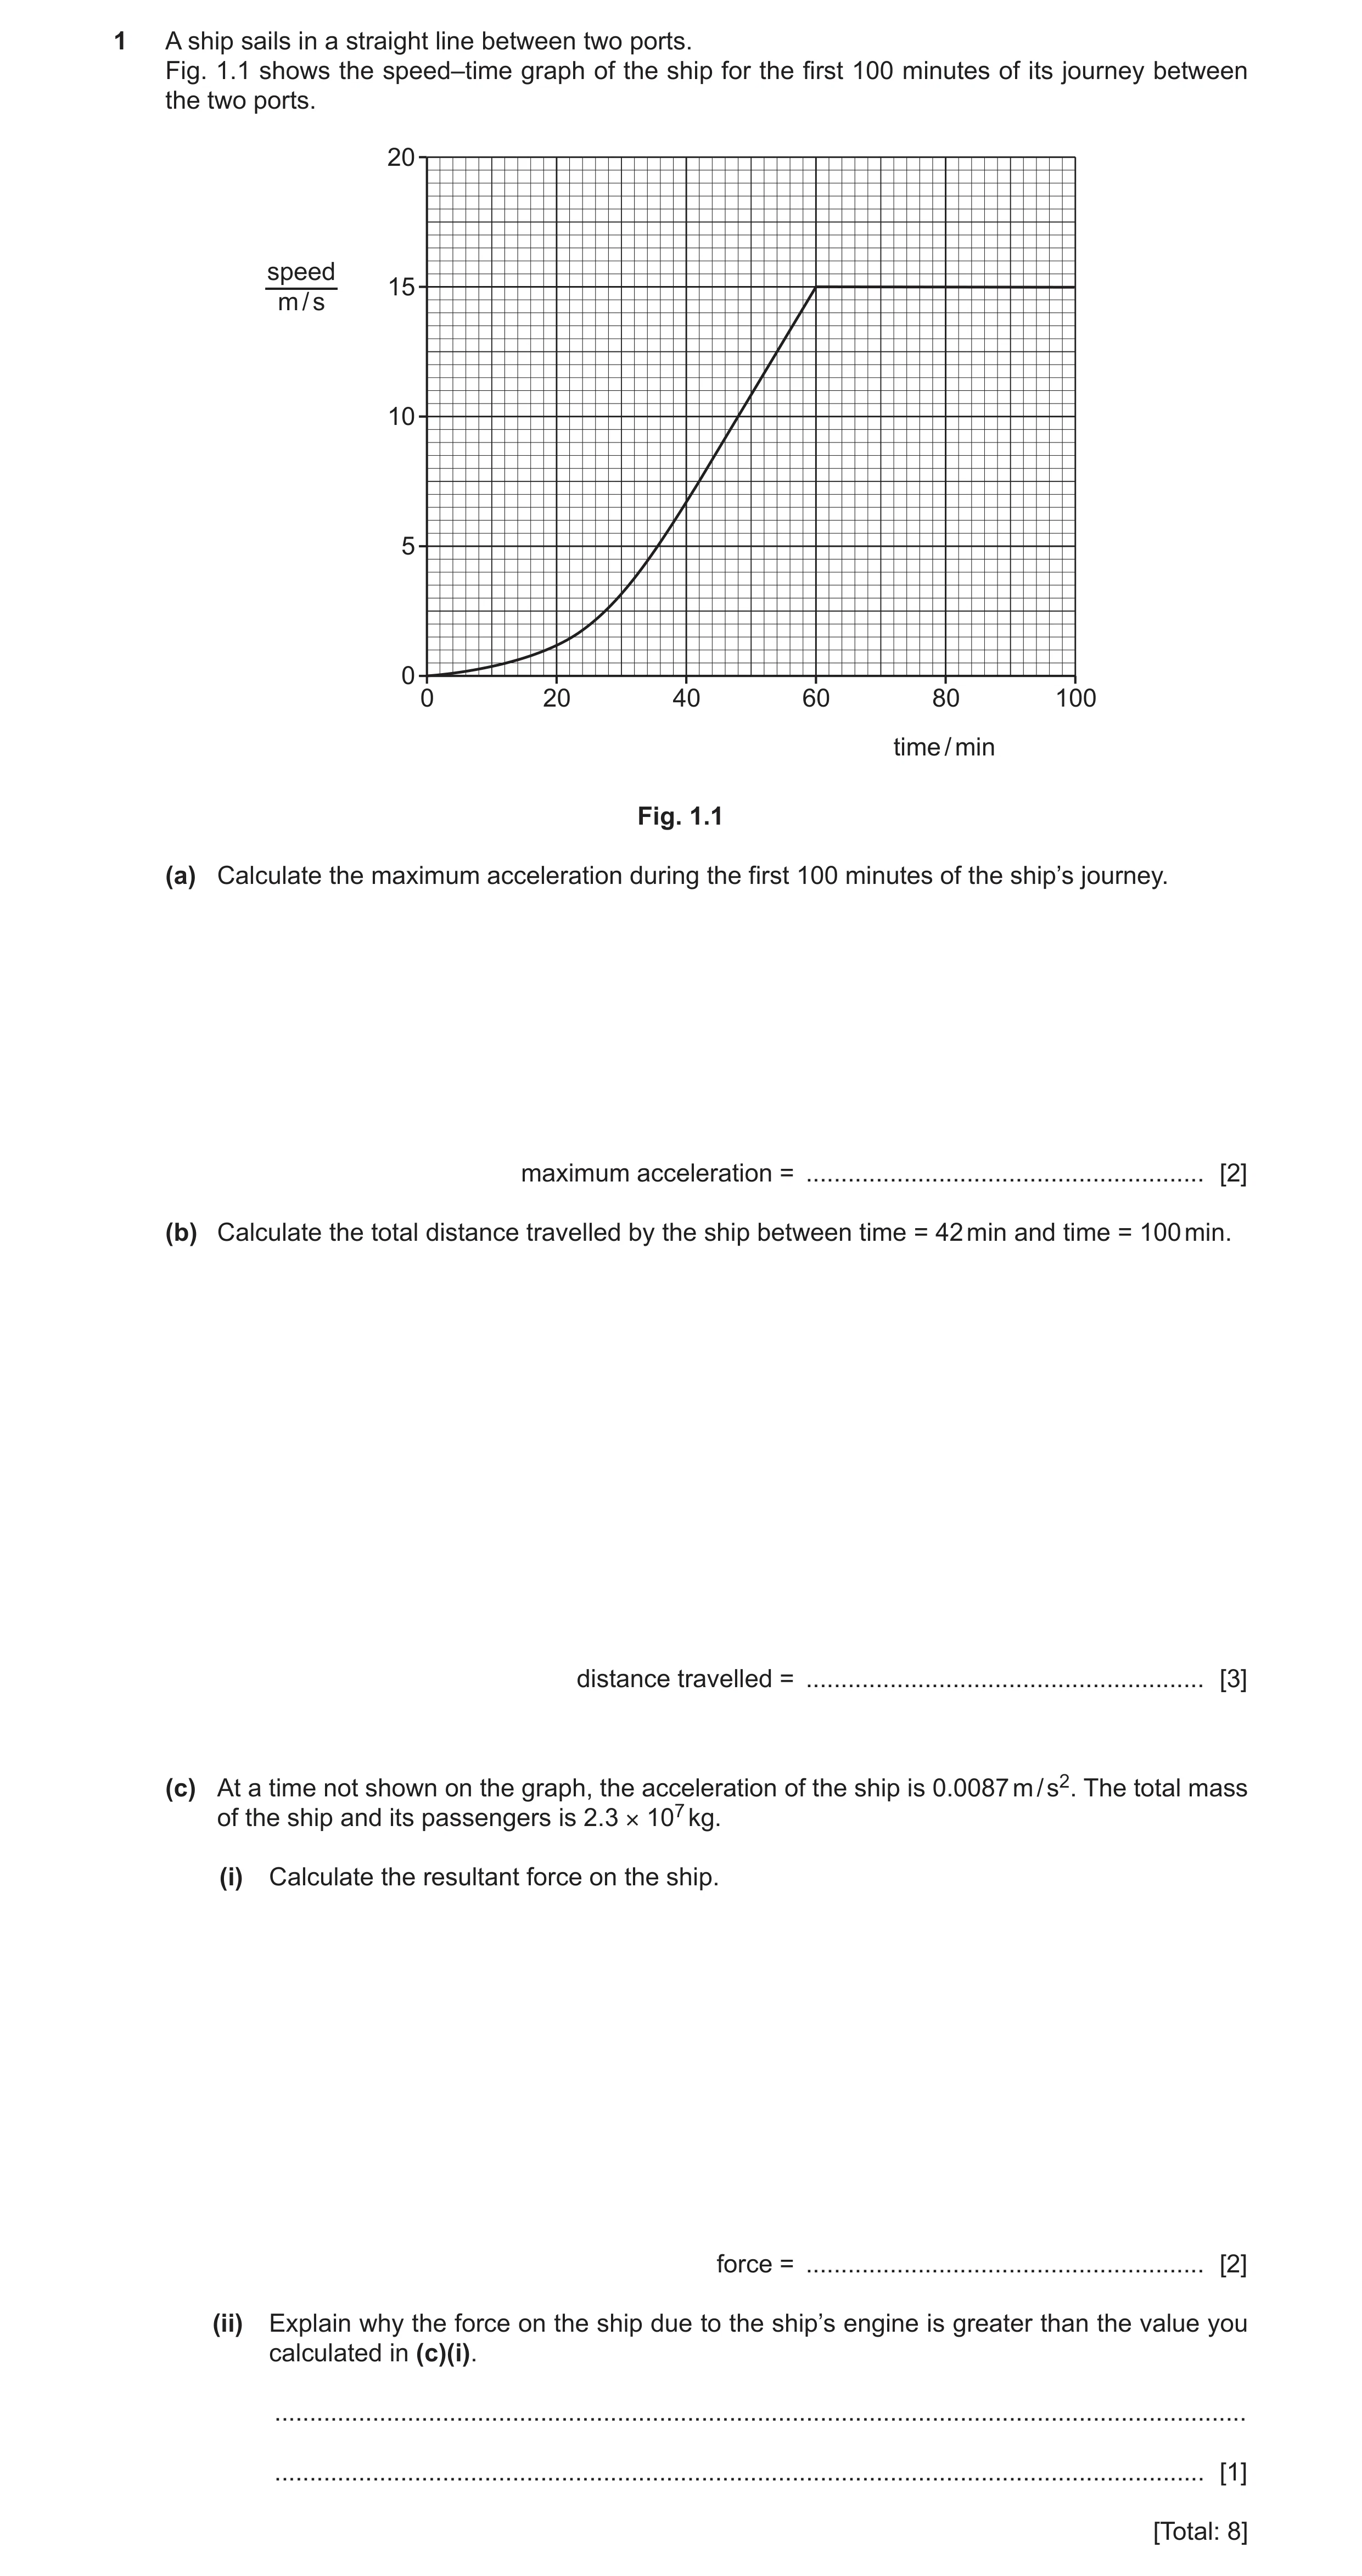
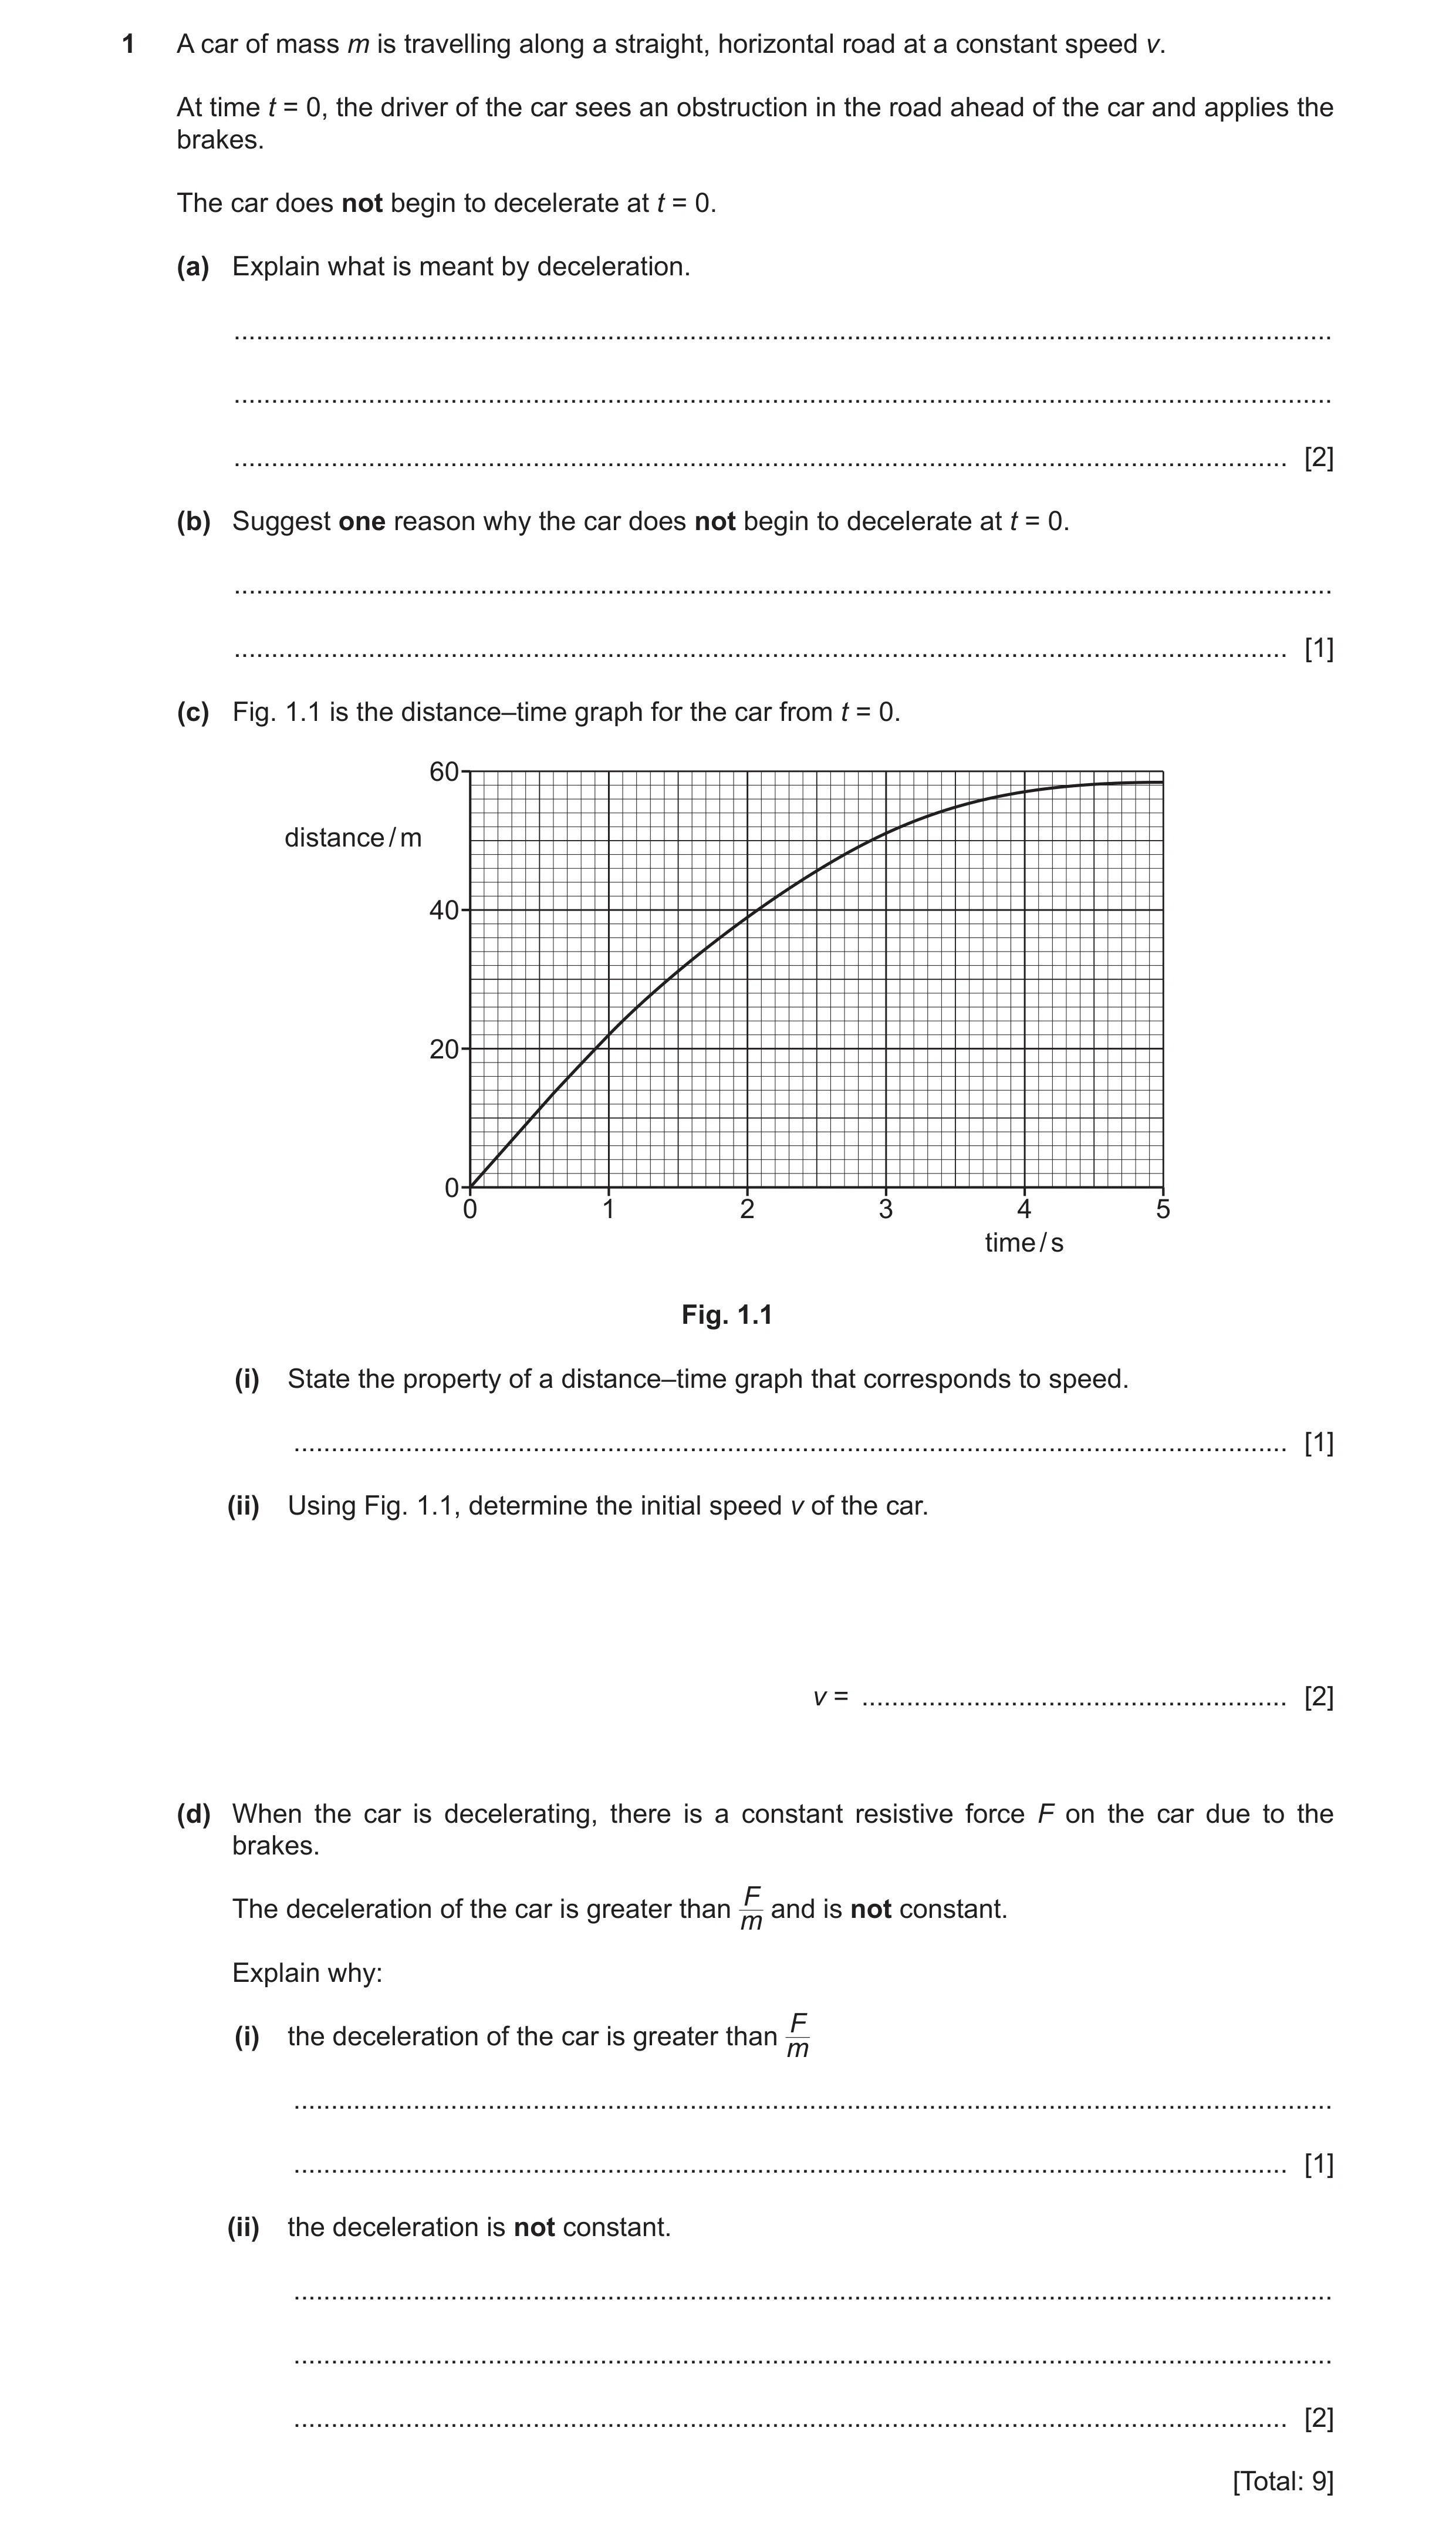
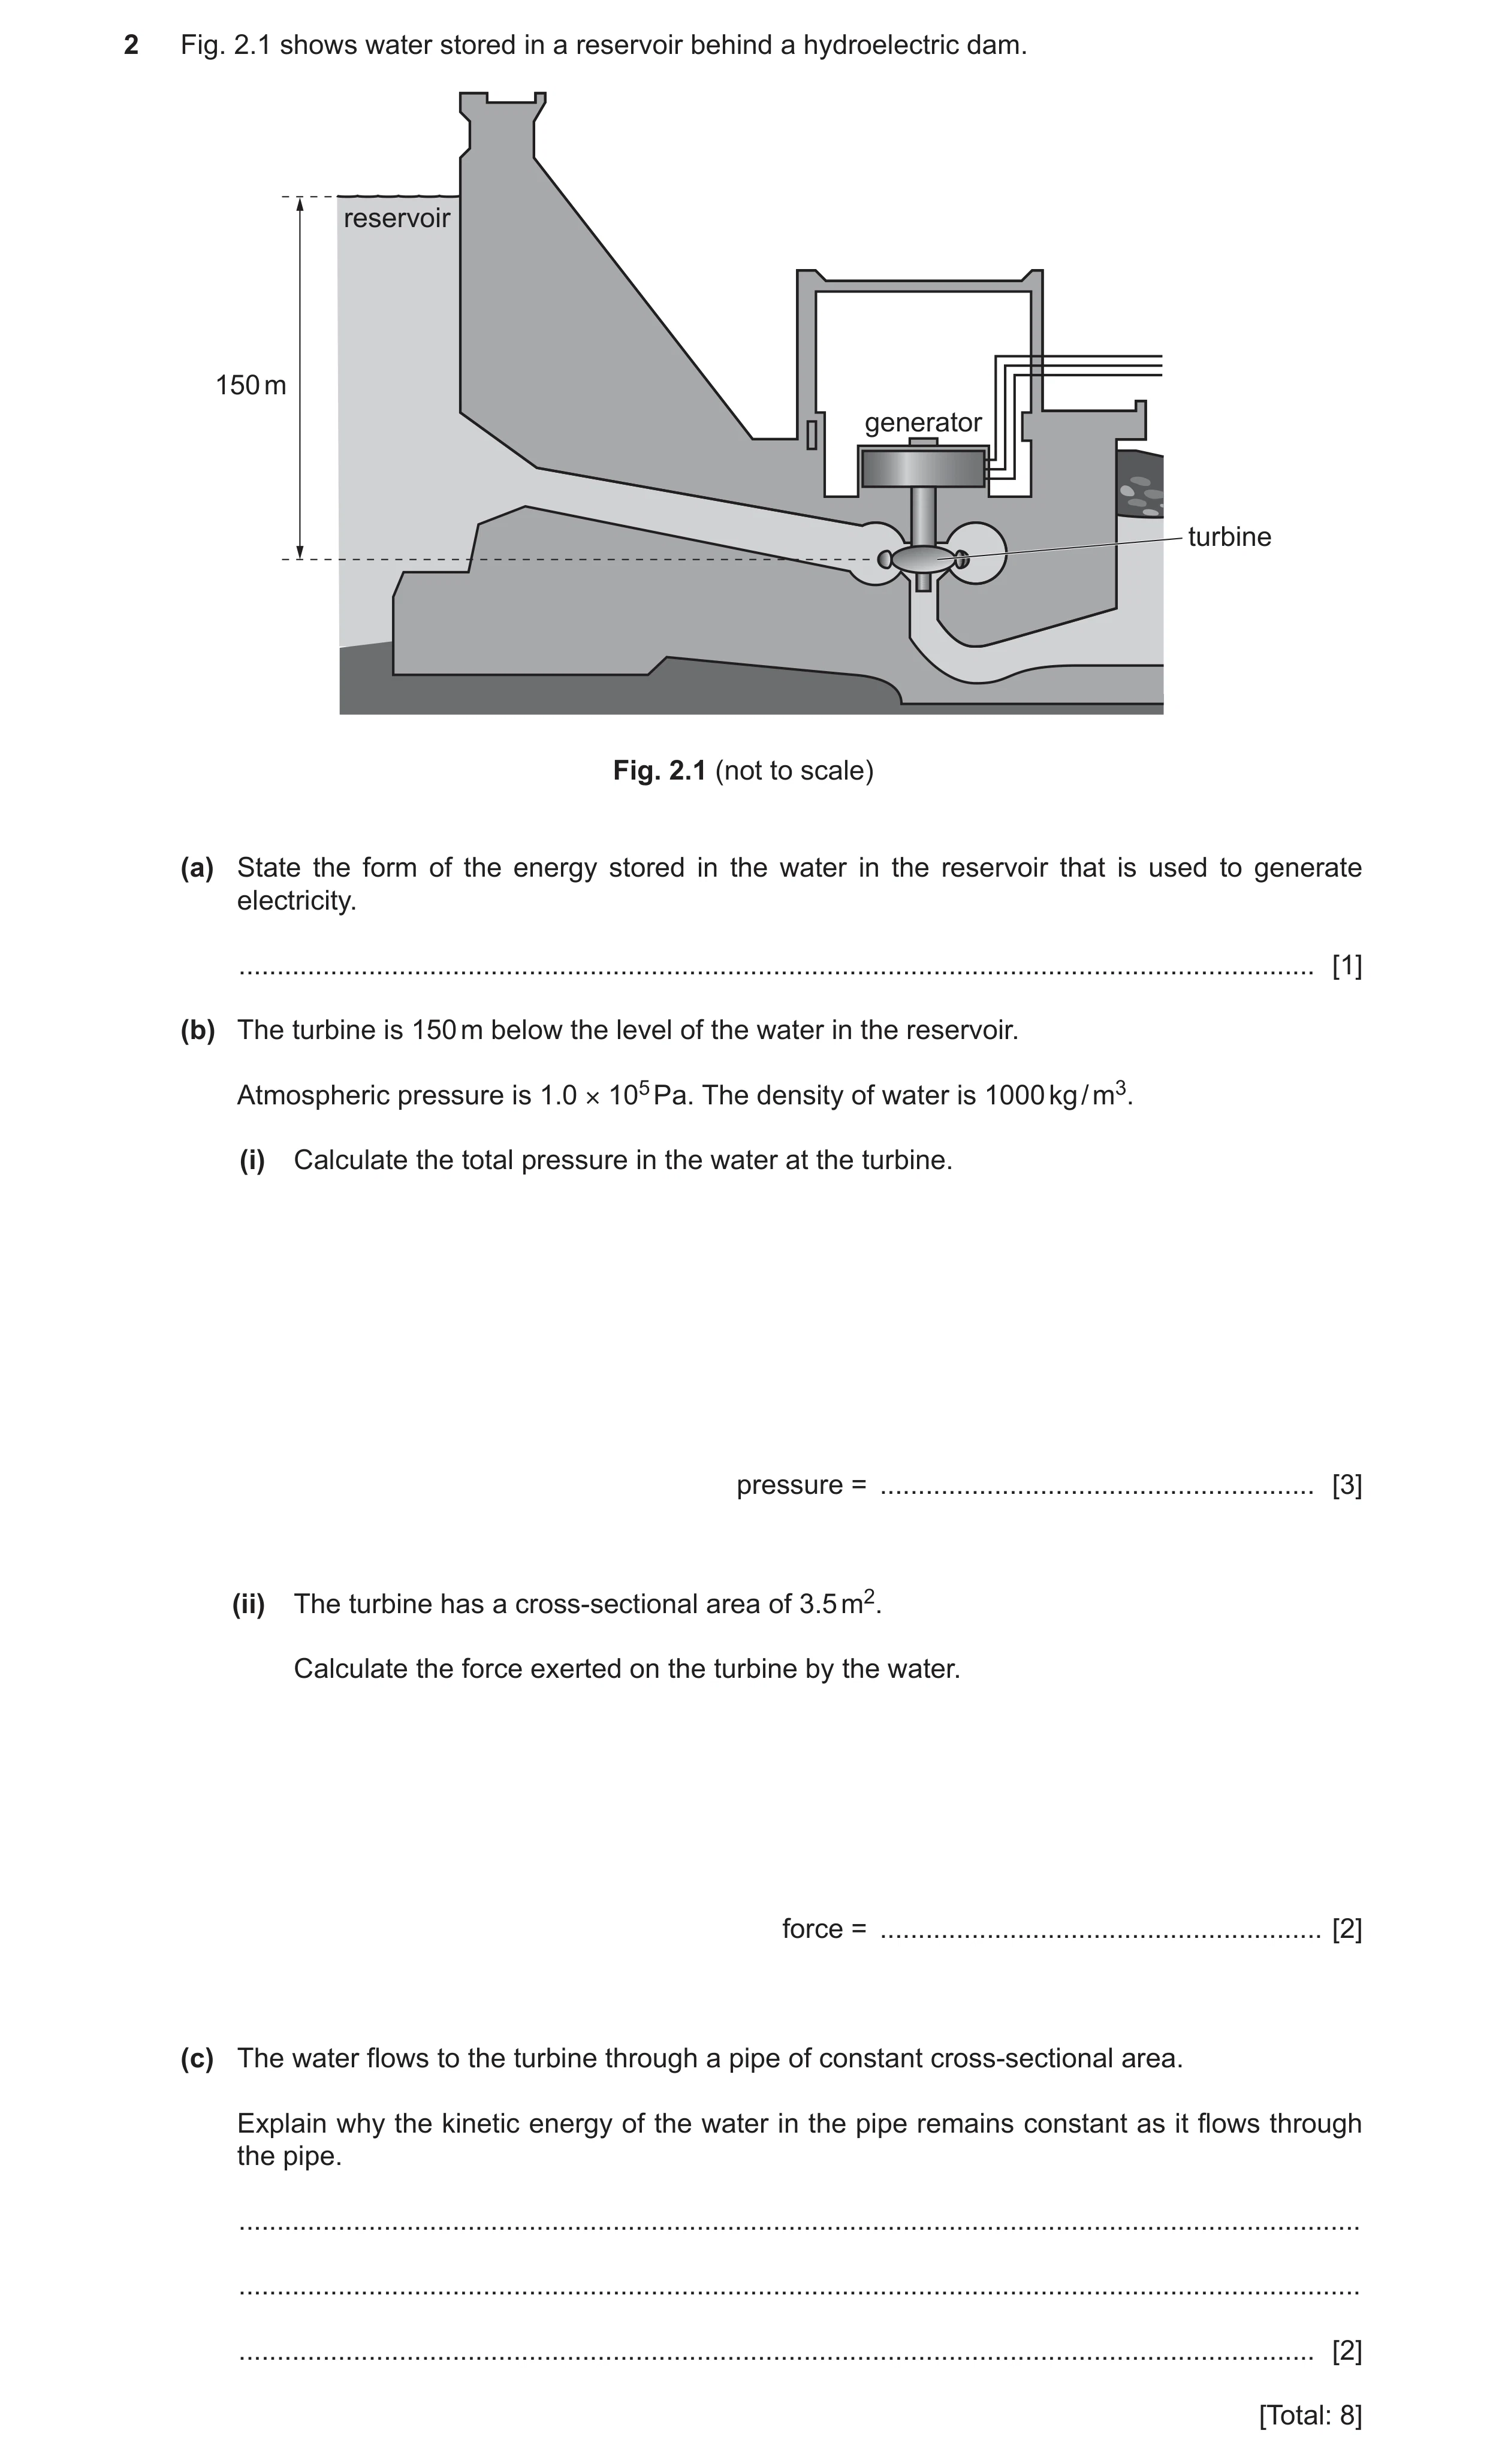
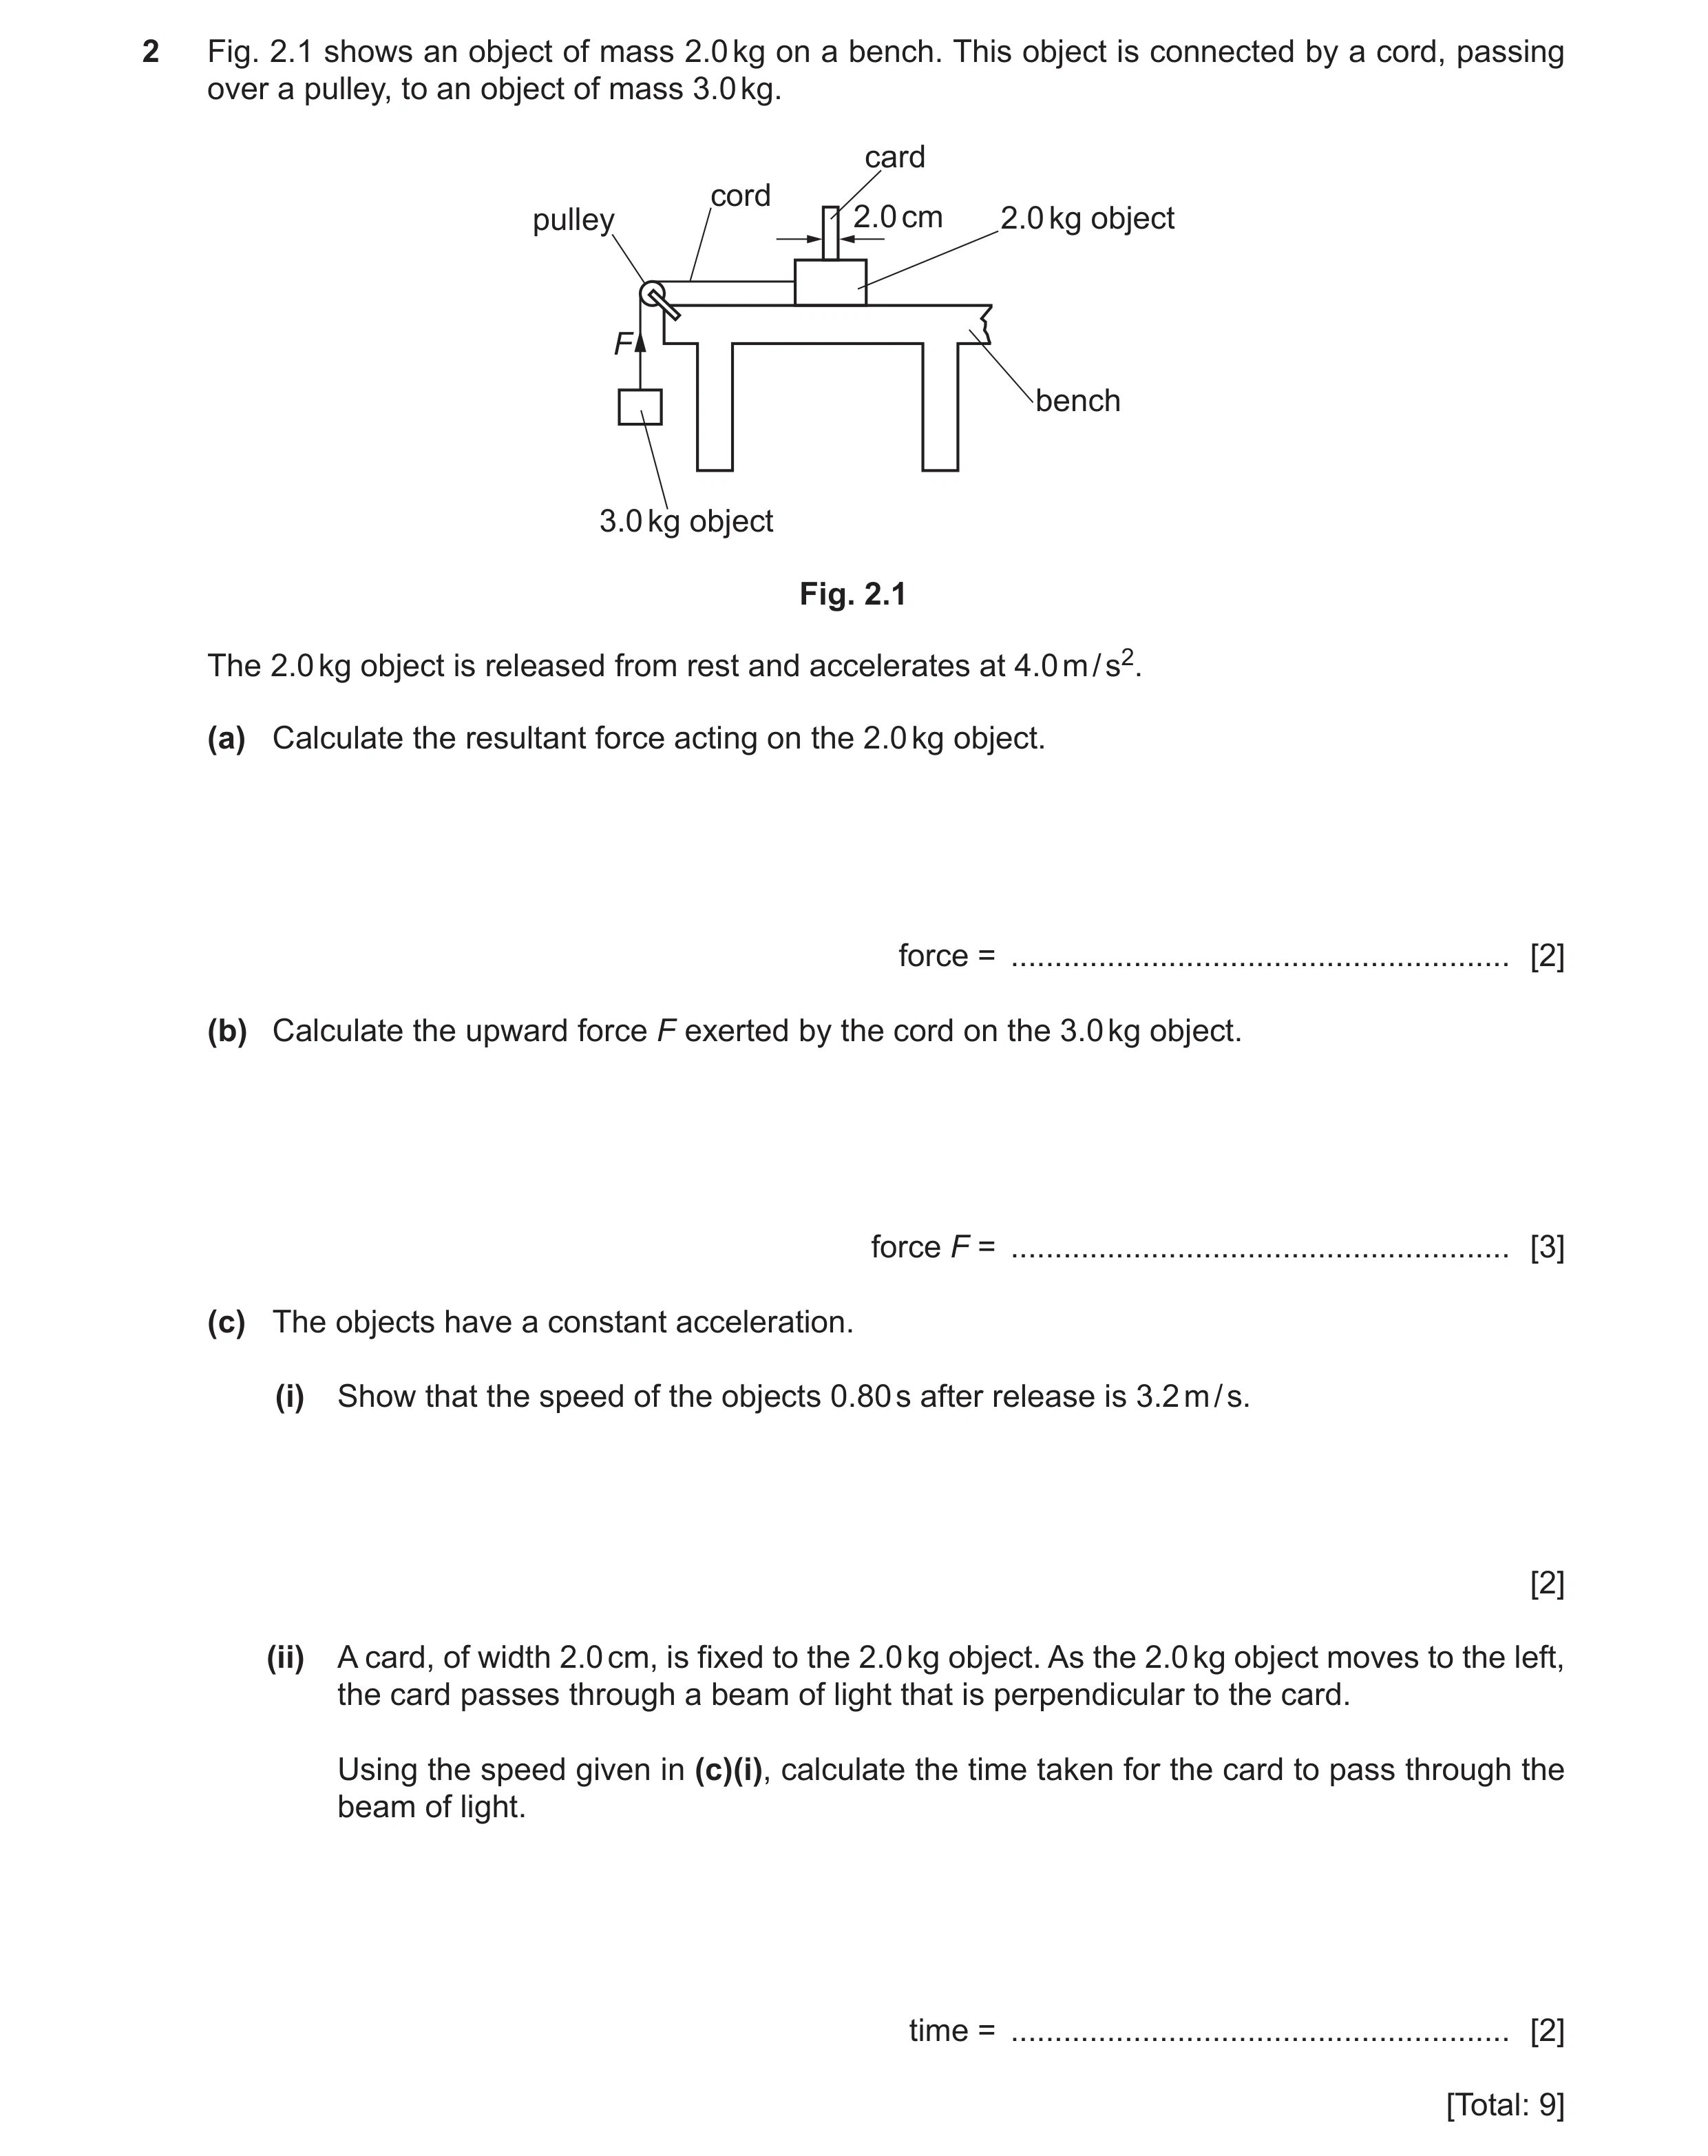 48 / 78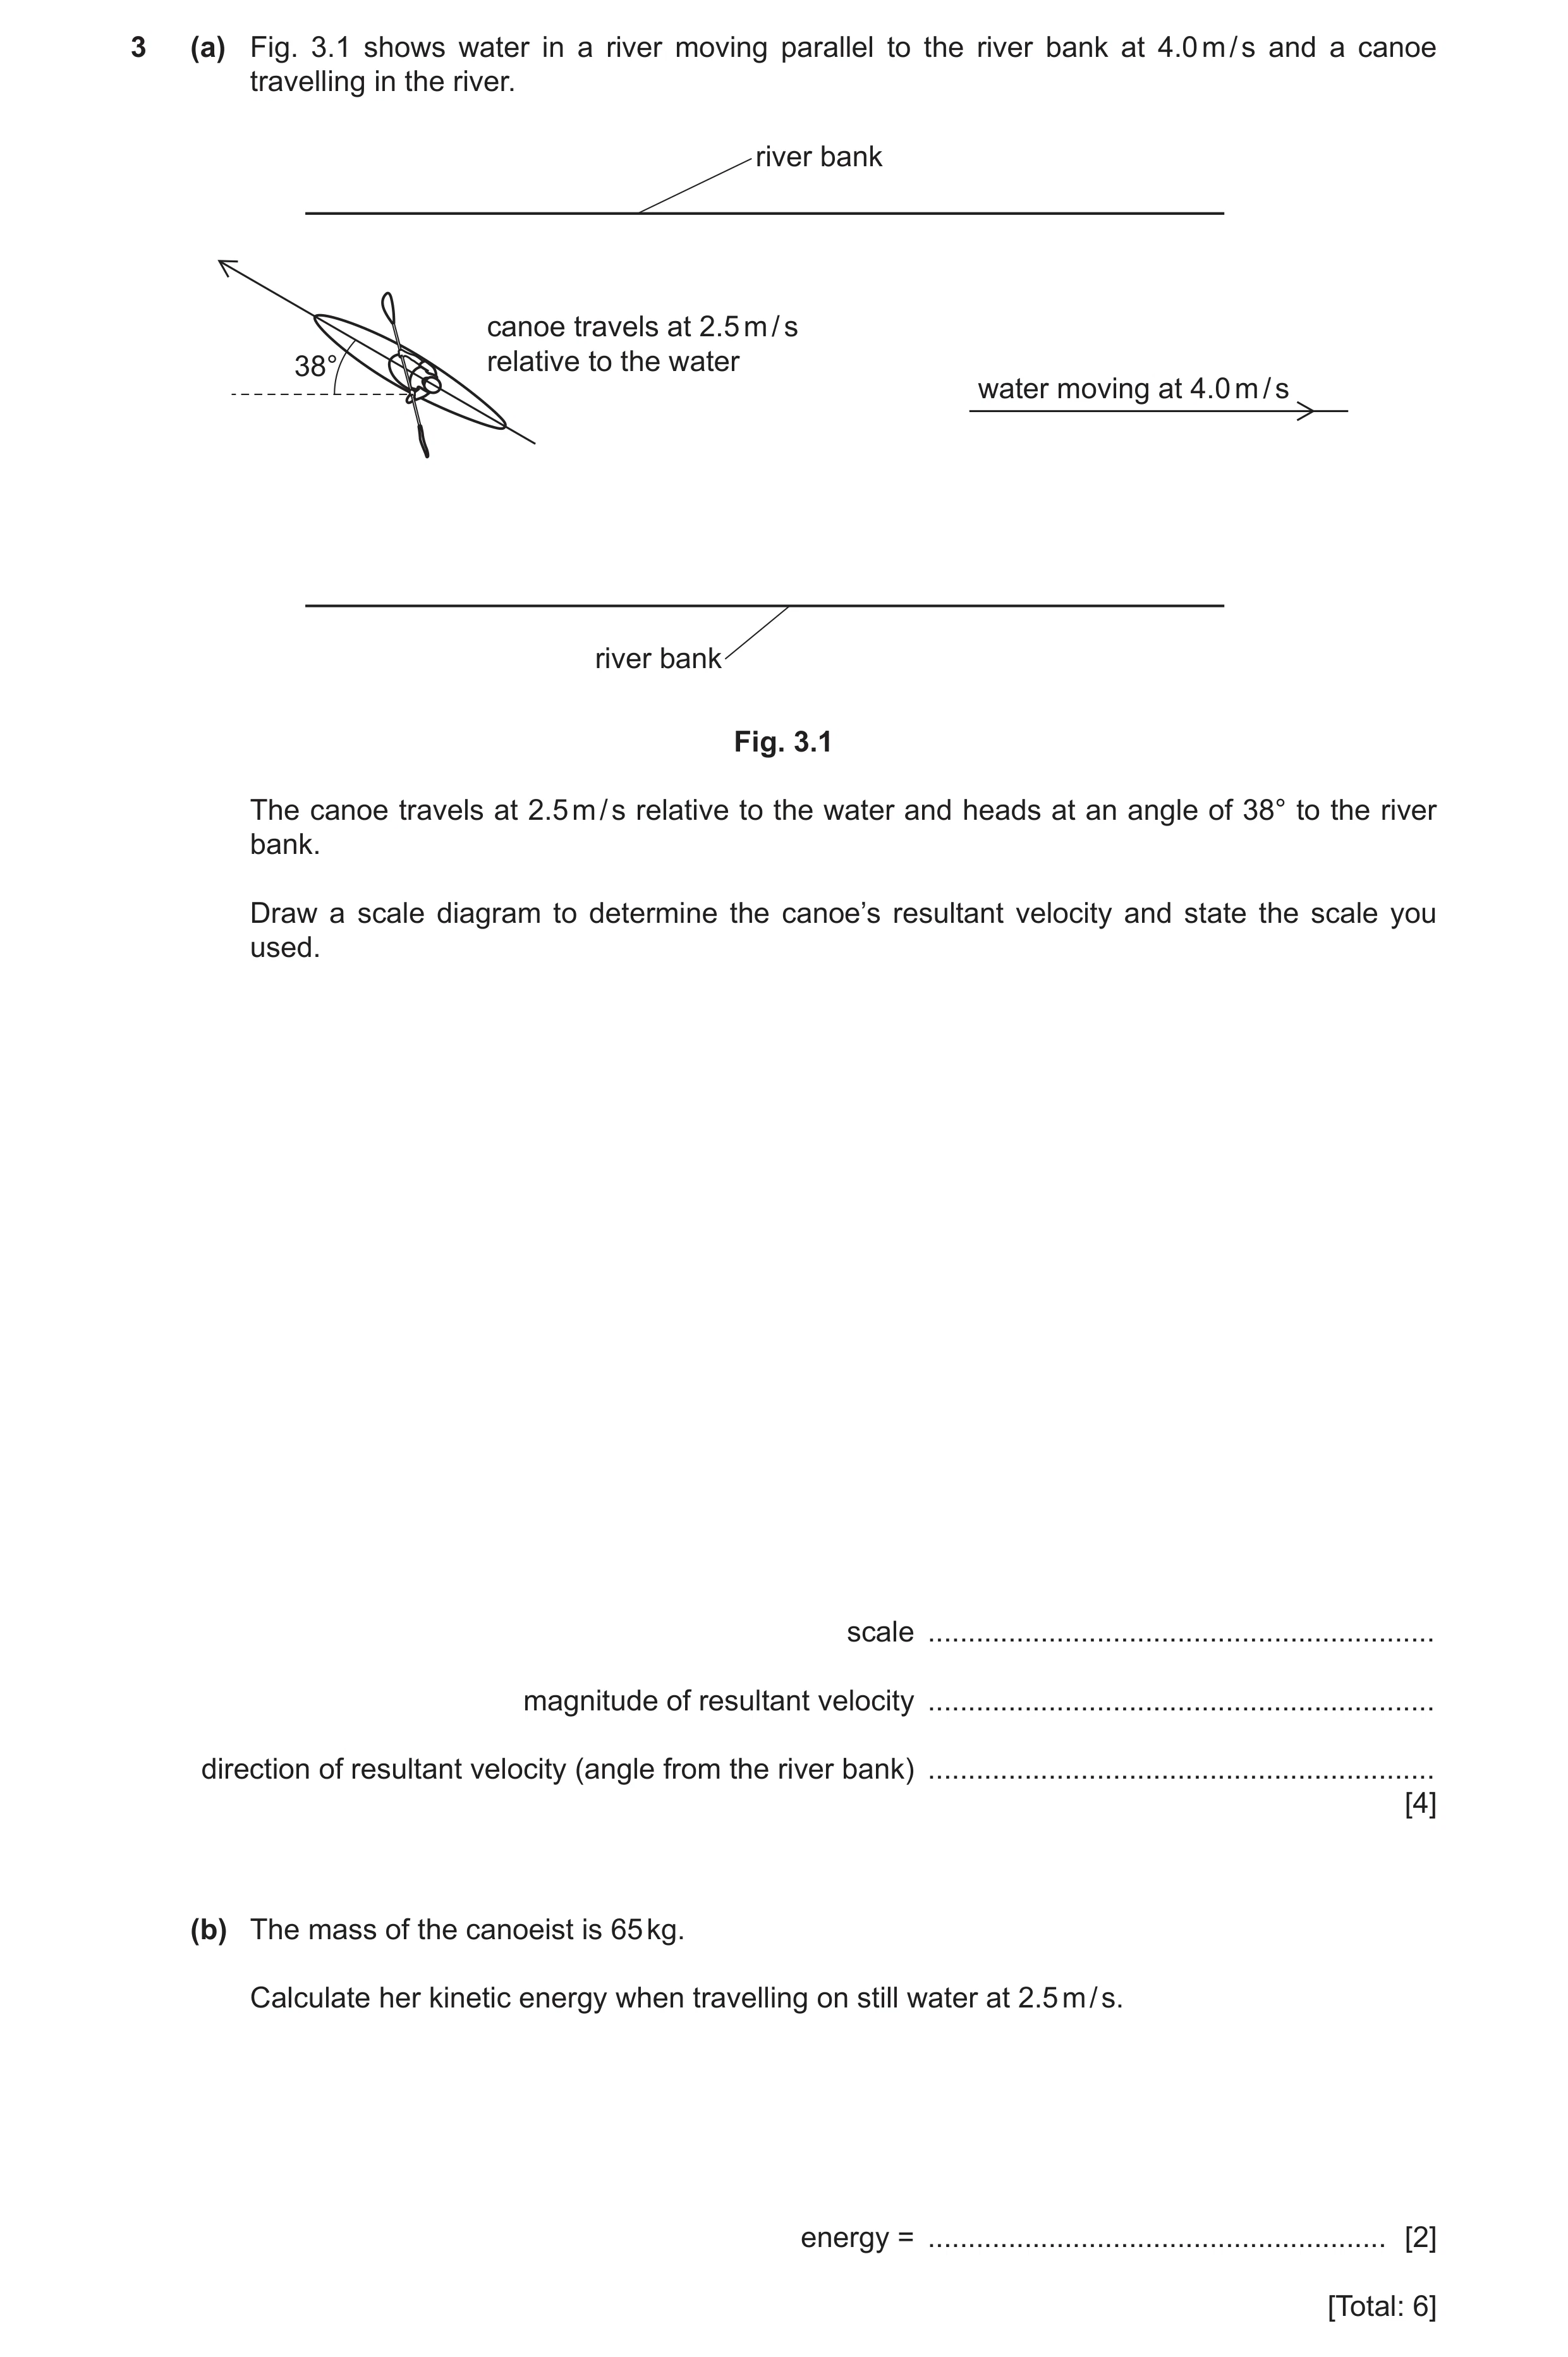
 51 / 78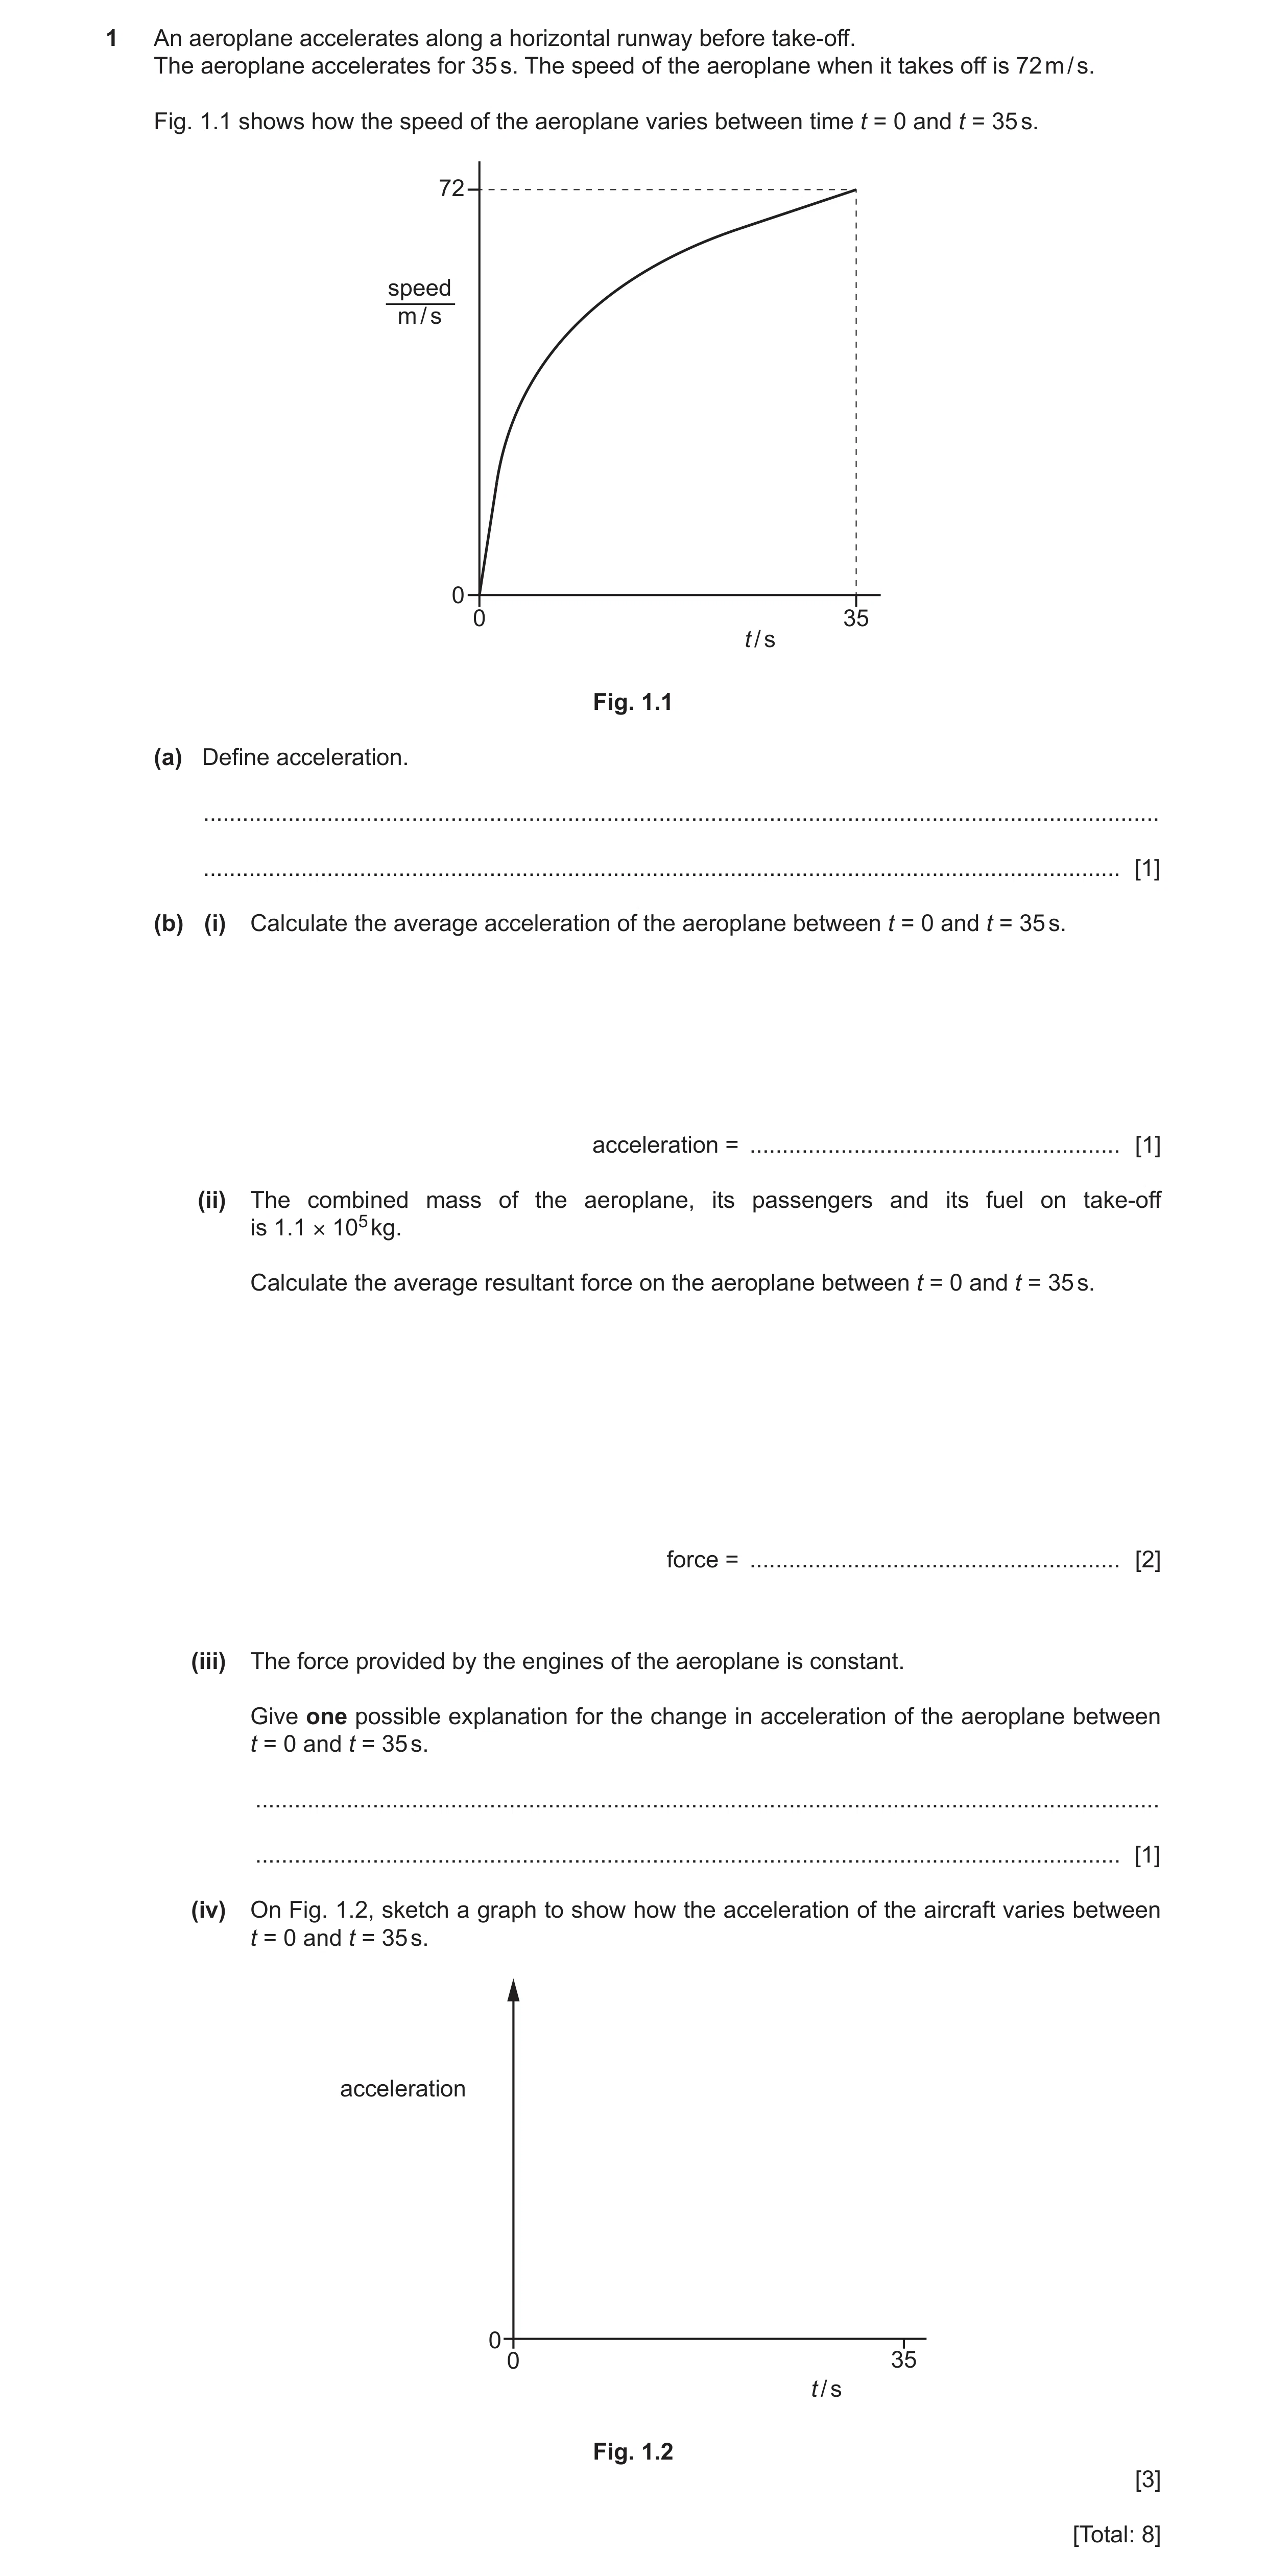
 54 / 78
 55 / 78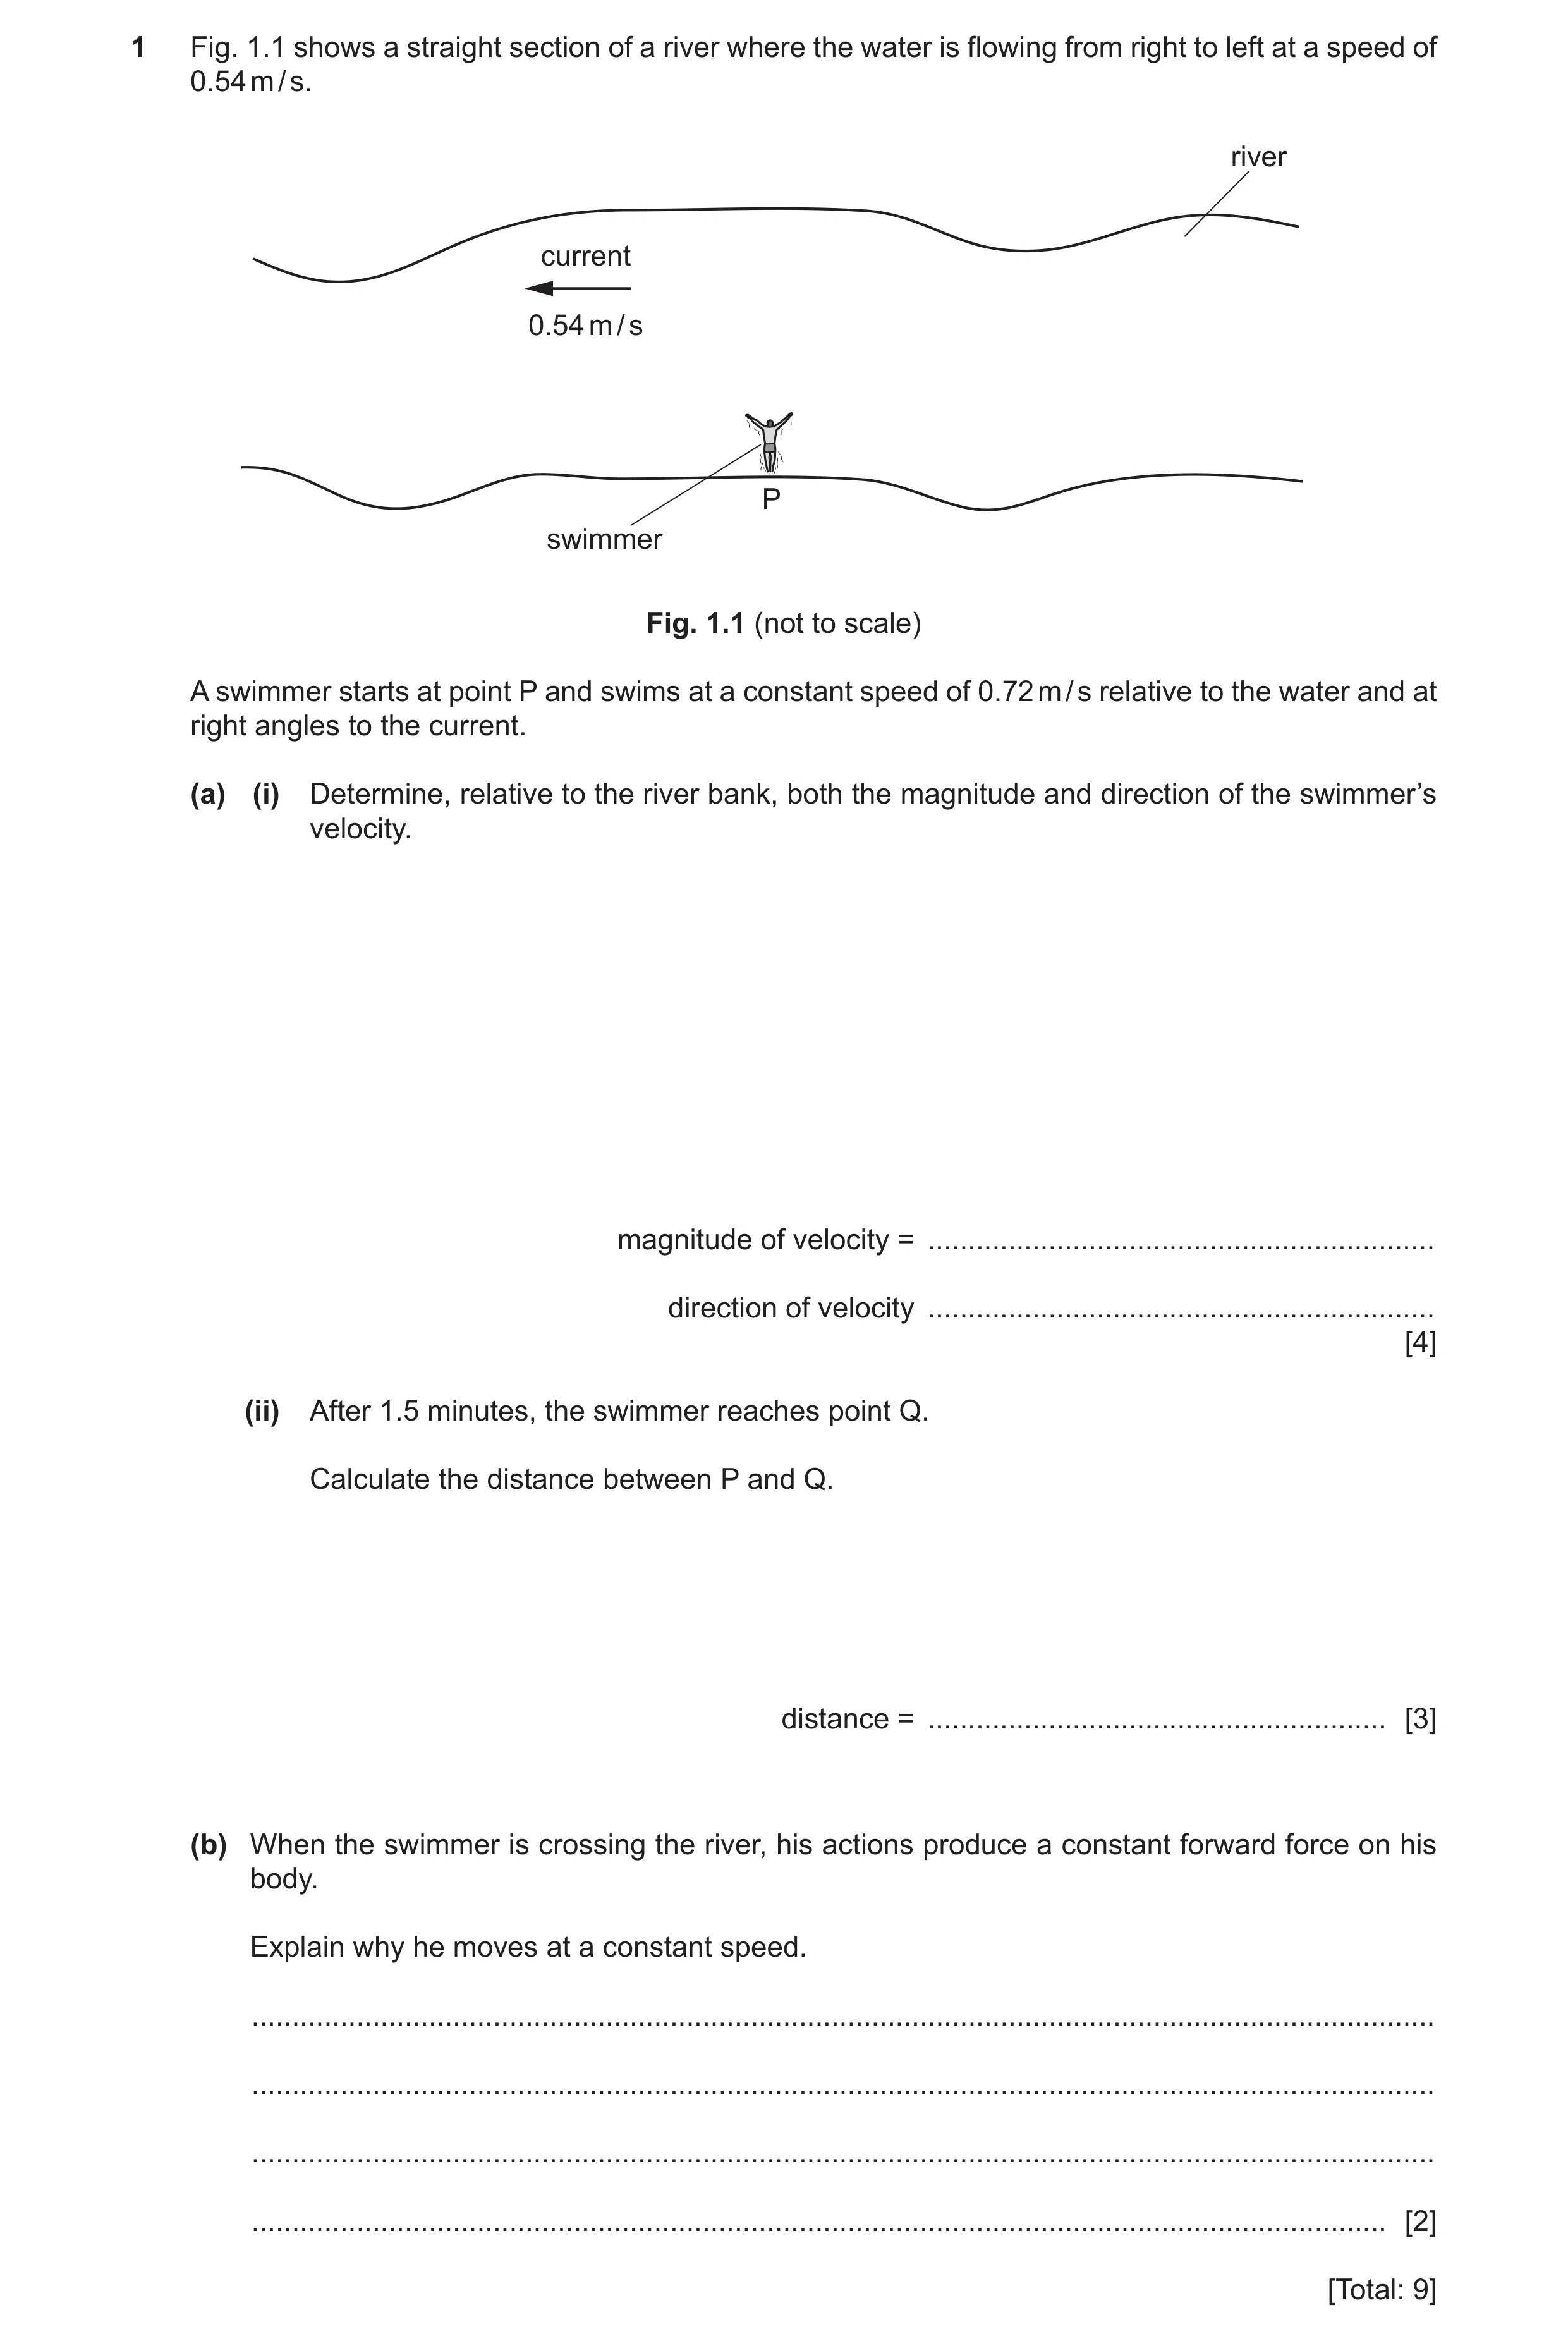
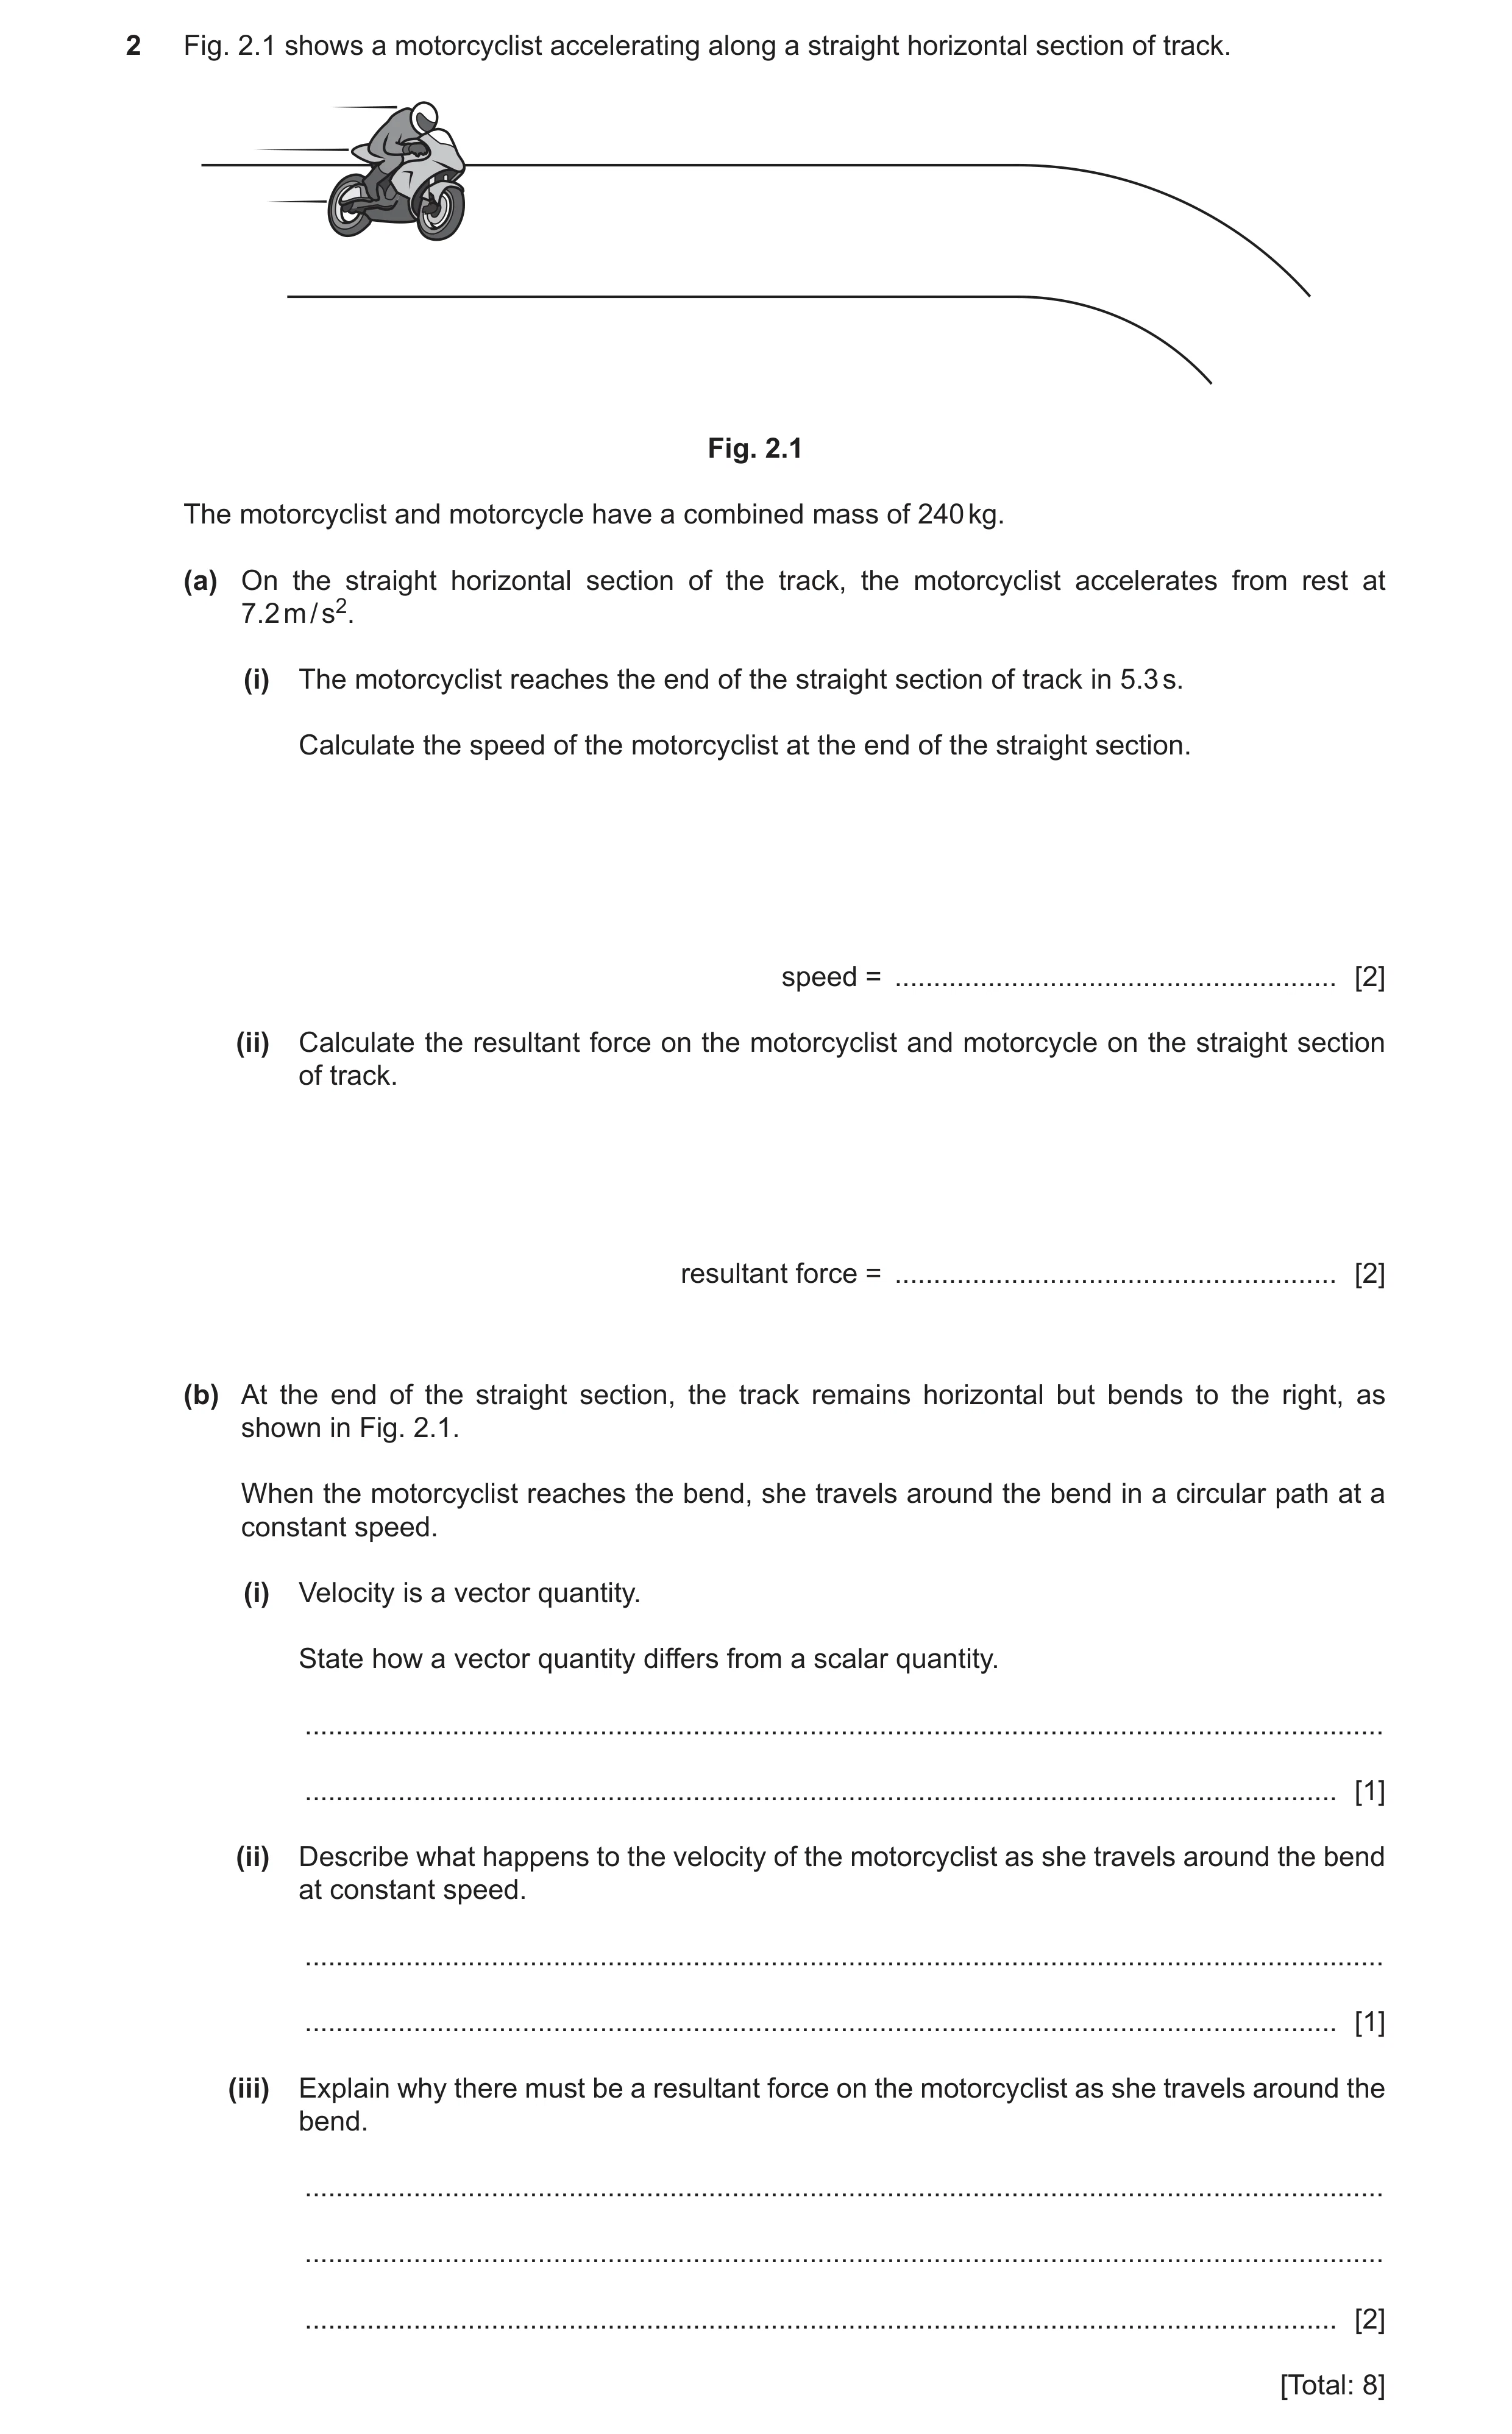
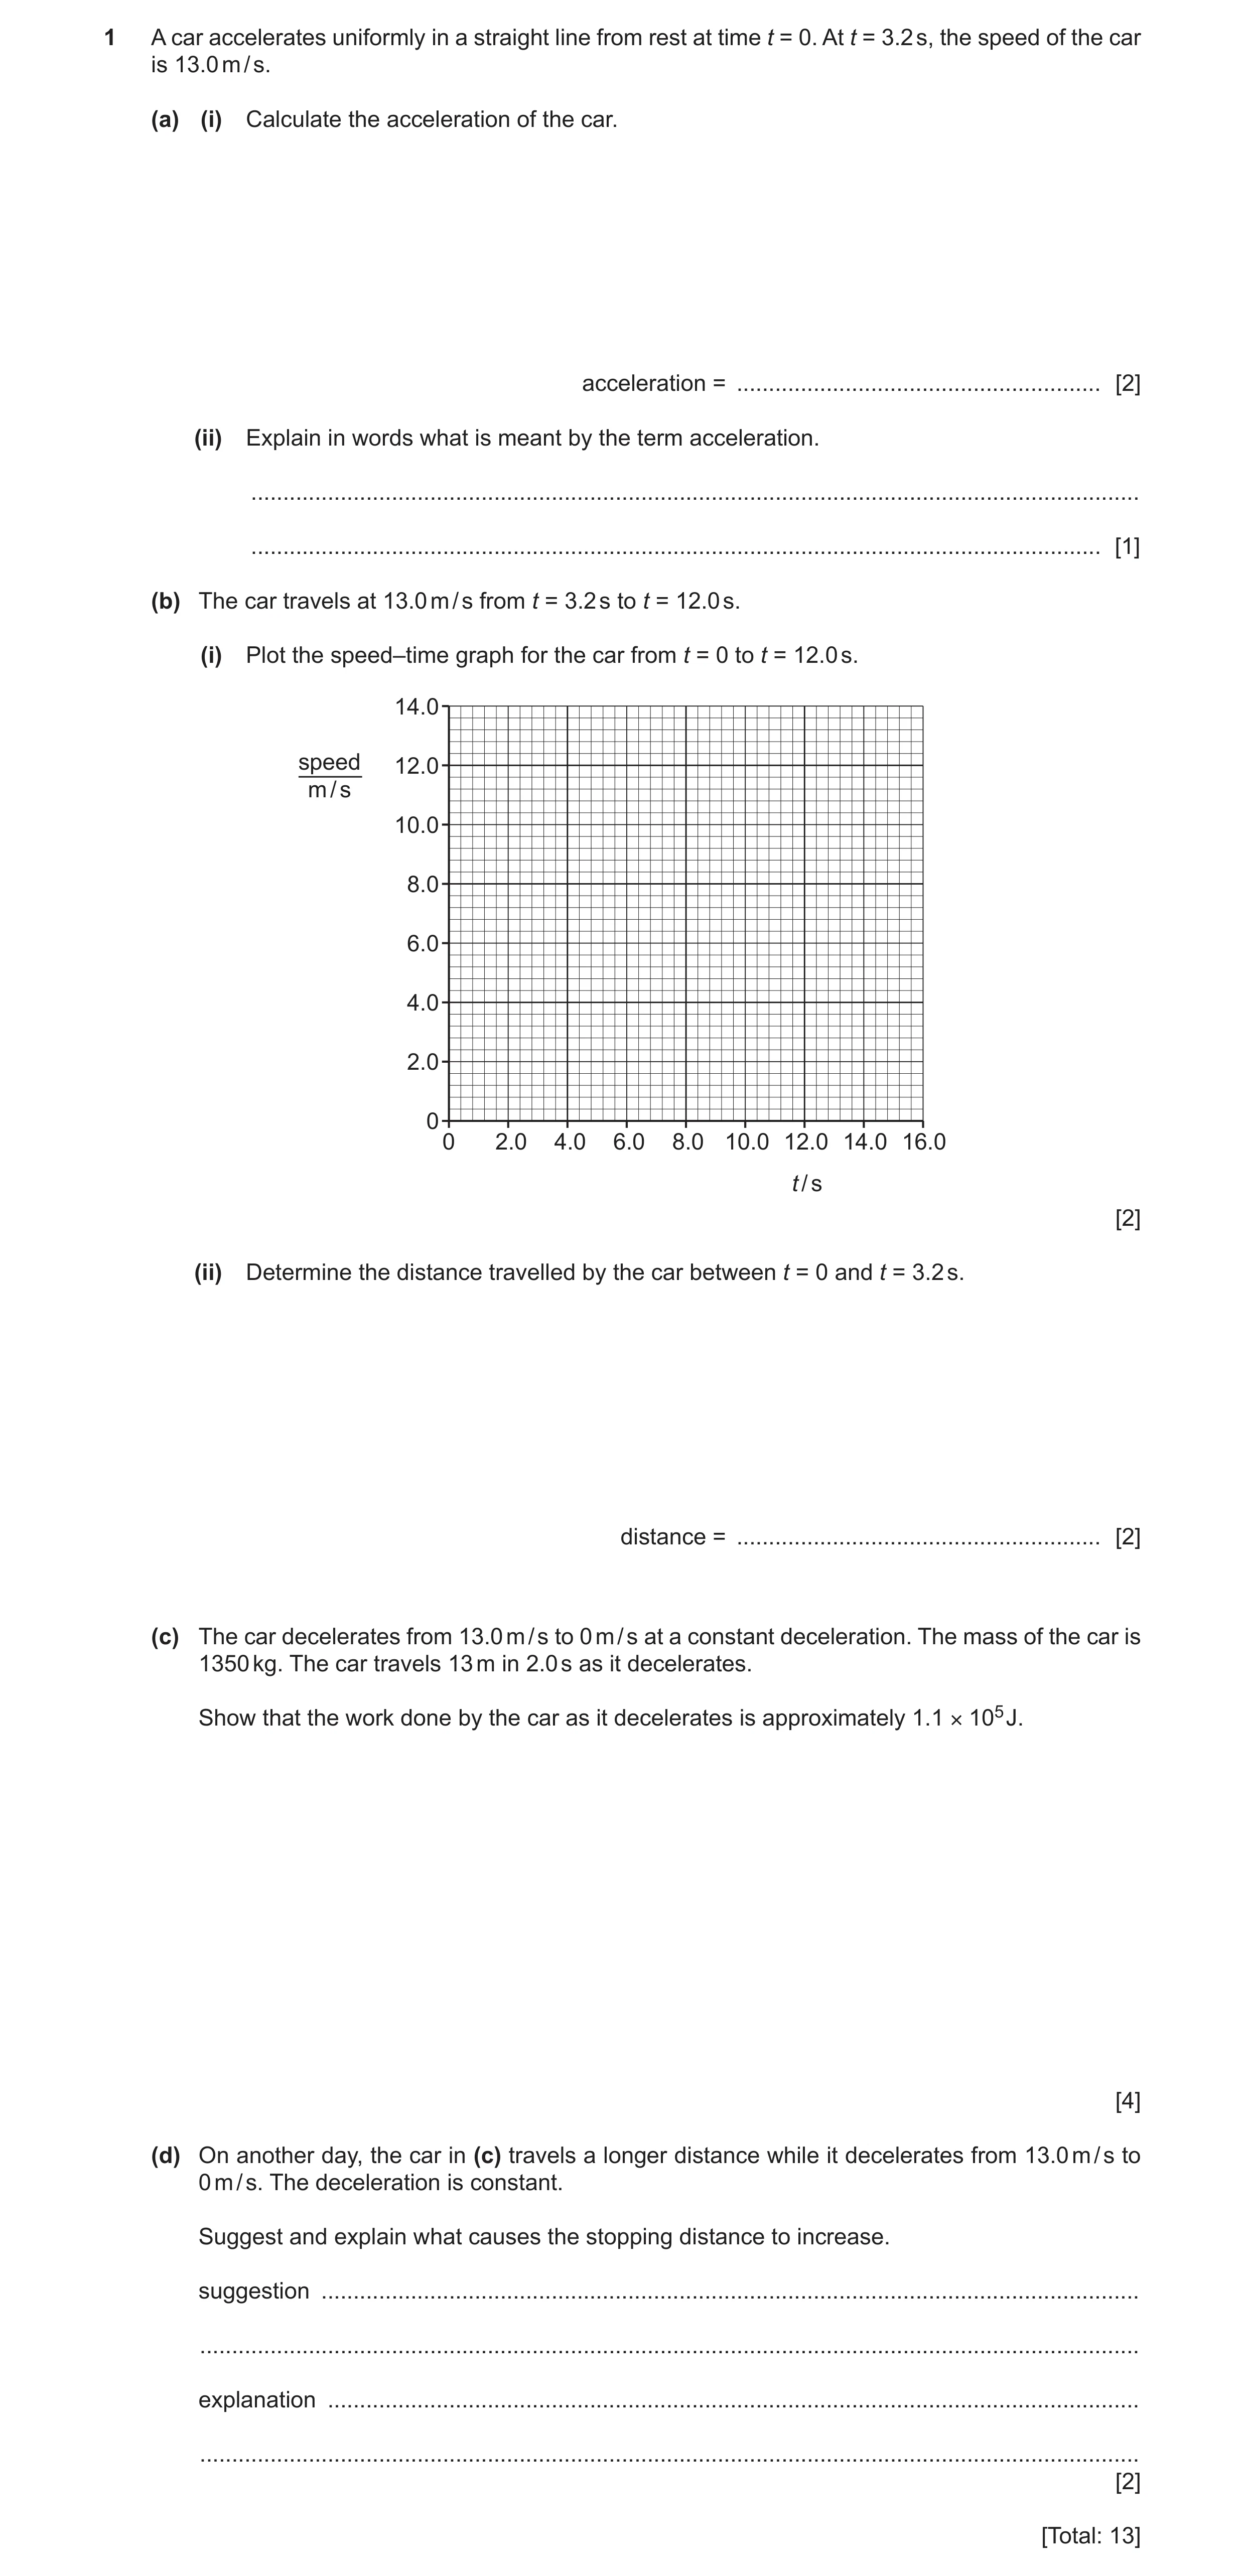
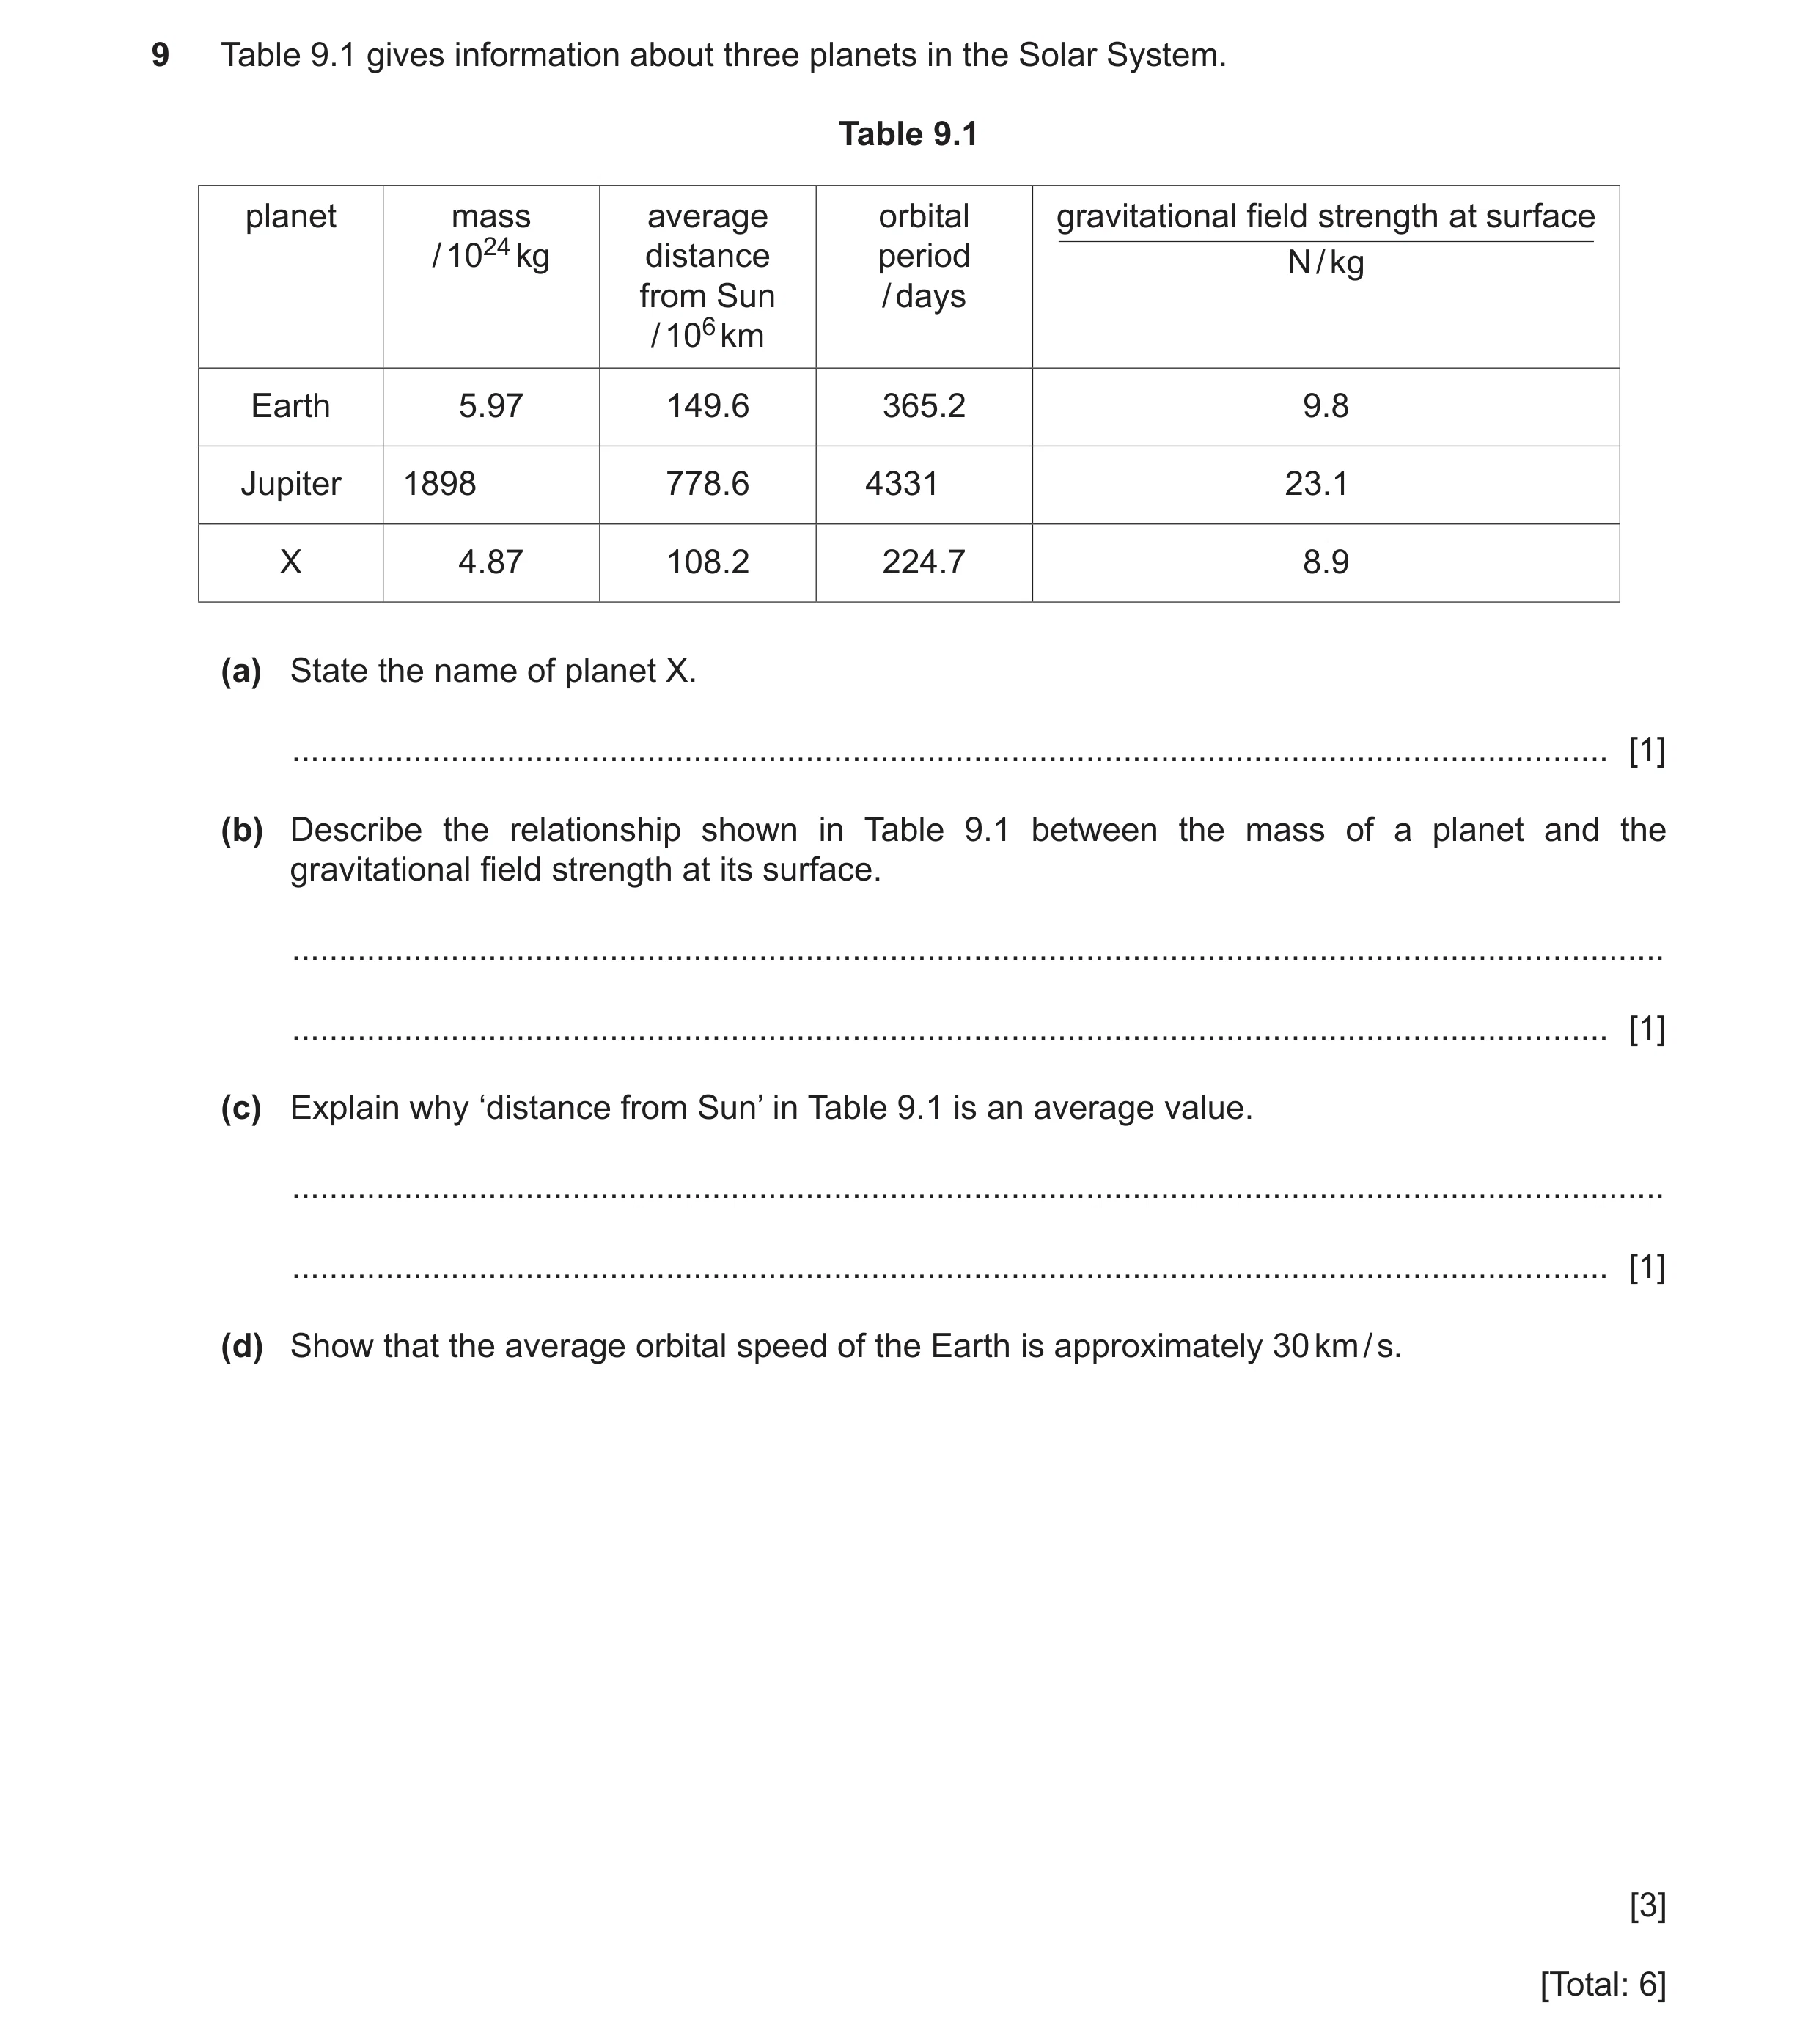 60 / 78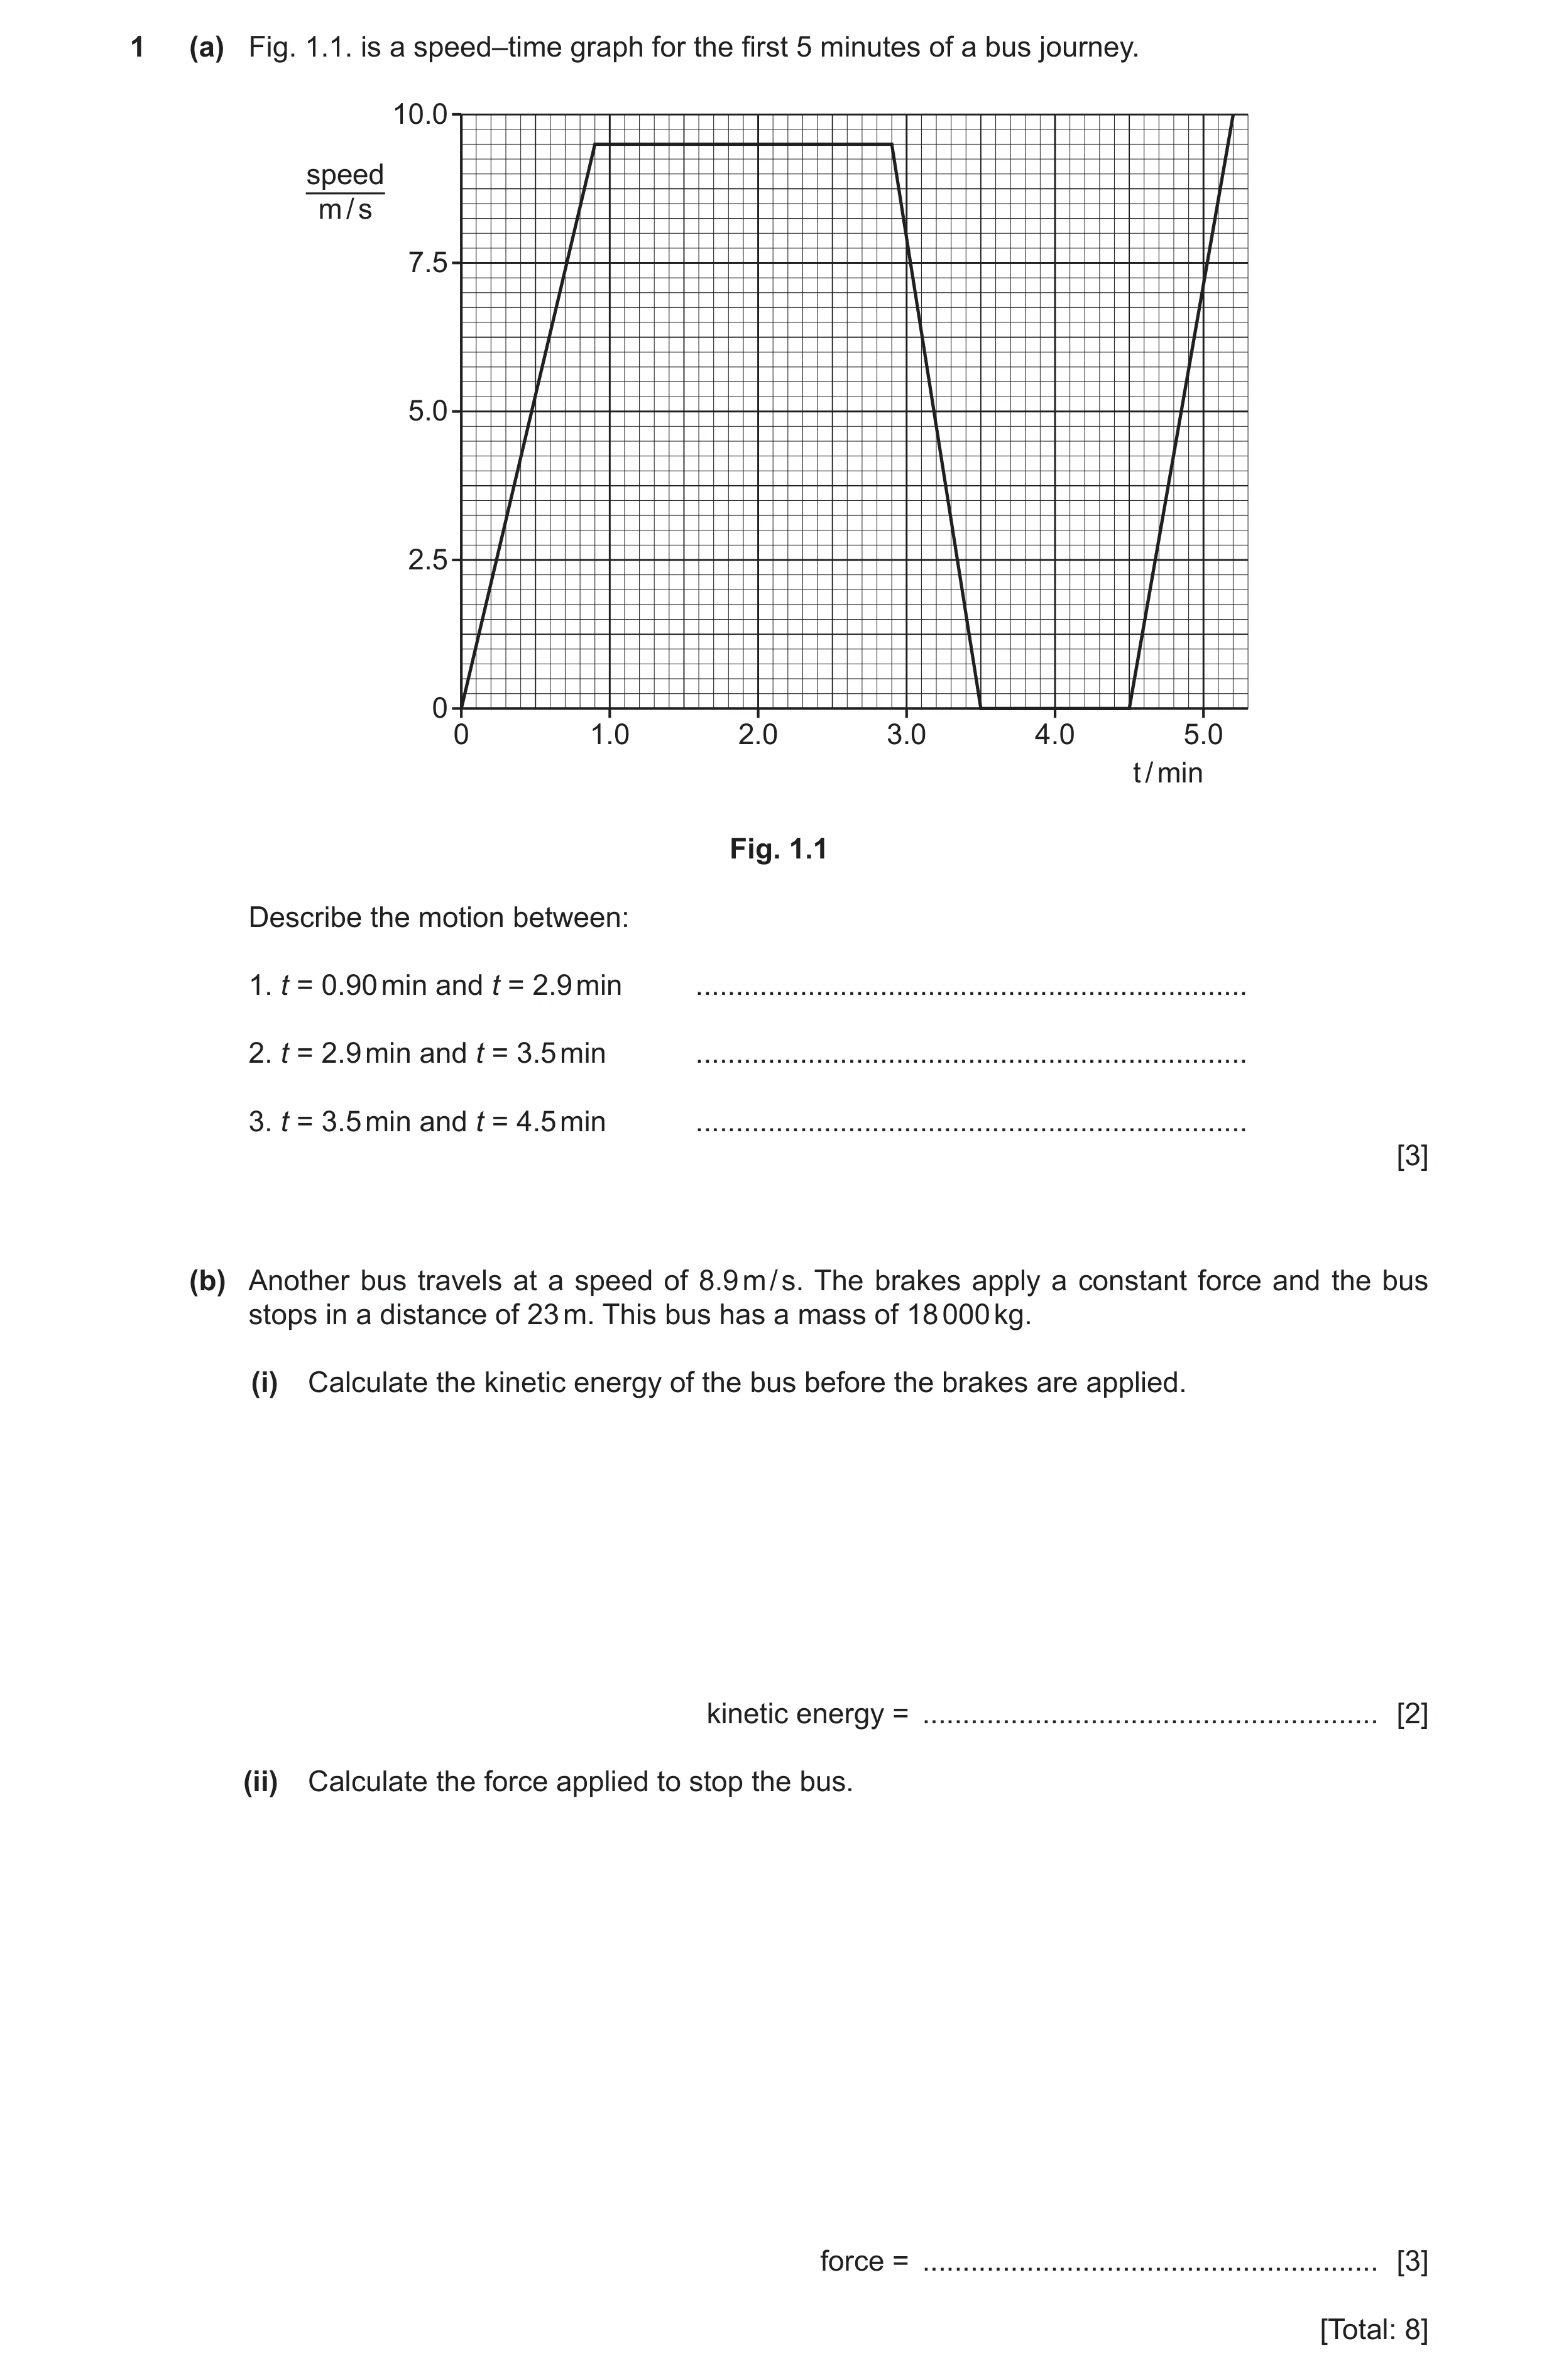
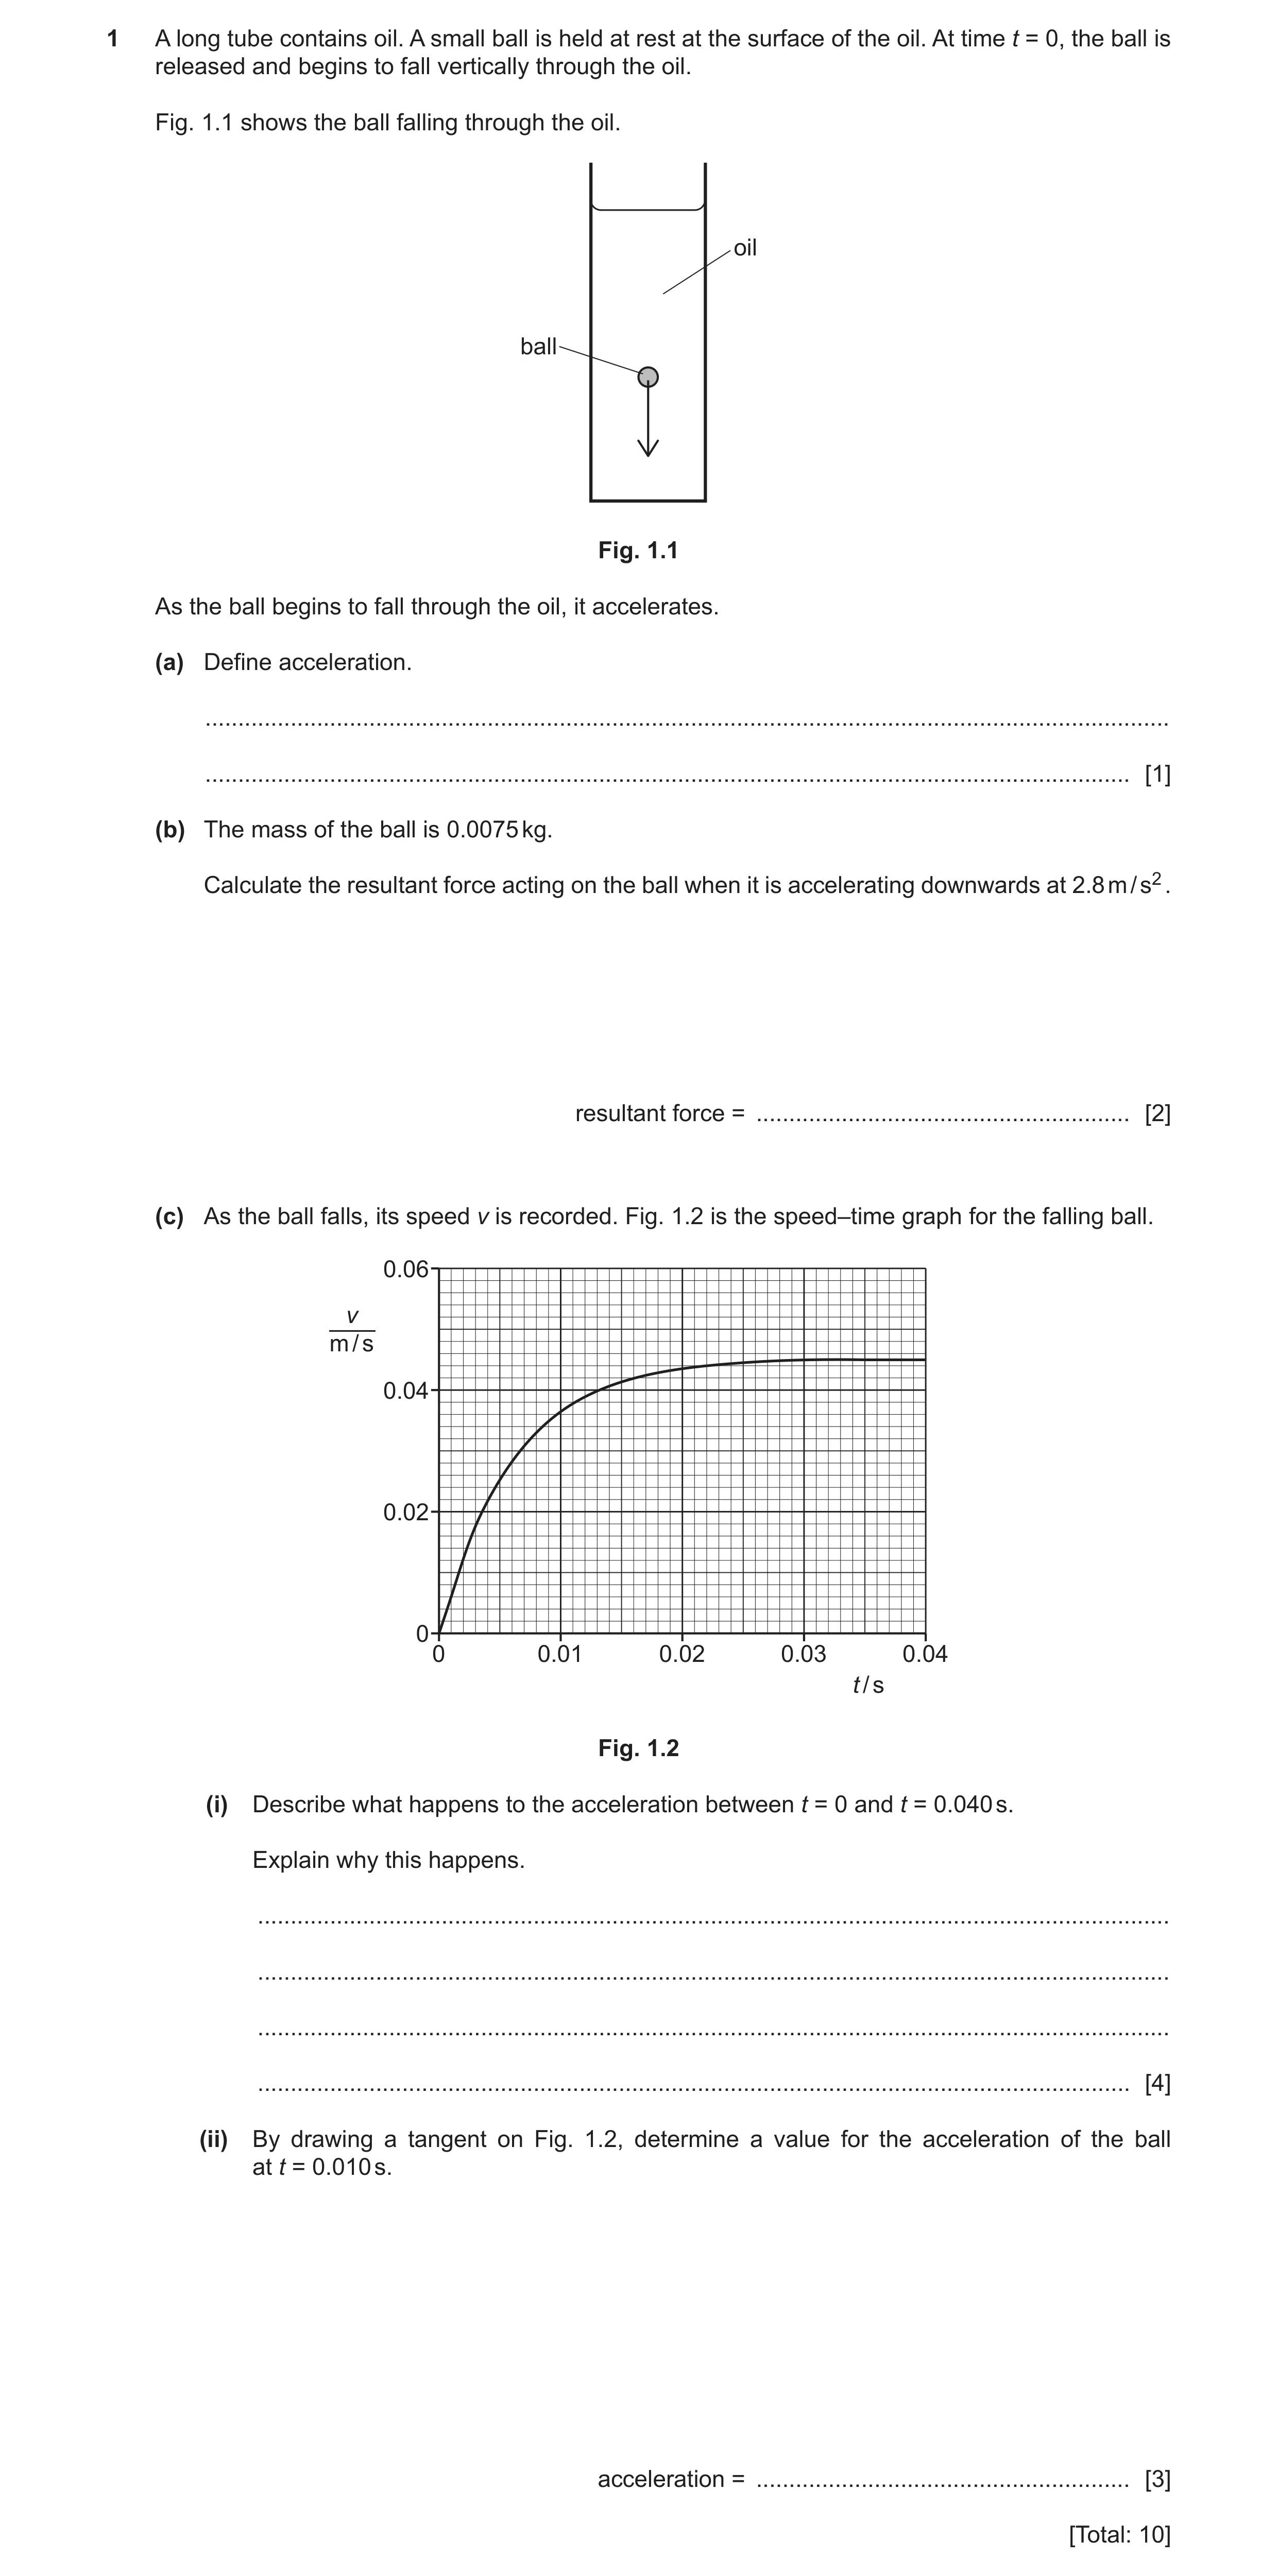
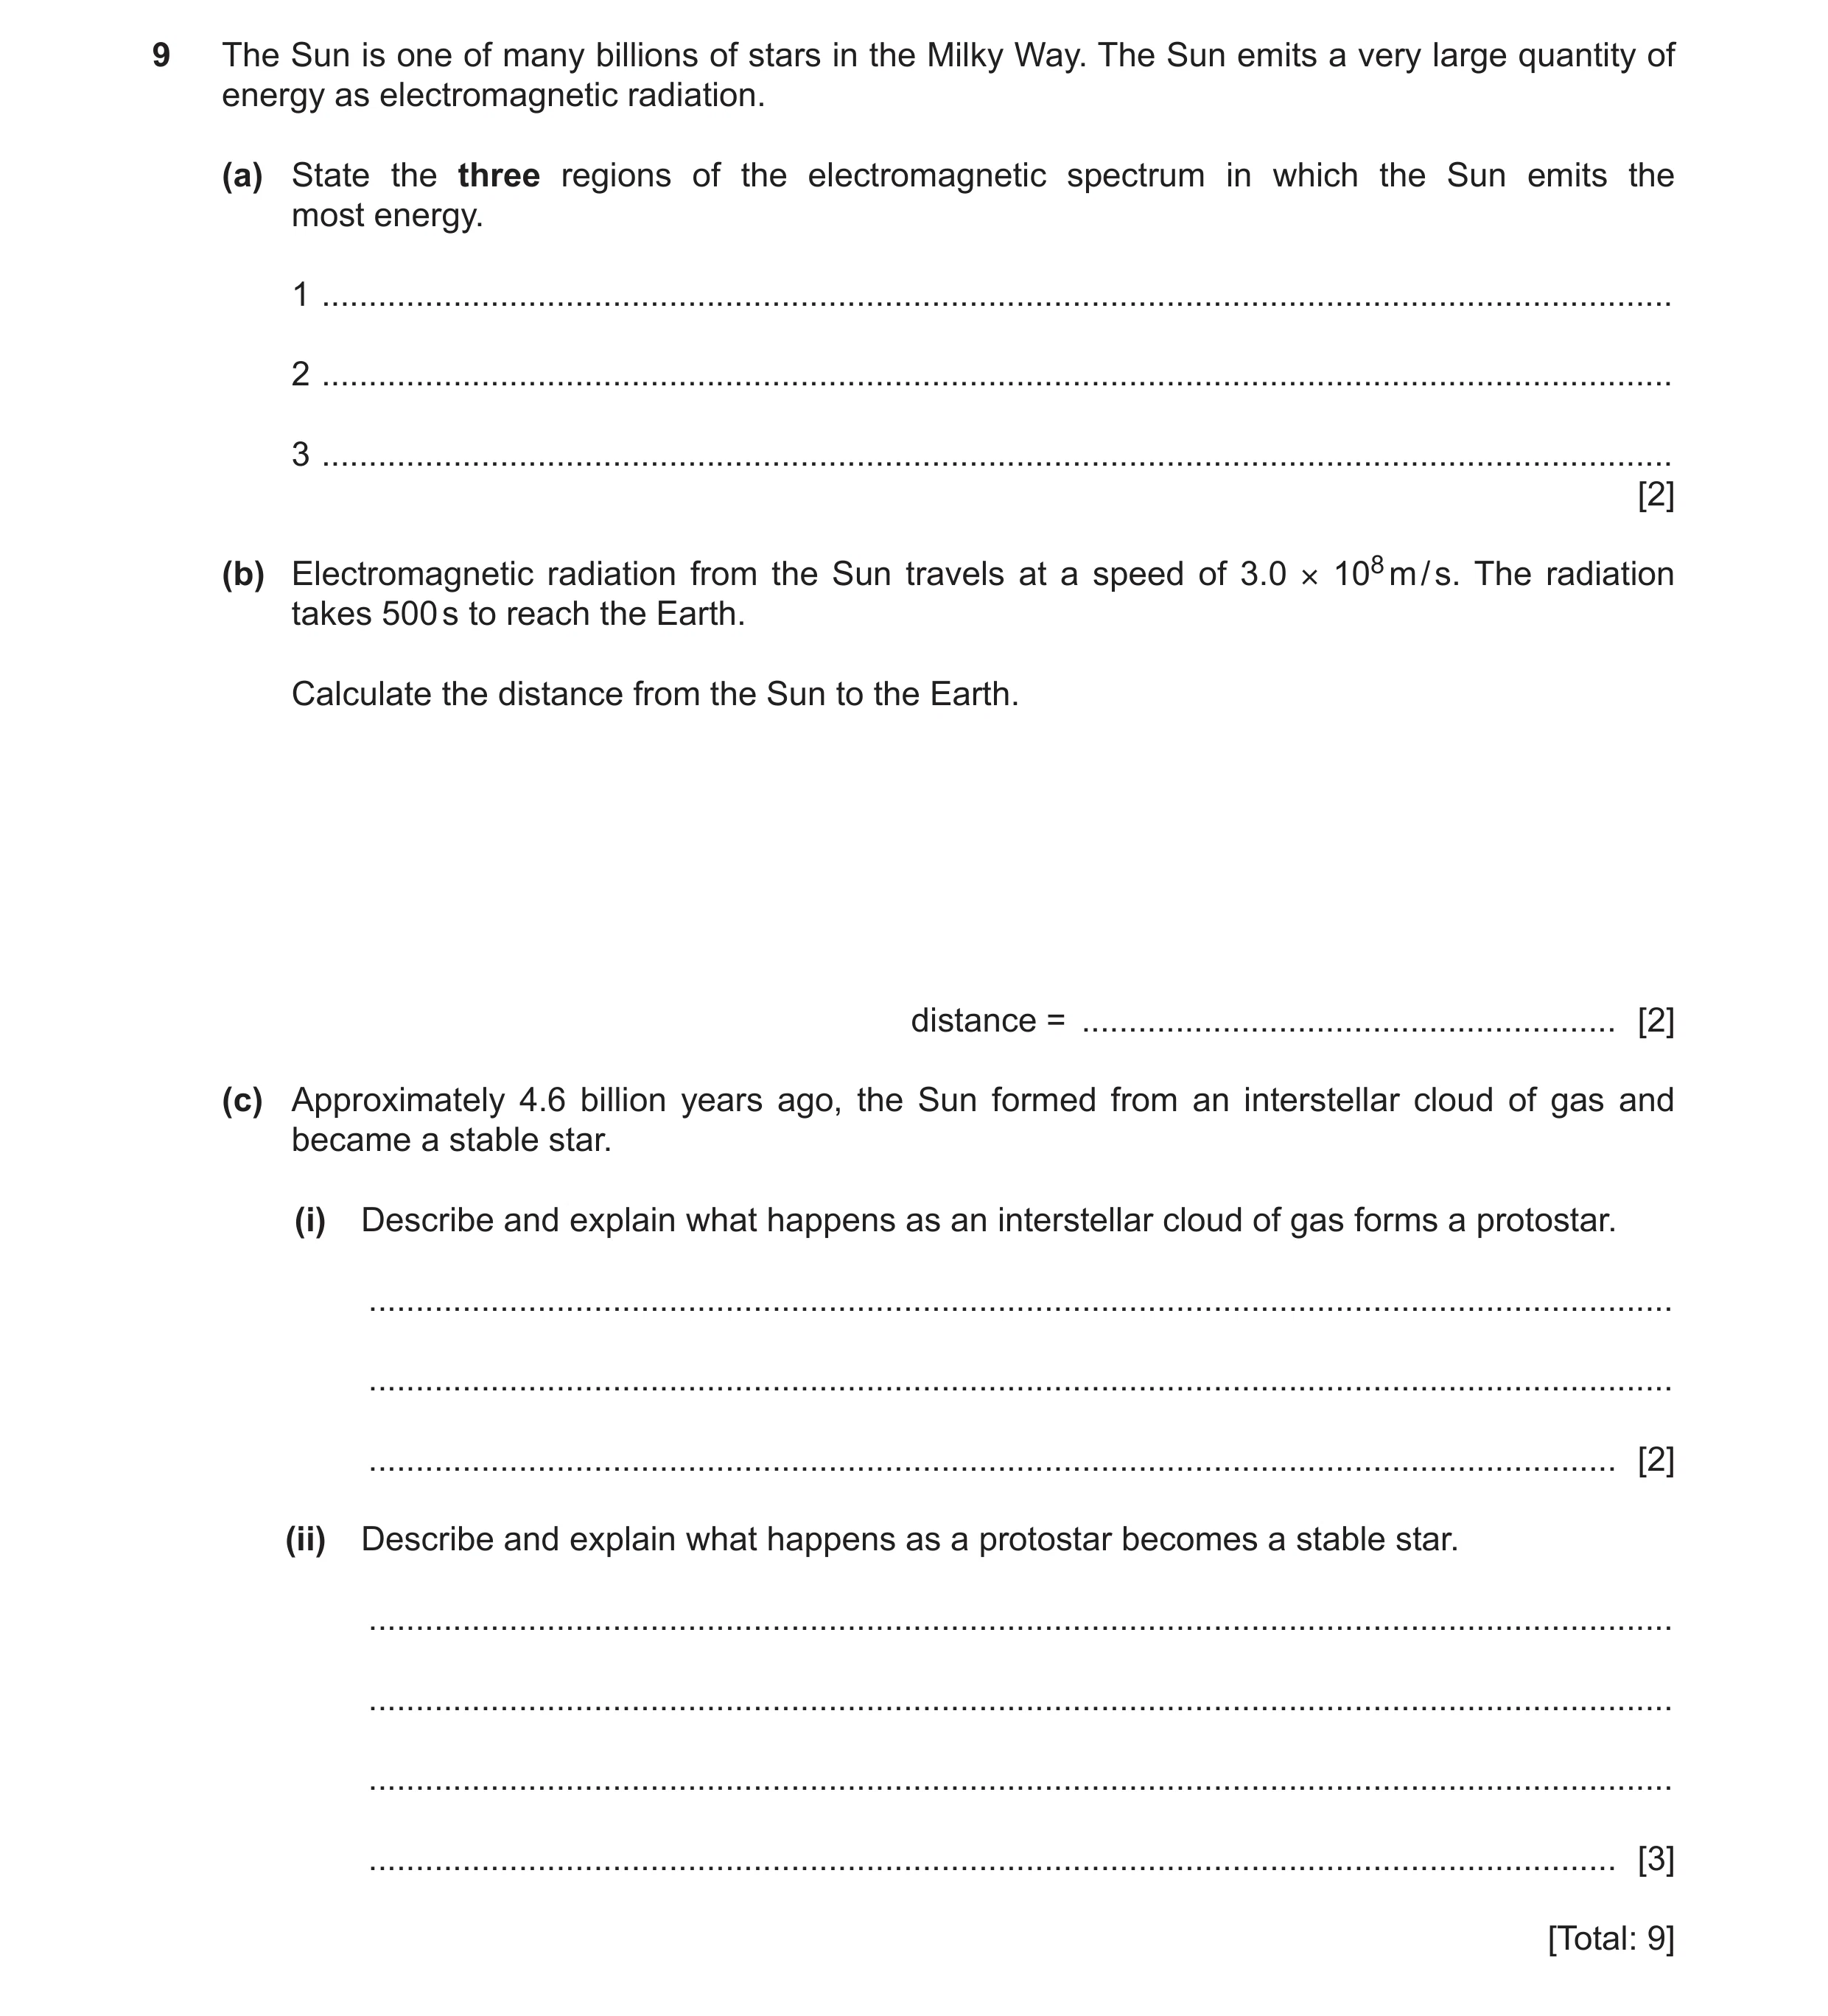 64 / 78
 65 / 78
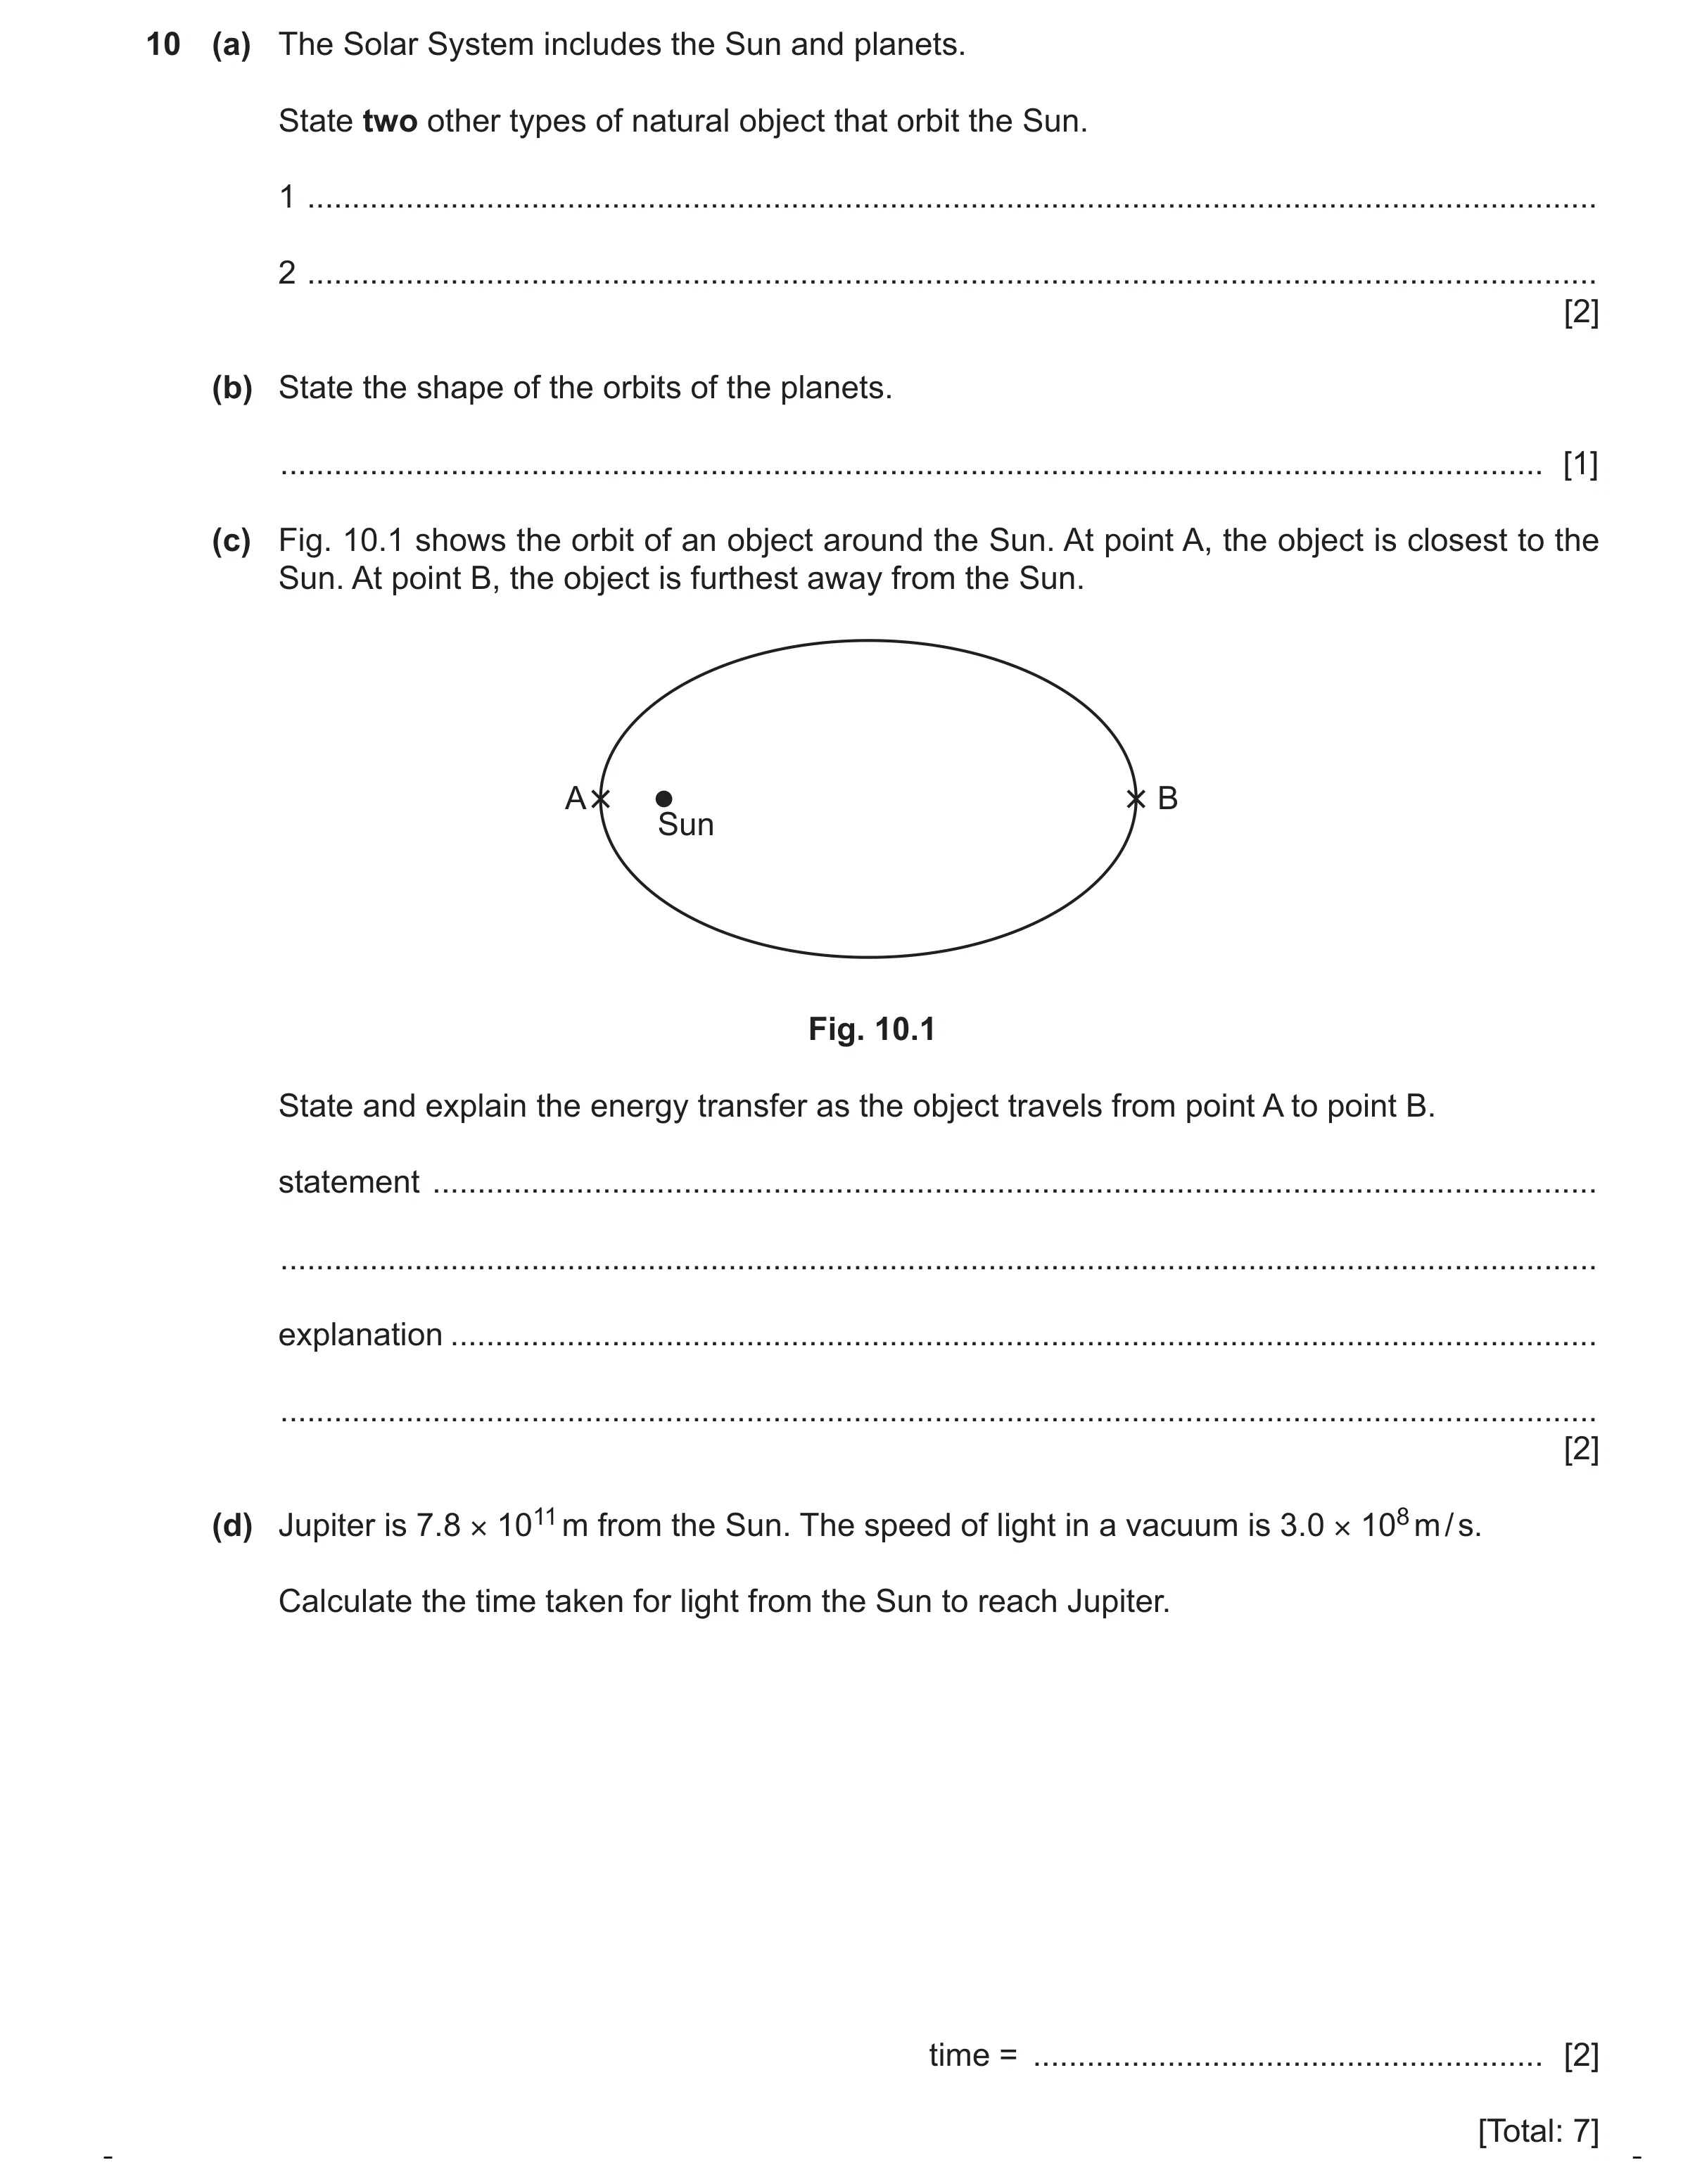 66 / 78
 67 / 78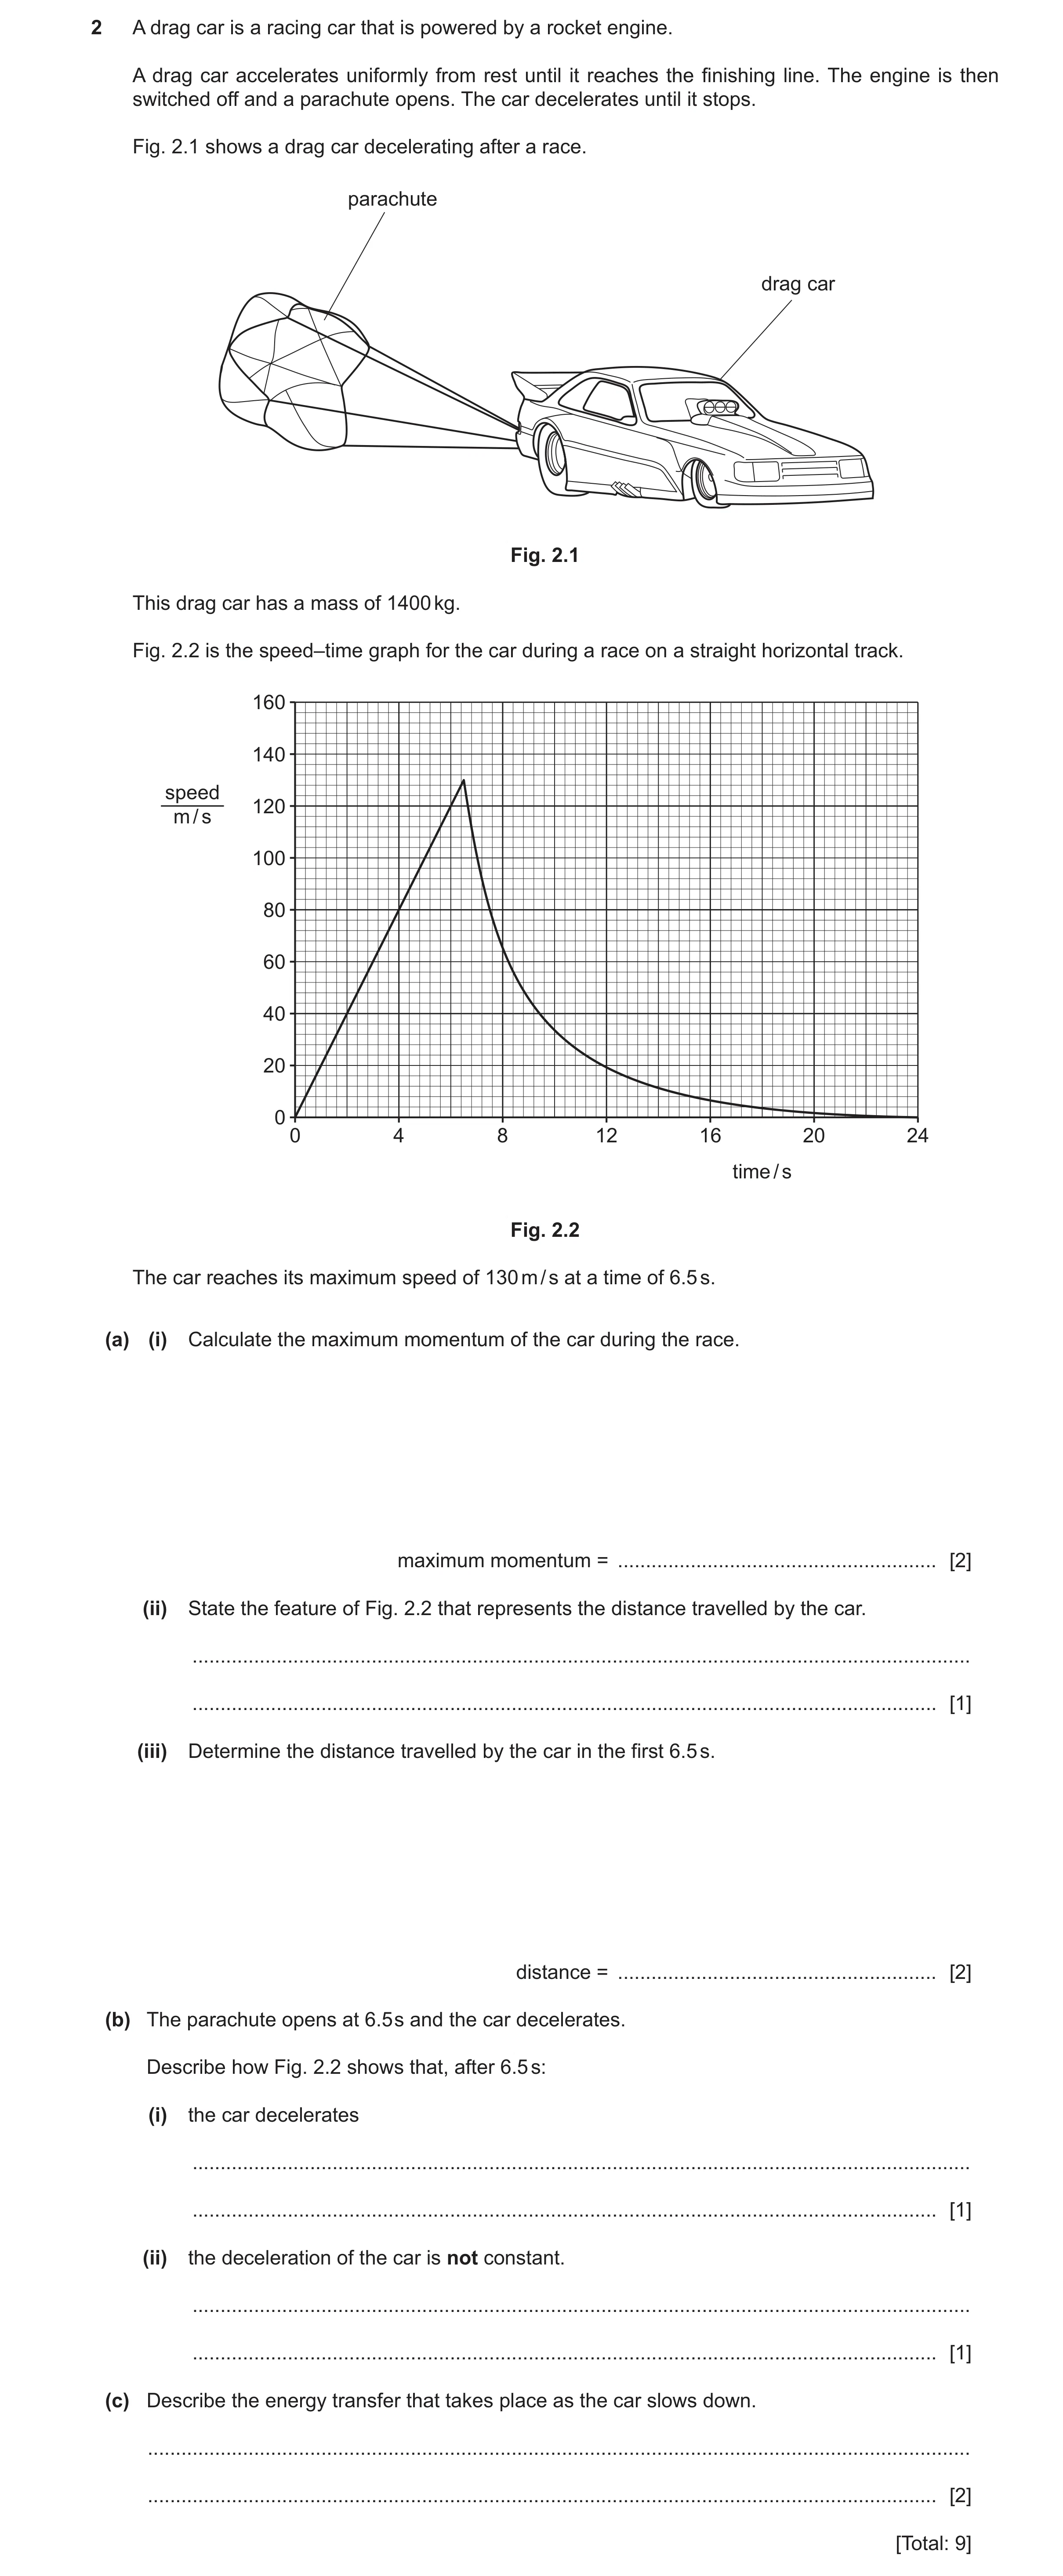
 70 / 78
![Question 55: (a) Circle the vector quantities in the list. acceleration mass speed time velocity [1] (b) Fig. 1.1 shows the speed–time graph for a train…](https://img.pastlit.com/crops/e5df5ae0-9411-49fa-b526-c459662ba24f/q1.webp)
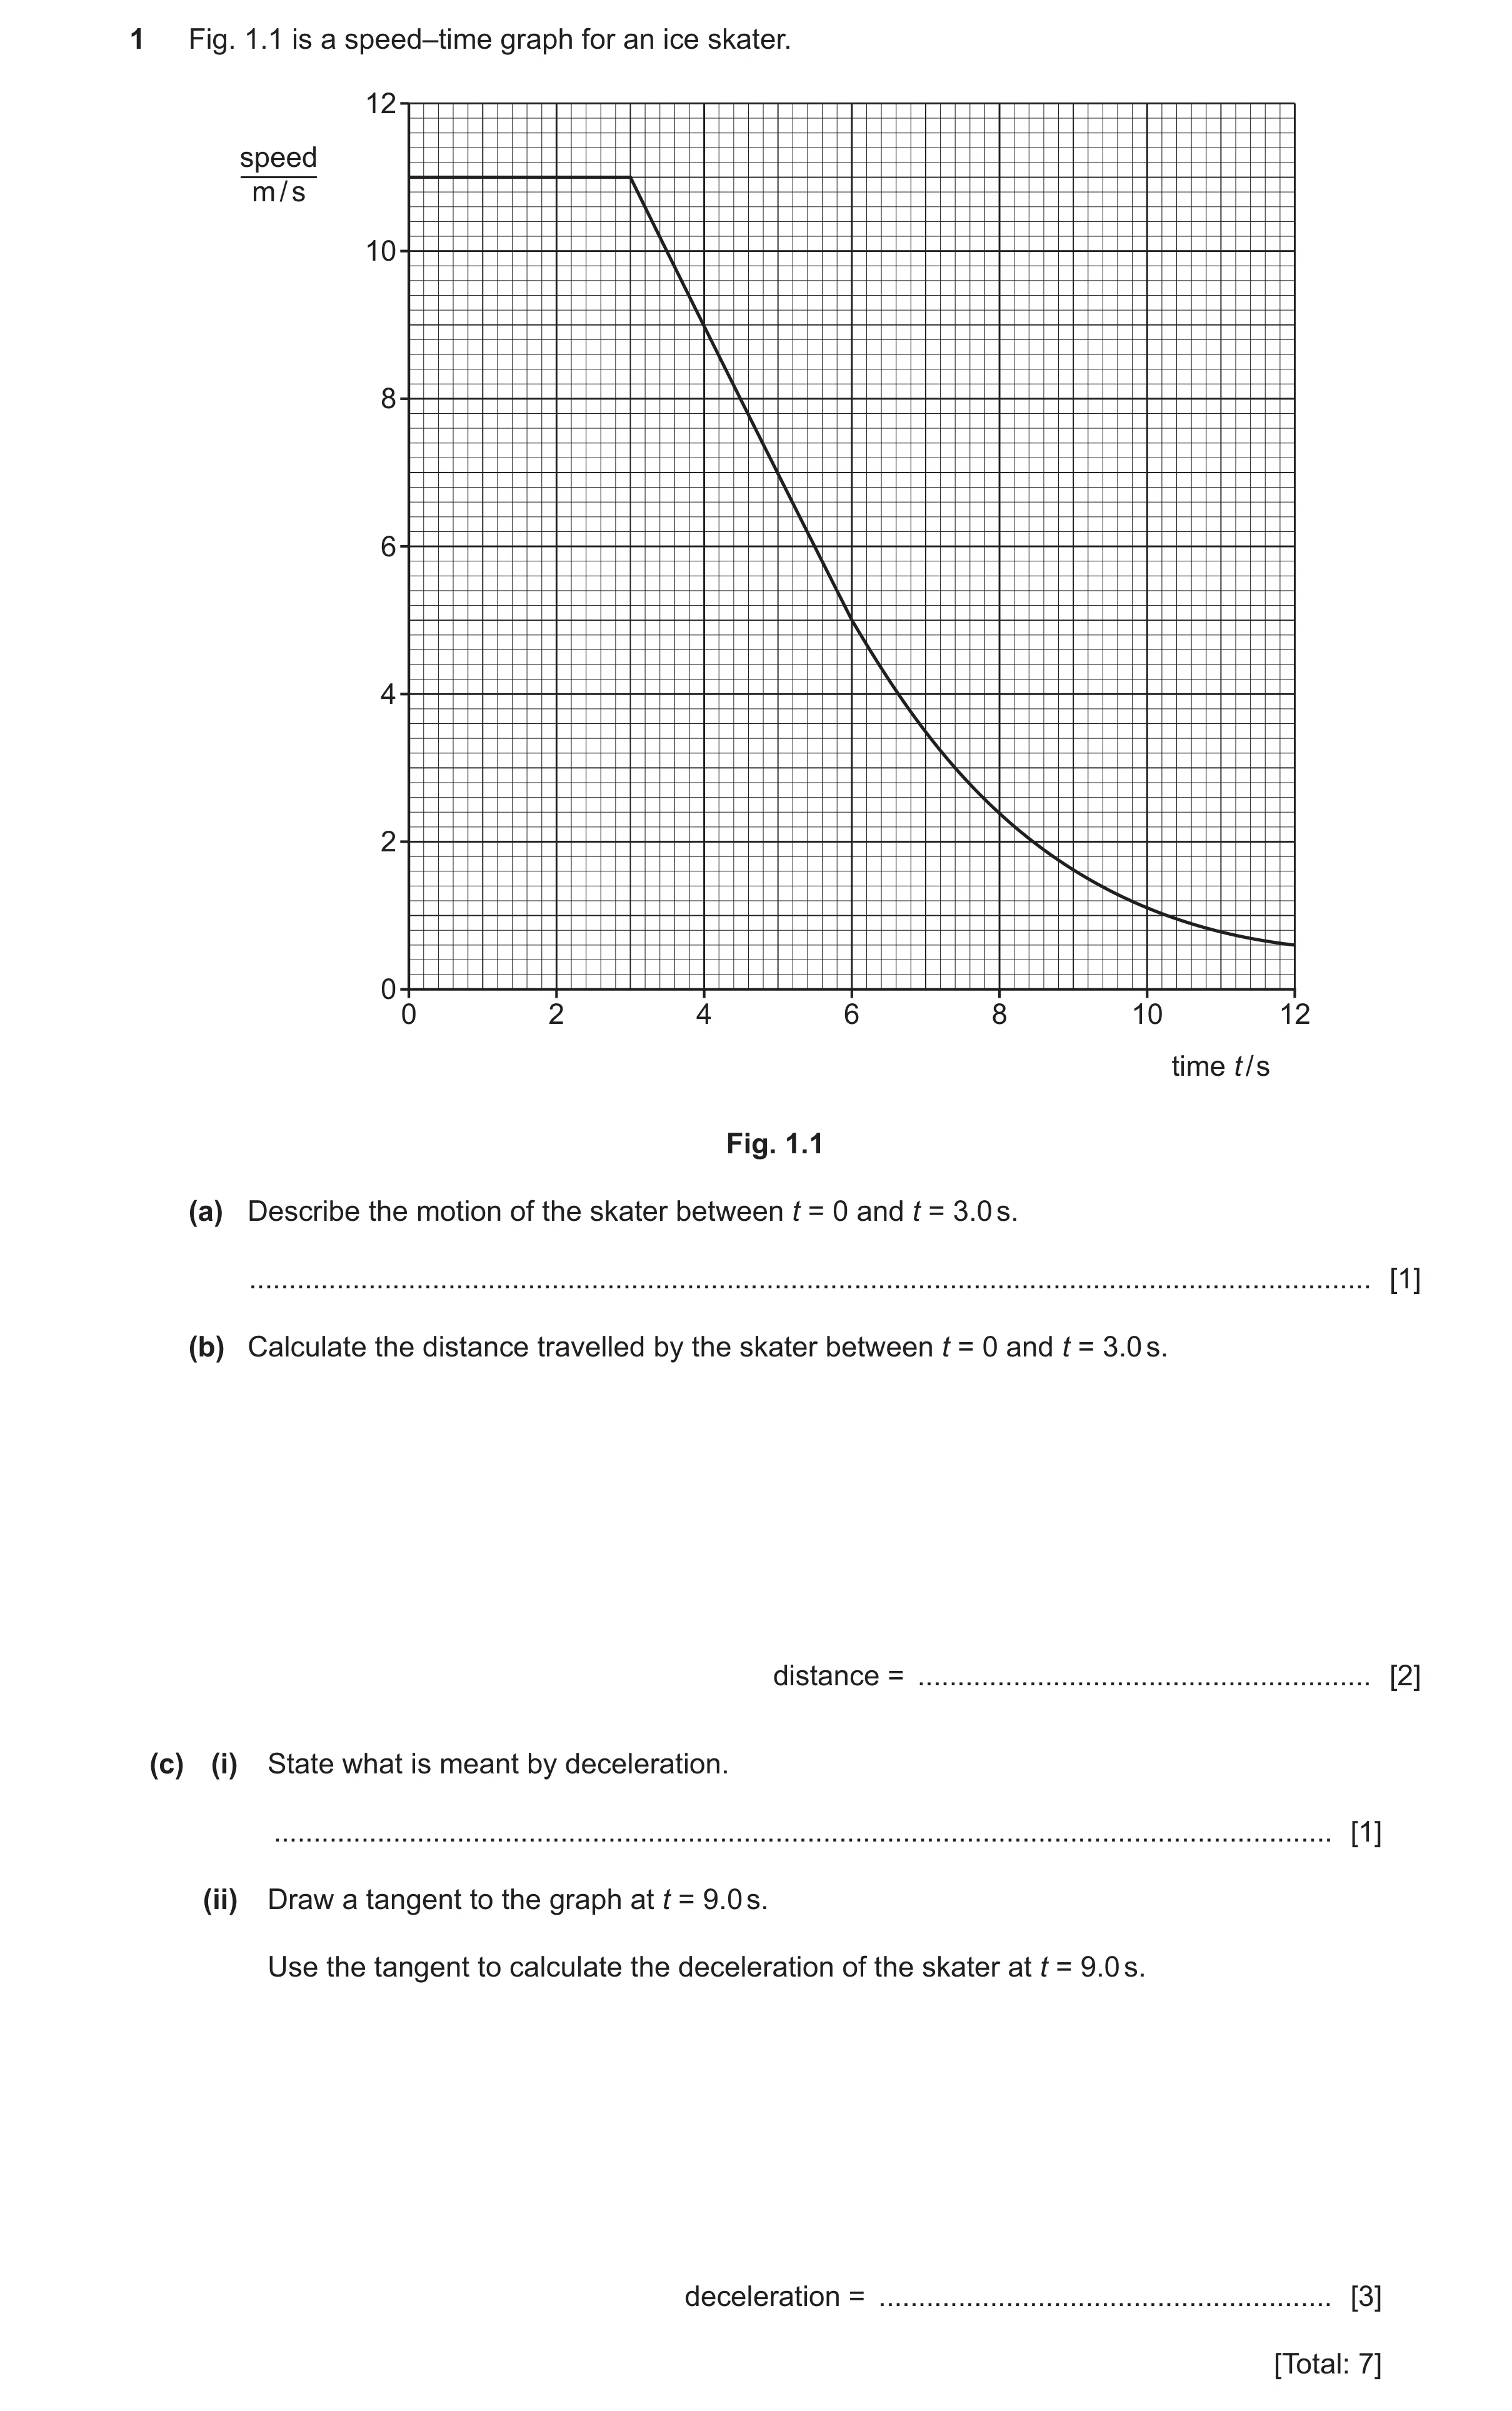
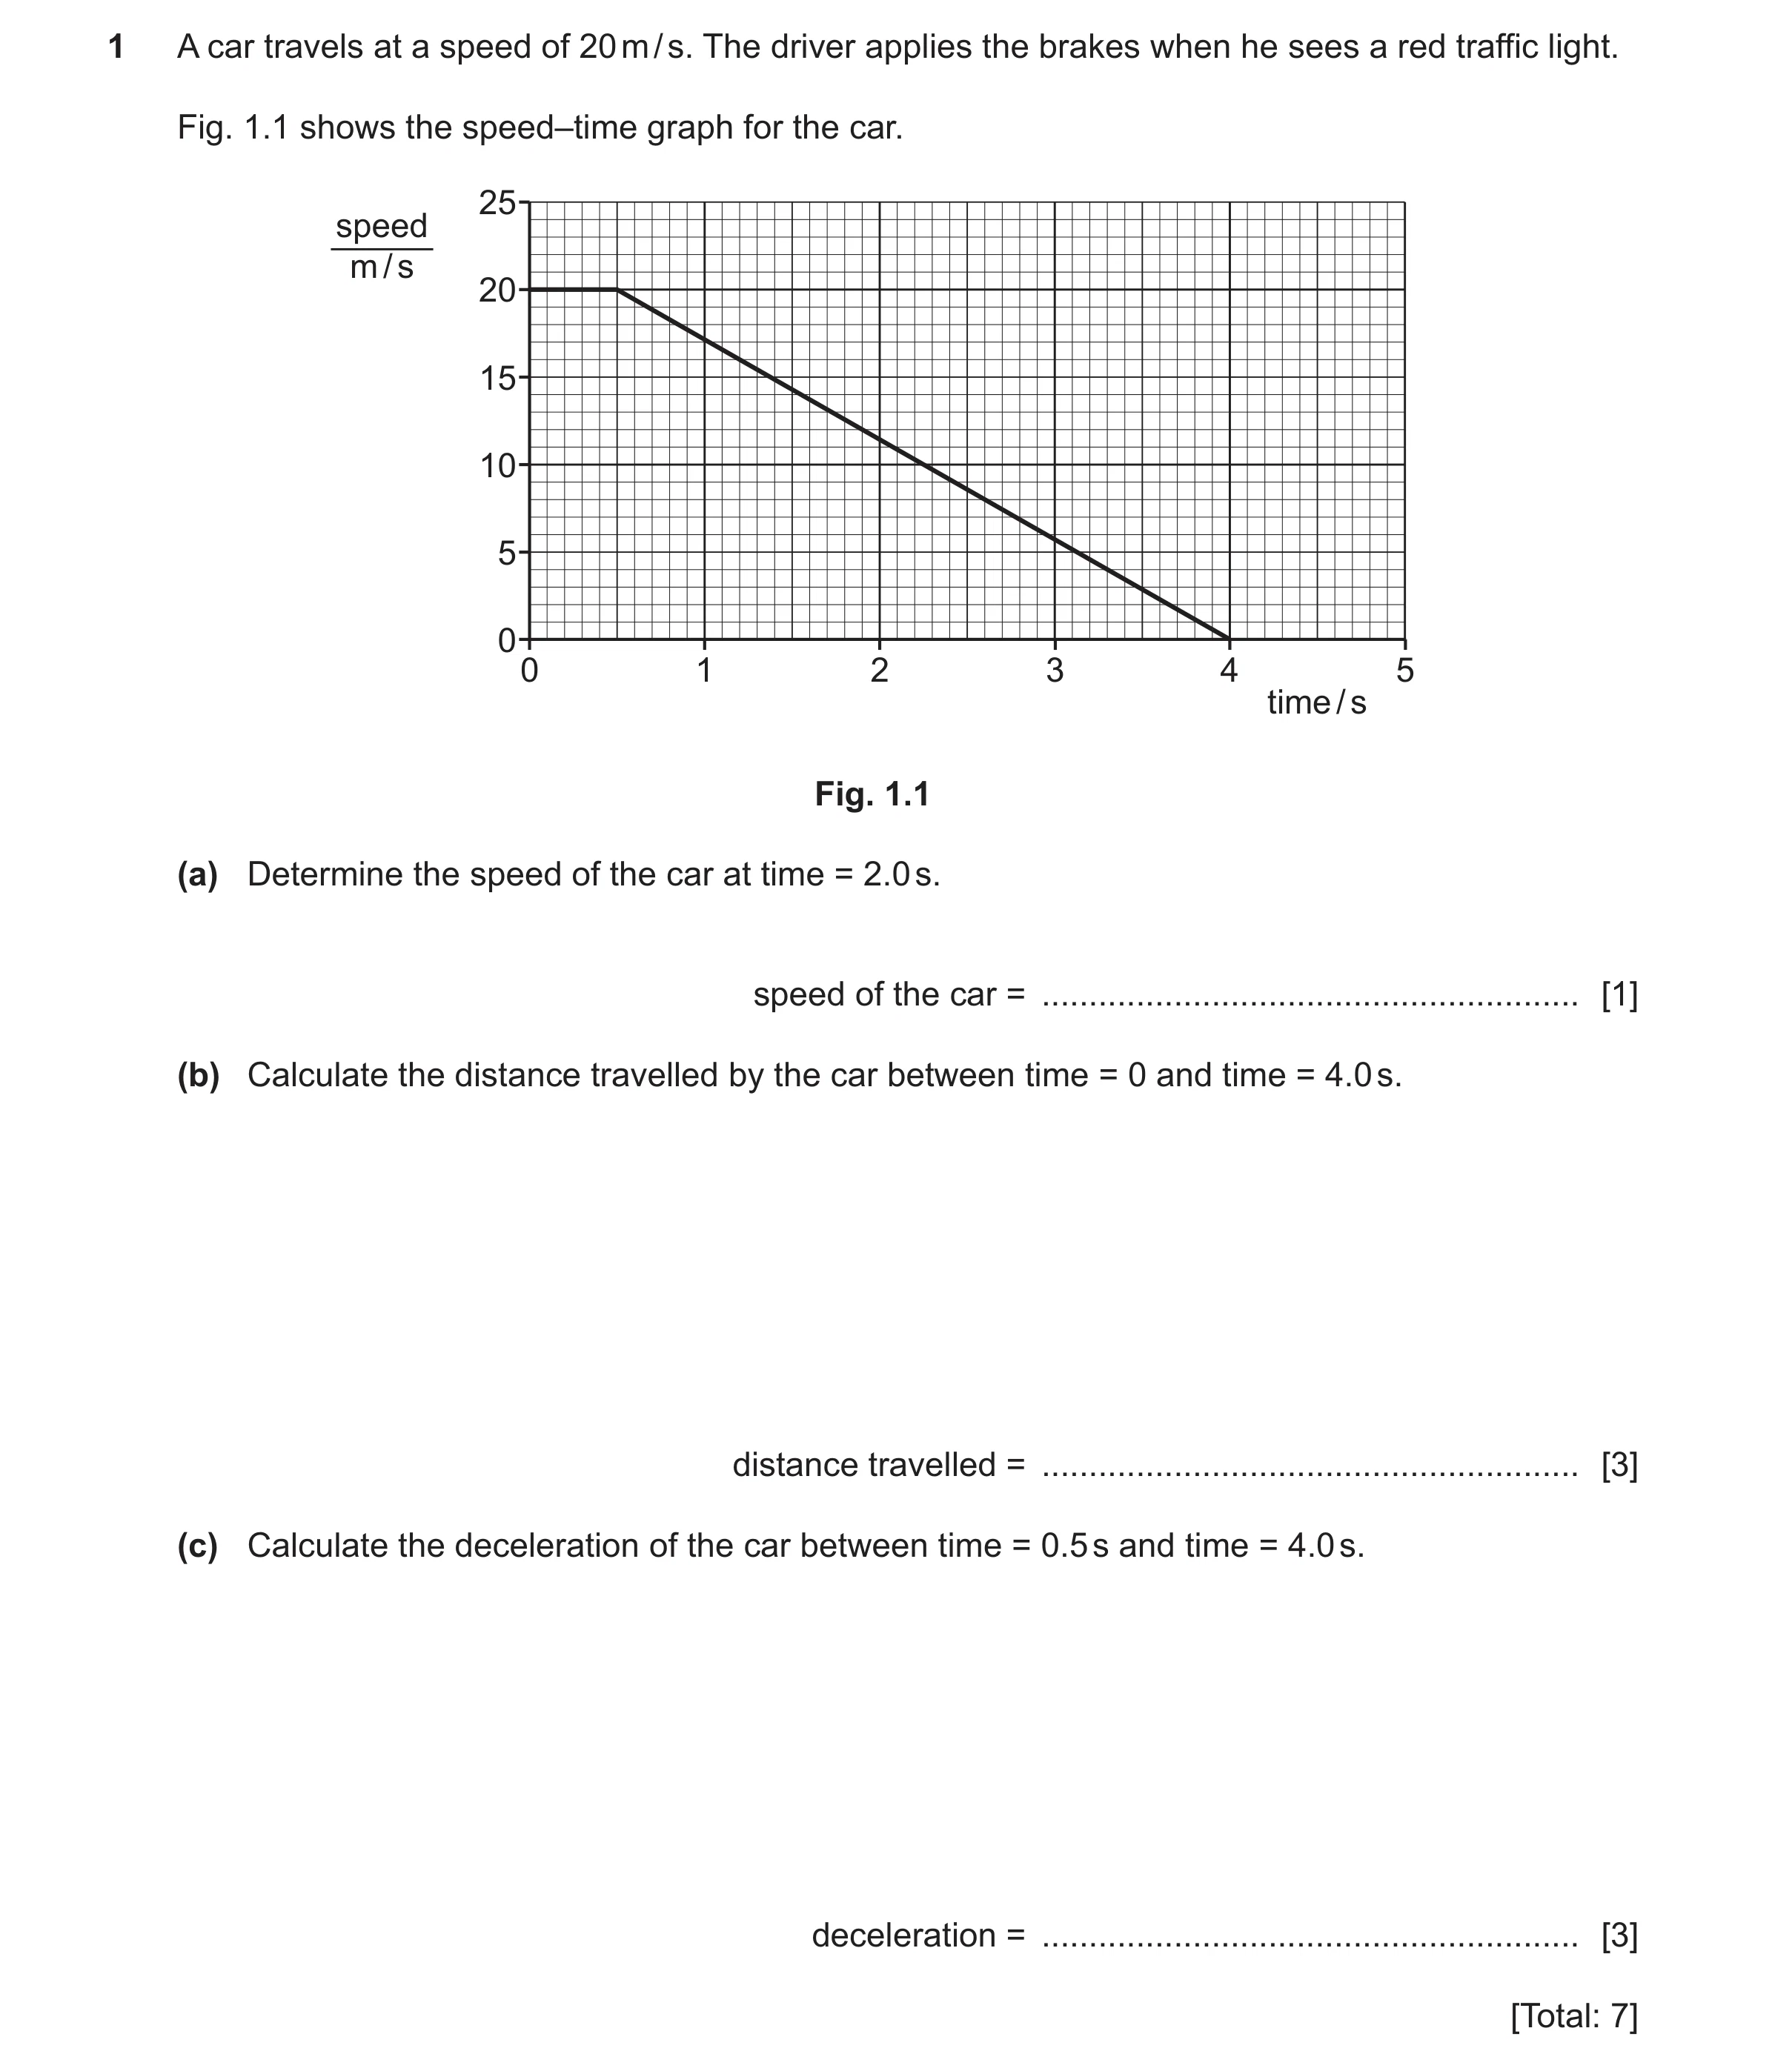 74 / 78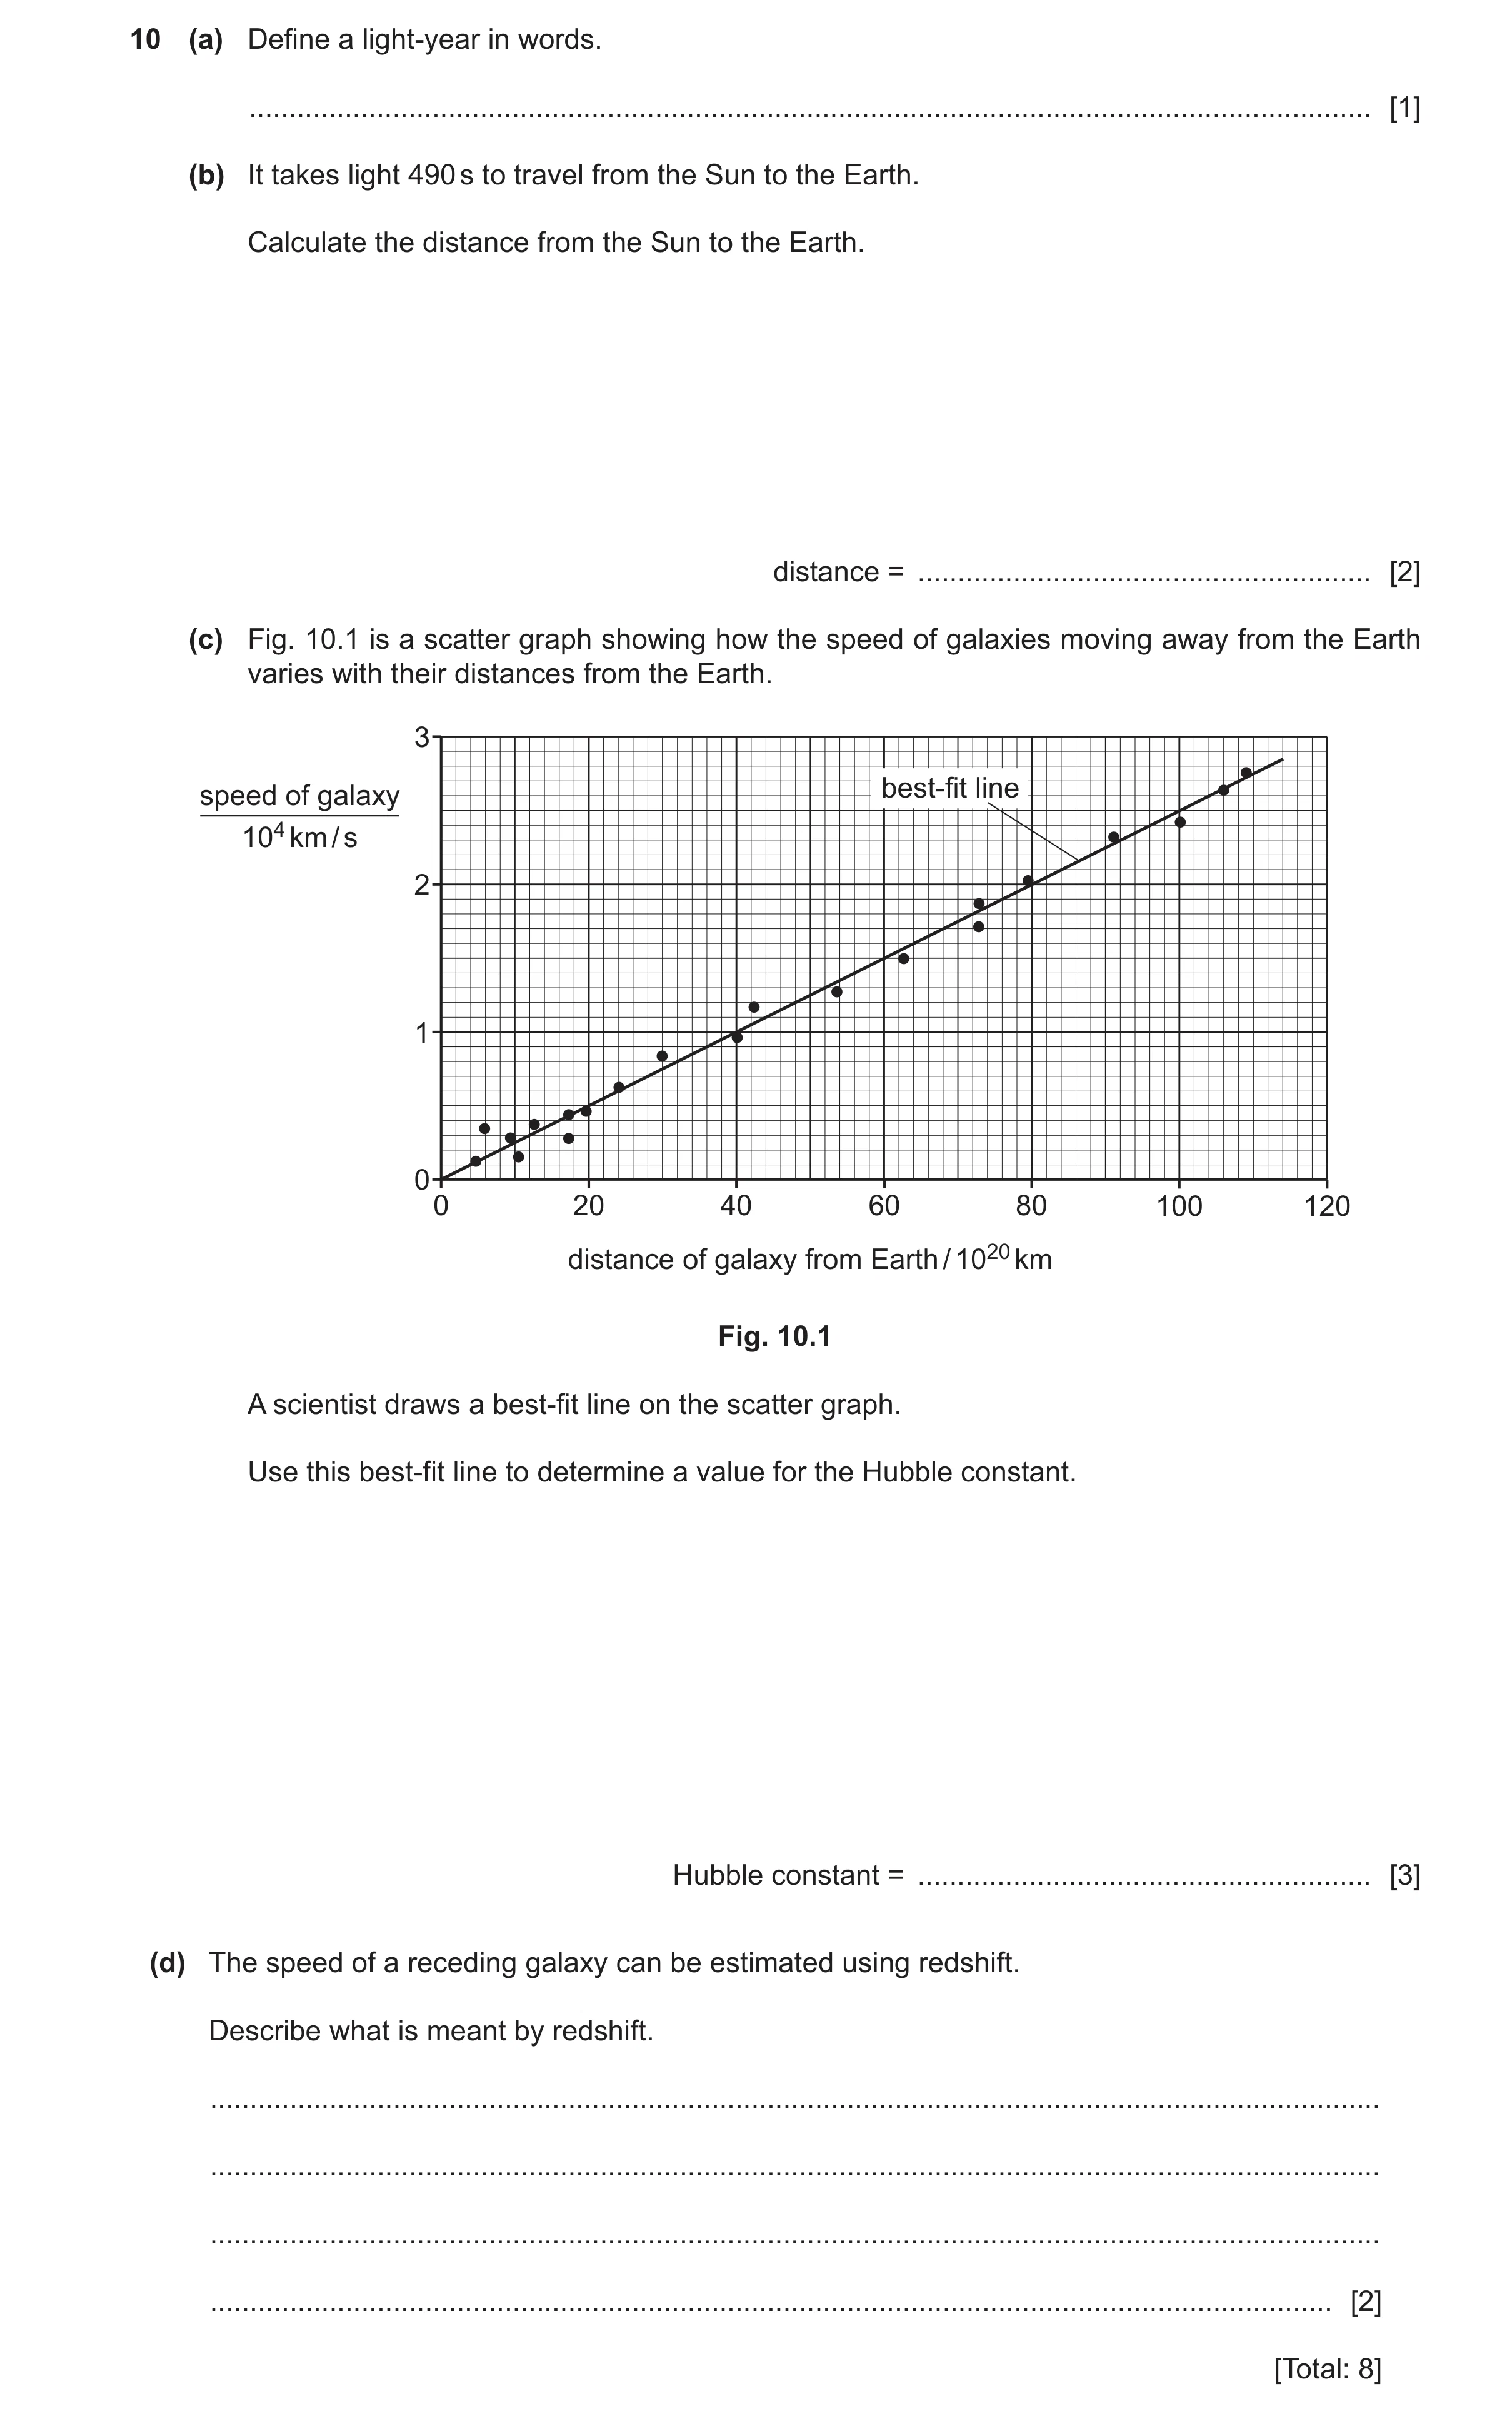
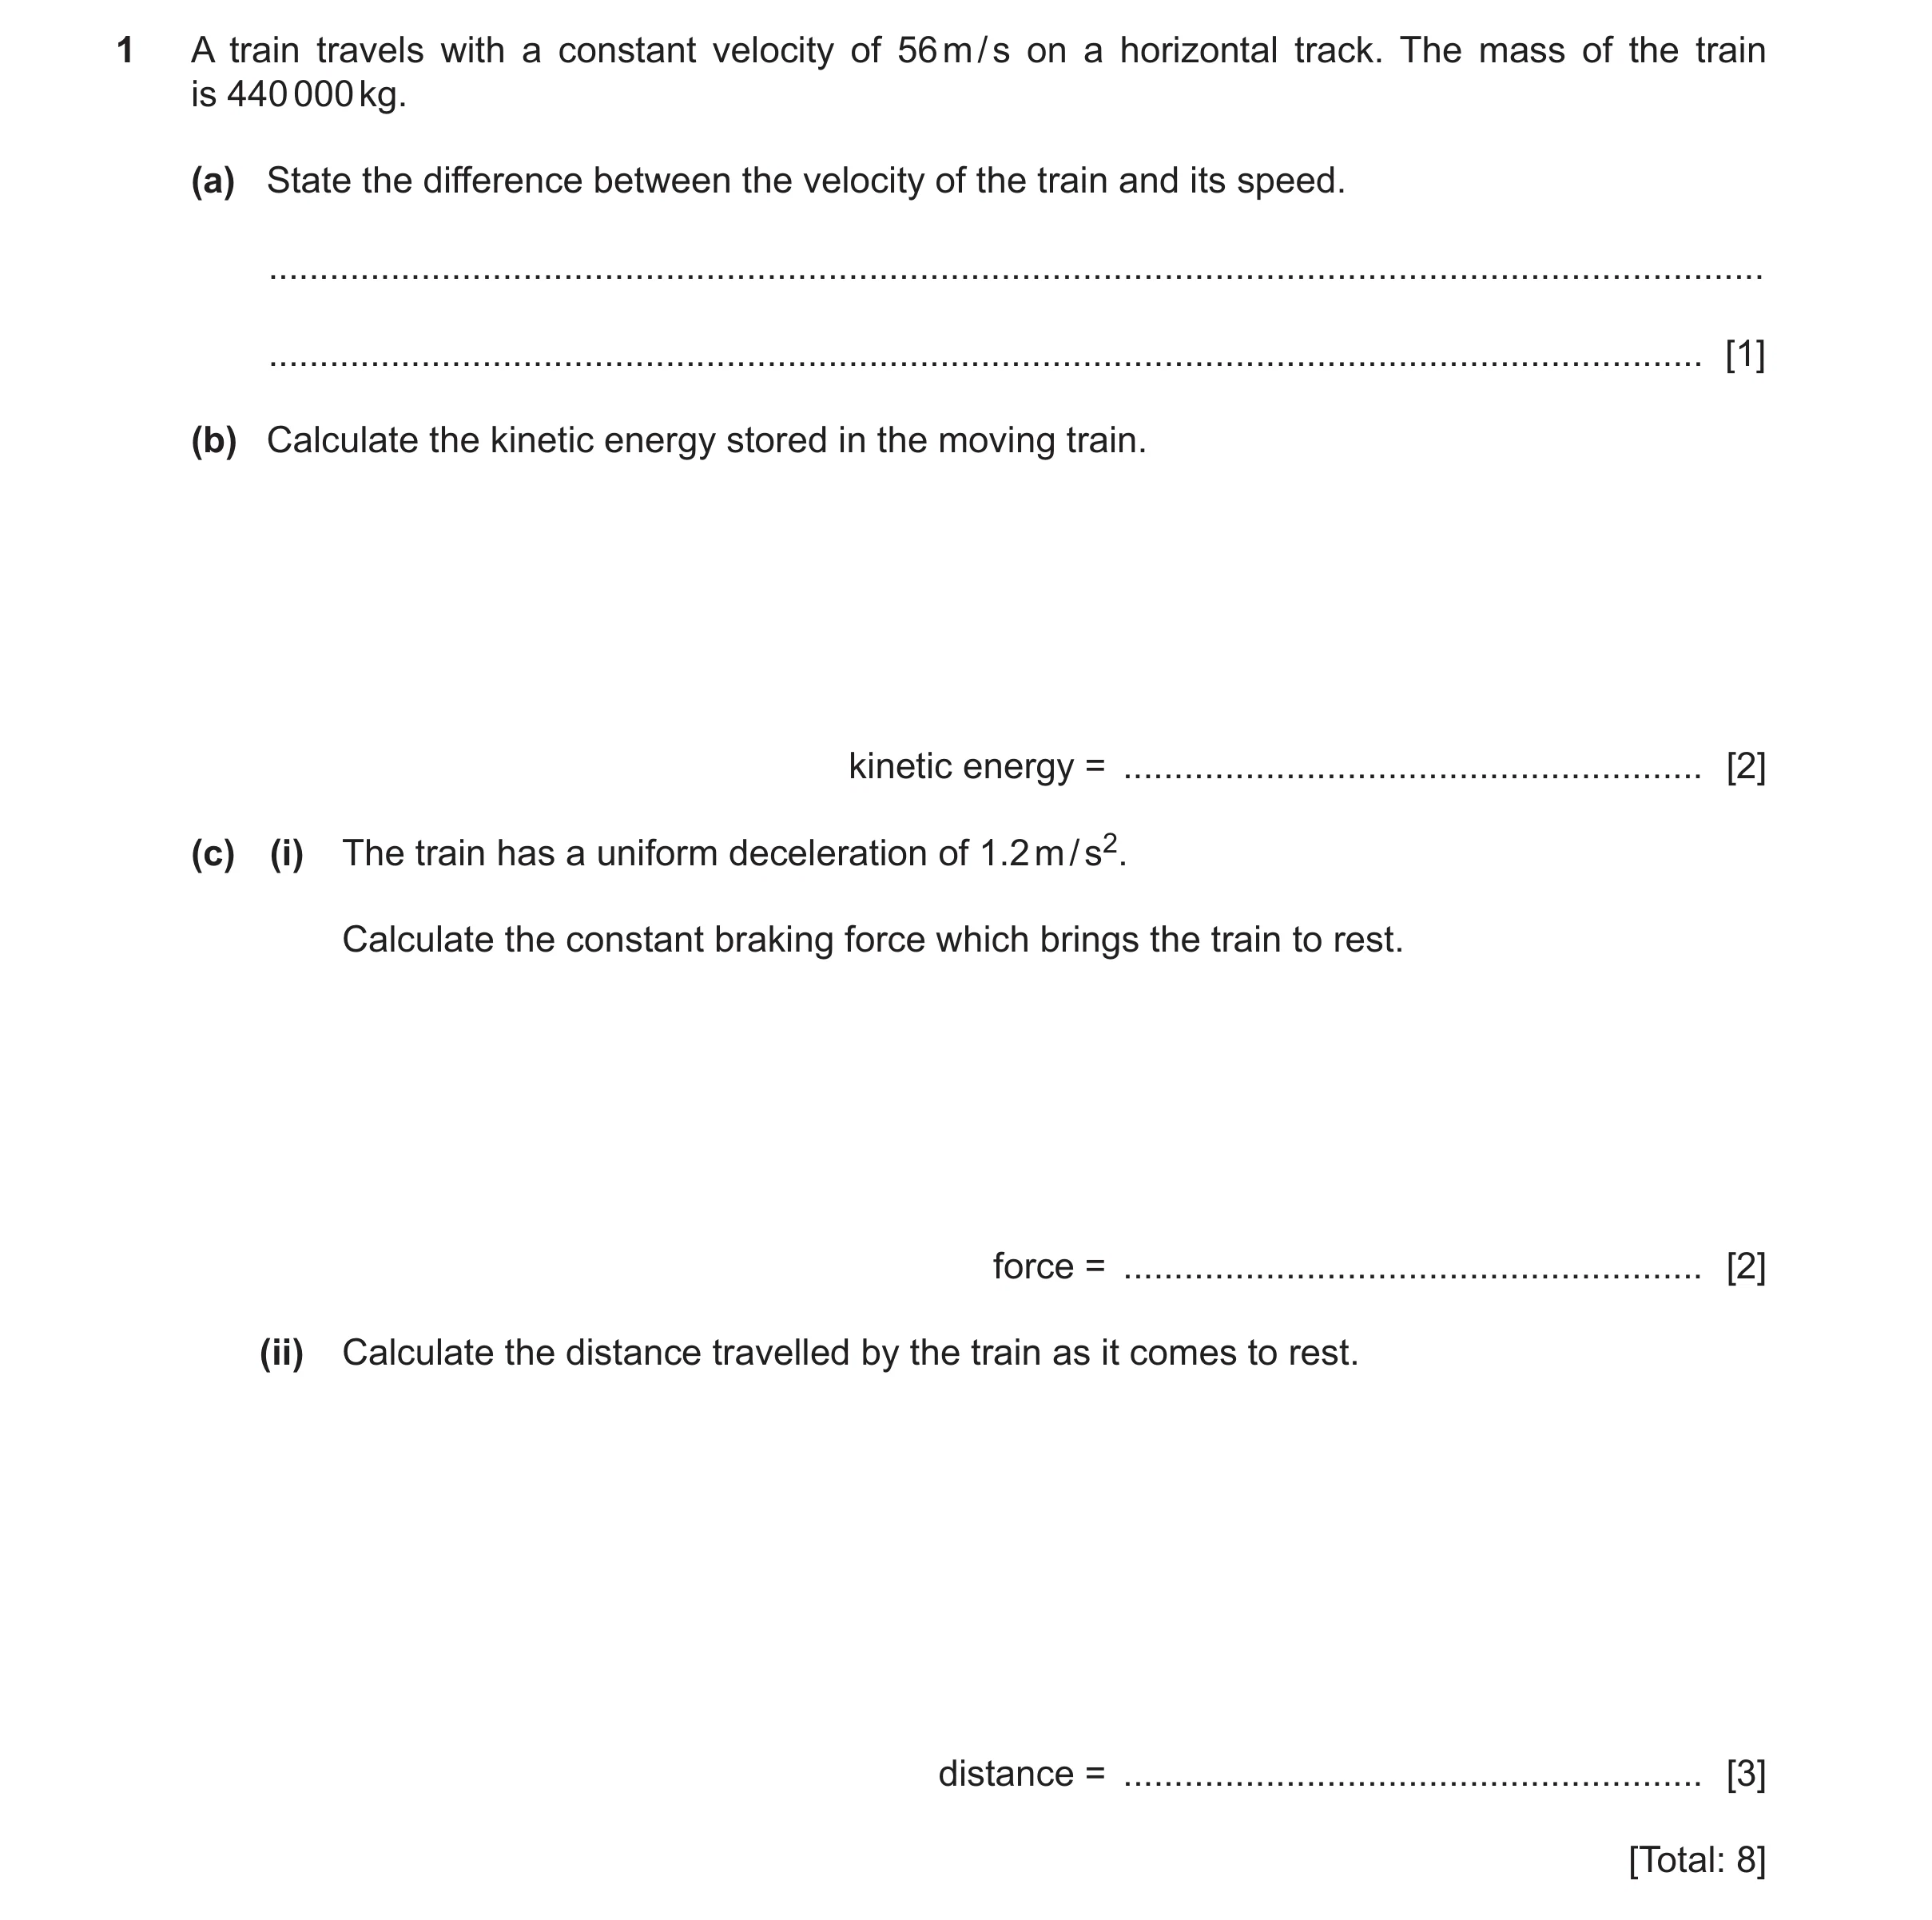 76 / 78
 77 / 78
 78 / 78
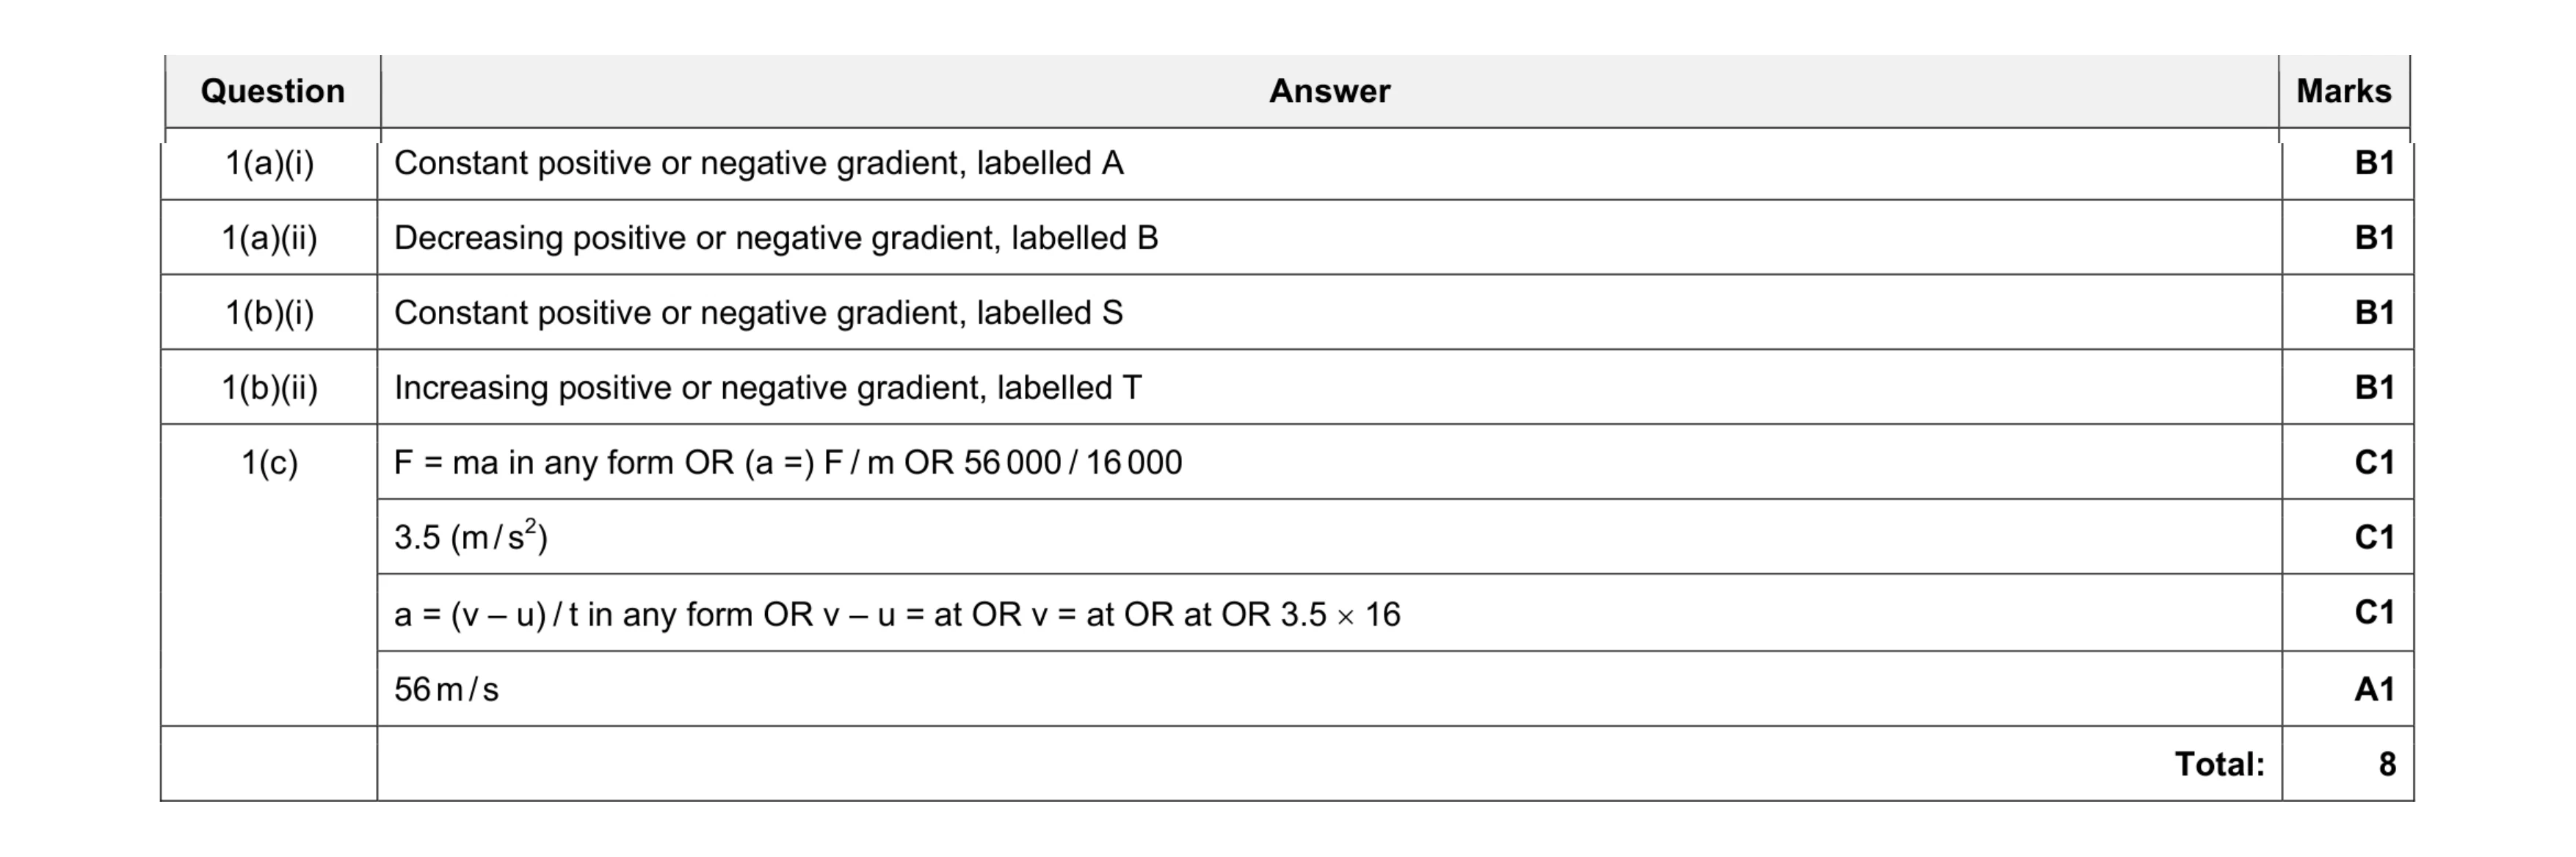 8
8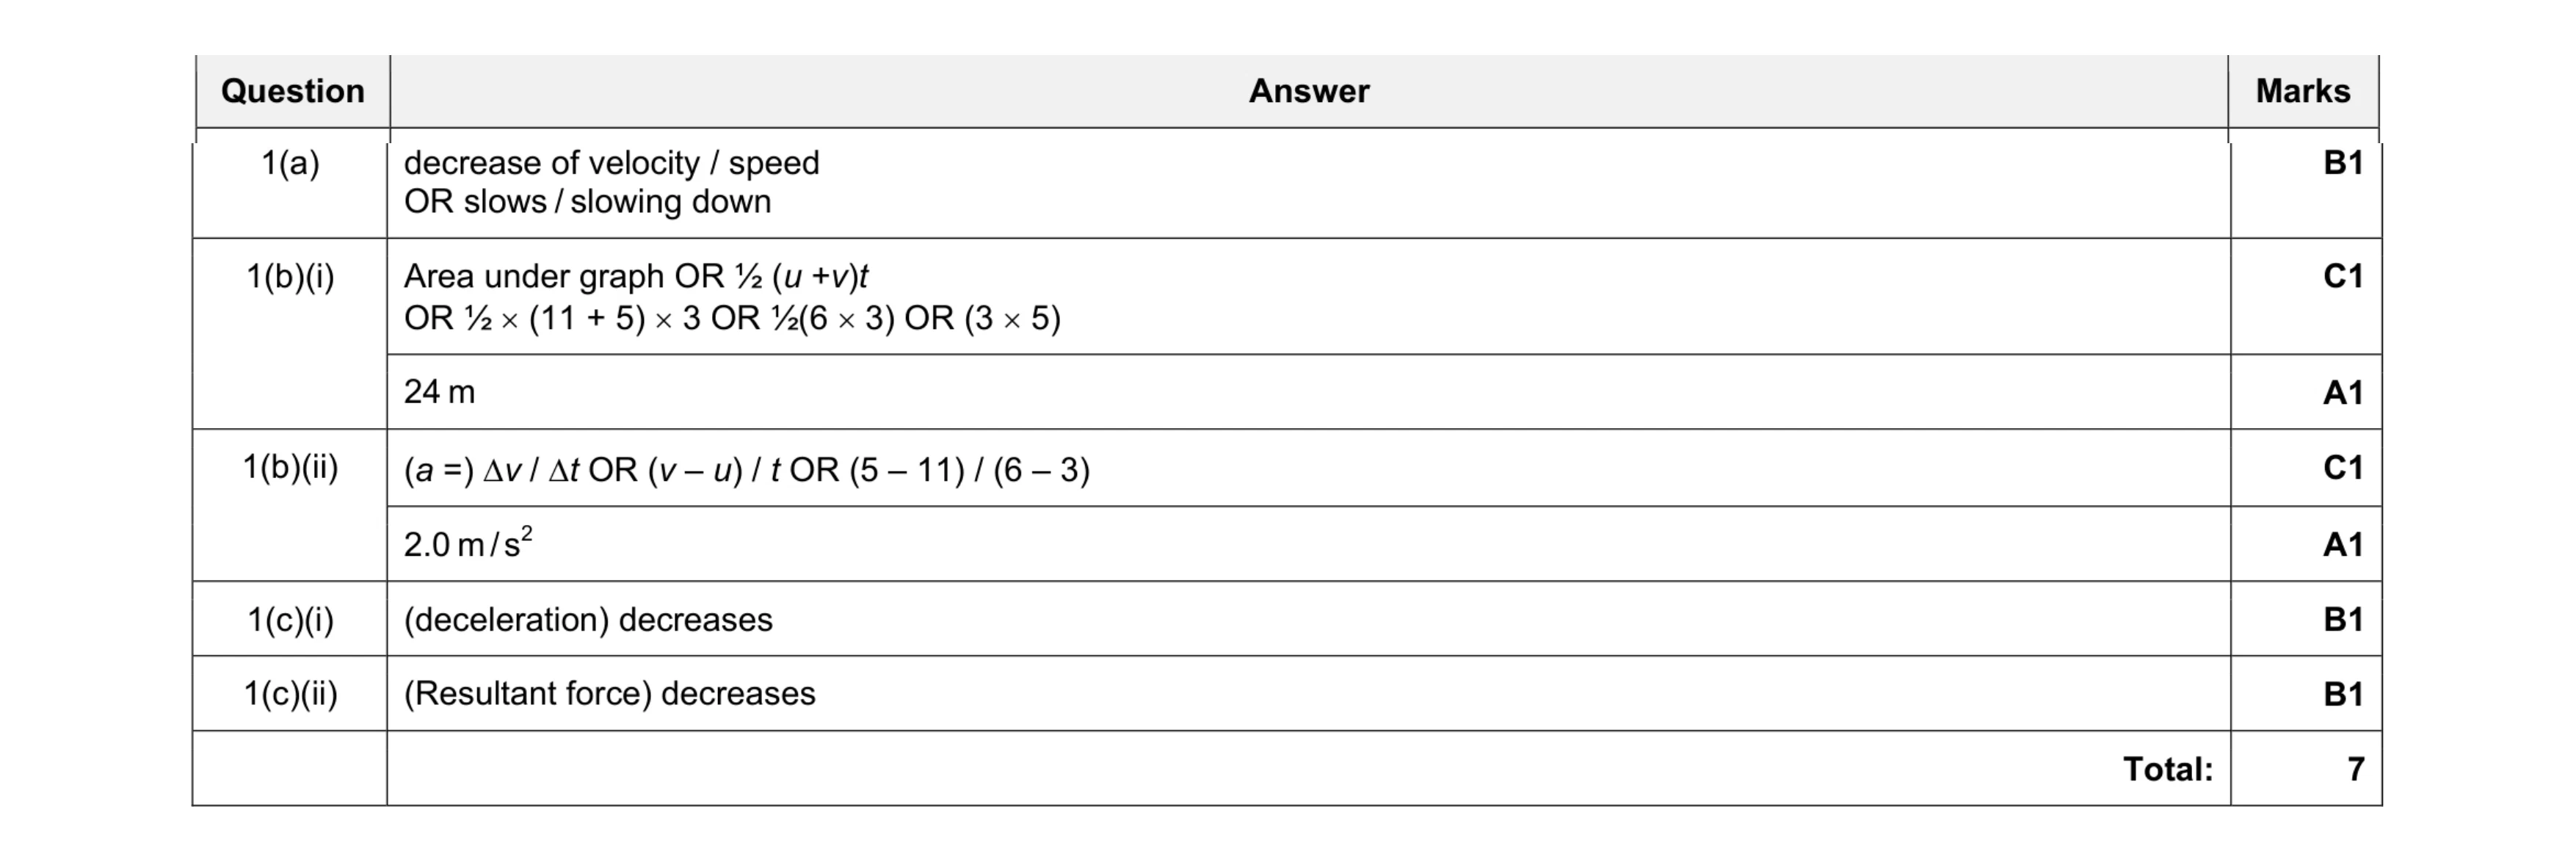 7
7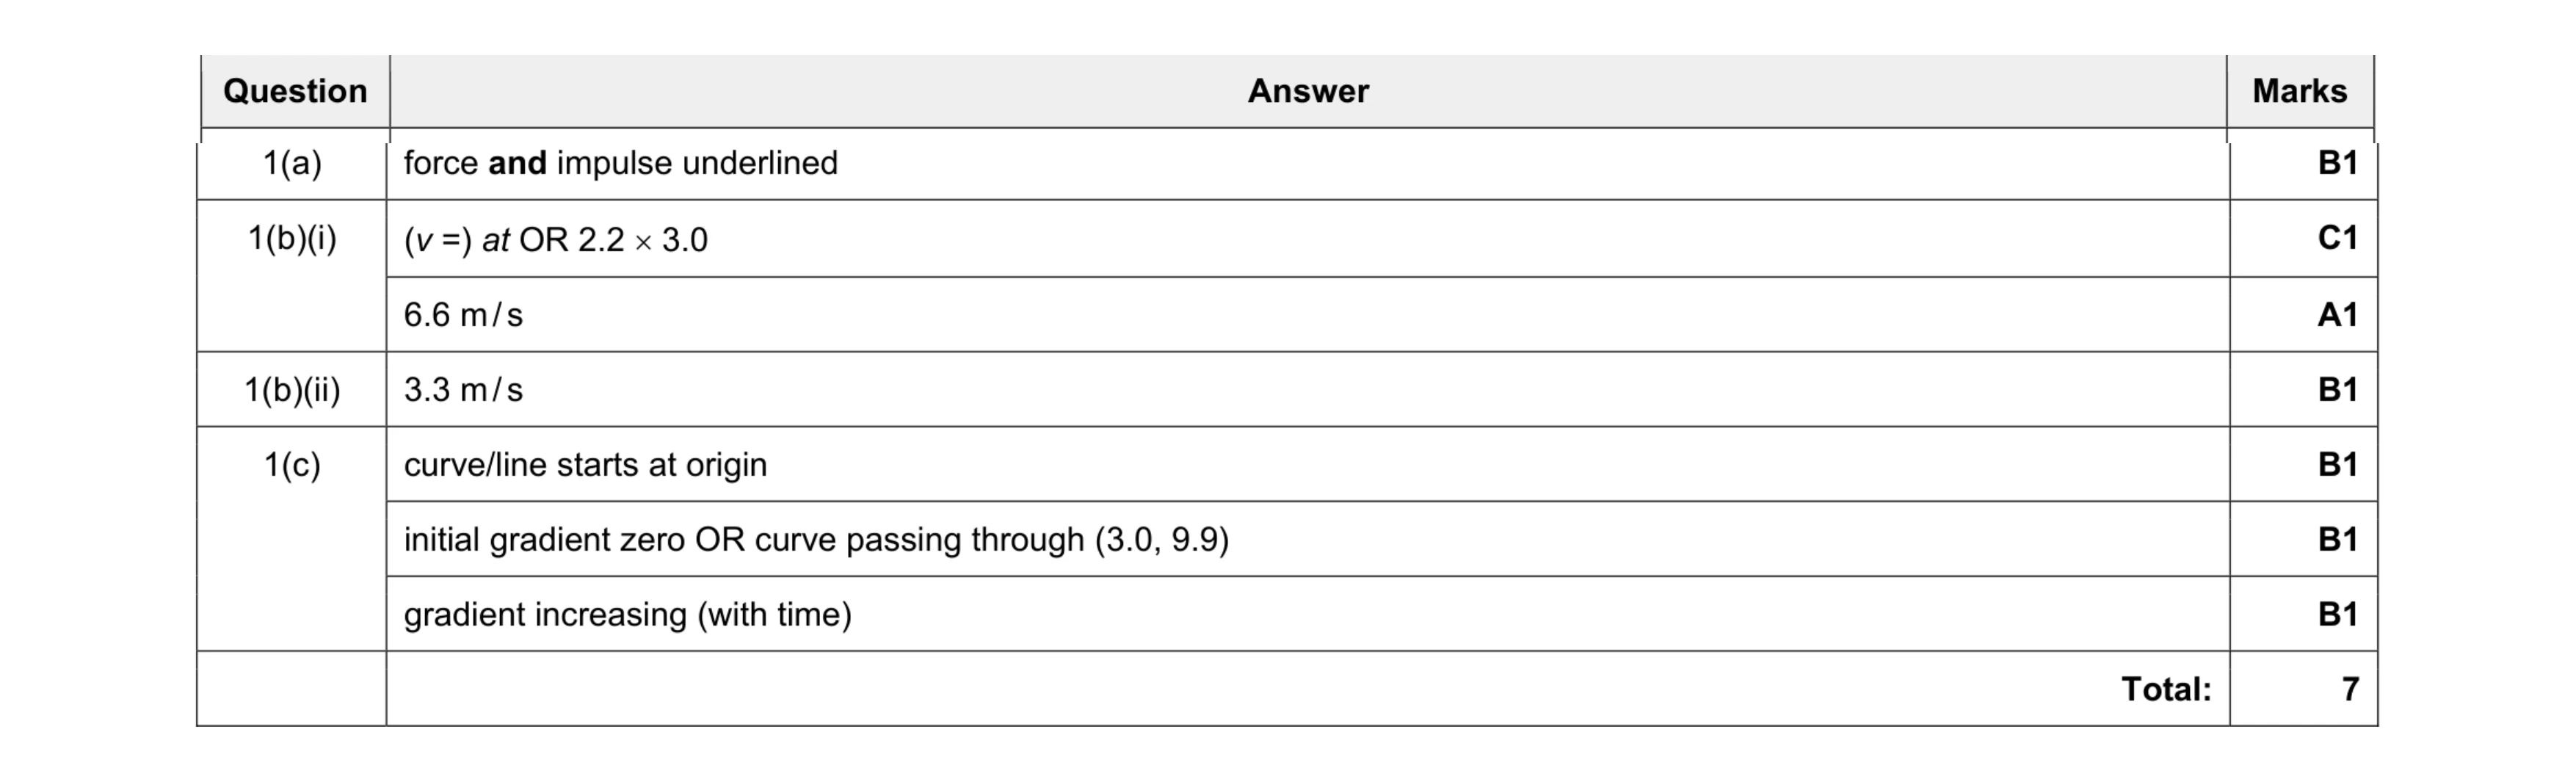 7
7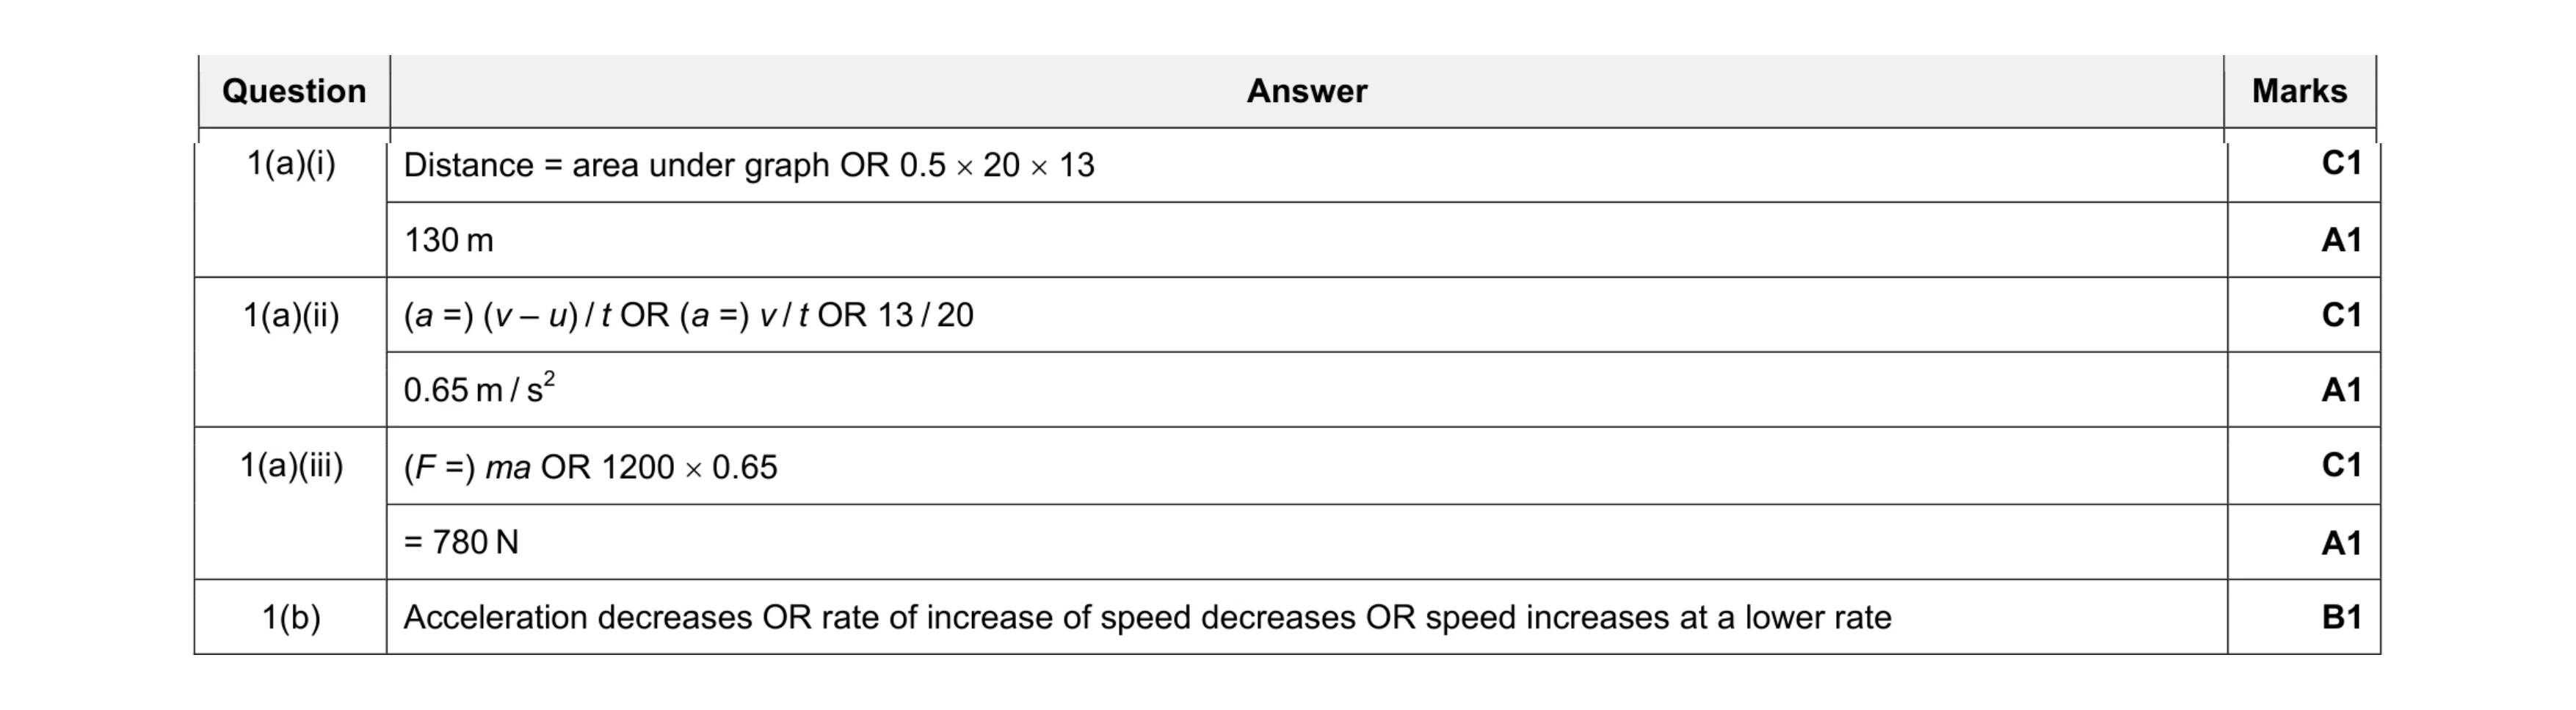 7
7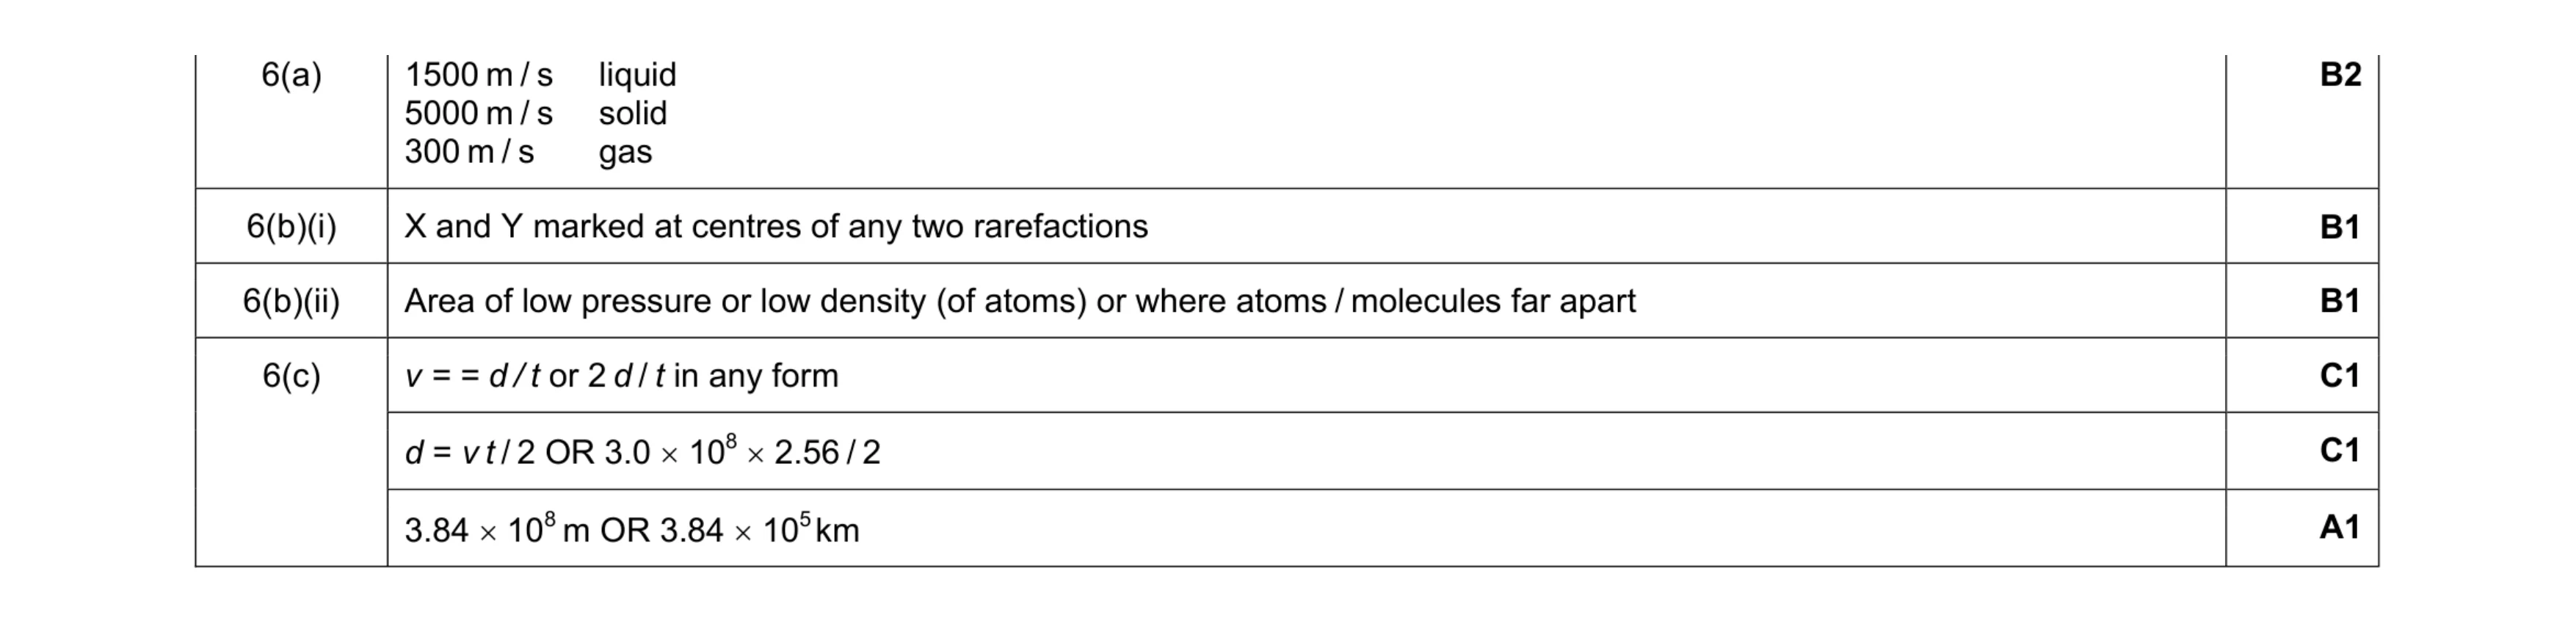 7
7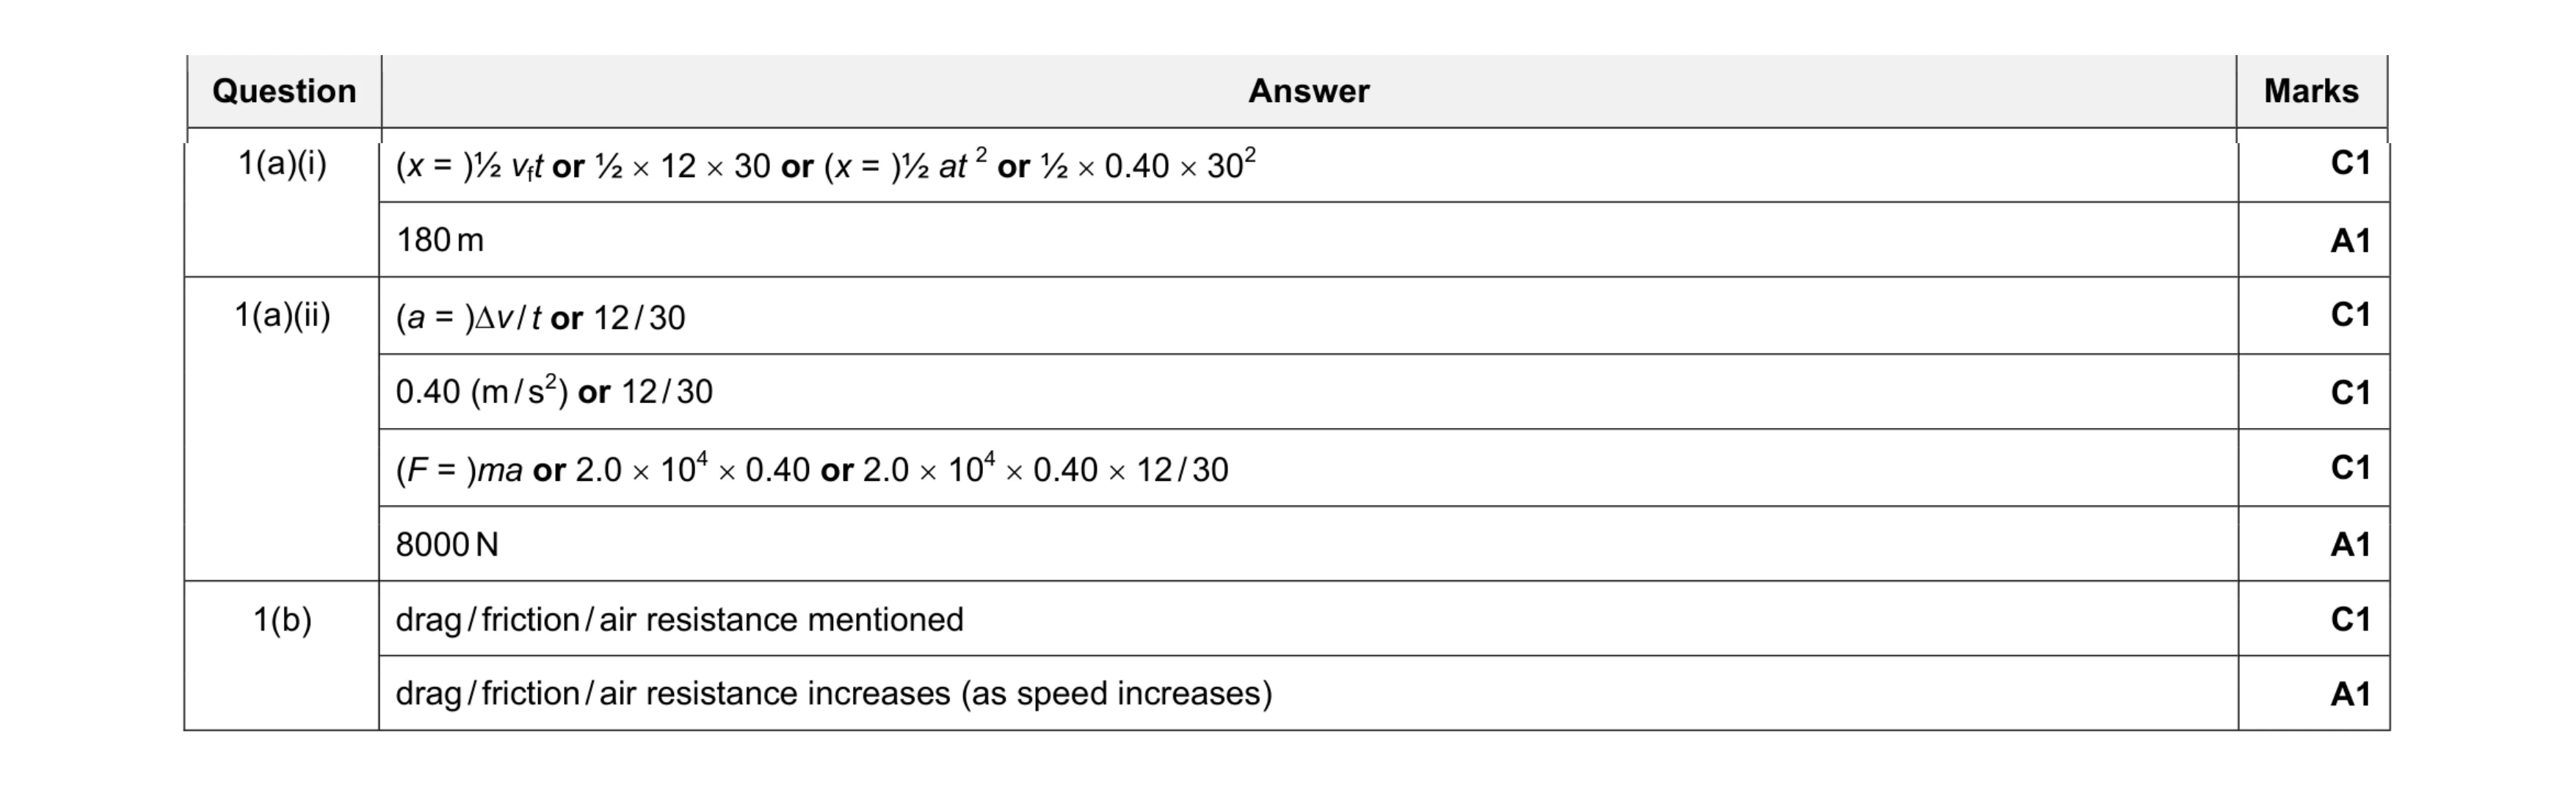 8
8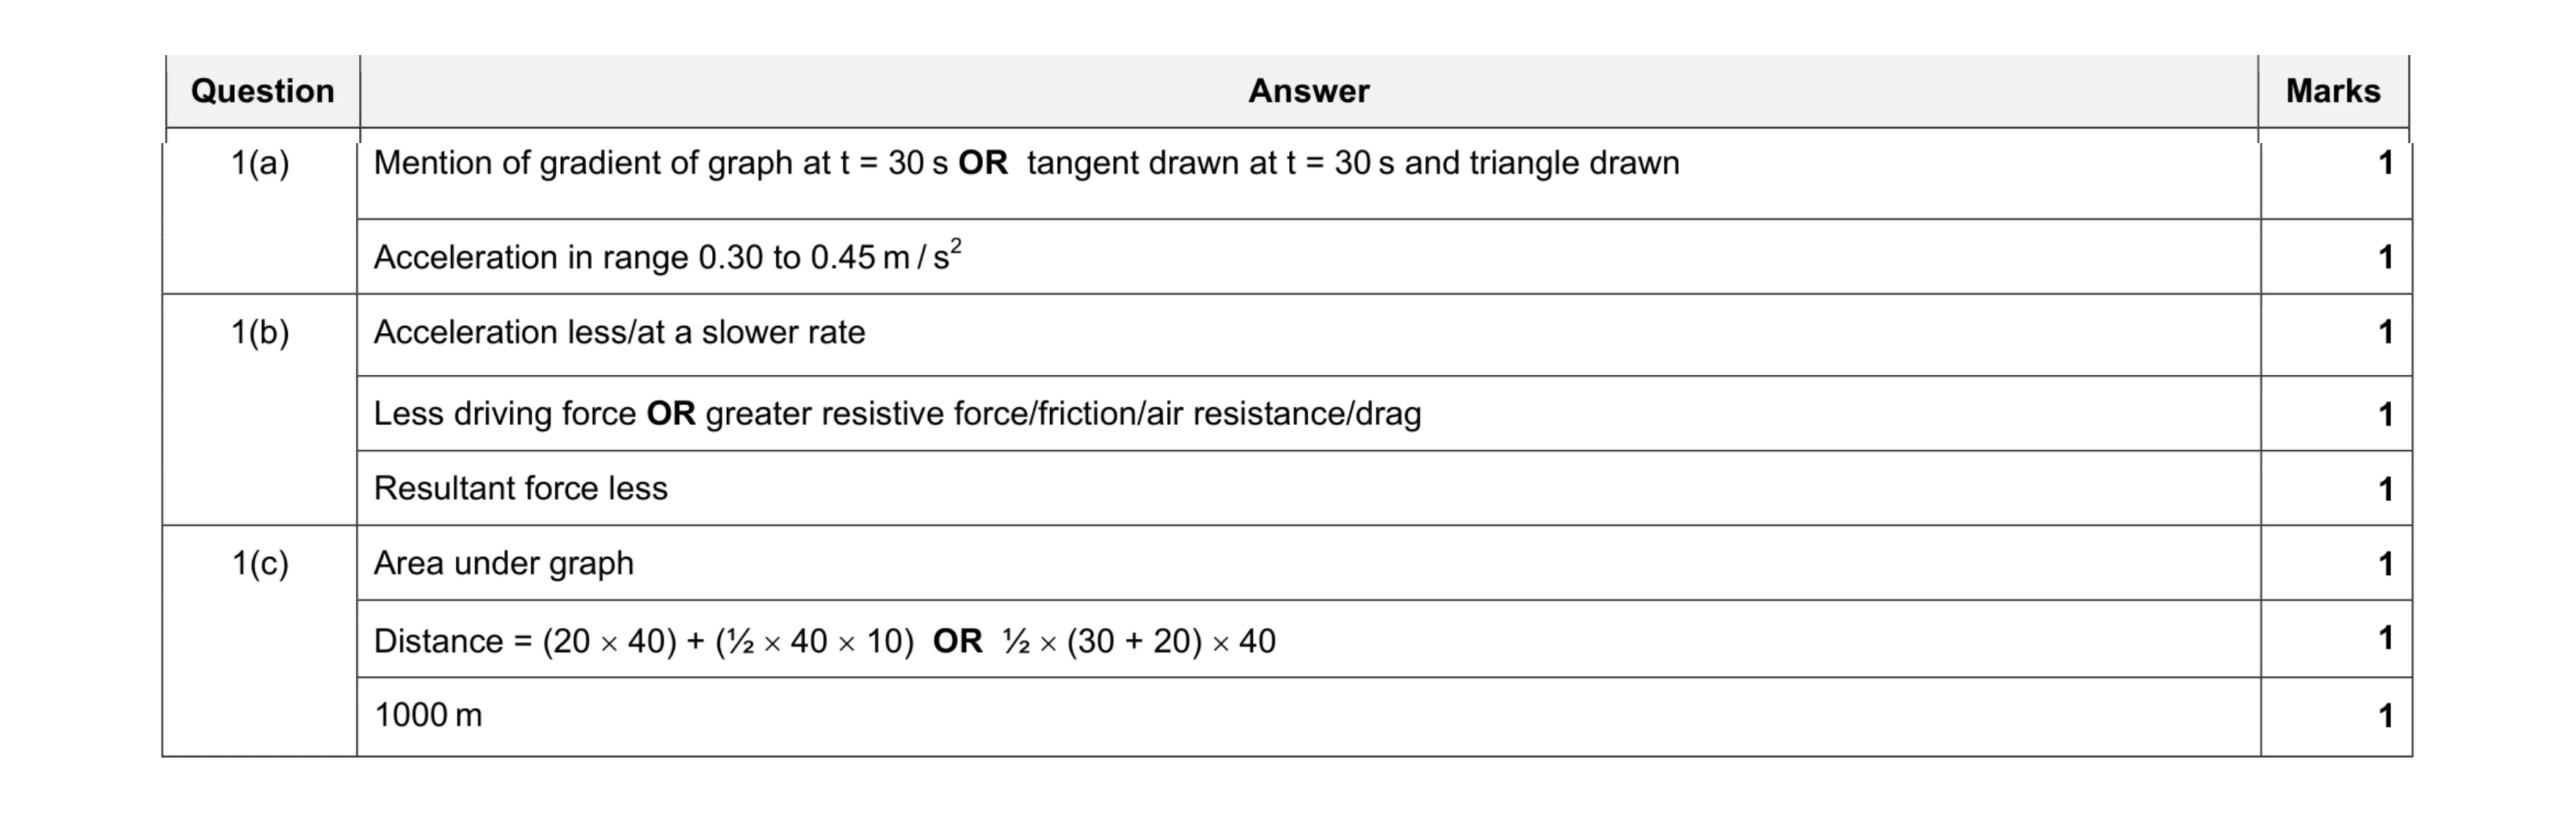 8
8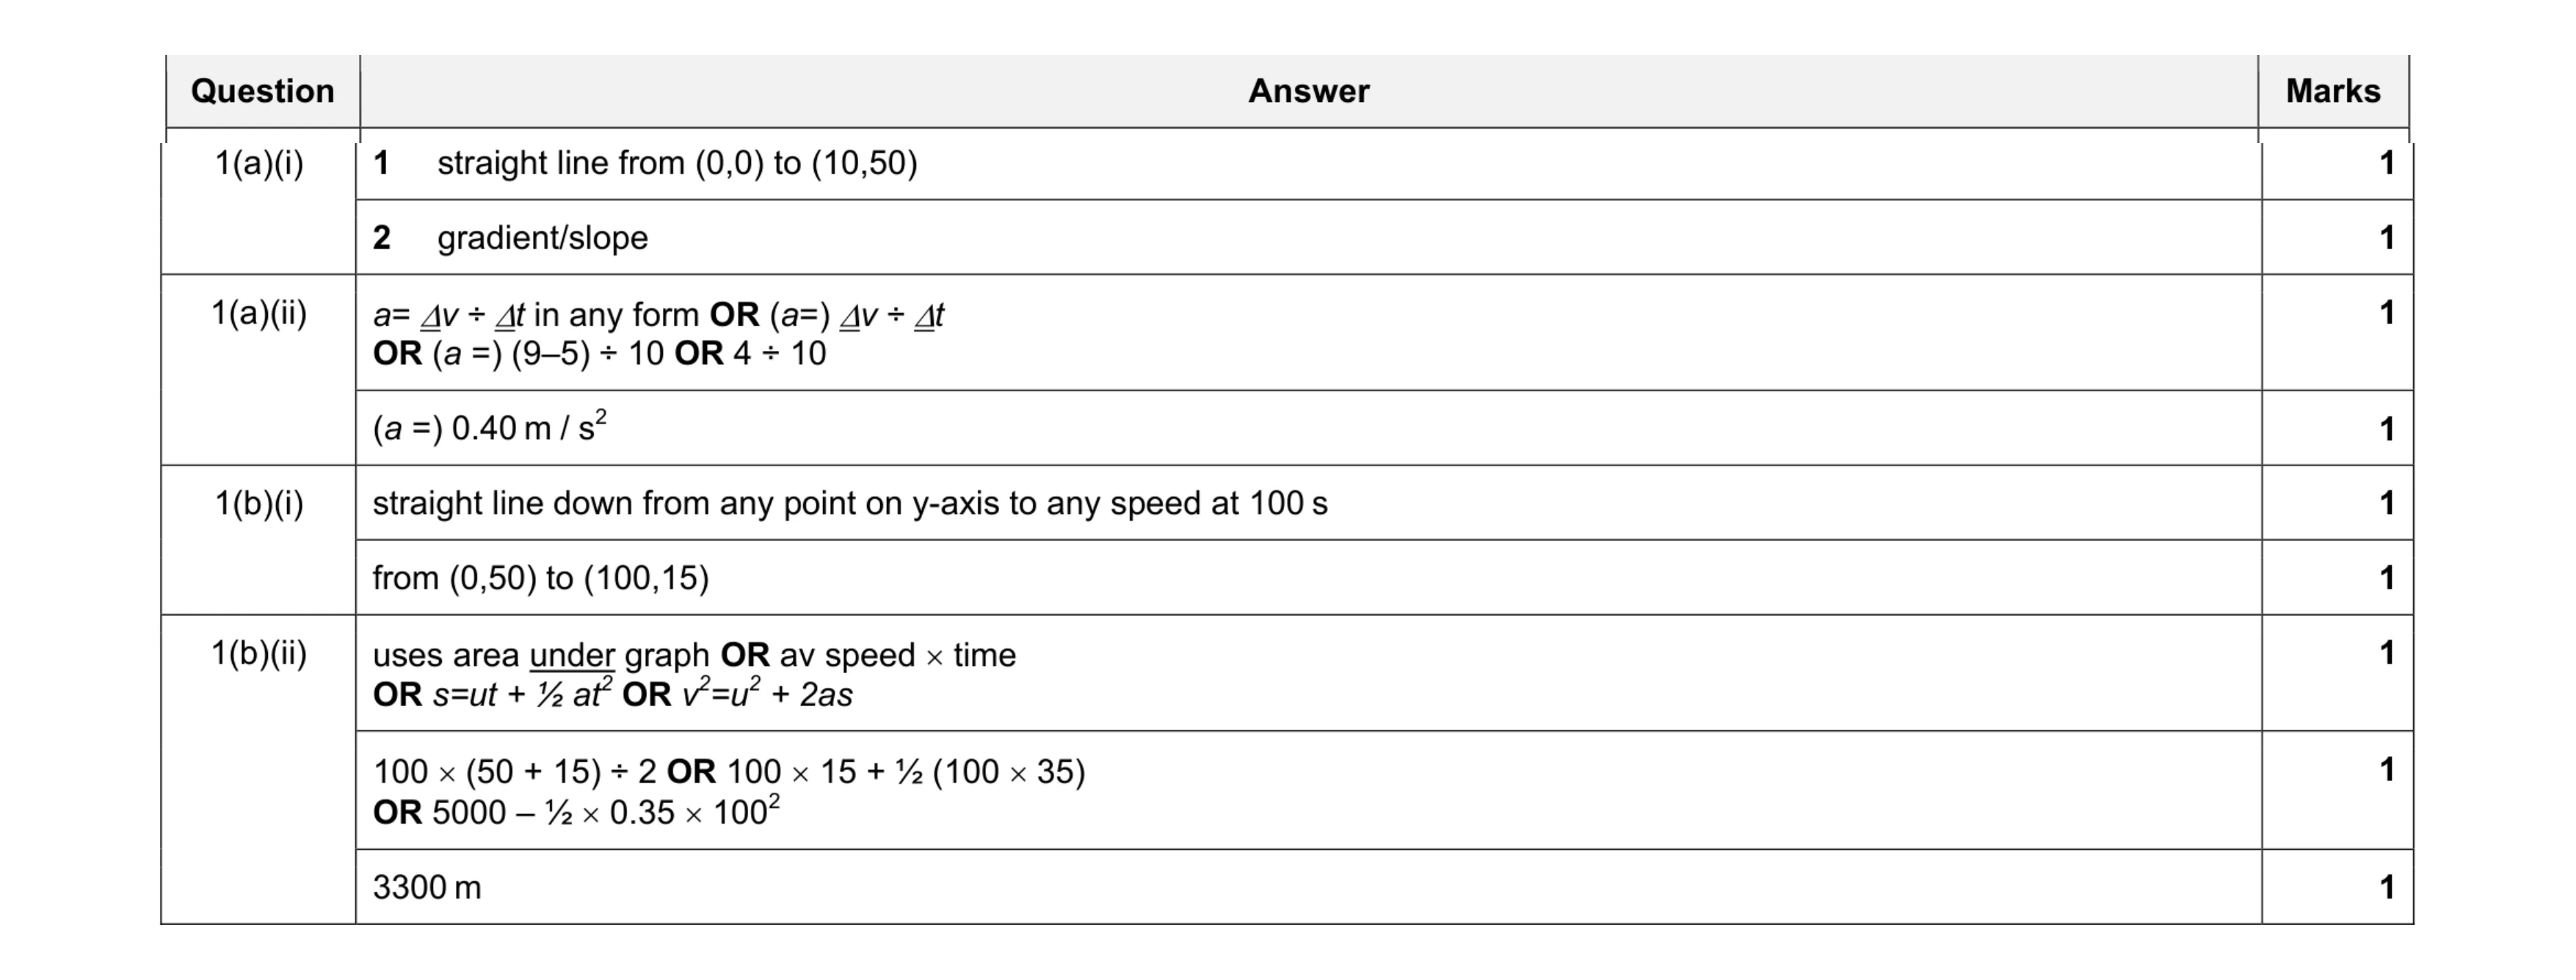 9
9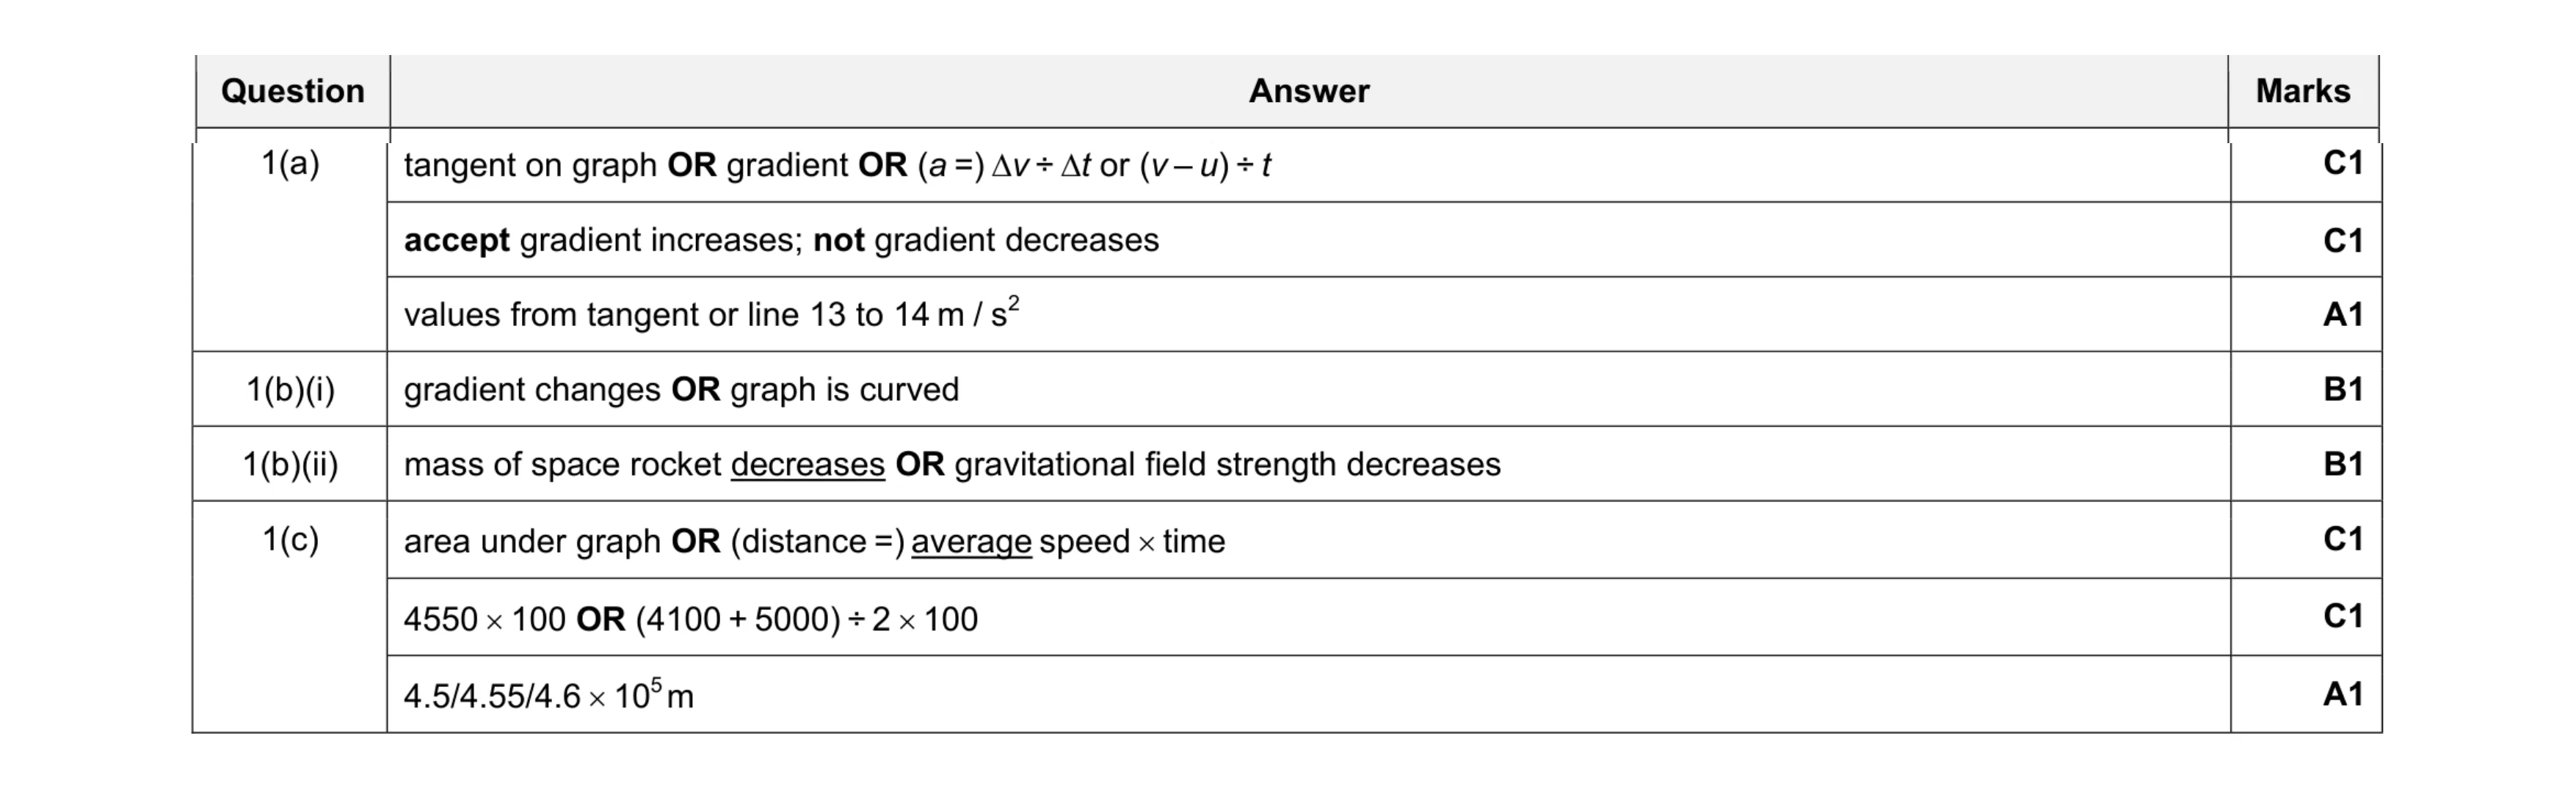 8
8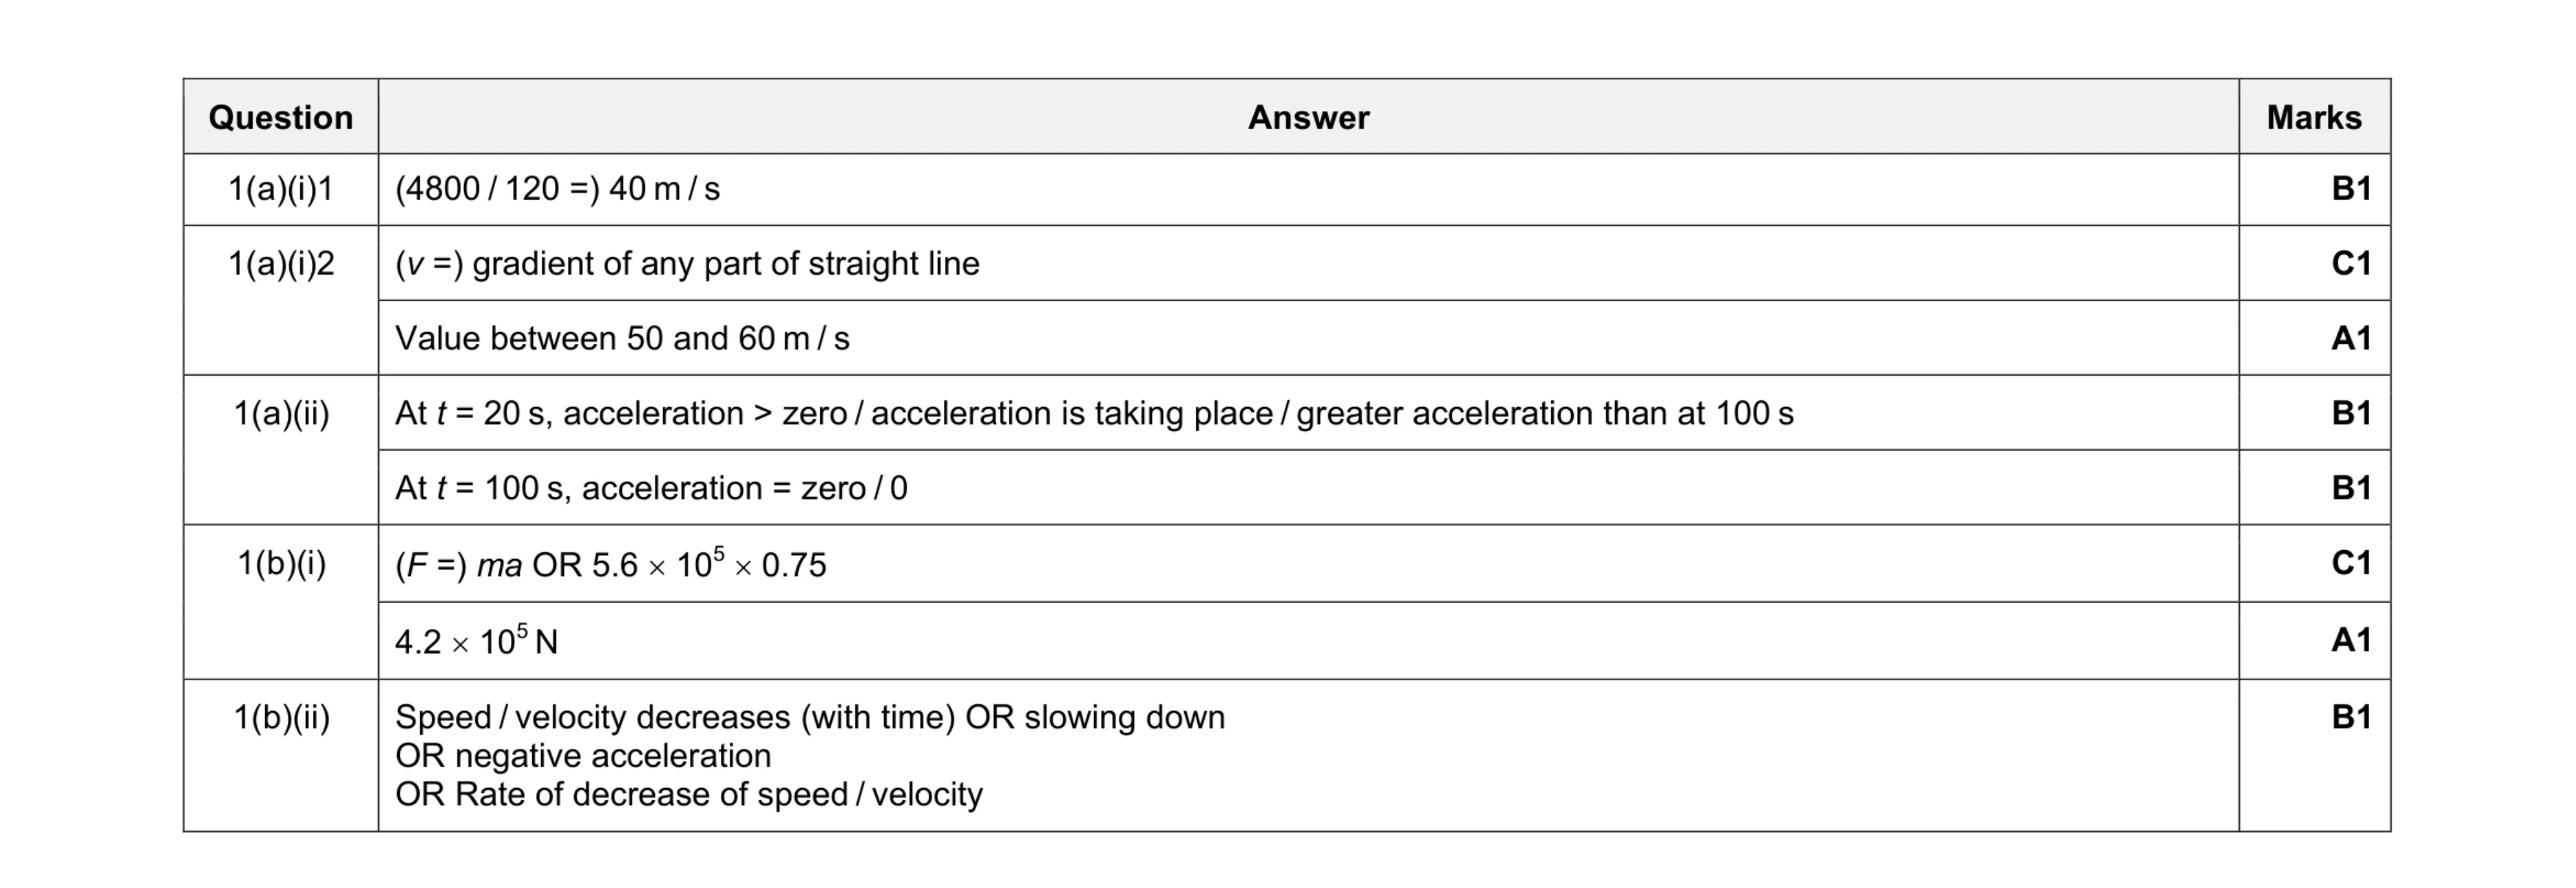 8
8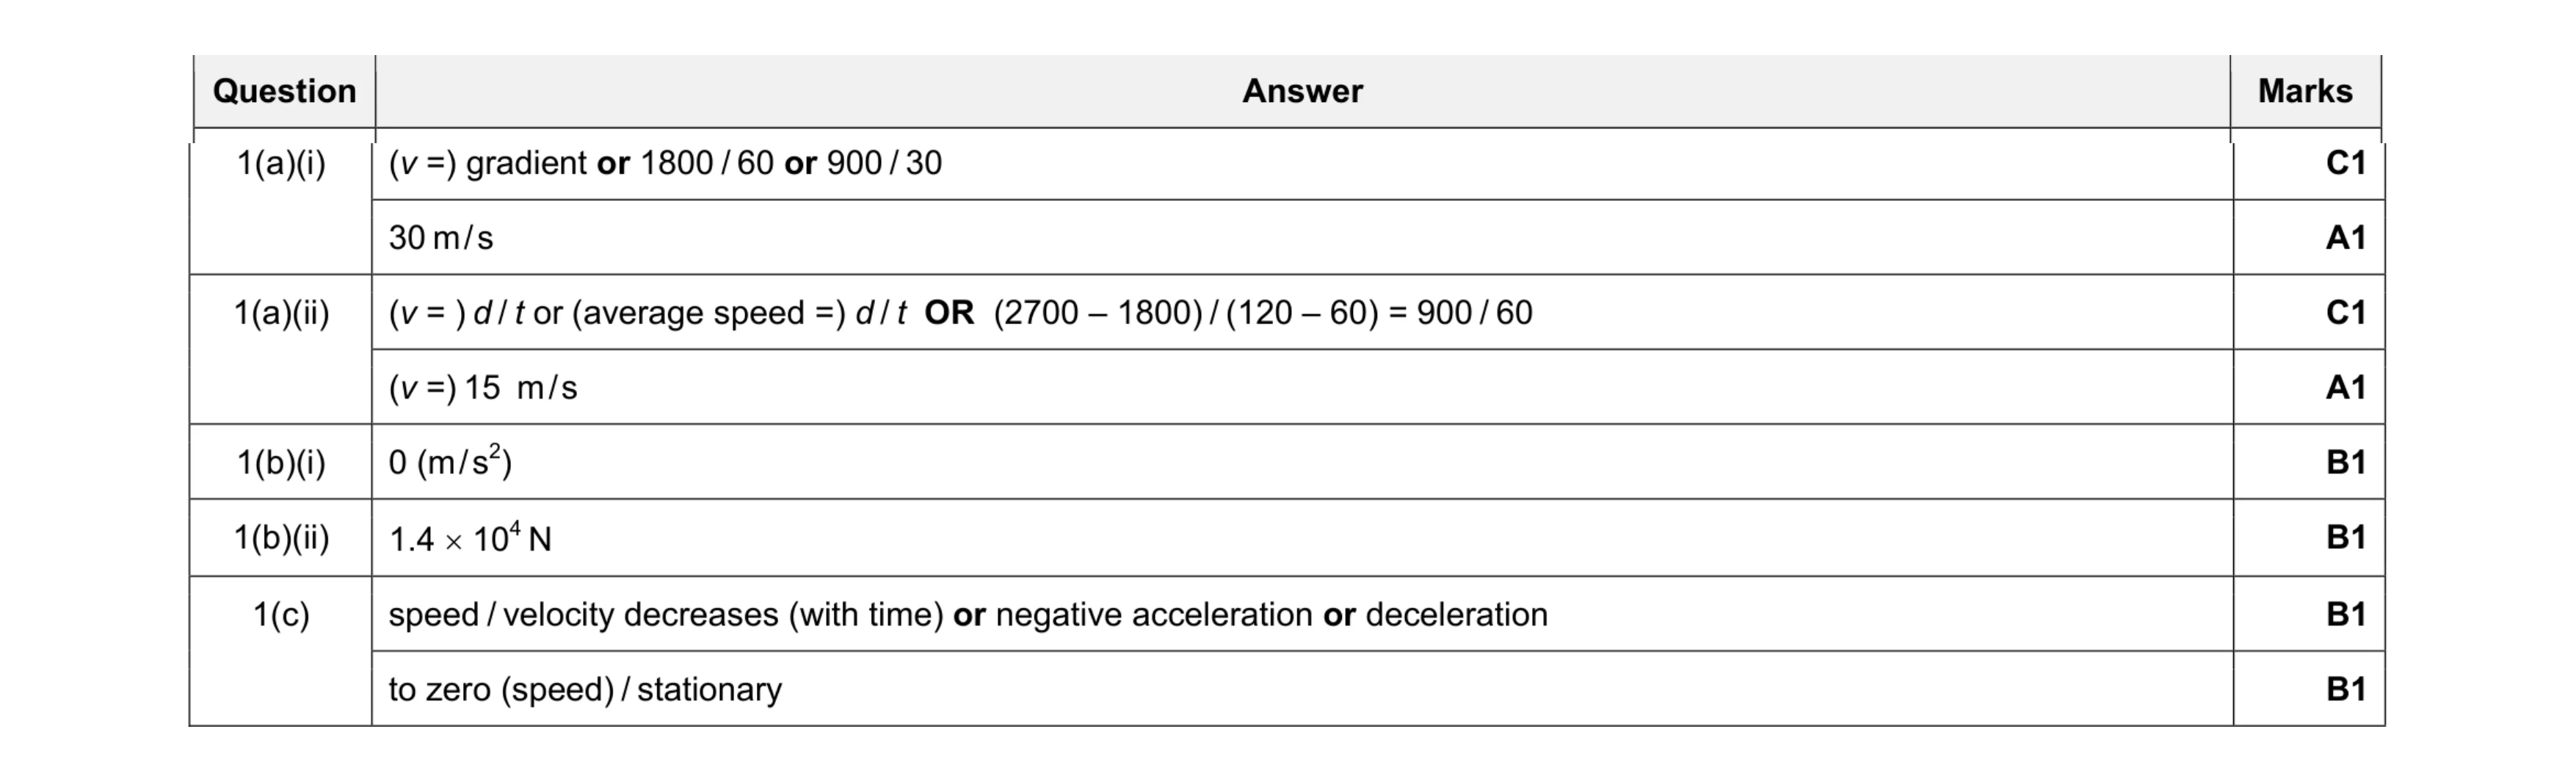 8
8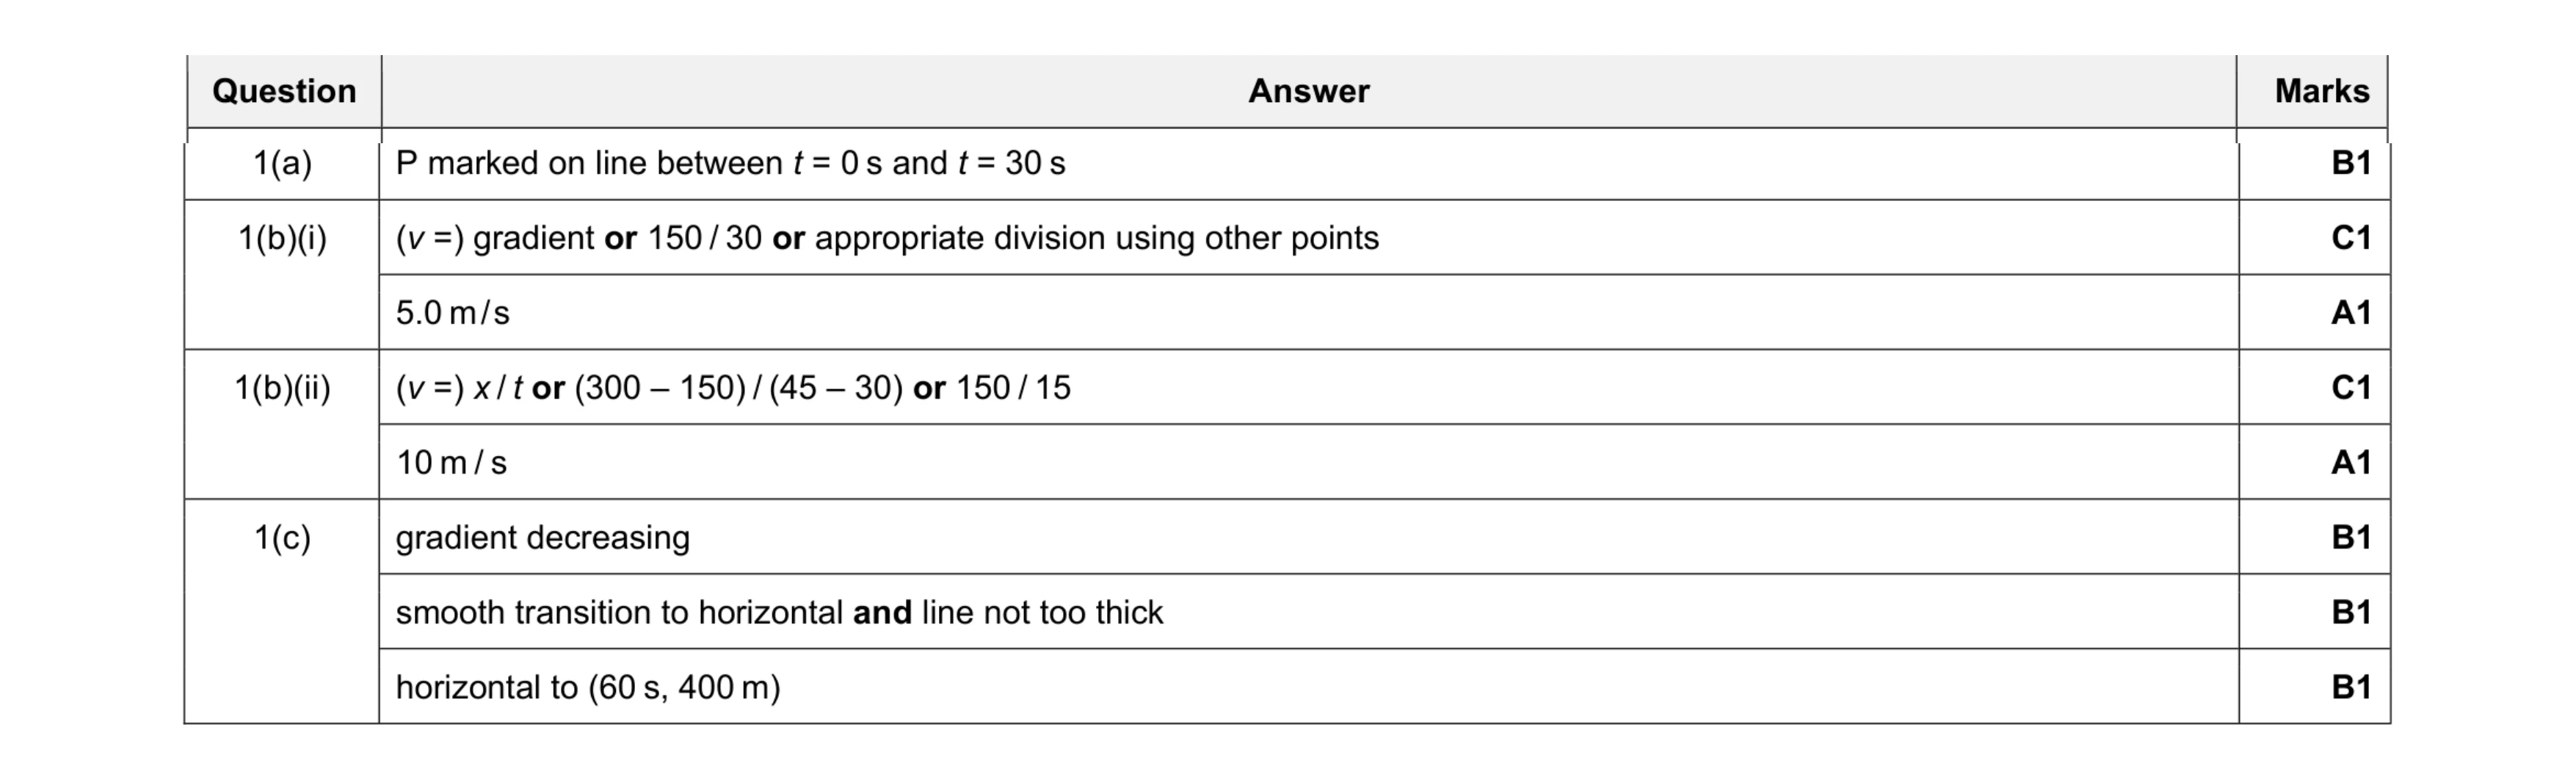 8
8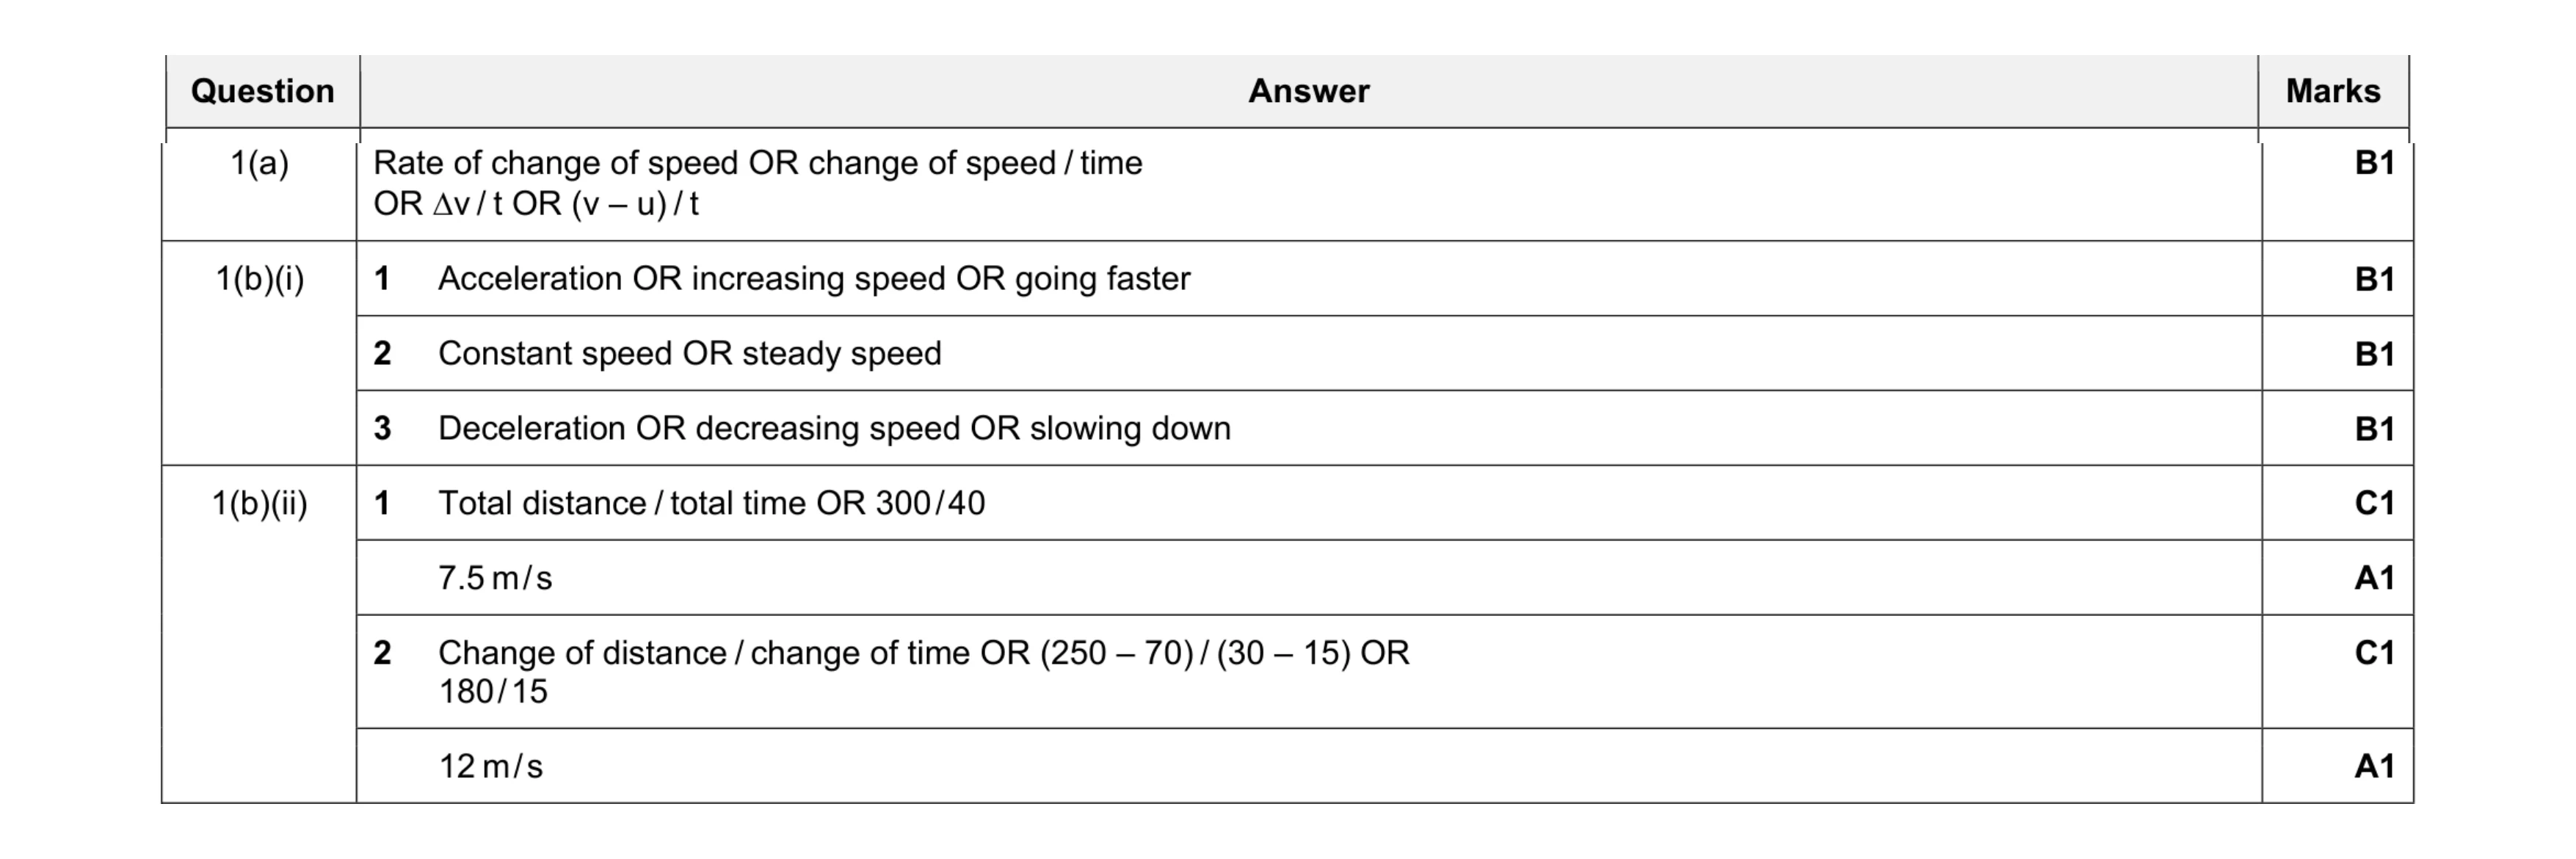 8
8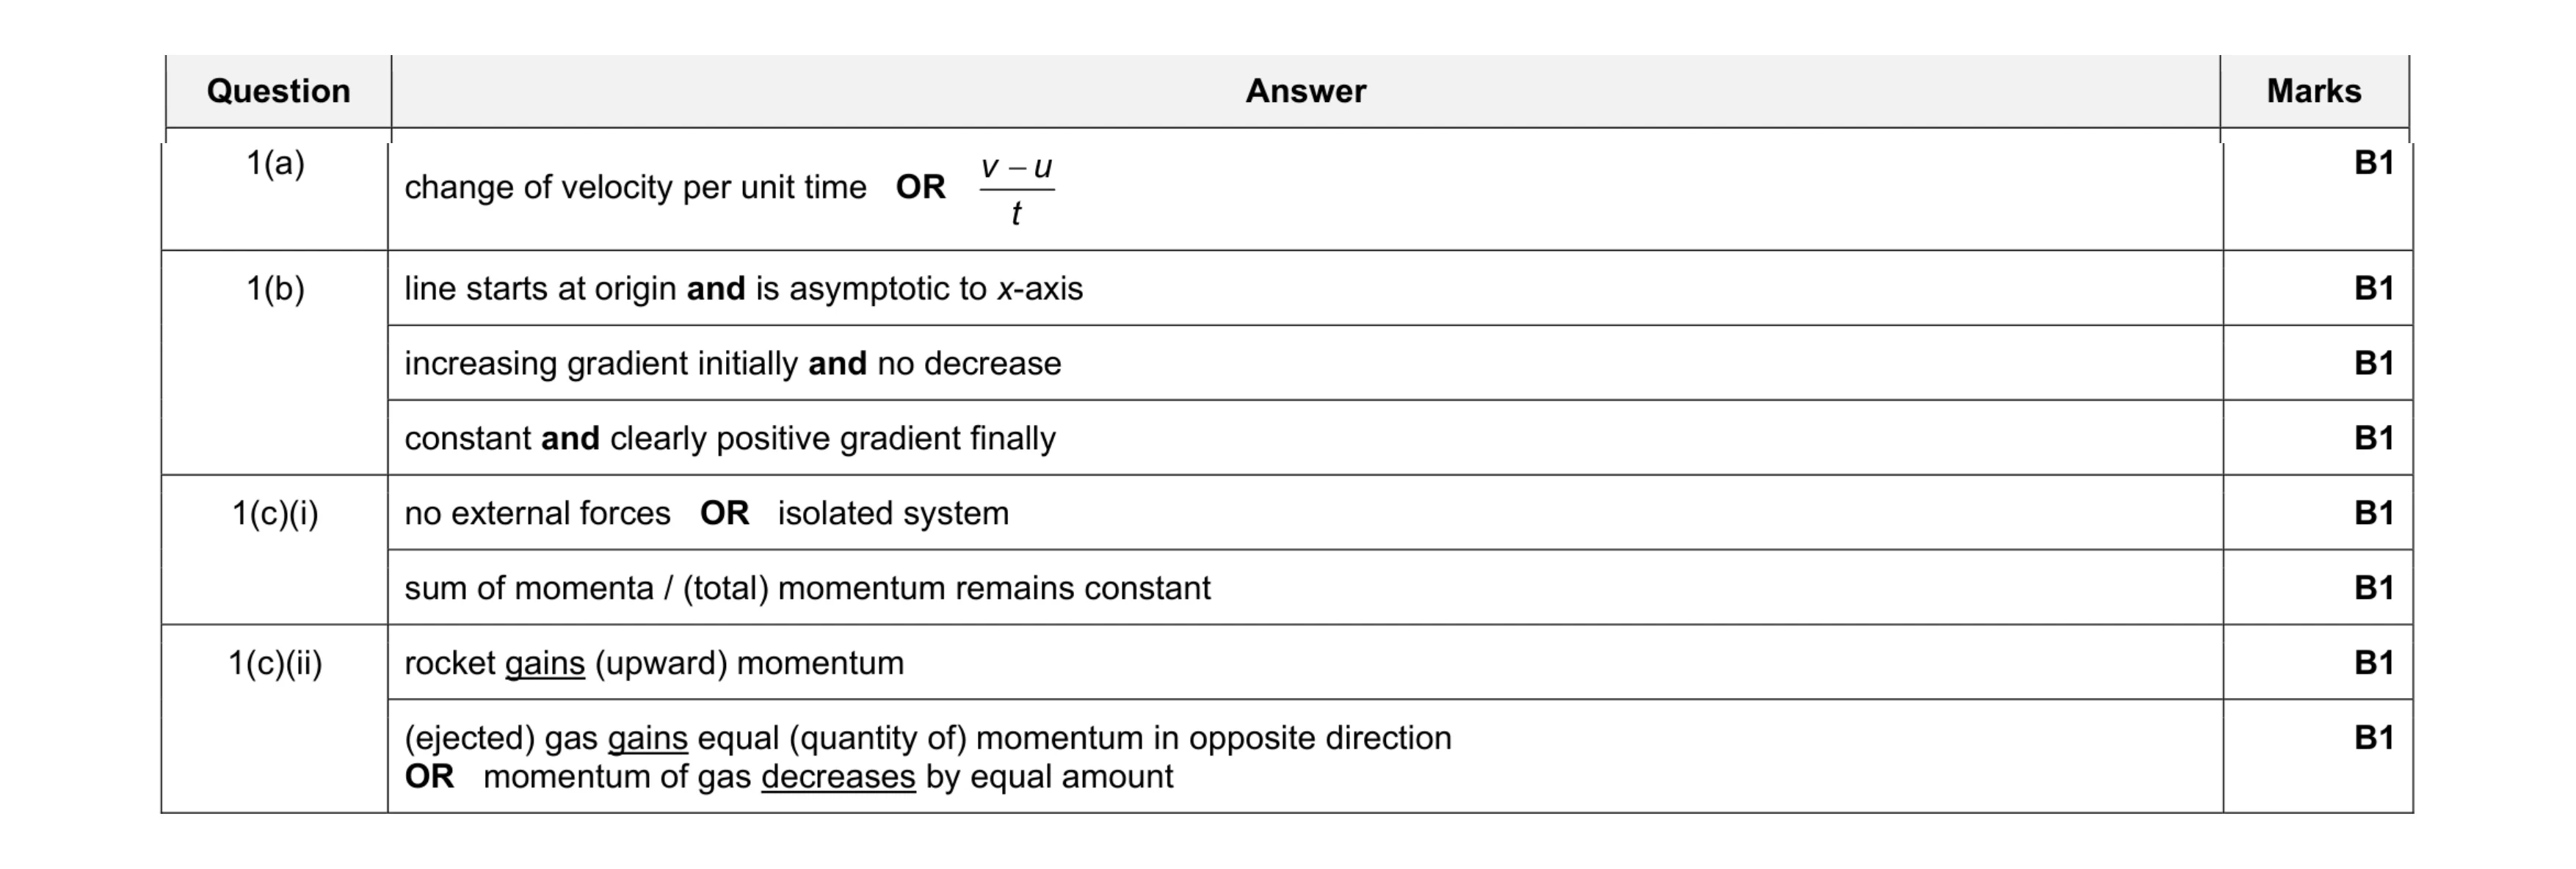 8
8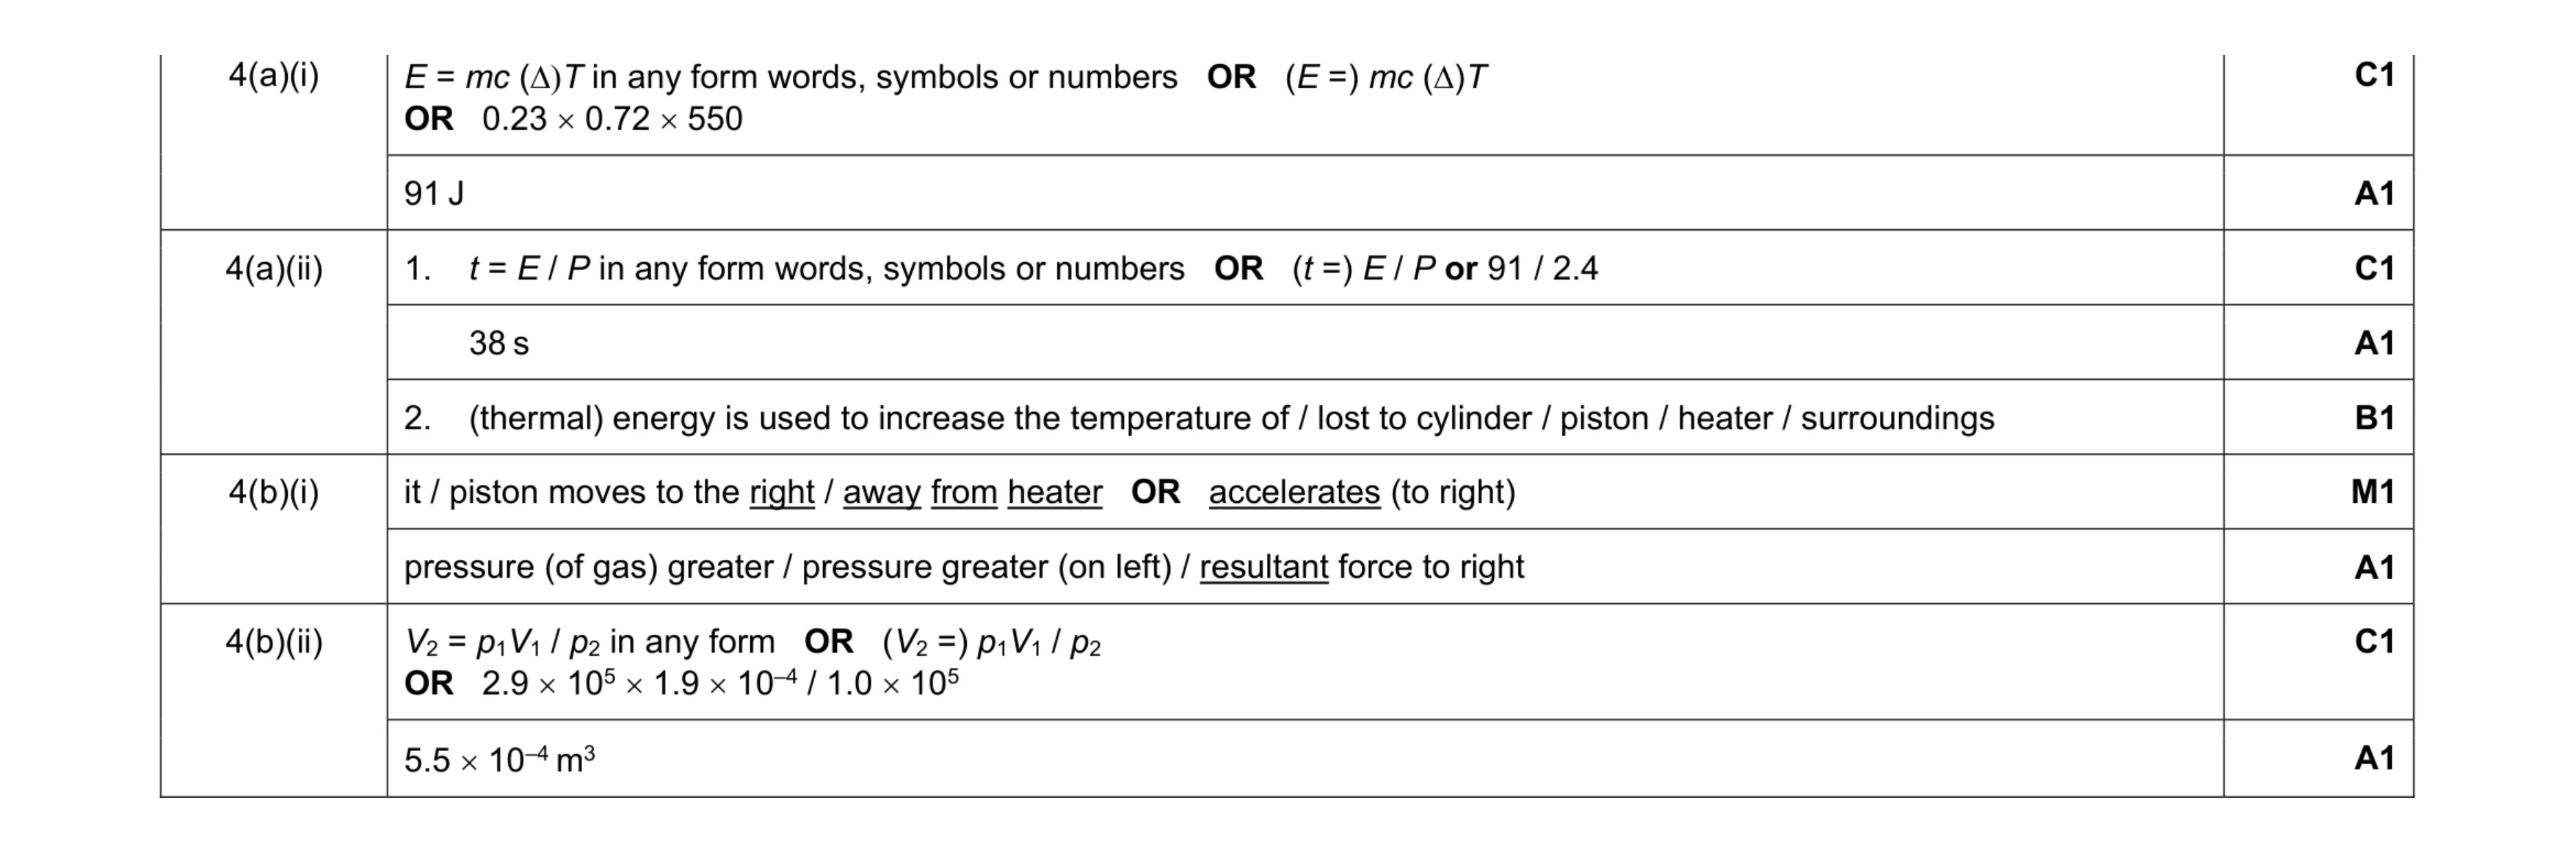 9
9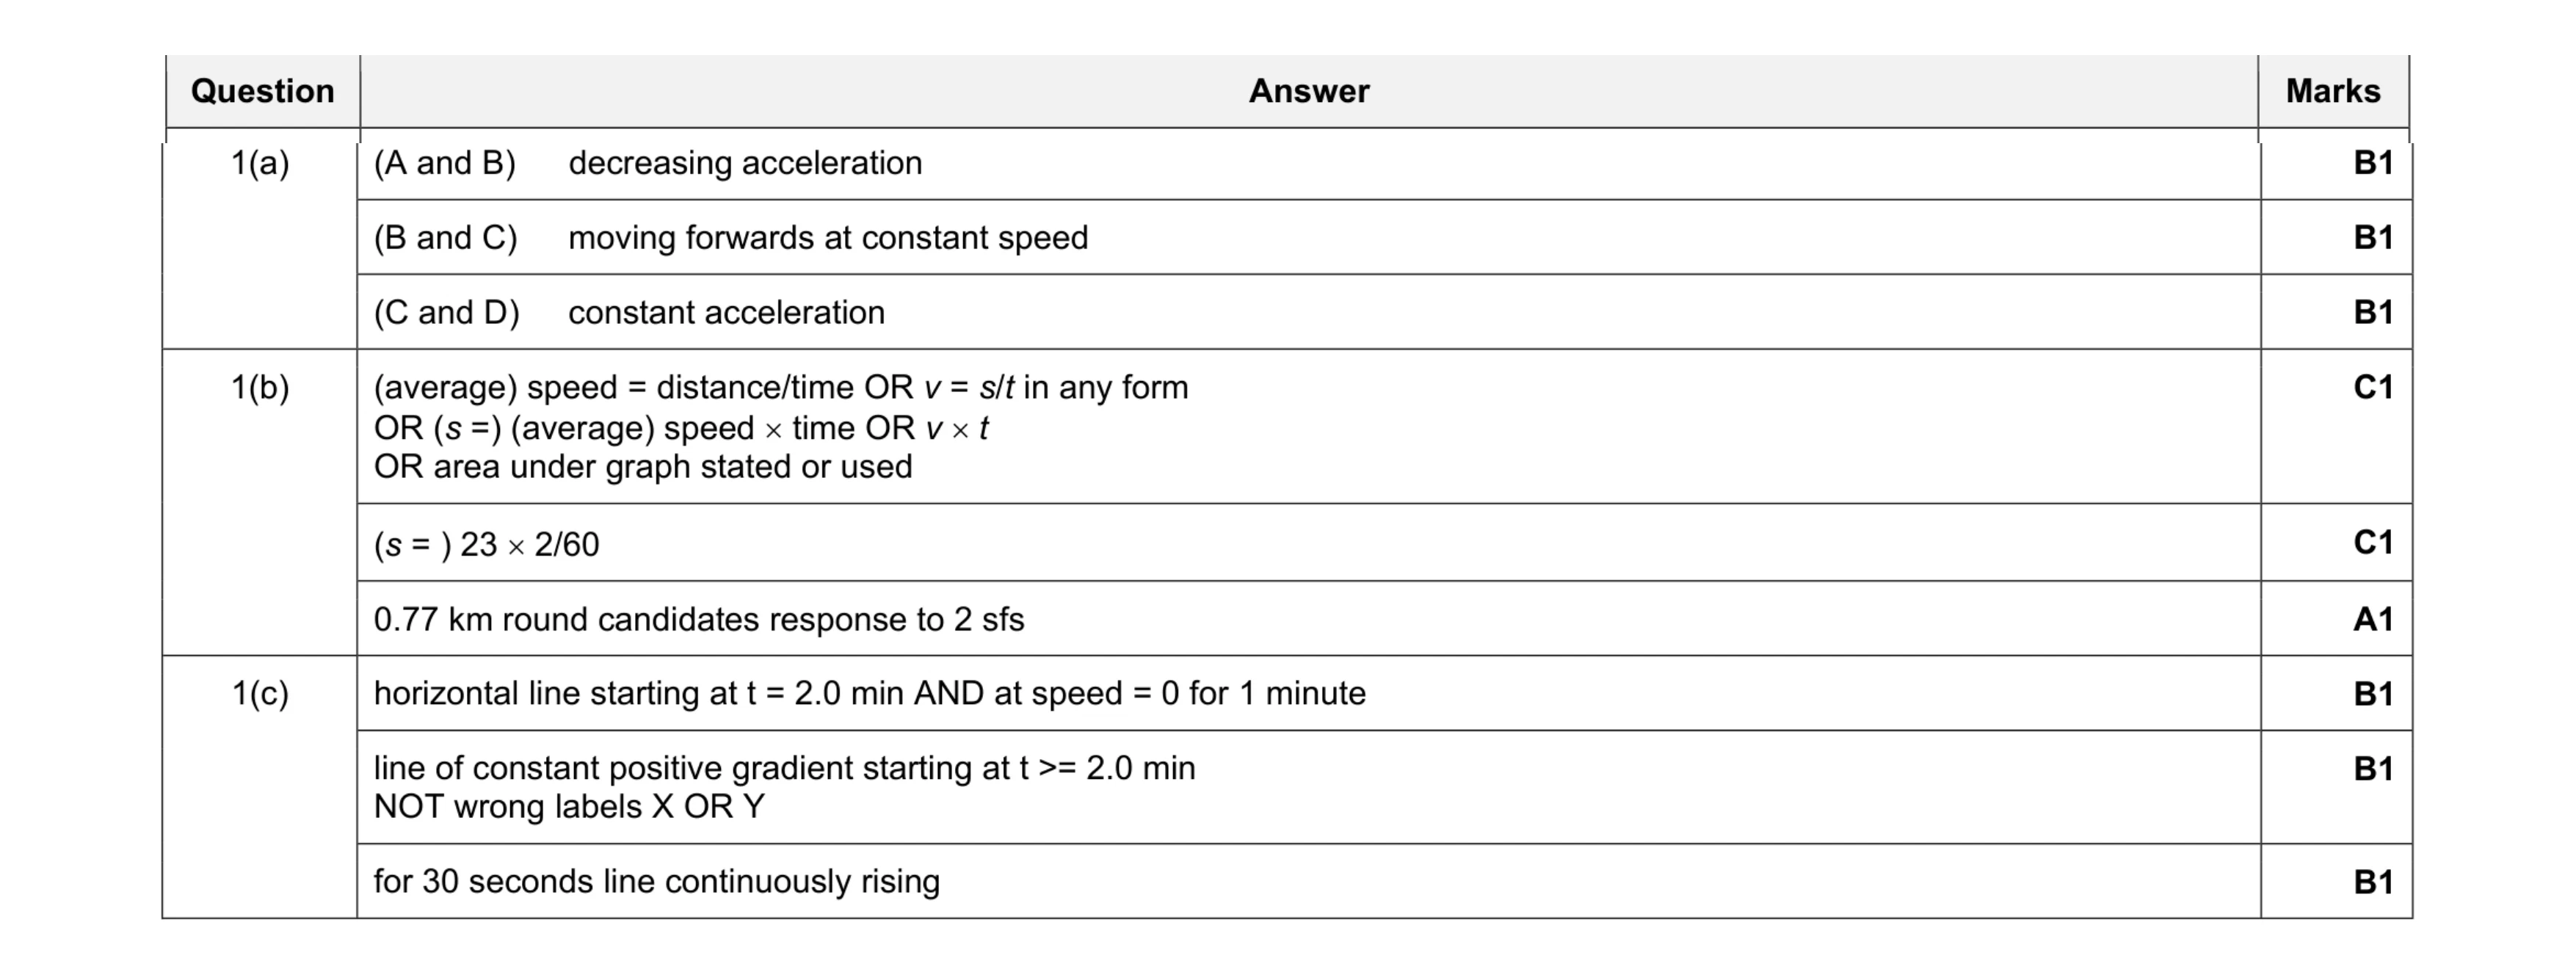 9
9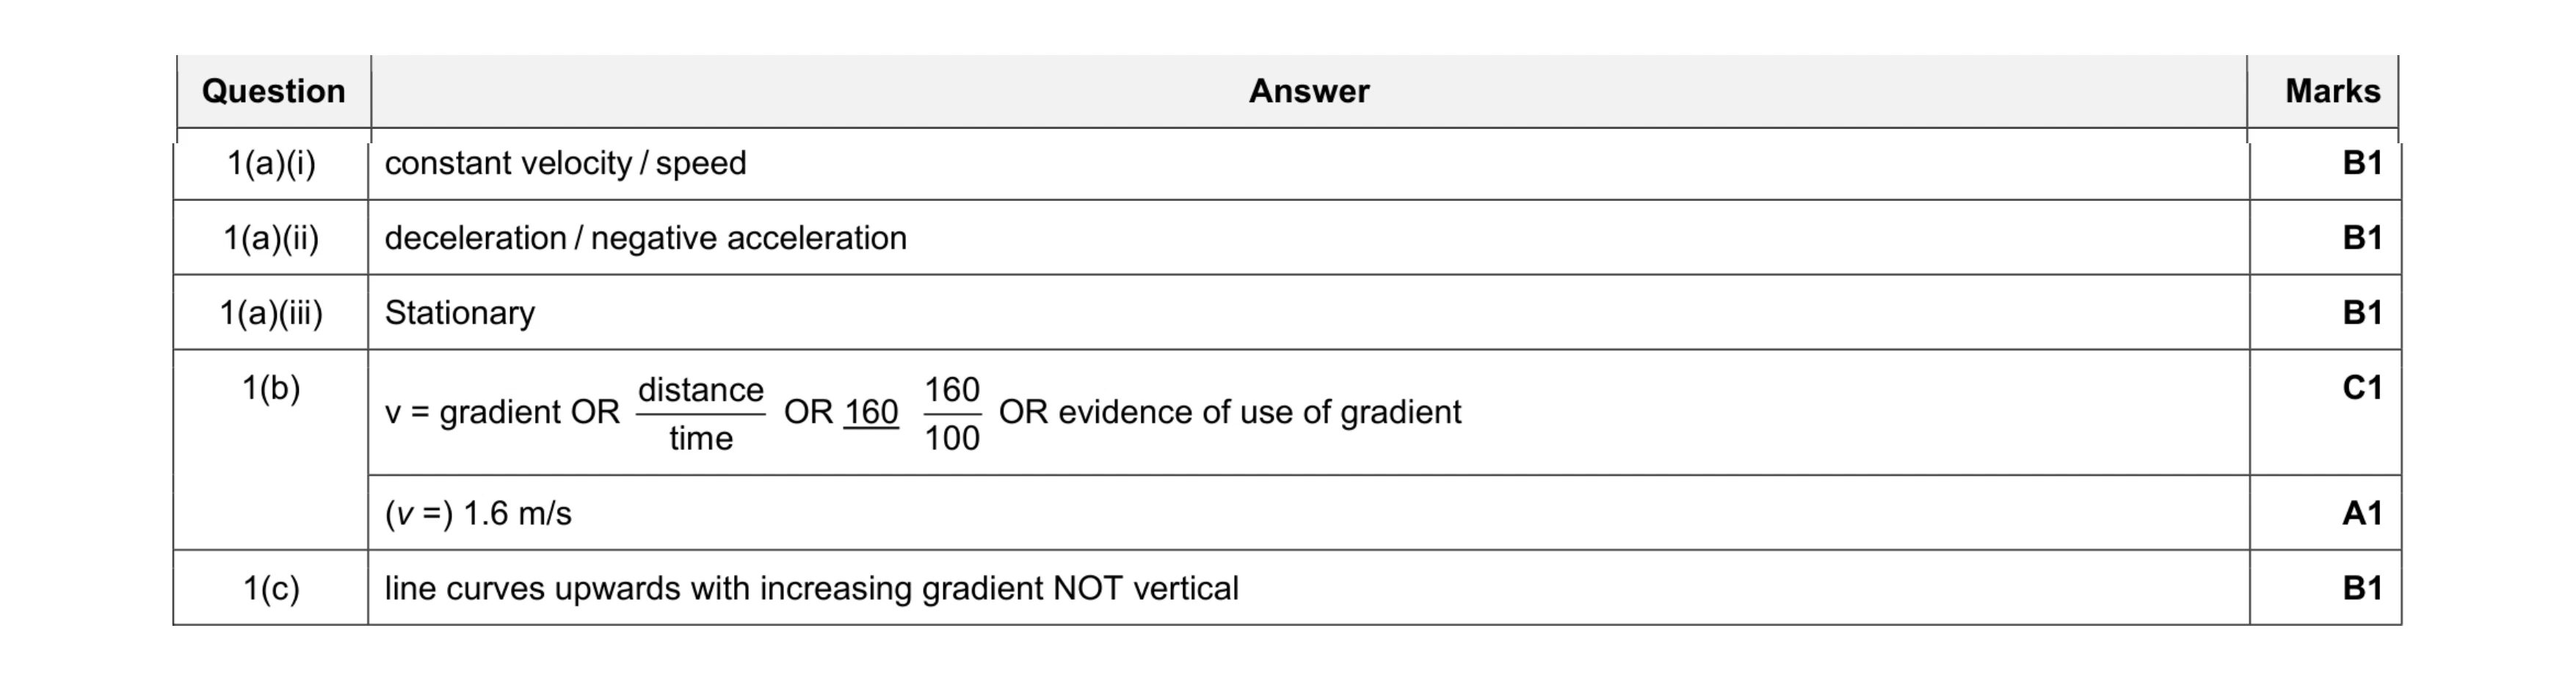 6
6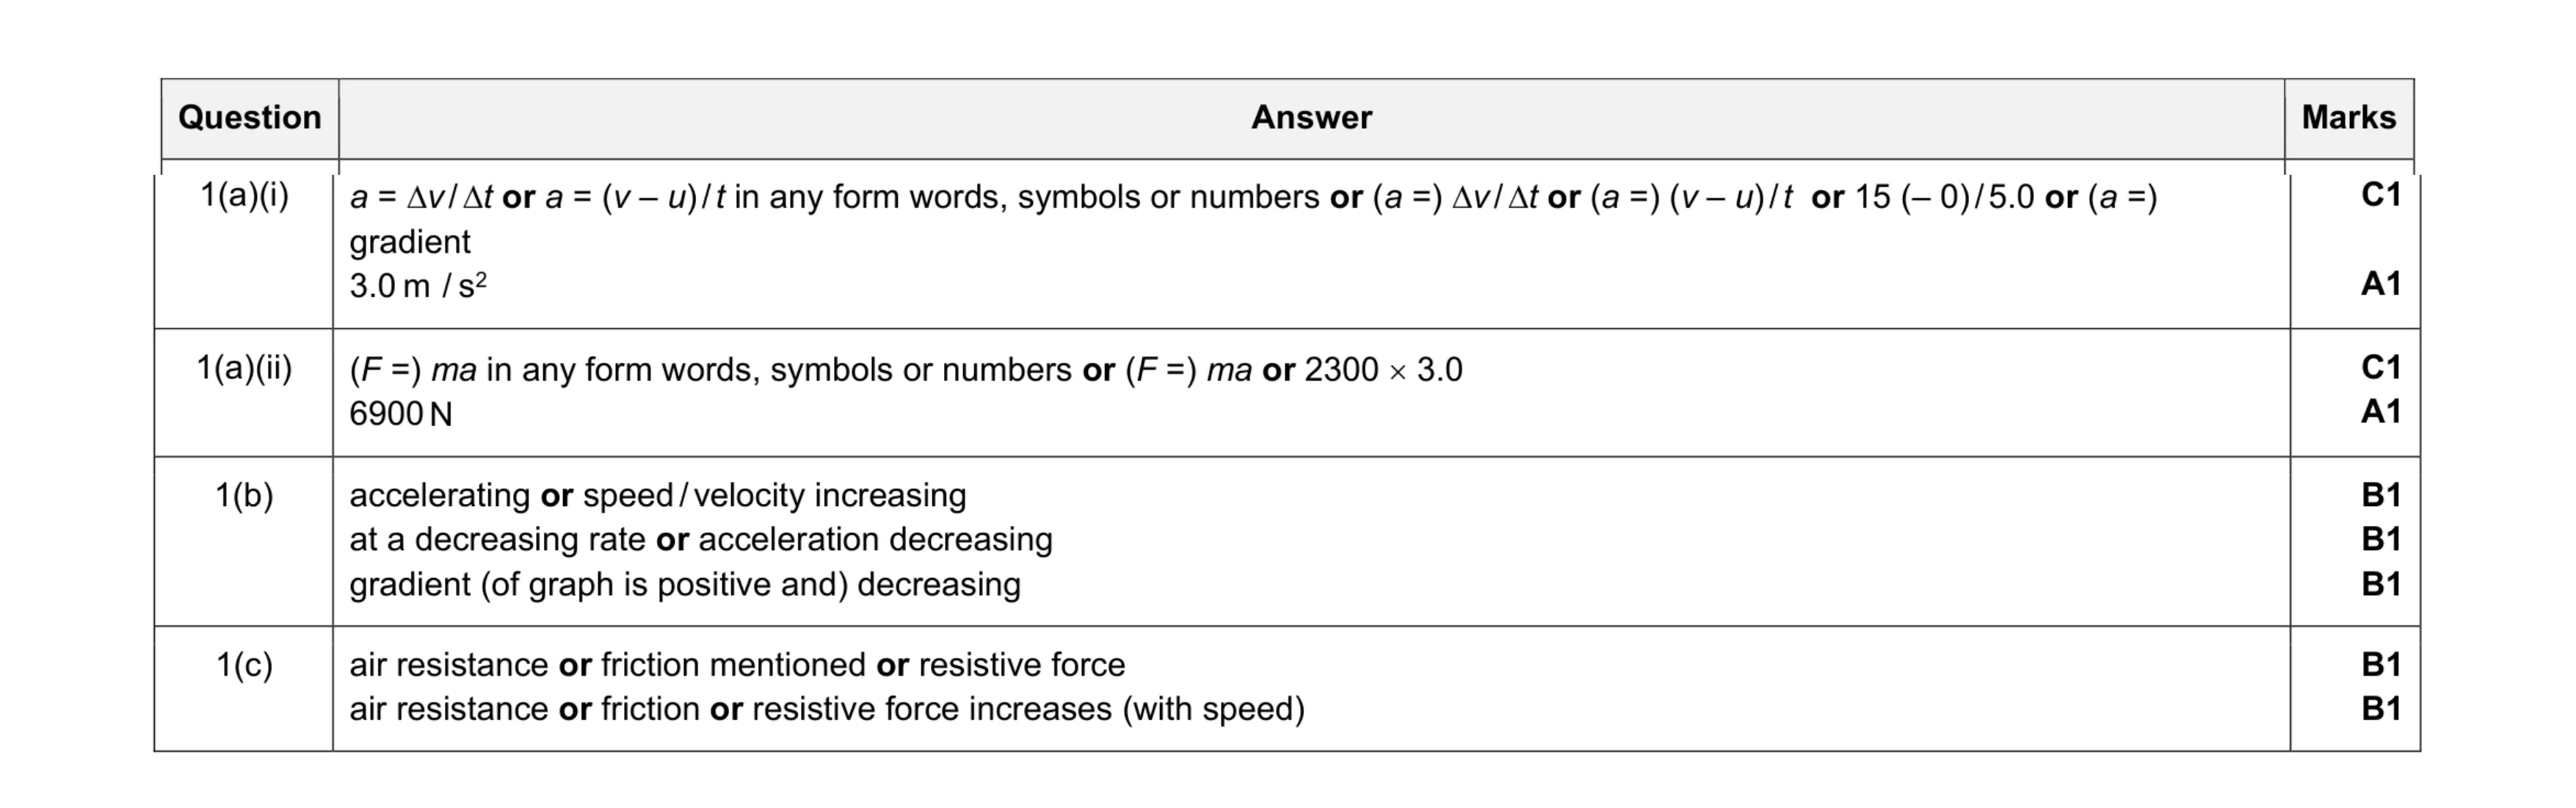 9
9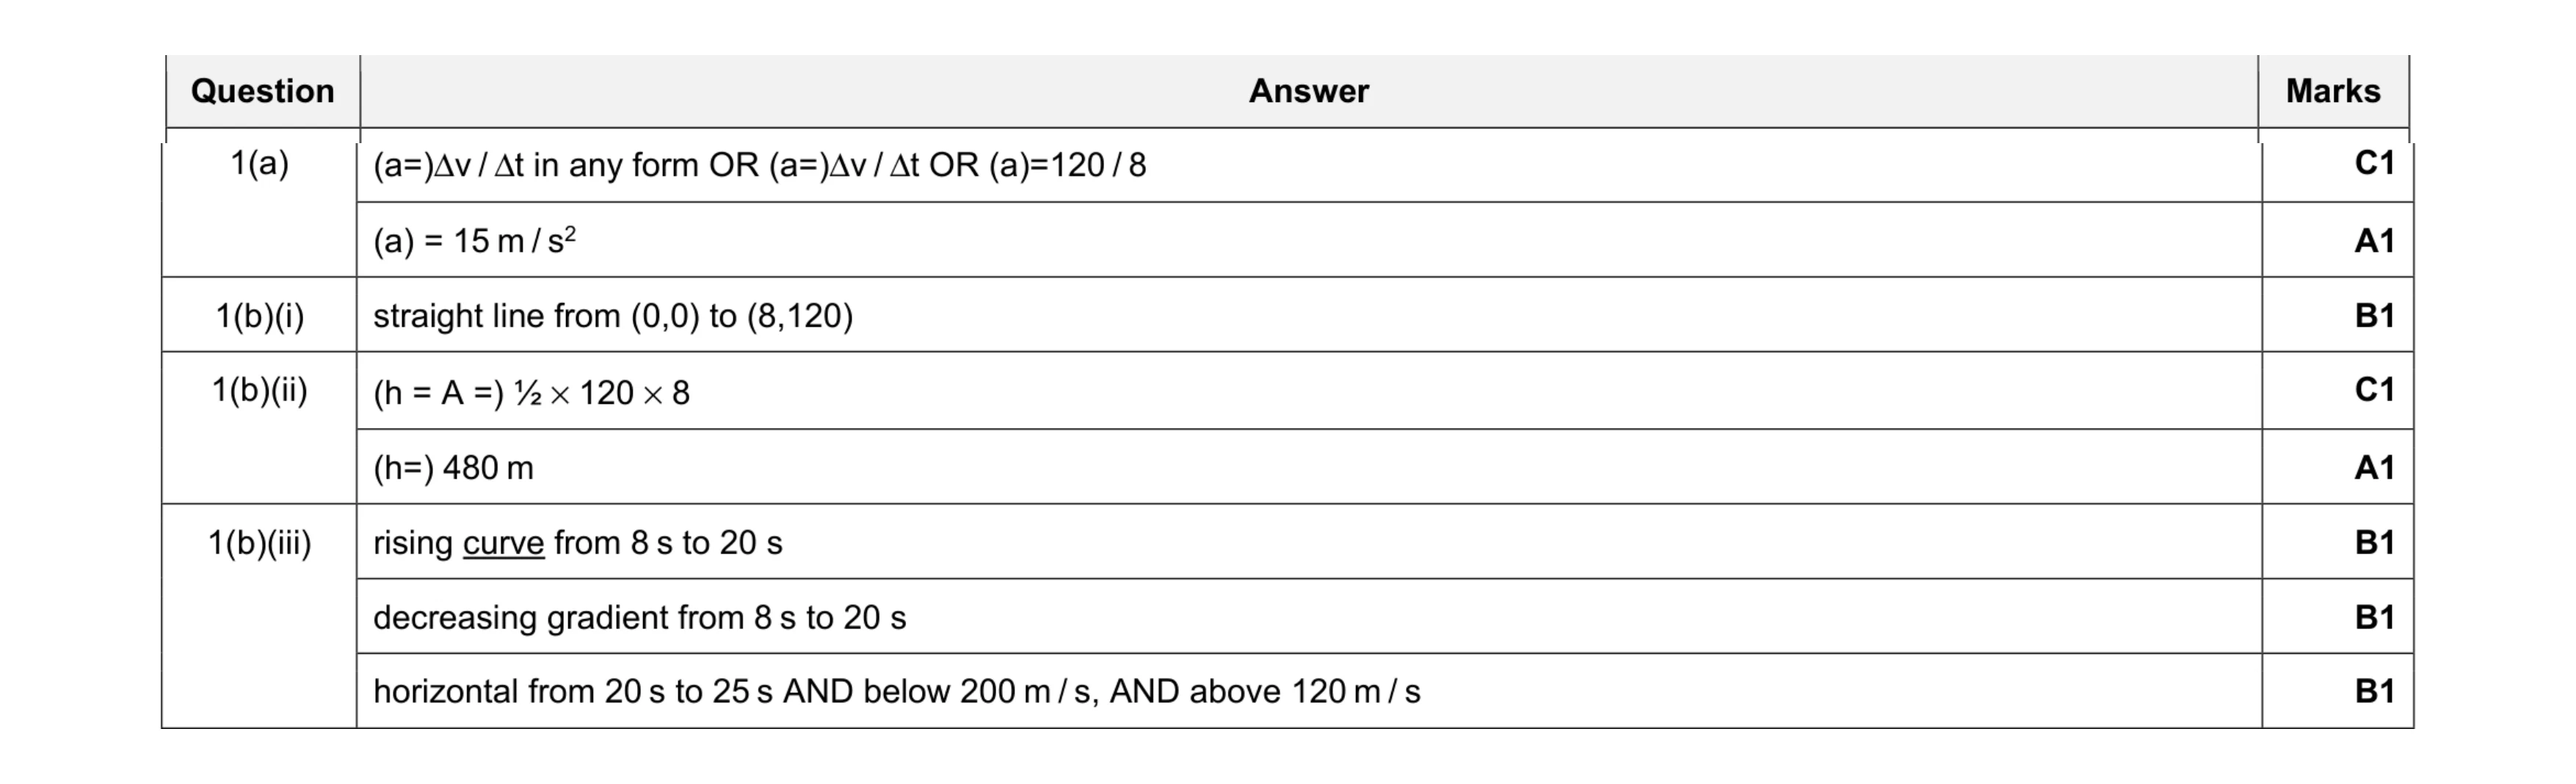 8
8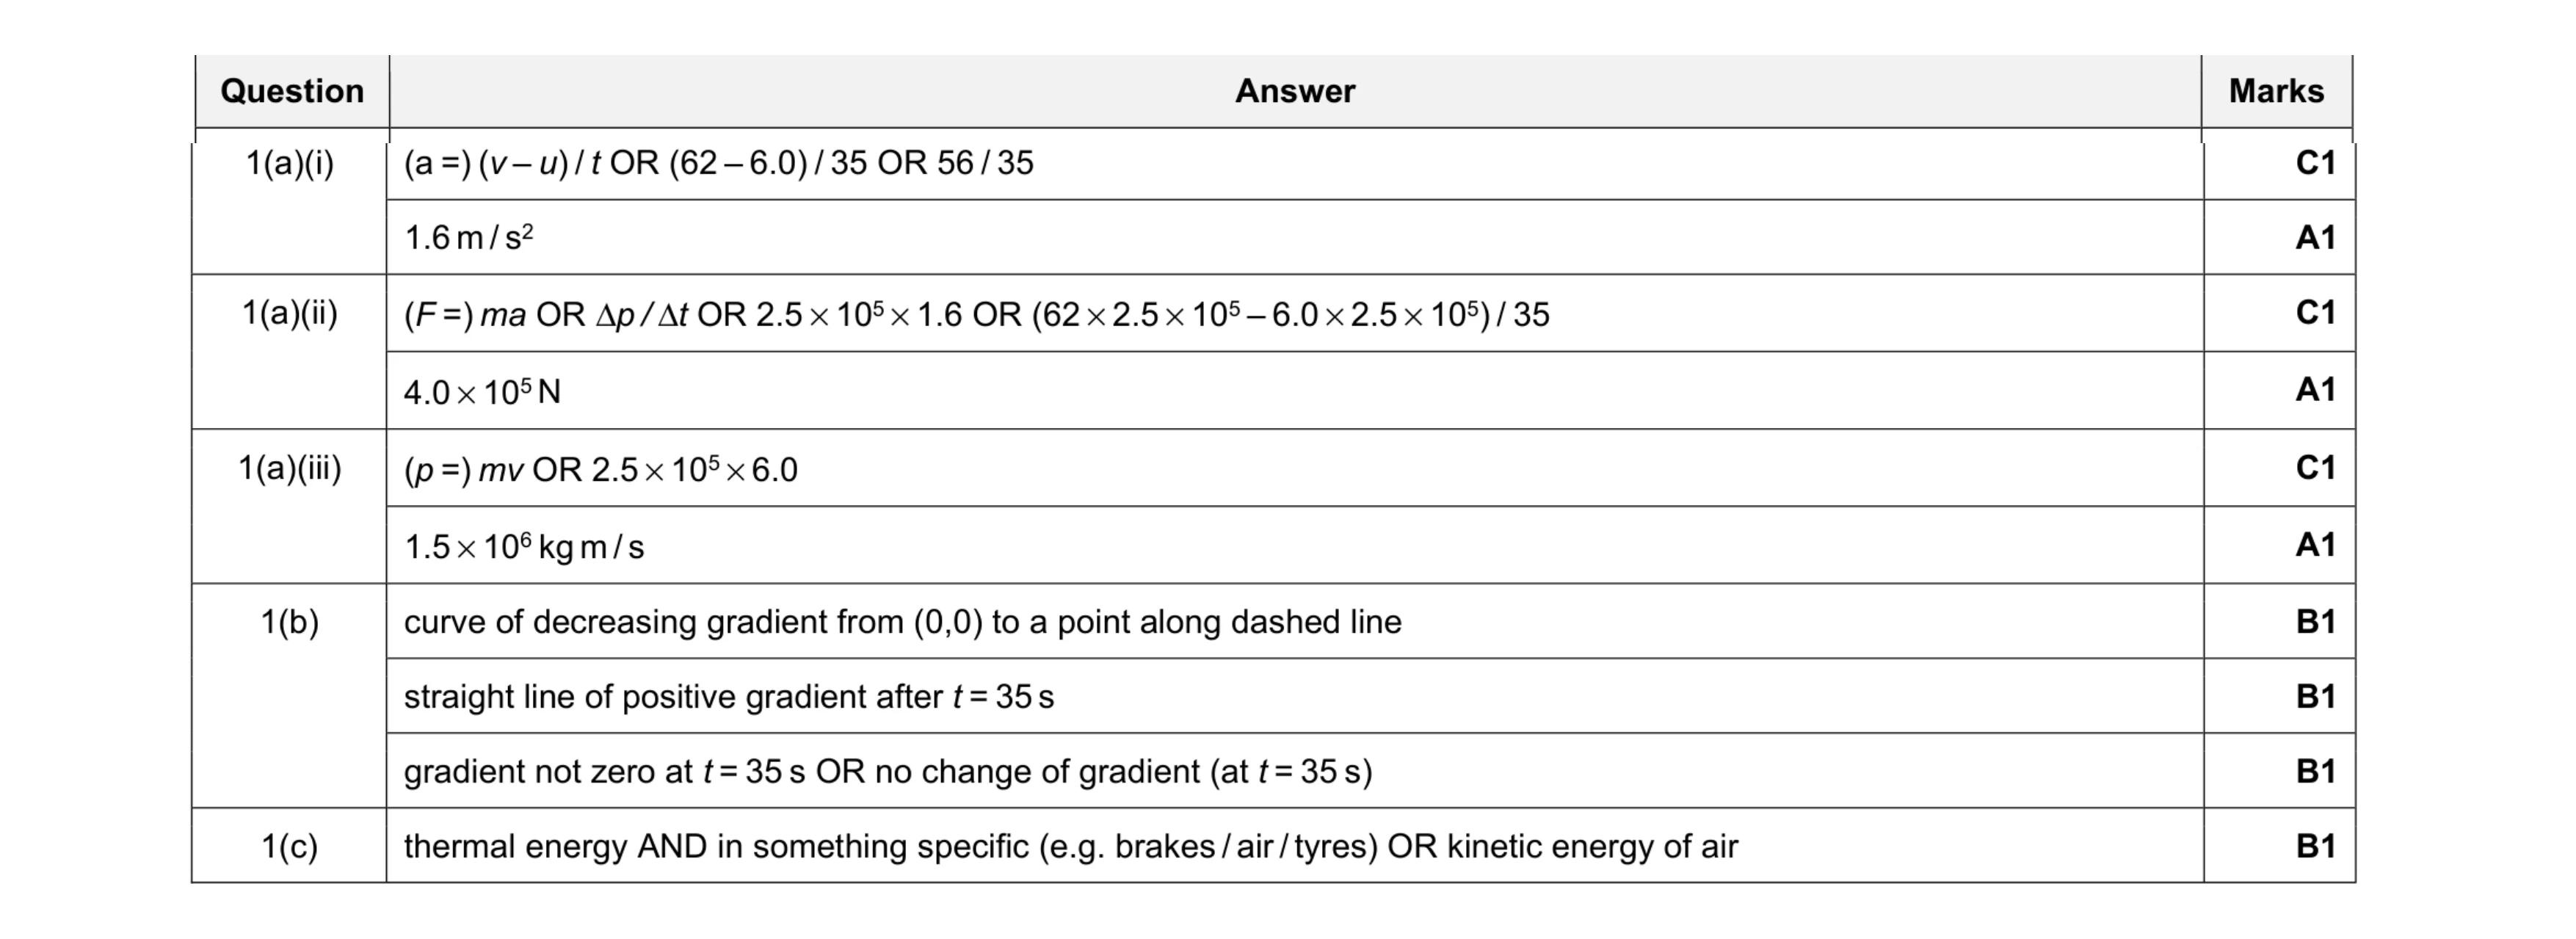 10
10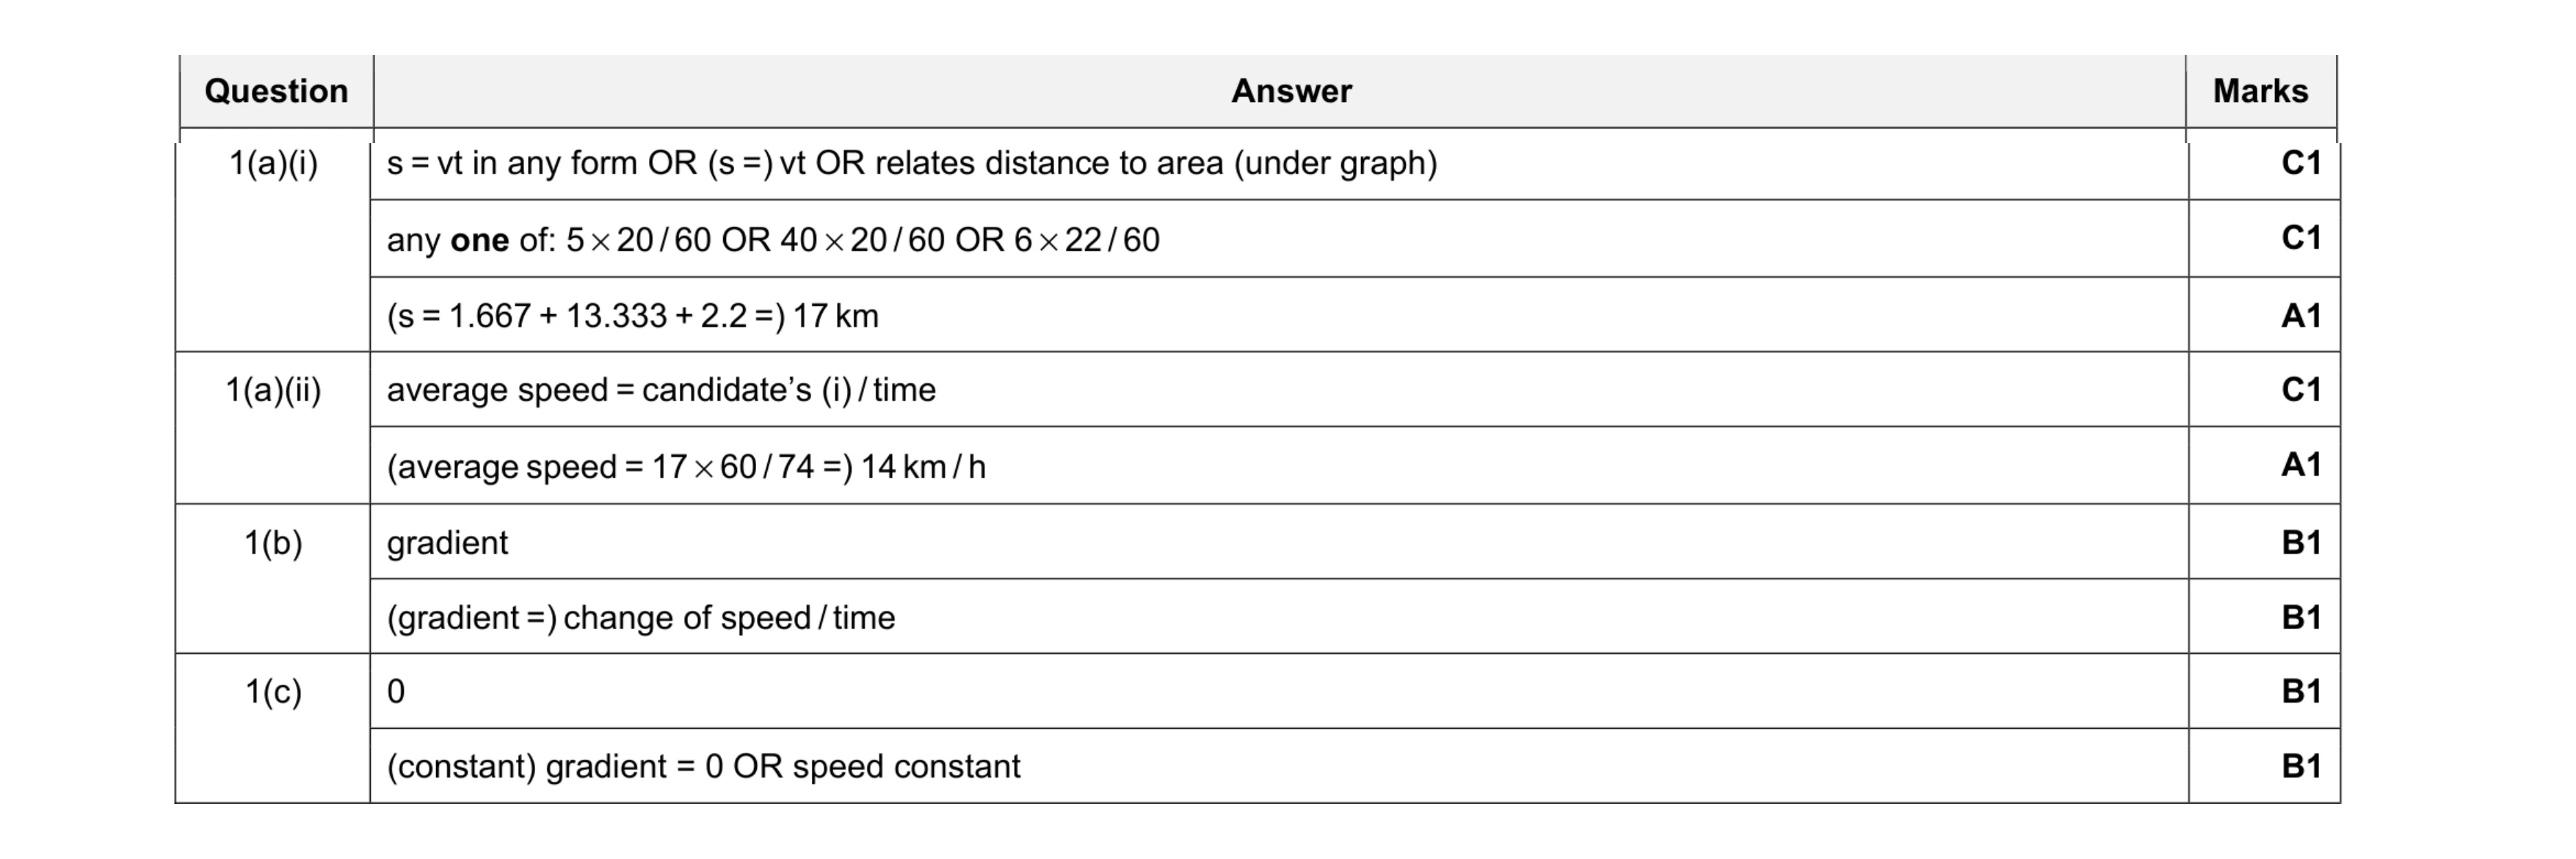 9
9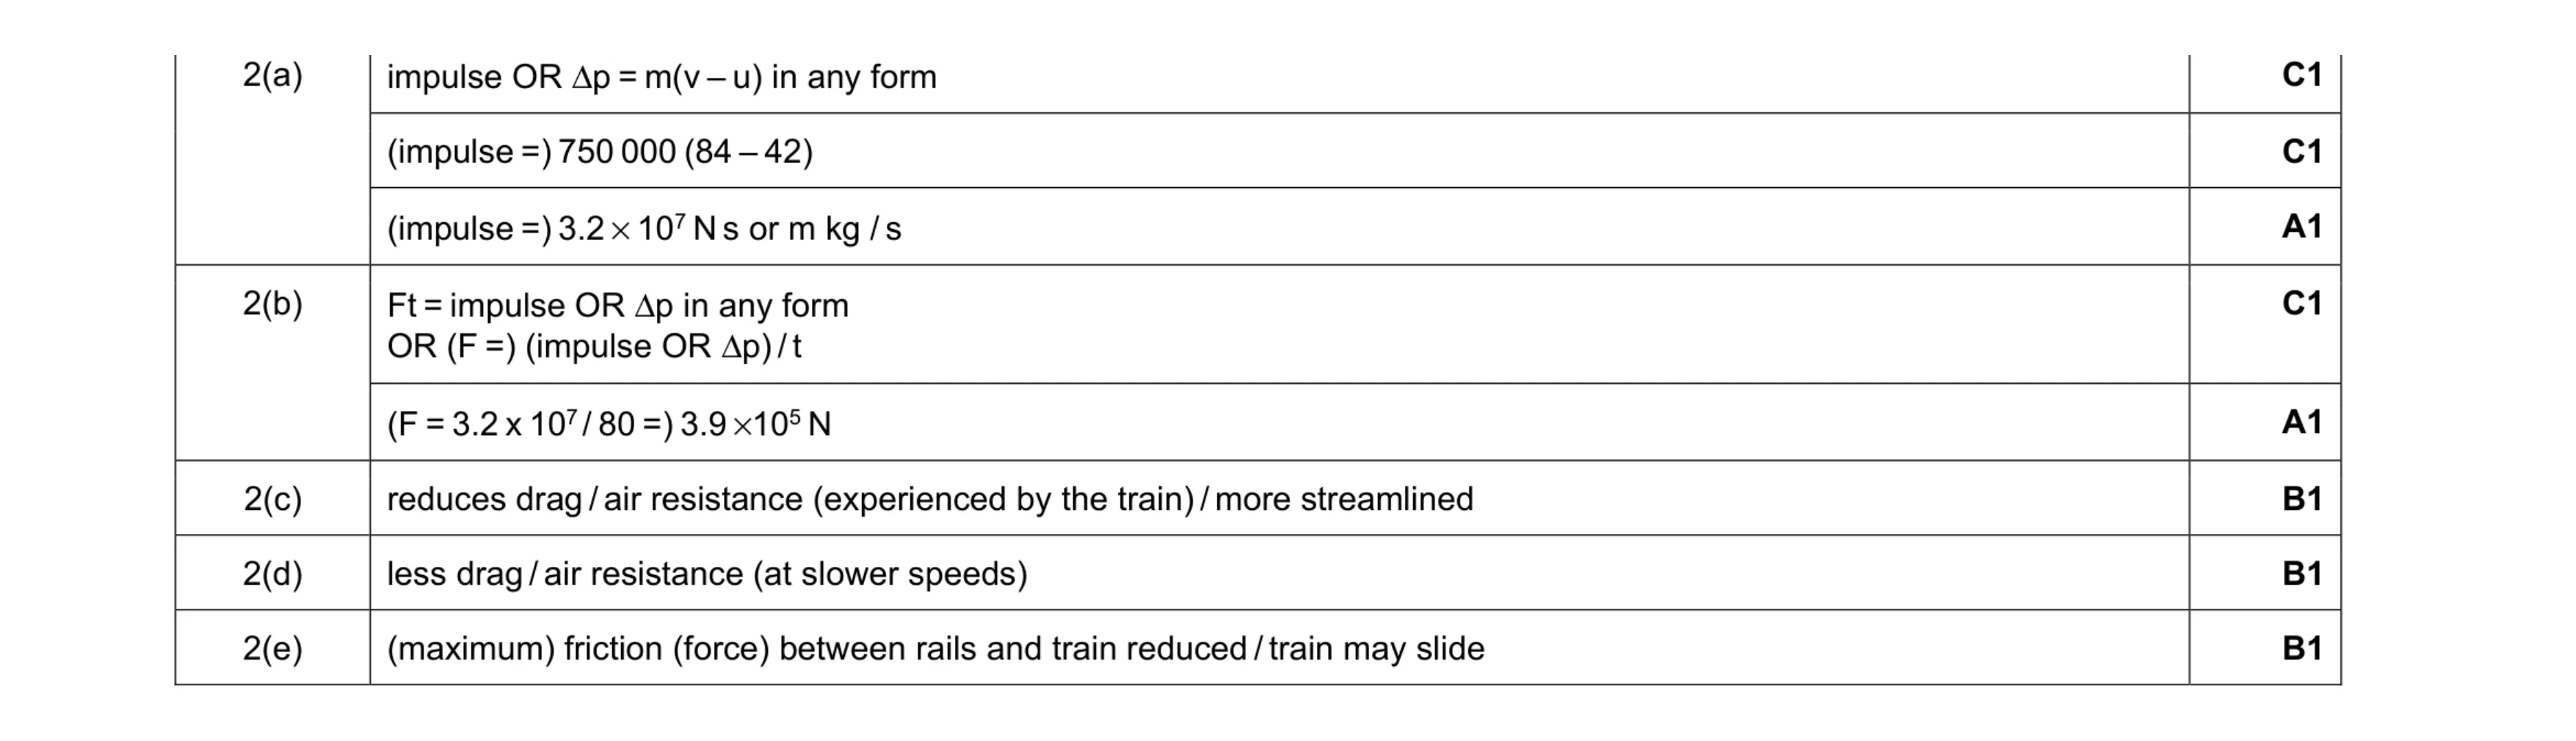 8
8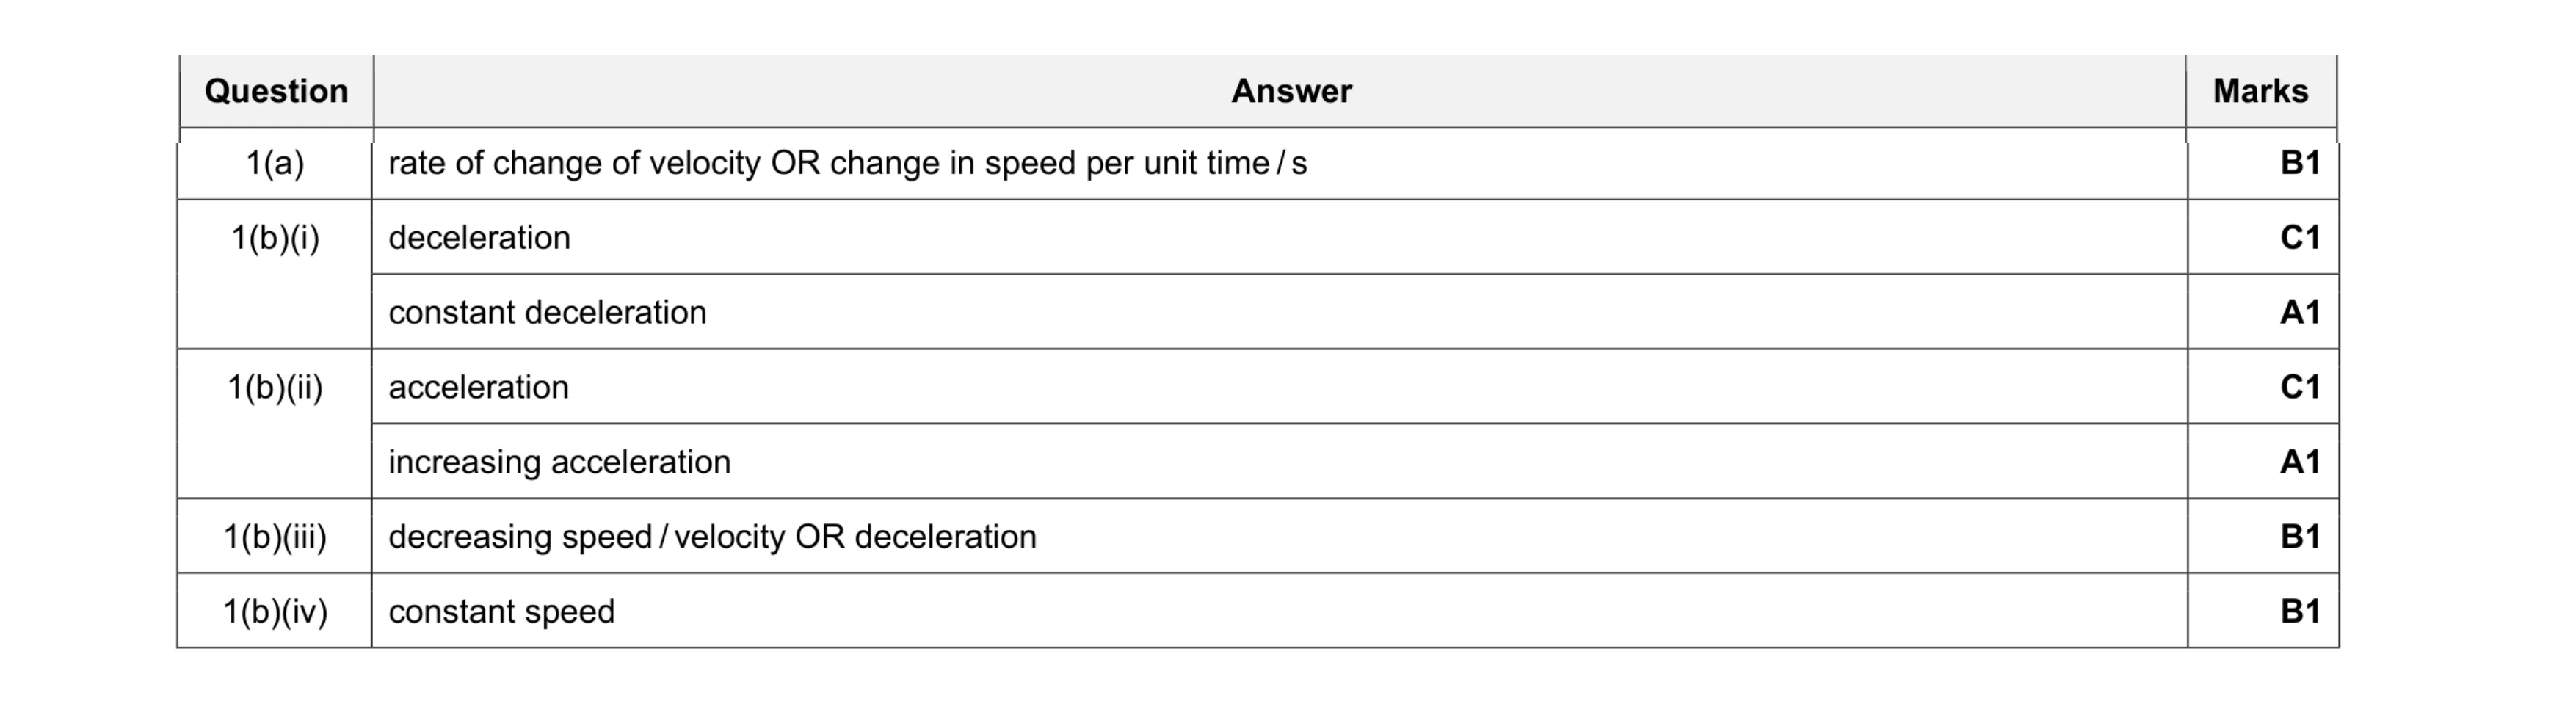 7
7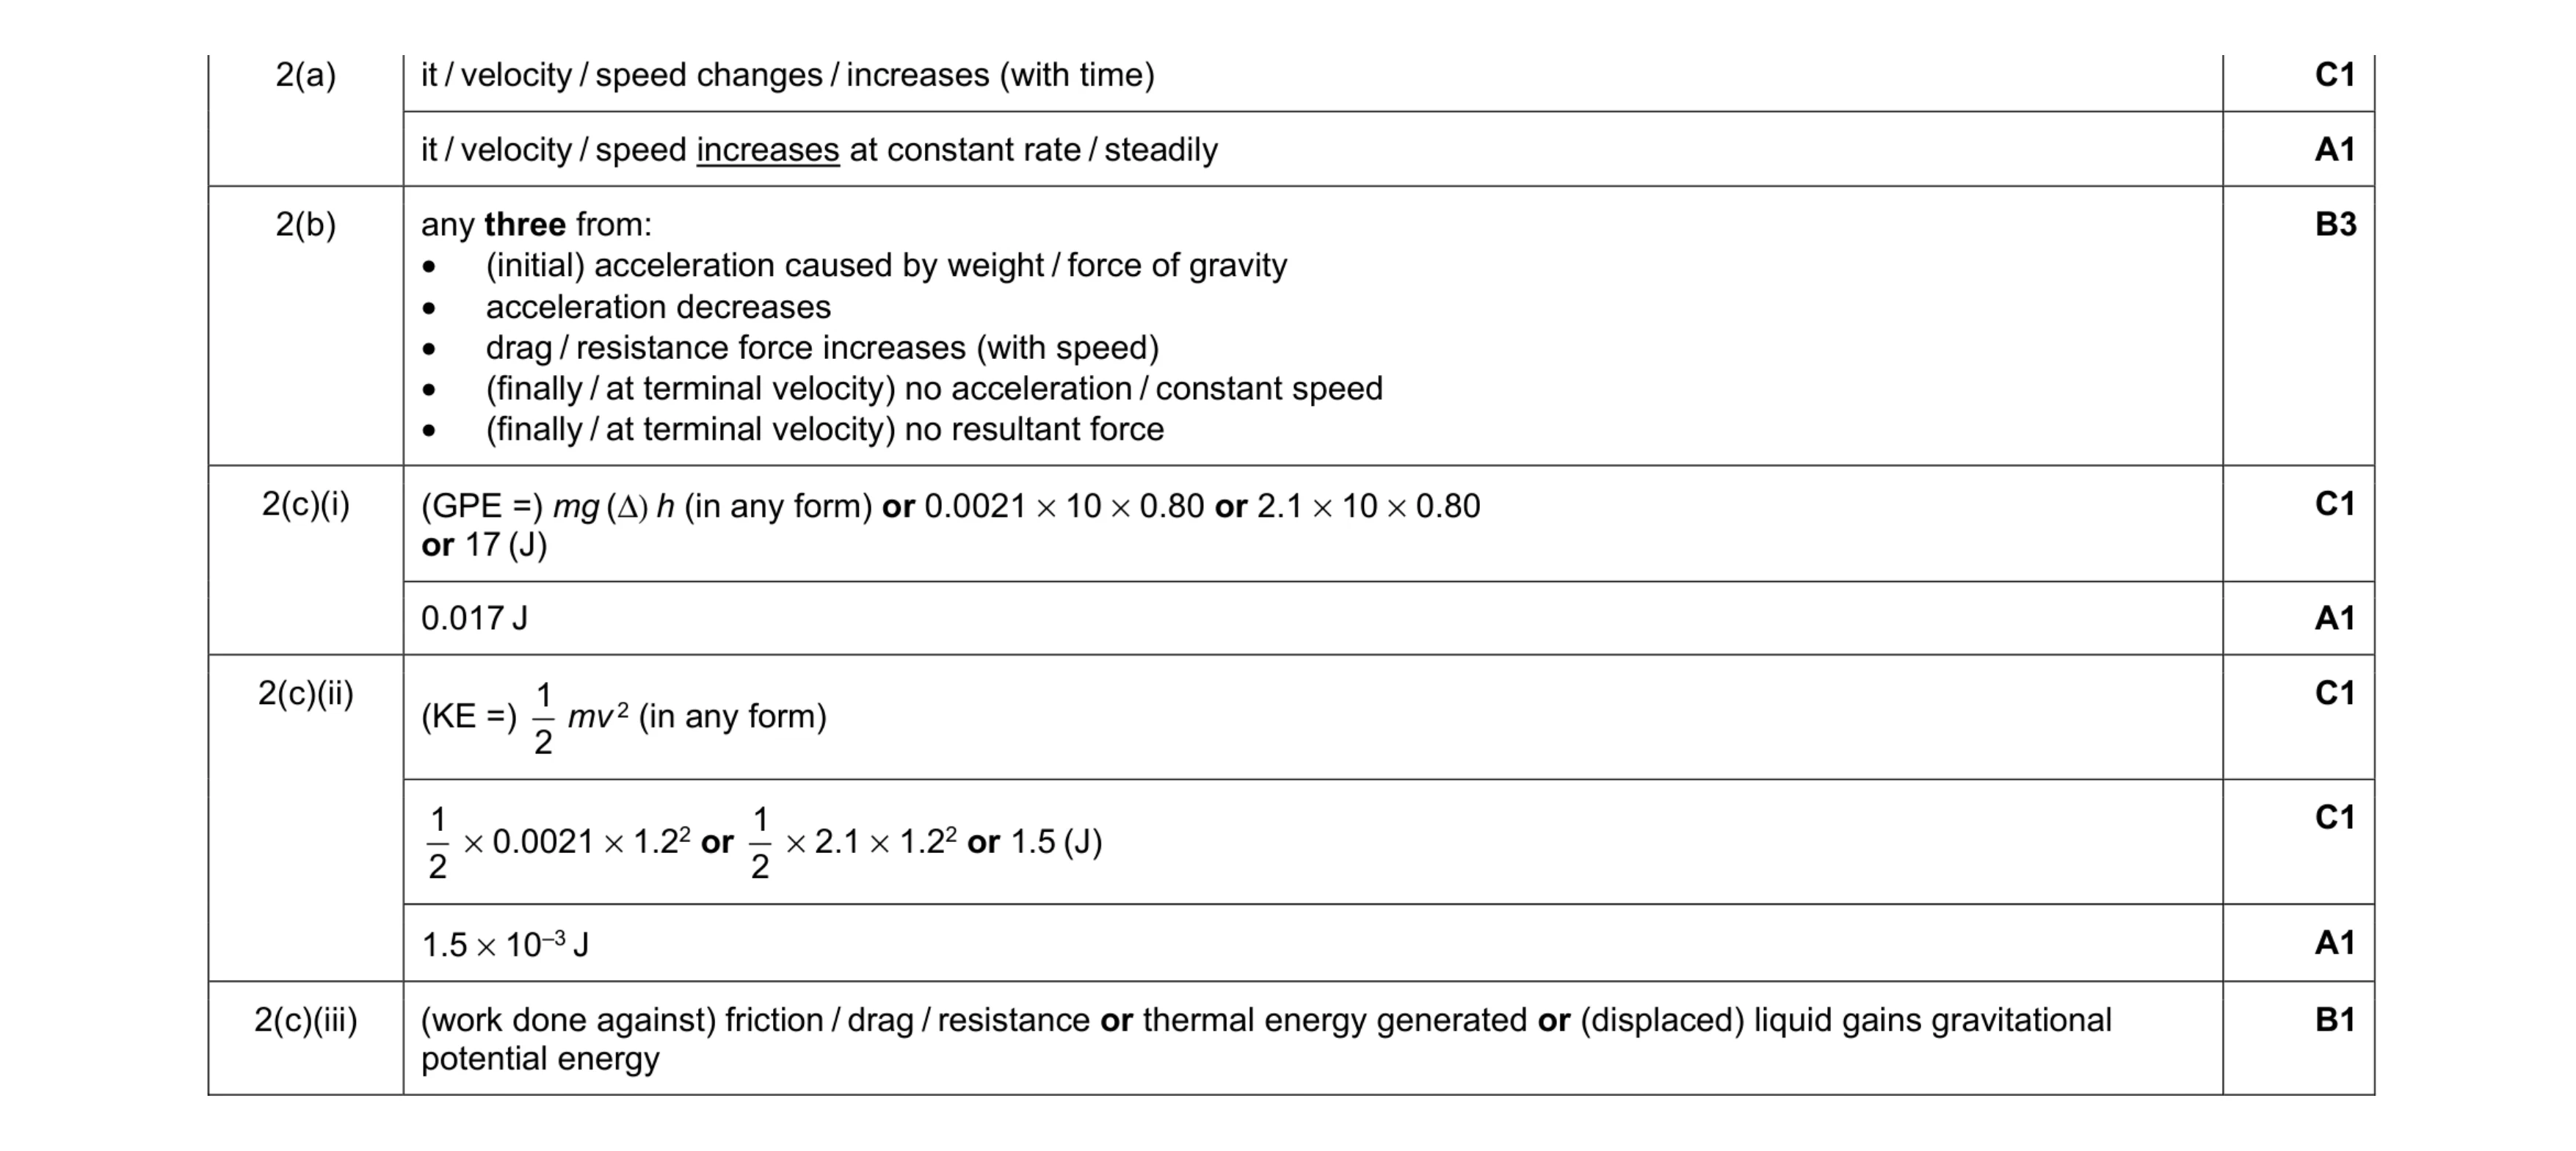 11
11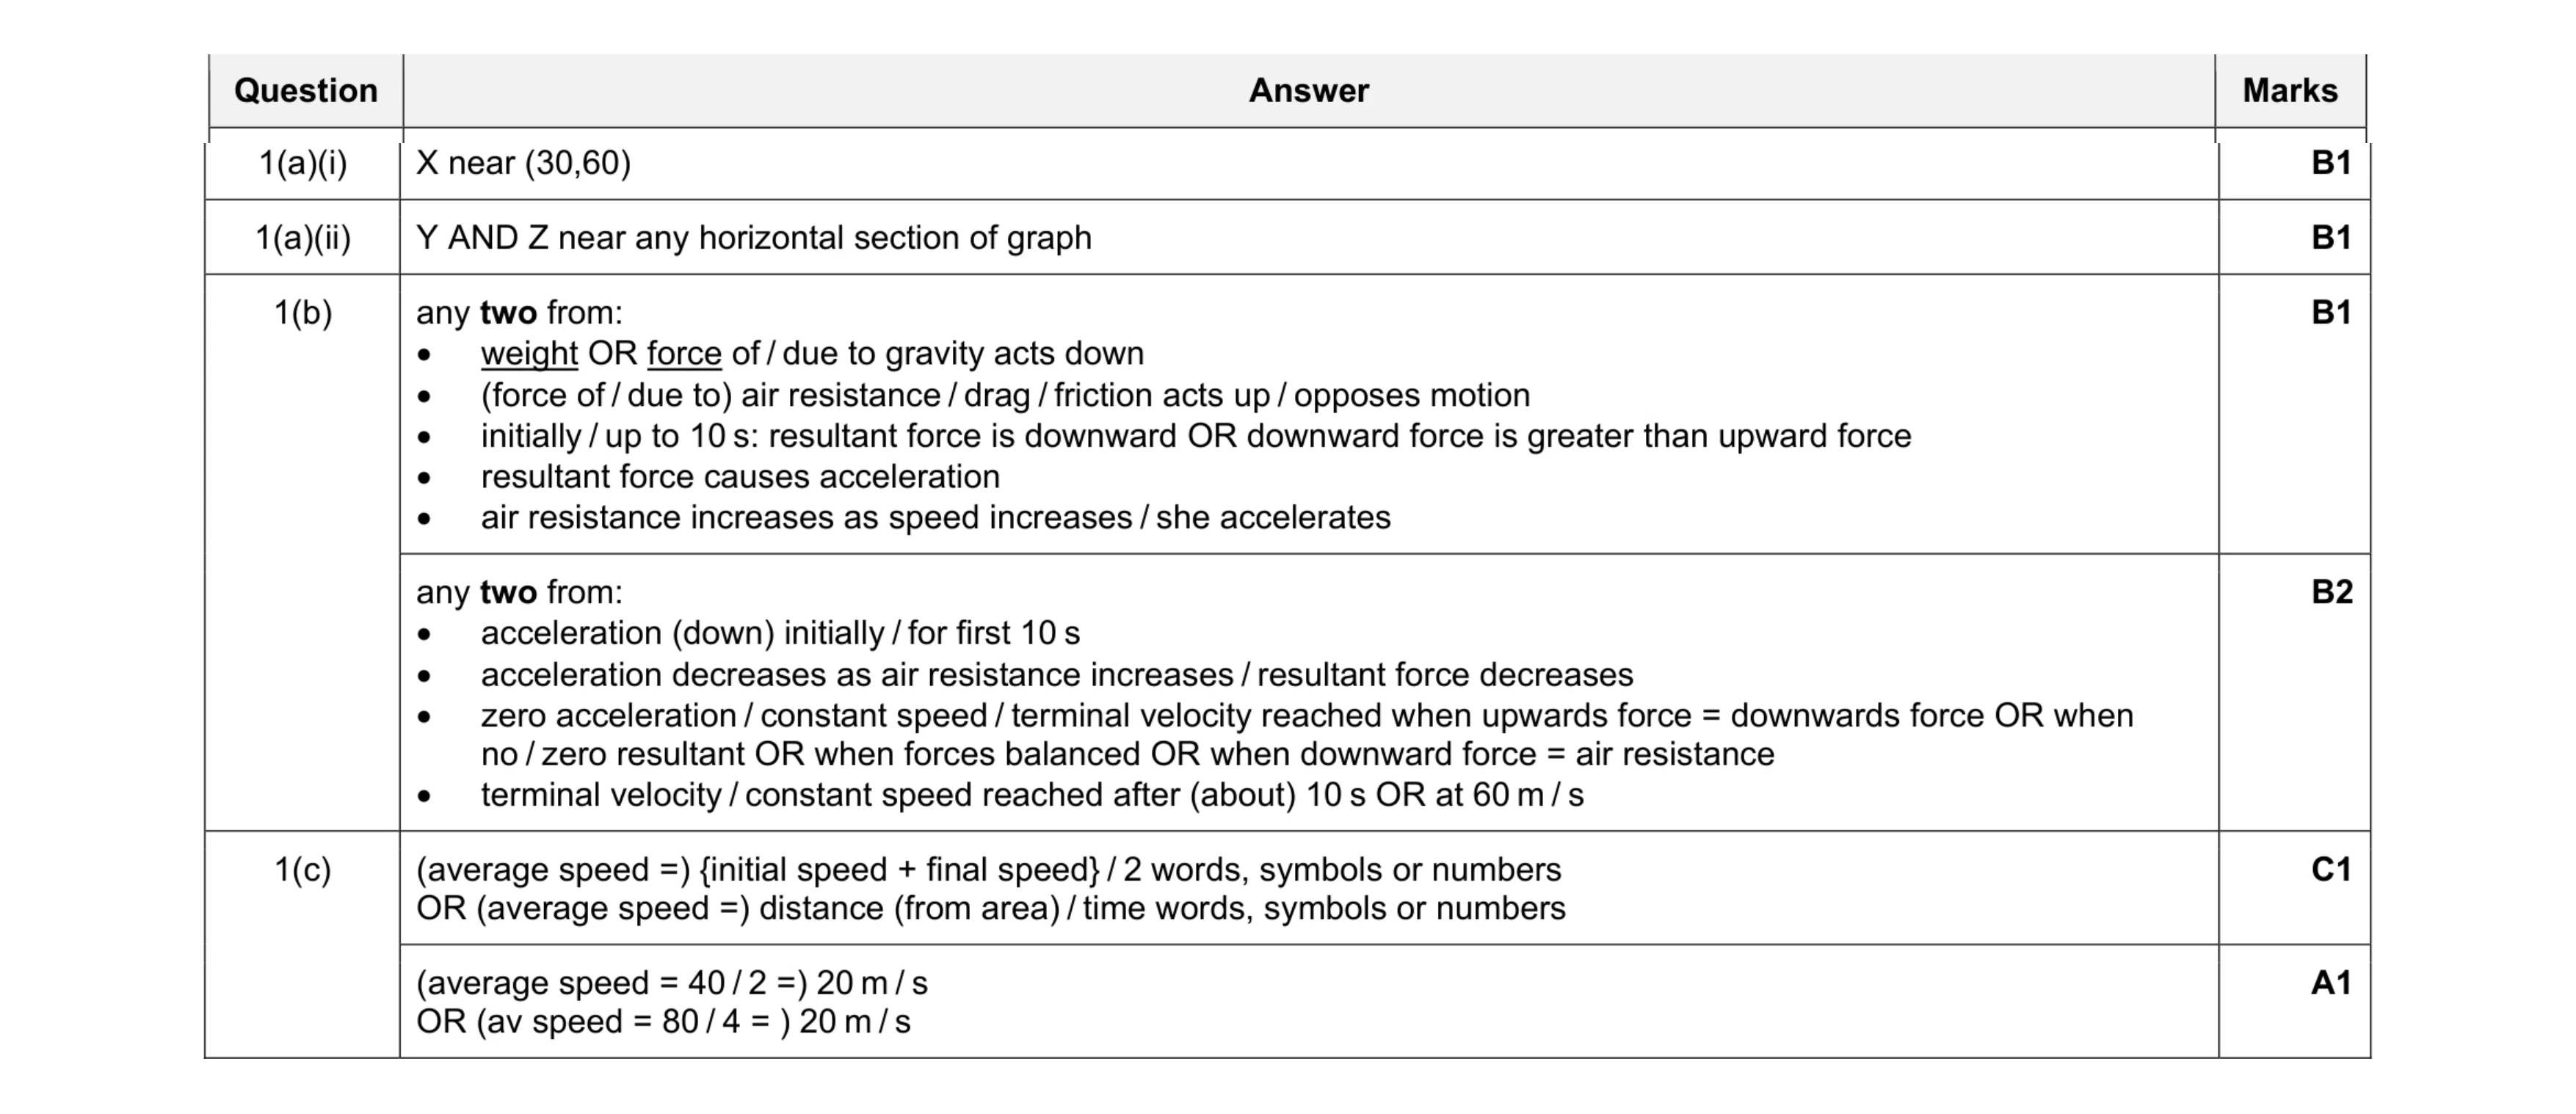 8
8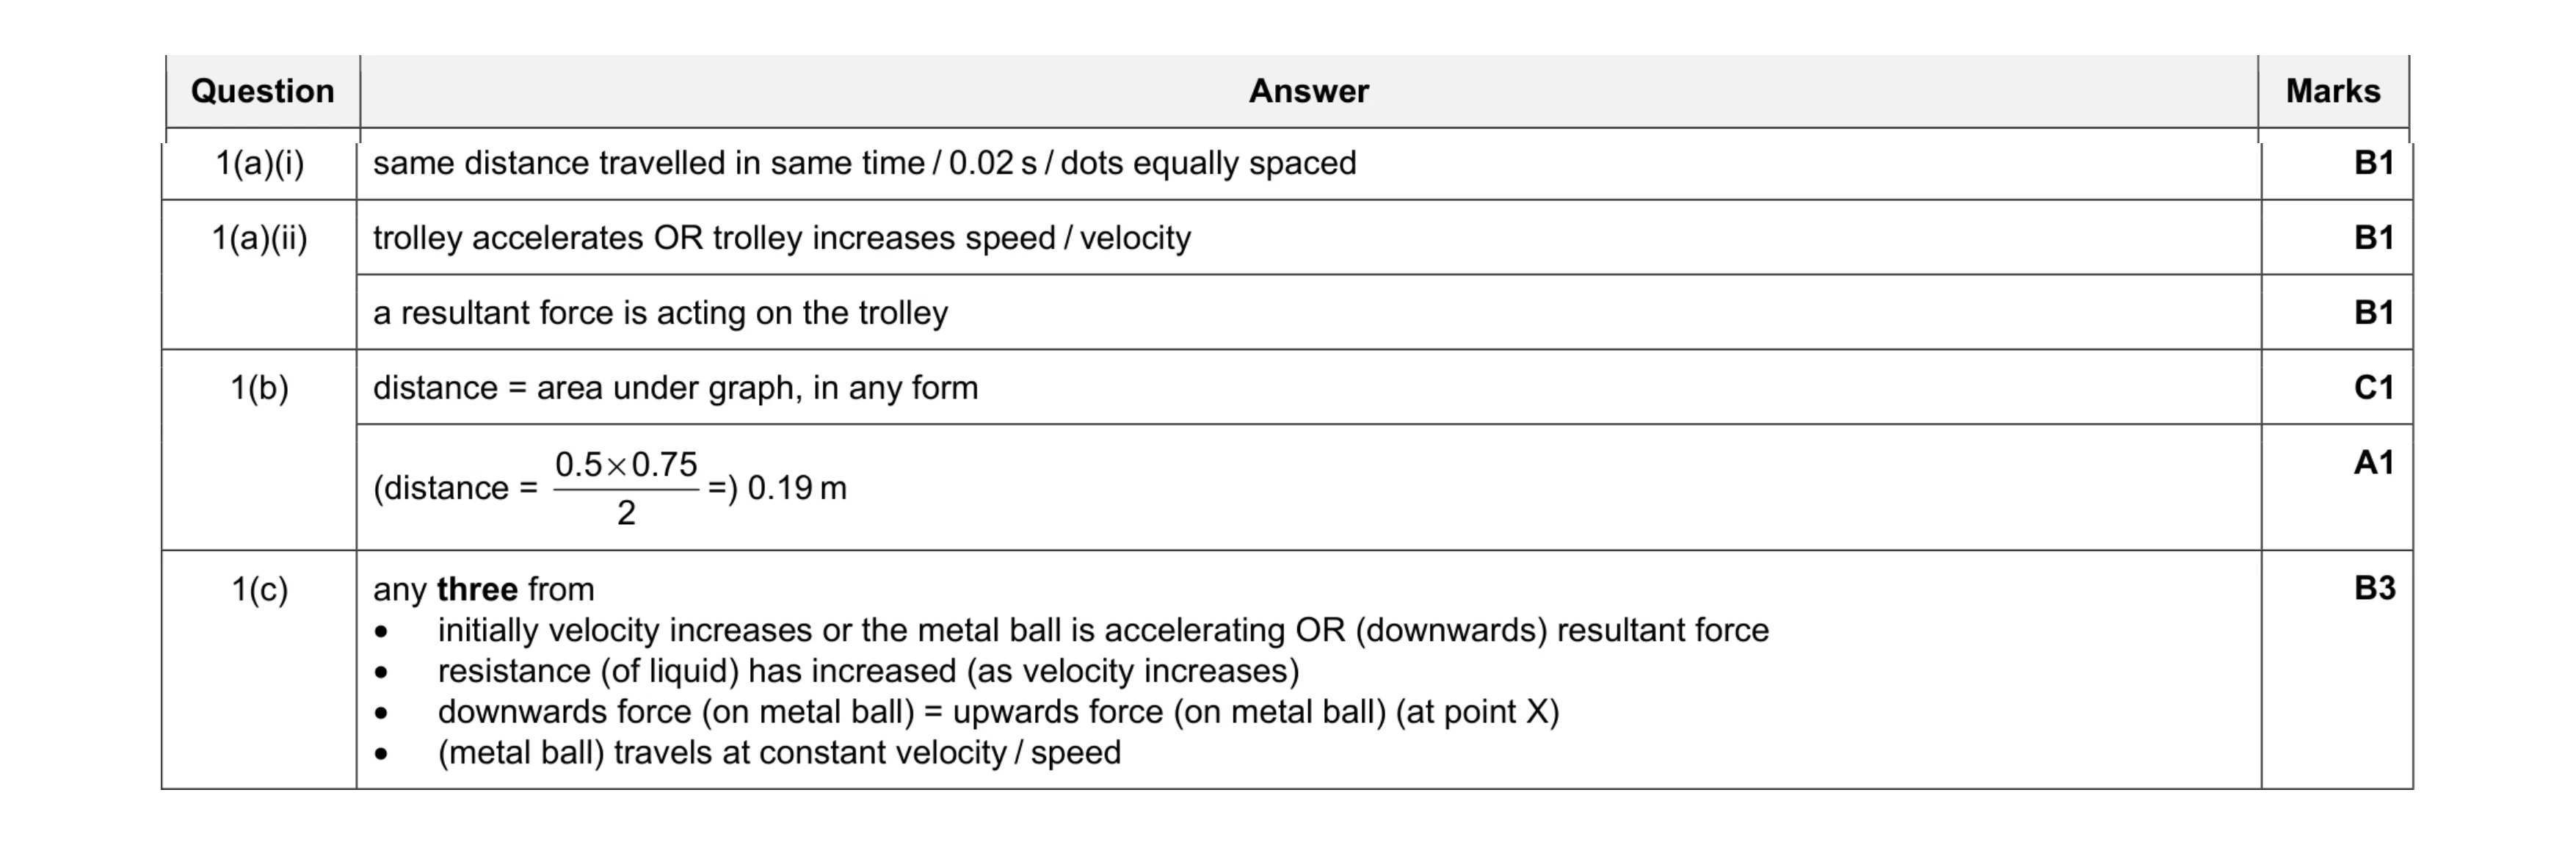 8
8 5
5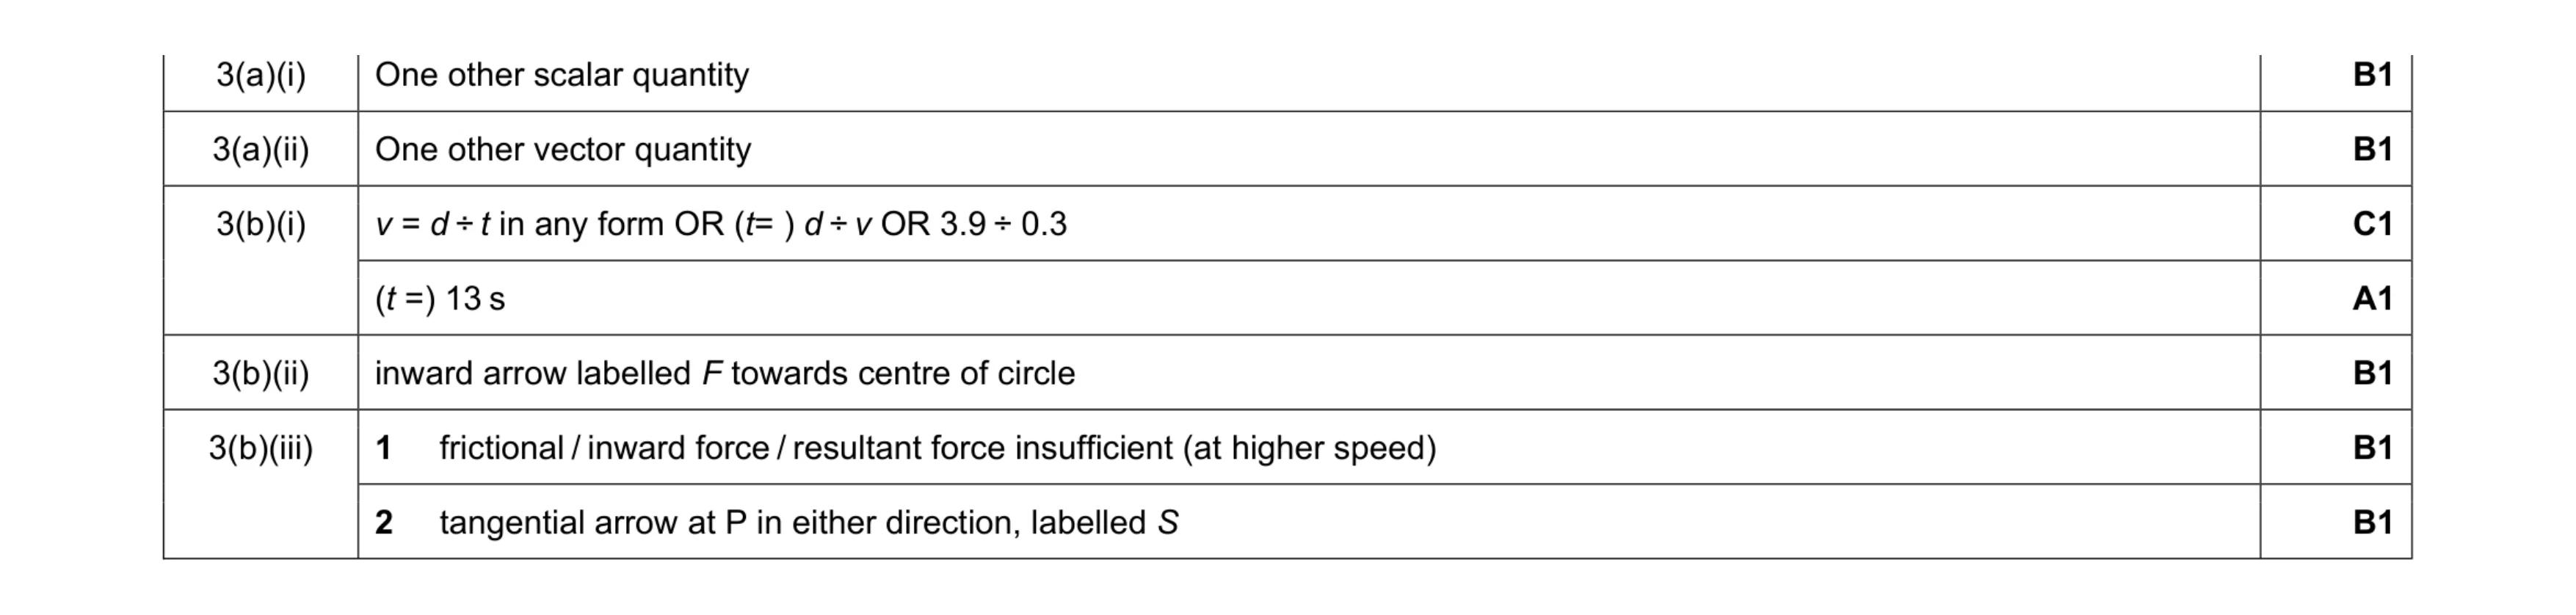 7
7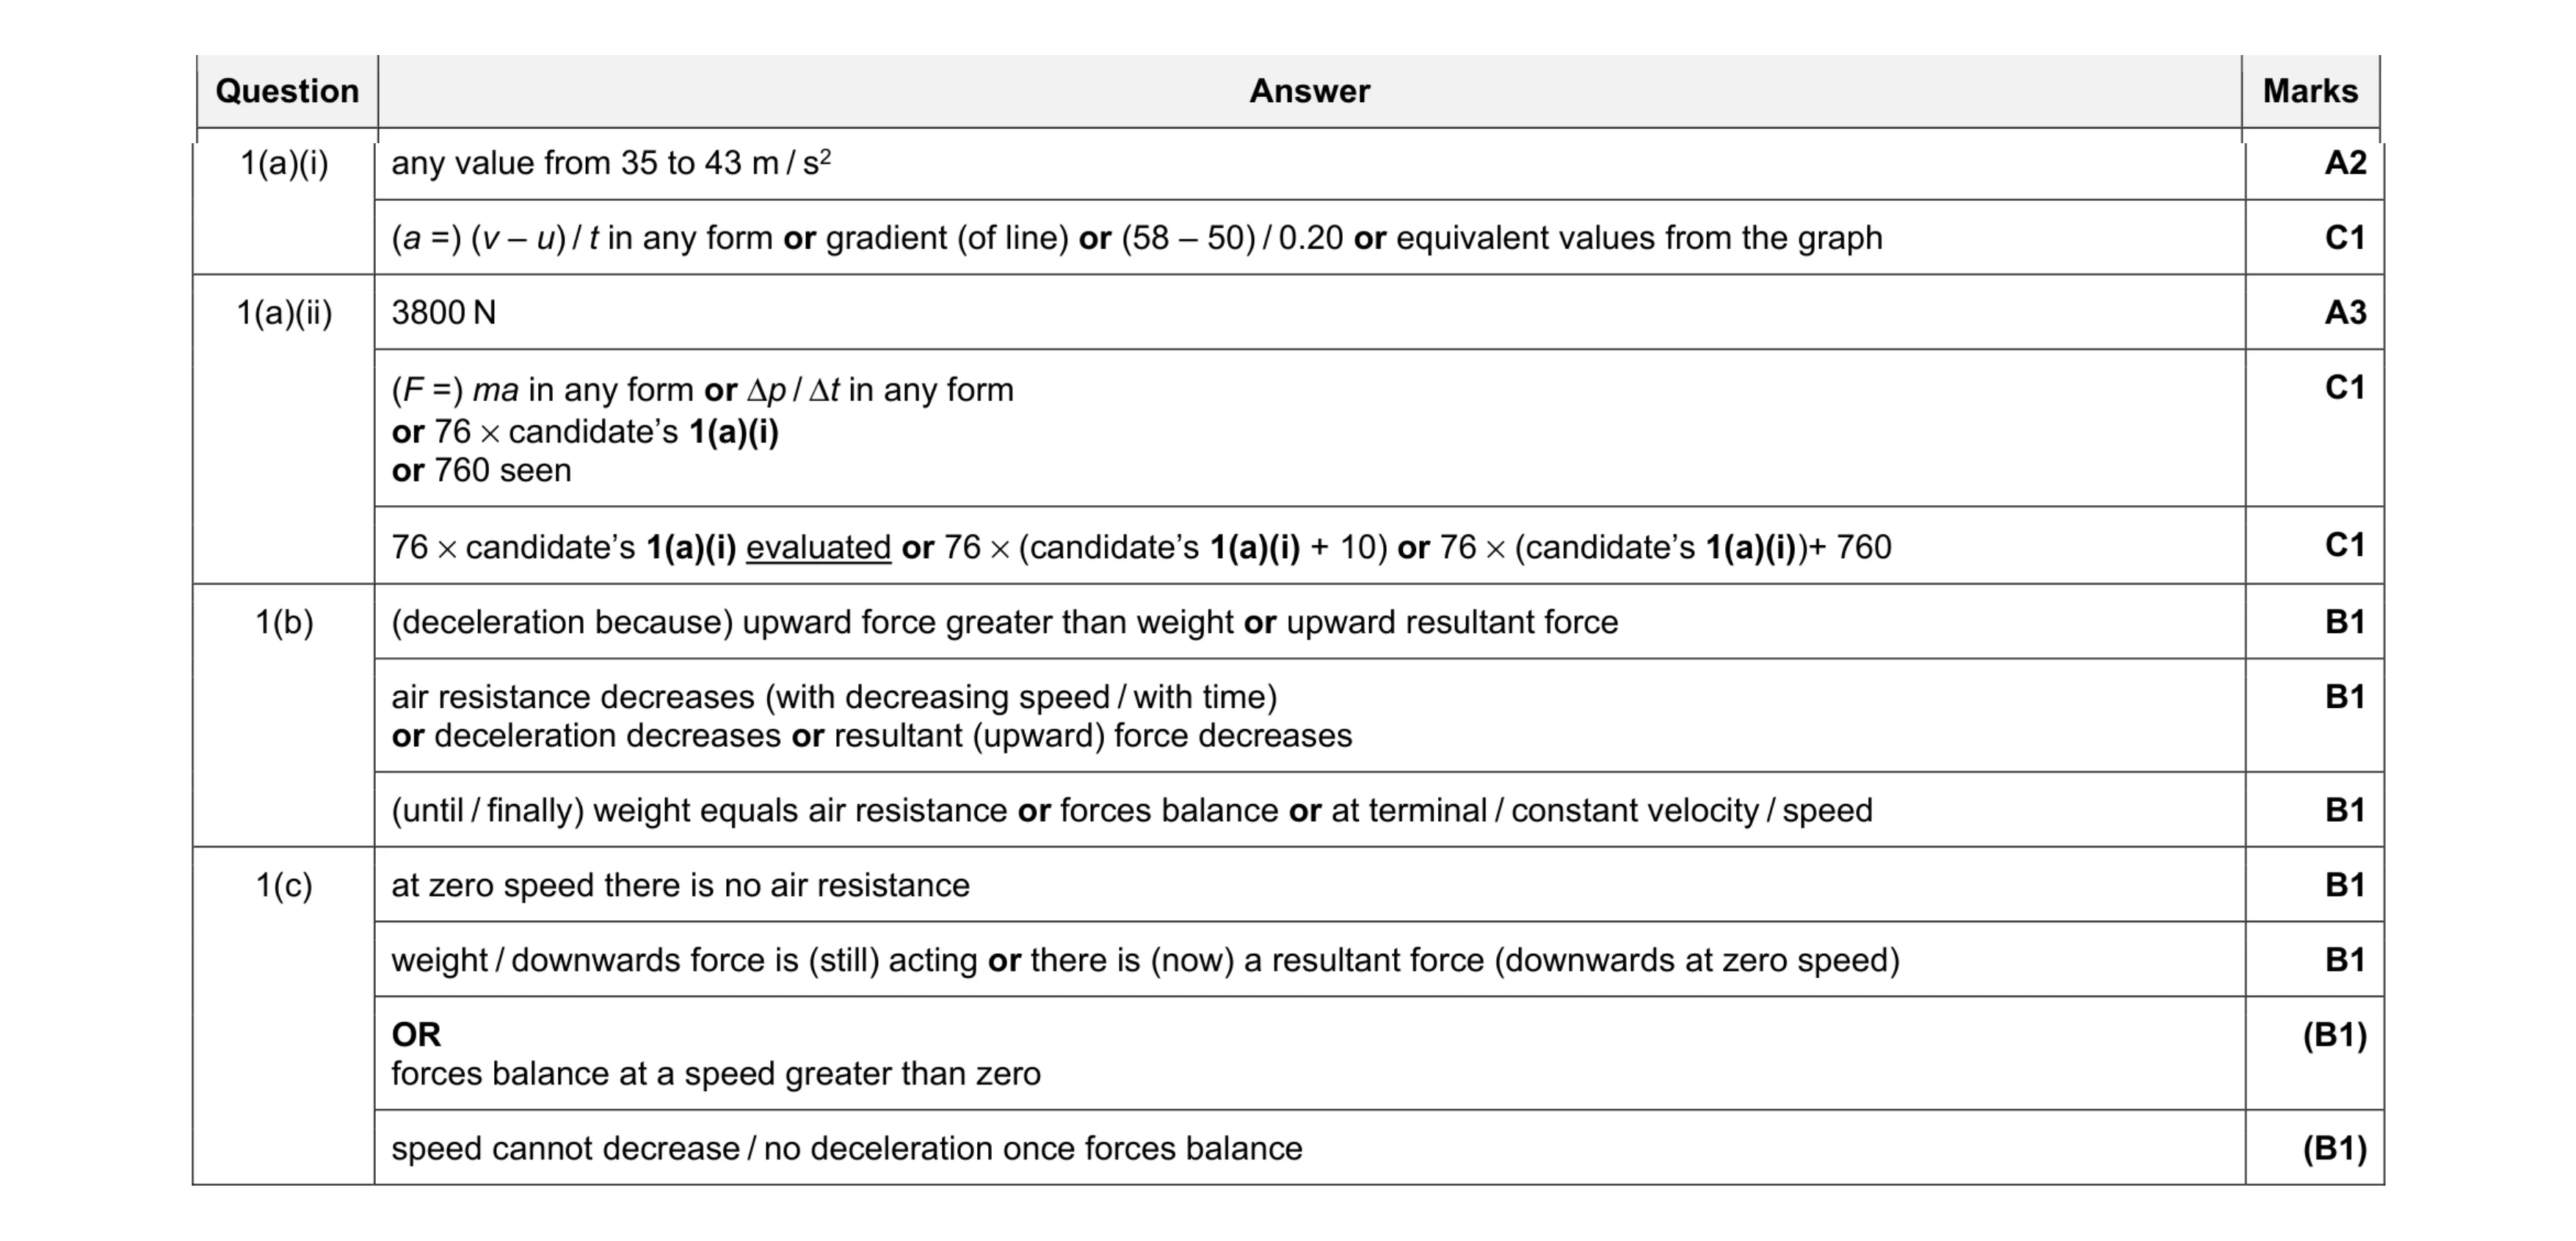 10
10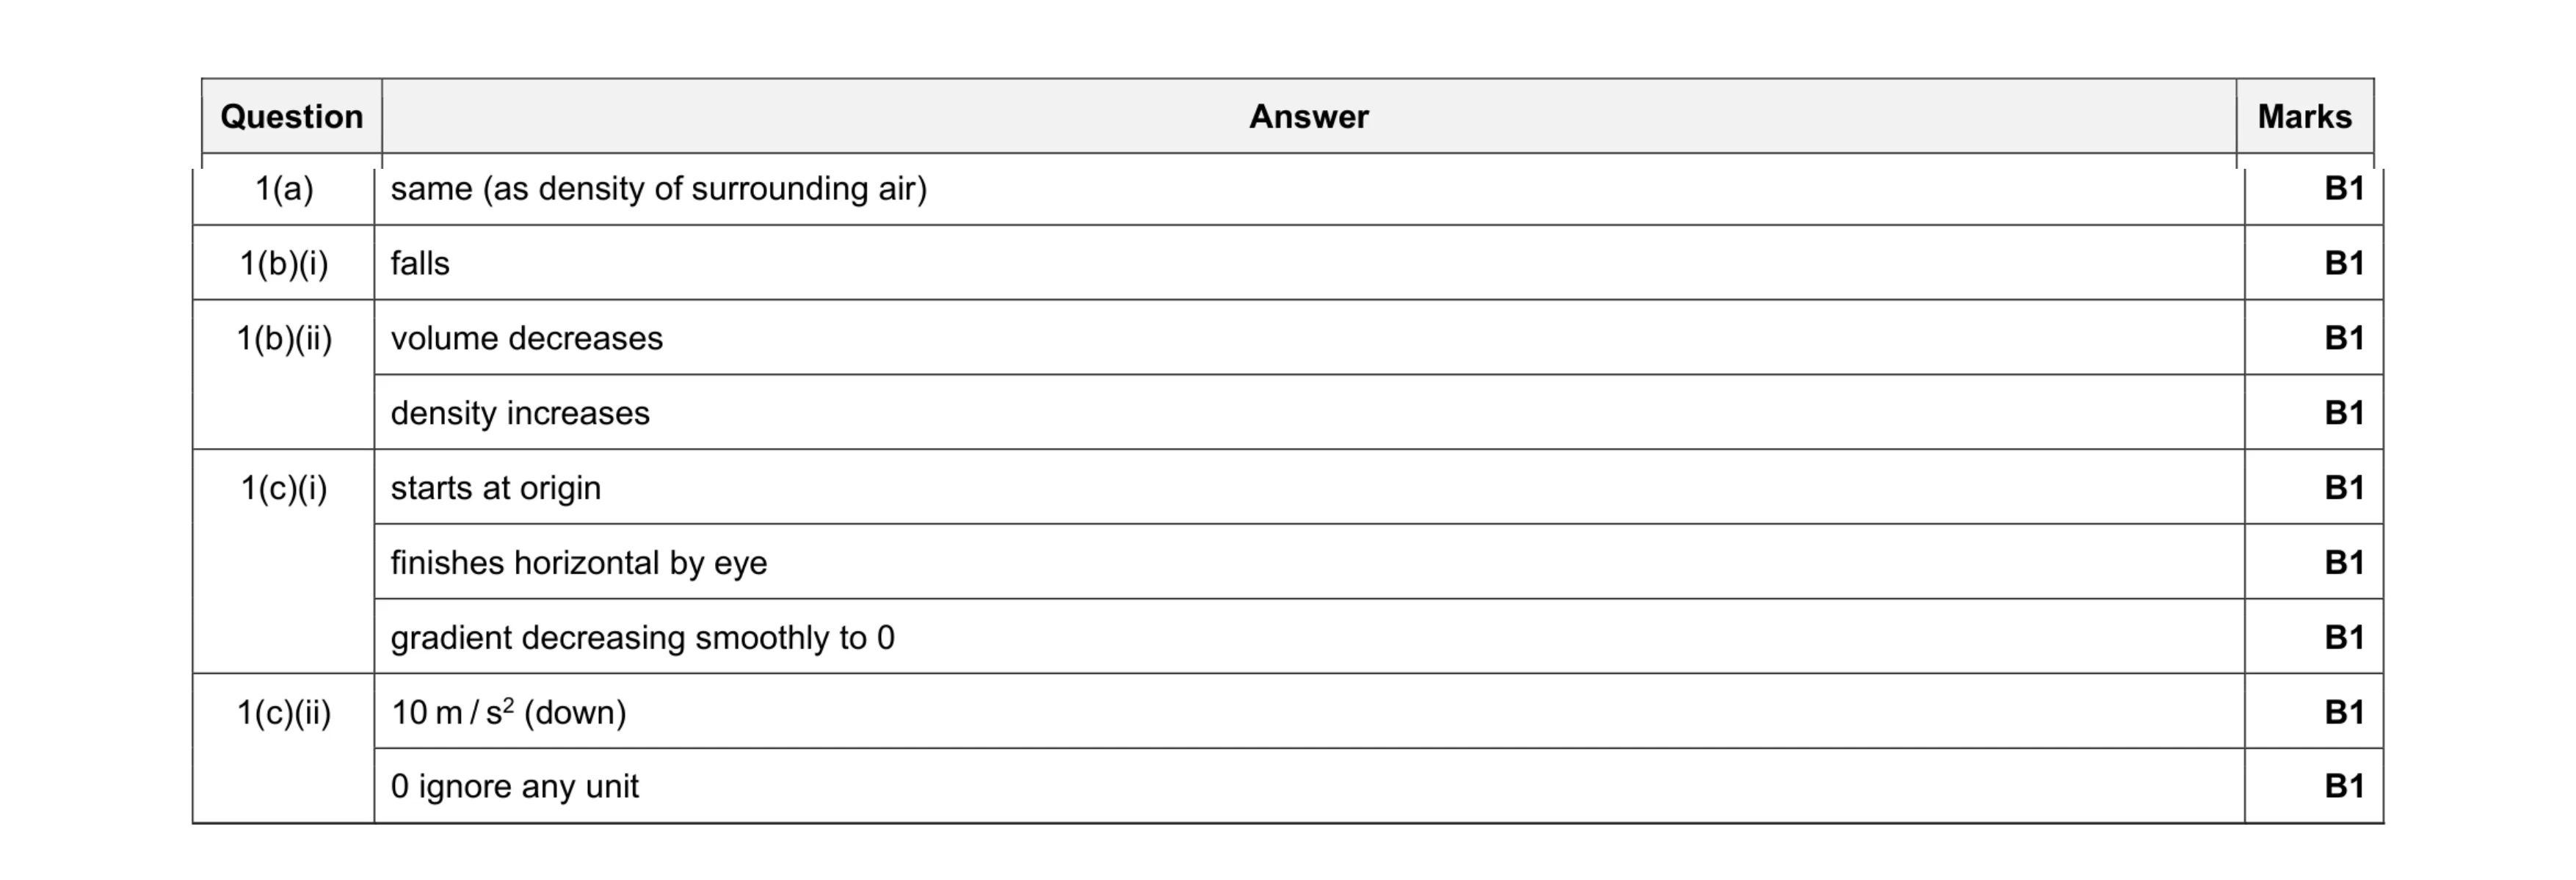 9
9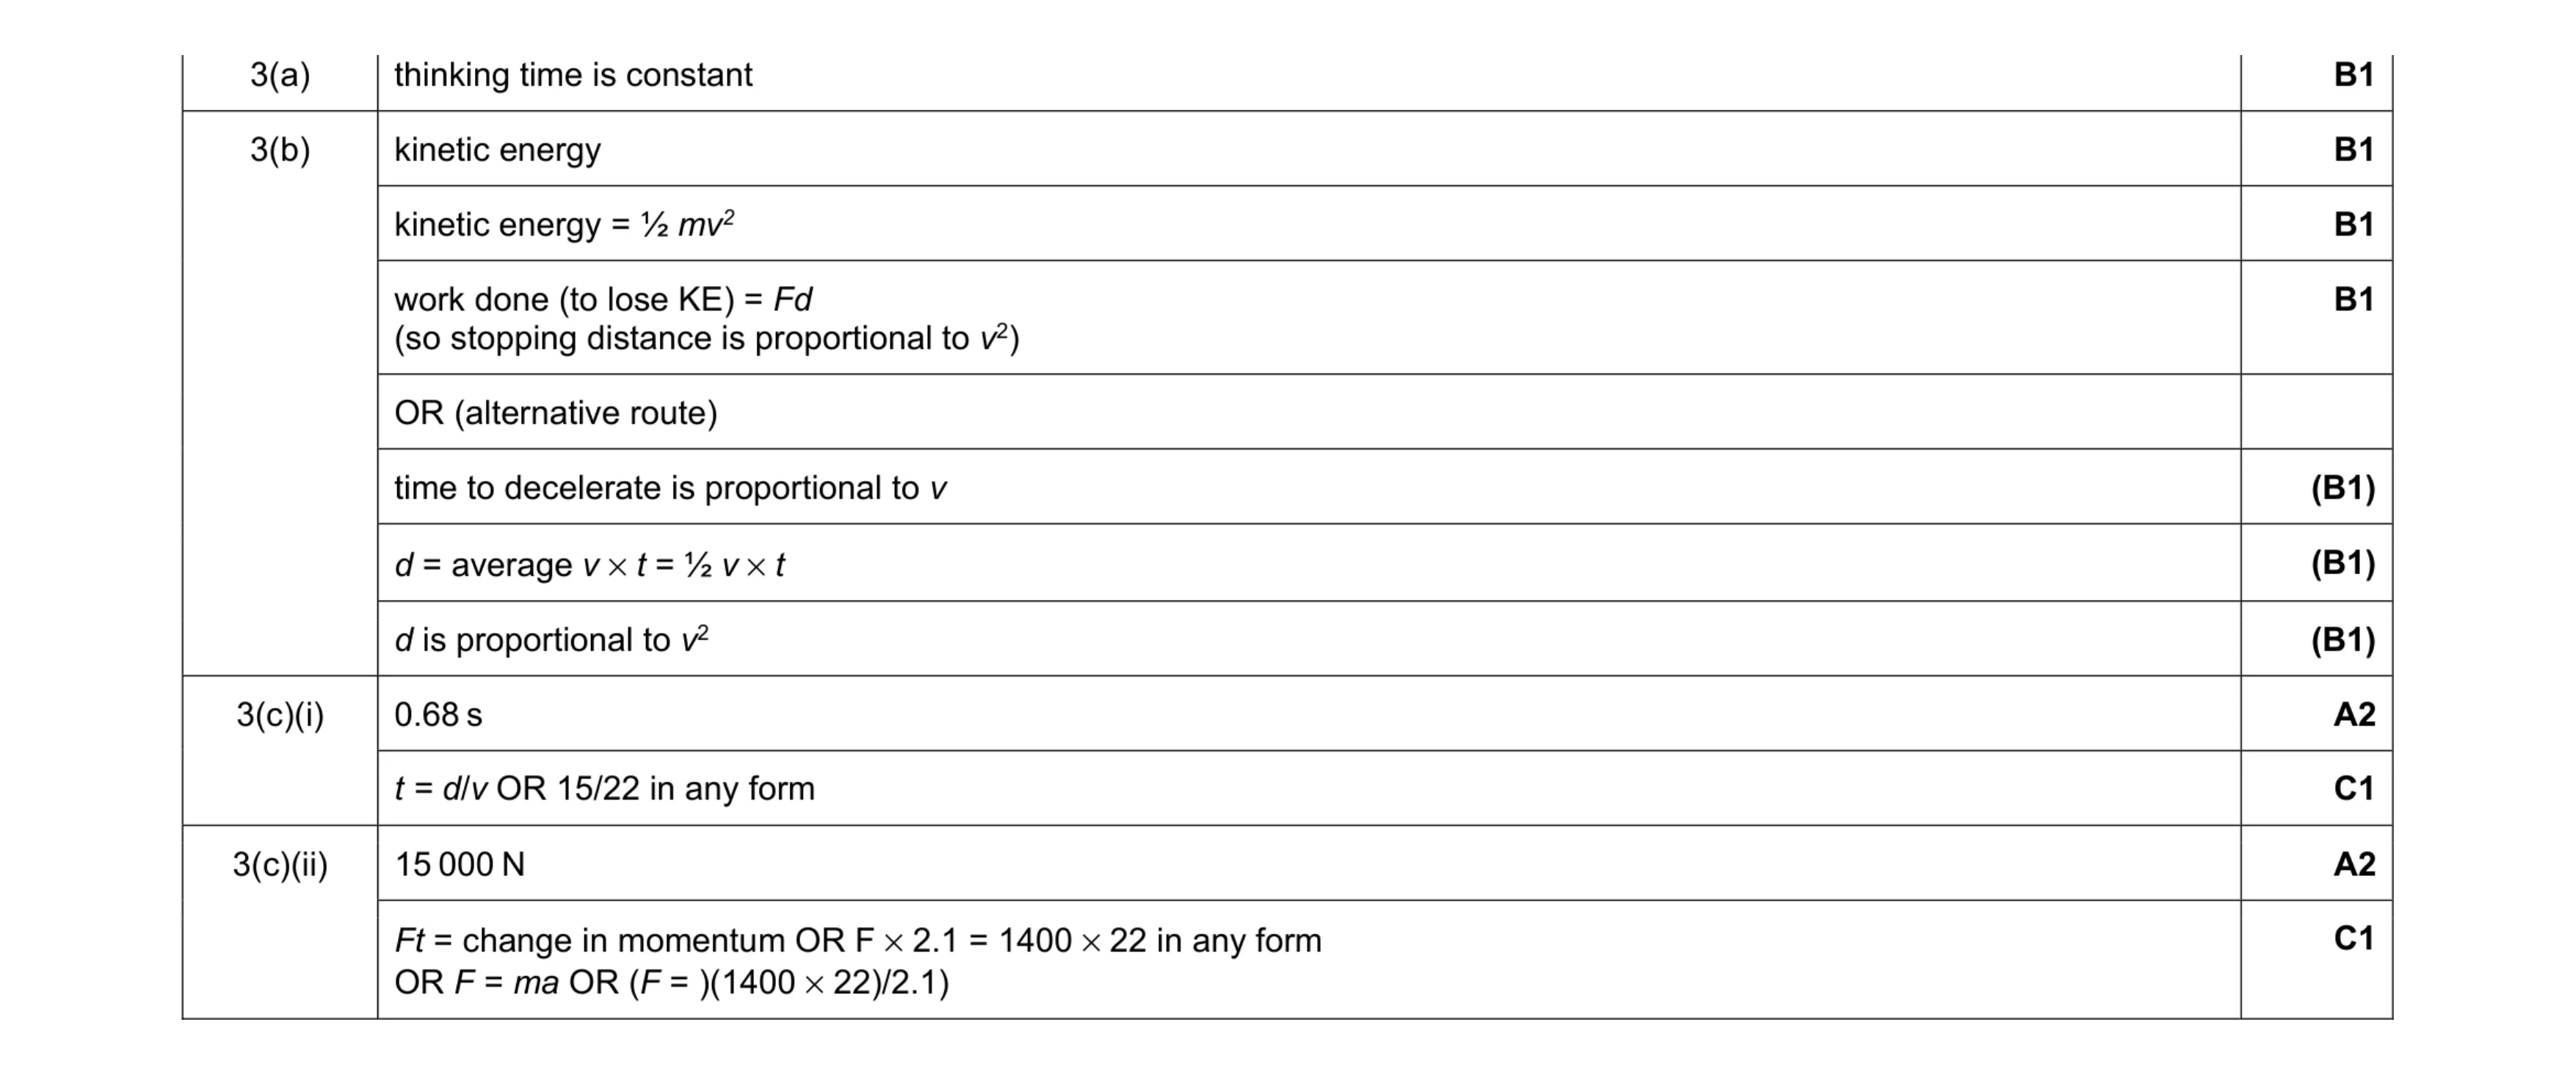 8
8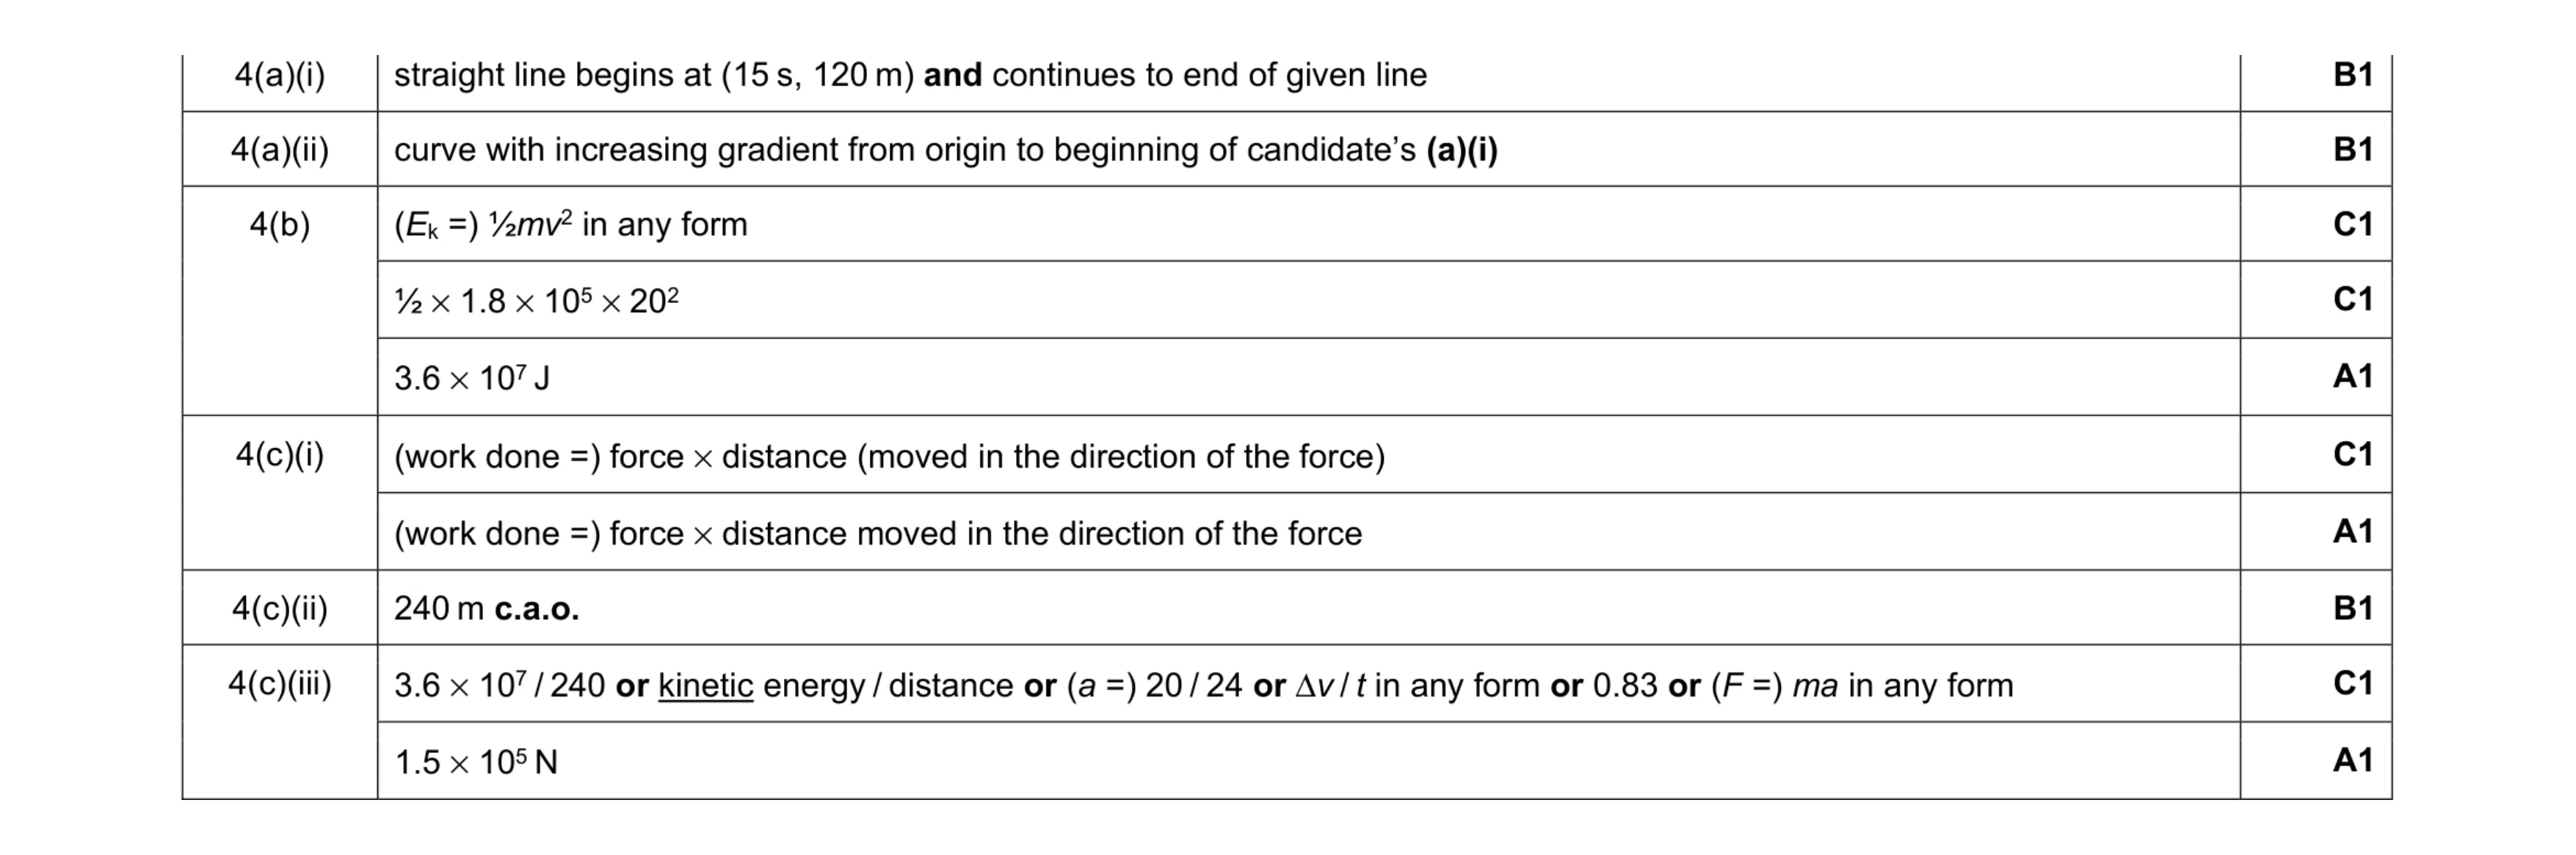 10
10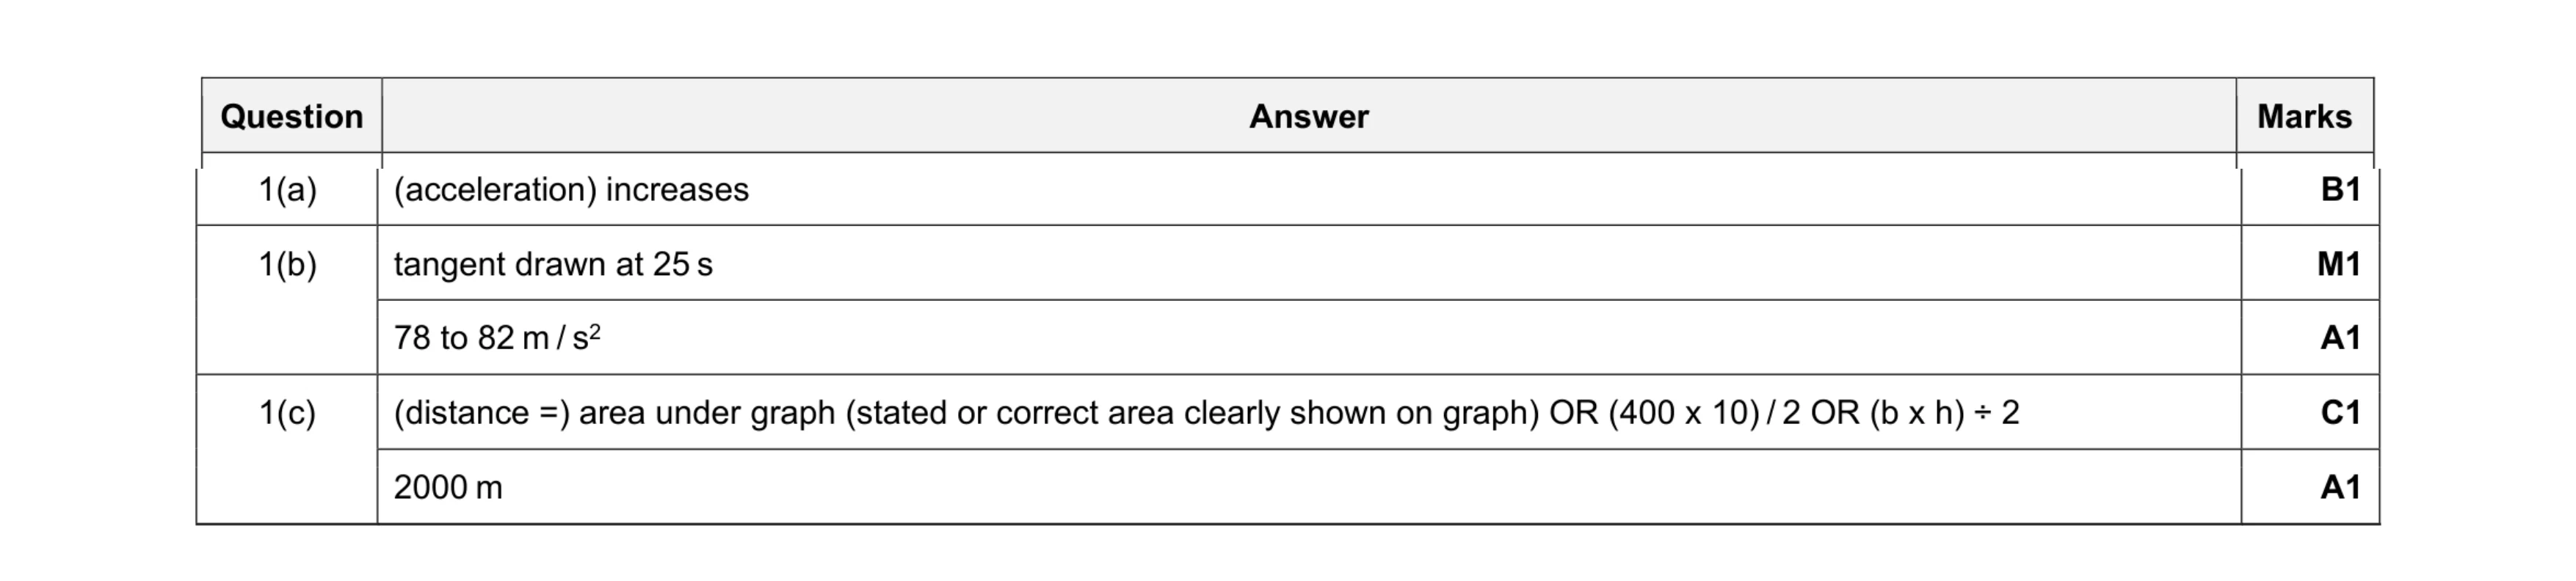 5
5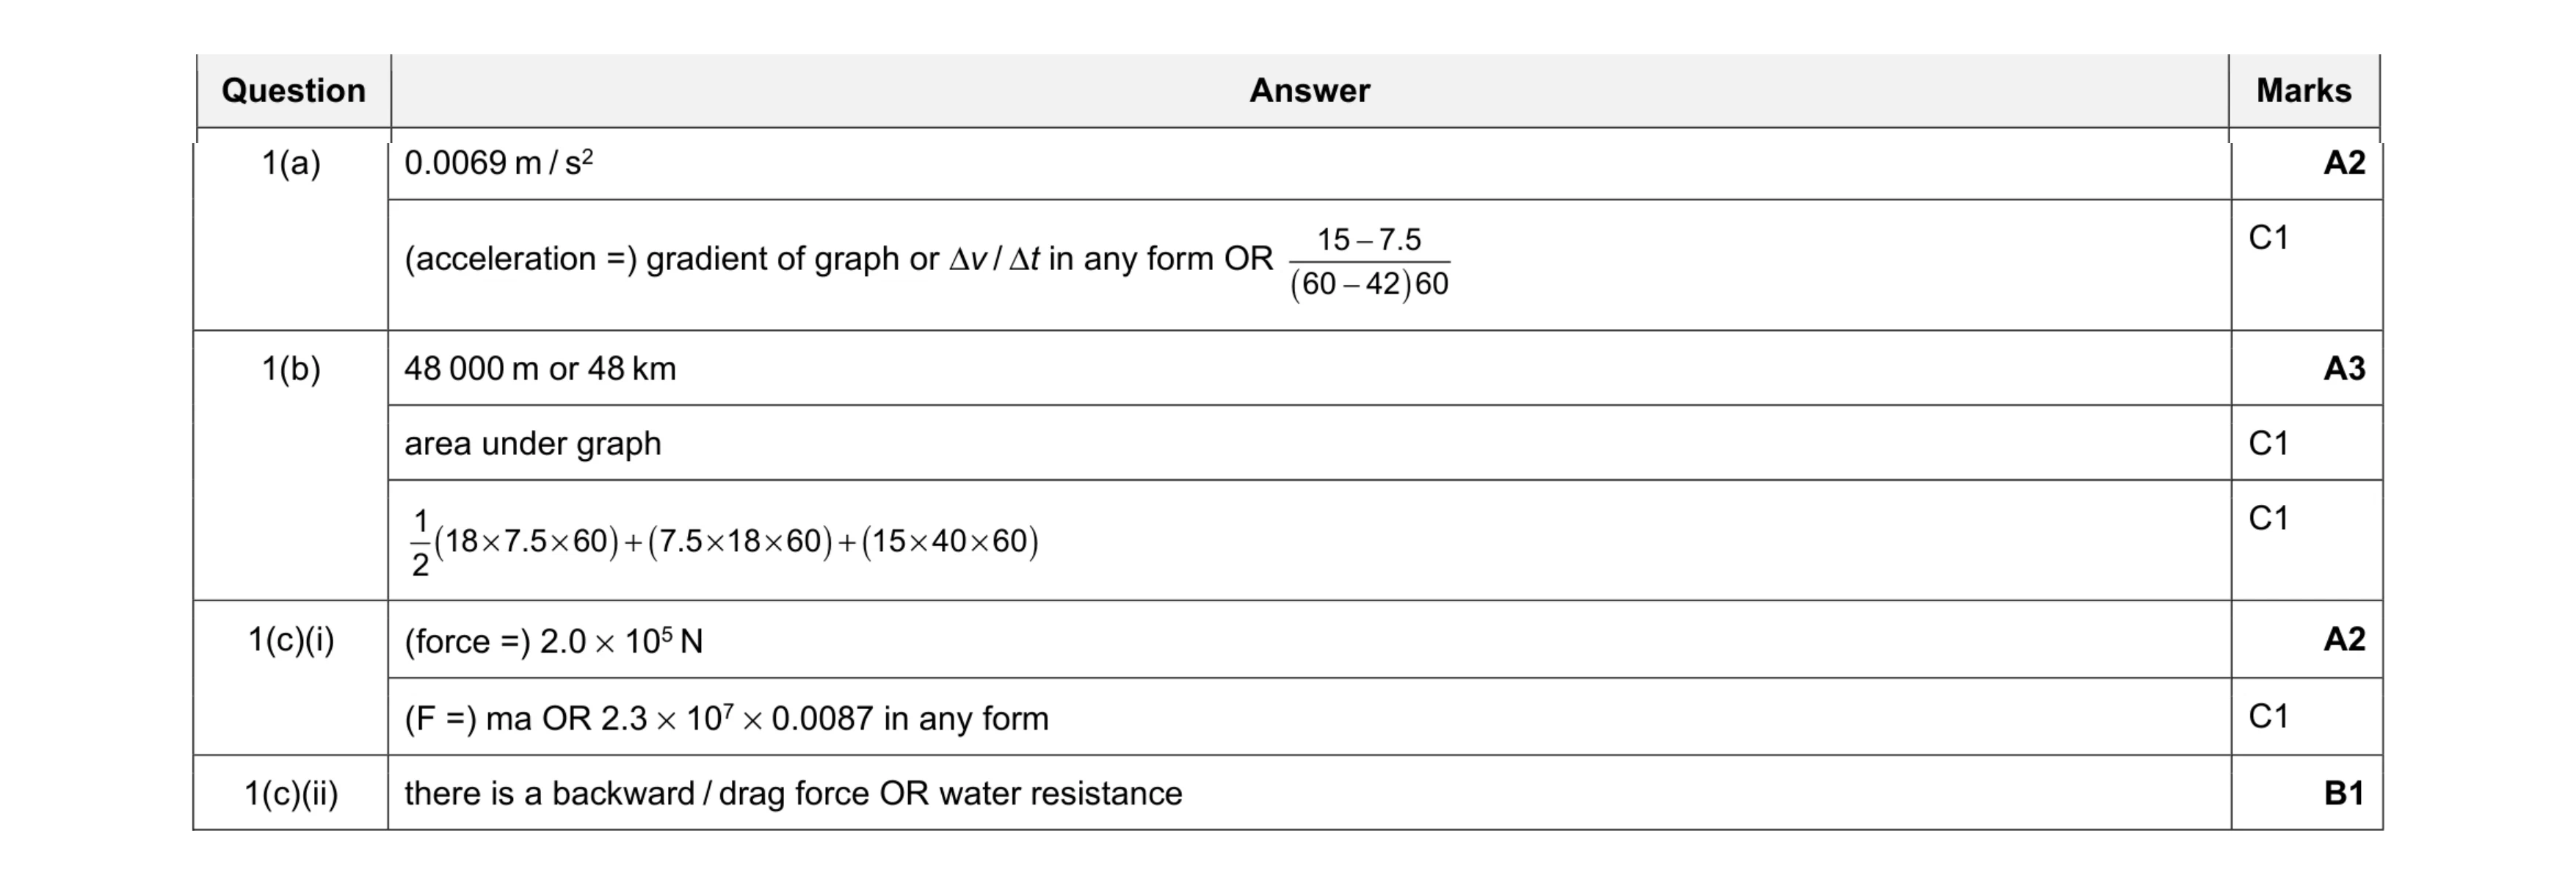 8
8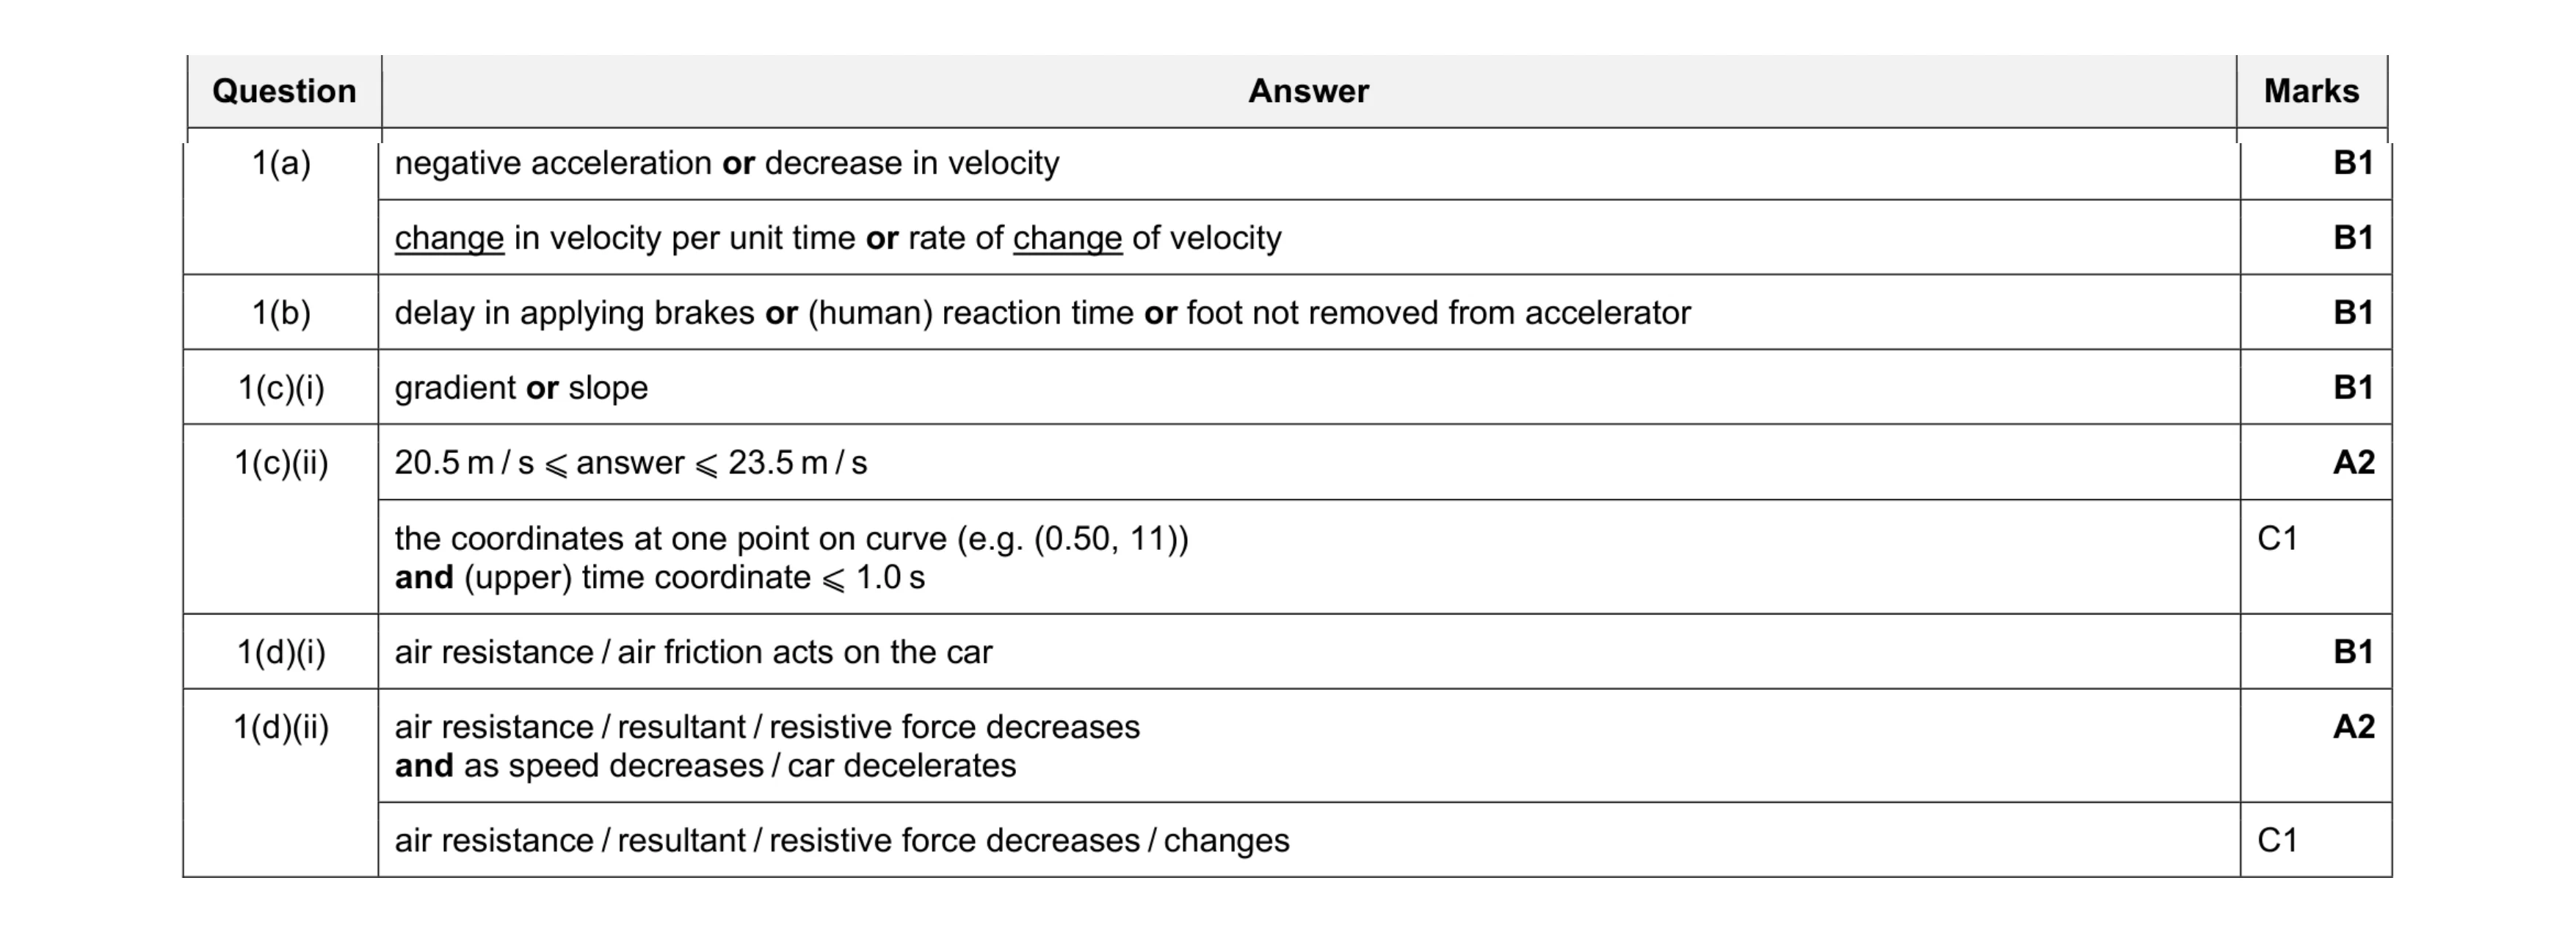 9
9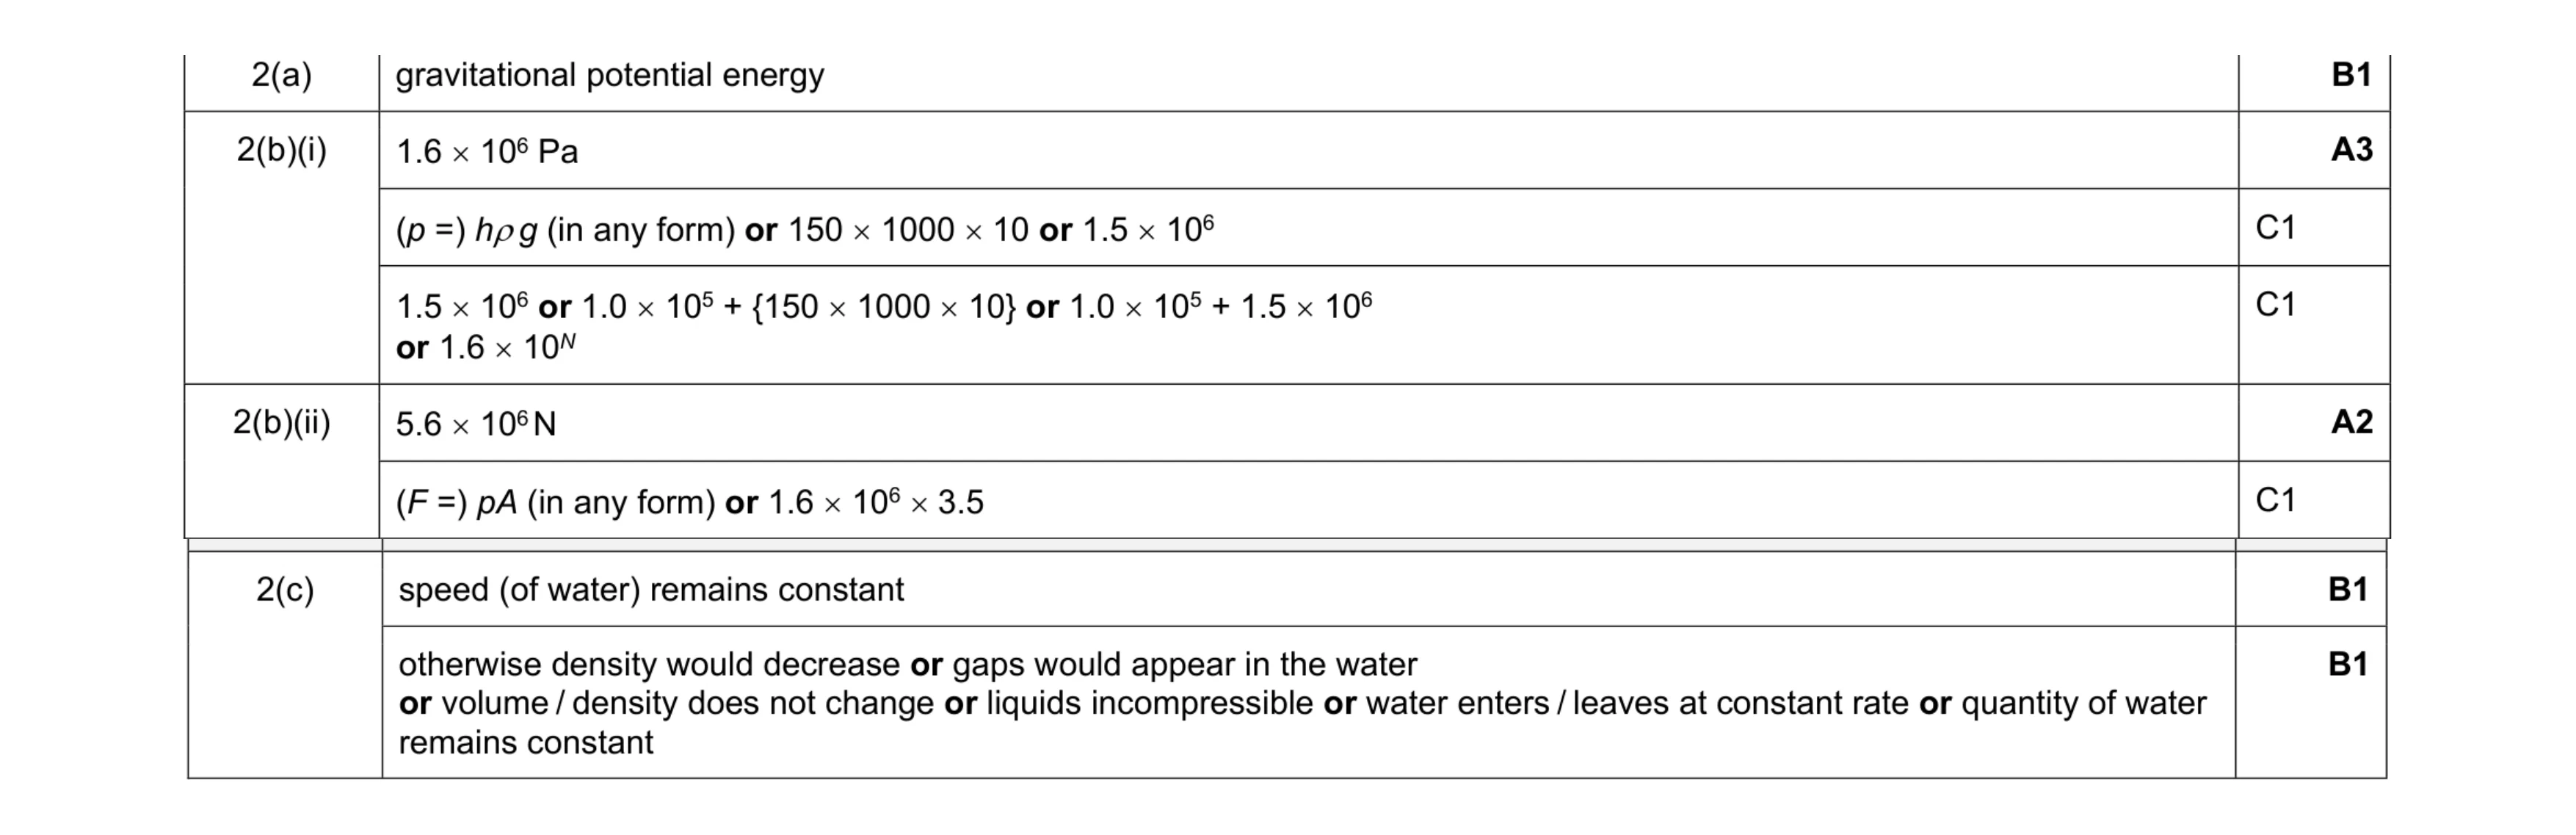 8
8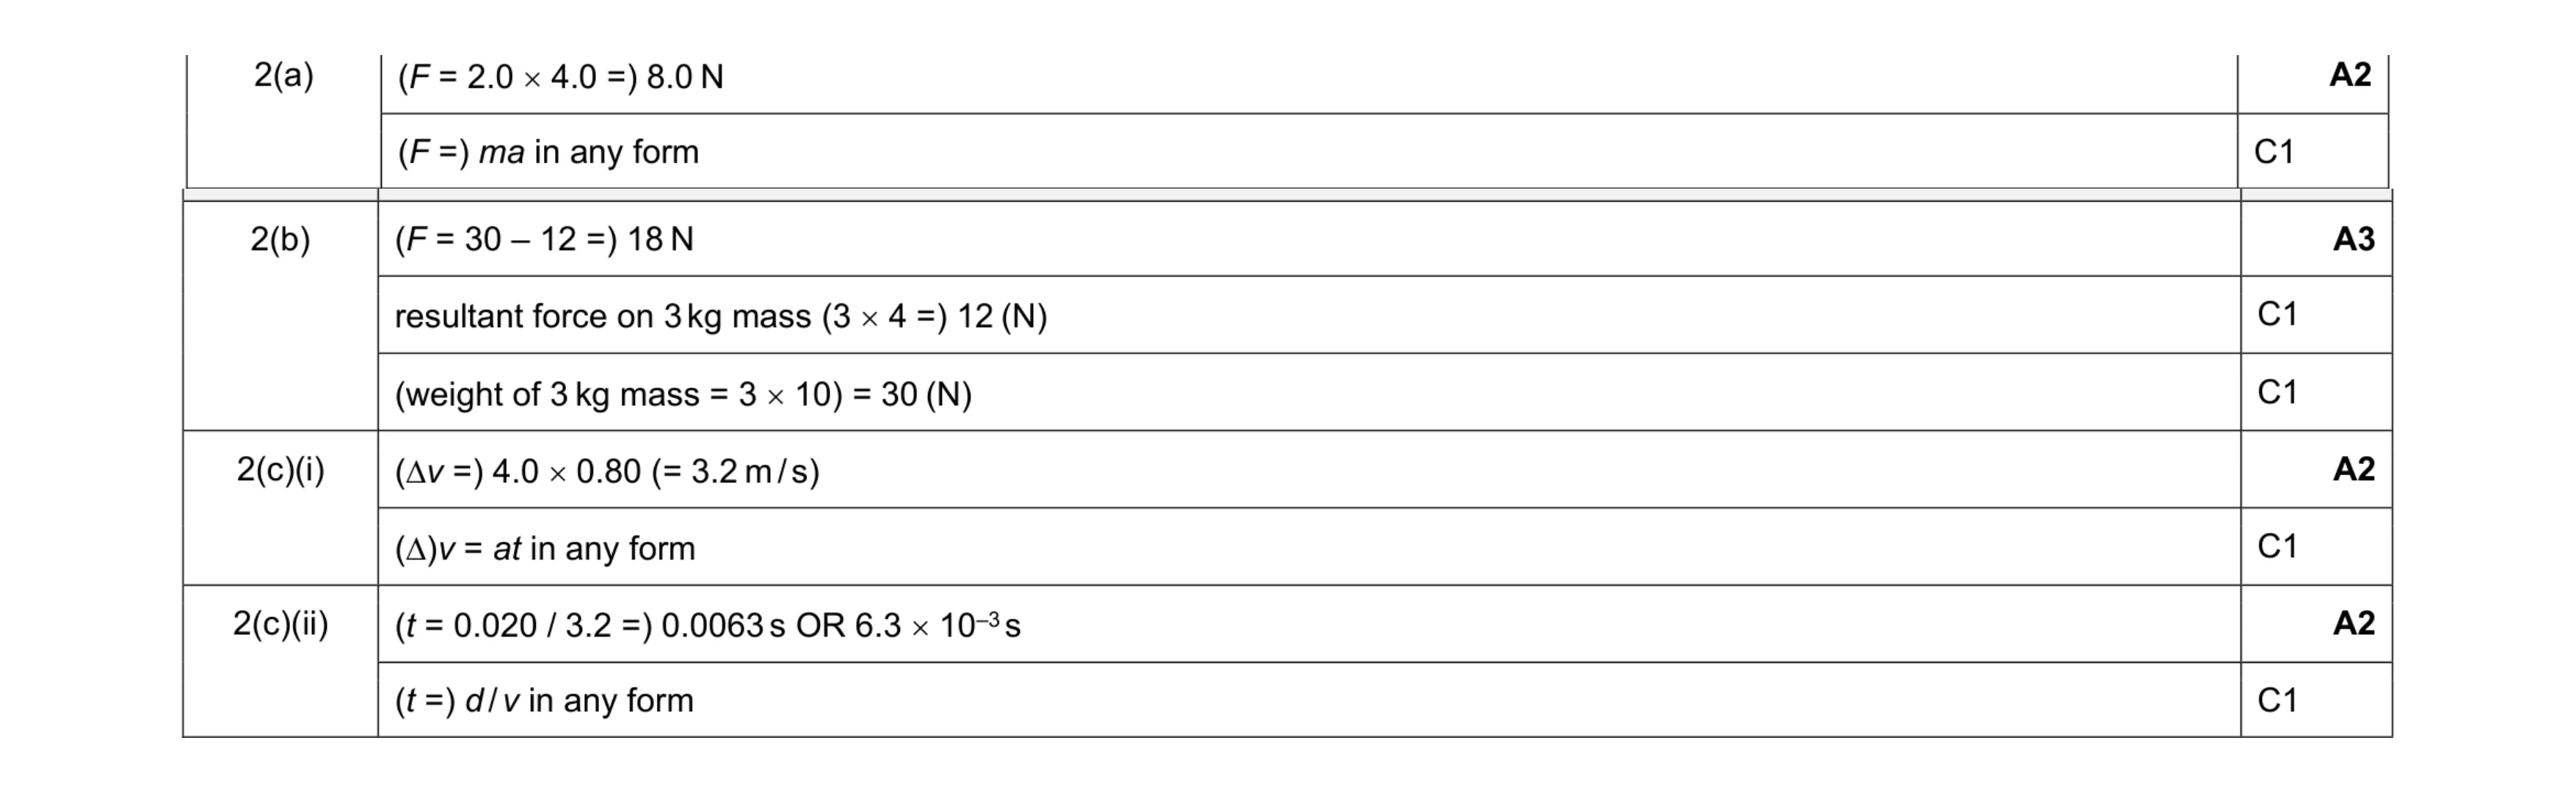 9
9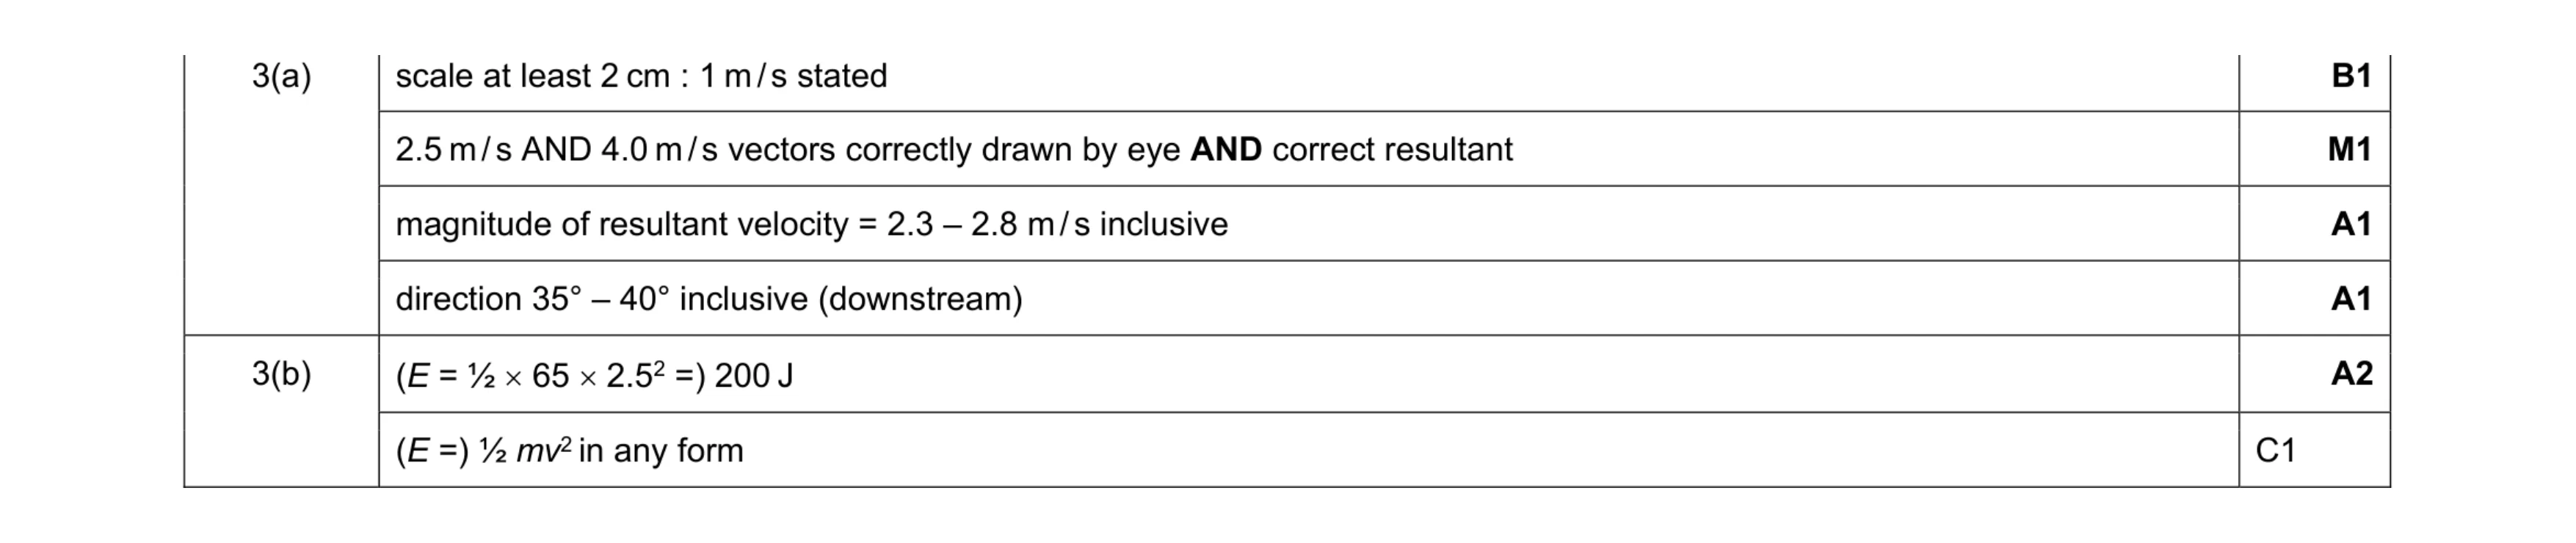 6
6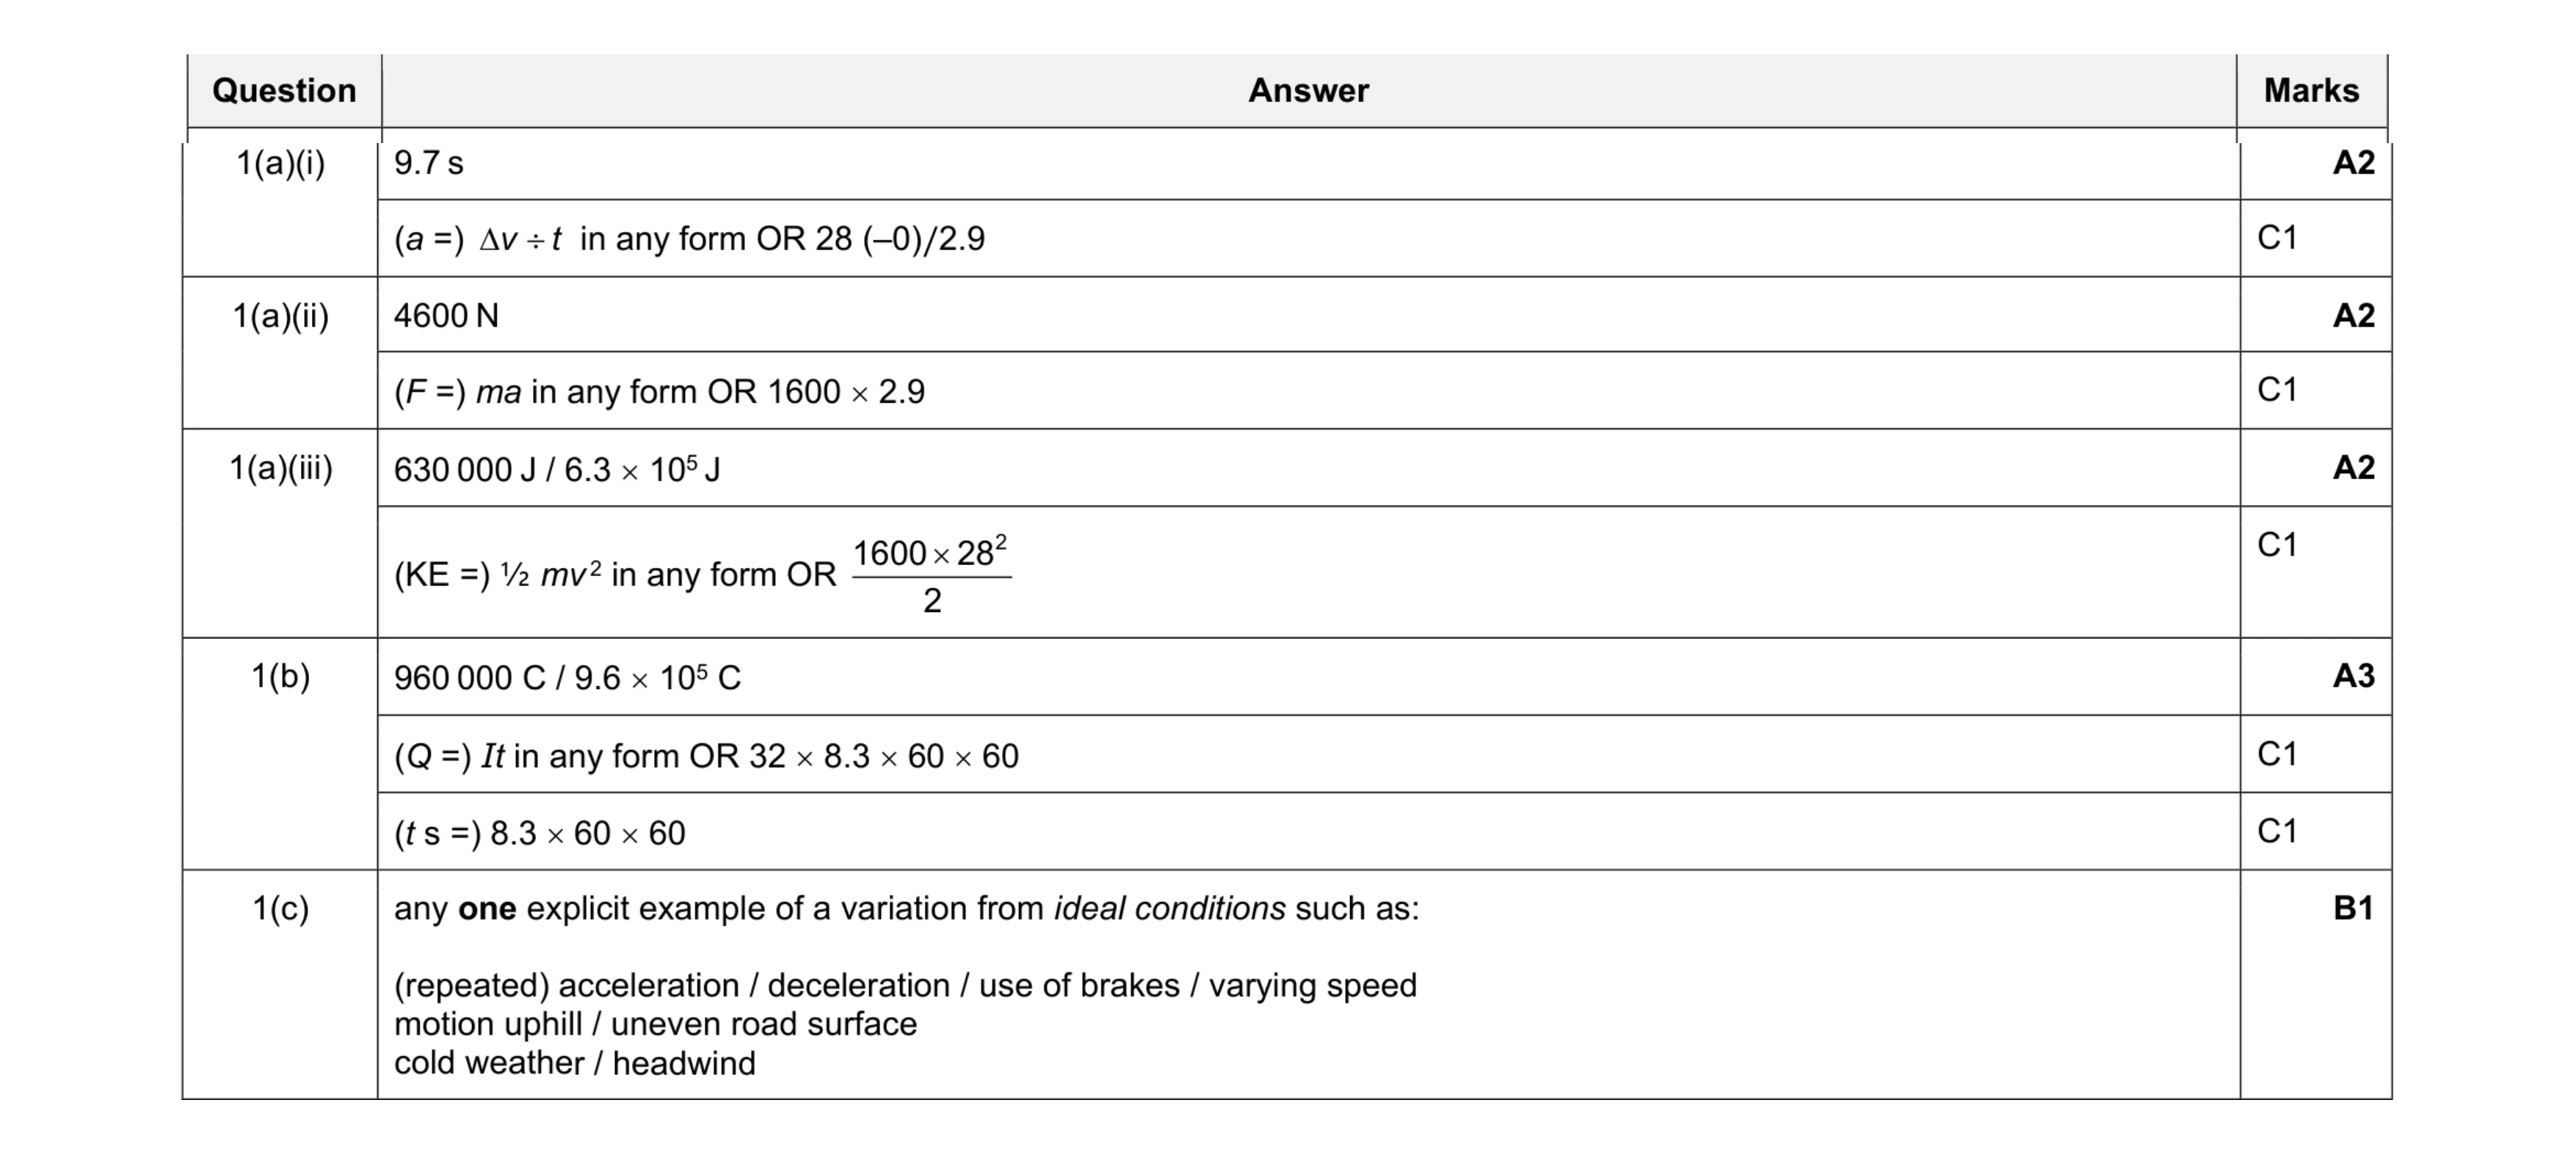 10
10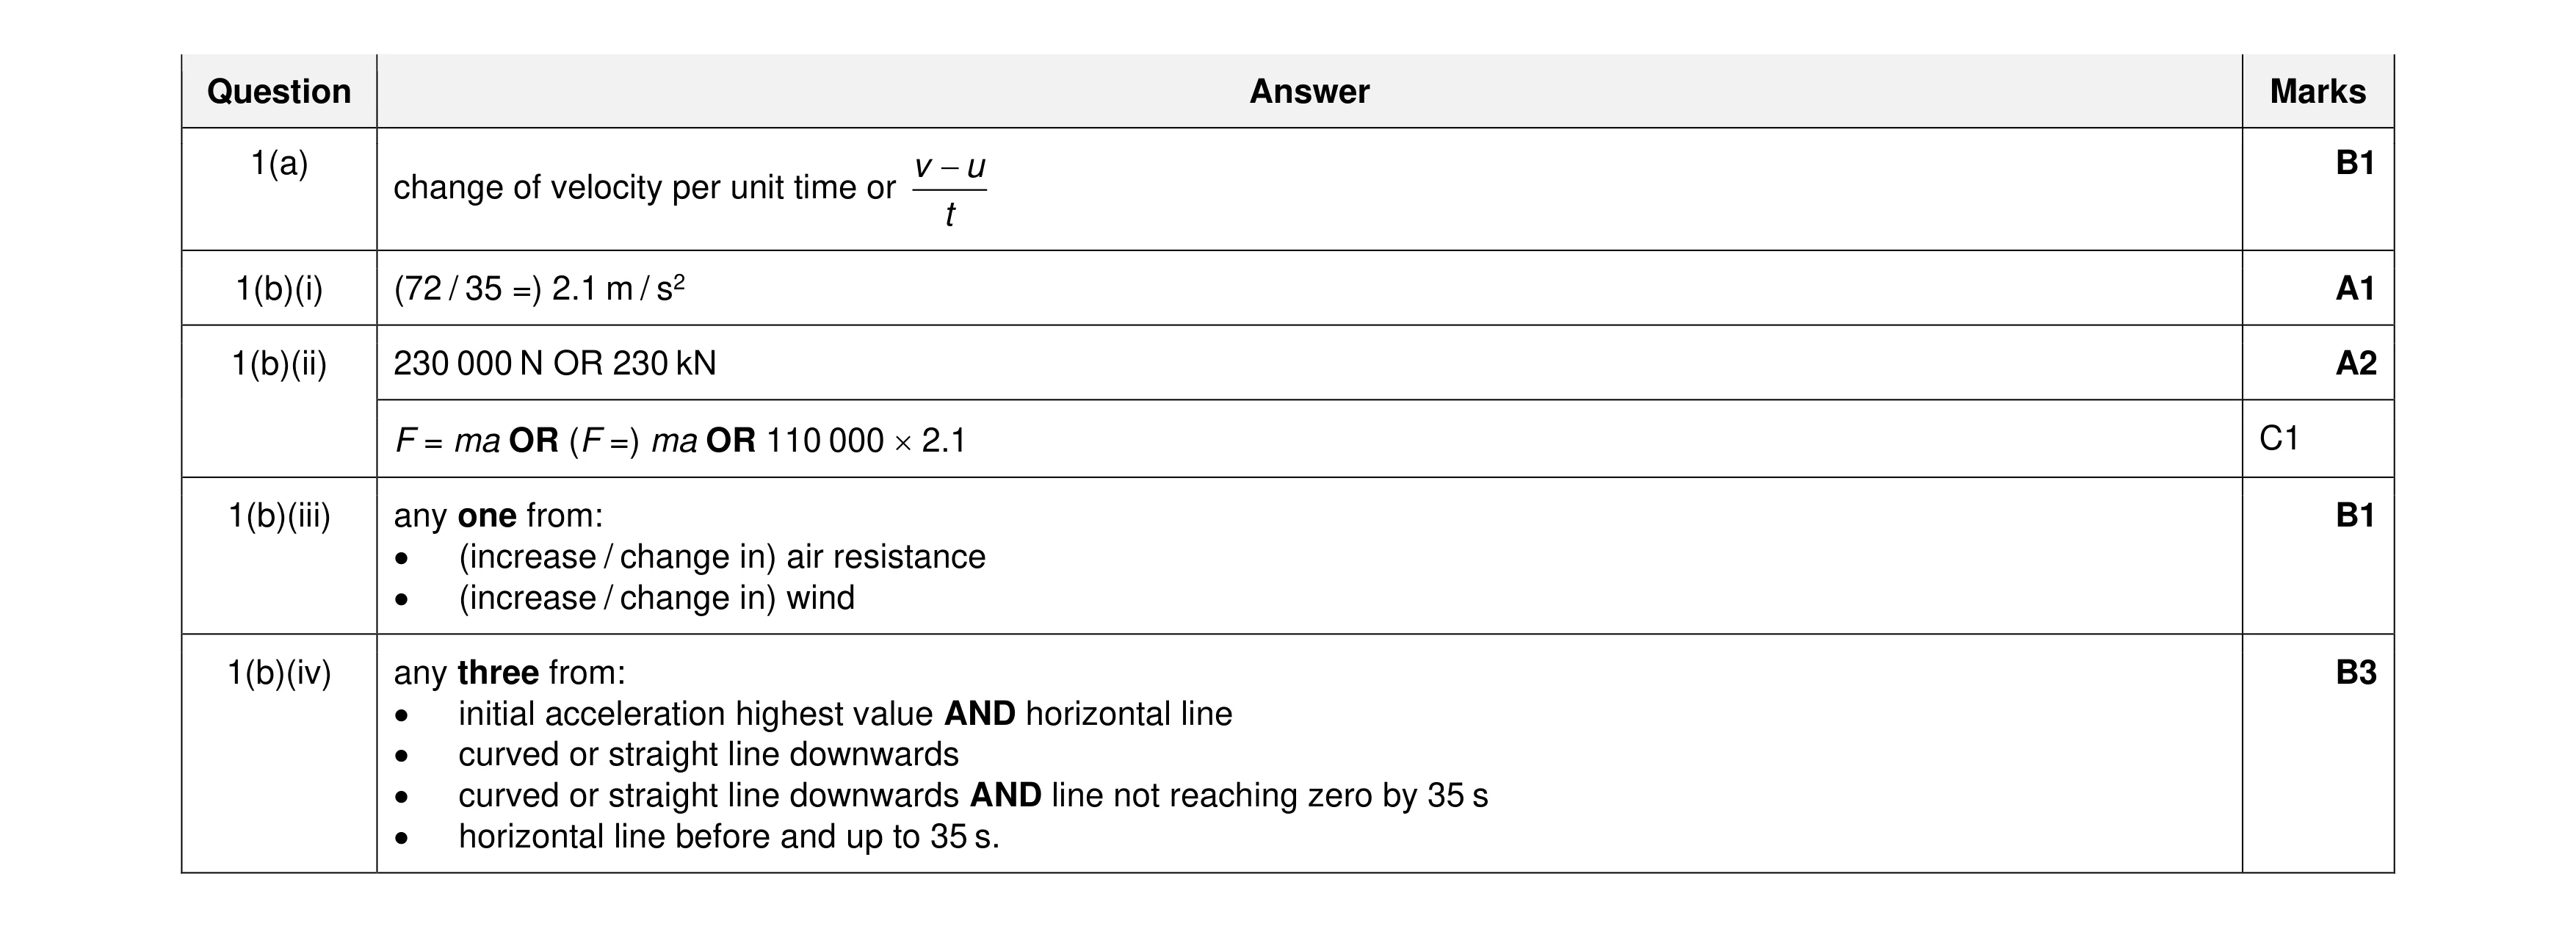 8
8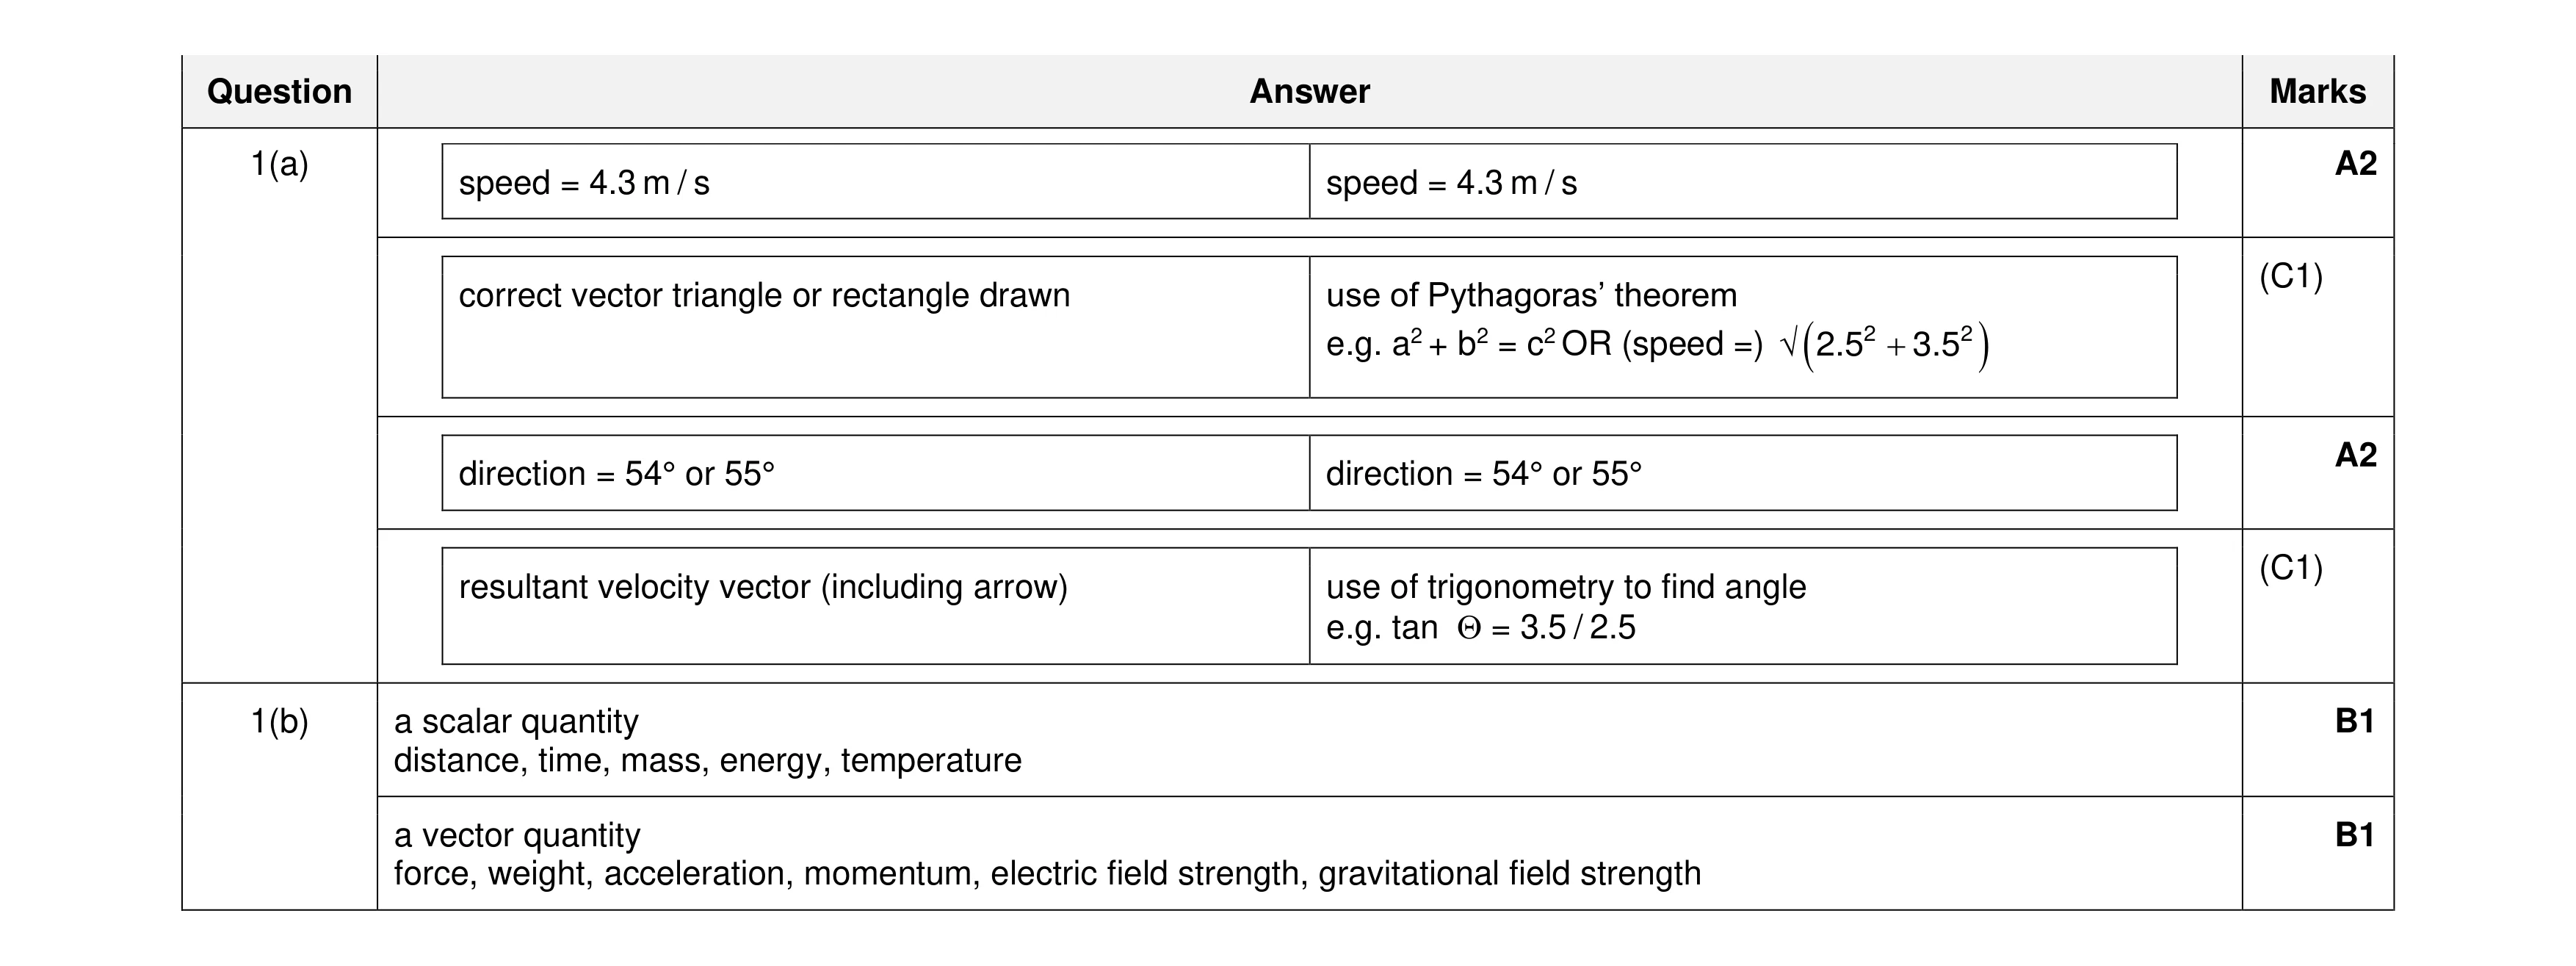 6
6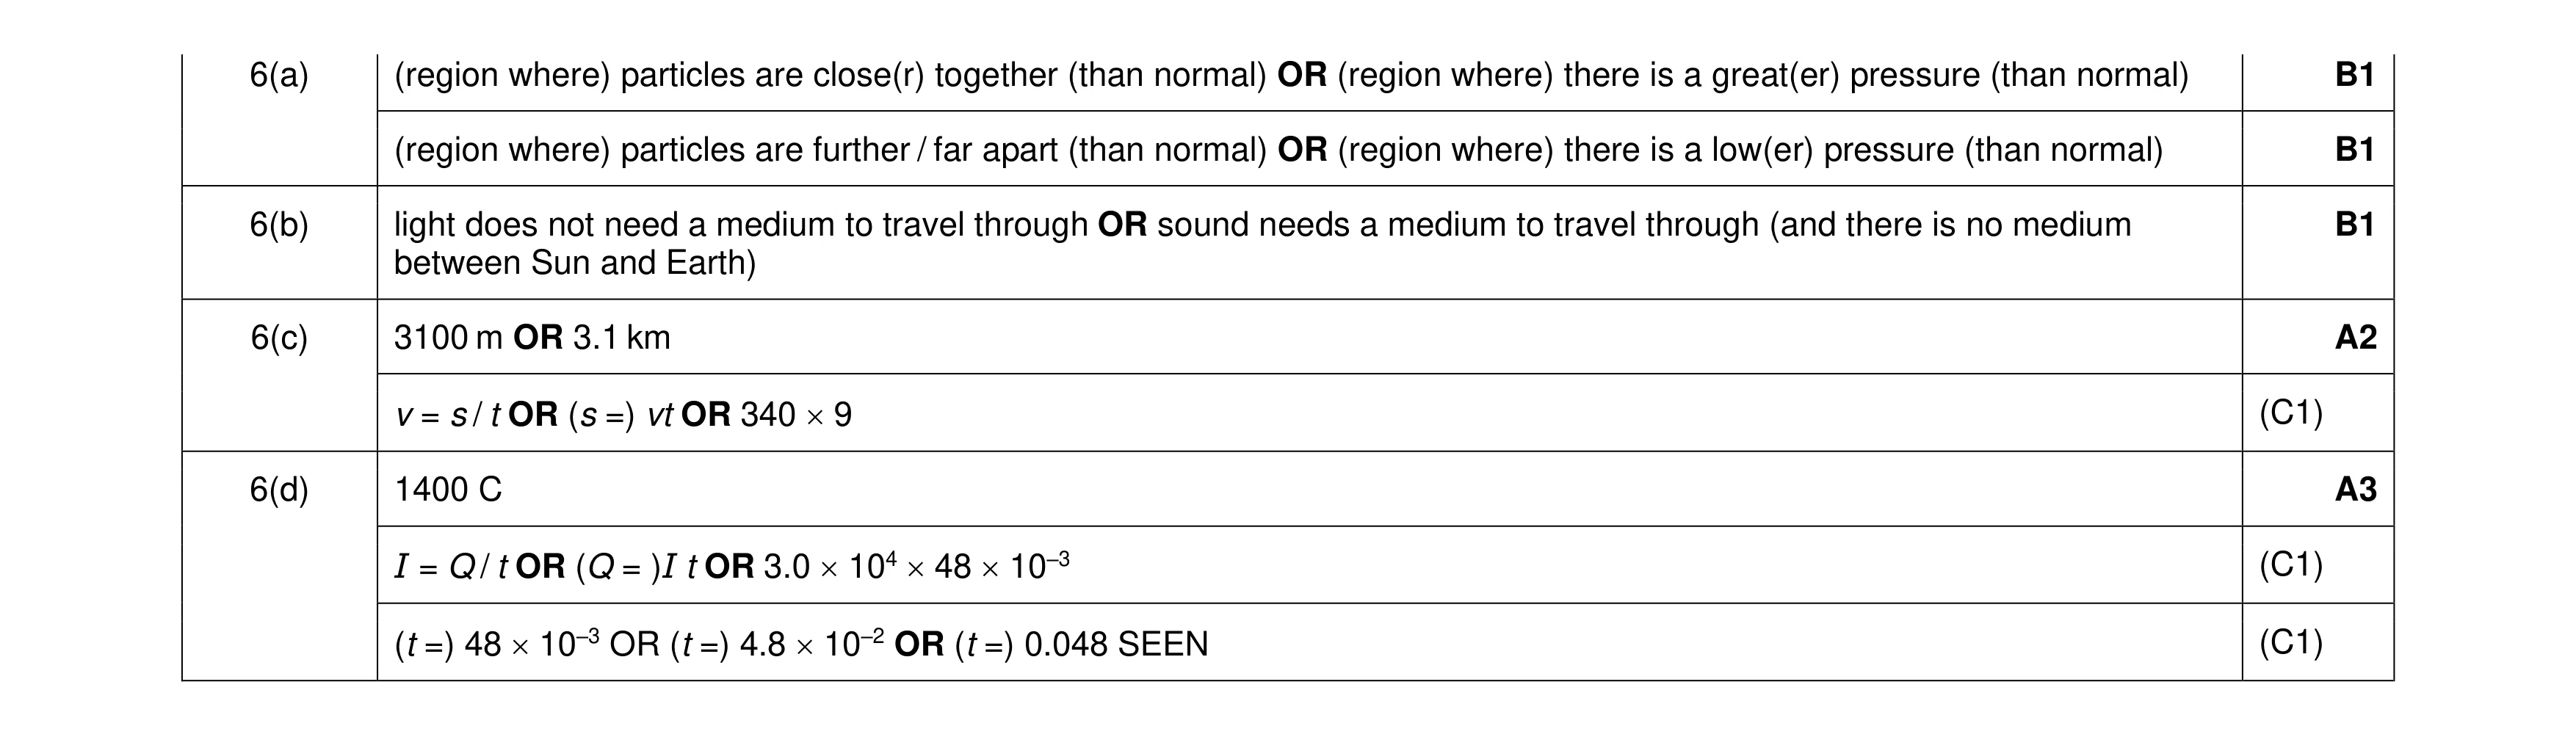 8
8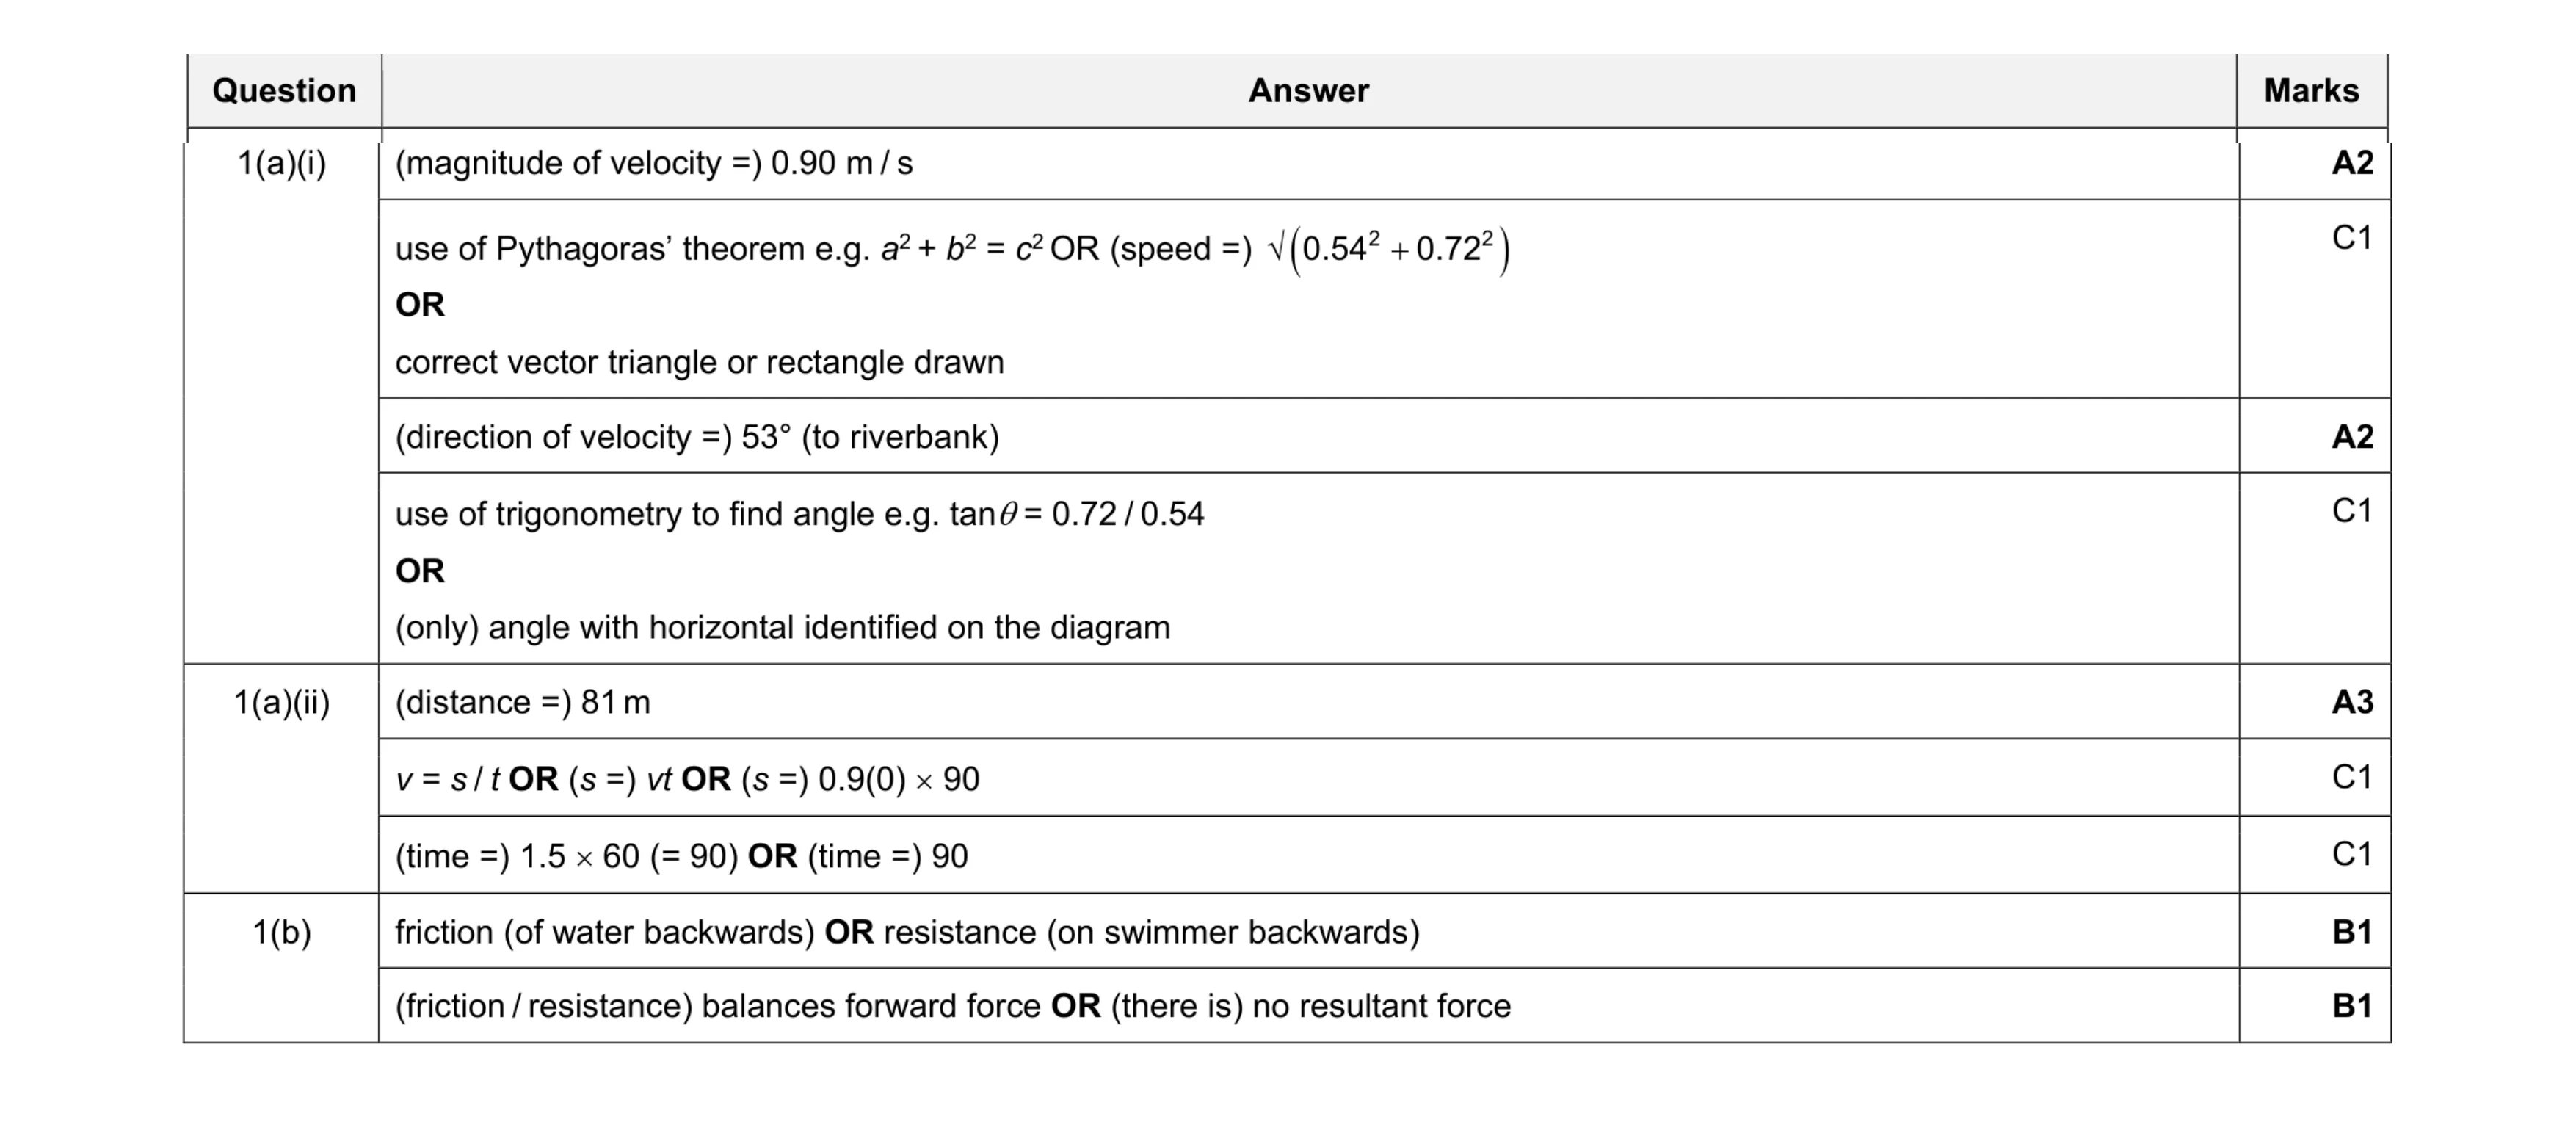 9
9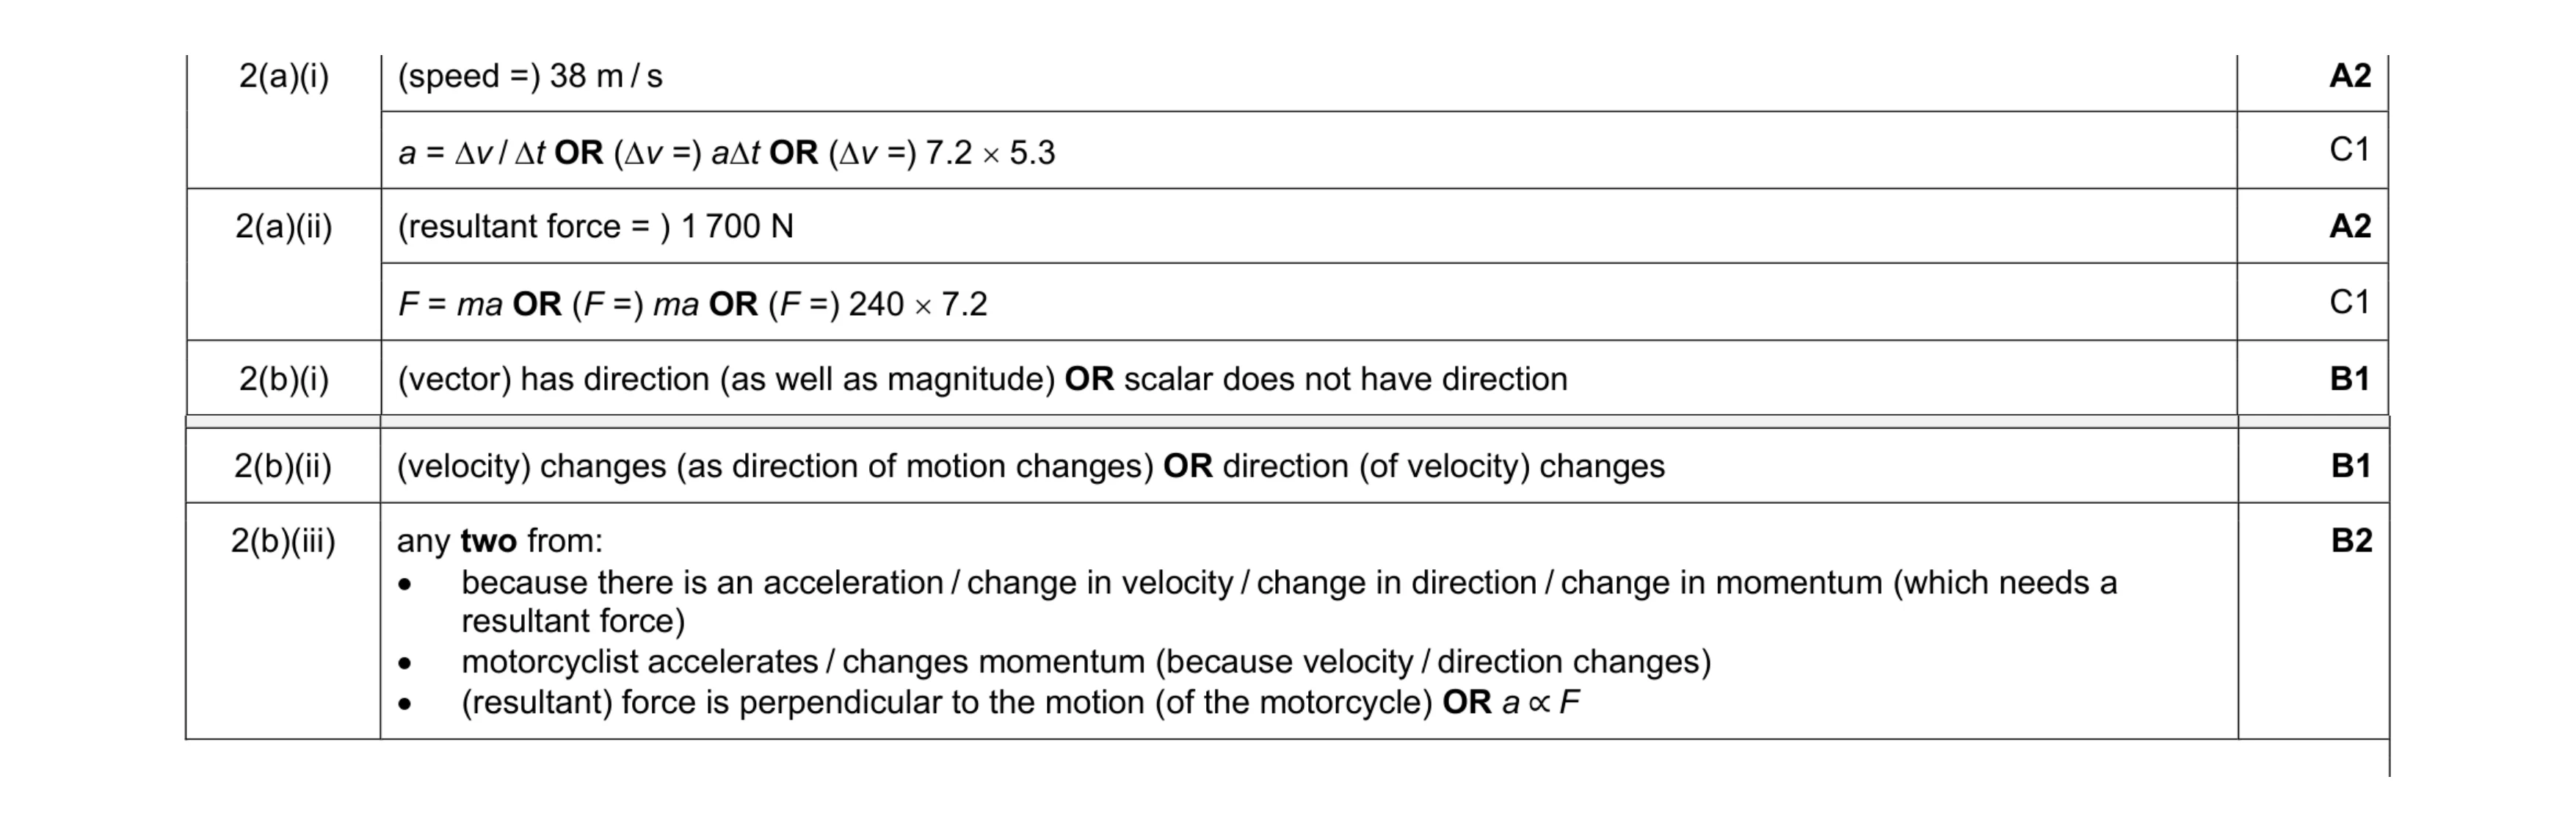 8
8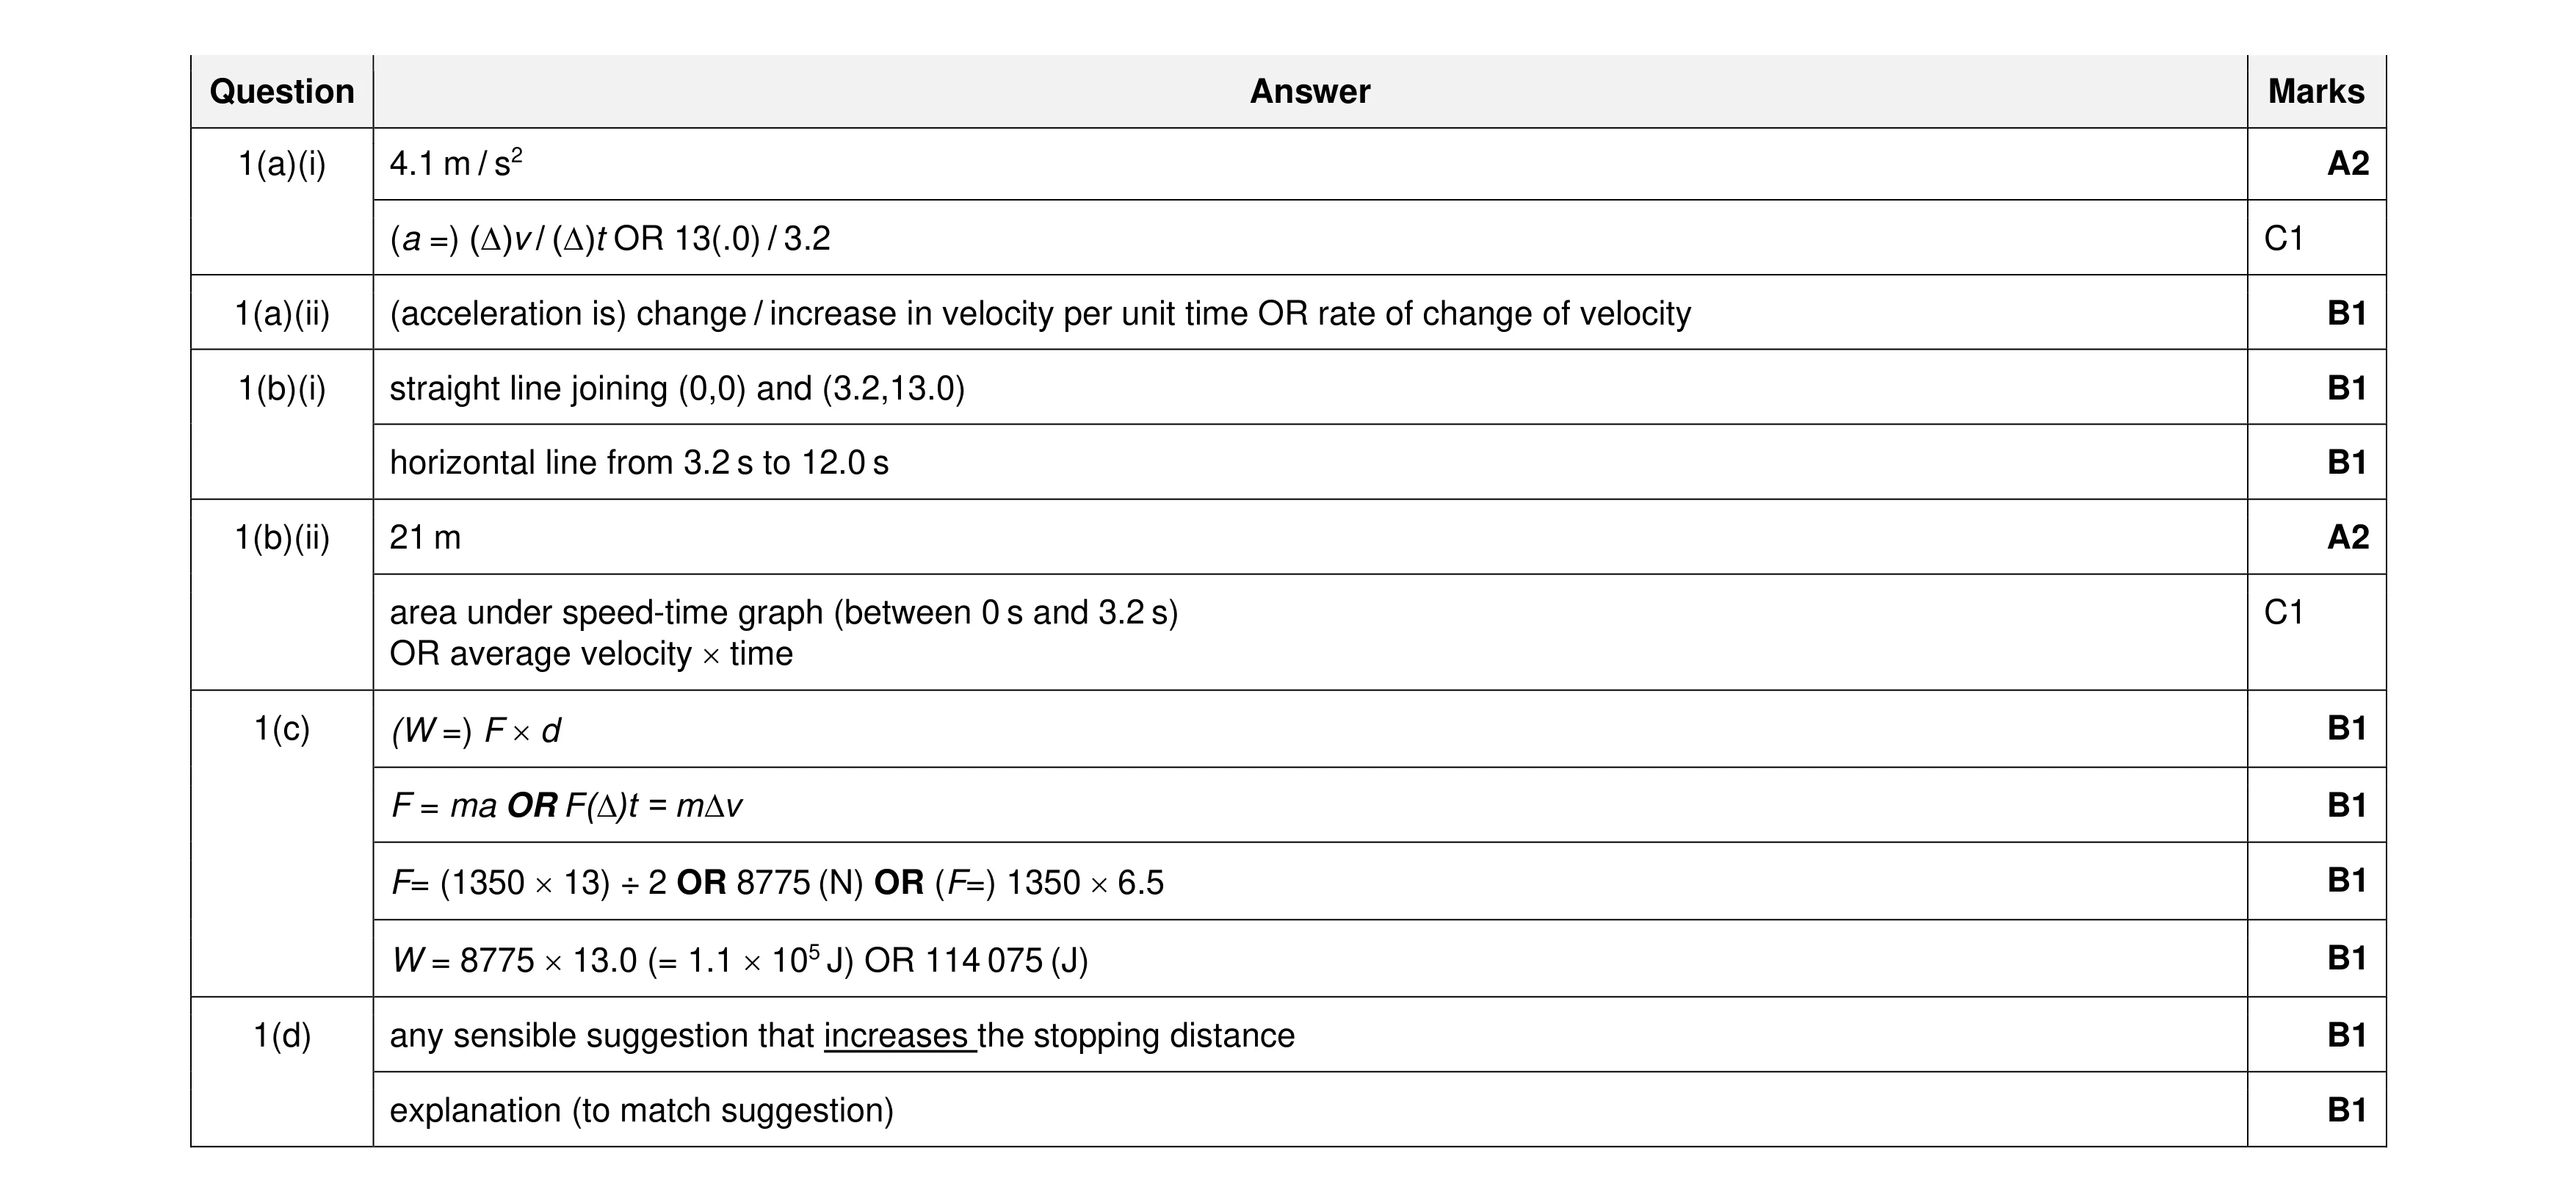 13
13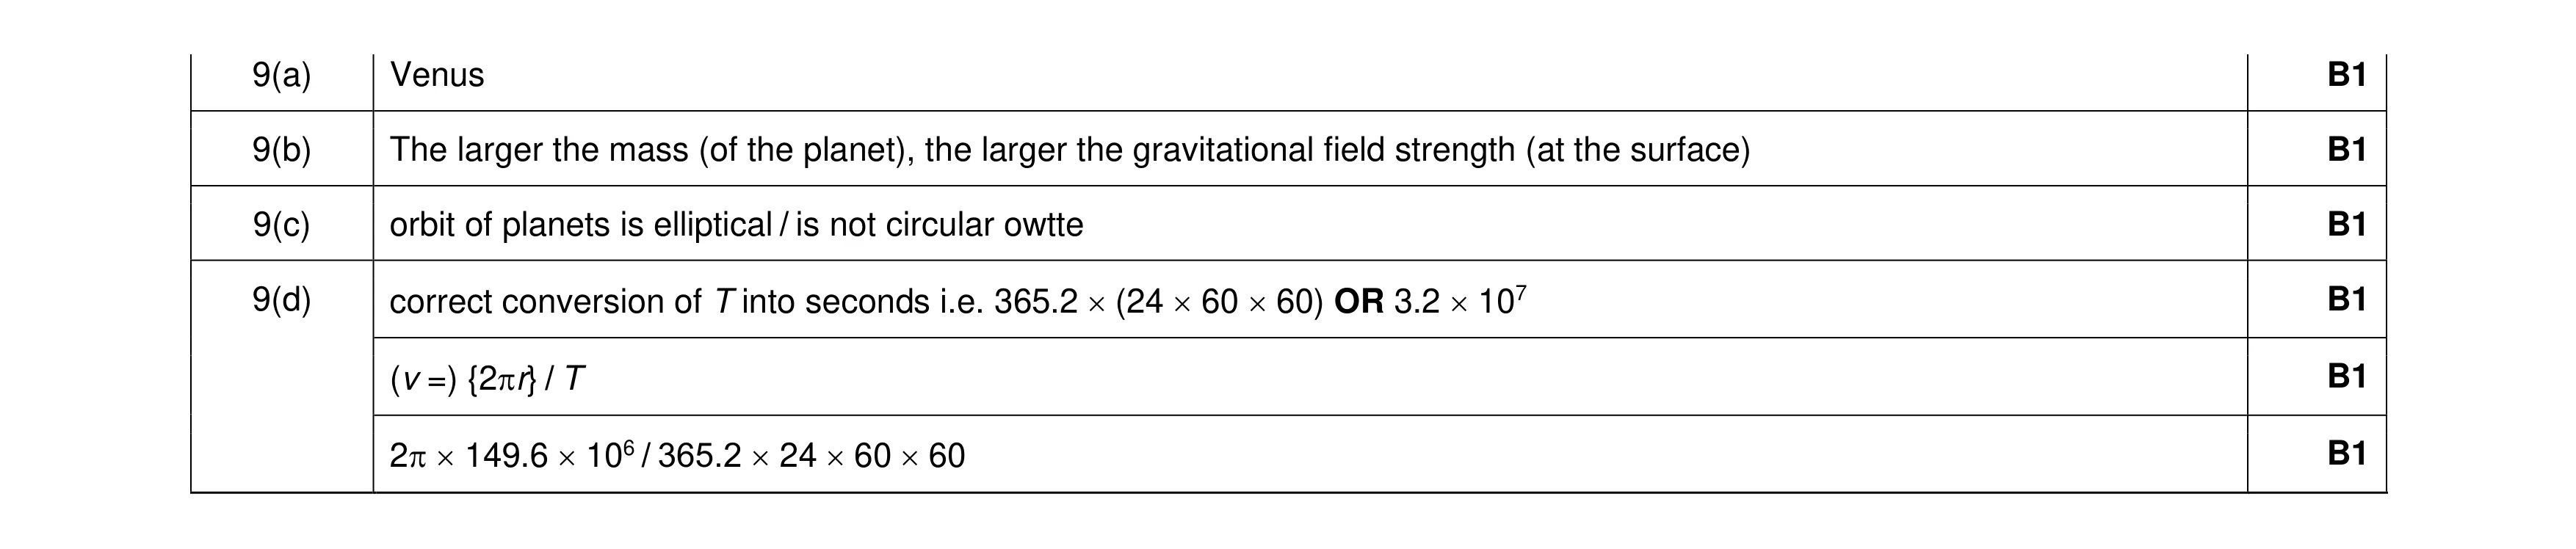 6
6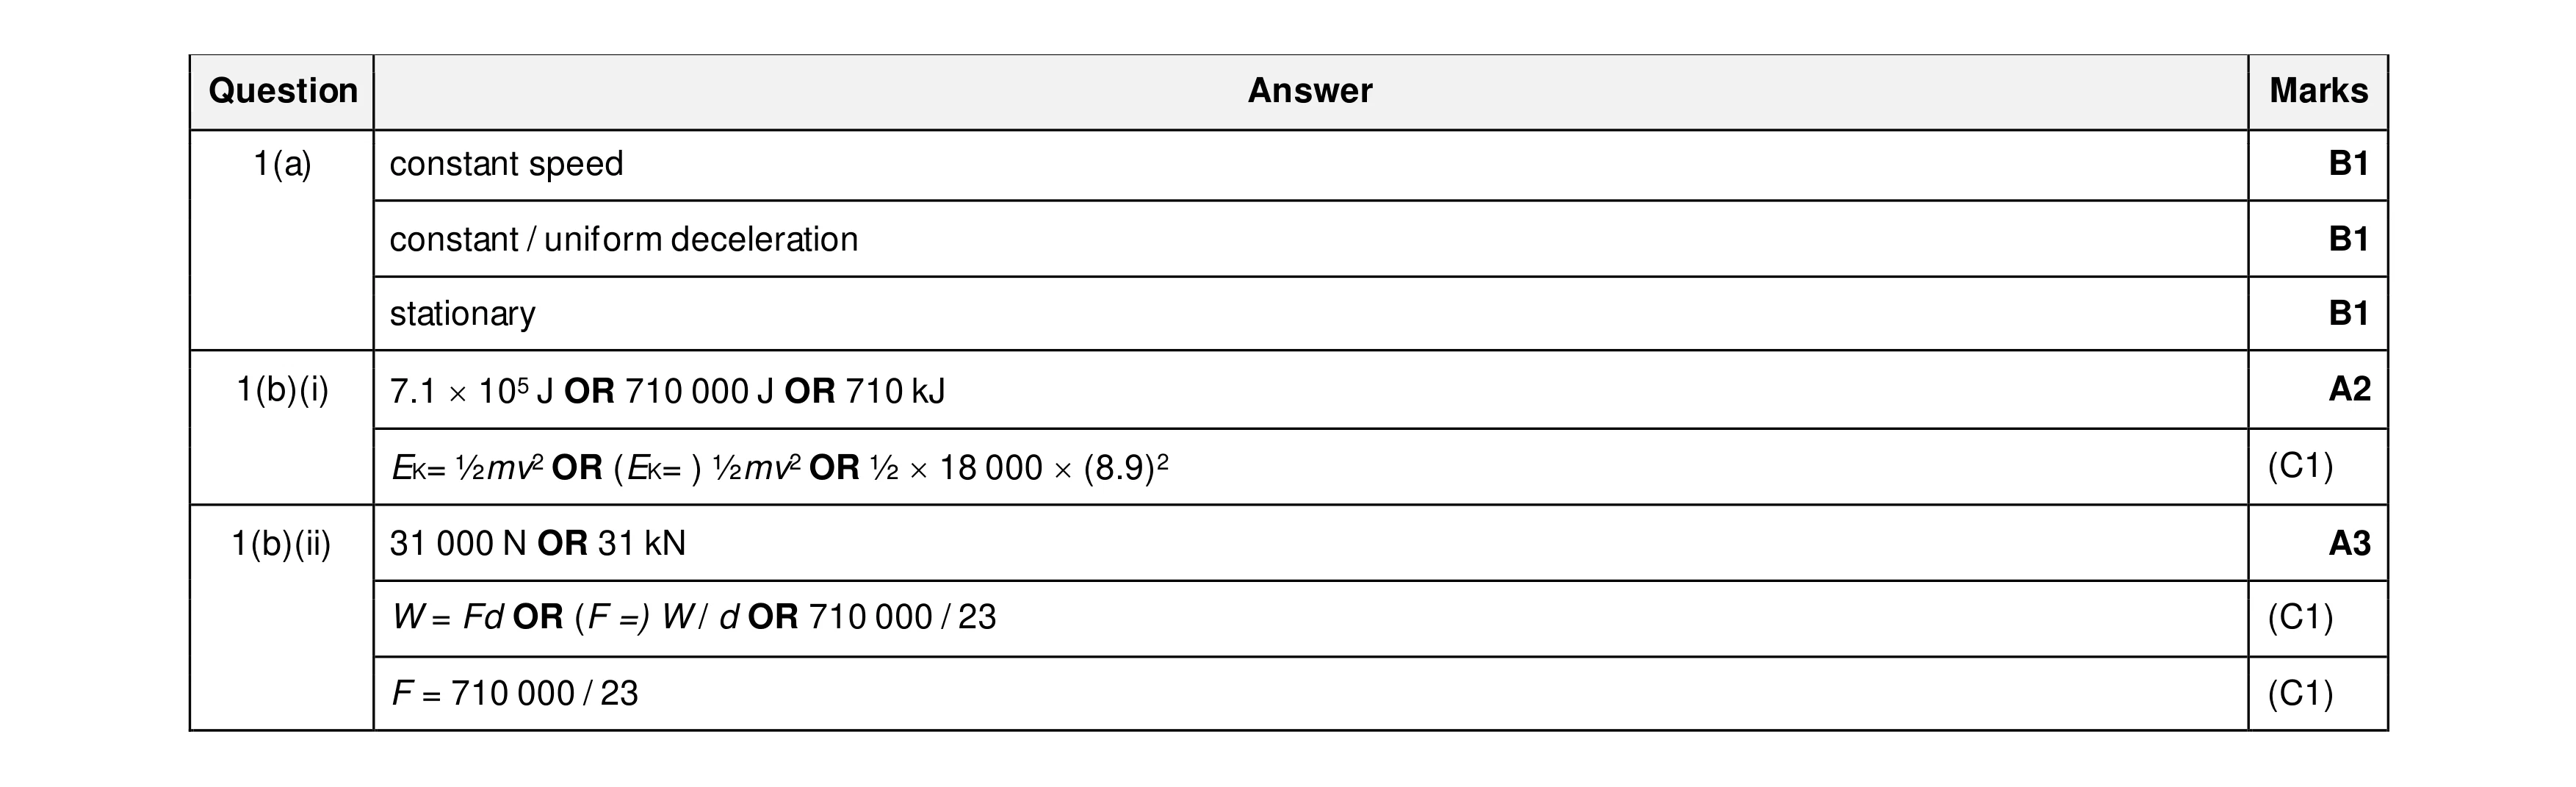 8
8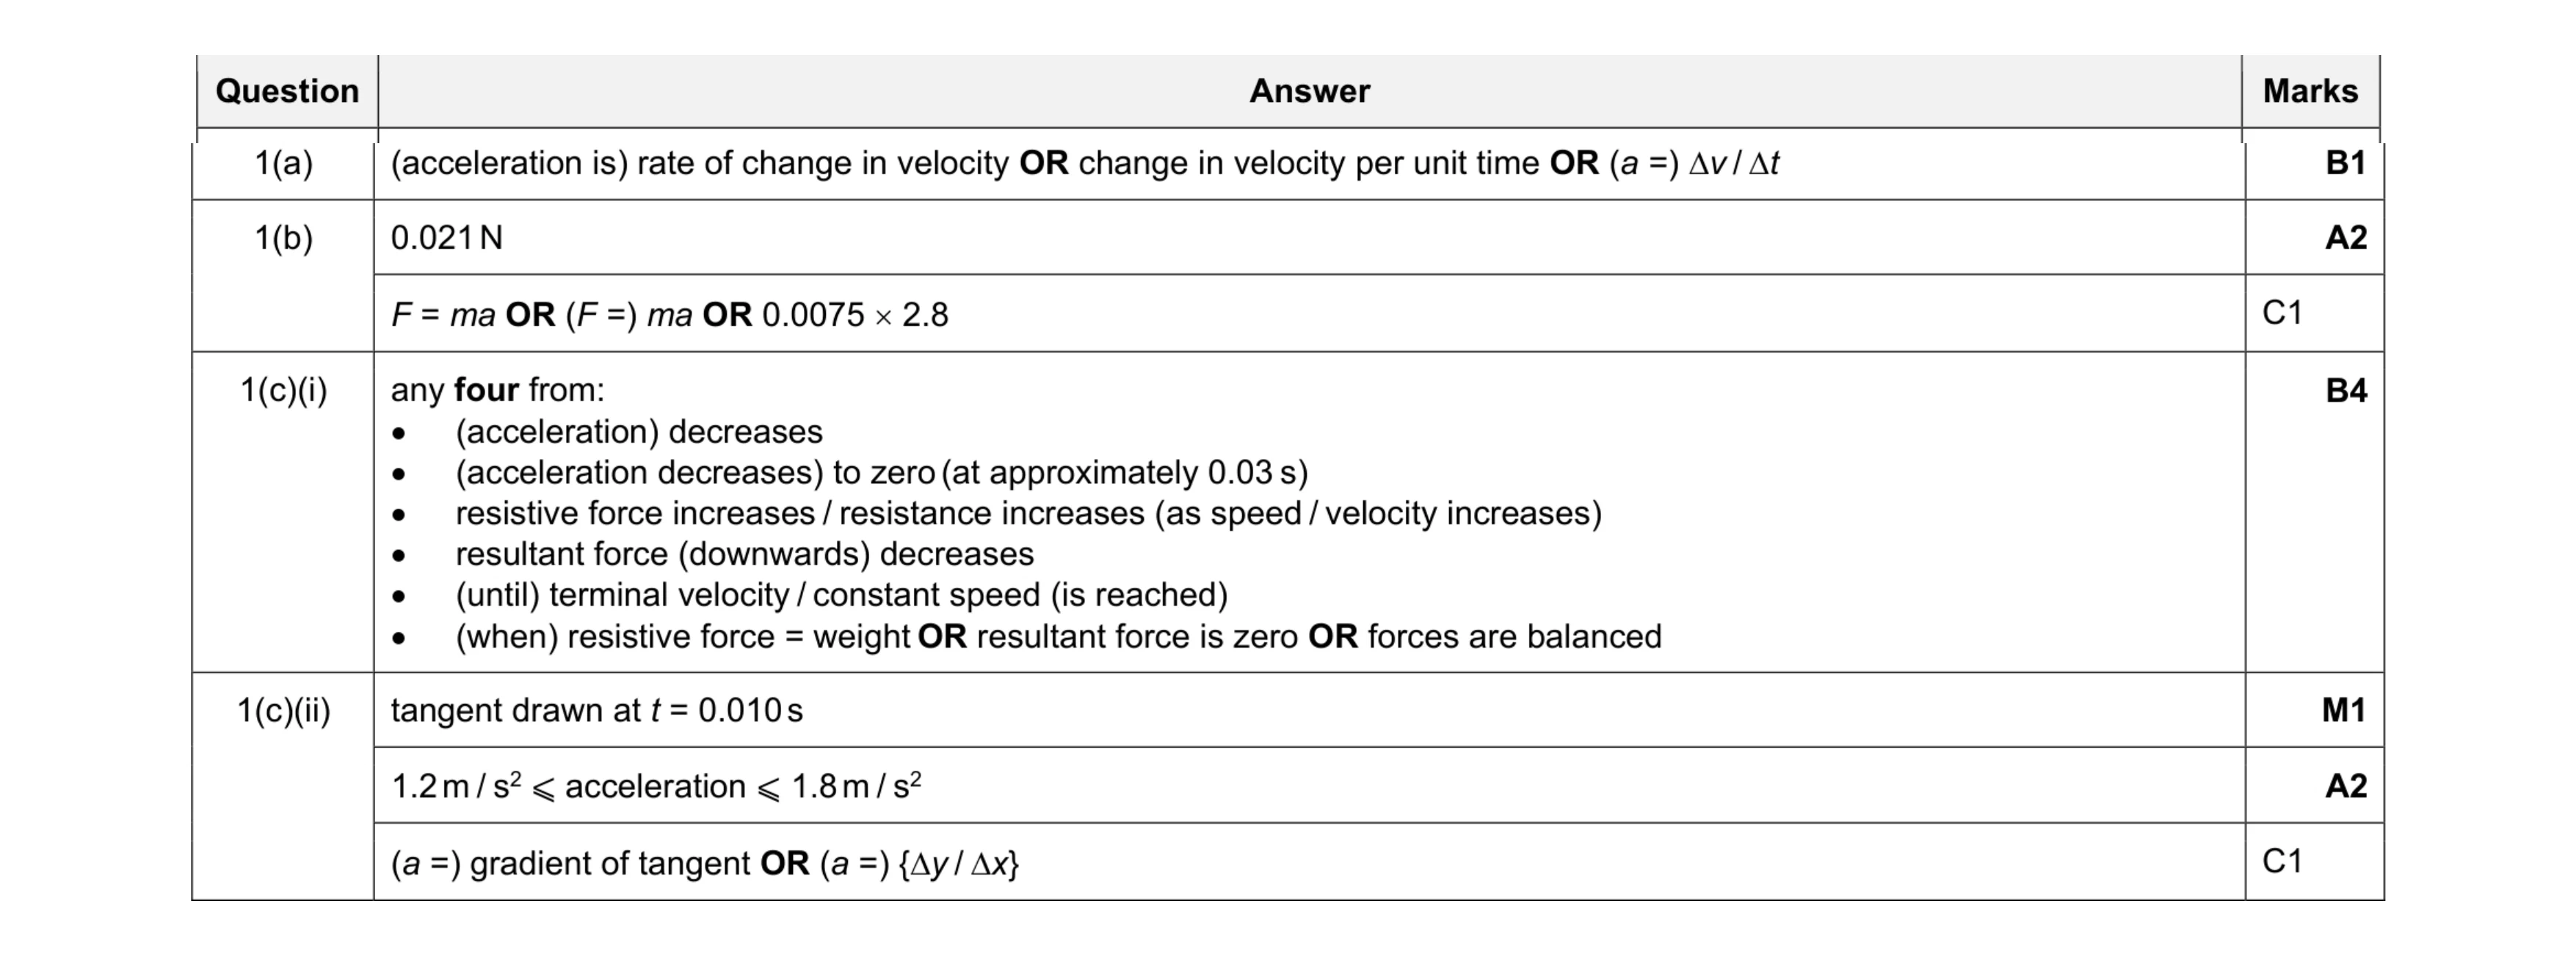 10
10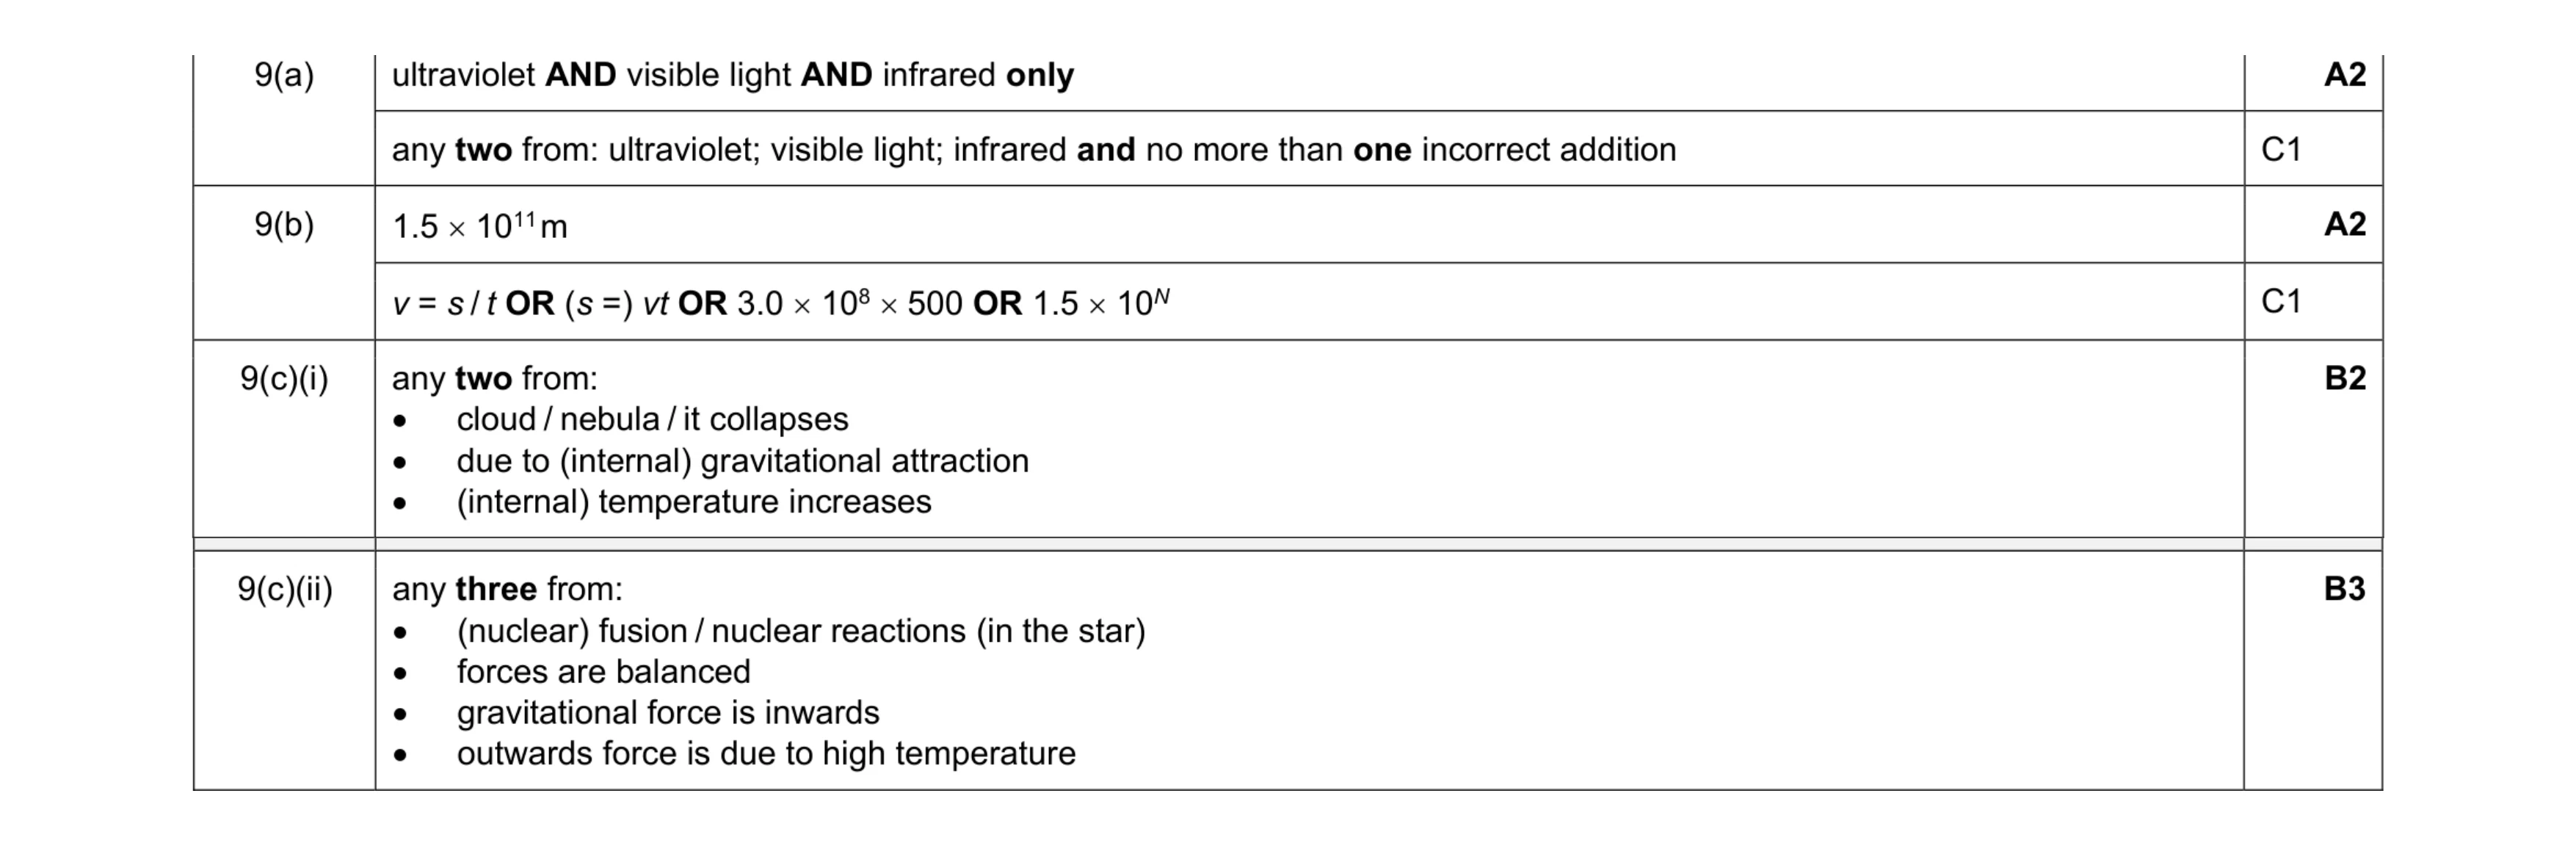 9
9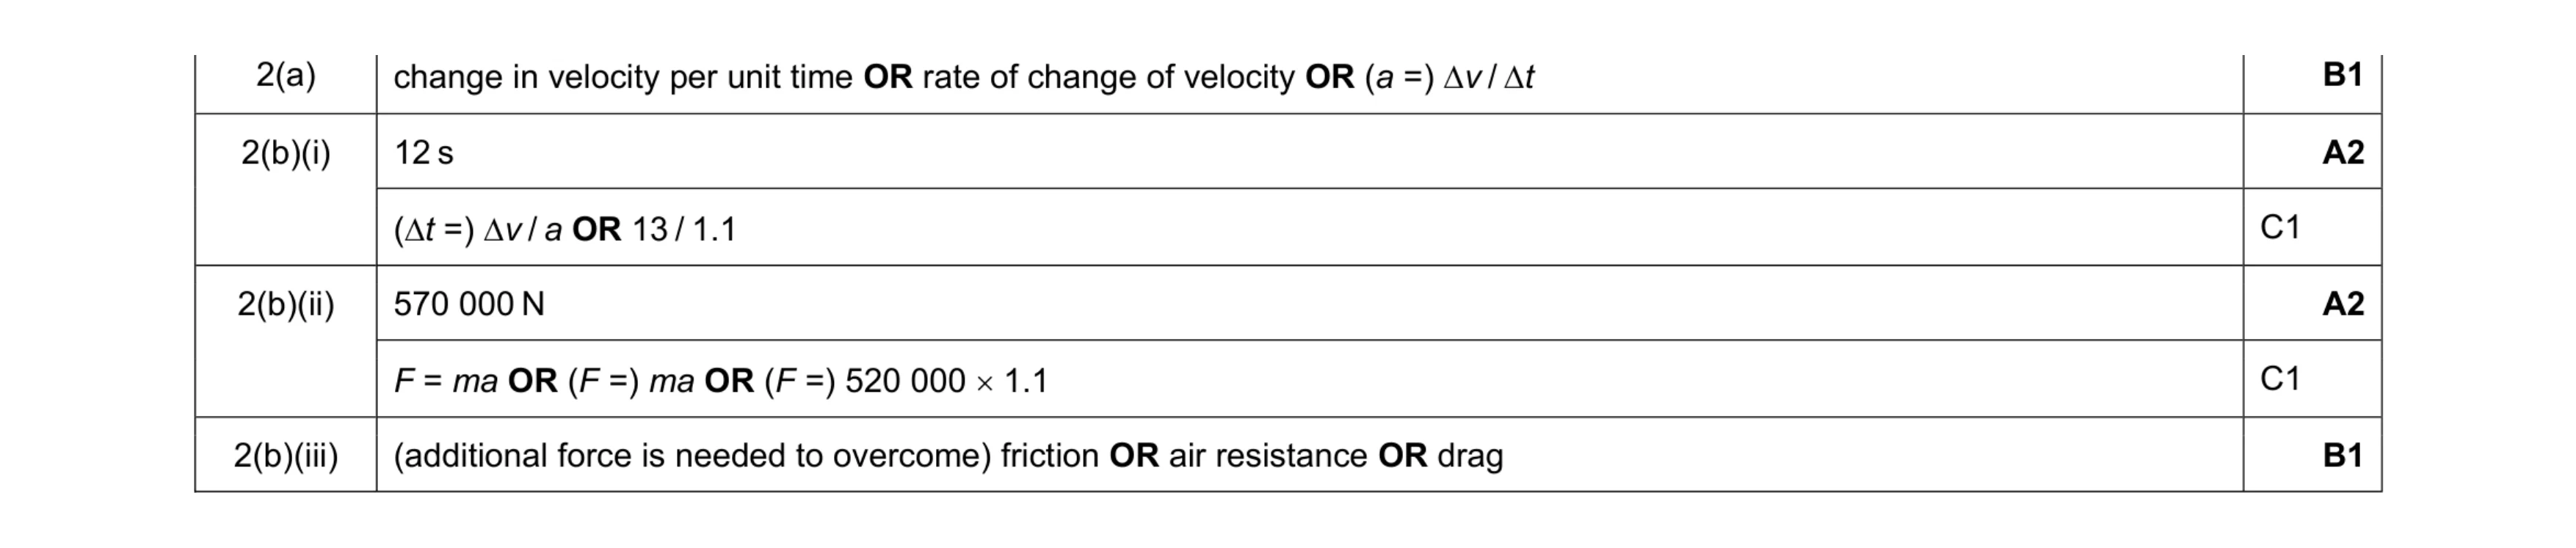 6
6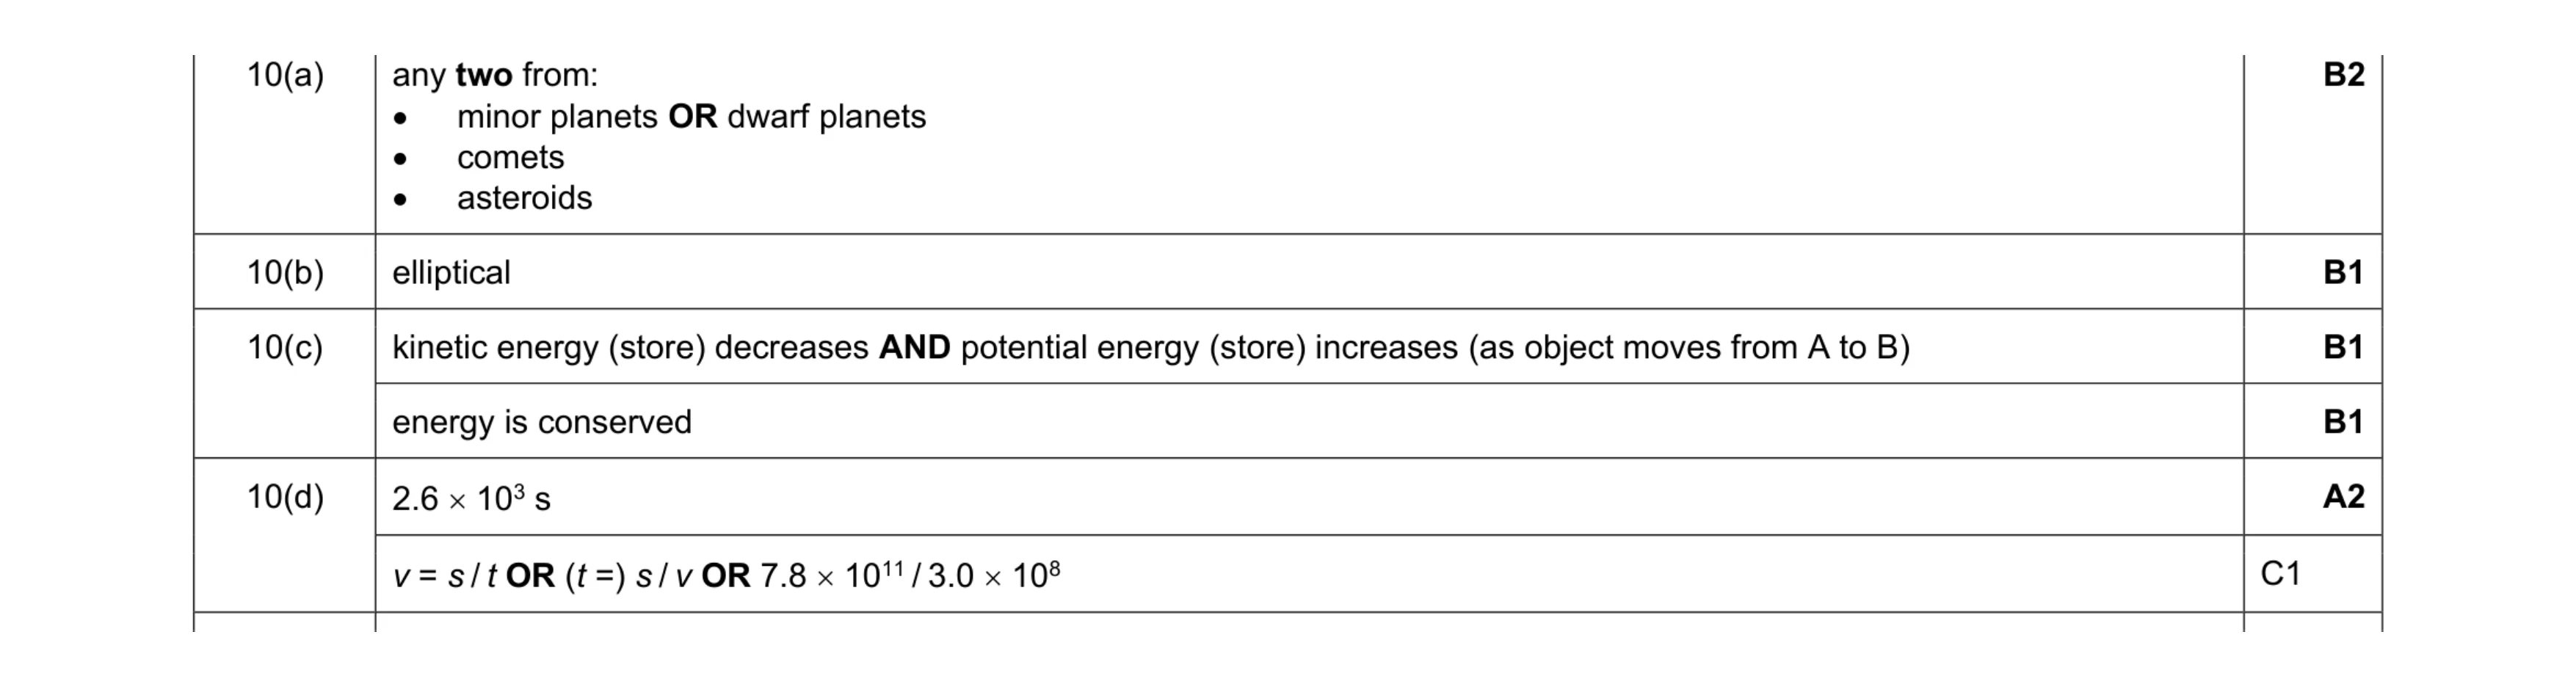 7
7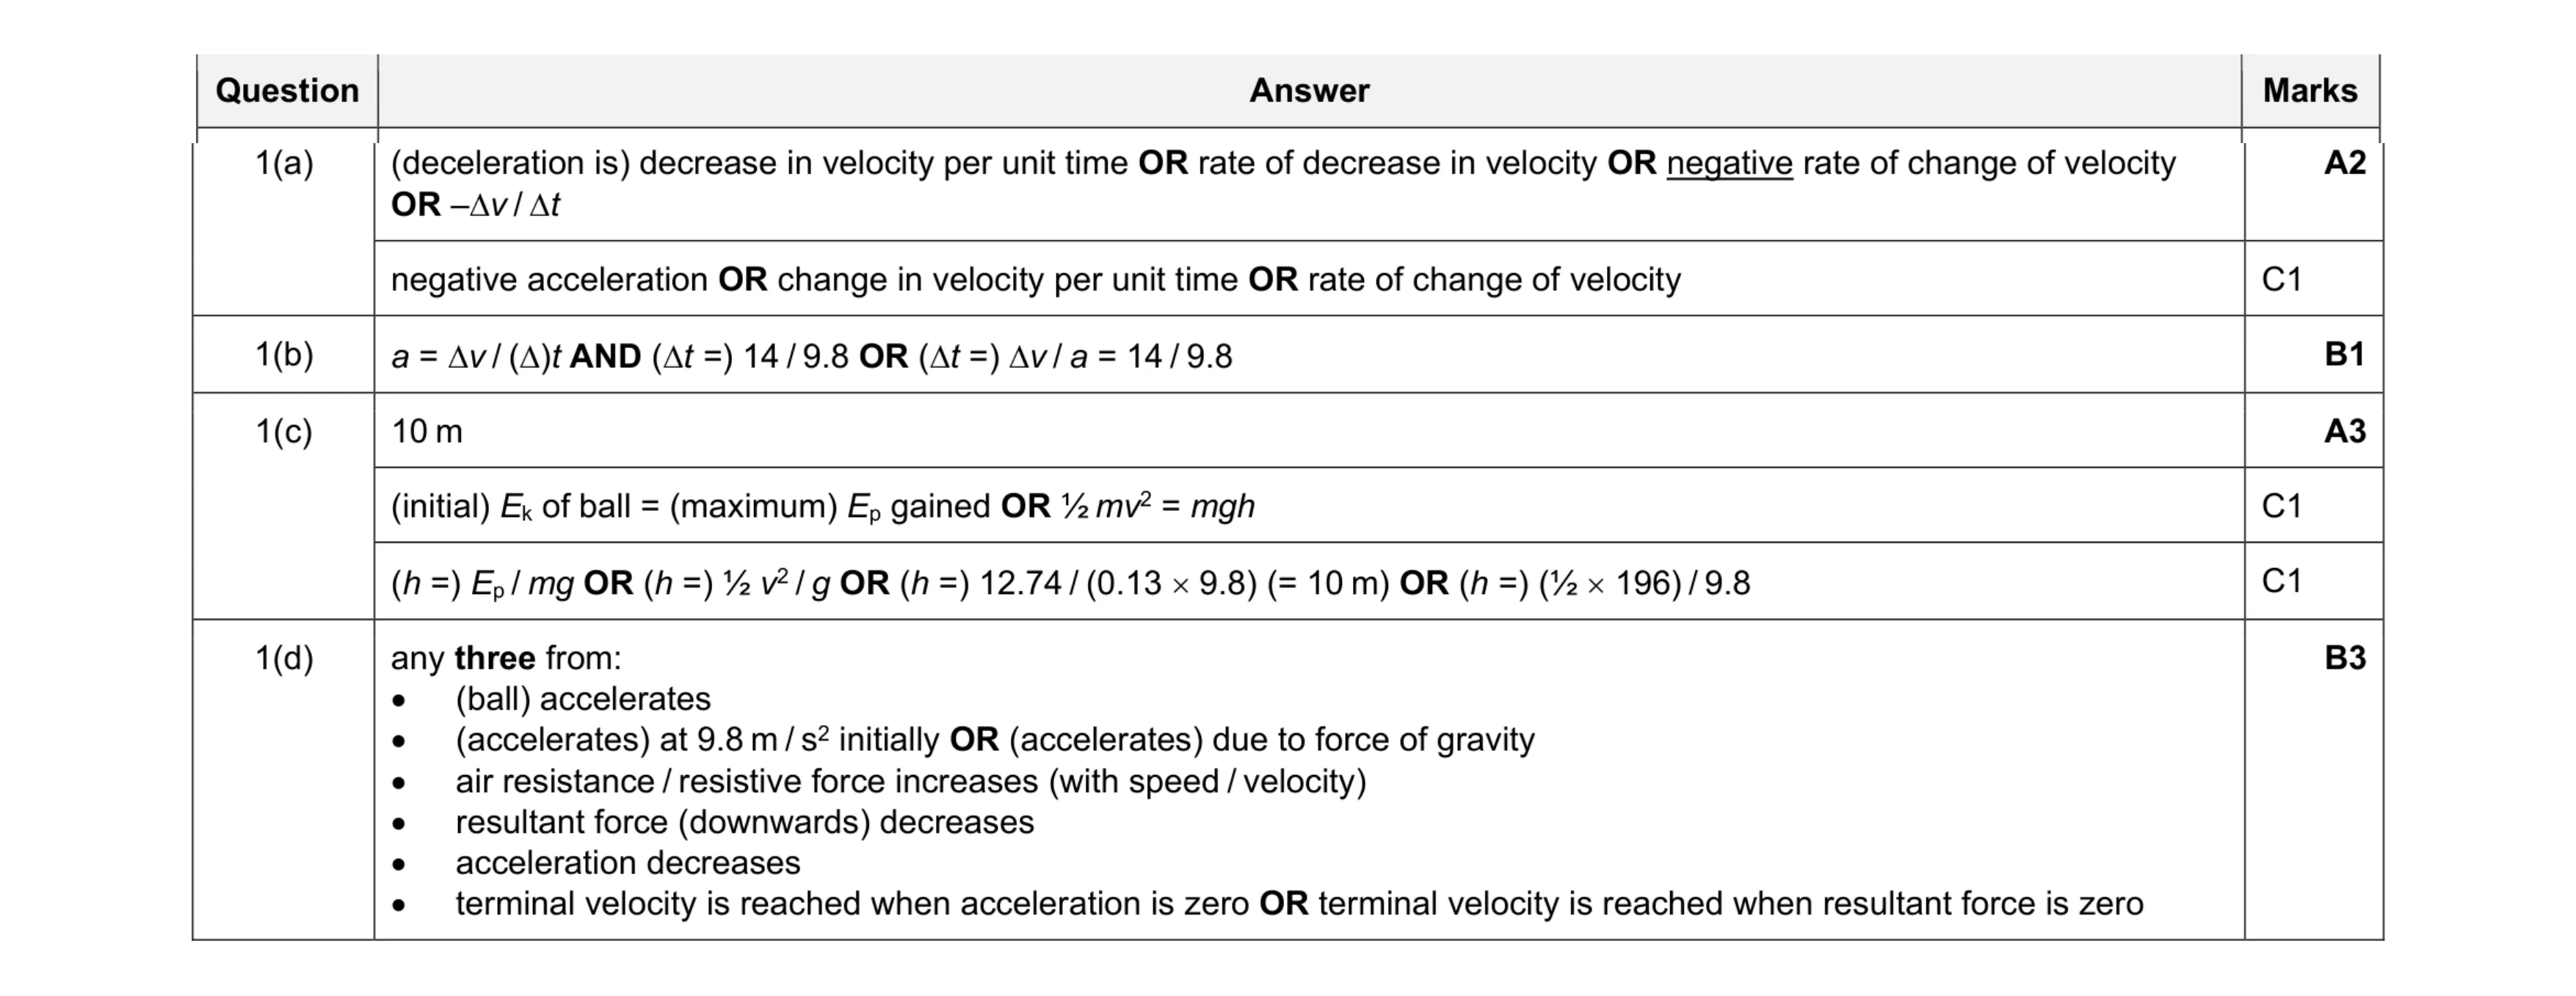 9
9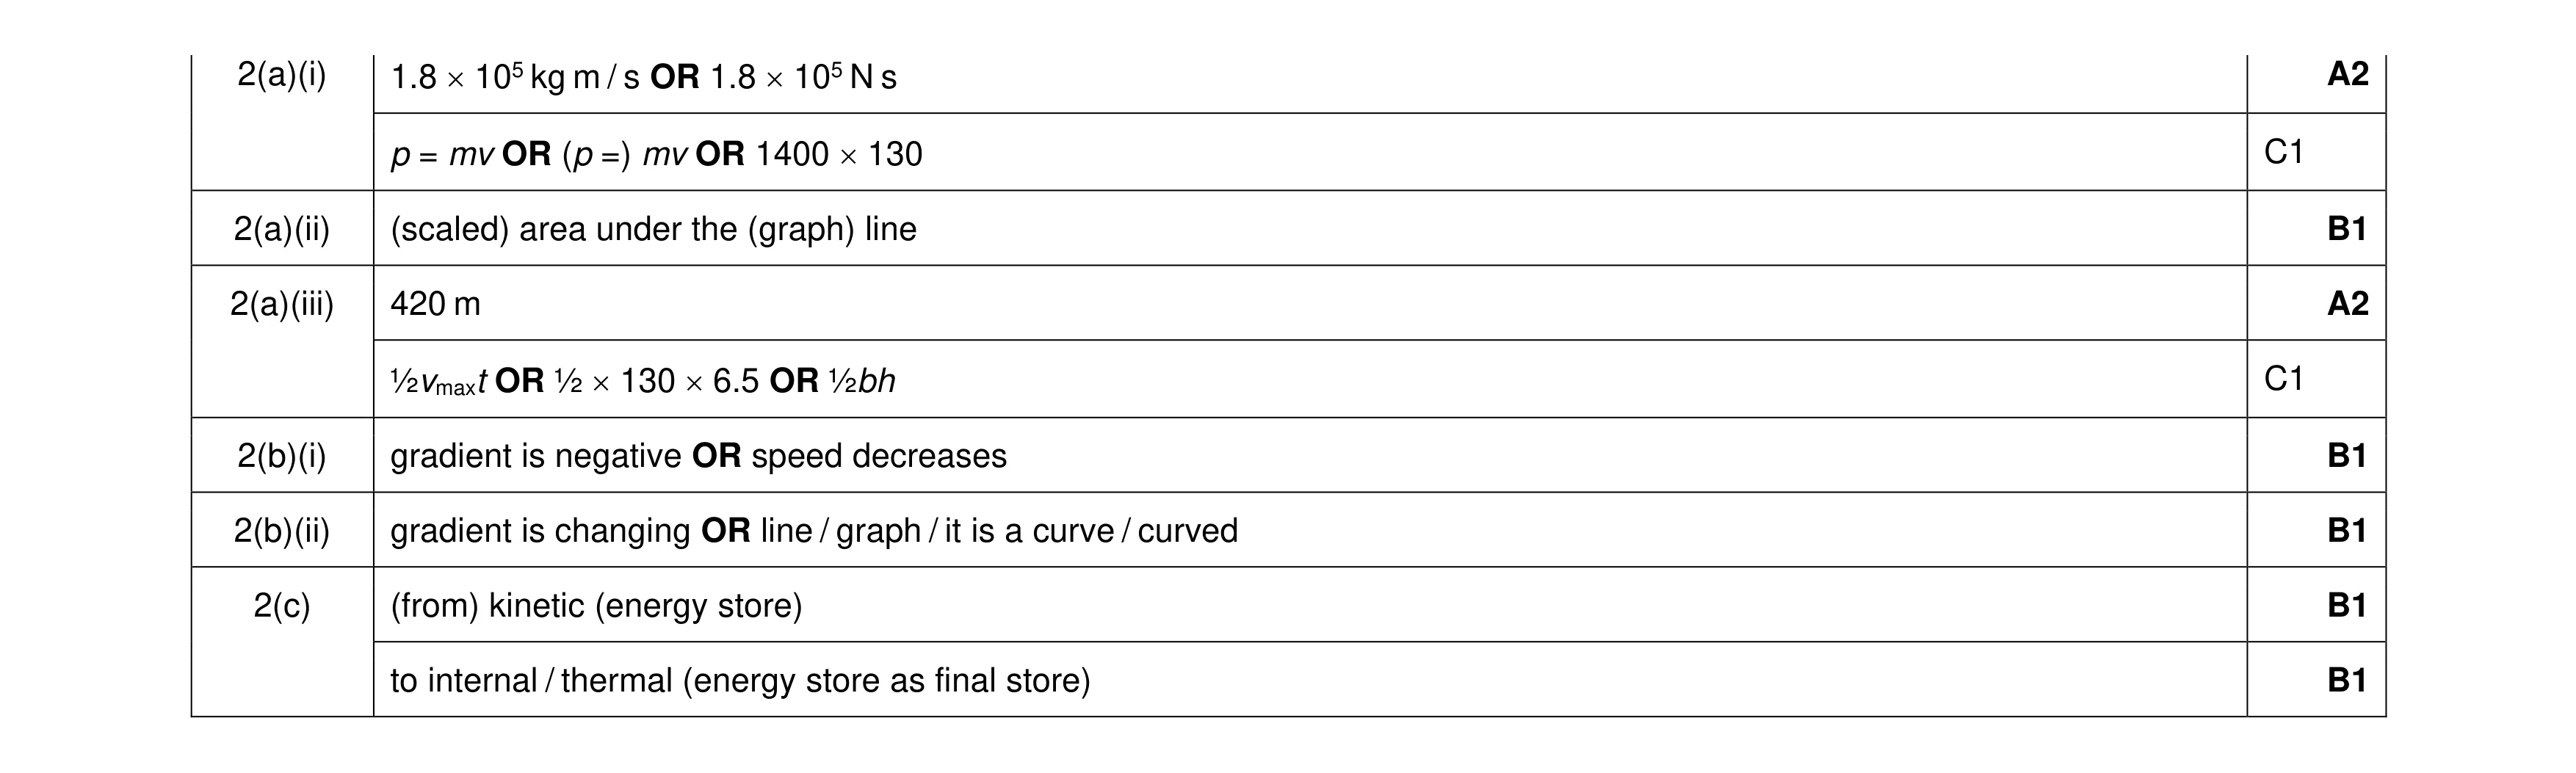 9
9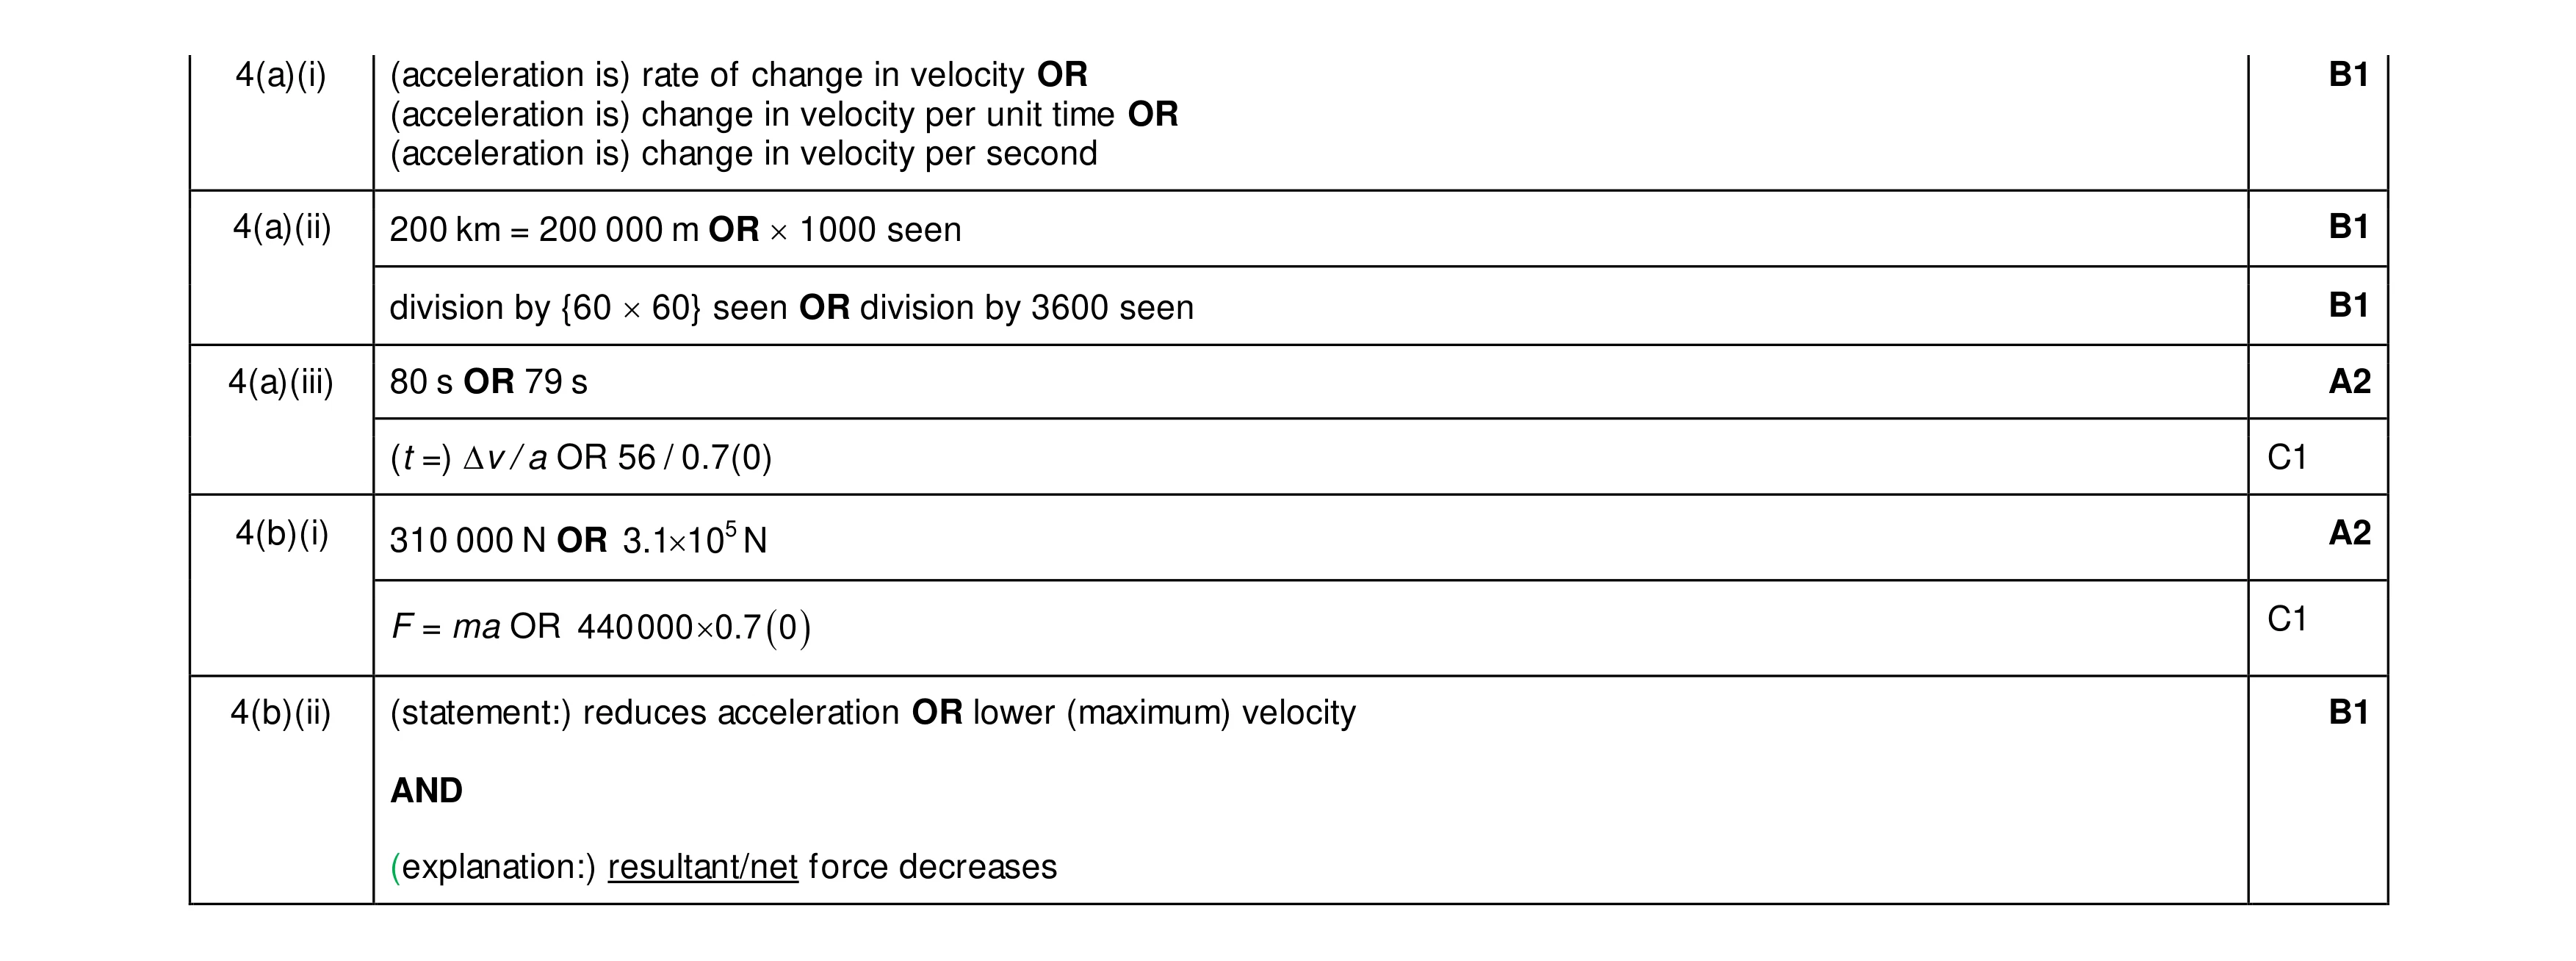 8
8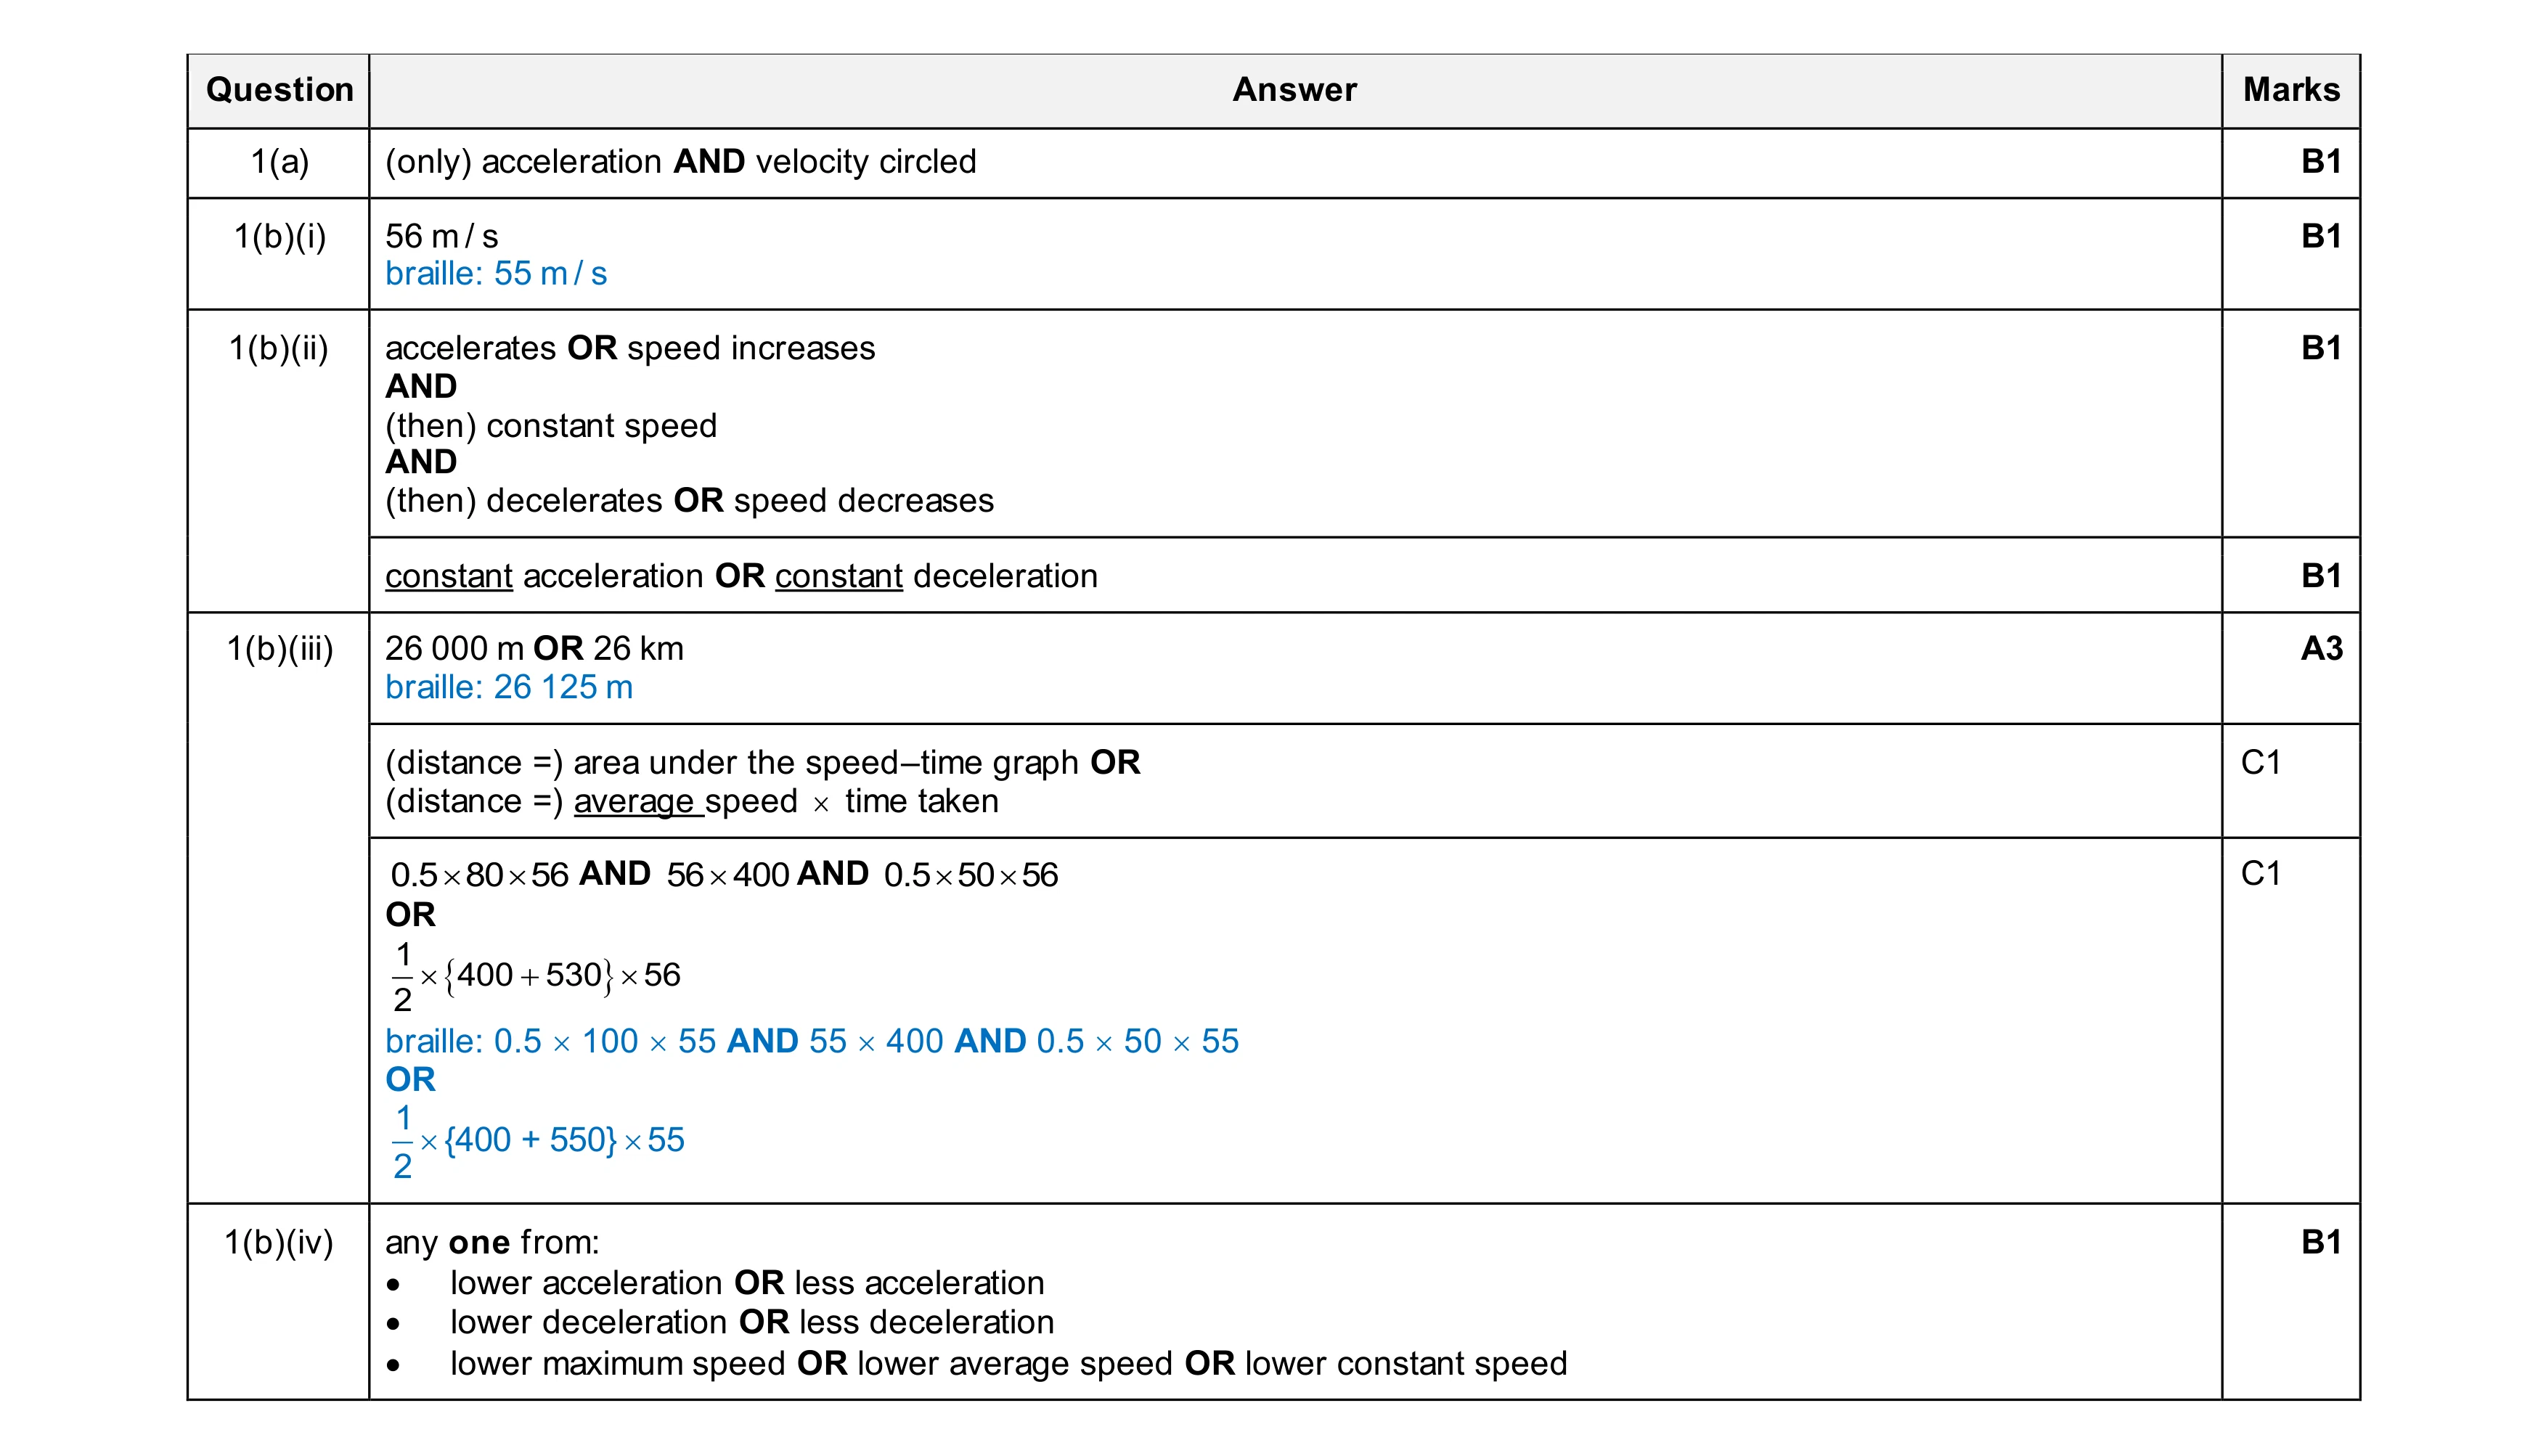 8
8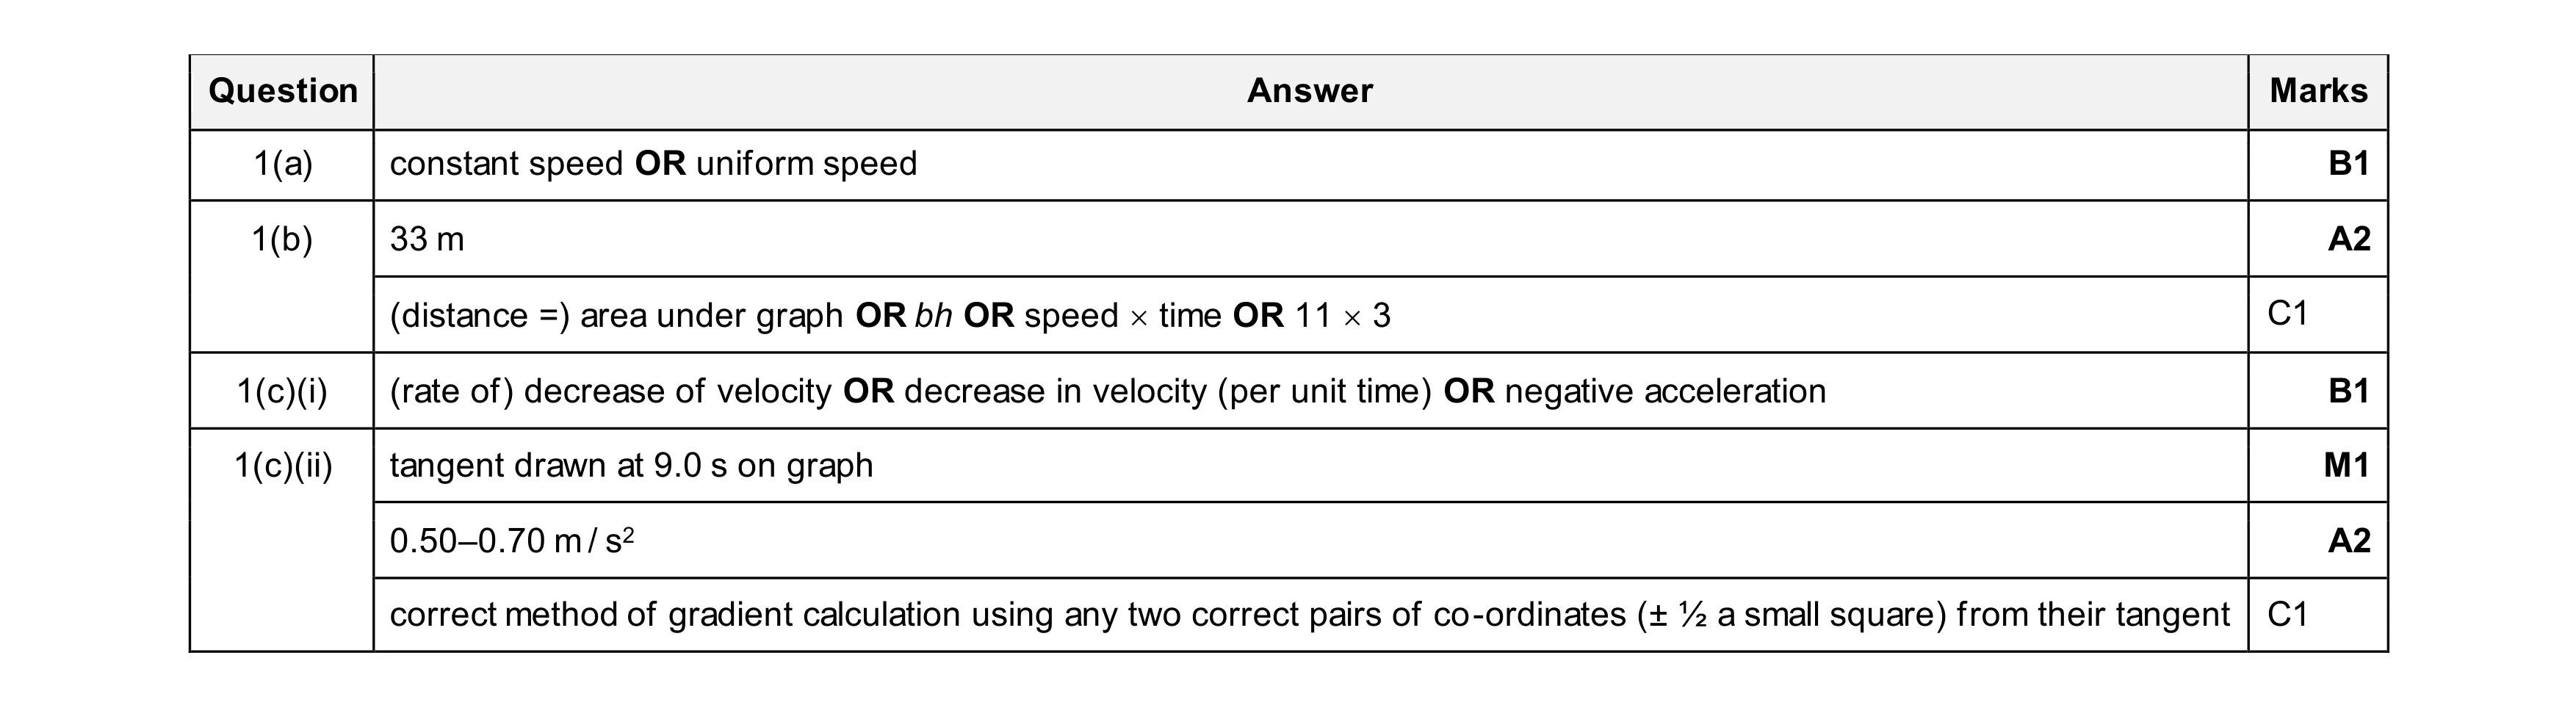 7
7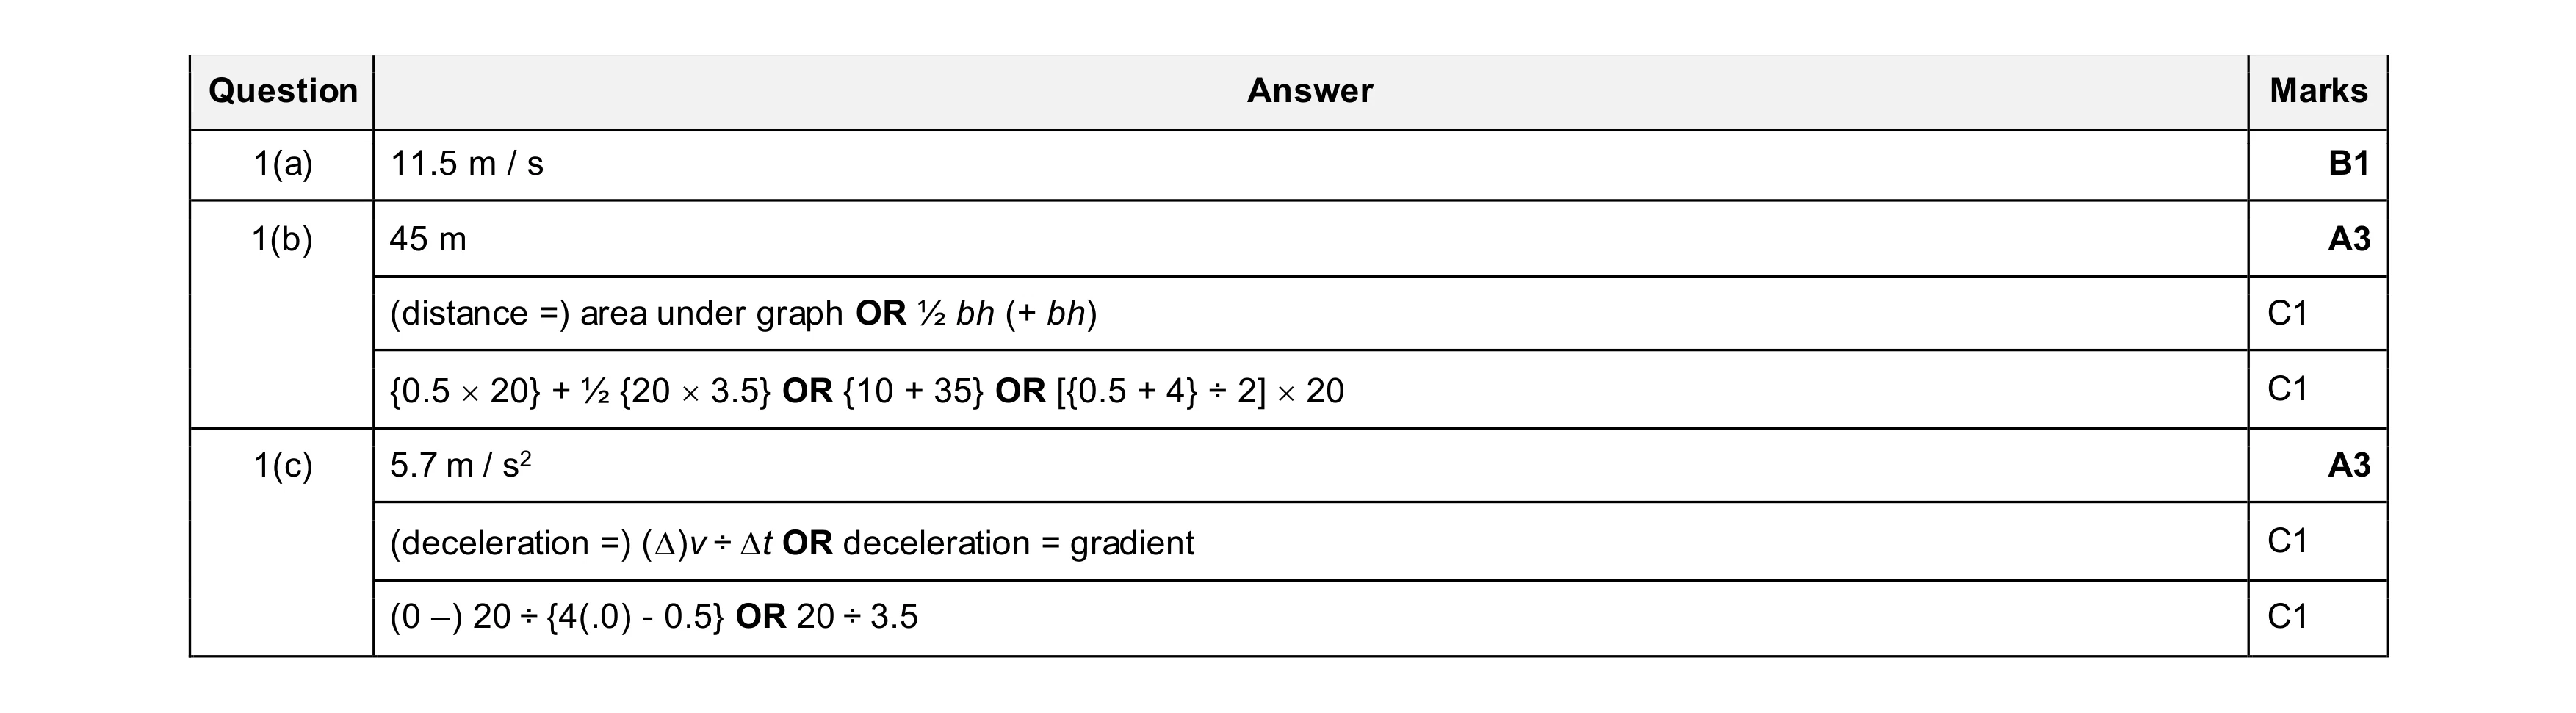 7
7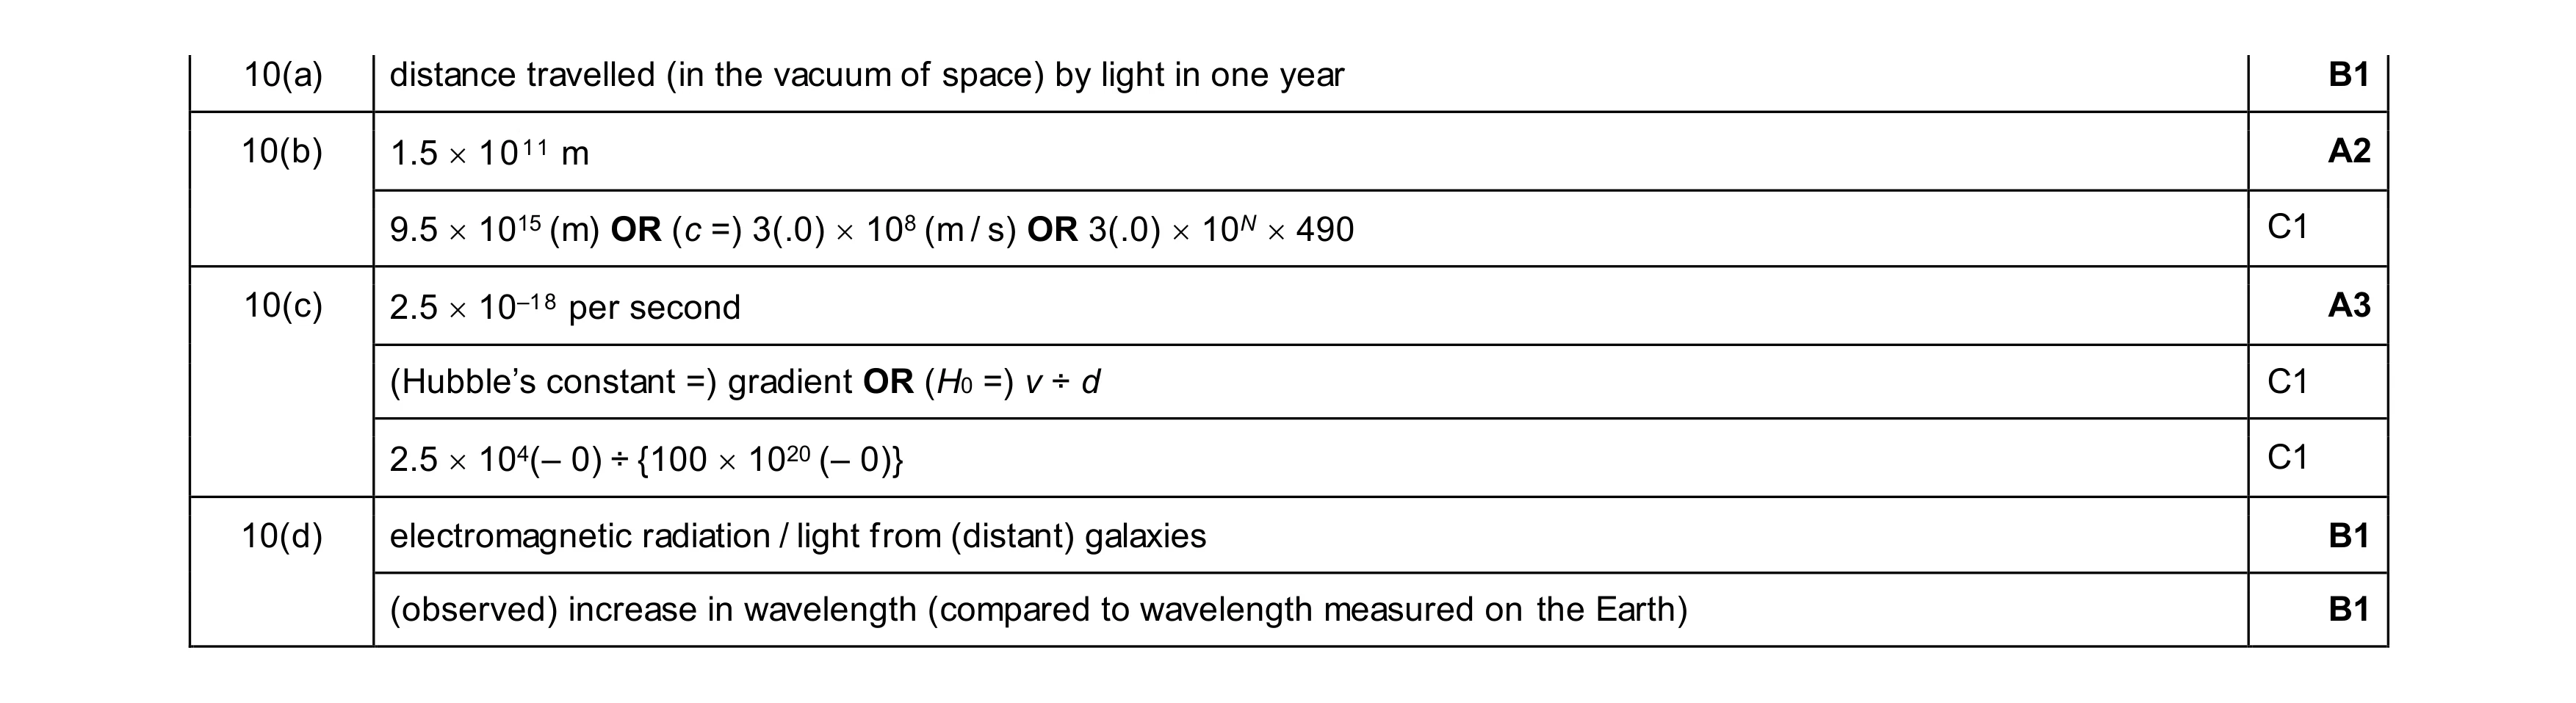 8
8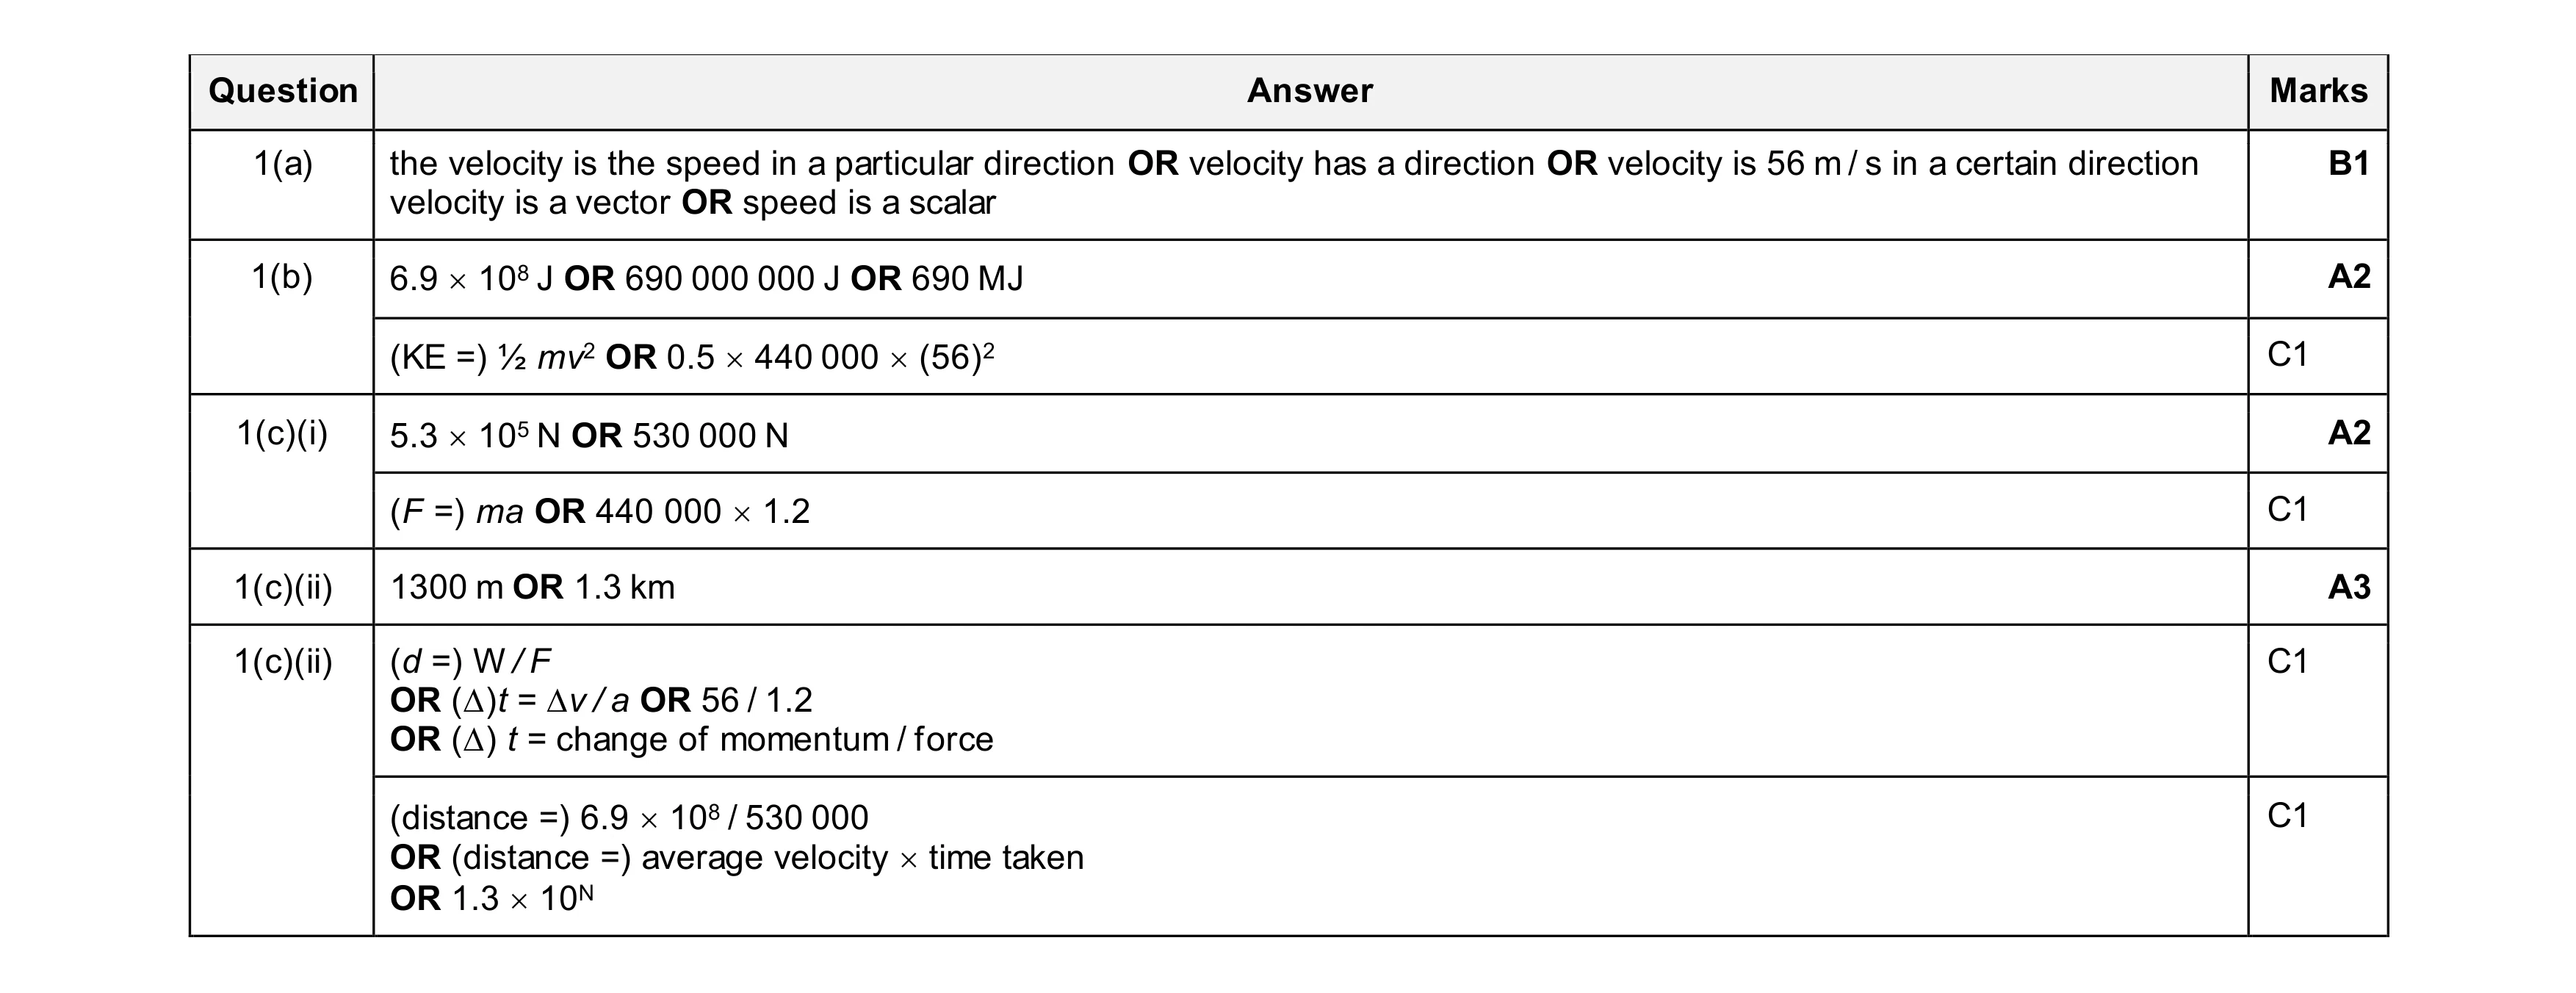 8
8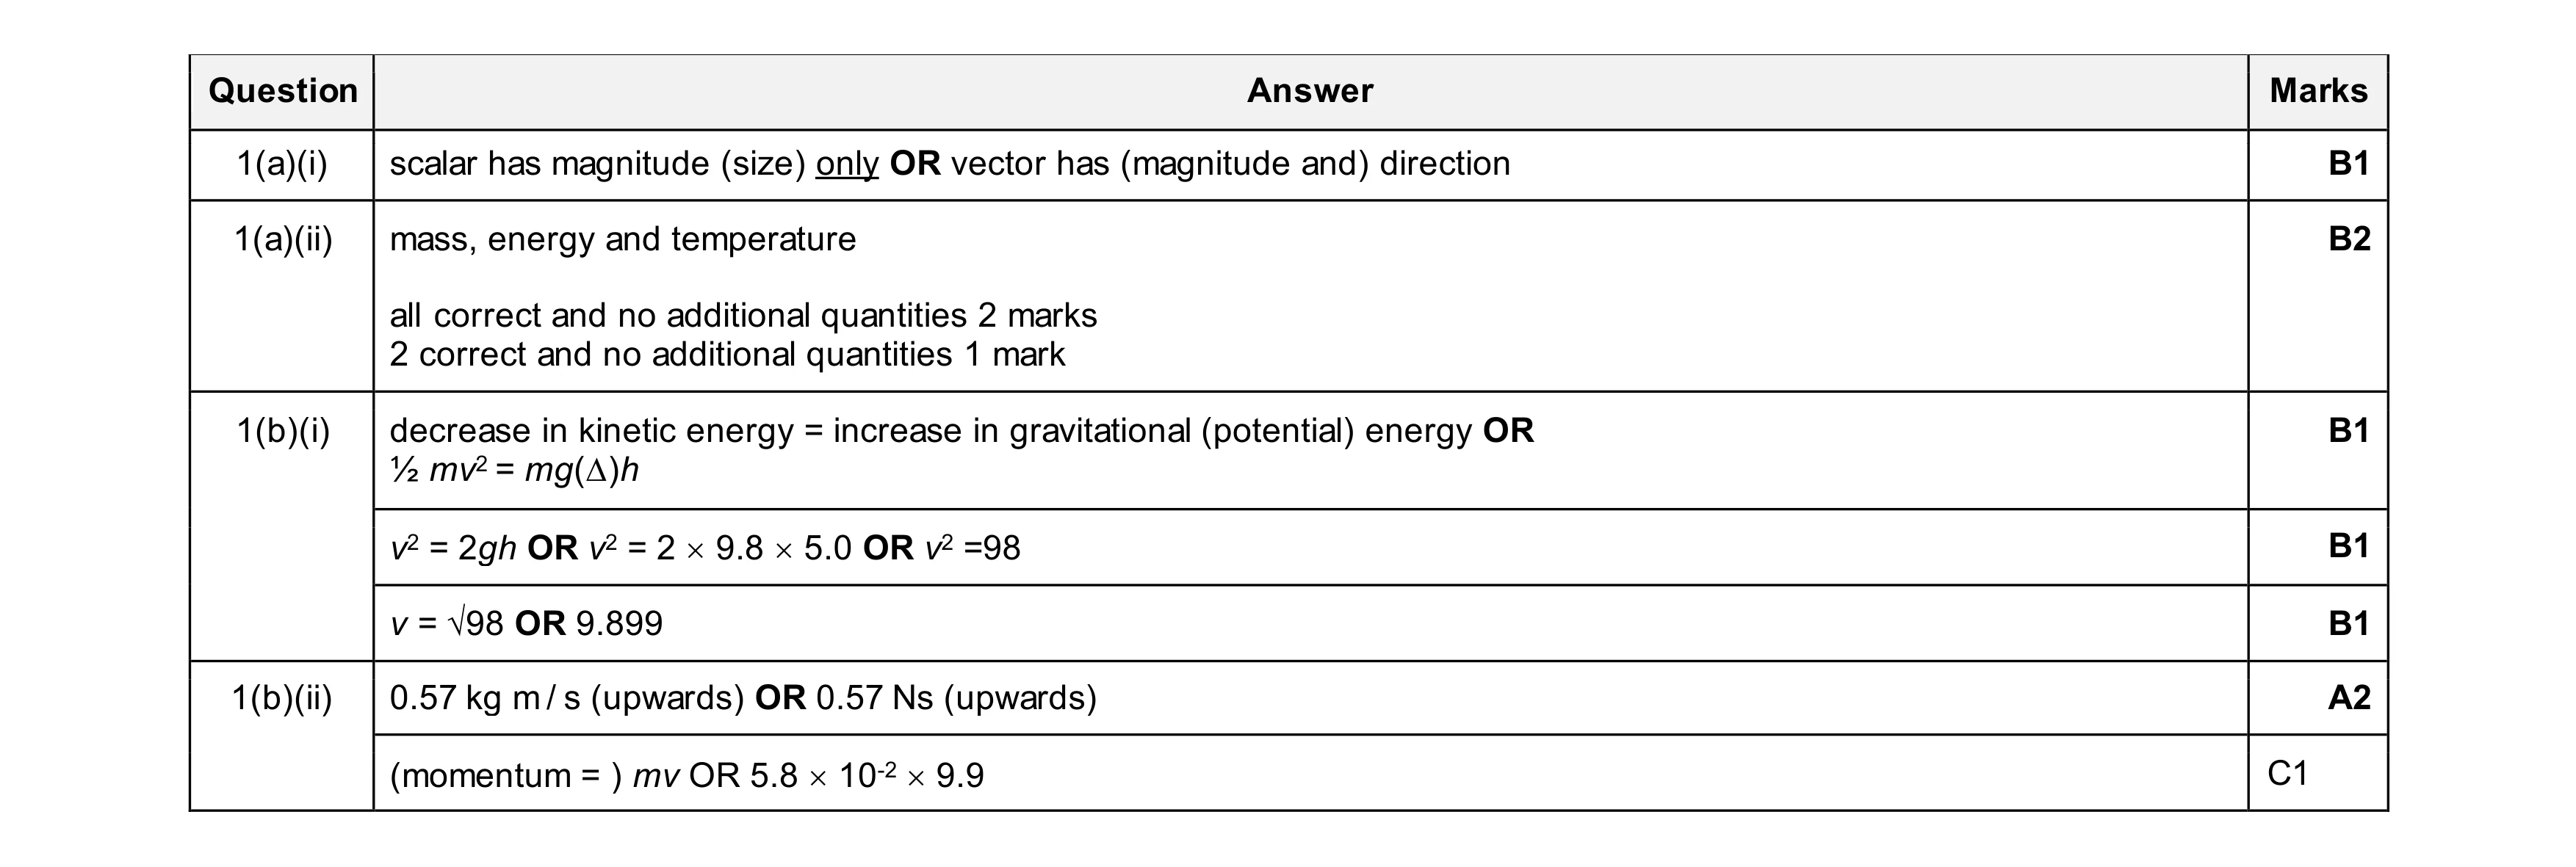 8
8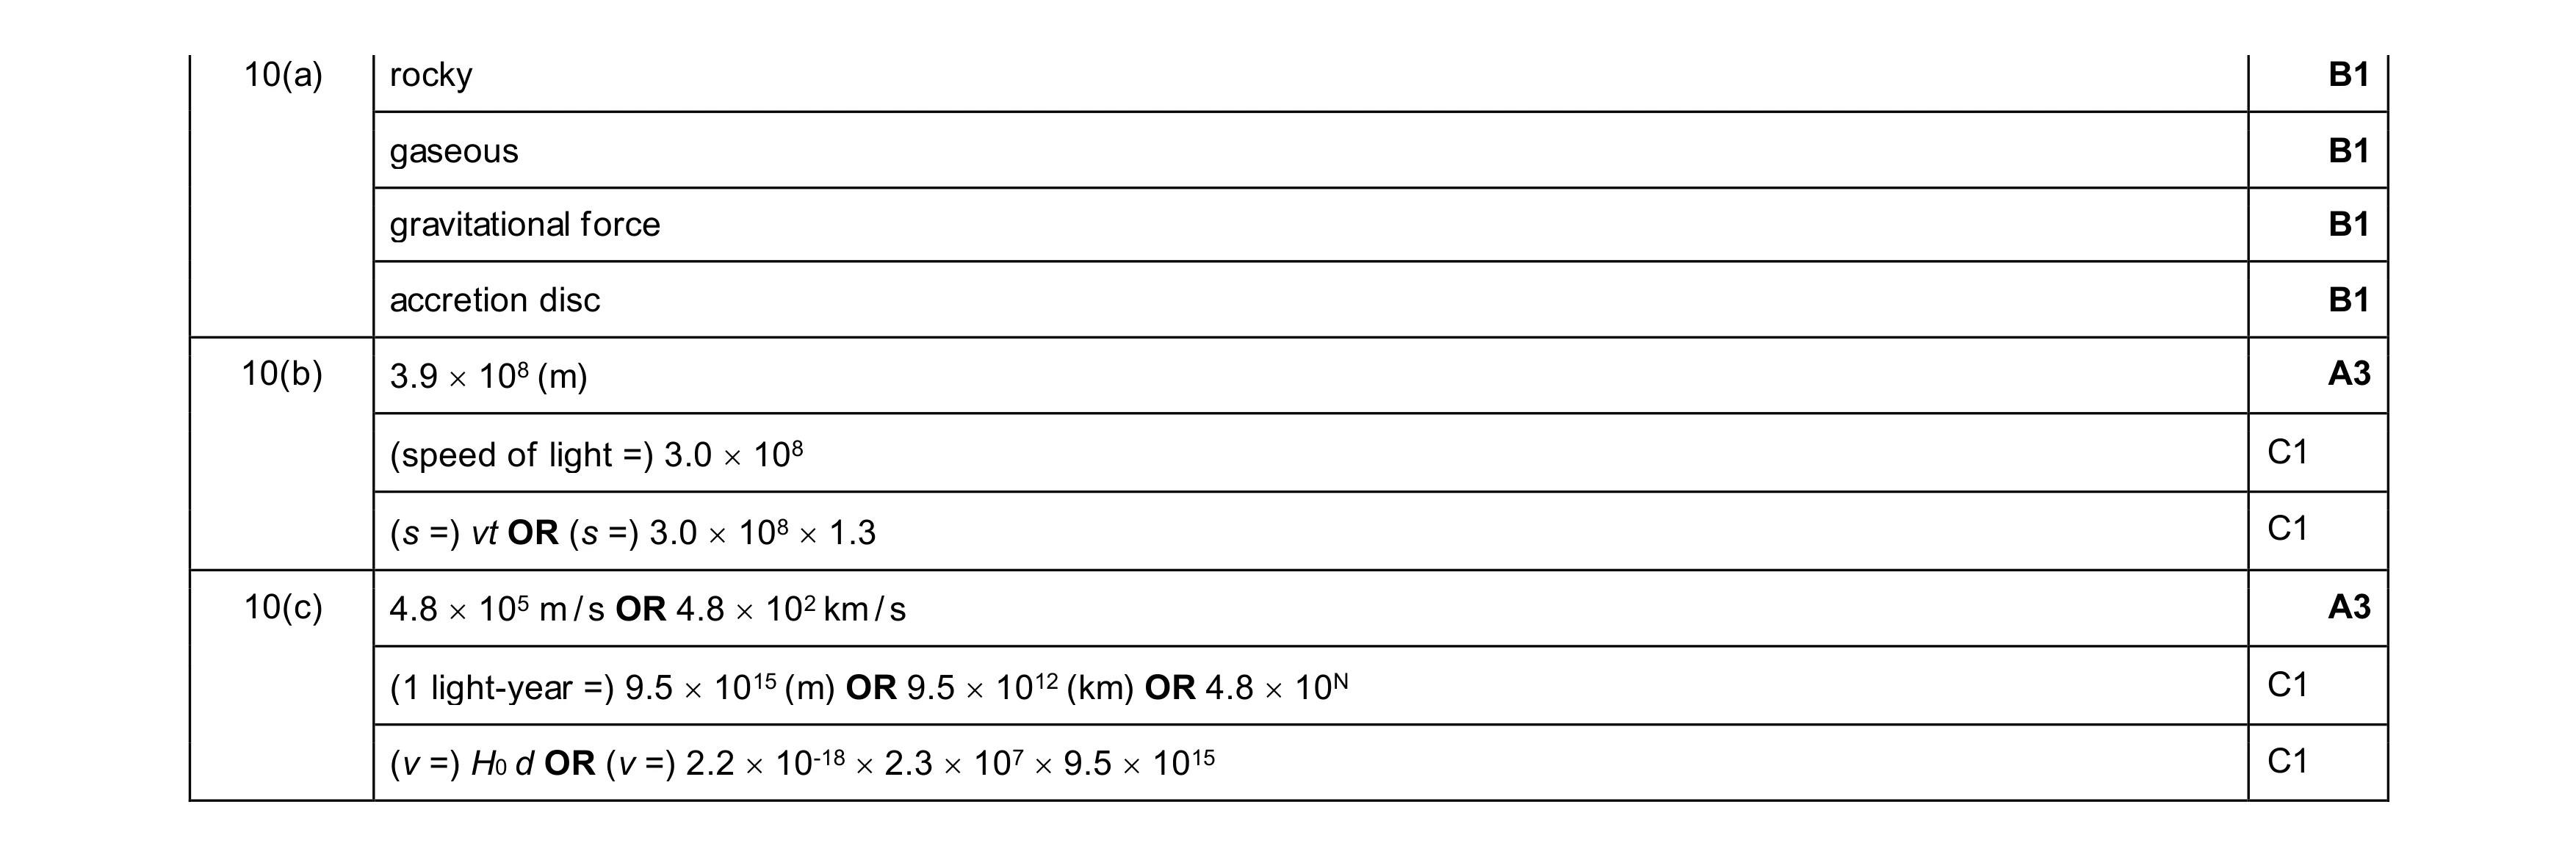 10
10