Cambridge IGCSE Physics 0625 — 2018 Oct/Nov Paper 3 · Variant 1
0625/31/O/N/18 · 12 questions · 80 marks · ≈90 min
The question paper and its mark scheme, free to read here and free to download. This is Cambridge’s own paper, exactly as it was sat.
Question paper16 pages

Mark scheme13 pages
Answers below. Sit the paper first if you are practising.
Questions as text
Q1 · A speed-time graph for a student who is running
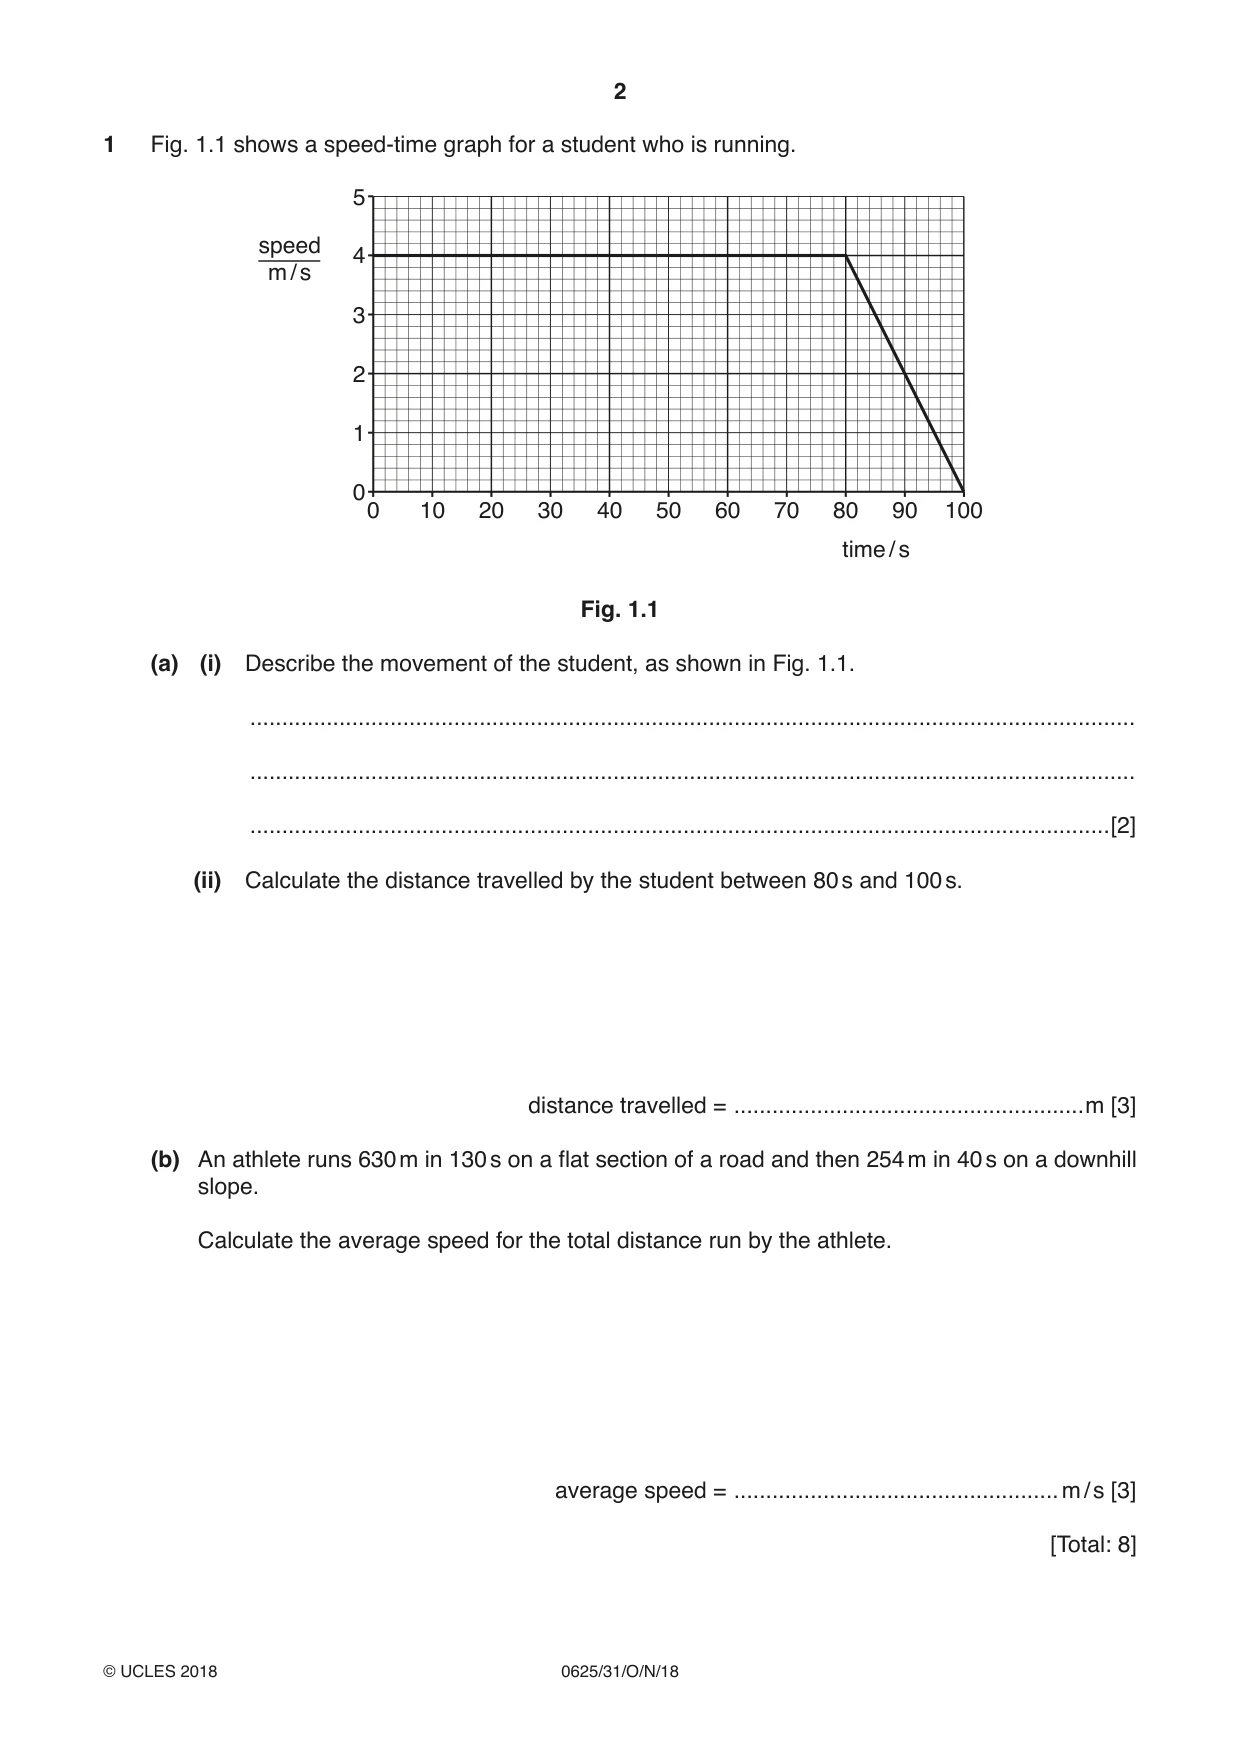
1 Fig. 1.1 shows a speed-time graph for a student who is running. 5 speed 4 m / s 3 2 1 00 10 20 30 40 50 60 70 80 90 100 time / s Fig. 1.1 (a) (i) Describe the movement of the student, as shown in Fig. 1.1. ........................................................................................................................................... ........................................................................................................................................... .......................................................................................................................................[2] (ii) Calculate the distance travelled by the student between 80 s and 100 s. distance travelled = .......................................................m [3] (b) An athlete runs 630 m in 130 s on a flat section of a road and then 254 m in 40 s on a downhill slope. Calculate the average speed for the total distance run by the athlete. average speed = ...................................................m / s [3] [Total: 8]
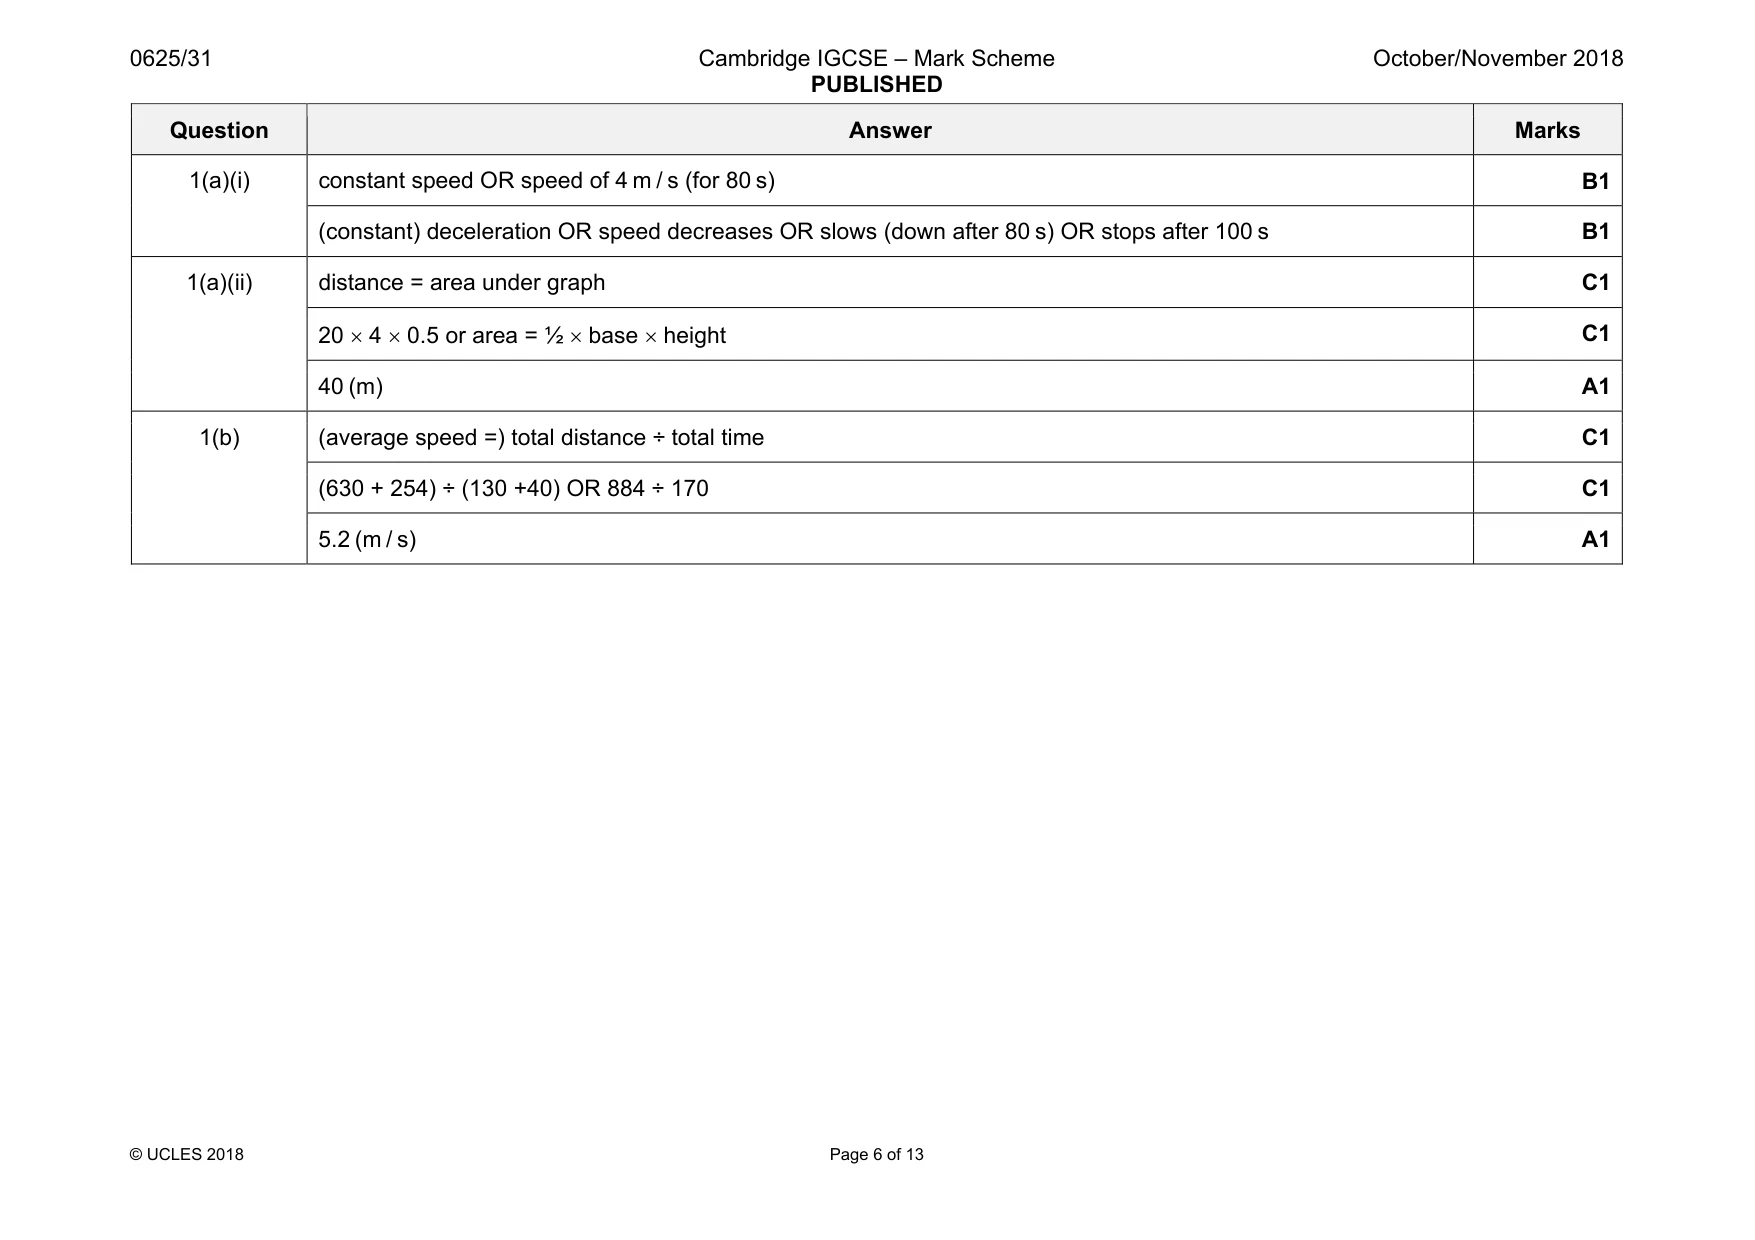
Mark scheme: 1(a)(i) constant speed OR speed of 4 m / s (for 80 s) B1 (constant) deceleration OR speed decreases OR slows (down after 80 s) OR stops after 100 s B1 1(a)(ii) distance = area under graph C1 20 × 4 × 0.5 or area = ½ × base × height C1 40 (m) A1 1(b) (average speed =) total distance ÷ total time C1 (630 + 254) ÷ (130 +40) OR 884 ÷ 170 C1 5.2 (m / s) A1
Q2 · A raft floating on water
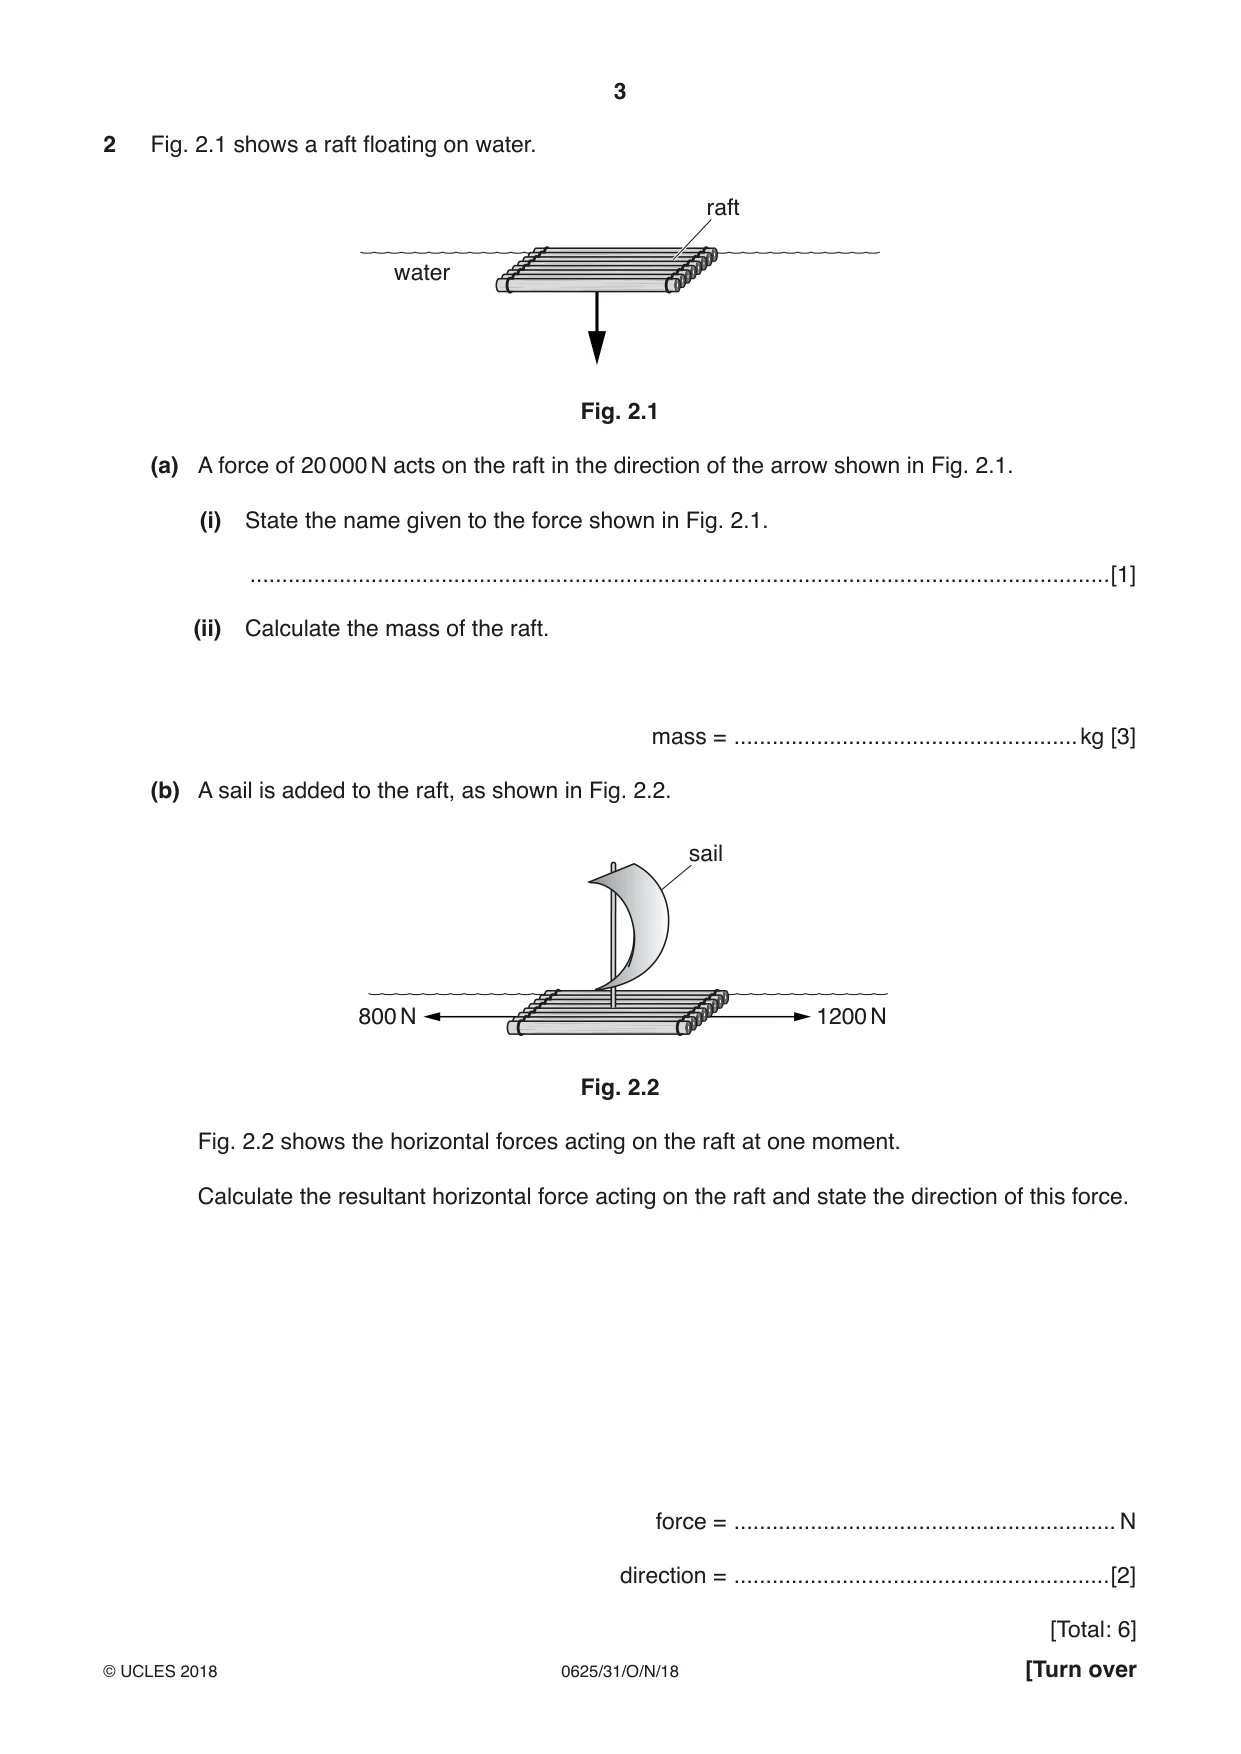
2 Fig. 2.1 shows a raft floating on water. raft water Fig. 2.1 (a) A force of 20 000 N acts on the raft in the direction of the arrow shown in Fig. 2.1. (i) State the name given to the force shown in Fig. 2.1. .......................................................................................................................................[1] (ii) Calculate the mass of the raft. mass = ......................................................kg [3] (b) A sail is added to the raft, as shown in Fig. 2.2. sail 800 N 1200 N Fig. 2.2 Fig. 2.2 shows the horizontal forces acting on the raft at one moment. Calculate the resultant horizontal force acting on the raft and state the direction of this force. force = ............................................................ N direction = ...........................................................[2] [Total: 6]
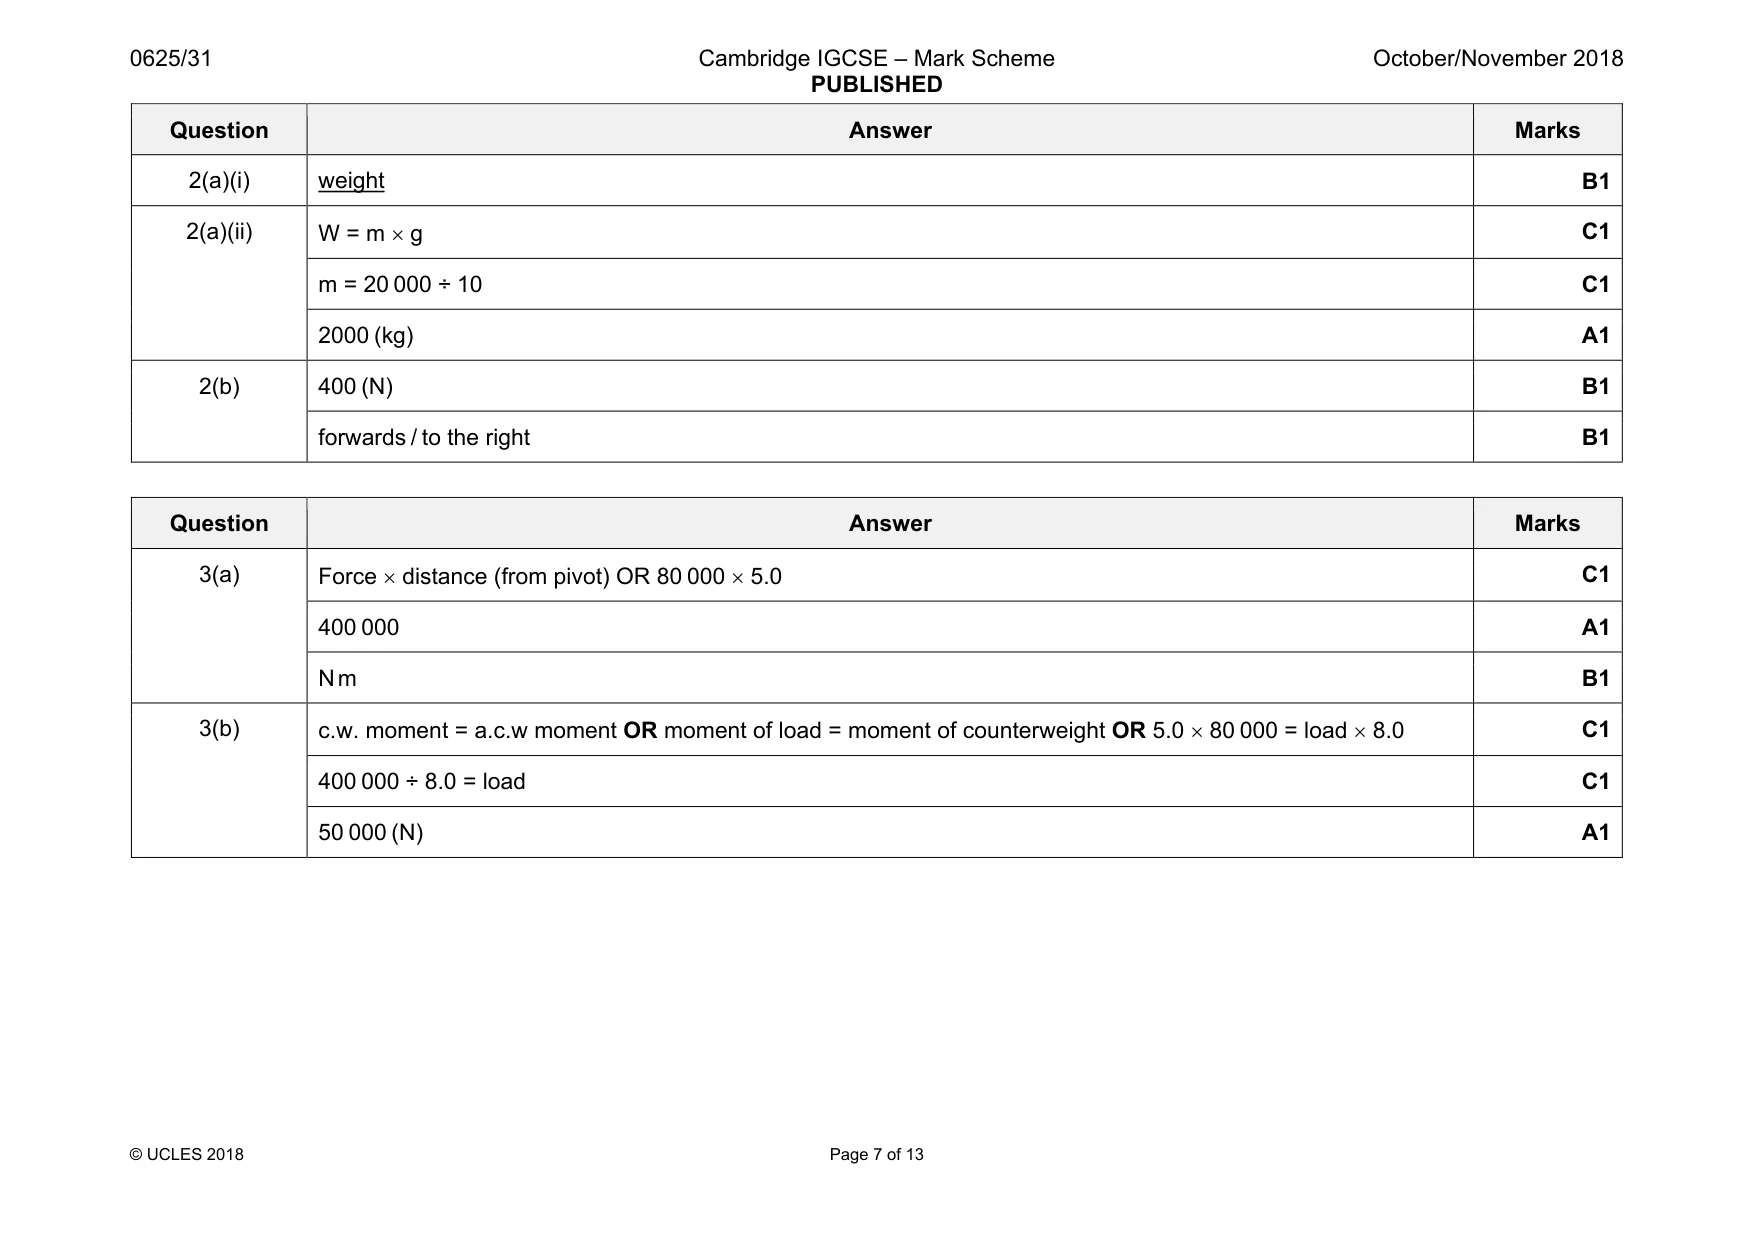
Mark scheme: 2(a)(i) weight B1 2(a)(ii) W = m × g C1 m = 20 000 ÷ 10 C1 2000 (kg) A1 2(b) 400 (N) B1 forwards / to the right B1
Q3 · A tower crane has a load W, as shown in Fig
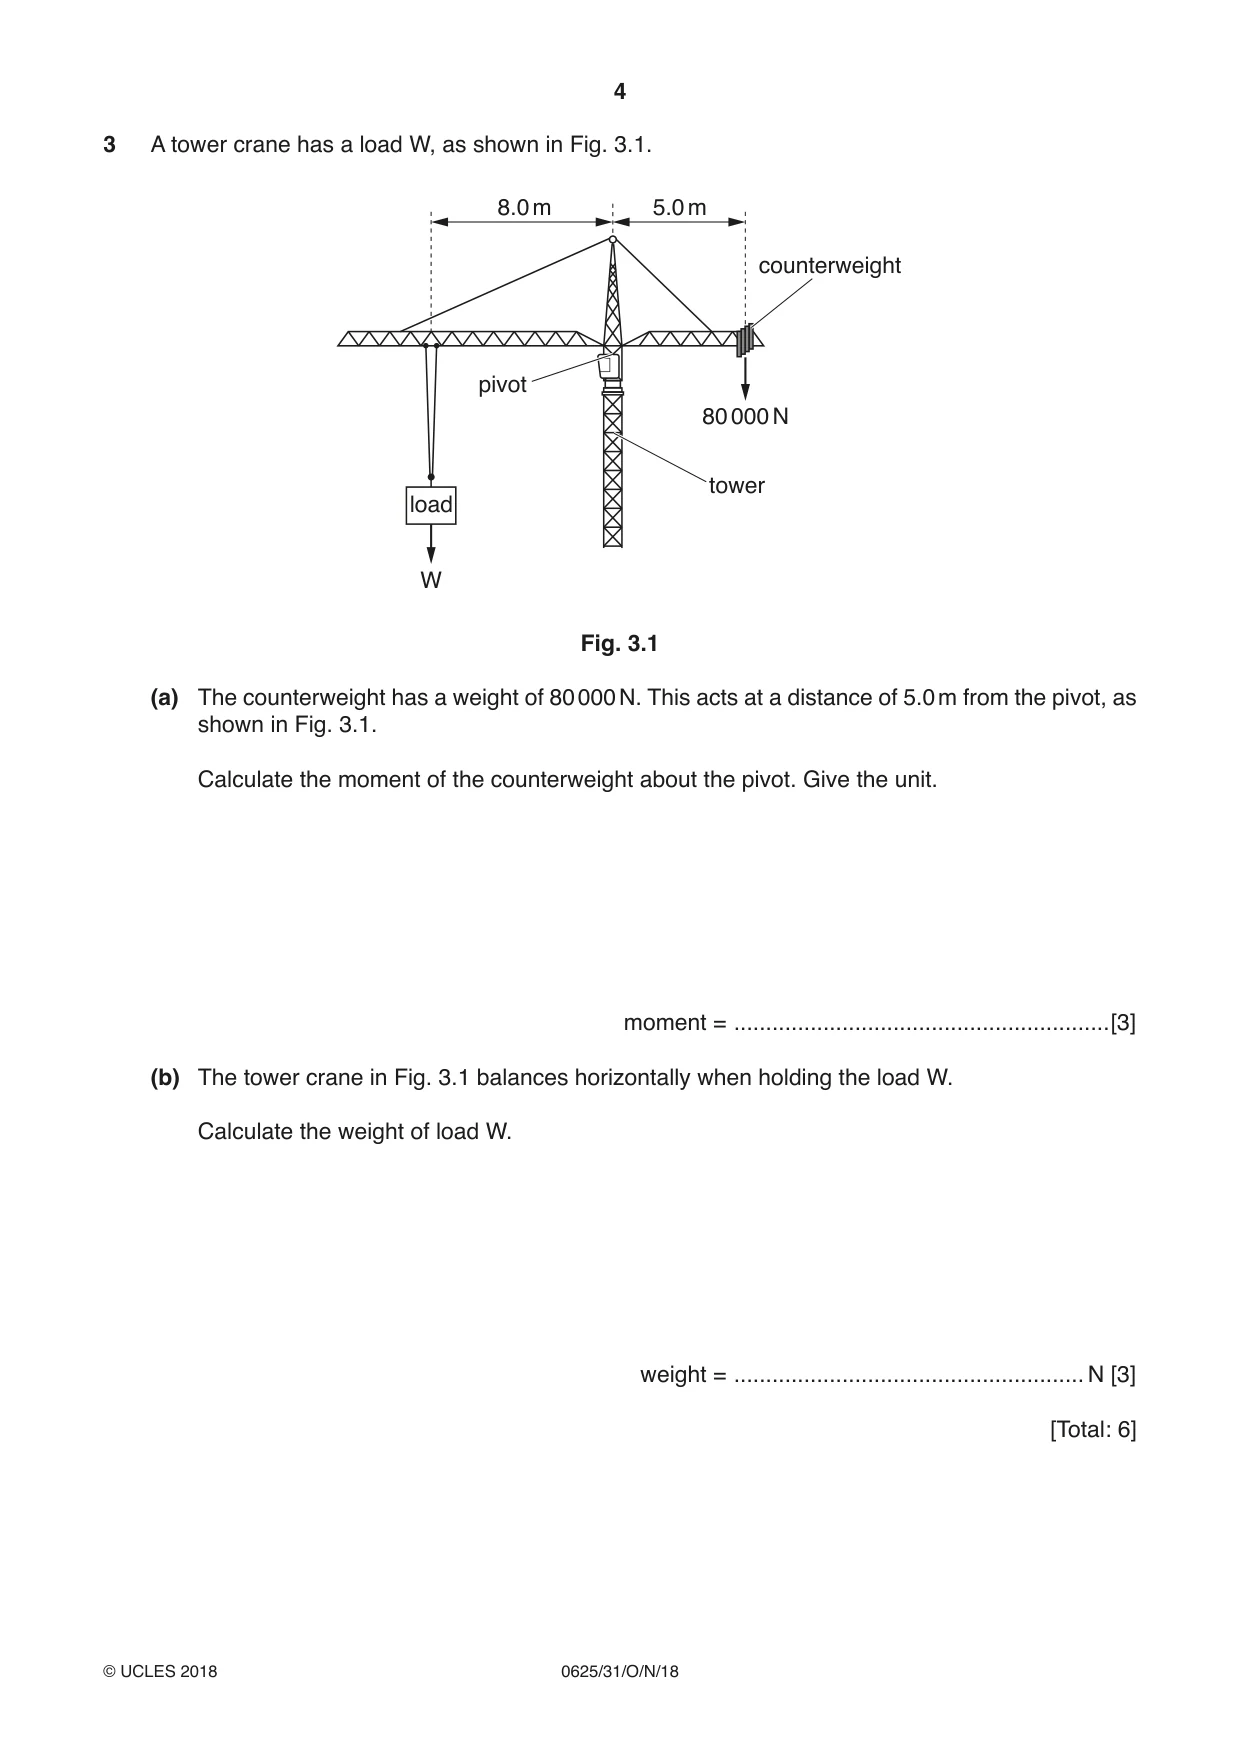
3 A tower crane has a load W, as shown in Fig. 3.1. 8.0 m 5.0 m counterweight pivot 80 000 N tower load W Fig. 3.1 (a) The counterweight has a weight of 80 000 N. This acts at a distance of 5.0 m from the pivot, as shown in Fig. 3.1. Calculate the moment of the counterweight about the pivot. Give the unit. moment = ...........................................................[3] (b) The tower crane in Fig. 3.1 balances horizontally when holding the load W. Calculate the weight of load W. weight = ....................................................... N [3] [Total: 6]
Mark scheme: 3(a) C1 400 000 A1 Nm B1 3(b) c.w. moment = a.c.w moment OR moment of load = moment of counterweight OR 5.0 × 80 000 = load × 8.0 C1 400 000 ÷ 8.0 = load C1 50 000 (N) A1
Q4 · A student draws diagrams that represent three states of matter, as shown in Fig
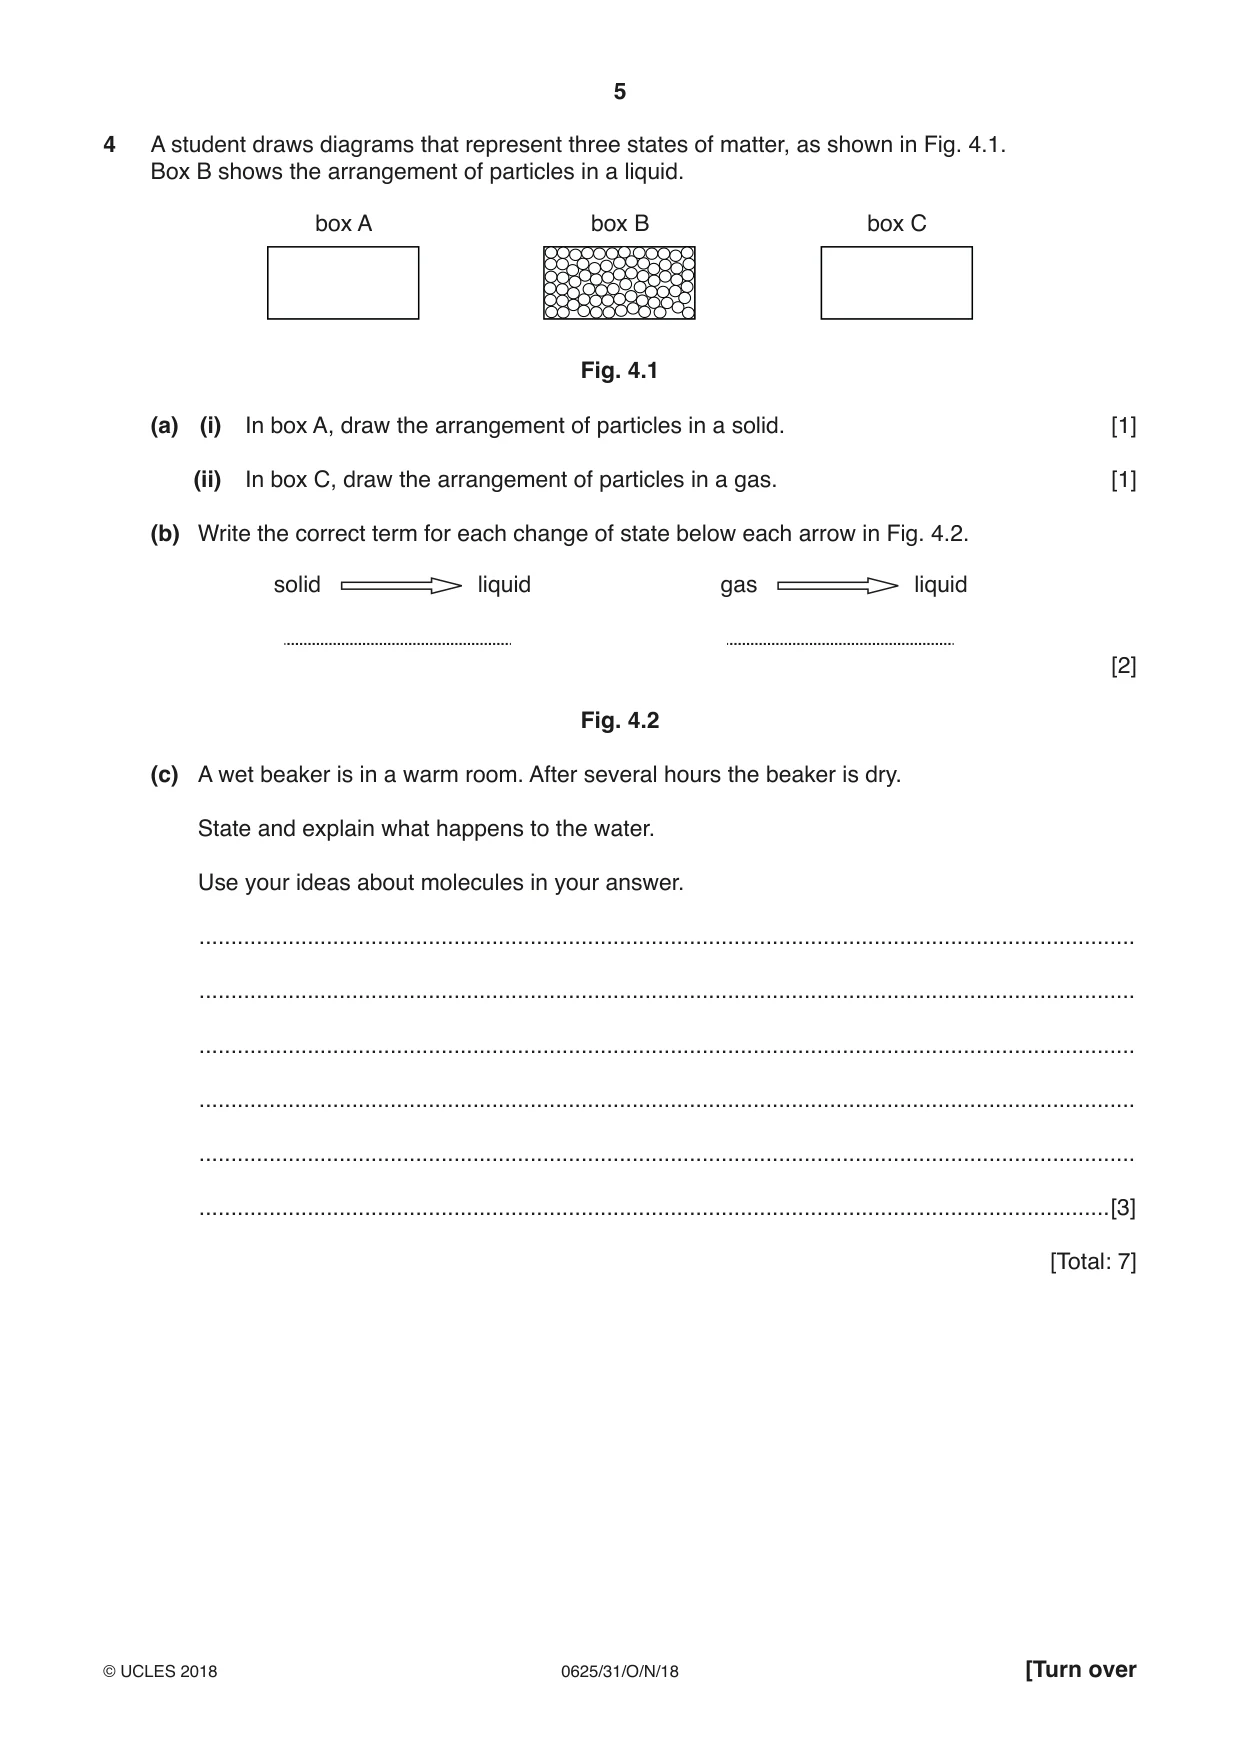
4 A student draws diagrams that represent three states of matter, as shown in Fig. 4.1. Box B shows the arrangement of particles in a liquid. box A box B box C Fig. 4.1 (a) (i) In box A, draw the arrangement of particles in a solid. [1] (ii) In box C, draw the arrangement of particles in a gas. [1] (b) Write the correct term for each change of state below each arrow in Fig. 4.2. solid liquid gas liquid [2] Fig. 4.2 (c) A wet beaker is in a warm room. After several hours the beaker is dry. State and explain what happens to the water. Use your ideas about molecules in your answer. ................................................................................................................................................... ................................................................................................................................................... ................................................................................................................................................... ................................................................................................................................................... ................................................................................................................................................... ...............................................................................................................................................[3] [Total: 7]
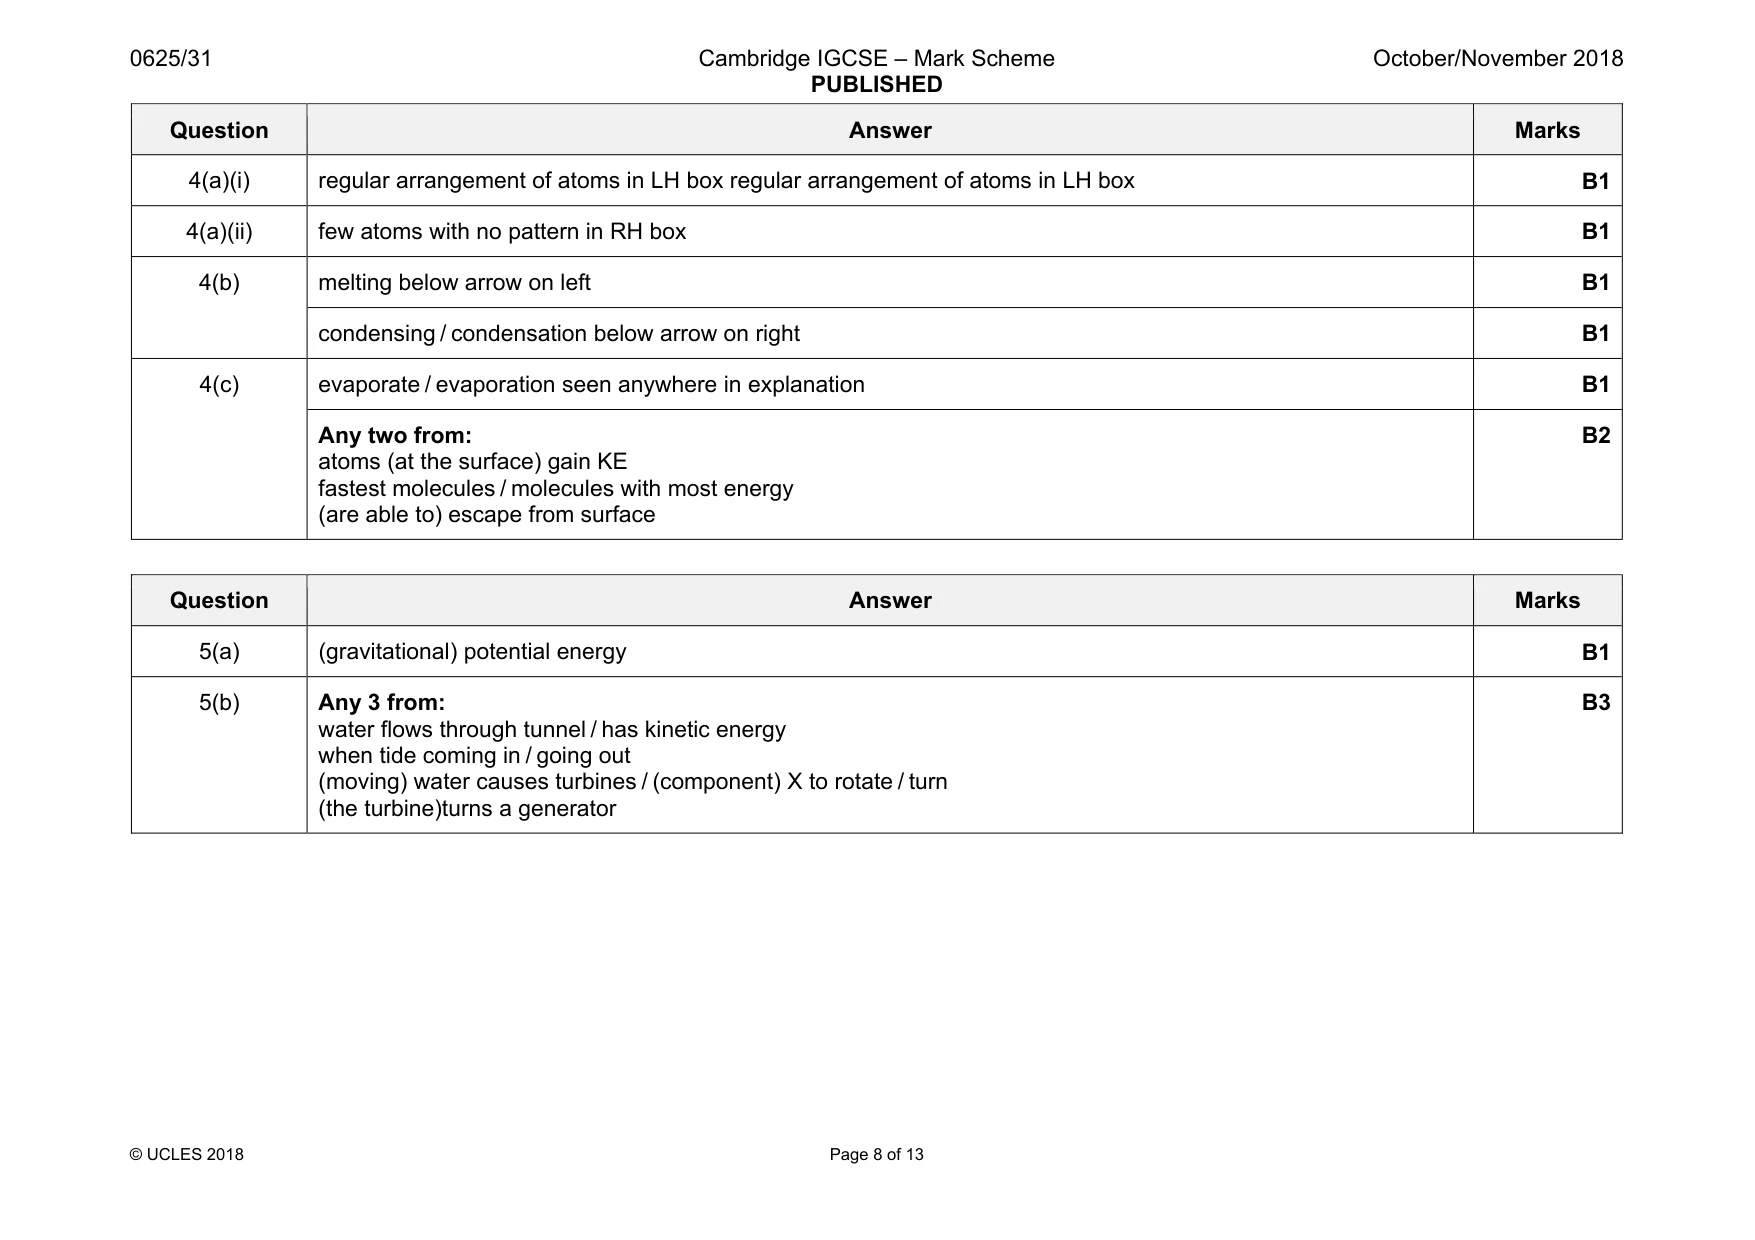
Mark scheme: 4(a)(i) regular arrangement of atoms in LH box regular arrangement of atoms in LH box B1 4(a)(ii) few atoms with no pattern in RH box B1 4(b) melting below arrow on left B1 condensing / condensation below arrow on right B1 4(c) evaporate / evaporation seen anywhere in explanation B1 Any two from: atoms (at the surface) gain KE fastest molecules / molecules with most energy (are able to) escape from surface B2
Q5 · A tidal barrage (dam) produces electricity using tides
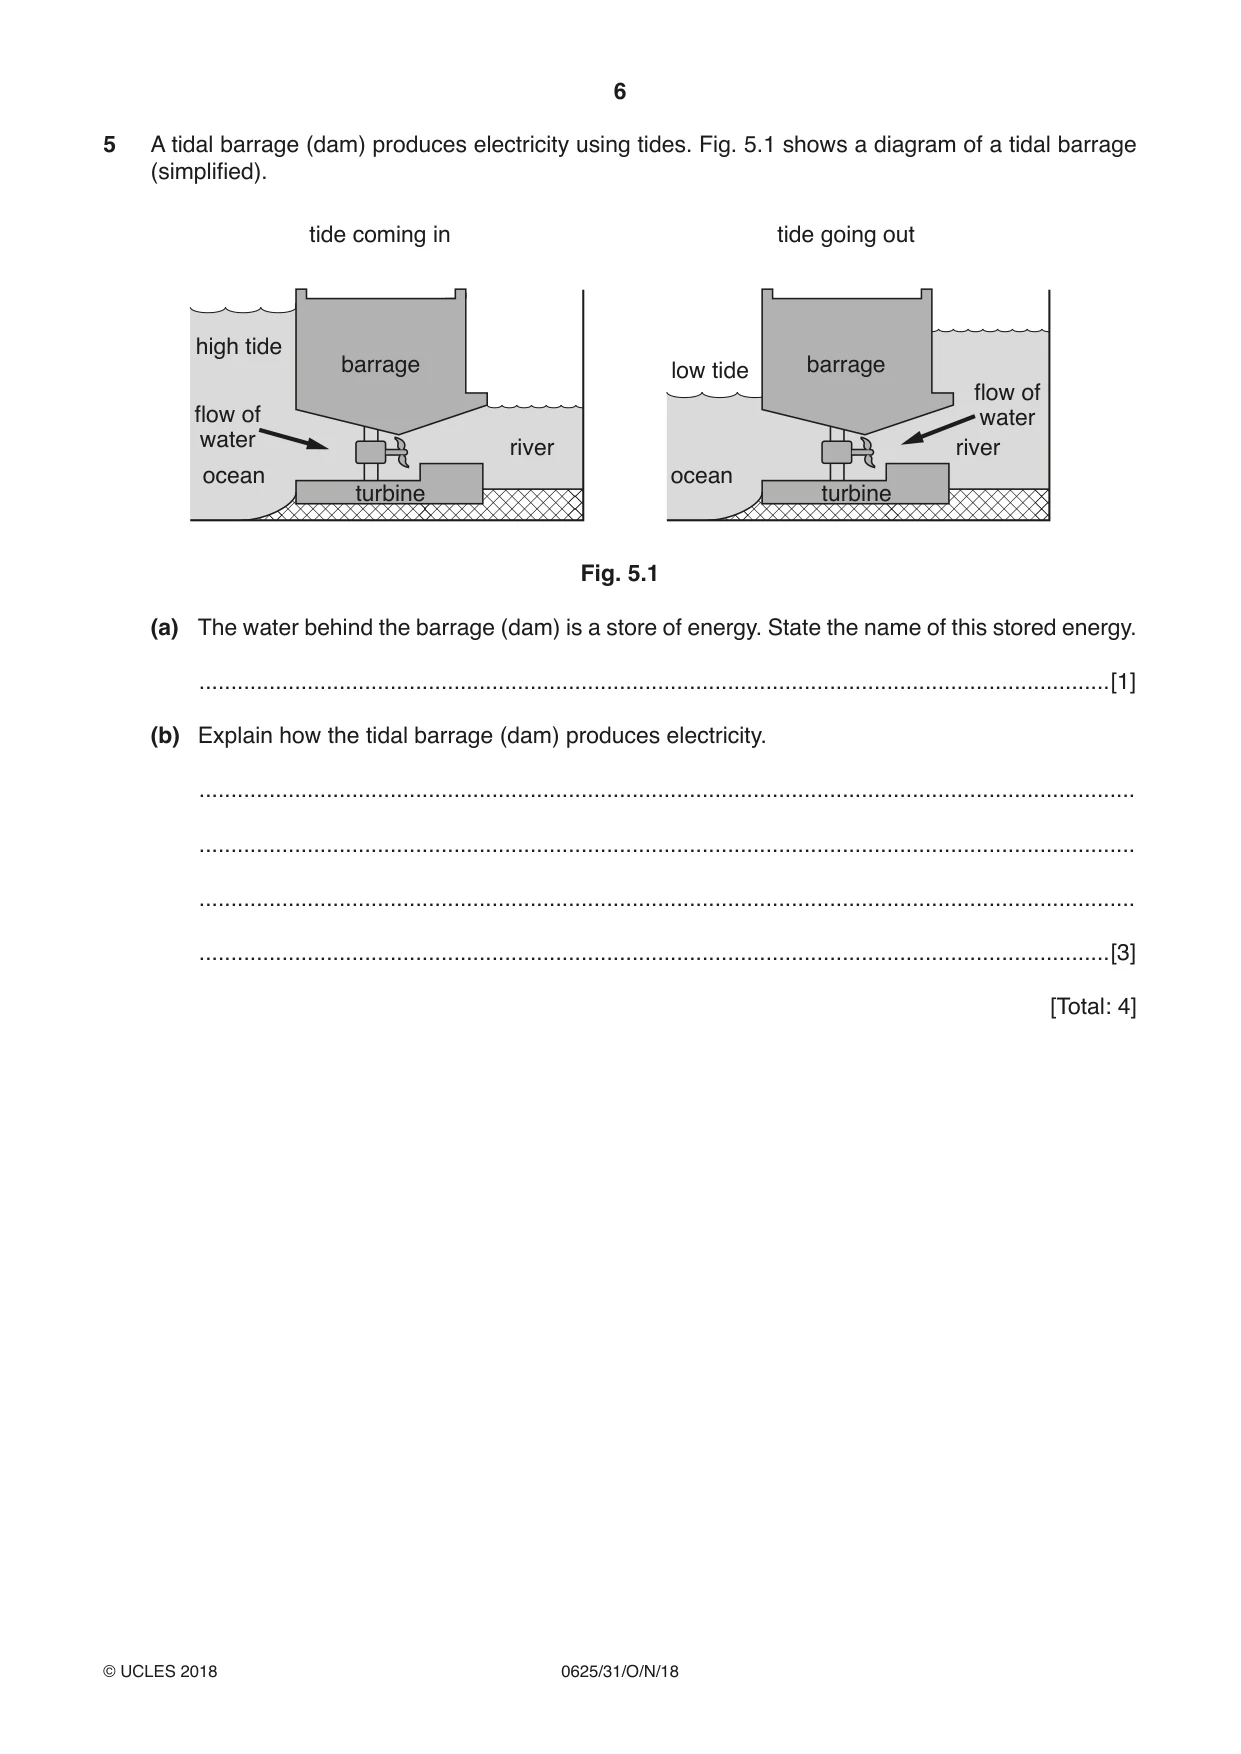
5 A tidal barrage (dam) produces electricity using tides. Fig. 5.1 shows a diagram of a tidal barrage (simplified). tide coming in tide going out high tide barrage low tide barrage flow of flow of water water river river ocean ocean turbine turbine Fig. 5.1 (a) The water behind the barrage (dam) is a store of energy. State the name of this stored energy. ...............................................................................................................................................[1] (b) Explain how the tidal barrage (dam) produces electricity. ................................................................................................................................................... ................................................................................................................................................... ................................................................................................................................................... ...............................................................................................................................................[3] [Total: 4]
Mark scheme: 5(a) (gravitational) potential energy B1 5(b) Any 3 from: water flows through tunnel / has kinetic energy when tide coming in / going out (moving) water causes turbines / (component) X to rotate / turn (the turbine)turns a generator B3
Q6 · Some materials are poor conductors of thermal energy (heat energy)
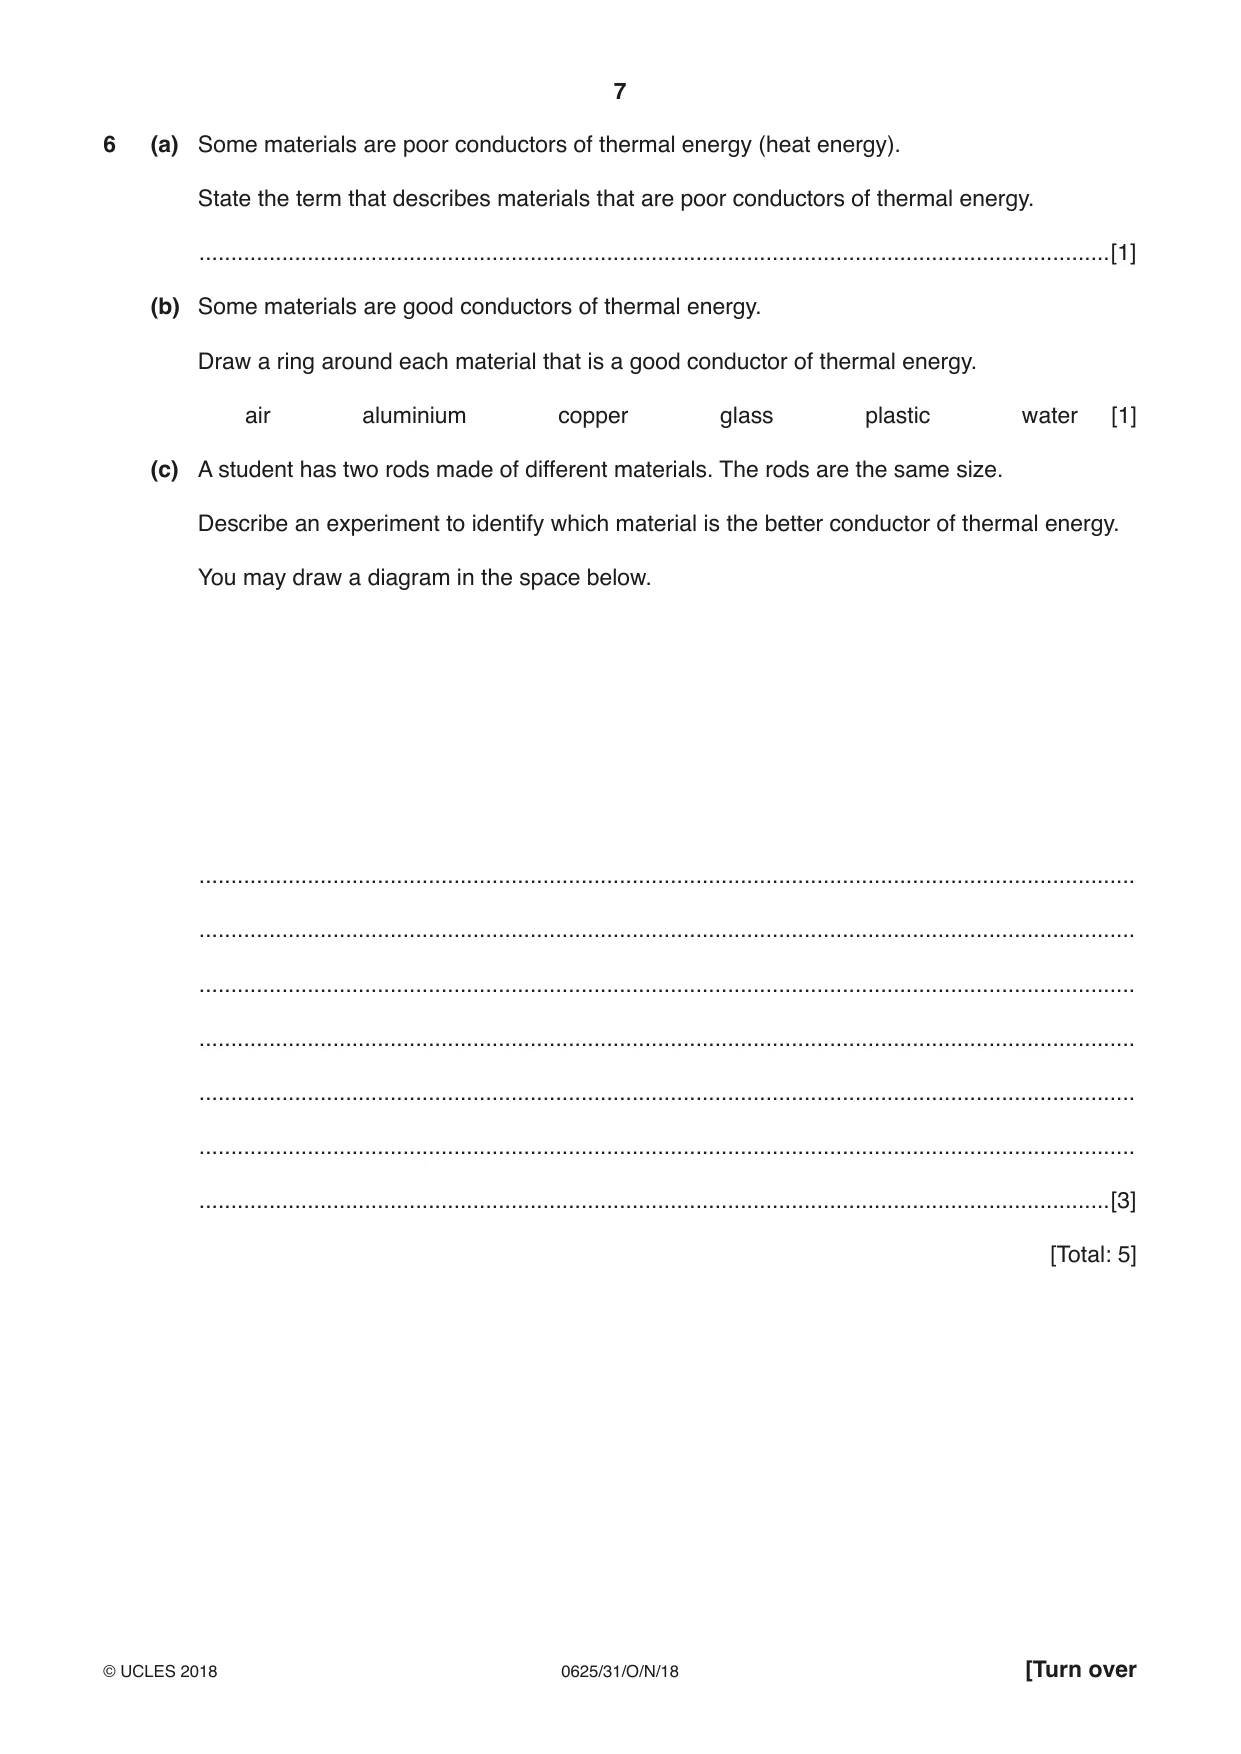
6 (a) Some materials are poor conductors of thermal energy (heat energy). State the term that describes materials that are poor conductors of thermal energy. ...............................................................................................................................................[1] (b) Some materials are good conductors of thermal energy. Draw a ring around each material that is a good conductor of thermal energy. air aluminium copper glass plastic water [1] (c) A student has two rods made of different materials. The rods are the same size. Describe an experiment to identify which material is the better conductor of thermal energy. You may draw a diagram in the space below. ................................................................................................................................................... ................................................................................................................................................... ................................................................................................................................................... ................................................................................................................................................... ................................................................................................................................................... ................................................................................................................................................... ...............................................................................................................................................[3] [Total: 5]
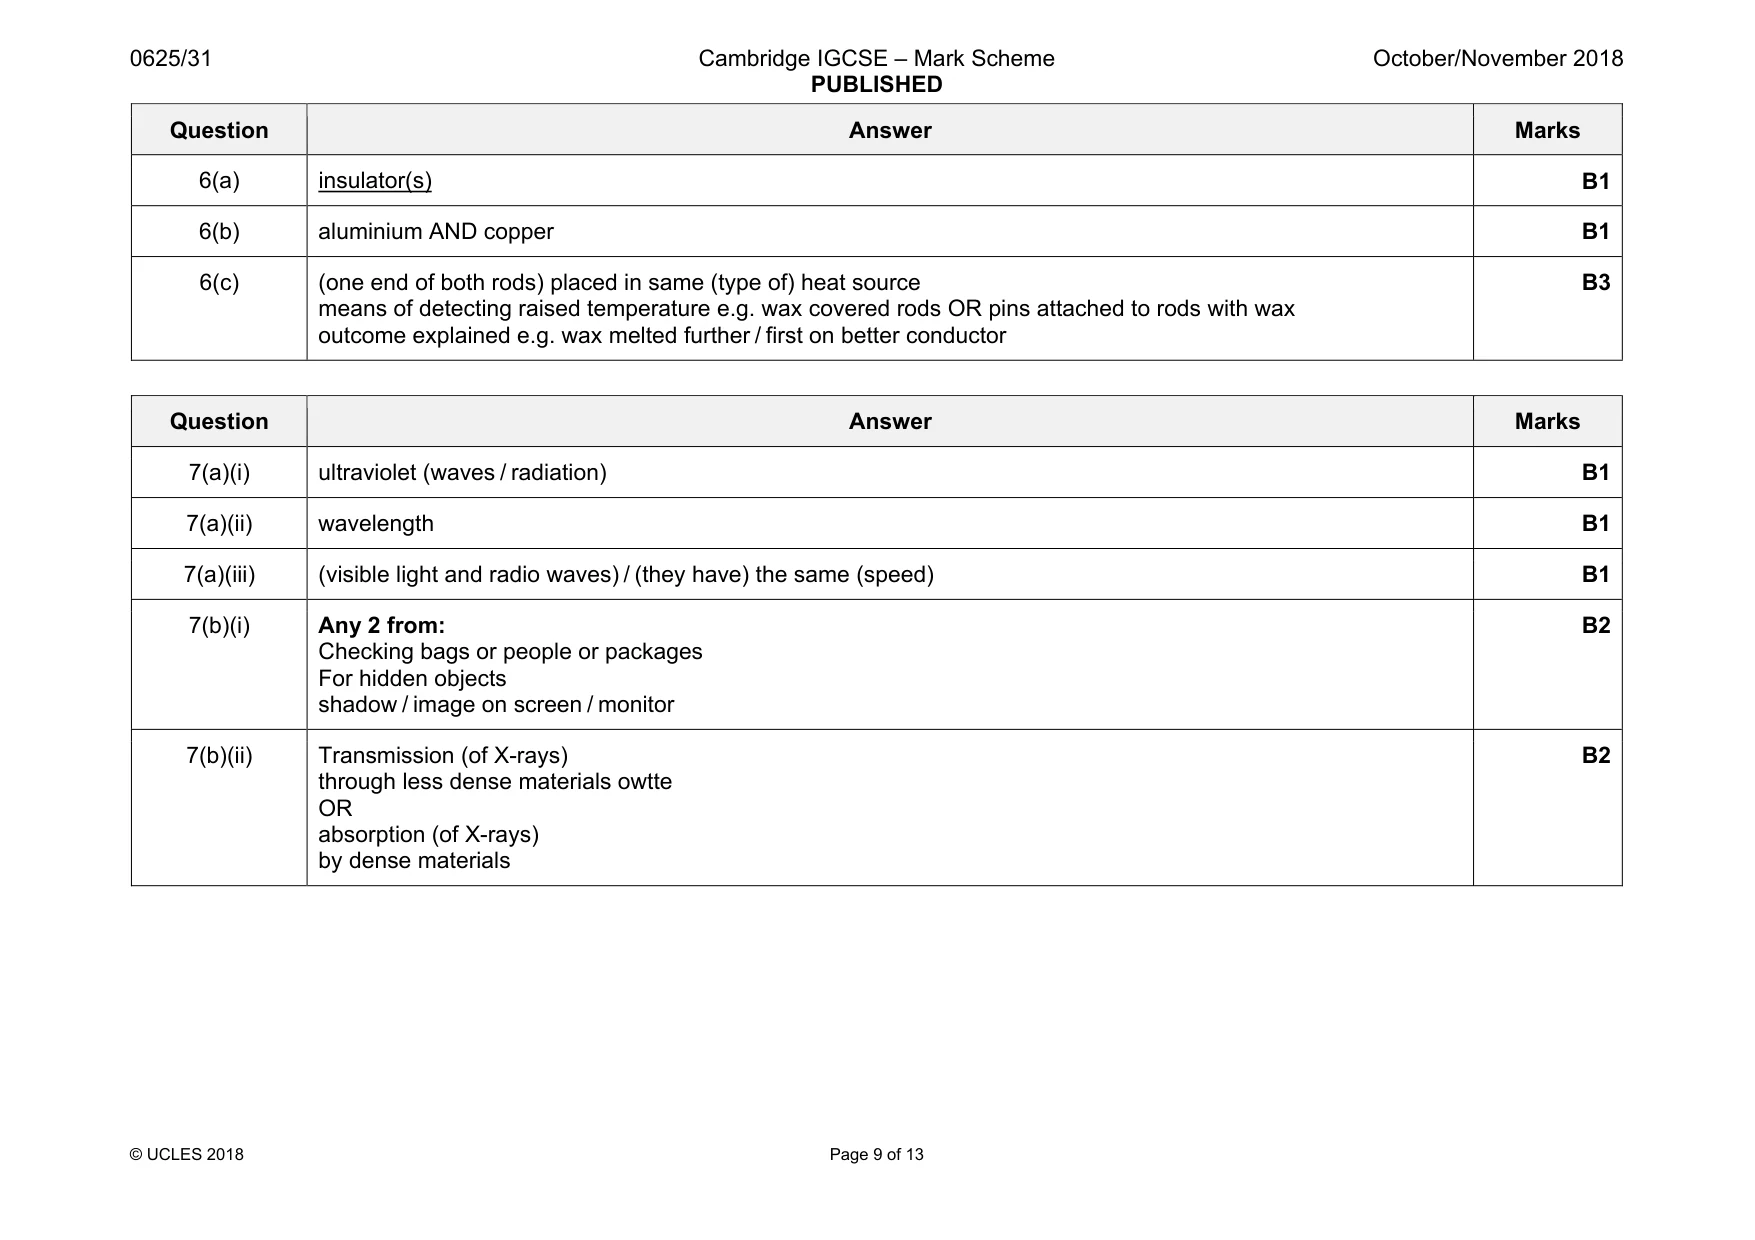
Mark scheme: 6(a) insulator(s) B1 6(b) aluminium AND copper B1 6(c) (one end of both rods) placed in same (type of) heat source means of detecting raised temperature e.g. wax covered rods OR pins attached to rods with wax outcome explained e.g. wax melted further / first on better conductor B3
Question 7
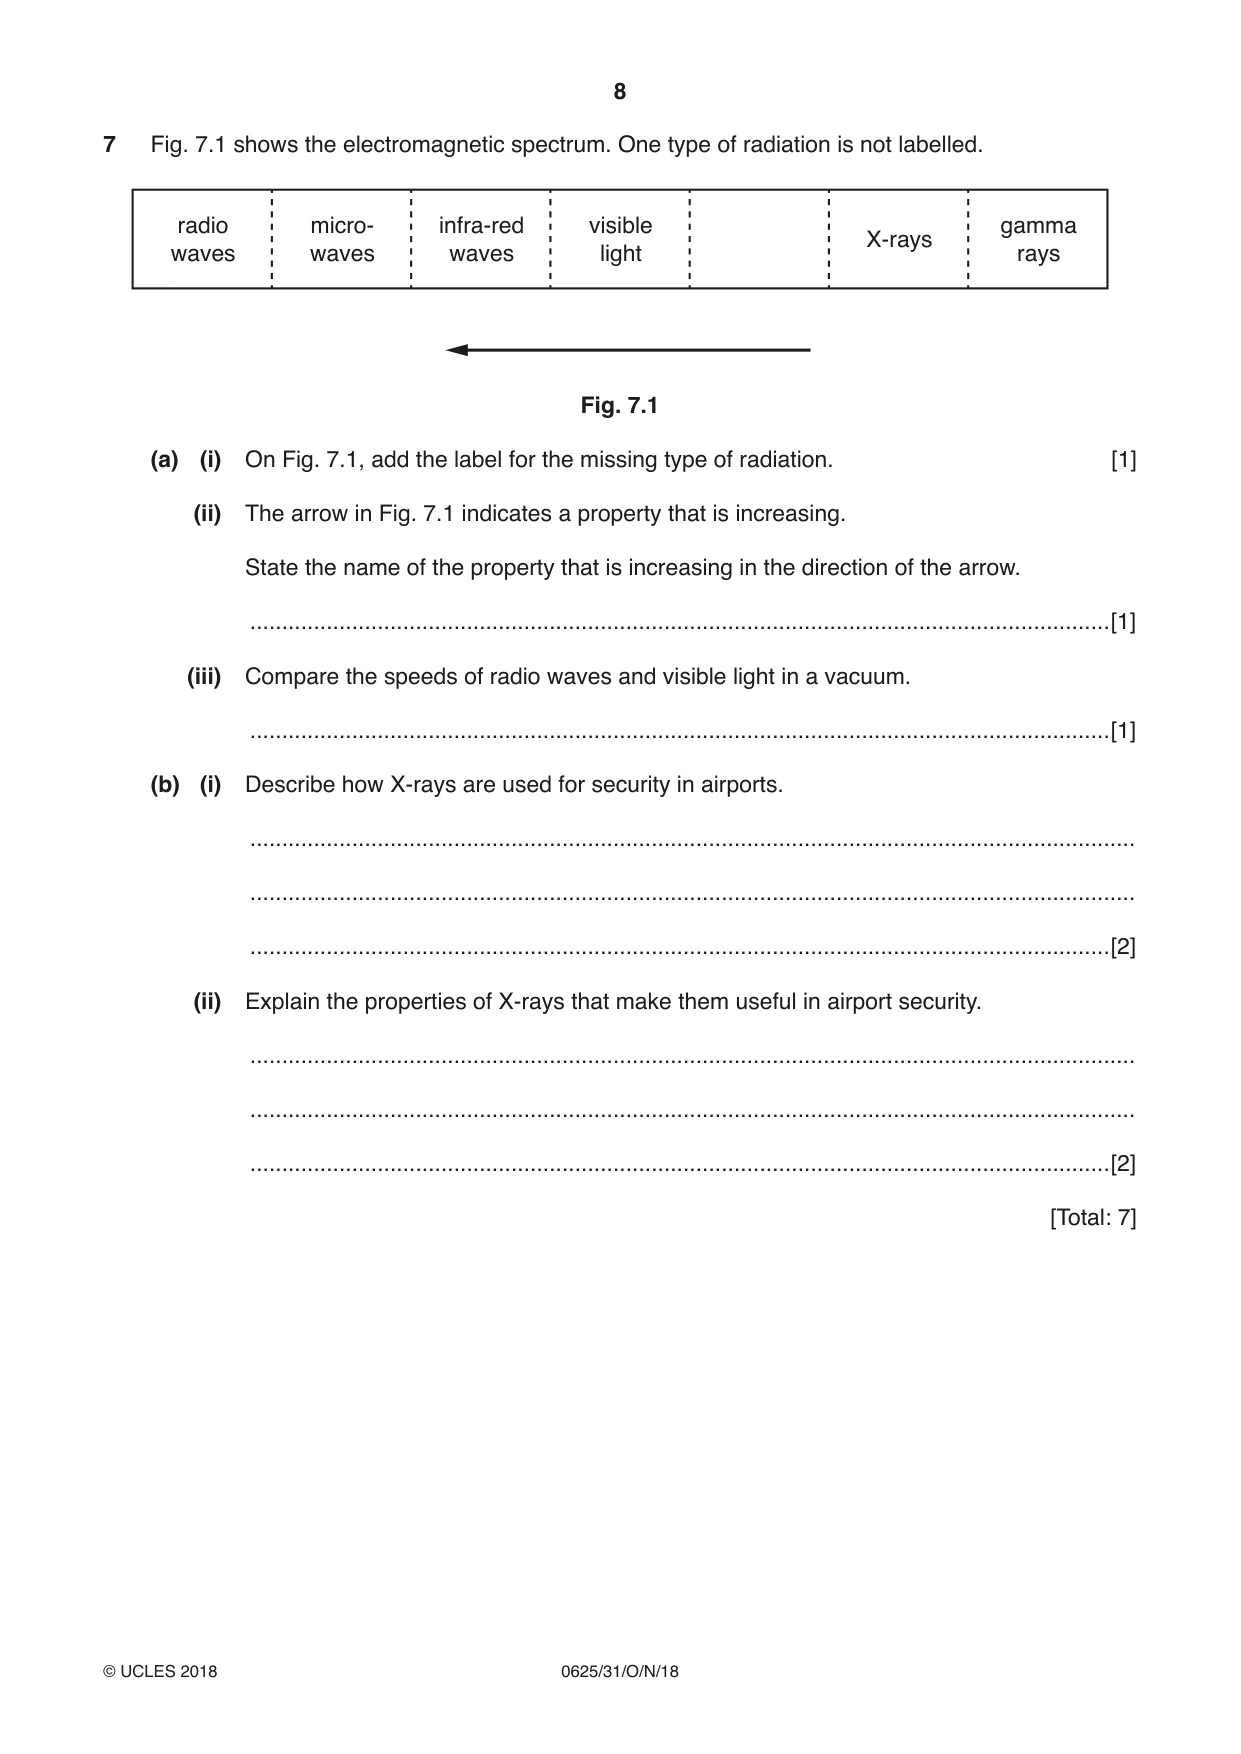
7 Fig. 7.1 shows the electromagnetic spectrum. One type of radiation is not labelled. radio micro- infra-red visible gamma X-rays waves waves waves light rays Fig. 7.1 (a) (i) On Fig. 7.1, add the label for the missing type of radiation. [1] (ii) The arrow in Fig. 7.1 indicates a property that is increasing. State the name of the property that is increasing in the direction of the arrow. .......................................................................................................................................[1] (iii) Compare the speeds of radio waves and visible light in a vacuum. .......................................................................................................................................[1] (b) (i) Describe how X-rays are used for security in airports. ........................................................................................................................................... ........................................................................................................................................... .......................................................................................................................................[2] (ii) Explain the properties of X-rays that make them useful in airport security. ........................................................................................................................................... ........................................................................................................................................... .......................................................................................................................................[2] [Total: 7]
Mark scheme: 7(a)(i) ultraviolet (waves / radiation) B1 7(a)(ii) wavelength B1 7(a)(iii) (visible light and radio waves) / (they have) the same (speed) B1 7(b)(i) Any 2 from: Checking bags or people or packages For hidden objects shadow / image on screen / monitor B2 7(b)(ii) Transmission (of X-rays) through less dense materials owtte OR absorption (of X-rays) by dense materials B2
Q8 · A tuning fork and a wooden block
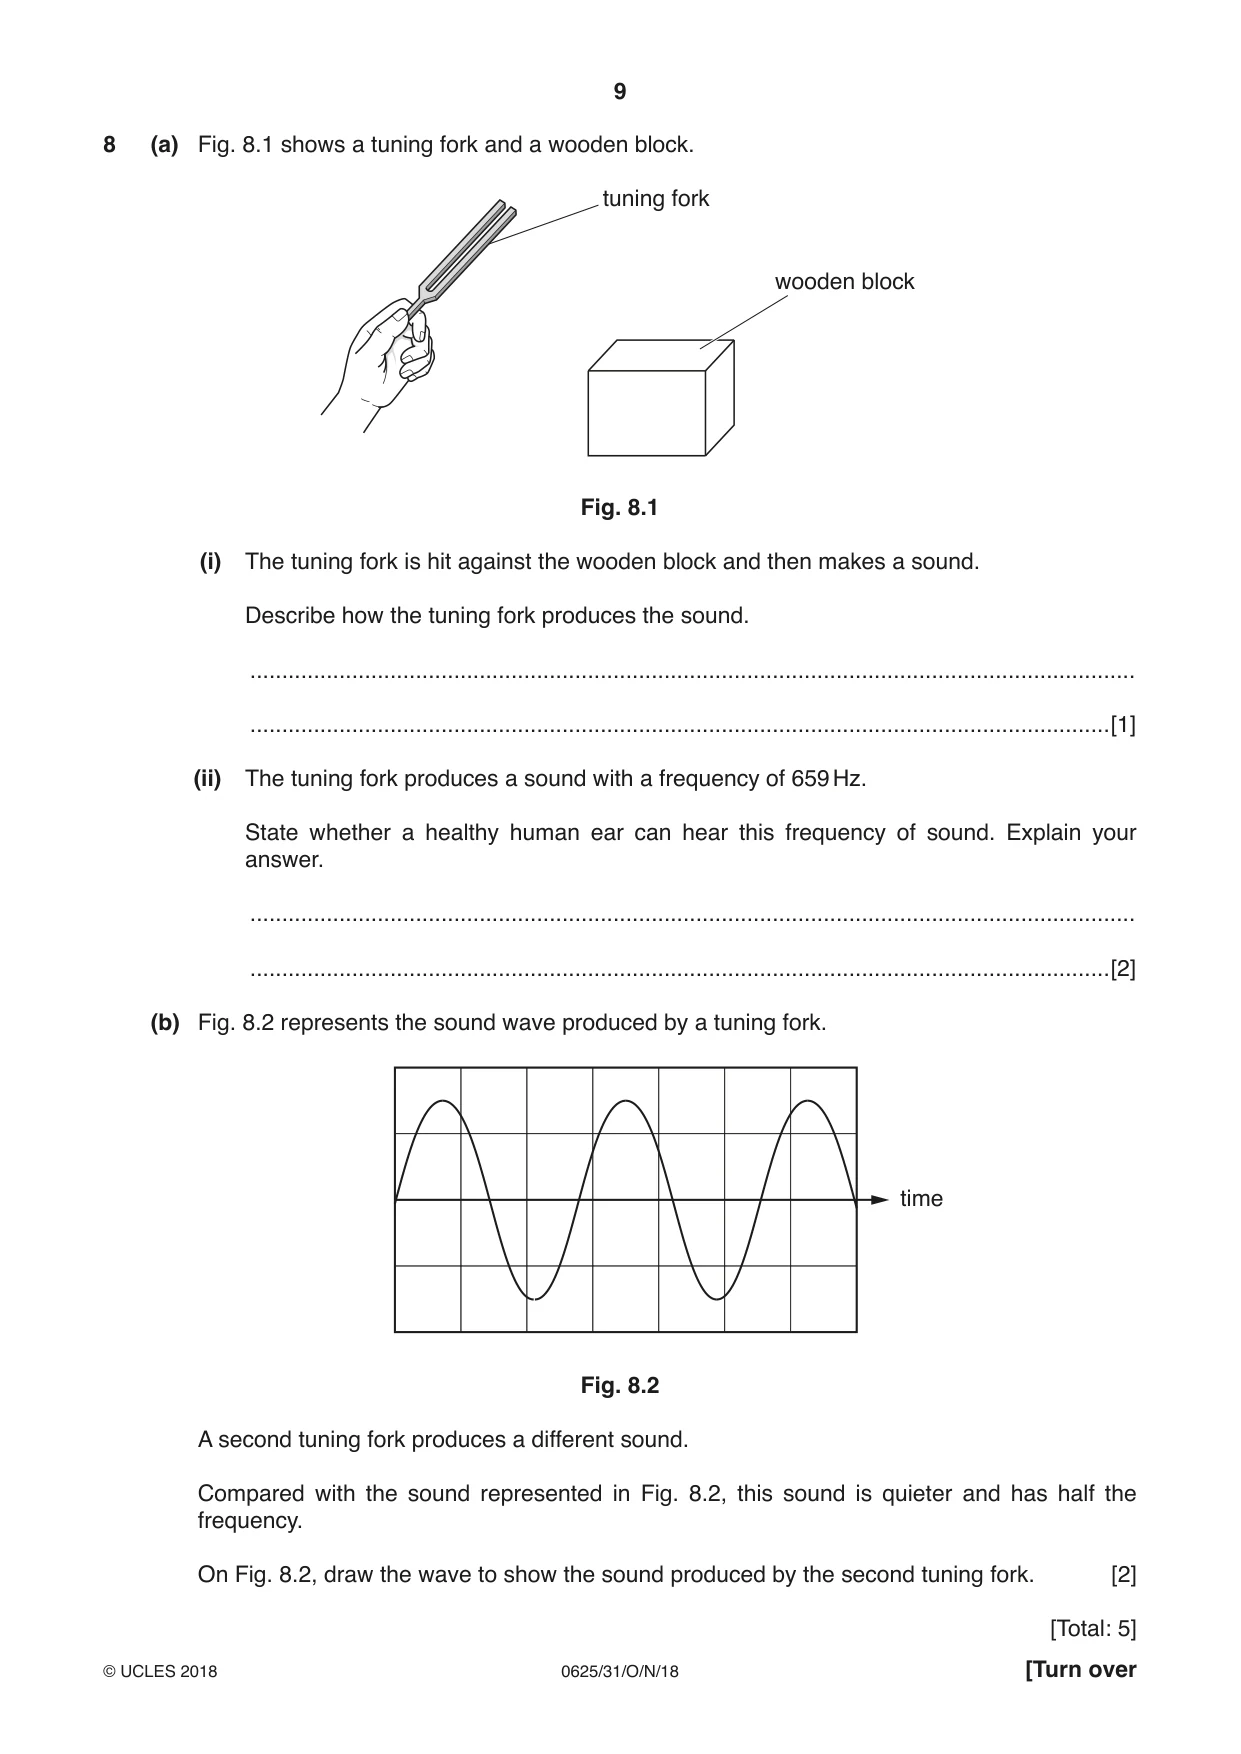
8 (a) Fig. 8.1 shows a tuning fork and a wooden block. tuning fork wooden block Fig. 8.1 (i) The tuning fork is hit against the wooden block and then makes a sound. Describe how the tuning fork produces the sound. ........................................................................................................................................... .......................................................................................................................................[1] (ii) The tuning fork produces a sound with a frequency of 659 Hz. State whether a healthy human ear can hear this frequency of sound. Explain your answer. ........................................................................................................................................... .......................................................................................................................................[2] (b) Fig. 8.2 represents the sound wave produced by a tuning fork. time Fig. 8.2 A second tuning fork produces a different sound. Compared with the sound represented in Fig. 8.2, this sound is quieter and has half the frequency. On Fig. 8.2, draw the wave to show the sound produced by the second tuning fork. [2] [Total: 5]
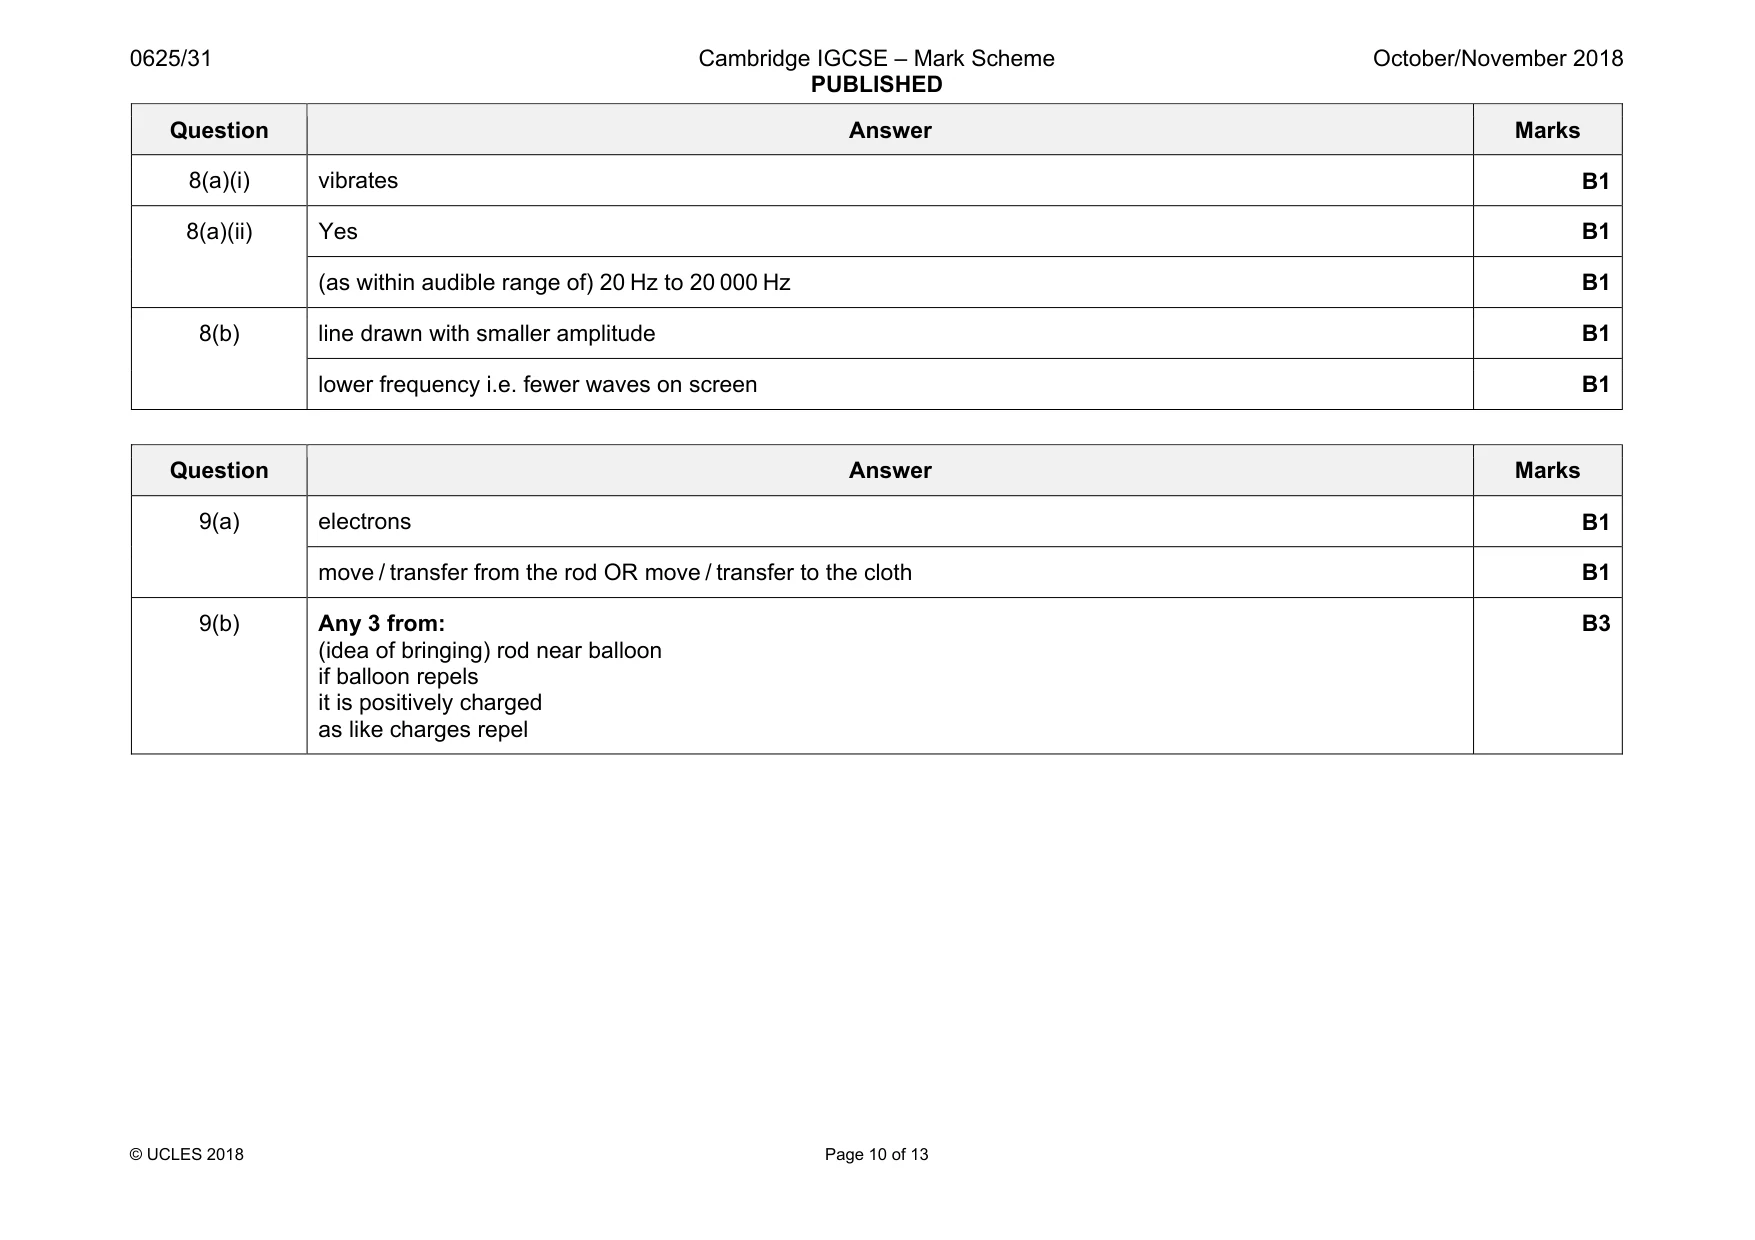
Mark scheme: 8(a)(i) vibrates B1 8(a)(ii) Yes B1 (as within audible range of) 20 Hz to 20 000 Hz B1 8(b) line drawn with smaller amplitude B1 lower frequency i.e. fewer waves on screen B1
Q9 · A student experiments with electric charge
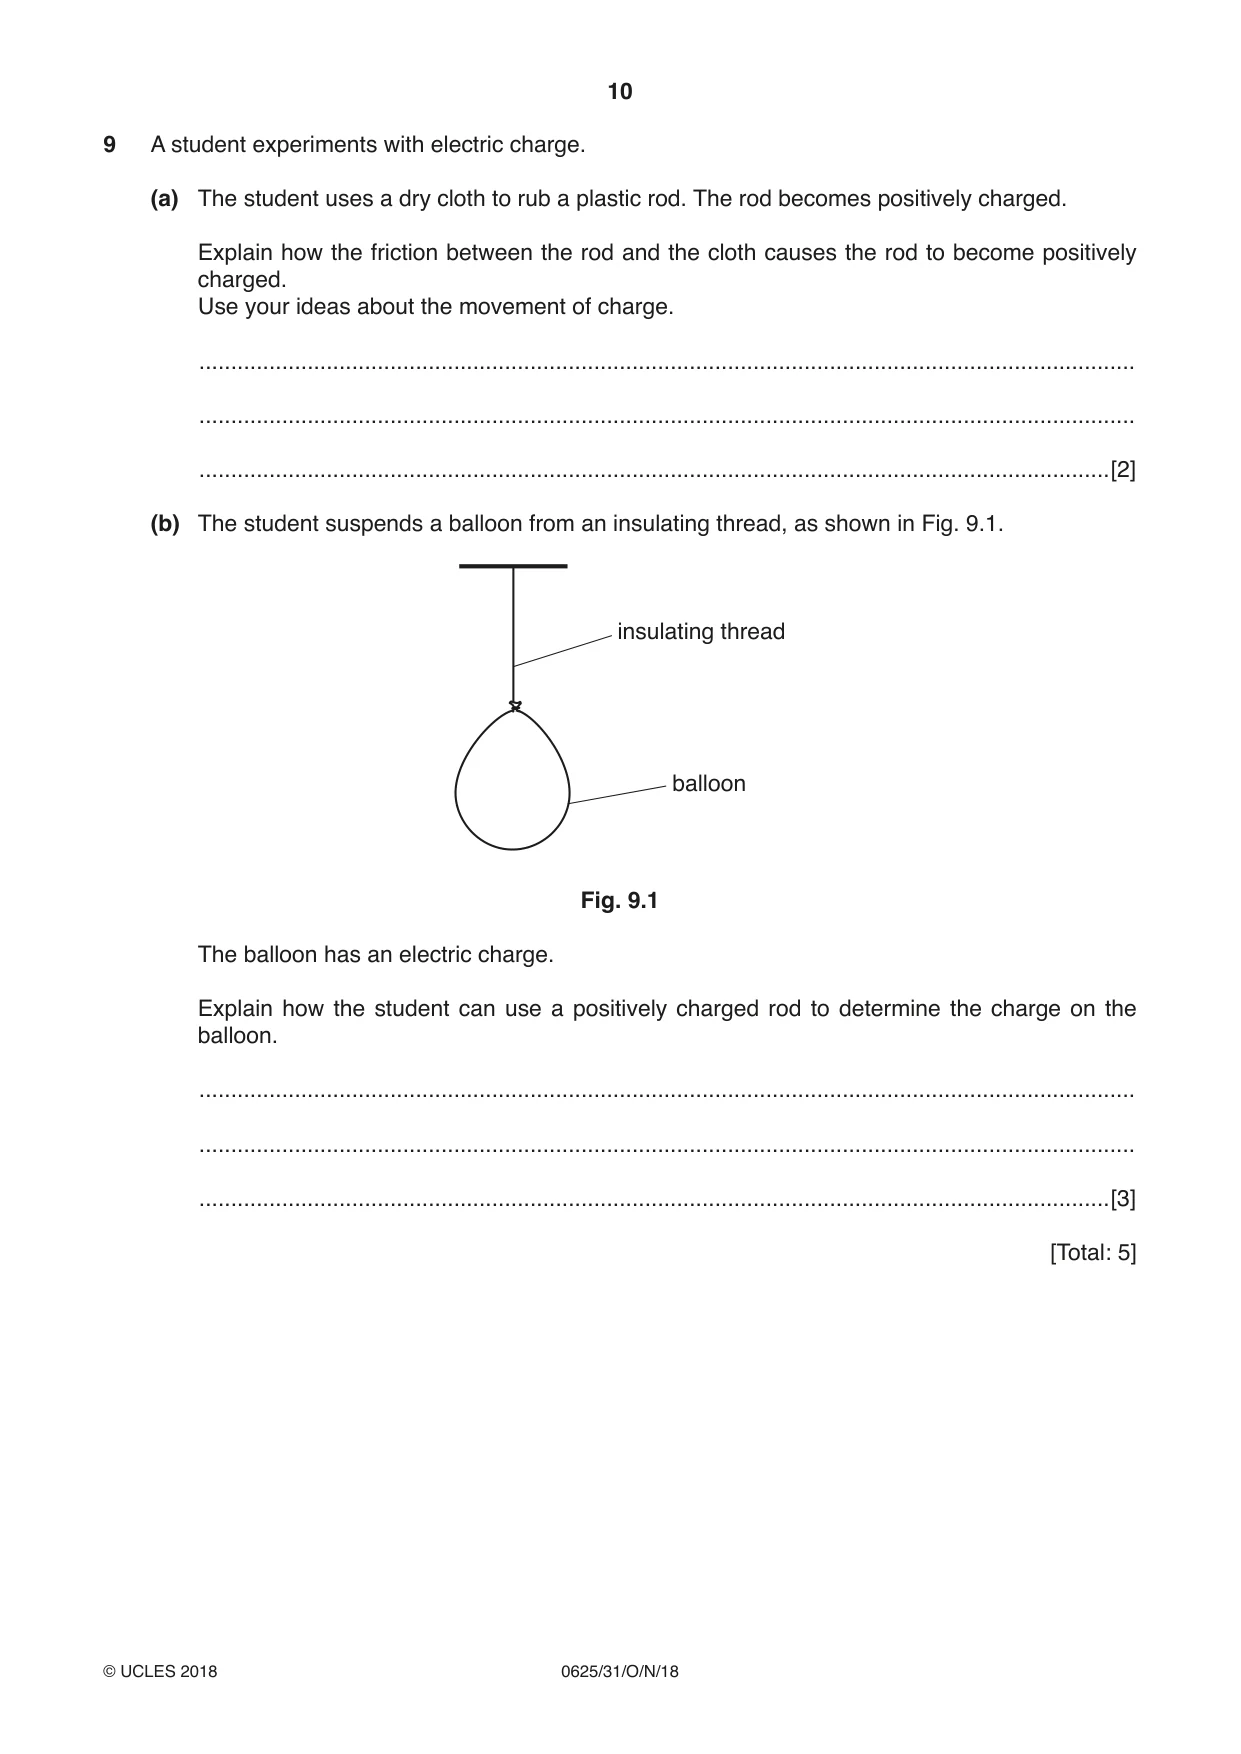
9 A student experiments with electric charge. (a) The student uses a dry cloth to rub a plastic rod. The rod becomes positively charged. Explain how the friction between the rod and the cloth causes the rod to become positively charged. Use your ideas about the movement of charge. ................................................................................................................................................... ................................................................................................................................................... ...............................................................................................................................................[2] (b) The student suspends a balloon from an insulating thread, as shown in Fig. 9.1. insulating thread balloon Fig. 9.1 The balloon has an electric charge. Explain how the student can use a positively charged rod to determine the charge on the balloon. ................................................................................................................................................... ................................................................................................................................................... ...............................................................................................................................................[3] [Total: 5]
Mark scheme: 9(a) electrons B1 move / transfer from the rod OR move / transfer to the cloth B1 9(b) Any 3 from: (idea of bringing) rod near balloon if balloon repels it is positively charged as like charges repel B3
Q10 · A student does an experiment to determine the resistance of a fixed resistor, R
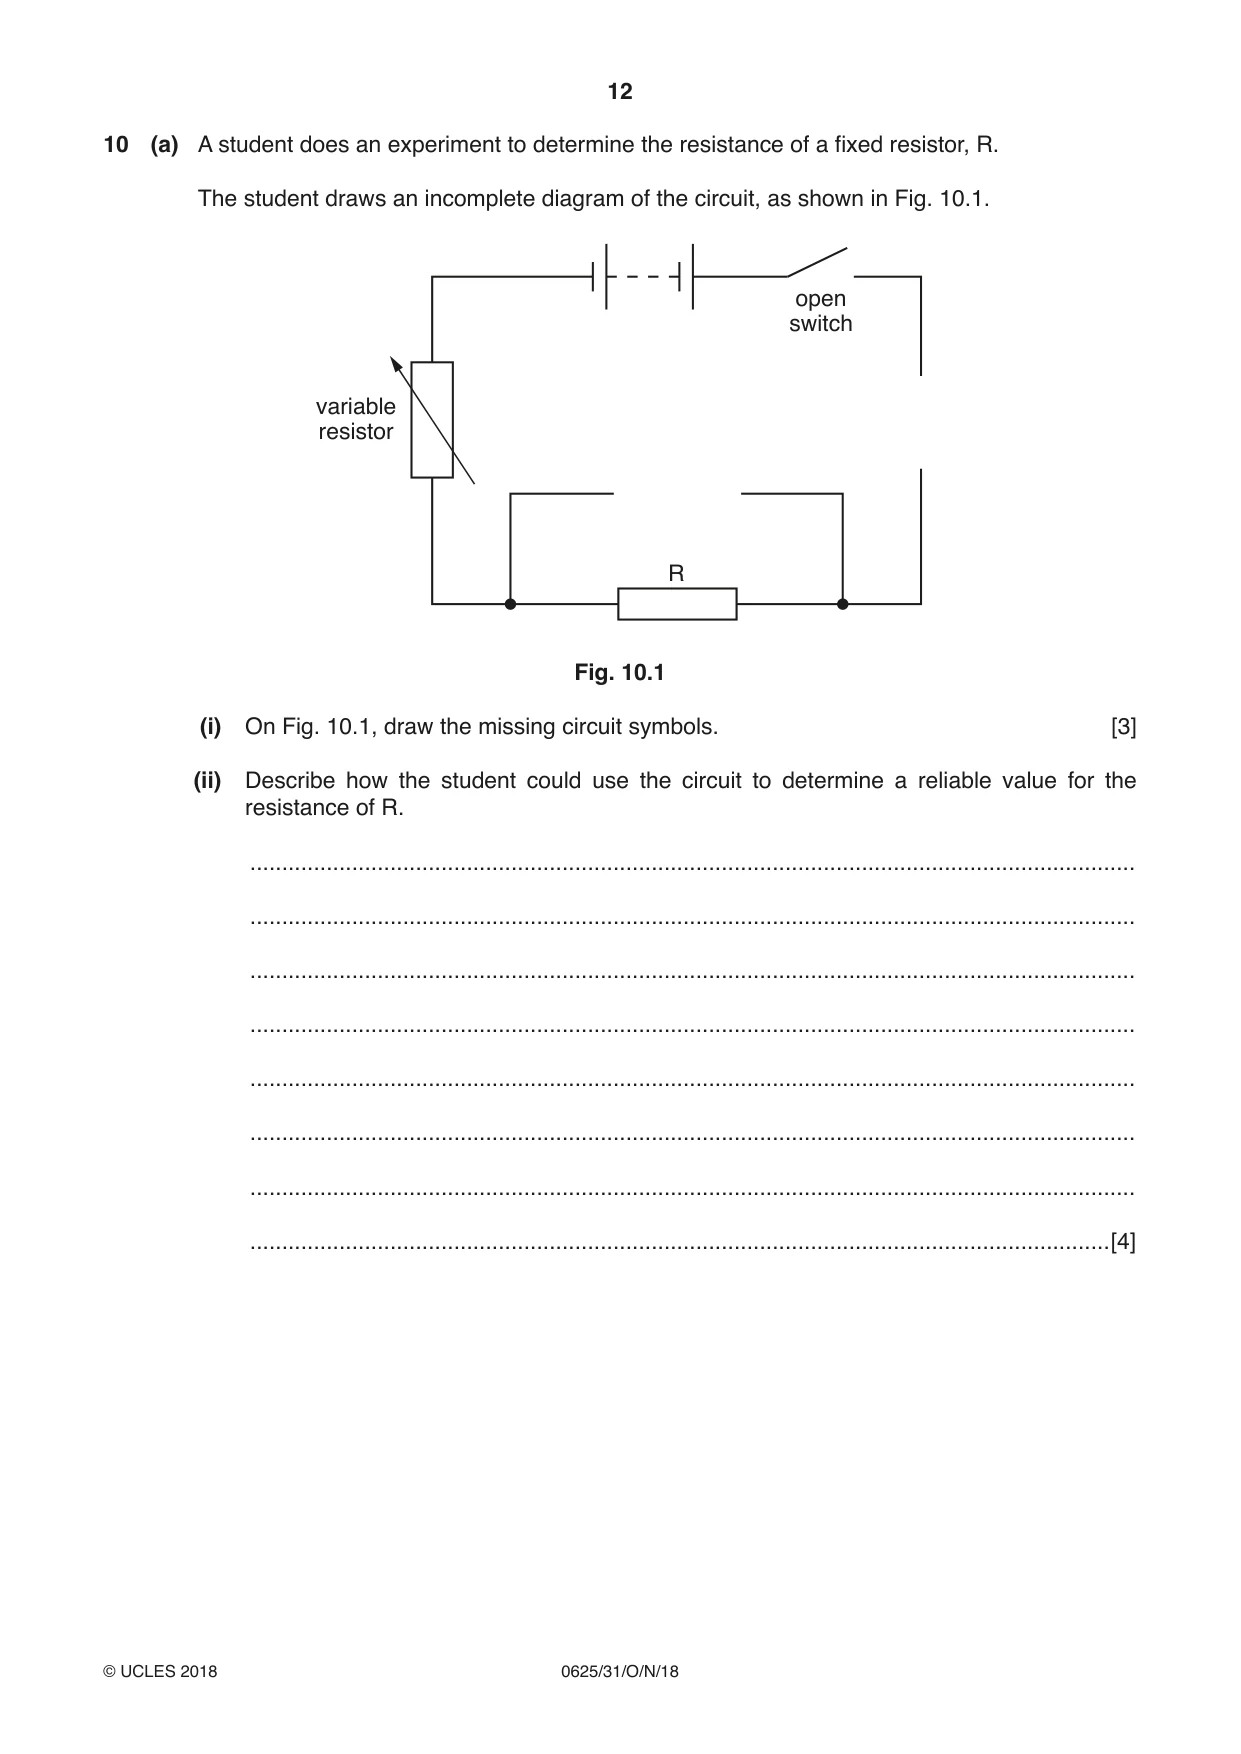
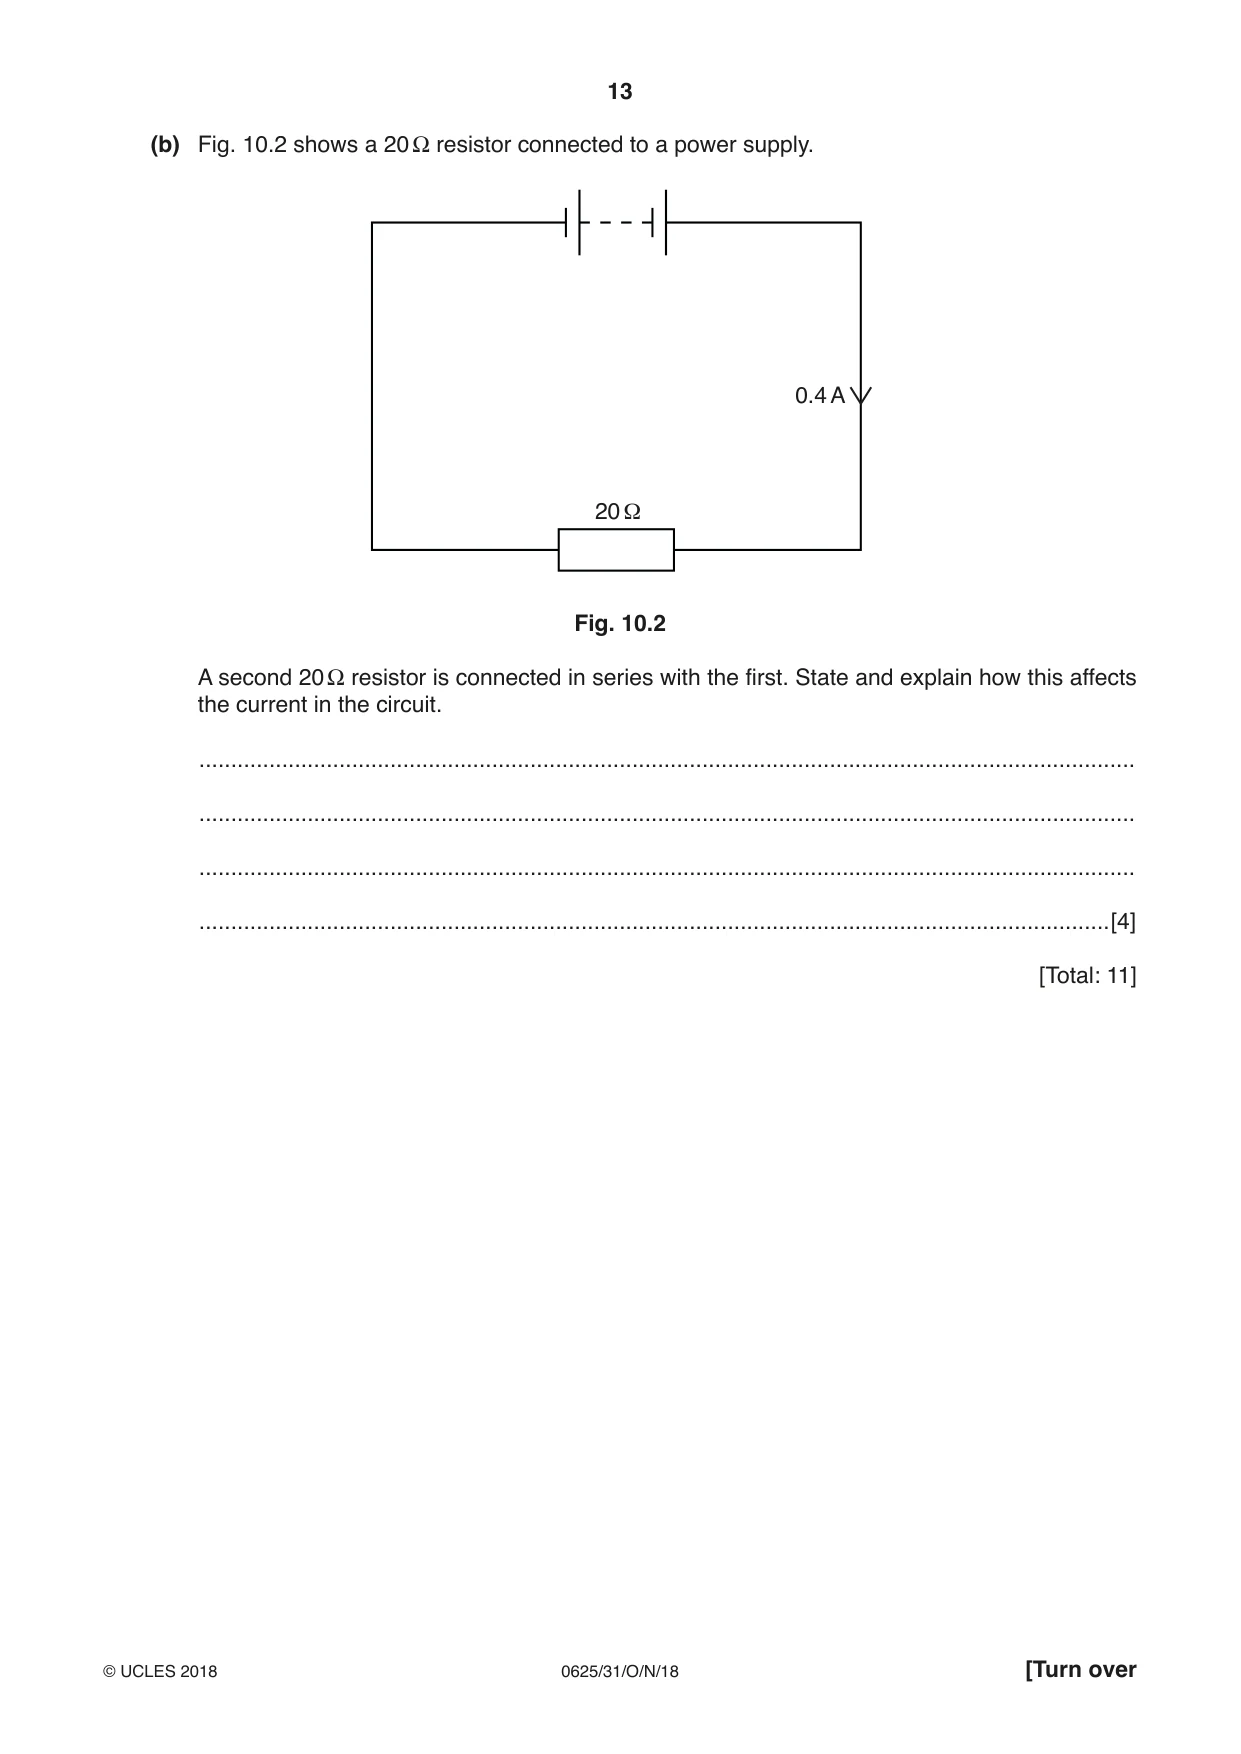
10 (a) A student does an experiment to determine the resistance of a fixed resistor, R. The student draws an incomplete diagram of the circuit, as shown in Fig. 10.1. open switch variable resistor R Fig. 10.1 (i) On Fig. 10.1, draw the missing circuit symbols. [3] (ii) Describe how the student could use the circuit to determine a reliable value for the resistance of R. ........................................................................................................................................... ........................................................................................................................................... ........................................................................................................................................... ........................................................................................................................................... ........................................................................................................................................... ........................................................................................................................................... ........................................................................................................................................... .......................................................................................................................................[4] (b) Fig. 10.2 shows a 20 Ω resistor connected to a power supply. 0.4 A 20 Ω Fig. 10.2 A second 20 Ω resistor is connected in series with the first. State and explain how this affects the current in the circuit. ................................................................................................................................................... ................................................................................................................................................... ................................................................................................................................................... ...............................................................................................................................................[4] [Total: 11]
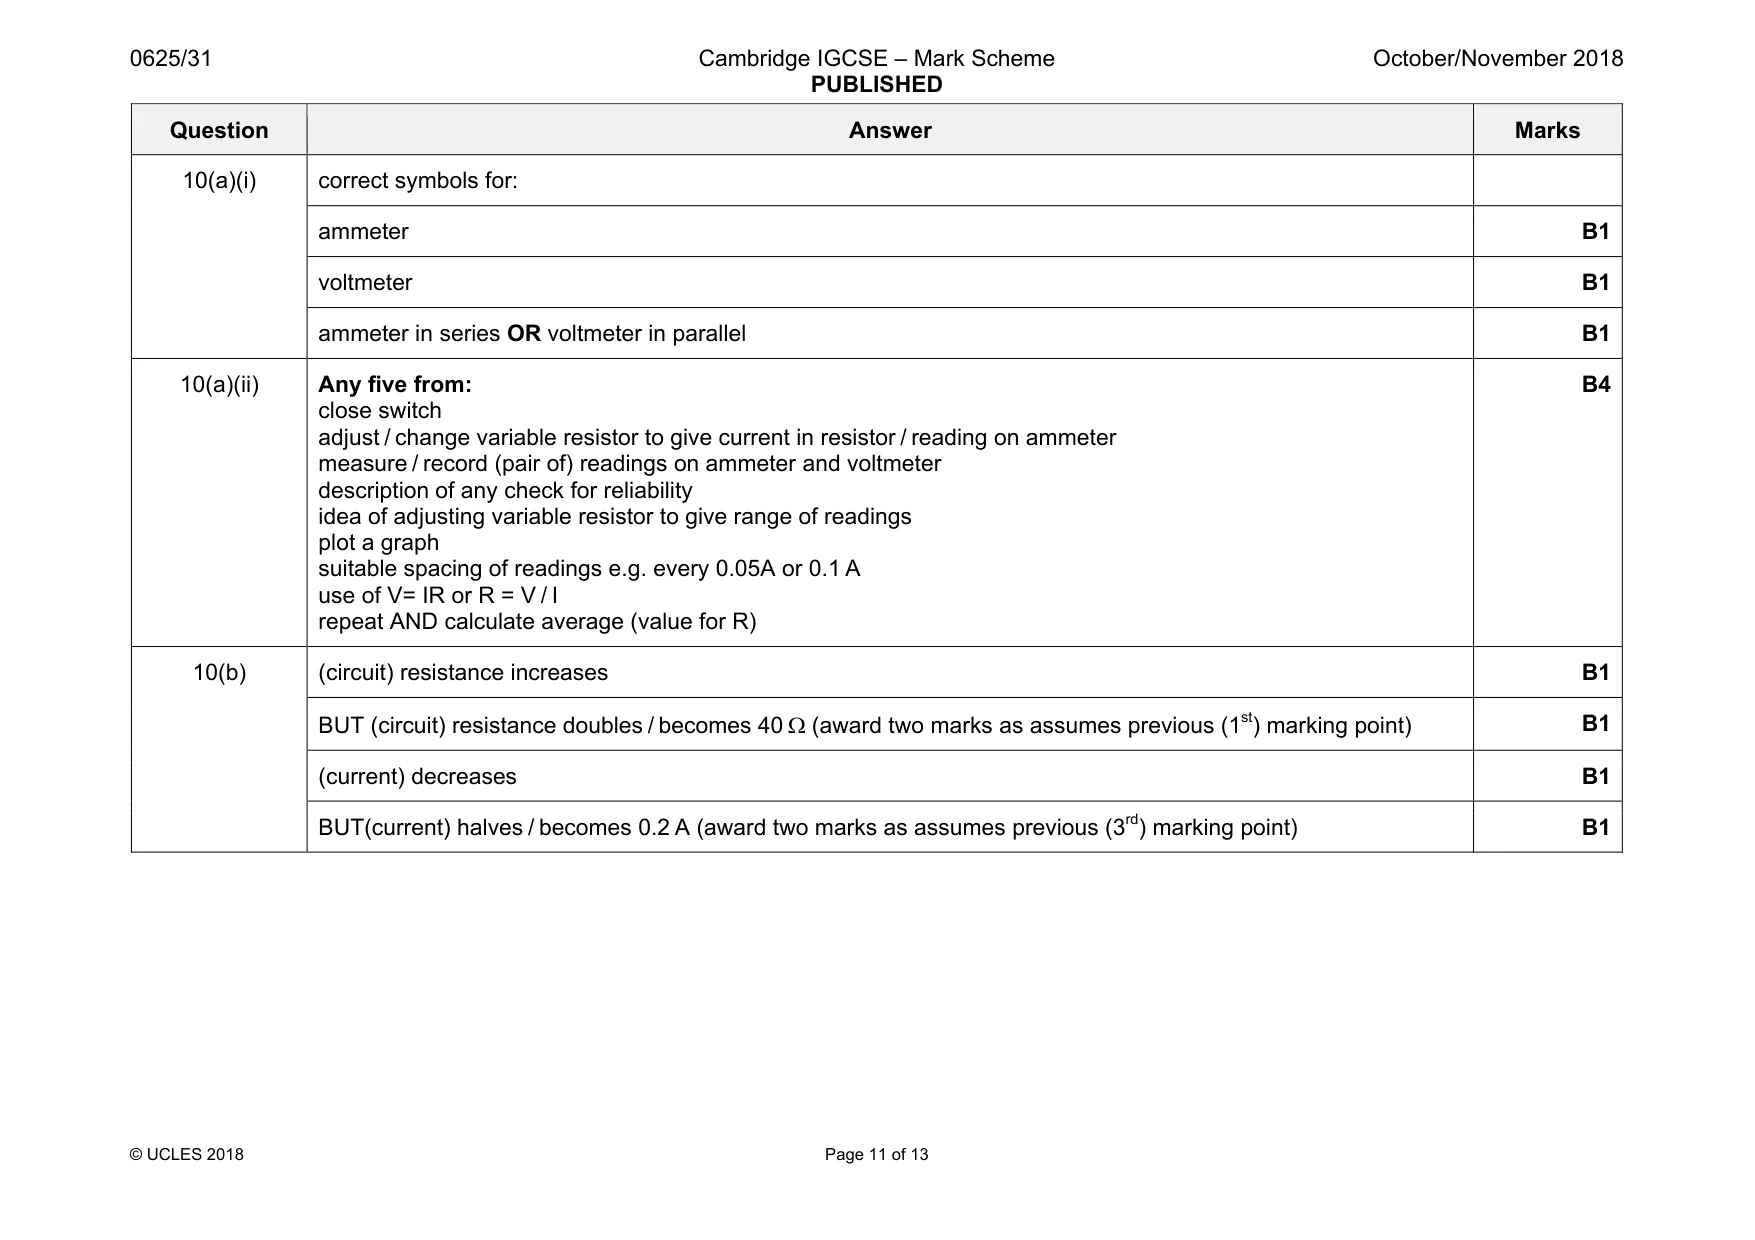
Mark scheme: 10(a)(i) correct symbols for: ammeter B1 voltmeter B1 ammeter in series OR voltmeter in parallel B1 10(a)(ii) Any five from: close switch adjust / change variable resistor to give current in resistor / reading on ammeter measure / record (pair of) readings on ammeter and voltmeter description of any check for reliability idea of adjusting variable resistor to give range of readings plot a graph suitable spacing of readings e.g. every 0.05A or 0.1 A use of V= IR or R = V / I repeat AND calculate average (value for R) B4 10(b) (circuit) resistance increases B1 BUT (circuit) resistance doubles / becomes 40 Ω (award two marks as assumes previous (1st) marking point) B1 (current) decreases B1 BUT(current) halves / becomes 0.2 A (award two marks as assumes previous (3rd) marking point) B1
Q11 · A student has a model electric railway
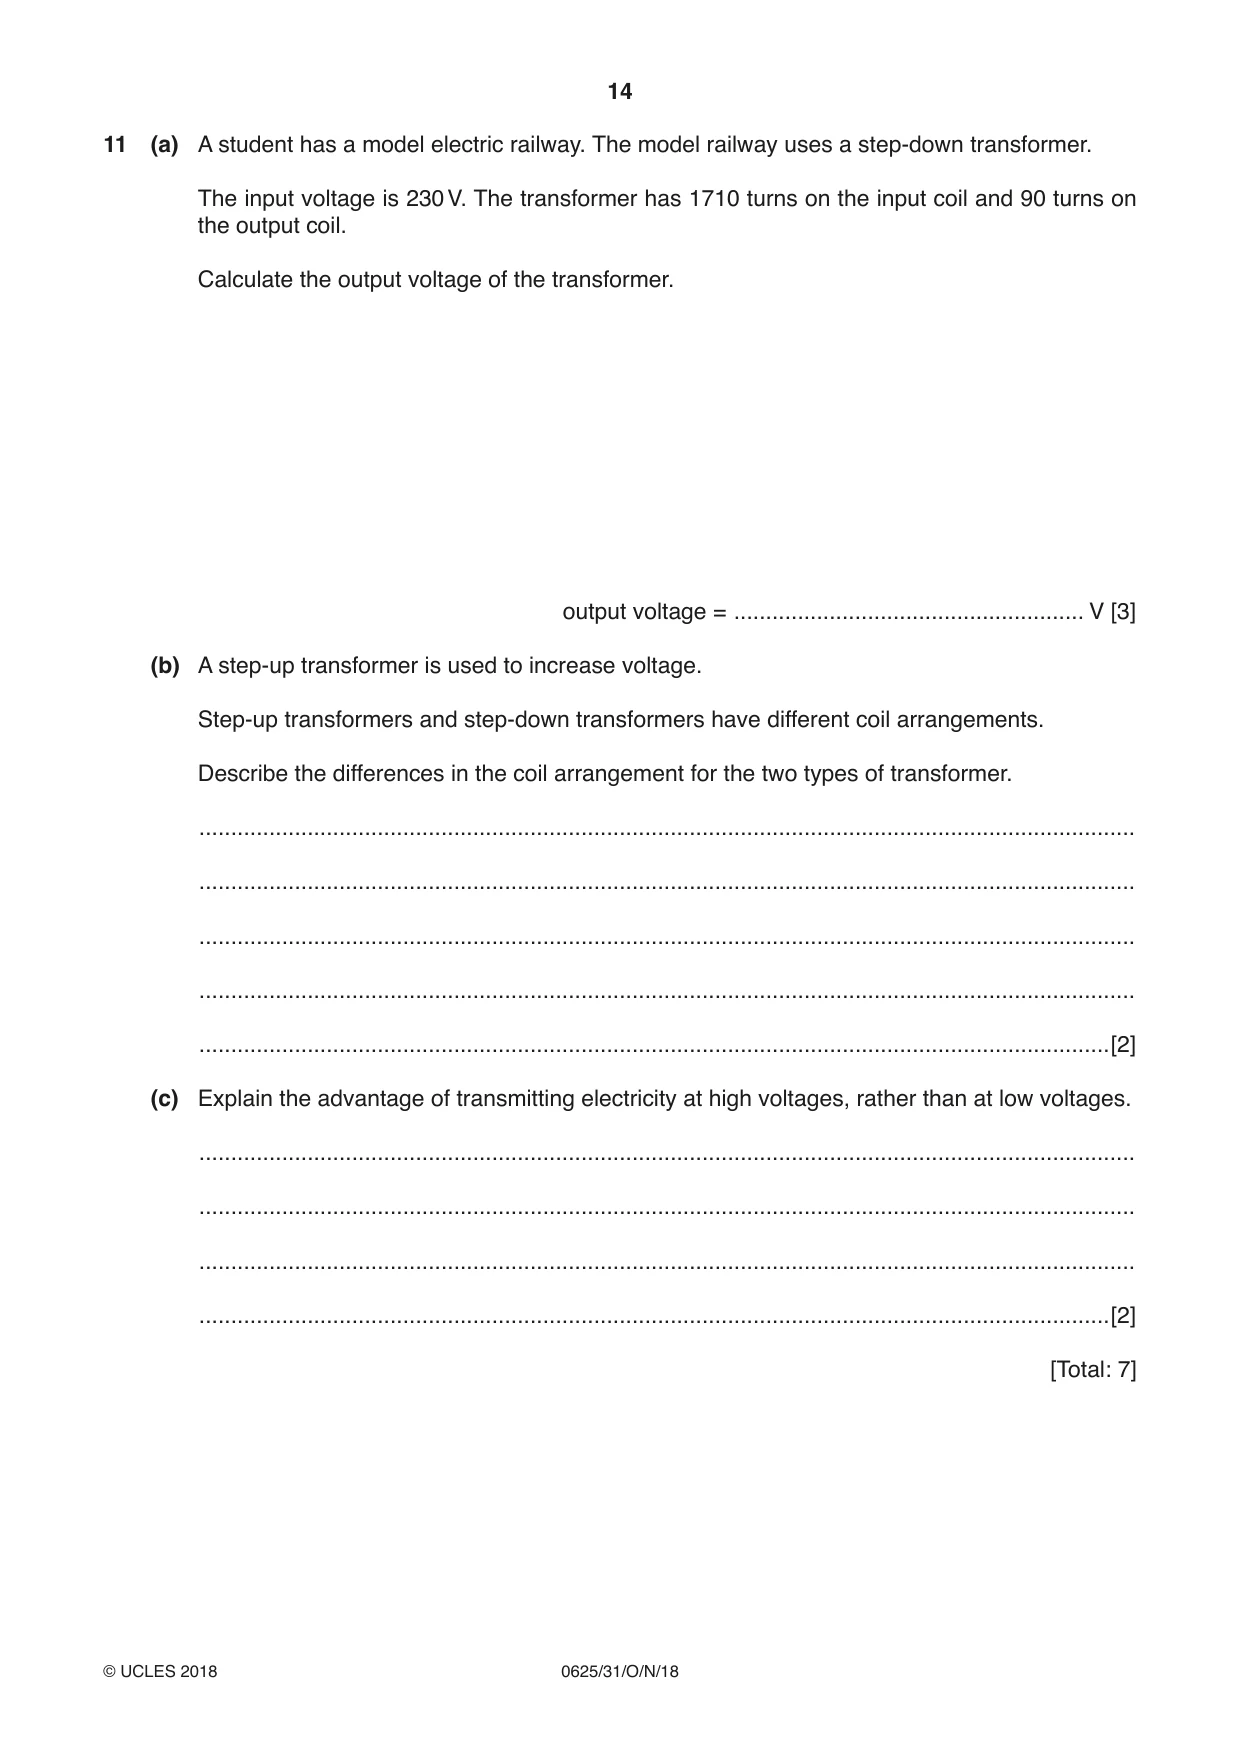
11 (a) A student has a model electric railway. The model railway uses a step-down transformer. The input voltage is 230 V. The transformer has 1710 turns on the input coil and 90 turns on the output coil. Calculate the output voltage of the transformer. output voltage = ....................................................... V [3] (b) A step-up transformer is used to increase voltage. Step-up transformers and step-down transformers have different coil arrangements. Describe the differences in the coil arrangement for the two types of transformer. ................................................................................................................................................... ................................................................................................................................................... ................................................................................................................................................... ................................................................................................................................................... ...............................................................................................................................................[2] (c) Explain the advantage of transmitting electricity at high voltages, rather than at low voltages. ................................................................................................................................................... ................................................................................................................................................... ................................................................................................................................................... ...............................................................................................................................................[2] [Total: 7]
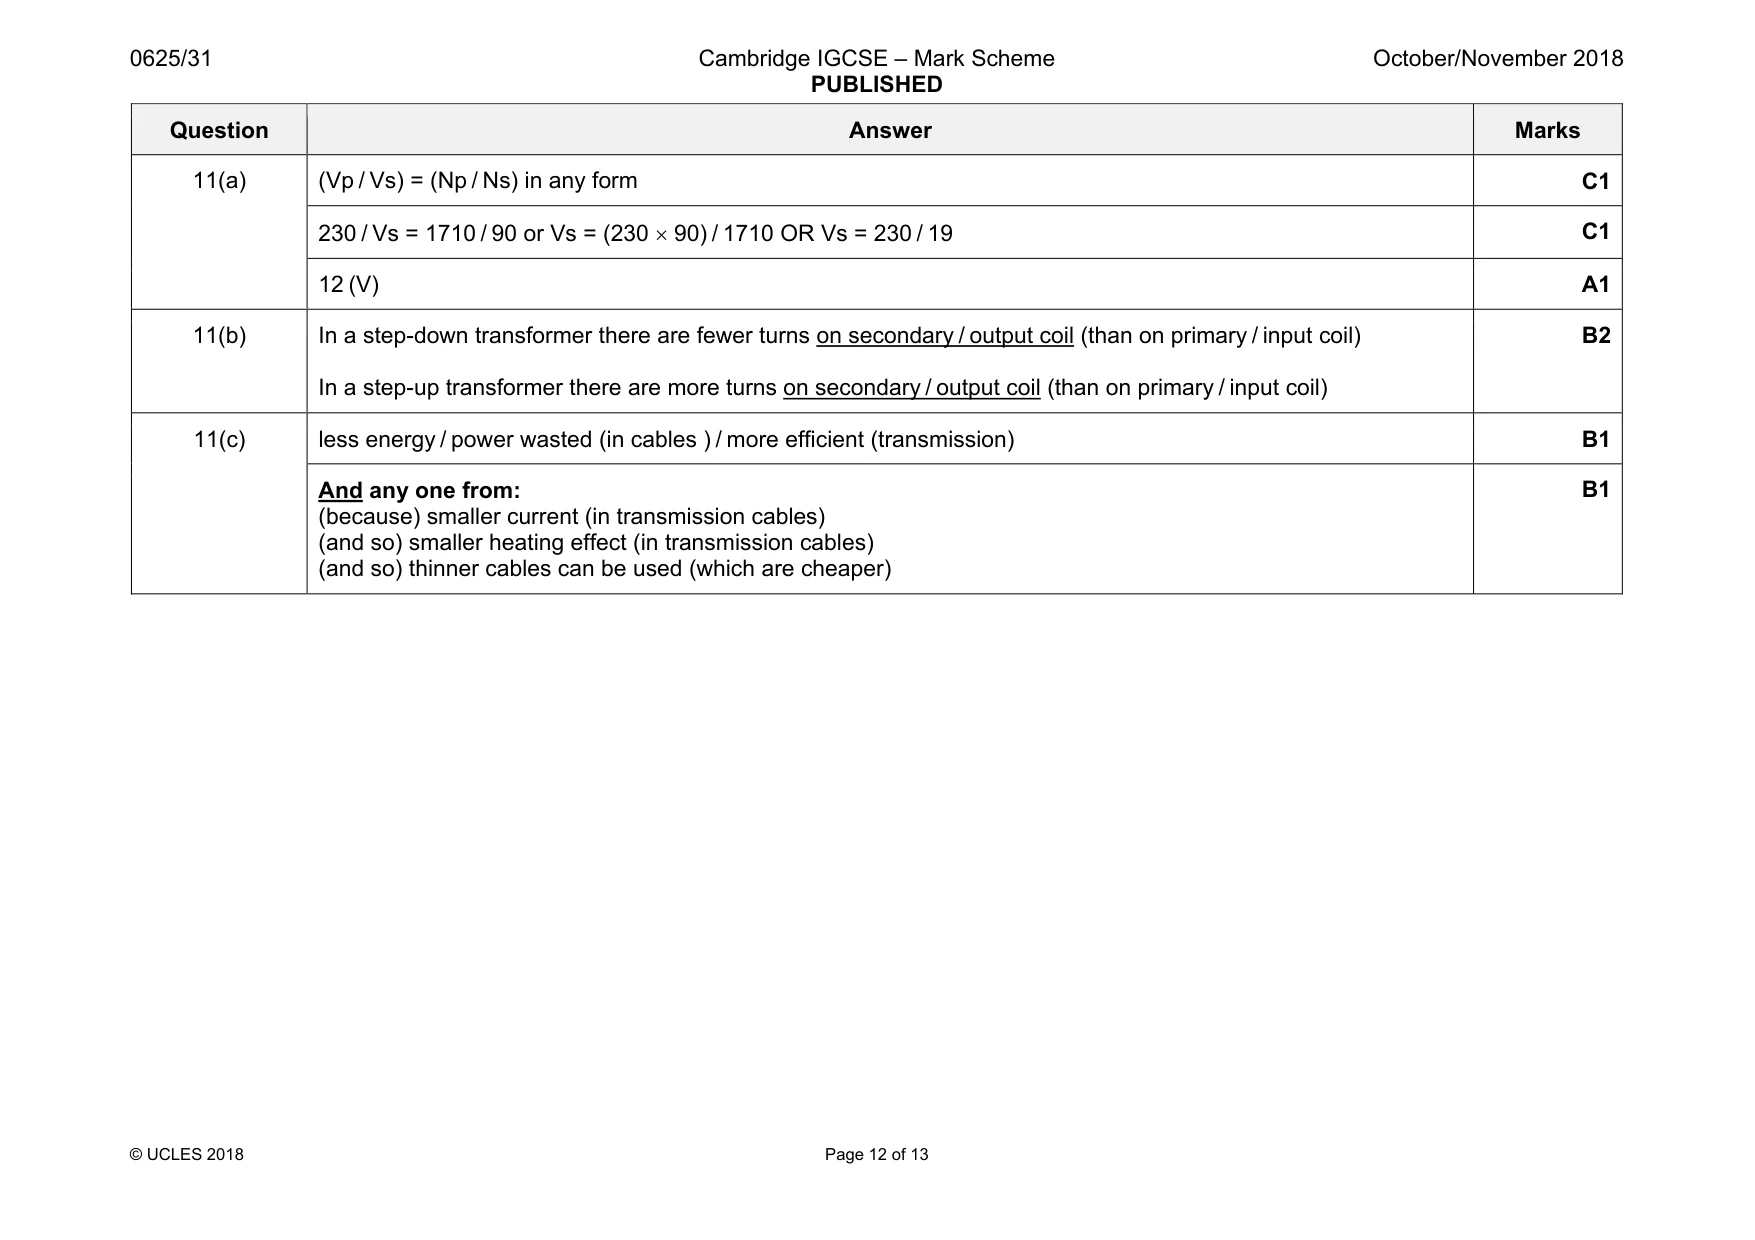
Mark scheme: 11(a) (Vp / Vs) = (Np / Ns) in any form C1 230 / Vs = 1710 / 90 or Vs = (230 × 90) / 1710 OR Vs = 230 / 19 C1 12 (V) A1 11(b) In a step-down transformer there are fewer turns on secondary / output coil (than on primary / input coil) In a step-up transformer there are more turns on secondary / output coil (than on primary / input coil) B2 11(c) less energy / power wasted (in cables ) / more efficient (transmission) B1 And any one from: (because) smaller current (in transmission cables) (and so) smaller heating effect (in transmission cables) (and so) thinner cables can be used (which are cheaper) B1
Q12 · This notation represents the nucleus of a neutral atom of carbon-14
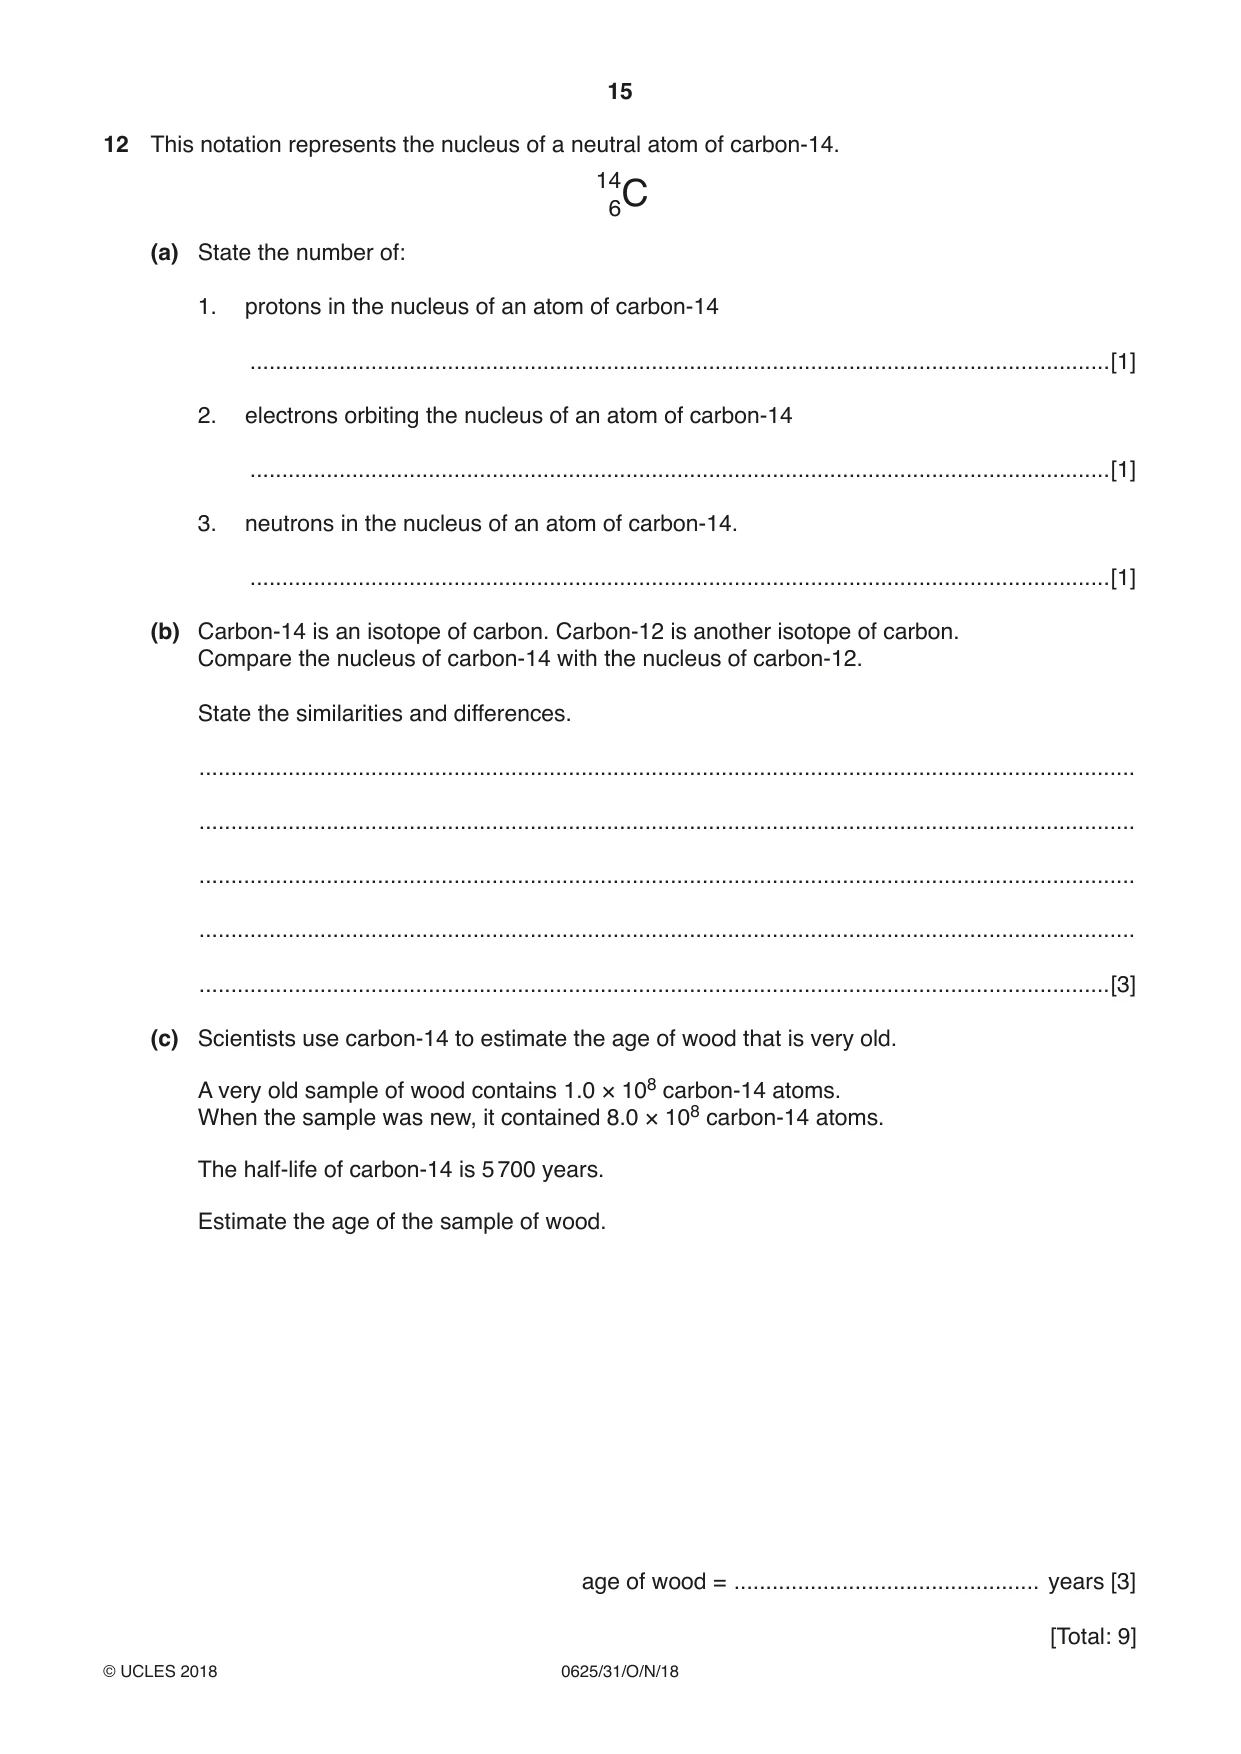
12 This notation represents the nucleus of a neutral atom of carbon-14. 146C (a) State the number of: 1. protons in the nucleus of an atom of carbon-14 .......................................................................................................................................[1] 2. electrons orbiting the nucleus of an atom of carbon-14 .......................................................................................................................................[1] 3. neutrons in the nucleus of an atom of carbon-14. .......................................................................................................................................[1] (b) Carbon-14 is an isotope of carbon. Carbon-12 is another isotope of carbon. Compare the nucleus of carbon-14 with the nucleus of carbon-12. State the similarities and differences. ................................................................................................................................................... ................................................................................................................................................... ................................................................................................................................................... ................................................................................................................................................... ...............................................................................................................................................[3] (c) Scientists use carbon-14 to estimate the age of wood that is very old. A very old sample of wood contains 1.0 × 10⁸ carbon-14 atoms. When the sample was new, it contained 8.0 × 10⁸ carbon-14 atoms. The half-life of carbon-14 is 5 700 years. Estimate the age of the sample of wood. age of wood = ................................................ years [3]
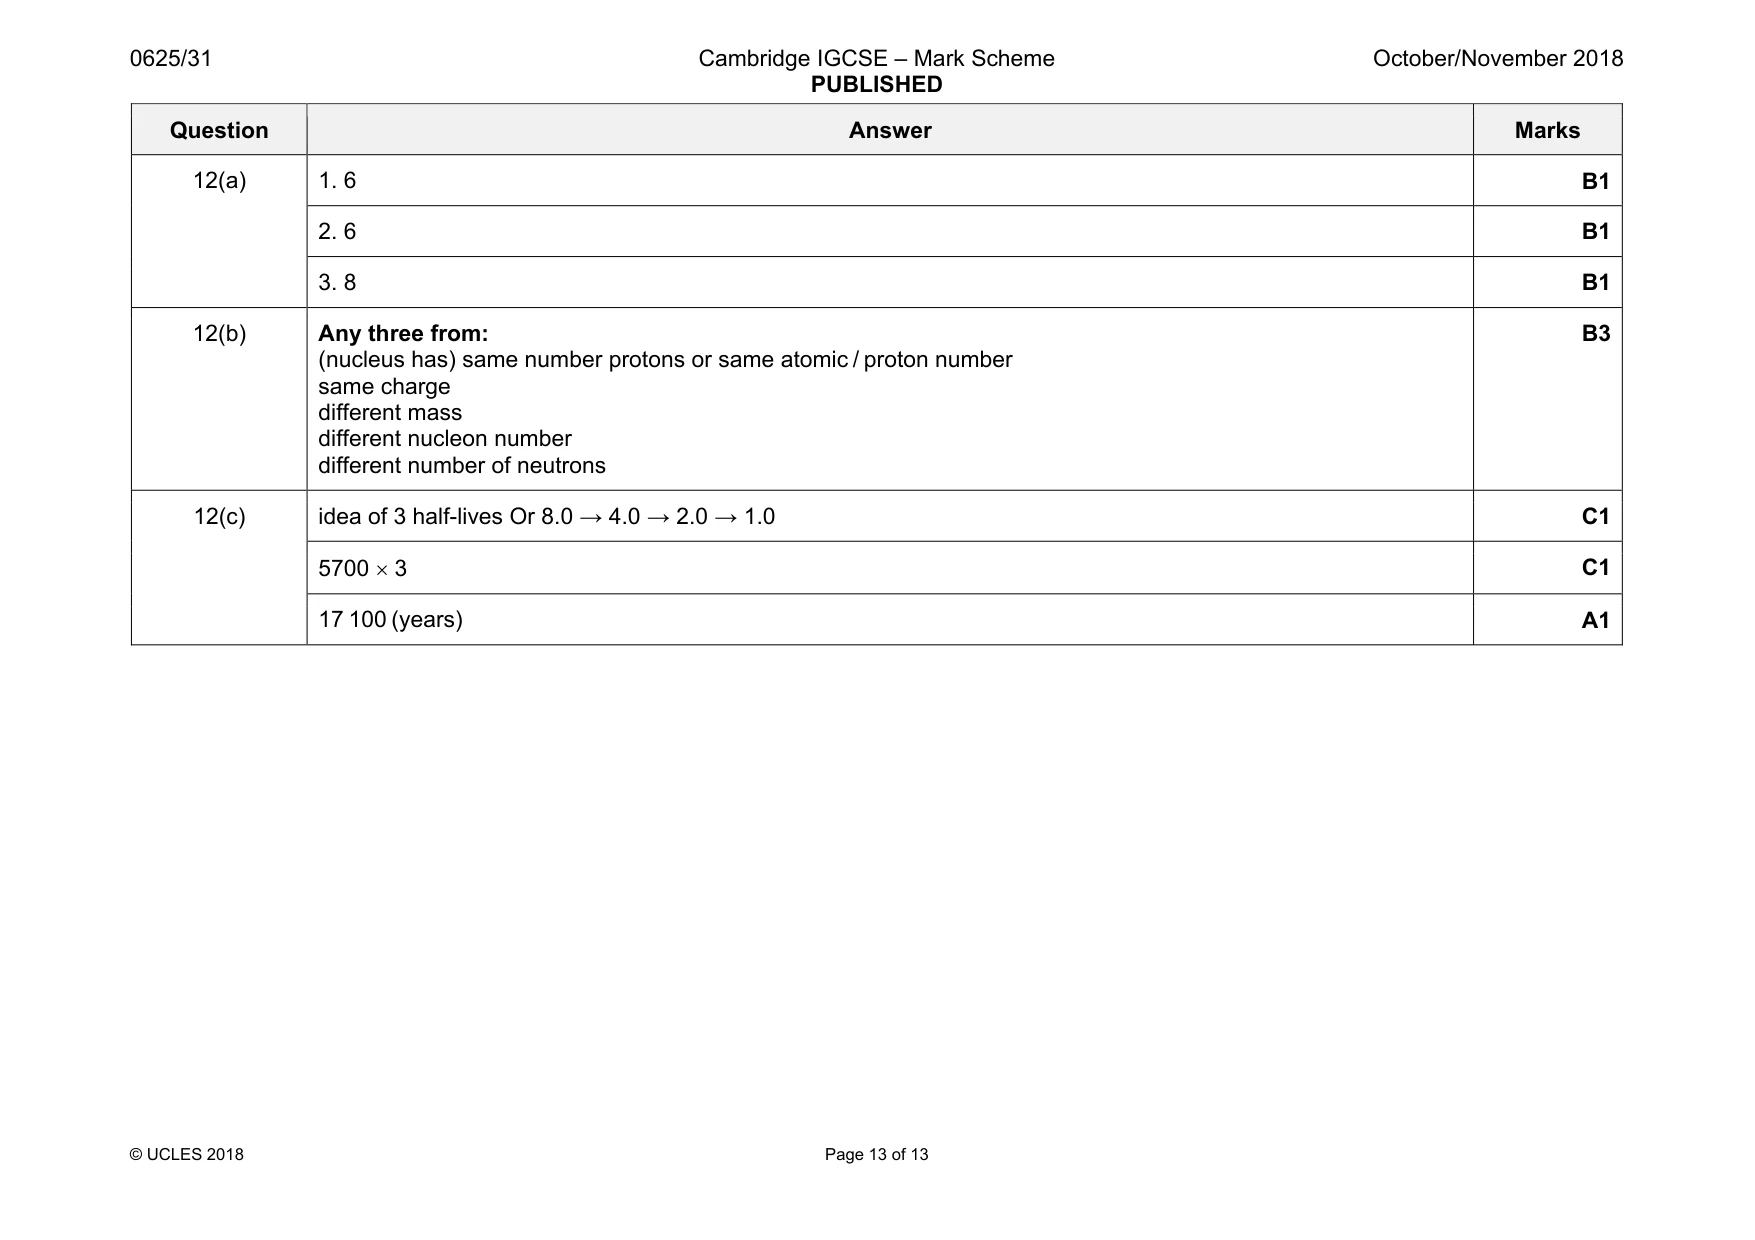
Mark scheme: 12(a) 1. 6 B1 2. 6 B1 3. 8 B1 12(b) Any three from: (nucleus has) same number protons or same atomic / proton number same charge different mass different nucleon number different number of neutrons B3 12(c) idea of 3 half-lives Or 8.0 → 4.0 → 2.0 → 1.0 C1 5700 × 3 C1 17 100 (years) A1
What was in this paper
The subtopics covered by these 12 questions, and how many questions each got. Open one in a new tab to see every Cambridge question on it.
What you needed in this session
Cambridge’s own grade thresholds for 2018 Oct/Nov, Paper 3 · Variant 1. A higher threshold means an easier paper — the bar moves with how the cohort did.