Cambridge IGCSE Physics 0625 — 2021 Oct/Nov Paper 3 · Variant 3
0625/33/O/N/21 · 11 questions · 80 marks · ≈90 min
The question paper and its mark scheme, free to read here and free to download. This is Cambridge’s own paper, exactly as it was sat.
Question paper20 pages

Mark scheme13 pages
Answers below. Sit the paper first if you are practising.
Questions as text
Q1 · A plant pot falling from an upstairs balcony
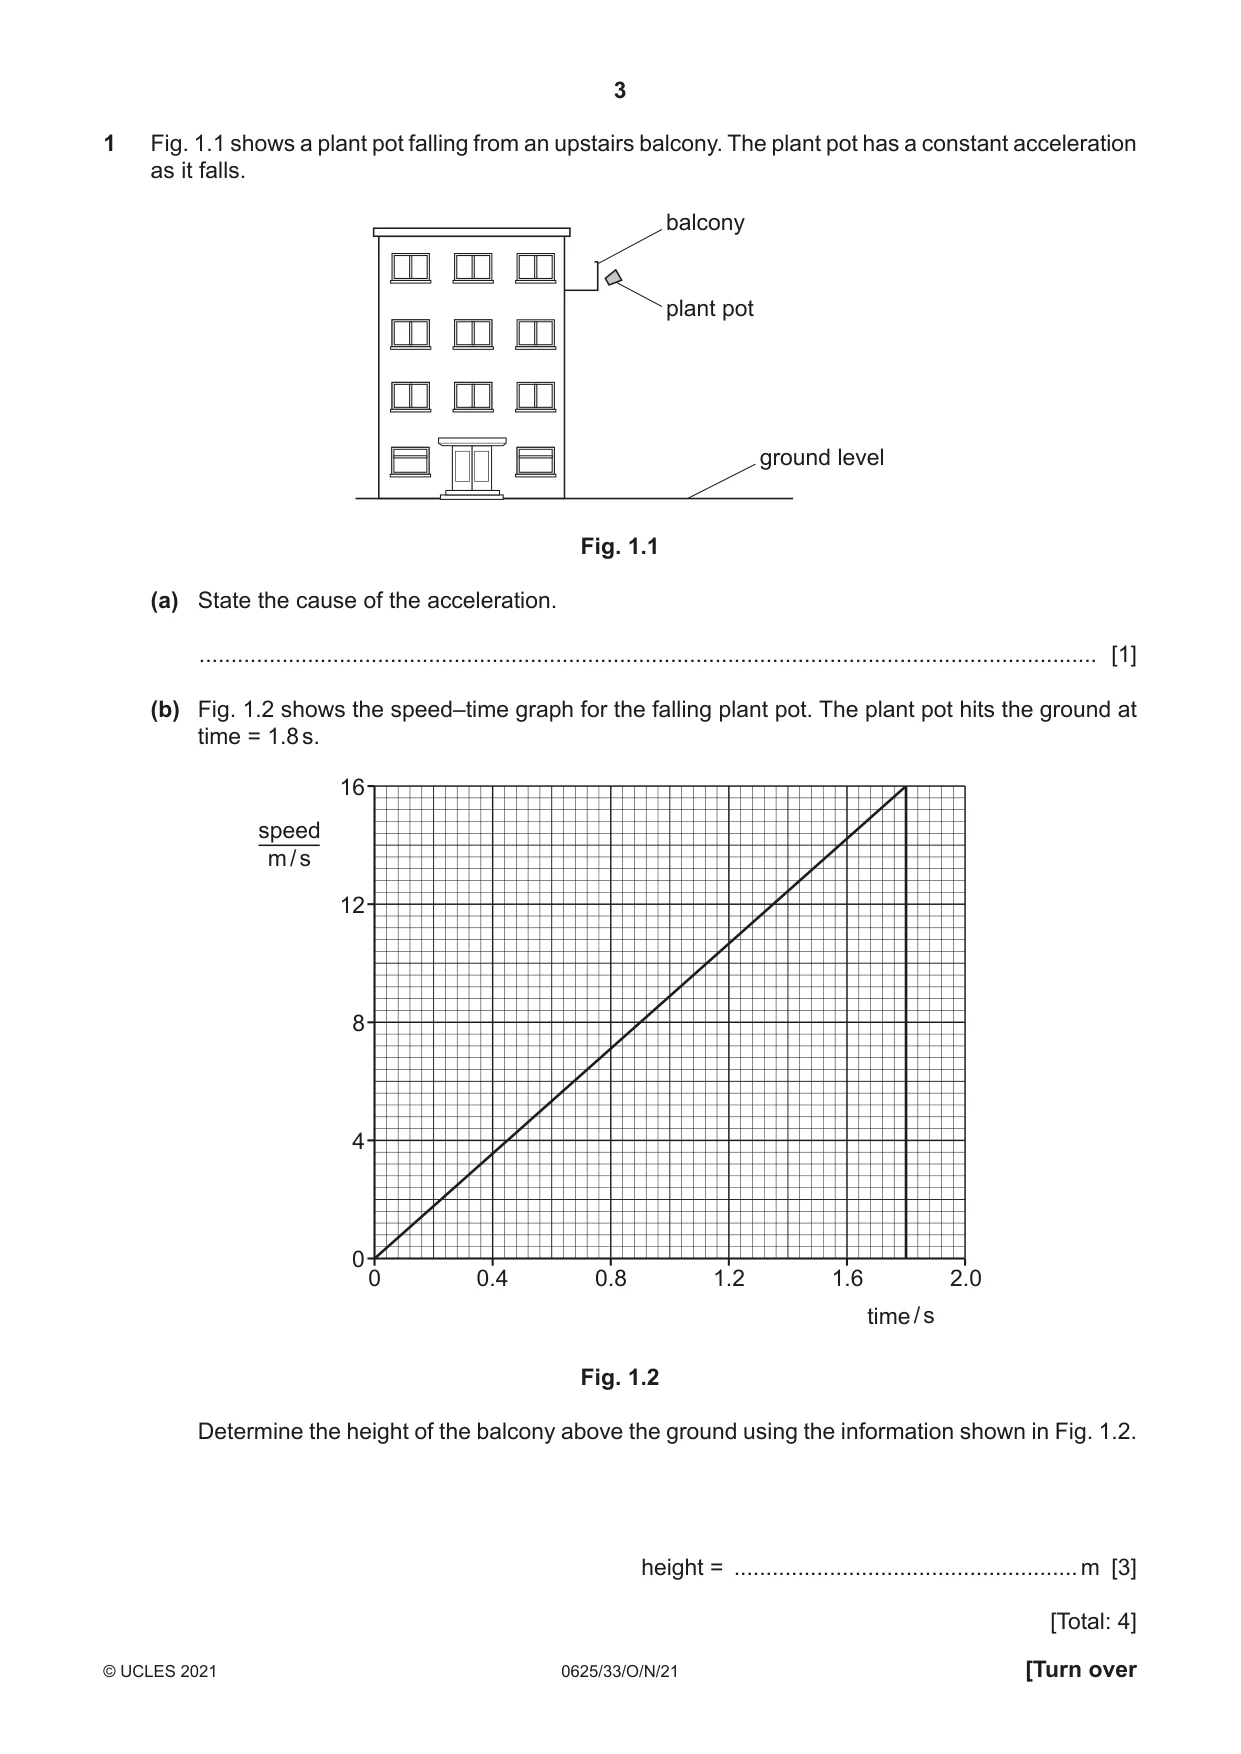
1 Fig. 1.1 shows a plant pot falling from an upstairs balcony. The plant pot has a constant acceleration as it falls. balcony plant pot ground level Fig. 1.1 (a) State the cause of the acceleration. ............................................................................................................................................. [1] (b) Fig. 1.2 shows the speed–time graph for the falling plant pot. The plant pot hits the ground at time = 1.8 s. 16 speed m / s 12 8 4 0 0 0.4 0.8 1.2 1.6 2.0 time / s Fig. 1.2 Determine the height of the balcony above the ground using the information shown in Fig. 1.2. height = ......................................................m [3] [Total: 4]
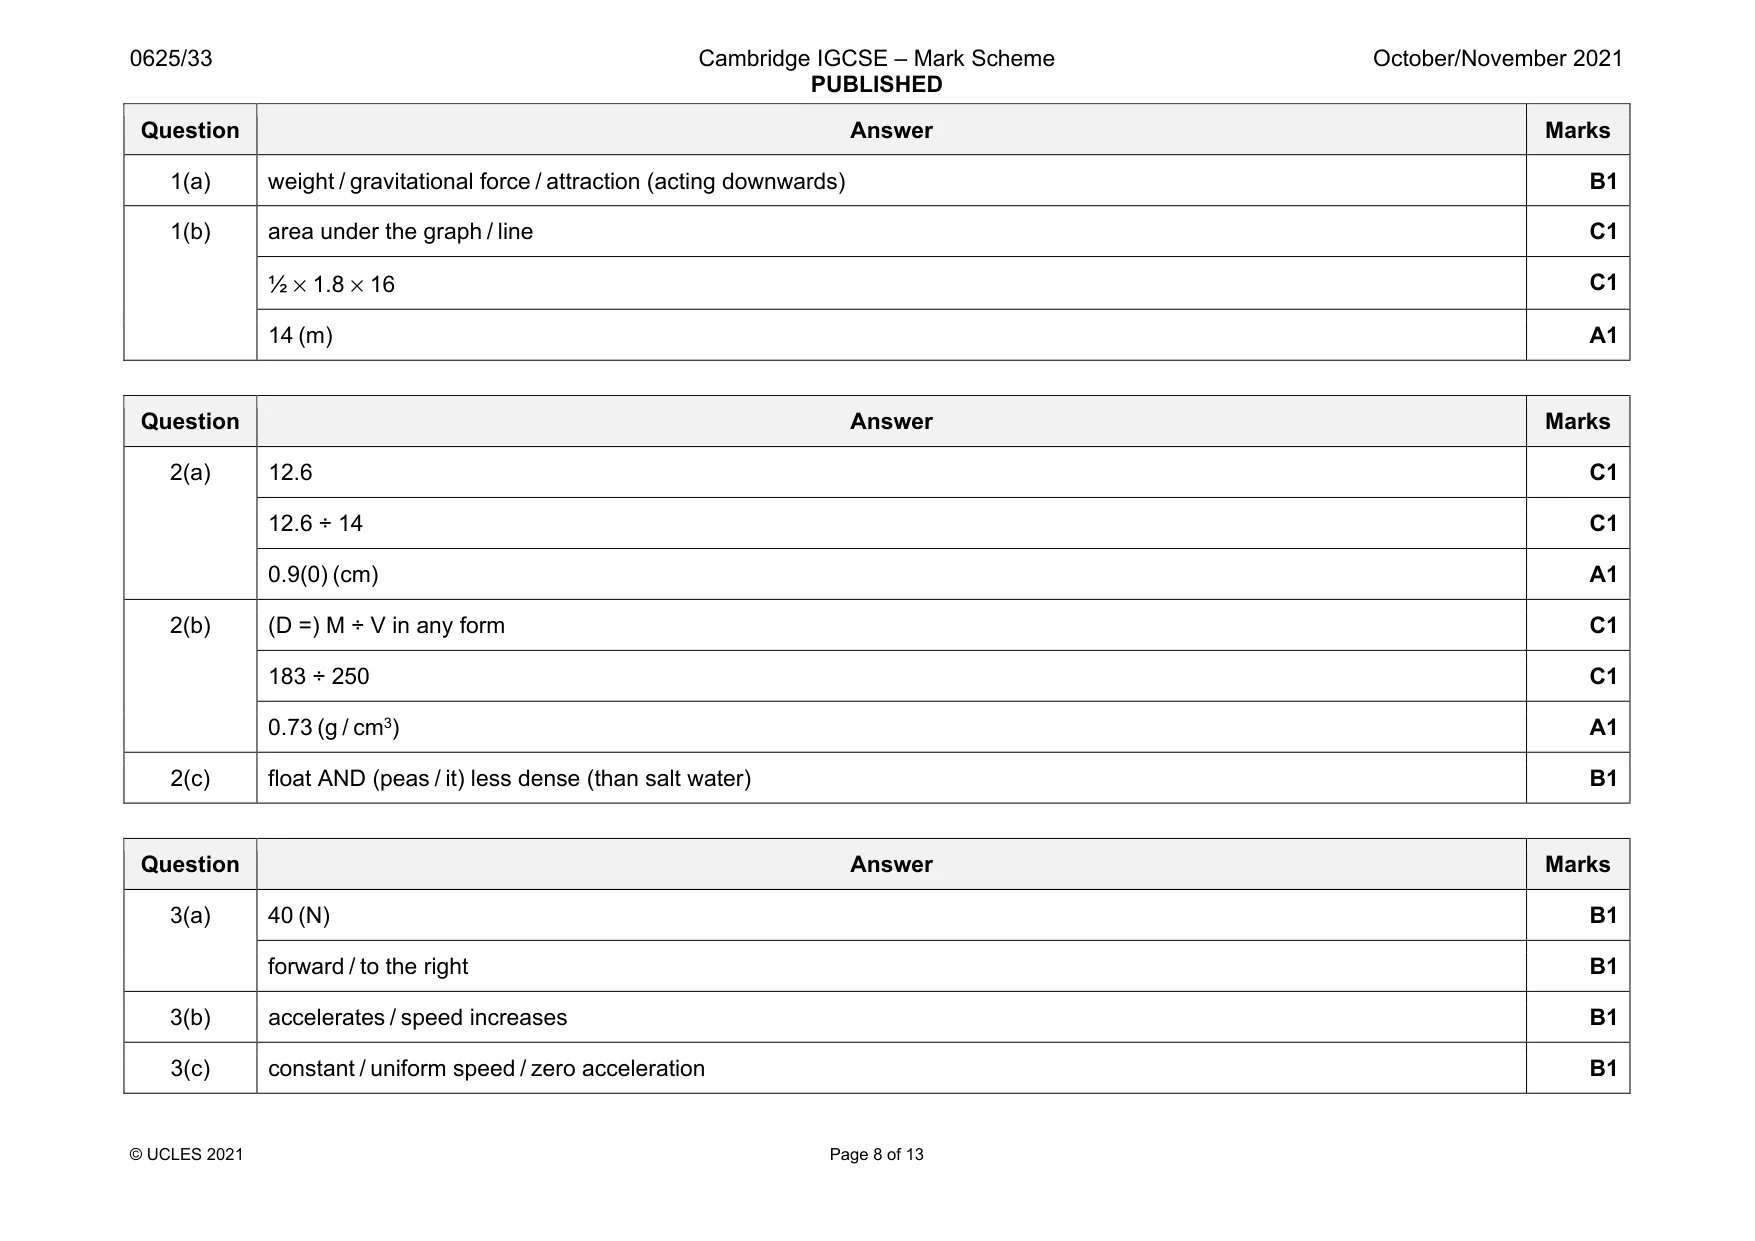
Mark scheme: 1(a) weight / gravitational force / attraction (acting downwards) B1 1(b) area under the graph / line C1 ½ × 1.8 × 16 C1 14 (m) A1
Question 2
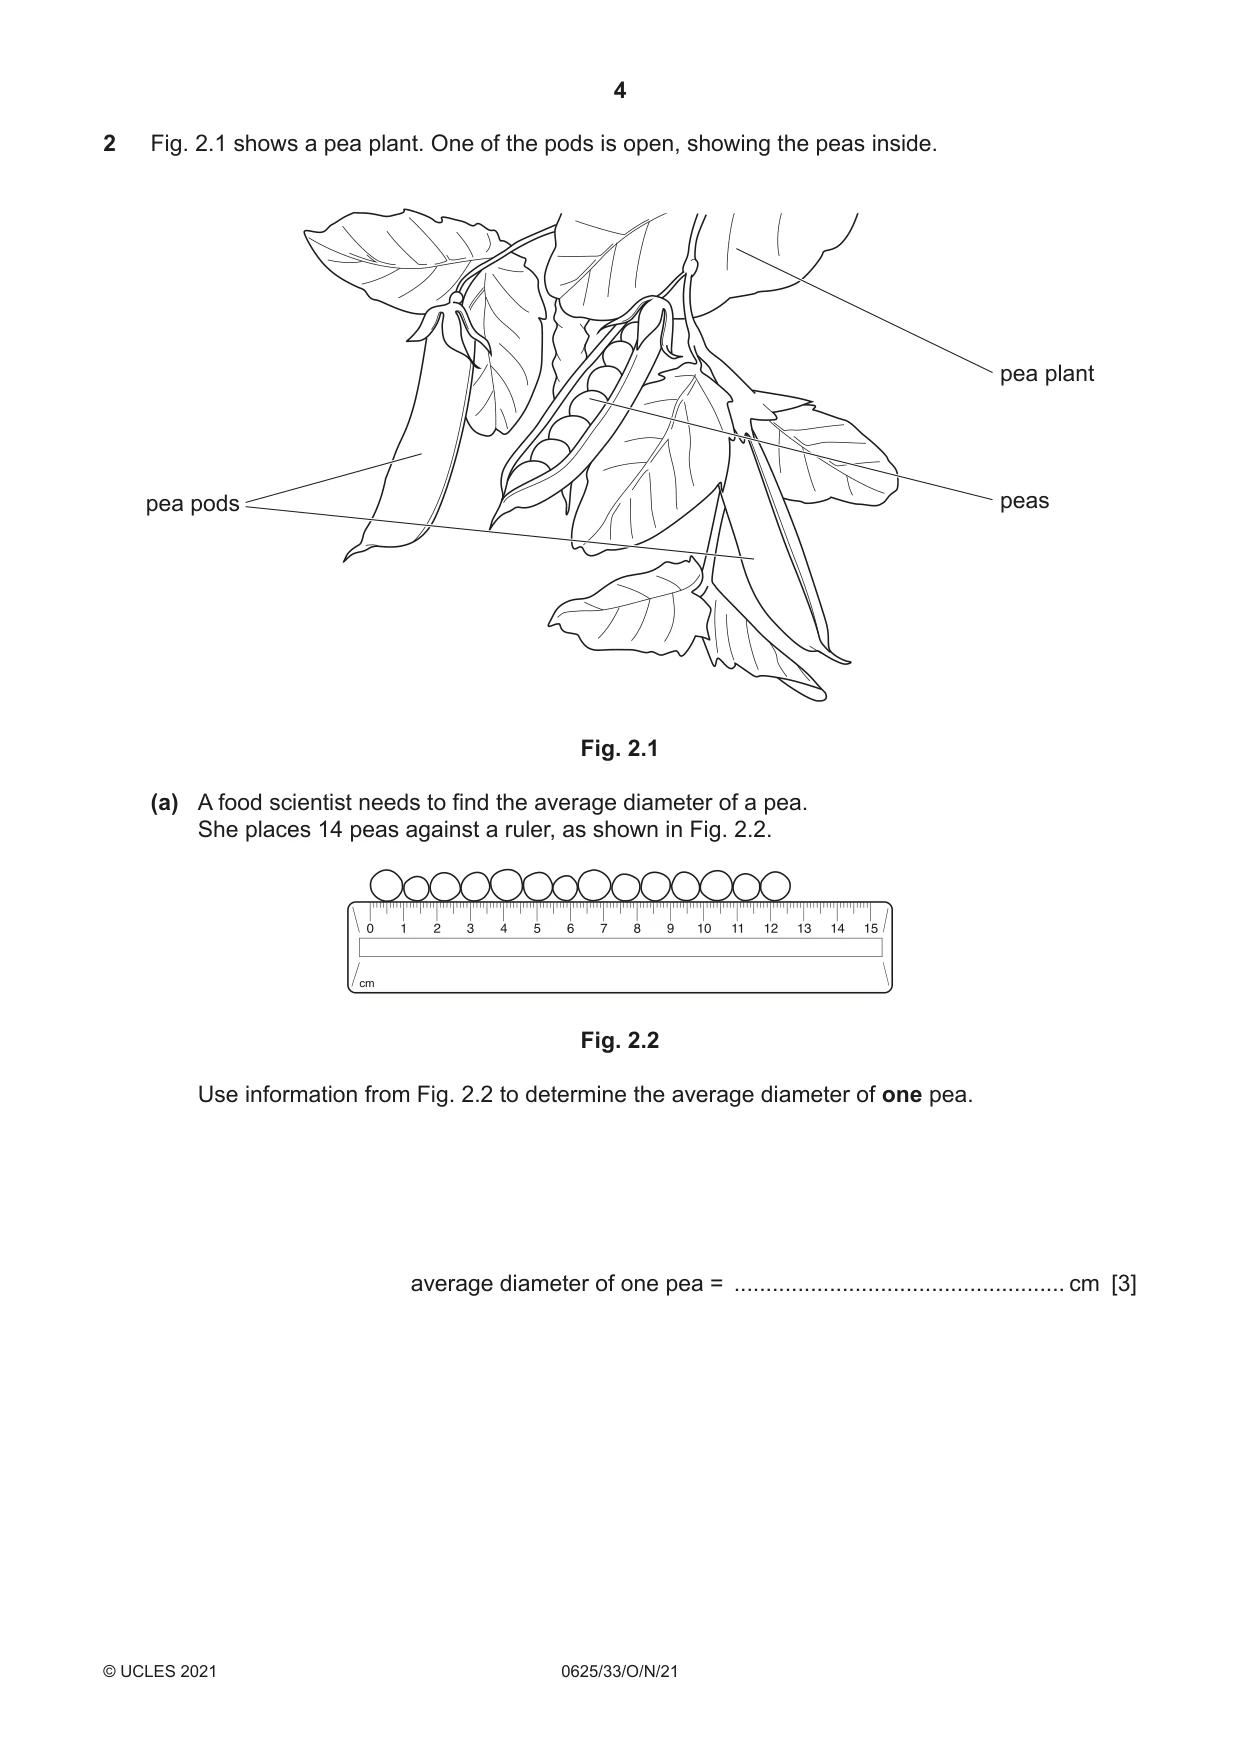
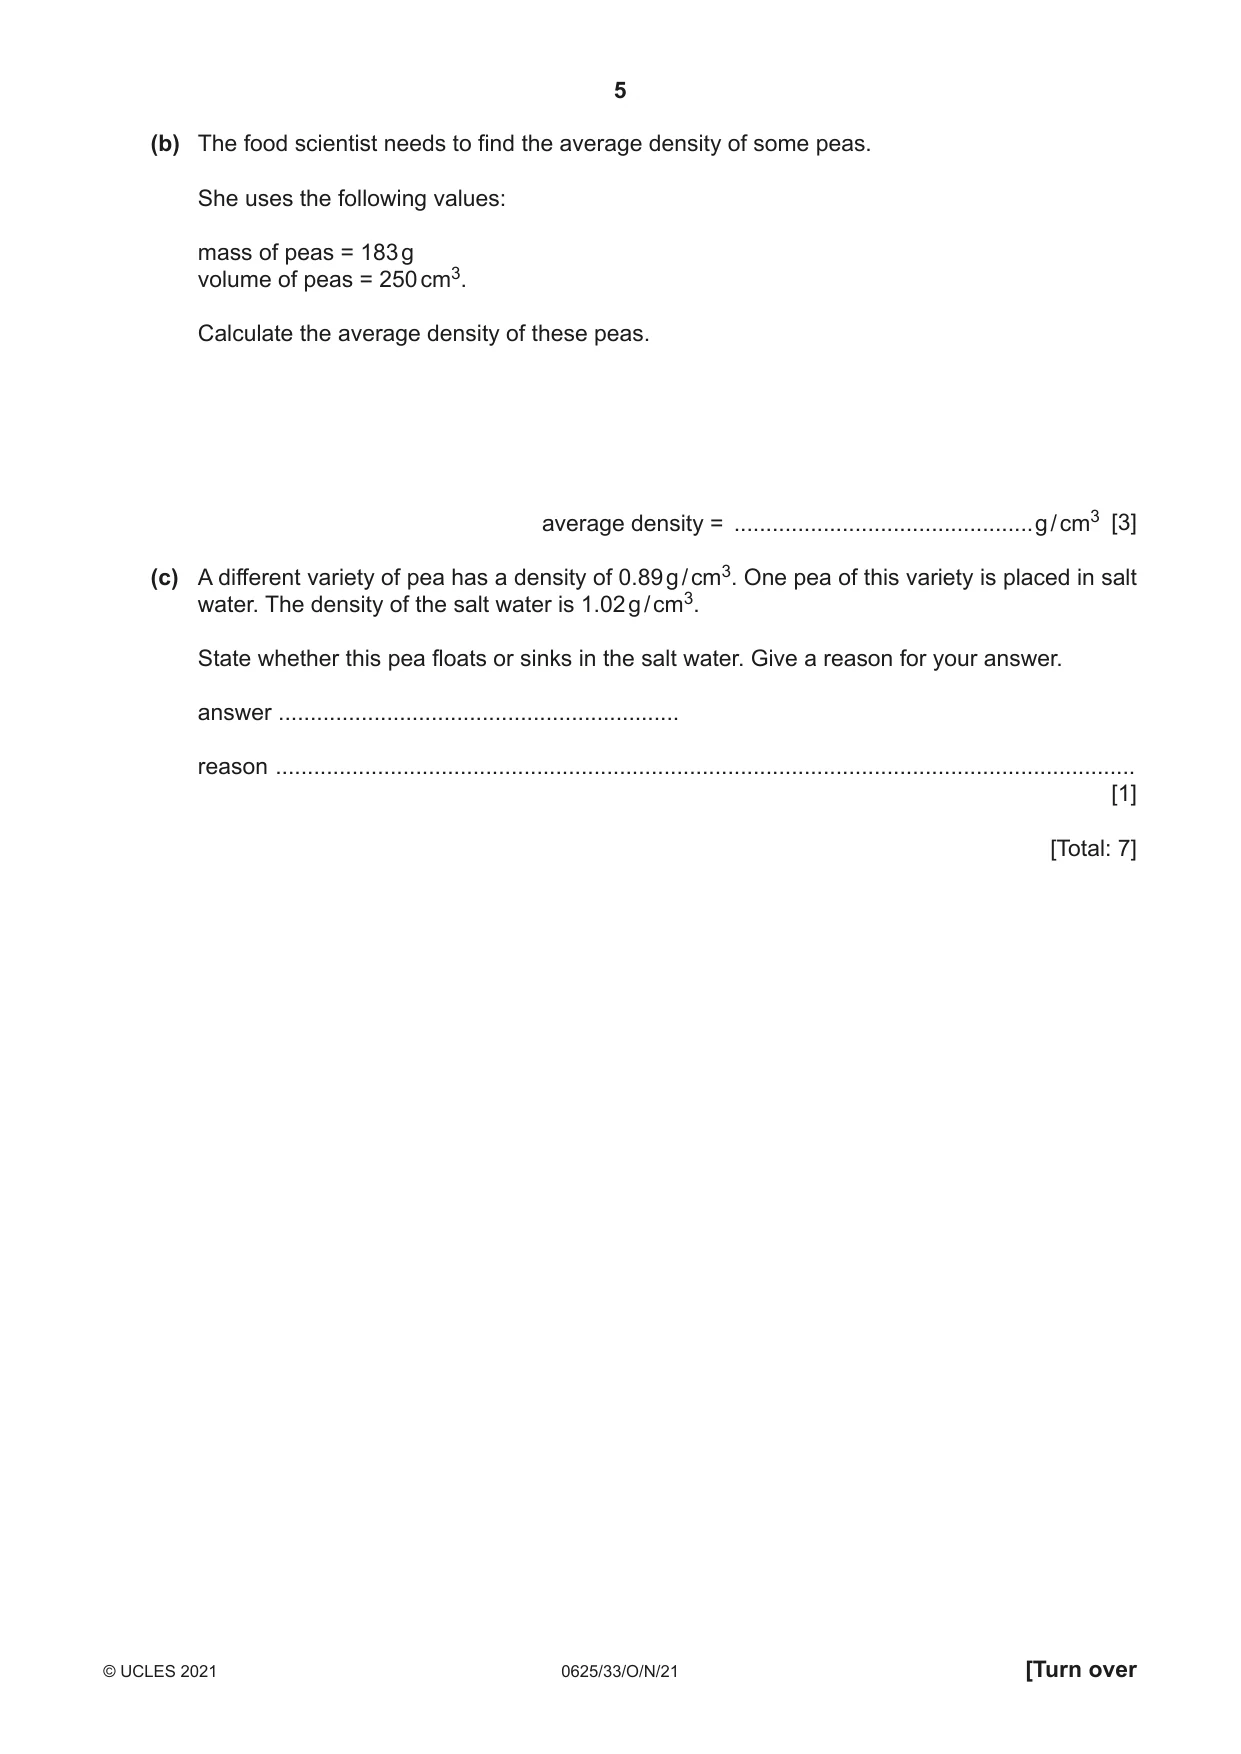
2 Fig. 2.1 shows a pea plant. One of the pods is open, showing the peas inside. pea plant pea pods peas Fig. 2.1 (a) A food scientist needs to find the average diameter of a pea. She places 14 peas against a ruler, as shown in Fig. 2.2. Fig. 2.2 Use information from Fig. 2.2 to determine the average diameter of one pea. average diameter of one pea = .................................................... cm [3] (b) The food scientist needs to find the average density of some peas. She uses the following values: mass of peas = 183 g volume of peas = 250 cm3. Calculate the average density of these peas. average density = ...............................................g / cm3 [3] (c) A different variety of pea has a density of 0.89 g / cm3. One pea of this variety is placed in salt water. The density of the salt water is 1.02 g / cm3. State whether this pea floats or sinks in the salt water. Give a reason for your answer. answer ............................................................... reason ....................................................................................................................................... [1] [Total: 7]
Mark scheme: 2(a) 12.6 C1 12.6 ÷ 14 C1 0.9(0) (cm) A1 2(b) (D =) M ÷ V in any form C1 183 ÷ 250 C1 0.73 (g / cm3) A1 2(c) float AND (peas / it) less dense (than salt water) B1
Q3 · The horizontal forces acting on a skateboarder
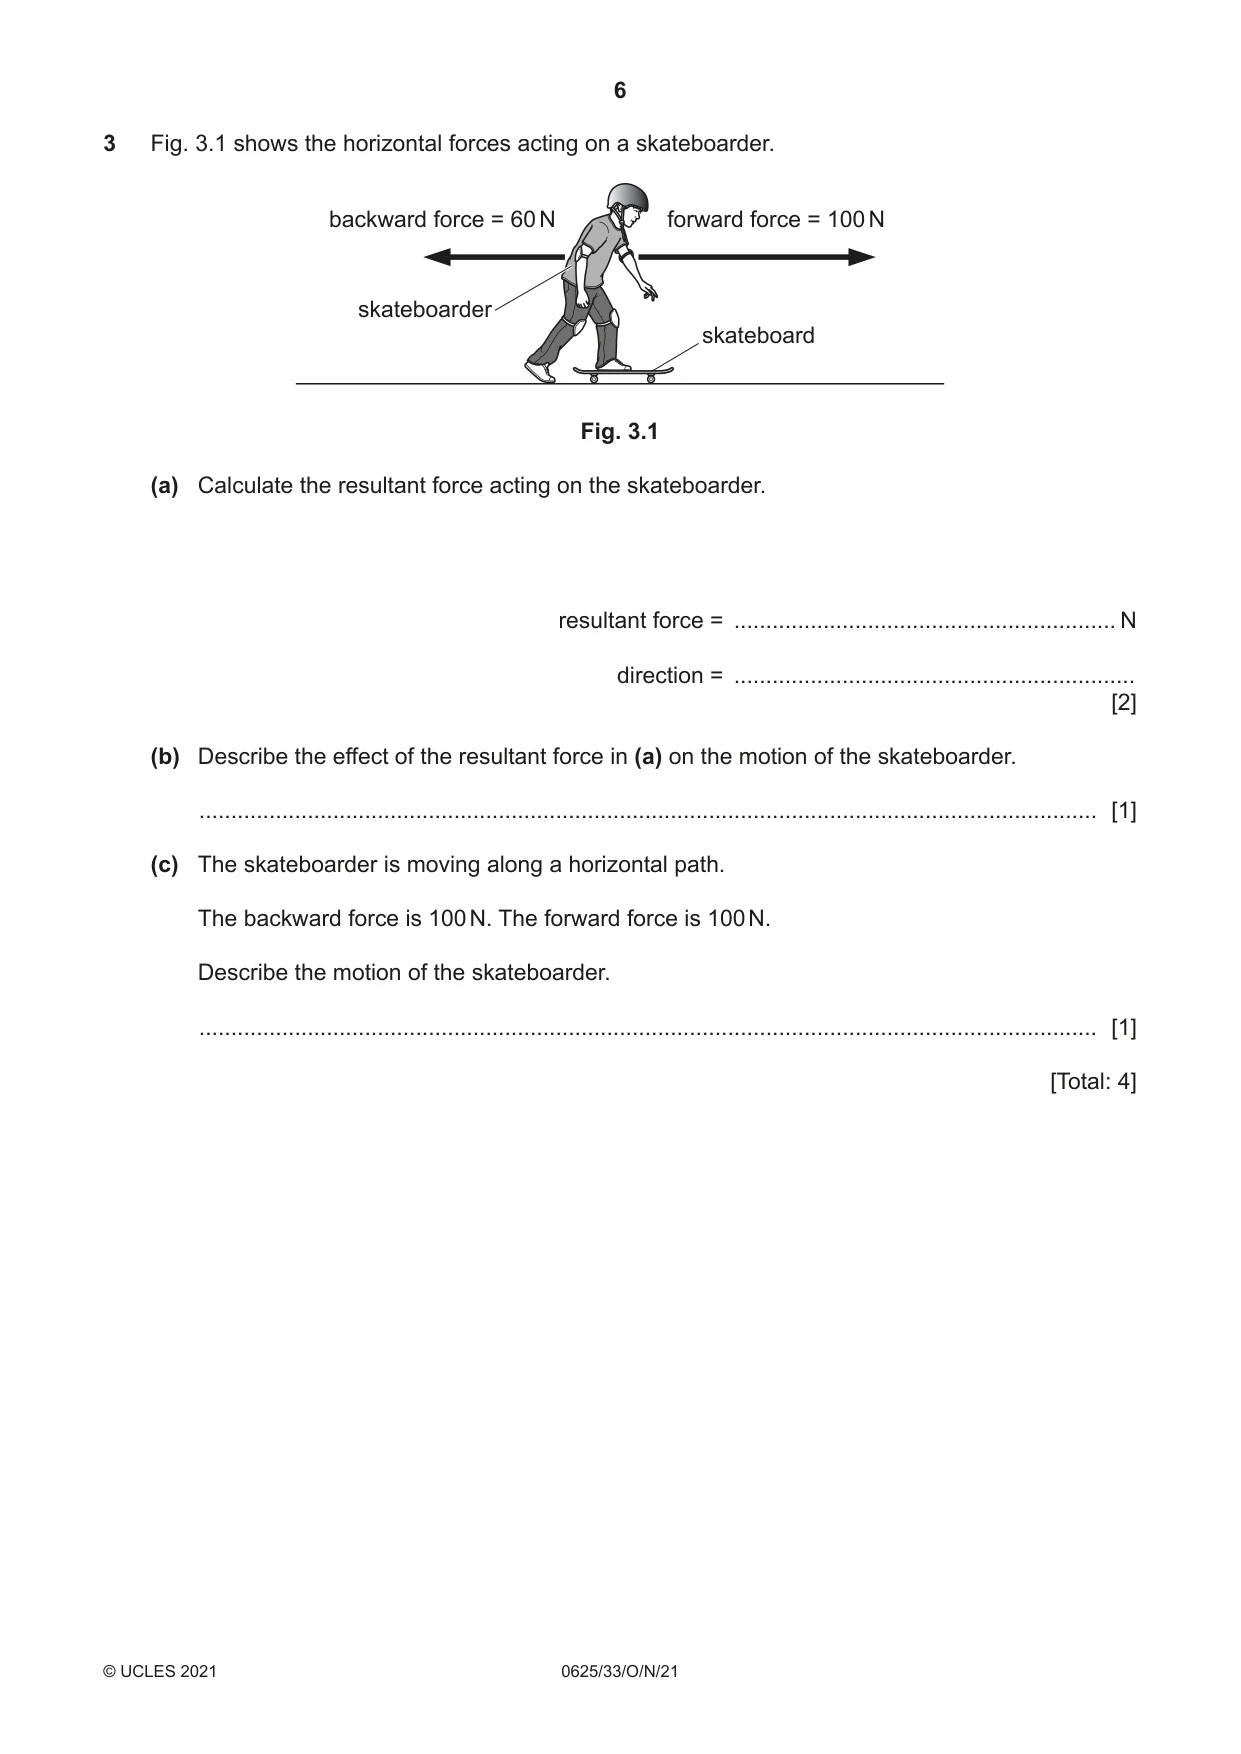
3 Fig. 3.1 shows the horizontal forces acting on a skateboarder. backward force = 60 N forward force = 100 N skateboarder skateboard Fig. 3.1 (a) Calculate the resultant force acting on the skateboarder. resultant force = ............................................................ N direction = ............................................................... [2] (b) Describe the effect of the resultant force in (a) on the motion of the skateboarder. ............................................................................................................................................. [1] (c) The skateboarder is moving along a horizontal path. The backward force is 100 N. The forward force is 100 N. Describe the motion of the skateboarder. ............................................................................................................................................. [1] [Total: 4]
Mark scheme: 3(a) 40 (N) B1 forward / to the right B1 3(b) accelerates / speed increases B1 3(c) constant / uniform speed / zero acceleration B1
Q4 · State the principle of conservation of energy
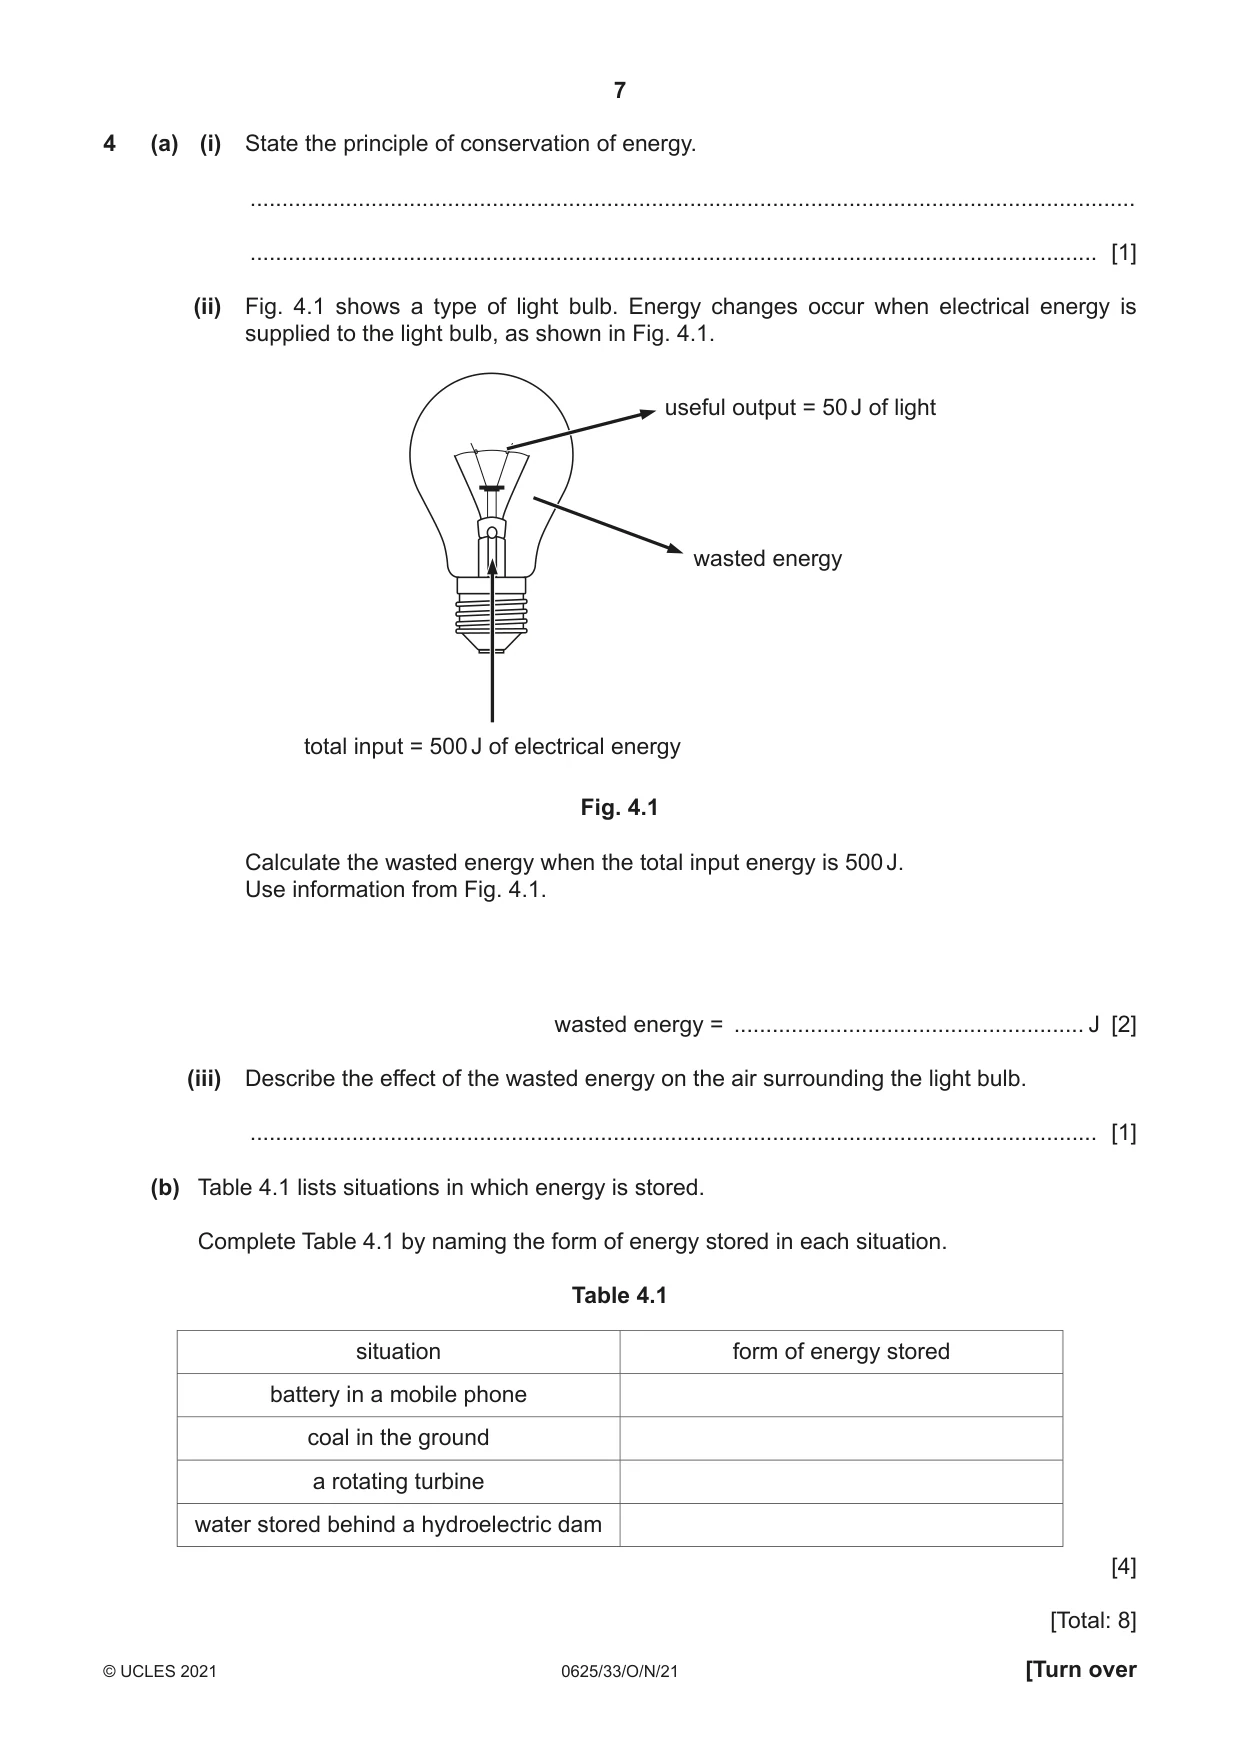
4 (a) (i) State the principle of conservation of energy. ........................................................................................................................................... ..................................................................................................................................... [1] (ii) Fig. 4.1 shows a type of light bulb. Energy changes occur when electrical energy is supplied to the light bulb, as shown in Fig. 4.1. useful output = 50 J of light wasted energy total input = 500 J of electrical energy Fig. 4.1 Calculate the wasted energy when the total input energy is 500 J. Use information from Fig. 4.1. wasted energy = ....................................................... J [2] (iii) Describe the effect of the wasted energy on the air surrounding the light bulb. ..................................................................................................................................... [1] (b) Table 4.1 lists situations in which energy is stored. Complete Table 4.1 by naming the form of energy stored in each situation. Table 4.1 situation form of energy stored battery in a mobile phone coal in the ground a rotating turbine water stored behind a hydroelectric dam [4] [Total: 8]
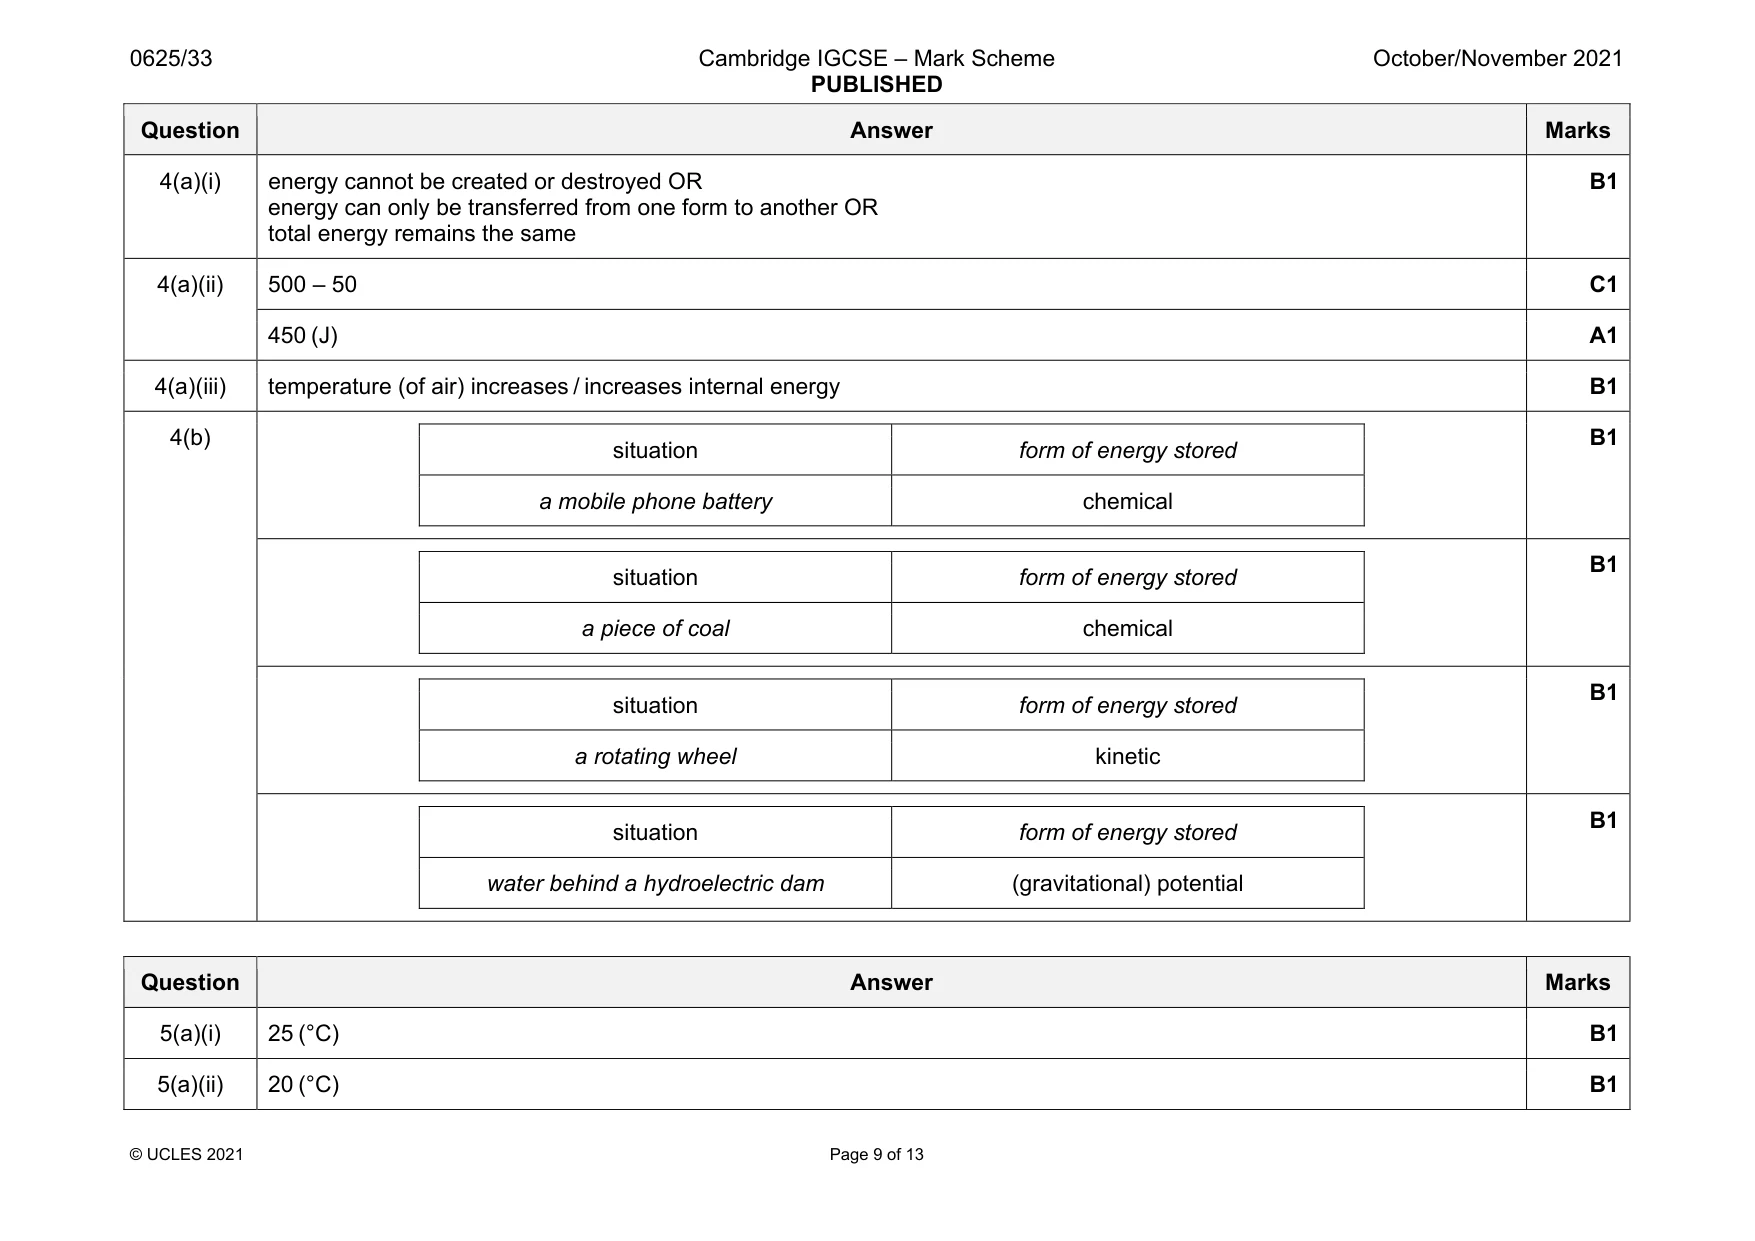
Mark scheme: 4(a)(i) energy cannot be created or destroyed OR energy can only be transferred from one form to another OR total energy remains the same B1 4(a)(ii) 500 – 50 C1 450 (J) A1 4(a)(iii) temperature (of air) increases / increases internal energy B1 4(b) situation form of energy stored a mobile phone battery chemical B1 situation form of energy stored a piece of coal chemical B1 situation form of energy stored a rotating wheel kinetic B1 situation form of energy stored water behind a hydroelectric dam (gravitational) potential B1
Q5 · Two metal blocks, A and B, which are the same size and made of the same material
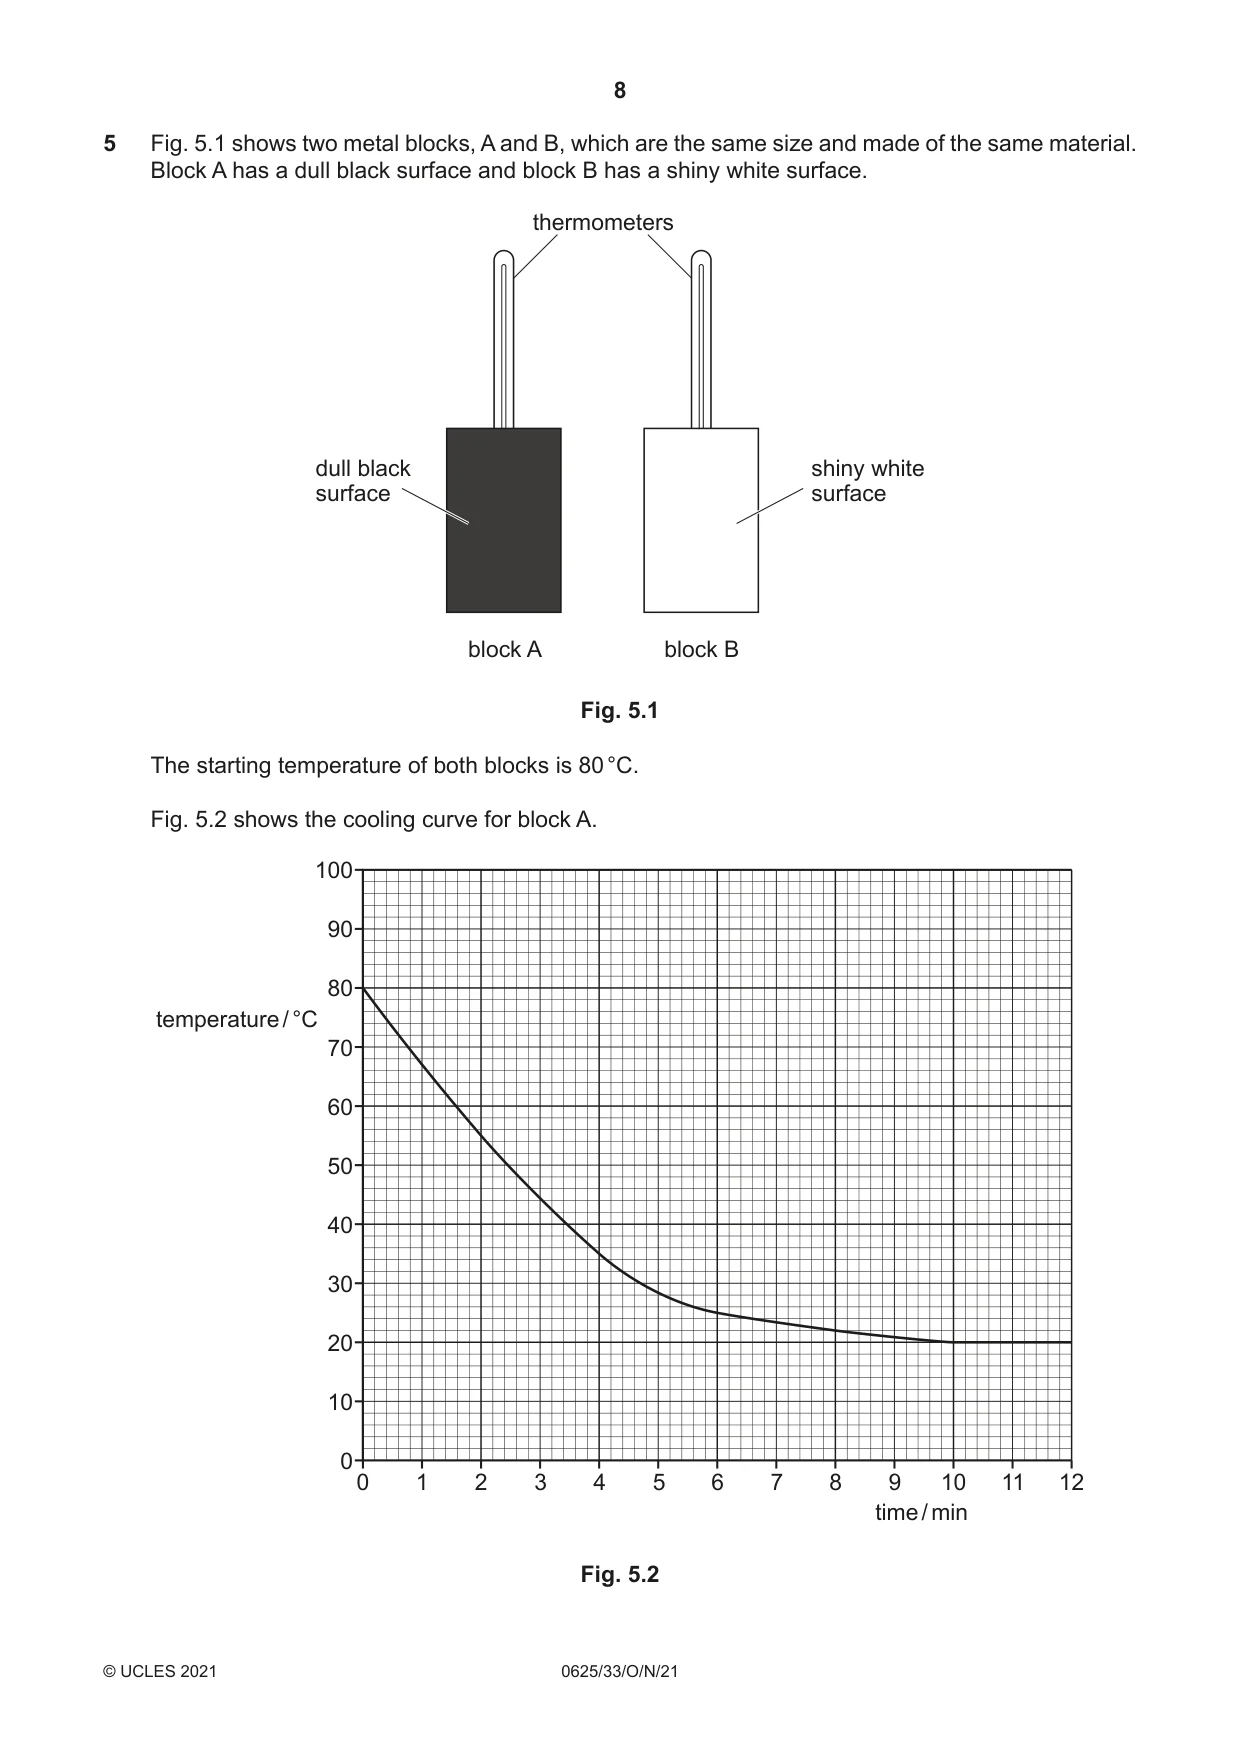
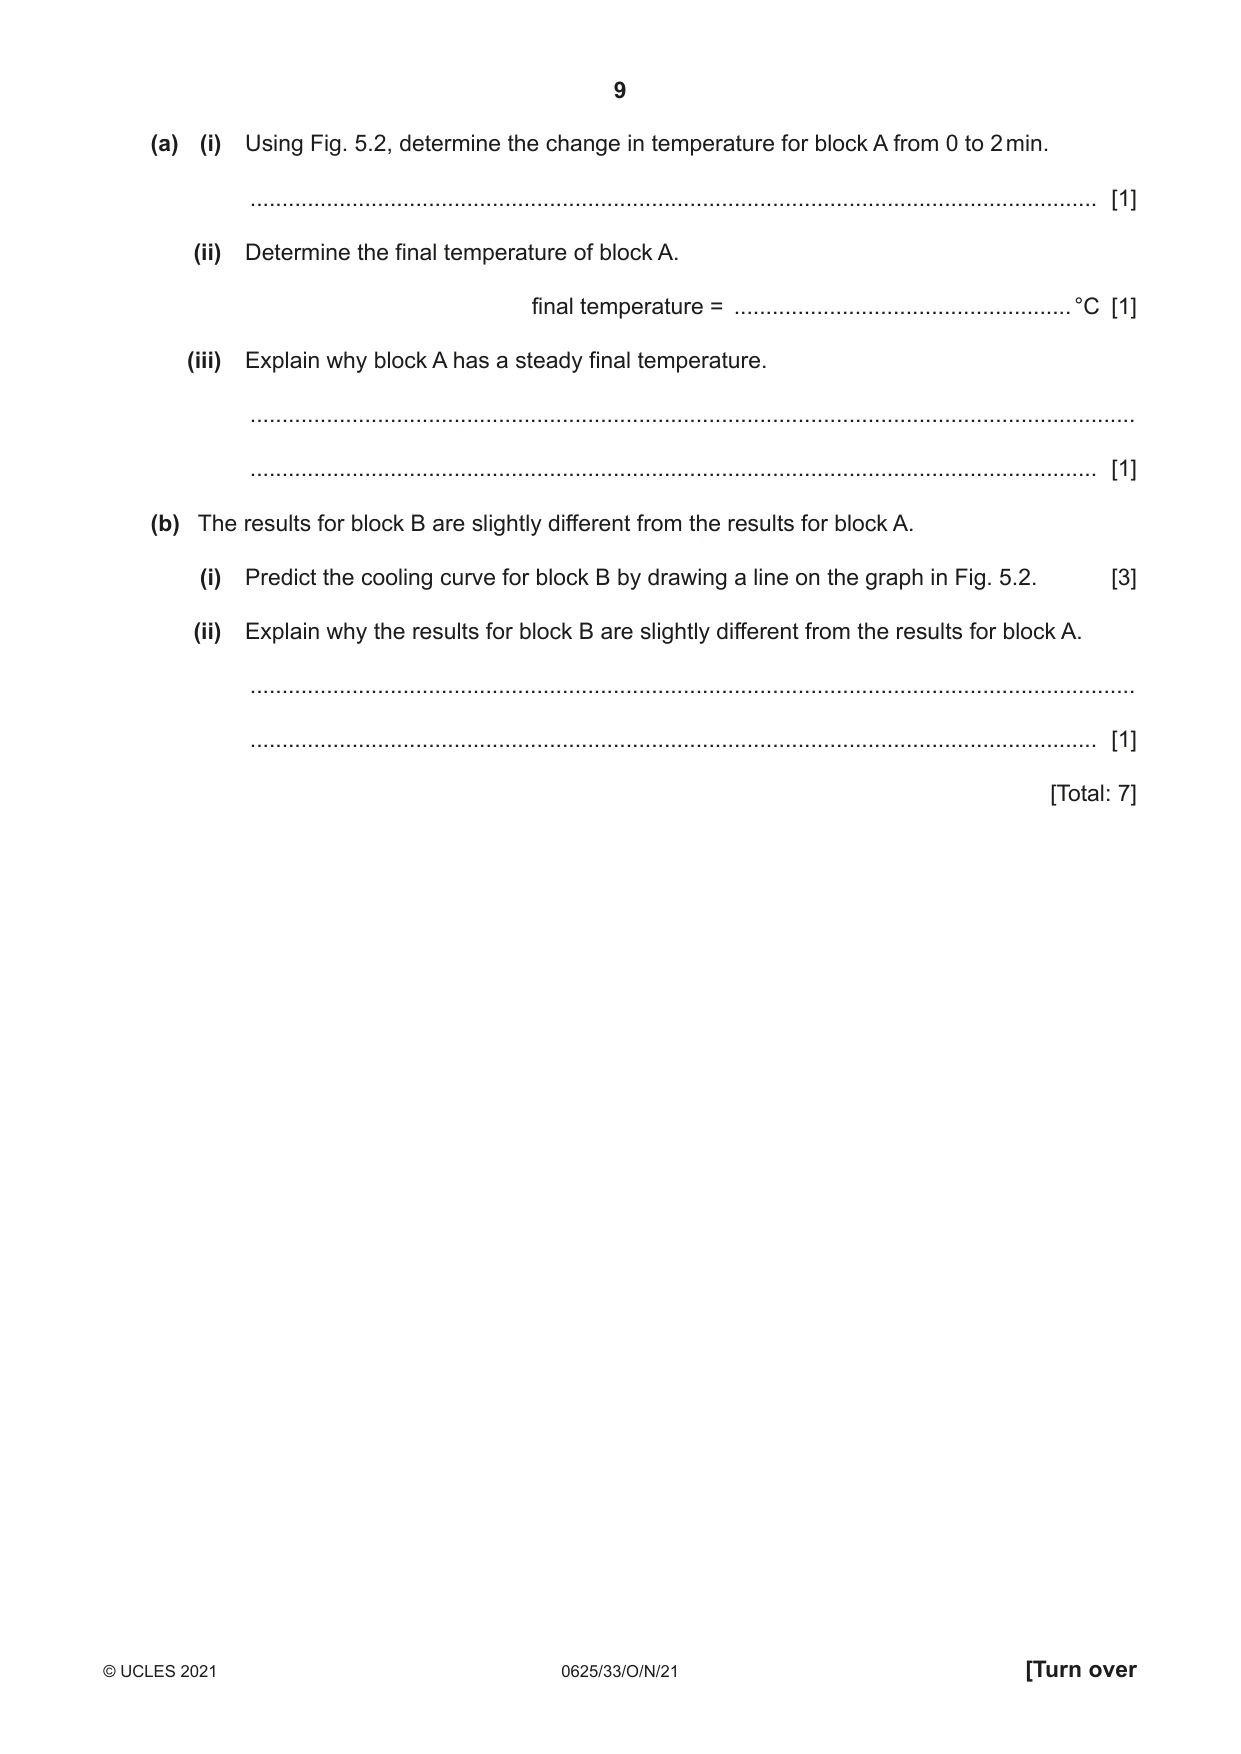
5 Fig. 5.1 shows two metal blocks, A and B, which are the same size and made of the same material. Block A has a dull black surface and block B has a shiny white surface. thermometers dull black shiny white surface surface block A block B Fig. 5.1 The starting temperature of both blocks is 80 °C. Fig. 5.2 shows the cooling curve for block A. 100 90 80 temperature / °C 70 60 50 40 30 20 10 0 0 1 2 3 4 5 6 7 8 9 10 11 12 time / min Fig. 5.2 (a) (i) Using Fig. 5.2, determine the change in temperature for block A from 0 to 2 min. ..................................................................................................................................... [1] (ii) Determine the final temperature of block A. final temperature = .....................................................°C [1] (iii) Explain why block A has a steady final temperature. ........................................................................................................................................... ..................................................................................................................................... [1] (b) The results for block B are slightly different from the results for block A. (i) Predict the cooling curve for block B by drawing a line on the graph in Fig. 5.2. [3] (ii) Explain why the results for block B are slightly different from the results for block A. ........................................................................................................................................... ..................................................................................................................................... [1] [Total: 7]
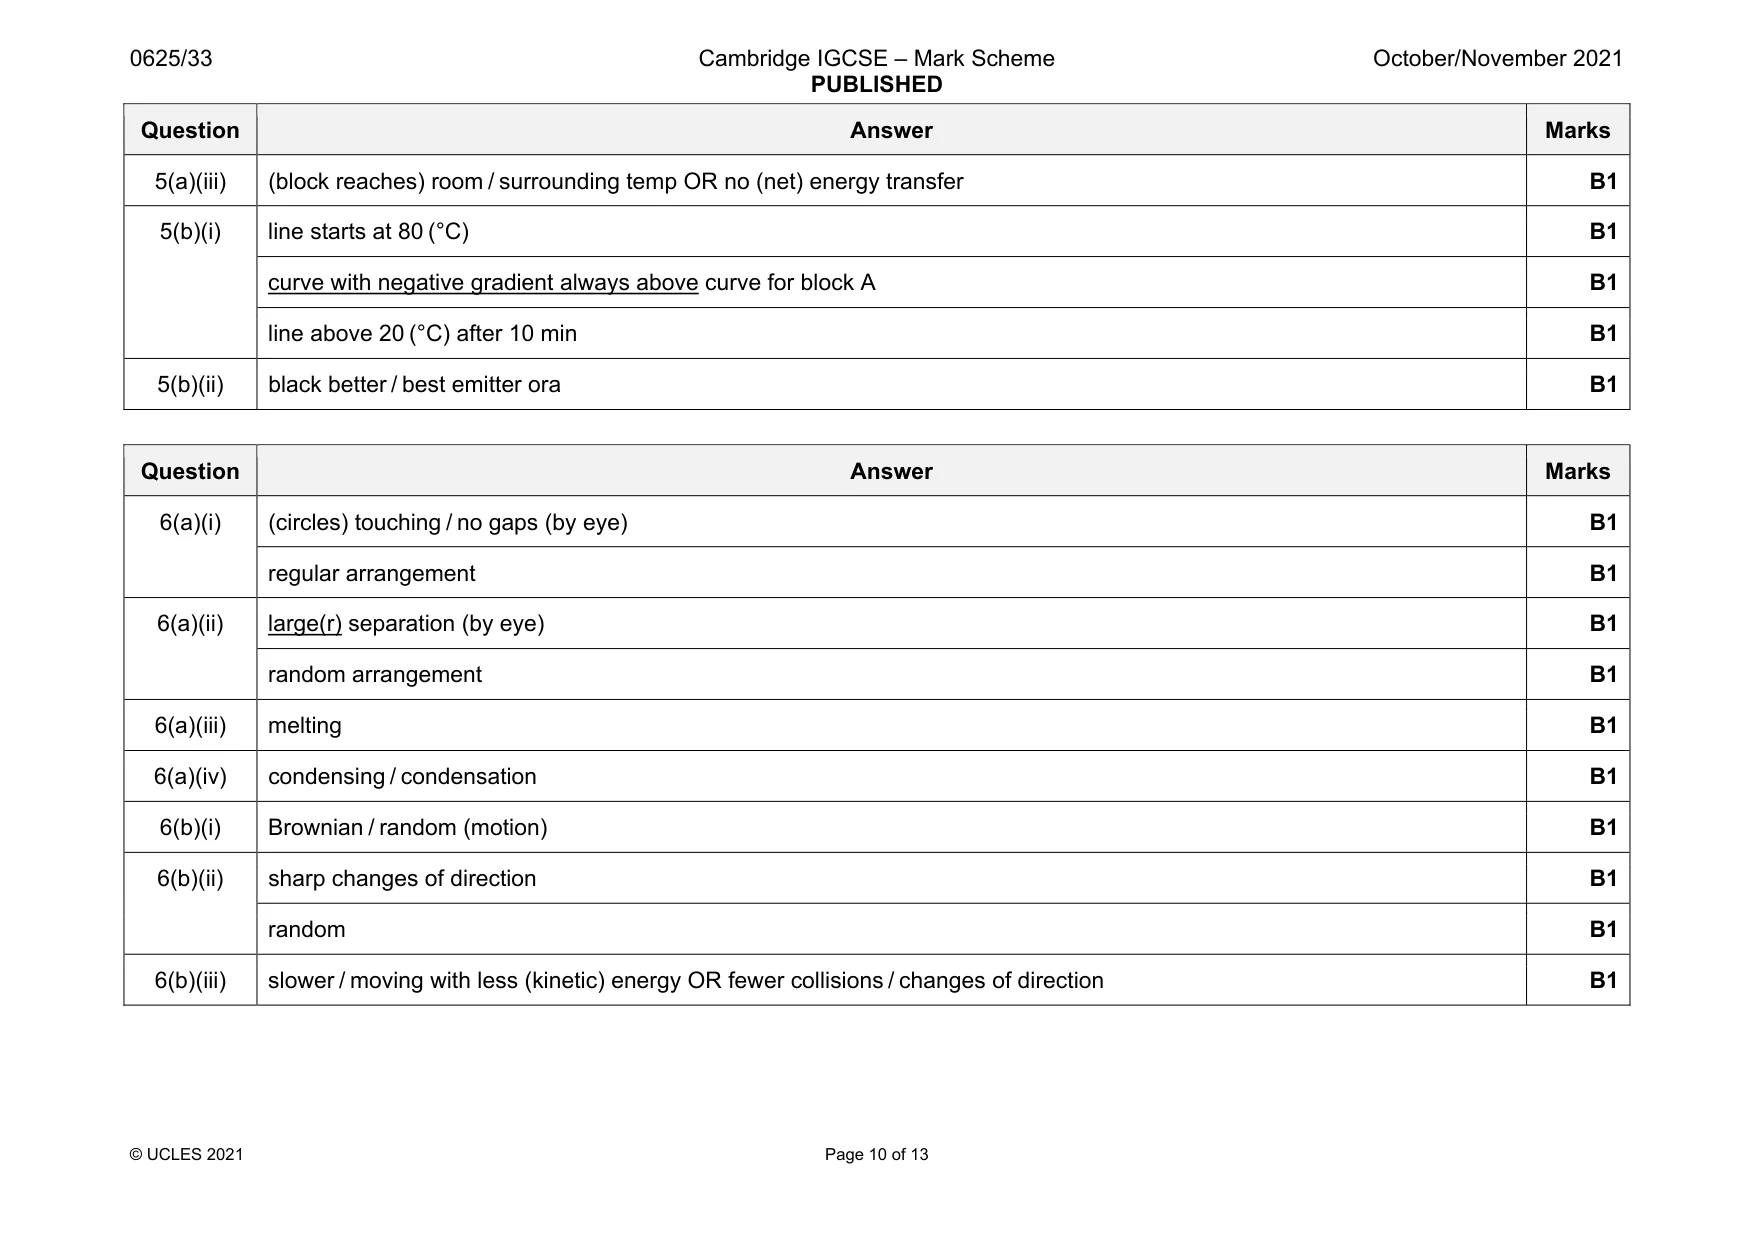
Mark scheme: 5(a)(i) 25 (°C) B1 5(a)(ii) 20 (°C) B1 Question Answer Marks 5(a)(iii) (block reaches) room / surrounding temp OR no (net) energy transfer B1 5(b)(i) line starts at 80 (°C) B1 curve with negative gradient always above curve for block A B1 line above 20 (°C) after 10 min B1 5(b)(ii) black better / best emitter ora B1
Question 6
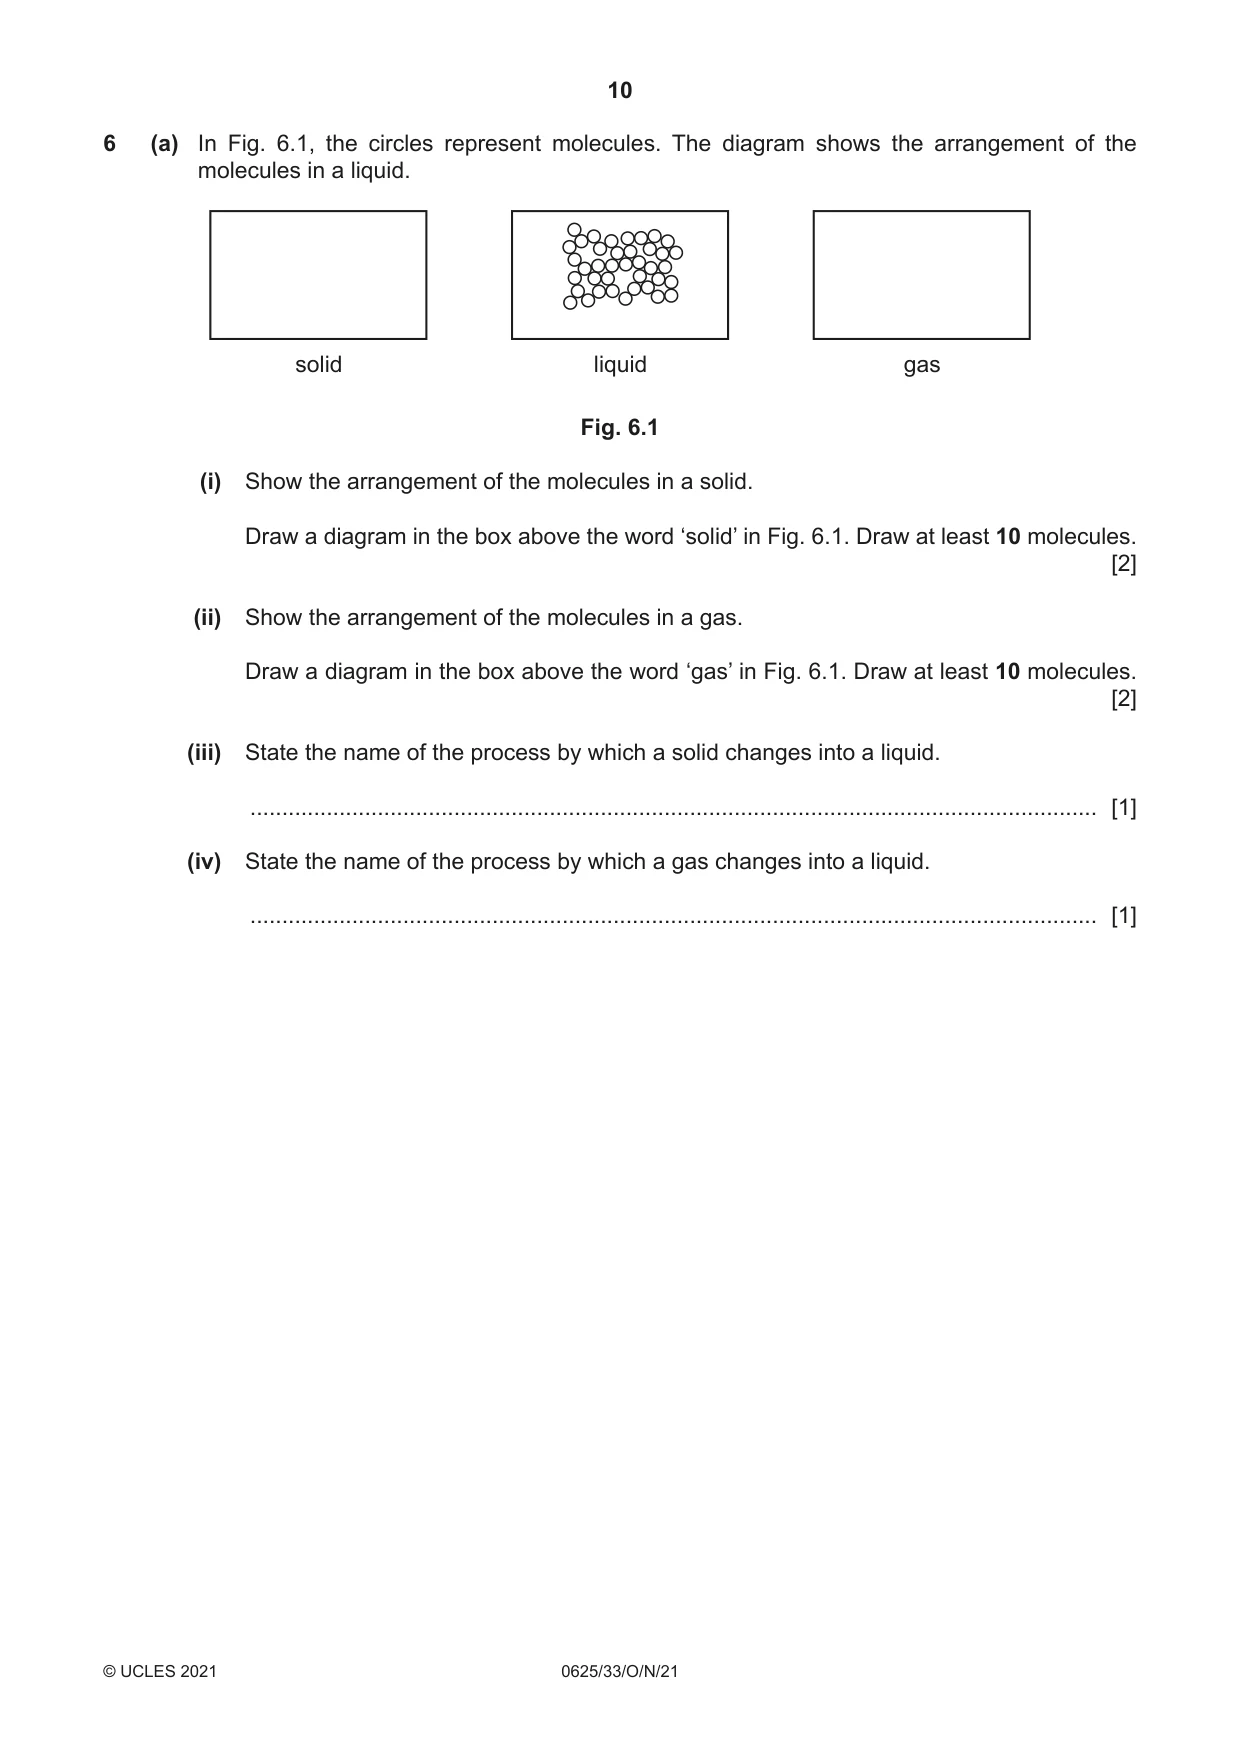
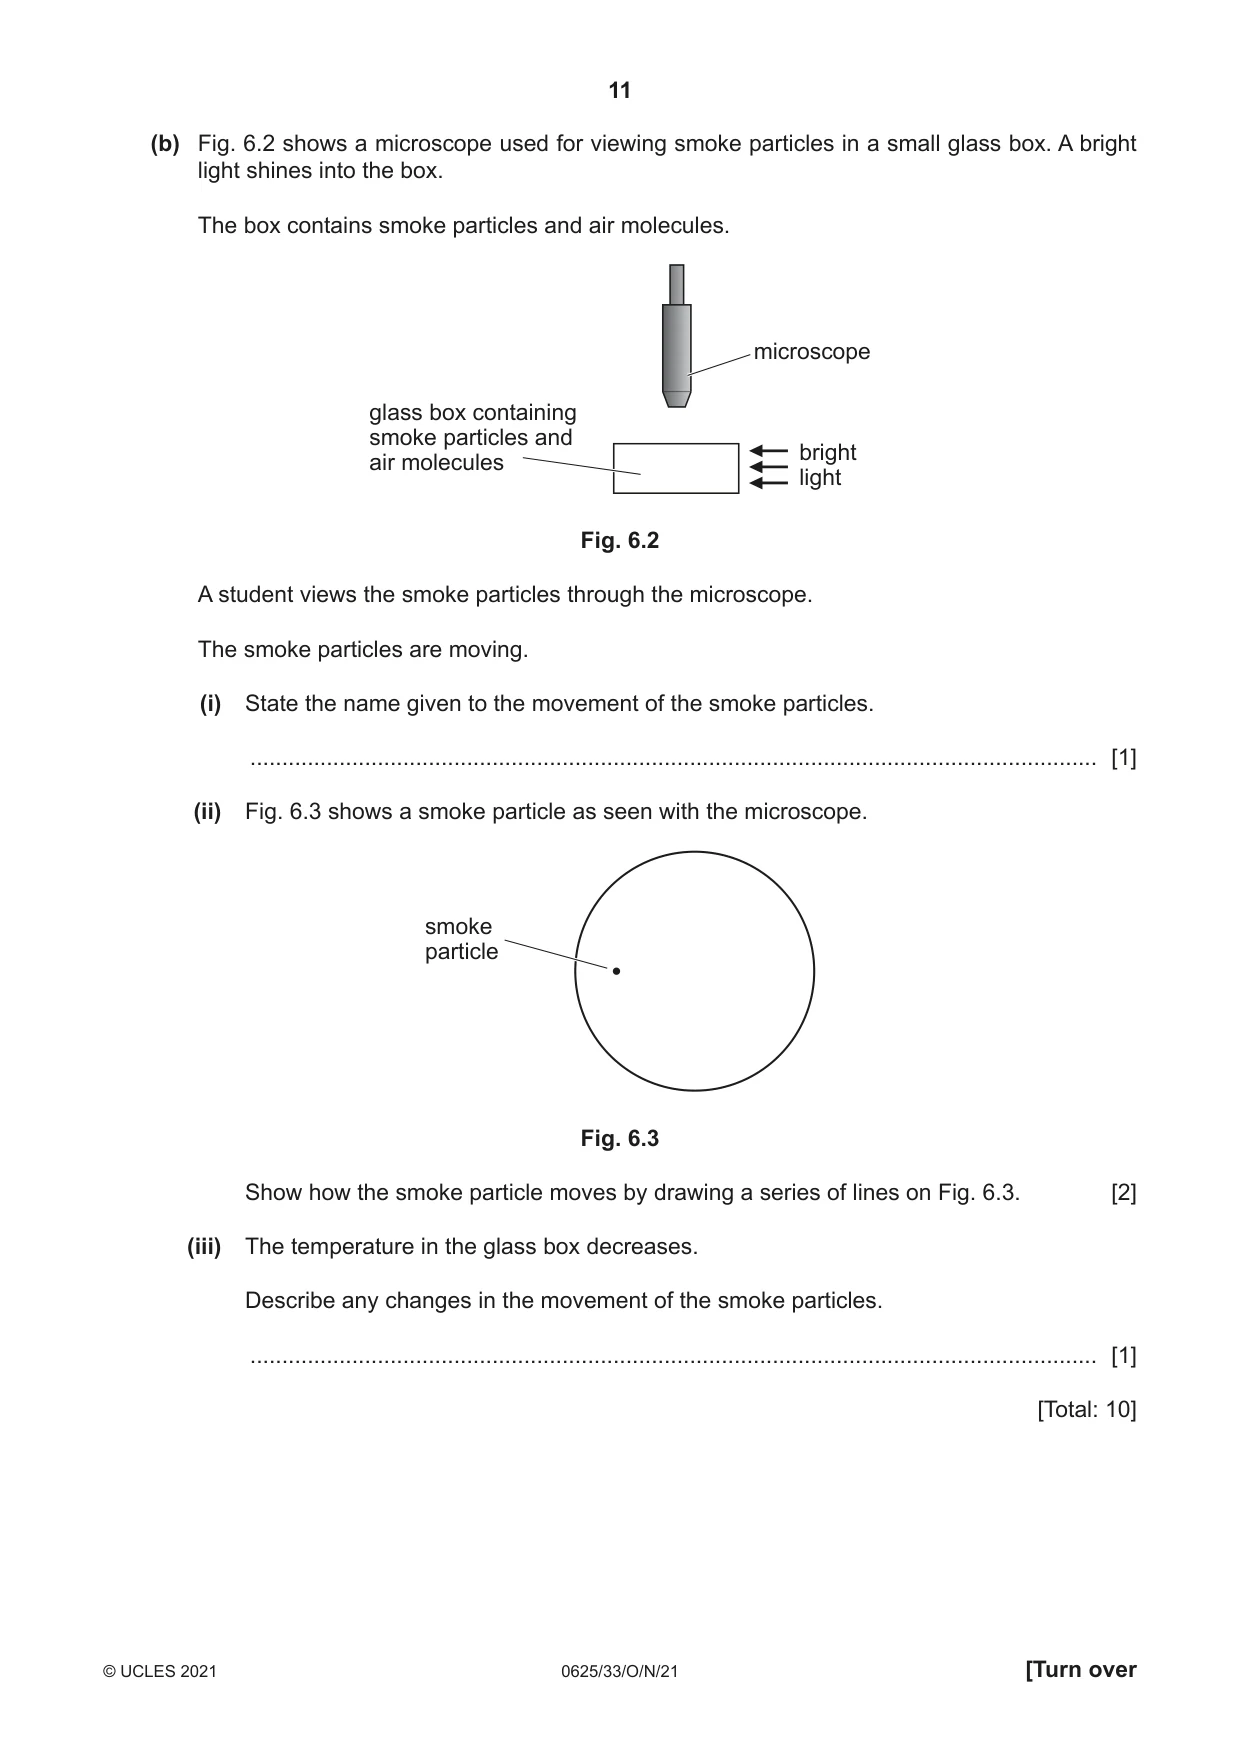
6 (a) In Fig. 6.1, the circles represent molecules. The diagram shows the arrangement of the molecules in a liquid. solid liquid gas Fig. 6.1 (i) Show the arrangement of the molecules in a solid. Draw a diagram in the box above the word ‘solid’ in Fig. 6.1. Draw at least 10 molecules. [2] (ii) Show the arrangement of the molecules in a gas. Draw a diagram in the box above the word ‘gas’ in Fig. 6.1. Draw at least 10 molecules. [2] (iii) State the name of the process by which a solid changes into a liquid. ..................................................................................................................................... [1] (iv) State the name of the process by which a gas changes into a liquid. ..................................................................................................................................... [1] (b) Fig. 6.2 shows a microscope used for viewing smoke particles in a small glass box. A bright light shines into the box. The box contains smoke particles and air molecules. microscope glass box containing smoke particles and bright air molecules light Fig. 6.2 A student views the smoke particles through the microscope. The smoke particles are moving. (i) State the name given to the movement of the smoke particles. ..................................................................................................................................... [1] (ii) Fig. 6.3 shows a smoke particle as seen with the microscope. smoke particle Fig. 6.3 Show how the smoke particle moves by drawing a series of lines on Fig. 6.3. [2] (iii) The temperature in the glass box decreases. Describe any changes in the movement of the smoke particles. ..................................................................................................................................... [1] [Total: 10]
Mark scheme: 6(a)(i) (circles) touching / no gaps (by eye) B1 regular arrangement B1 6(a)(ii) large(r) separation (by eye) B1 random arrangement B1 6(a)(iii) melting B1 6(a)(iv) condensing / condensation B1 6(b)(i) Brownian / random (motion) B1 6(b)(ii) sharp changes of direction B1 random B1 6(b)(iii) slower / moving with less (kinetic) energy OR fewer collisions / changes of direction B1
Q7 · A group of students are taking measurements so they can calculate the speed of sound
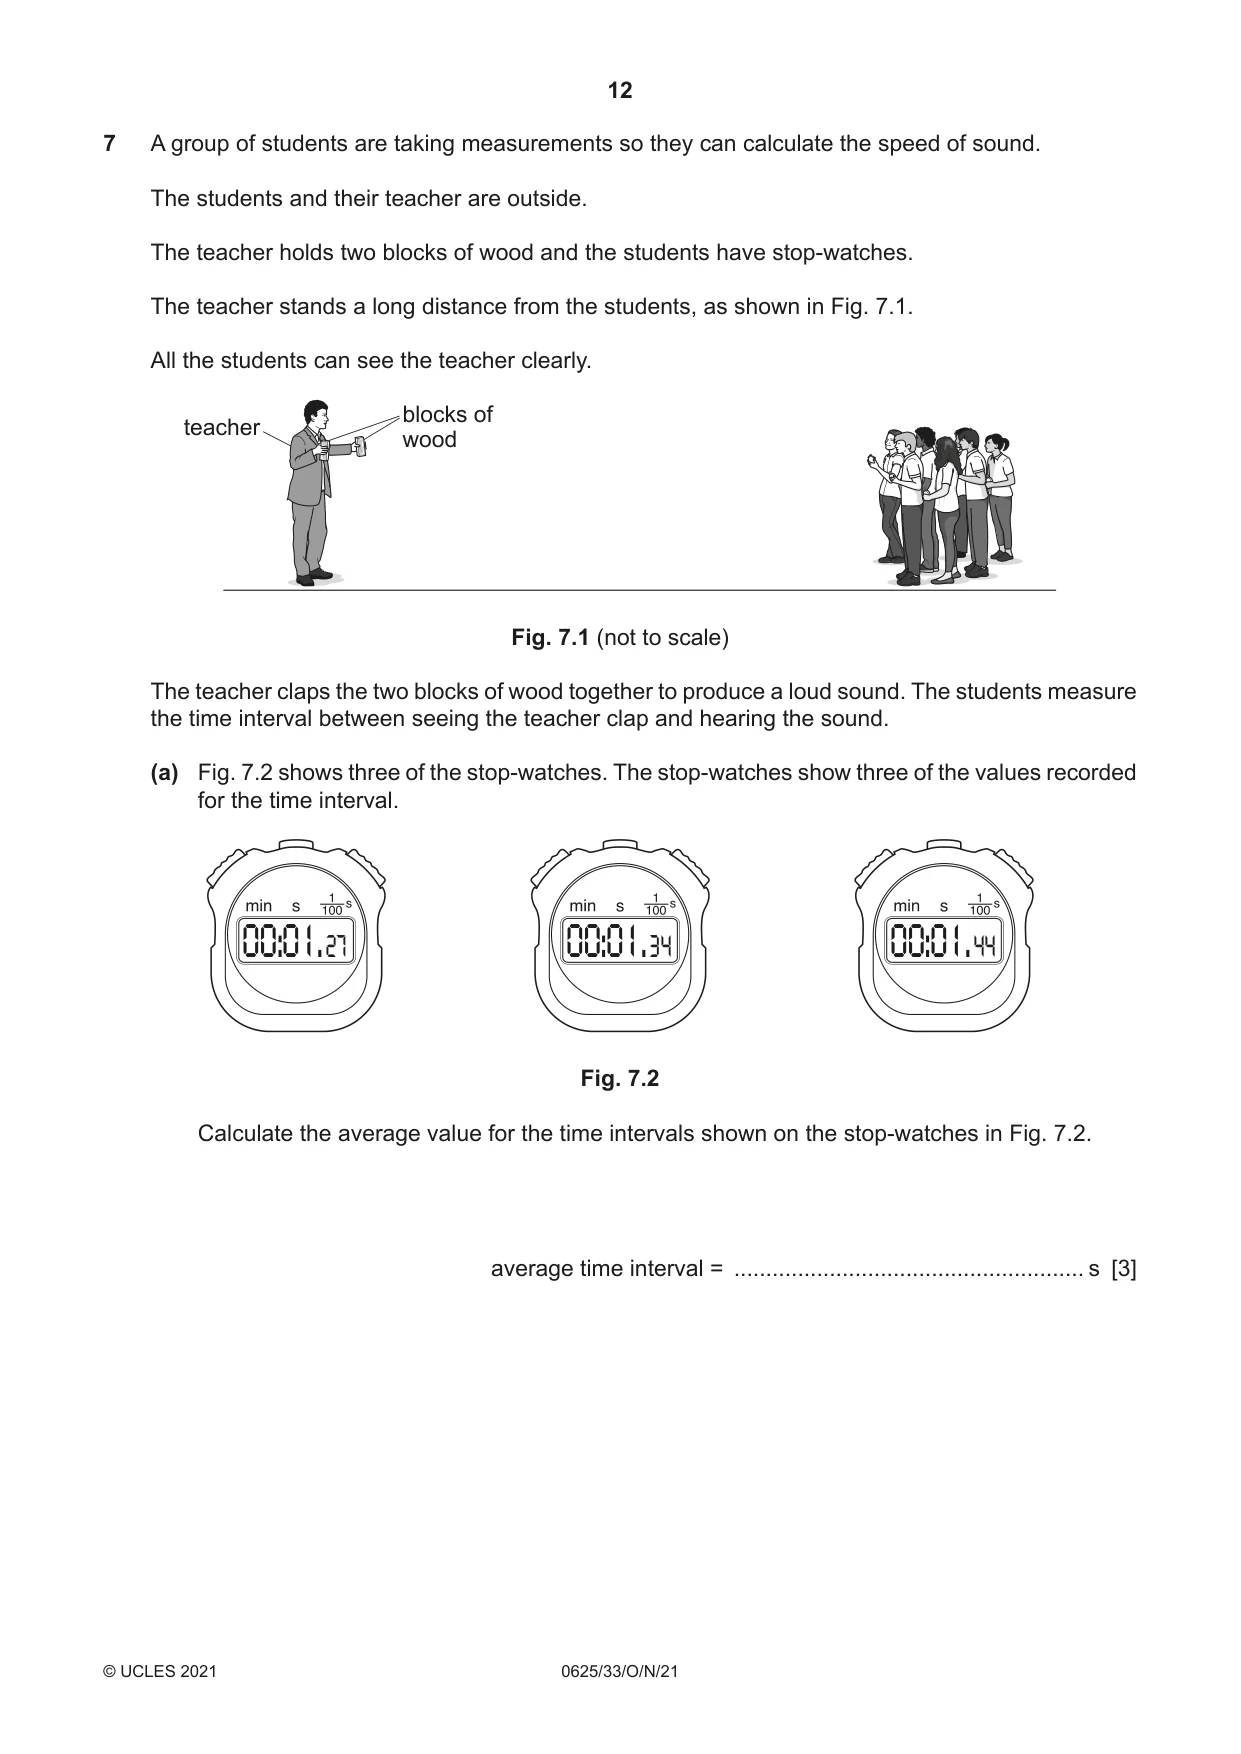
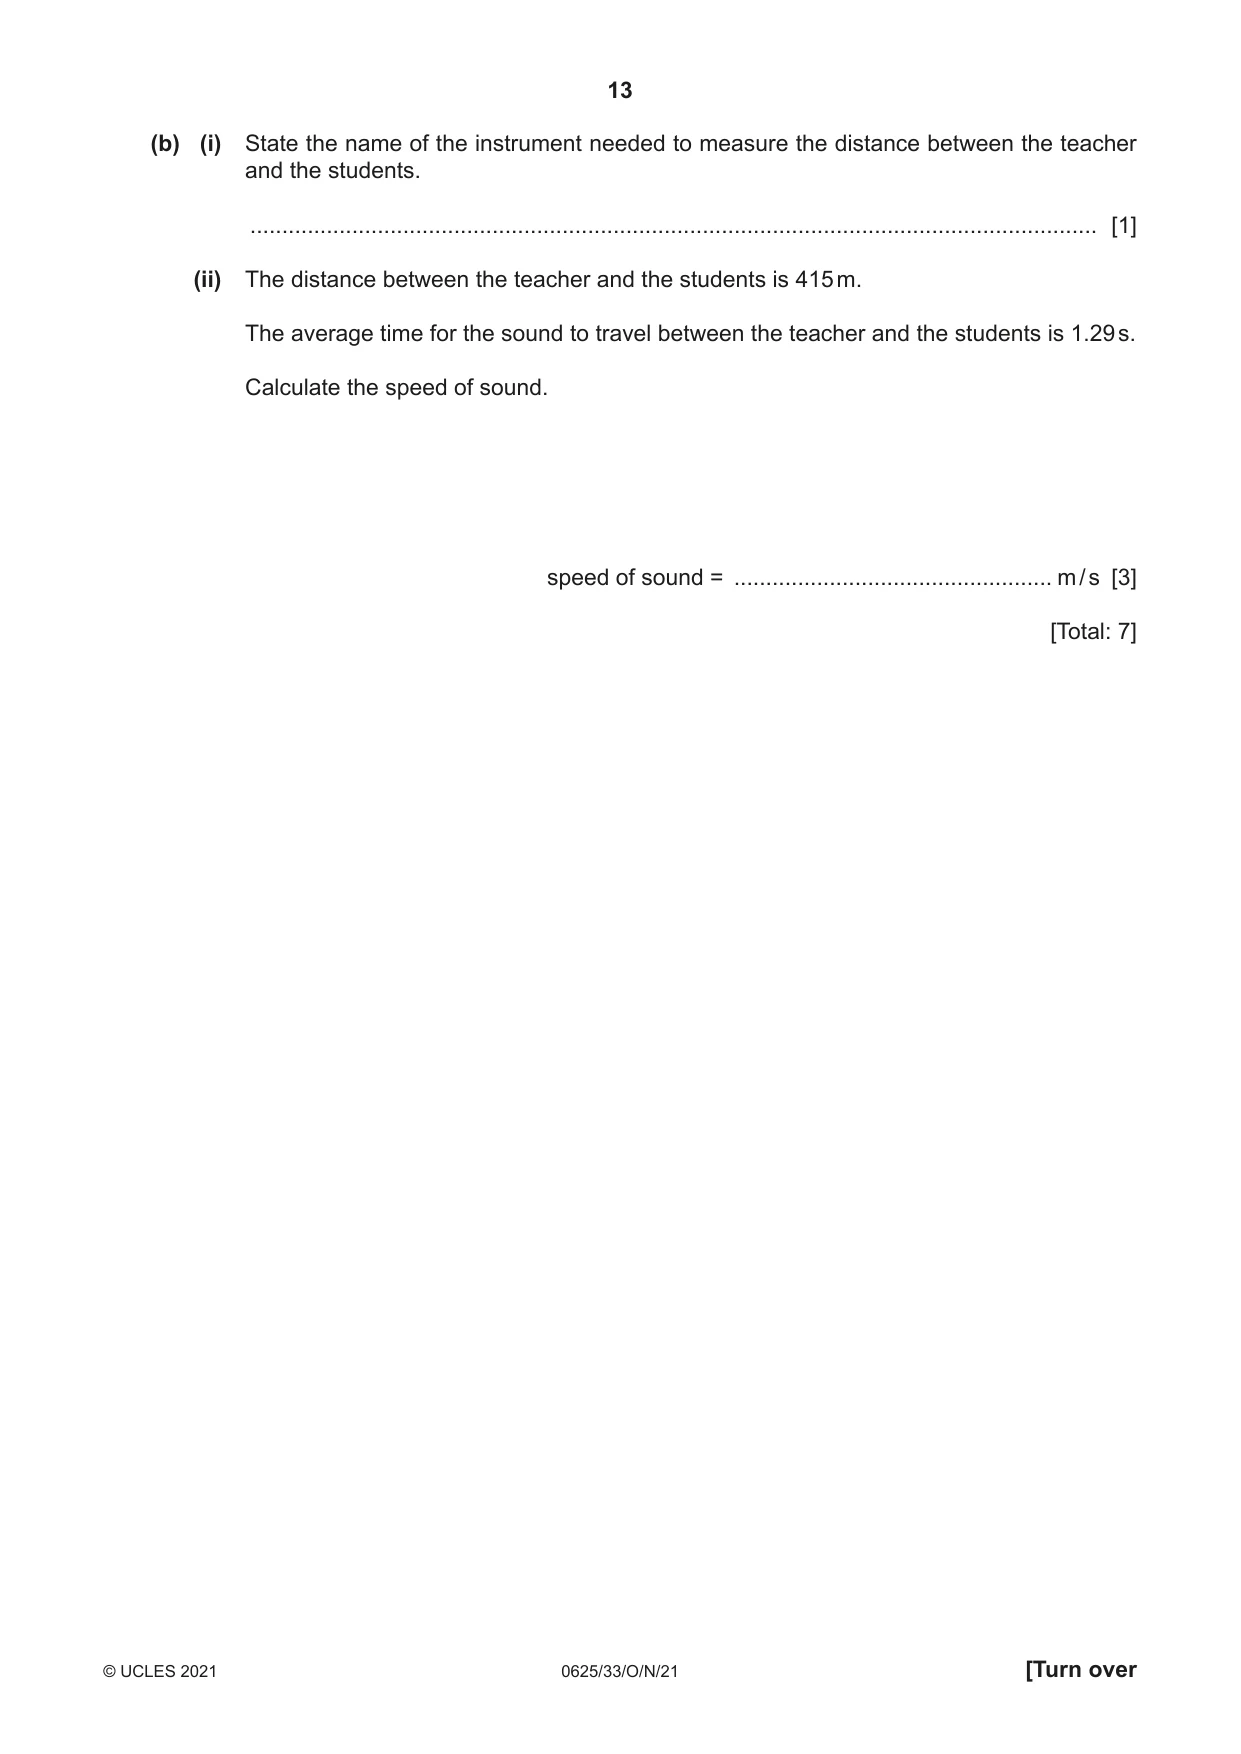
7 A group of students are taking measurements so they can calculate the speed of sound. The students and their teacher are outside. The teacher holds two blocks of wood and the students have stop-watches. The teacher stands a long distance from the students, as shown in Fig. 7.1. All the students can see the teacher clearly. blocks of teacher wood Fig. 7.1 (not to scale) The teacher claps the two blocks of wood together to produce a loud sound. The students measure the time interval between seeing the teacher clap and hearing the sound. (a) Fig. 7.2 shows three of the stop-watches. The stop-watches show three of the values recorded for the time interval. 00:01.27 00:01.34 00:01.44 Fig. 7.2 Calculate the average value for the time intervals shown on the stop-watches in Fig. 7.2. average time interval = ....................................................... s [3] (b) (i) State the name of the instrument needed to measure the distance between the teacher and the students. ..................................................................................................................................... [1] (ii) The distance between the teacher and the students is 415 m. The average time for the sound to travel between the teacher and the students is 1.29 s. Calculate the speed of sound. speed of sound = .................................................. m / s [3] [Total: 7]
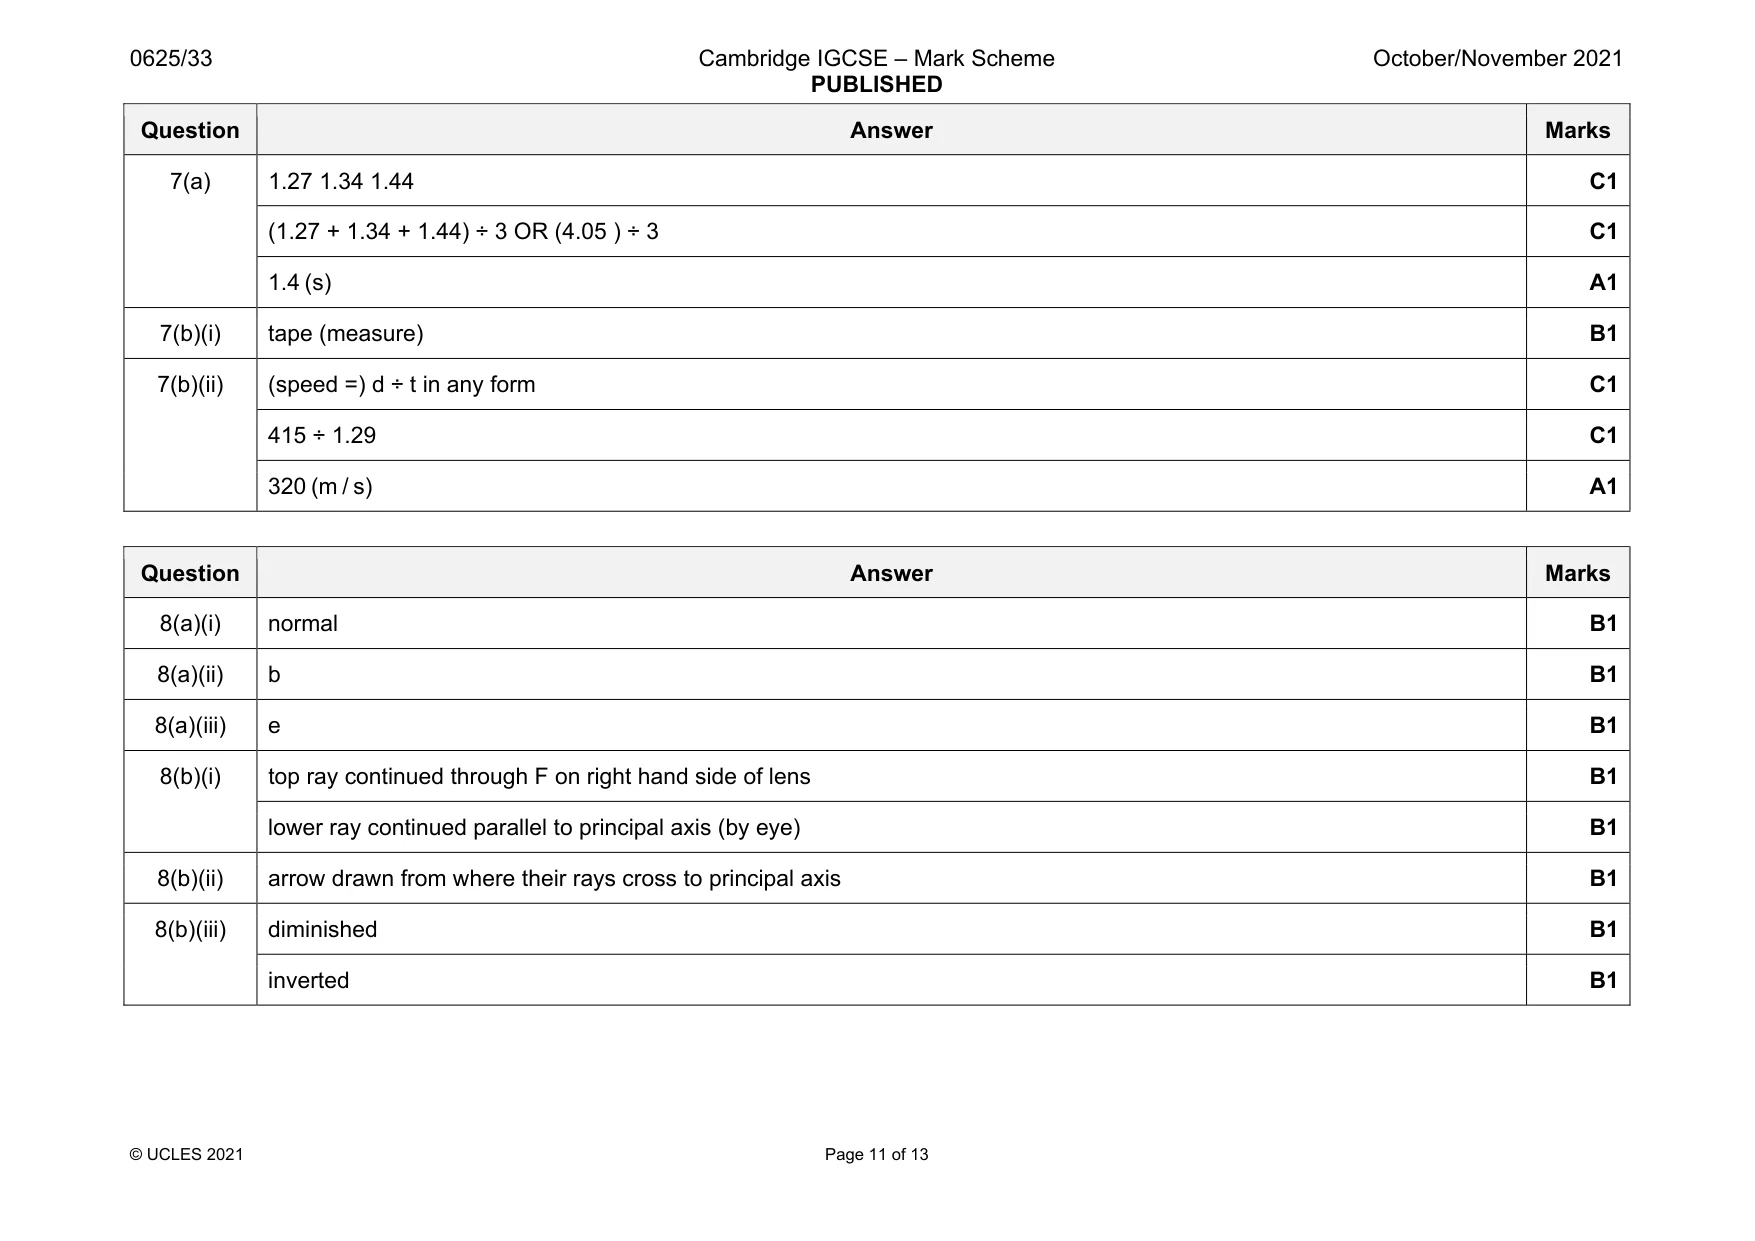
Mark scheme: 7(a) 1.27 1.34 1.44 C1 (1.27 + 1.34 + 1.44) ÷ 3 OR (4.05 ) ÷ 3 C1 1.4 (s) A1 7(b)(i) tape (measure) B1 7(b)(ii) (speed =) d ÷ t in any form C1 415 ÷ 1.29 C1 320 (m / s) A1
More questions on Physical quantities and measurement techniques
Q8 · The diagram in Fig
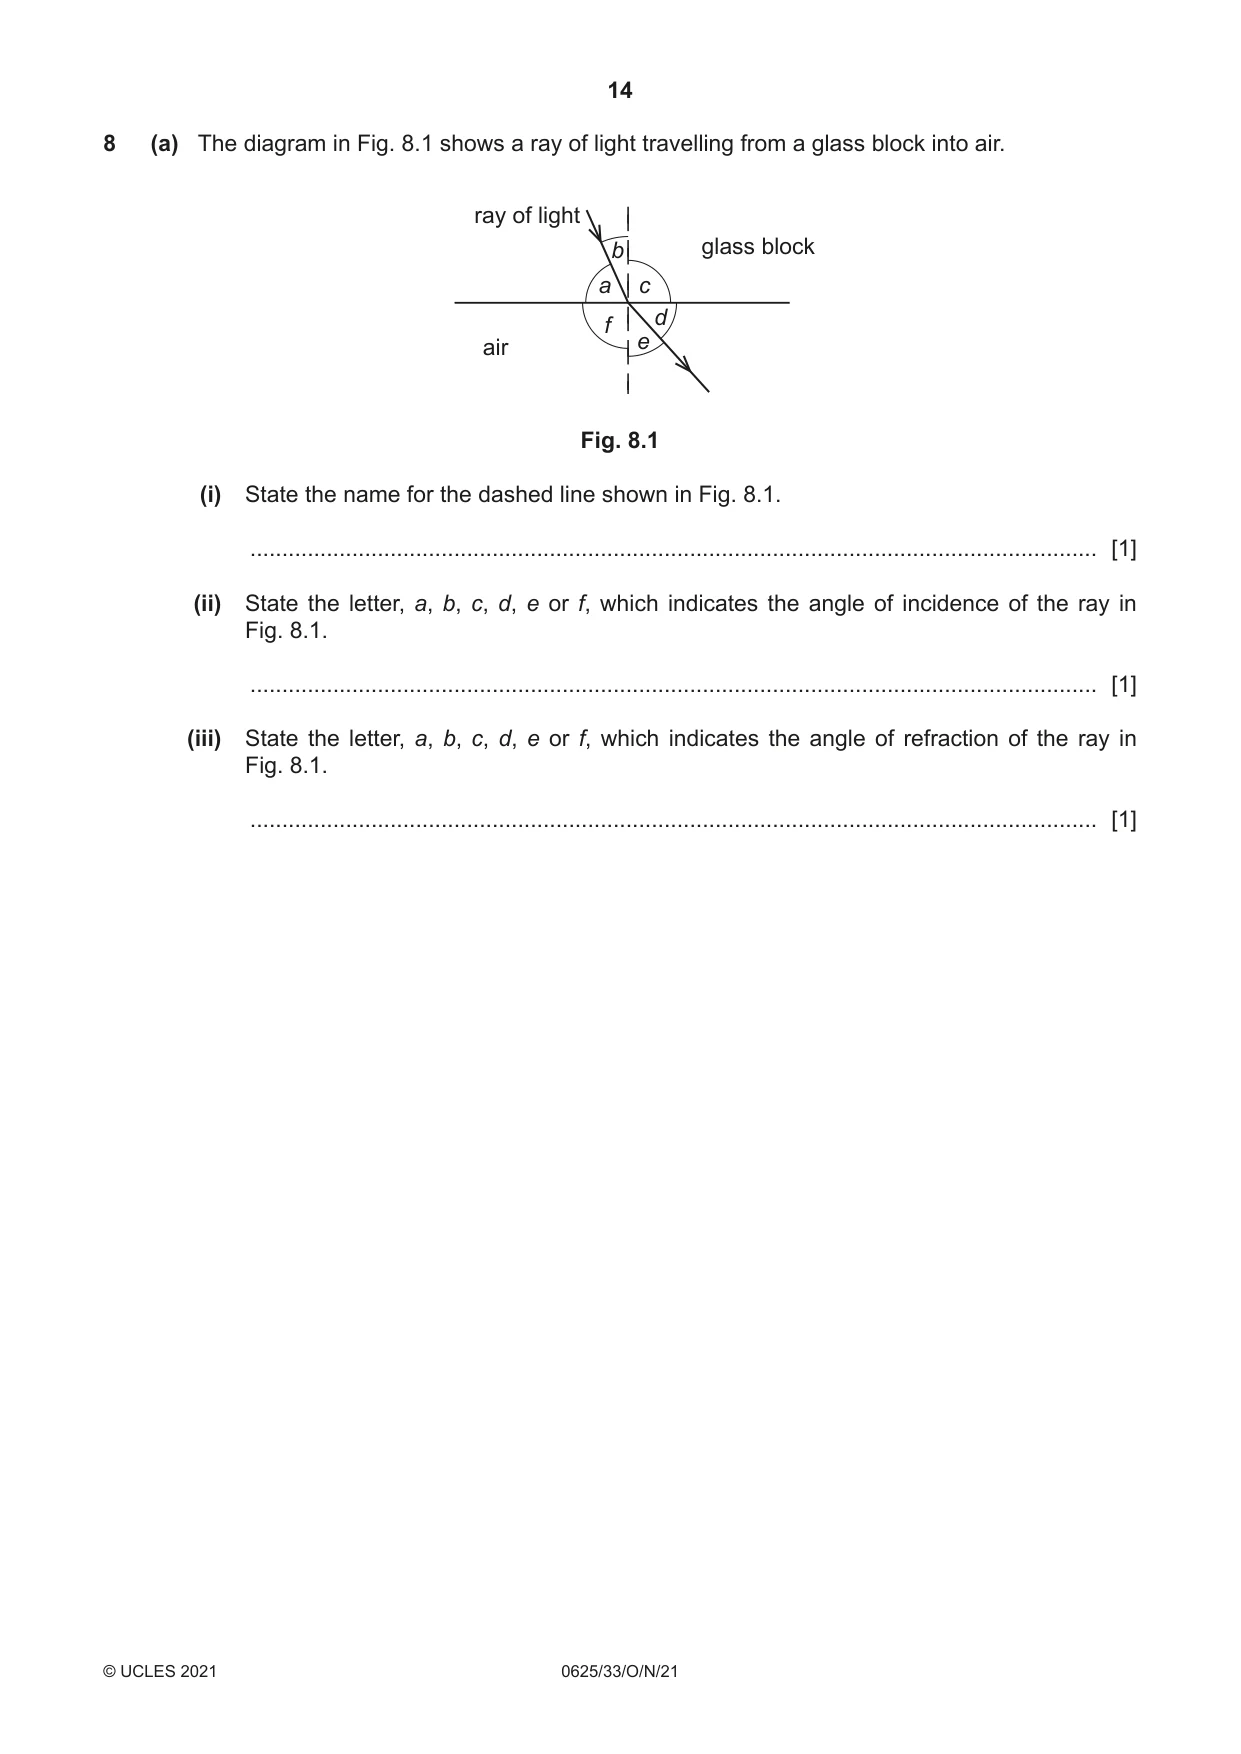
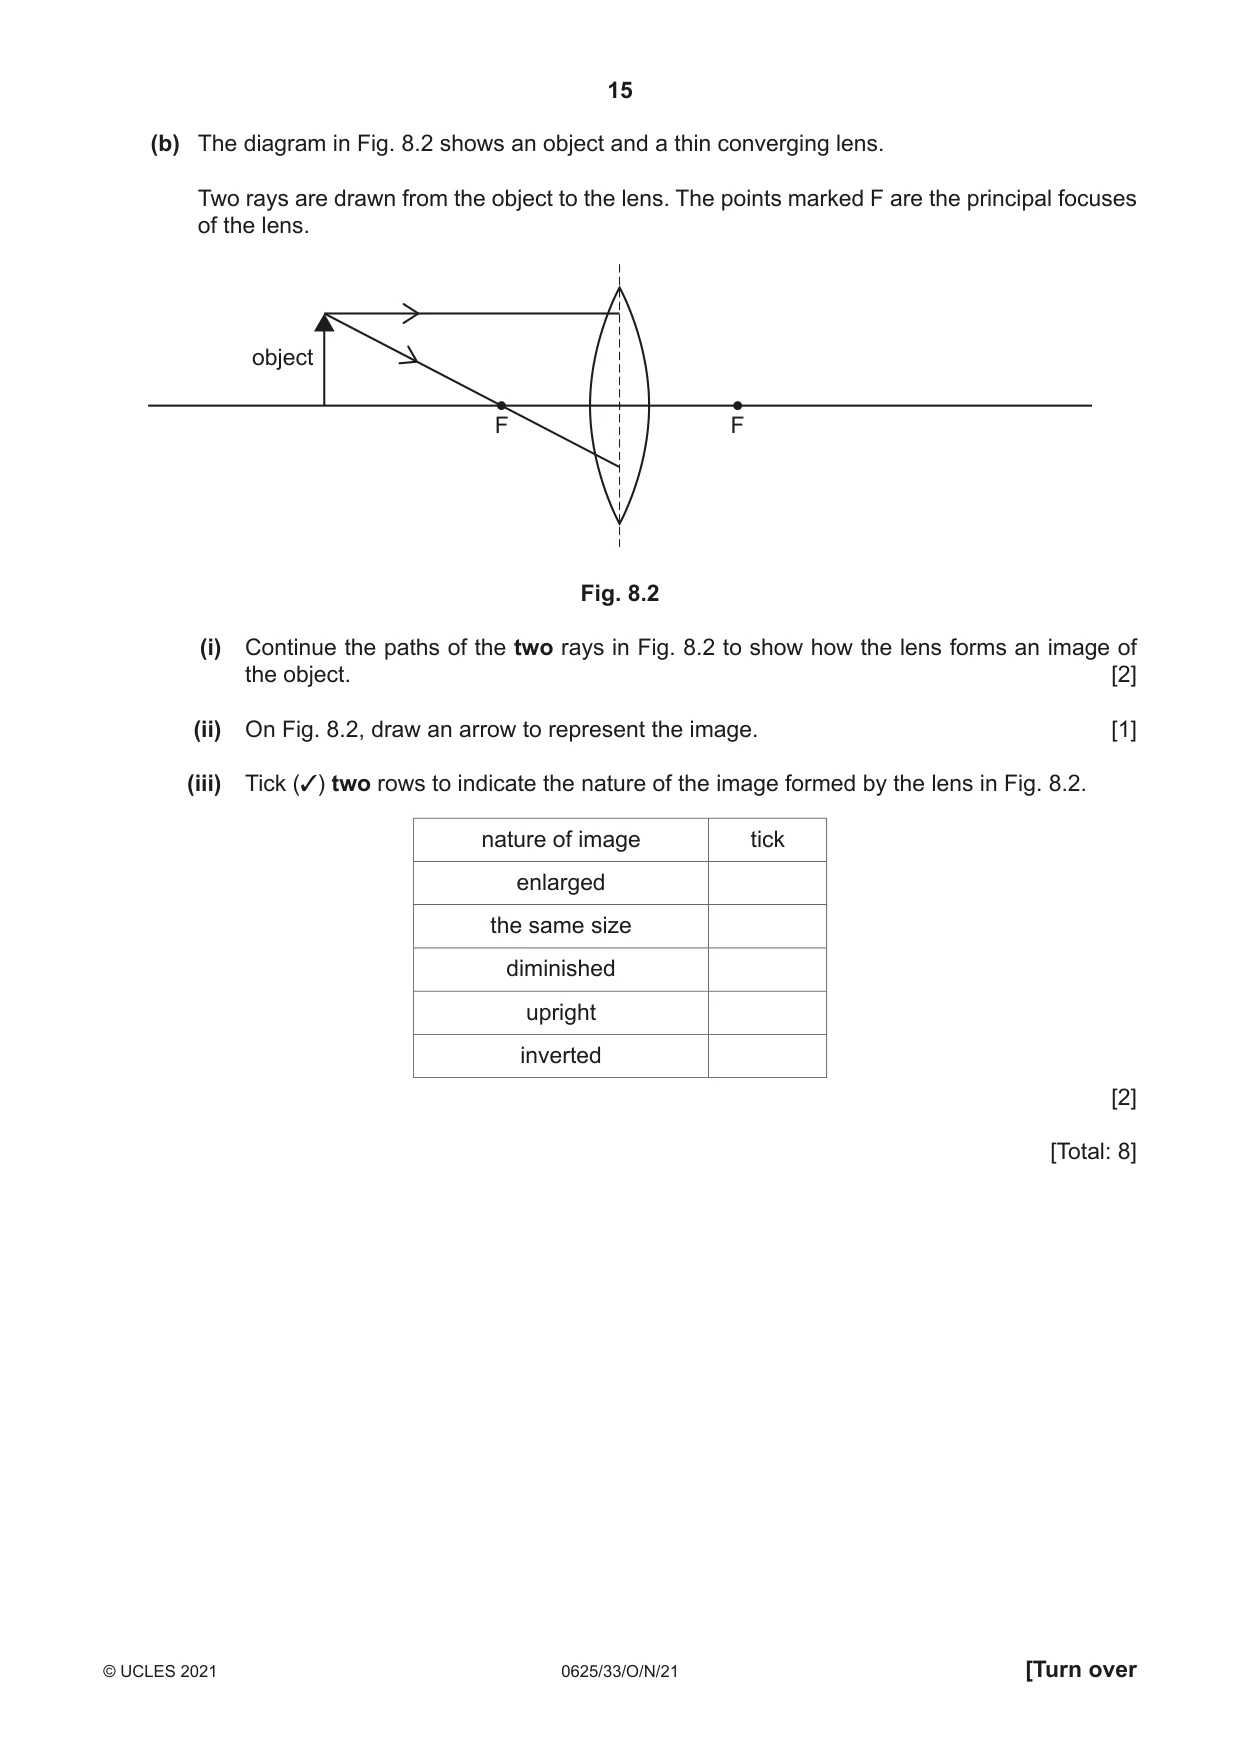
8 (a) The diagram in Fig. 8.1 shows a ray of light travelling from a glass block into air. ray of light b glass block a c d f air e Fig. 8.1 (i) State the name for the dashed line shown in Fig. 8.1. ..................................................................................................................................... [1] (ii) State the letter, a, b, c, d, e or f, which indicates the angle of incidence of the ray in Fig. 8.1. ..................................................................................................................................... [1] (iii) State the letter, a, b, c, d, e or f, which indicates the angle of refraction of the ray in Fig. 8.1. ..................................................................................................................................... [1] (b) The diagram in Fig. 8.2 shows an object and a thin converging lens. Two rays are drawn from the object to the lens. The points marked F are the principal focuses of the lens. object F F Fig. 8.2 (i) Continue the paths of the two rays in Fig. 8.2 to show how the lens forms an image of the object. [2] (ii) On Fig. 8.2, draw an arrow to represent the image. [1] (iii) Tick (✓) two rows to indicate the nature of the image formed by the lens in Fig. 8.2. nature of image tick enlarged the same size diminished upright inverted [2] [Total: 8]
Mark scheme: 8(a)(i) normal B1 8(a)(ii) b B1 8(a)(iii) e B1 8(b)(i) top ray continued through F on right hand side of lens B1 lower ray continued parallel to principal axis (by eye) B1 8(b)(ii) arrow drawn from where their rays cross to principal axis B1 8(b)(iii) diminished B1 inverted B1
Q9 · The circuit diagrams in Fig
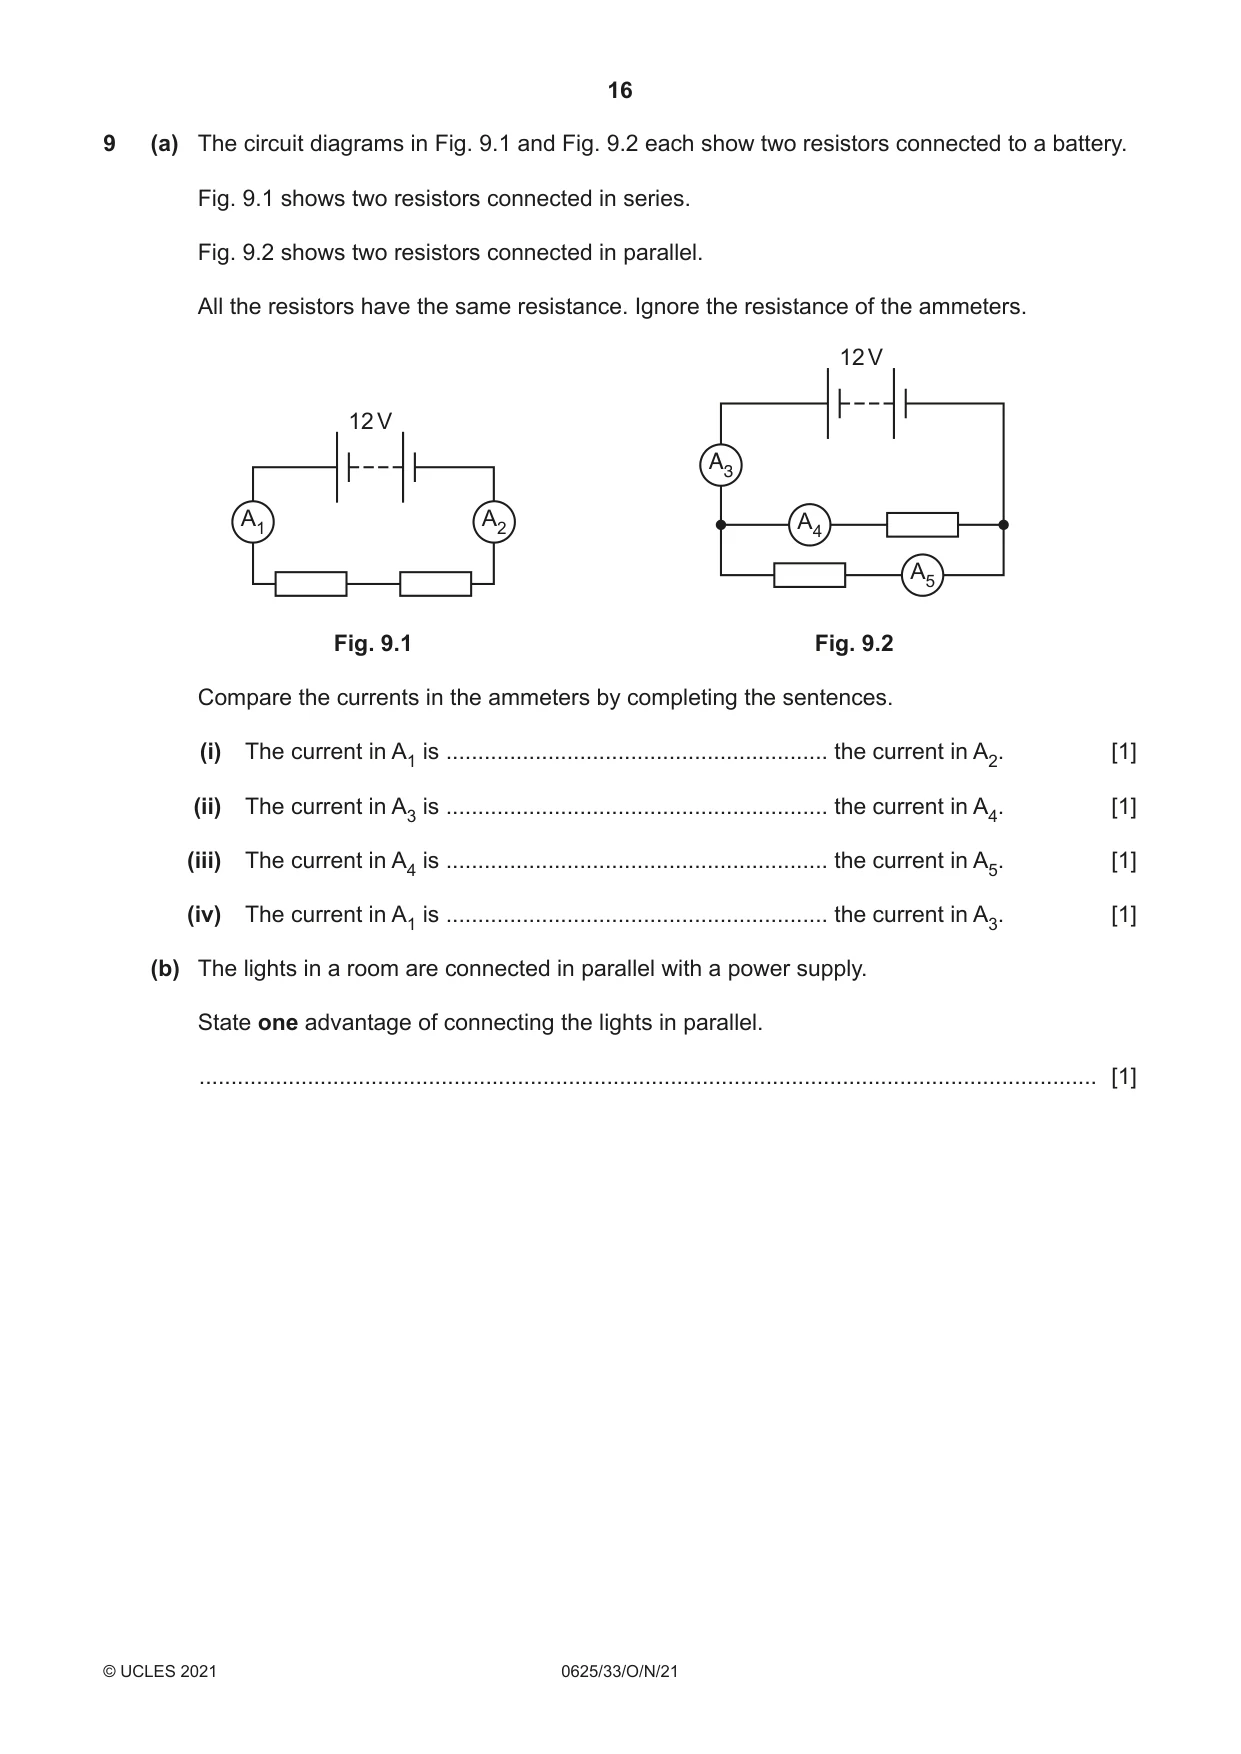
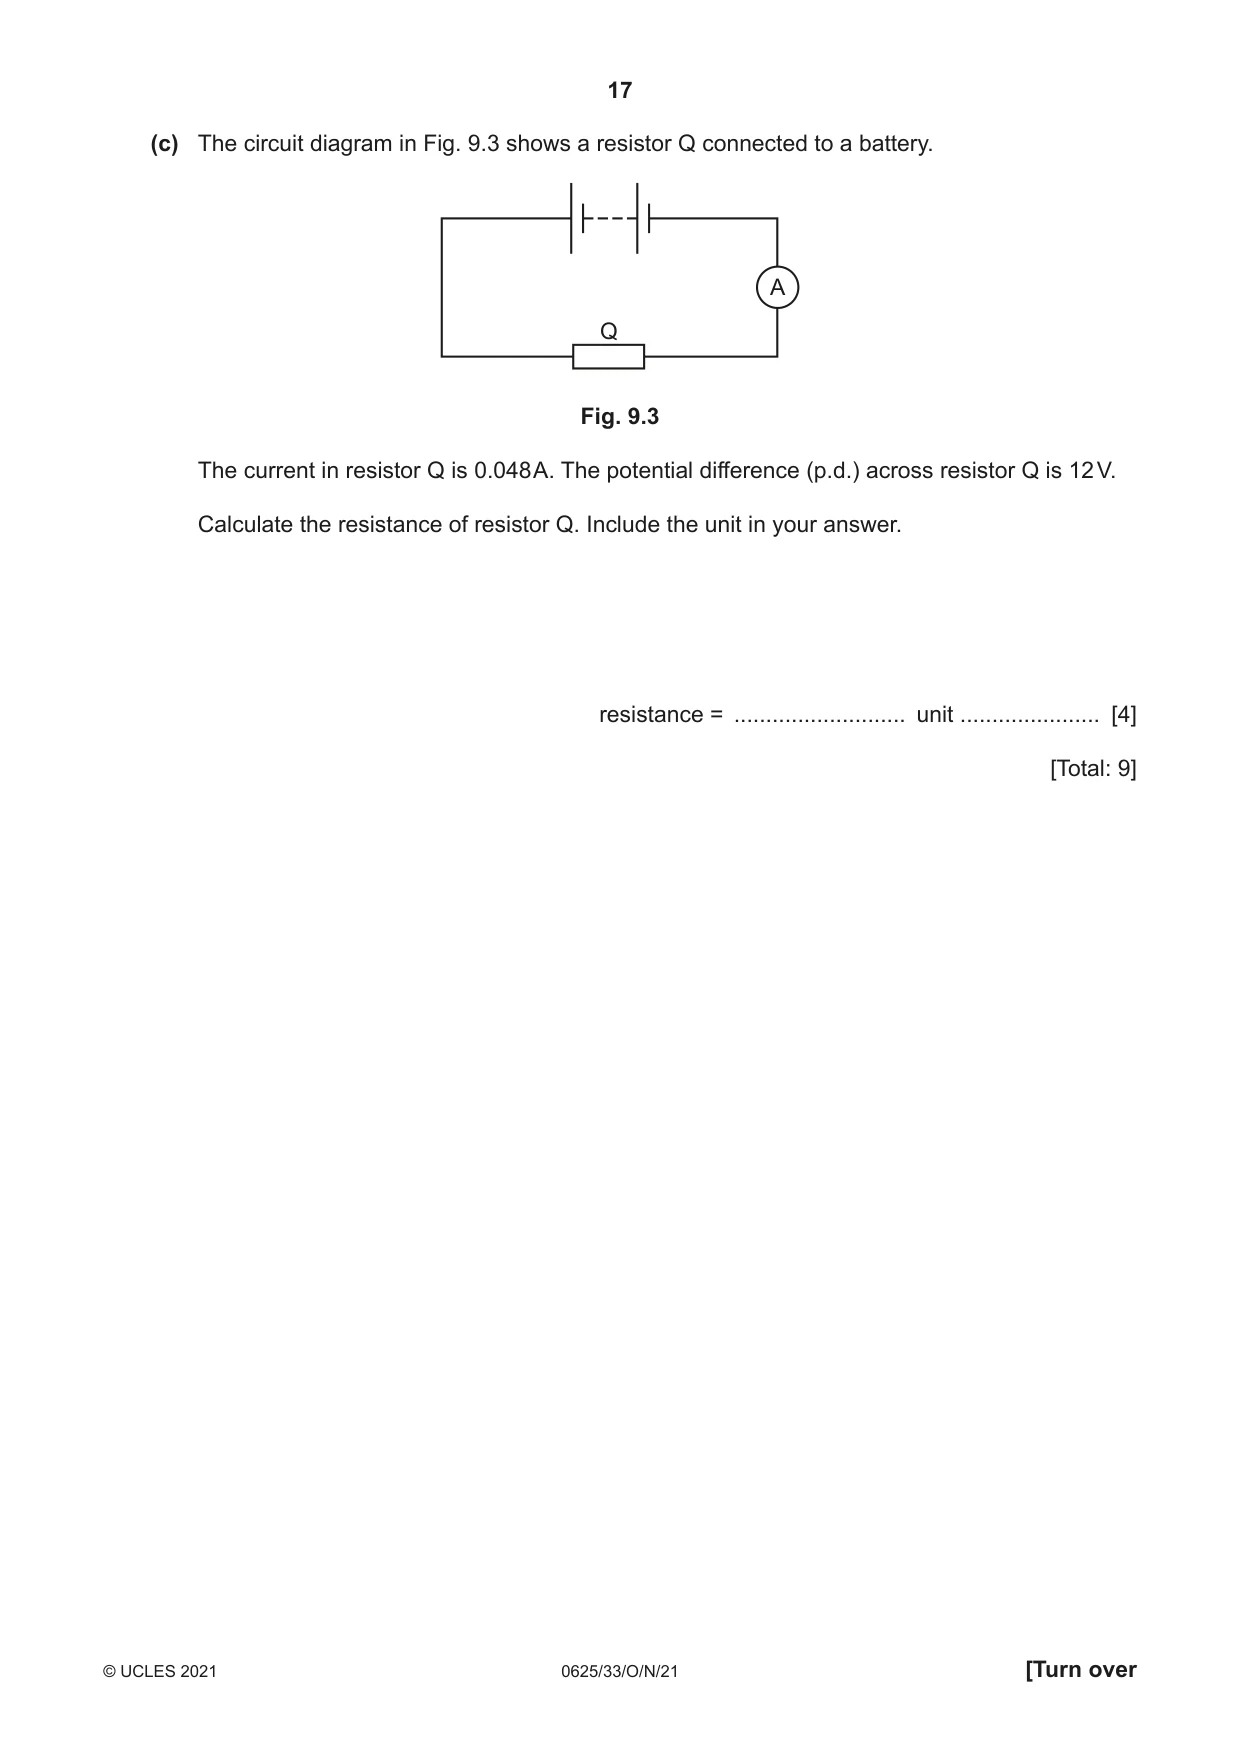
9 (a) The circuit diagrams in Fig. 9.1 and Fig. 9.2 each show two resistors connected to a battery. Fig. 9.1 shows two resistors connected in series. Fig. 9.2 shows two resistors connected in parallel. All the resistors have the same resistance. Ignore the resistance of the ammeters. 12 V 12 V A3 A1 A2 A4 A5 Fig. 9.1 Fig. 9.2 Compare the currents in the ammeters by completing the sentences. (i) The current in A1 is ............................................................ the current in A2. [1] (ii) The current in A3 is ............................................................ the current in A4. [1] (iii) The current in A4 is ............................................................ the current in A5. [1] (iv) The current in A1 is ............................................................ the current in A3. [1] (b) The lights in a room are connected in parallel with a power supply. State one advantage of connecting the lights in parallel. ............................................................................................................................................. [1] (c) The circuit diagram in Fig. 9.3 shows a resistor Q connected to a battery. A Q Fig. 9.3 The current in resistor Q is 0.048 A. The potential difference (p.d.) across resistor Q is 12 V. Calculate the resistance of resistor Q. Include the unit in your answer. resistance = ........................... unit ...................... [4] [Total: 9]
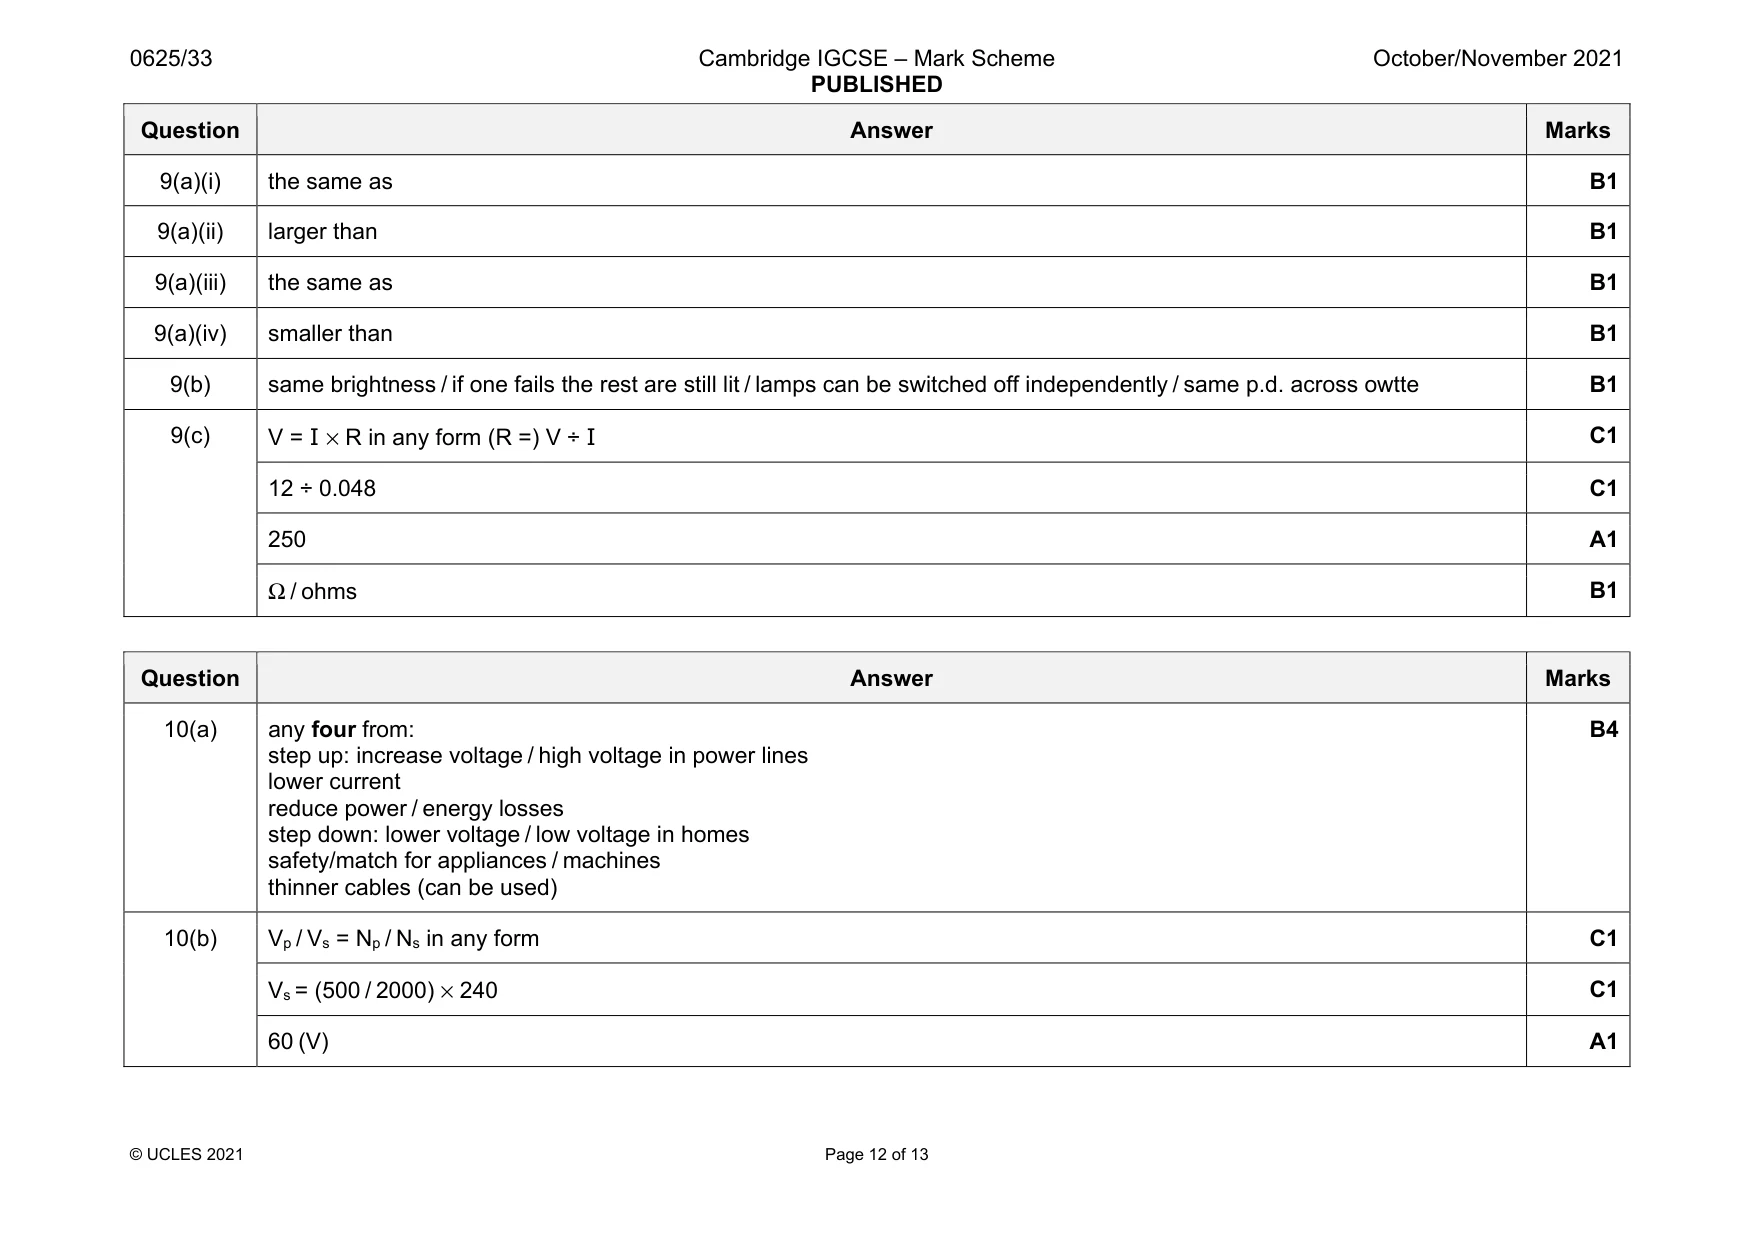
Mark scheme: 9(a)(i) the same as B1 9(a)(ii) larger than B1 9(a)(iii) the same as B1 9(a)(iv) smaller than B1 9(b) same brightness / if one fails the rest are still lit / lamps can be switched off independently / same p.d. across owtte B1 9(c) V = I × R in any form (R =) V ÷ I C1 12 ÷ 0.048 C1 250 A1 Ω / ohms B1
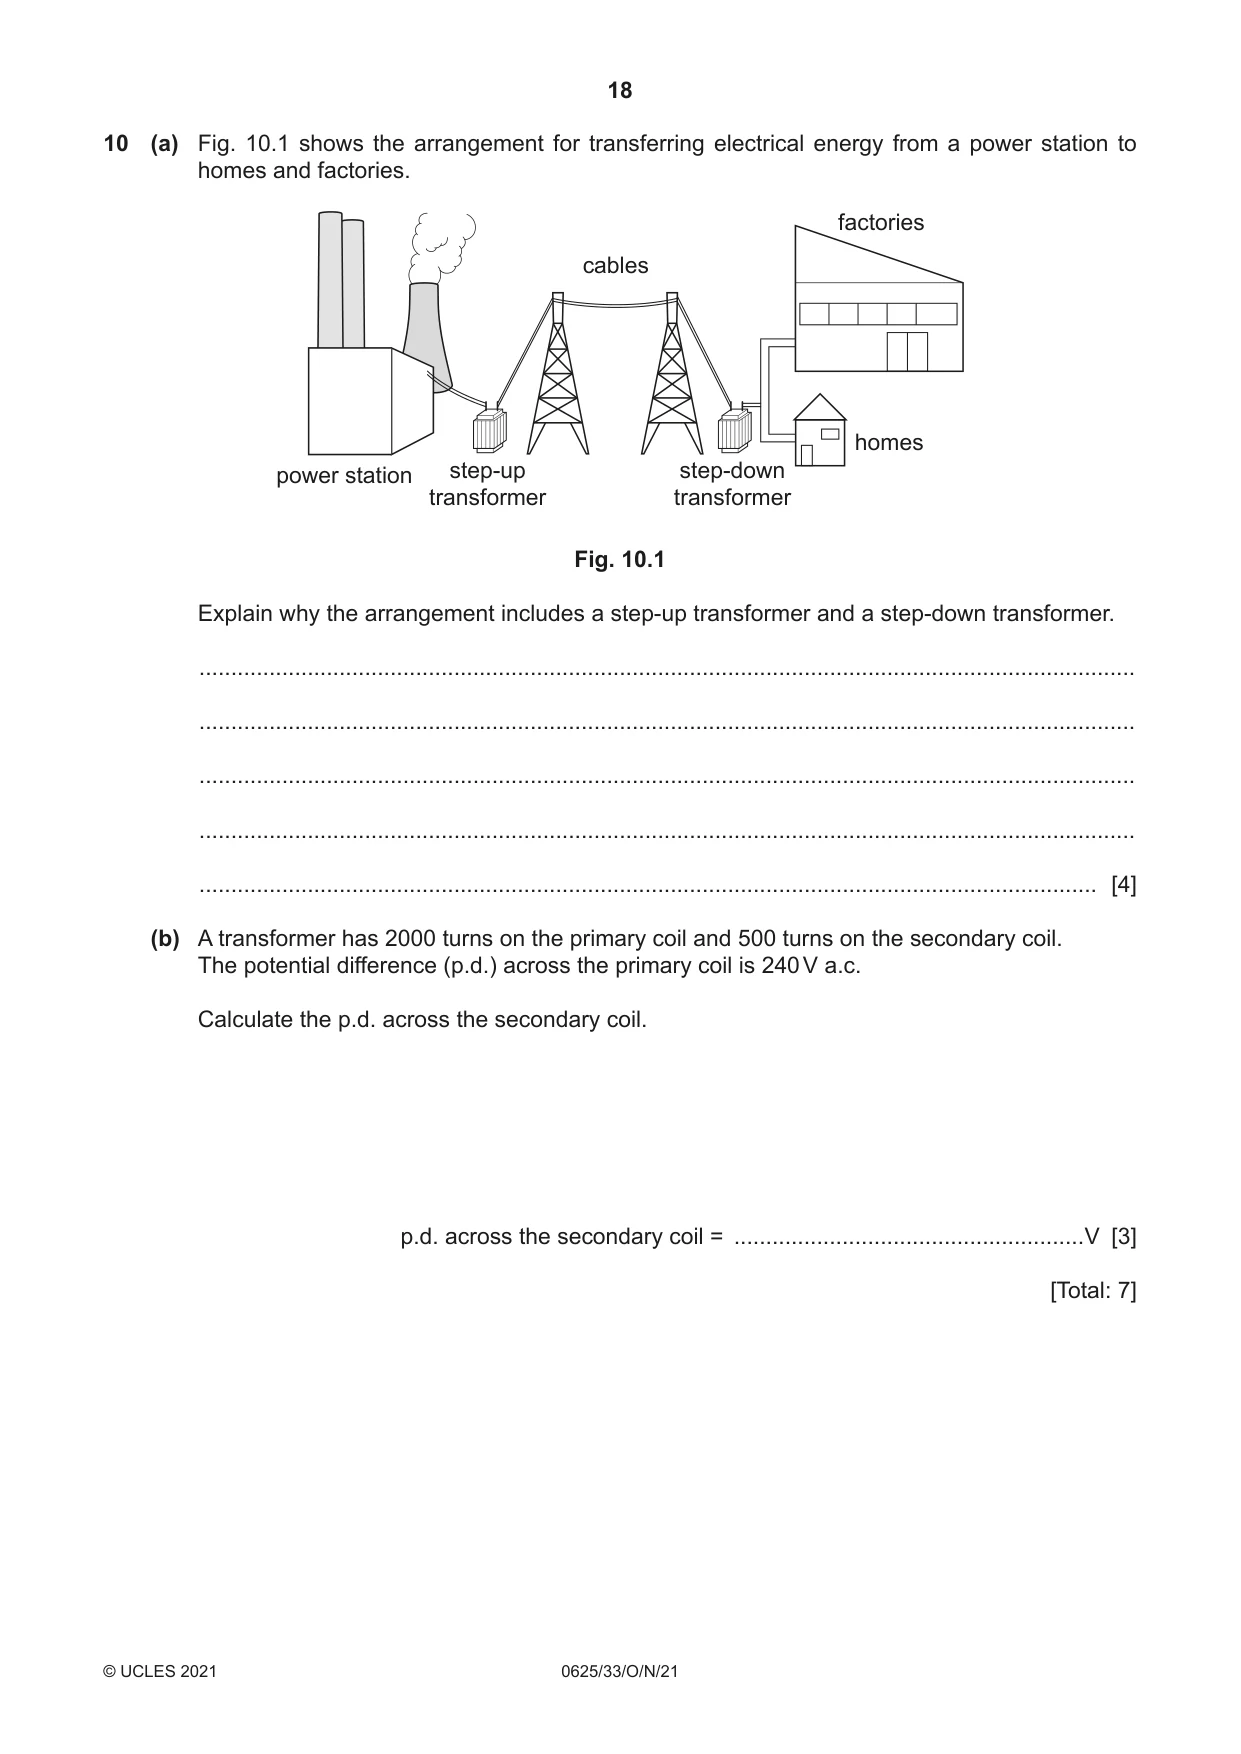
Q10 · The arrangement for transferring electrical energy from a power station to homes and…
10 (a) Fig. 10.1 shows the arrangement for transferring electrical energy from a power station to homes and factories. factories cables homes power station step-up step-down transformer transformer Fig. 10.1 Explain why the arrangement includes a step-up transformer and a step-down transformer. ................................................................................................................................................... ................................................................................................................................................... ................................................................................................................................................... ................................................................................................................................................... ............................................................................................................................................. [4] (b) A transformer has 2000 turns on the primary coil and 500 turns on the secondary coil. The potential difference (p.d.) across the primary coil is 240 V a.c. Calculate the p.d. across the secondary coil. p.d. across the secondary coil = .......................................................V [3] [Total: 7]
Mark scheme: 10(a) any four from: step up: increase voltage / high voltage in power lines lower current reduce power / energy losses step down: lower voltage / low voltage in homes safety/match for appliances / machines thinner cables (can be used) 10(b) Vp / Vs = Np / Ns in any form C1 Vs = (500 / 2000) × 240 C1 60 (V) A1
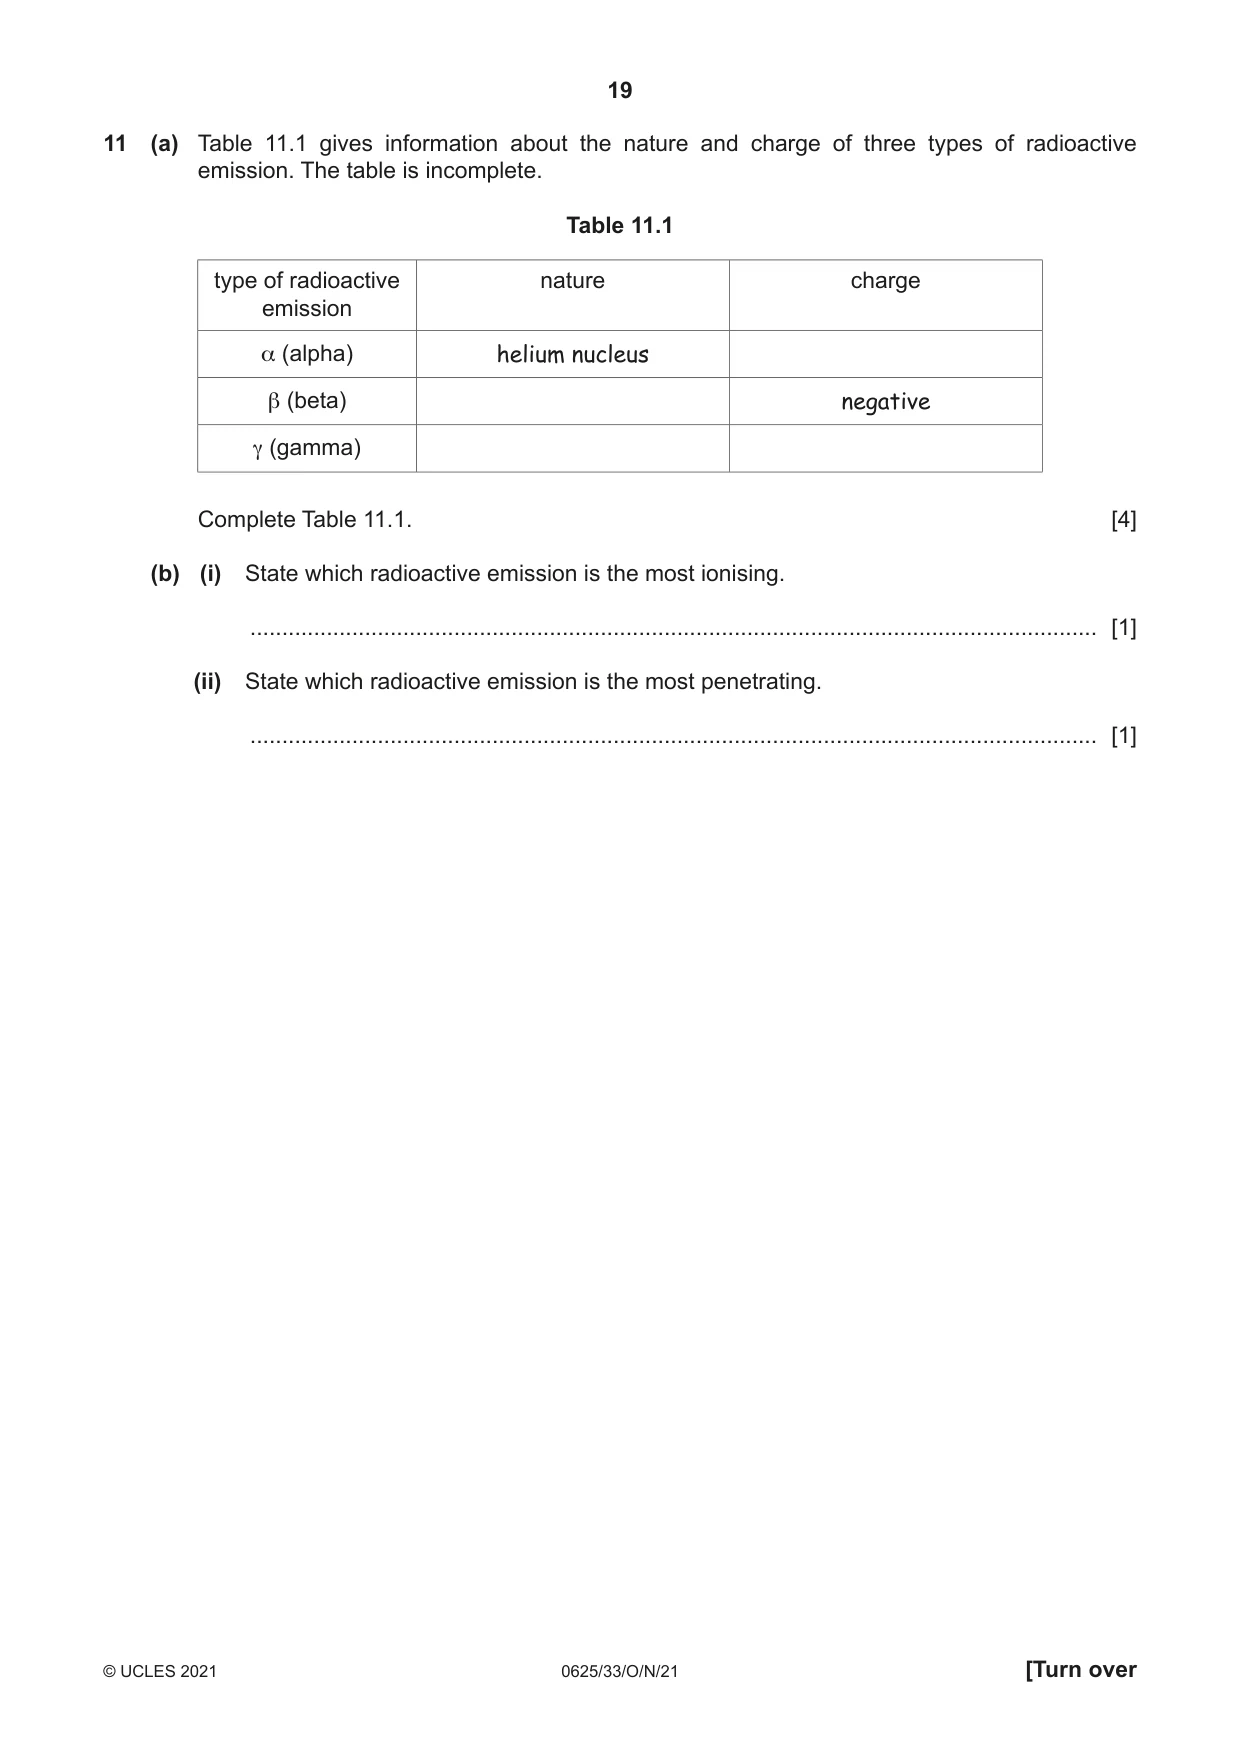
Q11 · Information about the nature and charge of three types of radioactive emission
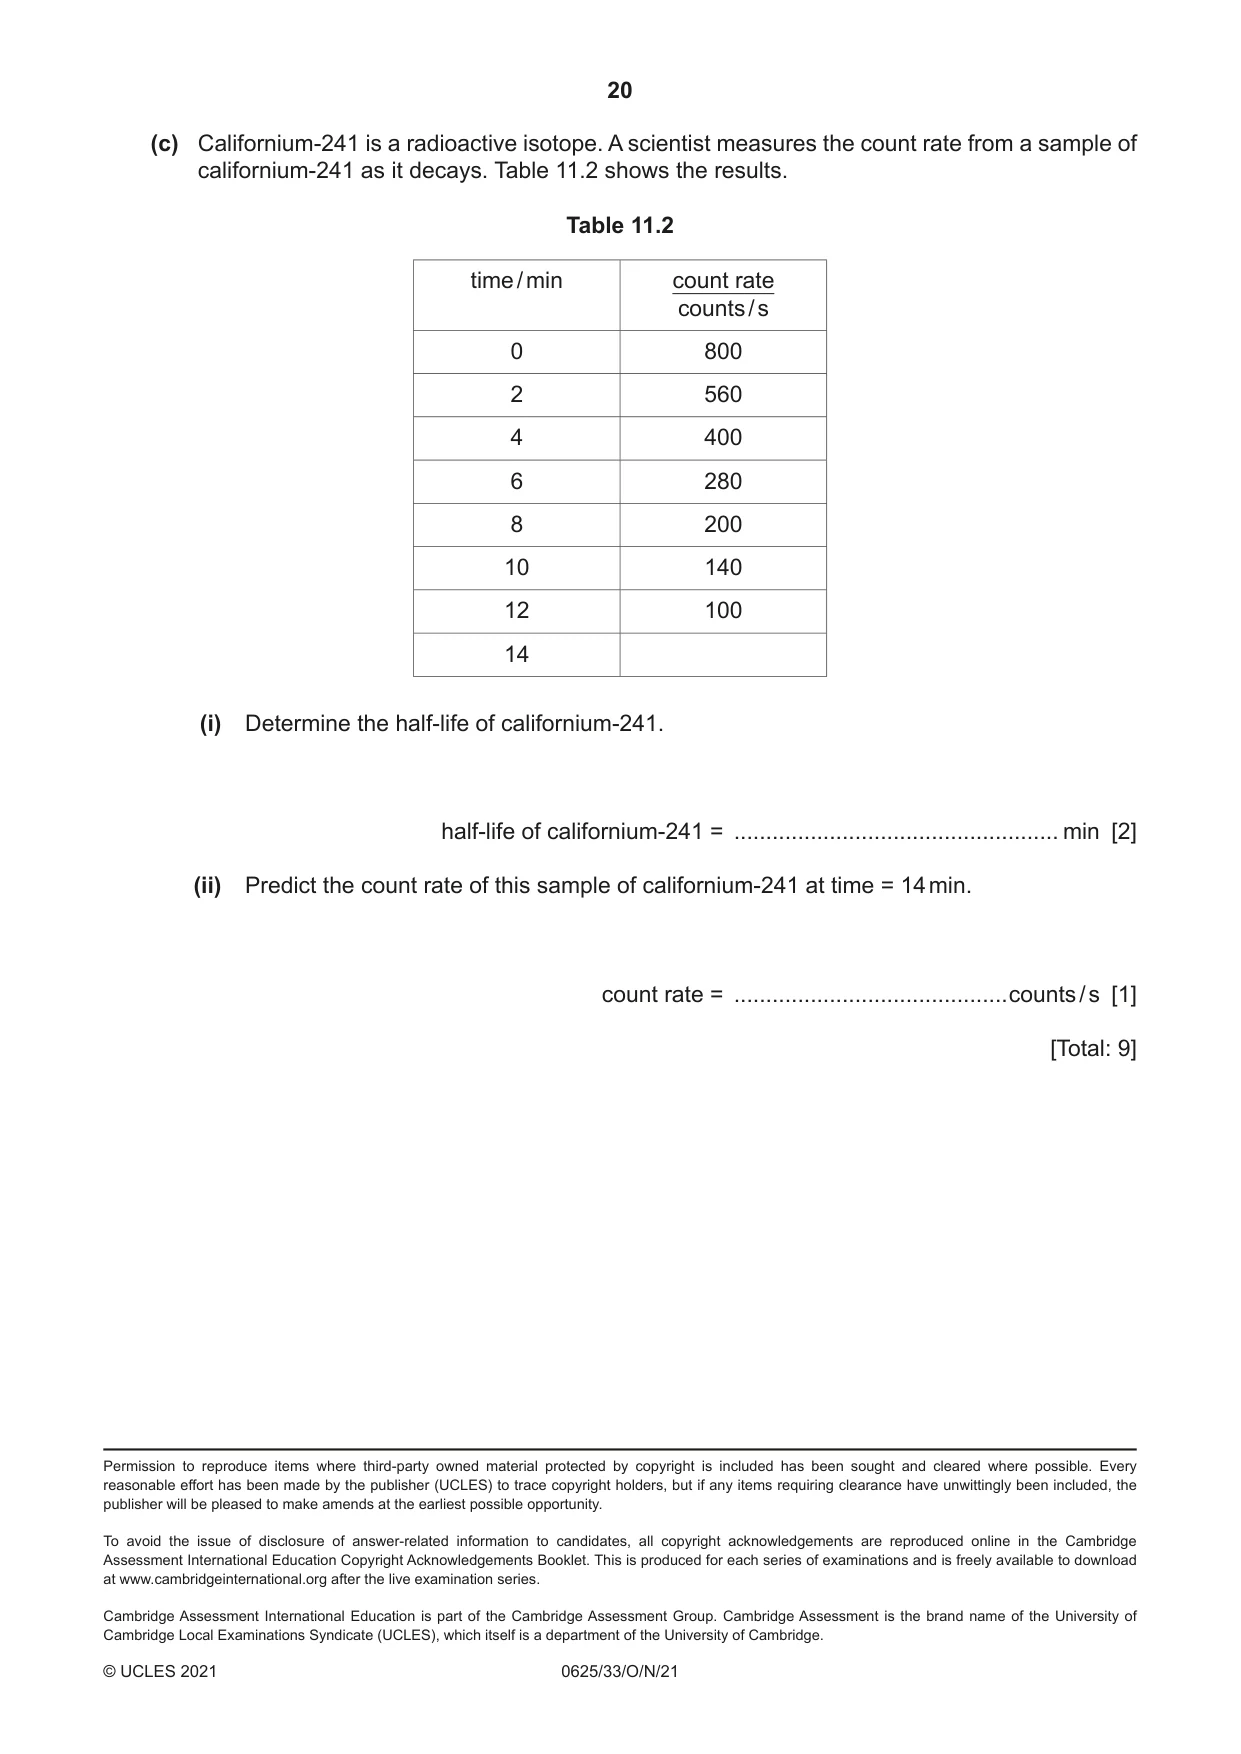
11 (a) Table 11.1 gives information about the nature and charge of three types of radioactive emission. The table is incomplete. Table 11.1 type of radioactive nature charge emission α (alpha) helium nucleus β (beta) negative γ (gamma) Complete Table 11.1. [4] (b) (i) State which radioactive emission is the most ionising. ..................................................................................................................................... [1] (ii) State which radioactive emission is the most penetrating. ..................................................................................................................................... [1] (c) Californium-241 is a radioactive isotope. A scientist measures the count rate from a sample of californium-241 as it decays. Table 11.2 shows the results. Table 11.2 time / min count rate counts / s 0 800 2 560 4 400 6 280 8 200 10 140 12 100 14 (i) Determine the half-life of californium-241. half-life of californium-241 = ................................................... min [2] (ii) Predict the count rate of this sample of californium-241 at time = 14 min. count rate = ...........................................counts / s [1] [Total: 9]
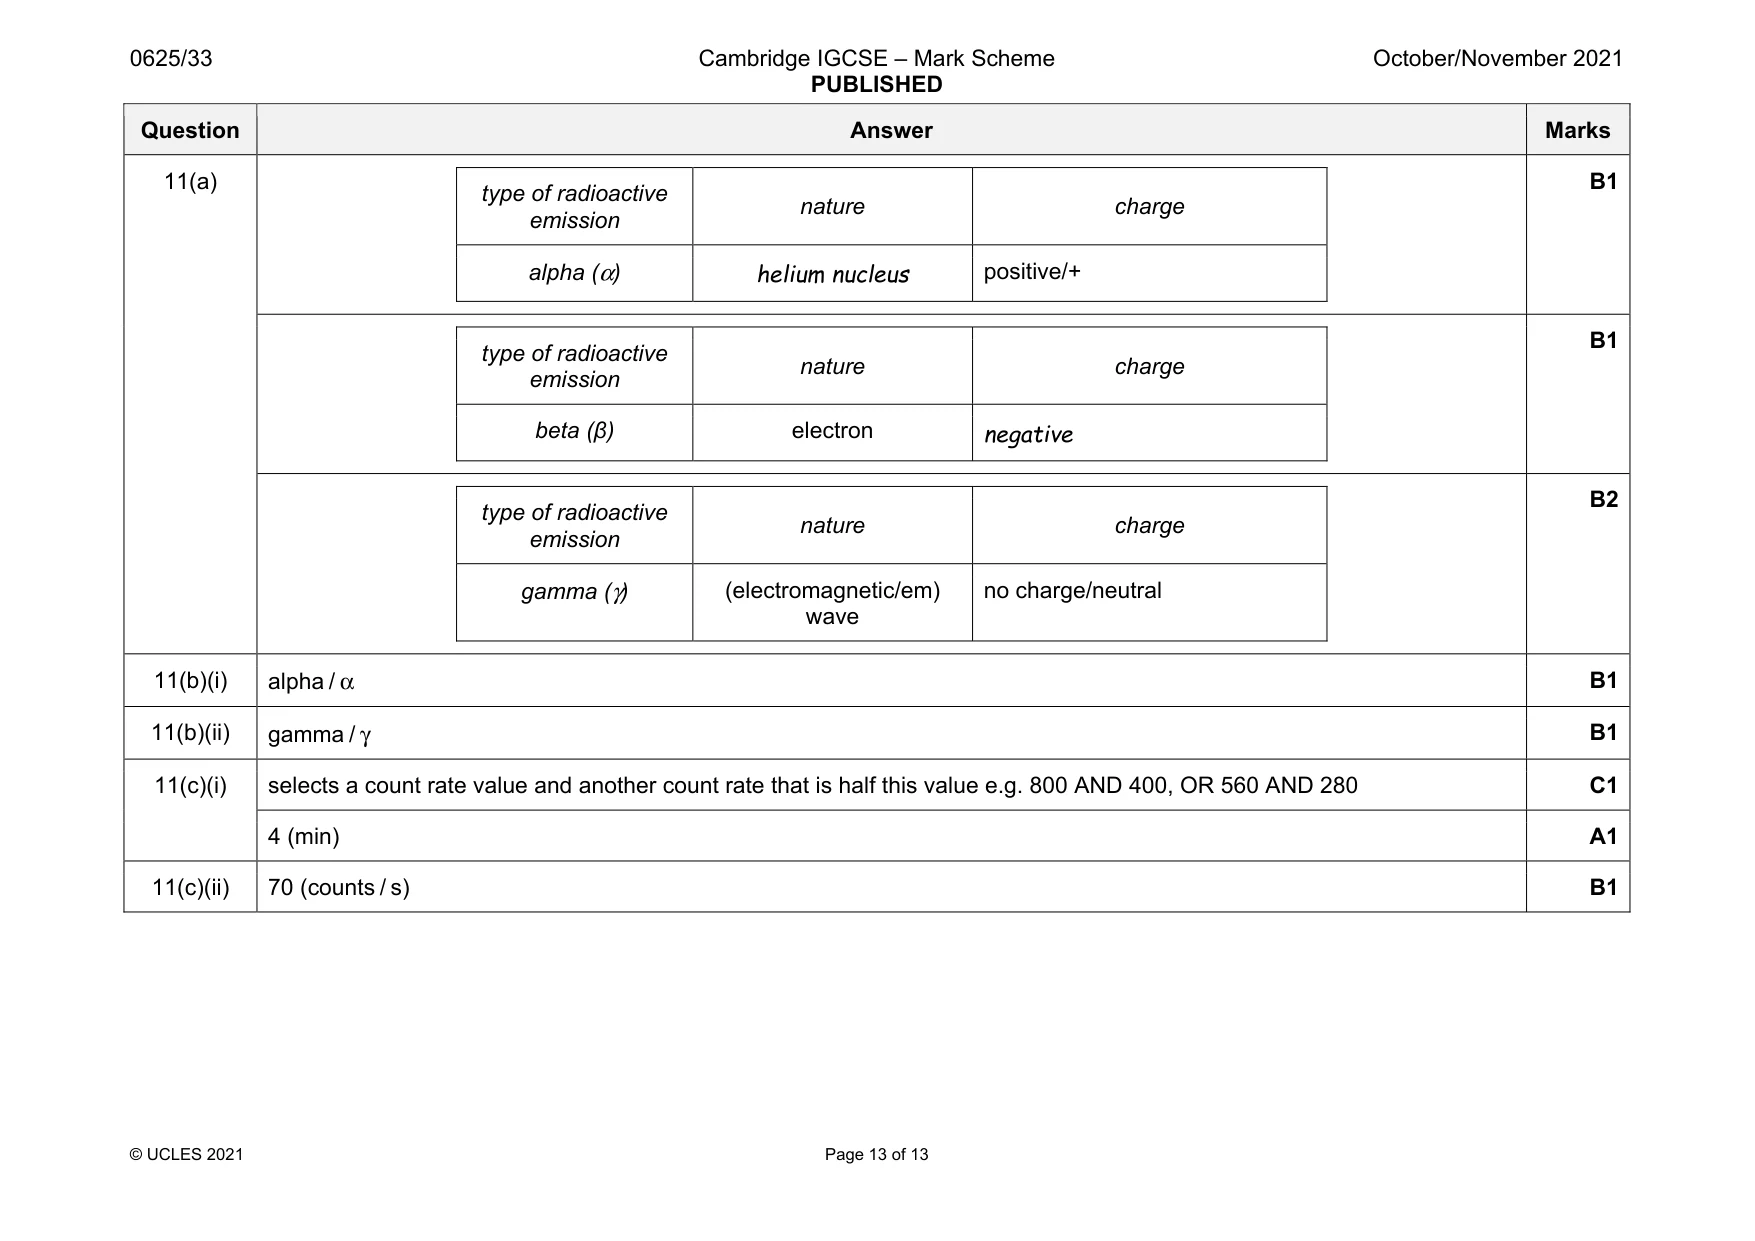
Mark scheme: 11(a) type of radioactive emission nature charge alpha (α) helium nucleus positive/+ B1 type of radioactive emission nature charge beta (β) electron negative B1 type of radioactive emission nature charge gamma (γ) (electromagnetic/em) wave no charge/neutral B2 11(b)(i) alpha / α B1 11(b)(ii) gamma / γ B1 11(c)(i) selects a count rate value and another count rate that is half this value e.g. 800 AND 400, OR 560 AND 280 C1 4 (min) A1 11(c)(ii) 70 (counts / s) B1
What was in this paper
The subtopics covered by these 11 questions, and how many questions each got. Open one in a new tab to see every Cambridge question on it.
What you needed in this session
Cambridge’s own grade thresholds for 2021 Oct/Nov, Paper 3 · Variant 3. A higher threshold means an easier paper — the bar moves with how the cohort did.