Cambridge IGCSE Physics 0625 — 2023 Oct/Nov Paper 3 · Variant 1
0625/31/O/N/23 · 11 questions · 80 marks · ≈90 min
The question paper and its mark scheme, free to read here and free to download. This is Cambridge’s own paper, exactly as it was sat.
Question paper16 pages
Mark scheme13 pages
Answers below. Sit the paper first if you are practising.
Questions as text
Q1 · A distance–time graph for a cyclist
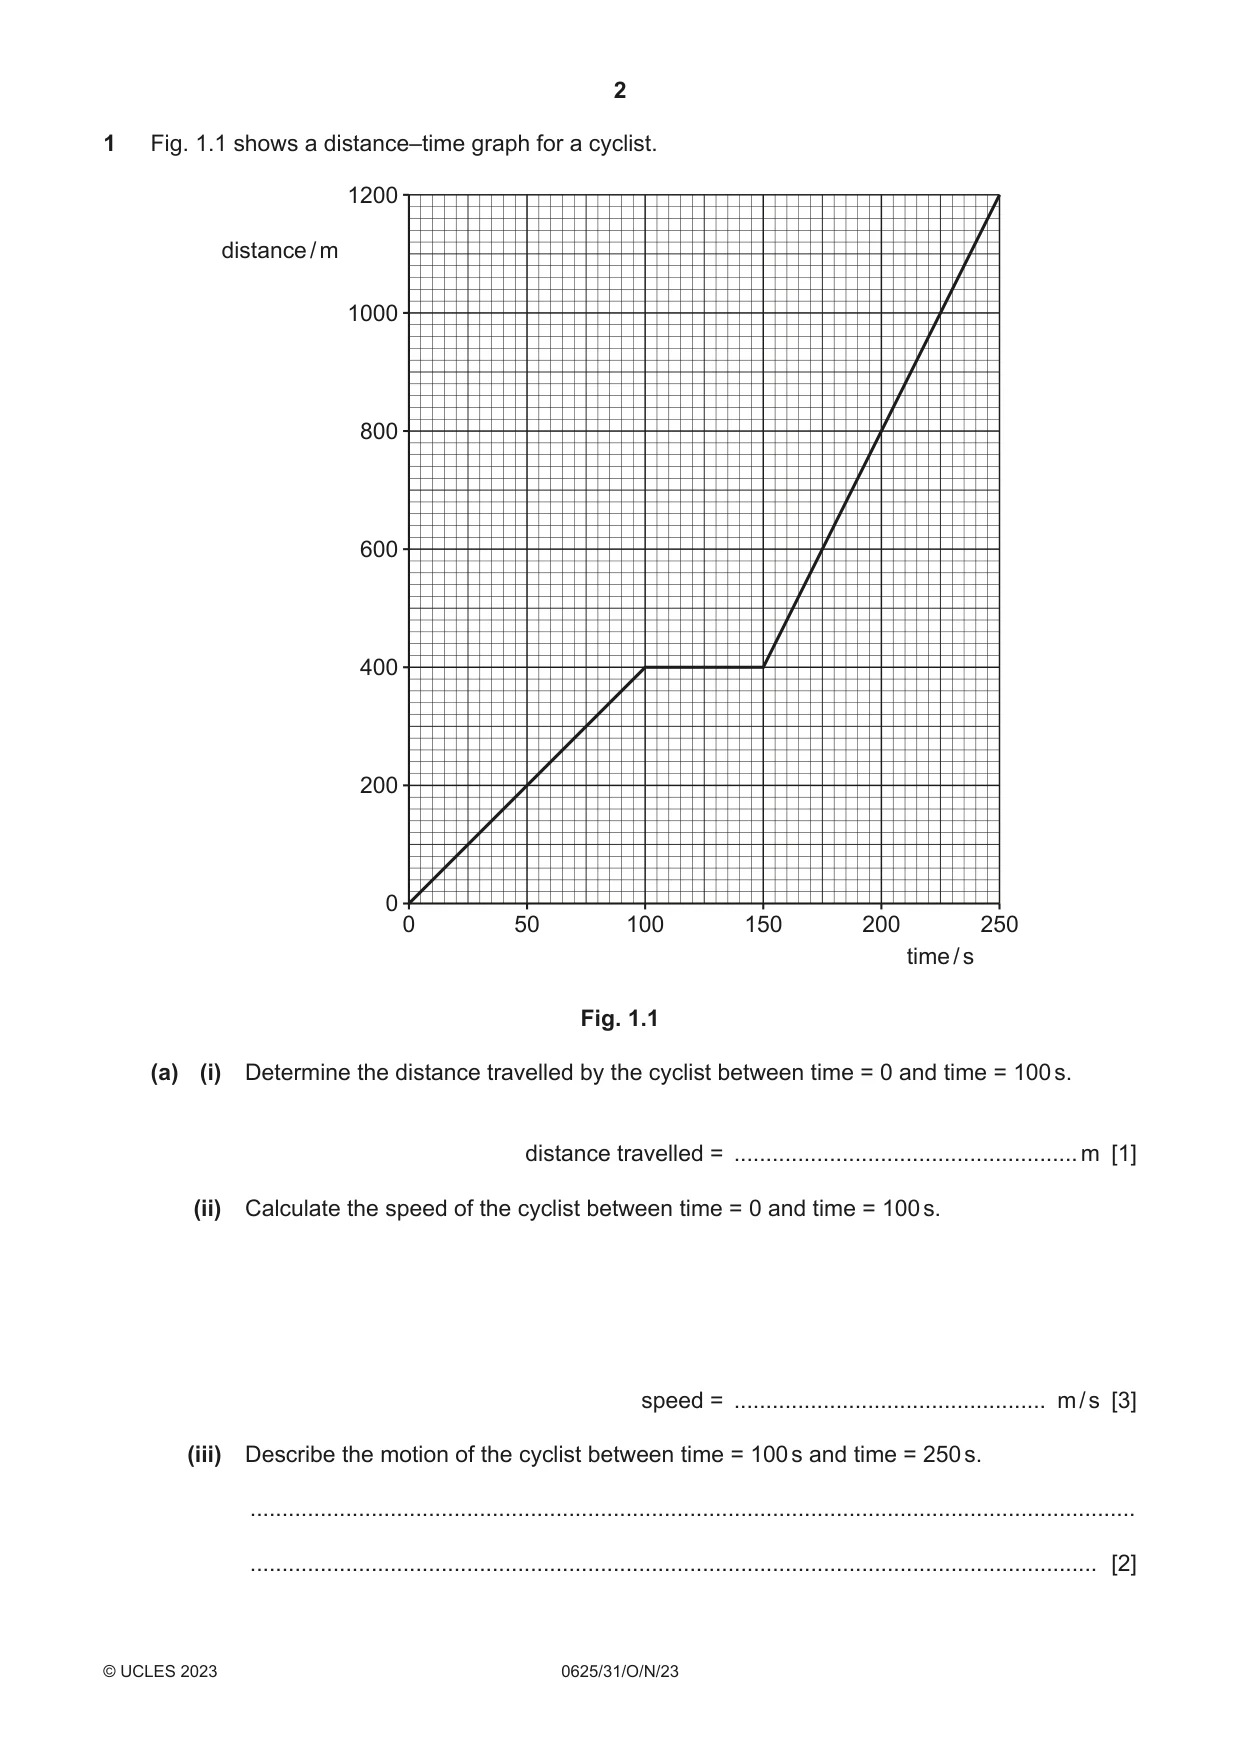
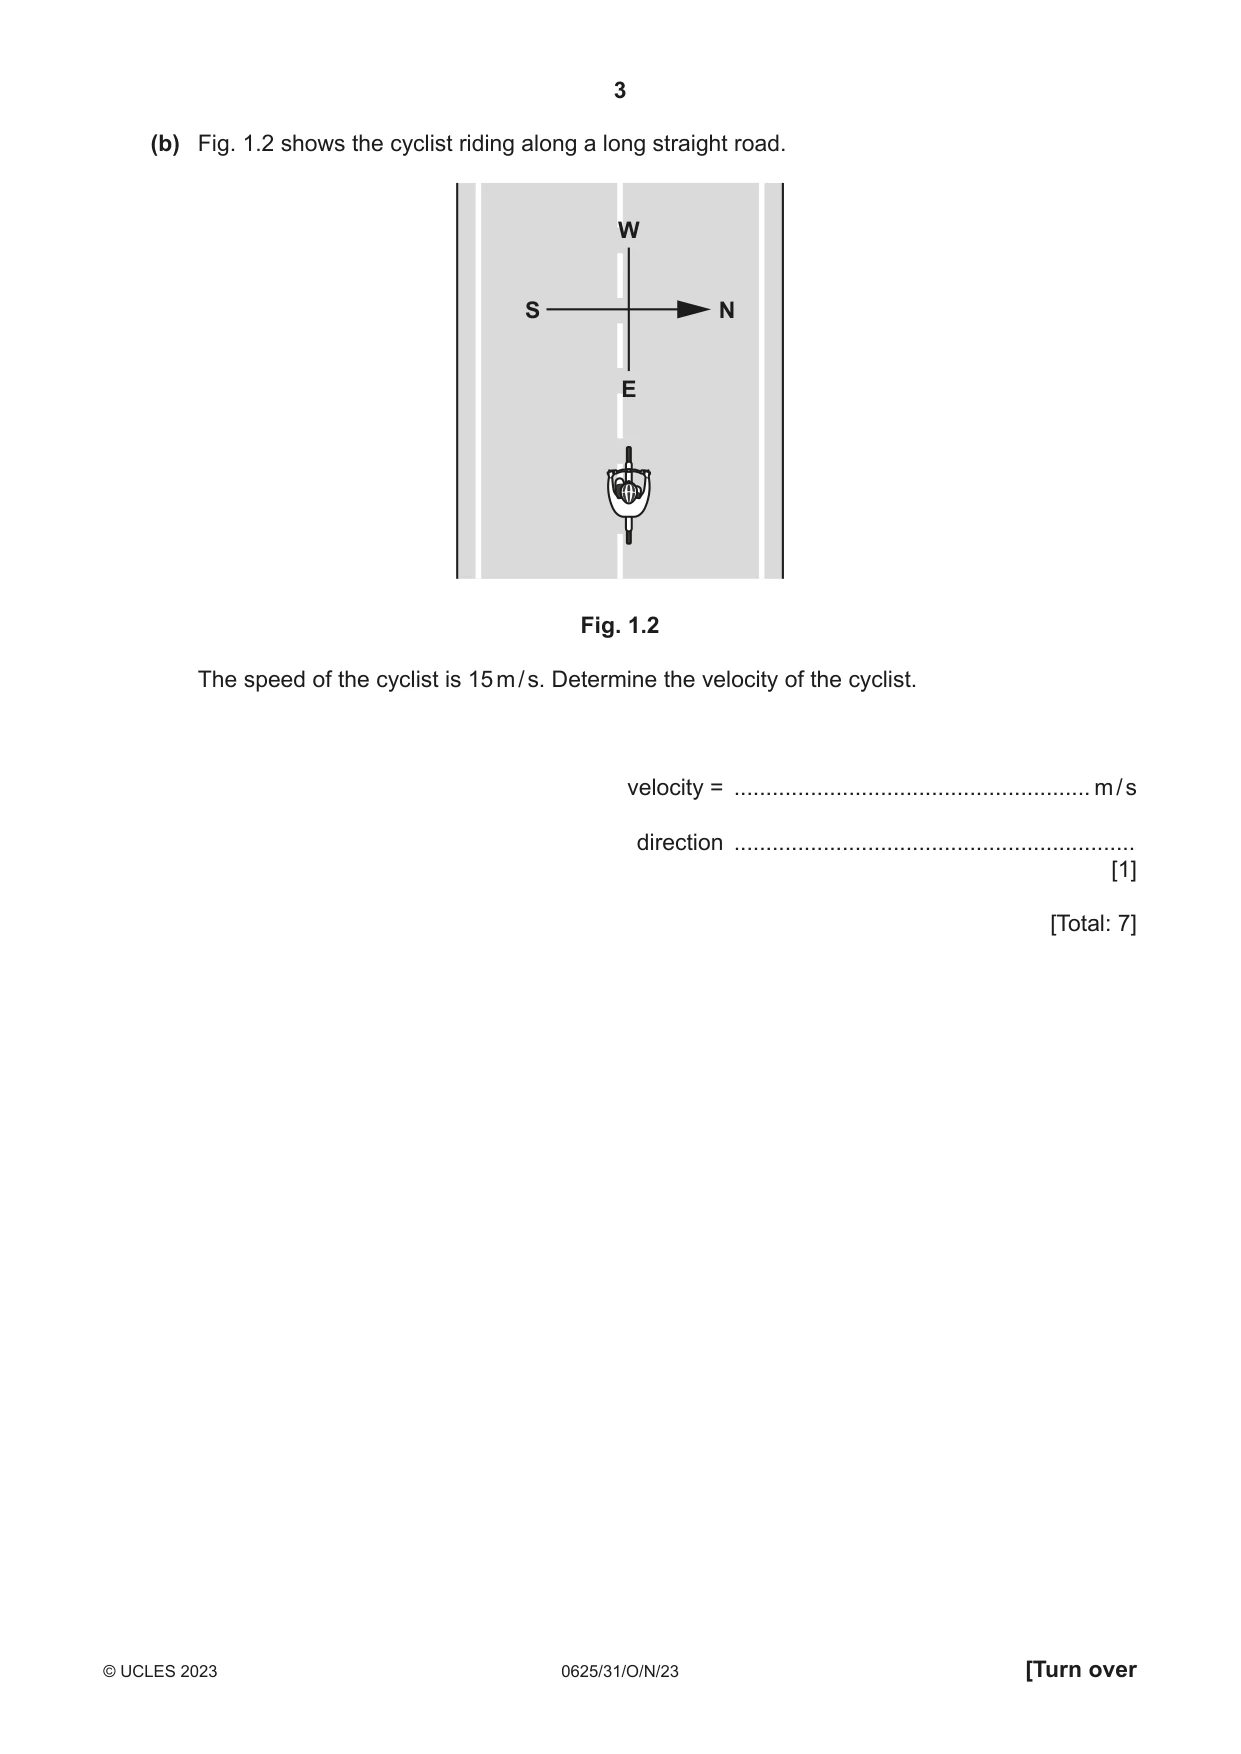
1 Fig. 1.1 shows a distance–time graph for a cyclist. 1200 distance / m 1000 800 600 400 200 0 0 50 100 150 200 250 time / s Fig. 1.1 (a) (i) Determine the distance travelled by the cyclist between time = 0 and time = 100 s. distance travelled = ...................................................... m [1] (ii) Calculate the speed of the cyclist between time = 0 and time = 100 s. speed = ................................................. m / s [3] (iii) Describe the motion of the cyclist between time = 100 s and time = 250 s. ........................................................................................................................................... ..................................................................................................................................... [2] (b) Fig. 1.2 shows the cyclist riding along a long straight road. W S N E Fig. 1.2 The speed of the cyclist is 15 m / s. Determine the velocity of the cyclist. velocity = ........................................................ m / s direction ............................................................... [1] [Total: 7]
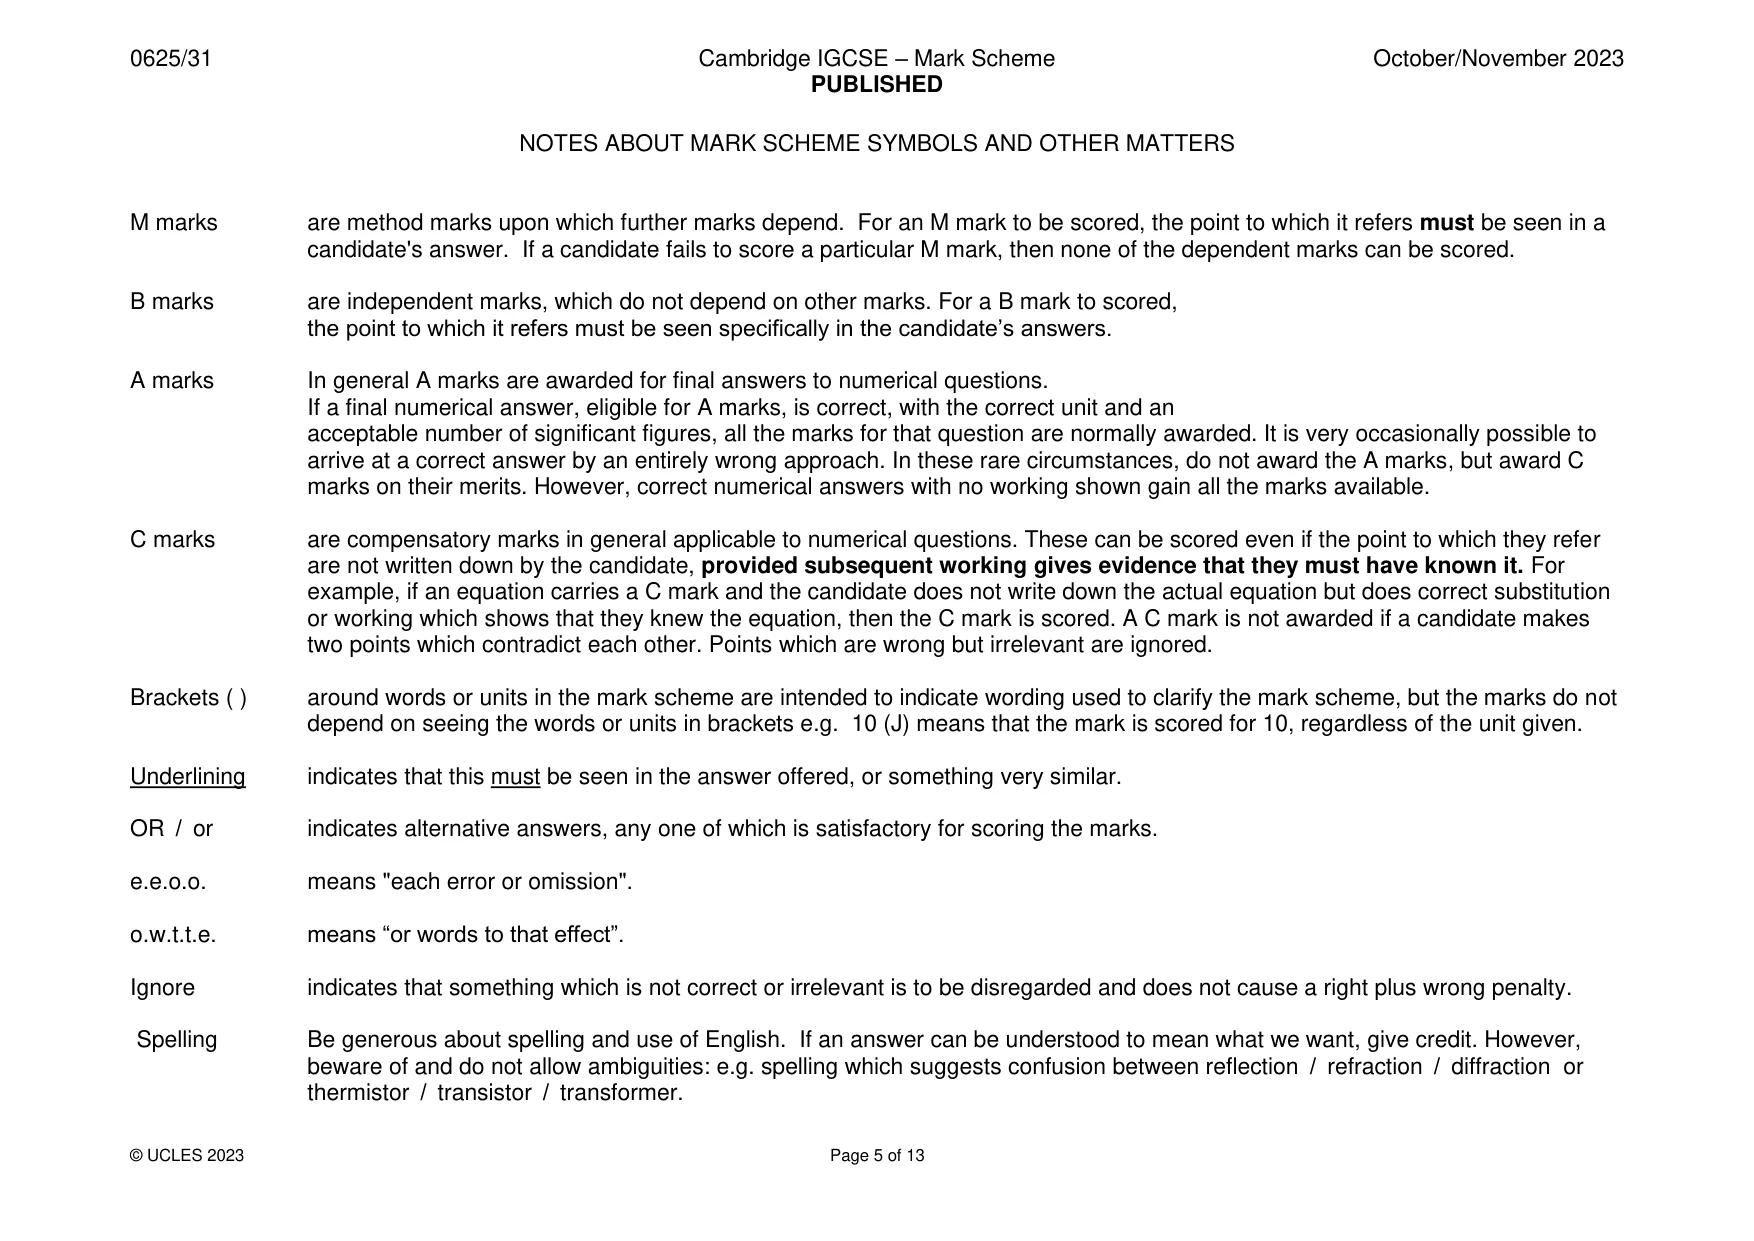
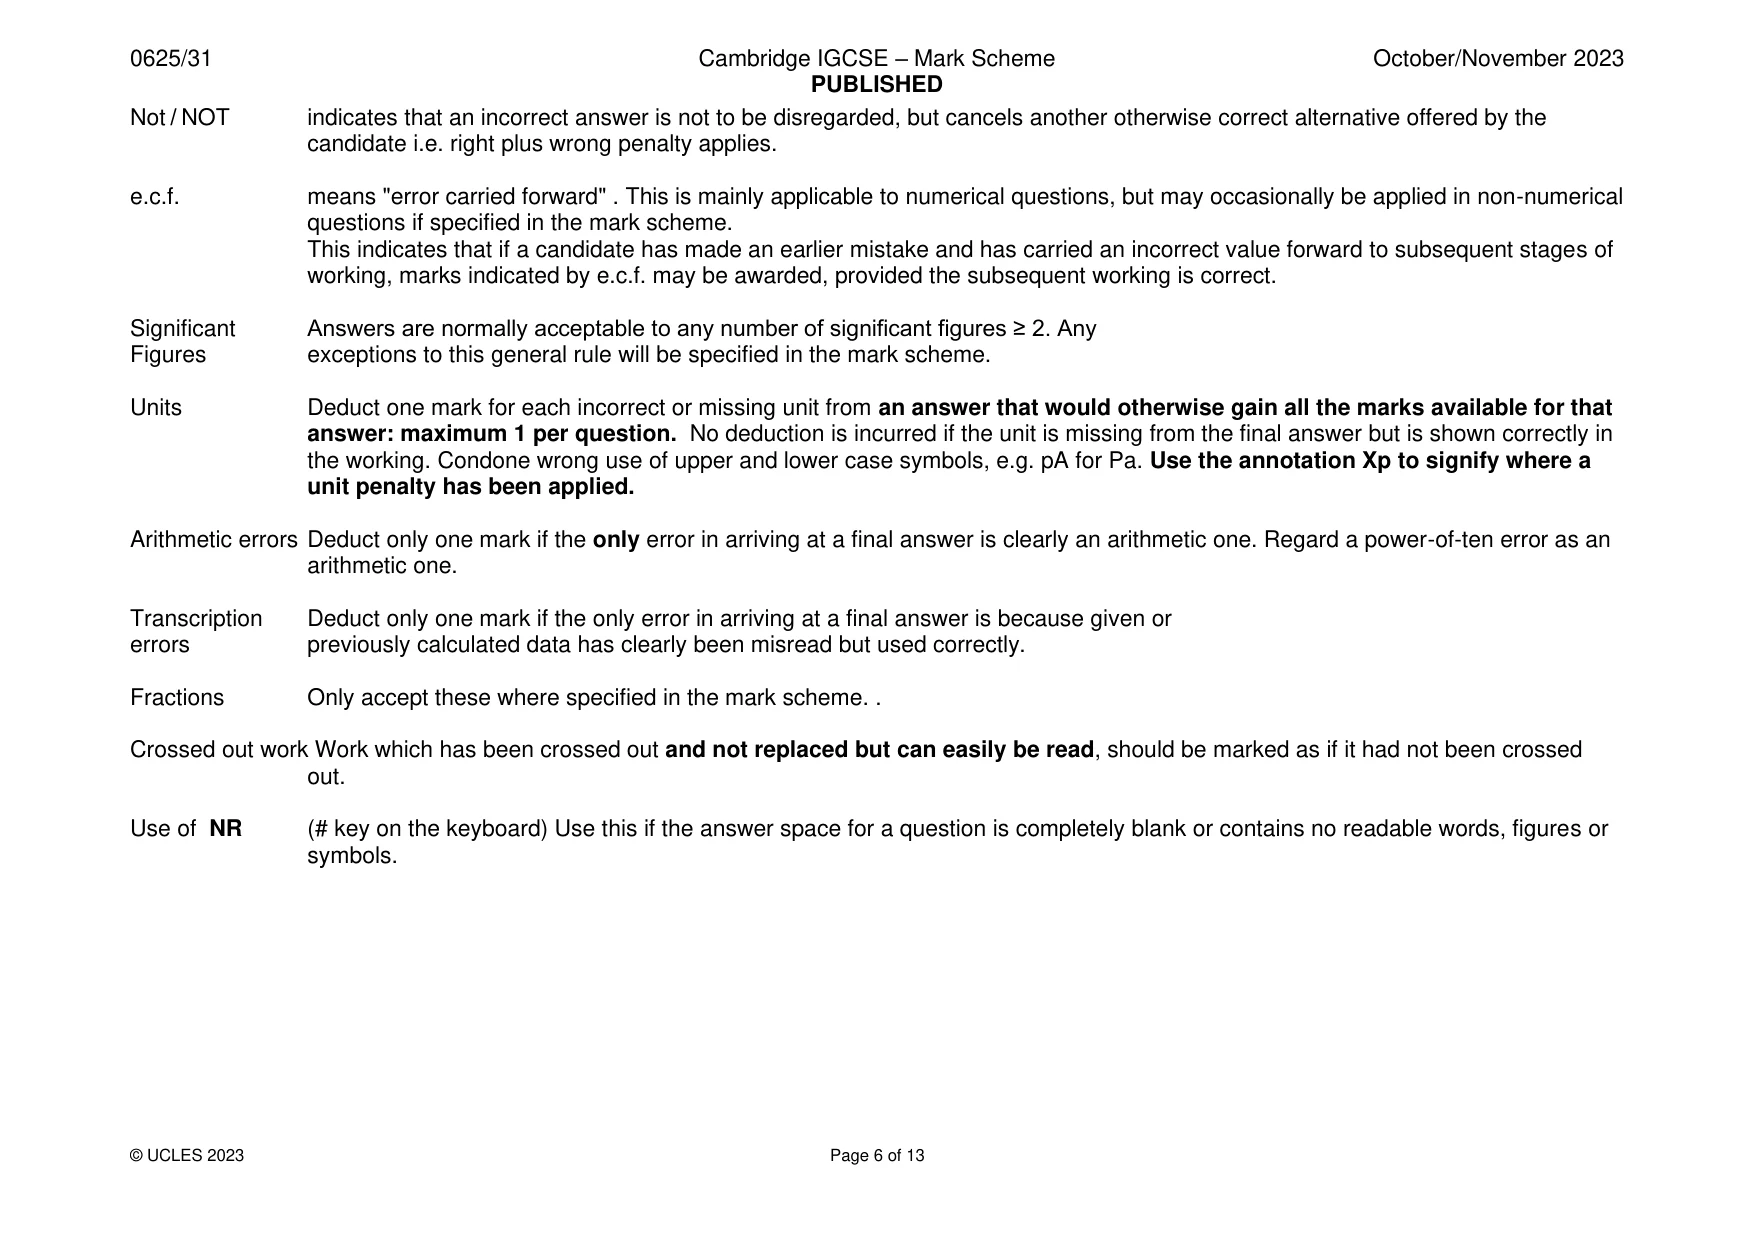
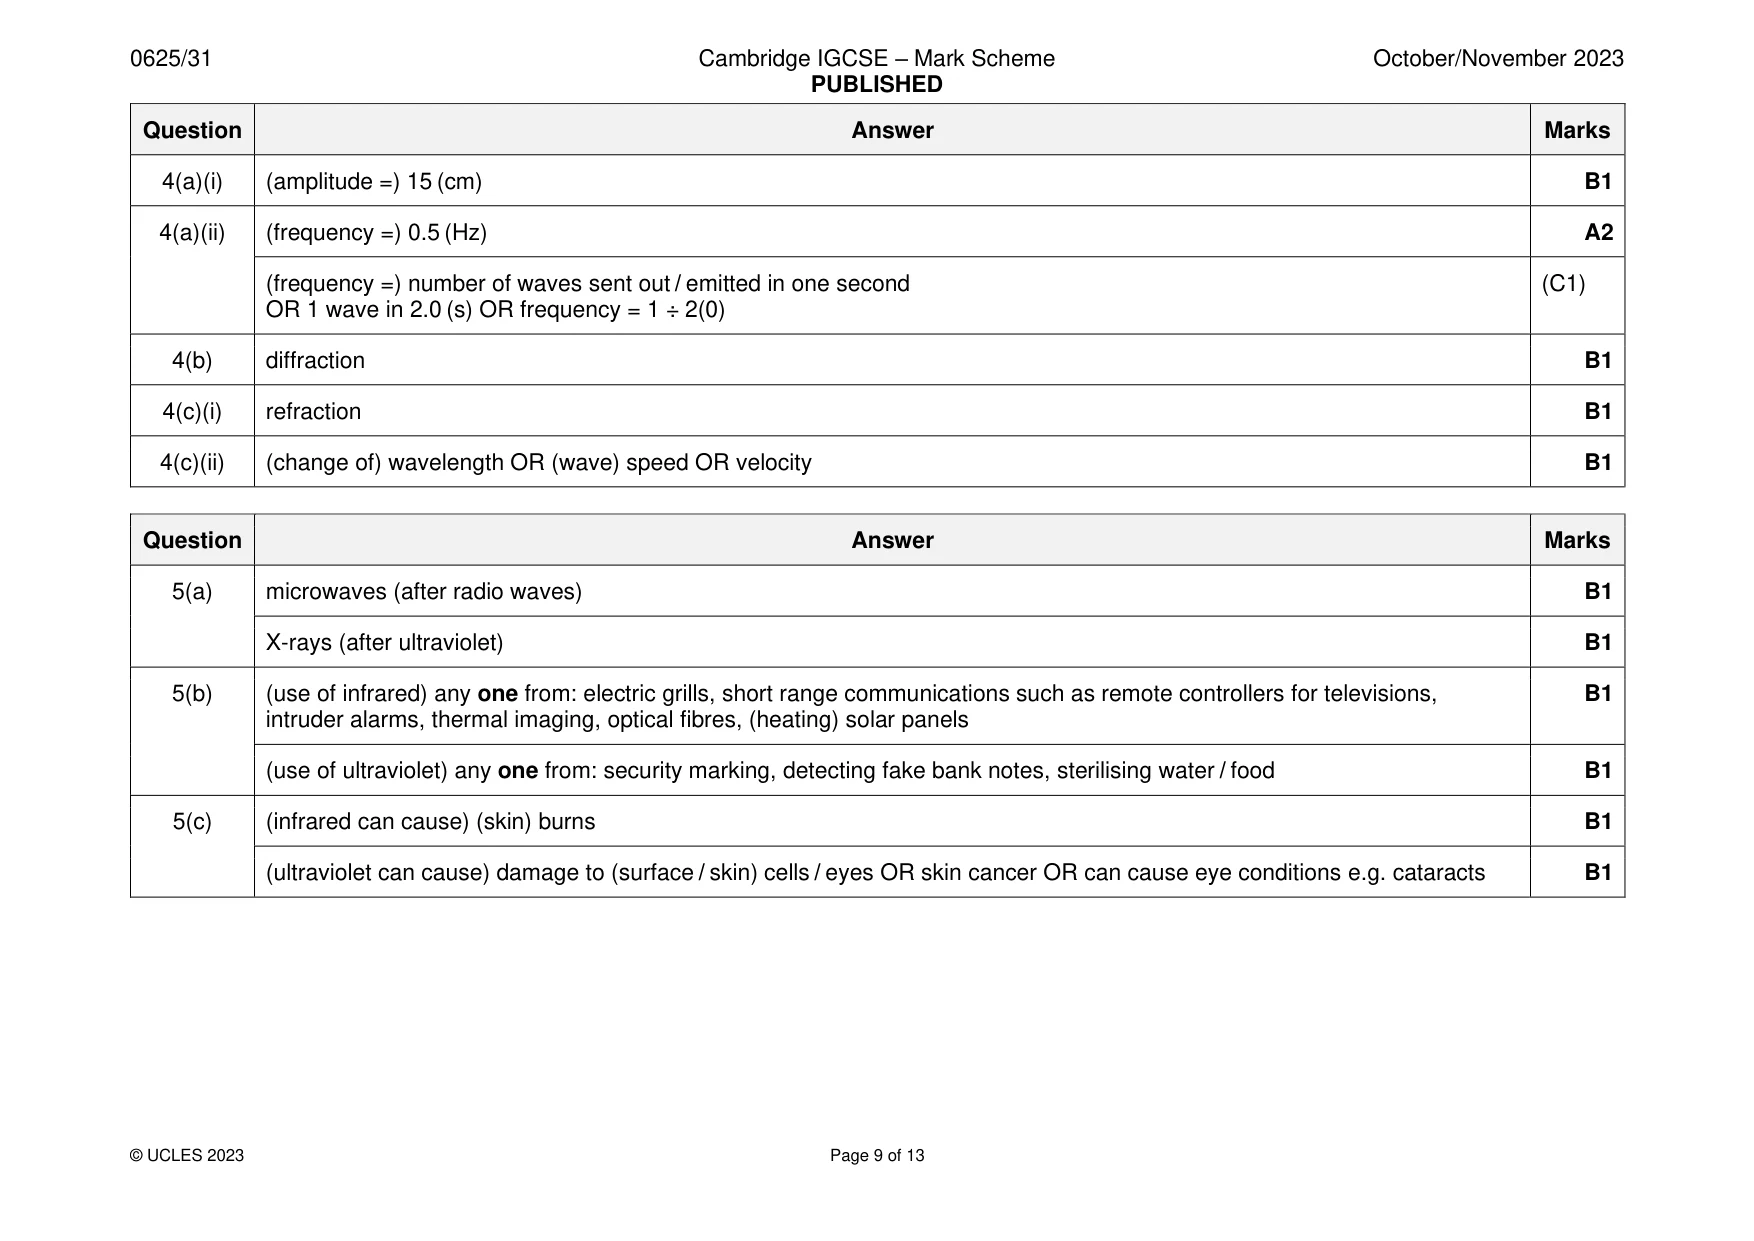
Mark scheme: Question Answer Marks 1(a)(i) (distance =) 400 (m) B1 1(a)(ii) 4(0) (m / s) A3 400 ÷ 100 (C2) (speed =) gradient of distance-time graph OR distance ÷ time (C1) 1(a)(iii) stationary OR stopped OR at rest (between 100 and 150 s) B1 (then) constant / steady speed (between 150 and 250 s) B1 1(b) 15 (m / s) (due) west / W B1
Q2 · The mass of a solid metal cylinder is 400 g and its volume is 52 cm3
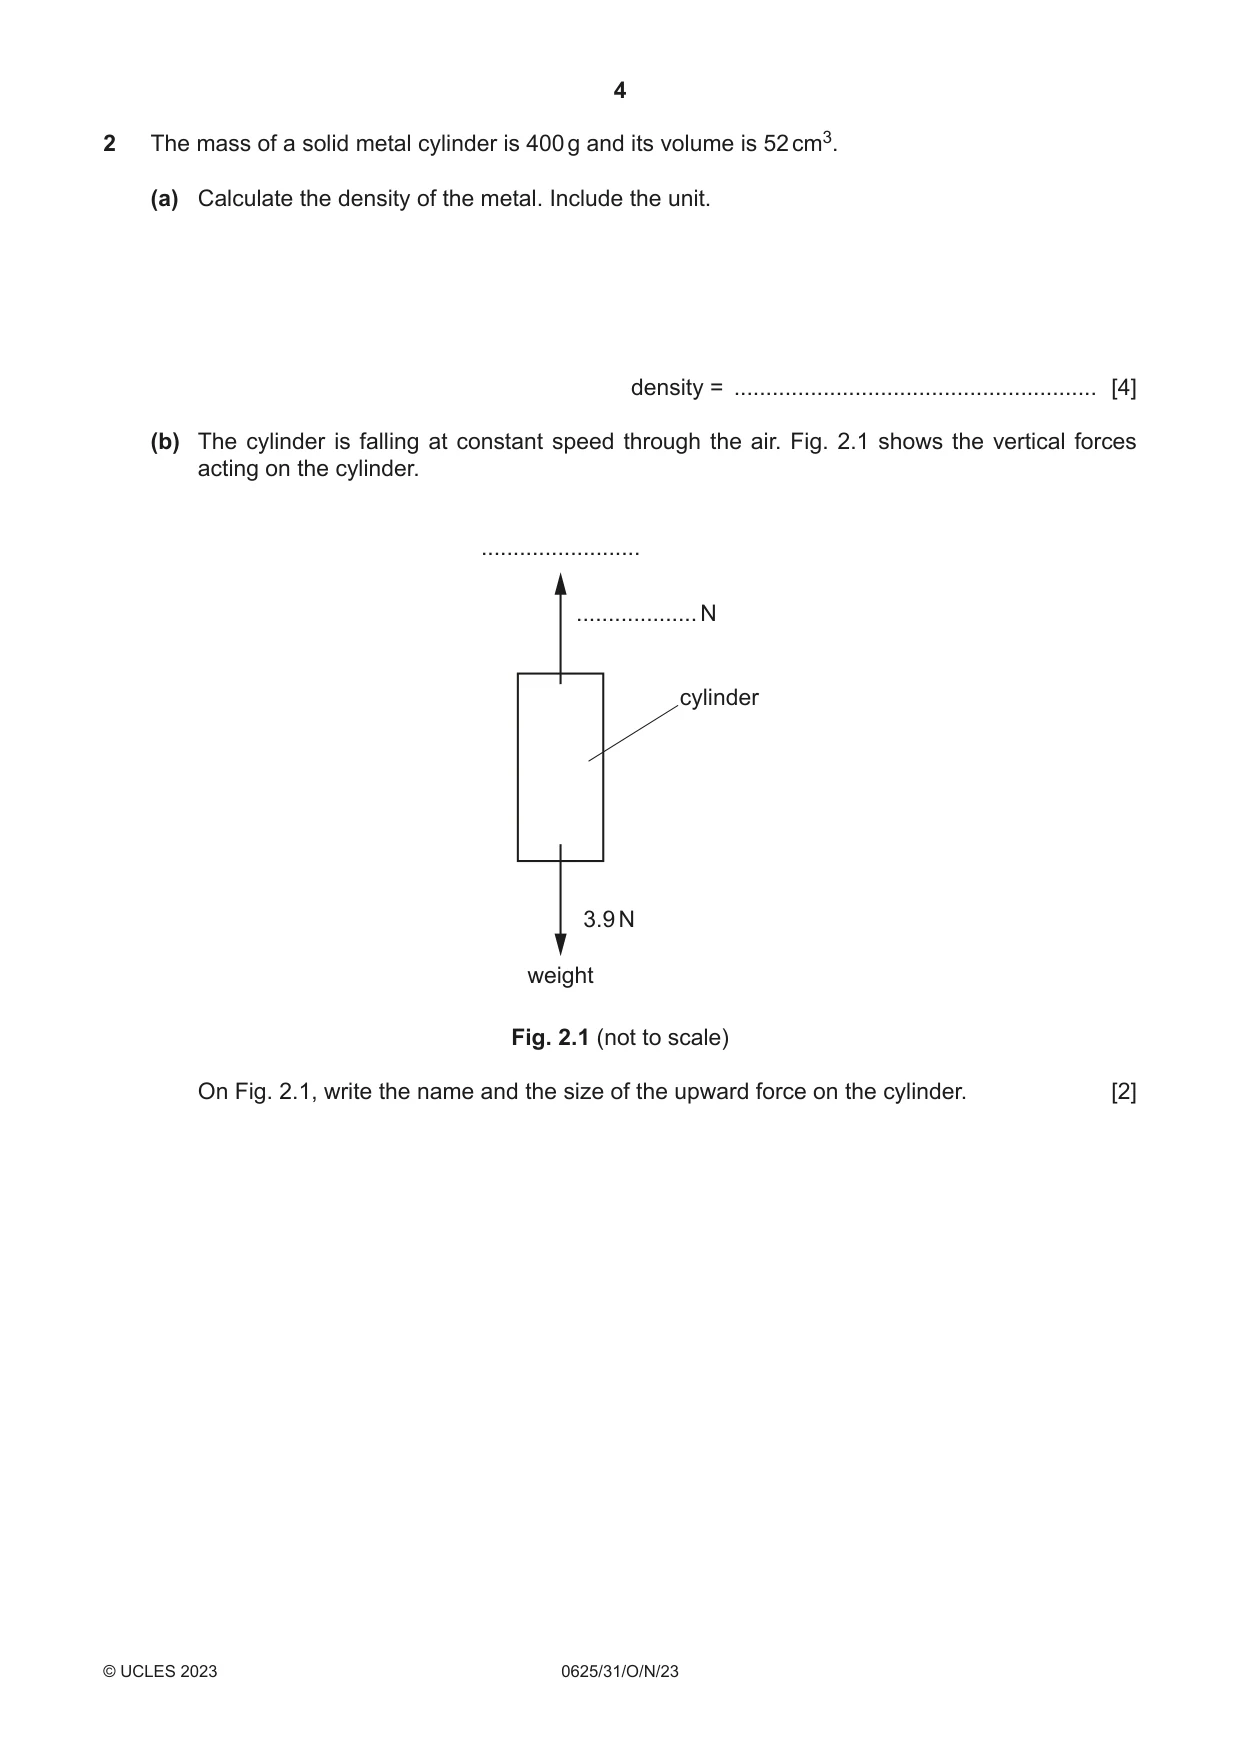
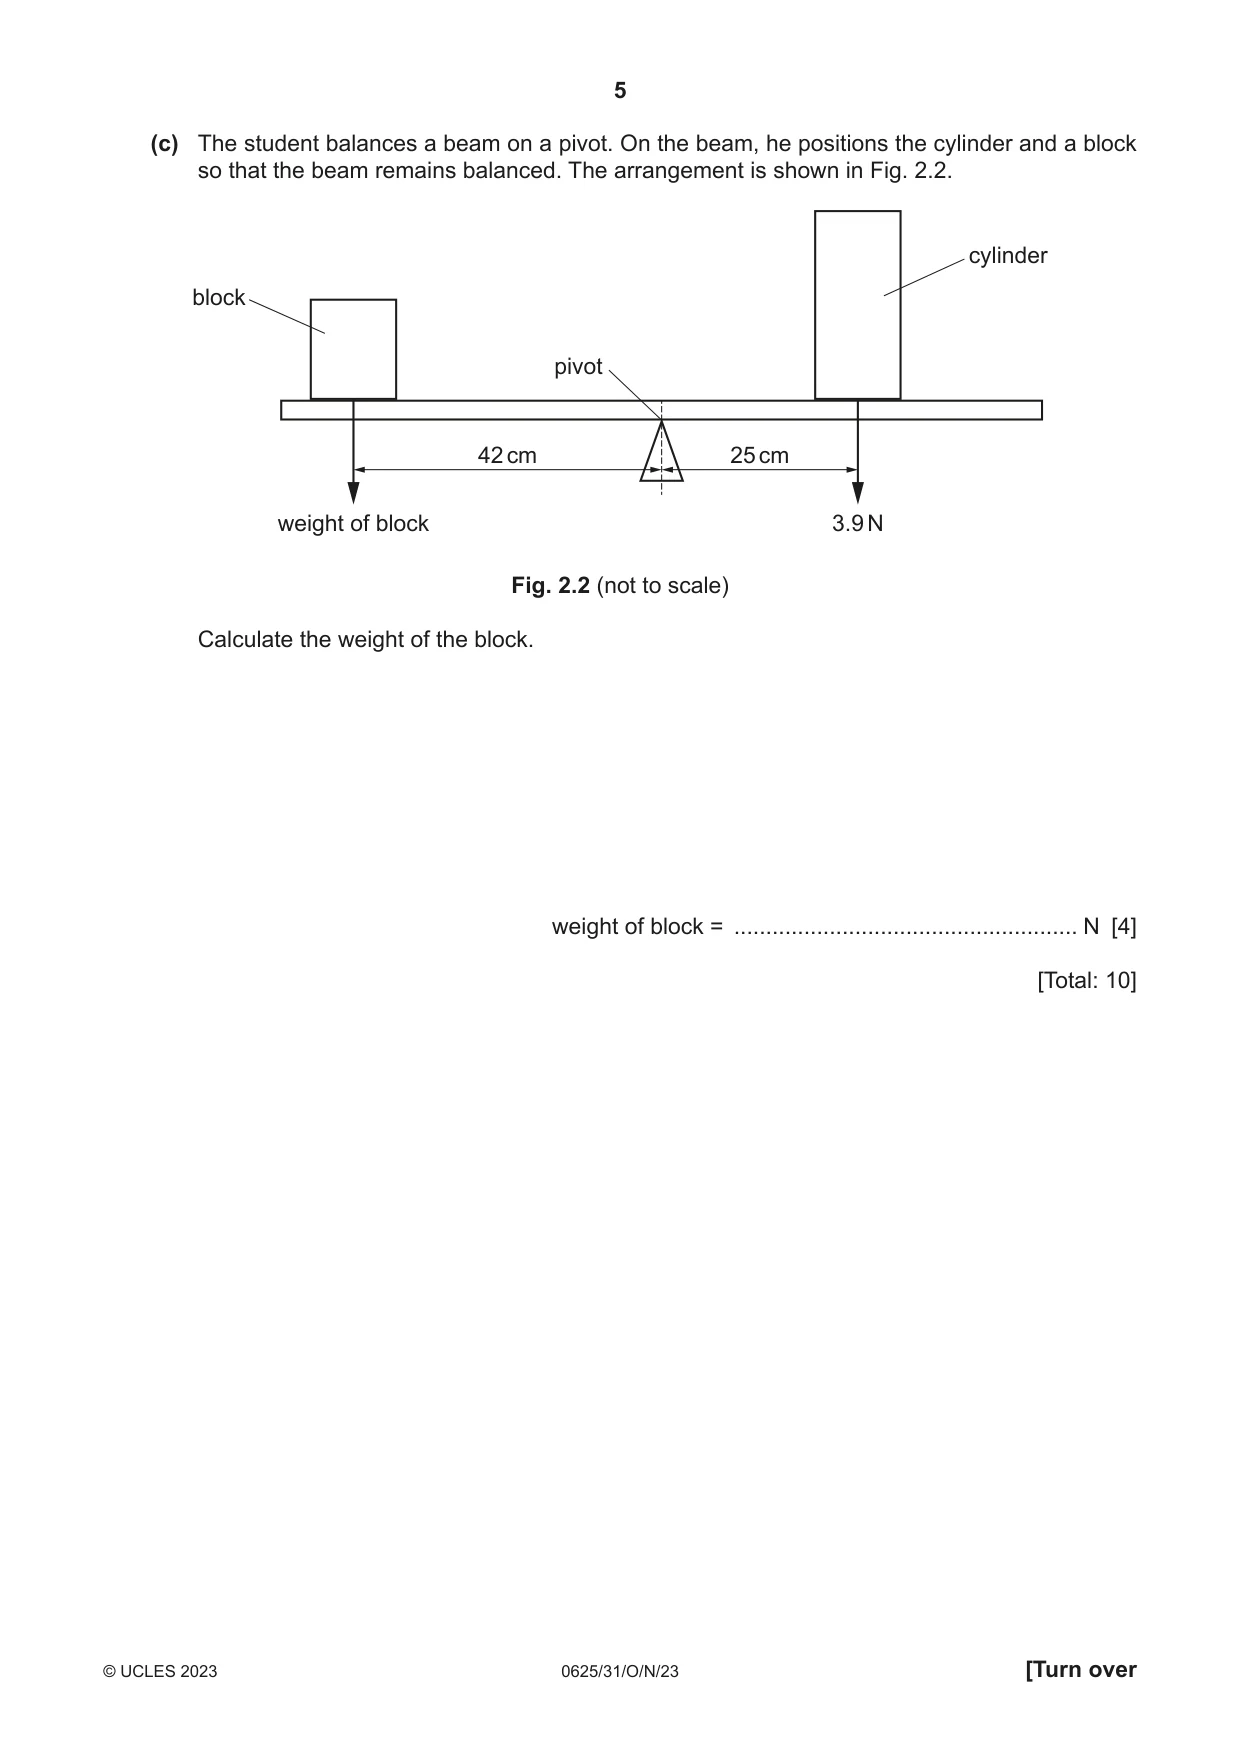
2 The mass of a solid metal cylinder is 400 g and its volume is 52 cm3. (a) Calculate the density of the metal. Include the unit. density = ......................................................... [4] (b) The cylinder is falling at constant speed through the air. Fig. 2.1 shows the vertical forces acting on the cylinder. ......................... ................... N cylinder 3.9 N weight Fig. 2.1 (not to scale) On Fig. 2.1, write the name and the size of the upward force on the cylinder. [2] (c) The student balances a beam on a pivot. On the beam, he positions the cylinder and a block so that the beam remains balanced. The arrangement is shown in Fig. 2.2. cylinder block pivot 42 cm 25 cm weight of block 3.9 N Fig. 2.2 (not to scale) Calculate the weight of the block. weight of block = ...................................................... N [4] [Total: 10]
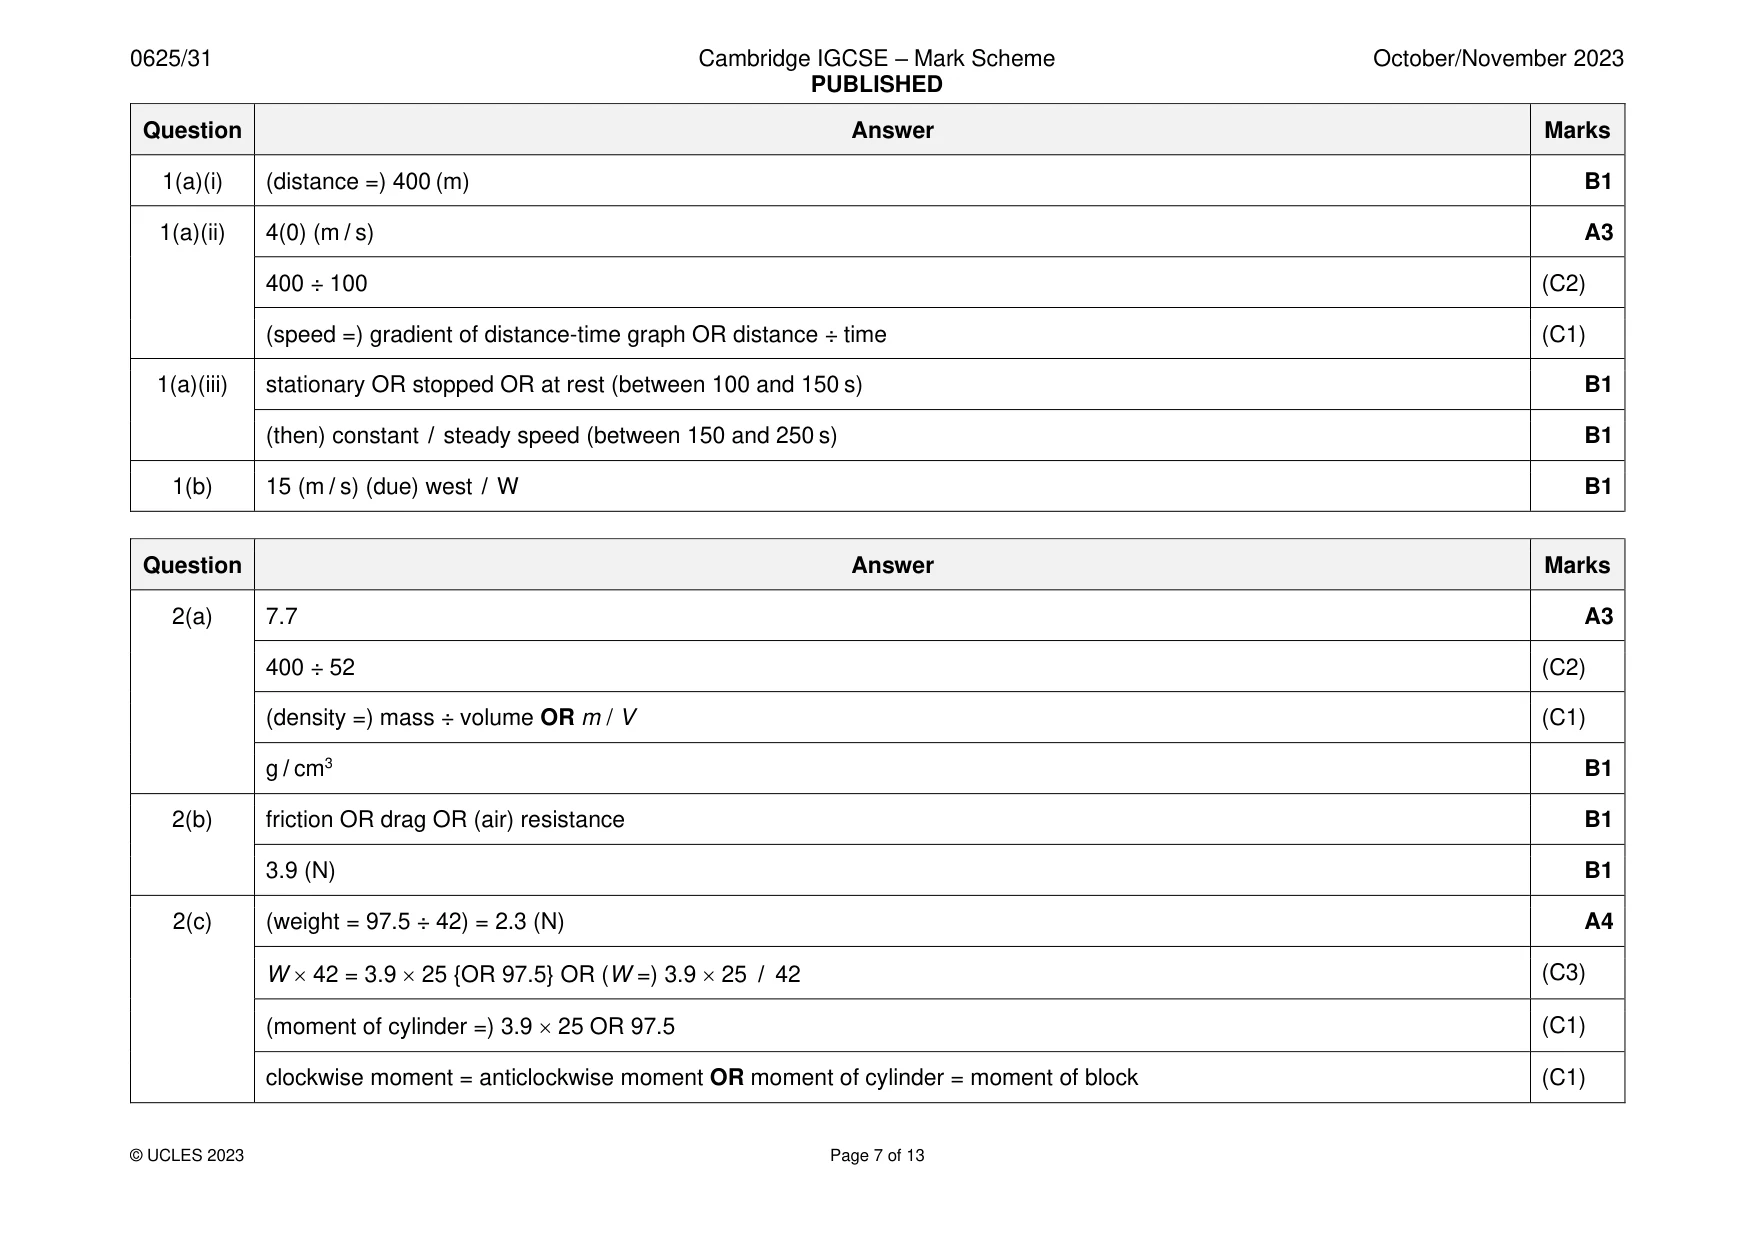
Mark scheme: 2(a) 7.7 A3 400 ÷ 52 (C2) (density =) mass ÷ volume OR m / V (C1) g / cm3 B1 2(b) friction OR drag OR (air) resistance B1 3.9 (N) B1 2(c) (weight = 97.5 ÷ 42) = 2.3 (N) A4 W 42 = 3.9 25 {OR 97.5} OR (W =) 3.9 25 / 42 (C3) (moment of cylinder =) 3.9 25 OR 97.5 (C1) clockwise moment = anticlockwise moment OR moment of cylinder = moment of block (C1)
Q3 · The arrangement and separation of particles in a liquid
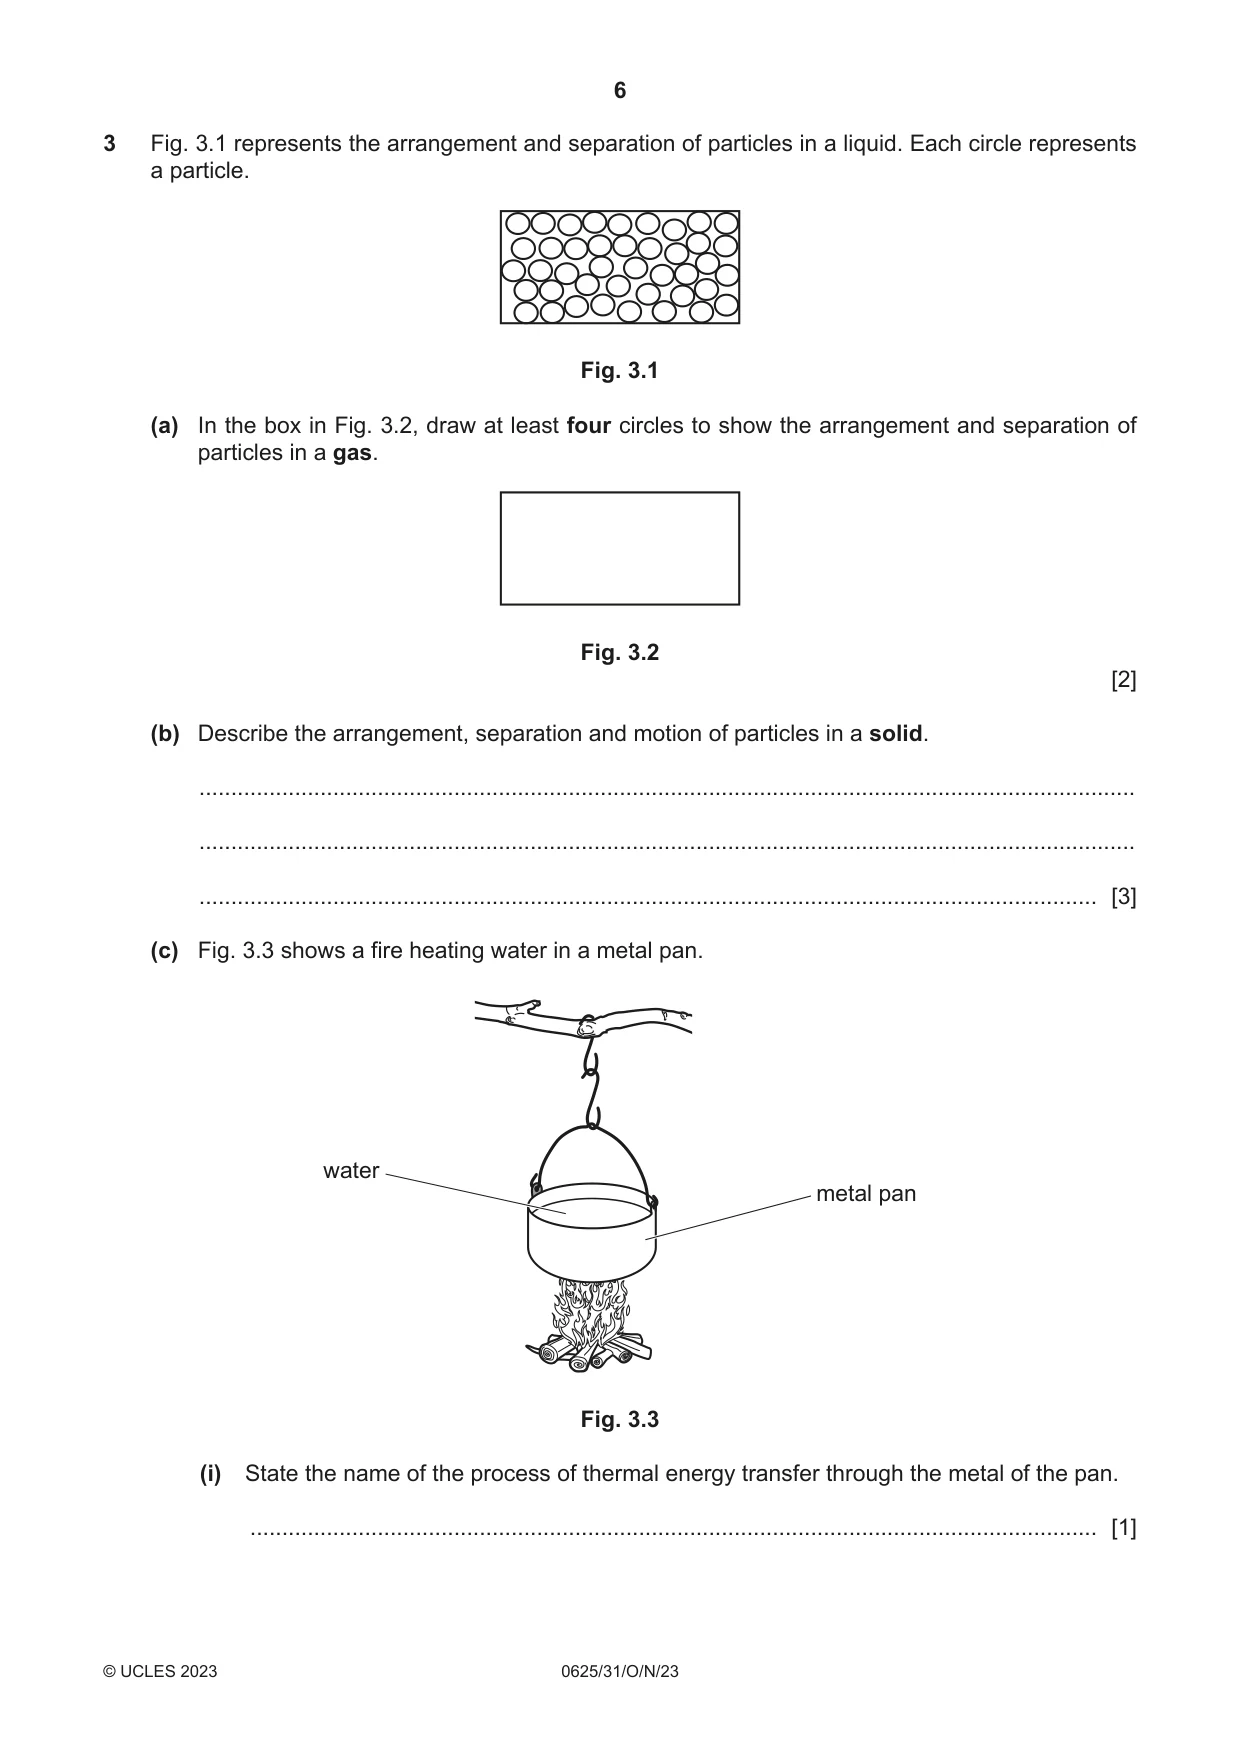
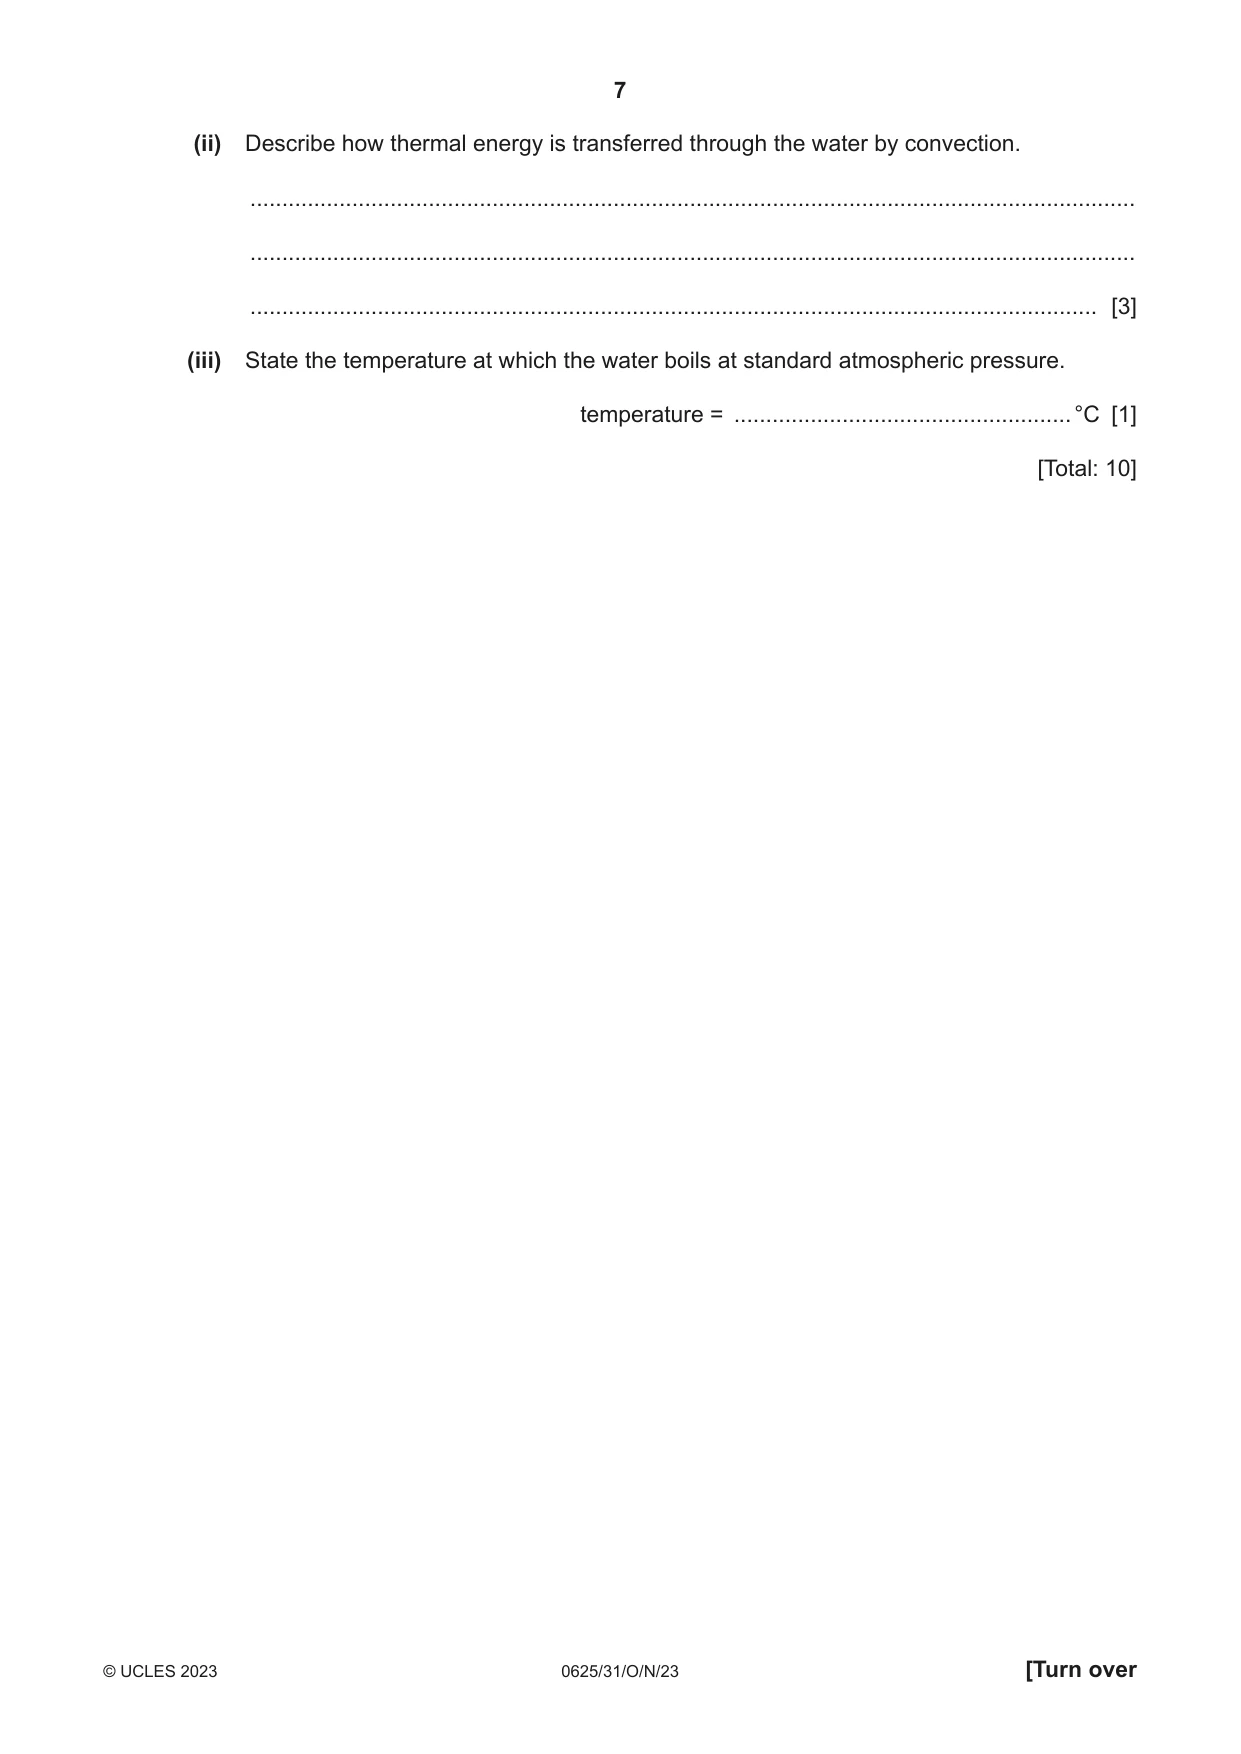
3 Fig. 3.1 represents the arrangement and separation of particles in a liquid. Each circle represents a particle. Fig. 3.1 (a) In the box in Fig. 3.2, draw at least four circles to show the arrangement and separation of particles in a gas. Fig. 3.2 [2] (b) Describe the arrangement, separation and motion of particles in a solid. ................................................................................................................................................... ................................................................................................................................................... ............................................................................................................................................. [3] (c) Fig. 3.3 shows a fire heating water in a metal pan. water metal pan Fig. 3.3 (i) State the name of the process of thermal energy transfer through the metal of the pan. ..................................................................................................................................... [1] (ii) Describe how thermal energy is transferred through the water by convection. ........................................................................................................................................... ........................................................................................................................................... ..................................................................................................................................... [3] (iii) State the temperature at which the water boils at standard atmospheric pressure. temperature = ..................................................... °C [1] [Total: 10]
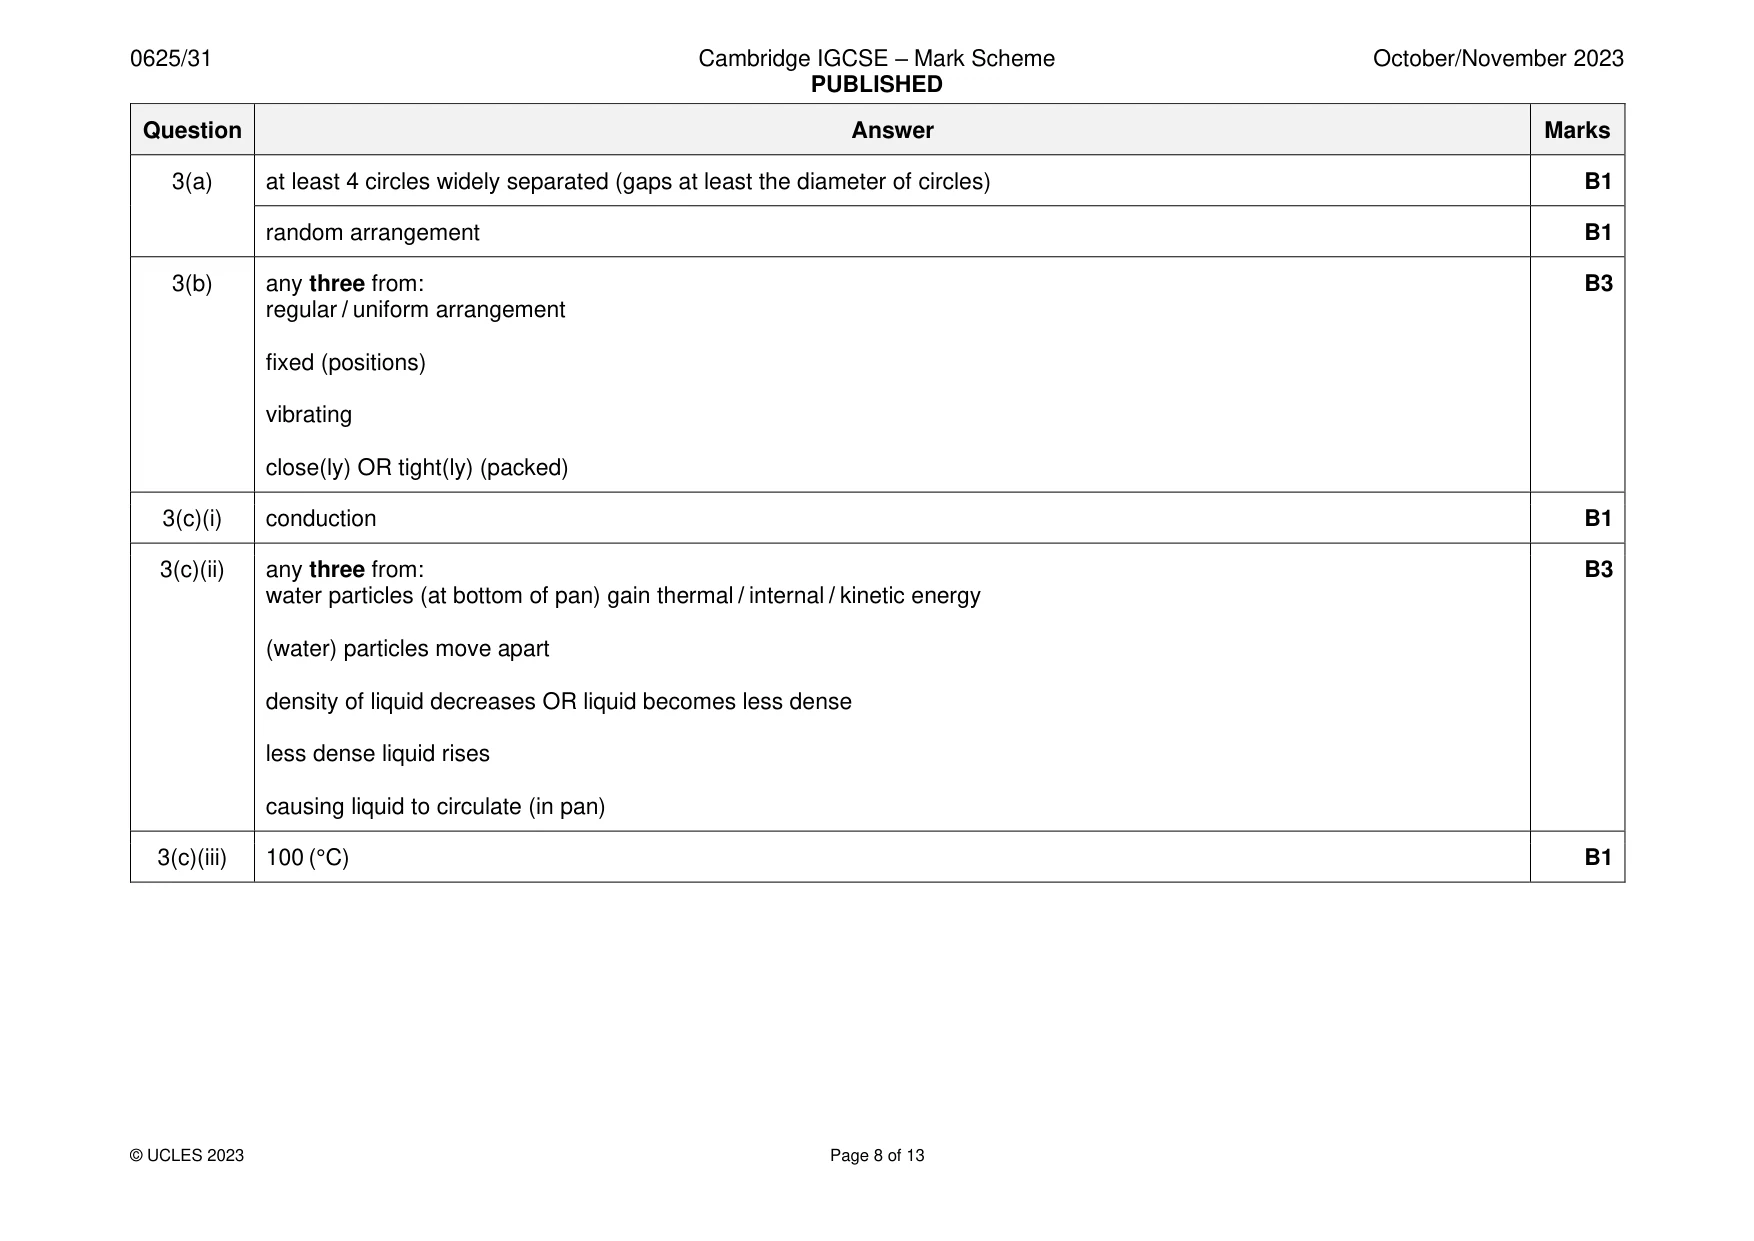
Mark scheme: 3(a) at least 4 circles widely separated (gaps at least the diameter of circles) B1 random arrangement B1 3(b) any three from: B3 regular / uniform arrangement fixed (positions) vibrating close(ly) OR tight(ly) (packed) 3(c)(i) conduction B1 3(c)(ii) any three from: B3 water particles (at bottom of pan) gain thermal / internal / kinetic energy (water) particles move apart density of liquid decreases OR liquid becomes less dense less dense liquid rises causing liquid to circulate (in pan) 3(c)(iii) 100 (°C) B1
Q4 · A wave on the surface of water
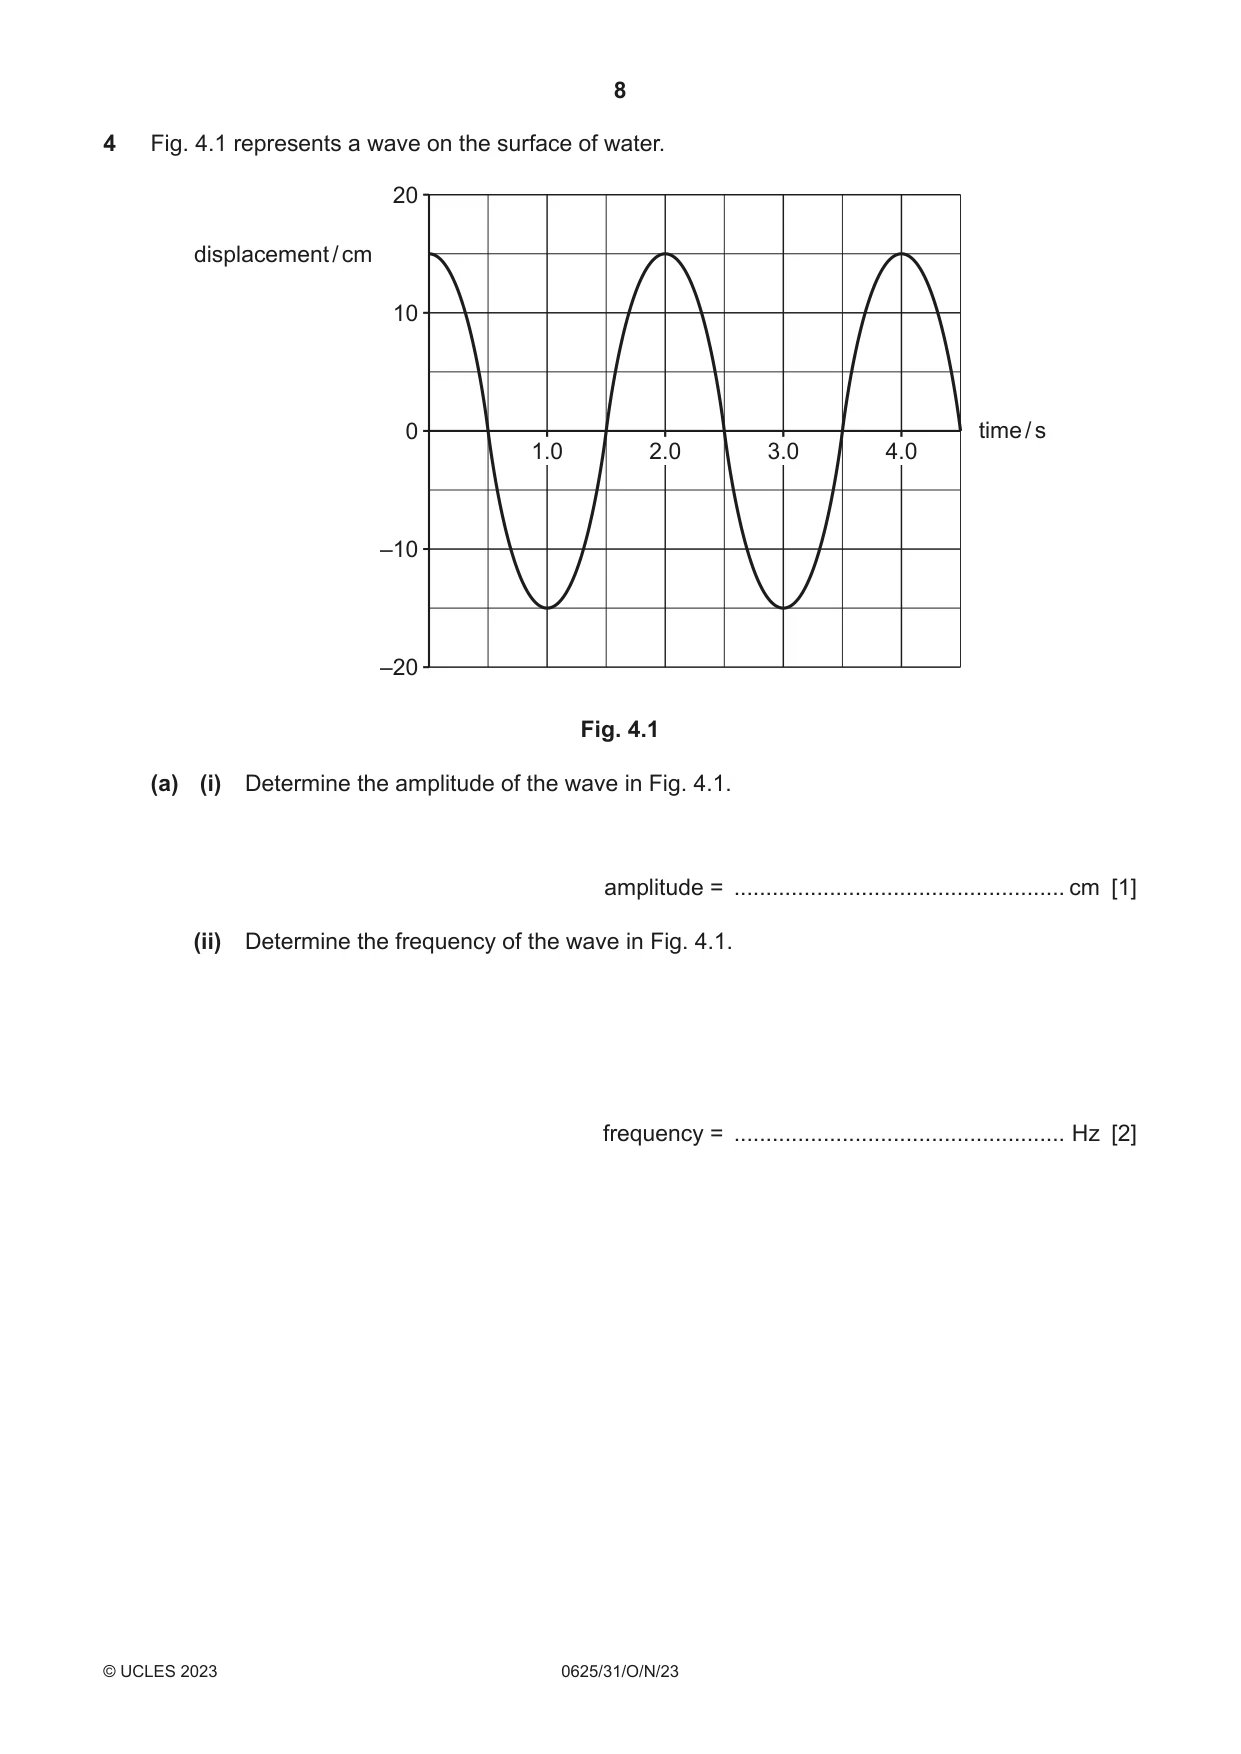
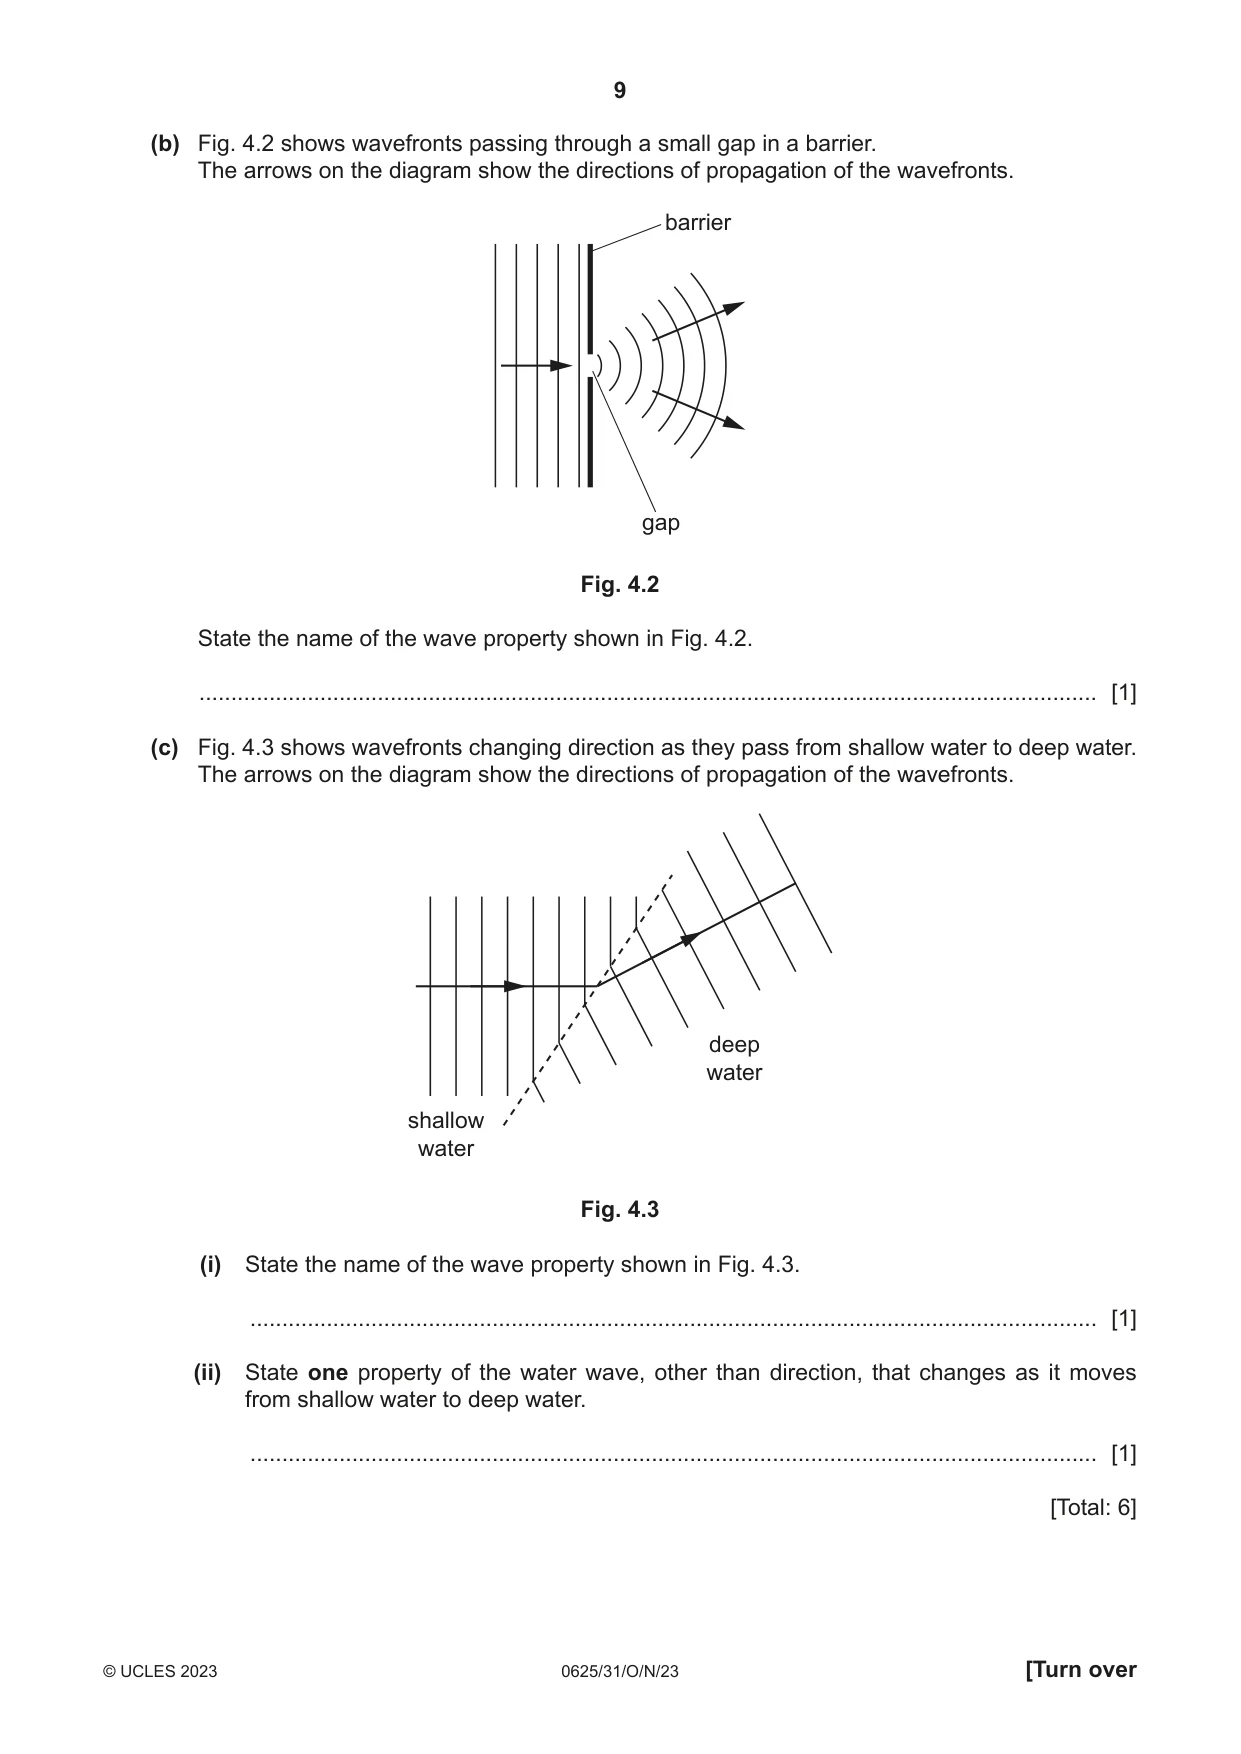
4 Fig. 4.1 represents a wave on the surface of water. 20 displacement / cm 10 0 time / s 1.0 2.0 3.0 4.0 –10 –20 Fig. 4.1 (a) (i) Determine the amplitude of the wave in Fig. 4.1. amplitude = .................................................... cm [1] (ii) Determine the frequency of the wave in Fig. 4.1. frequency = .................................................... Hz [2] (b) Fig. 4.2 shows wavefronts passing through a small gap in a barrier. The arrows on the diagram show the directions of propagation of the wavefronts. barrier gap Fig. 4.2 State the name of the wave property shown in Fig. 4.2. ............................................................................................................................................. [1] (c) Fig. 4.3 shows wavefronts changing direction as they pass from shallow water to deep water. The arrows on the diagram show the directions of propagation of the wavefronts. deep water shallow water Fig. 4.3 (i) State the name of the wave property shown in Fig. 4.3. ..................................................................................................................................... [1] (ii) State one property of the water wave, other than direction, that changes as it moves from shallow water to deep water. ..................................................................................................................................... [1] [Total: 6]
Mark scheme: 4(a)(i) (amplitude =) 15 (cm) B1 4(a)(ii) (frequency =) 0.5 (Hz) A2 (frequency =) number of waves sent out / emitted in one second (C1) OR 1 wave in 2.0 (s) OR frequency = 1 ÷ 2(0) 4(b) diffraction B1 4(c)(i) refraction B1 4(c)(ii) (change of) wavelength OR (wave) speed OR velocity B1
Q5 · The main regions of the electromagnetic spectrum in order of increasing frequency
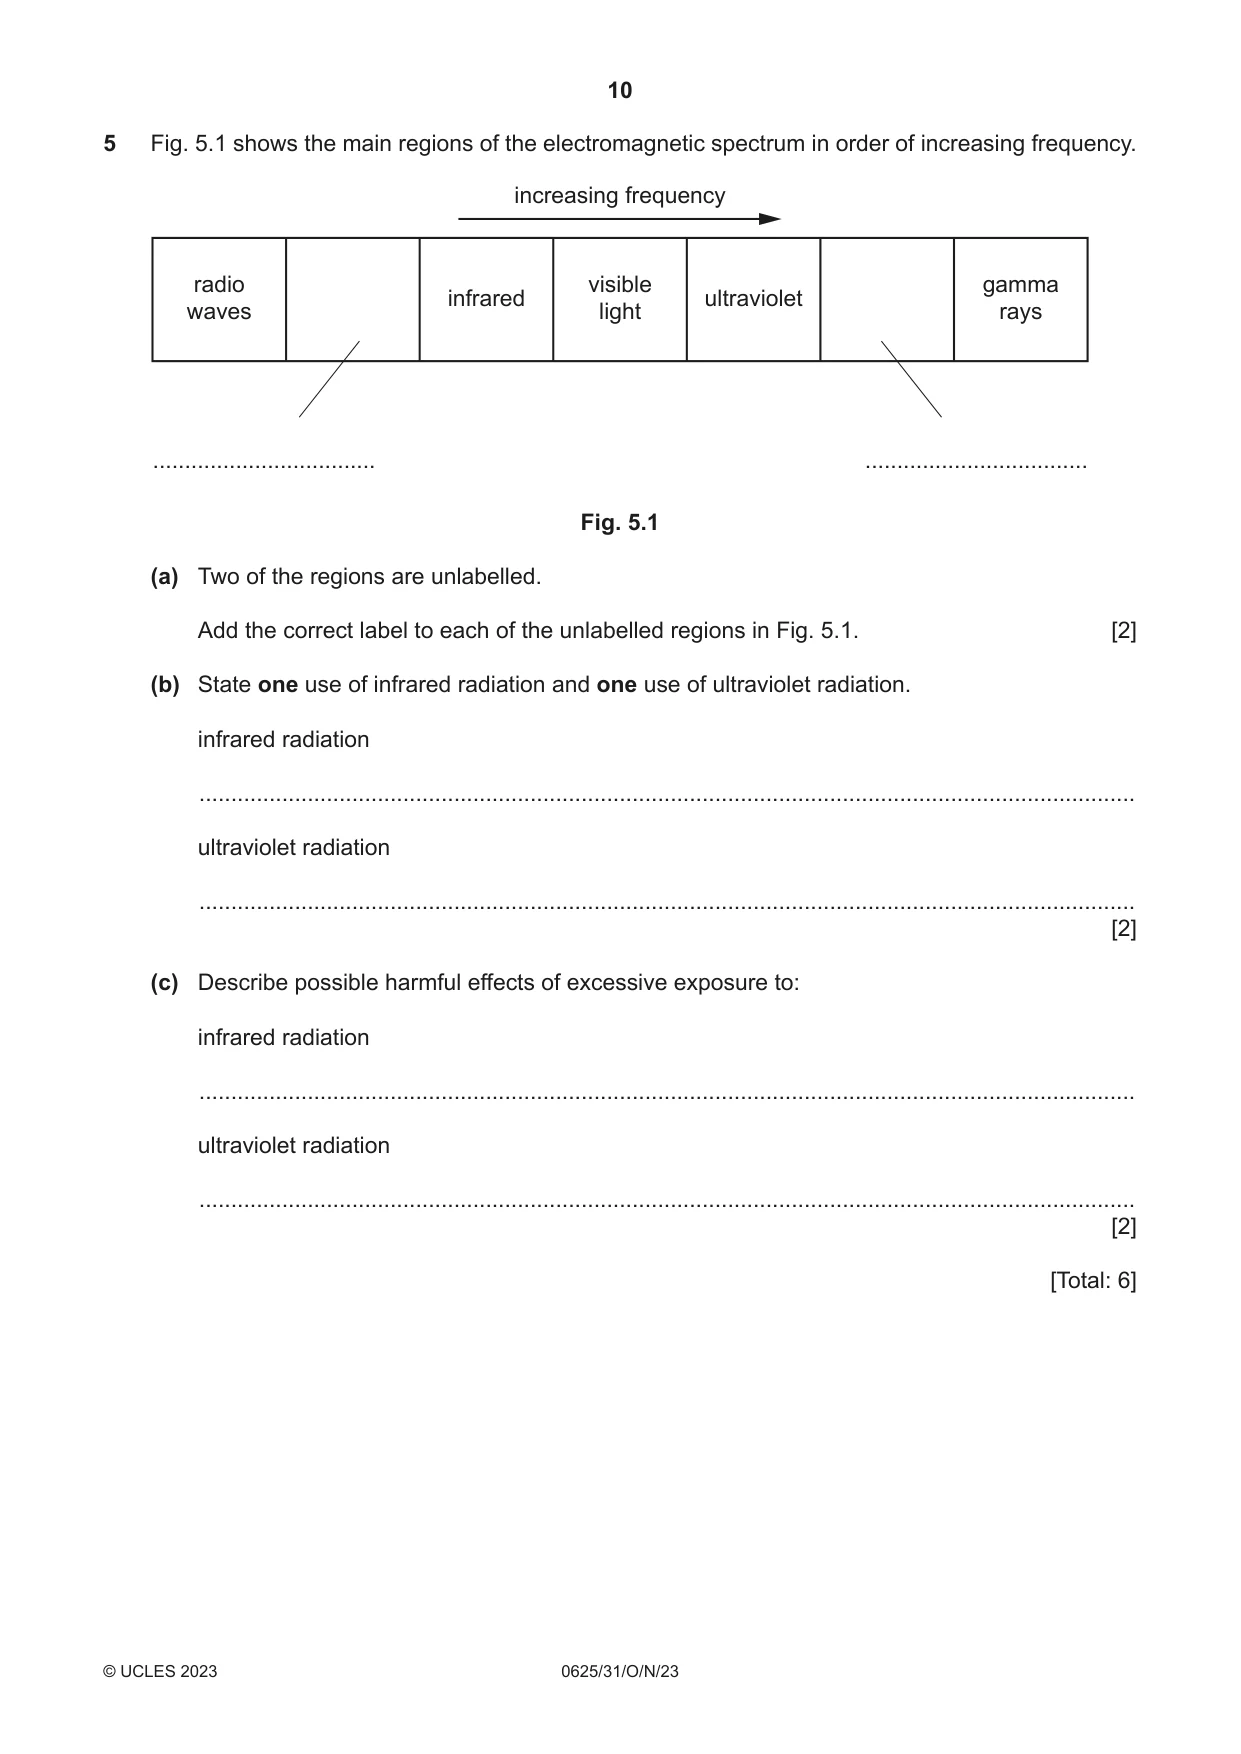
5 Fig. 5.1 shows the main regions of the electromagnetic spectrum in order of increasing frequency. increasing frequency radio visible gamma infrared ultraviolet waves light rays ................................... ................................... Fig. 5.1 (a) Two of the regions are unlabelled. Add the correct label to each of the unlabelled regions in Fig. 5.1. [2] (b) State one use of infrared radiation and one use of ultraviolet radiation. infrared radiation ................................................................................................................................................... ultraviolet radiation ................................................................................................................................................... [2] (c) Describe possible harmful effects of excessive exposure to: infrared radiation ................................................................................................................................................... ultraviolet radiation ................................................................................................................................................... [2] [Total: 6]
Mark scheme: 5(a) microwaves (after radio waves) B1 X-rays (after ultraviolet) B1 5(b) (use of infrared) any one from: electric grills, short range communications such as remote controllers for televisions, B1 intruder alarms, thermal imaging, optical fibres, (heating) solar panels (use of ultraviolet) any one from: security marking, detecting fake bank notes, sterilising water / food B1 5(c) (infrared can cause) (skin) burns B1 (ultraviolet can cause) damage to (surface / skin) cells / eyes OR skin cancer OR can cause eye conditions e.g. cataracts B1
Question 6
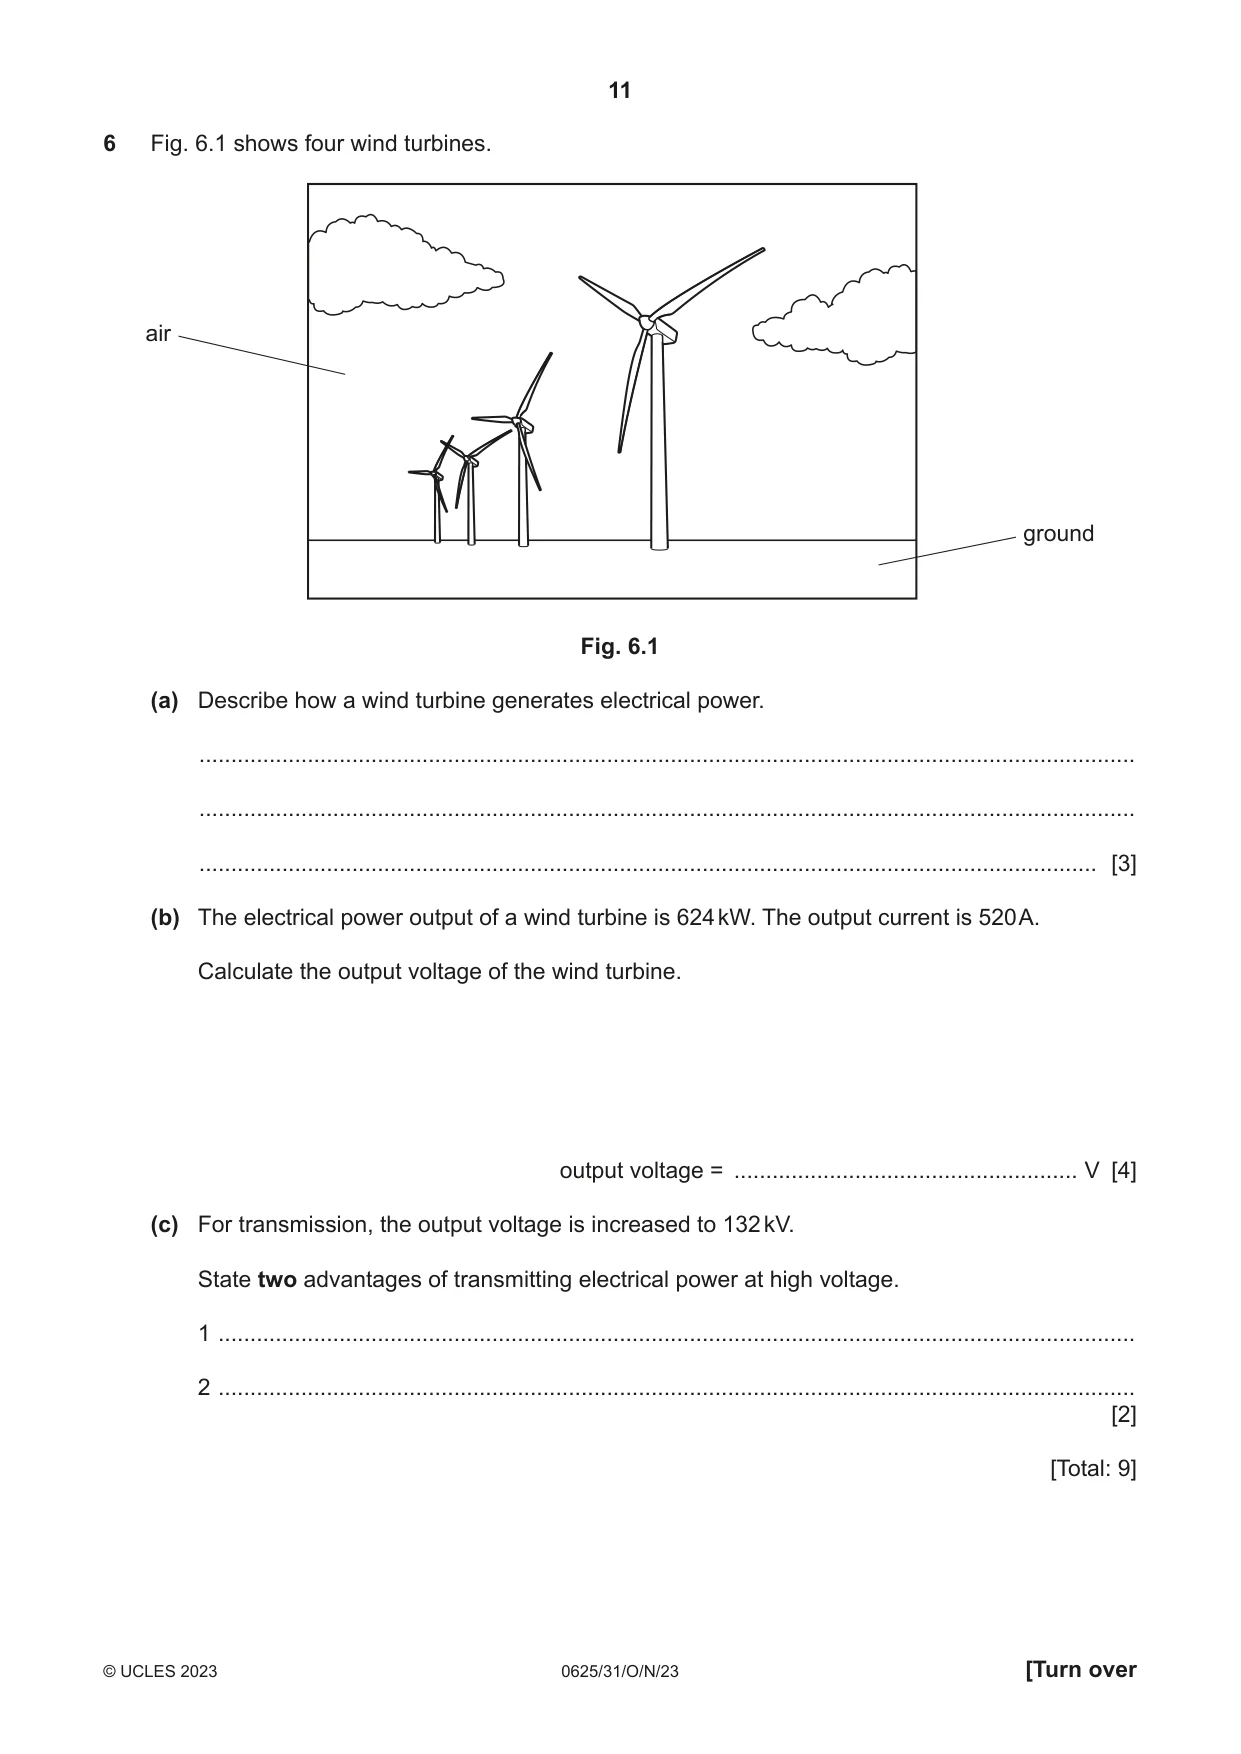
6 Fig. 6.1 shows four wind turbines. air ground Fig. 6.1 (a) Describe how a wind turbine generates electrical power. ................................................................................................................................................... ................................................................................................................................................... ............................................................................................................................................. [3] (b) The electrical power output of a wind turbine is 624 kW. The output current is 520 A. Calculate the output voltage of the wind turbine. output voltage = ...................................................... V [4] (c) For transmission, the output voltage is increased to 132 kV. State two advantages of transmitting electrical power at high voltage. 1 ................................................................................................................................................ 2 ................................................................................................................................................ [2] [Total: 9]
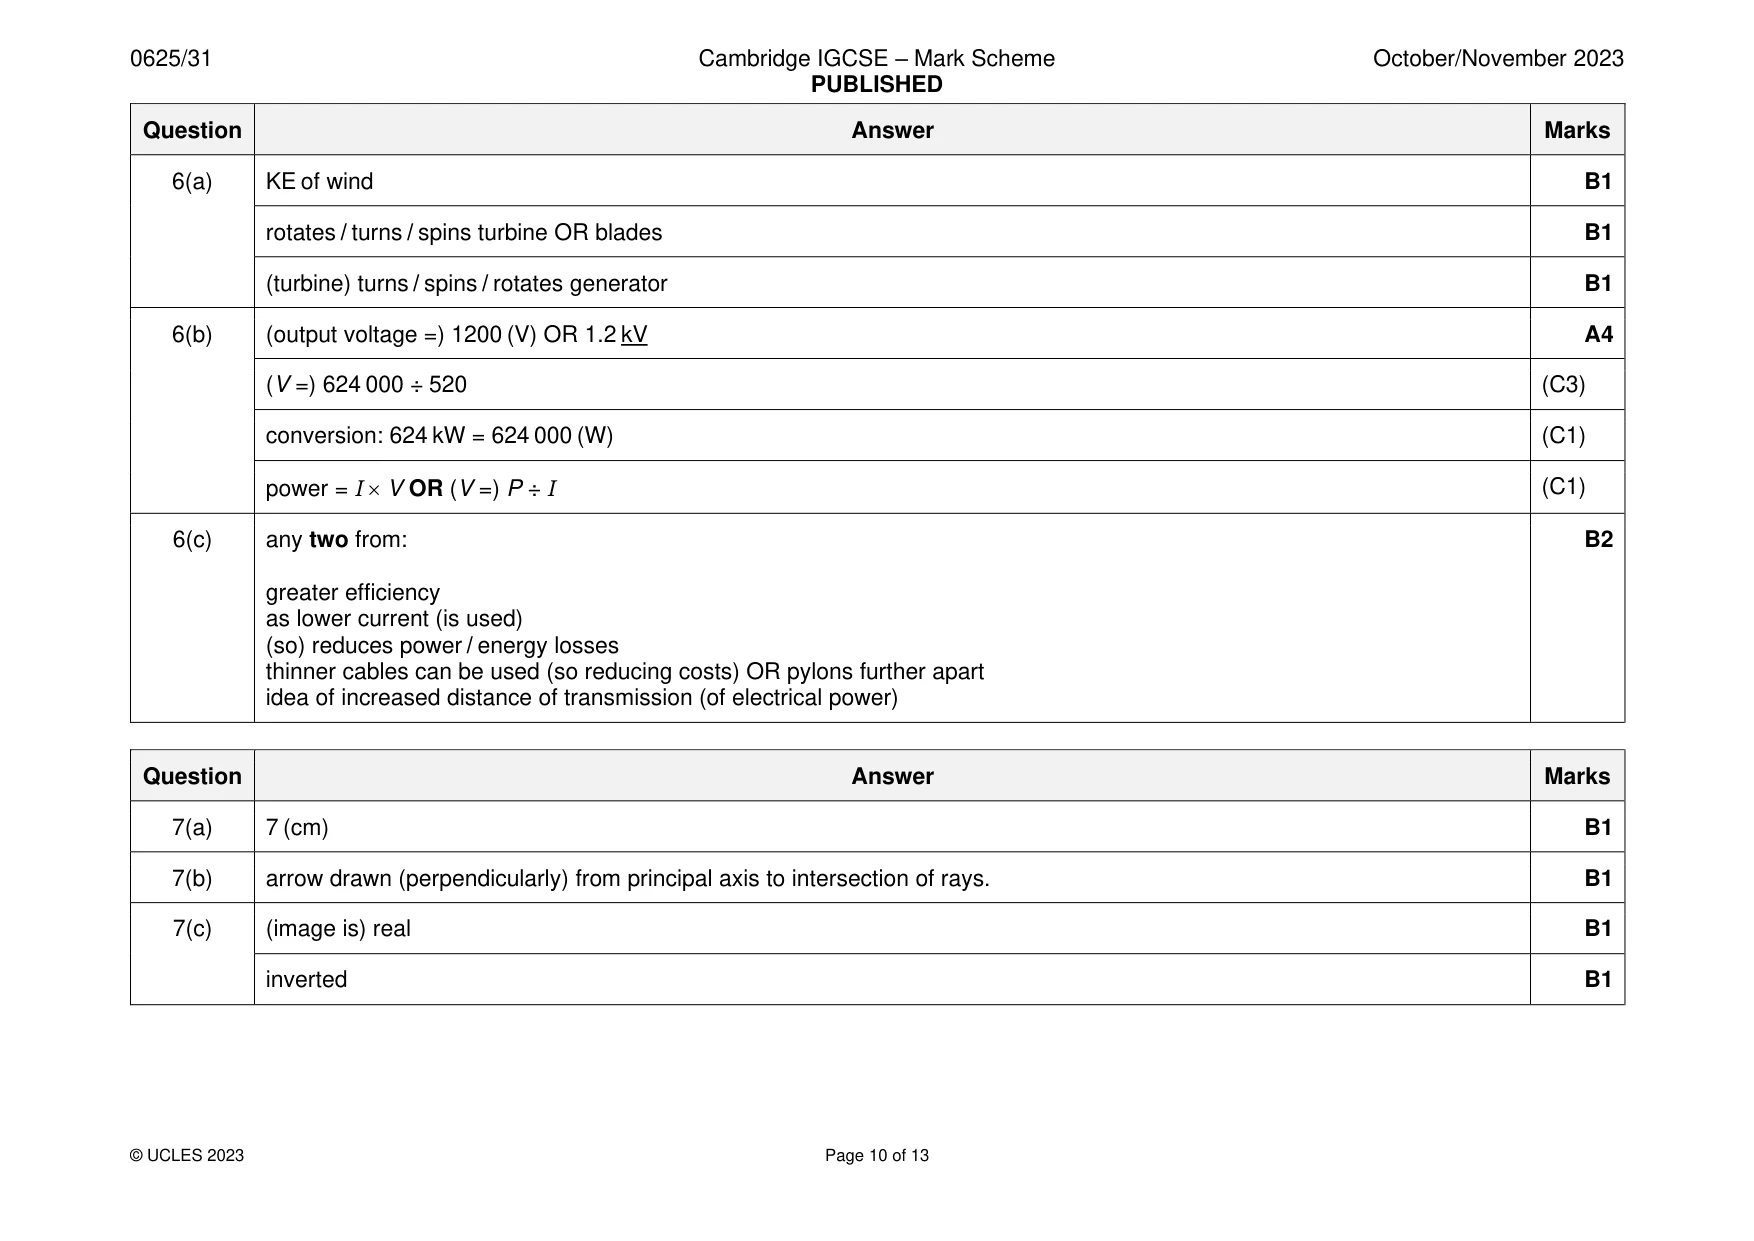
Mark scheme: 6(a) KE of wind B1 rotates / turns / spins turbine OR blades B1 (turbine) turns / spins / rotates generator B1 6(b) (output voltage =) 1200 (V) OR 1.2 kV A4 (V =) 624 000 ÷ 520 (C3) conversion: 624 kW = 624 000 (W) (C1) power = I V OR (V =) P ÷ I (C1) 6(c) any two from: B2 greater efficiency as lower current (is used) (so) reduces power / energy losses thinner cables can be used (so reducing costs) OR pylons further apart idea of increased distance of transmission (of electrical power)
Q7 · A ray diagram for an object positioned on the principal axis of a thin converging lens
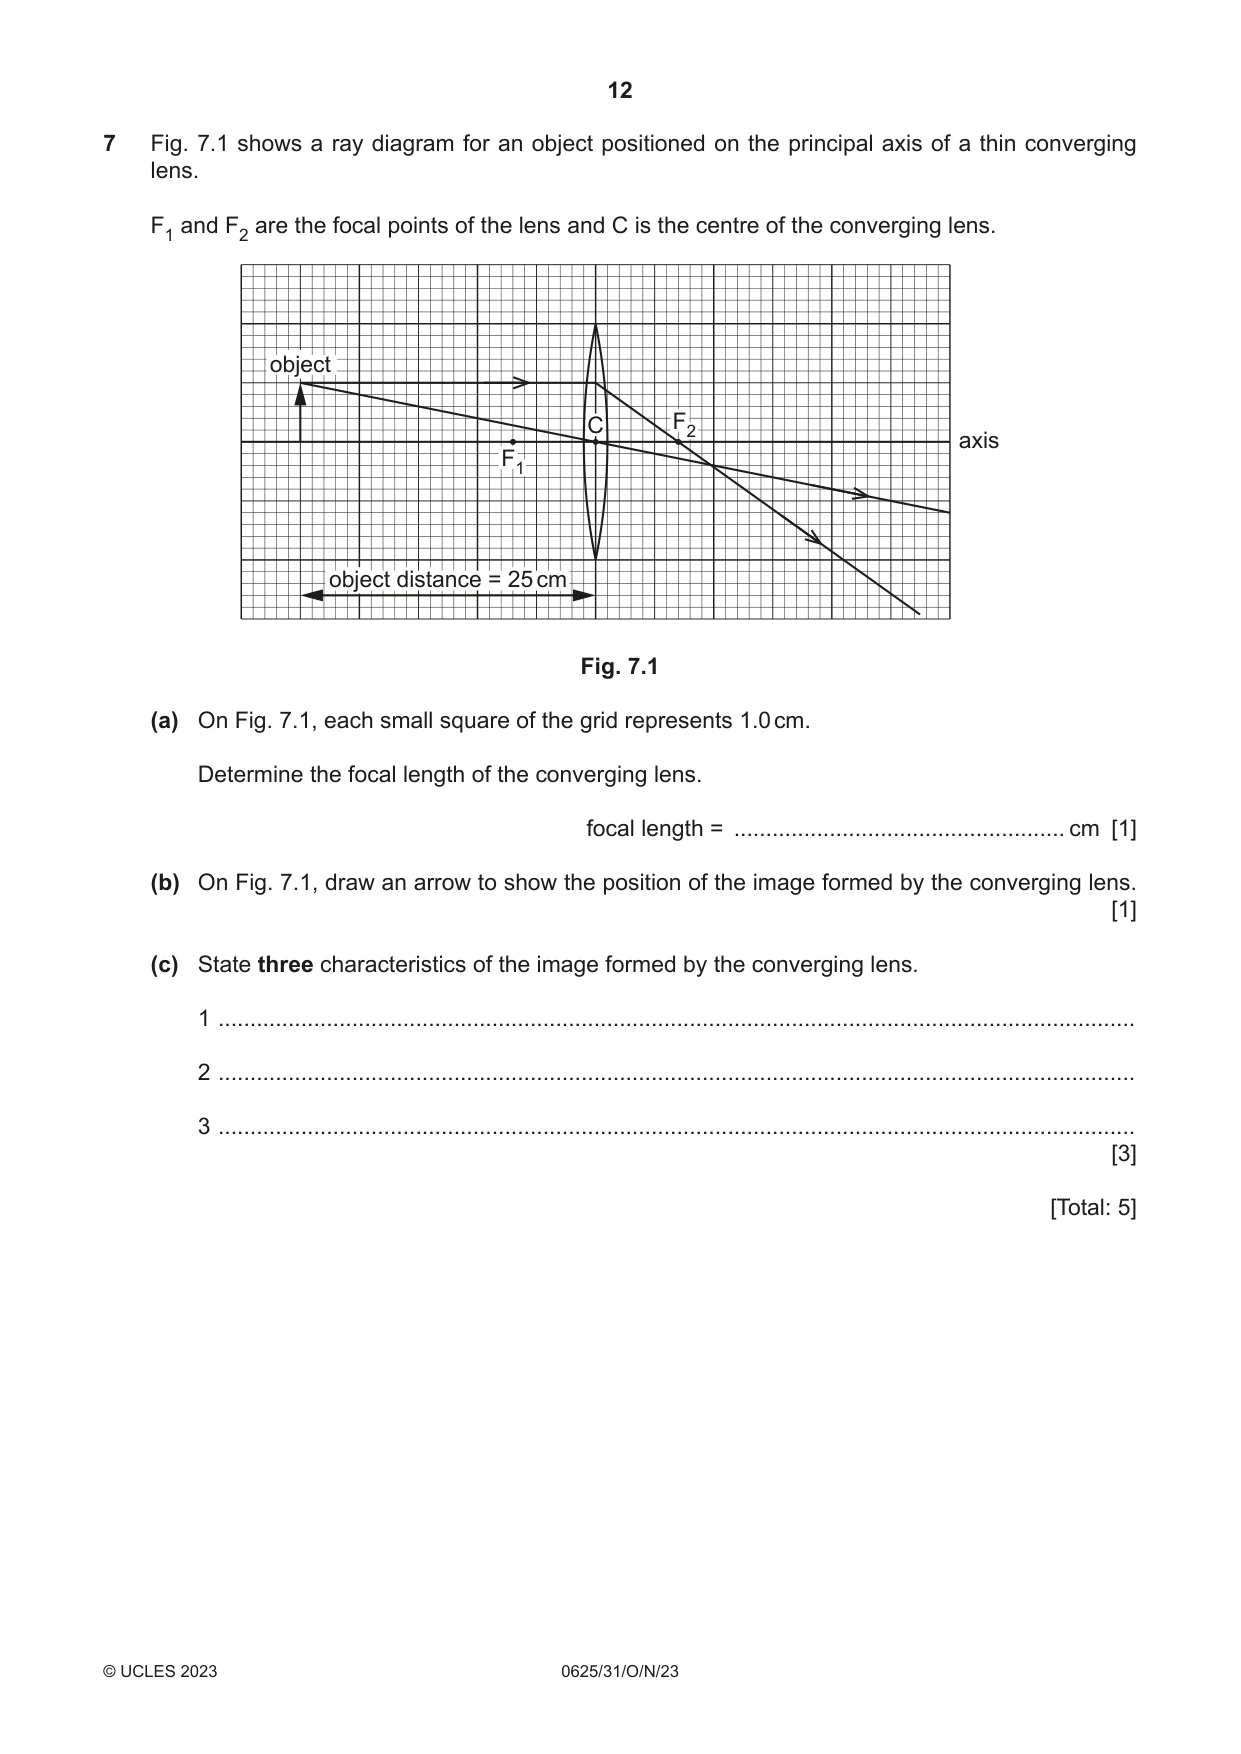
7 Fig. 7.1 shows a ray diagram for an object positioned on the principal axis of a thin converging lens. F1 and F2 are the focal points of the lens and C is the centre of the converging lens. object C F2 axis F1 object distance = 25 cm Fig. 7.1 (a) On Fig. 7.1, each small square of the grid represents 1.0 cm. Determine the focal length of the converging lens. focal length = .................................................... cm [1] (b) On Fig. 7.1, draw an arrow to show the position of the image formed by the converging lens. [1] (c) State three characteristics of the image formed by the converging lens. 1 ................................................................................................................................................ 2 ................................................................................................................................................ 3 ................................................................................................................................................ [3] [Total: 5]
Mark scheme: 7(a) 7 (cm) B1 7(b) arrow drawn (perpendicularly) from principal axis to intersection of rays. B1 7(c) (image is) real B1 inverted B1
Q8 · A solenoid (long coil of wire) connected in a circuit
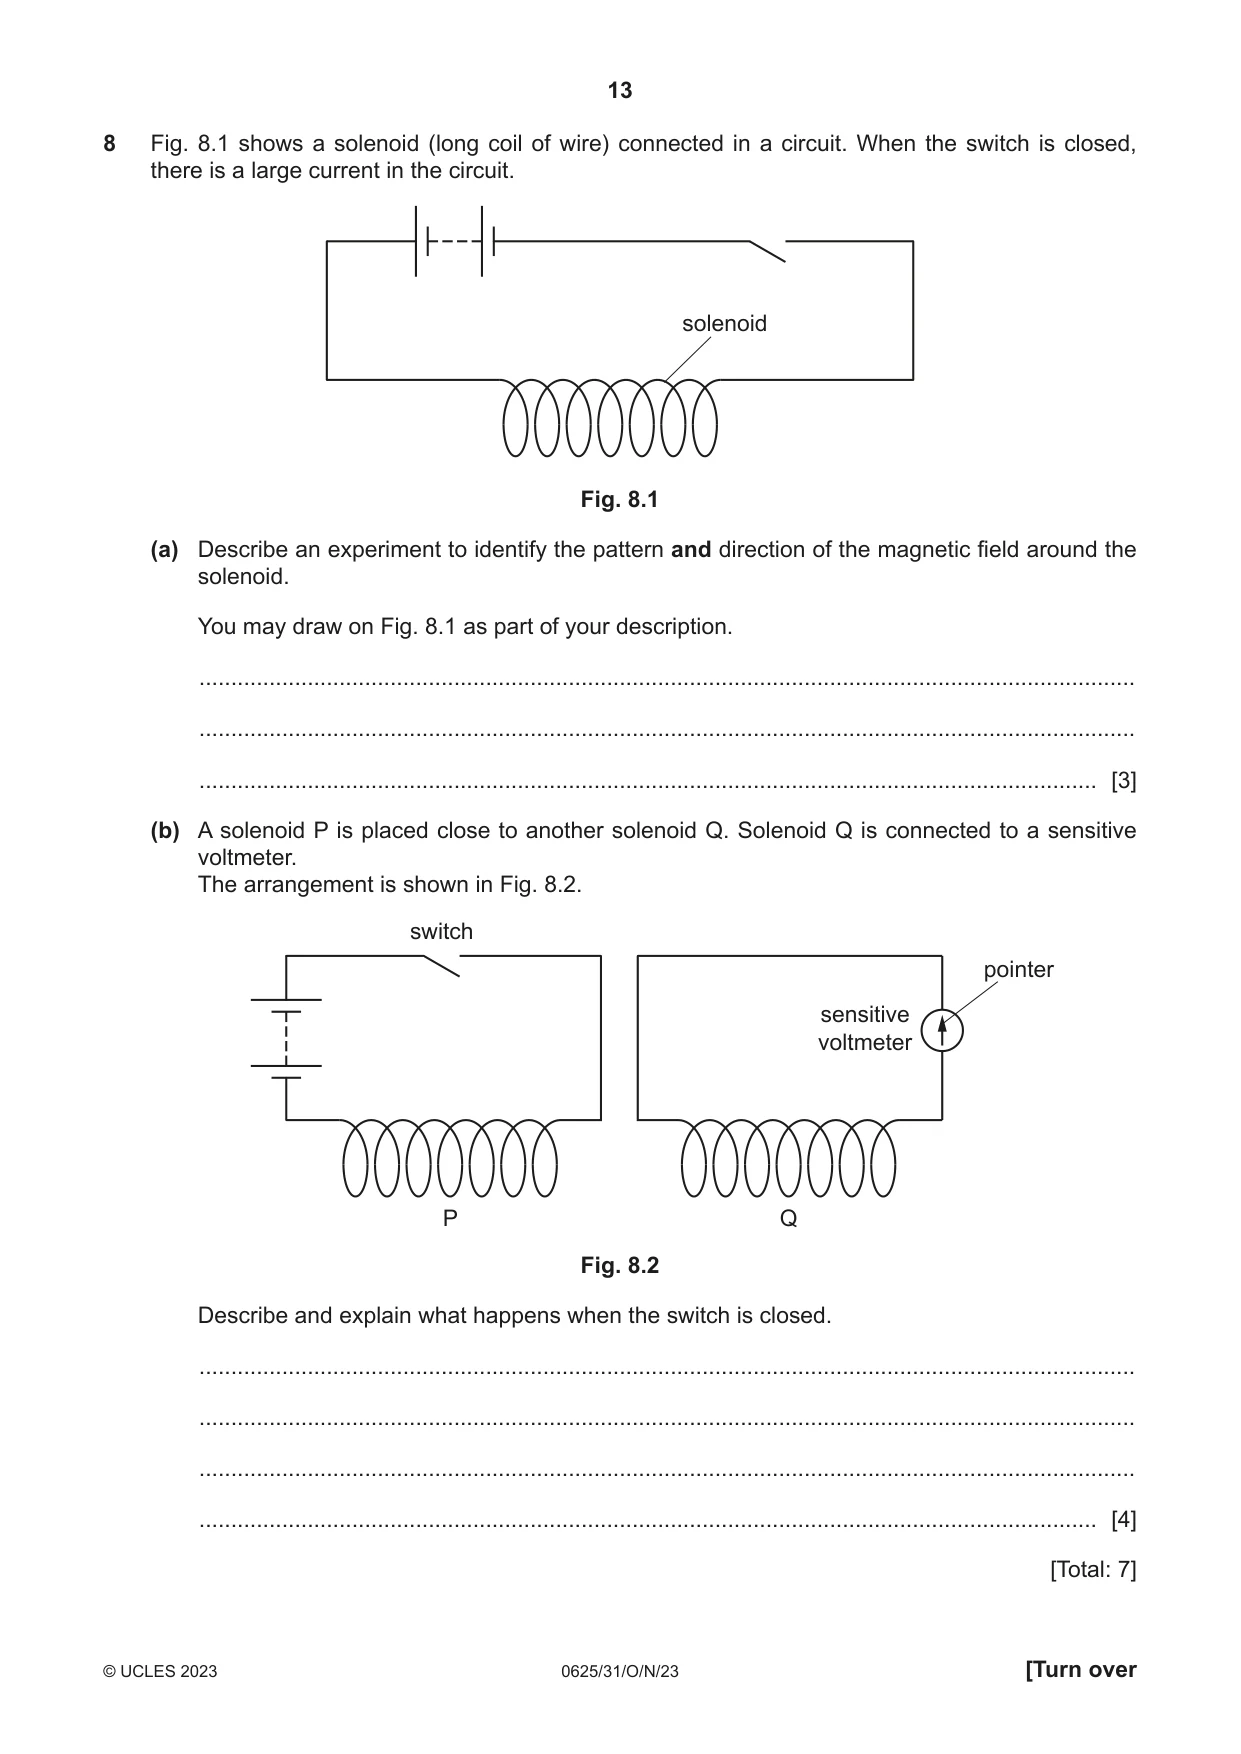
8 Fig. 8.1 shows a solenoid (long coil of wire) connected in a circuit. When the switch is closed, there is a large current in the circuit. solenoid Fig. 8.1 (a) Describe an experiment to identify the pattern and direction of the magnetic field around the solenoid. You may draw on Fig. 8.1 as part of your description. ................................................................................................................................................... ................................................................................................................................................... ............................................................................................................................................. [3] (b) A solenoid P is placed close to another solenoid Q. Solenoid Q is connected to a sensitive voltmeter. The arrangement is shown in Fig. 8.2. switch pointer sensitive voltmeter P Q Fig. 8.2 Describe and explain what happens when the switch is closed. ................................................................................................................................................... ................................................................................................................................................... ................................................................................................................................................... ............................................................................................................................................. [4] [Total: 7]
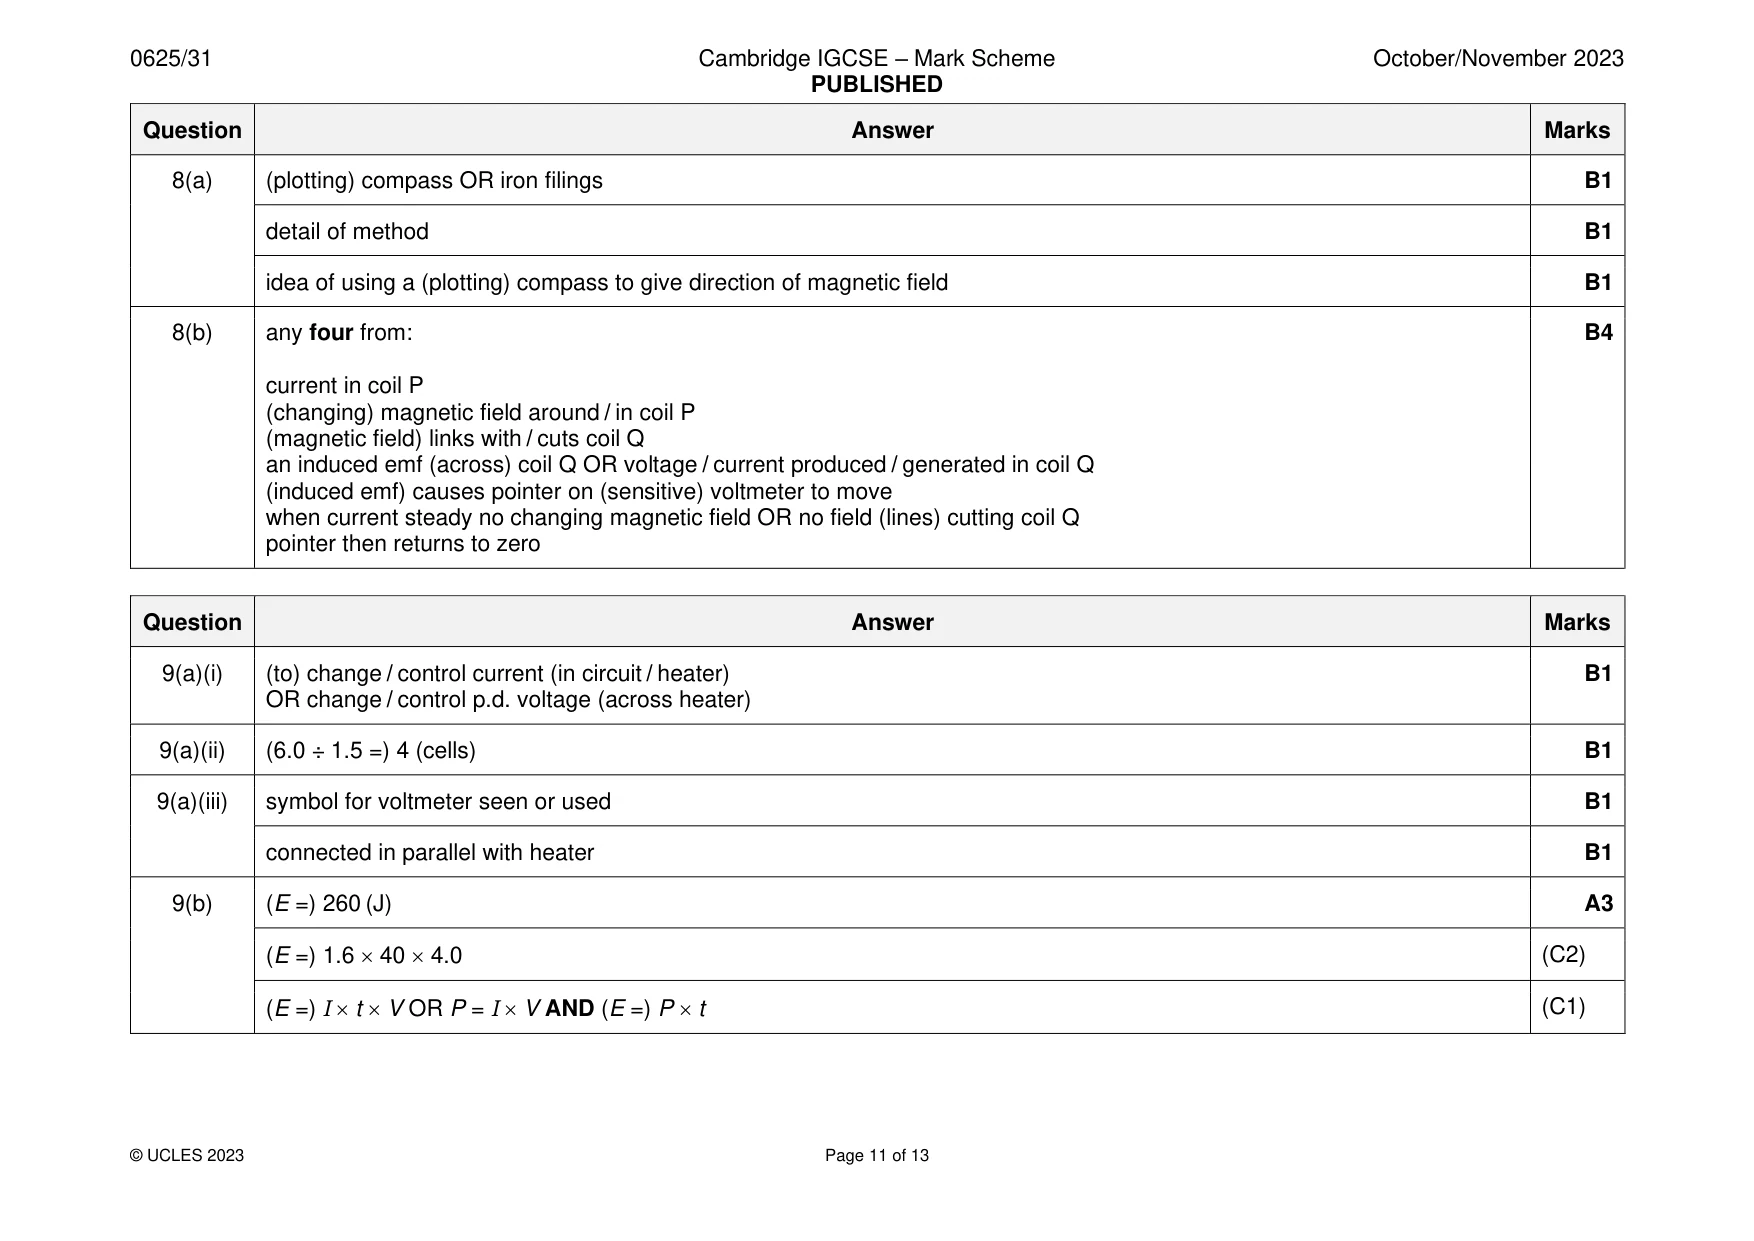
Mark scheme: 8(a) (plotting) compass OR iron filings B1 detail of method B1 idea of using a (plotting) compass to give direction of magnetic field B1 8(b) any four from: B4 current in coil P (changing) magnetic field around / in coil P (magnetic field) links with / cuts coil Q an induced emf (across) coil Q OR voltage / current produced / generated in coil Q (induced emf) causes pointer on (sensitive) voltmeter to move when current steady no changing magnetic field OR no field (lines) cutting coil Q pointer then returns to zero
Q9 · A student investigates an electric circuit
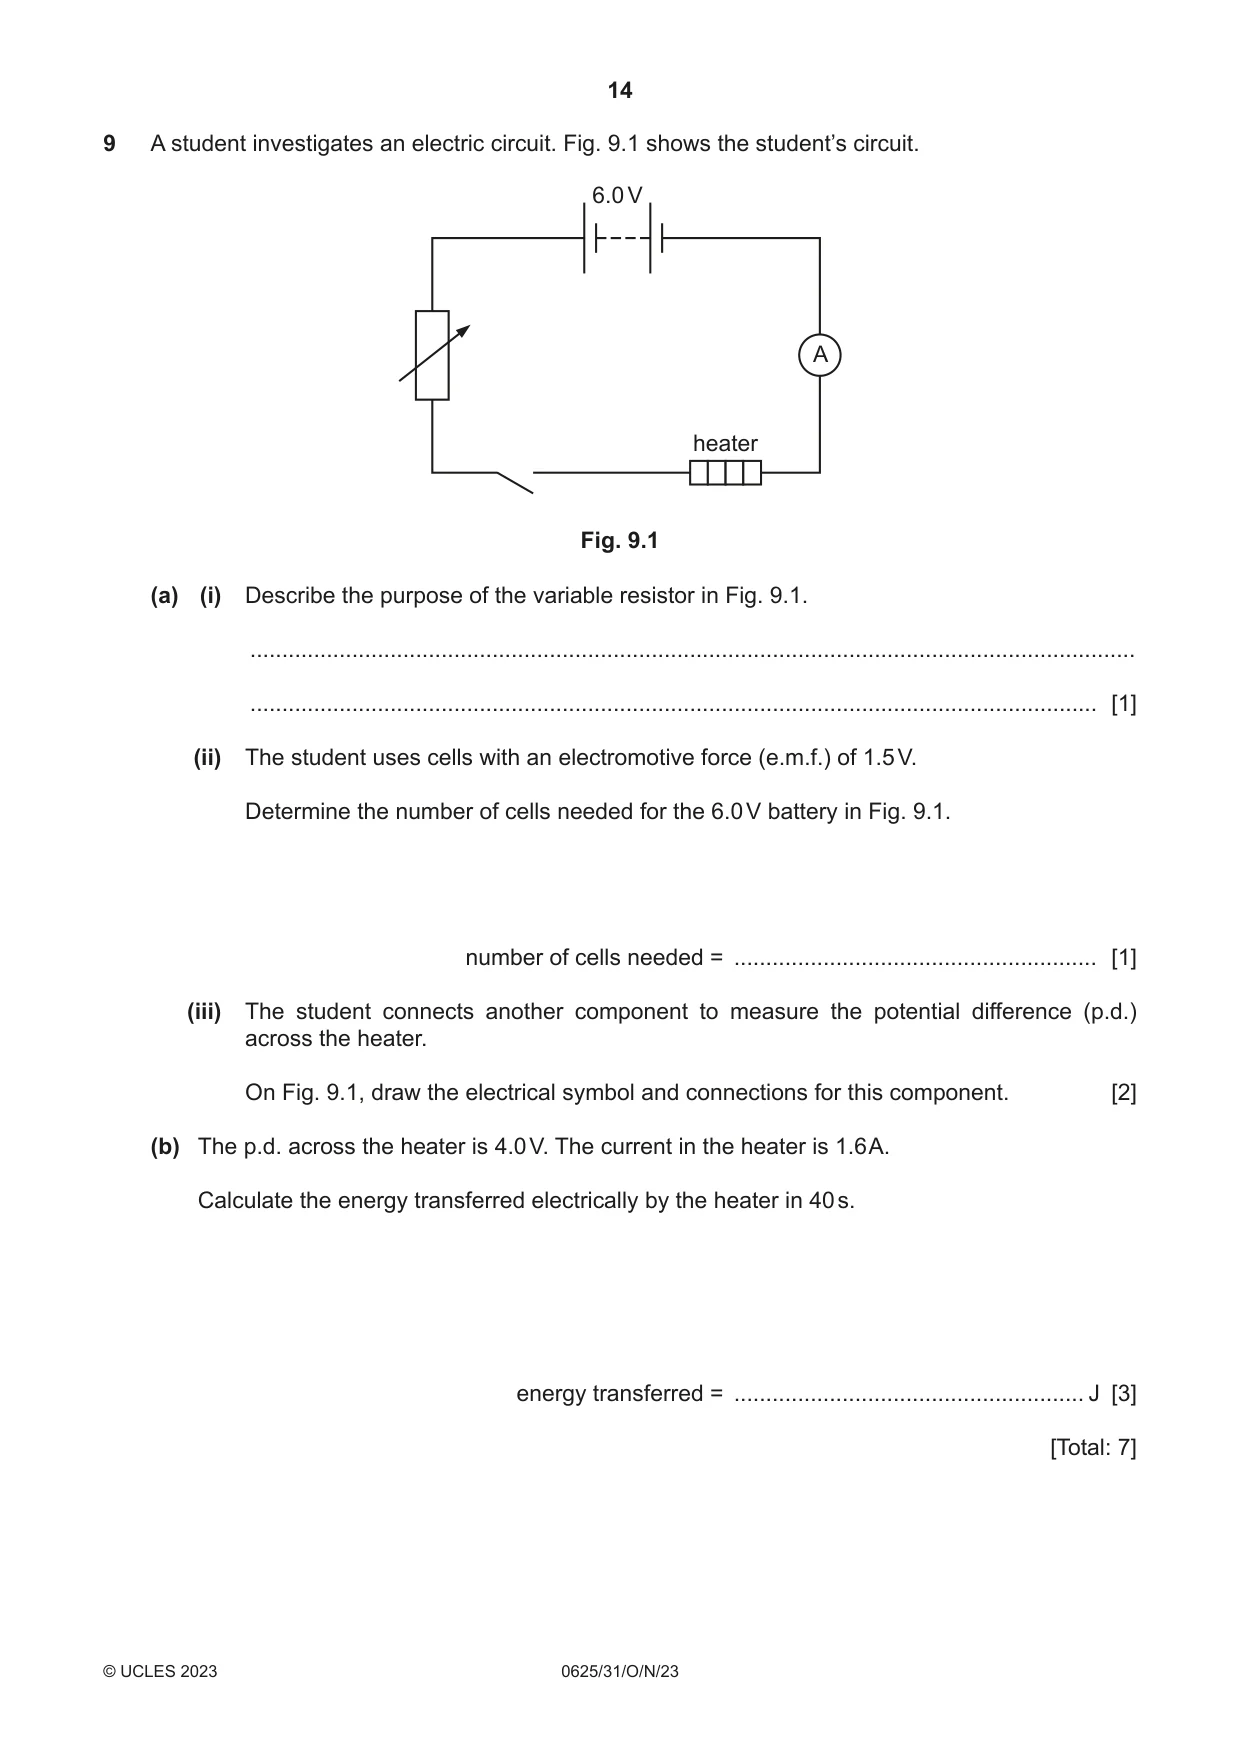
9 A student investigates an electric circuit. Fig. 9.1 shows the student’s circuit. 6.0 V A heater Fig. 9.1 (a) (i) Describe the purpose of the variable resistor in Fig. 9.1. ........................................................................................................................................... ..................................................................................................................................... [1] (ii) The student uses cells with an electromotive force (e.m.f.) of 1.5 V. Determine the number of cells needed for the 6.0 V battery in Fig. 9.1. number of cells needed = ......................................................... [1] (iii) The student connects another component to measure the potential difference (p.d.) across the heater. On Fig. 9.1, draw the electrical symbol and connections for this component. [2] (b) The p.d. across the heater is 4.0 V. The current in the heater is 1.6 A. Calculate the energy transferred electrically by the heater in 40 s. energy transferred = ....................................................... J [3] [Total: 7]
Mark scheme: 9(a)(i) (to) change / control current (in circuit / heater) B1 OR change / control p.d. voltage (across heater) 9(a)(ii) (6.0 ÷ 1.5 =) 4 (cells) B1 9(a)(iii) symbol for voltmeter seen or used B1 connected in parallel with heater B1 9(b) (E =) 260 (J) A3 (E =) 1.6 40 4.0 (C2) (E =) I t V OR P = I V AND (E =) P t (C1)
Q10 · A nucleus of an isotope of actinium contains 89 protons and 136 neutrons
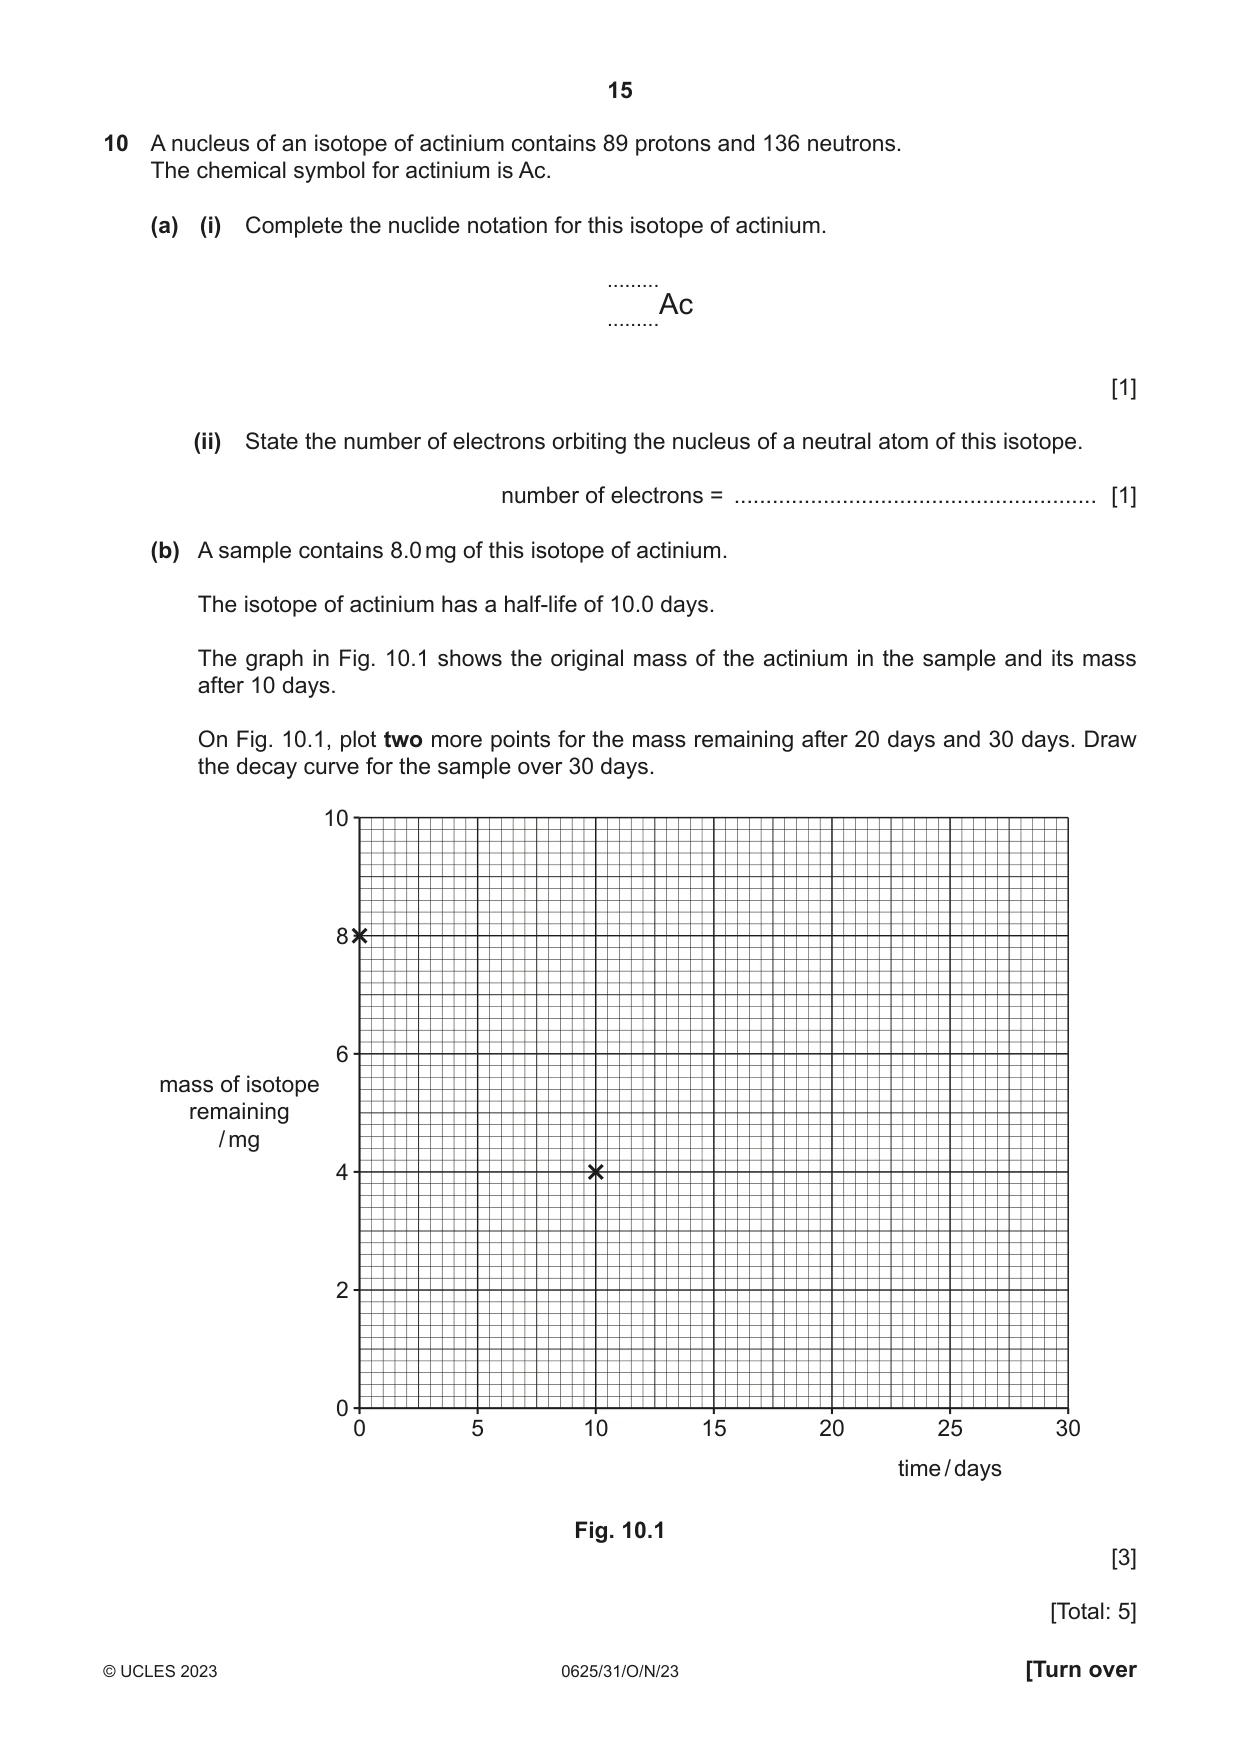
10 A nucleus of an isotope of actinium contains 89 protons and 136 neutrons. The chemical symbol for actinium is Ac. (a) (i) Complete the nuclide notation for this isotope of actinium. ......... .........Ac [1] (ii) State the number of electrons orbiting the nucleus of a neutral atom of this isotope. number of electrons = ......................................................... [1] (b) A sample contains 8.0 mg of this isotope of actinium. The isotope of actinium has a half-life of 10.0 days. The graph in Fig. 10.1 shows the original mass of the actinium in the sample and its mass after 10 days. On Fig. 10.1, plot two more points for the mass remaining after 20 days and 30 days. Draw the decay curve for the sample over 30 days. 10 8 6 mass of isotope remaining / mg 4 2 0 0 5 10 15 20 25 30 time / days Fig. 10.1 [3] [Total: 5]
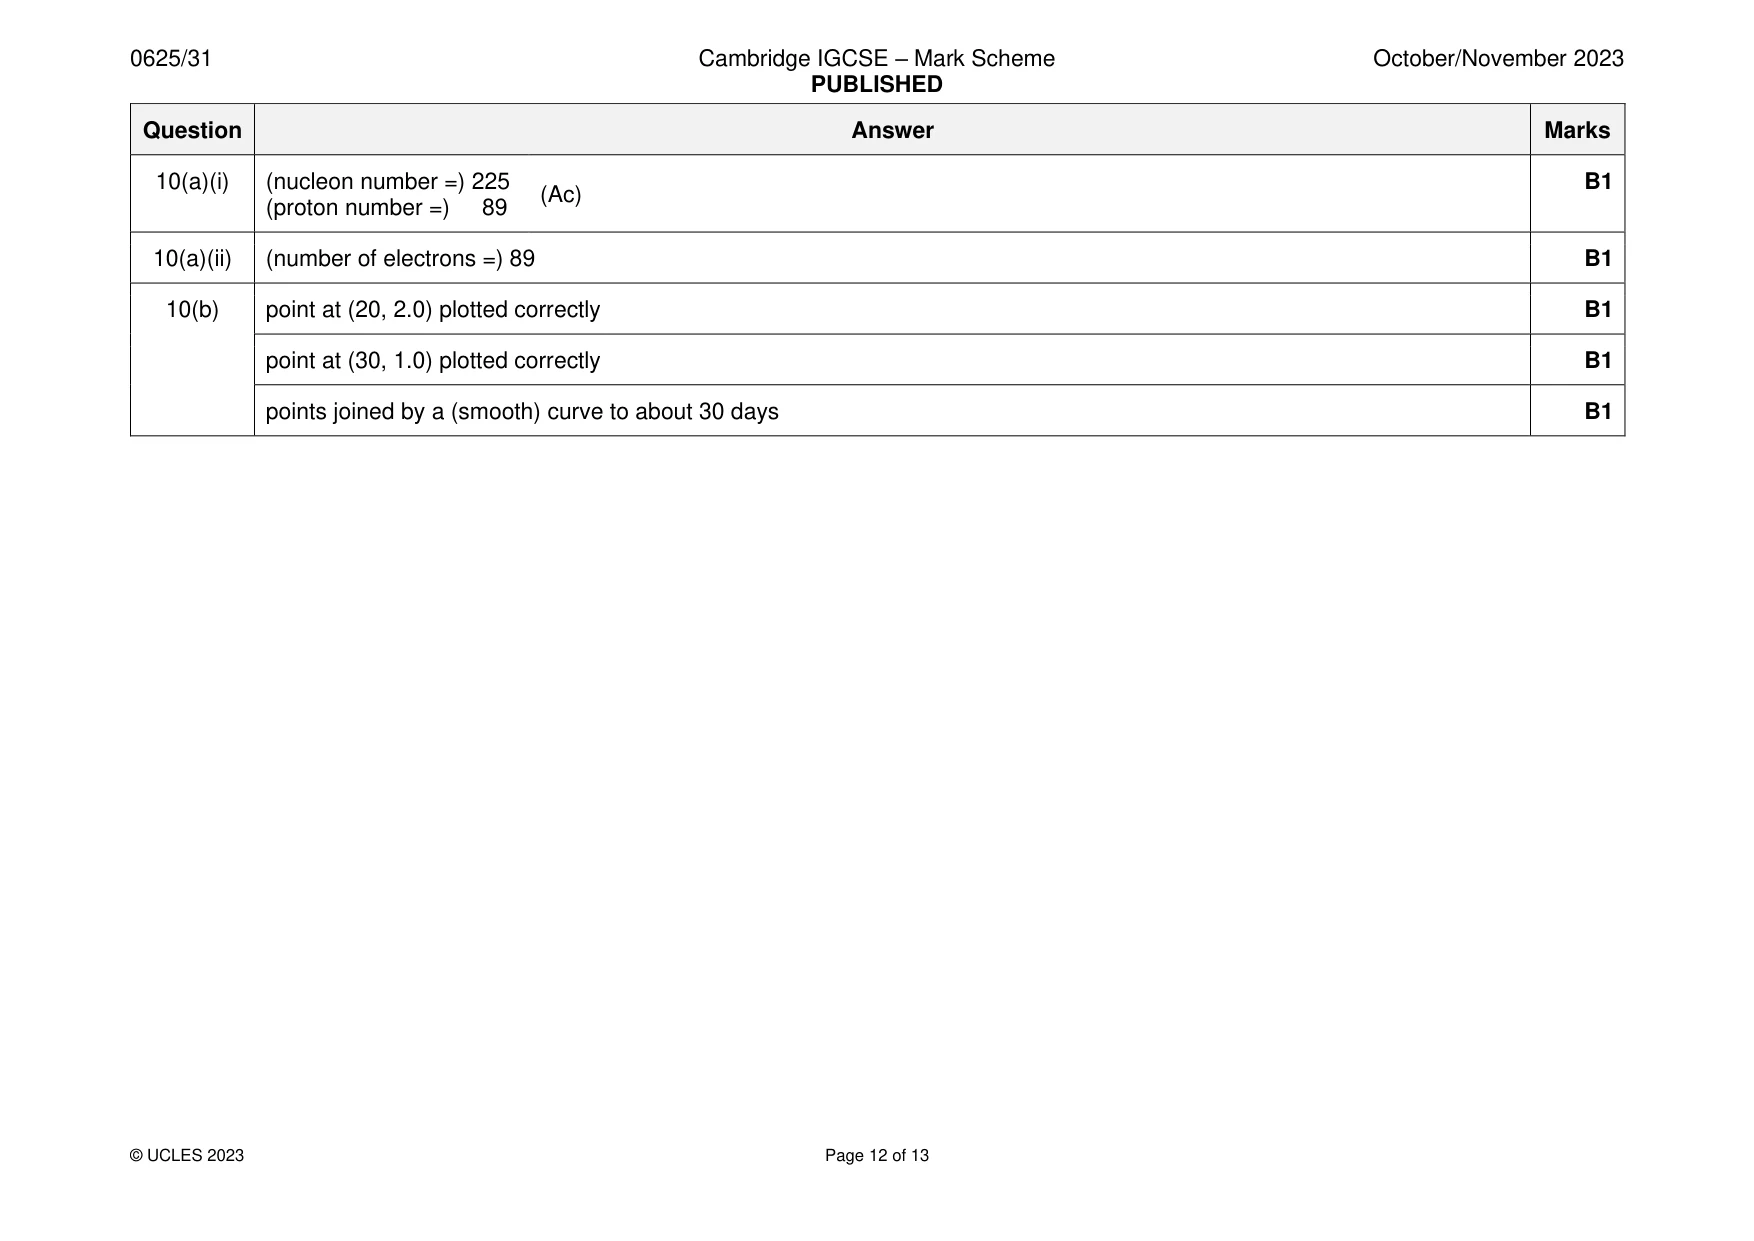
Mark scheme: 10(a)(i) (nucleon number =) 225 B1 (Ac) (proton number =) 89 10(a)(ii) (number of electrons =) 89 B1 10(b) point at (20, 2.0) plotted correctly B1 point at (30, 1.0) plotted correctly B1 points joined by a (smooth) curve to about 30 days B1
Q11 · The Sun and part of the Solar System
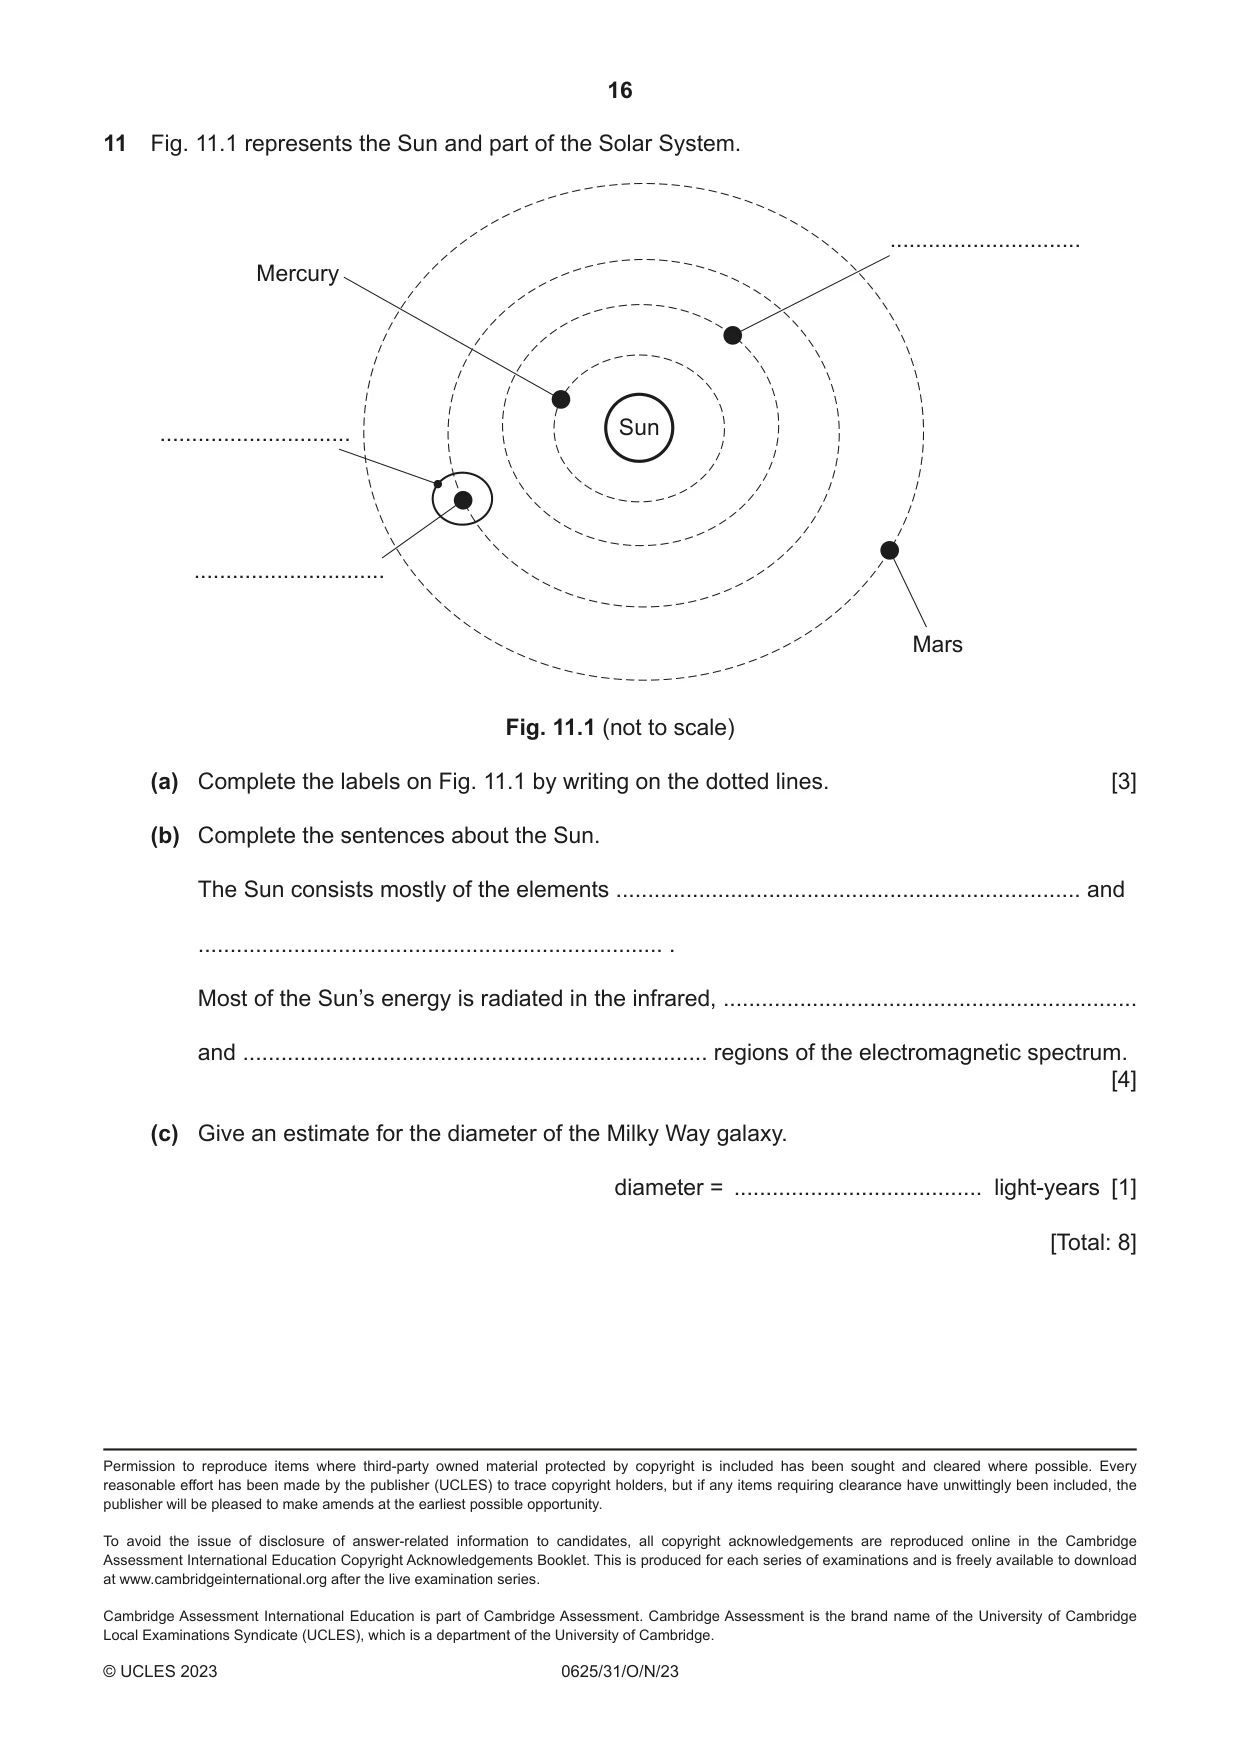
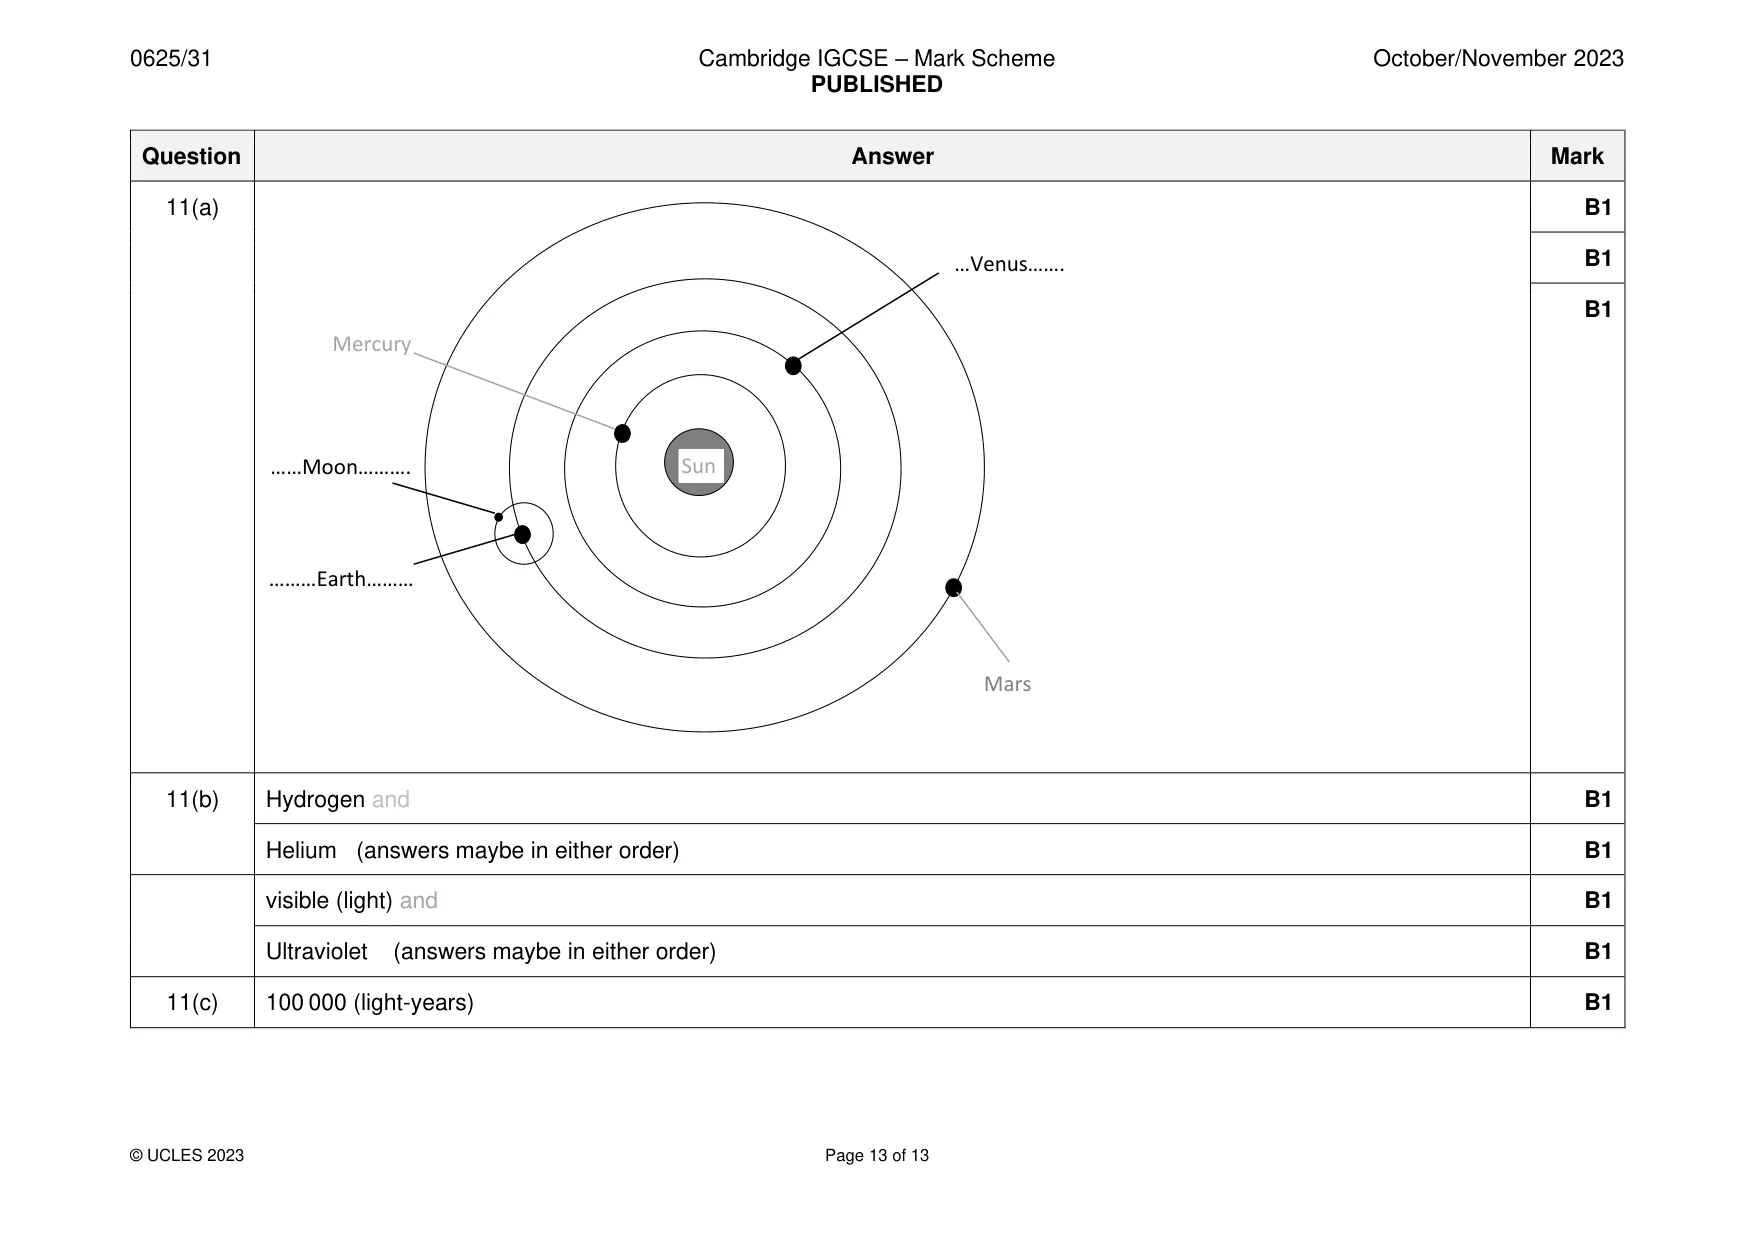
11 Fig. 11.1 represents the Sun and part of the Solar System. .............................. Mercury .............................. Sun .............................. Mars Fig. 11.1 (not to scale) (a) Complete the labels on Fig. 11.1 by writing on the dotted lines. [3] (b) Complete the sentences about the Sun. The Sun consists mostly of the elements ......................................................................... and ......................................................................... . Most of the Sun’s energy is radiated in the infrared, ................................................................. and ......................................................................... regions of the electromagnetic spectrum. [4] (c) Give an estimate for the diameter of the Milky Way galaxy. diameter = ....................................... light-years [1] [Total: 8]
Mark scheme: 11(a) B1 …Venus……. B1 B1 Mercury ……Moon………. Sun ………Earth……… Mars 11(b) Hydrogen and B1 Helium (answers maybe in either order) B1 visible (light) and B1 Ultraviolet (answers maybe in either order) B1 11(c) 100 000 (light-years) B1
What was in this paper
The subtopics covered by these 11 questions, and how many questions each got. Open one in a new tab to see every Cambridge question on it.
What you needed in this session
Cambridge’s own grade thresholds for 2023 Oct/Nov, Paper 3 · Variant 1. A higher threshold means an easier paper — the bar moves with how the cohort did.