Cambridge IGCSE Physics 0625 — 2020 Oct/Nov Paper 3 · Variant 1
0625/31/O/N/20 · 12 questions · 80 marks · ≈90 min
The question paper and its mark scheme, free to read here and free to download. This is Cambridge’s own paper, exactly as it was sat.
Question paper20 pages
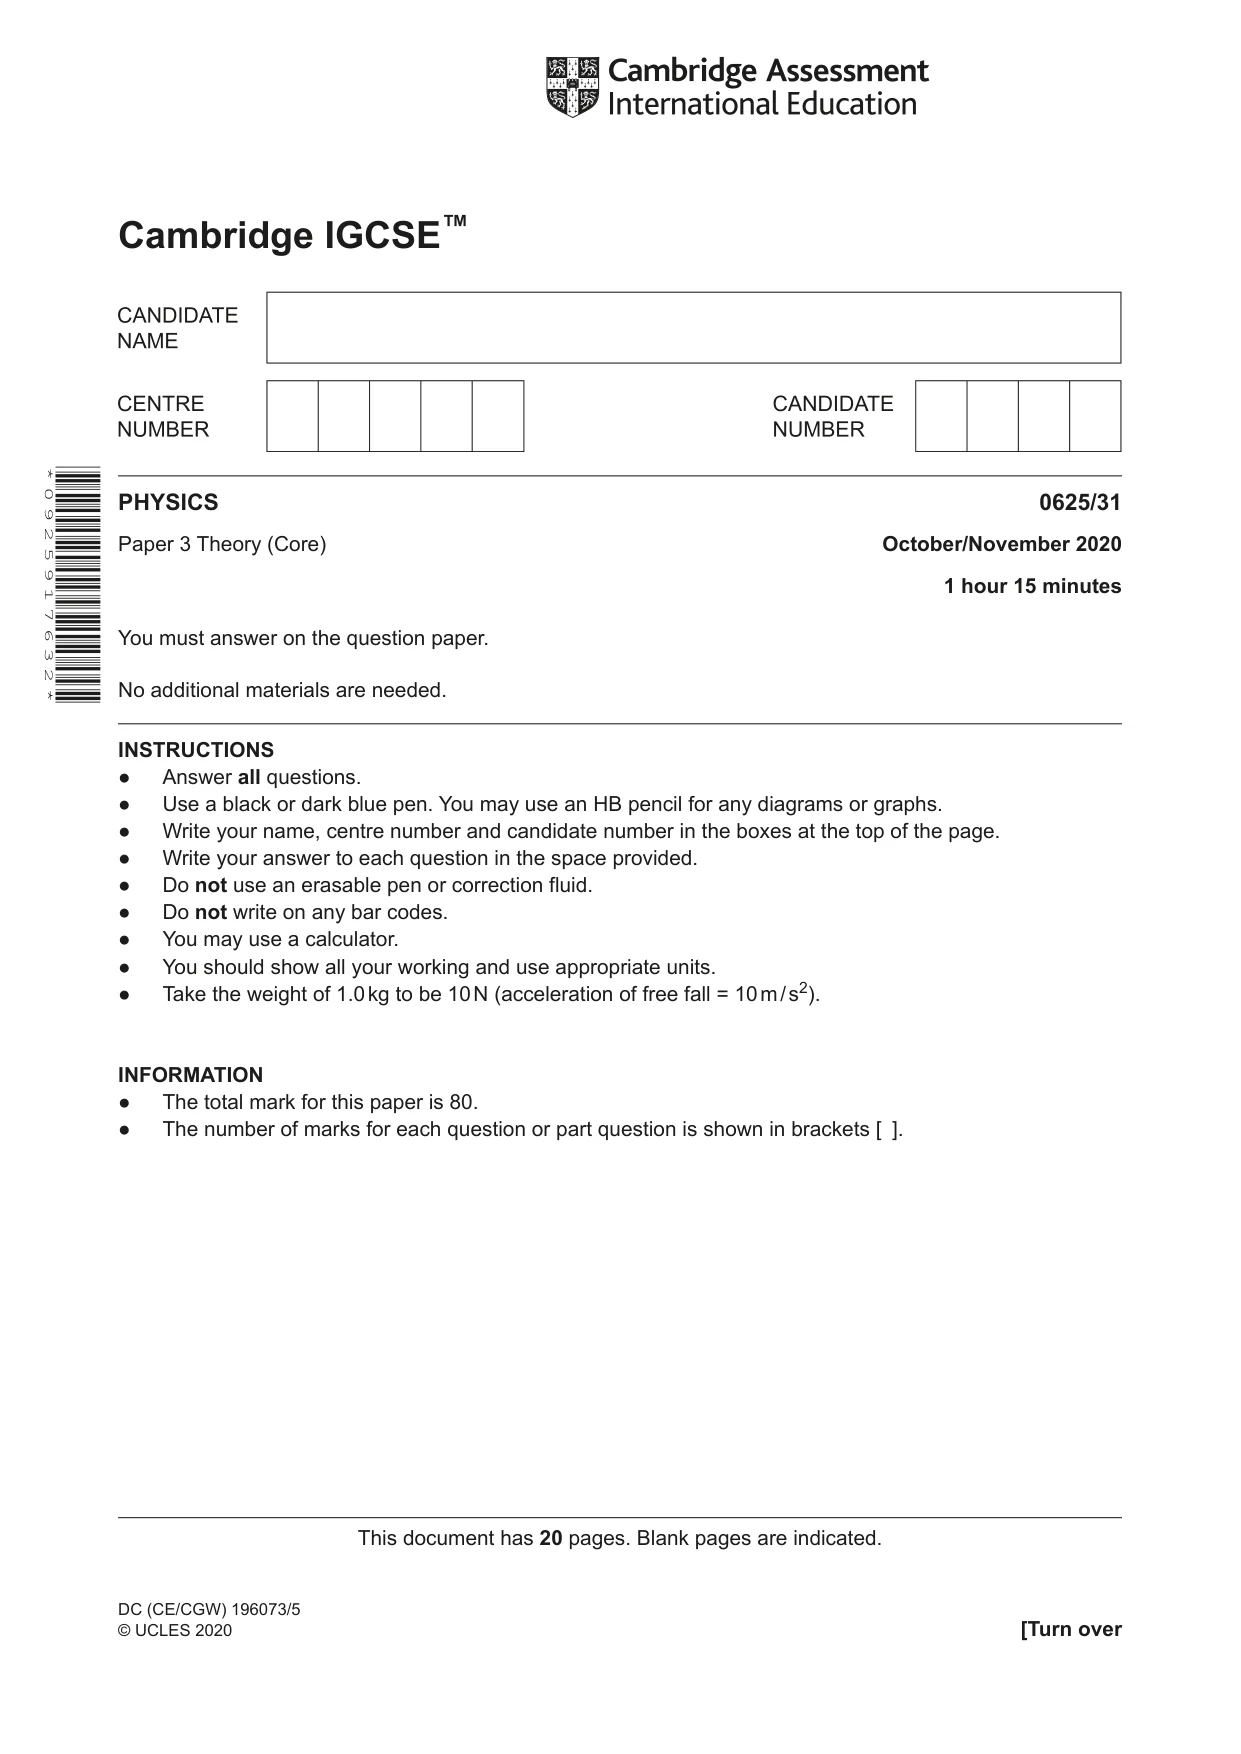
Mark scheme14 pages
Answers below. Sit the paper first if you are practising.
Questions as text
Q1 · Student P and student Q run in a 100 m race
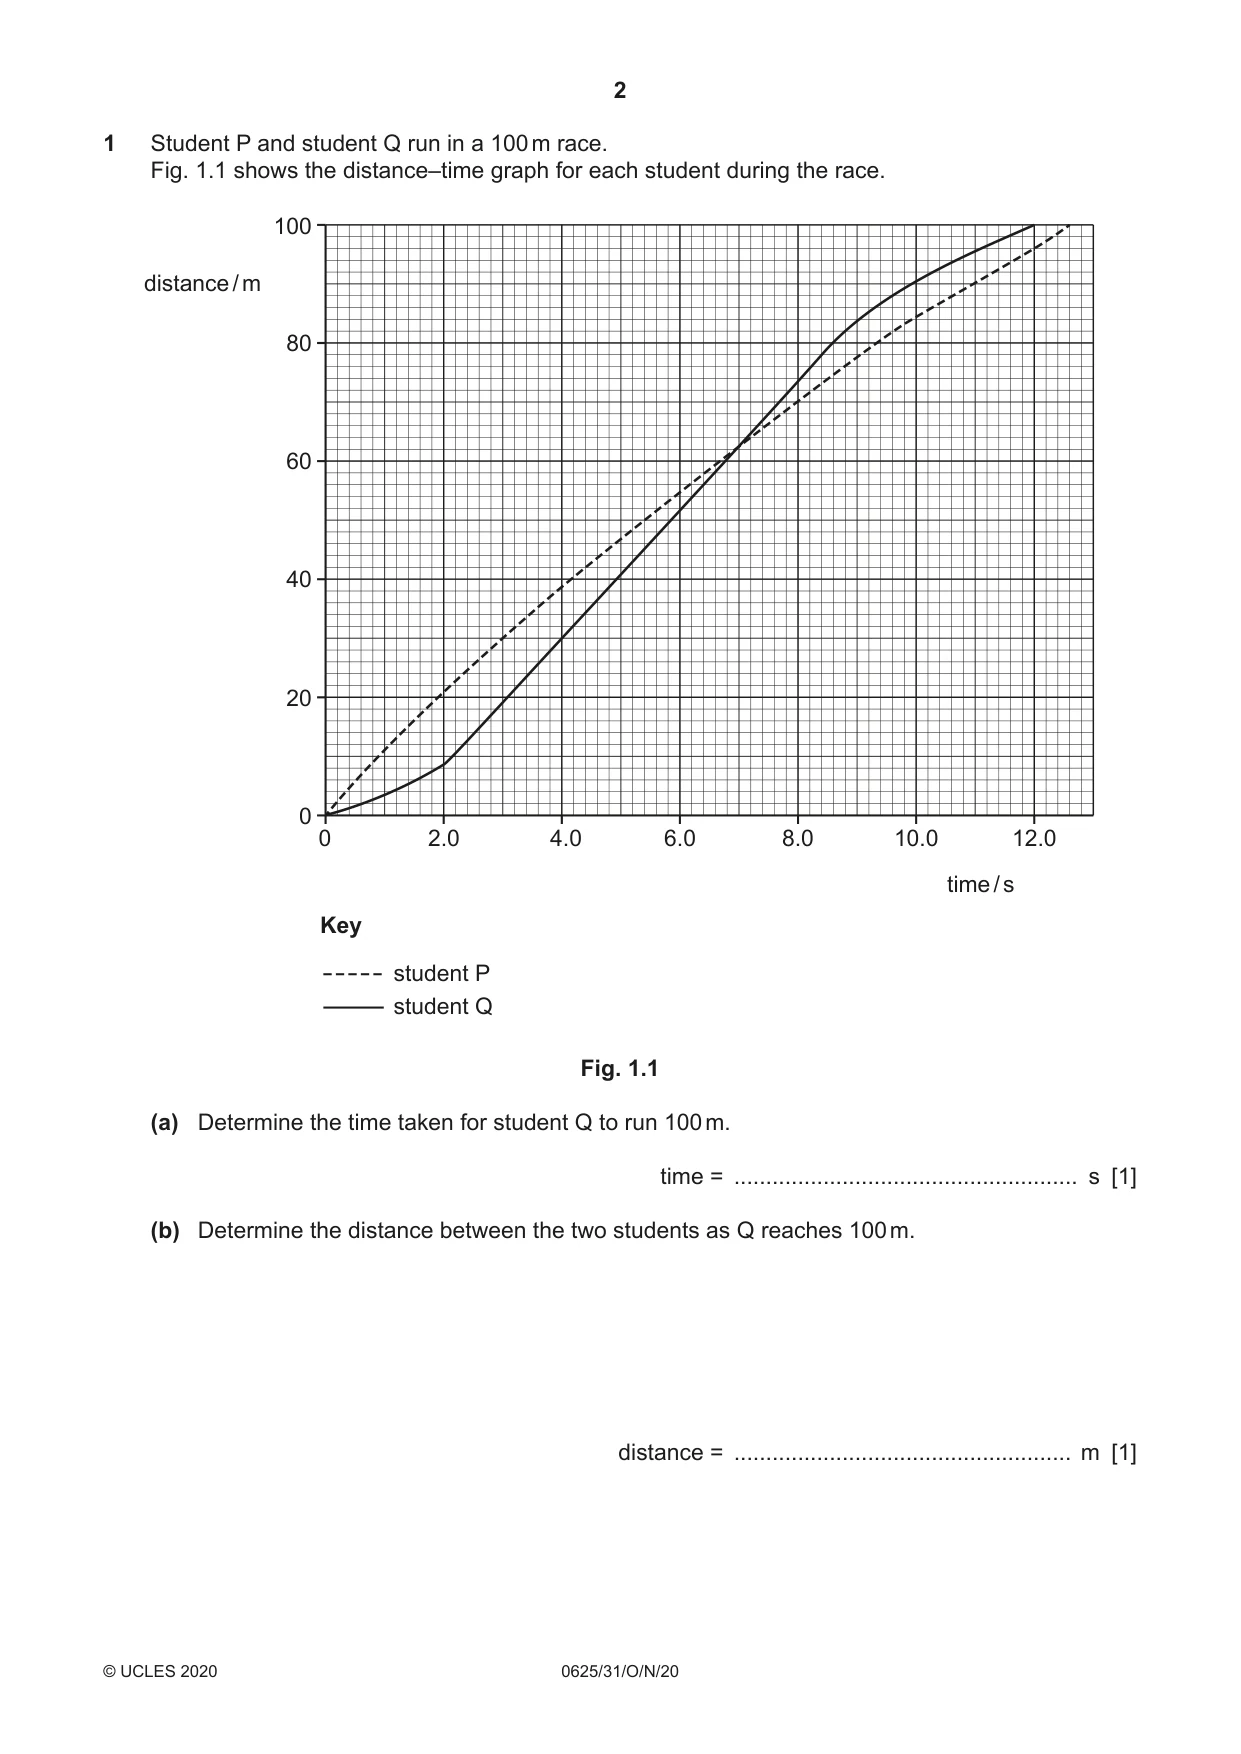
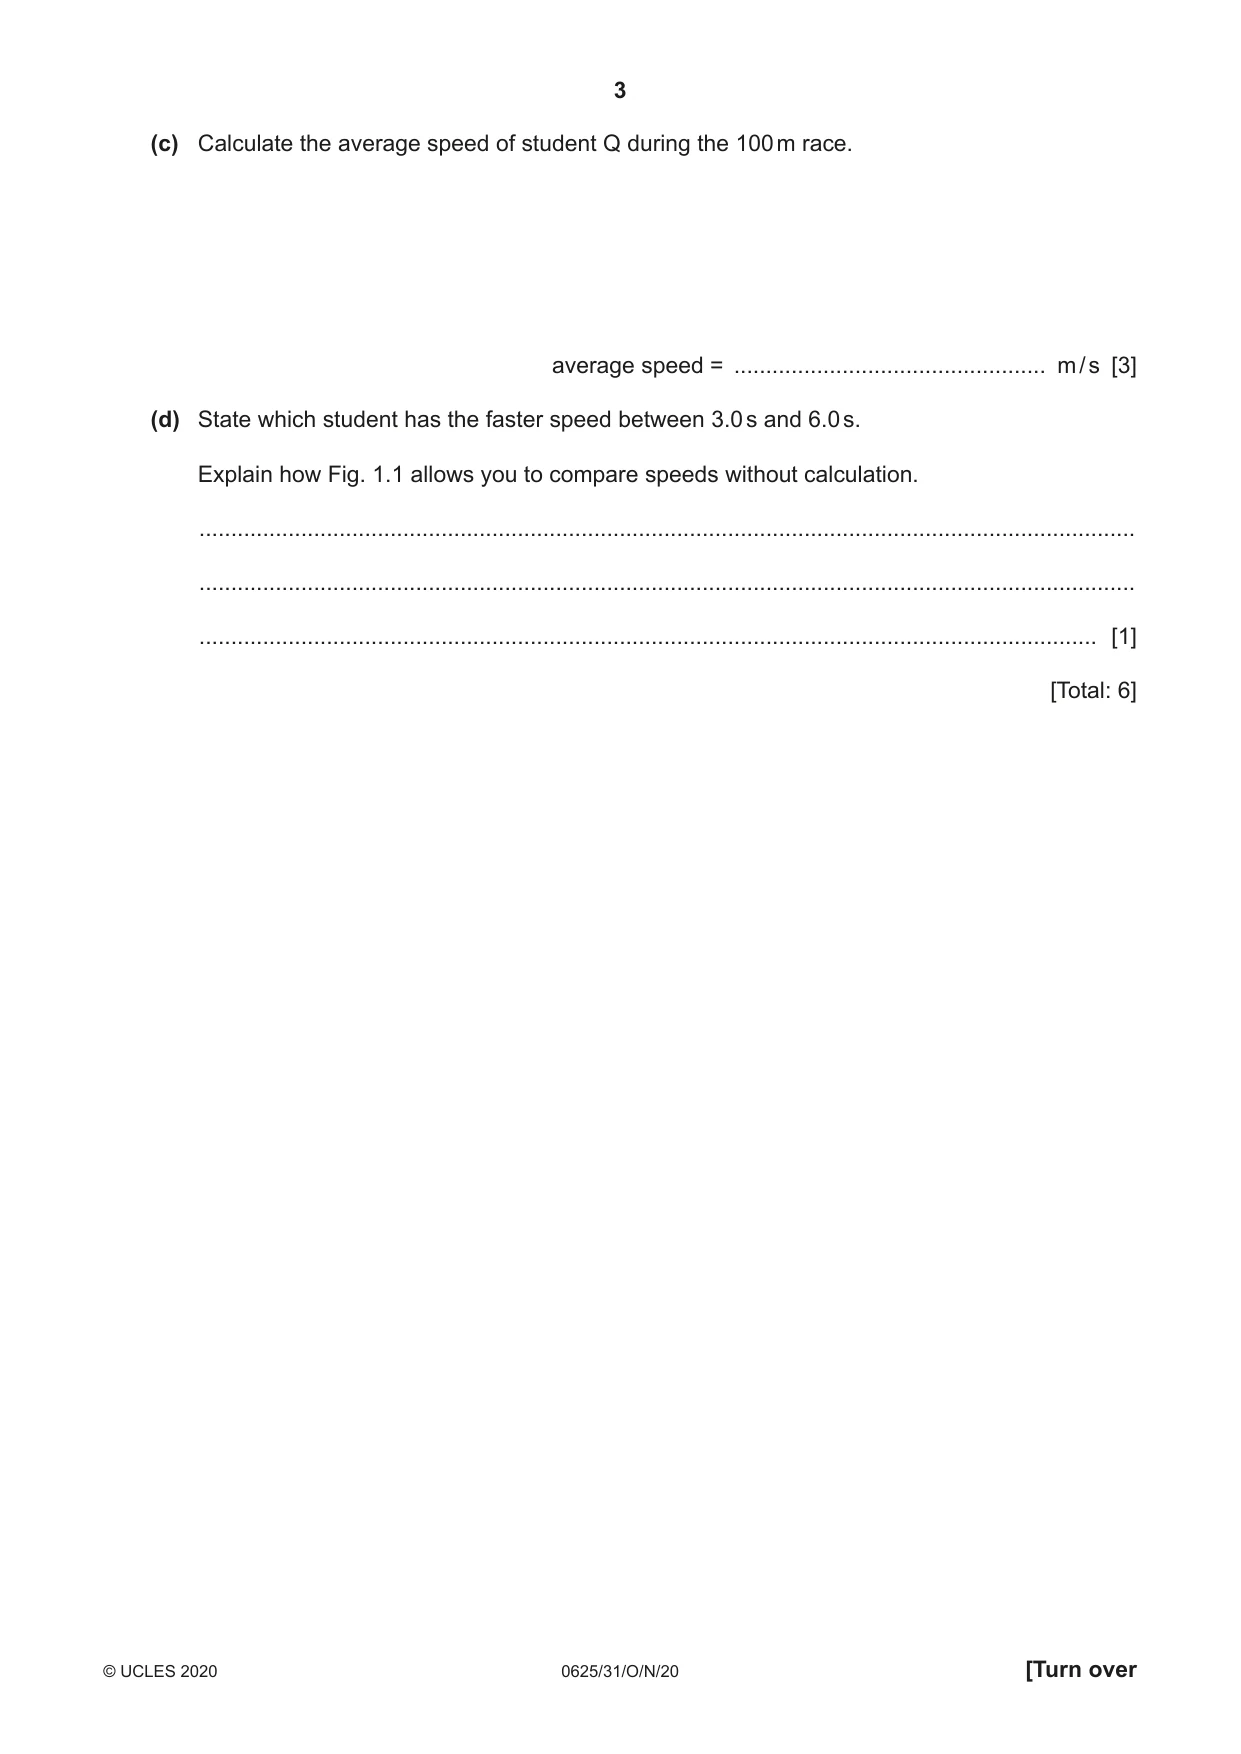
1 Student P and student Q run in a 100 m race. Fig. 1.1 shows the distance–time graph for each student during the race. 100 distance / m 80 60 40 20 0 0 2.0 4.0 6.0 8.0 10.0 12.0 time / s Key student P student Q Fig. 1.1 (a) Determine the time taken for student Q to run 100 m. time = ...................................................... s [1] (b) Determine the distance between the two students as Q reaches 100 m. distance = ..................................................... m [1] (c) Calculate the average speed of student Q during the 100 m race. average speed = ................................................. m / s [3] (d) State which student has the faster speed between 3.0 s and 6.0 s. Explain how Fig. 1.1 allows you to compare speeds without calculation. ................................................................................................................................................... ................................................................................................................................................... ............................................................................................................................................. [1] [Total: 6]
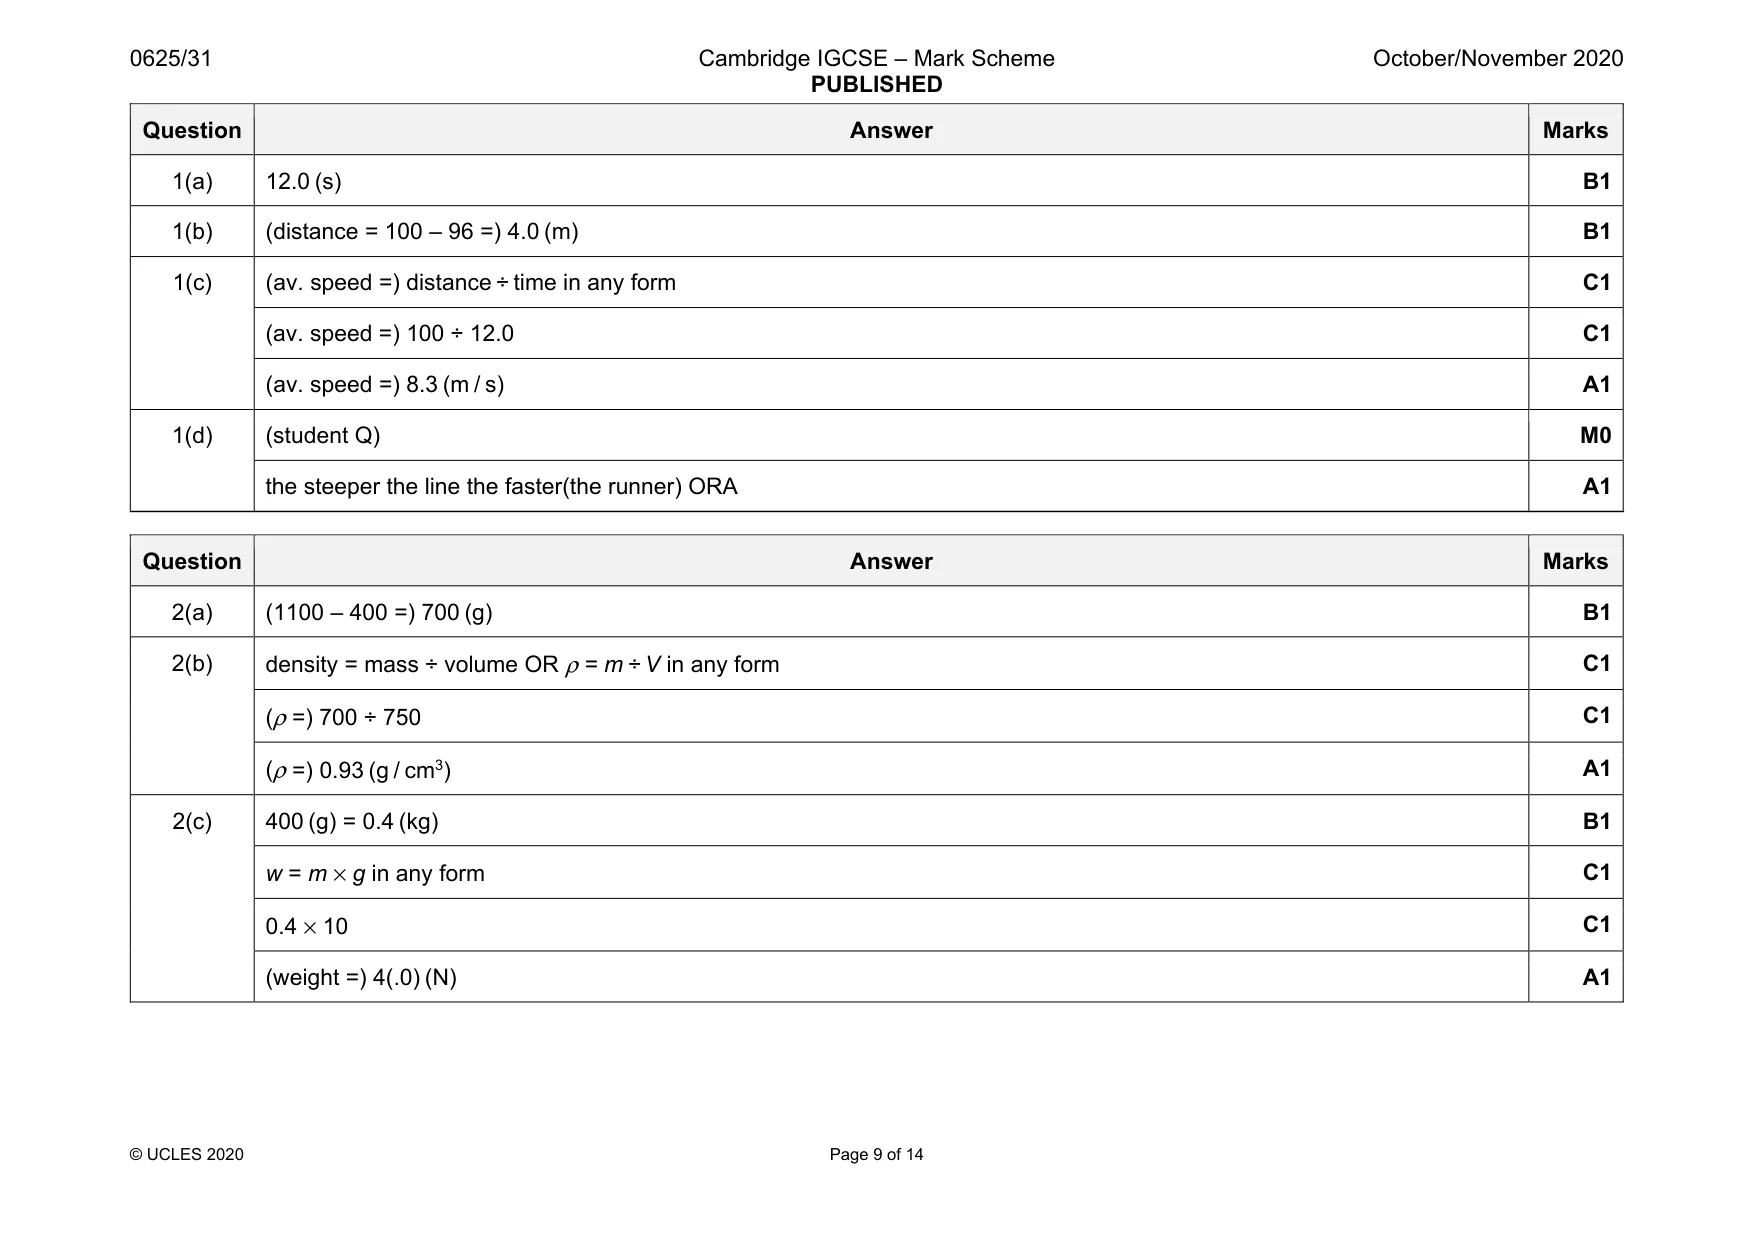
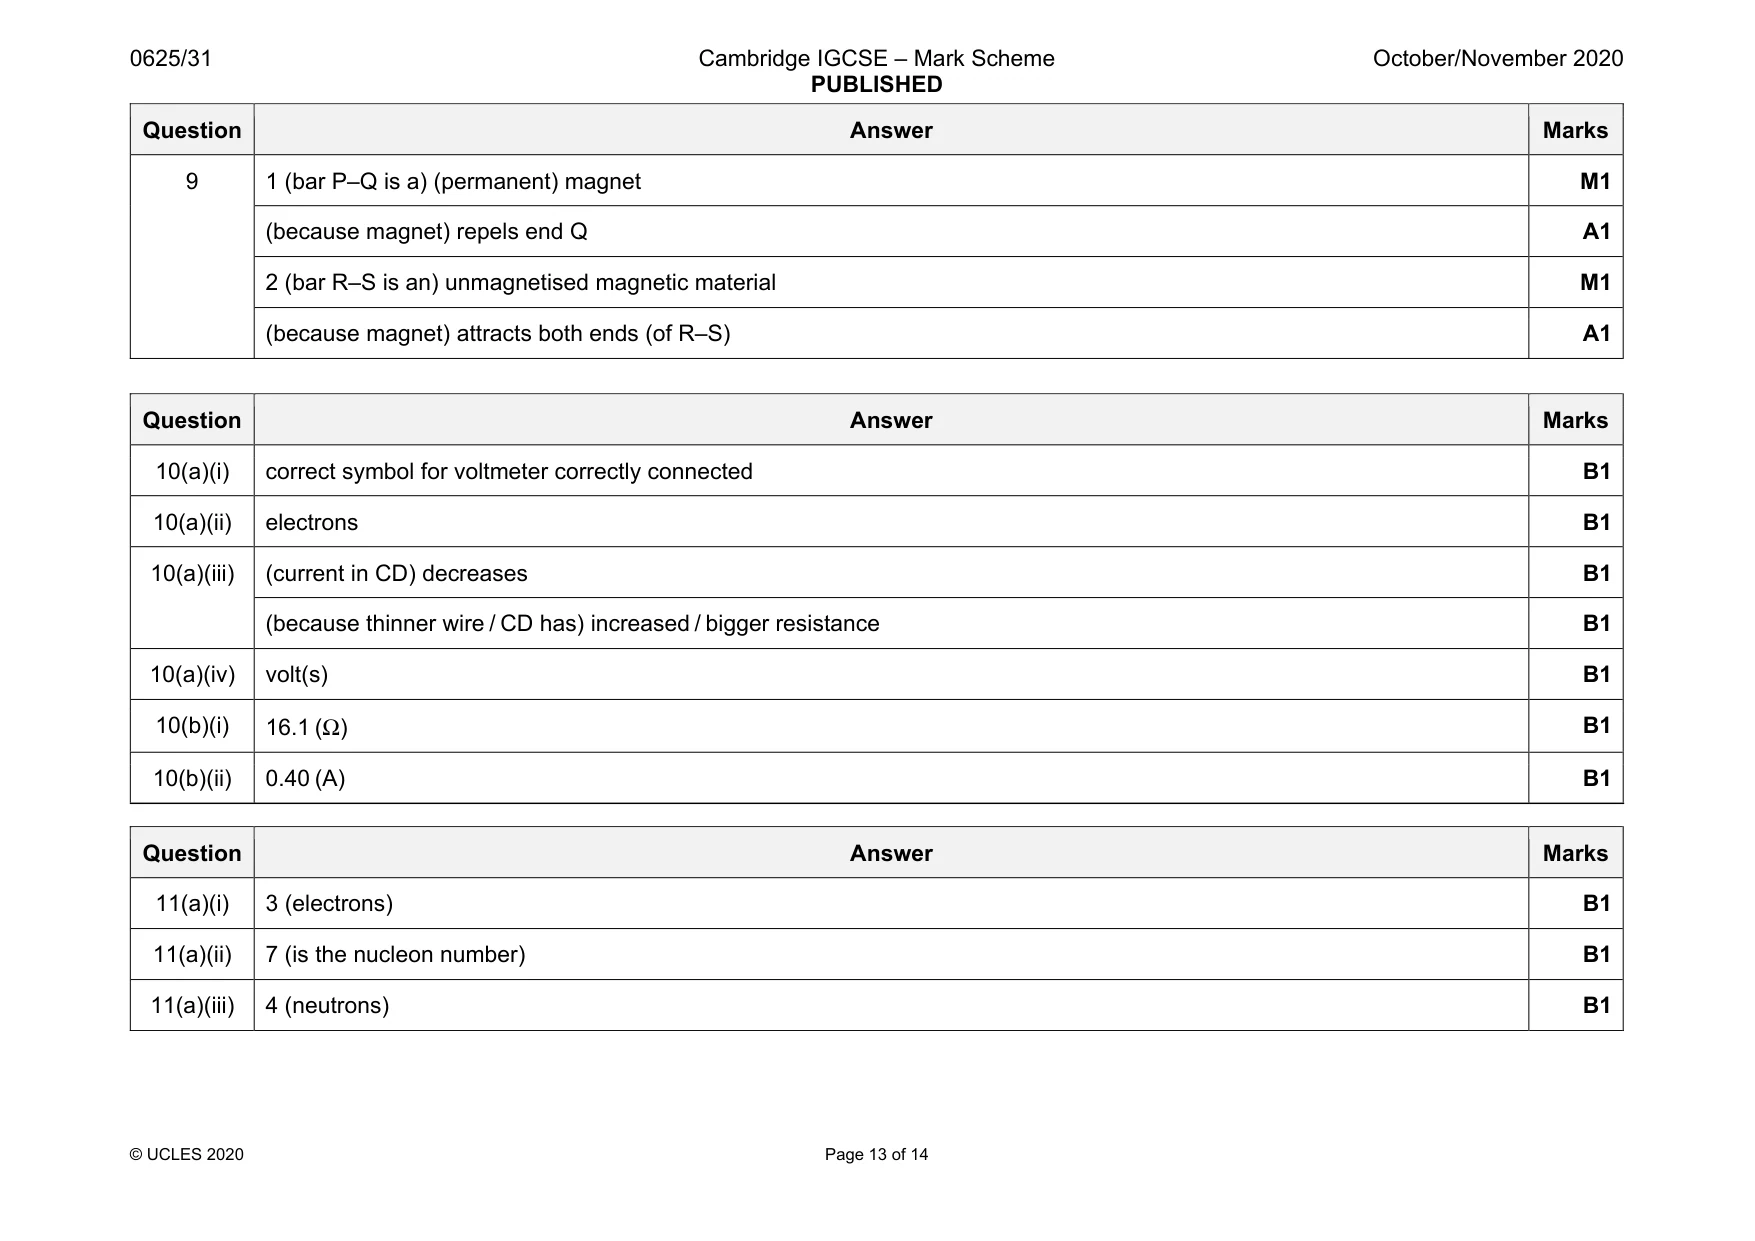
Mark scheme: 1(a) 12.0 (s) B1 1(b) (distance = 100 – 96 =) 4.0 (m) B1 1(c) (av. speed =) distance ÷ time in any form C1 (av. speed =) 100 ÷ 12.0 C1 (av. speed =) 8.3 (m / s) A1 1(d) (student Q) M0 the steeper the line the faster(the runner) ORA A1
Q2 · A beaker containing liquid on a top pan balance
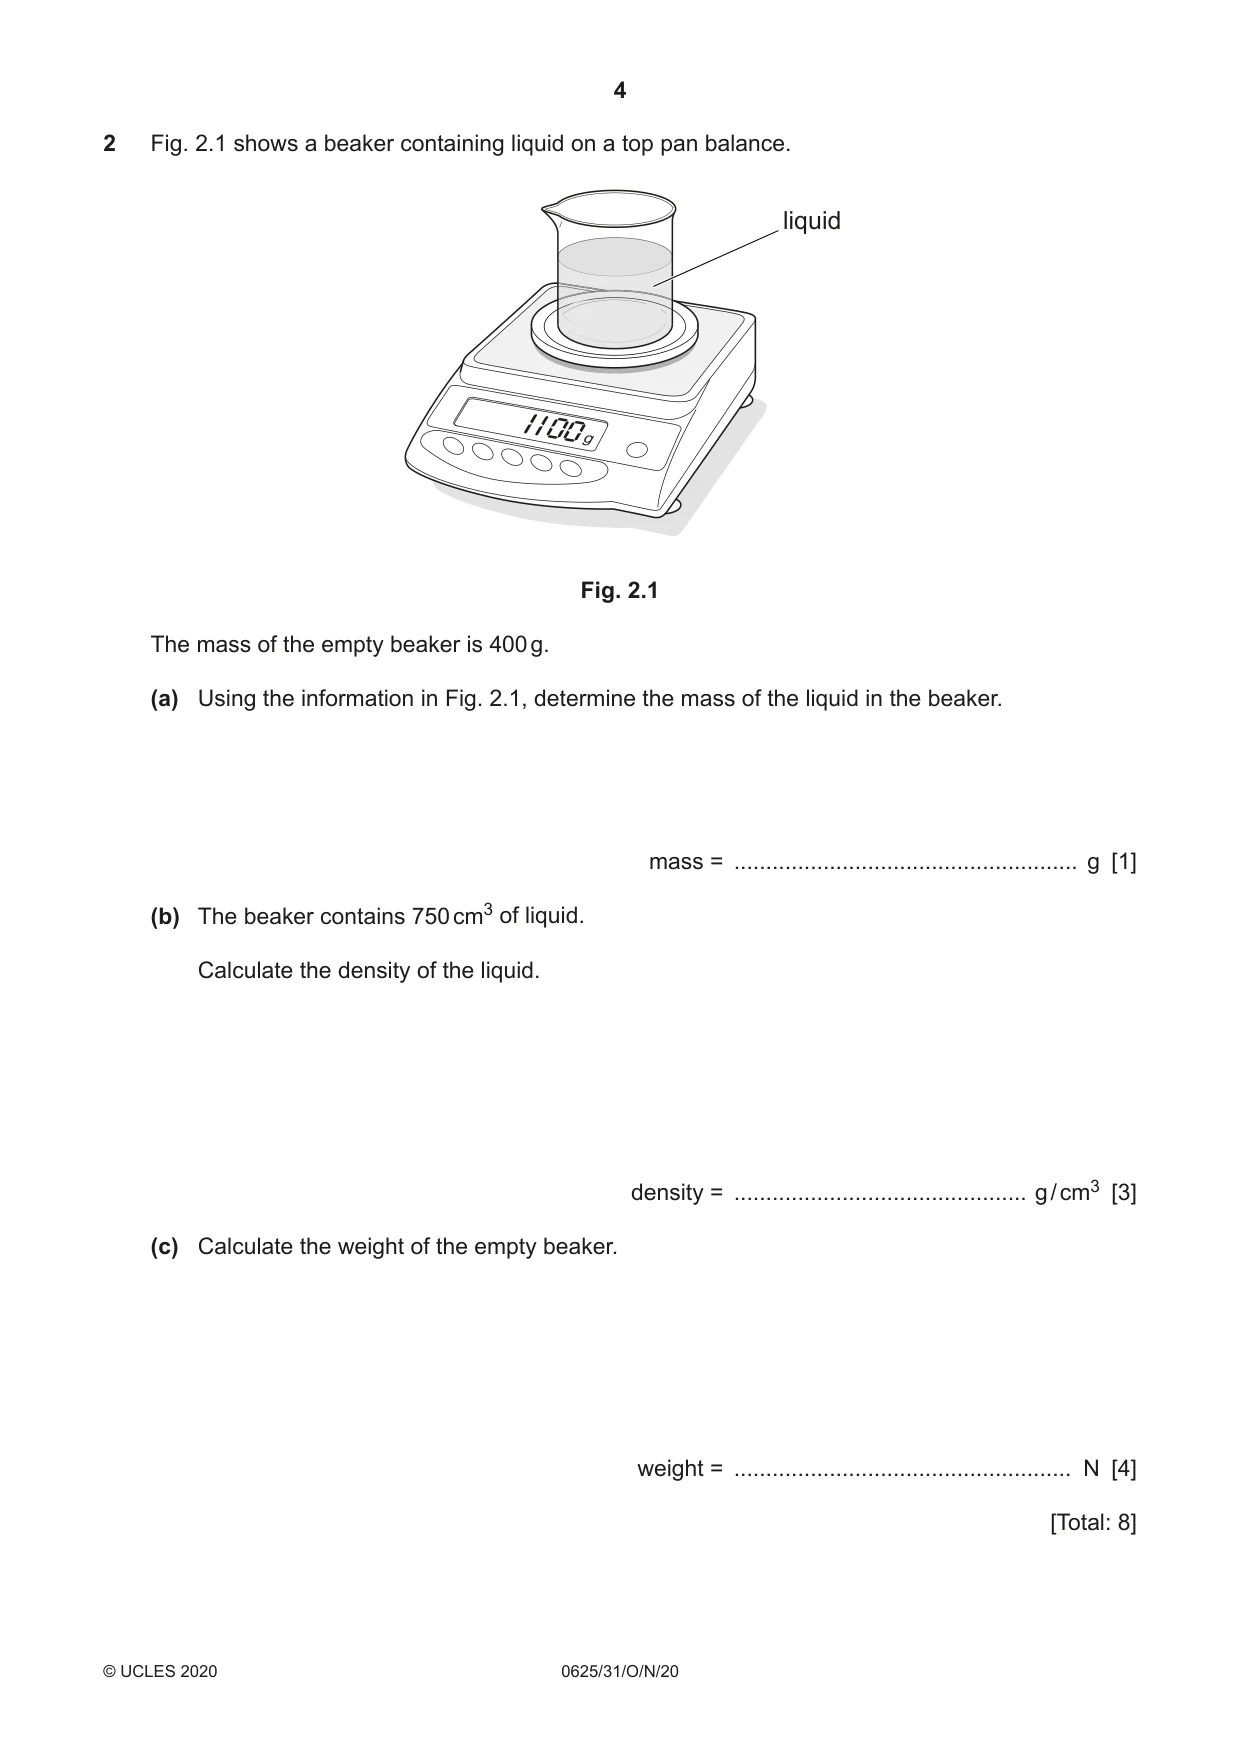
2 Fig. 2.1 shows a beaker containing liquid on a top pan balance. liquid Fig. 2.1 The mass of the empty beaker is 400 g. (a) Using the information in Fig. 2.1, determine the mass of the liquid in the beaker. mass = ...................................................... g [1] (b) The beaker contains 750 cm3 of liquid. Calculate the density of the liquid. density = .............................................. g / cm3 [3] (c) Calculate the weight of the empty beaker. weight = ..................................................... N [4] [Total: 8]
Mark scheme: 2(a) (1100 – 400 =) 700 (g) B1 2(b) density = mass ÷ volume OR ρ = m ÷ V in any form C1 (ρ =) 700 ÷ 750 C1 (ρ =) 0.93 (g / cm3) A1 2(c) 400 (g) = 0.4 (kg) B1 w = m × g in any form C1 0.4 × 10 C1 (weight =) 4(.0) (N) A1
Q3 · Three horizontal forces acting on a car as it moves along a straight road
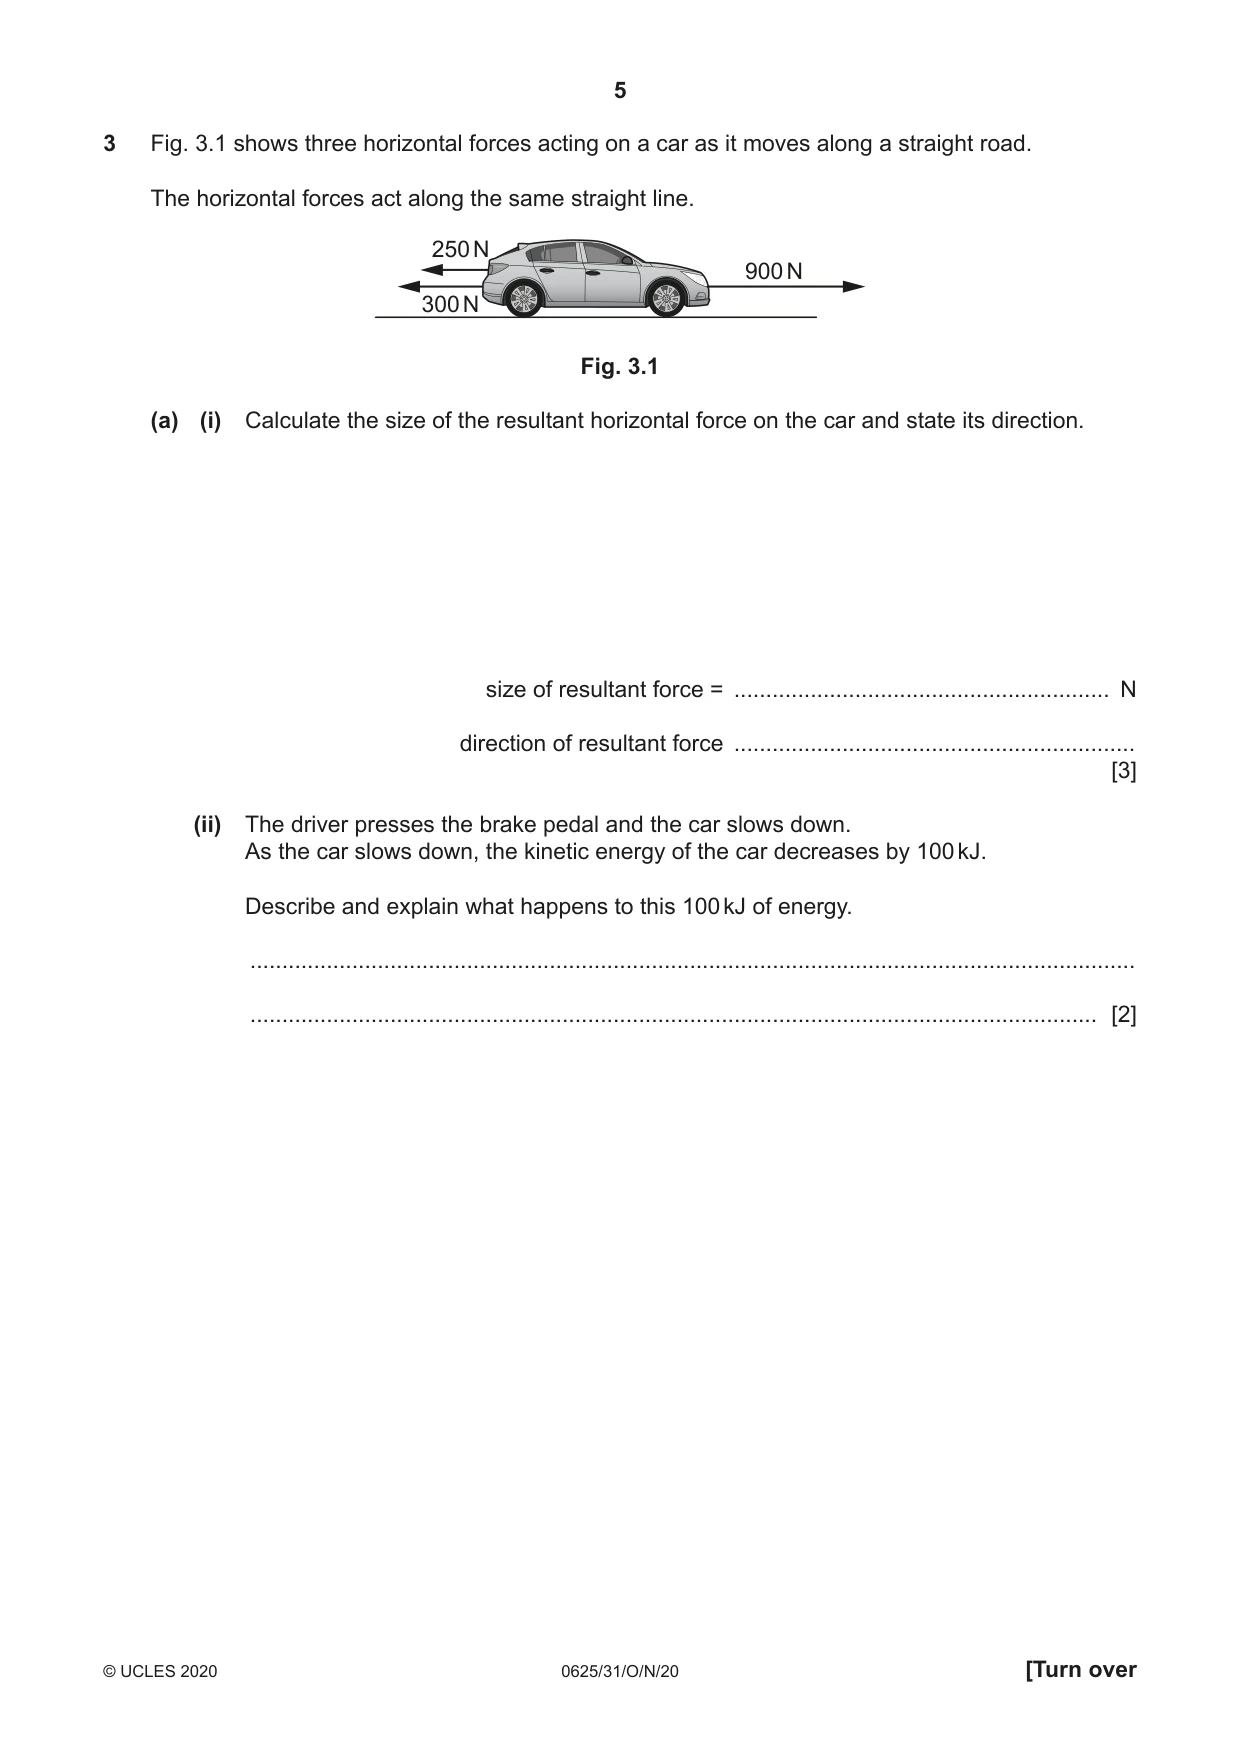
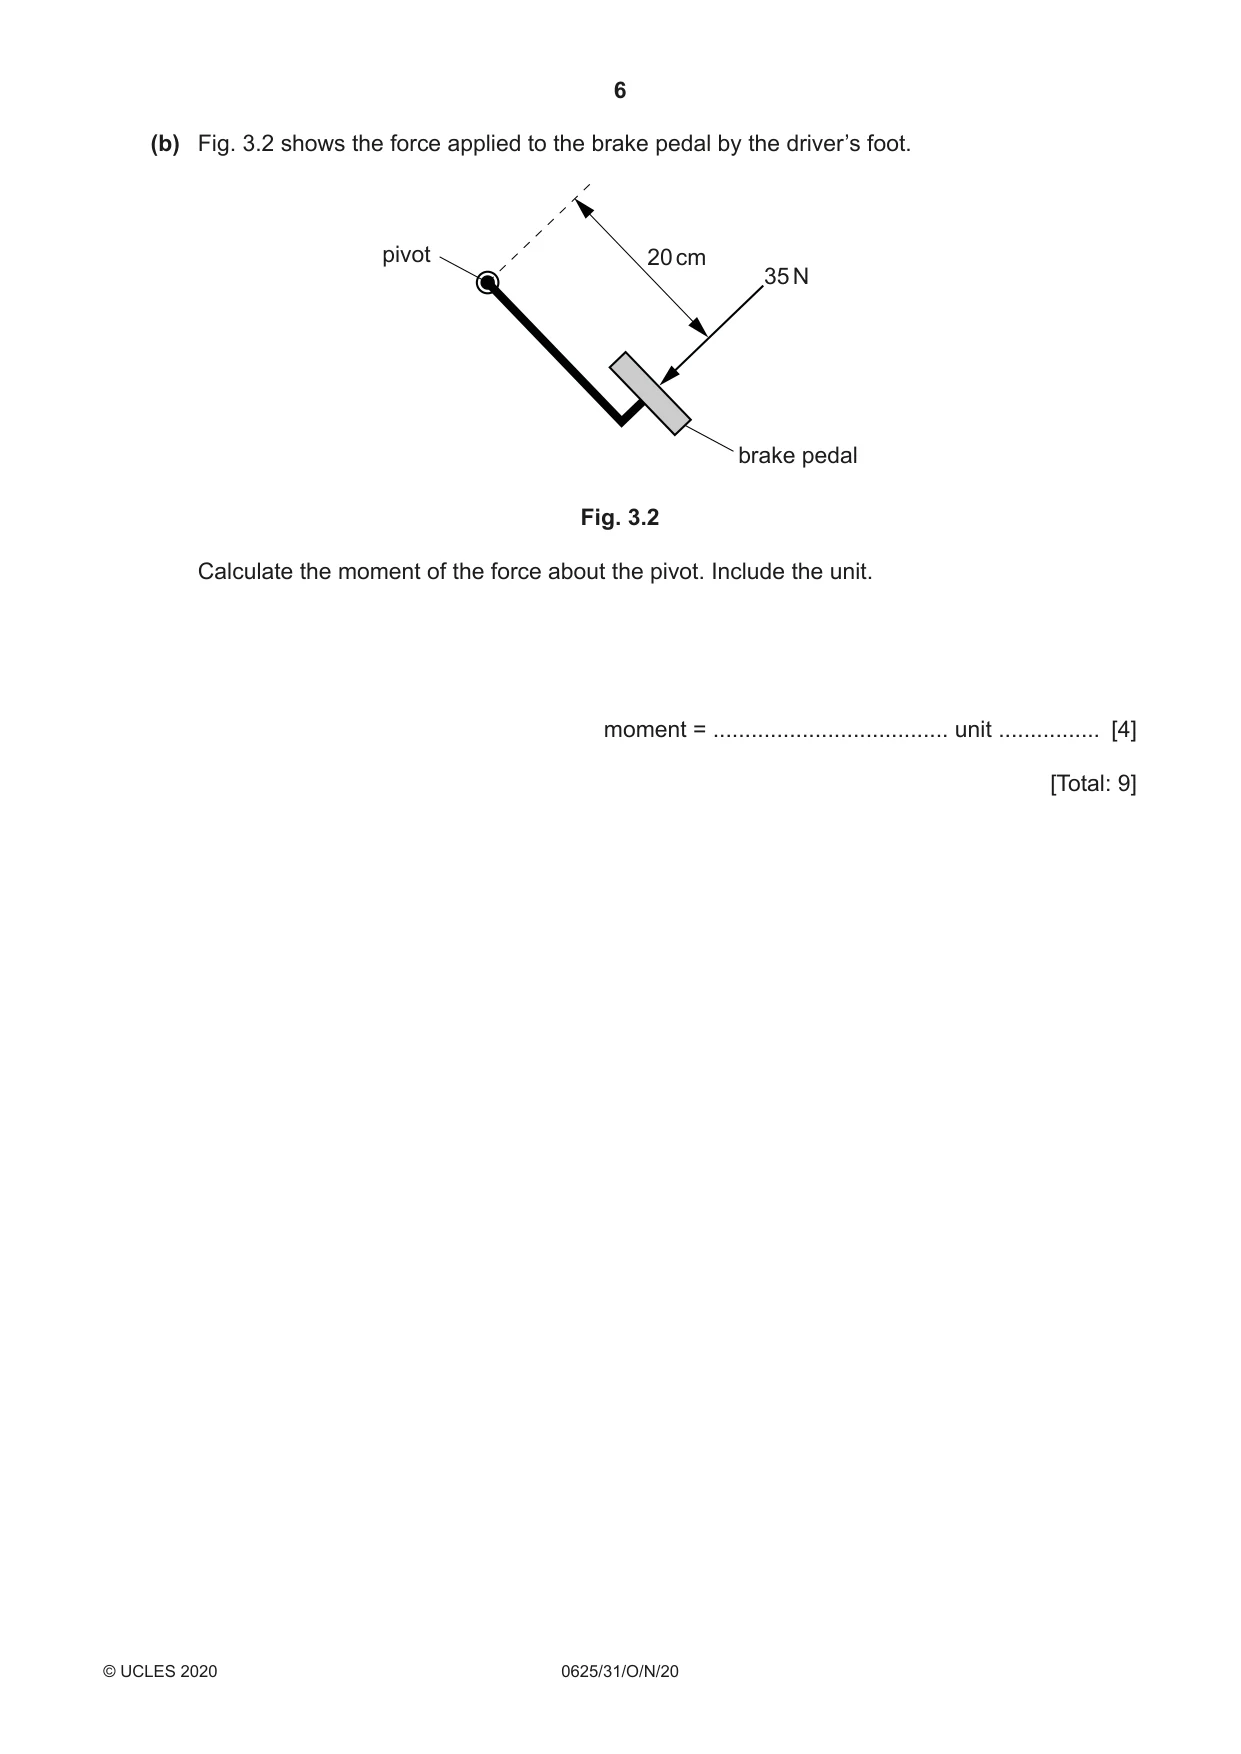
3 Fig. 3.1 shows three horizontal forces acting on a car as it moves along a straight road. The horizontal forces act along the same straight line. 250 N 900 N 300 N Fig. 3.1 (a) (i) Calculate the size of the resultant horizontal force on the car and state its direction. size of resultant force = ........................................................... N direction of resultant force ............................................................... [3] (ii) The driver presses the brake pedal and the car slows down. As the car slows down, the kinetic energy of the car decreases by 100 kJ. Describe and explain what happens to this 100 kJ of energy. ........................................................................................................................................... ..................................................................................................................................... [2] (b) Fig. 3.2 shows the force applied to the brake pedal by the driver’s foot. pivot 20 cm 35 N brake pedal Fig. 3.2 Calculate the moment of the force about the pivot. Include the unit. moment = ..................................... unit ................ [4] [Total: 9]
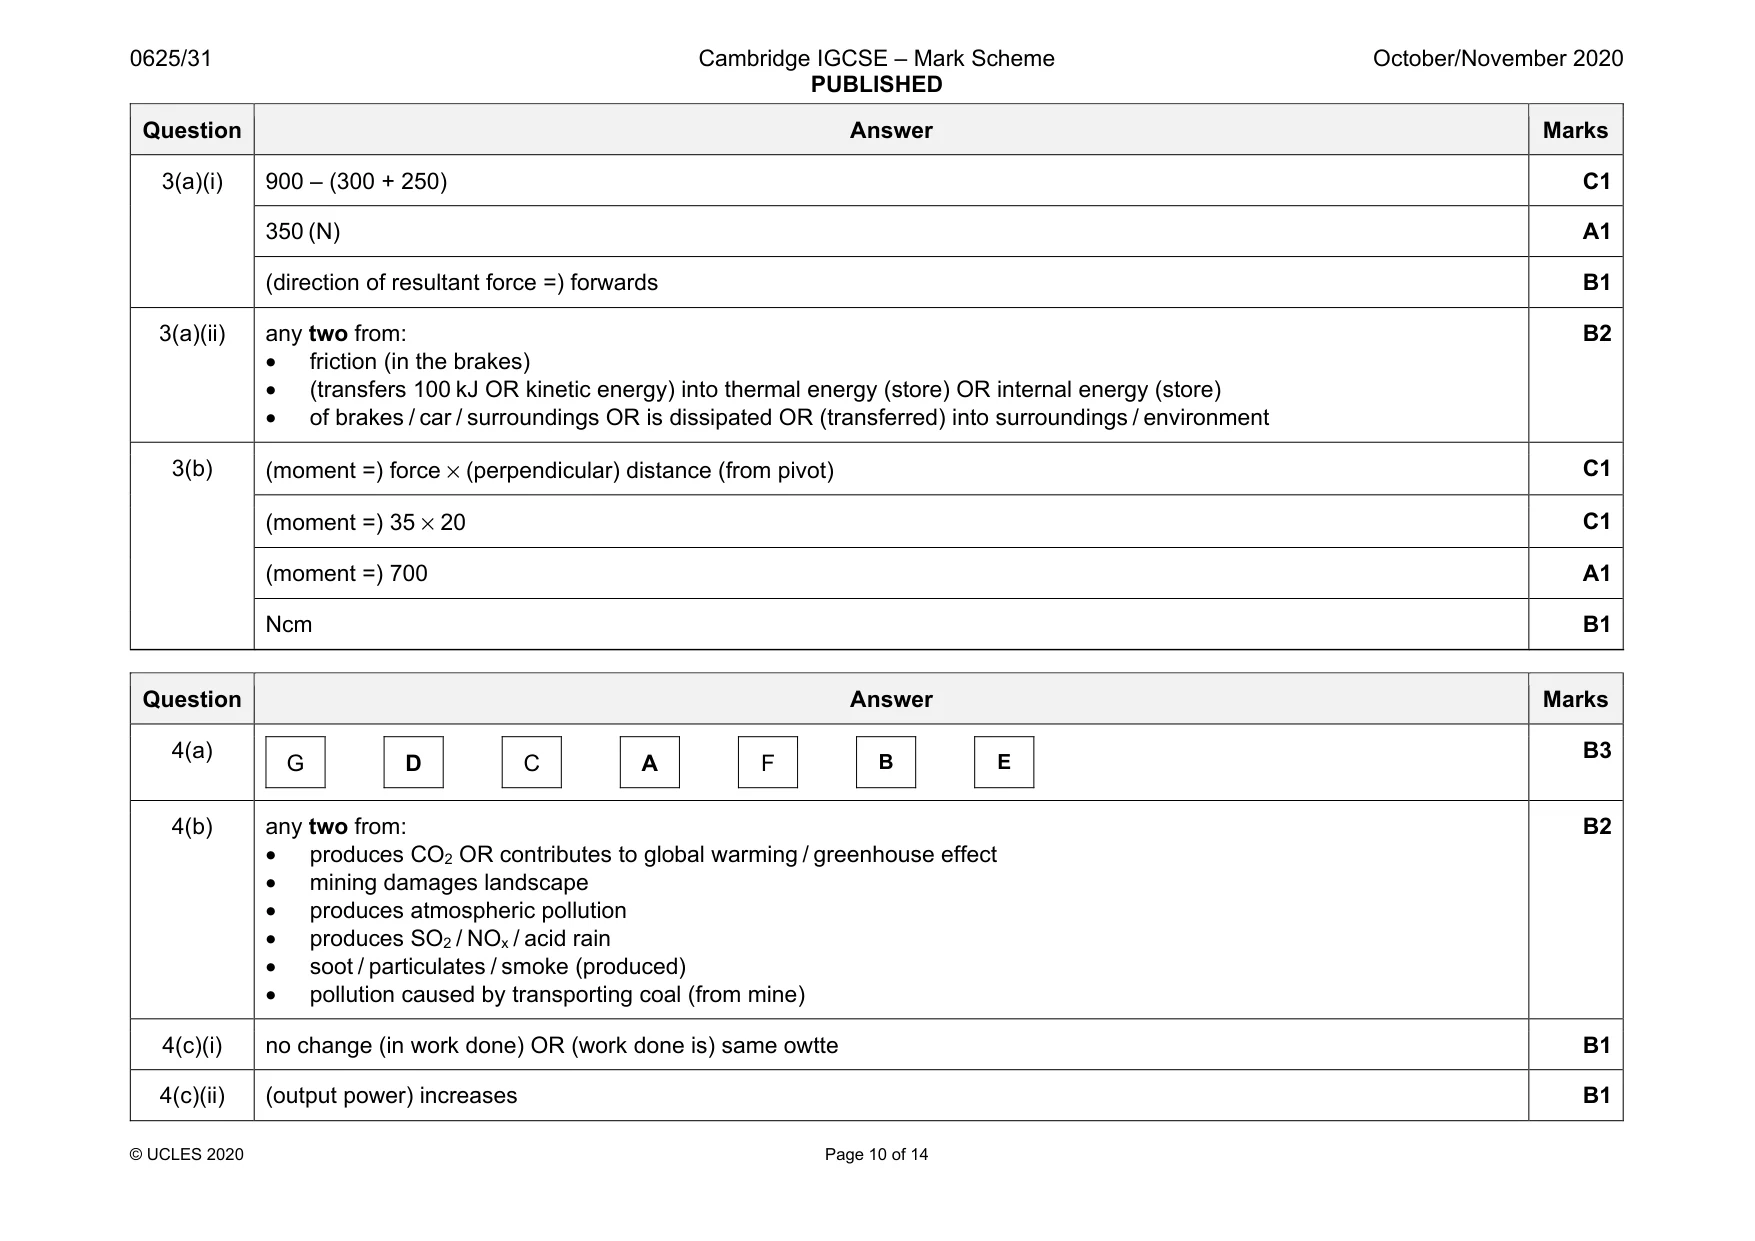
Mark scheme: 3(a)(i) 900 – (300 + 250) C1 350 (N) A1 (direction of resultant force =) forwards B1 3(a)(ii) any two from: • friction (in the brakes) • (transfers 100 kJ OR kinetic energy) into thermal energy (store) OR internal energy (store) • of brakes / car / surroundings OR is dissipated OR (transferred) into surroundings / environment B2 3(b) (moment =) force × (perpendicular) distance (from pivot) C1 (moment =) 35 × 20 C1 (moment =) 700 A1 Ncm B1
Q4 · Electrical energy is provided to homes and industry from a coal-fired power station
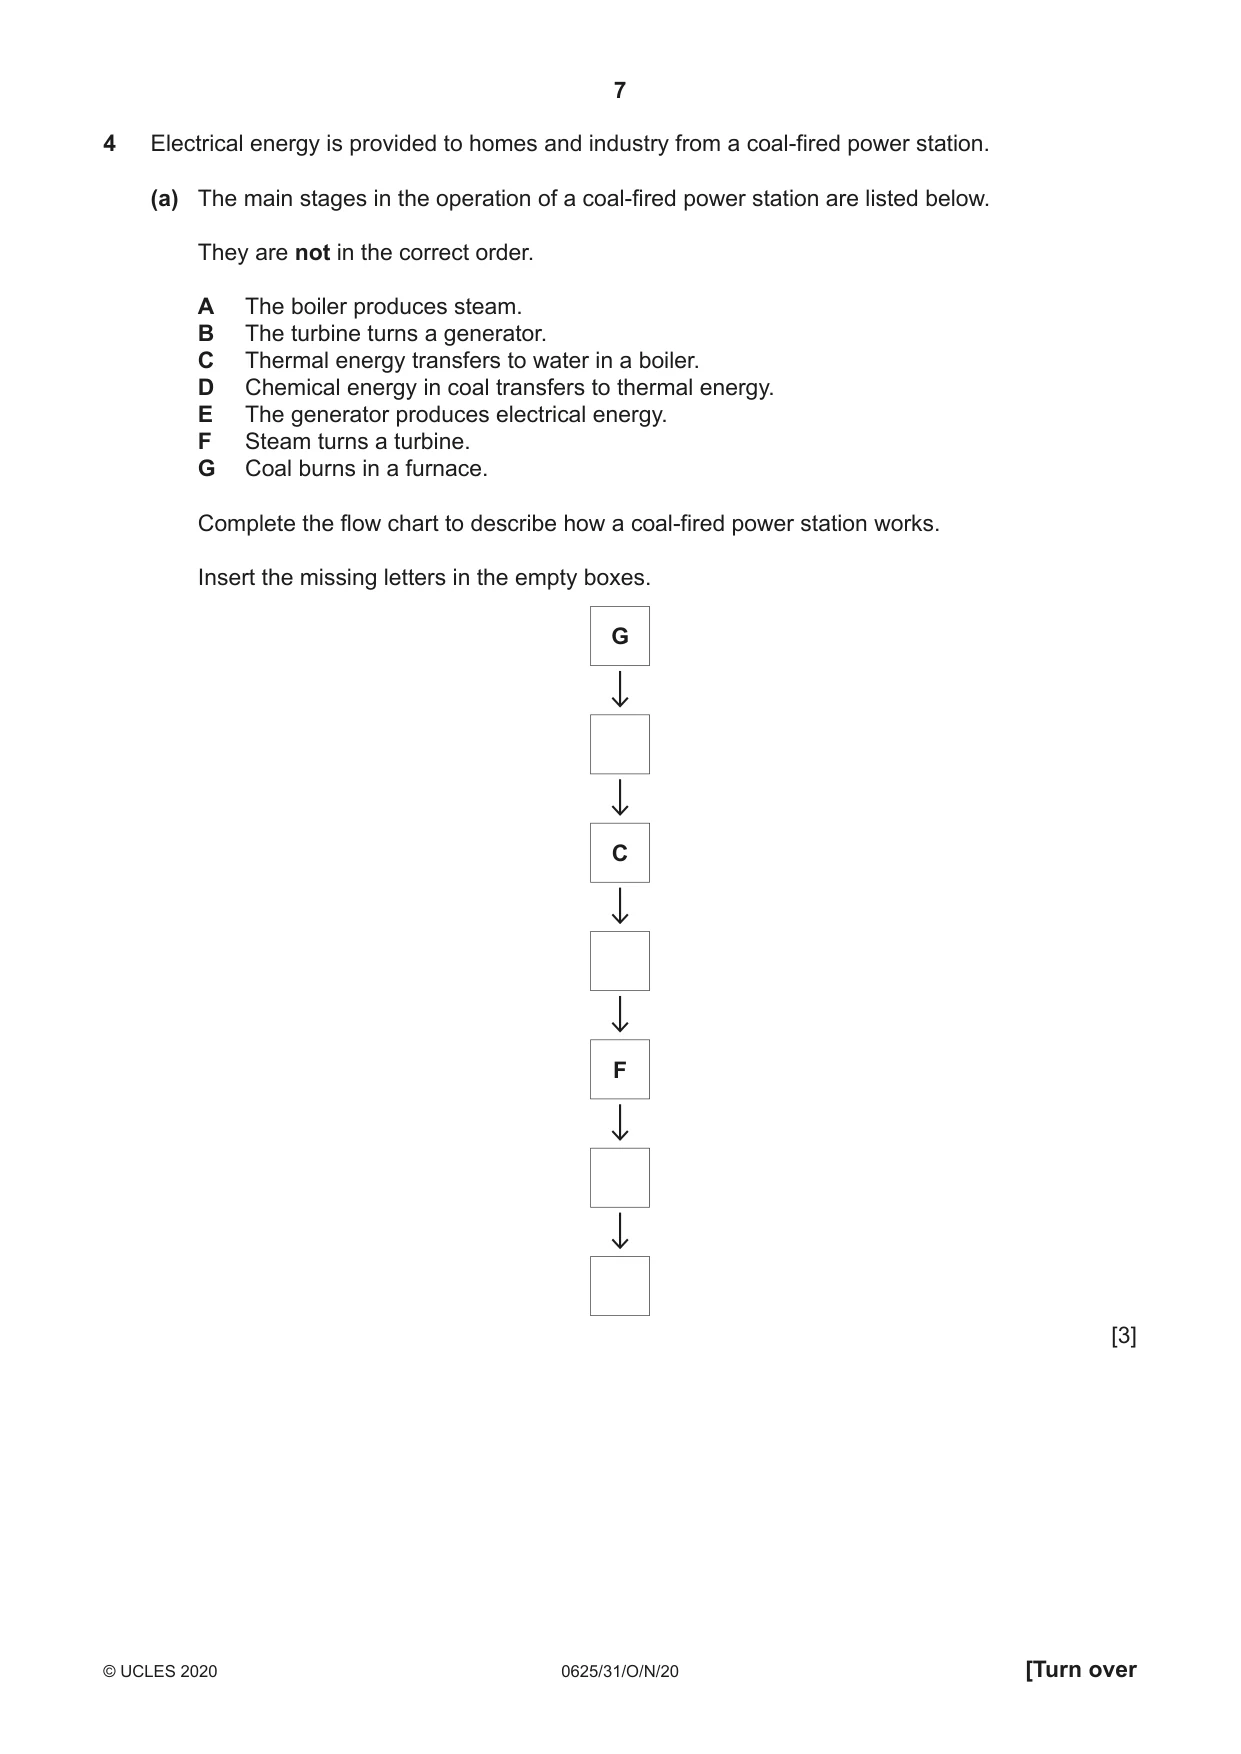
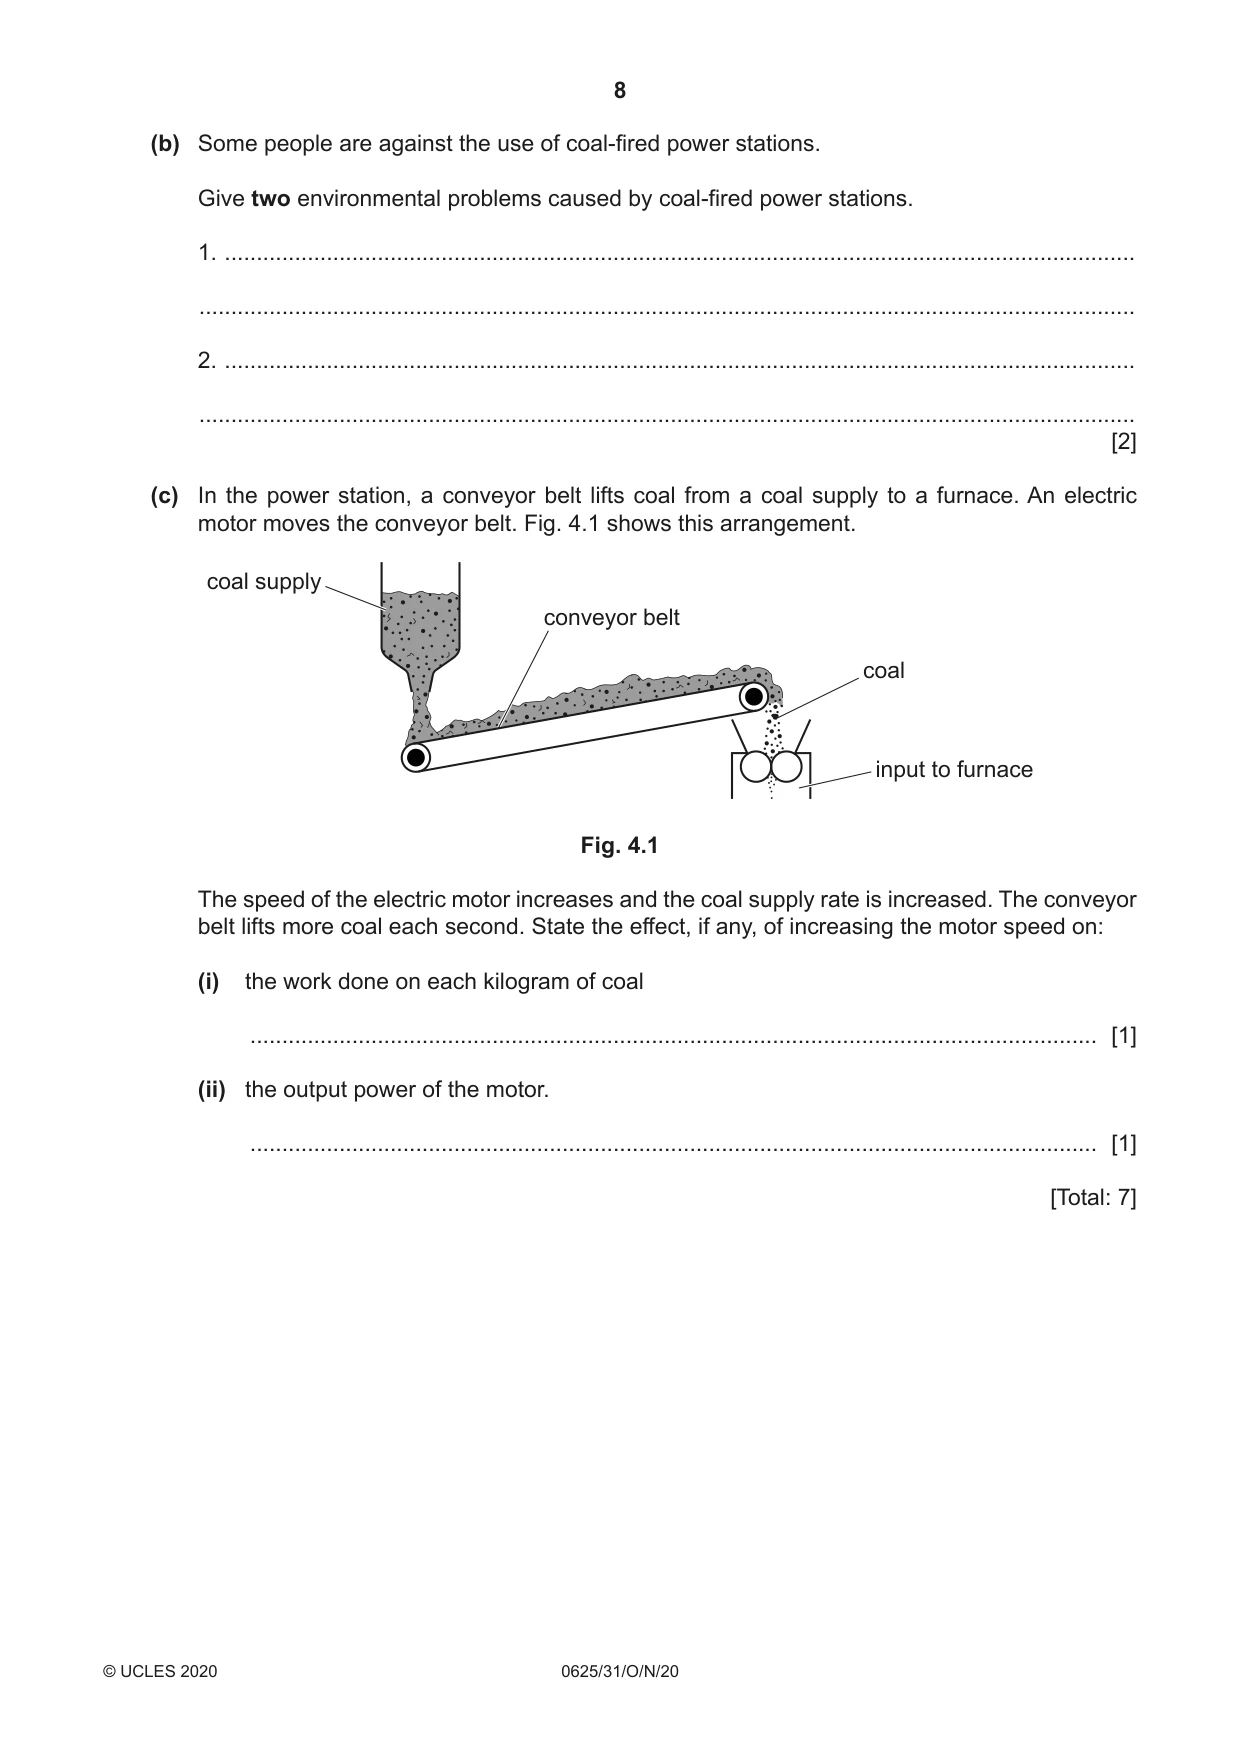
4 Electrical energy is provided to homes and industry from a coal-fired power station. (a) The main stages in the operation of a coal-fired power station are listed below. They are not in the correct order. A The boiler produces steam. B The turbine turns a generator. C Thermal energy transfers to water in a boiler. D Chemical energy in coal transfers to thermal energy. E The generator produces electrical energy. F Steam turns a turbine. G Coal burns in a furnace. Complete the flow chart to describe how a coal-fired power station works. Insert the missing letters in the empty boxes. G C F [3] (b) Some people are against the use of coal-fired power stations. Give two environmental problems caused by coal-fired power stations. 1. ............................................................................................................................................... ................................................................................................................................................... 2. ............................................................................................................................................... ................................................................................................................................................... [2] (c) In the power station, a conveyor belt lifts coal from a coal supply to a furnace. An electric motor moves the conveyor belt. Fig. 4.1 shows this arrangement. coal supply conveyor belt coal input to furnace Fig. 4.1 The speed of the electric motor increases and the coal supply rate is increased. The conveyor belt lifts more coal each second. State the effect, if any, of increasing the motor speed on: (i) the work done on each kilogram of coal ..................................................................................................................................... [1] (ii) the output power of the motor. ..................................................................................................................................... [1] [Total: 7]
Mark scheme: 4(a) G D C A F B E B3 4(b) any two from: • produces CO2 OR contributes to global warming / greenhouse effect • mining damages landscape • produces atmospheric pollution • produces SO2 / NOx / acid rain • soot / particulates / smoke (produced) • pollution caused by transporting coal (from mine) B2 4(c)(i) no change (in work done) OR (work done is) same owtte B1 4(c)(ii) (output power) increases B1
Q5 · A steel container fitted with a liquid manometer
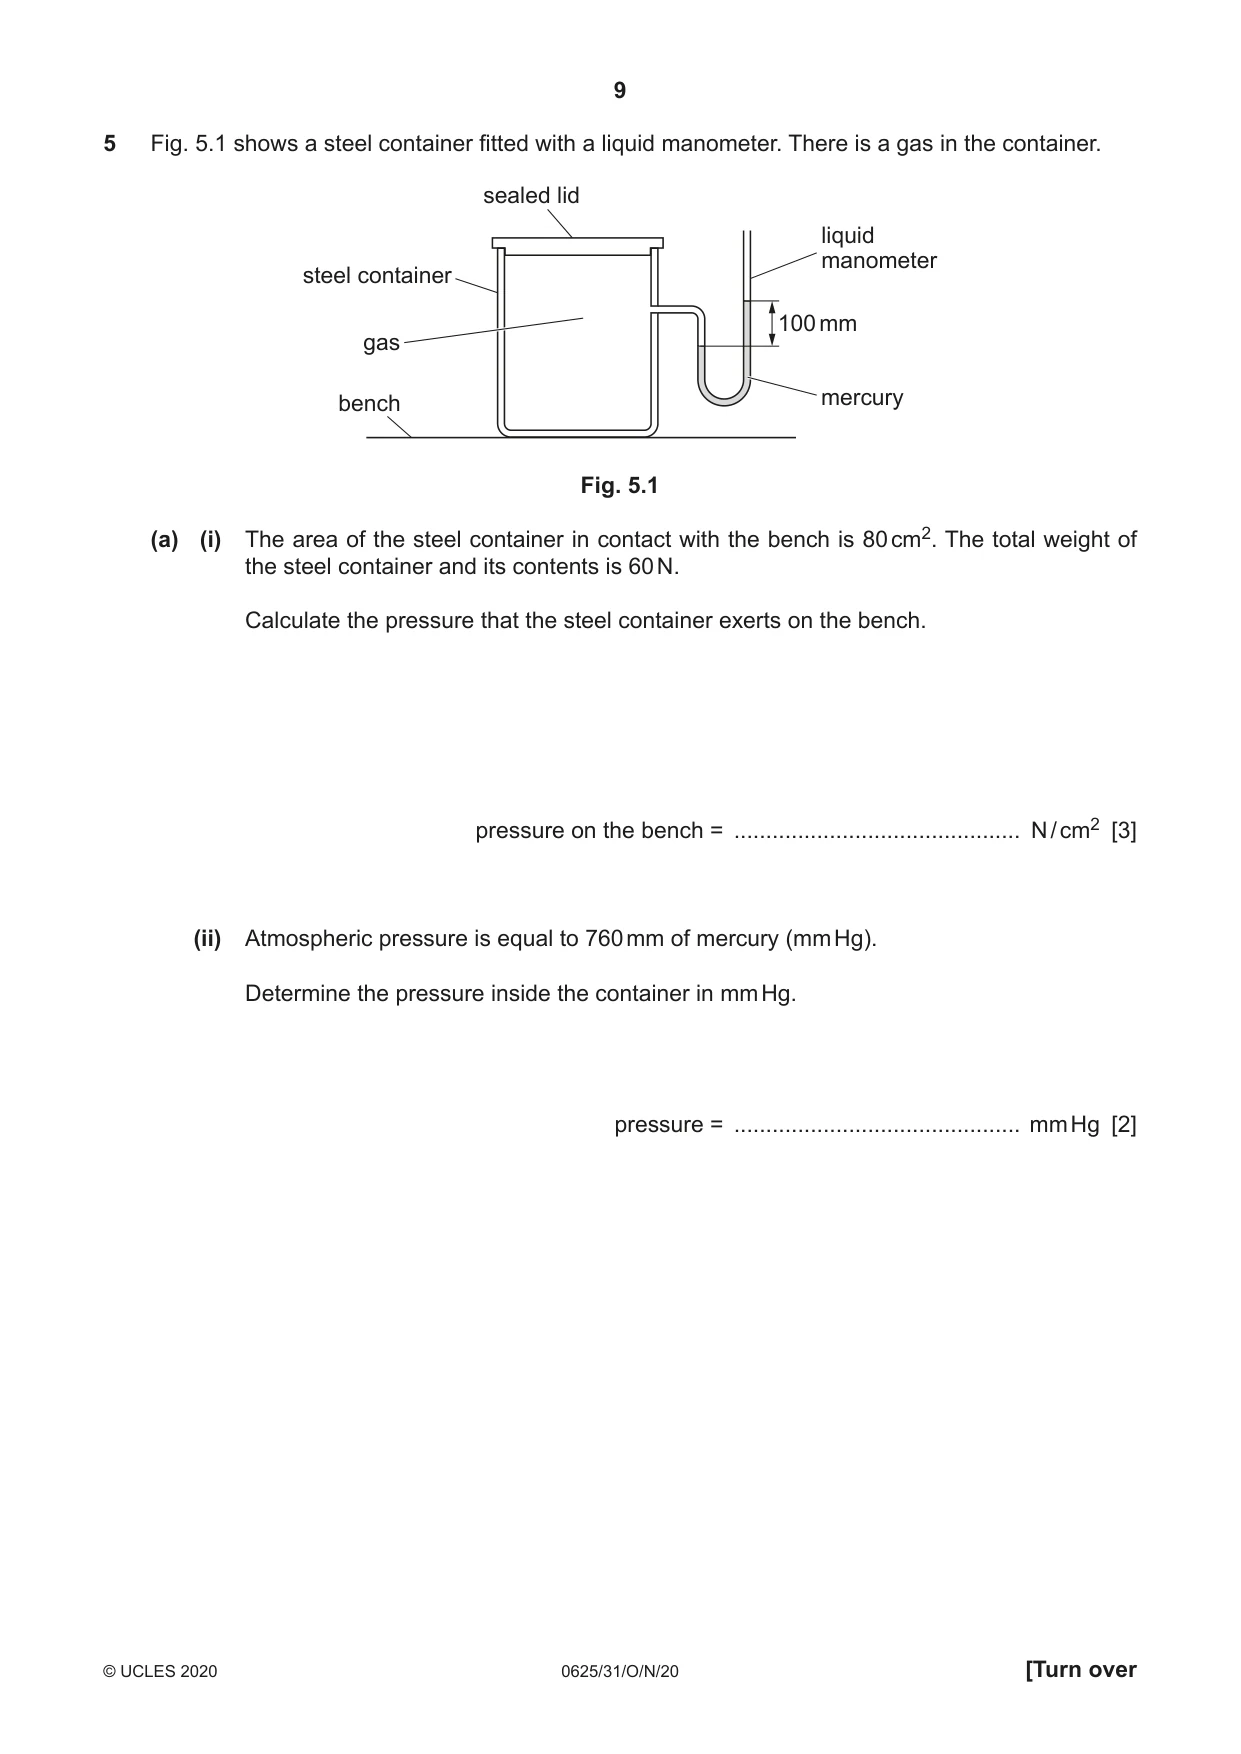
5 Fig. 5.1 shows a steel container fitted with a liquid manometer. There is a gas in the container. sealed lid liquid manometer steel container 100 mm gas bench mercury Fig. 5.1 (a) (i) The area of the steel container in contact with the bench is 80 cm2. The total weight of the steel container and its contents is 60 N. Calculate the pressure that the steel container exerts on the bench. pressure on the bench = ............................................. N / cm2 [3] (ii) Atmospheric pressure is equal to 760 mm of mercury (mm Hg). Determine the pressure inside the container in mm Hg. pressure = ............................................. mm Hg [2] (b) The temperature of the gas inside the steel container decreases. State and explain how the pressure of the gas changes as the temperature of the gas decreases. Use your ideas about molecules in your answer. ................................................................................................................................................... ................................................................................................................................................... ................................................................................................................................................... ................................................................................................................................................... ................................................................................................................................................... ............................................................................................................................................. [3] [Total: 8]
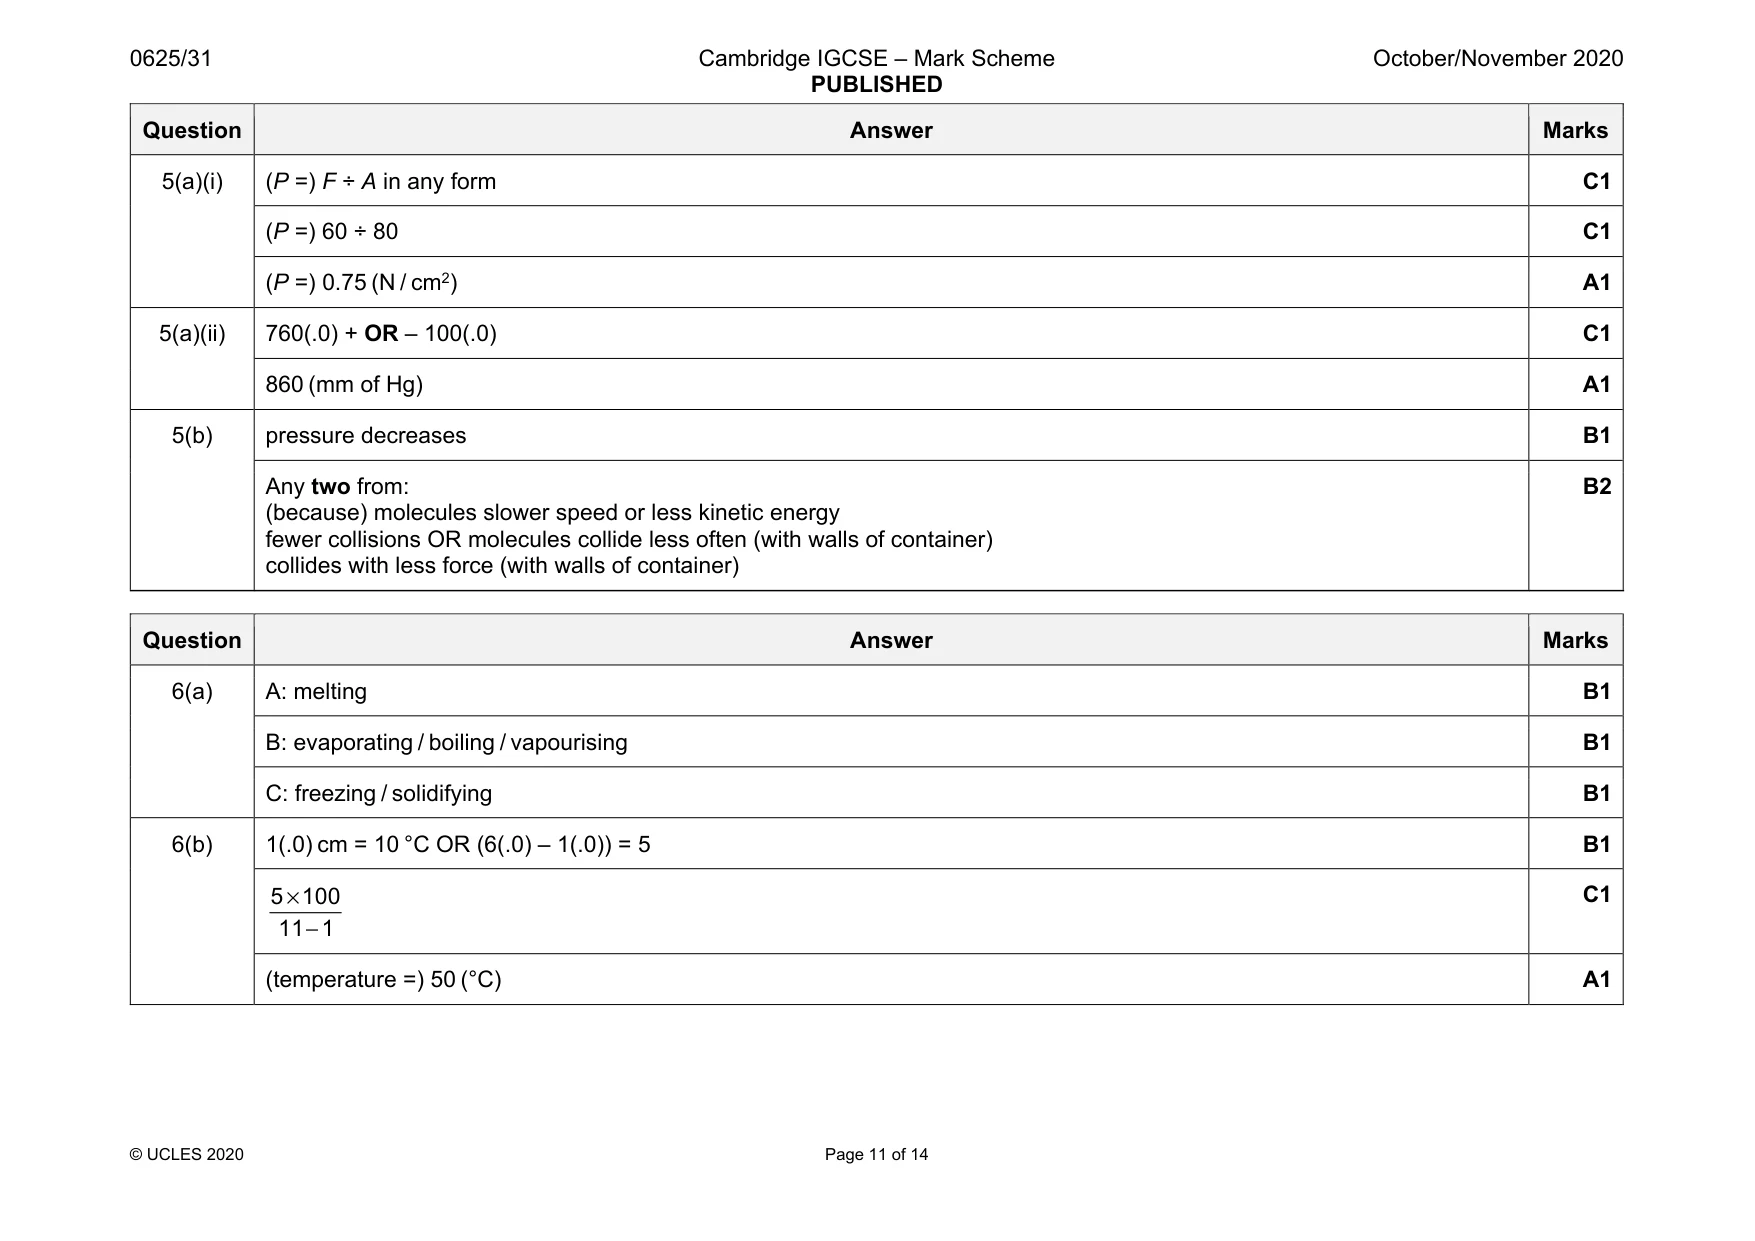
Mark scheme: 5(a)(i) (P =) F ÷ A in any form C1 (P =) 60 ÷ 80 C1 (P =) 0.75 (N / cm2) A1 5(a)(ii) 760(.0) + OR – 100(.0) C1 860 (mm of Hg) A1 5(b) pressure decreases B1 Any two from: (because) molecules slower speed or less kinetic energy fewer collisions OR molecules collide less often (with walls of container) collides with less force (with walls of container) B2
Q6 · Three changes of state
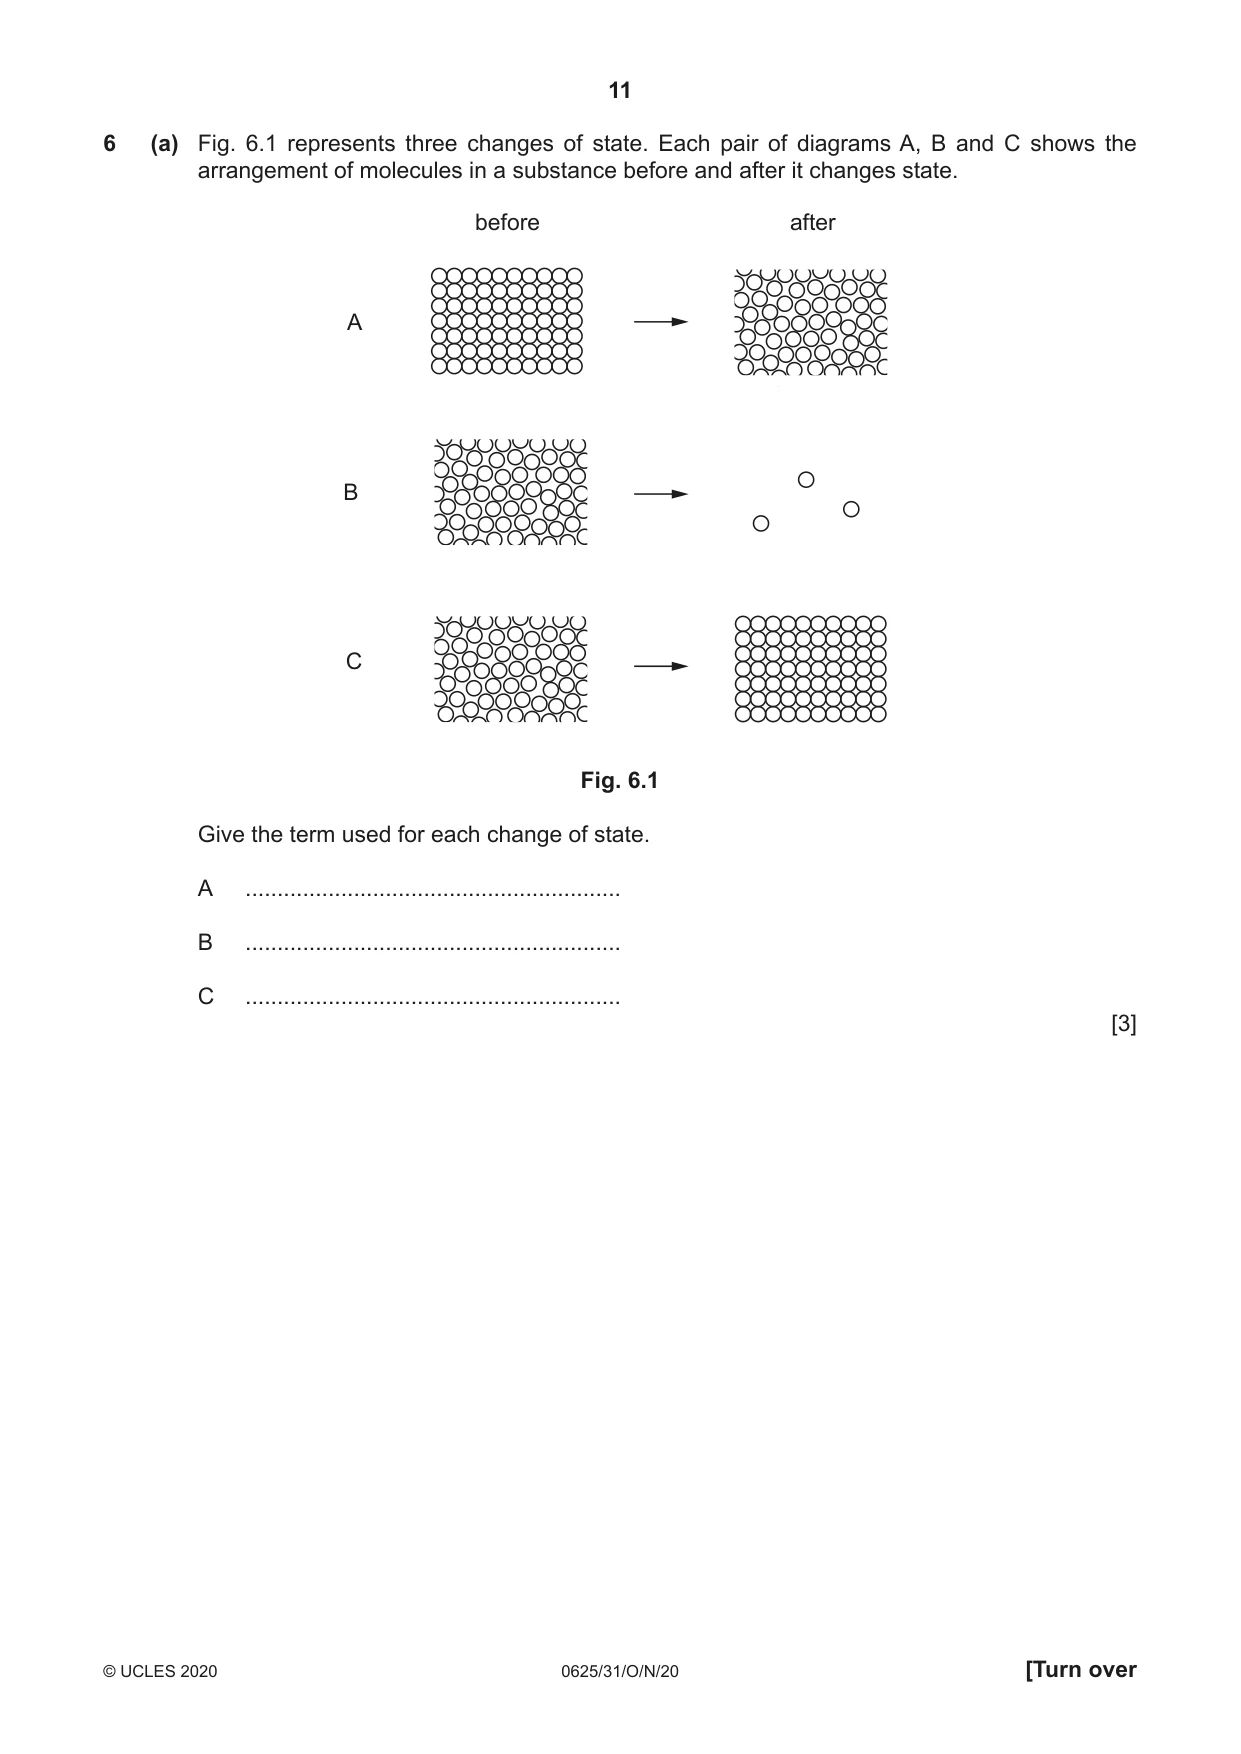
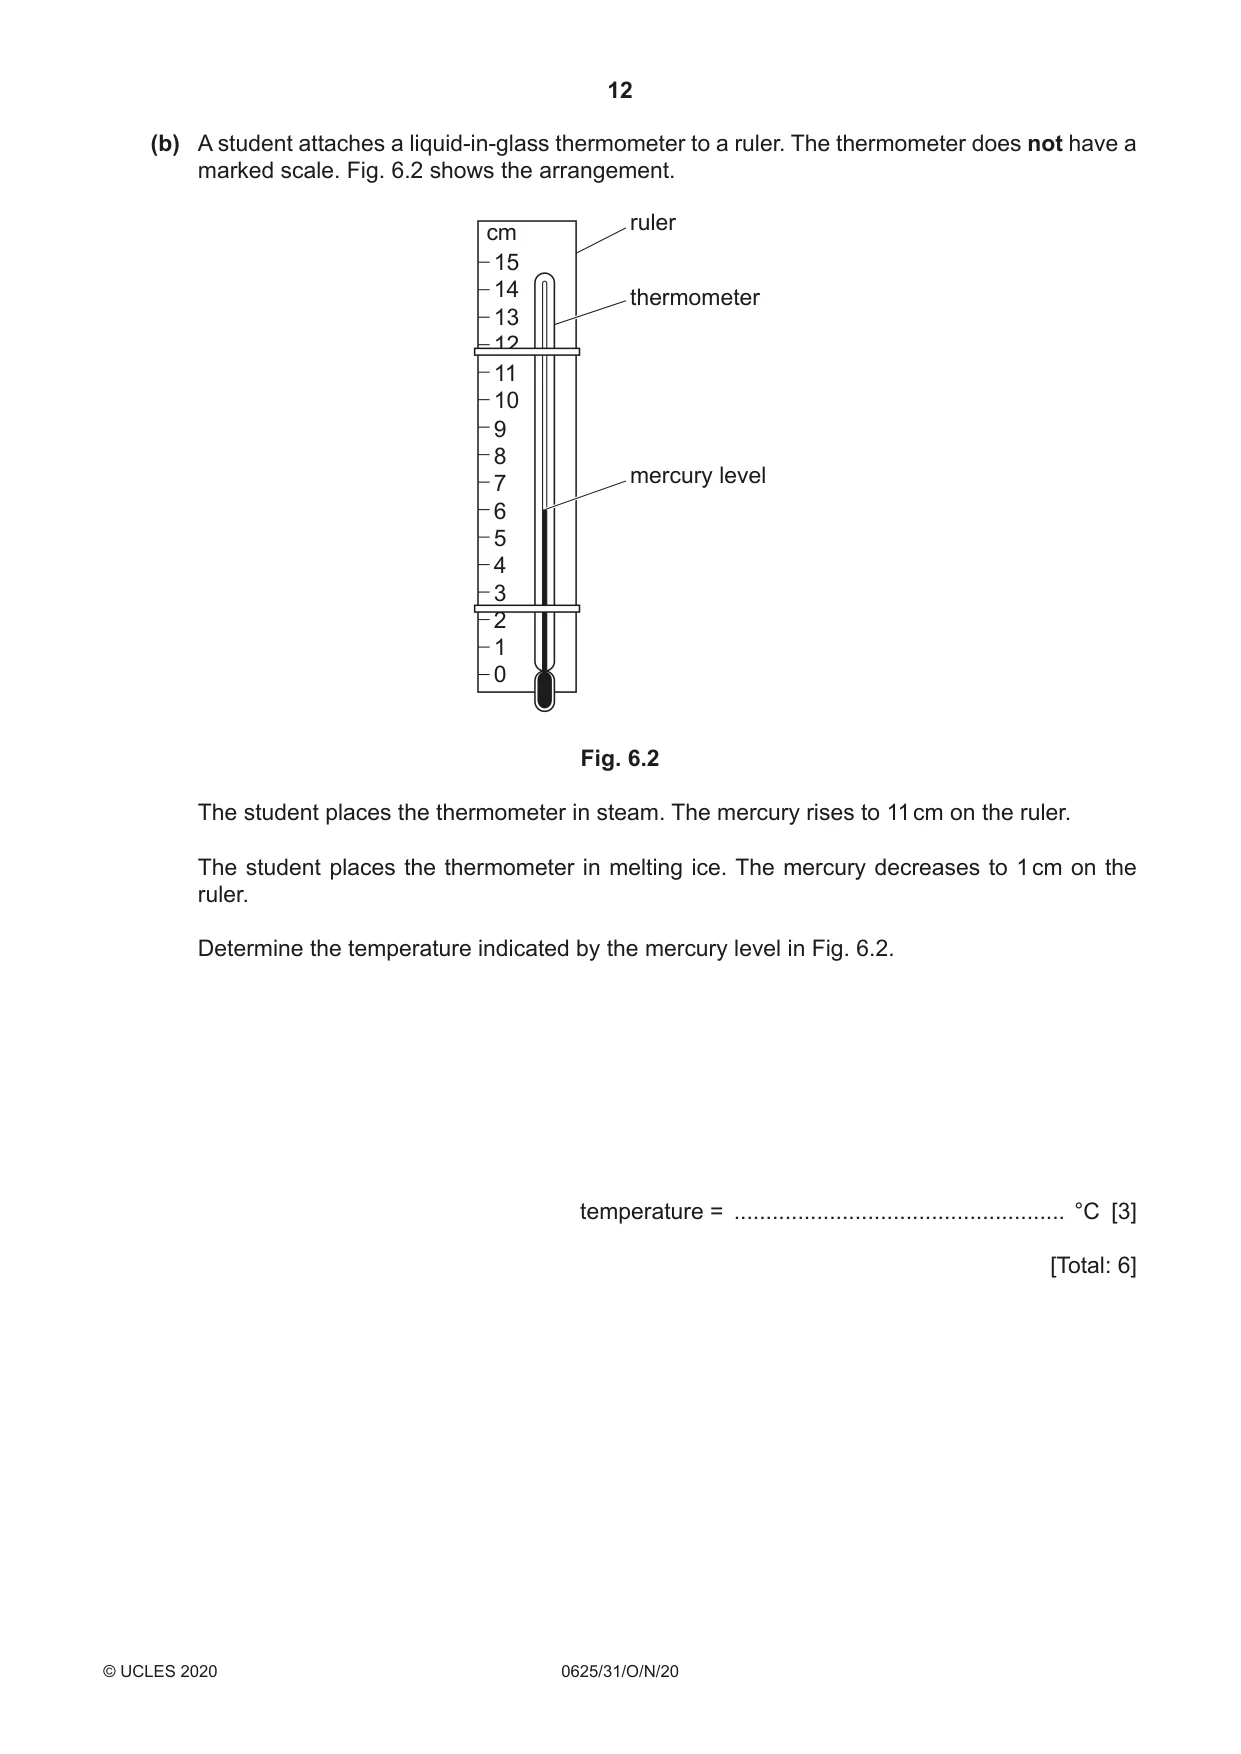
6 (a) Fig. 6.1 represents three changes of state. Each pair of diagrams A, B and C shows the arrangement of molecules in a substance before and after it changes state. before after A B C Fig. 6.1 Give the term used for each change of state. A ........................................................... B ........................................................... C ........................................................... [3] (b) A student attaches a liquid-in-glass thermometer to a ruler. The thermometer does not have a marked scale. Fig. 6.2 shows the arrangement. ruler cm 15 14 thermometer 13 12 11 10 9 8 mercury level 7 6 5 4 3 2 1 0 Fig. 6.2 The student places the thermometer in steam. The mercury rises to 11 cm on the ruler. The student places the thermometer in melting ice. The mercury decreases to 1 cm on the ruler. Determine the temperature indicated by the mercury level in Fig. 6.2. temperature = .................................................... °C [3] [Total: 6]
Mark scheme: 6(a) A: melting B1 B: evaporating / boiling / vapourising B1 C: freezing / solidifying B1 6(b) 1(.0) cm = 10 °C OR (6(.0) – 1(.0)) = 5 B1 × − 5 100 11 1 C1 (temperature =) 50 (°C) A1
Q7 · A ray of light incident on a plane mirror at point X
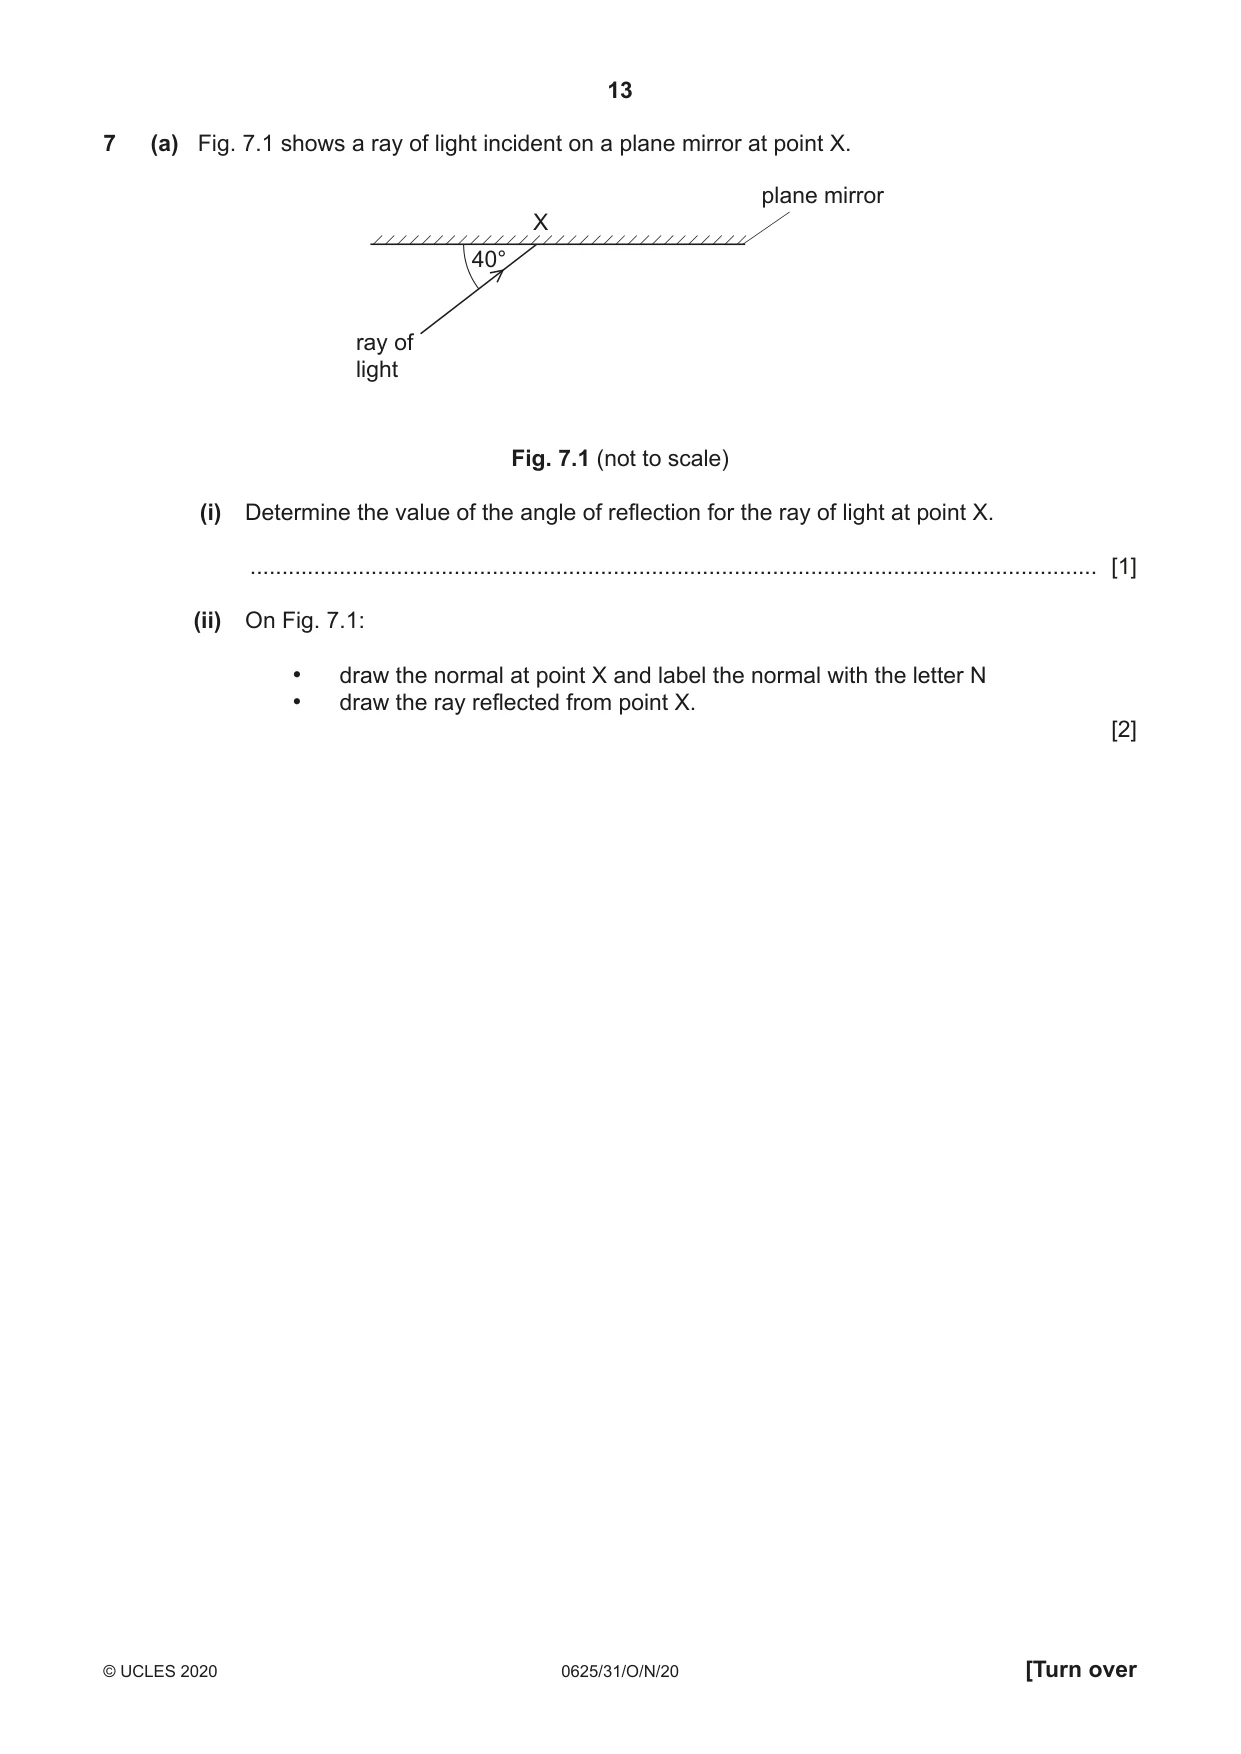
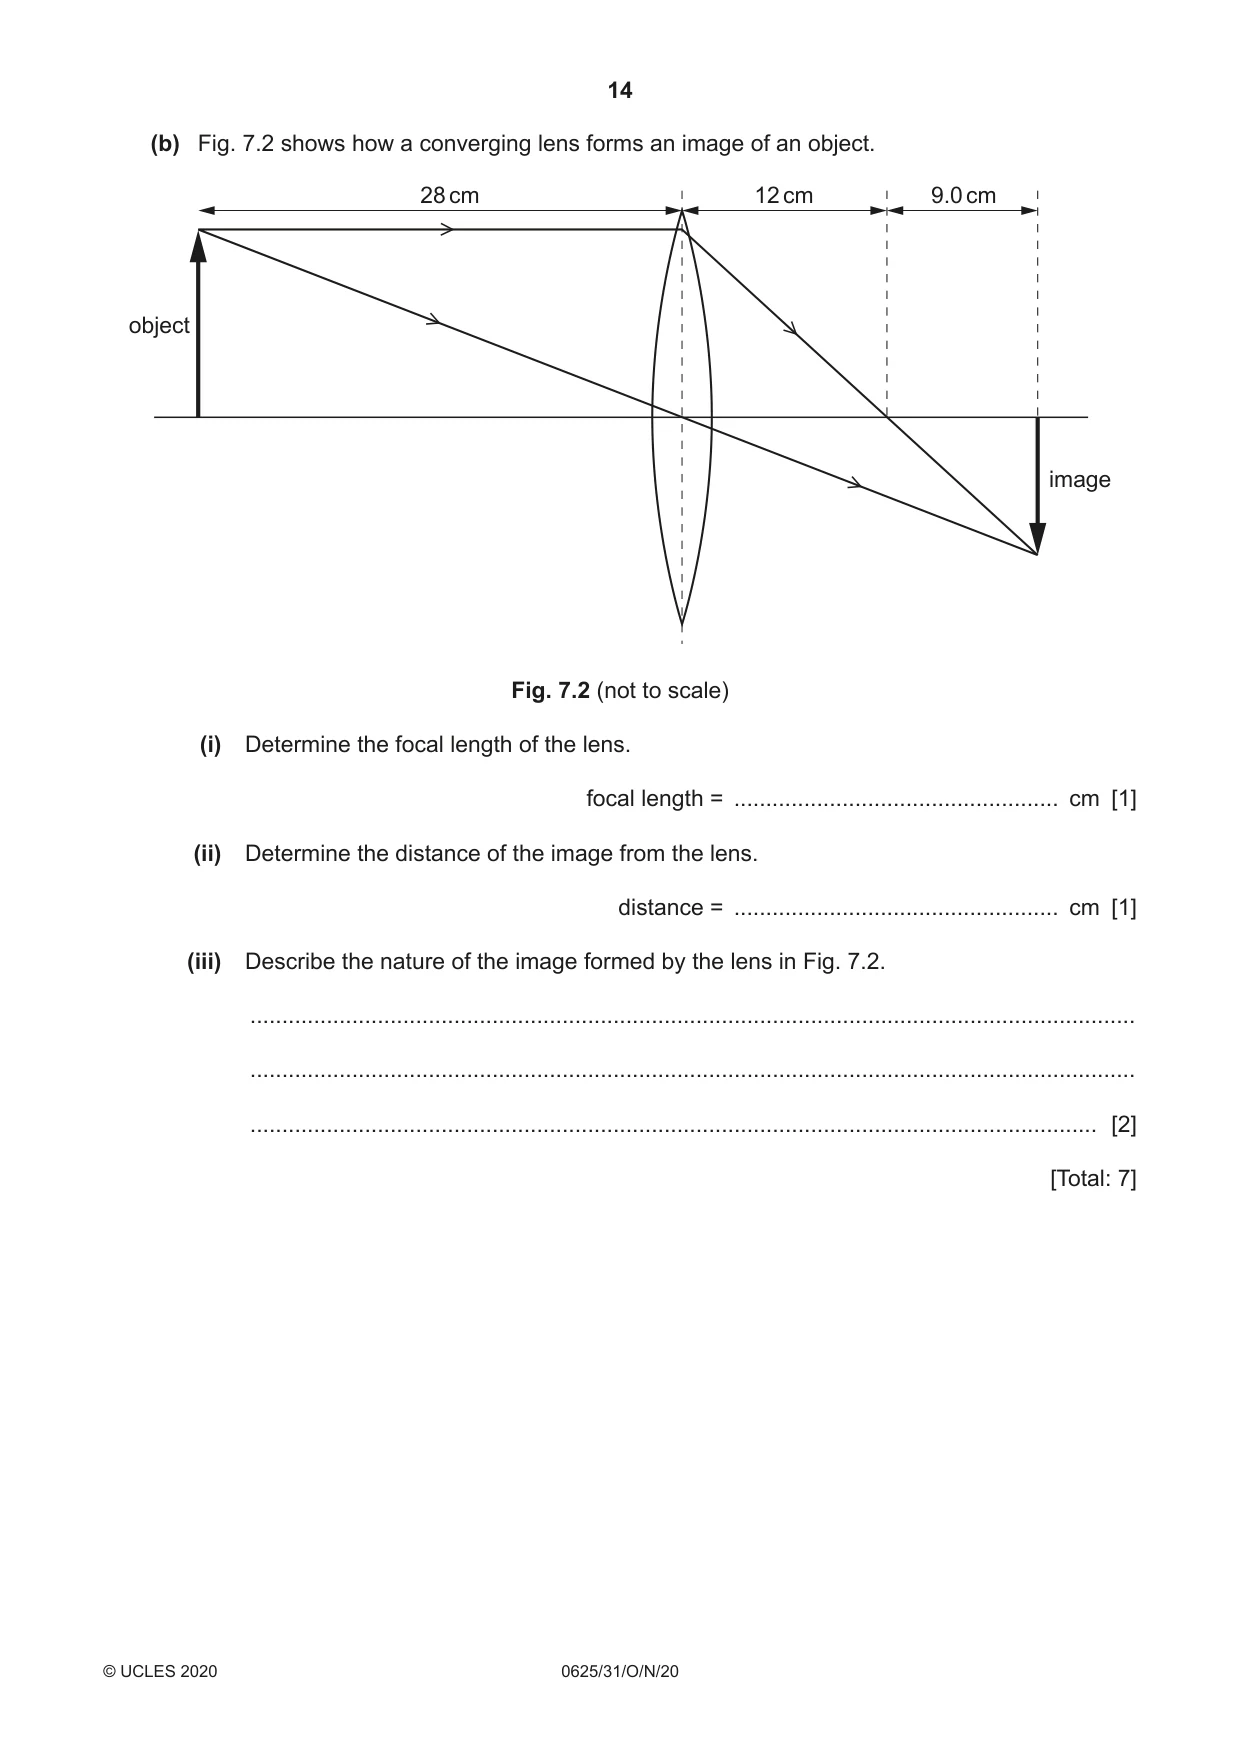
7 (a) Fig. 7.1 shows a ray of light incident on a plane mirror at point X. plane mirror X 40° ray of light Fig. 7.1 (not to scale) (i) Determine the value of the angle of reflection for the ray of light at point X. ..................................................................................................................................... [1] (ii) On Fig. 7.1: • draw the normal at point X and label the normal with the letter N • draw the ray reflected from point X. [2] (b) Fig. 7.2 shows how a converging lens forms an image of an object. 28 cm 12 cm 9.0 cm object image Fig. 7.2 (not to scale) (i) Determine the focal length of the lens. focal length = ................................................... cm [1] (ii) Determine the distance of the image from the lens. distance = ................................................... cm [1] (iii) Describe the nature of the image formed by the lens in Fig. 7.2. ........................................................................................................................................... ........................................................................................................................................... ..................................................................................................................................... [2] [Total: 7]
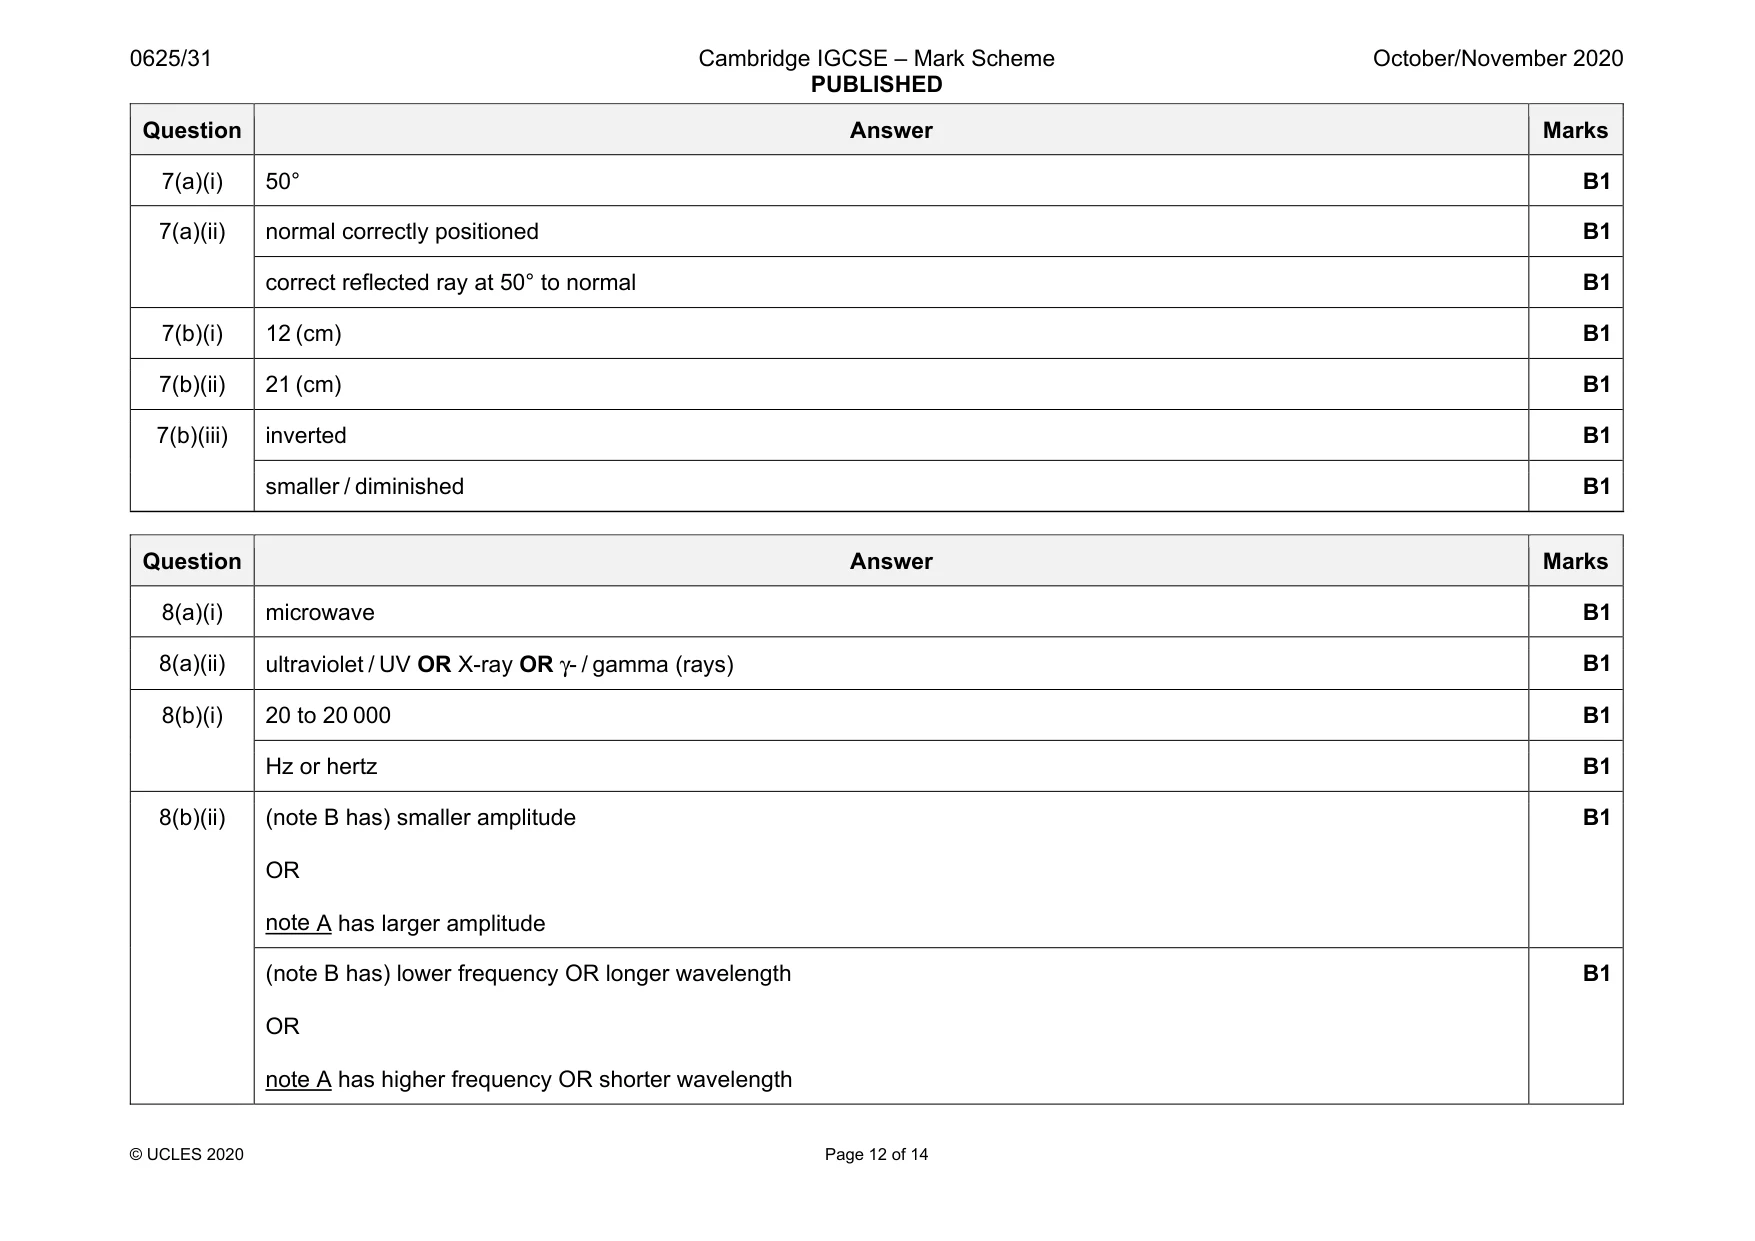
Mark scheme: 7(a)(i) 50° B1 7(a)(ii) normal correctly positioned B1 correct reflected ray at 50° to normal B1 7(b)(i) 12 (cm) B1 7(b)(ii) 21 (cm) B1 7(b)(iii) inverted B1 smaller / diminished B1
Q8 · A mobile (cell) phone
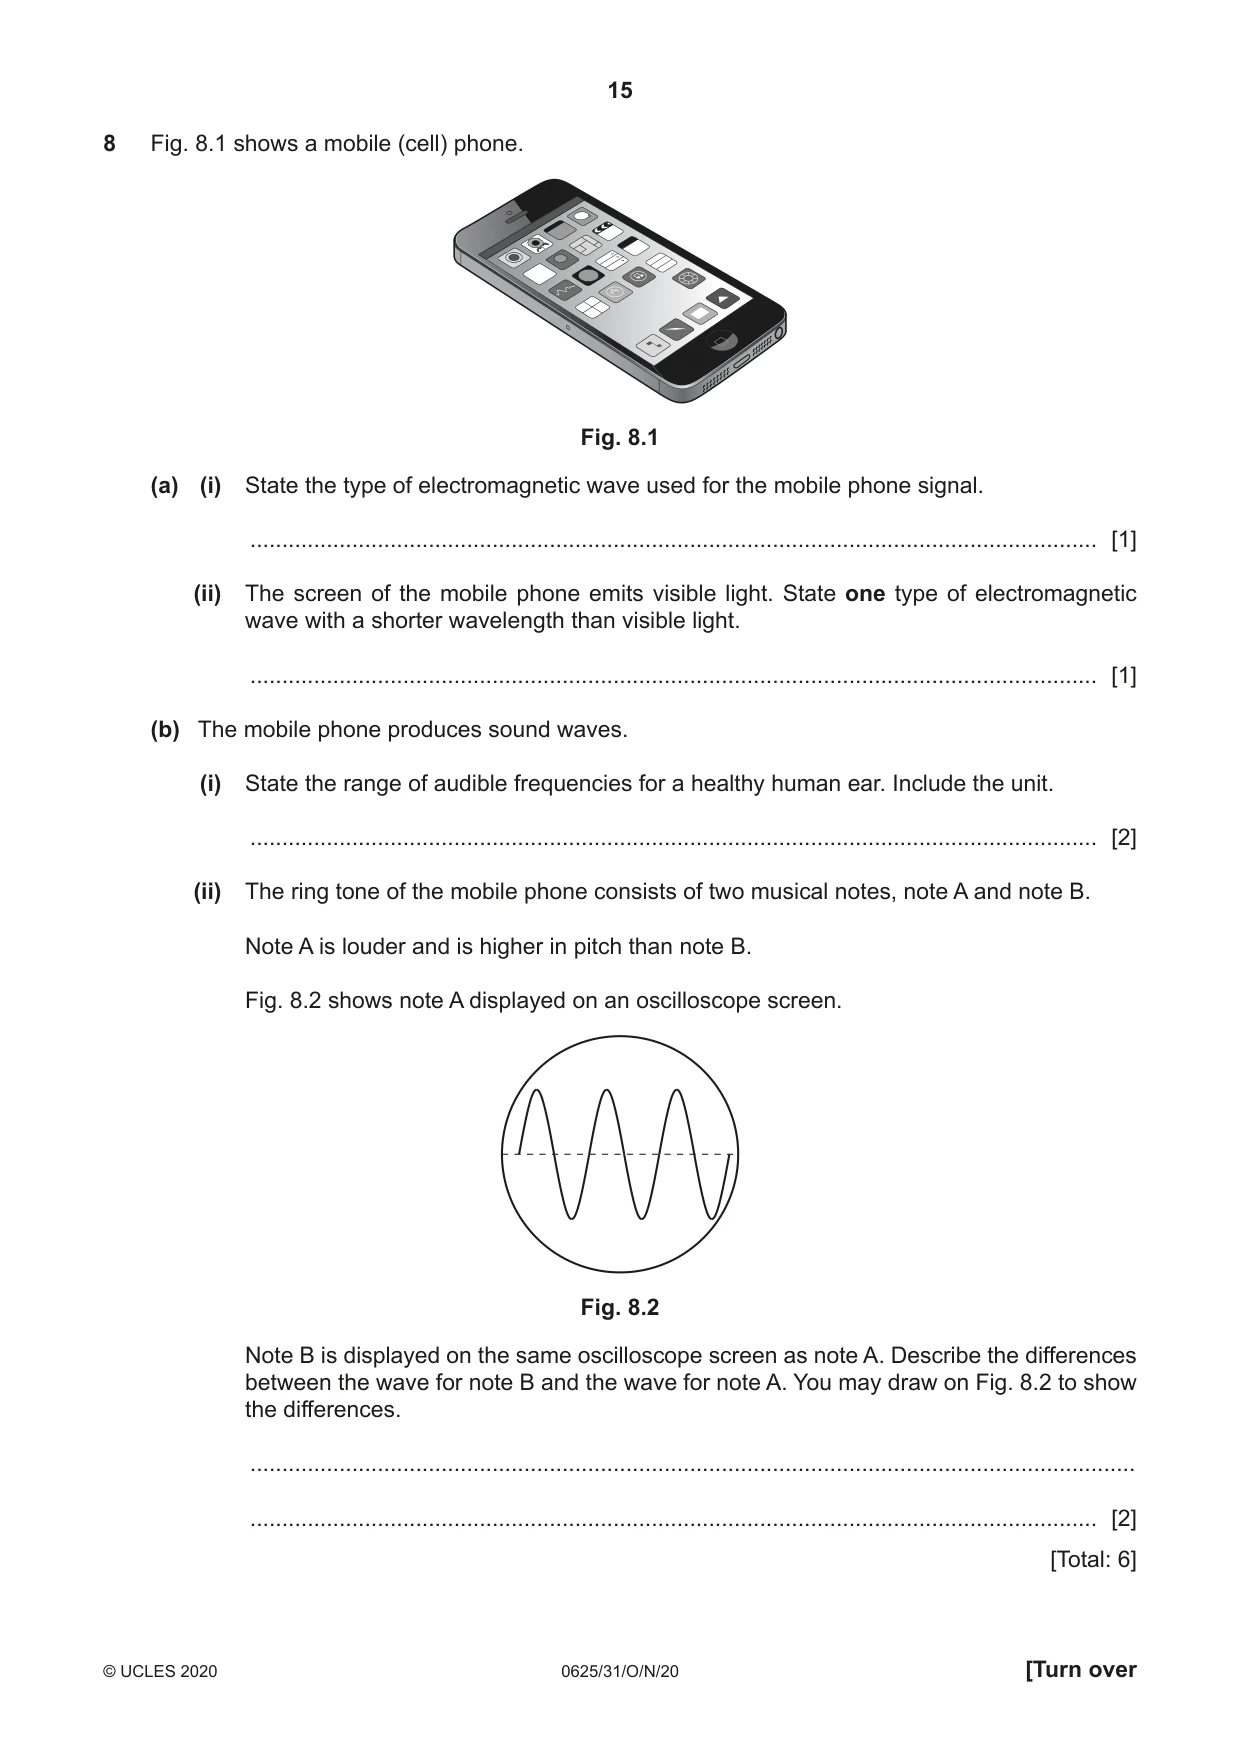
8 Fig. 8.1 shows a mobile (cell) phone. Fig. 8.1 (a) (i) State the type of electromagnetic wave used for the mobile phone signal. ..................................................................................................................................... [1] (ii) The screen of the mobile phone emits visible light. State one type of electromagnetic wave with a shorter wavelength than visible light. ..................................................................................................................................... [1] (b) The mobile phone produces sound waves. (i) State the range of audible frequencies for a healthy human ear. Include the unit. ..................................................................................................................................... [2] (ii) The ring tone of the mobile phone consists of two musical notes, note A and note B. Note A is louder and is higher in pitch than note B. Fig. 8.2 shows note A displayed on an oscilloscope screen. Fig. 8.2 Note B is displayed on the same oscilloscope screen as note A. Describe the differences between the wave for note B and the wave for note A. You may draw on Fig. 8.2 to show the differences. ........................................................................................................................................... ..................................................................................................................................... [2] [Total: 6]
Mark scheme: 8(a)(i) microwave B1 8(a)(ii) ultraviolet / UV OR X-ray OR γ- / gamma (rays) B1 8(b)(i) 20 to 20 000 B1 Hz or hertz B1 8(b)(ii) (note B has) smaller amplitude OR note A has larger amplitude B1 (note B has) lower frequency OR longer wavelength OR note A has higher frequency OR shorter wavelength B1
Q9 · A student has a permanent bar magnet and two metal bars, as shown in Fig
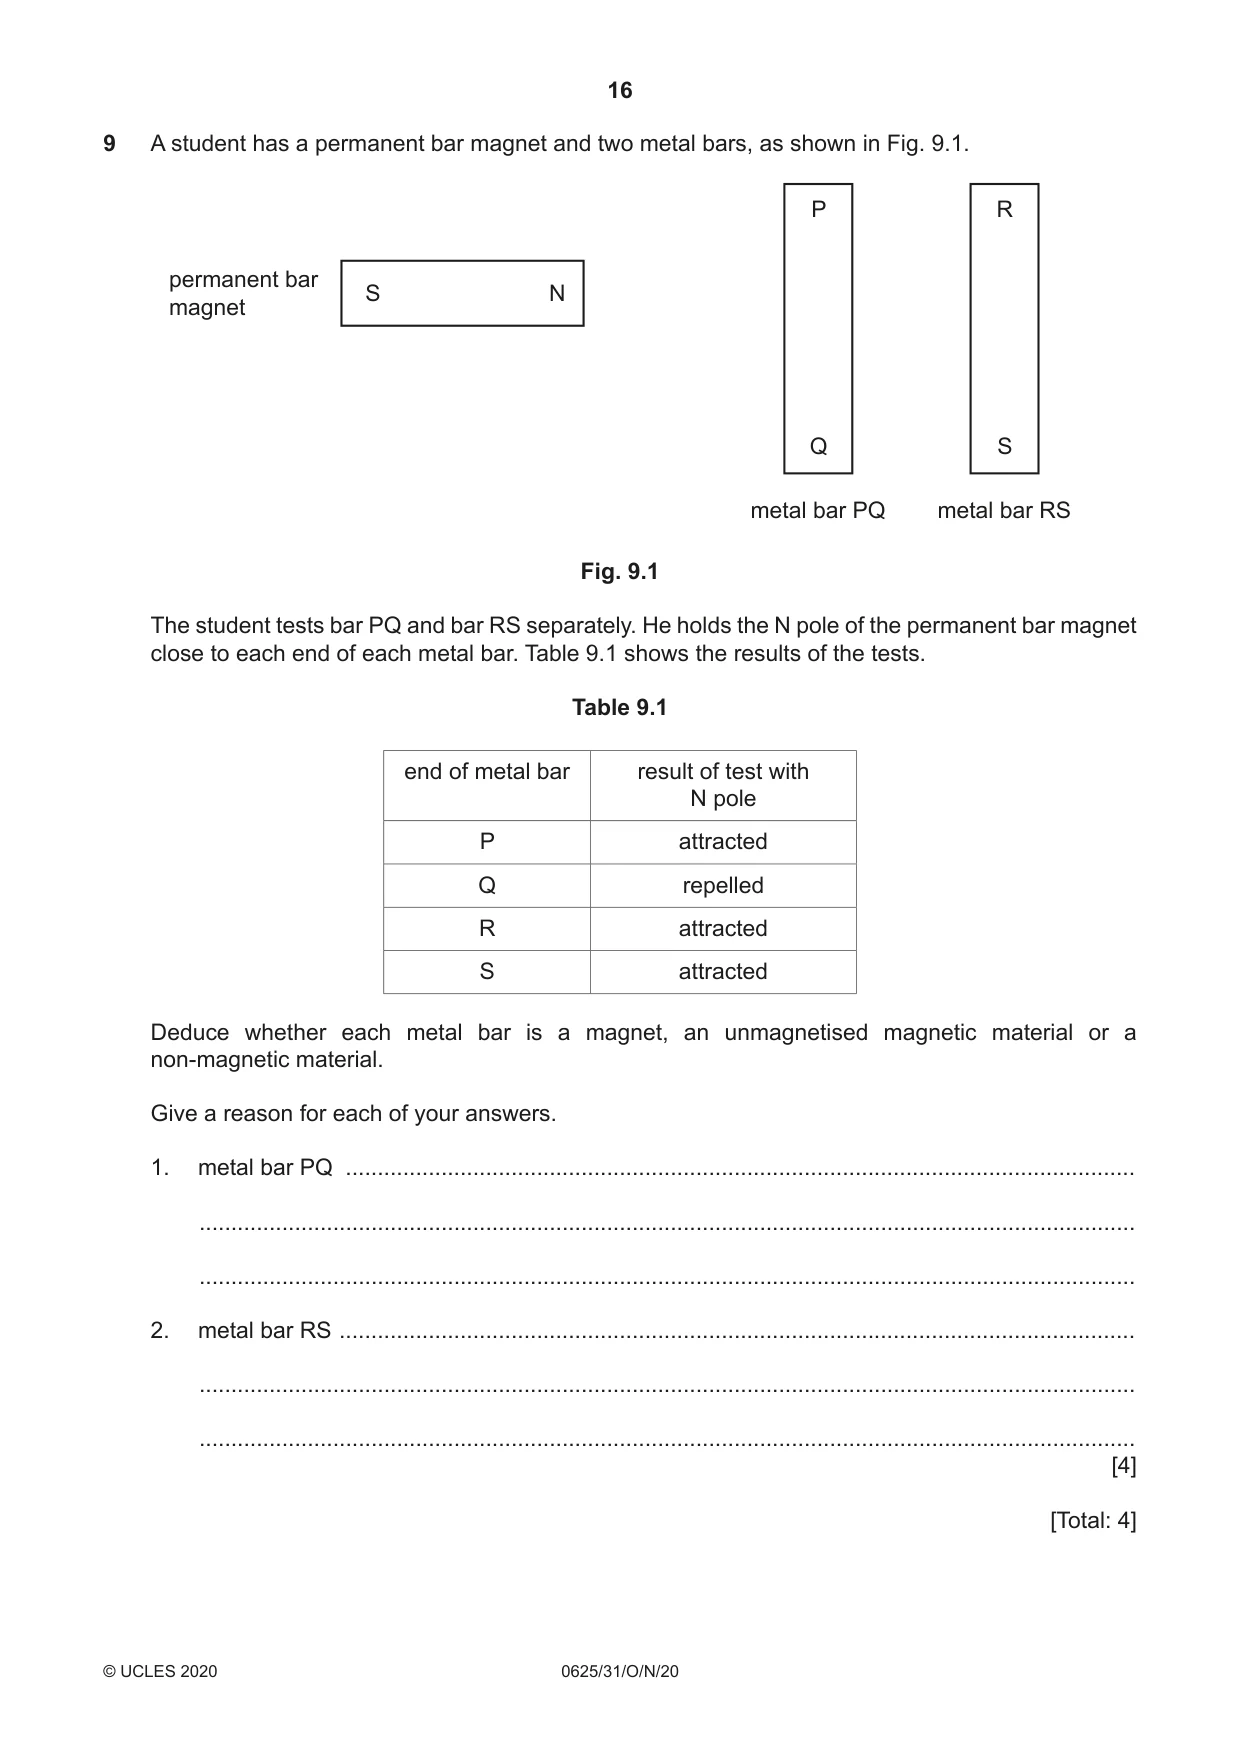
9 A student has a permanent bar magnet and two metal bars, as shown in Fig. 9.1. P R permanent bar S N magnet Q S metal bar PQ metal bar RS Fig. 9.1 The student tests bar PQ and bar RS separately. He holds the N pole of the permanent bar magnet close to each end of each metal bar. Table 9.1 shows the results of the tests. Table 9.1 end of metal bar result of test with N pole P attracted Q repelled R attracted S attracted Deduce whether each metal bar is a magnet, an unmagnetised magnetic material or a non-magnetic material. Give a reason for each of your answers. 1. metal bar PQ ............................................................................................................................ ................................................................................................................................................... ................................................................................................................................................... 2. metal bar RS ............................................................................................................................. ................................................................................................................................................... ................................................................................................................................................... [4] [Total: 4]
Mark scheme: 9 1 (bar P–Q is a) (permanent) magnet M1 (because magnet) repels end Q A1 2 (bar R–S is an) unmagnetised magnetic material M1 (because magnet) attracts both ends (of R–S) A1
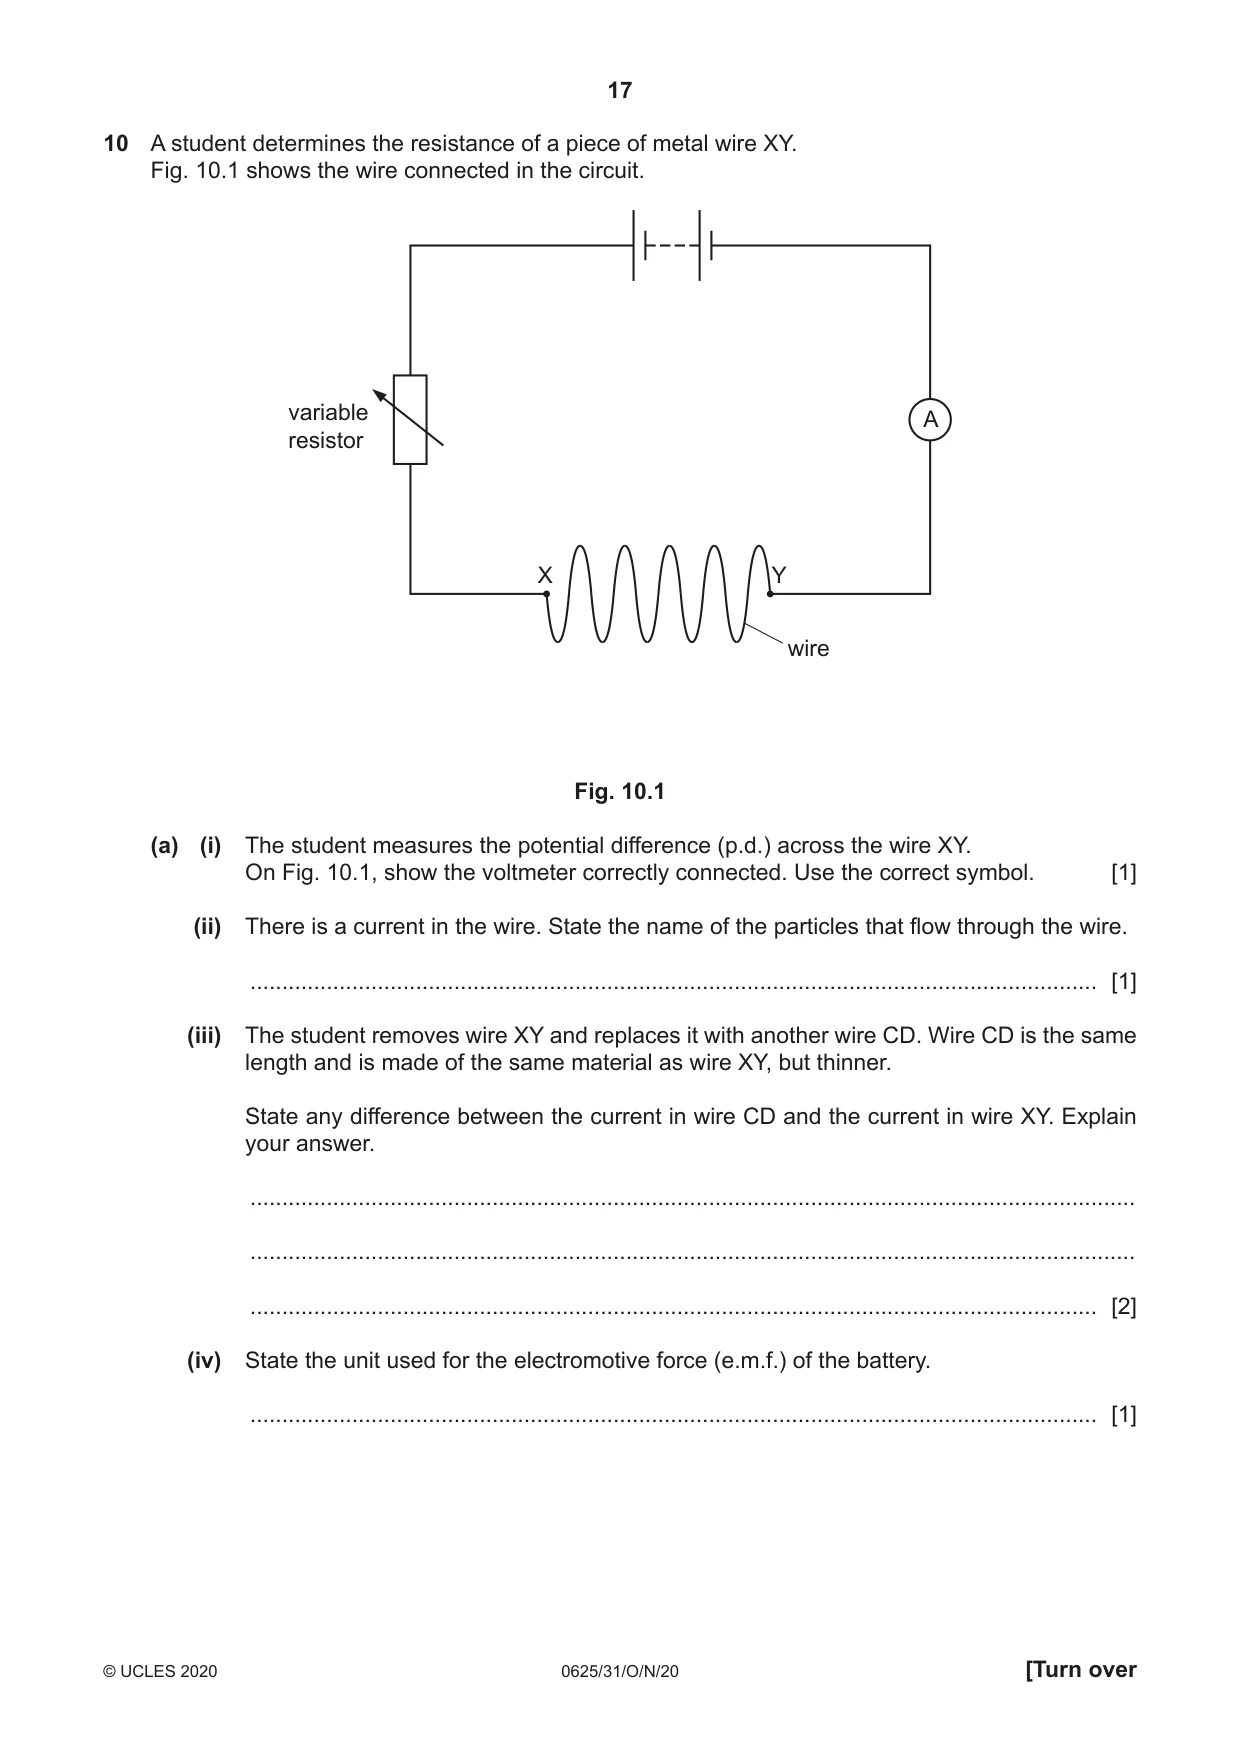
Q10 · A student determines the resistance of a piece of metal wire XY
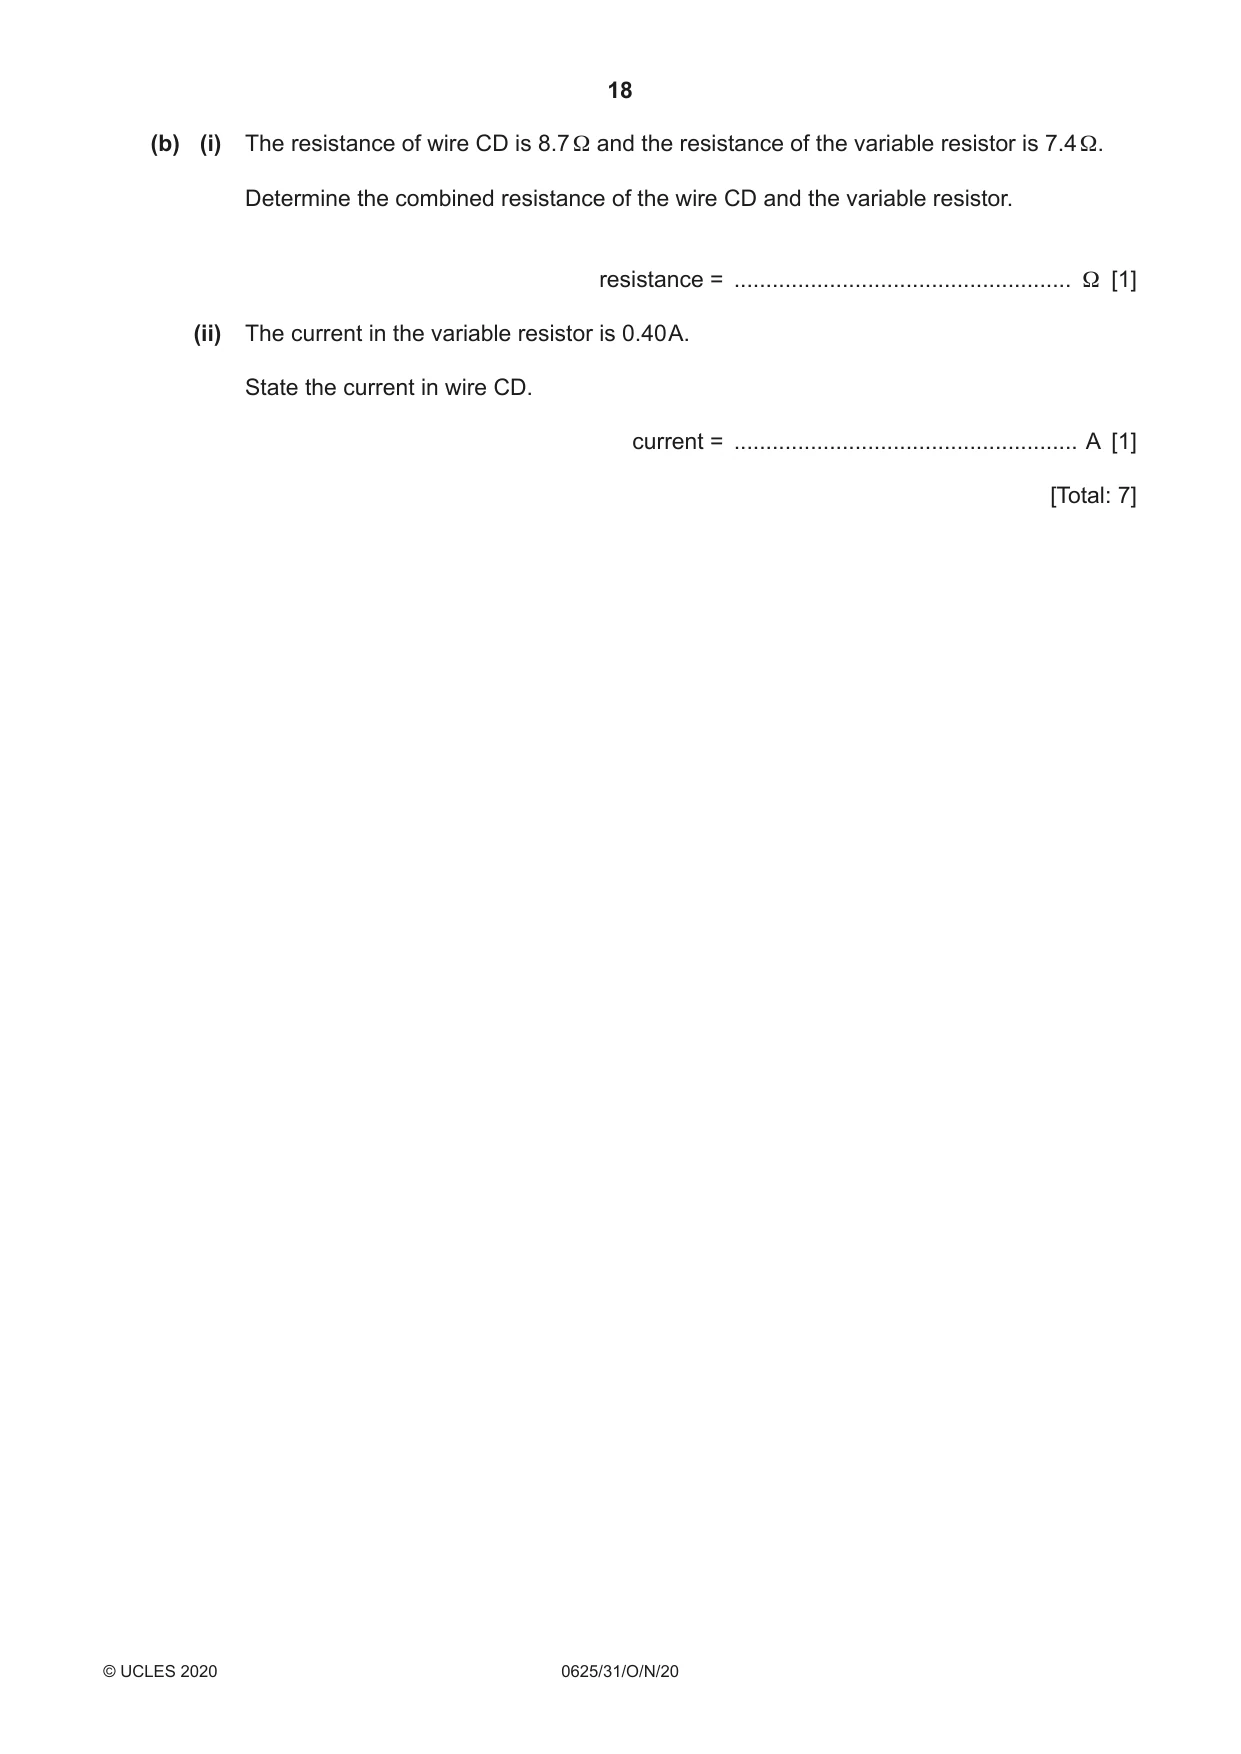
10 A student determines the resistance of a piece of metal wire XY. Fig. 10.1 shows the wire connected in the circuit. variable A resistor X Y wire Fig. 10.1 (a) (i) The student measures the potential difference (p.d.) across the wire XY. On Fig. 10.1, show the voltmeter correctly connected. Use the correct symbol. [1] (ii) There is a current in the wire. State the name of the particles that flow through the wire. ..................................................................................................................................... [1] (iii) The student removes wire XY and replaces it with another wire CD. Wire CD is the same length and is made of the same material as wire XY, but thinner. State any difference between the current in wire CD and the current in wire XY. Explain your answer. ........................................................................................................................................... ........................................................................................................................................... ..................................................................................................................................... [2] (iv) State the unit used for the electromotive force (e.m.f.) of the battery. ..................................................................................................................................... [1] (b) (i) The resistance of wire CD is 8.7 Ω and the resistance of the variable resistor is 7.4 Ω. Determine the combined resistance of the wire CD and the variable resistor. resistance = ..................................................... Ω [1] (ii) The current in the variable resistor is 0.40 A. State the current in wire CD. current = ...................................................... A [1] [Total: 7]
Mark scheme: 10(a)(i) correct symbol for voltmeter correctly connected B1 10(a)(ii) electrons B1 10(a)(iii) (current in CD) decreases B1 (because thinner wire / CD has) increased / bigger resistance B1 10(a)(iv) volt(s) B1 10(b)(i) 16.1 (Ω) B1 10(b)(ii) 0.40 (A) B1
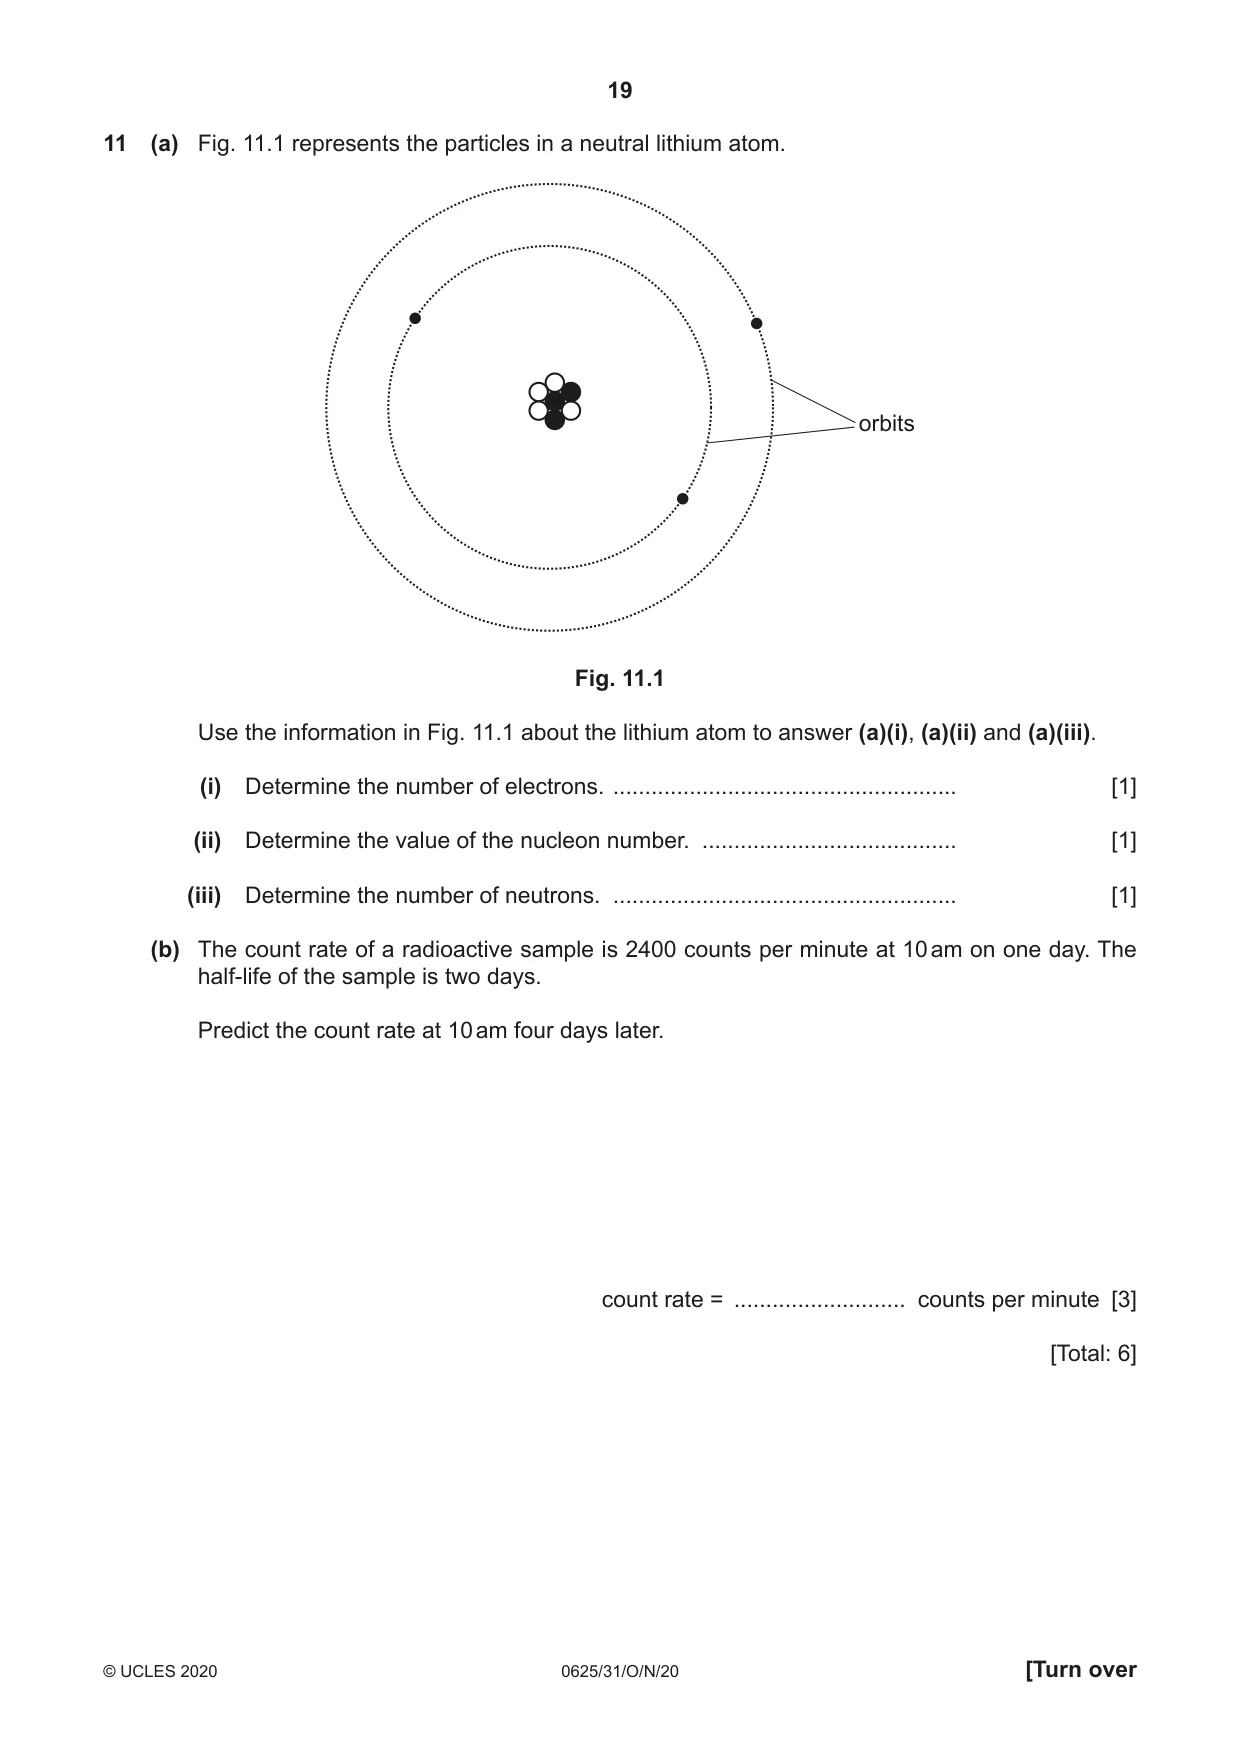
Q11 · The particles in a neutral lithium atom
11 (a) Fig. 11.1 represents the particles in a neutral lithium atom. orbits Fig. 11.1 Use the information in Fig. 11.1 about the lithium atom to answer (a)(i), (a)(ii) and (a)(iii). (i) Determine the number of electrons. ...................................................... [1] (ii) Determine the value of the nucleon number. ........................................ [1] (iii) Determine the number of neutrons. ...................................................... [1] (b) The count rate of a radioactive sample is 2400 counts per minute at 10 am on one day. The half-life of the sample is two days. Predict the count rate at 10 am four days later. count rate = ........................... counts per minute [3] [Total: 6]
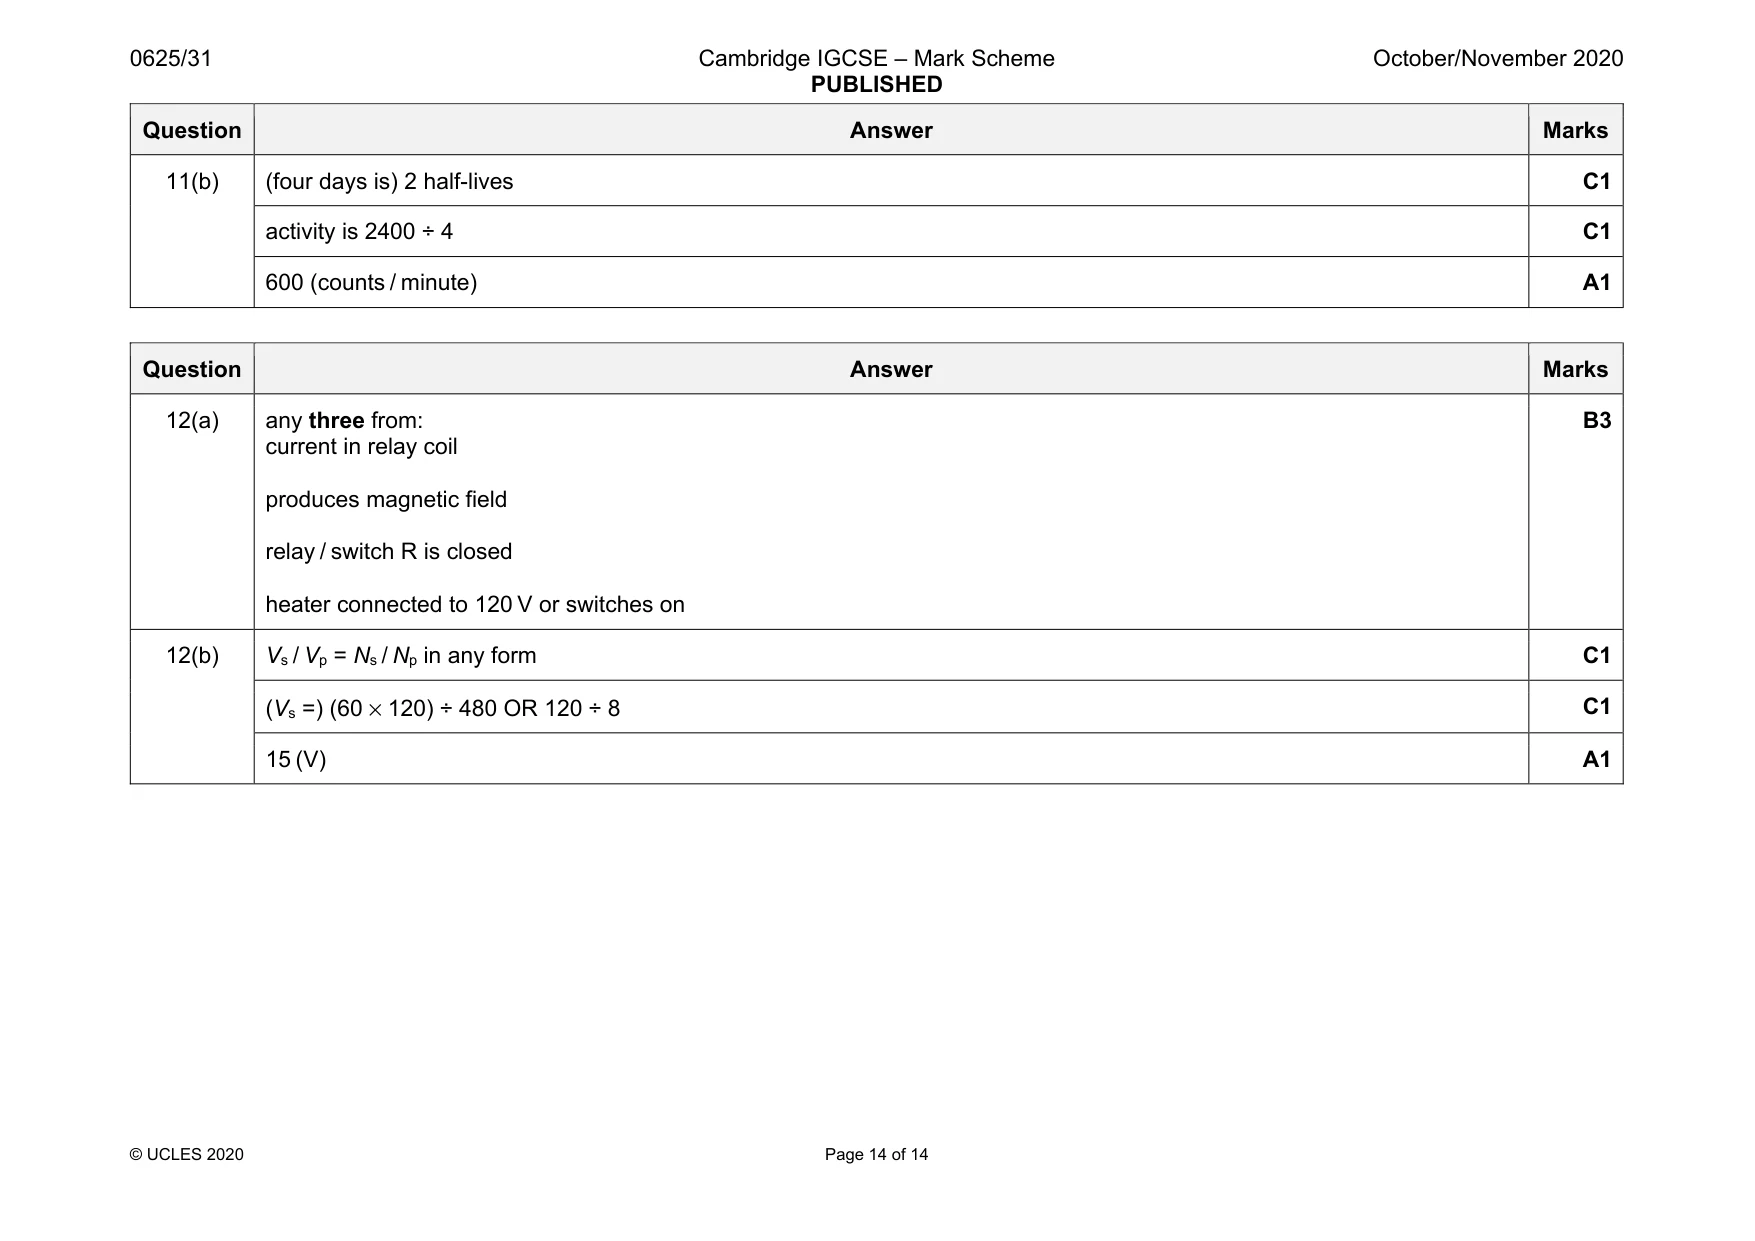
Mark scheme: 11(a)(i) 3 (electrons) B1 11(a)(ii) 7 (is the nucleon number) B1 11(a)(iii) 4 (neutrons) B1 Question Answer Marks 11(b) (four days is) 2 half-lives C1 activity is 2400 ÷ 4 C1 600 (counts / minute) A1
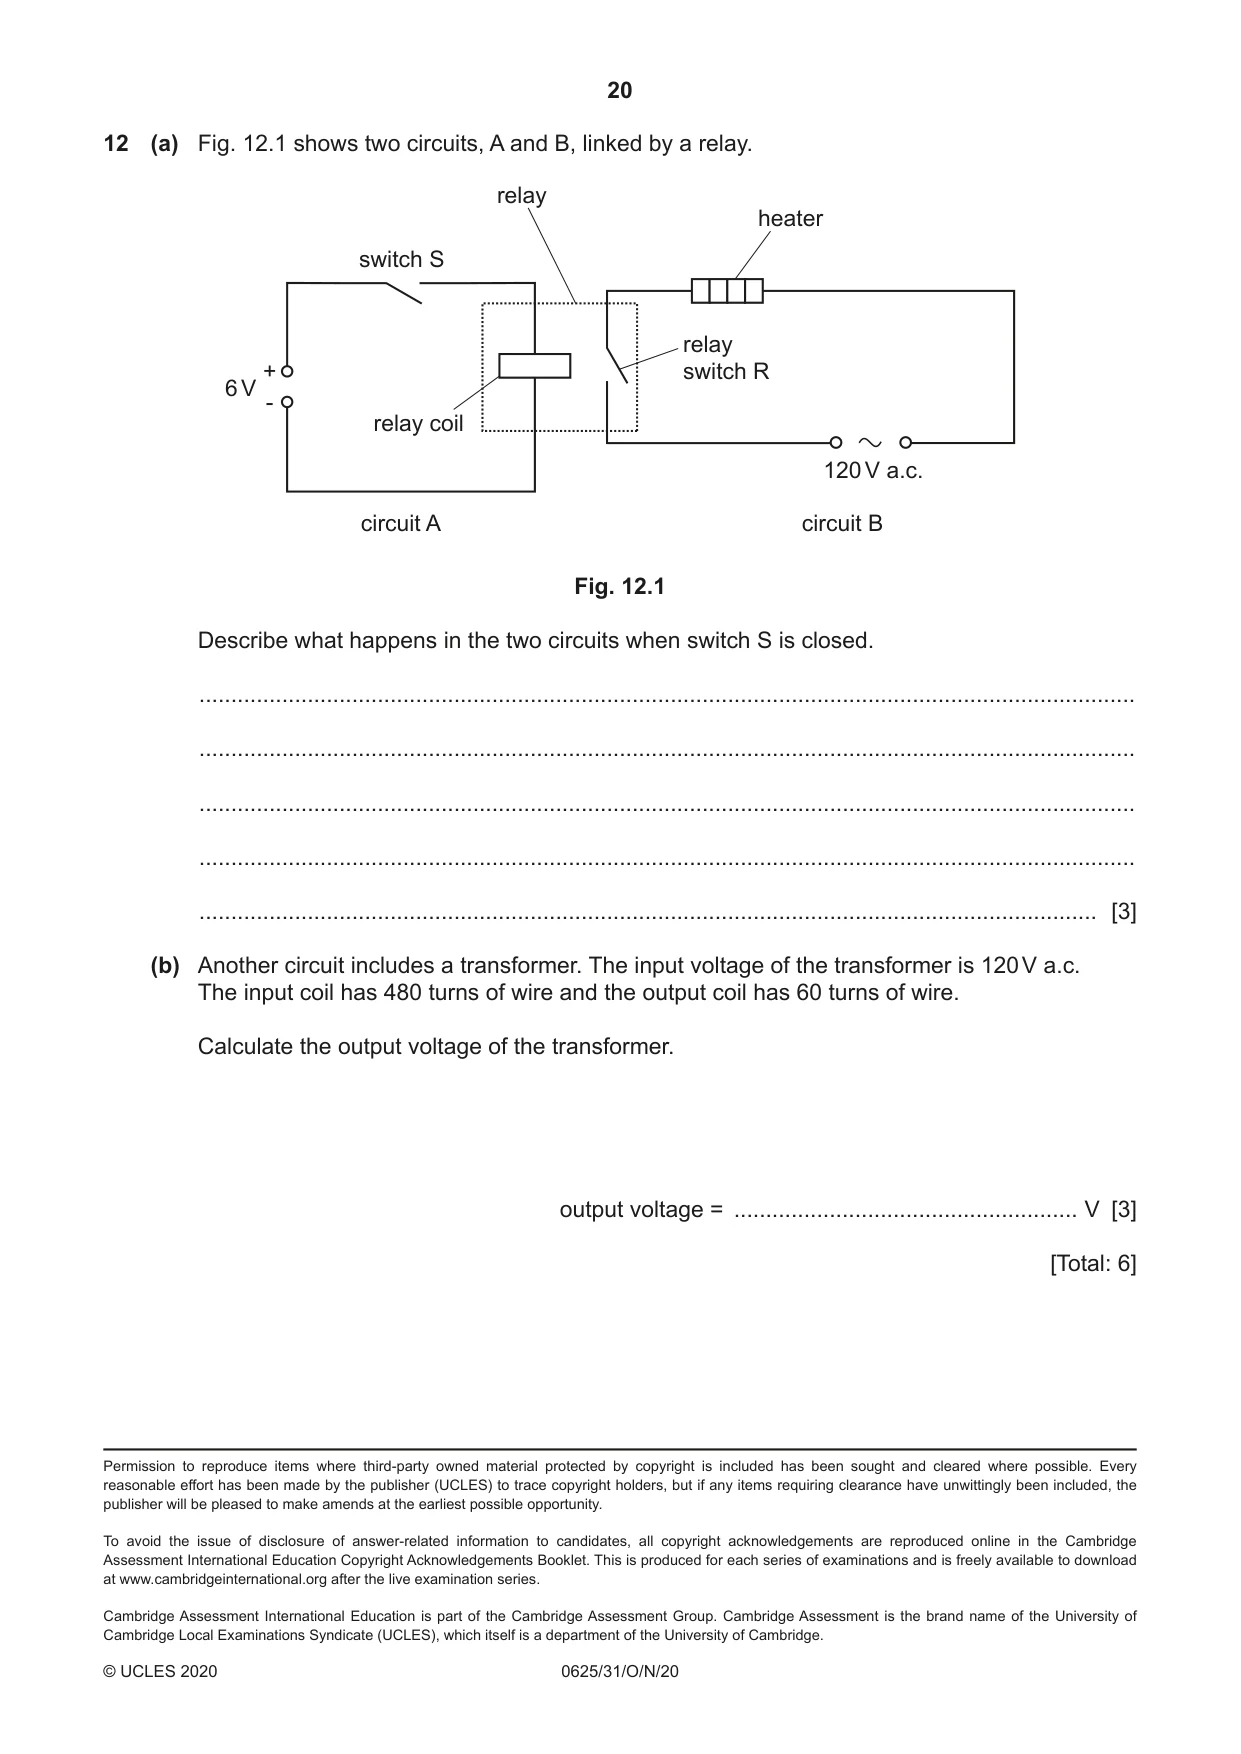
Q12 · Two circuits, A and B, linked by a relay
12 (a) Fig. 12.1 shows two circuits, A and B, linked by a relay. relay heater switch S relay + switch R 6 V - relay coil 120 V a.c. circuit A circuit B Fig. 12.1 Describe what happens in the two circuits when switch S is closed. ................................................................................................................................................... ................................................................................................................................................... ................................................................................................................................................... ................................................................................................................................................... ............................................................................................................................................. [3] (b) Another circuit includes a transformer. The input voltage of the transformer is 120 V a.c. The input coil has 480 turns of wire and the output coil has 60 turns of wire. Calculate the output voltage of the transformer. output voltage = ...................................................... V [3] [Total: 6]
Mark scheme: 12(a) any three from: current in relay coil produces magnetic field relay / switch R is closed heater connected to 120 V or switches on B3 12(b) Vs / Vp = Ns / Np in any form C1 (Vs =) (60 × 120) ÷ 480 OR 120 ÷ 8 C1 15 (V) A1
What was in this paper
The subtopics covered by these 12 questions, and how many questions each got. Open one in a new tab to see every Cambridge question on it.
What you needed in this session
Cambridge’s own grade thresholds for 2020 Oct/Nov, Paper 3 · Variant 1. A higher threshold means an easier paper — the bar moves with how the cohort did.