Questions as text
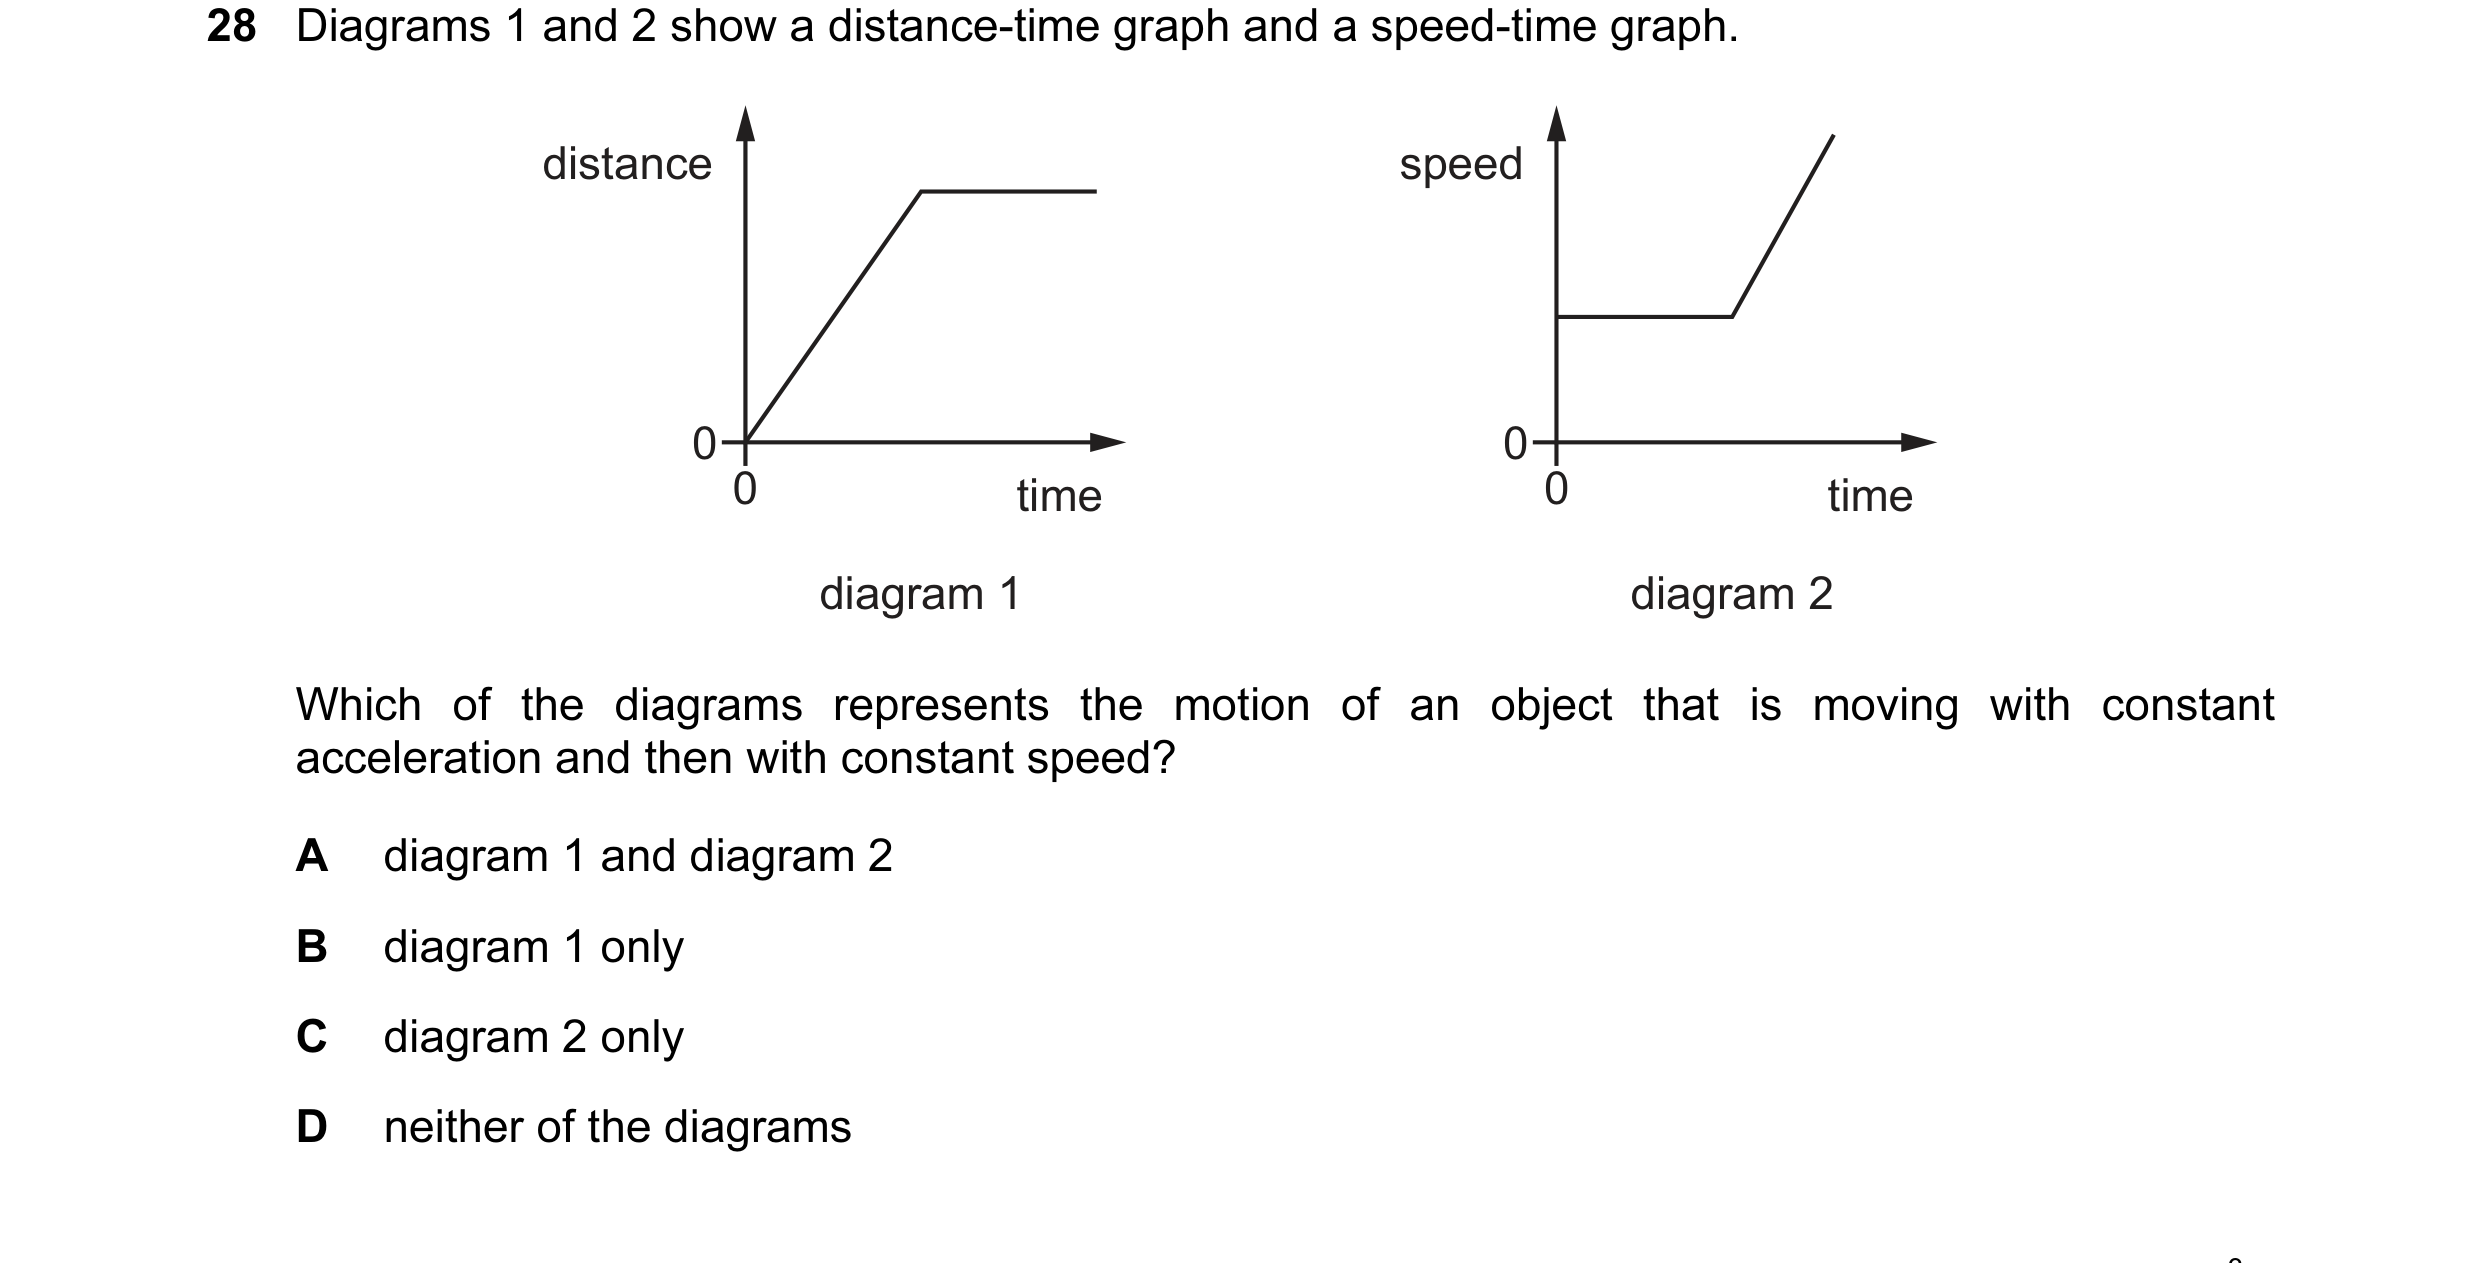
Q1 · Diagrams 1 and 2 show a distance-time graph and a speed-time graph 0653/22 Feb/March 2017
28 Diagrams 1 and 2 show a distance-time graph and a speed-time graph. distance speed 0 0 0 time 0 time diagram 1 diagram 2 Which of the diagrams represents the motion of an object that is moving with constant acceleration and then with constant speed? A diagram 1 and diagram 2 B diagram 1 only C diagram 2 only D neither of the diagrams
1 marks
Answer: D
This question in 0653/22 Feb/March 2017
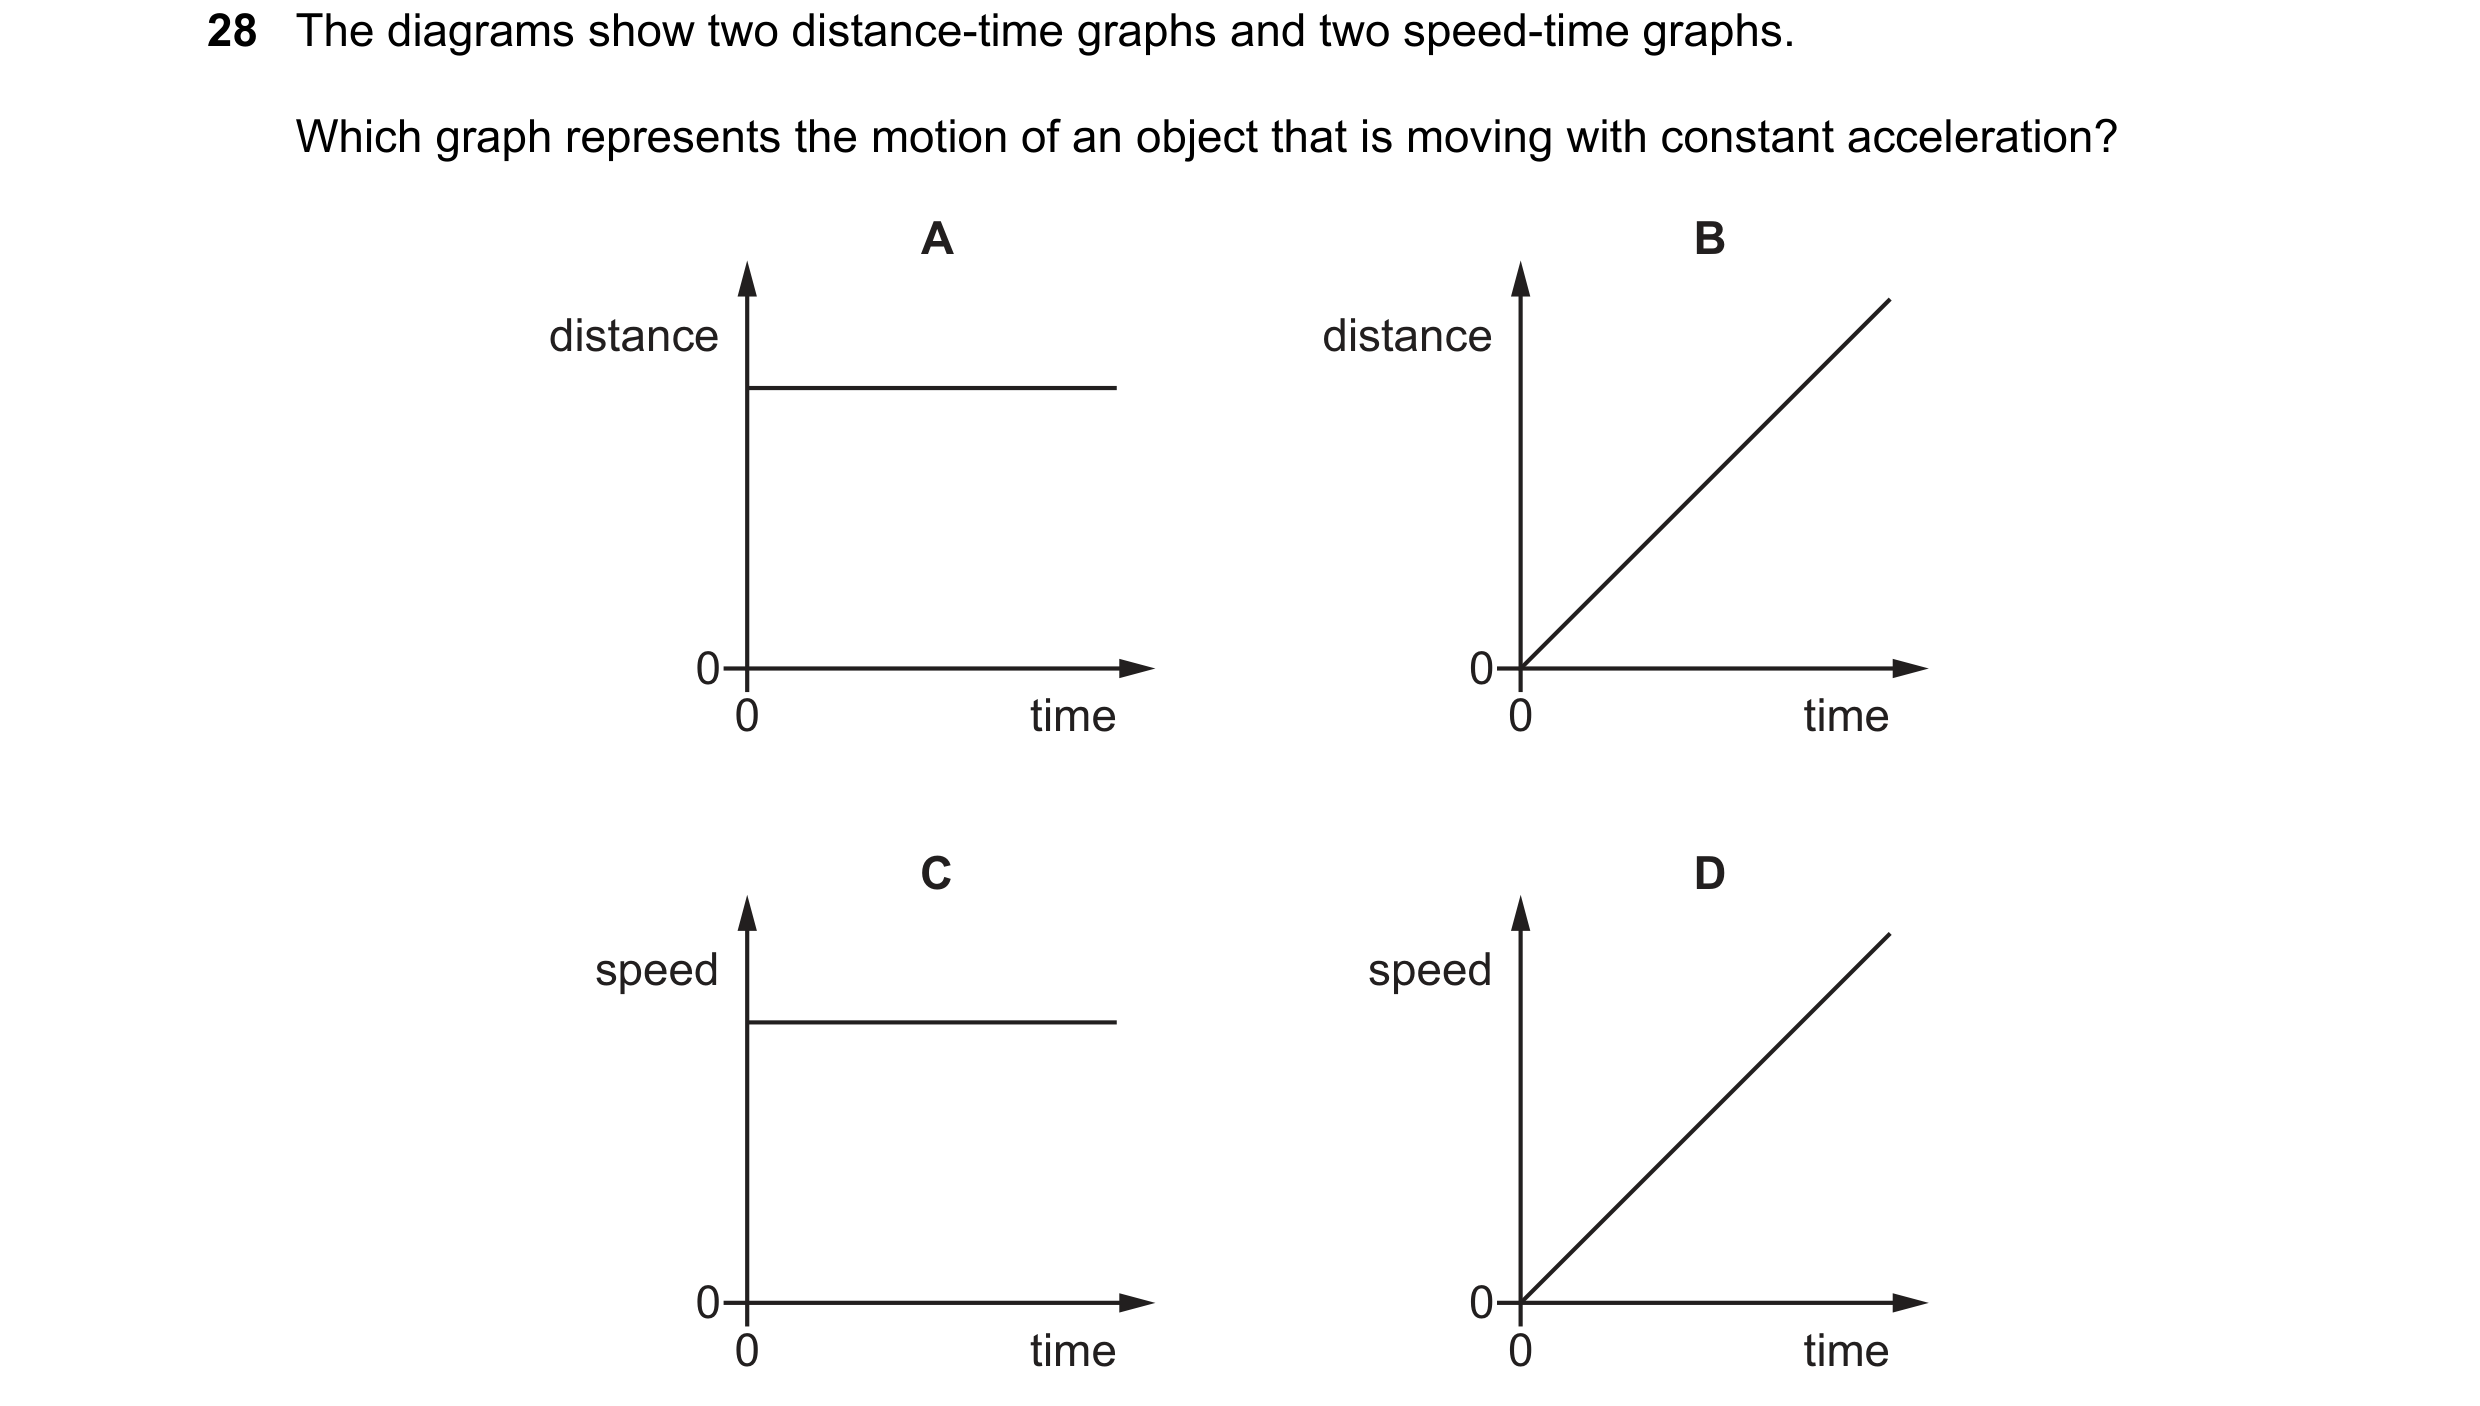
Q2 · The diagrams show two distance-time graphs and two speed-time graphs 0653/21 May/June 2017
28 The diagrams show two distance-time graphs and two speed-time graphs. Which graph represents the motion of an object that is moving with constant acceleration? A B distance distance 0 0 0 time 0 time C D speed speed 0 0 0 time 0 time
1 marks
Answer: D
This question in 0653/21 May/June 2017
Q3 · The diagram shows the speed-time graph for a vehicle 0653/22 May/June 2017
28 The diagram shows the speed-time graph for a vehicle. 12.0 speed m / s 6.0 0 0 30 time / s What is the acceleration of the vehicle, and how far does it travel in 30 s? acceleration distance m / s2 travelled / m A 0.20 180 B 0.20 270 C 0.40 180 D 0.40 270
1 marks
Answer: B
This question in 0653/22 May/June 2017
Q4 · A car is travelling on a straight road at a speed of 2.0 m / s 0653/23 May/June 2017
28 A car is travelling on a straight road at a speed of 2.0 m / s. It starts to accelerate constantly at 3.0 m / s2. How long does it take for the speed of the car to reach 8.0 m / s? A 0.50 s B 2.0 s C 2.7 s D 18 s
1 marks
Answer: B
This question in 0653/23 May/June 2017
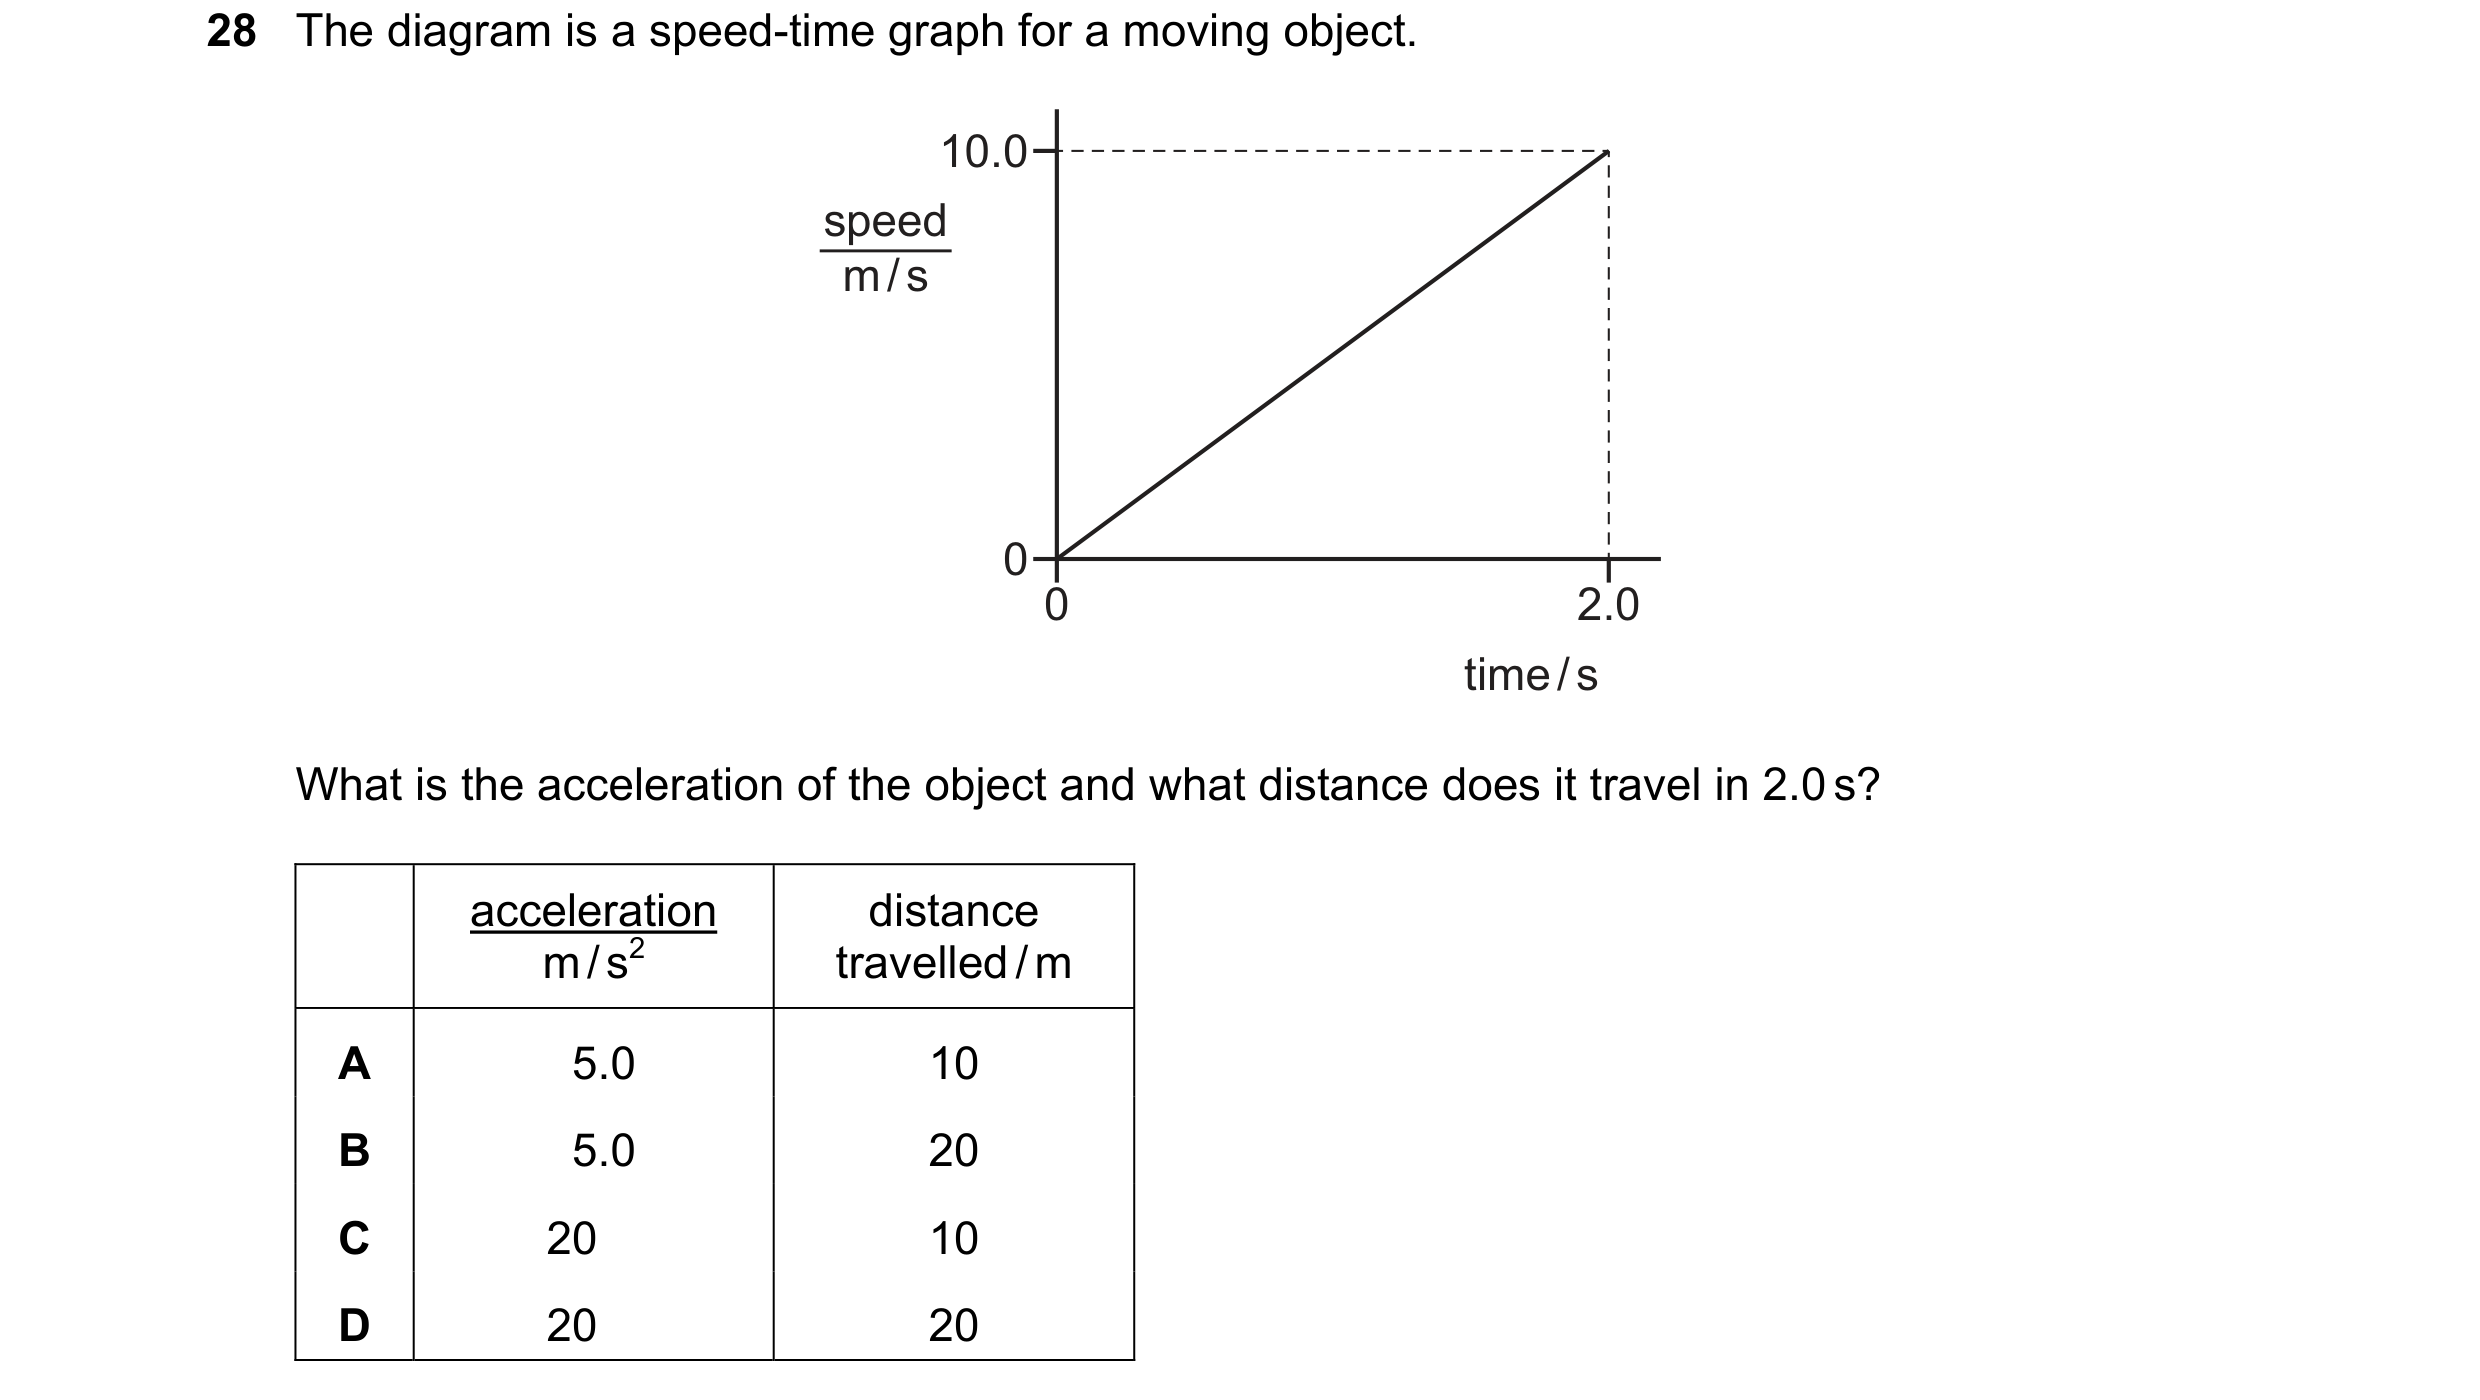
Q5 · The diagram is a speed-time graph for a moving object 0653/21 Oct/Nov 2017
28 The diagram is a speed-time graph for a moving object. 10.0 speed m / s 0 0 2.0 time / s What is the acceleration of the object and what distance does it travel in 2.0 s? acceleration distance m / s2 travelled / m A 5.0 10 B 5.0 20 C 20 10 D 20 20
1 marks
Answer: A
This question in 0653/21 Oct/Nov 2017
Q6 · The speed-time graph shown is for a bus travelling between stops 0653/22 Oct/Nov 2017
28 The speed-time graph shown is for a bus travelling between stops. Where on the graph is the acceleration of the bus greatest? C speed B A D 0 0 time
1 marks
Answer: B
This question in 0653/22 Oct/Nov 2017
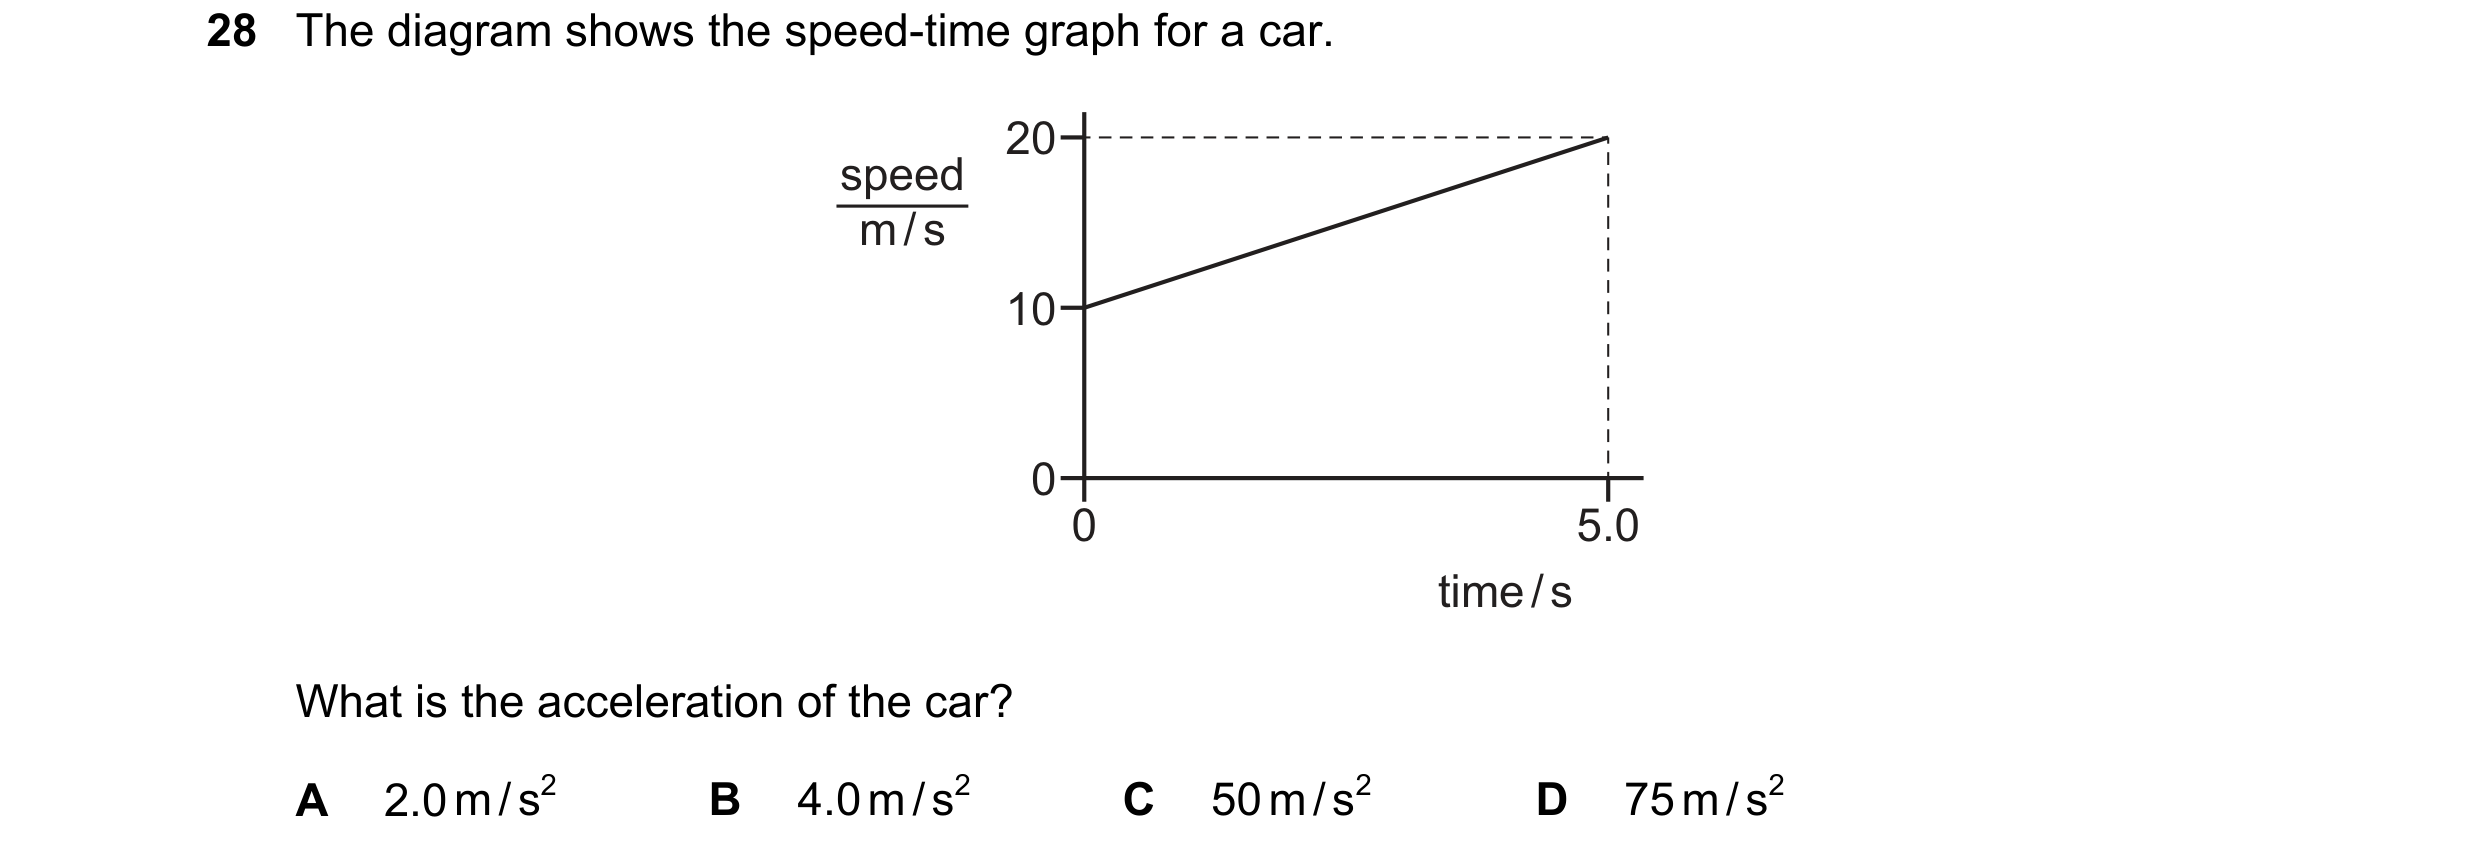
Q7 · The diagram shows the speed-time graph for a car 0653/23 Oct/Nov 2017
28 The diagram shows the speed-time graph for a car. 20 speed m / s 10 0 0 5.0 time / s What is the acceleration of the car? A 2.0 m / s2 B 4.0 m / s2 C 50 m / s2 D 75 m / s2
1 marks
Answer: A
This question in 0653/23 Oct/Nov 2017
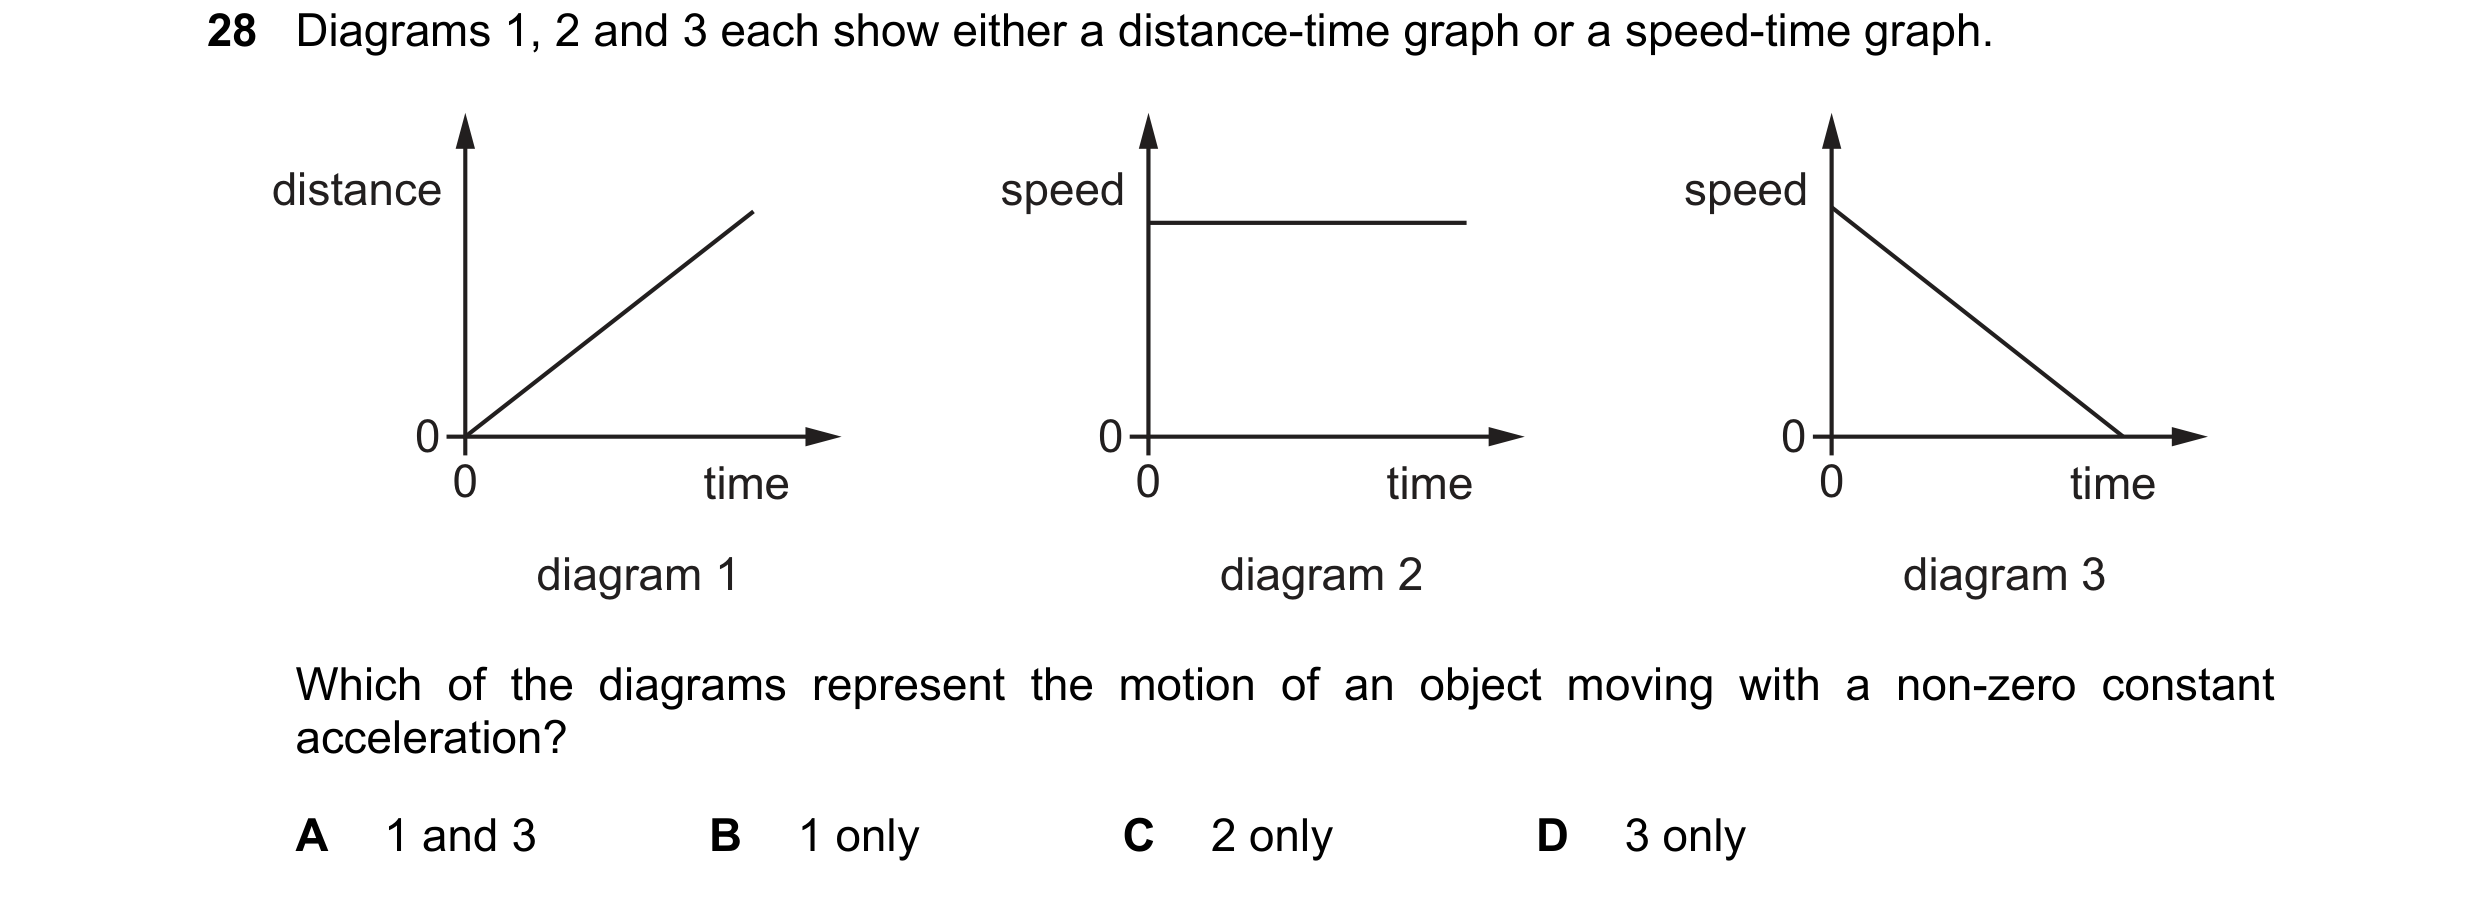
Q8 · Diagrams 1, 2 and 3 each show either a distance-time graph or a speed-time graph 0653/22 Feb/March 2018
28 Diagrams 1, 2 and 3 each show either a distance-time graph or a speed-time graph. distance speed speed 0 0 0 0 time 0 time 0 time diagram 1 diagram 2 diagram 3 Which of the diagrams represent the motion of an object moving with a non-zero constant acceleration? A 1 and 3 B 1 only C 2 only D 3 only
1 marks
Answer: D
This question in 0653/22 Feb/March 2018
Q9 · Diagrams 1, 2 and 3 show two distance-time graphs and one speed-time graph 0653/21 May/June 2018
28 Diagrams 1, 2 and 3 show two distance-time graphs and one speed-time graph. distance distance speed 0 0 0 0 time 0 time 0 time diagram 1 diagram 2 diagram 3 Which of the diagrams represent the motion of an object that is accelerating? A 1 and 2 B 1 only C 2 only D 3 only
1 marks
Answer: B
This question in 0653/21 May/June 2018
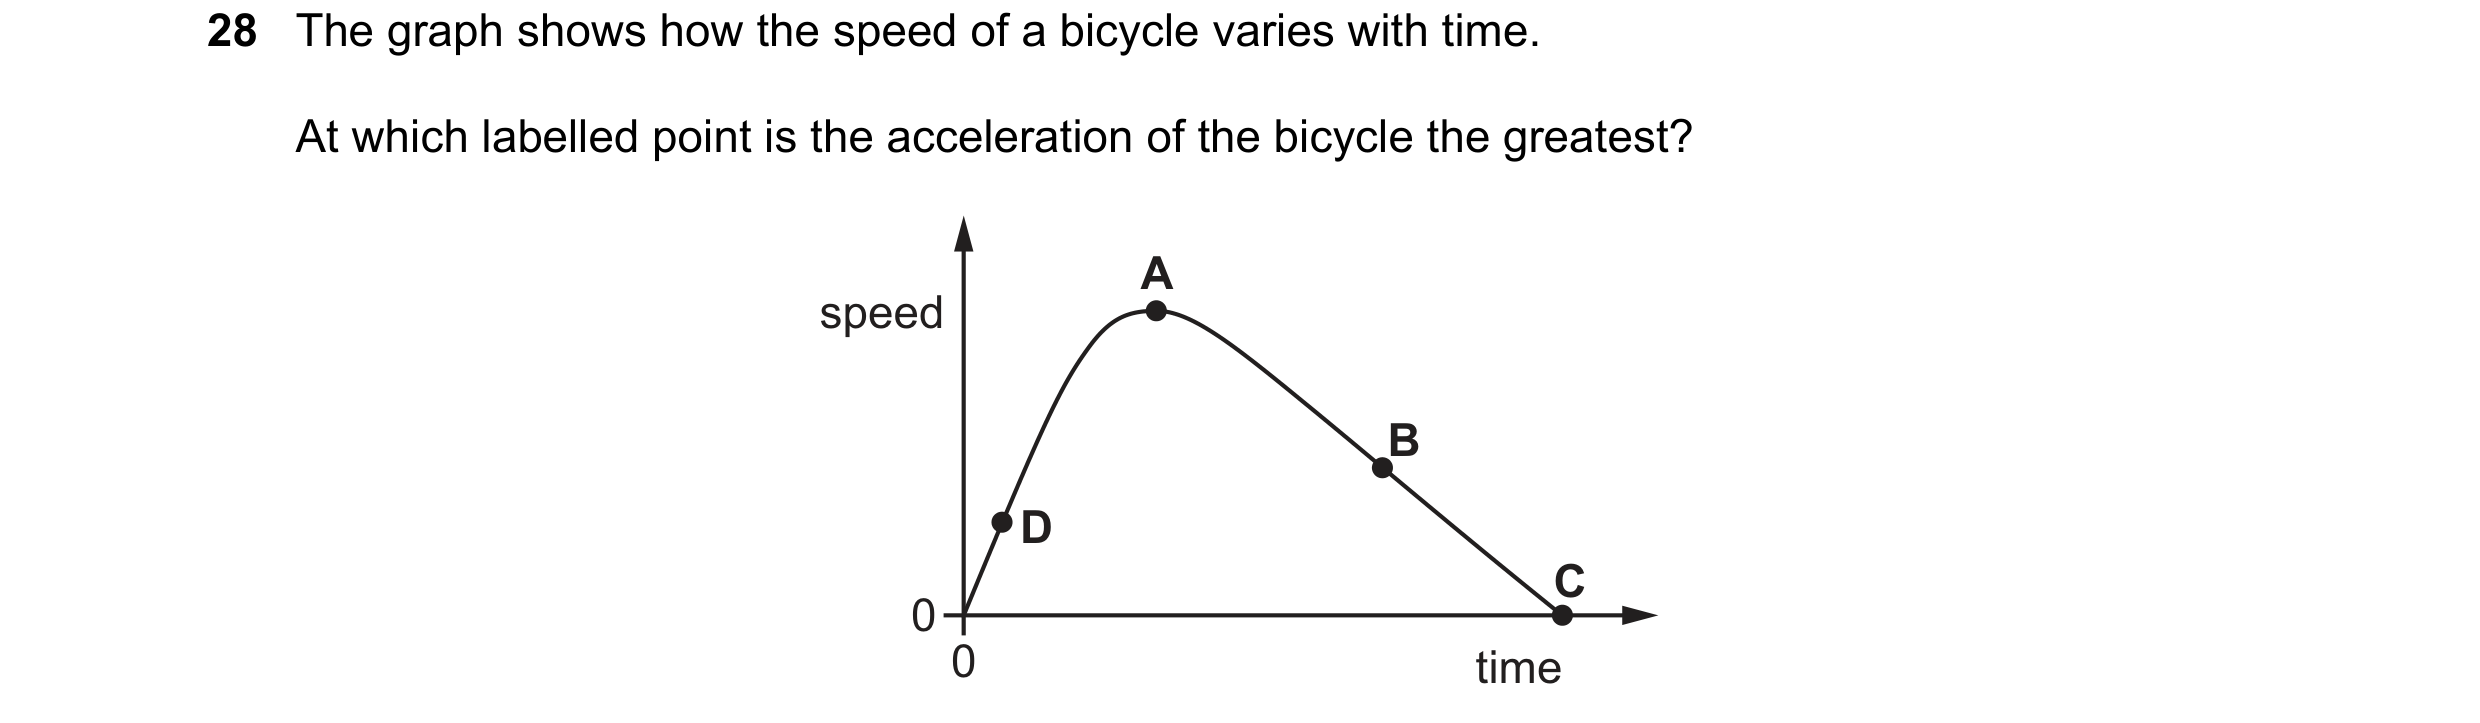
Q10 · The graph shows how the speed of a bicycle varies with time 0653/22 May/June 2018
28 The graph shows how the speed of a bicycle varies with time. At which labelled point is the acceleration of the bicycle the greatest? A speed B D C 0 0 time
1 marks
Answer: D
This question in 0653/22 May/June 2018
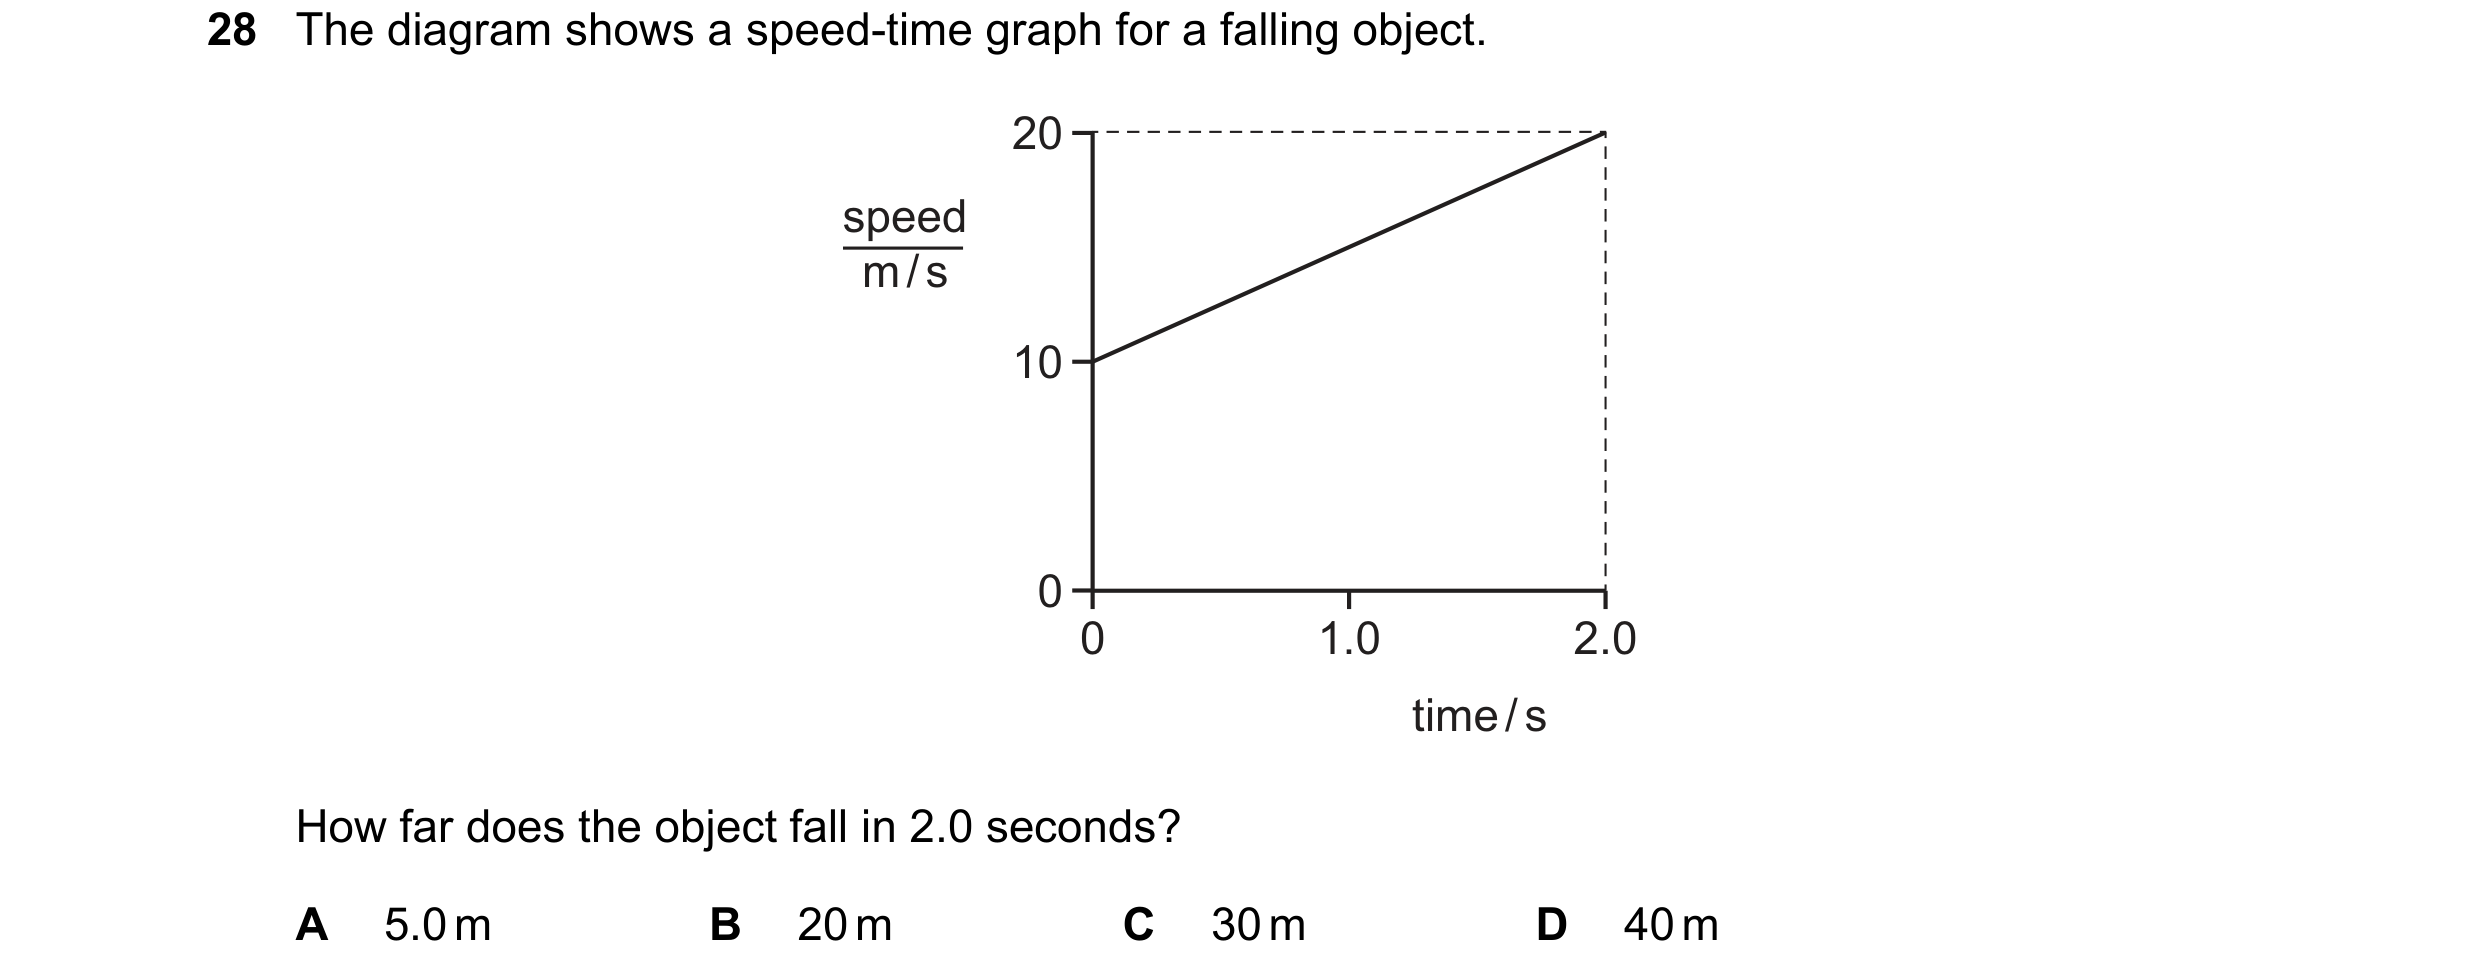
Q11 · The diagram shows a speed-time graph for a falling object 0653/23 May/June 2018
28 The diagram shows a speed-time graph for a falling object. 20 speed m / s 10 0 0 1.0 2.0 time / s How far does the object fall in 2.0 seconds? A 5.0 m B 20 m C 30 m D 40 m
1 marks
Answer: C
This question in 0653/23 May/June 2018
Q12 · A train travels between two stations 0653/22 Oct/Nov 2018
28 A train travels between two stations. The distance-time graph for the train is shown. At which time is the train travelling the fastest? distance 0 0 A B C D time
1 marks
Answer: B
This question in 0653/22 Oct/Nov 2018
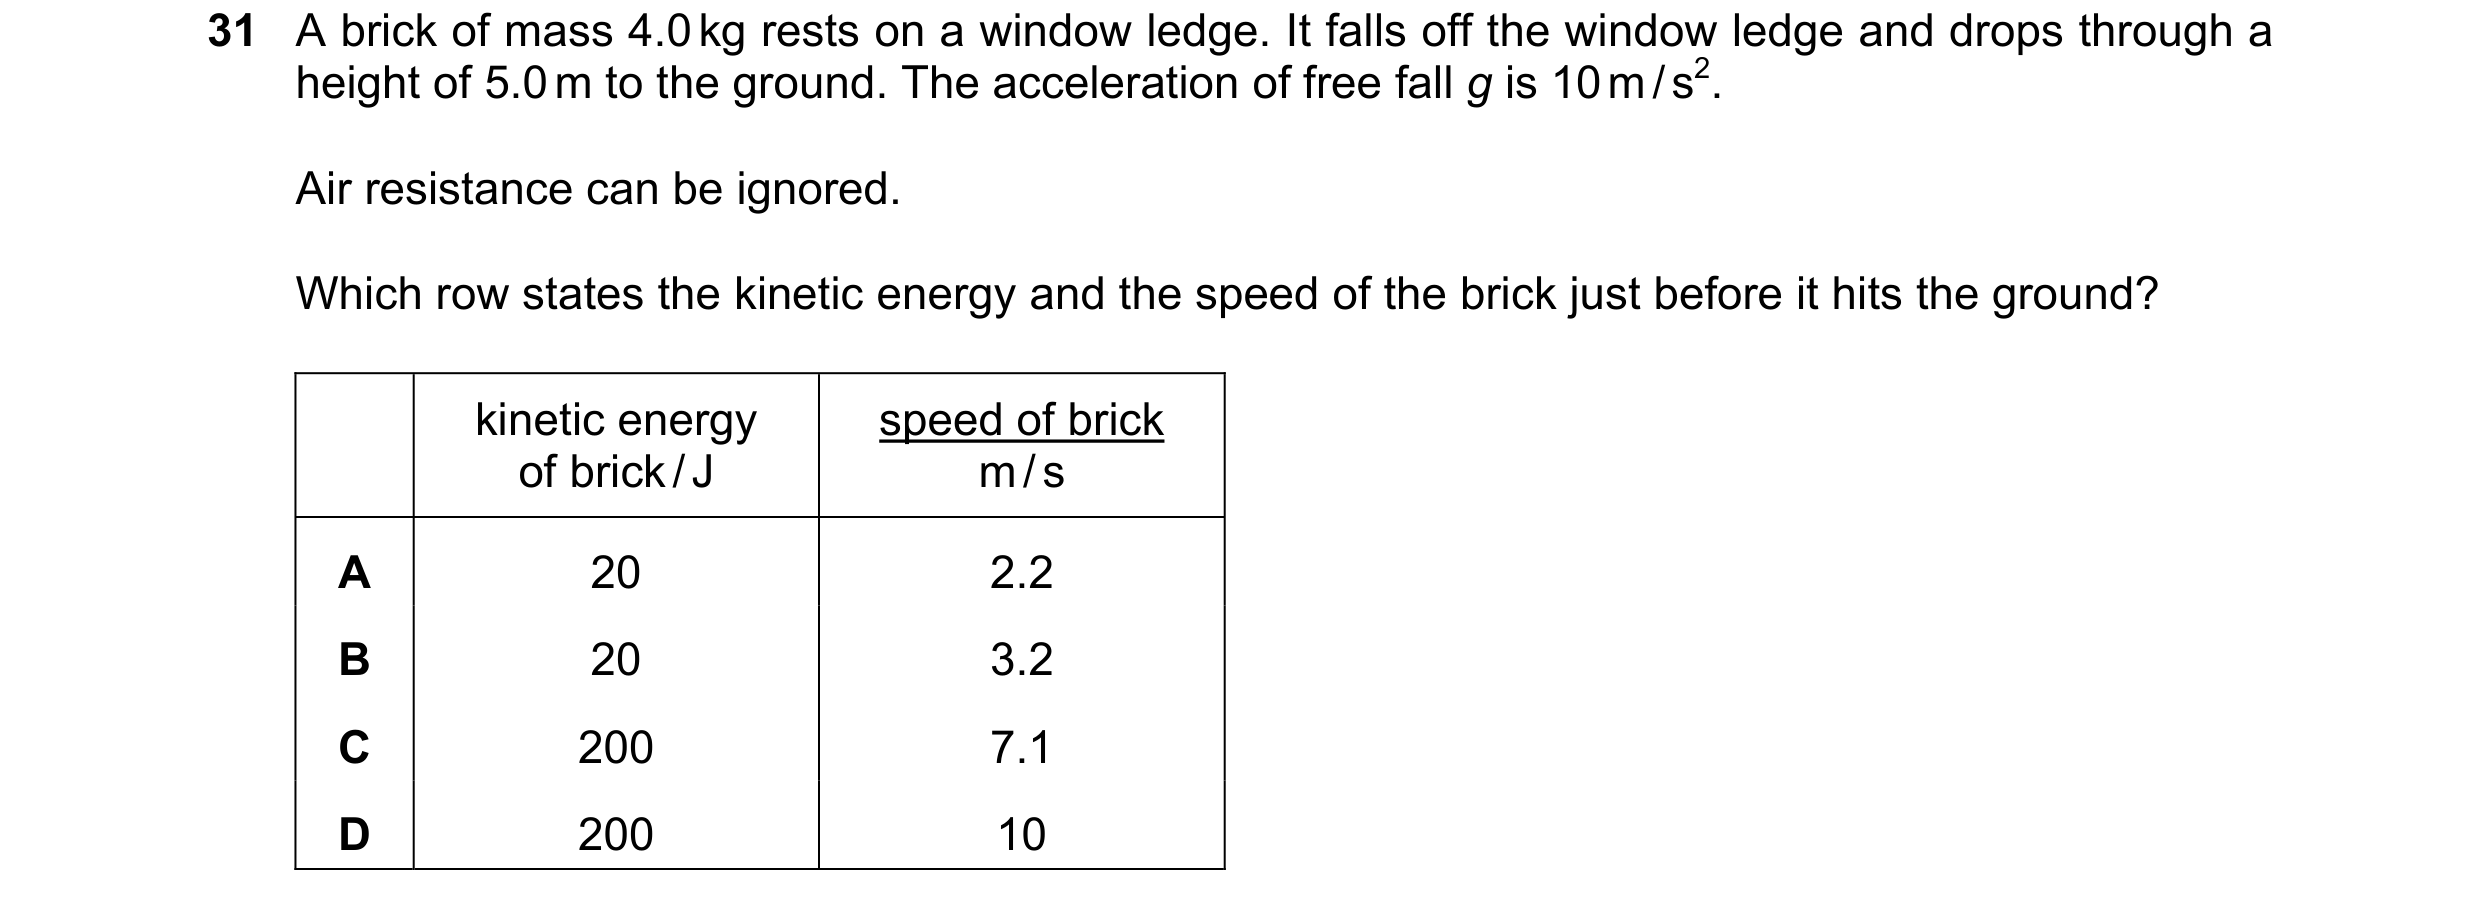
Q13 · A brick of mass 4.0 kg rests on a window ledge 0653/22 Oct/Nov 2018
31 A brick of mass 4.0 kg rests on a window ledge. It falls off the window ledge and drops through a height of 5.0 m to the ground. The acceleration of free fall g is 10 m / s2. Air resistance can be ignored. Which row states the kinetic energy and the speed of the brick just before it hits the ground? kinetic energy speed of brick of brick / J m / s A 20 2.2 B 20 3.2 C 200 7.1 D 200 10
1 marks
Answer: D
This question in 0653/22 Oct/Nov 2018
Q14 · A girl stands in front of a plane mirror 0653/22 Oct/Nov 2018
36 A girl stands in front of a plane mirror. She then walks towards the mirror at a speed of 1.0 m / s. At what combined speed do the girl and her image appear to approach each other? A 0 m / s B 0.50 m / s C 1.0 m / s D 2.0 m / s
1 marks
Answer: D
This question in 0653/22 Oct/Nov 2018
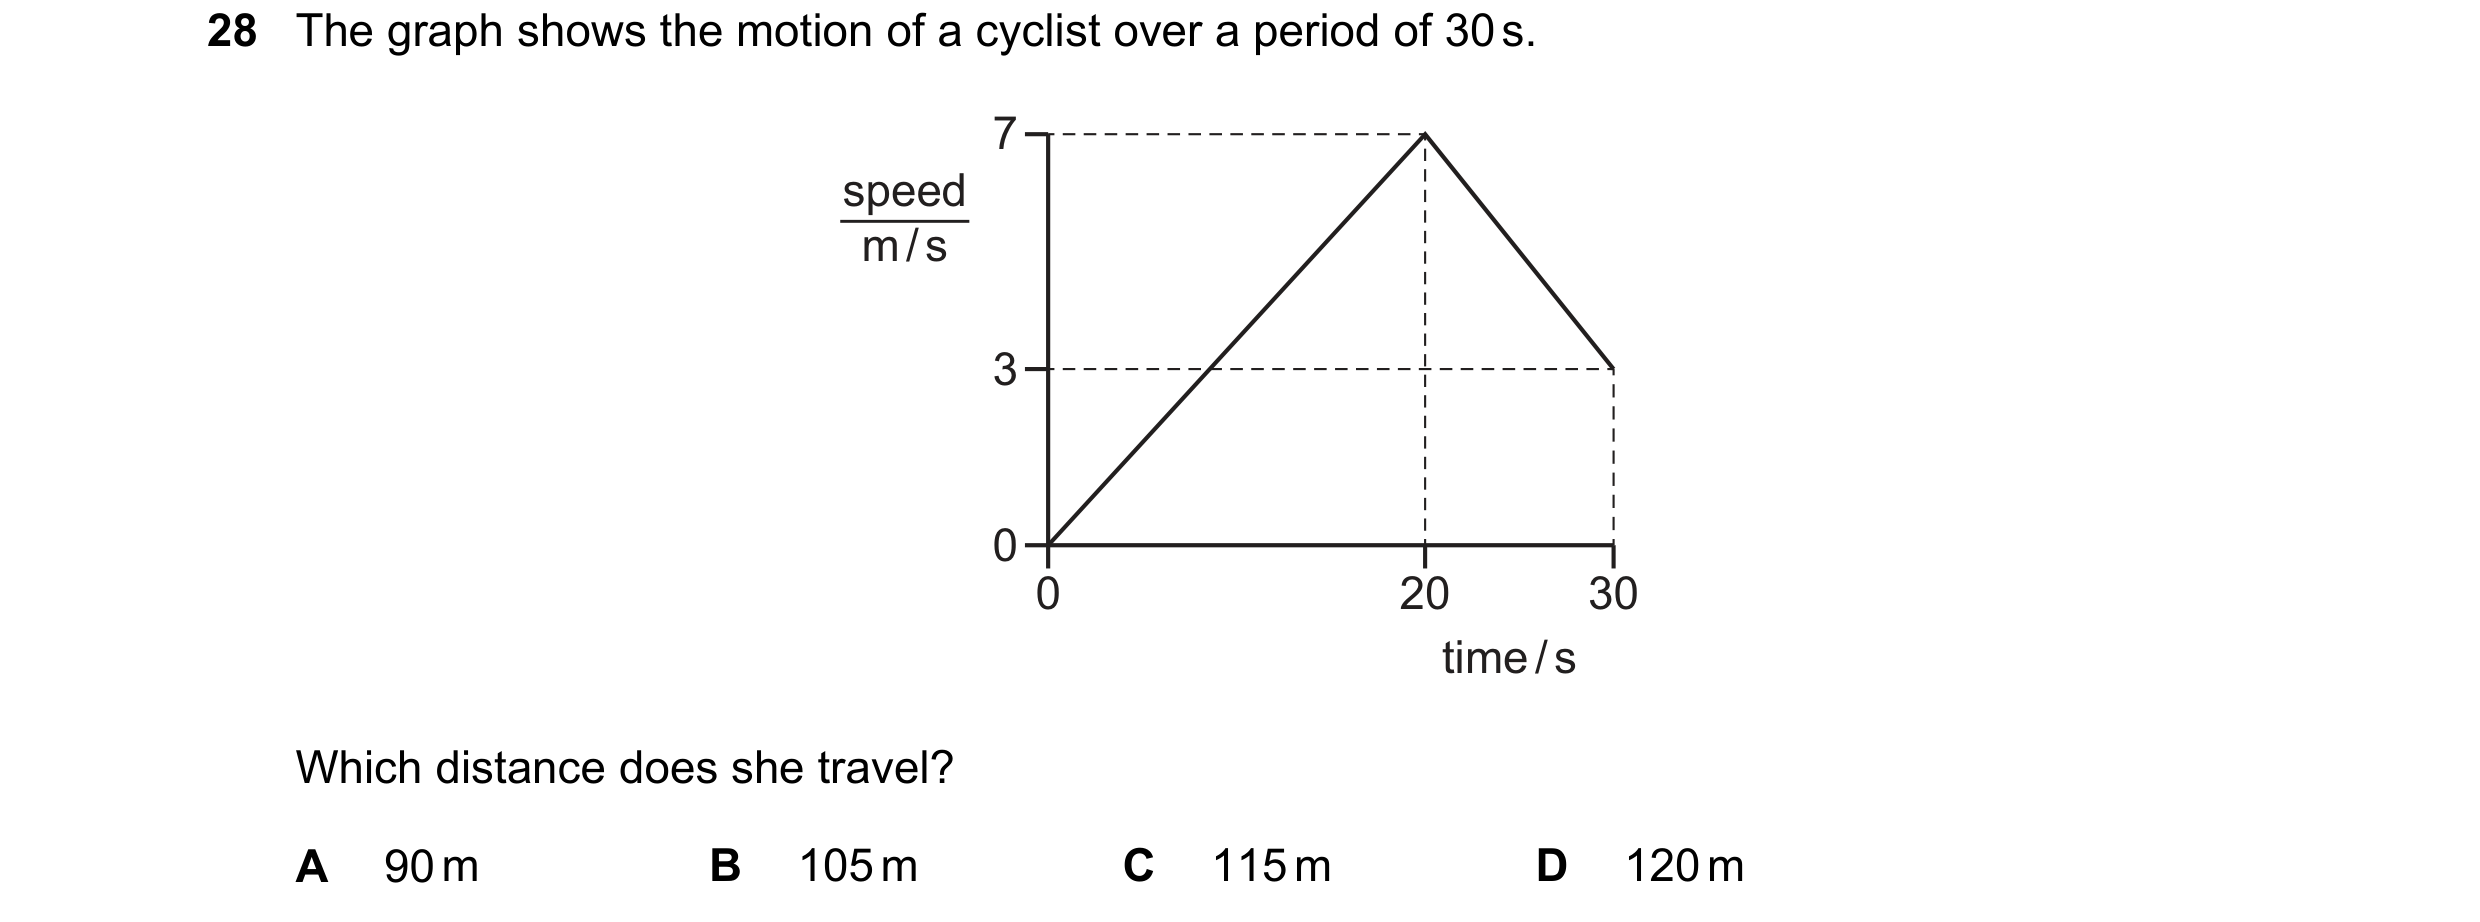
Q15 · The graph shows the motion of a cyclist over a period of 30 s 0653/23 Oct/Nov 2018
28 The graph shows the motion of a cyclist over a period of 30 s. 7 speed m / s 3 0 0 20 30 time / s Which distance does she travel? A 90 m B 105 m C 115 m D 120 m
1 marks
Answer: D
This question in 0653/23 Oct/Nov 2018
Q16 · The speed-time graph represents part of the journey of a car 0653/22 Feb/March 2019
28 The speed-time graph represents part of the journey of a car. 20 speed m / s 15 10 5 0 0 10 20 time / s How far does the car travel between 0 s and 20 s? A 150 m B 200 m C 250 m D 400 m
1 marks
Answer: C
This question in 0653/22 Feb/March 2019
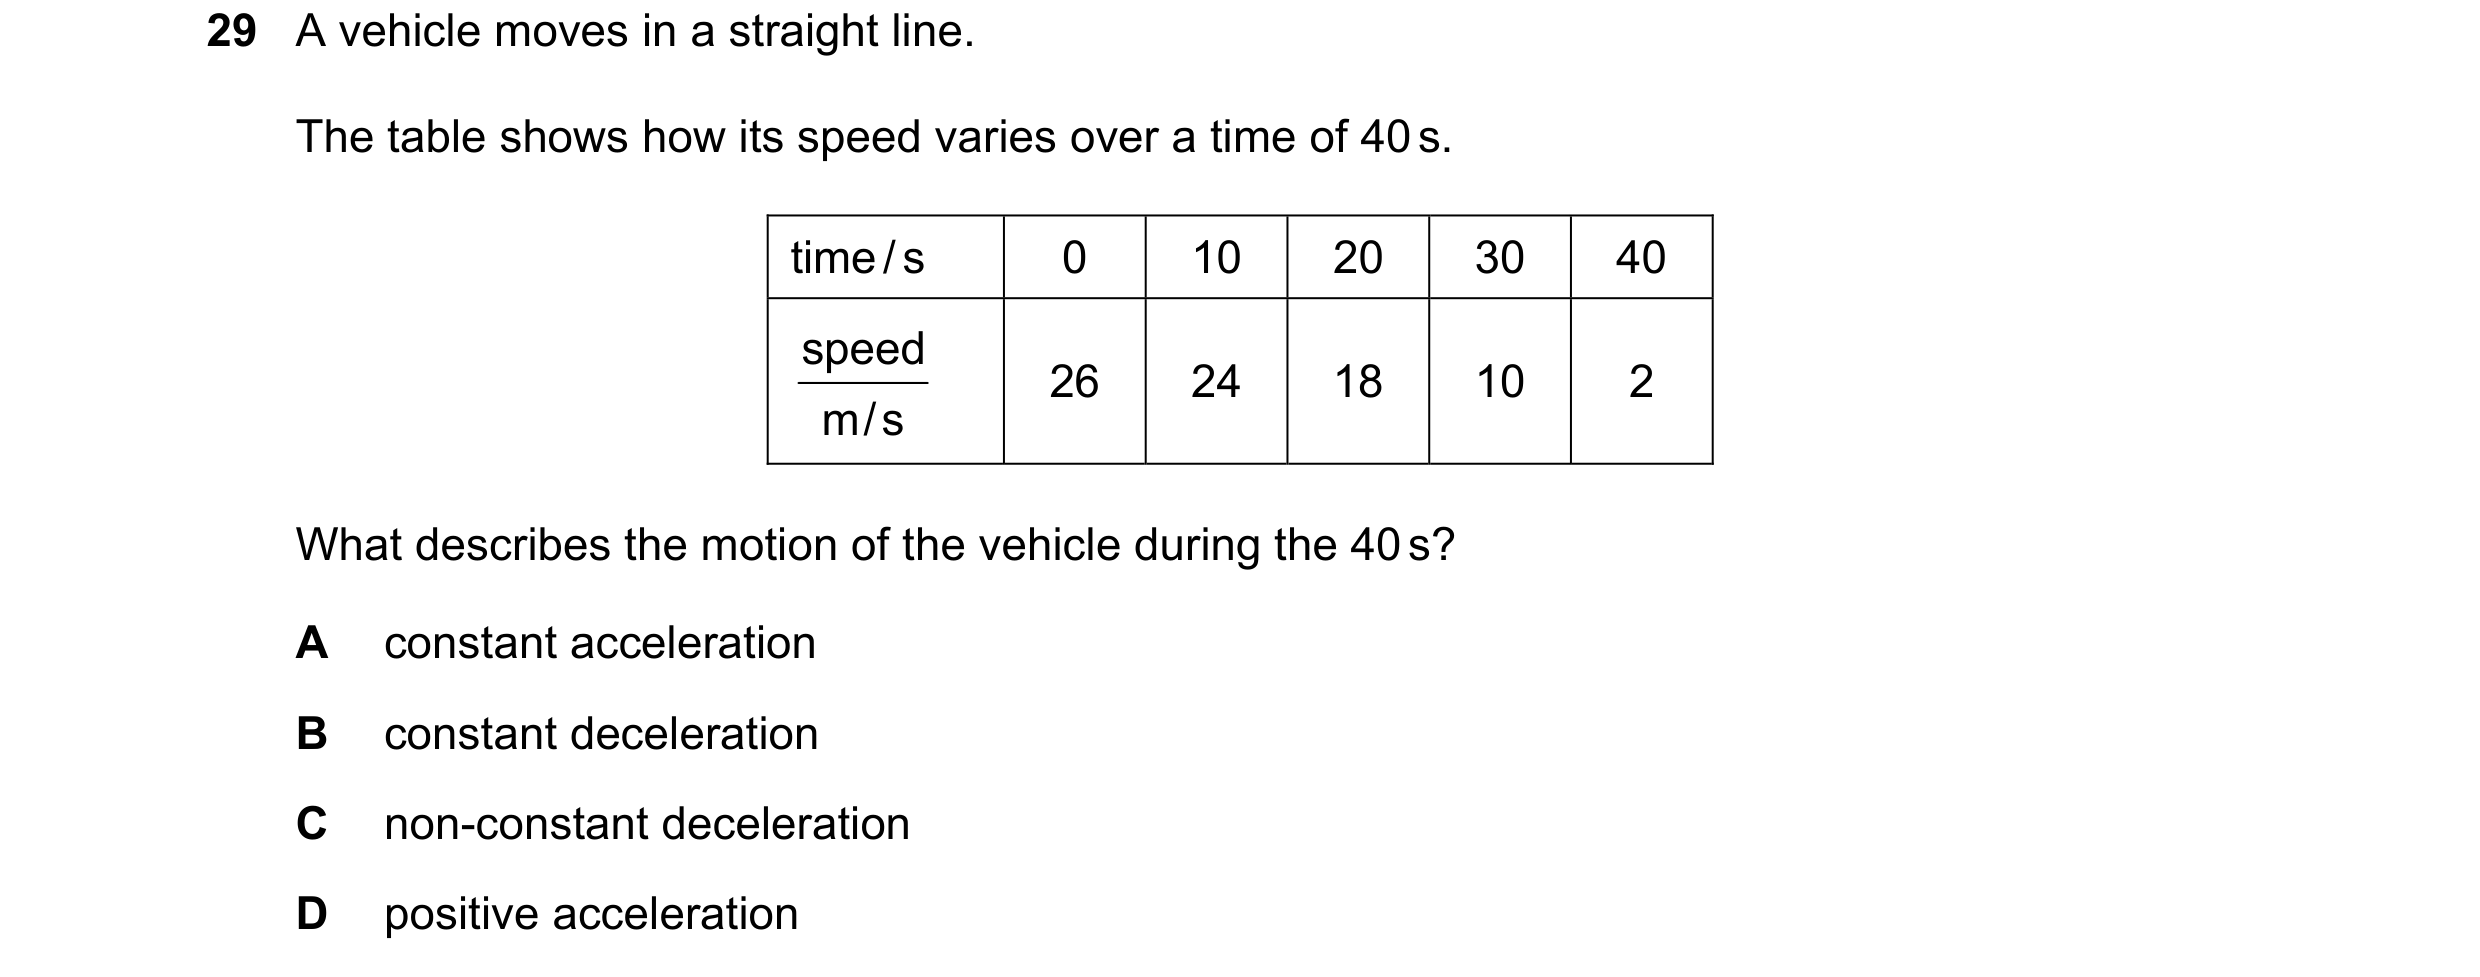
Q17 · A vehicle moves in a straight line 0653/22 Feb/March 2019
29 A vehicle moves in a straight line. The table shows how its speed varies over a time of 40 s. time / s 0 10 20 30 40 speed 26 24 18 10 2 m / s What describes the motion of the vehicle during the 40 s? A constant acceleration B constant deceleration C non-constant deceleration D positive acceleration
1 marks
Answer: C
This question in 0653/22 Feb/March 2019
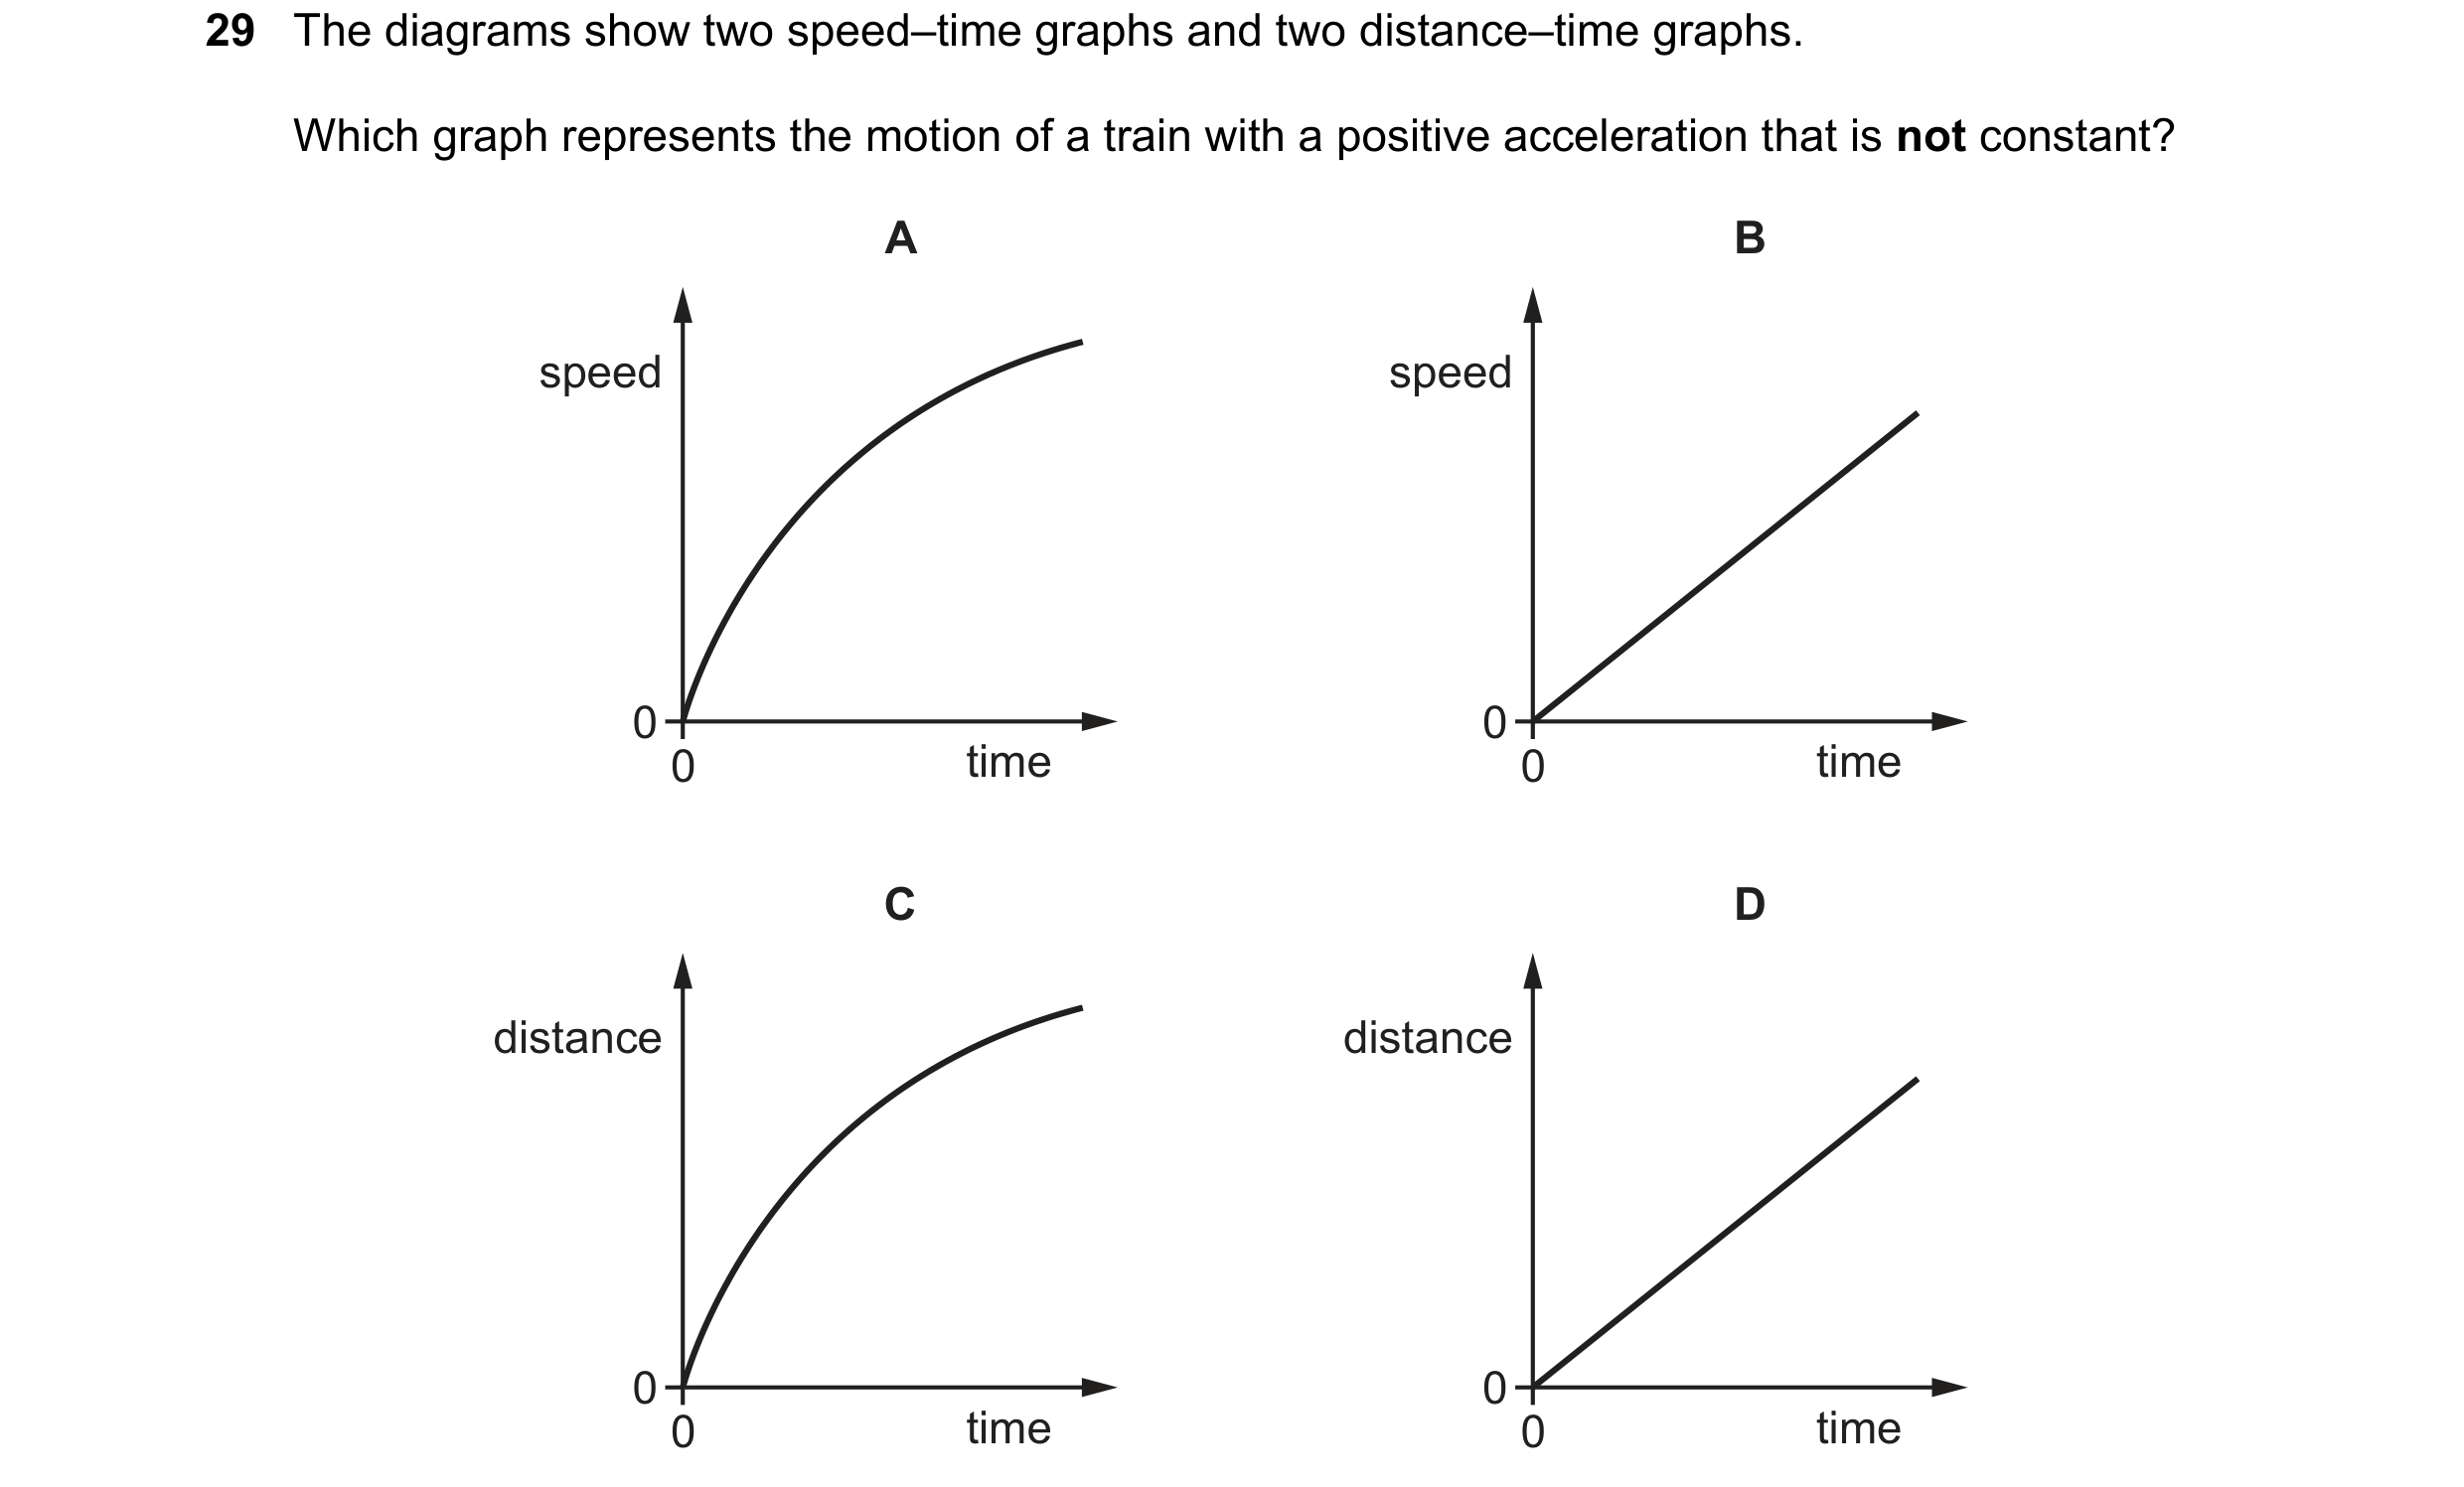
Q18 · The diagrams show two speed–time graphs and two distance–time graphs 0653/21 May/June 2019
29 The diagrams show two speed–time graphs and two distance–time graphs. Which graph represents the motion of a train with a positive acceleration that is not constant? A B speed speed 0 0 0 time 0 time C D distance distance 0 0 0 time 0 time
1 marks
Answer: A
This question in 0653/21 May/June 2019
Q19 · The speed of a car is measured at 1.0 s intervals 0653/22 May/June 2019
28 The speed of a car is measured at 1.0 s intervals. The results are shown in the table. time / s 0 1.0 2.0 3.0 4.0 speed 20 21 23 26 30 km / h Which is a description of the motion of the car? A at rest B constant acceleration C constant speed D non-constant acceleration
1 marks
Answer: D
This question in 0653/22 May/June 2019
Q20 · Which speed–time graph represents the motion of an object that travels a distance of 24 m? 0653/23 May/June 2019
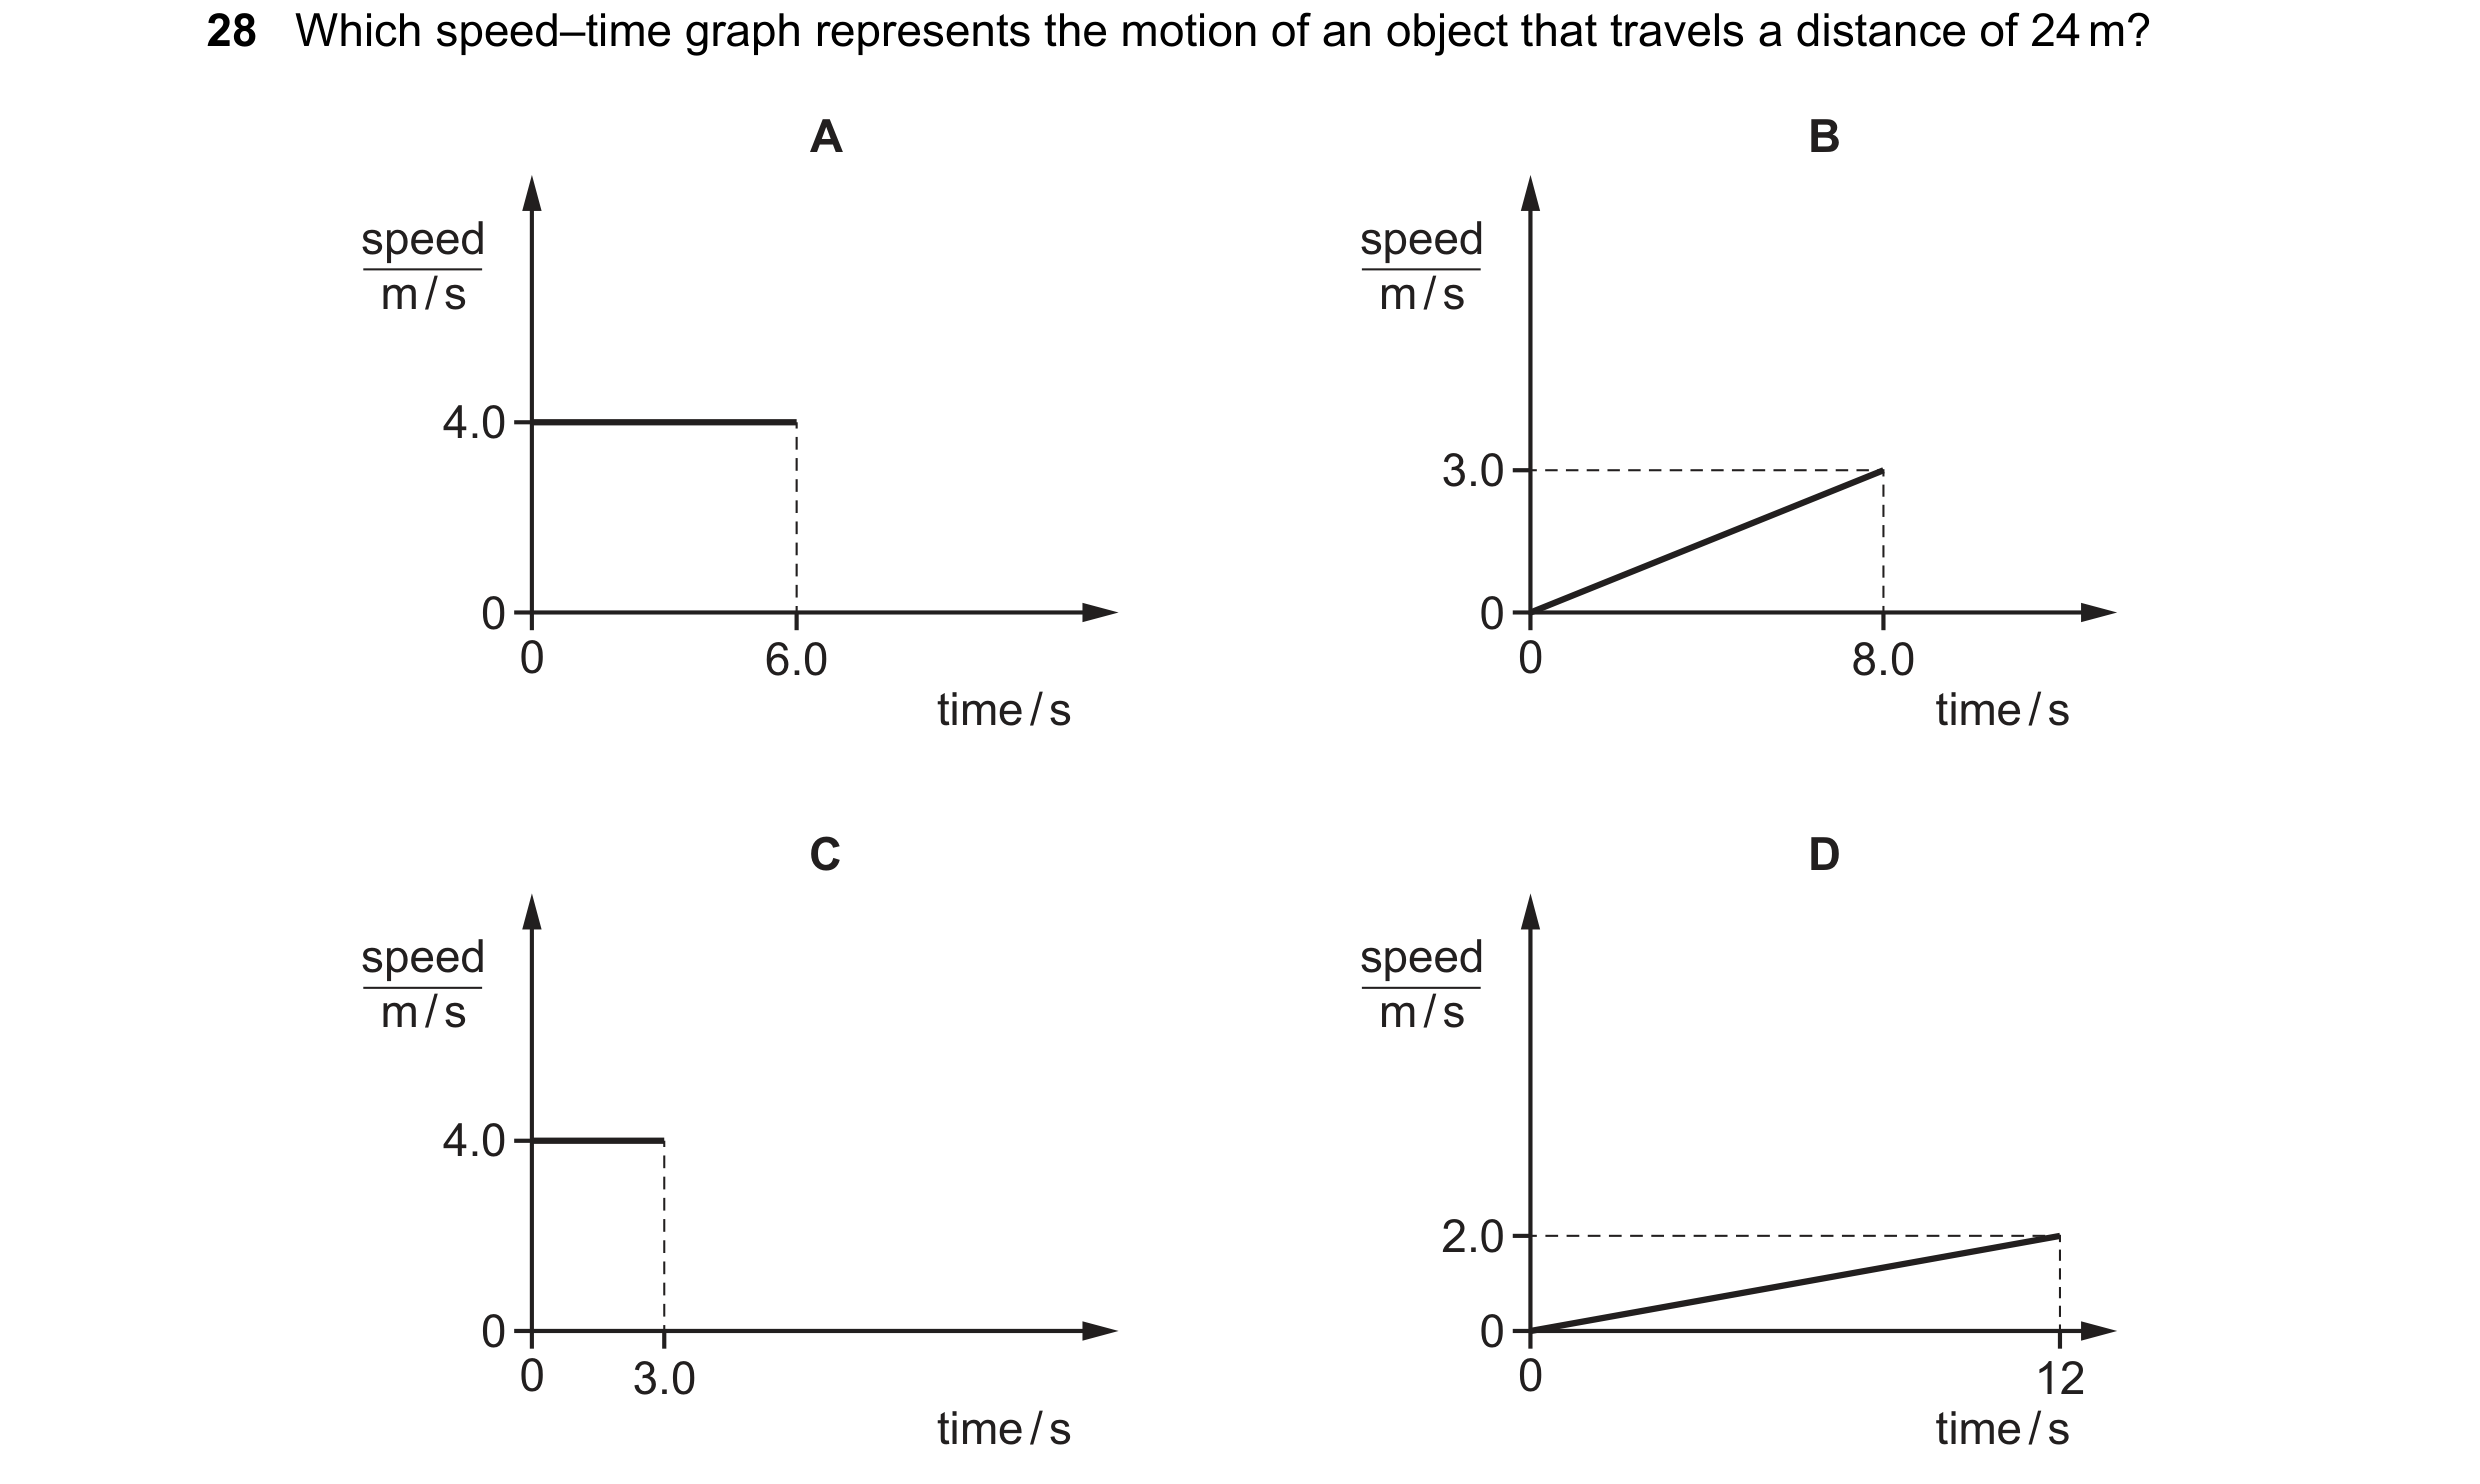
28 Which speed–time graph represents the motion of an object that travels a distance of 24 m? A B speed speed m / s m / s 4.0 3.0 0 0 0 6.0 0 8.0 time / s time / s C D speed speed m / s m / s 4.0 2.0 0 0 0 3.0 0 12 time / s time / s
1 marks
Answer: A
This question in 0653/23 May/June 2019
Q21 · A body moving with a speed of 2.0 m / s has a kinetic energy of 8.0 J 0653/23 May/June 2019
31 A body moving with a speed of 2.0 m / s has a kinetic energy of 8.0 J. What is the mass of the body? A 1.0 kg B 2.0 kg C 4.0 kg D 8.0 kg
1 marks
Answer: C
This question in 0653/23 May/June 2019
Q22 · The graph shows how the speed of a car changes with time 0653/21 Oct/Nov 2019
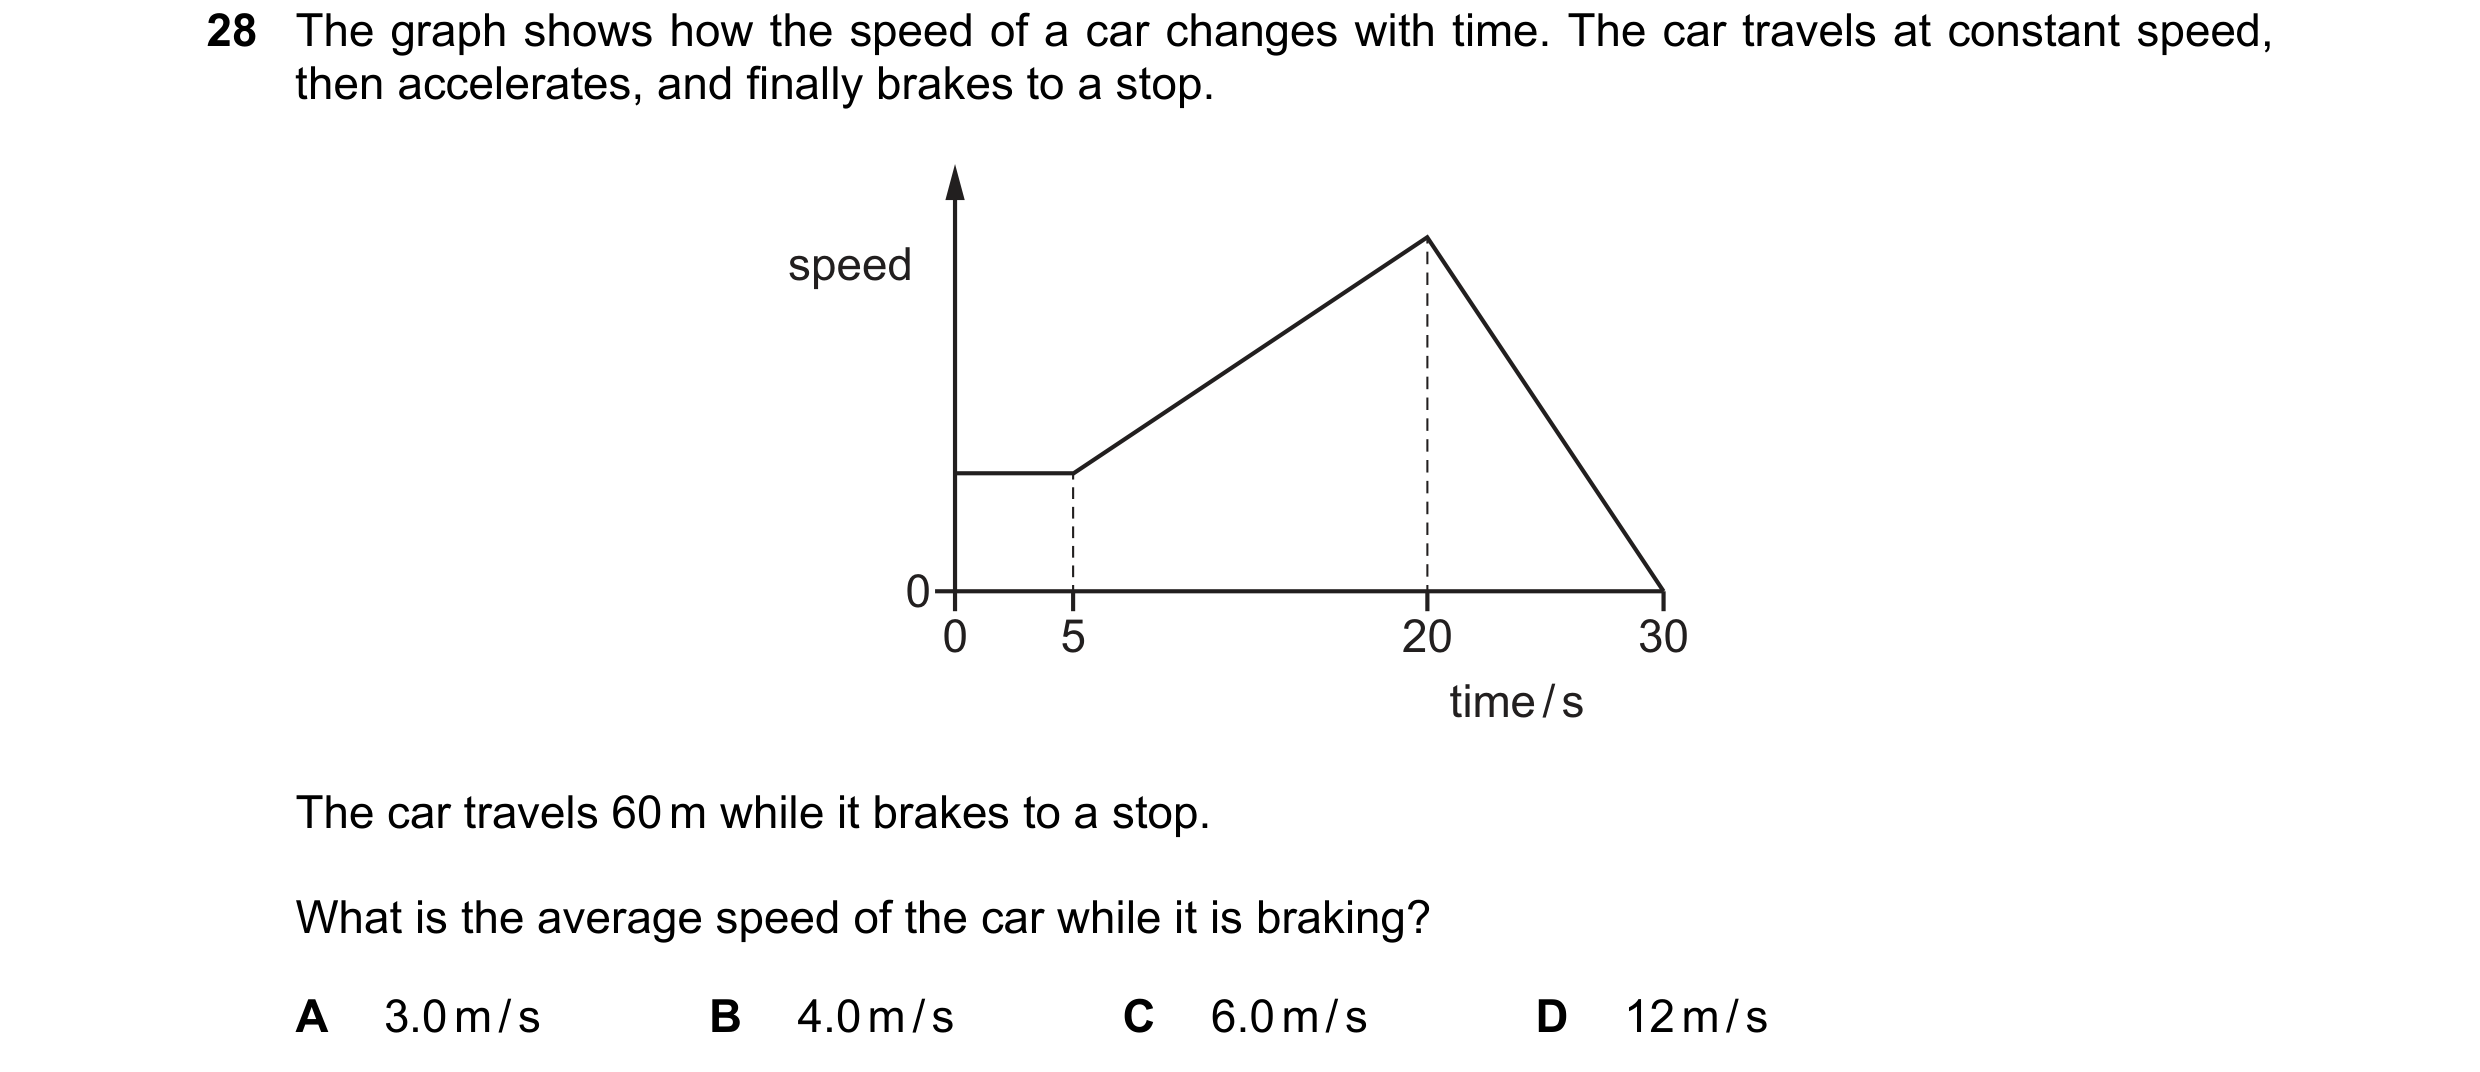
28 The graph shows how the speed of a car changes with time. The car travels at constant speed, then accelerates, and finally brakes to a stop. speed 0 0 5 20 30 time / s The car travels 60 m while it brakes to a stop. What is the average speed of the car while it is braking? A 3.0 m / s B 4.0 m / s C 6.0 m / s D 12 m / s
1 marks
Answer: C
This question in 0653/21 Oct/Nov 2019
Q23 · The graph shows how the speed of a car changes with time 0653/22 Oct/Nov 2019
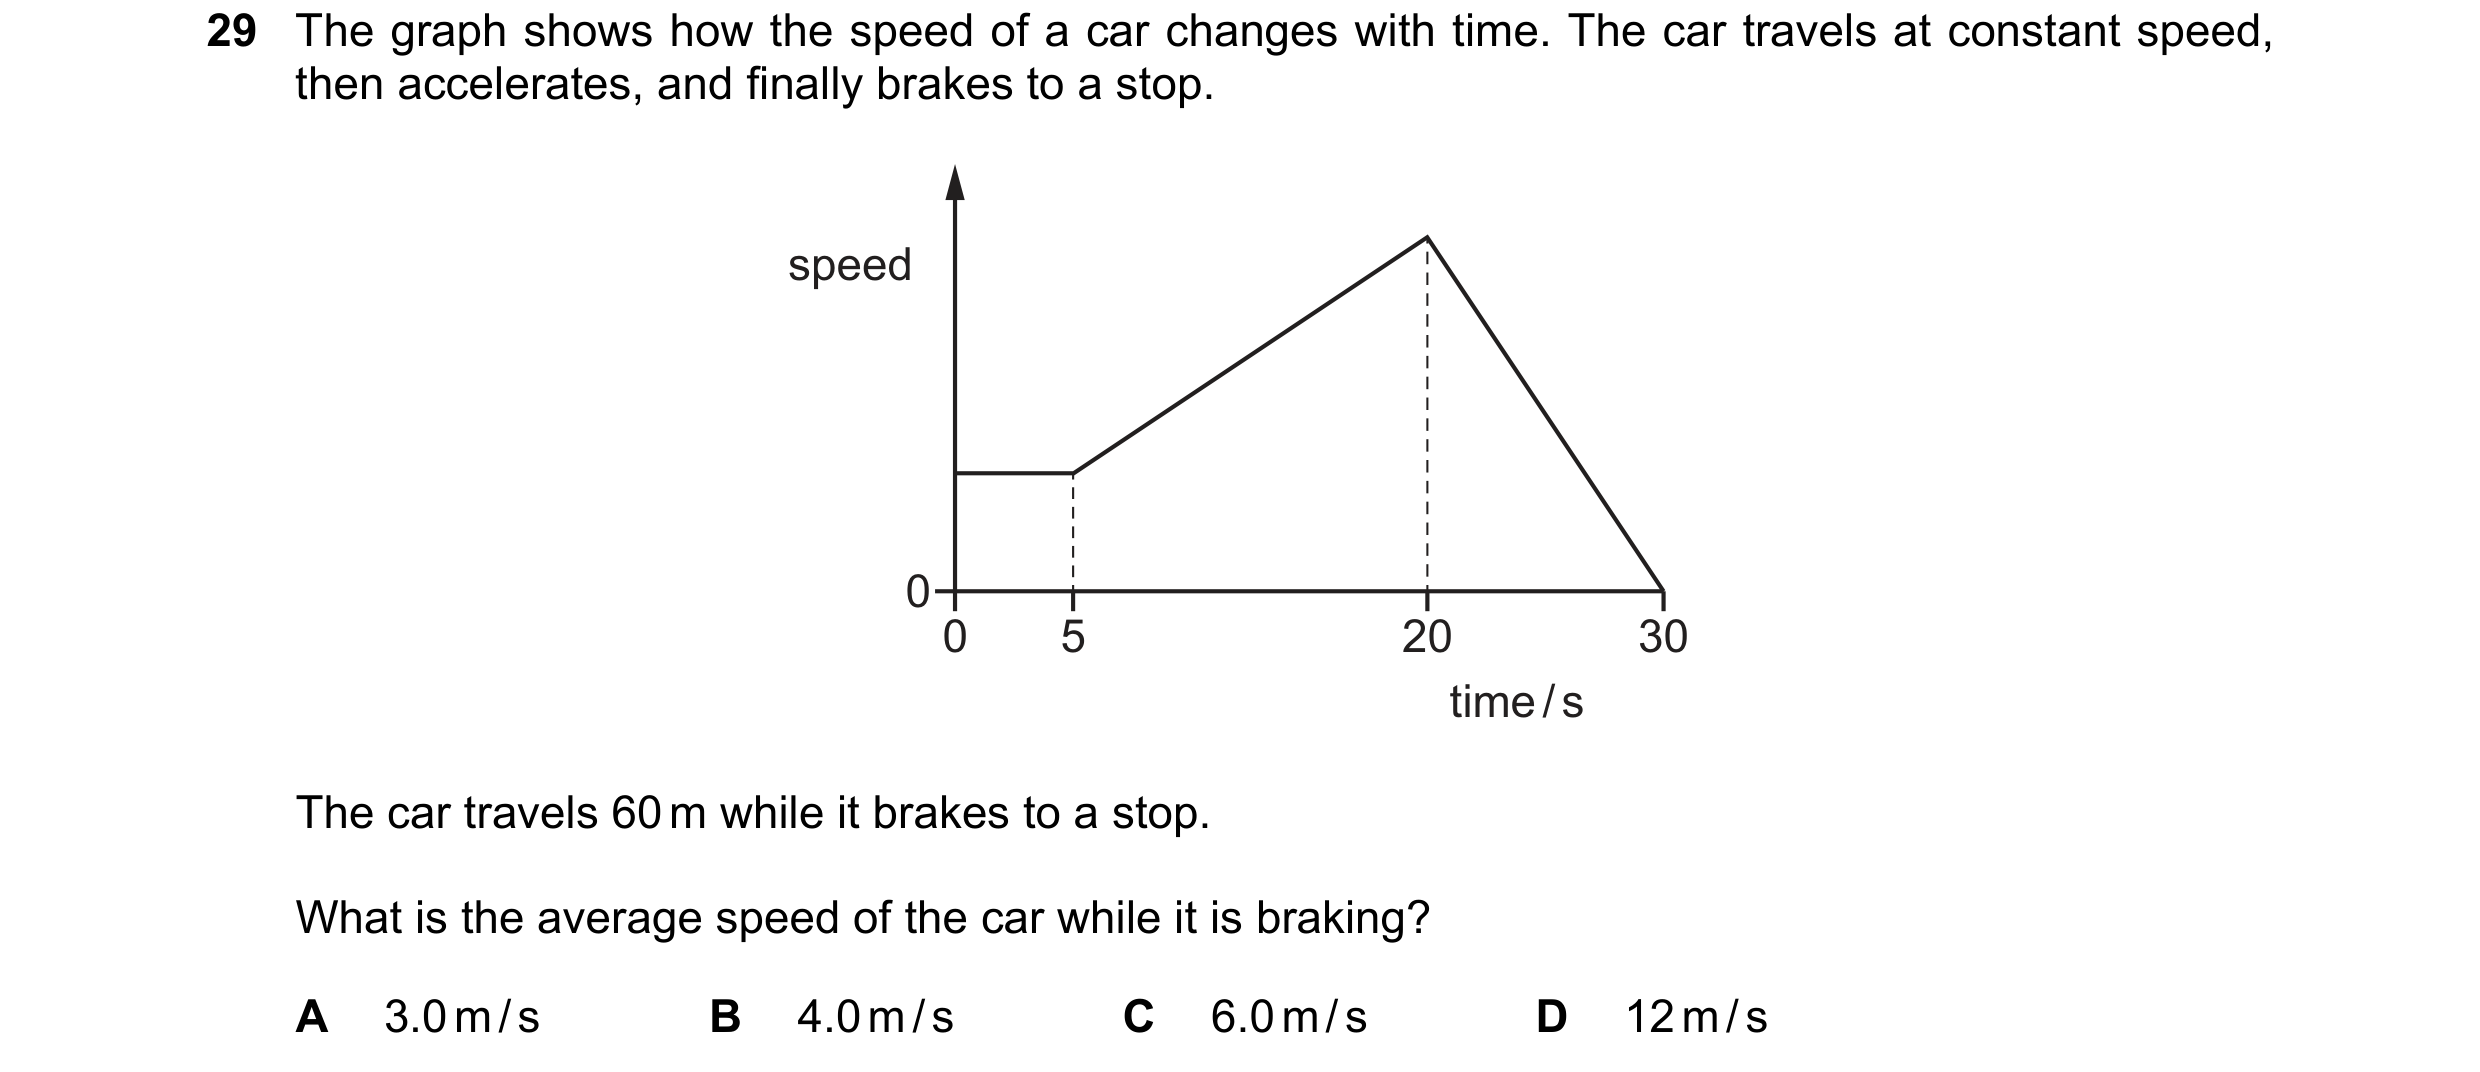
29 The graph shows how the speed of a car changes with time. The car travels at constant speed, then accelerates, and finally brakes to a stop. speed 0 0 5 20 30 time / s The car travels 60 m while it brakes to a stop. What is the average speed of the car while it is braking? A 3.0 m / s B 4.0 m / s C 6.0 m / s D 12 m / s
1 marks
Answer: C
This question in 0653/22 Oct/Nov 2019
Q24 · The graph shows how the speed of a car changes with time 0653/23 Oct/Nov 2019
28 The graph shows how the speed of a car changes with time. The car travels at constant speed, then accelerates, and finally brakes to a stop. speed 0 0 5 20 30 time / s The car travels 60 m while it brakes to a stop. What is the average speed of the car while it is braking? A 3.0 m / s B 4.0 m / s C 6.0 m / s D 12 m / s
1 marks
Answer: C
This question in 0653/23 Oct/Nov 2019
Q25 · The diagrams show two distance–time graphs and two speed–time graphs 0653/22 Feb/March 2020
28 The diagrams show two distance–time graphs and two speed–time graphs. Which graph represents the motion of an object that is moving with constant acceleration? A B distance distance 0 0 0 time 0 time C D speed speed 0 0 0 time 0 time
1 marks
Answer: D
This question in 0653/22 Feb/March 2020
Q26 · A car travels at various speeds during a short journey 0653/21 May/June 2020
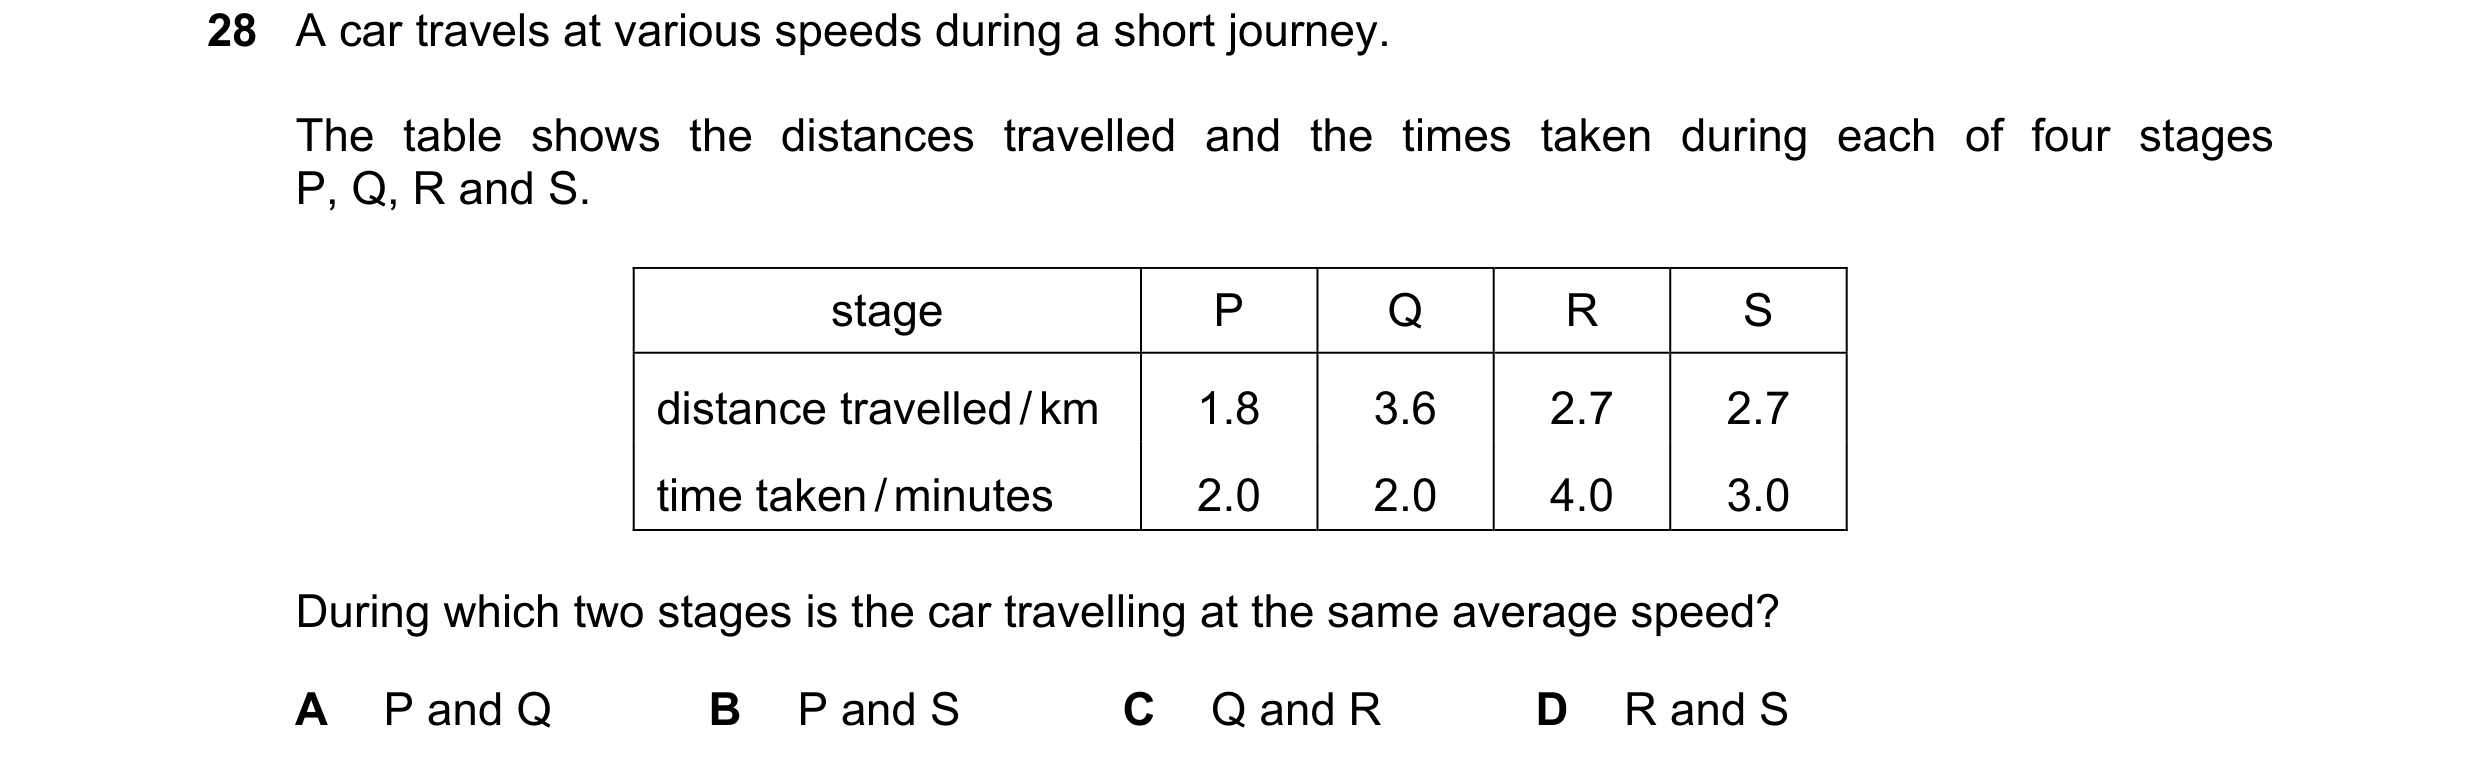
28 A car travels at various speeds during a short journey. The table shows the distances travelled and the times taken during each of four stages P, Q, R and S. stage P Q R S distance travelled / km 1.8 3.6 2.7 2.7 time taken / minutes 2.0 2.0 4.0 3.0 During which two stages is the car travelling at the same average speed? A P and Q B P and S C Q and R D R and S
1 marks
Answer: B
This question in 0653/21 May/June 2020
Q27 · An object is travelling in a straight line at constant speed 0653/21 May/June 2020
30 An object is travelling in a straight line at constant speed. Which statement describes the resultant force on the object? A It acts in the opposite direction to the motion of the object. B It acts in the same direction as the motion of the object. C It is constant, but not zero. D It is zero.
1 marks
Answer: D
This question in 0653/21 May/June 2020
Q28 · Which distance–time graph represents a body that is moving with changing speed? 0653/22 May/June 2020
28 Which distance–time graph represents a body that is moving with changing speed? A B distance distance 0 0 0 time 0 time C D distance distance 0 0 0 time 0 time
1 marks
Answer: D
This question in 0653/22 May/June 2020
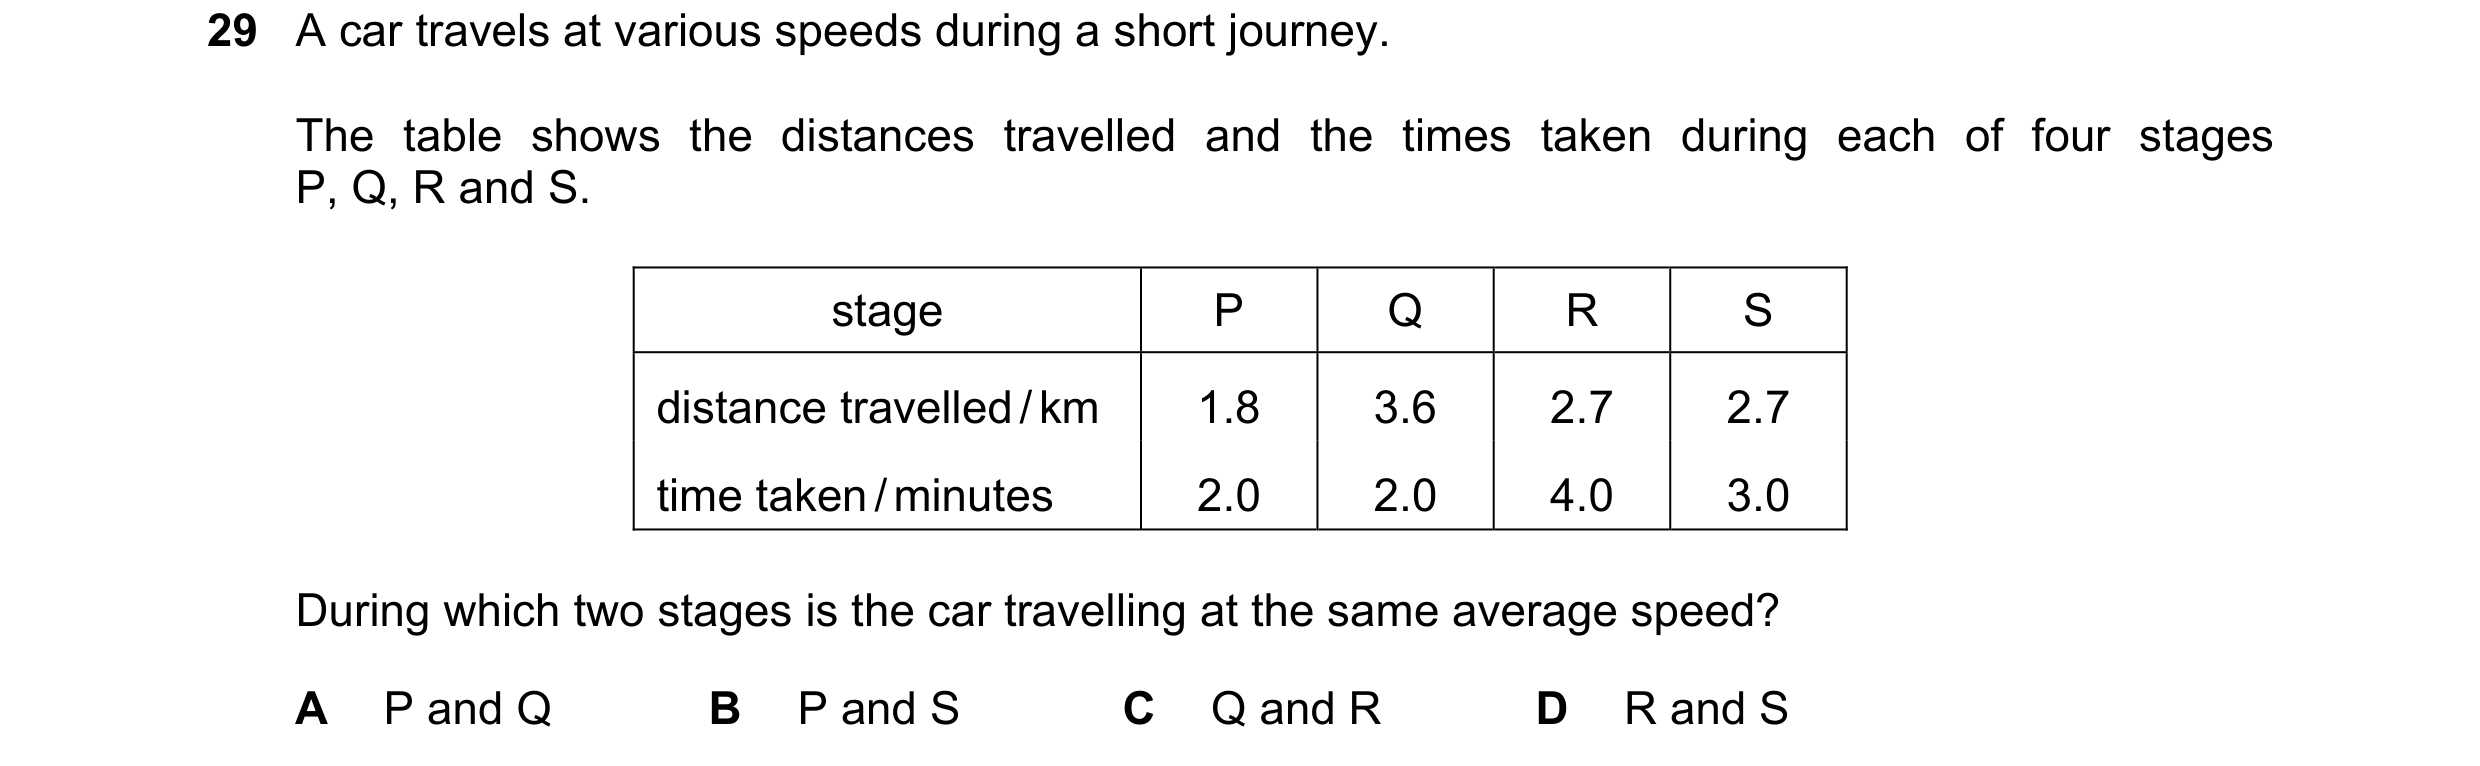
Q29 · A car travels at various speeds during a short journey 0653/22 May/June 2020
29 A car travels at various speeds during a short journey. The table shows the distances travelled and the times taken during each of four stages P, Q, R and S. stage P Q R S distance travelled / km 1.8 3.6 2.7 2.7 time taken / minutes 2.0 2.0 4.0 3.0 During which two stages is the car travelling at the same average speed? A P and Q B P and S C Q and R D R and S
1 marks
Answer: B
This question in 0653/22 May/June 2020
Q30 · What does the area under a speed–time graph represent? 0653/21 Oct/Nov 2020
28 What does the area under a speed–time graph represent? A acceleration B average speed C distance travelled D maximum speed
1 marks
Answer: C
This question in 0653/21 Oct/Nov 2020
Q31 · The diagram shows the speed–time graph for an object 0653/22 Oct/Nov 2020
28 The diagram shows the speed–time graph for an object. speed 20 m / s 10 0 0 30 time / s What is the distance travelled by the object in 30 s? A 150 m B 300 m C 450 m D 600 m
1 marks
Answer: C
This question in 0653/22 Oct/Nov 2020
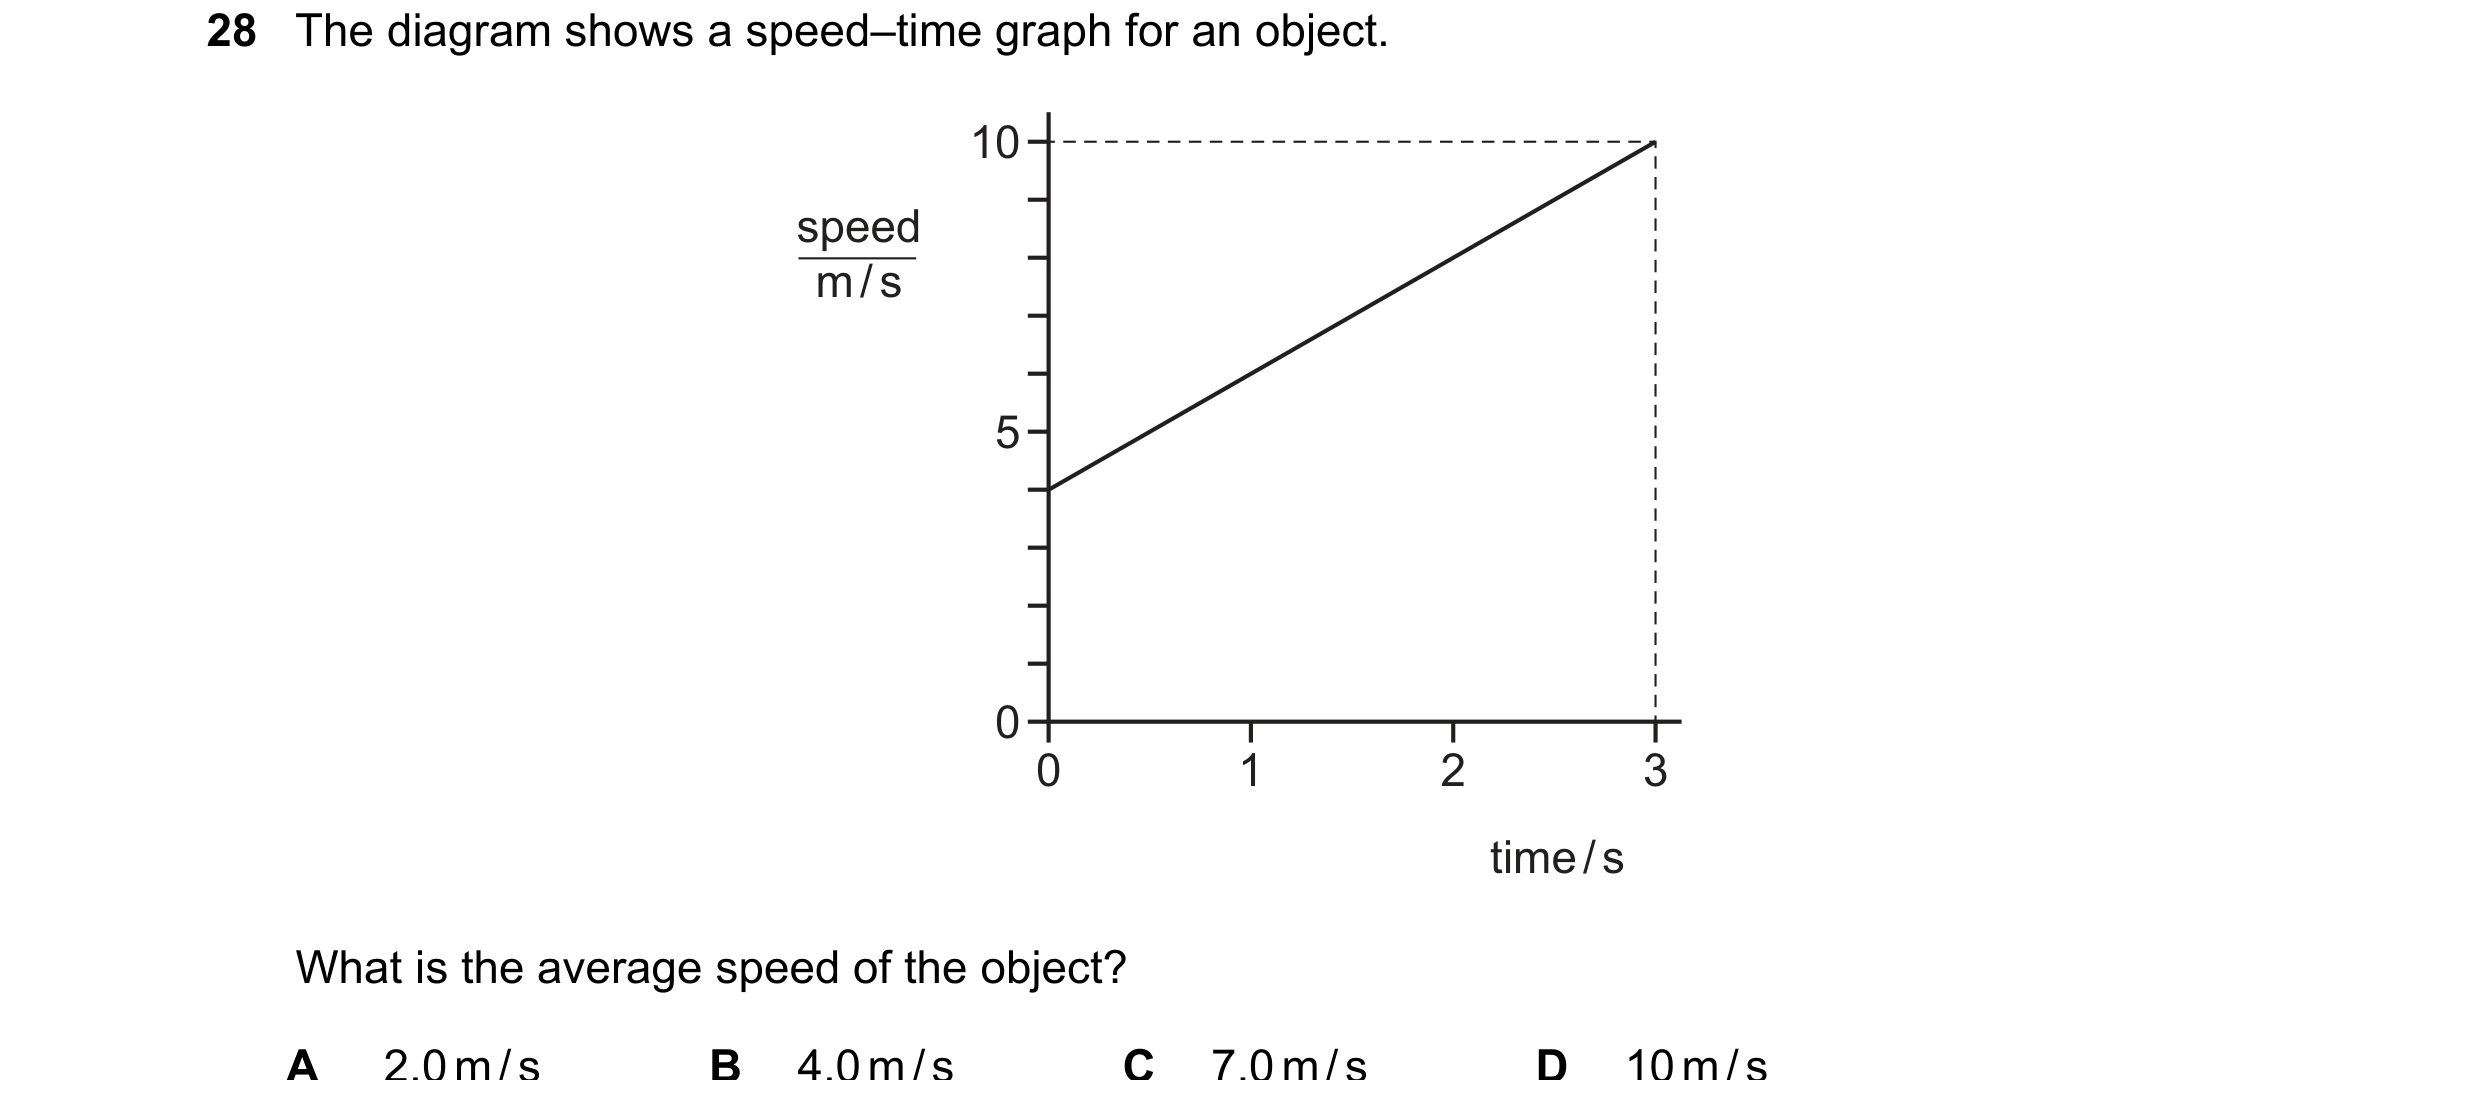
Q32 · The diagram shows a speed–time graph for an object 0653/23 Oct/Nov 2020
28 The diagram shows a speed–time graph for an object. 10 speed m / s 5 0 0 1 2 3 time / s What is the average speed of the object? A 2.0 m / s B 4.0 m / s C 7.0 m / s D 10 m / s
1 marks
Answer: C
This question in 0653/23 Oct/Nov 2020
Question 33 0653/22 Feb/March 2021
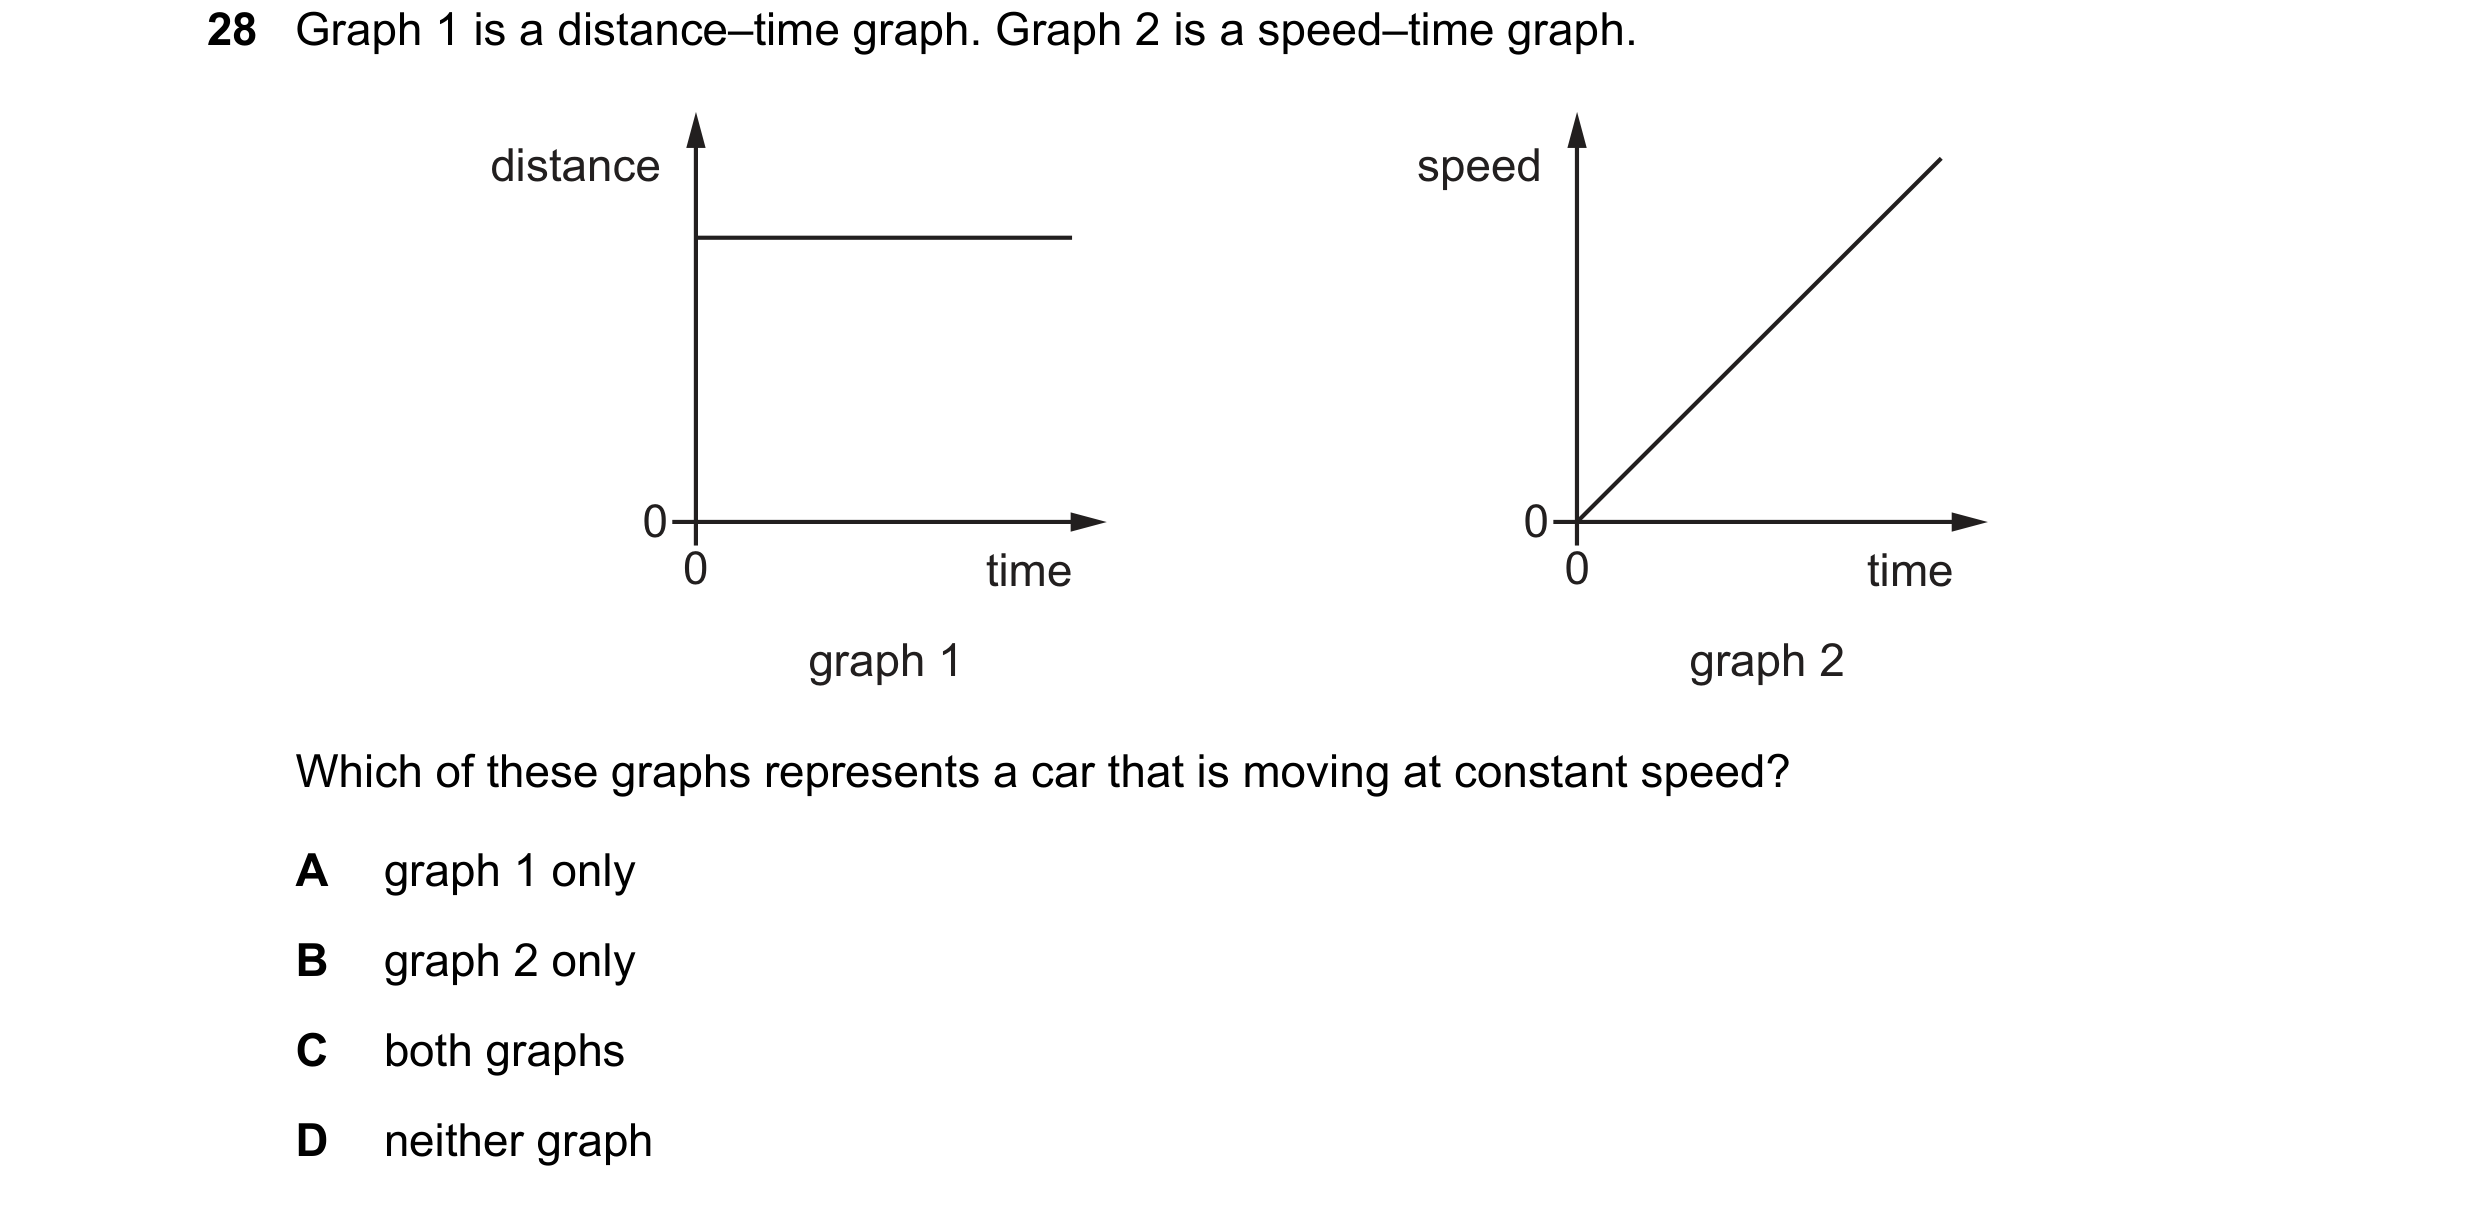
28 Graph 1 is a distance–time graph. Graph 2 is a speed–time graph. distance speed 0 0 0 time 0 time graph 1 graph 2 Which of these graphs represents a car that is moving at constant speed? A graph 1 only B graph 2 only C both graphs D neither graph
1 marks
Answer: D
This question in 0653/22 Feb/March 2021
Question 34 0653/21 May/June 2021
29 Diagram 1 is a distance–time graph. Diagram 2 and diagram 3 are speed–time graphs. distance speed speed 0 0 0 0 time 0 time 0 time diagram 1 diagram 2 diagram 3 Which of the diagrams represents the motion of an object moving with a non-zero constant acceleration? A 1 and 3 B 1 only C 2 only D 3 only
1 marks
Answer: D
This question in 0653/21 May/June 2021
Question 35 0653/22 May/June 2021
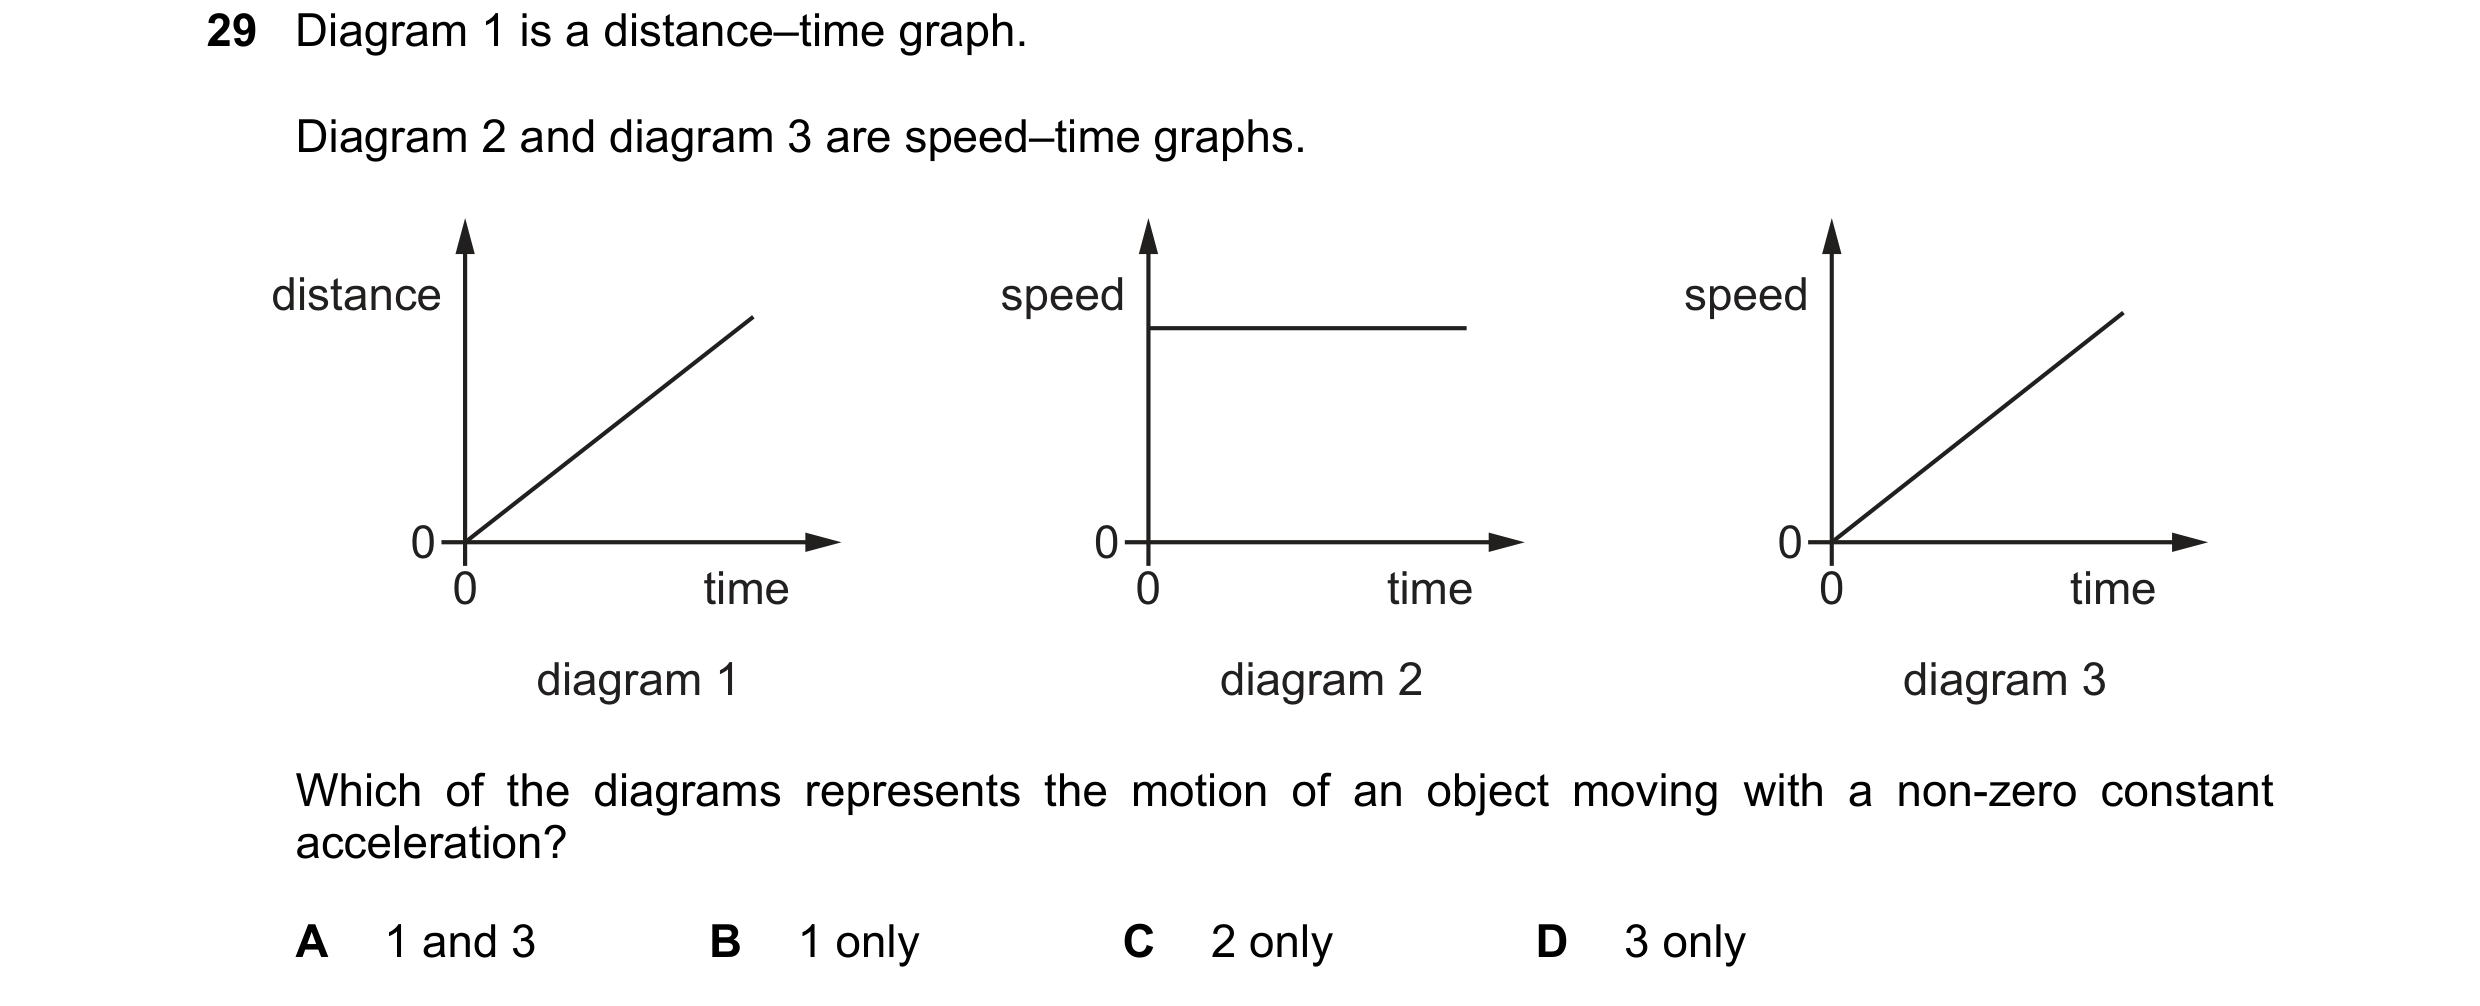
29 Diagram 1 is a distance–time graph. Diagram 2 and diagram 3 are speed–time graphs. distance speed speed 0 0 0 0 time 0 time 0 time diagram 1 diagram 2 diagram 3 Which of the diagrams represents the motion of an object moving with a non-zero constant acceleration? A 1 and 3 B 1 only C 2 only D 3 only
1 marks
Answer: D
This question in 0653/22 May/June 2021
Q36 · An athlete of mass 62 kg jumps through a vertical height of 1.25 m 0653/22 May/June 2021
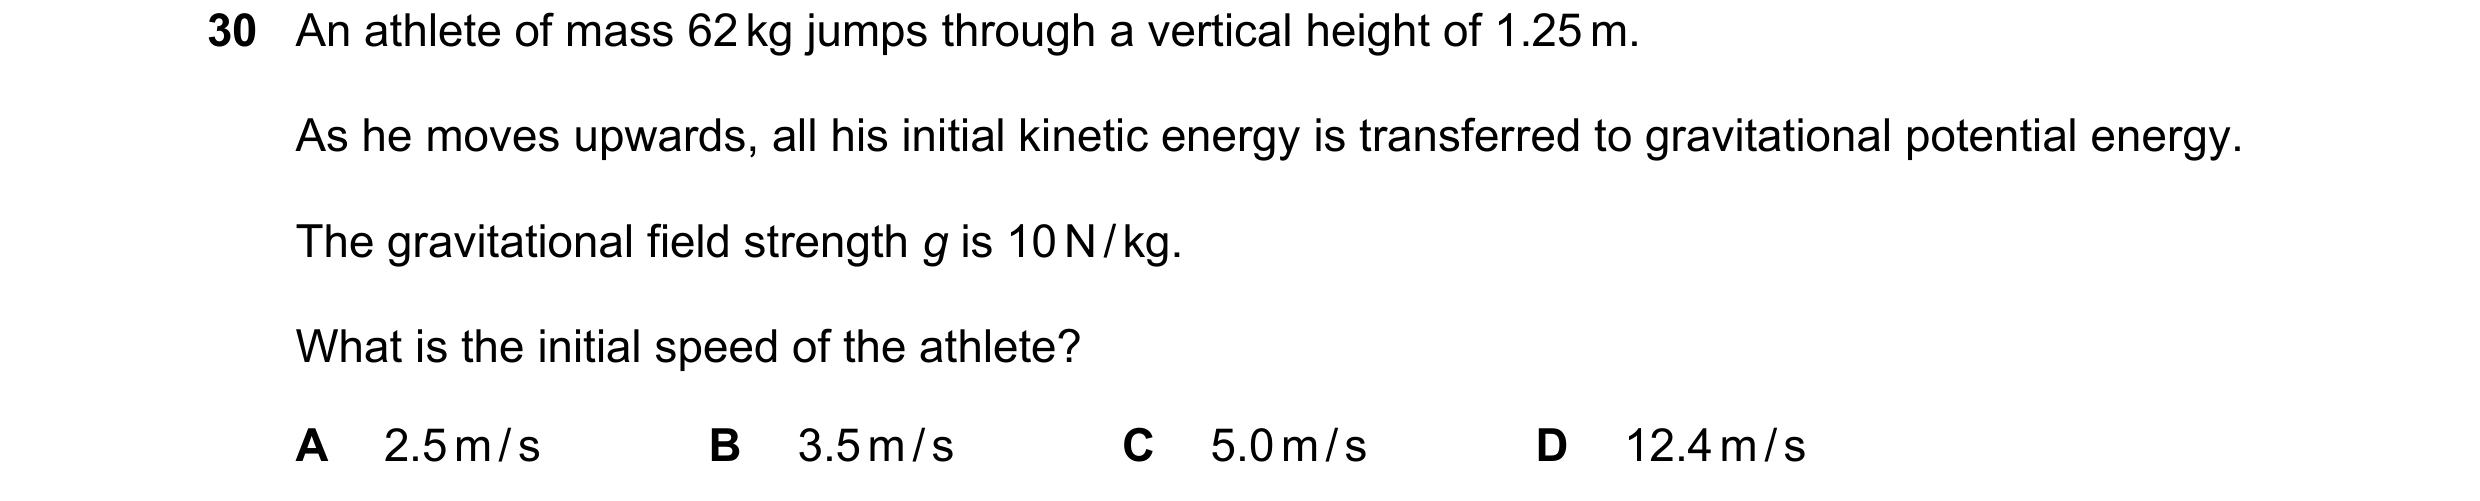
30 An athlete of mass 62 kg jumps through a vertical height of 1.25 m. As he moves upwards, all his initial kinetic energy is transferred to gravitational potential energy. The gravitational field strength g is 10 N / kg. What is the initial speed of the athlete? A 2.5 m / s B 3.5 m / s C 5.0 m / s D 12.4 m / s
1 marks
Answer: C
This question in 0653/22 May/June 2021
Question 37 0653/23 May/June 2021
29 Diagram 1 is a distance–time graph. Diagram 2 and diagram 3 are speed–time graphs. distance speed speed 0 0 0 0 time 0 time 0 time diagram 1 diagram 2 diagram 3 Which of the diagrams represents the motion of an object moving with a non-zero constant acceleration? A 1 and 3 B 1 only C 2 only D 3 only
1 marks
Answer: D
This question in 0653/23 May/June 2021
Q38 · The diagram shows the speed–time graph for an object that is accelerating 0653/21 Oct/Nov 2021
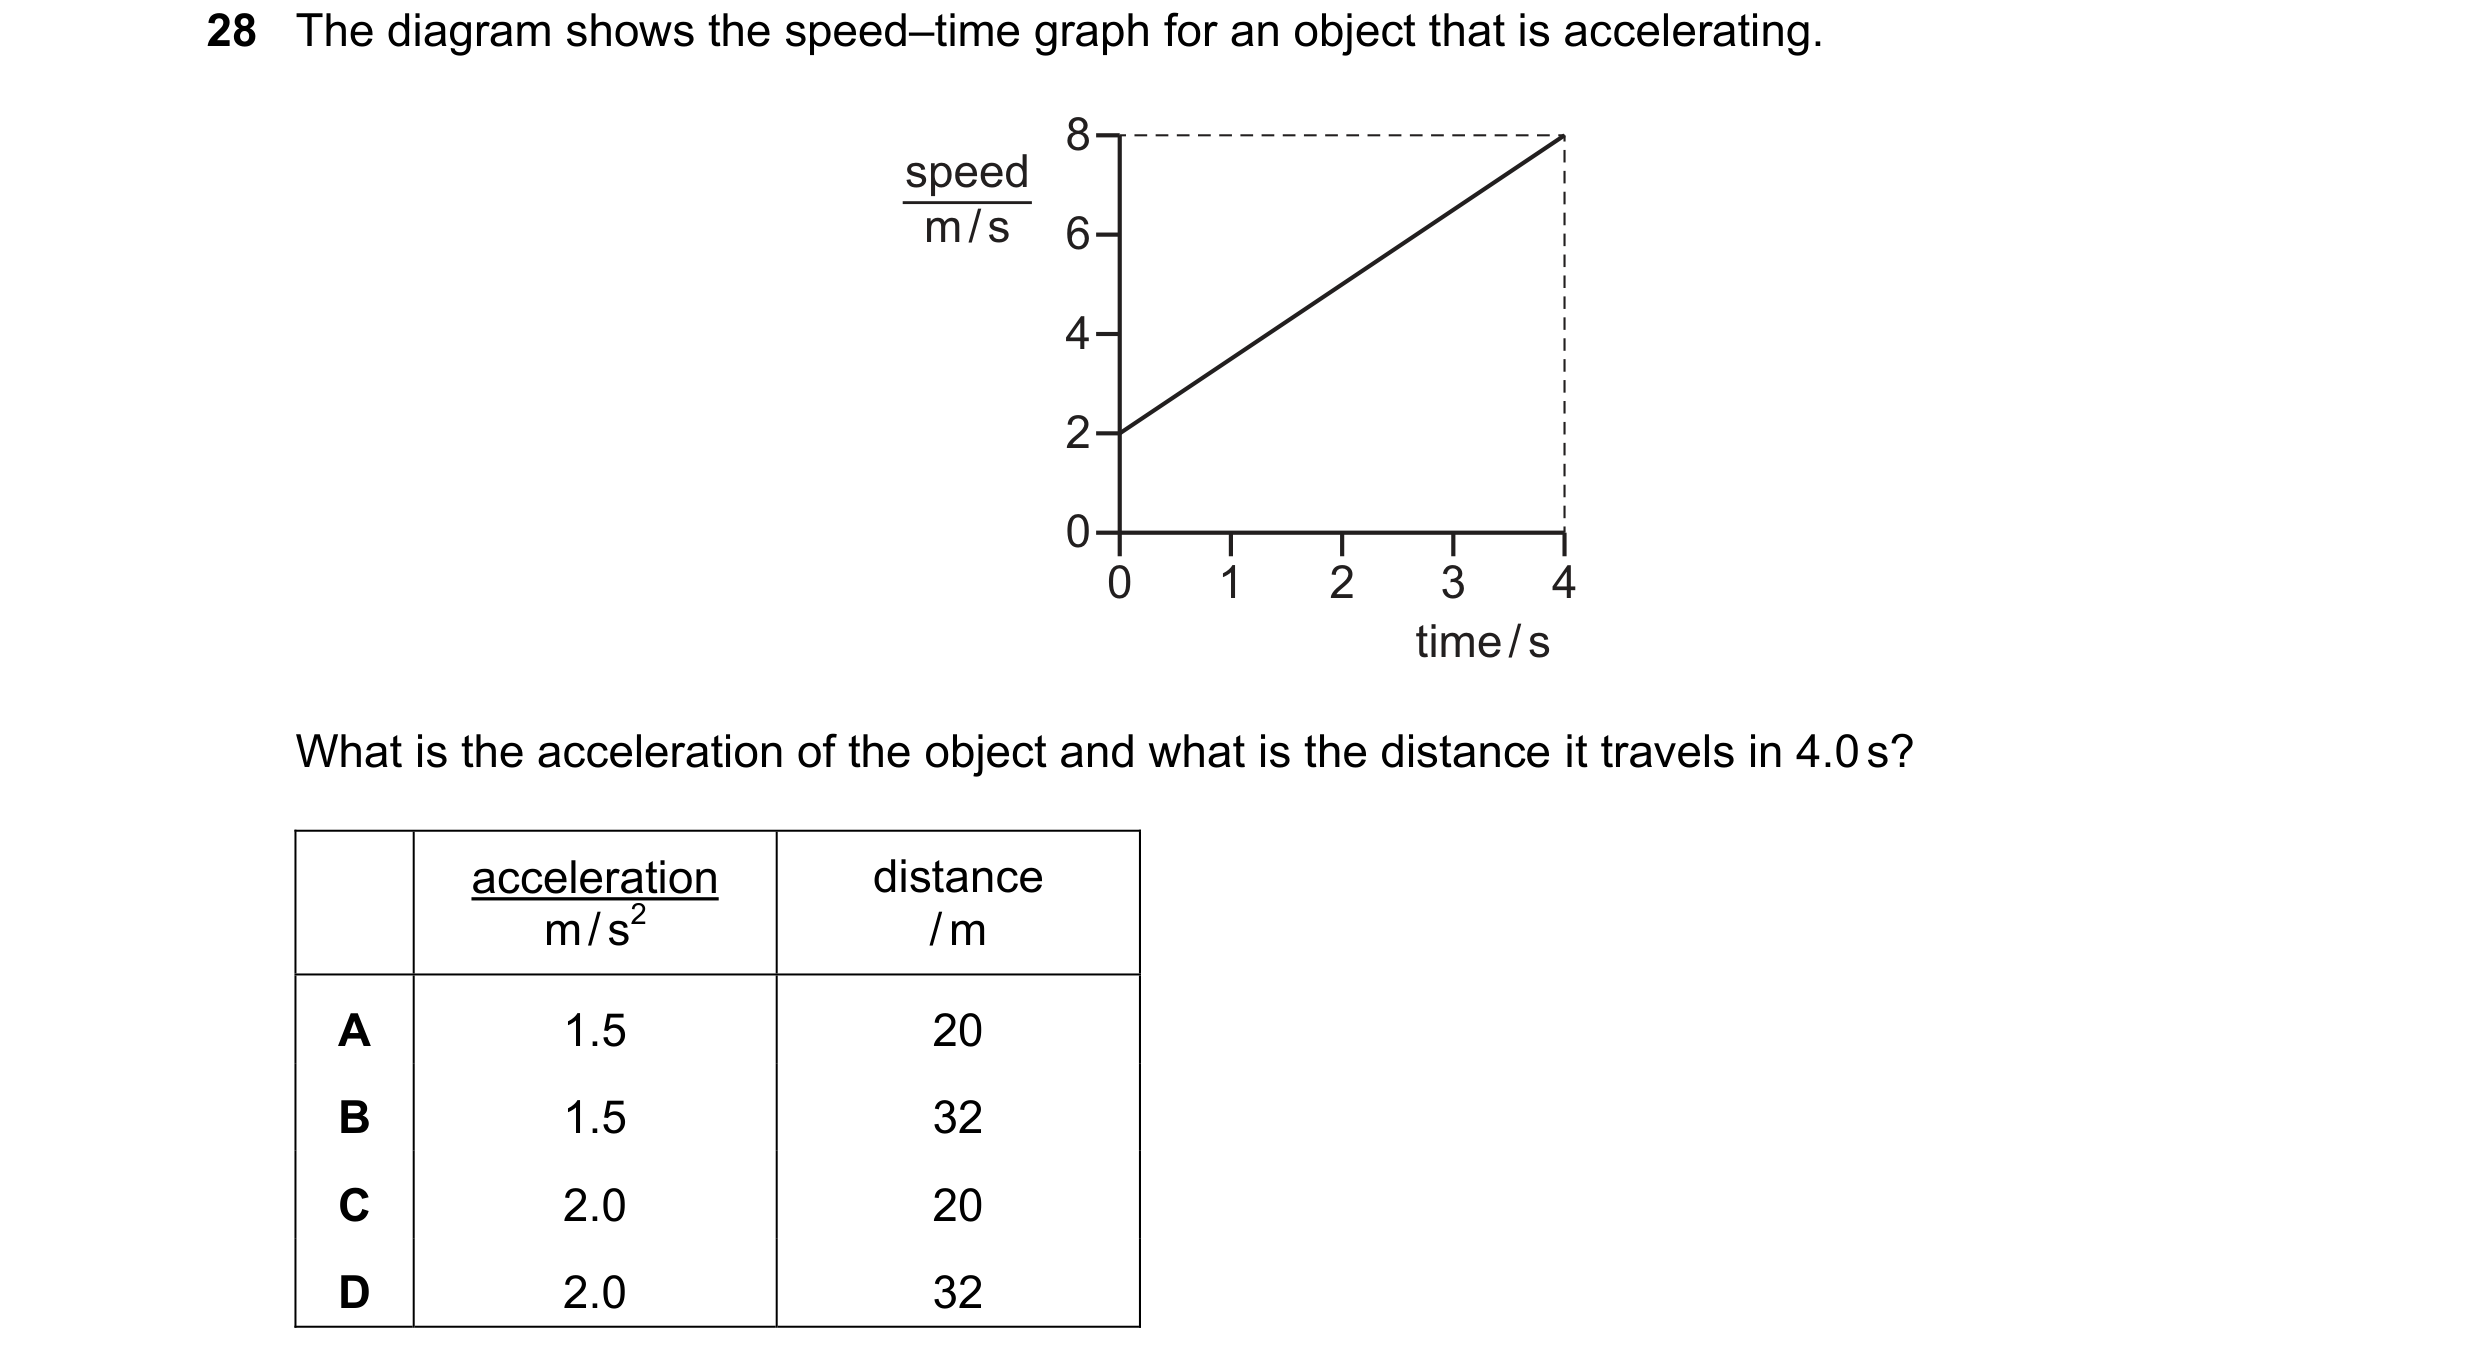
28 The diagram shows the speed–time graph for an object that is accelerating. 8 speed m / s 6 4 2 0 0 1 2 3 4 time / s What is the acceleration of the object and what is the distance it travels in 4.0 s? acceleration distance m / s2 / m A 1.5 20 B 1.5 32 C 2.0 20 D 2.0 32
1 marks
Answer: A
This question in 0653/21 Oct/Nov 2021
Q39 · A car accelerates from rest at a constant rate 0653/22 Oct/Nov 2021
28 A car accelerates from rest at a constant rate. It then moves with constant speed and finally comes to rest with non-constant deceleration. Which diagram shows the speed–time graph for the car? A B speed speed 0 0 0 time 0 time C D speed speed 0 0 0 time 0 time
1 marks
Answer: A
This question in 0653/22 Oct/Nov 2021
Q40 · A distance–time graph and a speed–time graph are plotted for a moving vehicle 0653/23 Oct/Nov 2021
28 A distance–time graph and a speed–time graph are plotted for a moving vehicle. Which feature gives the acceleration of the vehicle? A the area under the distance–time graph B the area under the speed–time graph C the gradient of the distance–time graph D the gradient of the speed–time graph
1 marks
Answer: D
This question in 0653/23 Oct/Nov 2021
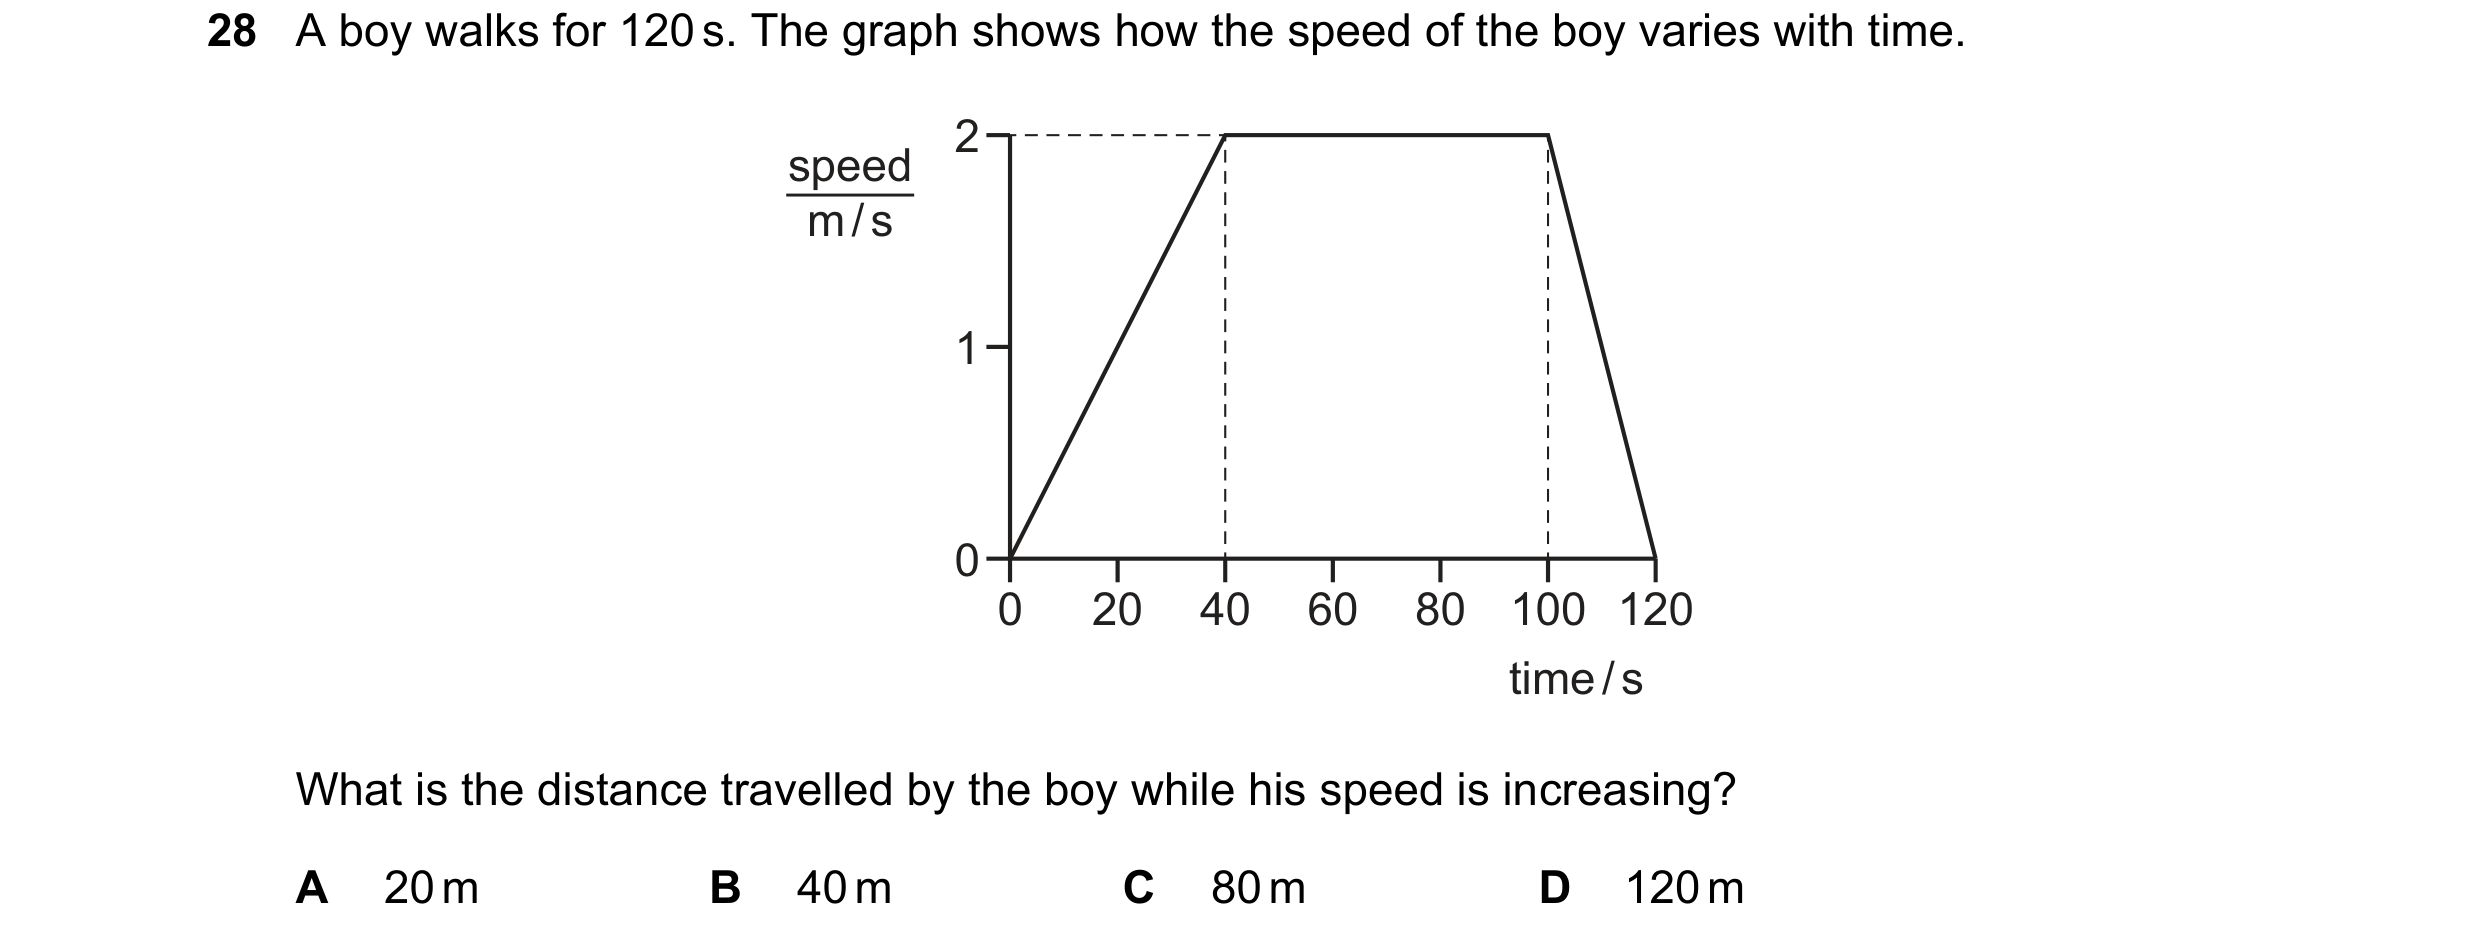
Q41 · A boy walks for 120 s 0653/22 Feb/March 2022
28 A boy walks for 120 s. The graph shows how the speed of the boy varies with time. 2 speed m / s 1 0 0 20 40 60 80 100 120 time / s What is the distance travelled by the boy while his speed is increasing? A 20 m B 40 m C 80 m D 120 m
1 marks
Answer: B
This question in 0653/22 Feb/March 2022
Q42 · Light takes 500 s to travel from the Sun to the Earth 0653/21 Oct/Nov 2022
35 Light takes 500 s to travel from the Sun to the Earth. What is the distance from the Sun to the Earth? A 1.7 105 m B 6.0 105 m C 3.0 108 m D 1.5 1011 m
1 marks
Answer: D
This question in 0653/21 Oct/Nov 2022
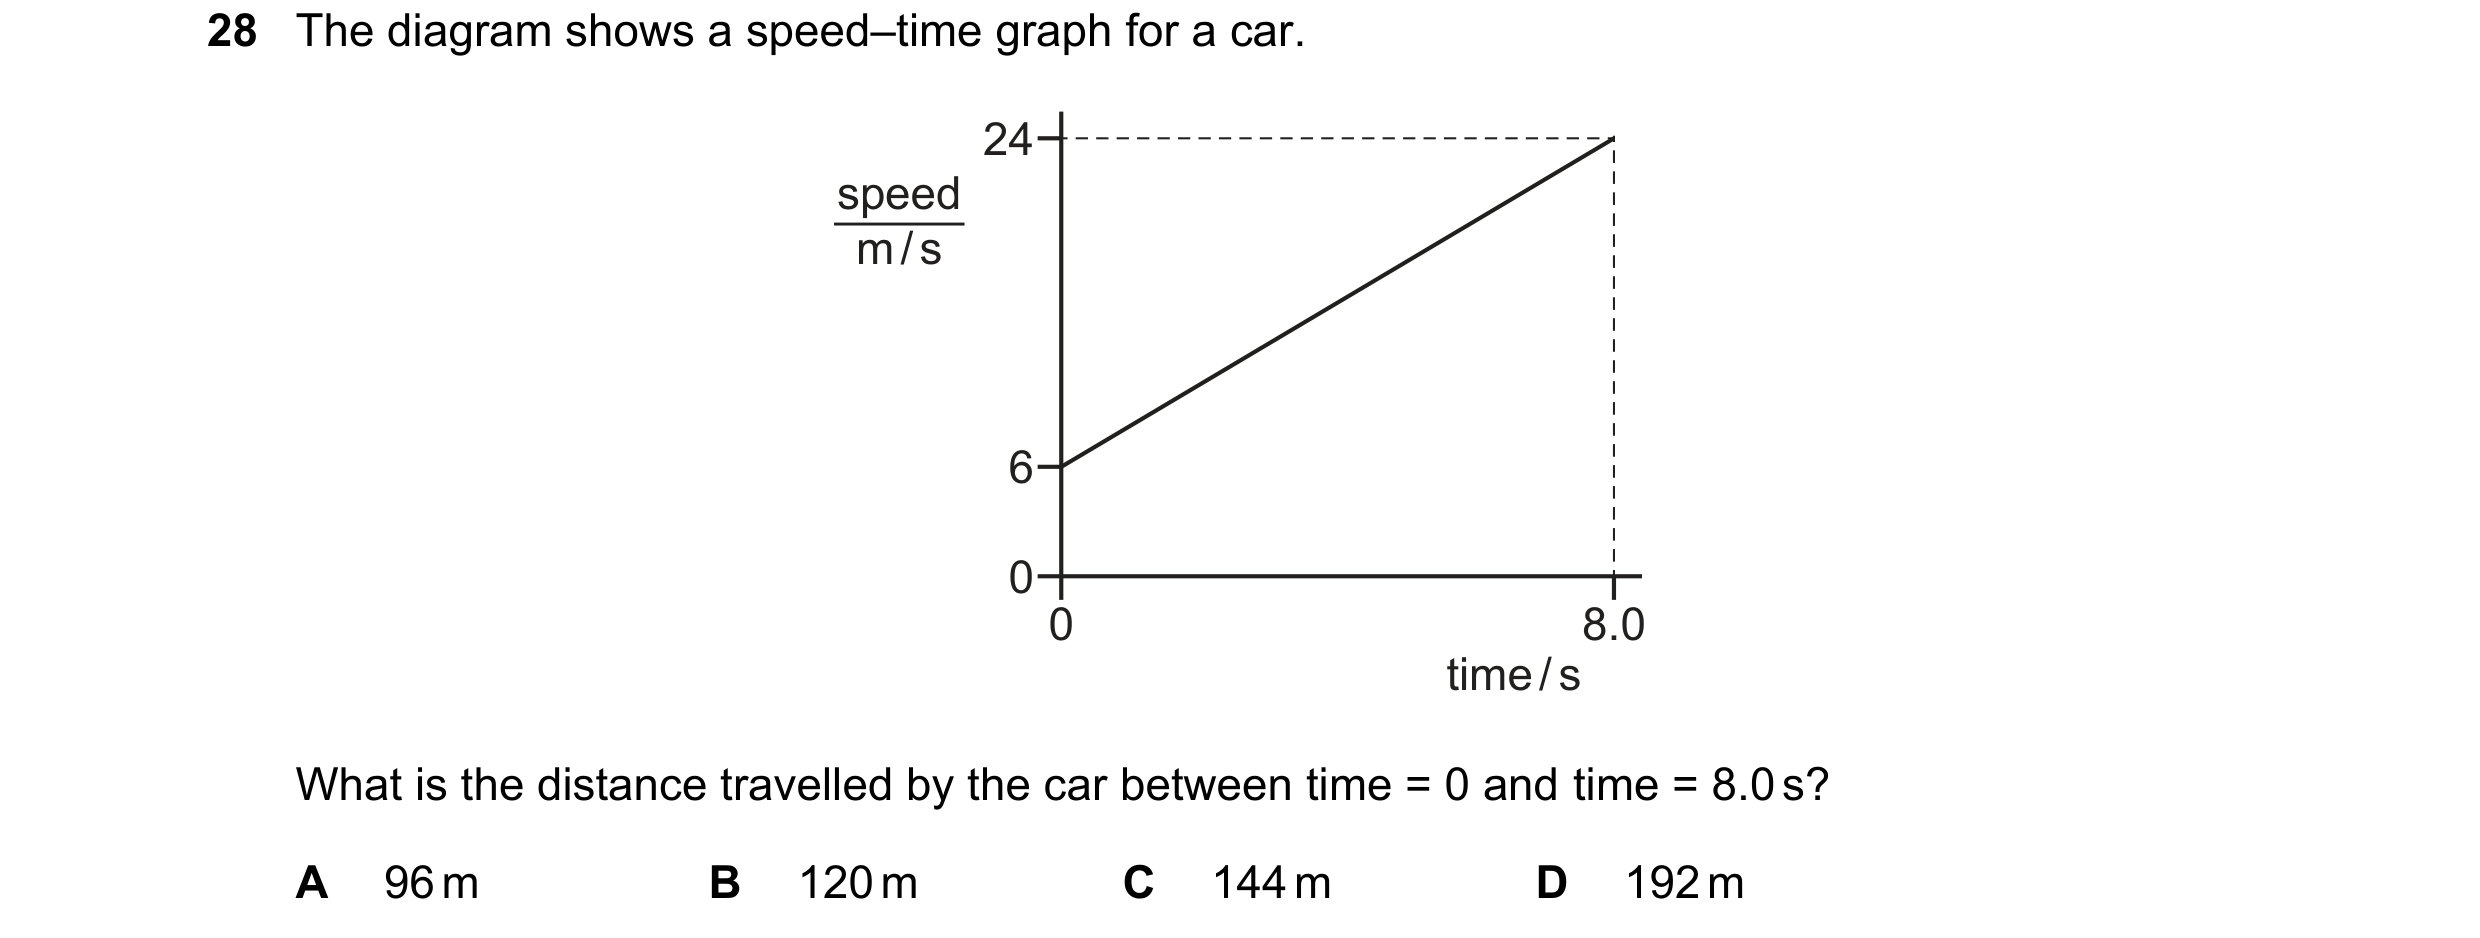
Q43 · The diagram shows a speed–time graph for a car 0653/22 Oct/Nov 2022
28 The diagram shows a speed–time graph for a car. 24 speed m / s 6 0 0 8.0 time / s What is the distance travelled by the car between time = 0 and time = 8.0 s? A 96 m B 120 m C 144 m D 192 m
1 marks
Answer: B
This question in 0653/22 Oct/Nov 2022
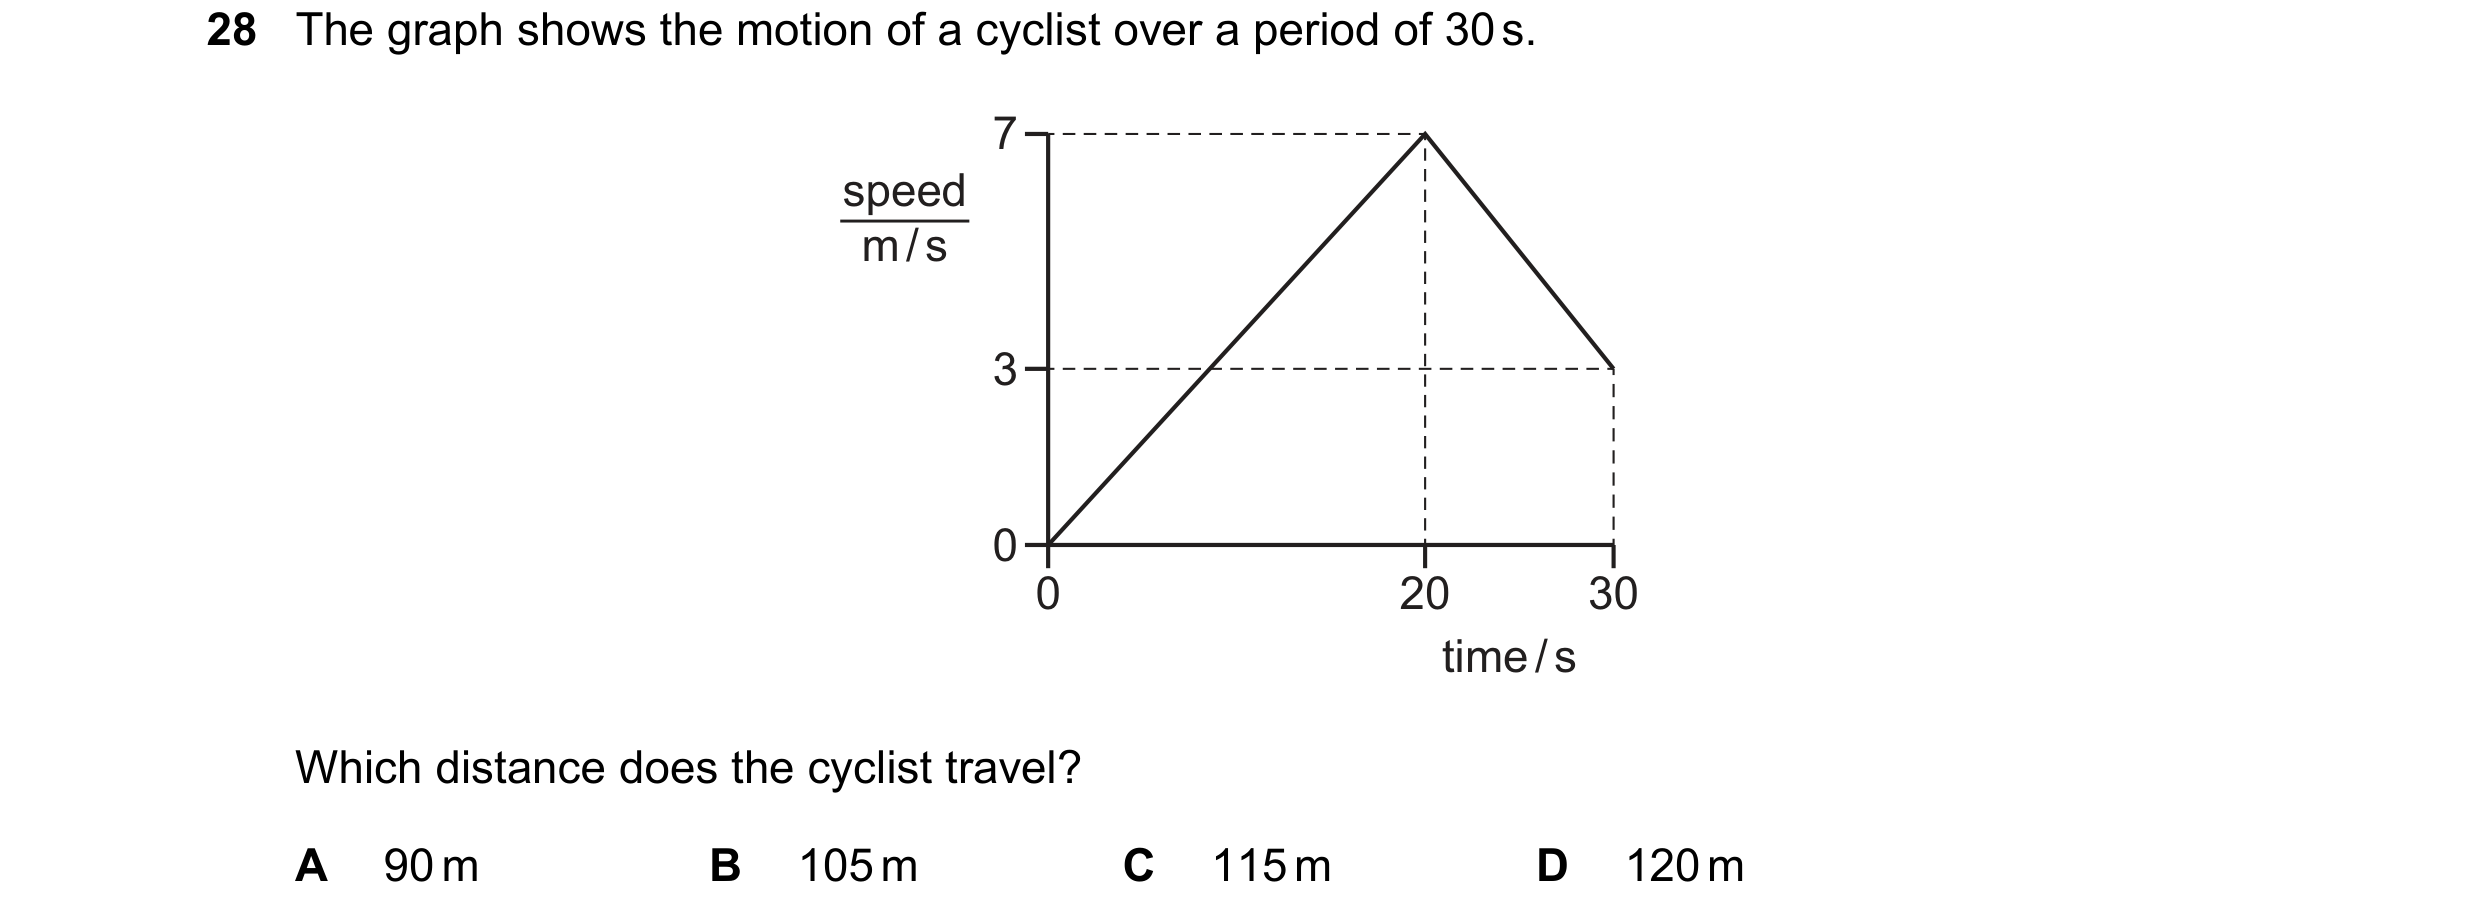
Q44 · The graph shows the motion of a cyclist over a period of 30 s 0653/21 May/June 2023
28 The graph shows the motion of a cyclist over a period of 30 s. 7 speed m / s 3 0 0 20 30 time / s Which distance does the cyclist travel? A 90 m B 105 m C 115 m D 120 m
1 marks
Answer: D
This question in 0653/21 May/June 2023
Q45 · Which speed–time graph represents the motion of an object that travels a distance of 24 m? 0653/22 May/June 2023
28 Which speed–time graph represents the motion of an object that travels a distance of 24 m? A B 4.0 speed speed m / s m / s 3.0 0 0 0 6.0 0 8.0 time / s time / s C D 4.0 speed speed m / s m / s 1.0 0 0 0 3.0 0 12 time / s time / s
1 marks
Answer: A
This question in 0653/22 May/June 2023
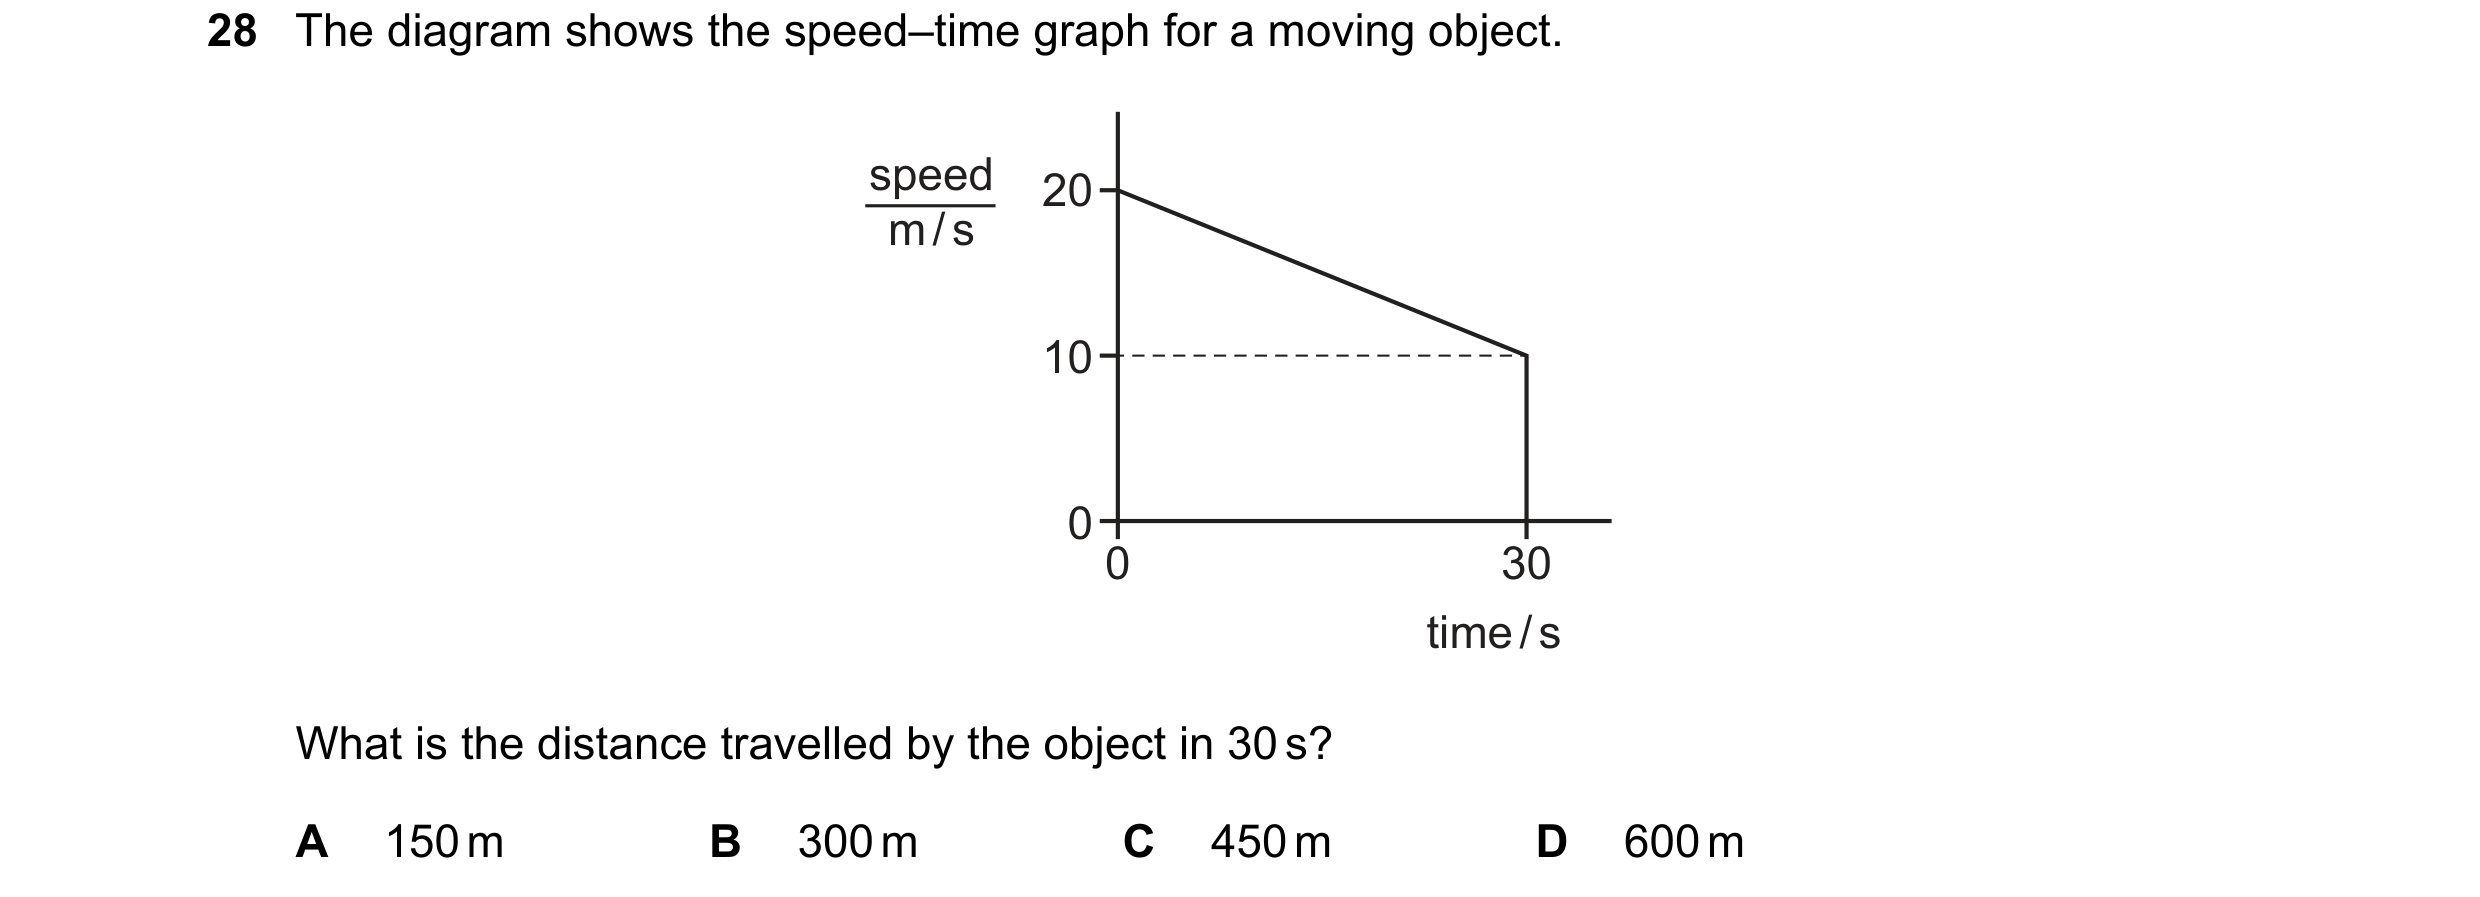
Q46 · The diagram shows the speed–time graph for a moving object 0653/23 May/June 2023
28 The diagram shows the speed–time graph for a moving object. speed 20 m / s 10 0 0 30 time / s What is the distance travelled by the object in 30 s? A 150 m B 300 m C 450 m D 600 m
1 marks
Answer: C
This question in 0653/23 May/June 2023
Q47 · Which speed–time graph represents motion for which the acceleration is constant but not… 0653/21 Oct/Nov 2023
28 Which speed–time graph represents motion for which the acceleration is constant but not zero? A B speed speed 0 0 0 time 0 time C D speed speed 0 0 0 time 0 time
1 marks
Answer: D
This question in 0653/21 Oct/Nov 2023
Q48 · An object travels 6.0 km in two minutes 0653/22 Oct/Nov 2023
28 An object travels 6.0 km in two minutes. What is its speed? A 0.050 m / s B 3.0 m / s C 50 m / s D 3000 m / s
1 marks
Answer: C
This question in 0653/22 Oct/Nov 2023
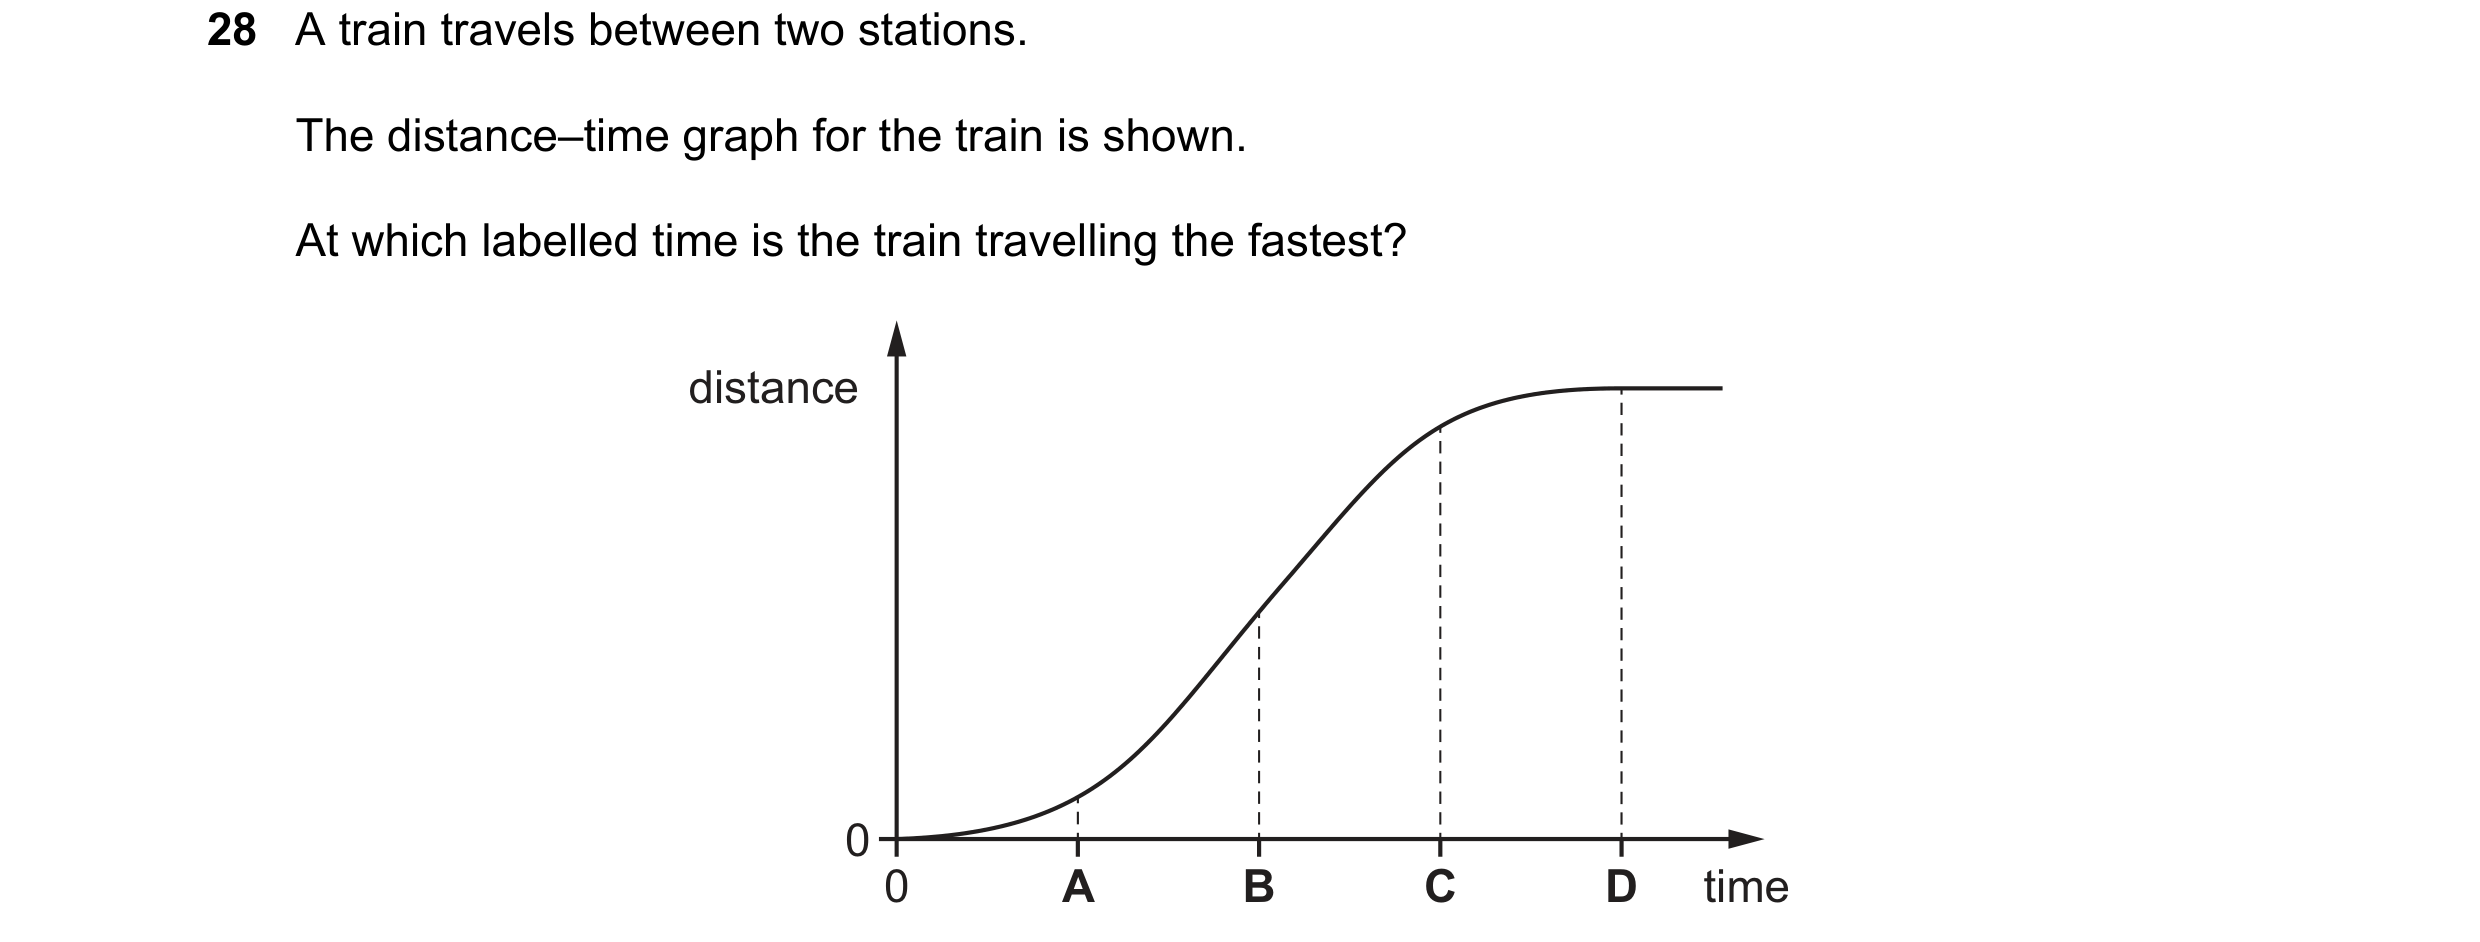
Q49 · A train travels between two stations 0653/23 Oct/Nov 2023
28 A train travels between two stations. The distance–time graph for the train is shown. At which labelled time is the train travelling the fastest? distance 0 0 A B C D time
1 marks
Answer: B
This question in 0653/23 Oct/Nov 2023
Q50 · The diagram shows a speed–time graph for a car 0653/22 Feb/March 2024
28 The diagram shows a speed–time graph for a car. speed 0 0 time What does the graph show about the car? A It is accelerating. B It is at rest. C It is decelerating. D It is travelling at constant speed.
1 marks
Answer: D
This question in 0653/22 Feb/March 2024
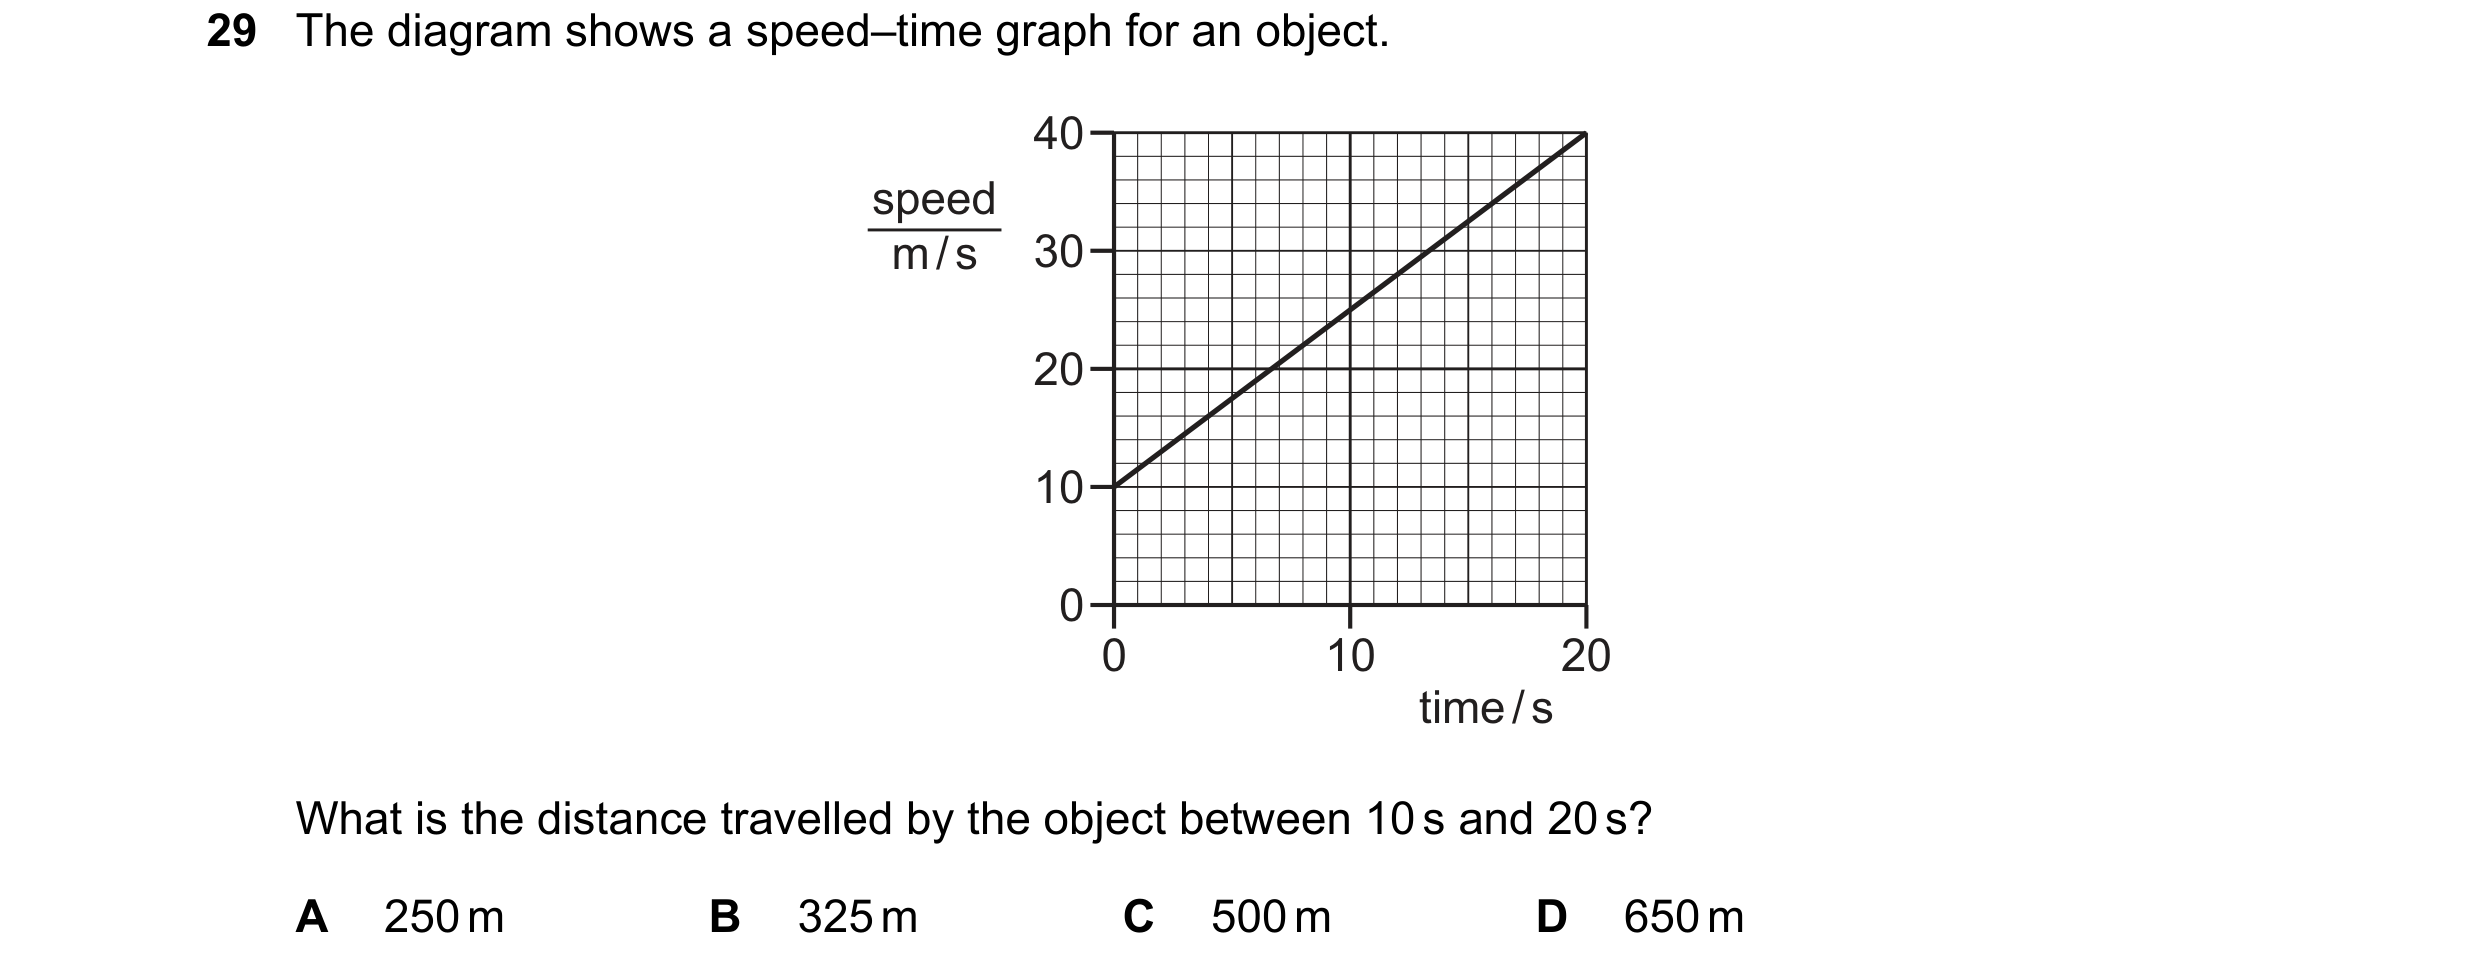
Q51 · The diagram shows a speed–time graph for an object 0653/22 Feb/March 2024
29 The diagram shows a speed–time graph for an object. 40 speed m / s 30 20 10 0 0 10 20 time / s What is the distance travelled by the object between 10 s and 20 s? A 250 m B 325 m C 500 m D 650 m
1 marks
Answer: B
This question in 0653/22 Feb/March 2024
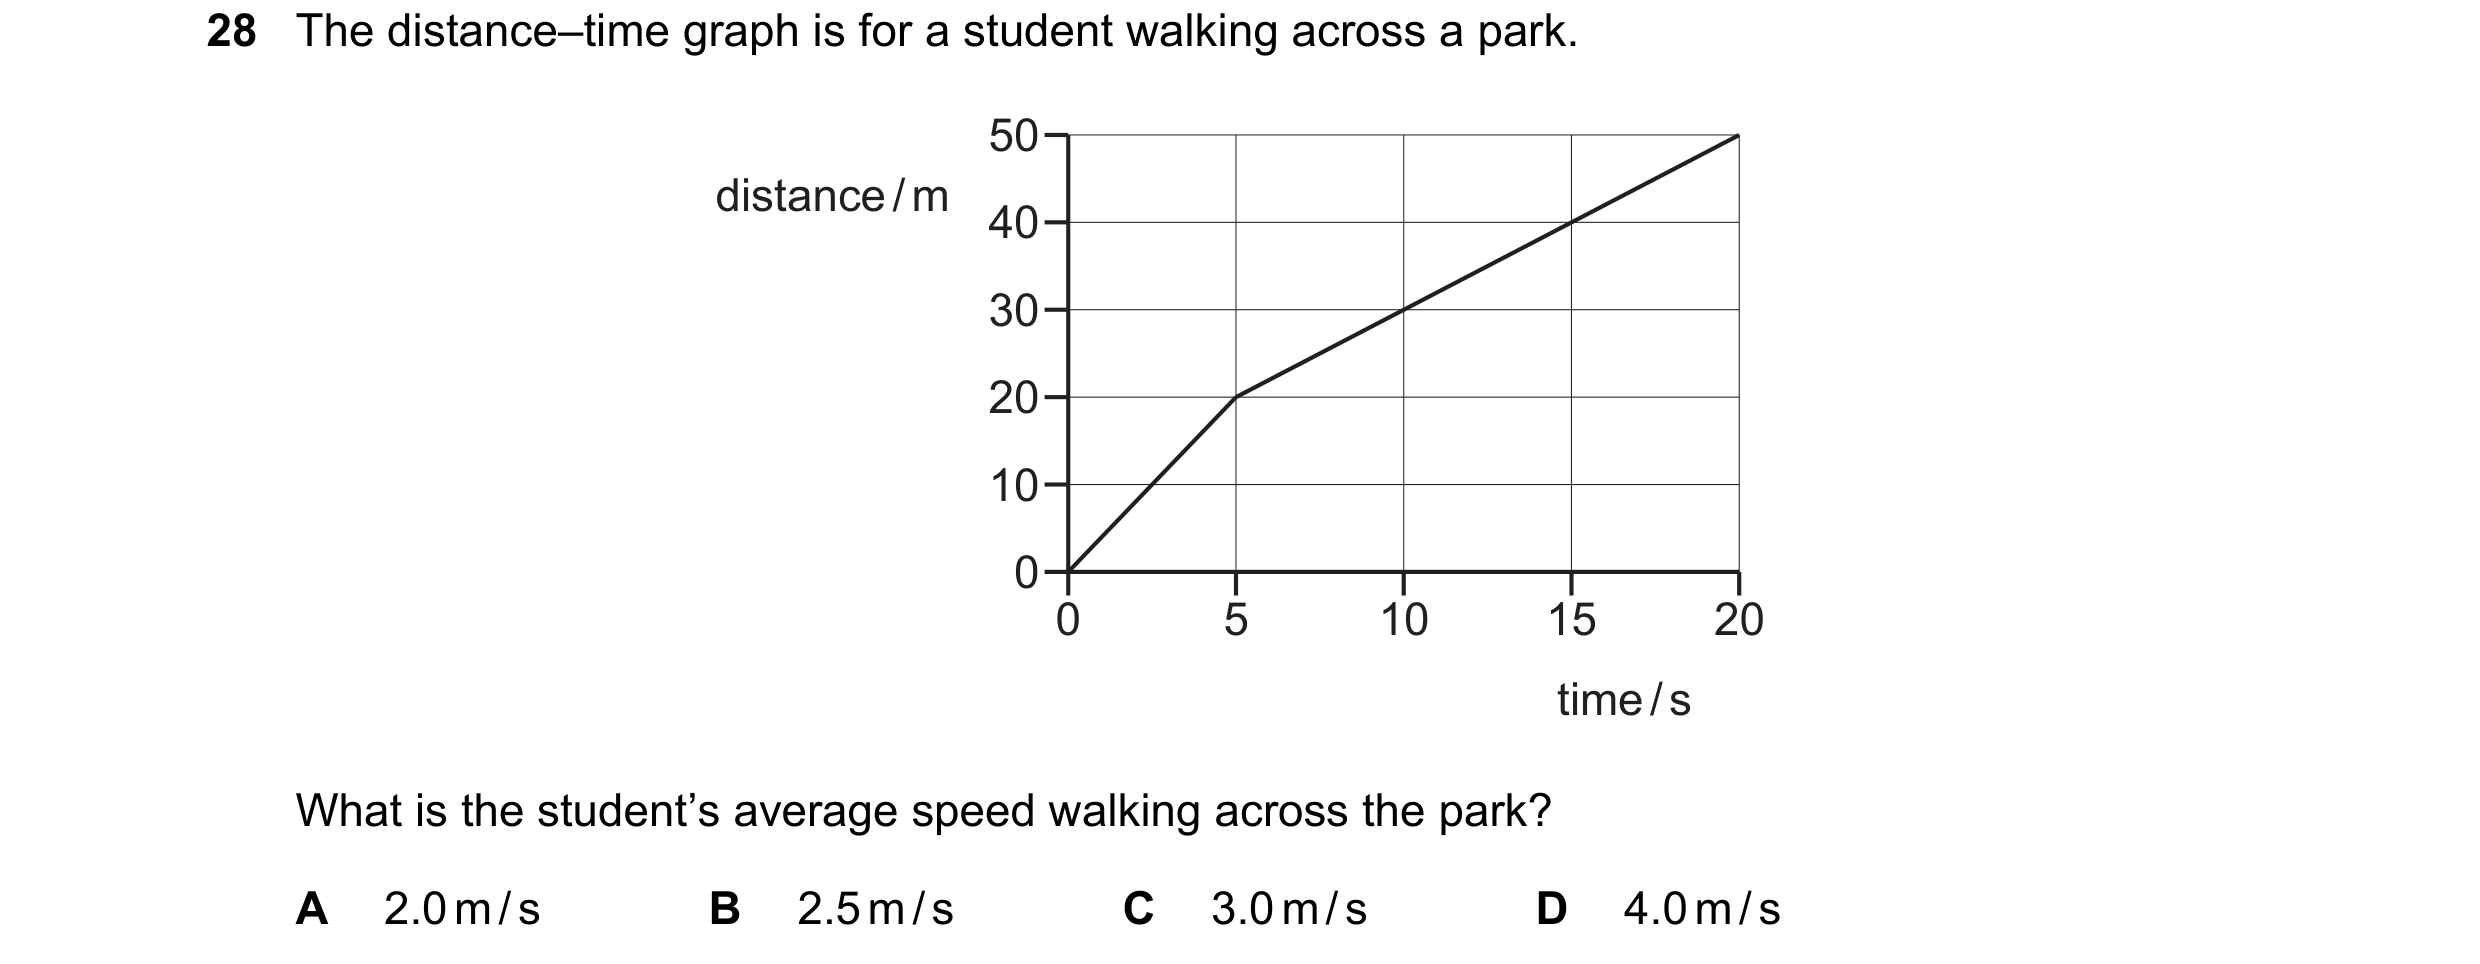
Q52 · The distance–time graph is for a student walking across a park 0653/23 May/June 2024
28 The distance–time graph is for a student walking across a park. 50 distance / m 40 30 20 10 0 0 5 10 15 20 time / s What is the student’s average speed walking across the park? A 2.0 m / s B 2.5 m / s C 3.0 m / s D 4.0 m / s
1 marks
Answer: B
This question in 0653/23 May/June 2024
Q53 · A car is moving downhill along a road at a constant speed 0653/21 Oct/Nov 2024
28 A car is moving downhill along a road at a constant speed. Which graph is the speed–time graph for the car? A B speed speed 0 0 0 time 0 time C D speed speed 0 0 0 time 0 time
1 marks
Answer: A
This question in 0653/21 Oct/Nov 2024
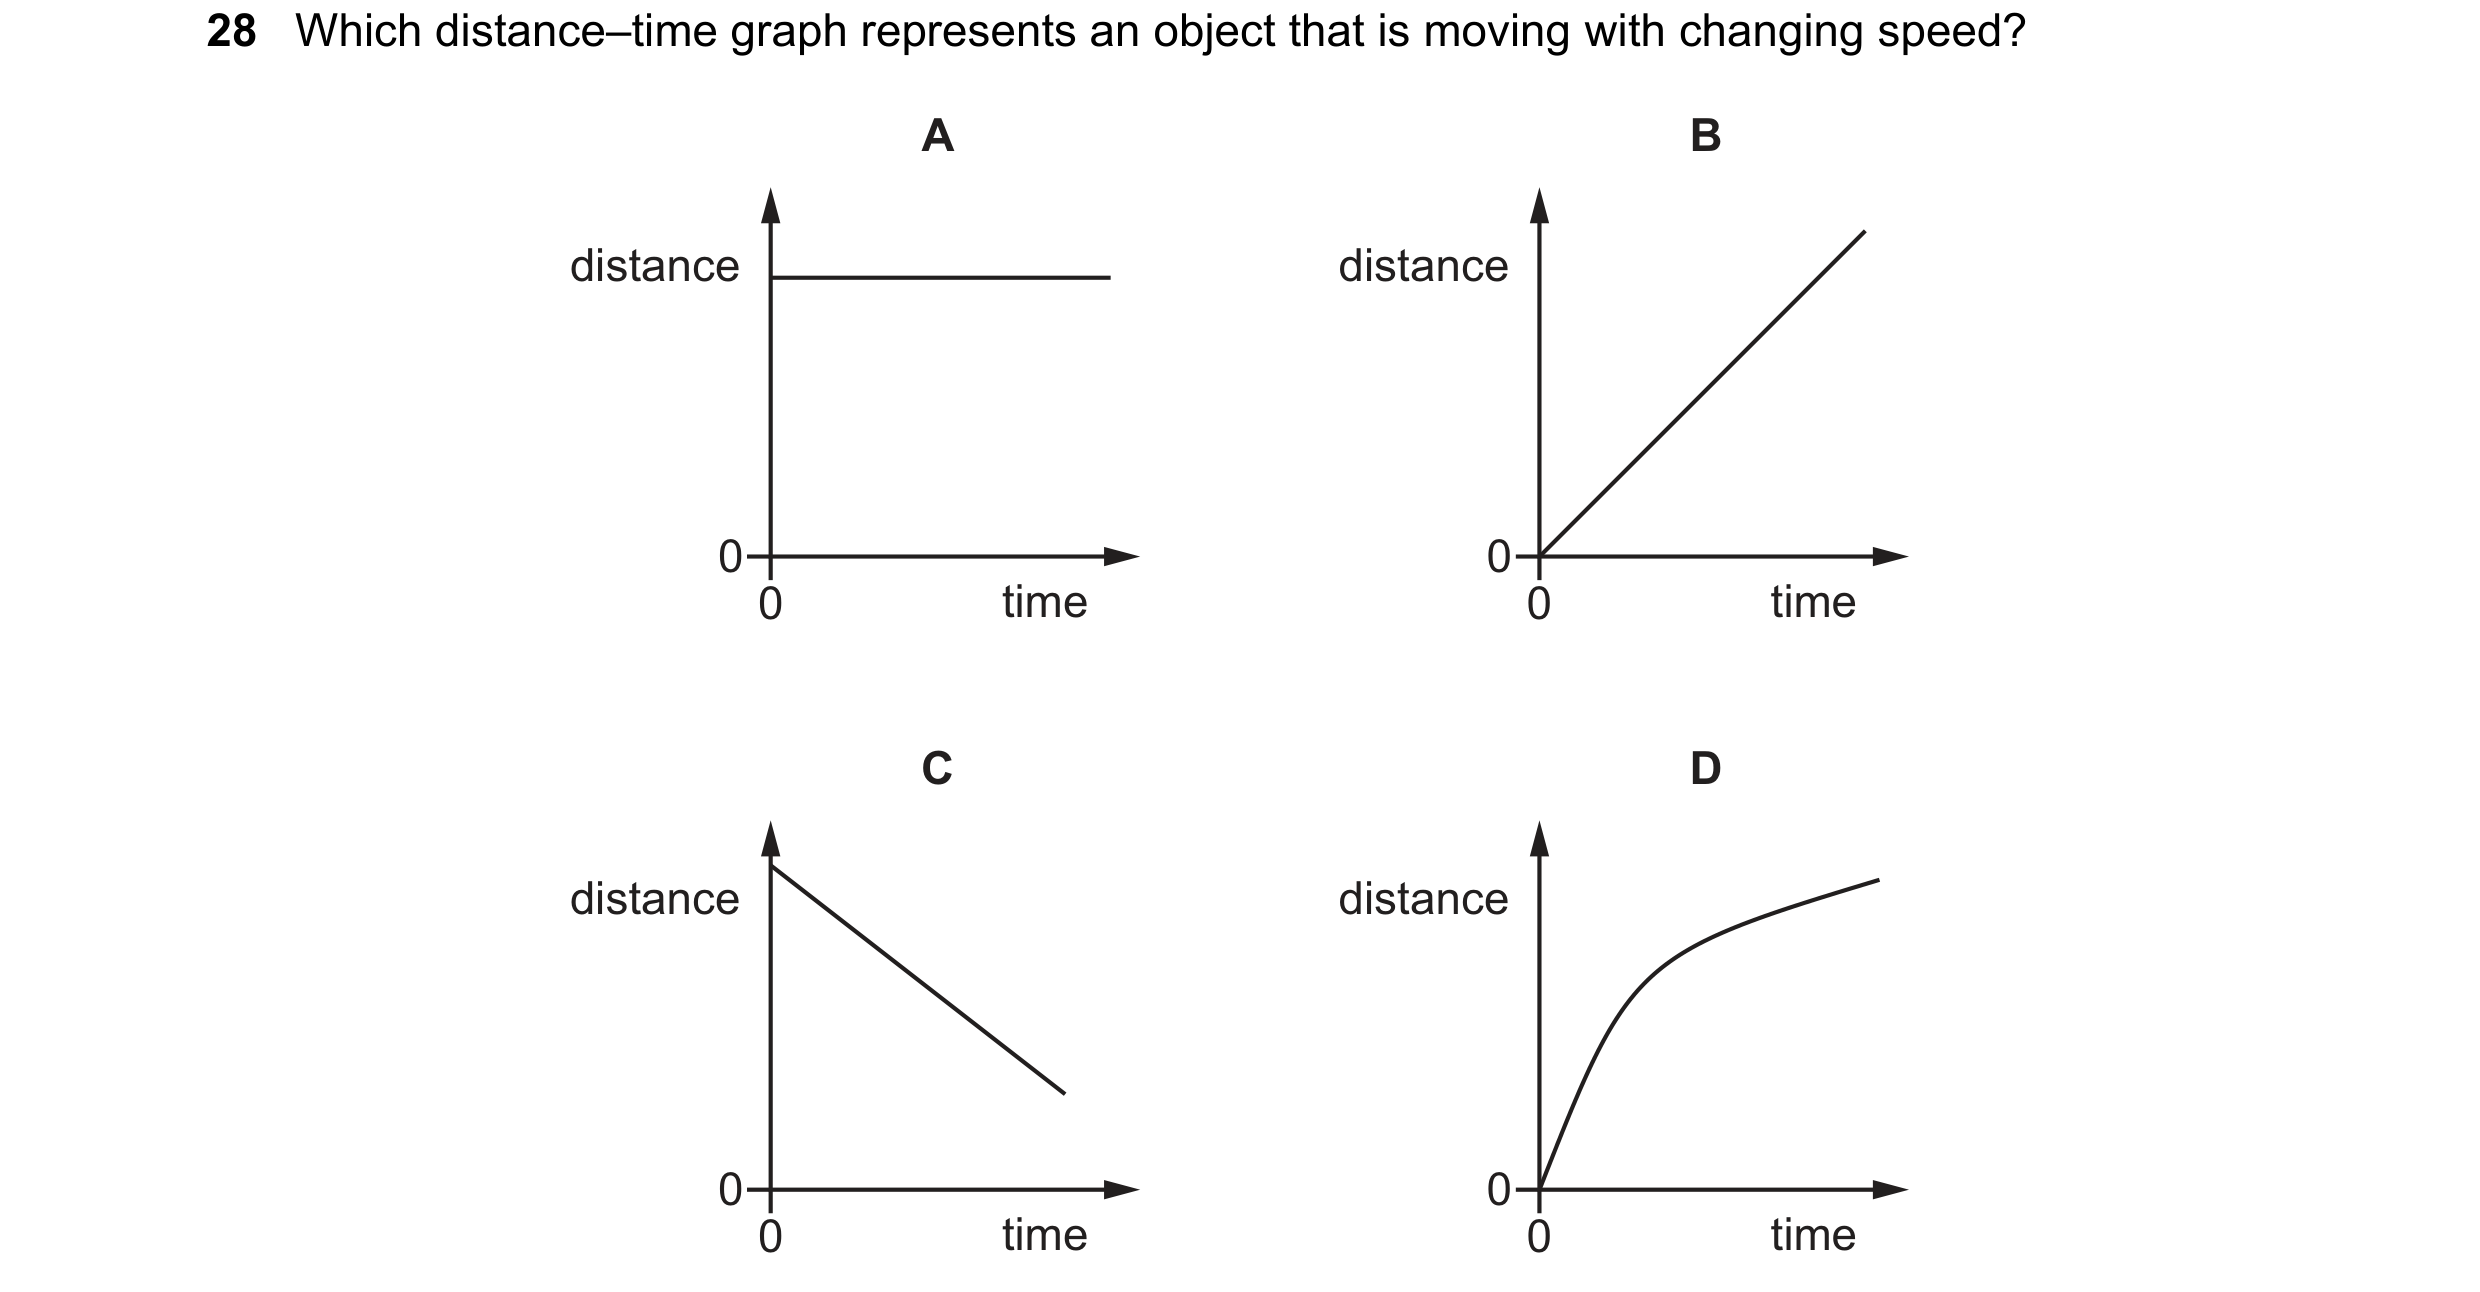
Q54 · Which distance–time graph represents an object that is moving with changing speed? 0653/23 Oct/Nov 2024
28 Which distance–time graph represents an object that is moving with changing speed? A B distance distance 0 0 0 time 0 time C D distance distance 0 0 0 time 0 time
1 marks
Answer: D
This question in 0653/23 Oct/Nov 2024
Q55 · Four objects, P, Q, R and S, are moving 0653/22 Feb/March 2025
29 Four objects, P, Q, R and S, are moving. The table shows the mass and speed of each object. mass speed / kg m / s P 1.0 4.0 Q 2.0 1.0 R 1.0 2.0 S 4.0 1.0 Which two objects have equal kinetic energies? A P and R B P and S C Q and R D R and S
1 marks
Answer: D
This question in 0653/22 Feb/March 2025
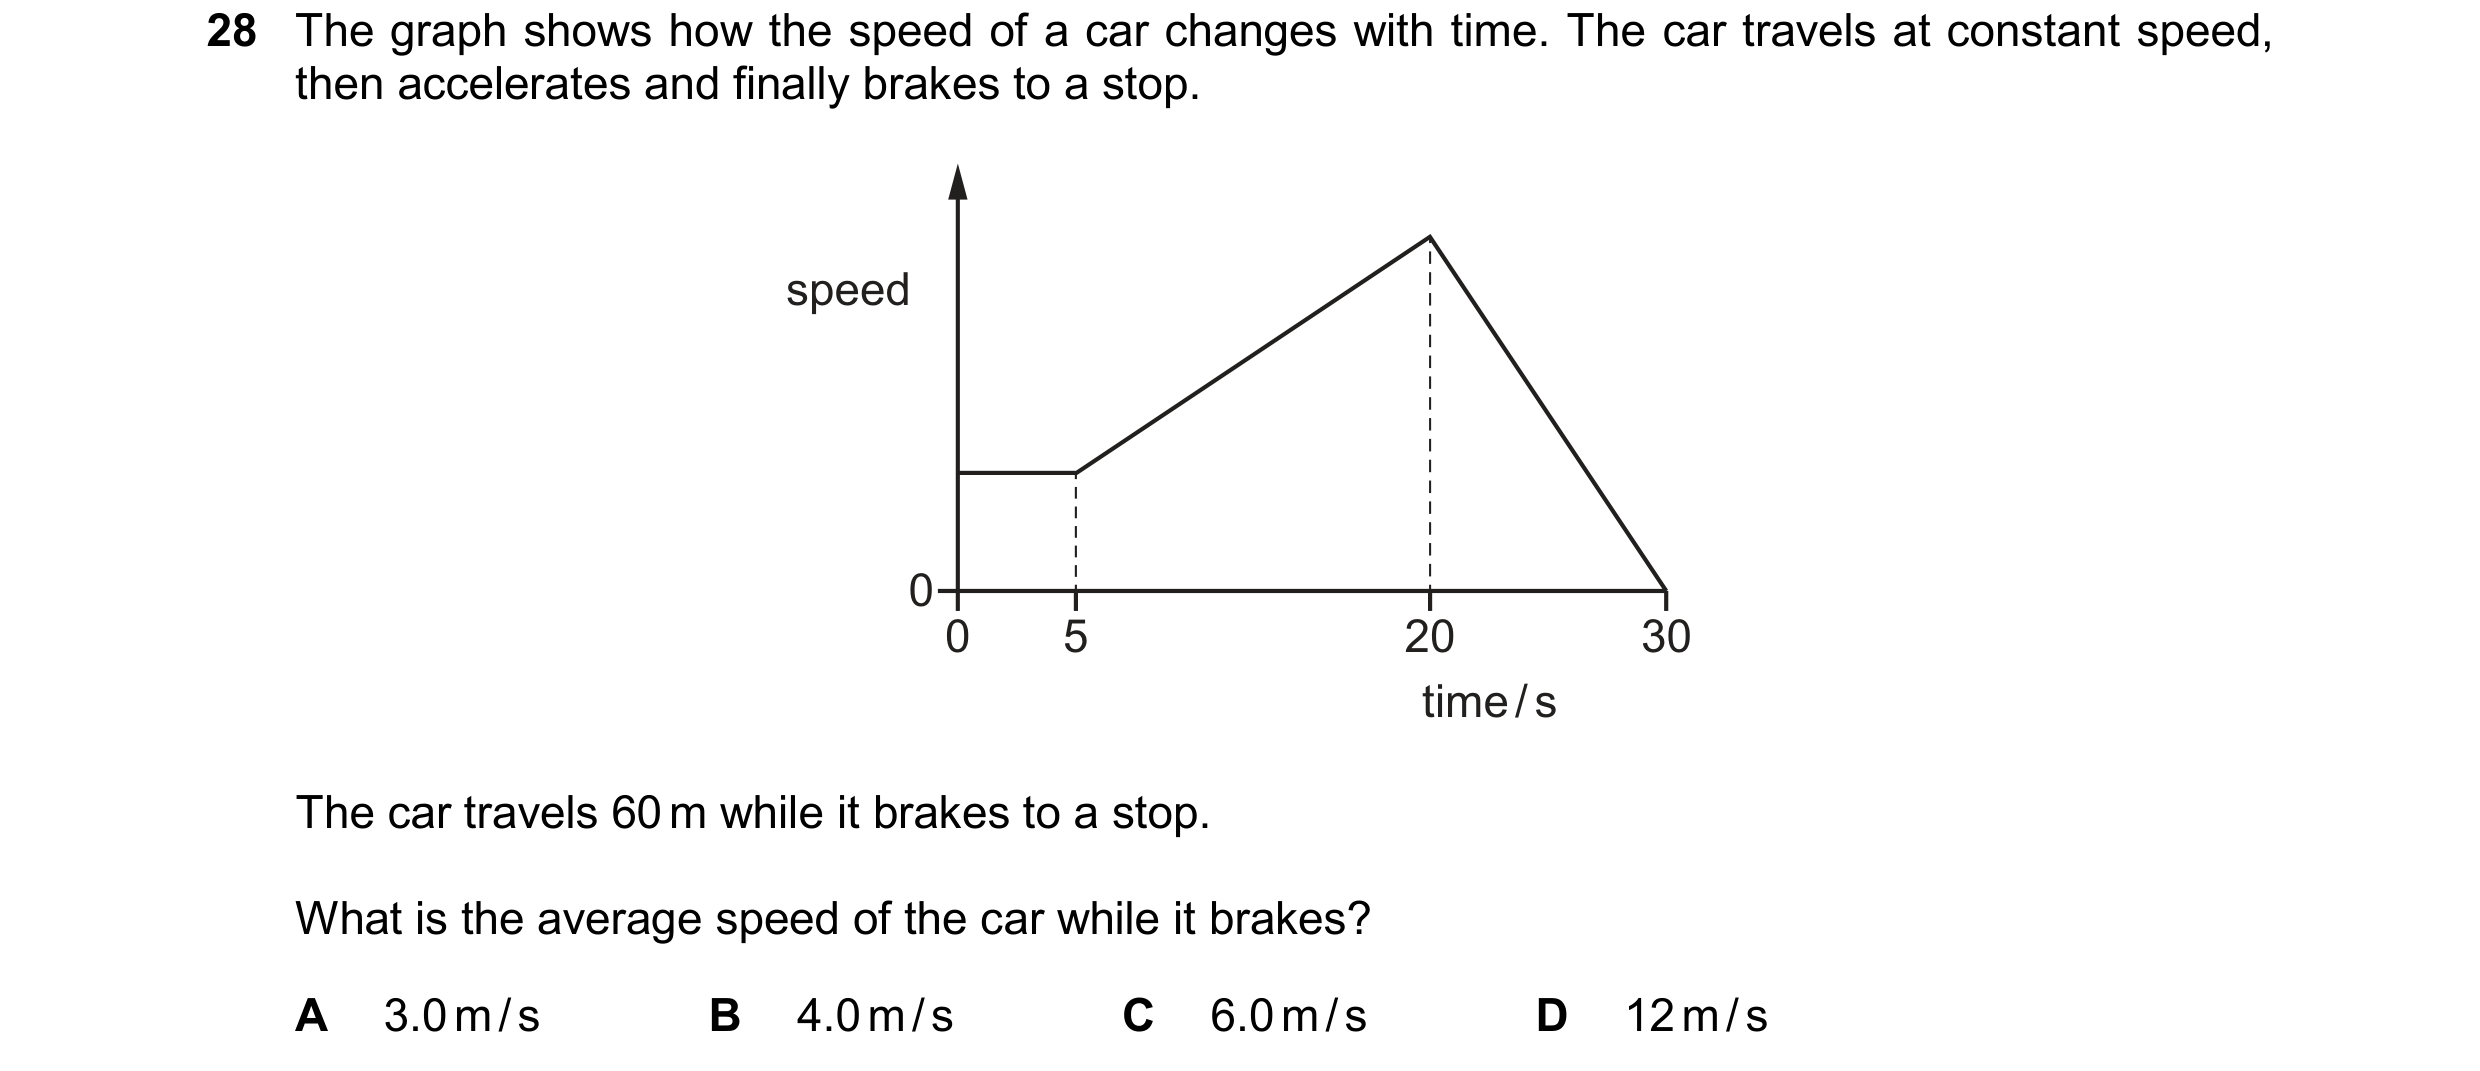
Q56 · The graph shows how the speed of a car changes with time 0653/21 May/June 2025
28 The graph shows how the speed of a car changes with time. The car travels at constant speed, then accelerates and finally brakes to a stop. speed 0 0 5 20 30 time / s The car travels 60 m while it brakes to a stop. What is the average speed of the car while it brakes? A 3.0 m / s B 4.0 m / s C 6.0 m / s D 12 m / s
1 marks
Answer: C
This question in 0653/21 May/June 2025
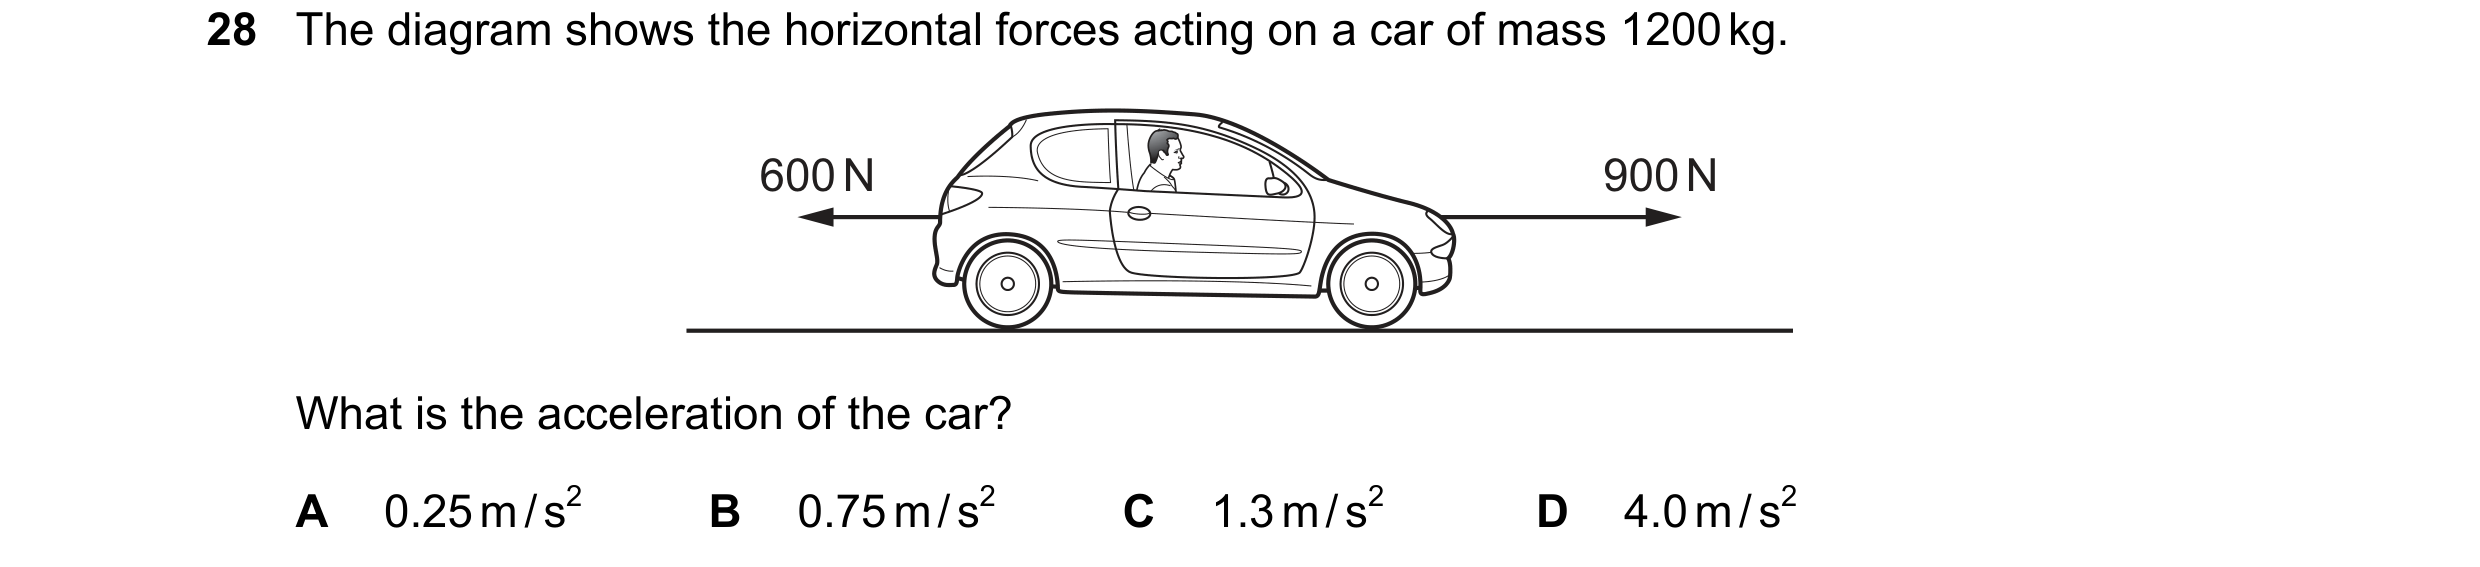
Q57 · The diagram shows the horizontal forces acting on a car of mass 1200 kg 0653/22 May/June 2025
28 The diagram shows the horizontal forces acting on a car of mass 1200 kg. 600 N 900 N What is the acceleration of the car? A 0.25 m / s2 B 0.75 m / s2 C 1.3 m / s2 D 4.0 m / s2
1 marks
Answer: A
This question in 0653/22 May/June 2025
Q58 · An object orbits a planet 0653/22 May/June 2025
40 An object orbits a planet. The period of the orbit is 8.0 hours. The speed of the object is 2.0 km / s. What is the radius of the orbit? A 1.5 105 m B 9.2 106 m C 2.9 107 m D 3.6 108 m
1 marks
Answer: B
This question in 0653/22 May/June 2025
Q59 · On planet R, there is no atmosphere and the acceleration of free fall g is 4.5 m / s2 0653/23 May/June 2025
28 On planet R, there is no atmosphere and the acceleration of free fall g is 4.5 m / s2. A rock of mass 2.0 kg falls from rest on planet R and hits the ground 4.0 m below. What is the speed of the rock as it hits the ground? A 4.5 m / s B 6.0 m / s C 18 m / s D 36 m / s
1 marks
Answer: B
This question in 0653/23 May/June 2025
Q60 · The diagram shows a speed–time graph for the motion of a car 0653/23 May/June 2025
29 The diagram shows a speed–time graph for the motion of a car. speed 0 0 time Which statement describes the motion of the car? A It accelerates and then travels at a constant speed. B It accelerates and then decelerates. C It travels at a constant speed and then is stationary. D It travels at a constant speed and then decelerates.
1 marks
Answer: A
This question in 0653/23 May/June 2025
Q61 · The length of a slope is 1200 m 0653/21 Oct/Nov 2025
28 The length of a slope is 1200 m. A cyclist rides up the slope in a time of 200 s. The cyclist then immediately rides back down the slope in a time of 100 s. What is the average speed of the cyclist for the whole journey? A 4.0 m / s B 8.0 m / s C 9.0 m / s D 18 m / s
1 marks
Answer: B
This question in 0653/21 Oct/Nov 2025
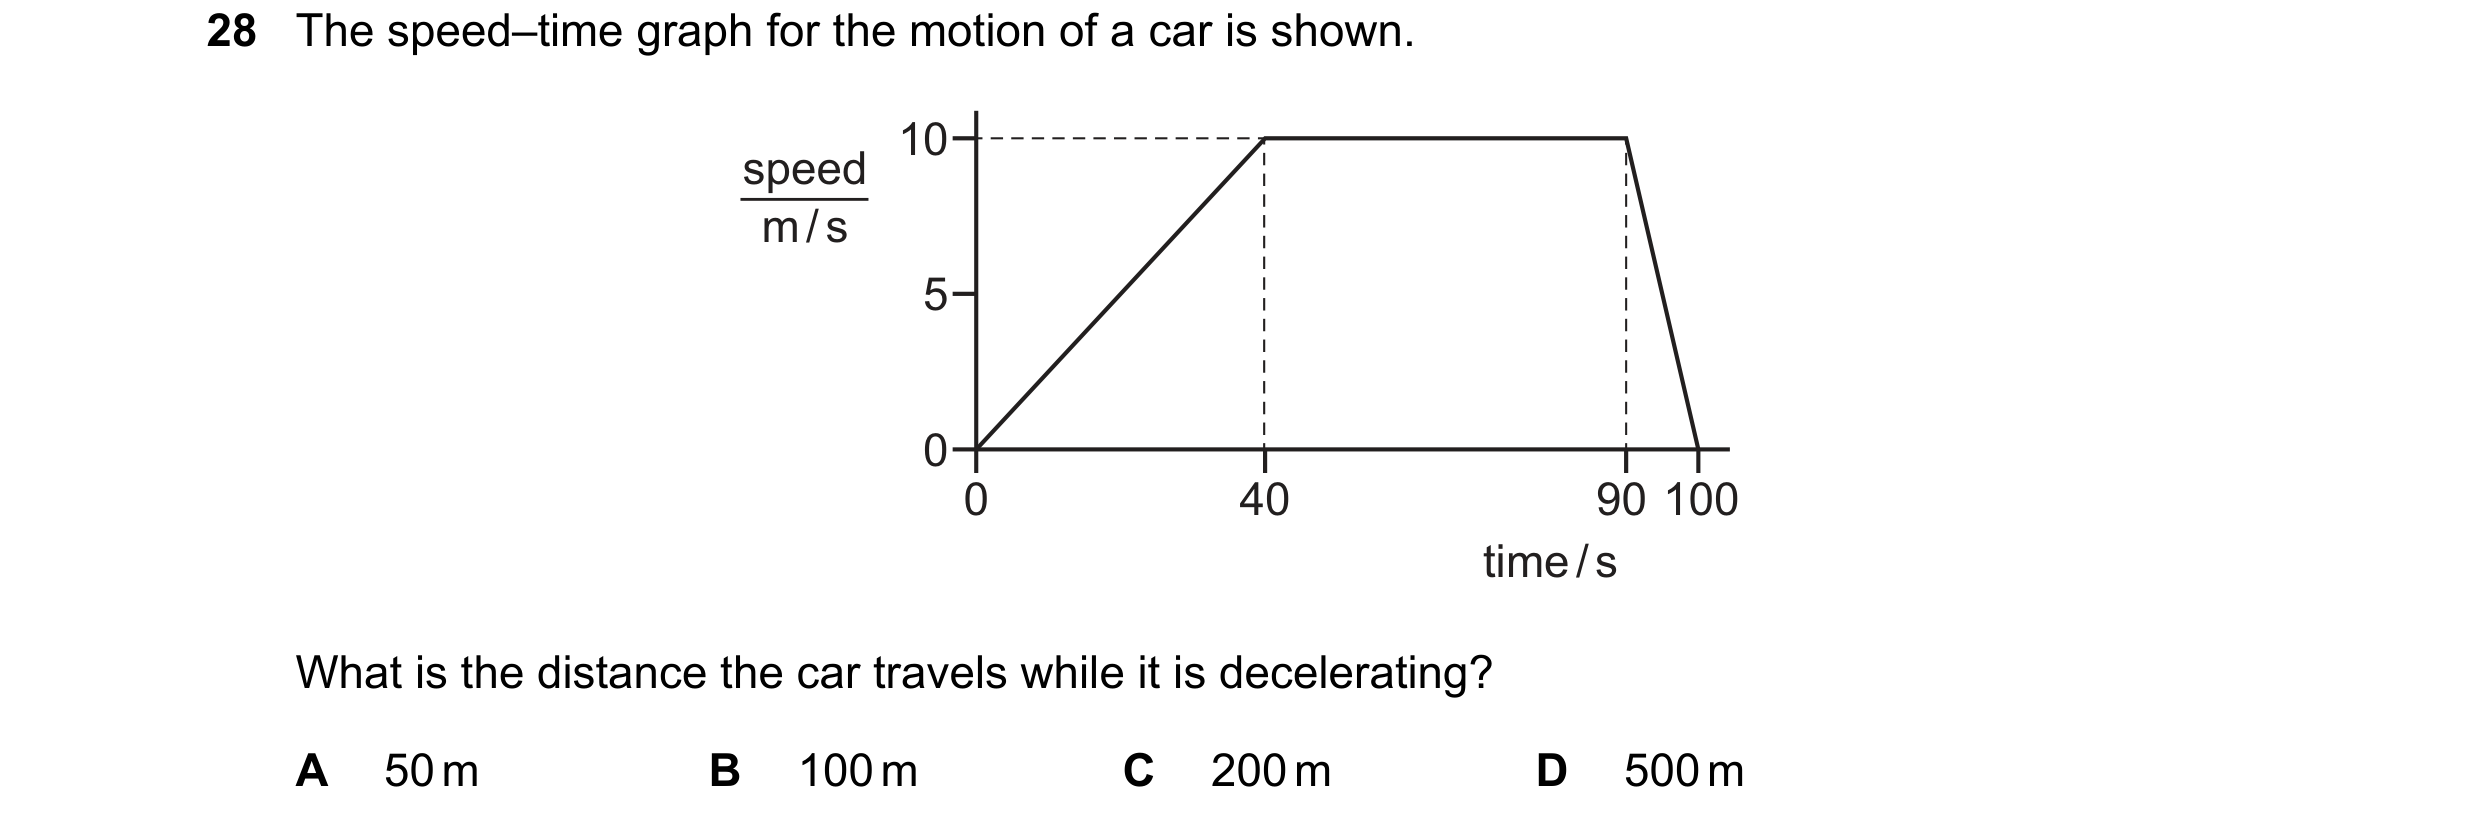
Q62 · The speed–time graph for the motion of a car is shown 0653/22 Oct/Nov 2025
28 The speed–time graph for the motion of a car is shown. 10 speed m / s 5 0 0 40 90 100 time / s What is the distance the car travels while it is decelerating? A 50 m B 100 m C 200 m D 500 m
1 marks
Answer: A
This question in 0653/22 Oct/Nov 2025
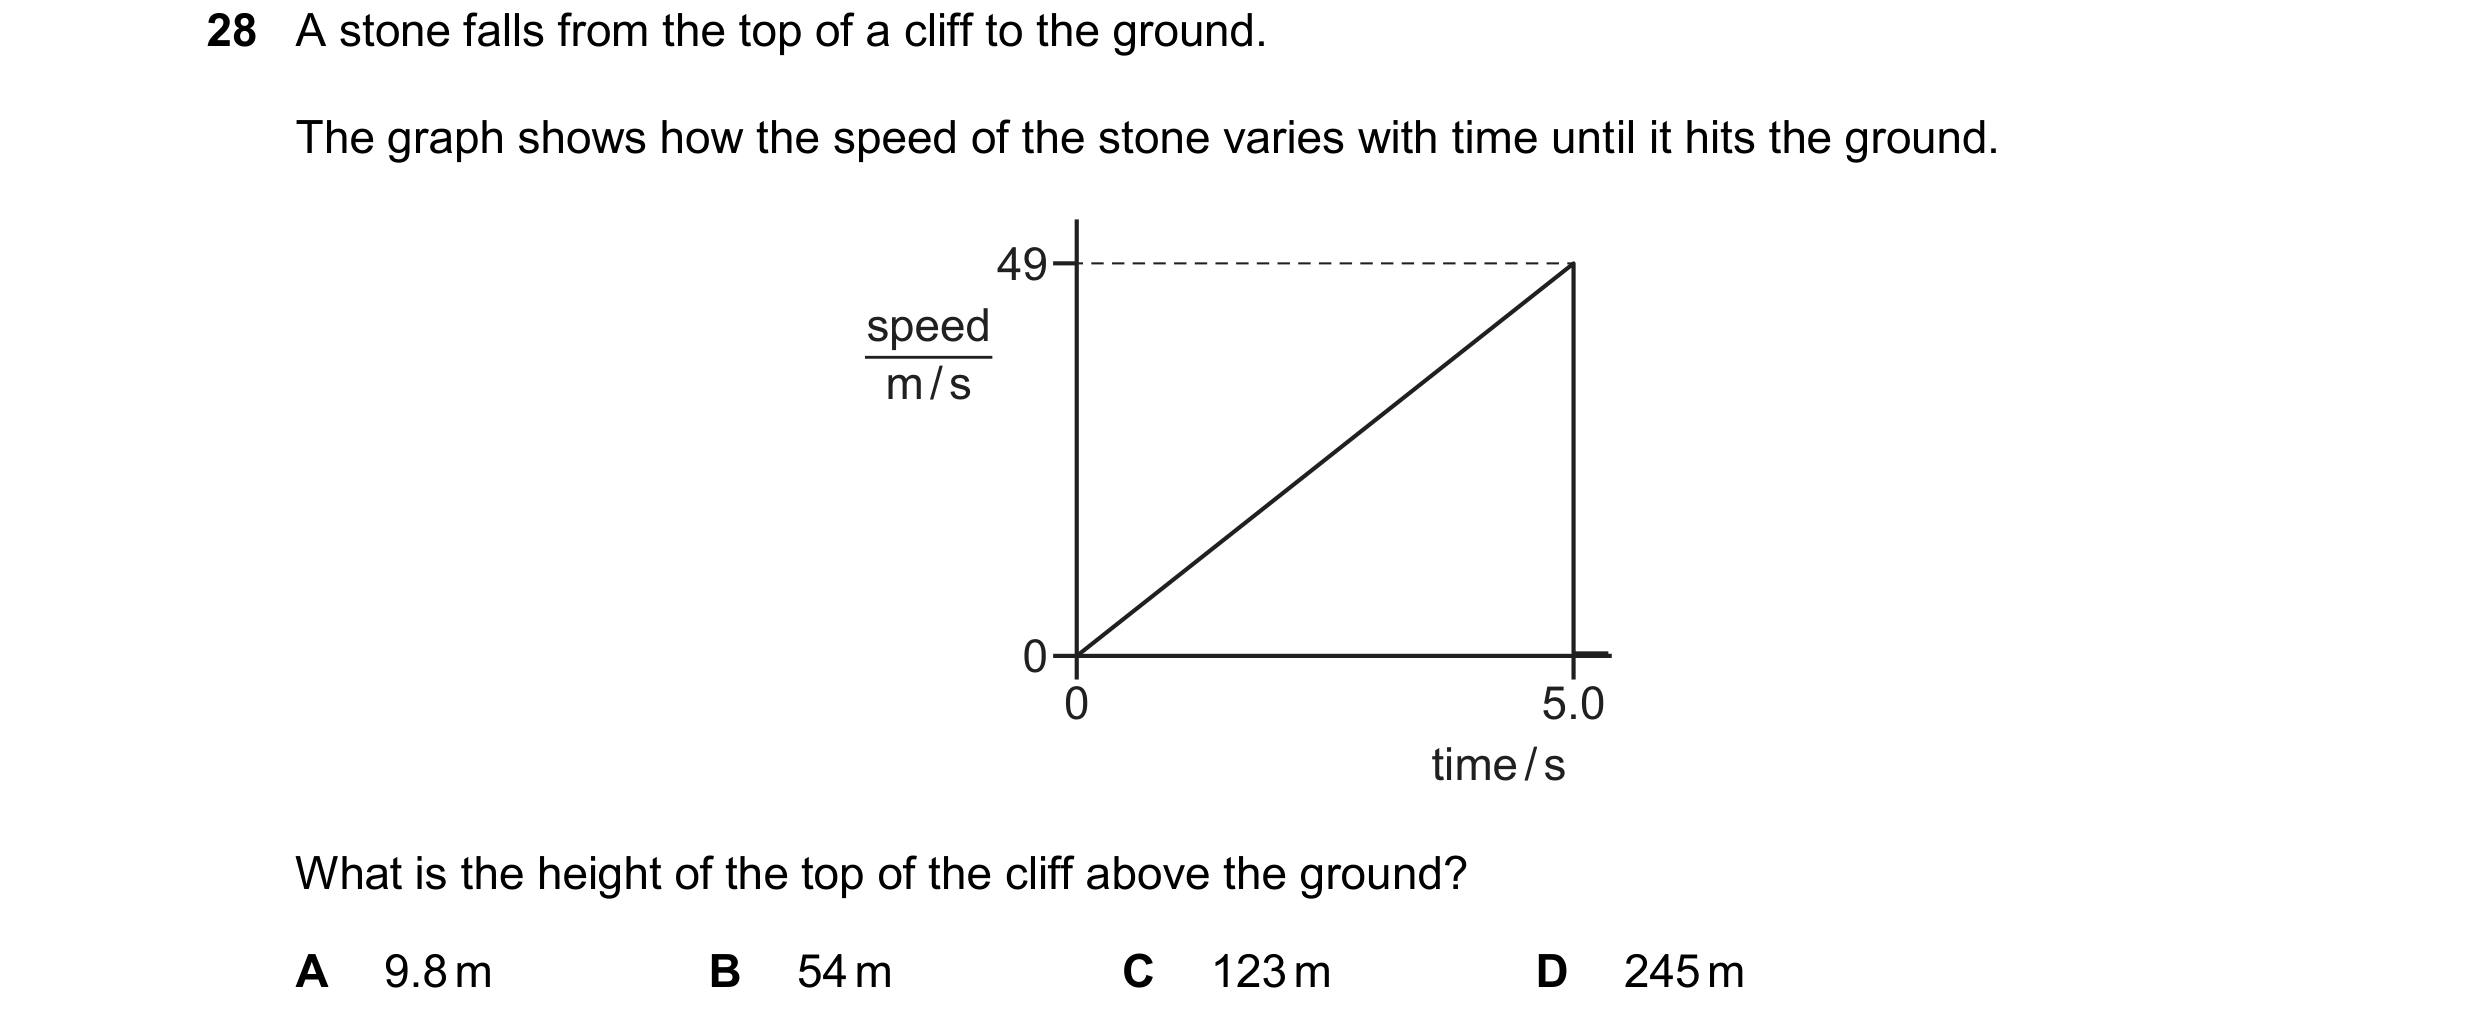
Q63 · A stone falls from the top of a cliff to the ground 0653/23 Oct/Nov 2025
28 A stone falls from the top of a cliff to the ground. The graph shows how the speed of the stone varies with time until it hits the ground. 49 speed m / s 0 0 5.0 time / s What is the height of the top of the cliff above the ground? A 9.8 m B 54 m C 123 m D 245 m
1 marks
Answer: C
This question in 0653/23 Oct/Nov 2025
 1 / 21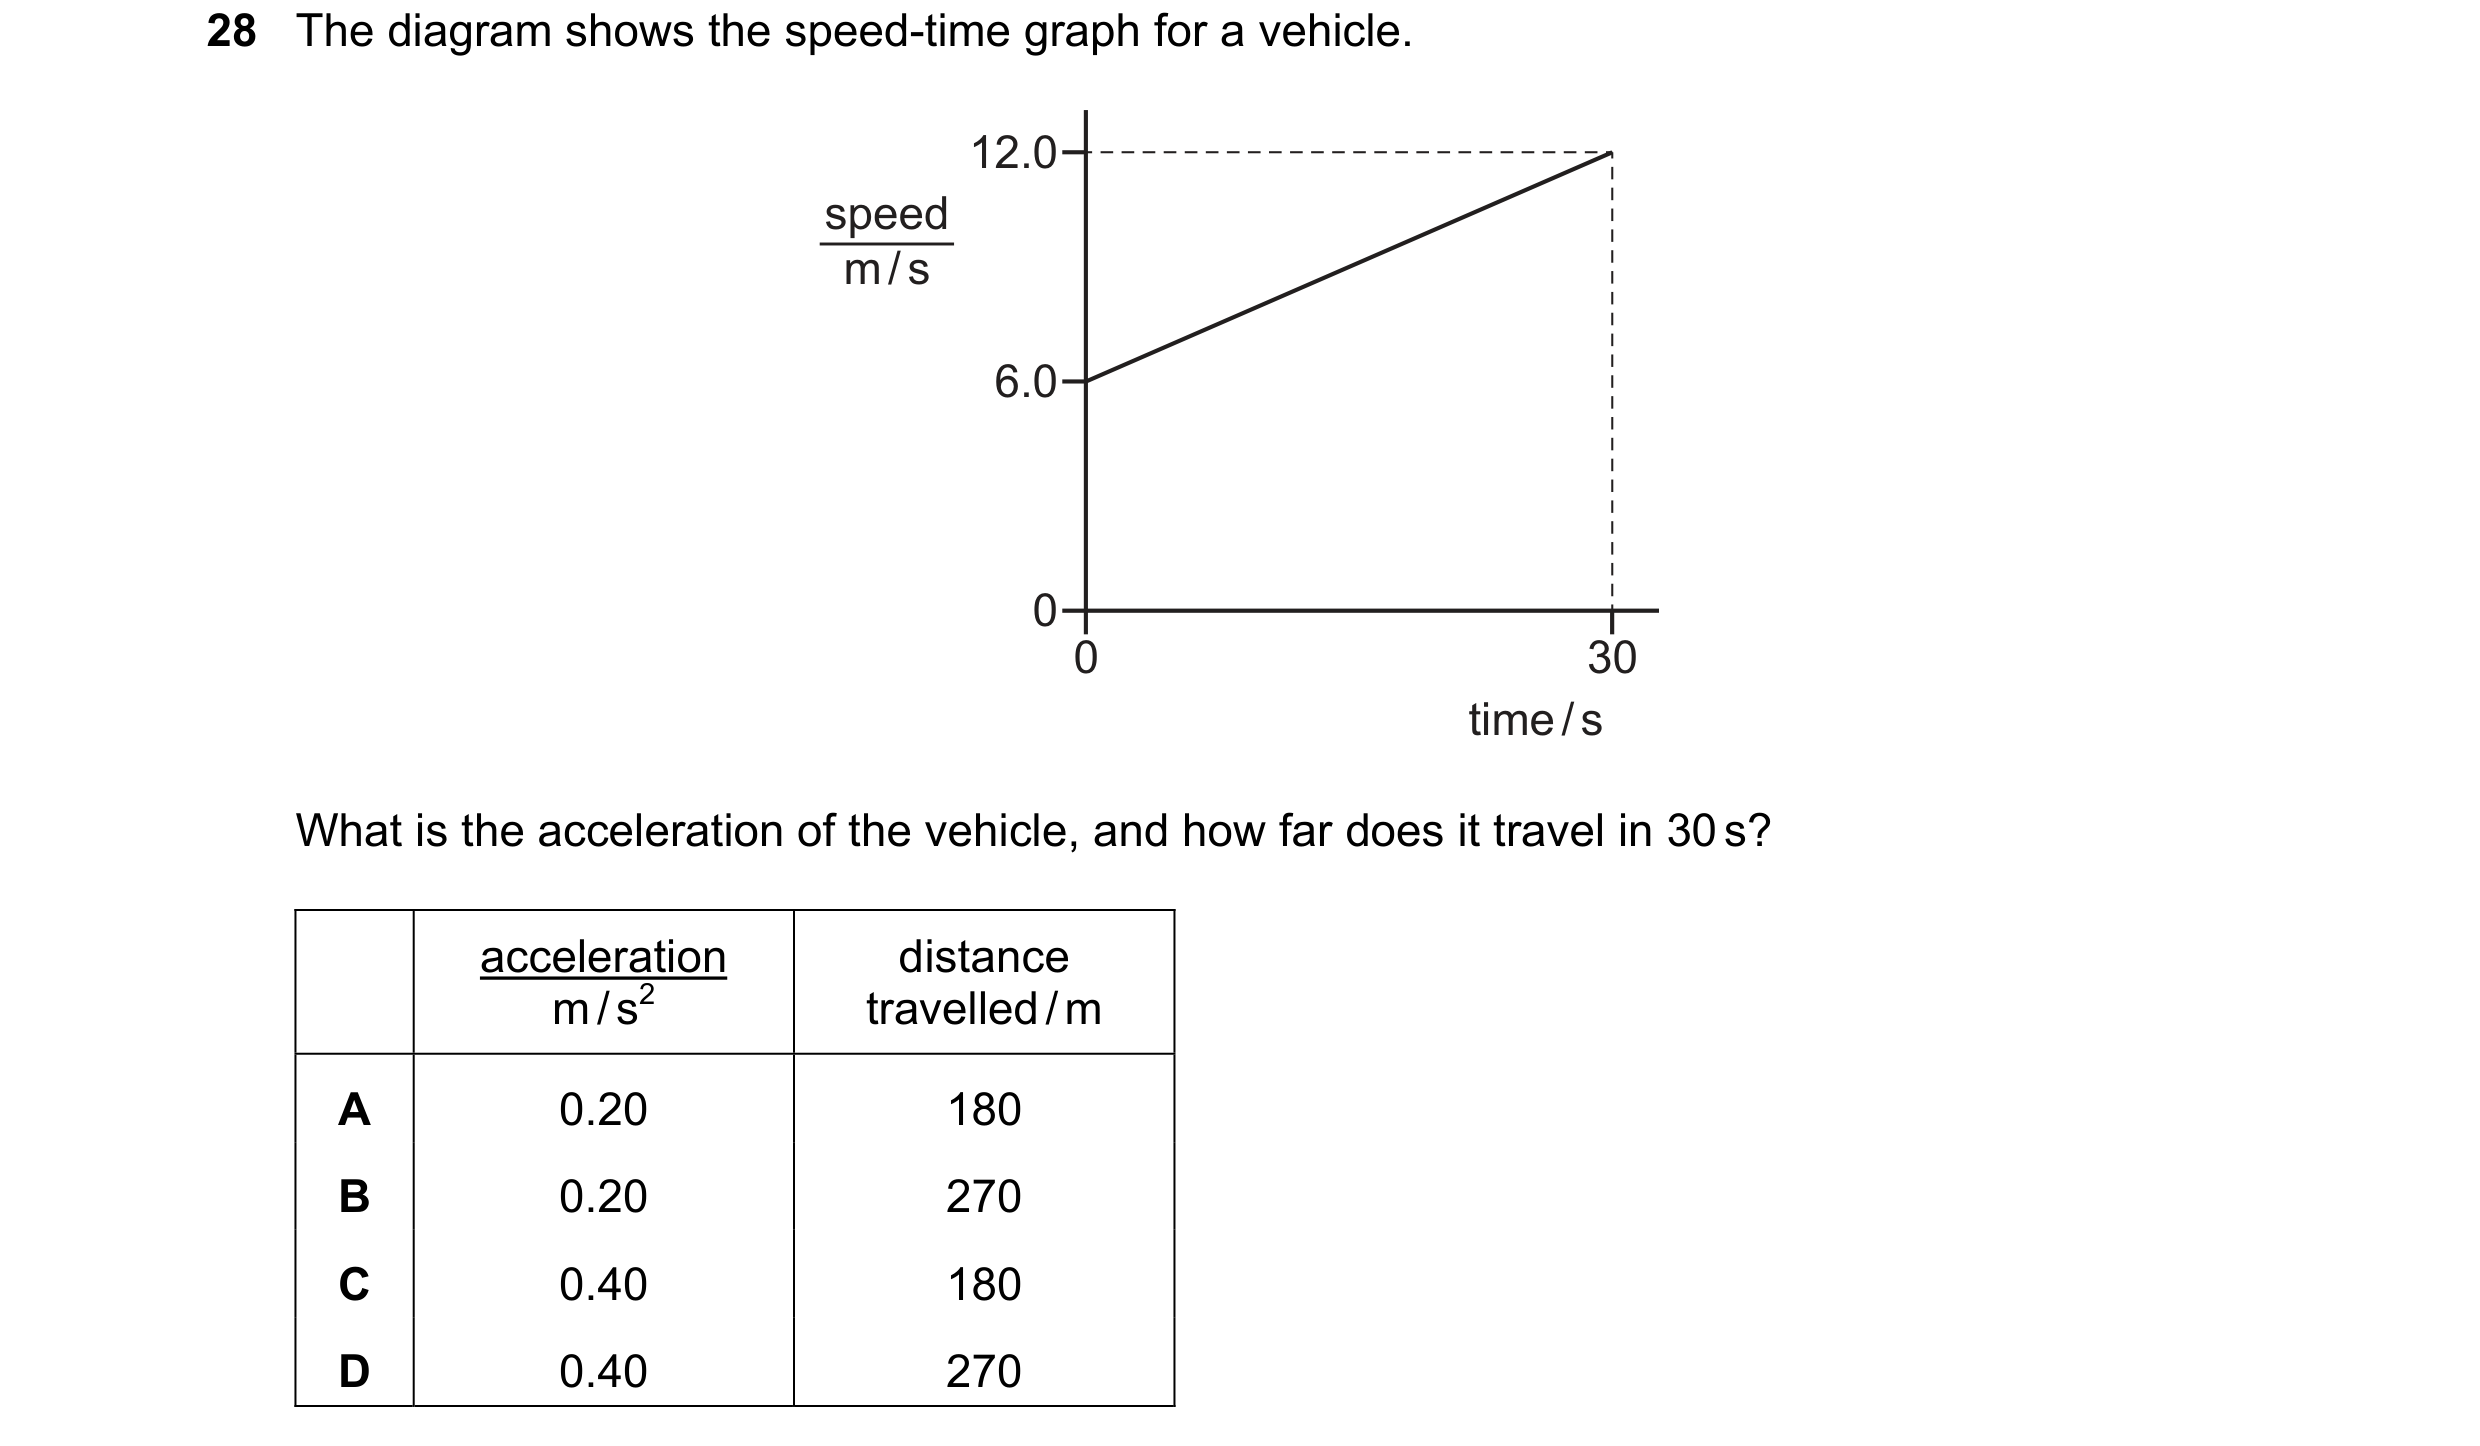

 2 / 21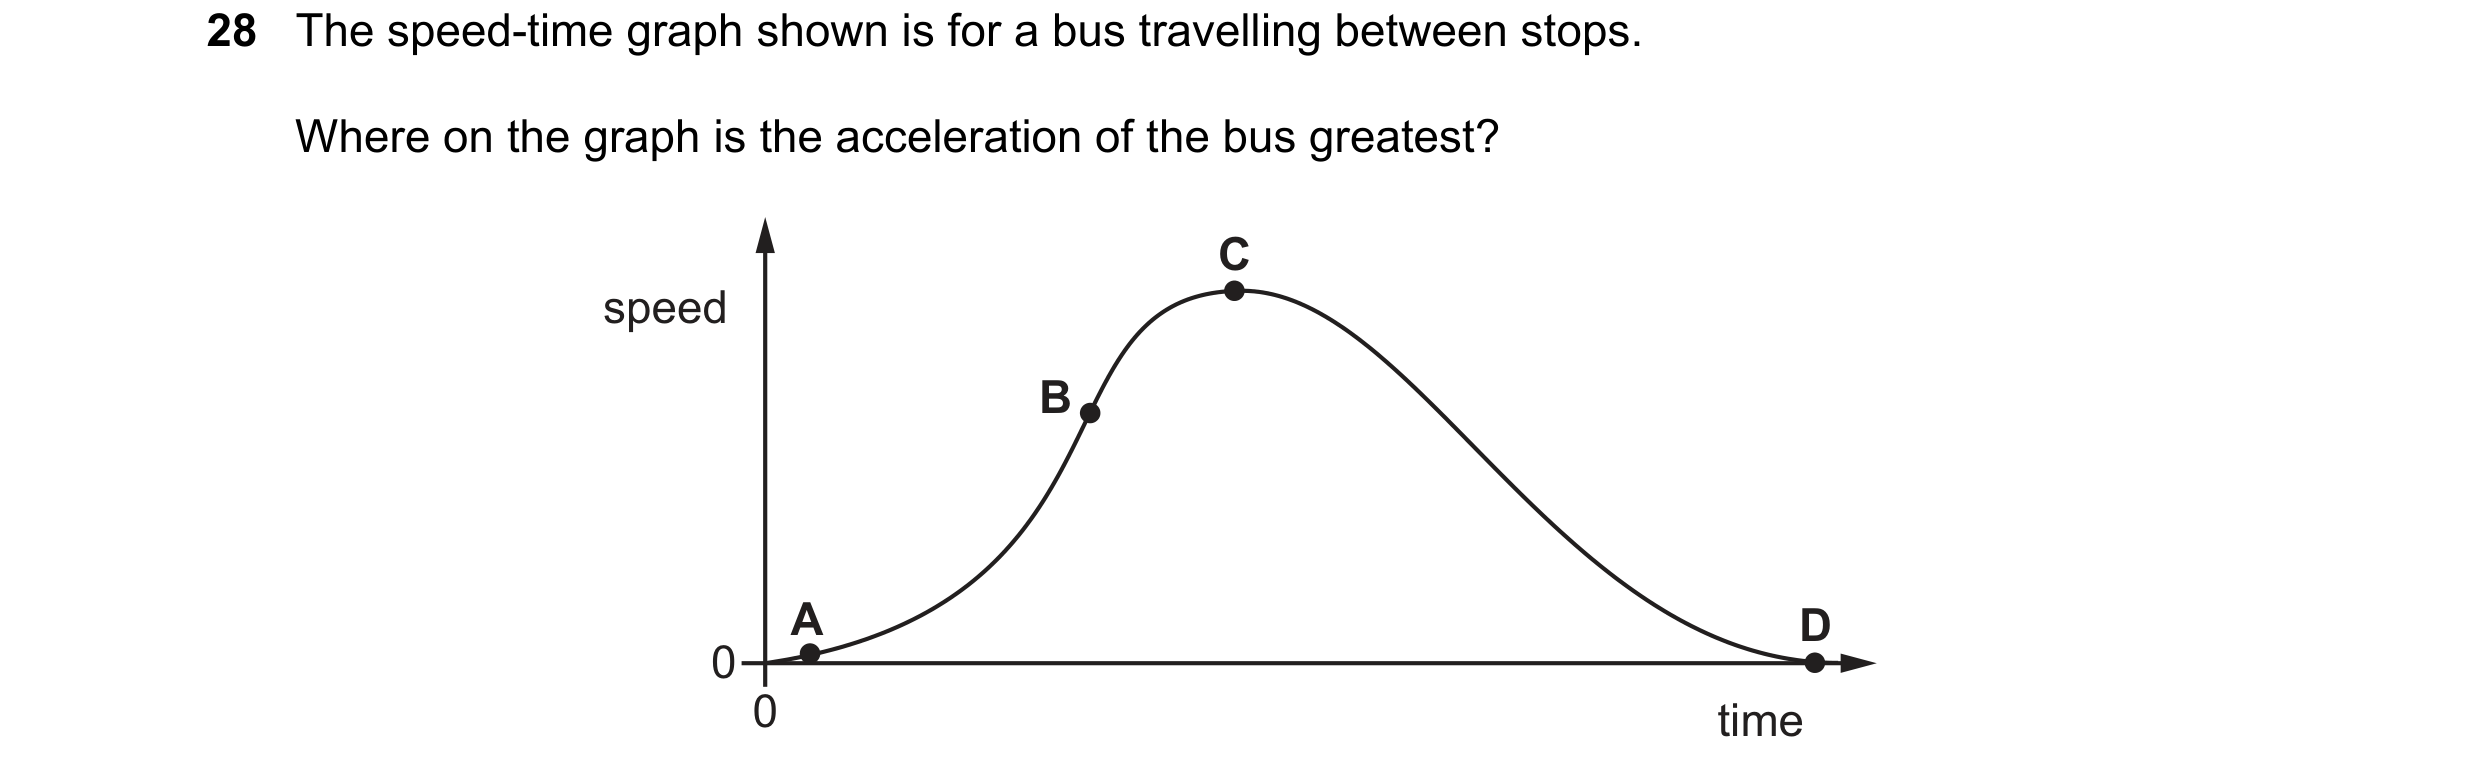
 3 / 21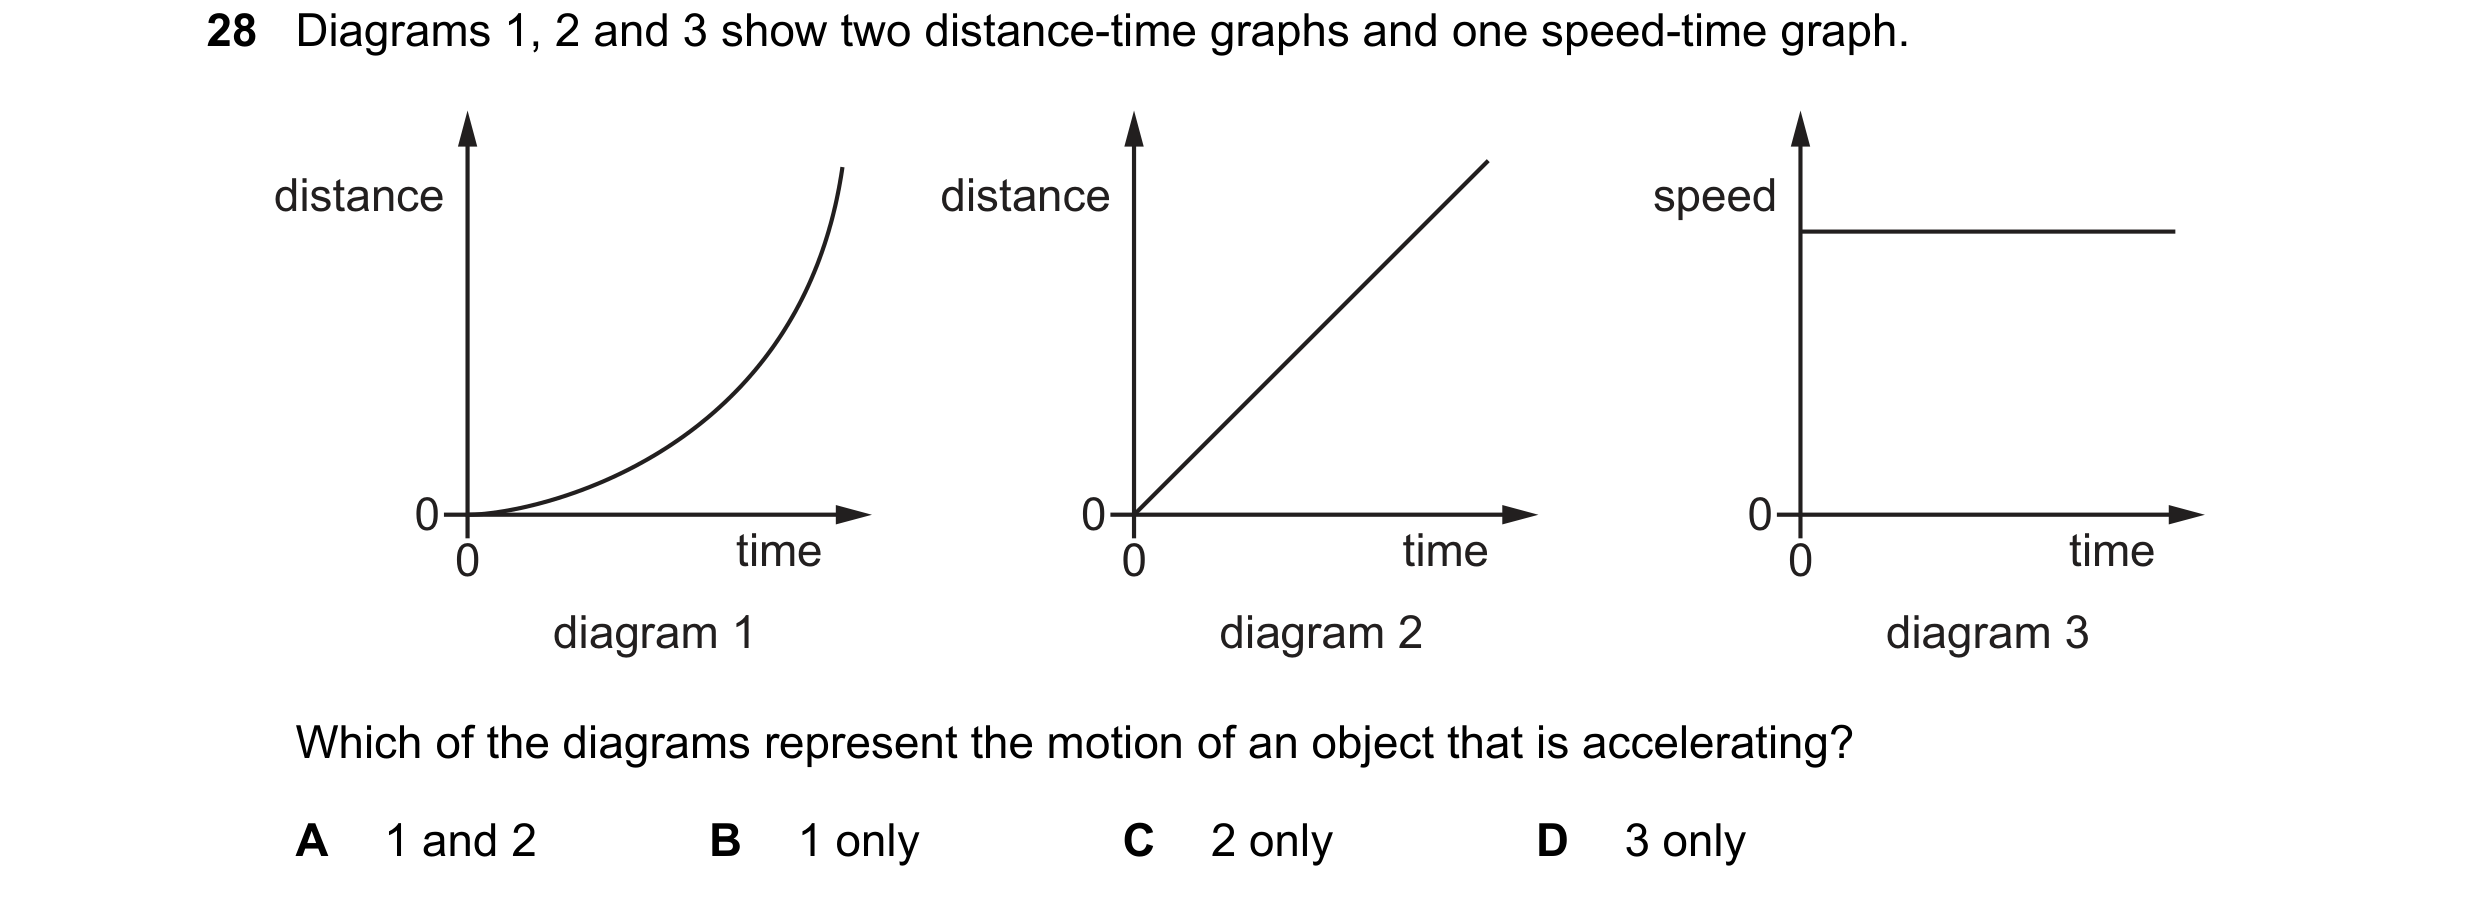
 4 / 21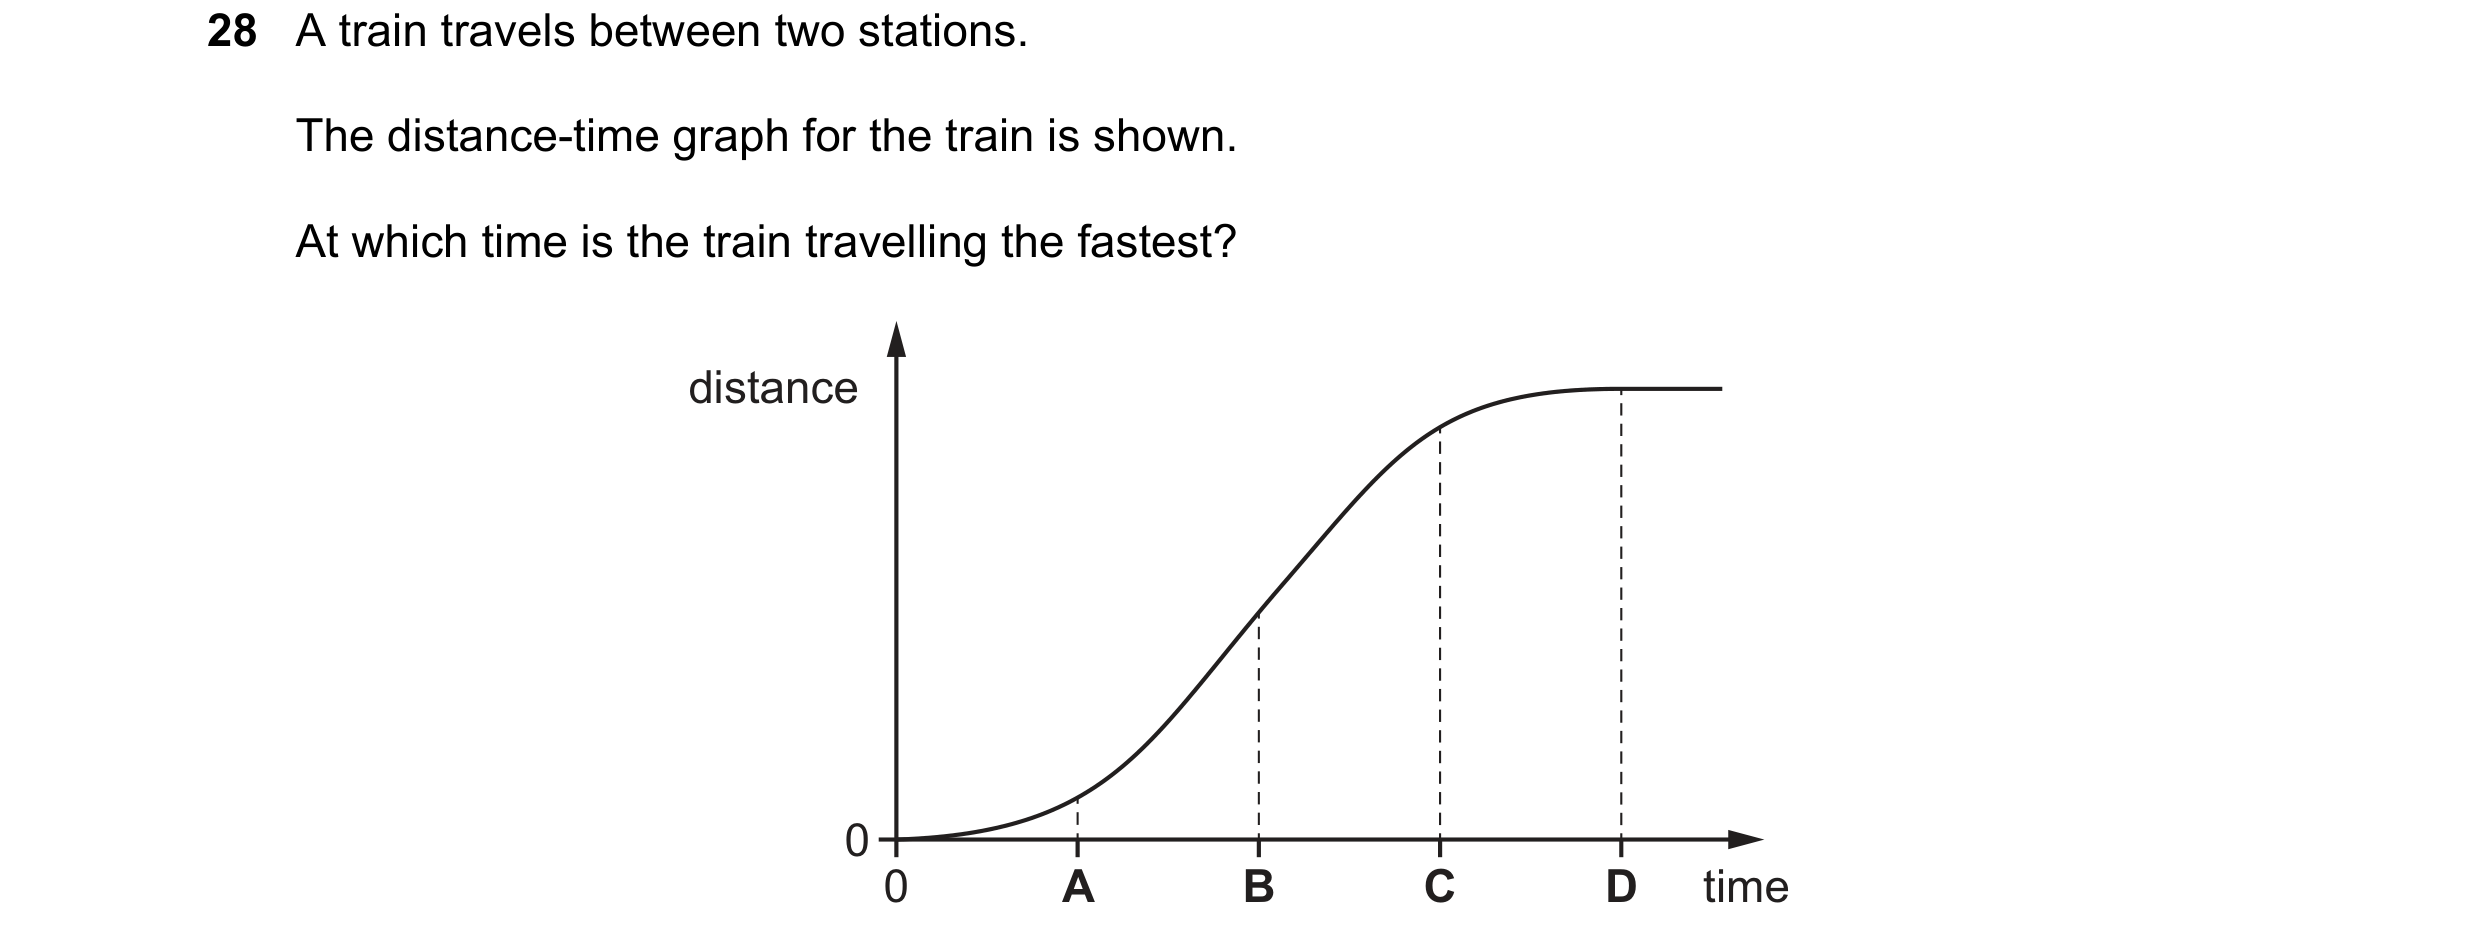

 5 / 21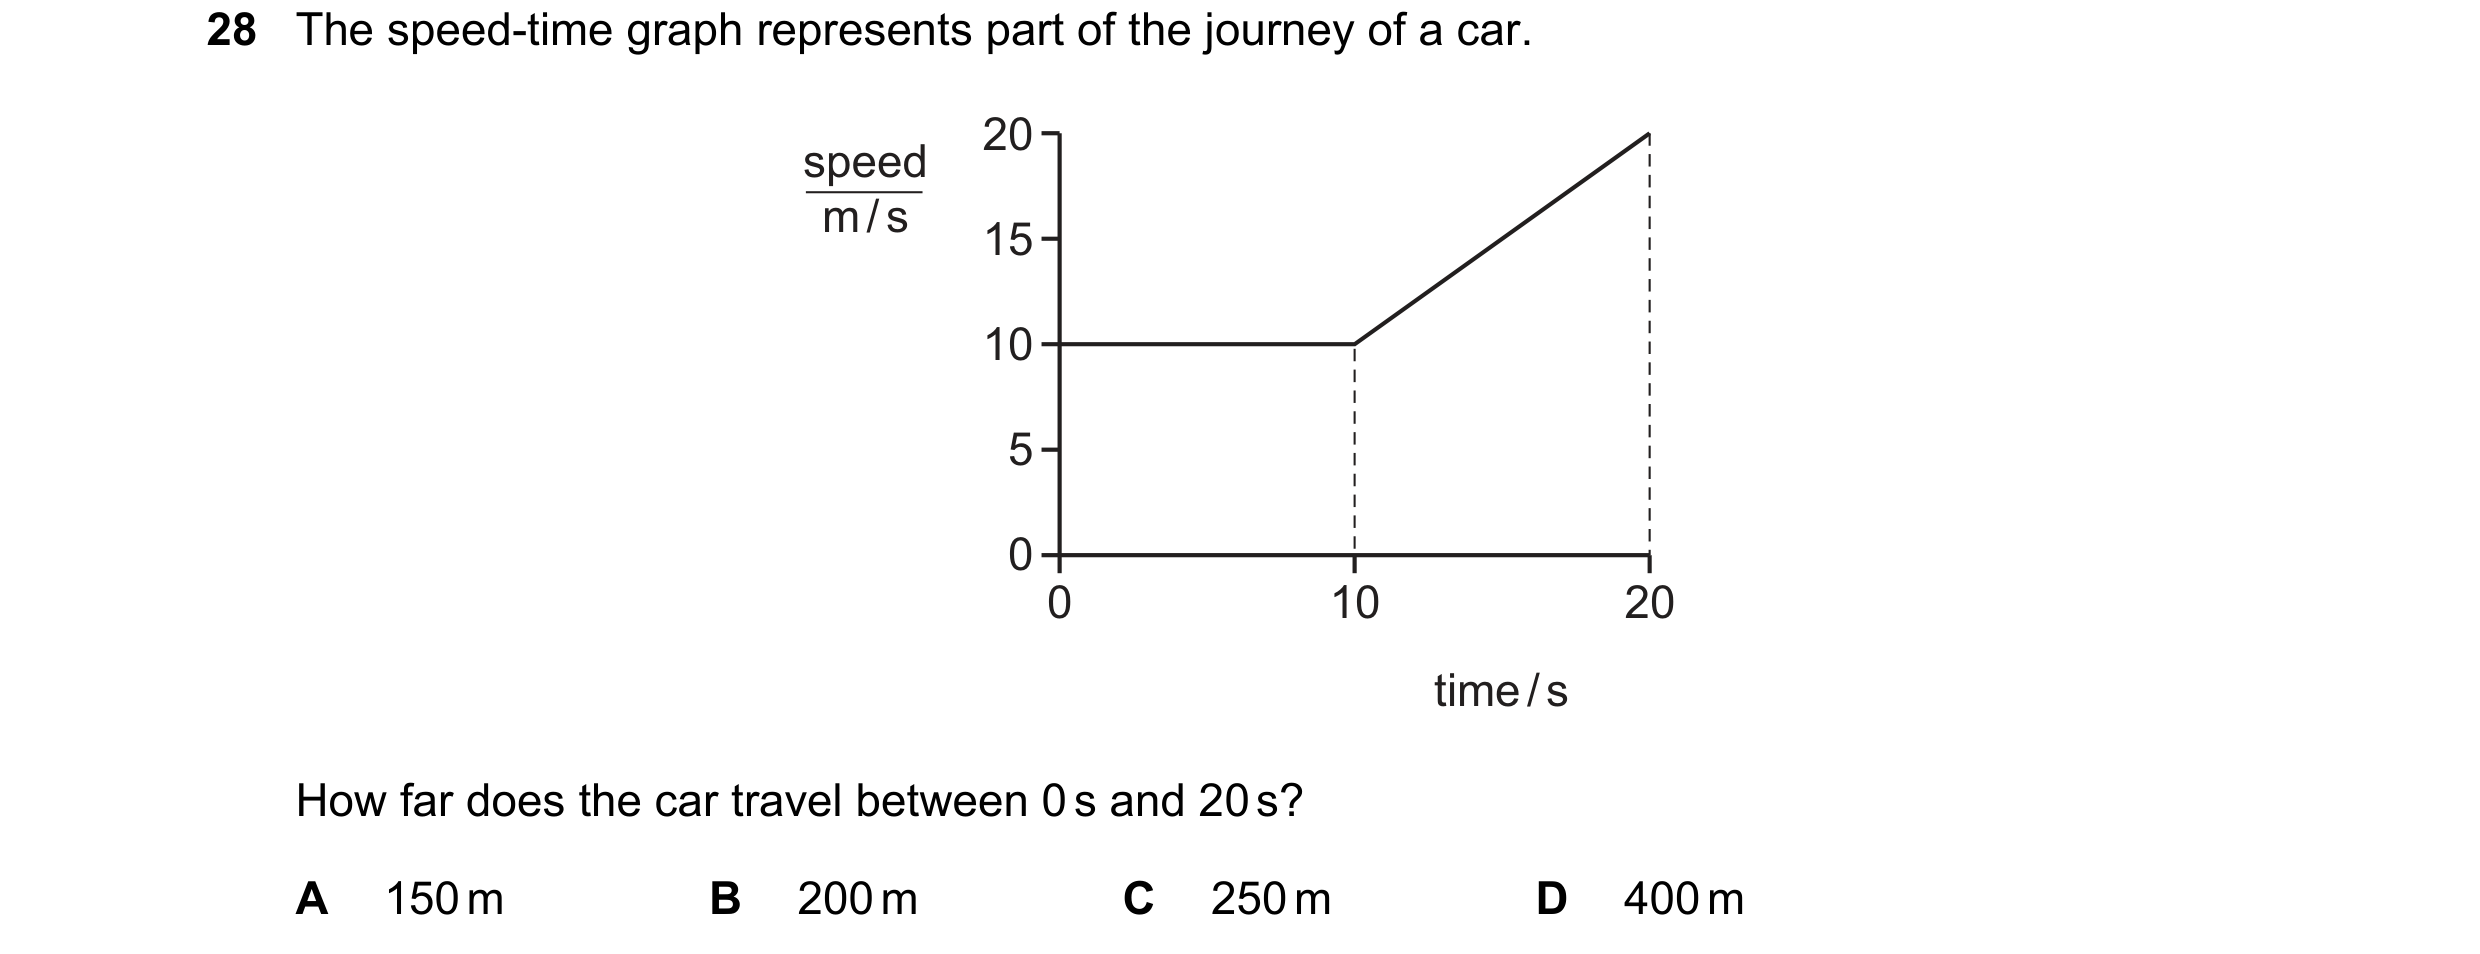
 6 / 21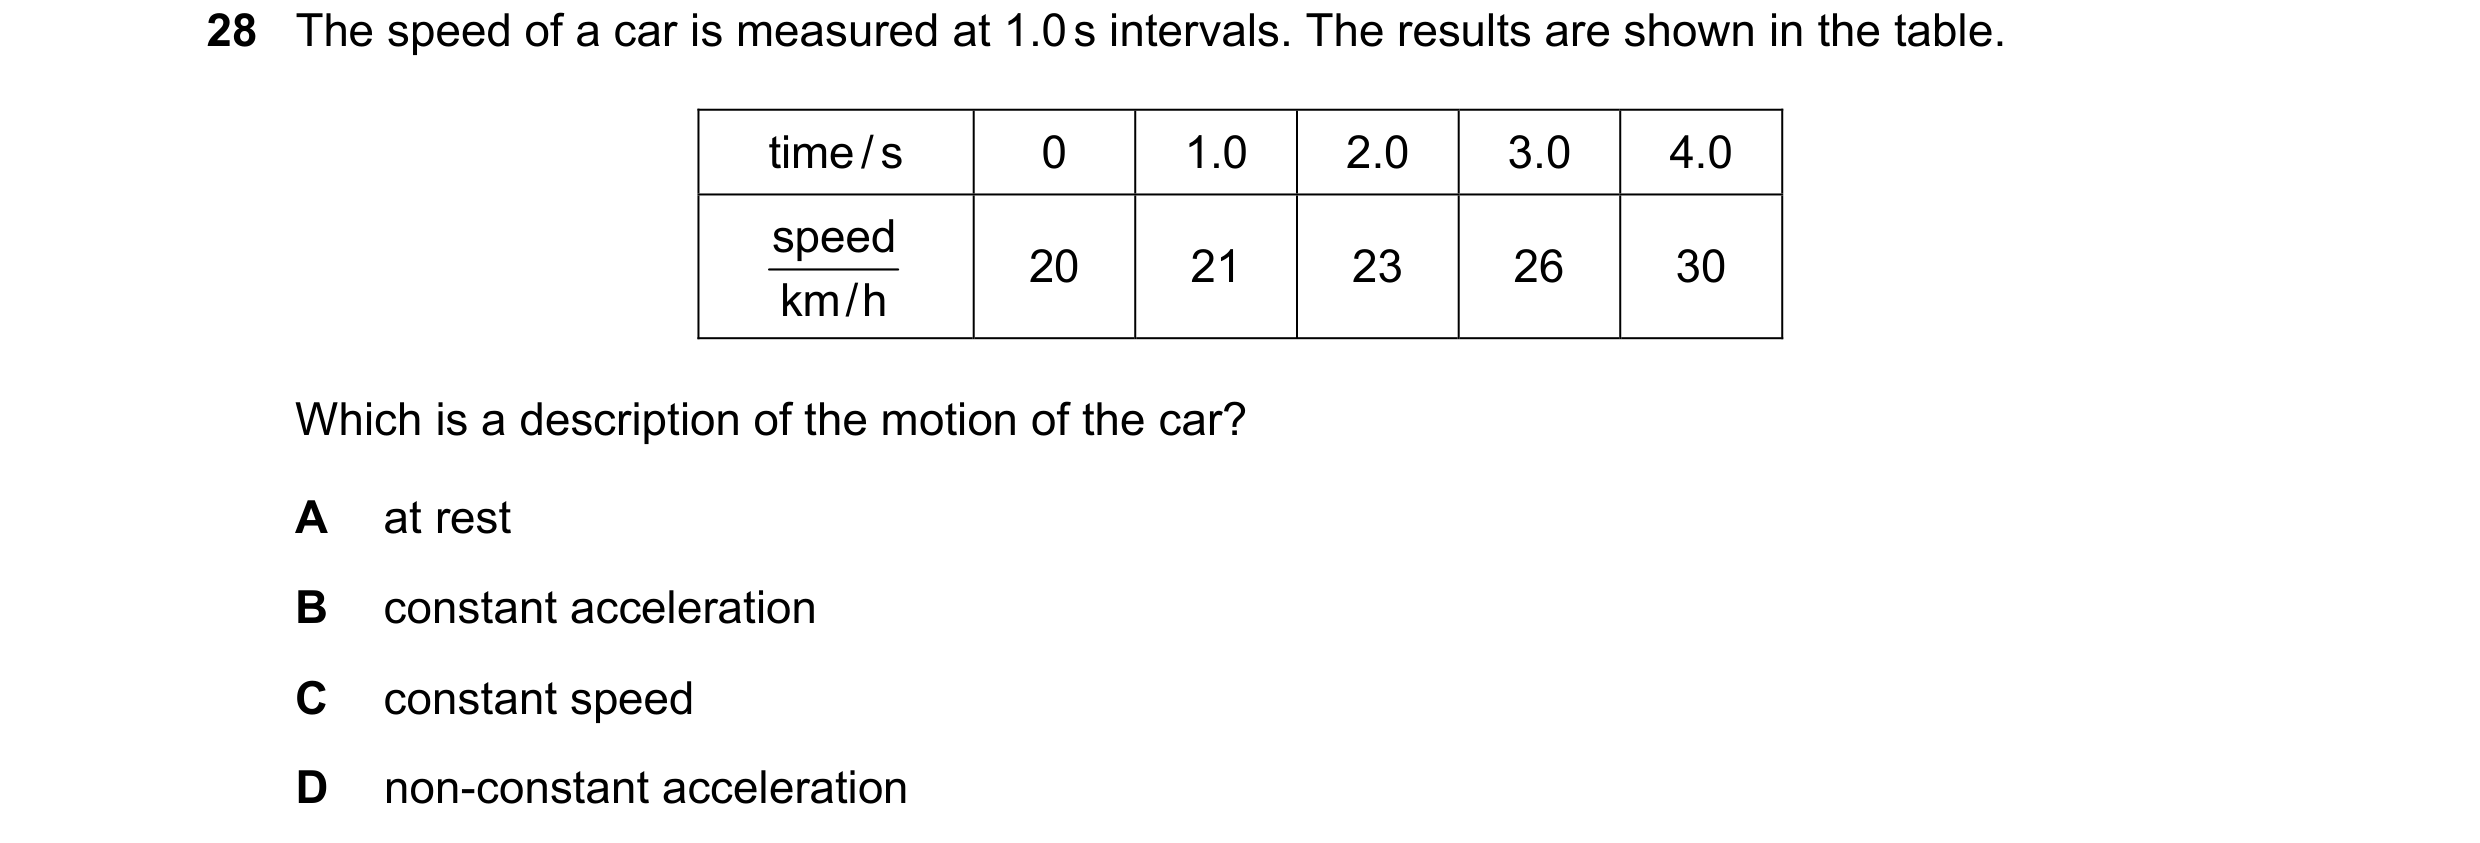
 7 / 21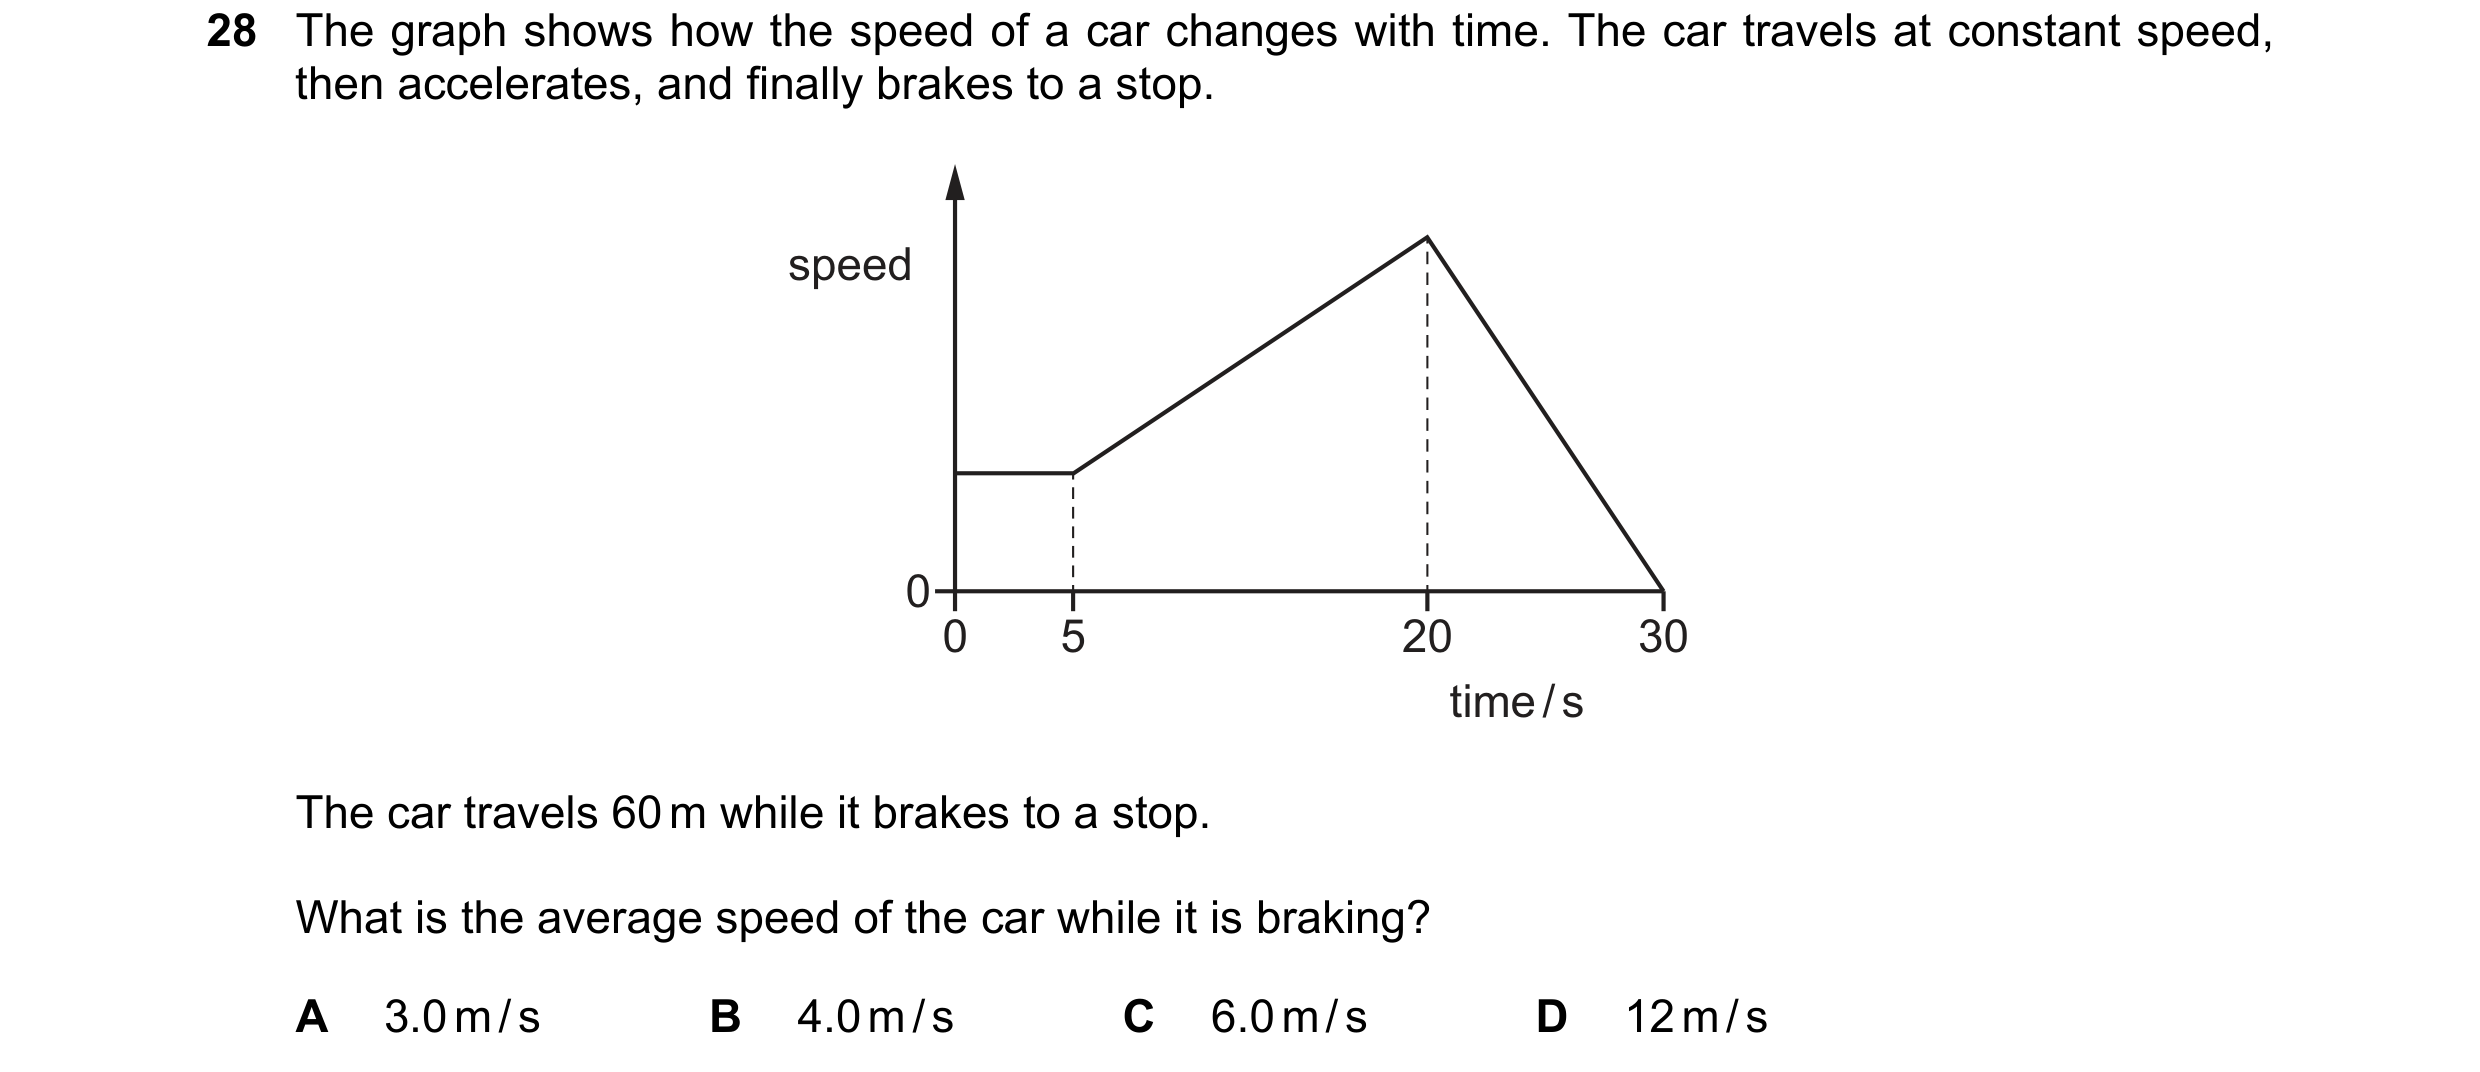
 8 / 21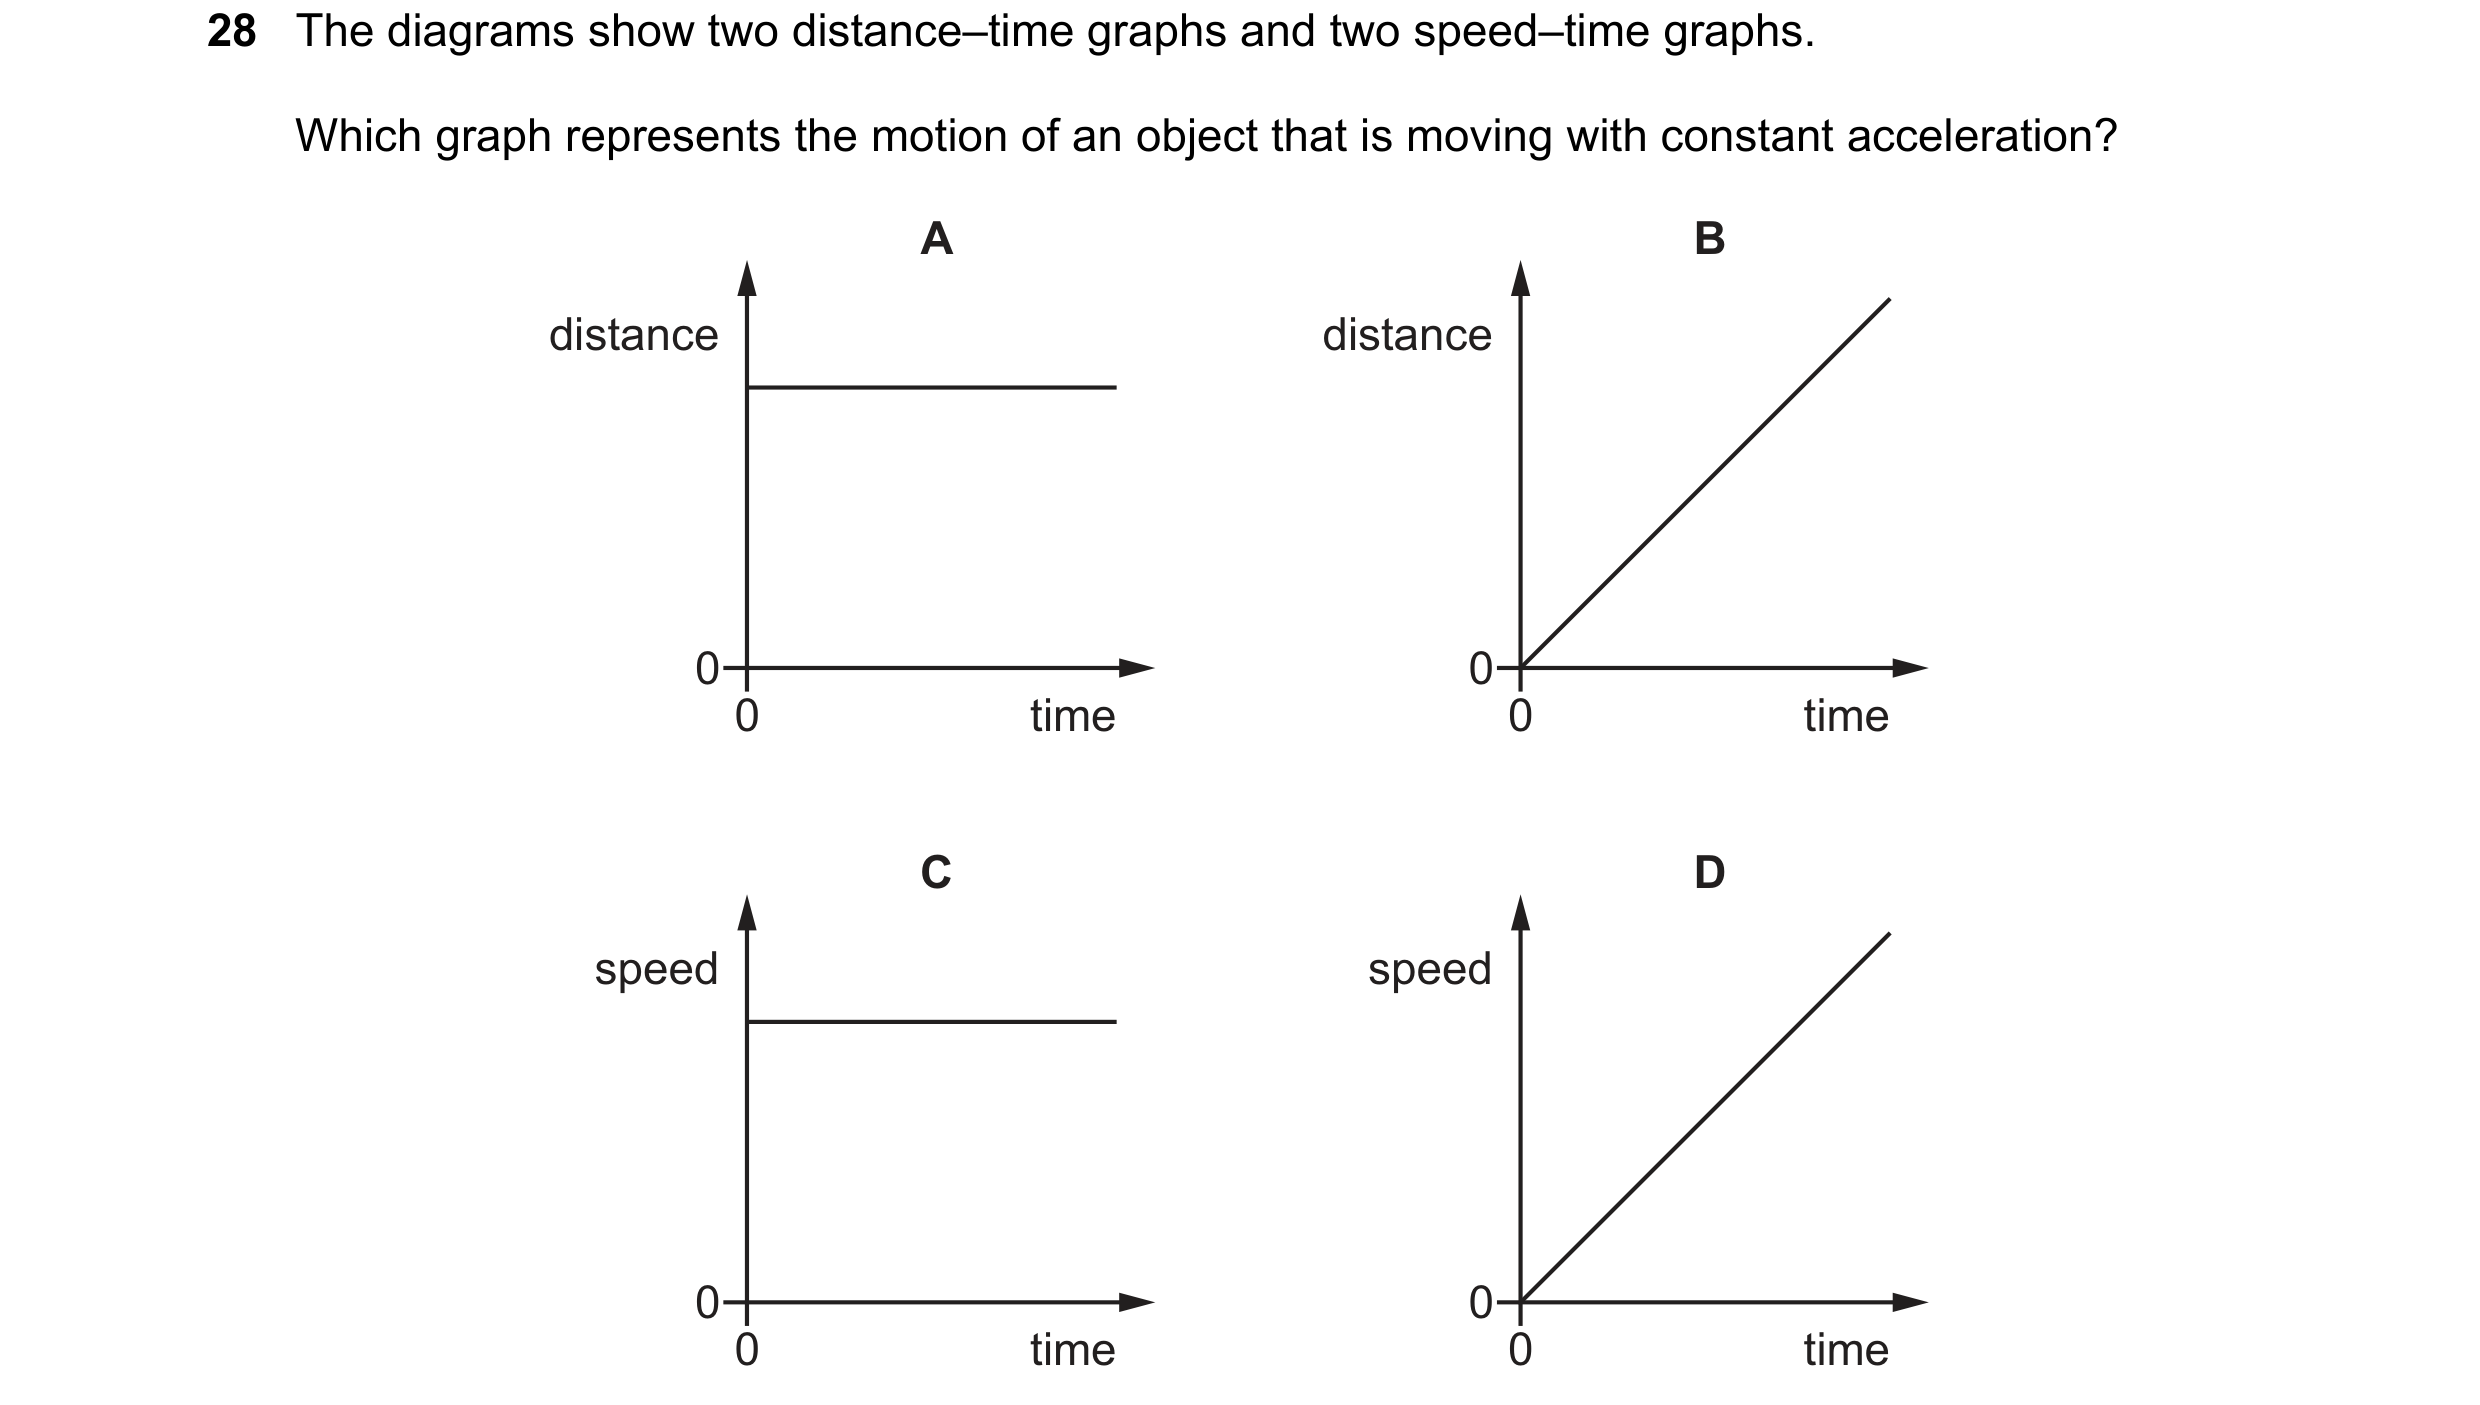
 9 / 21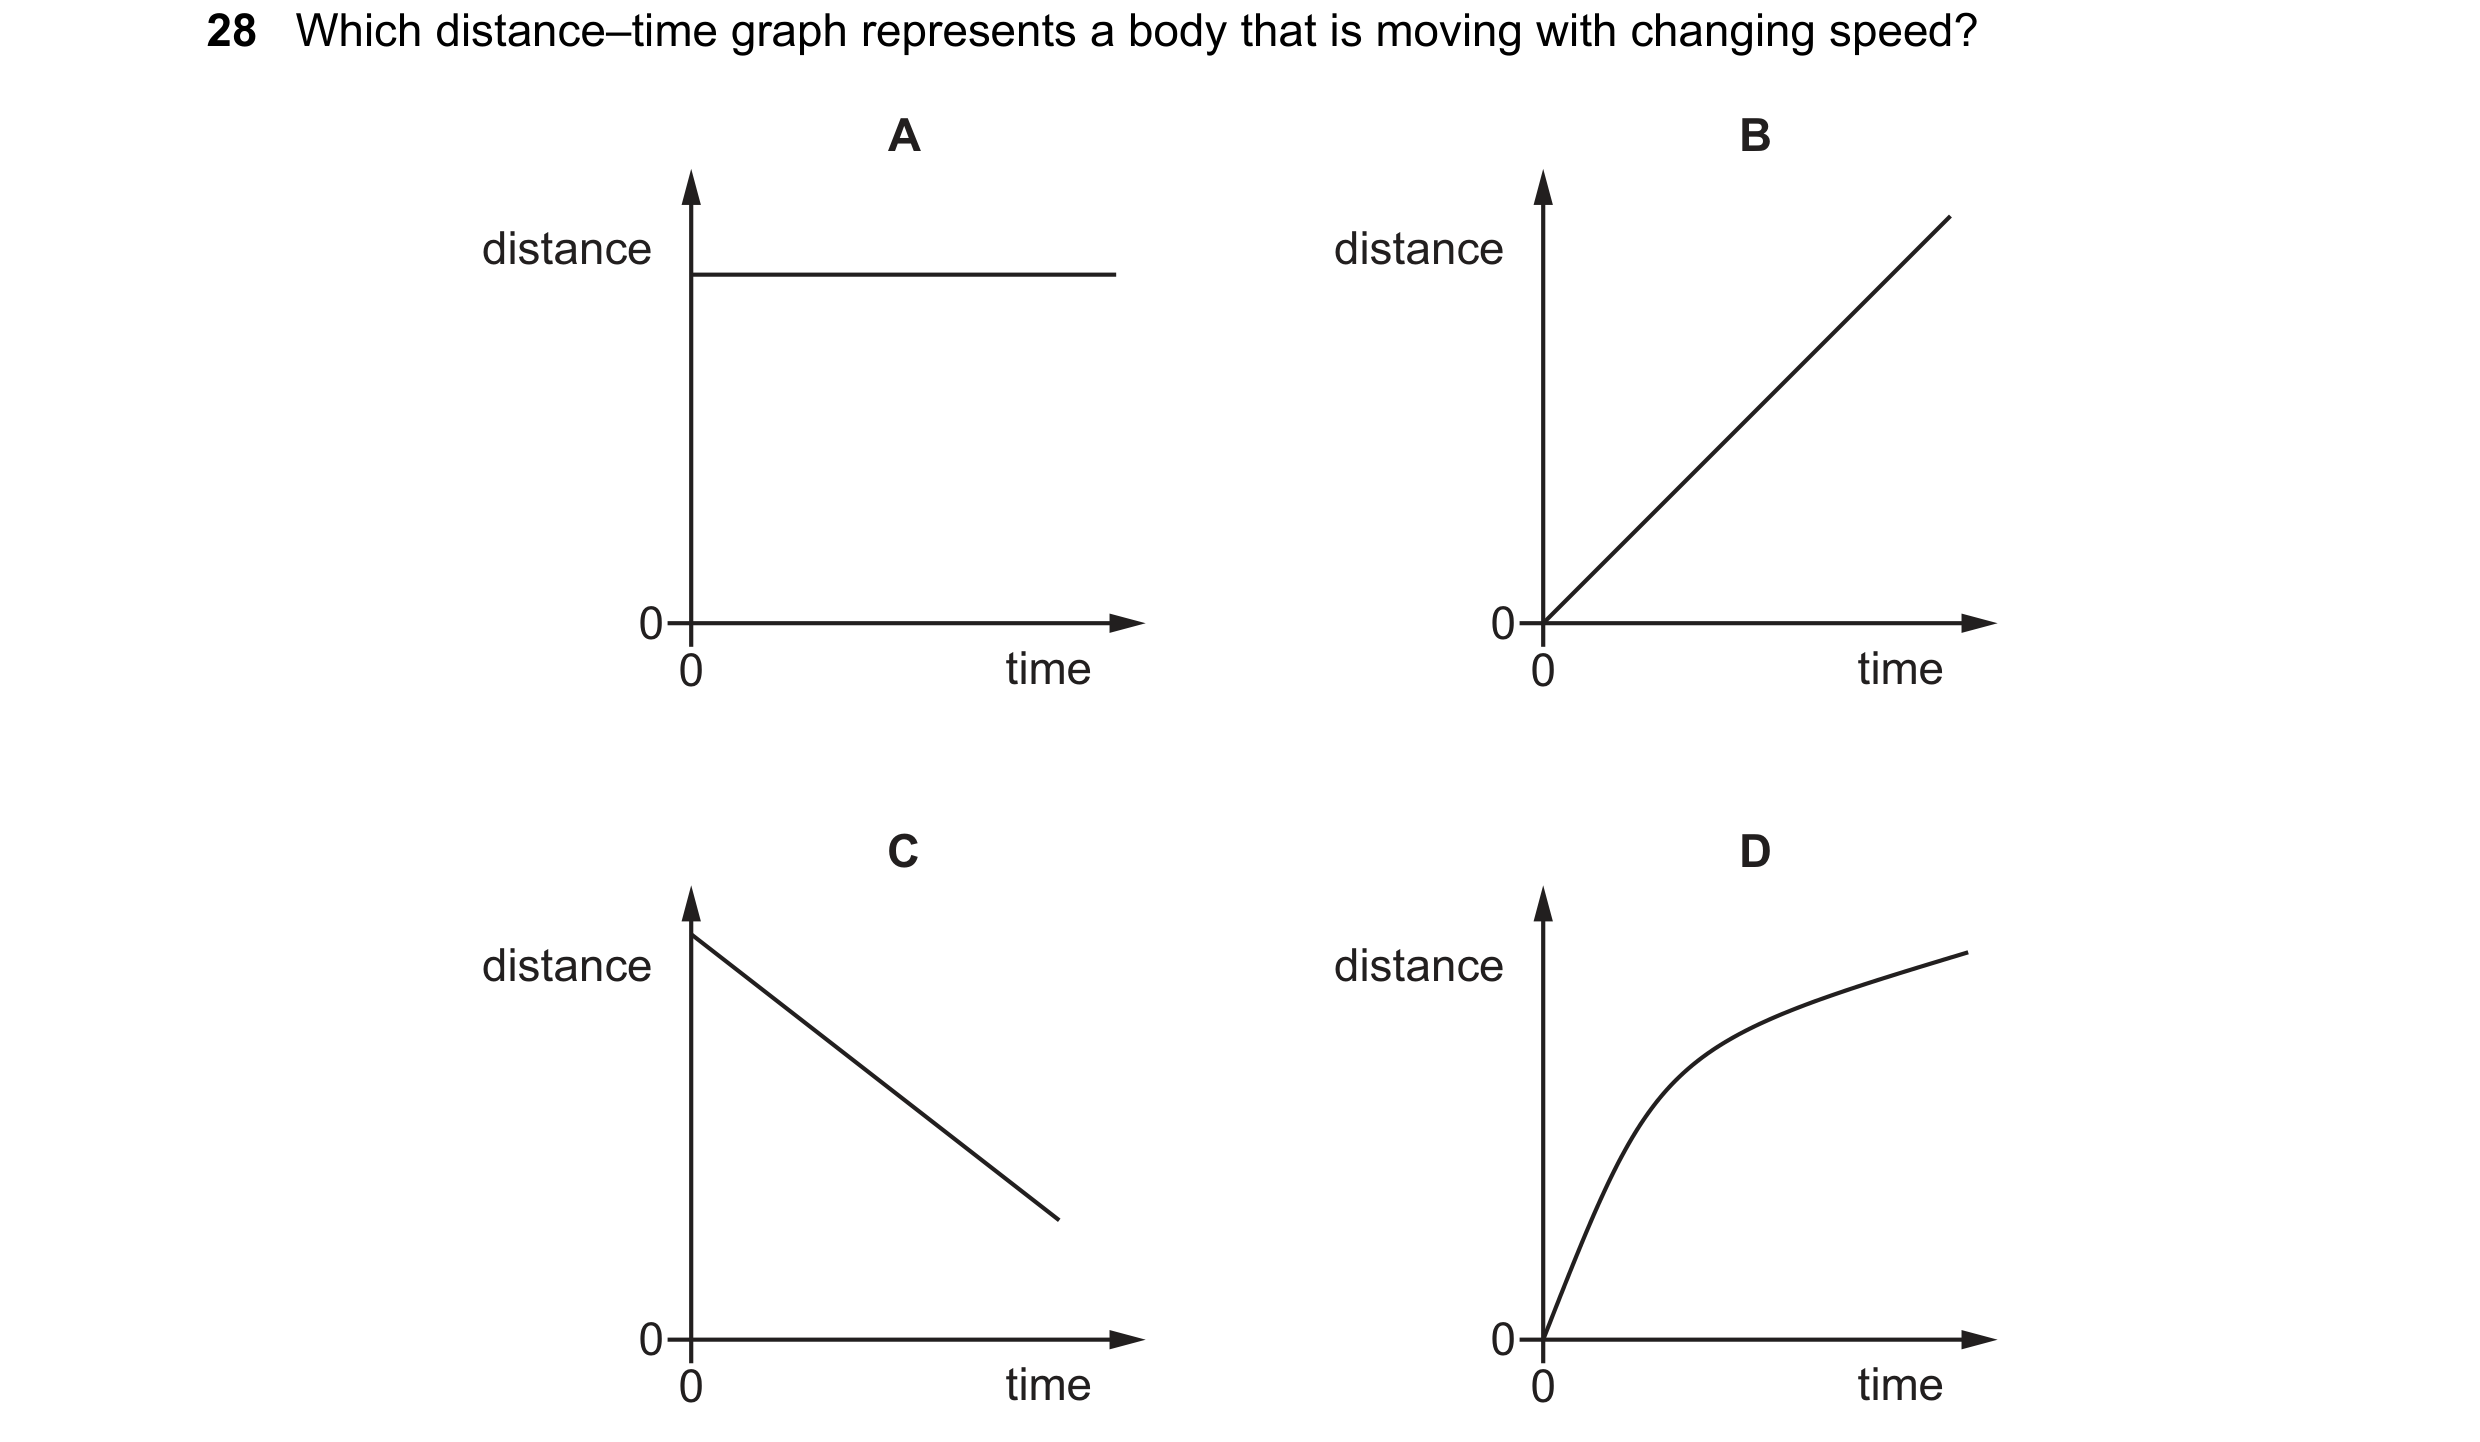
 10 / 21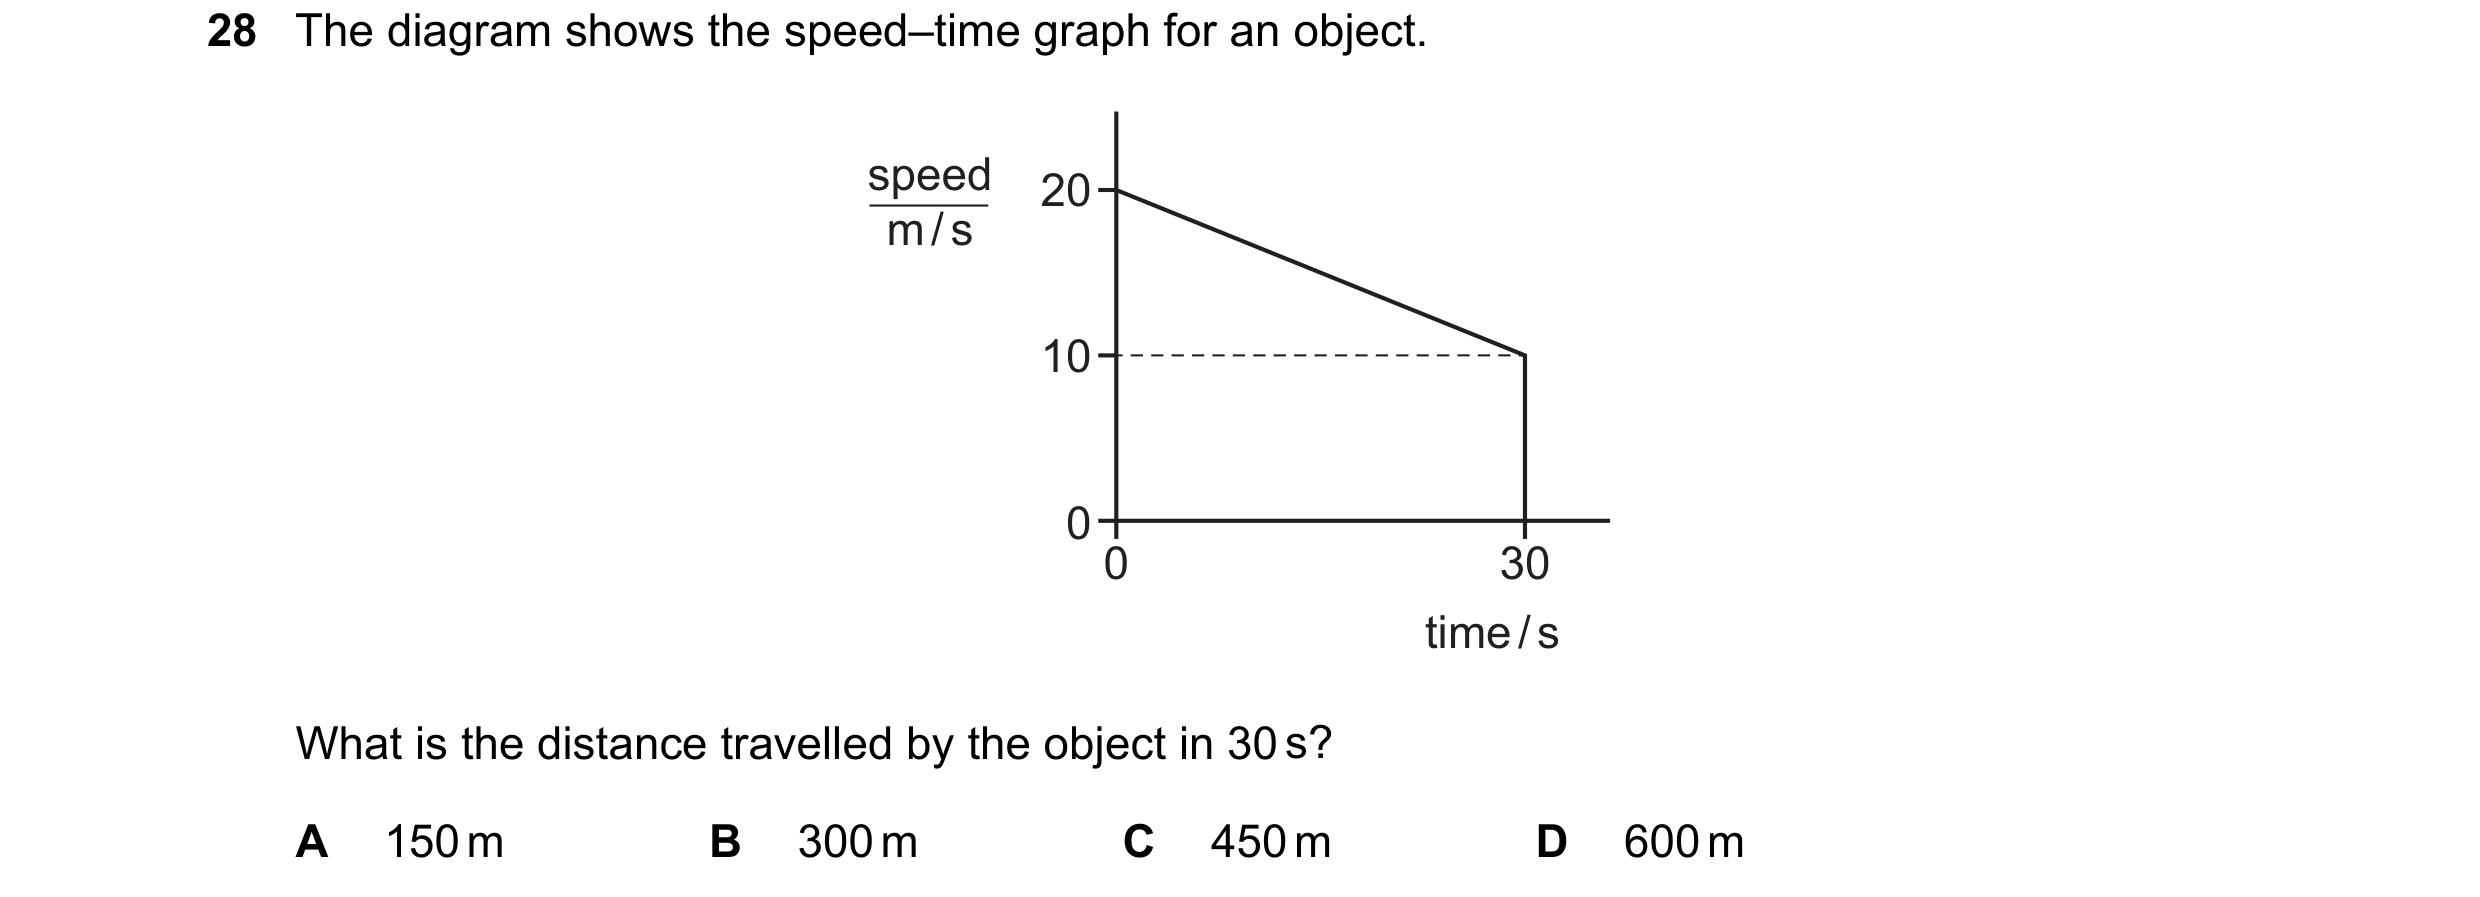
 11 / 21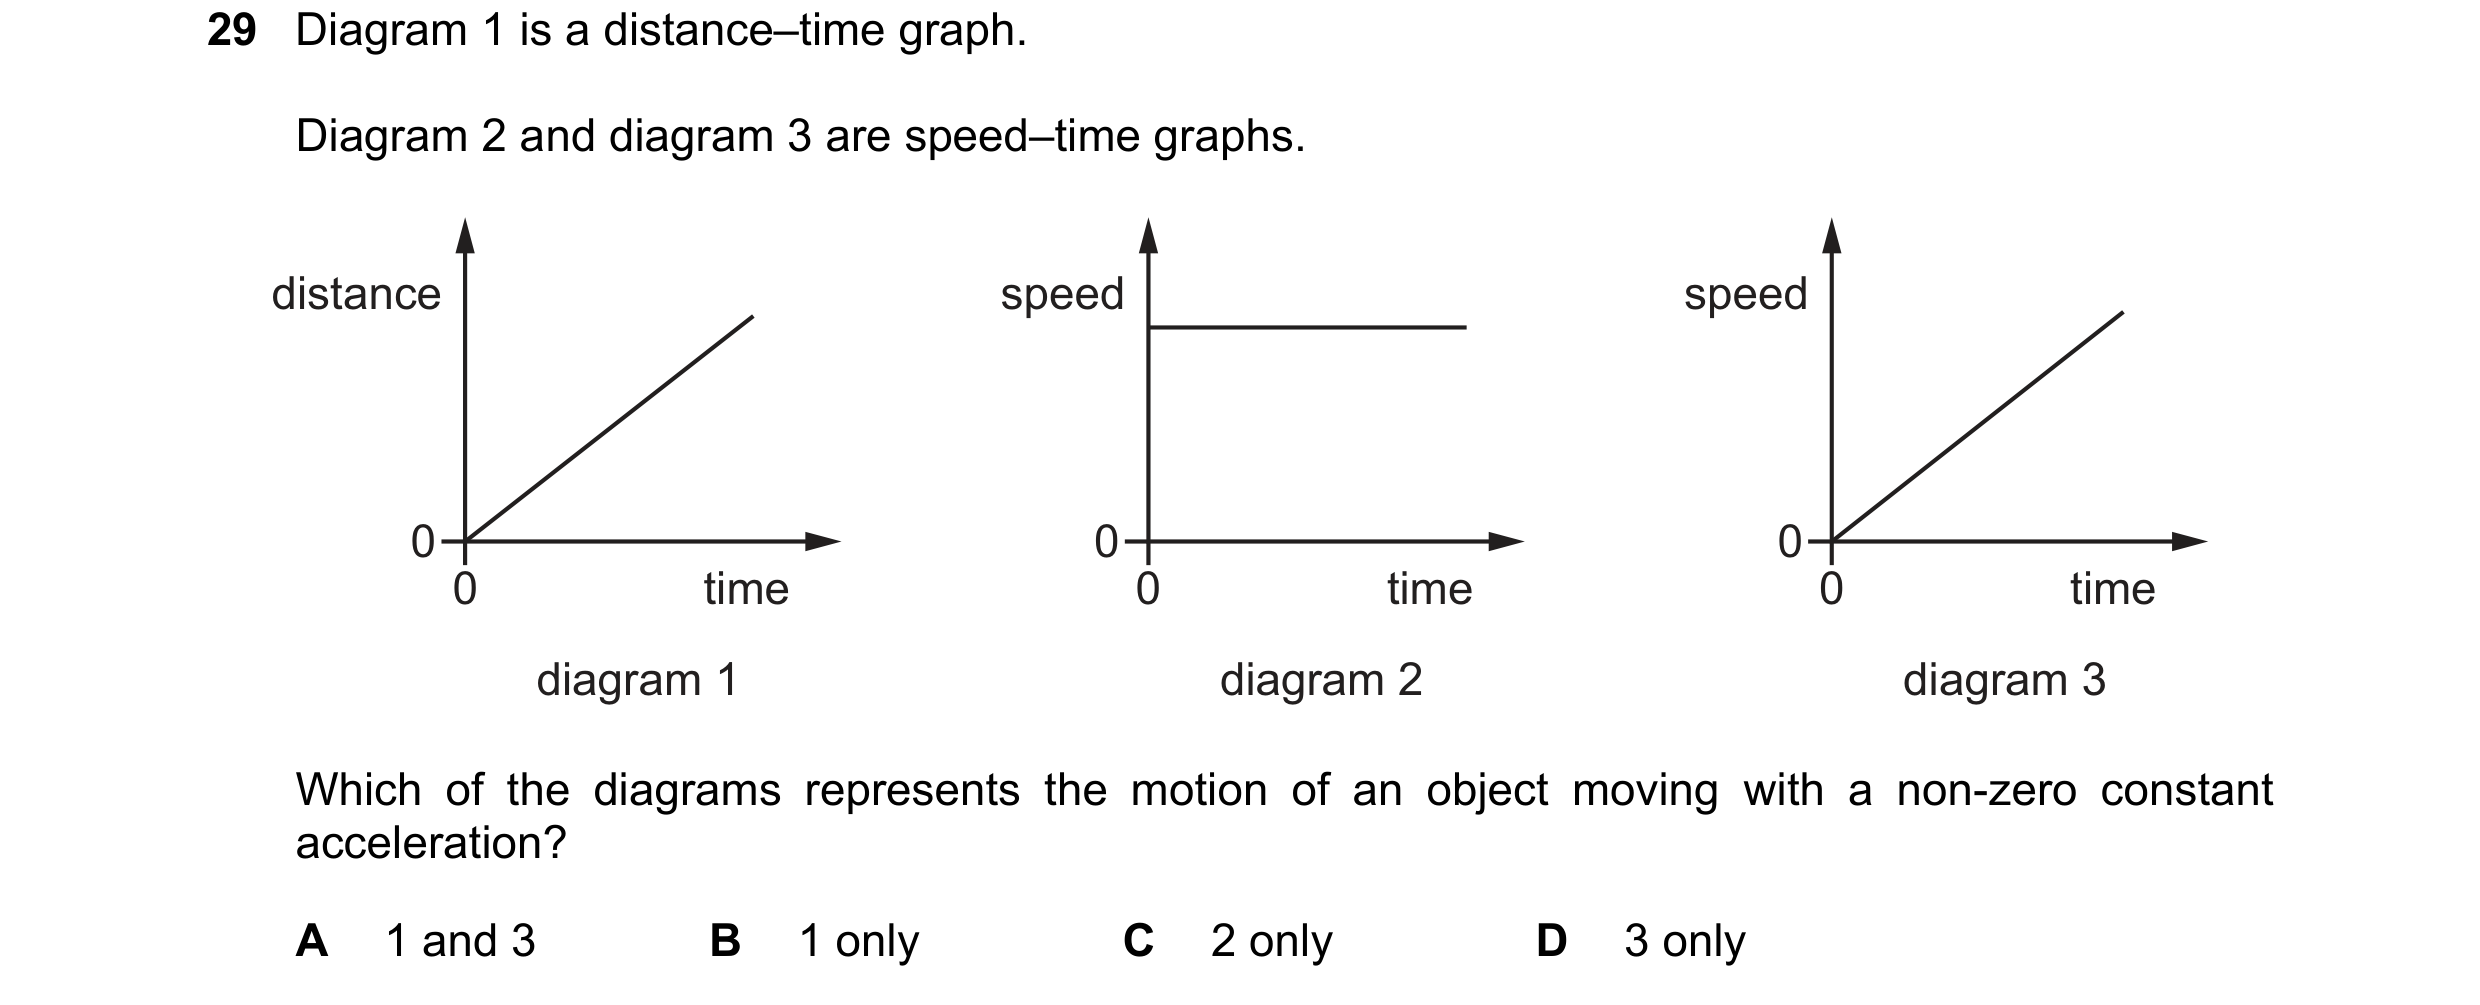
 12 / 21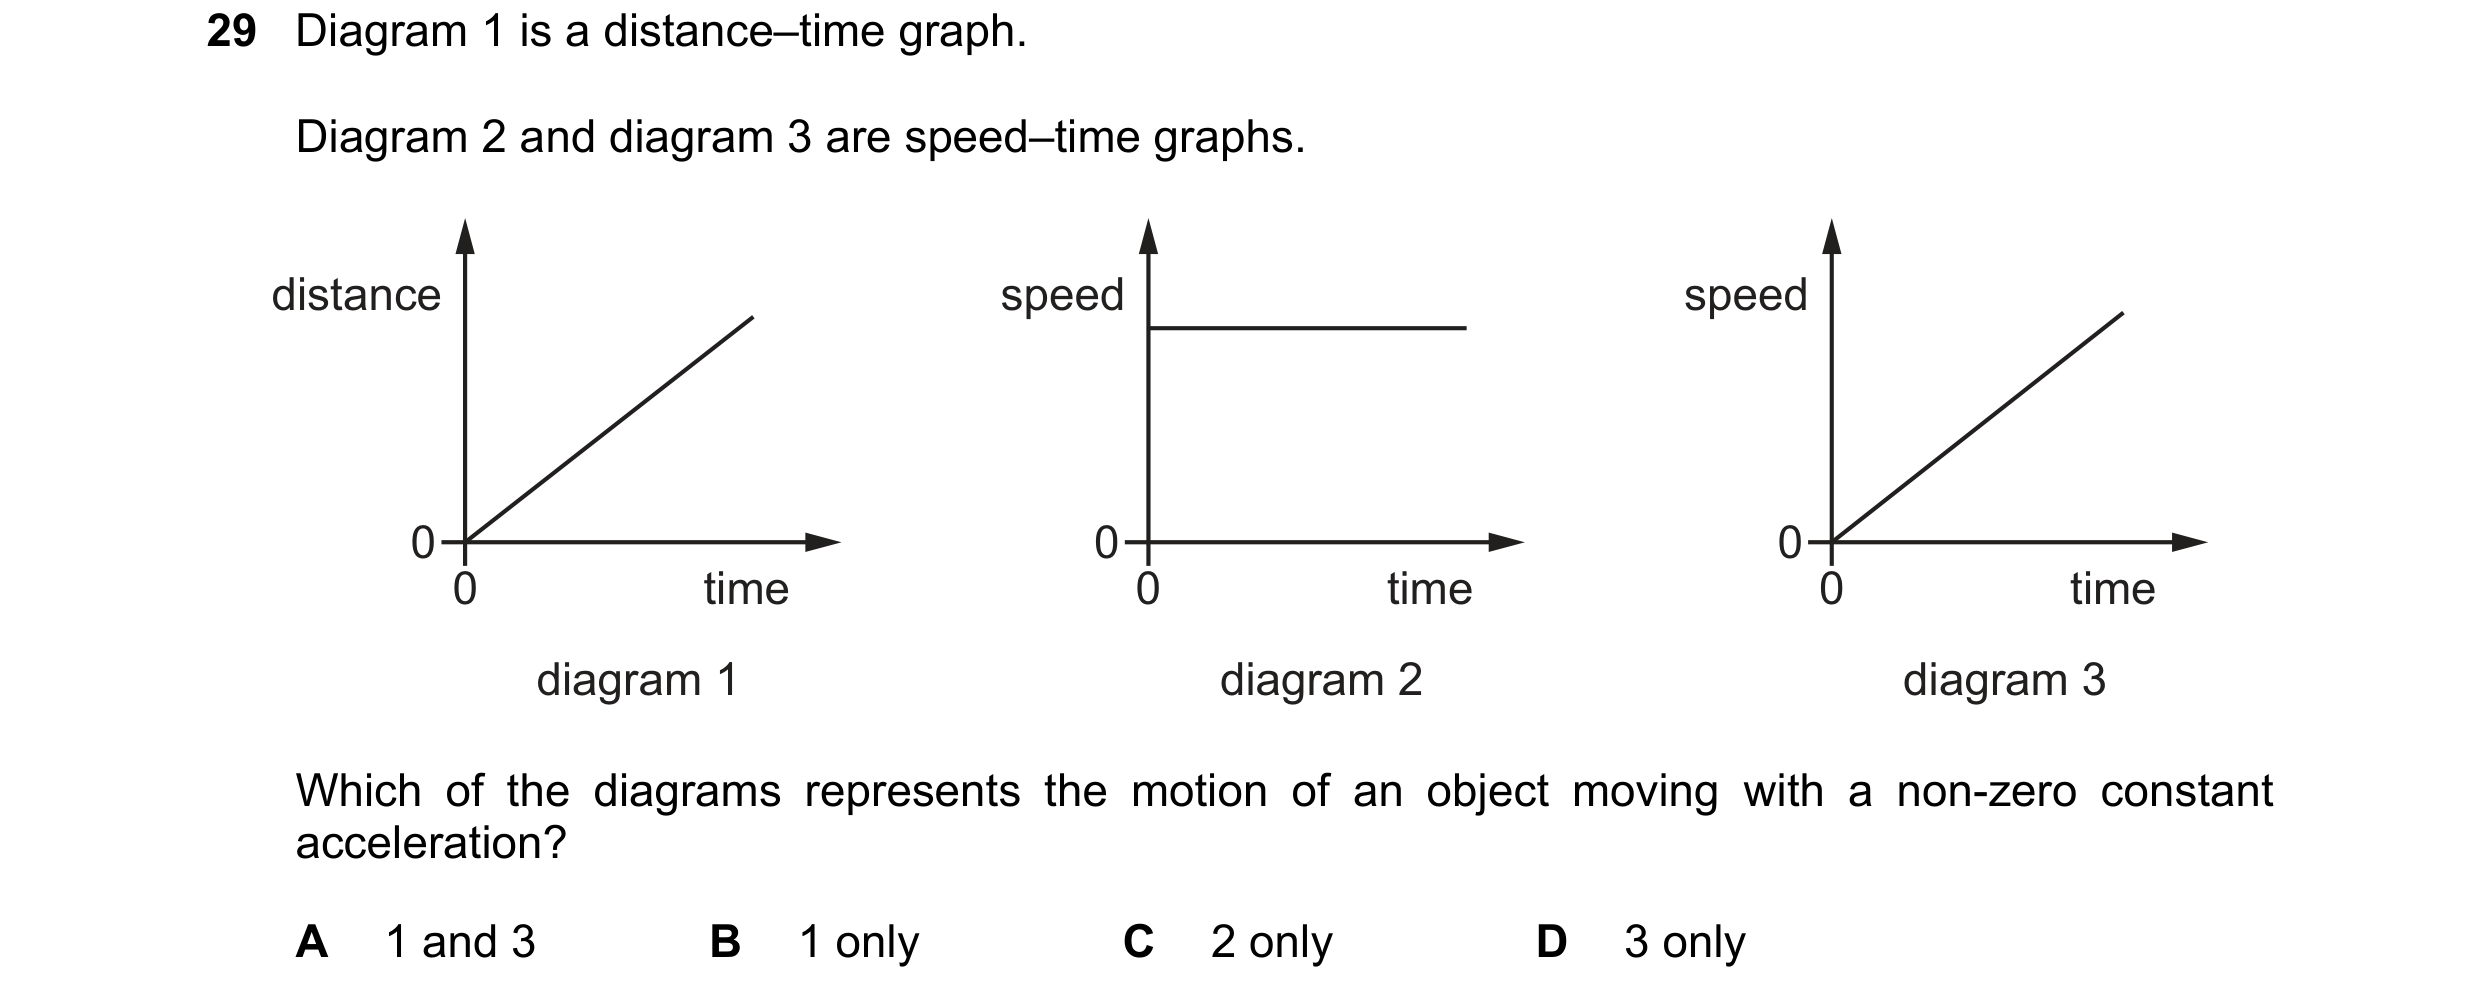
 13 / 21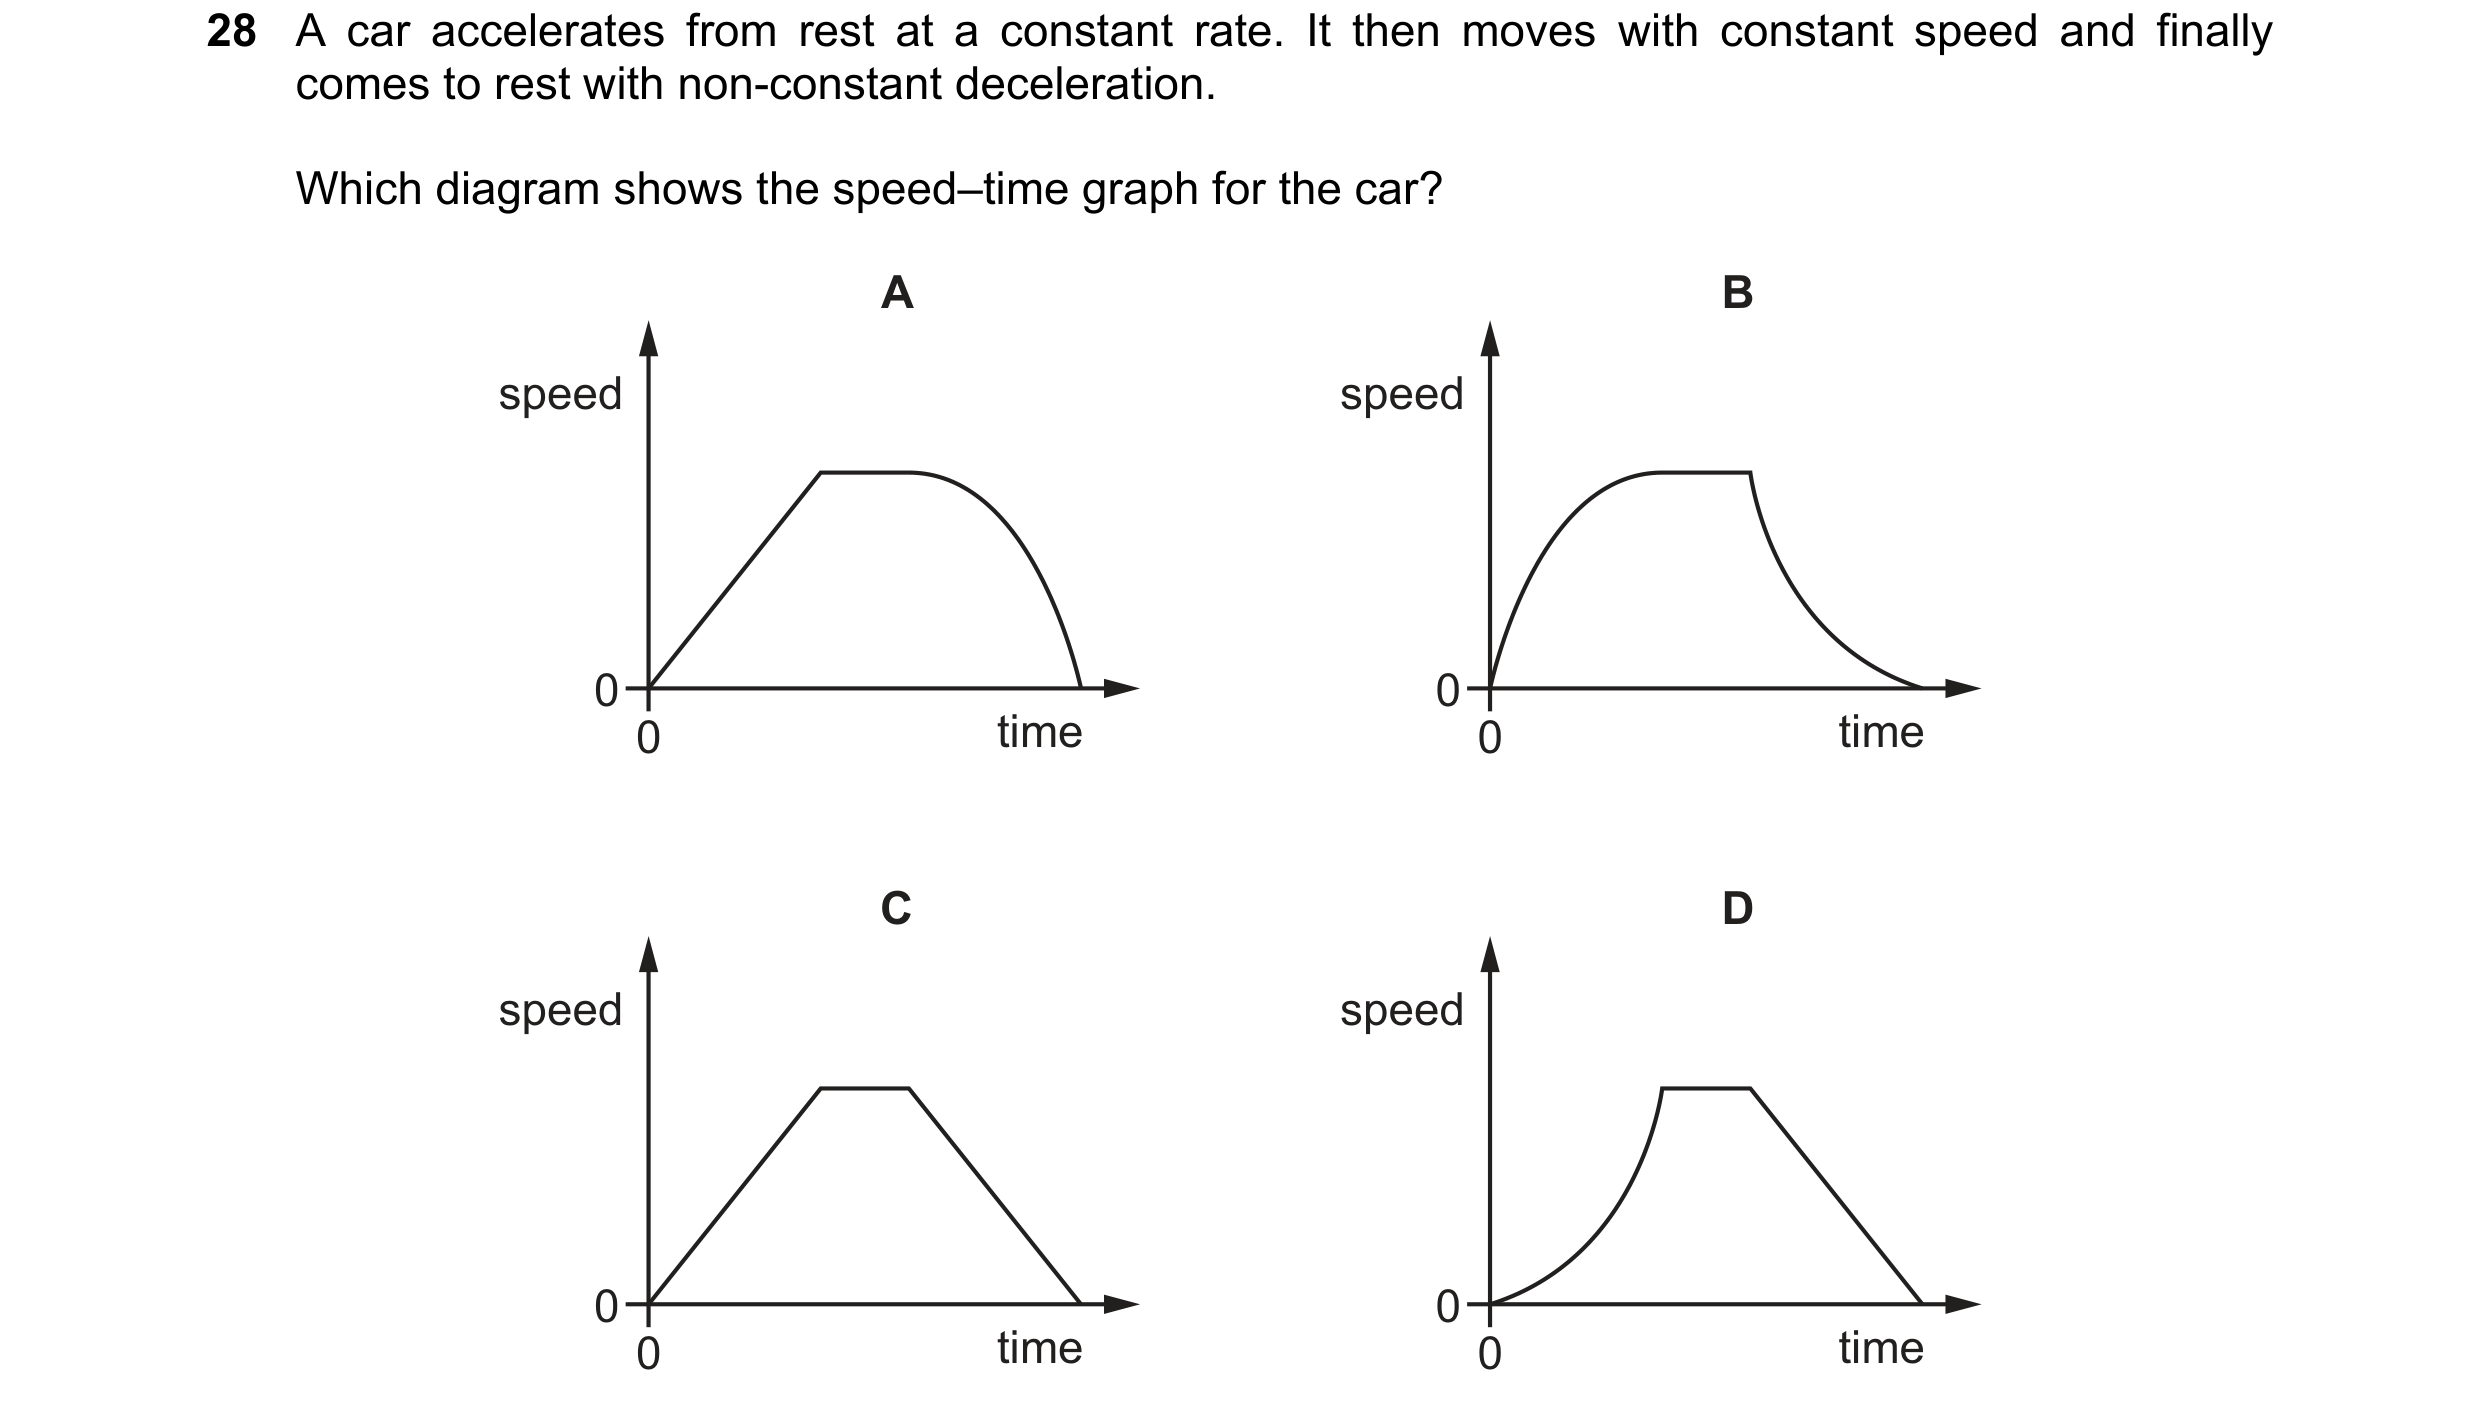
 14 / 21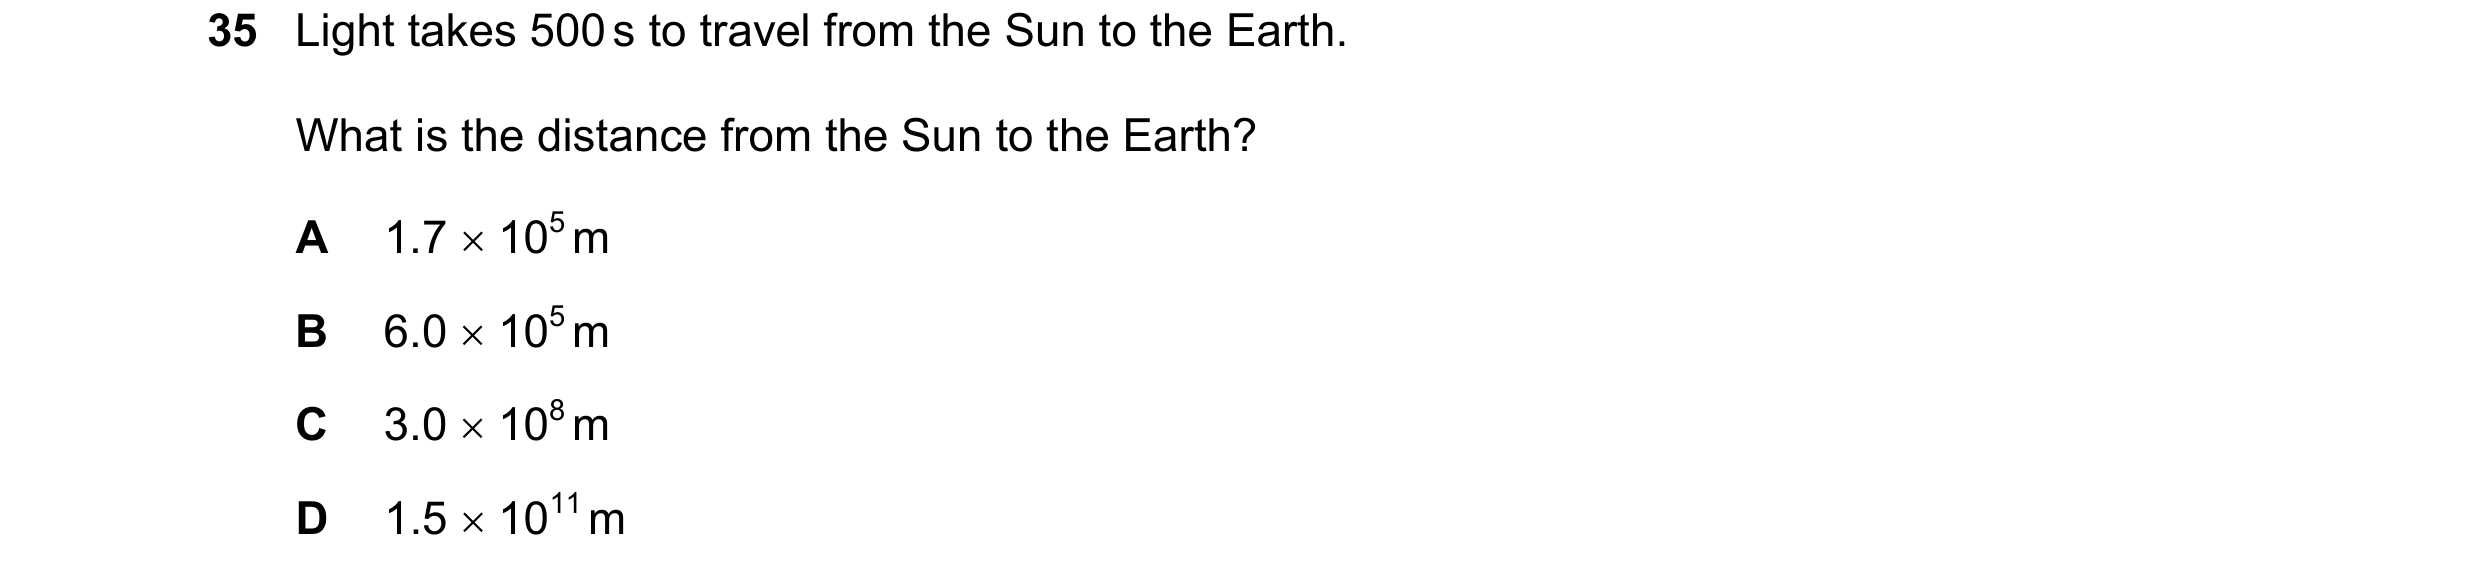
 15 / 21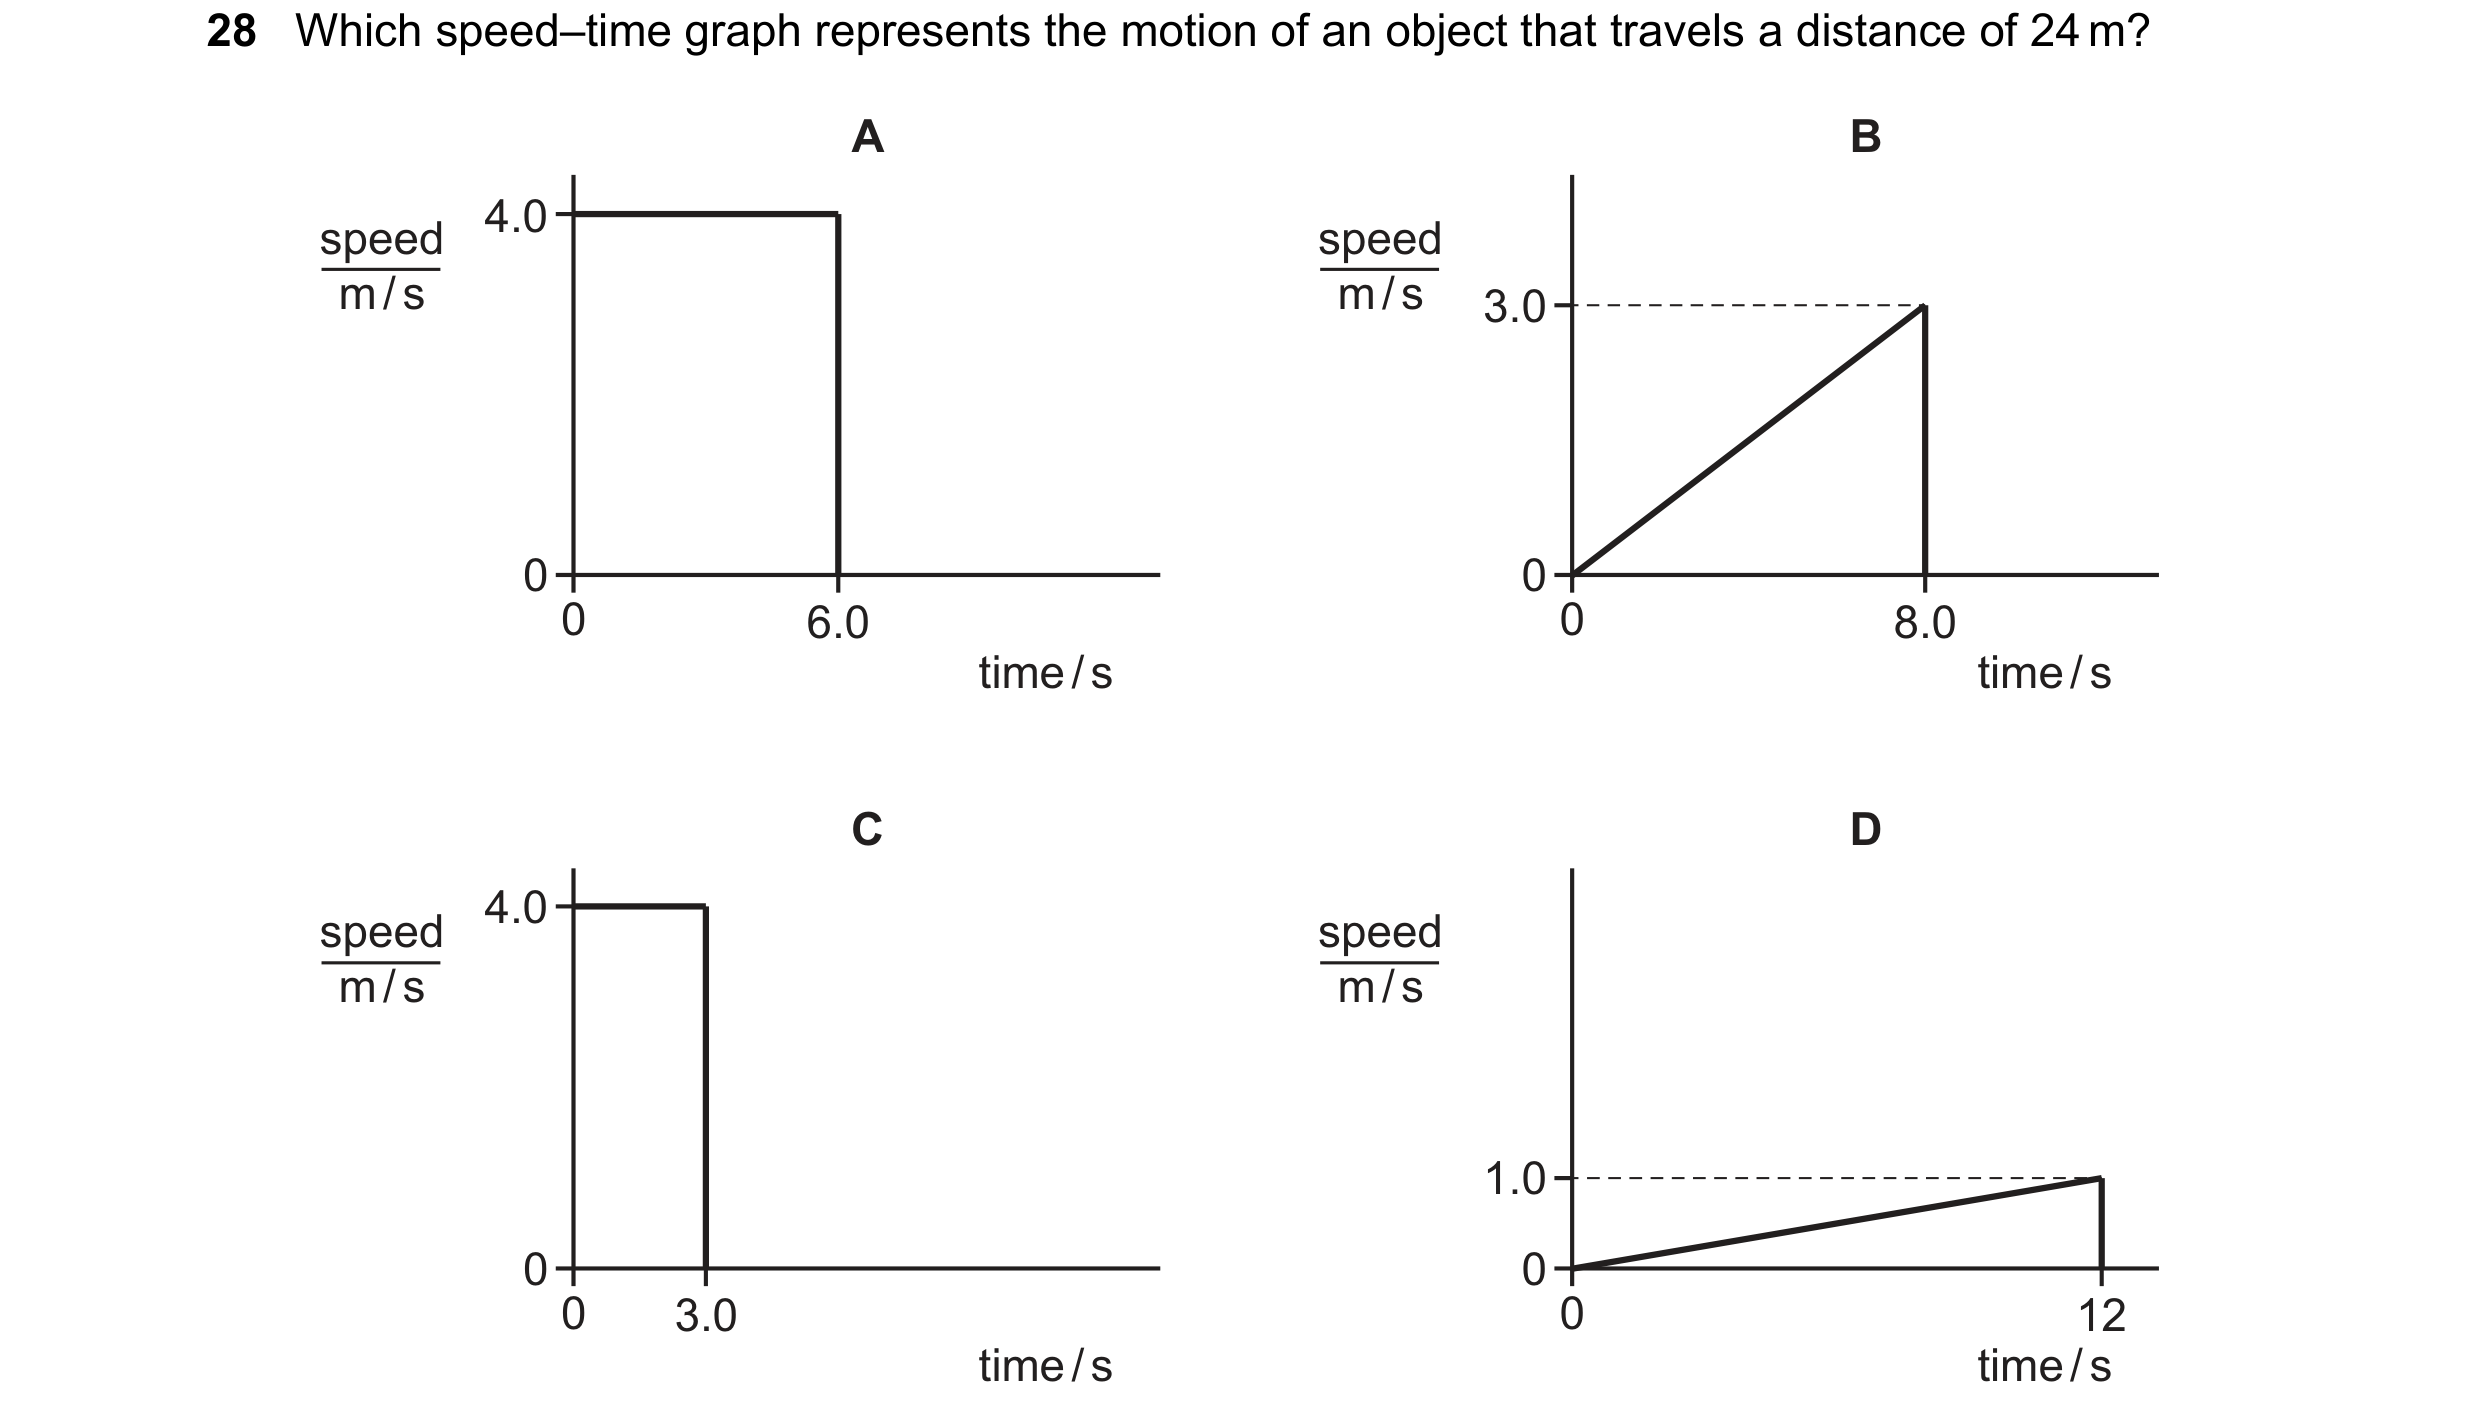
 16 / 21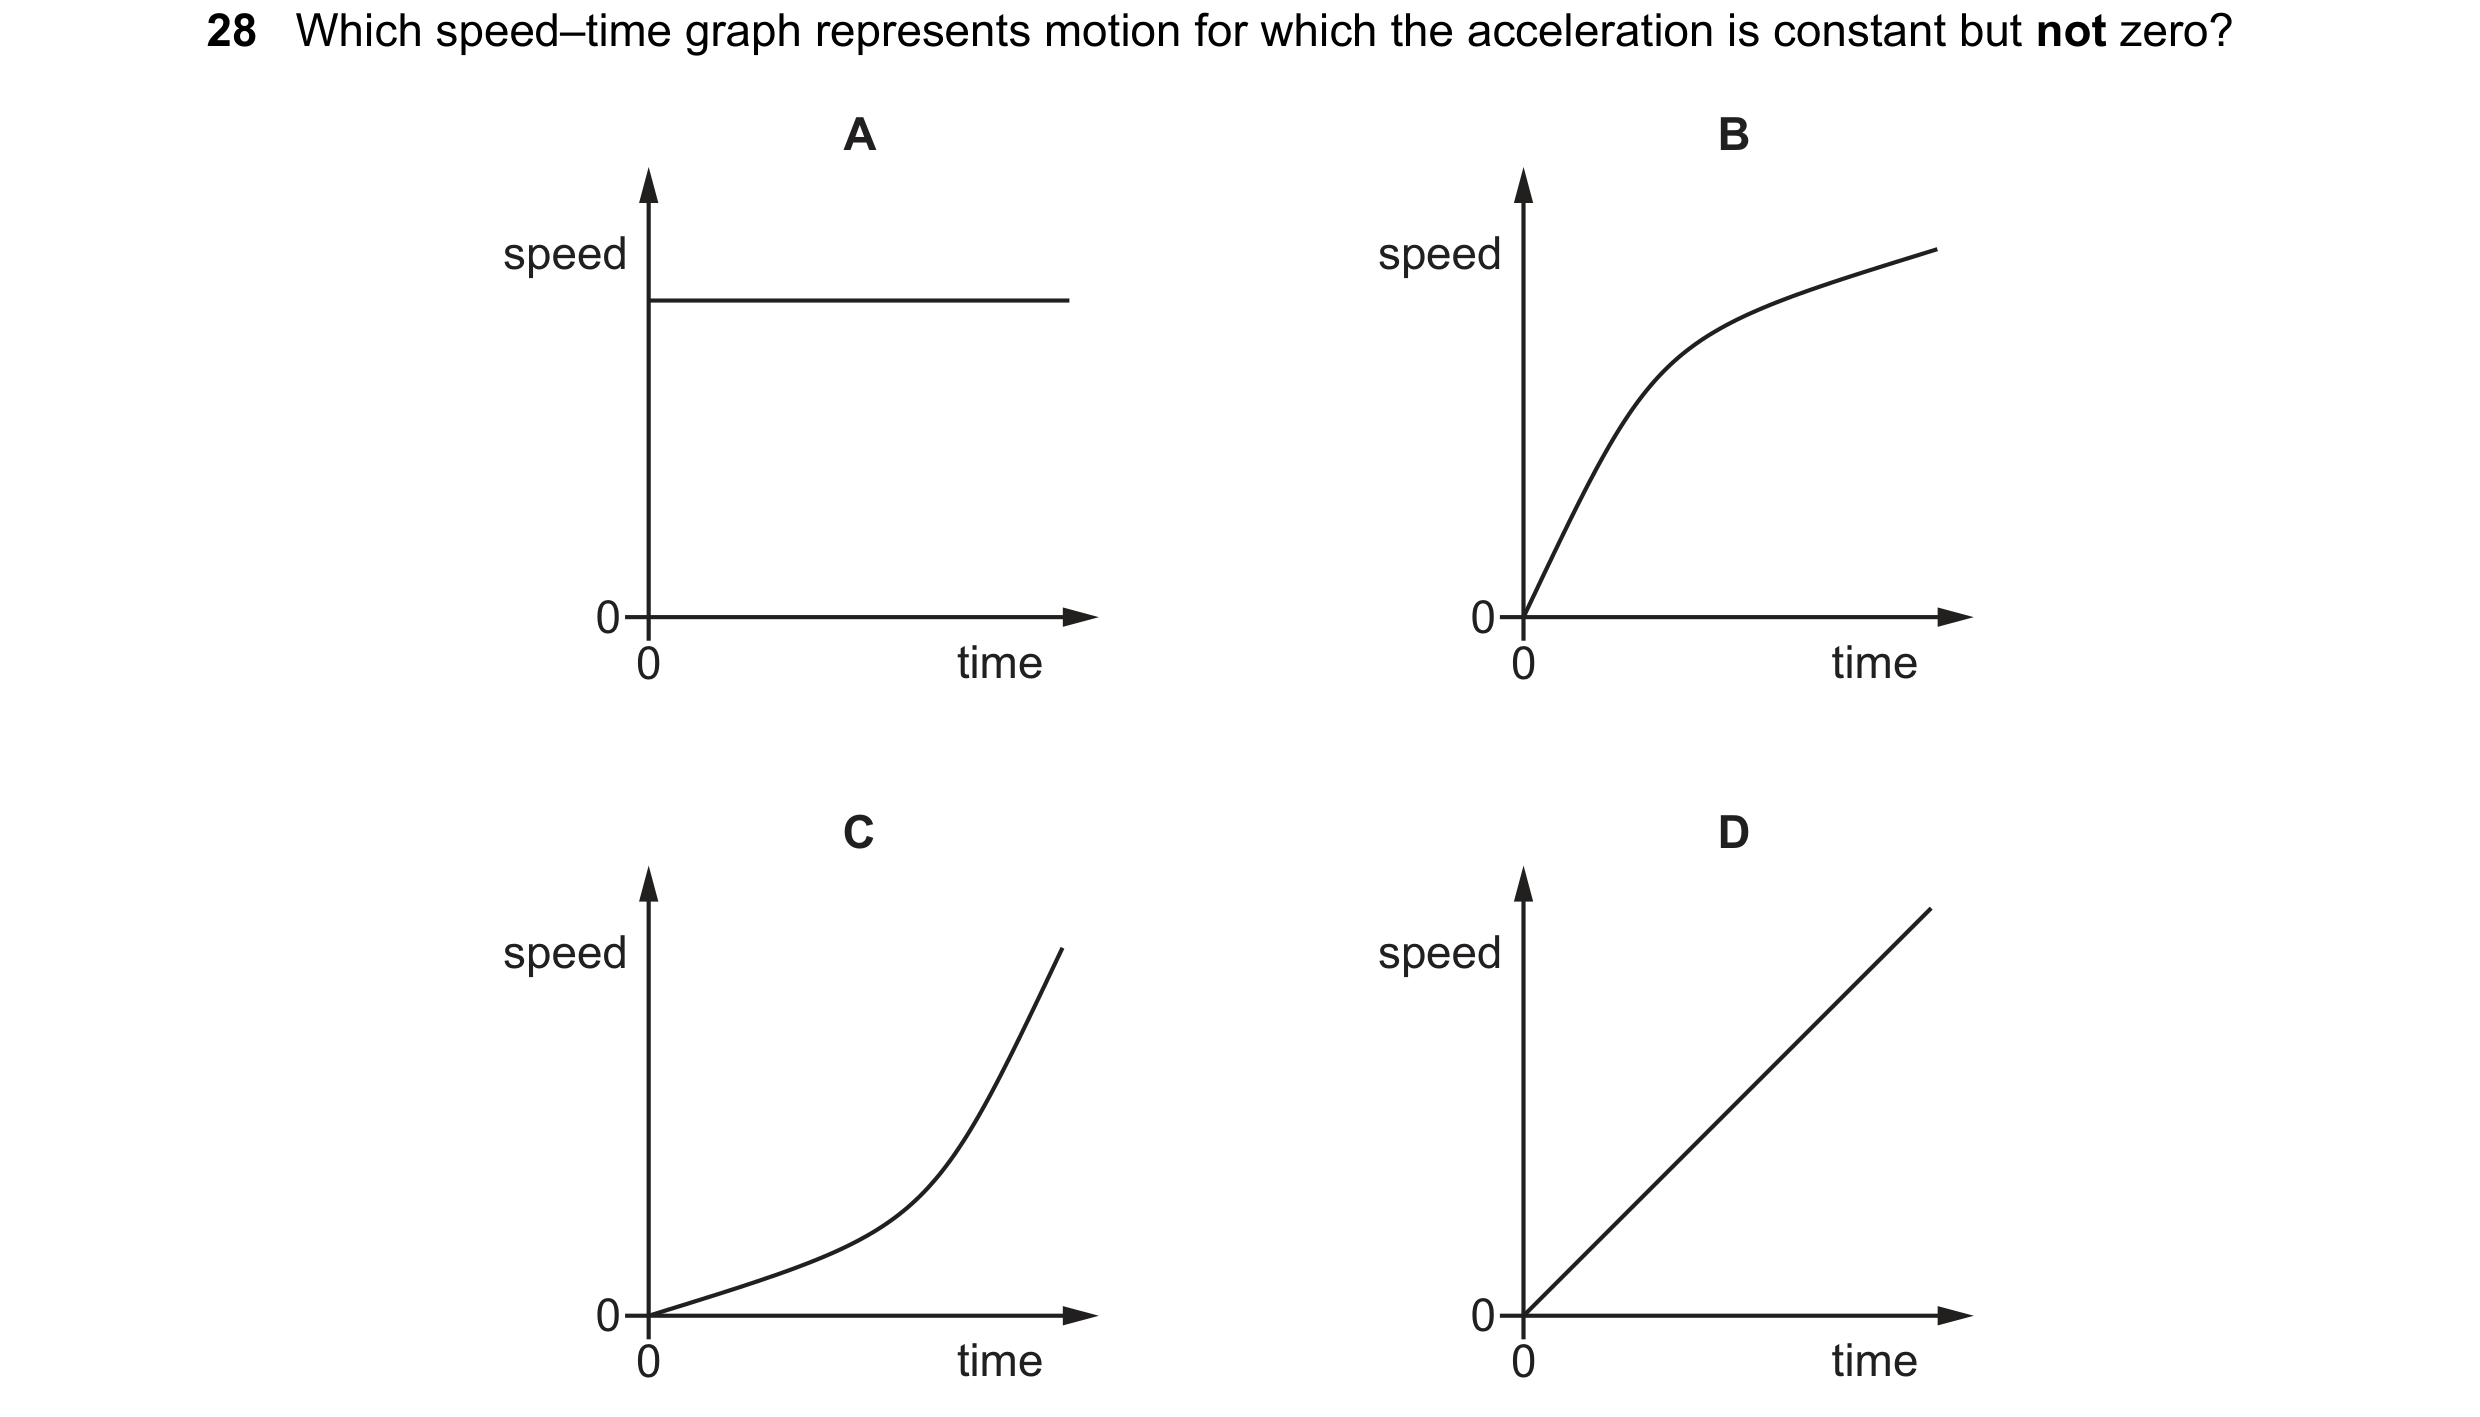

 17 / 21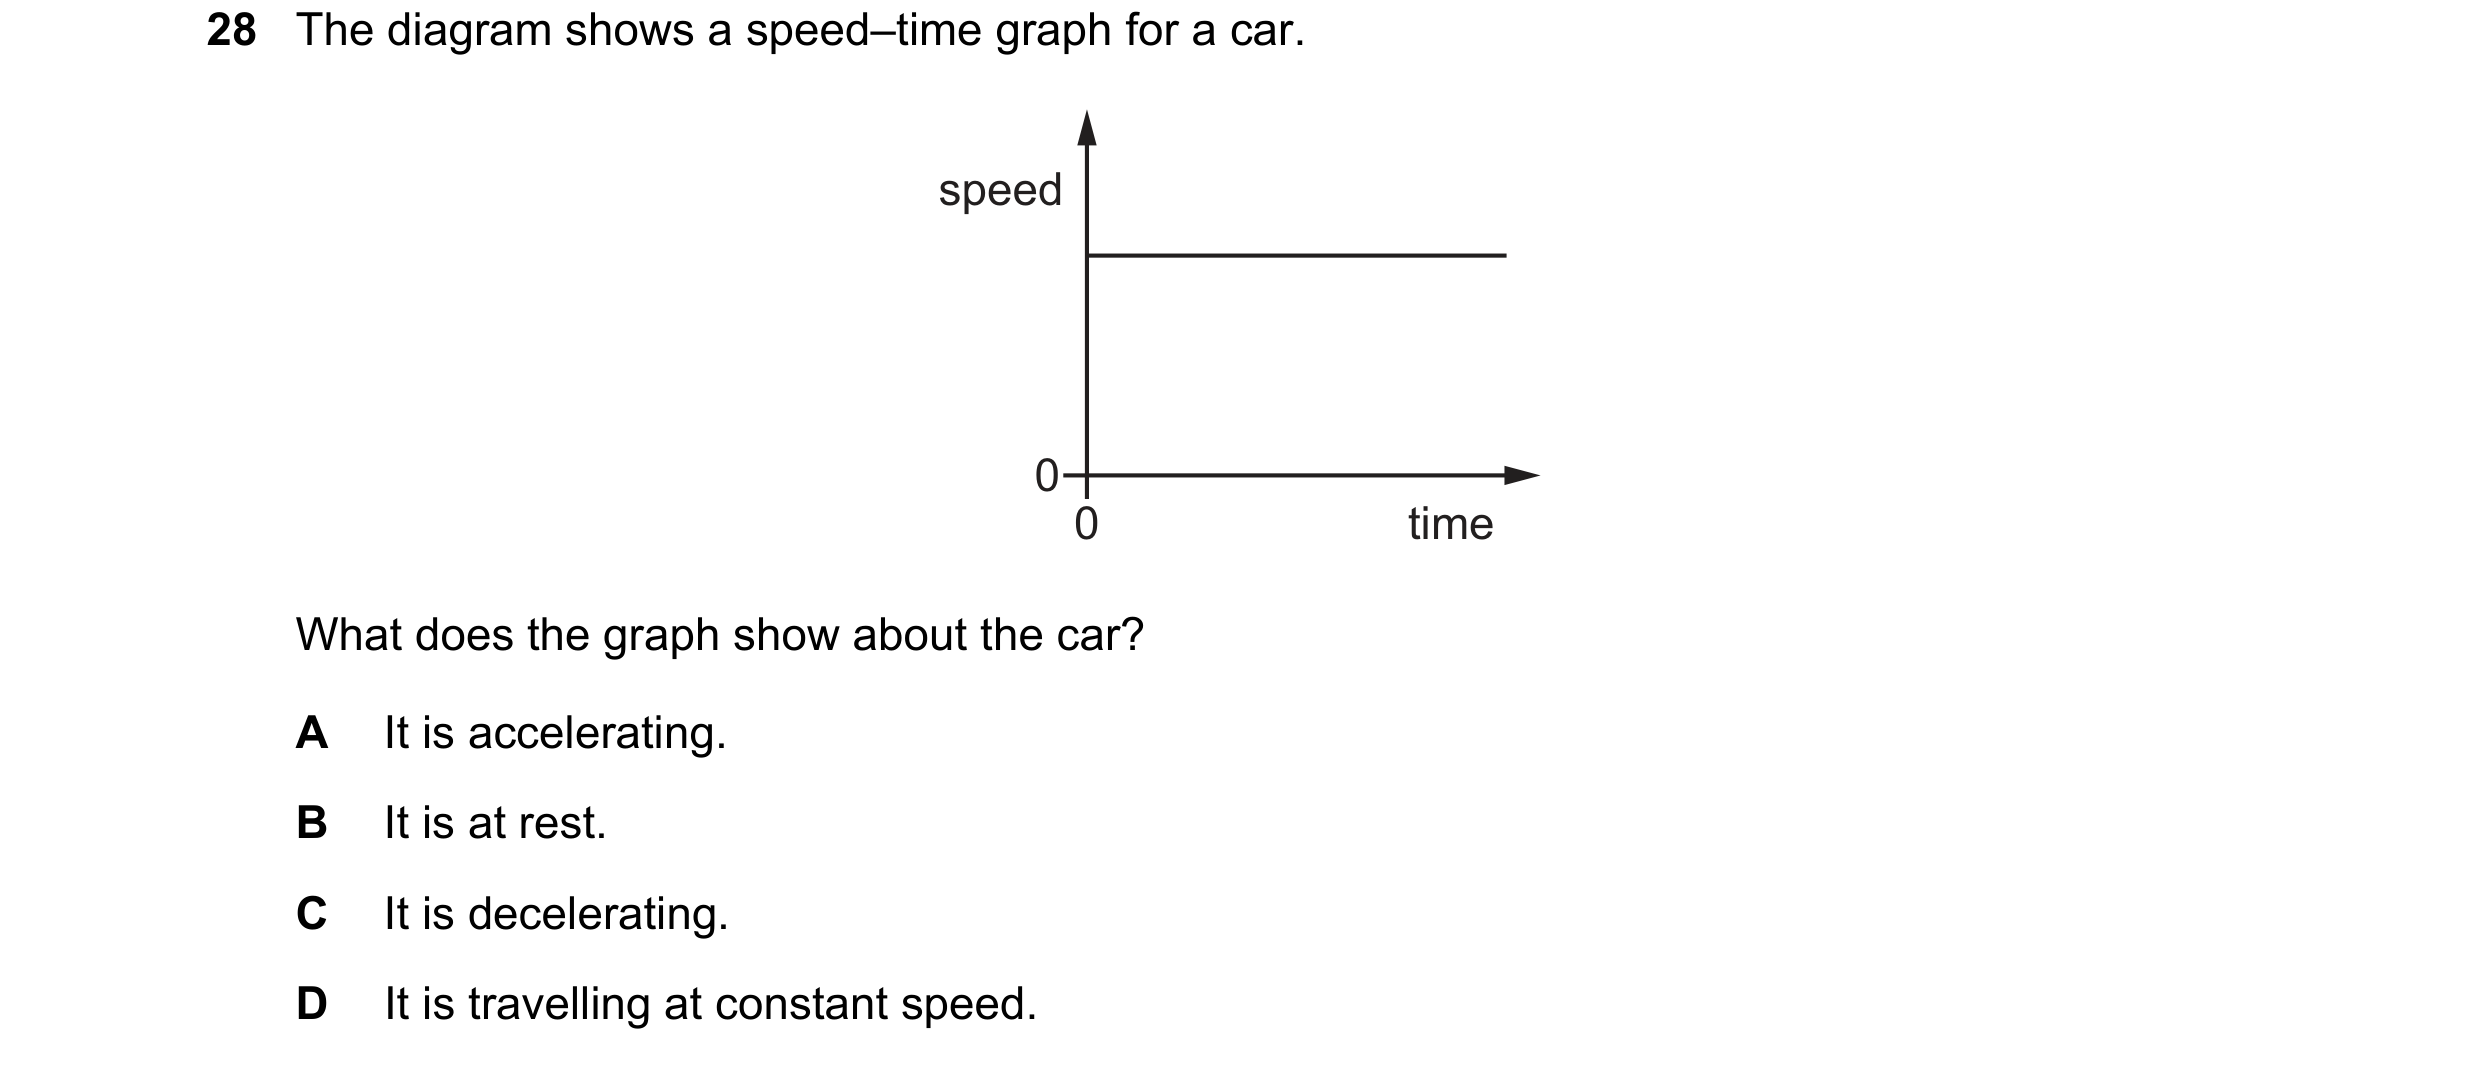
 18 / 21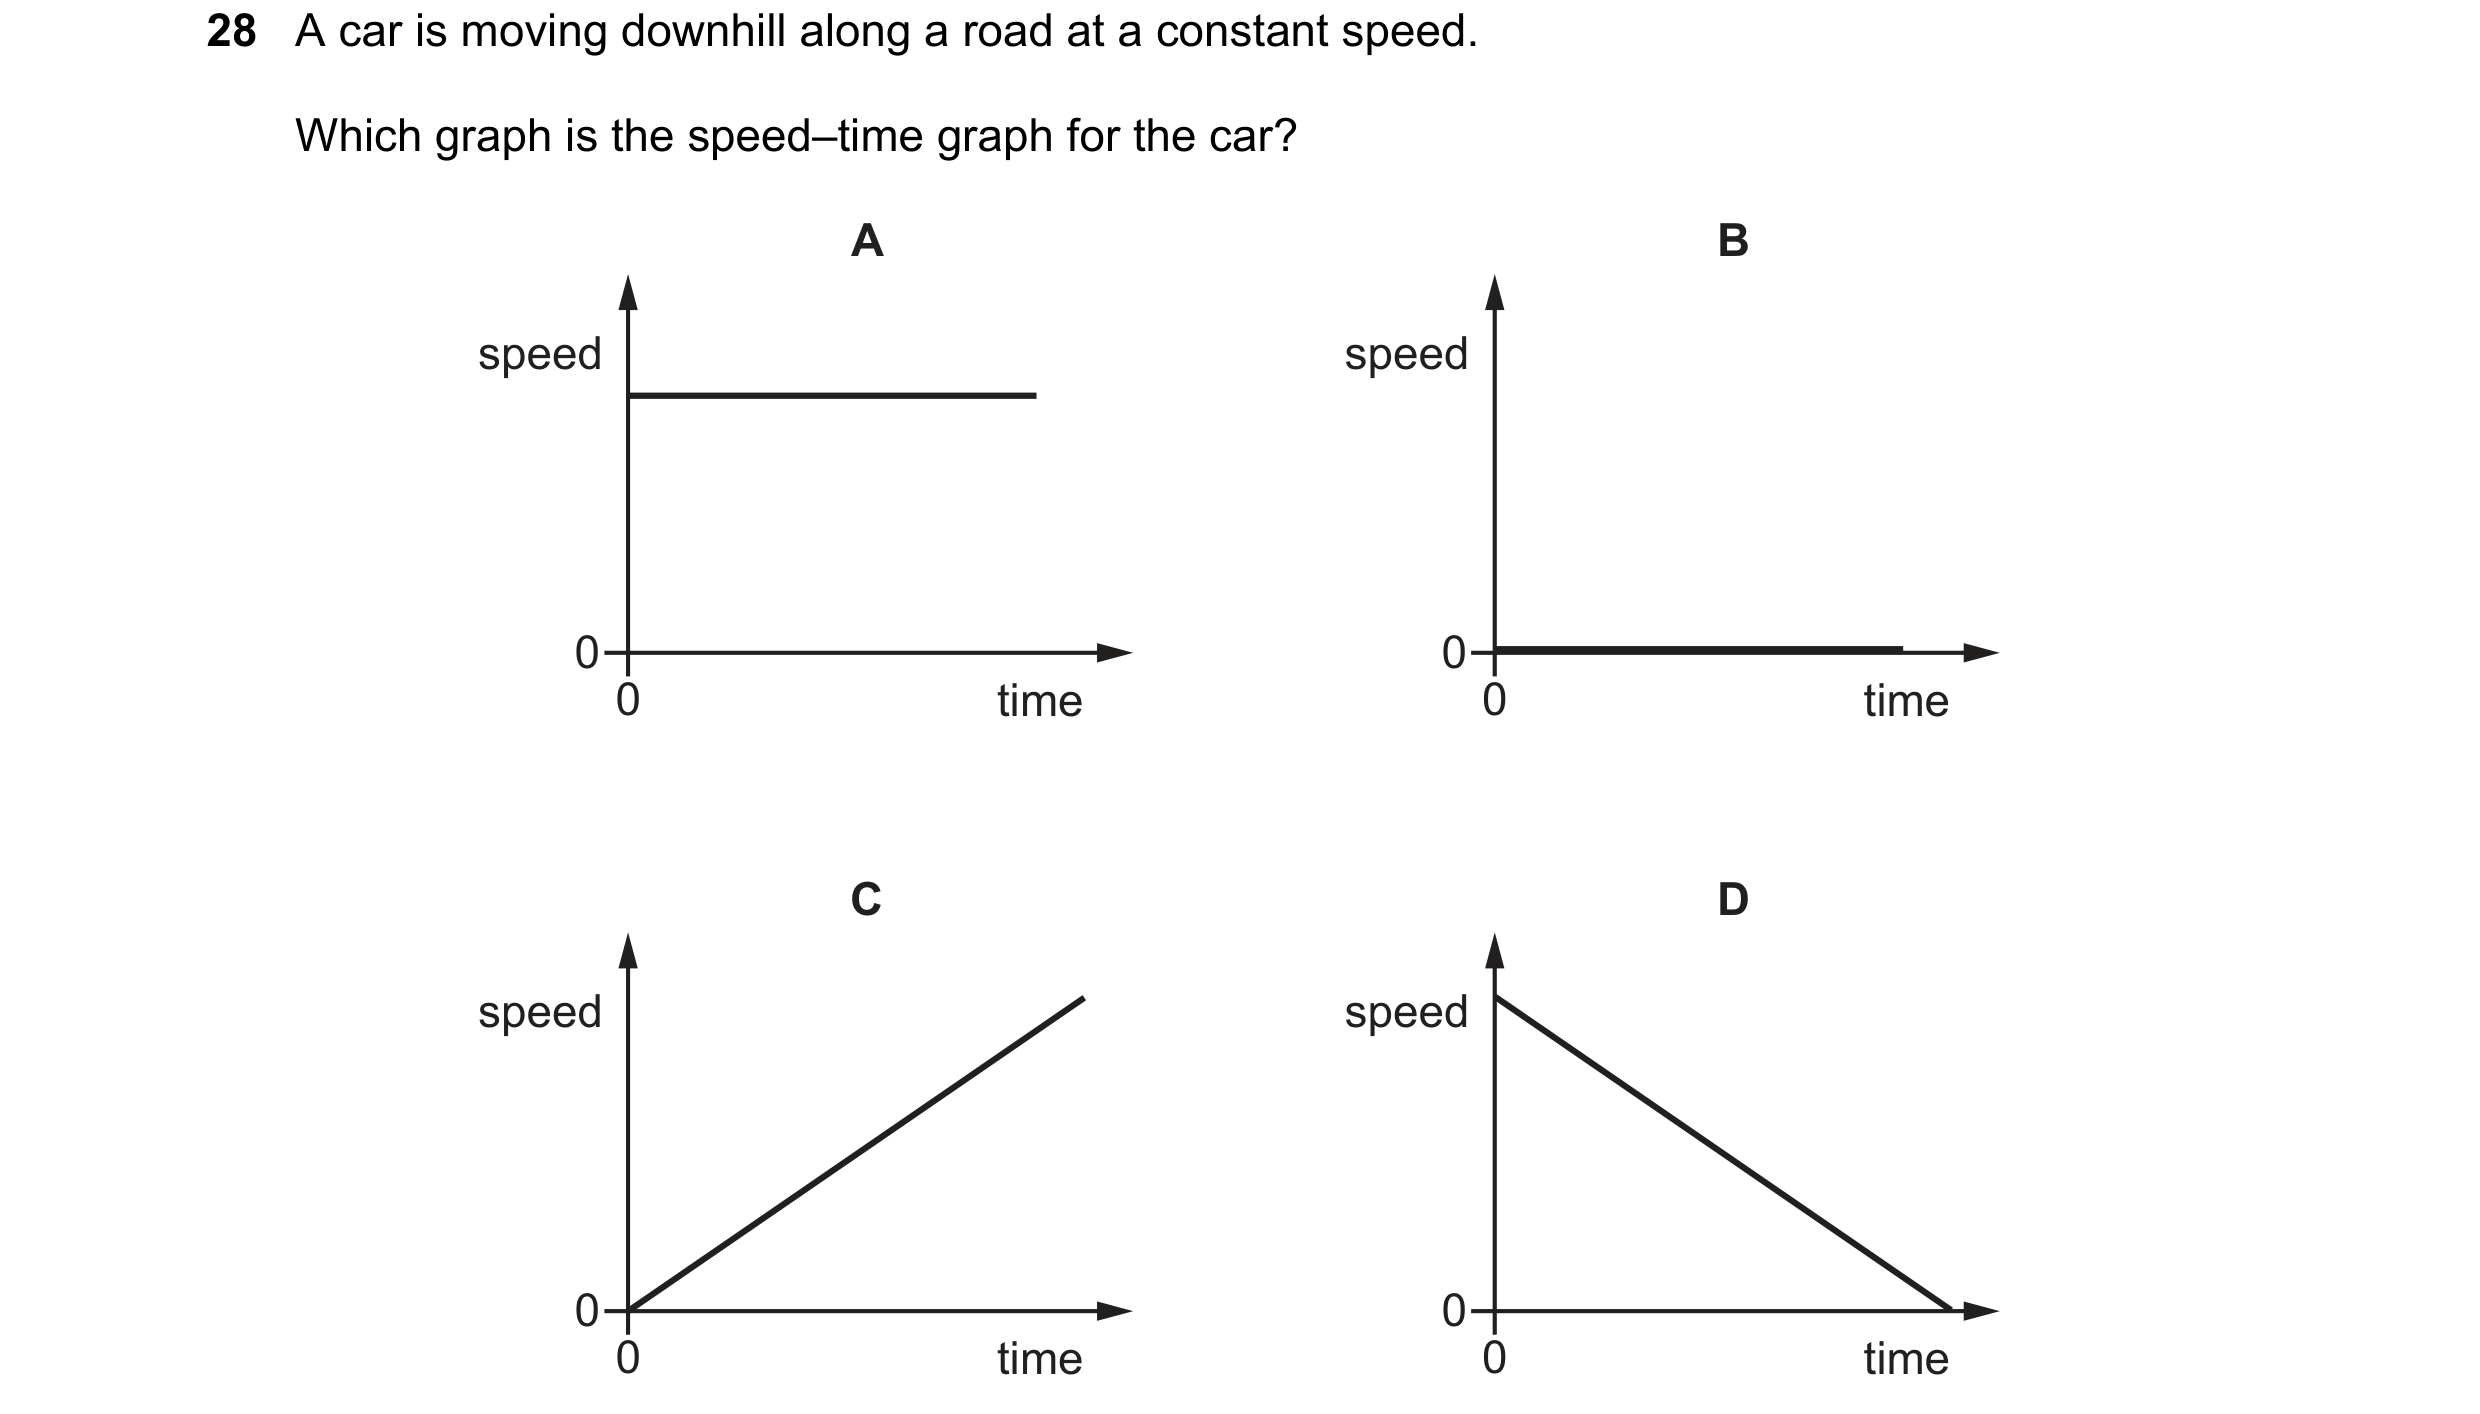
 19 / 21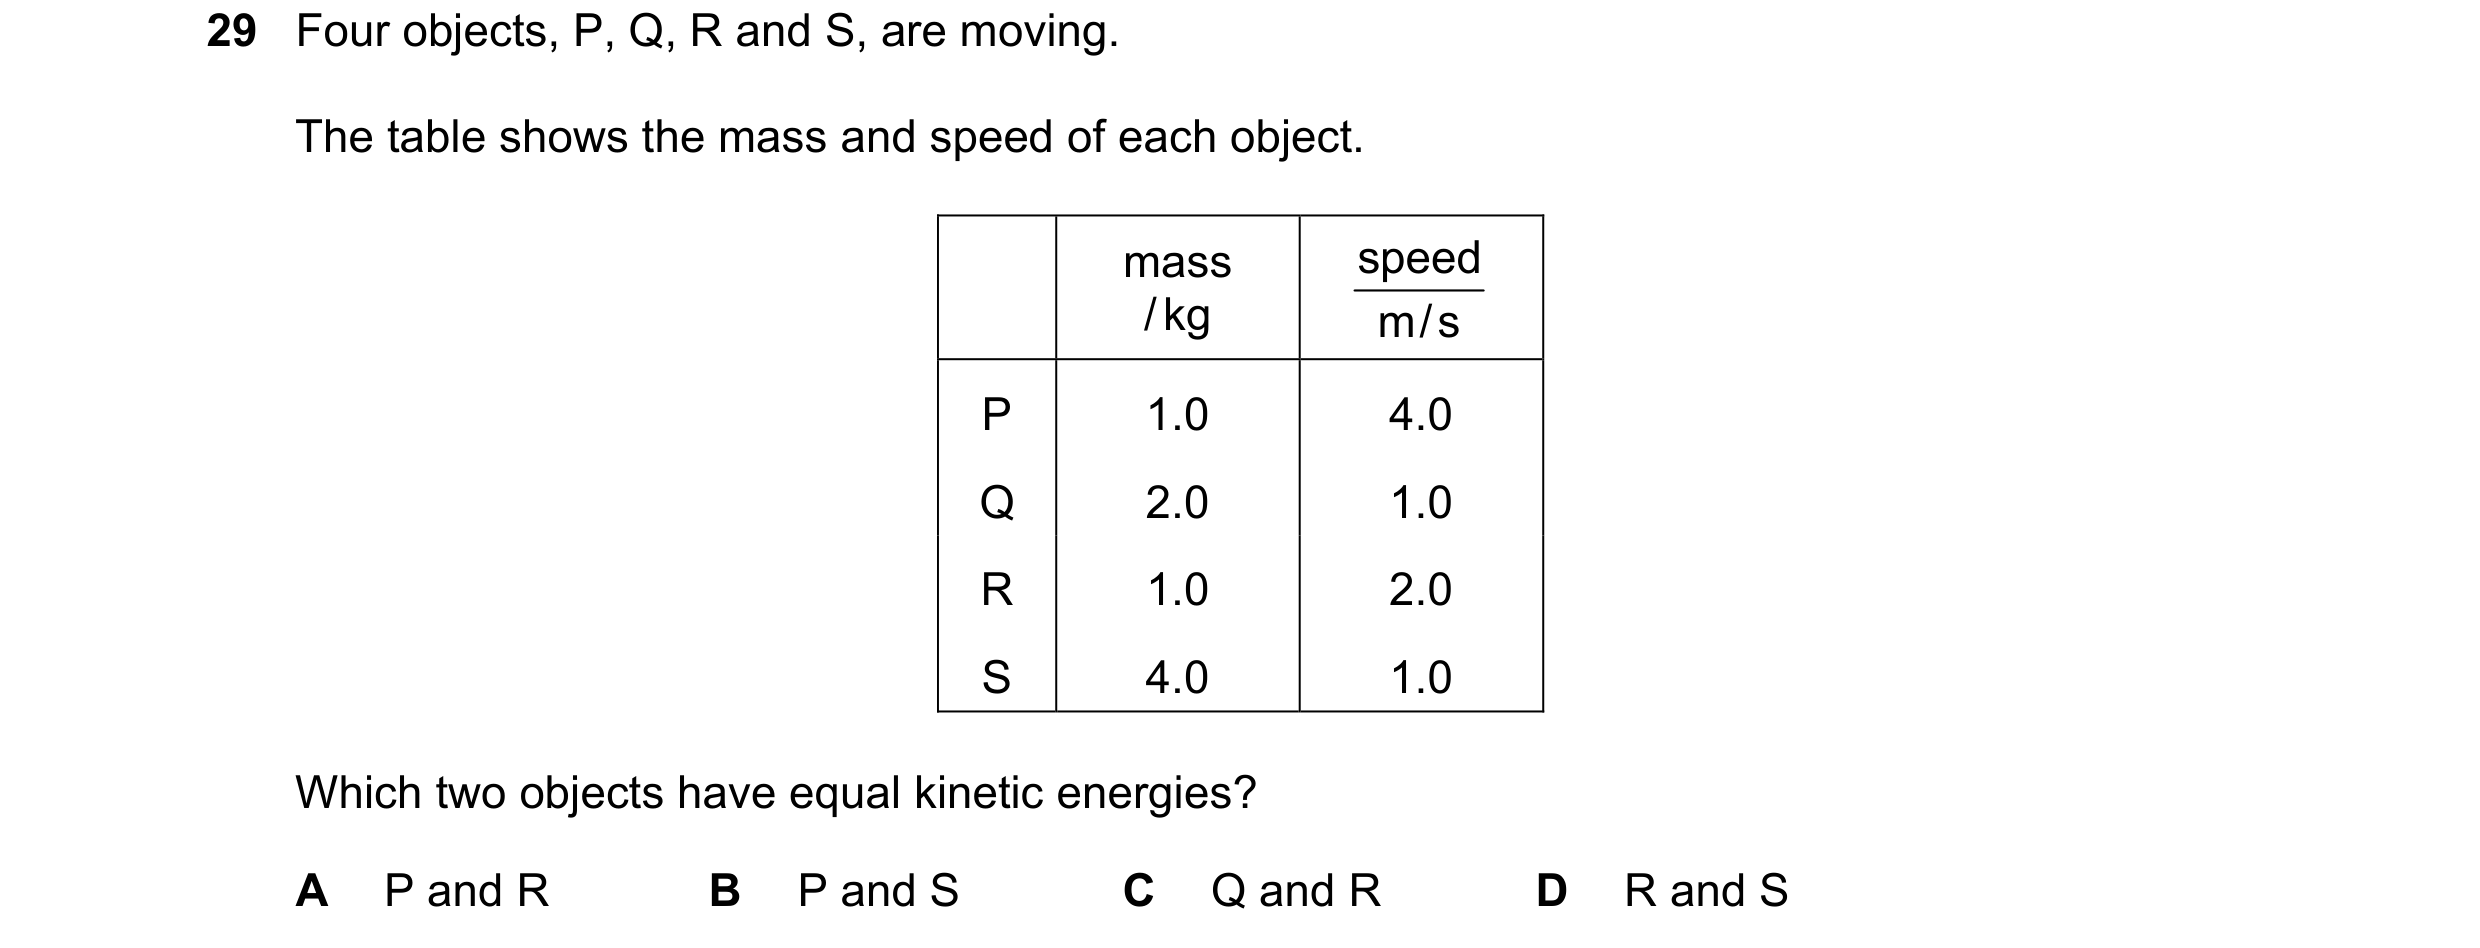

 20 / 21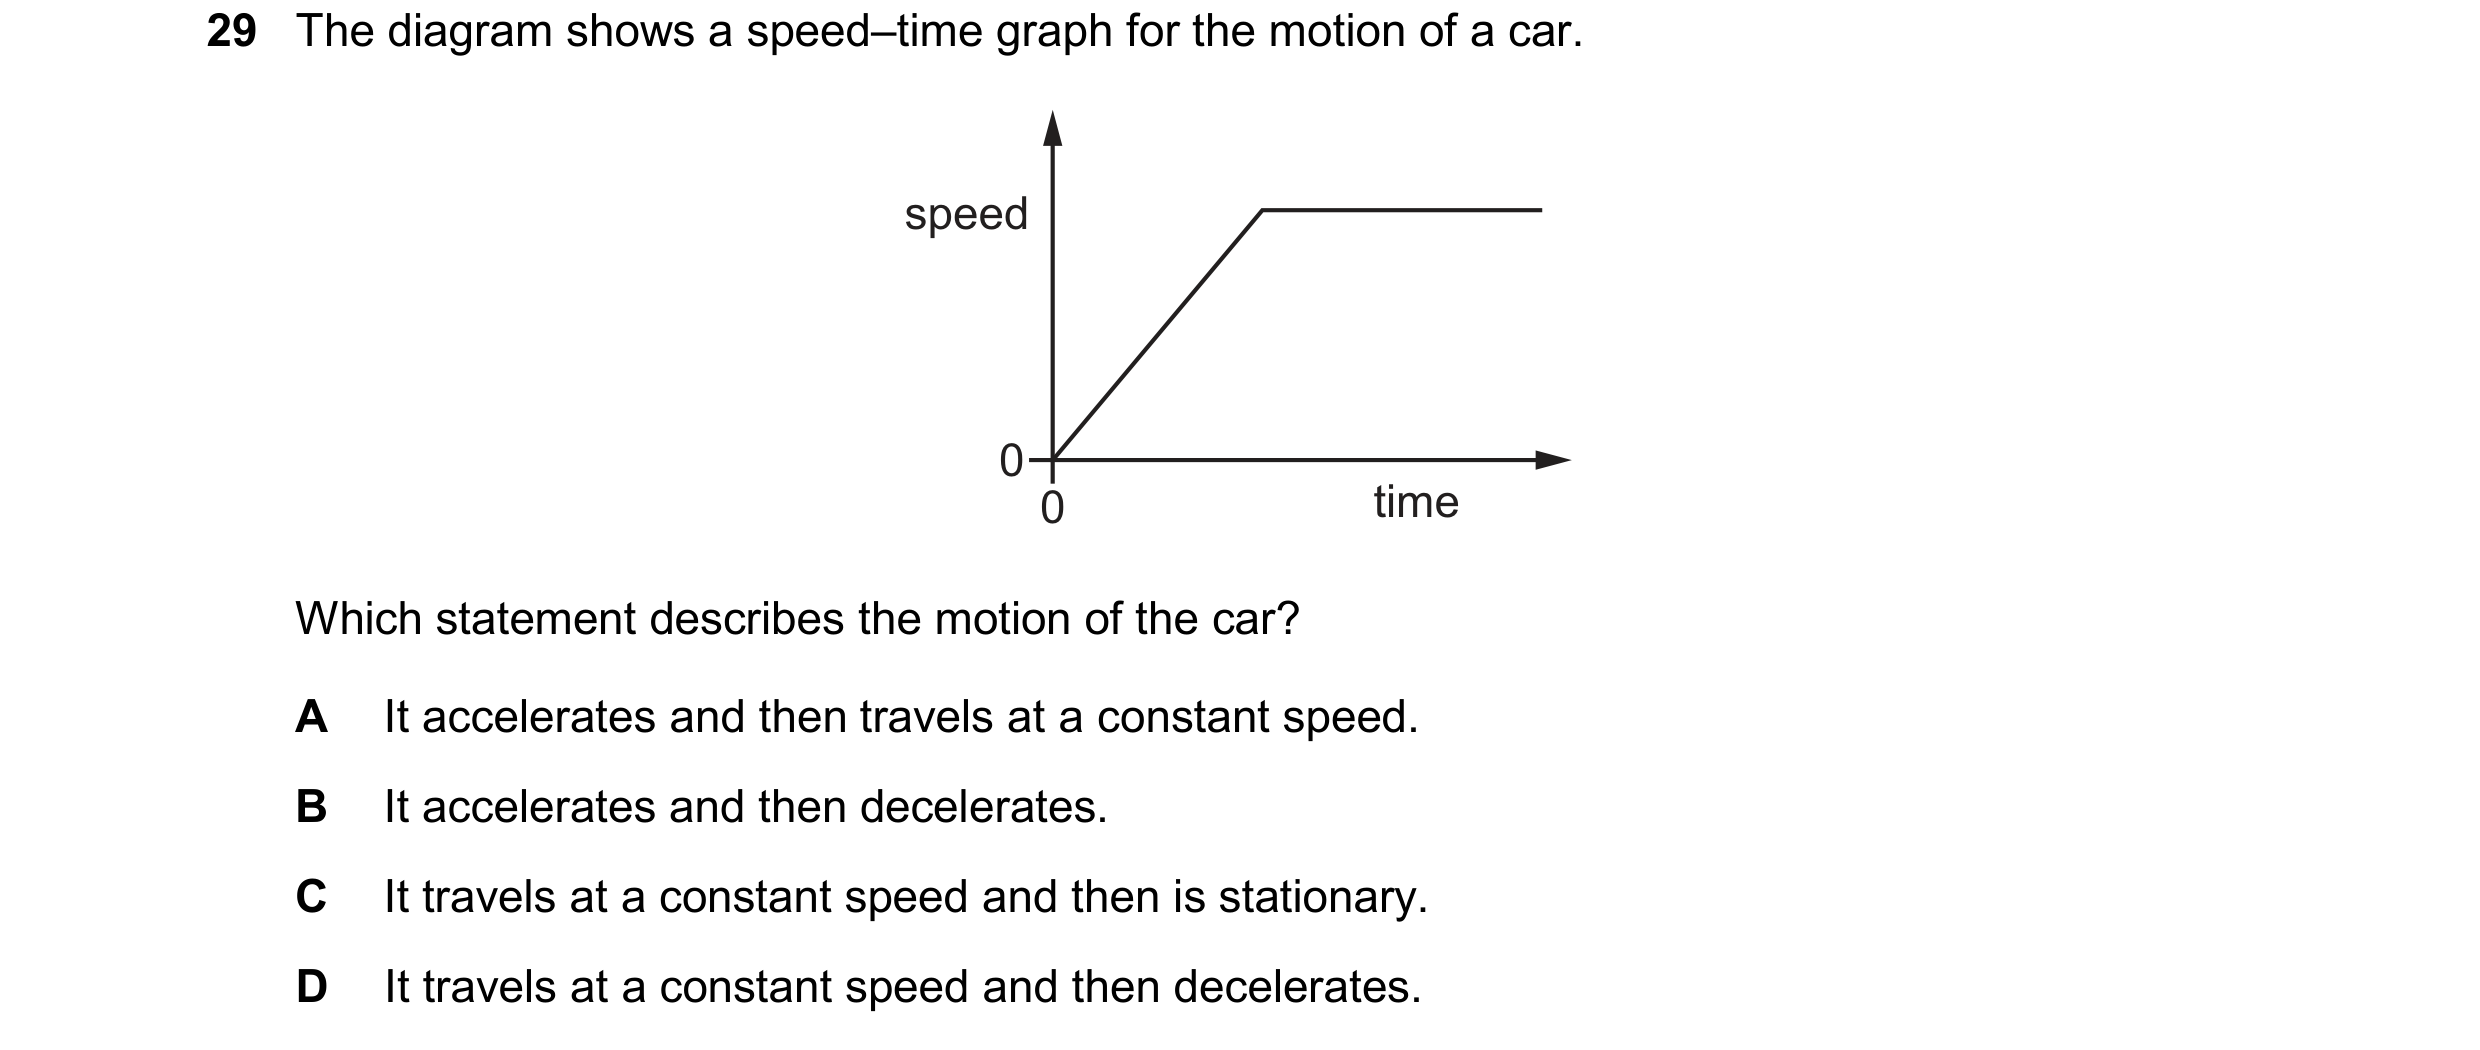

 21 / 21