Questions as text
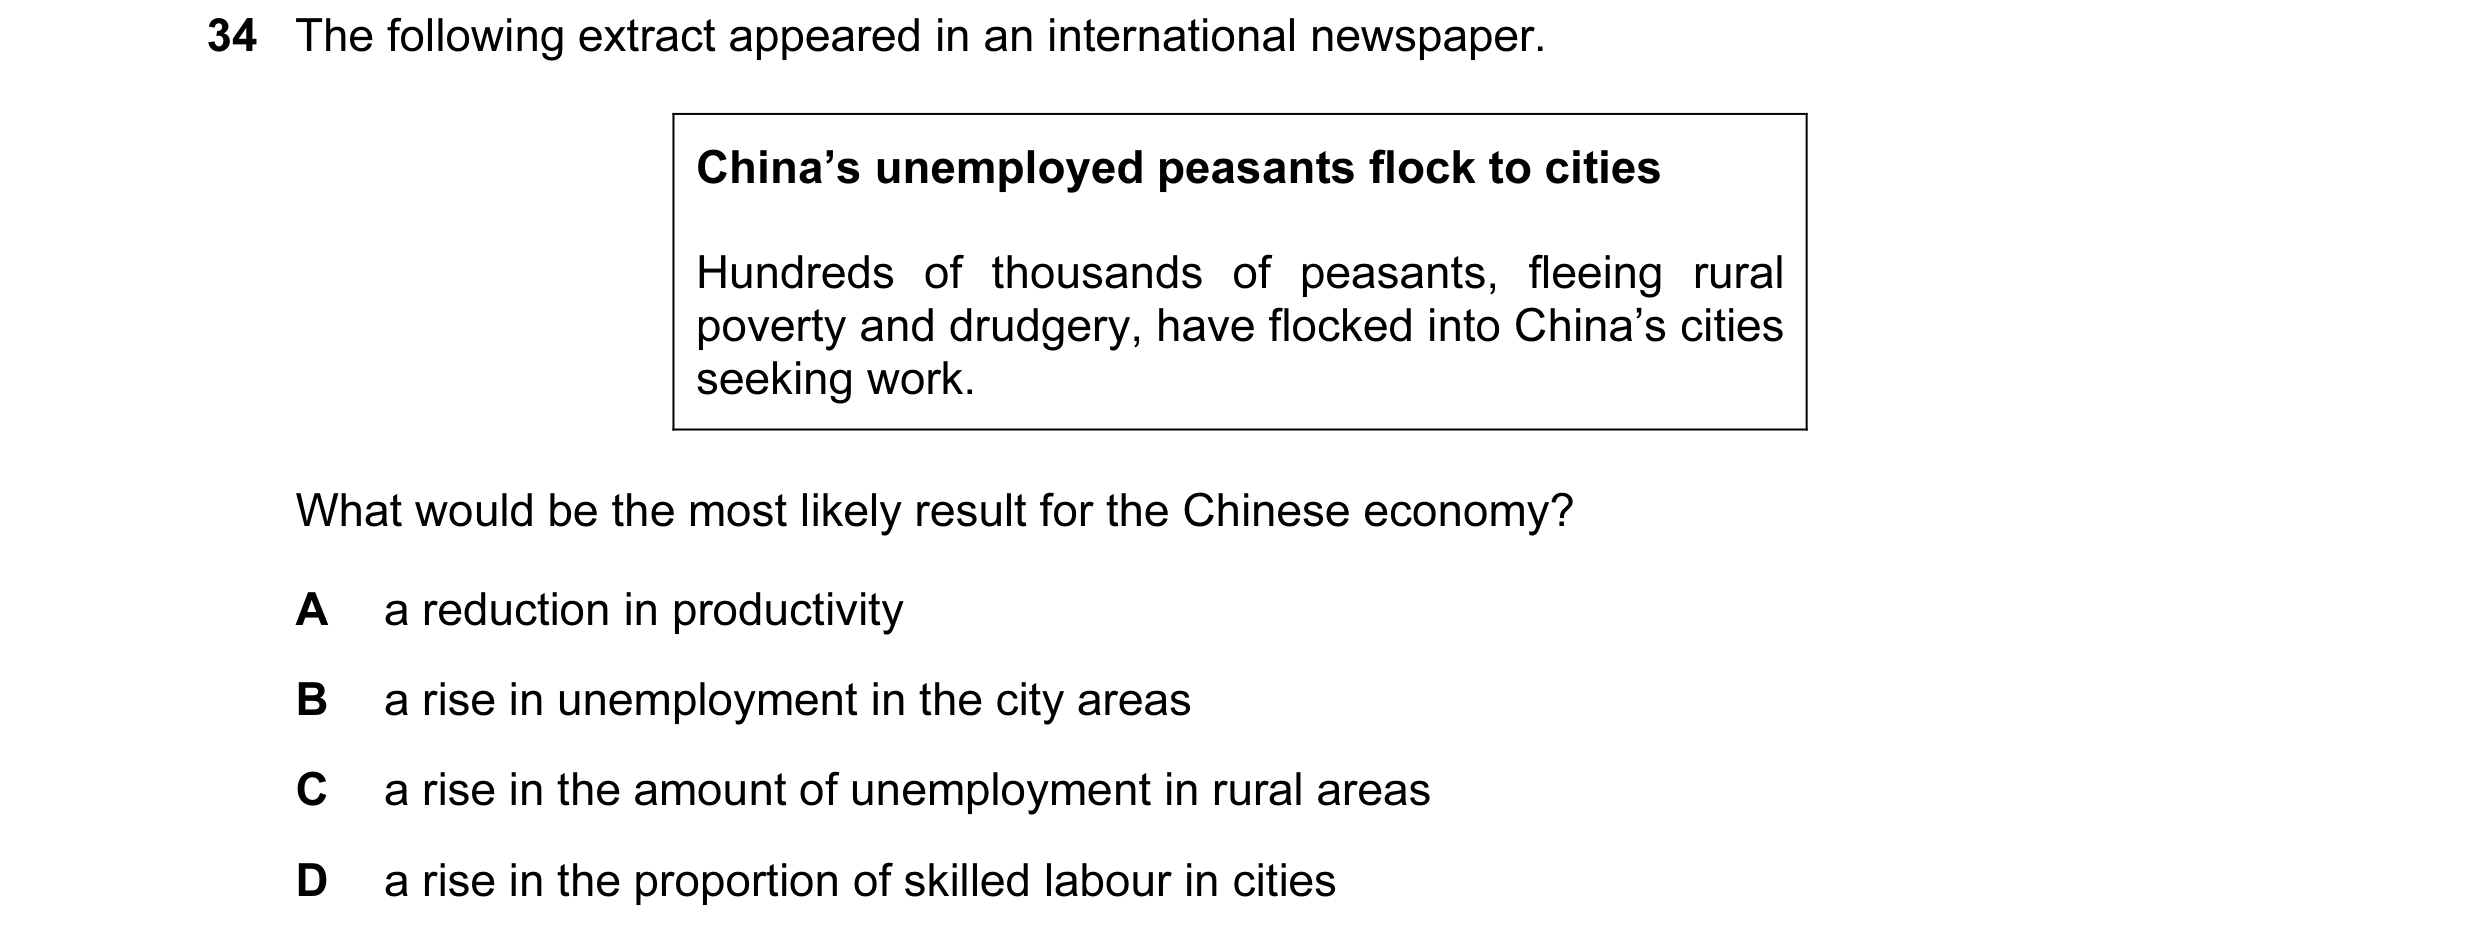
Q1 · The following extract appeared in an international newspaper 0455/11 Oct/Nov 2004
34 The following extract appeared in an international newspaper. China’s unemployed peasants flock to cities Hundreds of thousands of peasants, fleeing rural poverty and drudgery, have flocked into China’s cities seeking work. What would be the most likely result for the Chinese economy? A a reduction in productivity B a rise in unemployment in the city areas C a rise in the amount of unemployment in rural areas D a rise in the proportion of skilled labour in cities
1 marks
Answer: B
This question in 0455/11 Oct/Nov 2004
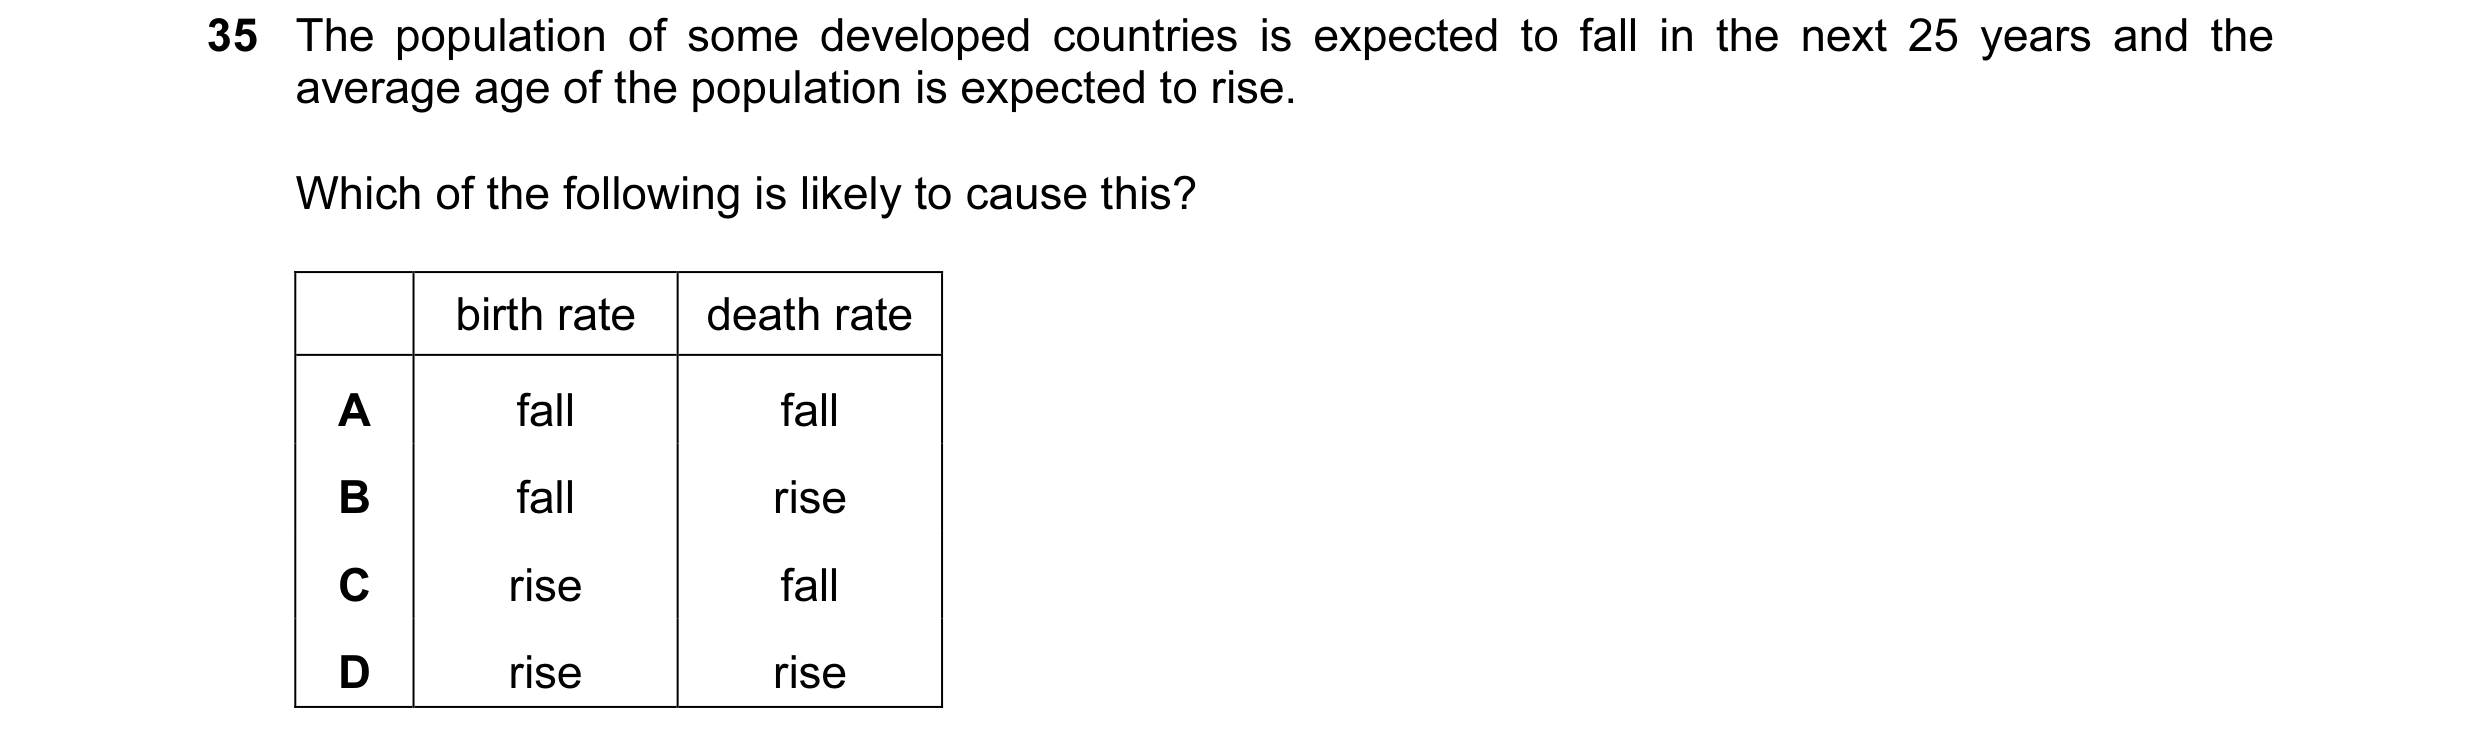
Q2 · The population of some developed countries is expected to fall in the next 25 years and… 0455/11 Oct/Nov 2004
35 The population of some developed countries is expected to fall in the next 25 years and the average age of the population is expected to rise. Which of the following is likely to cause this? birth rate death rate A fall fall B fall rise C rise fall D rise rise
1 marks
Answer: A
This question in 0455/11 Oct/Nov 2004
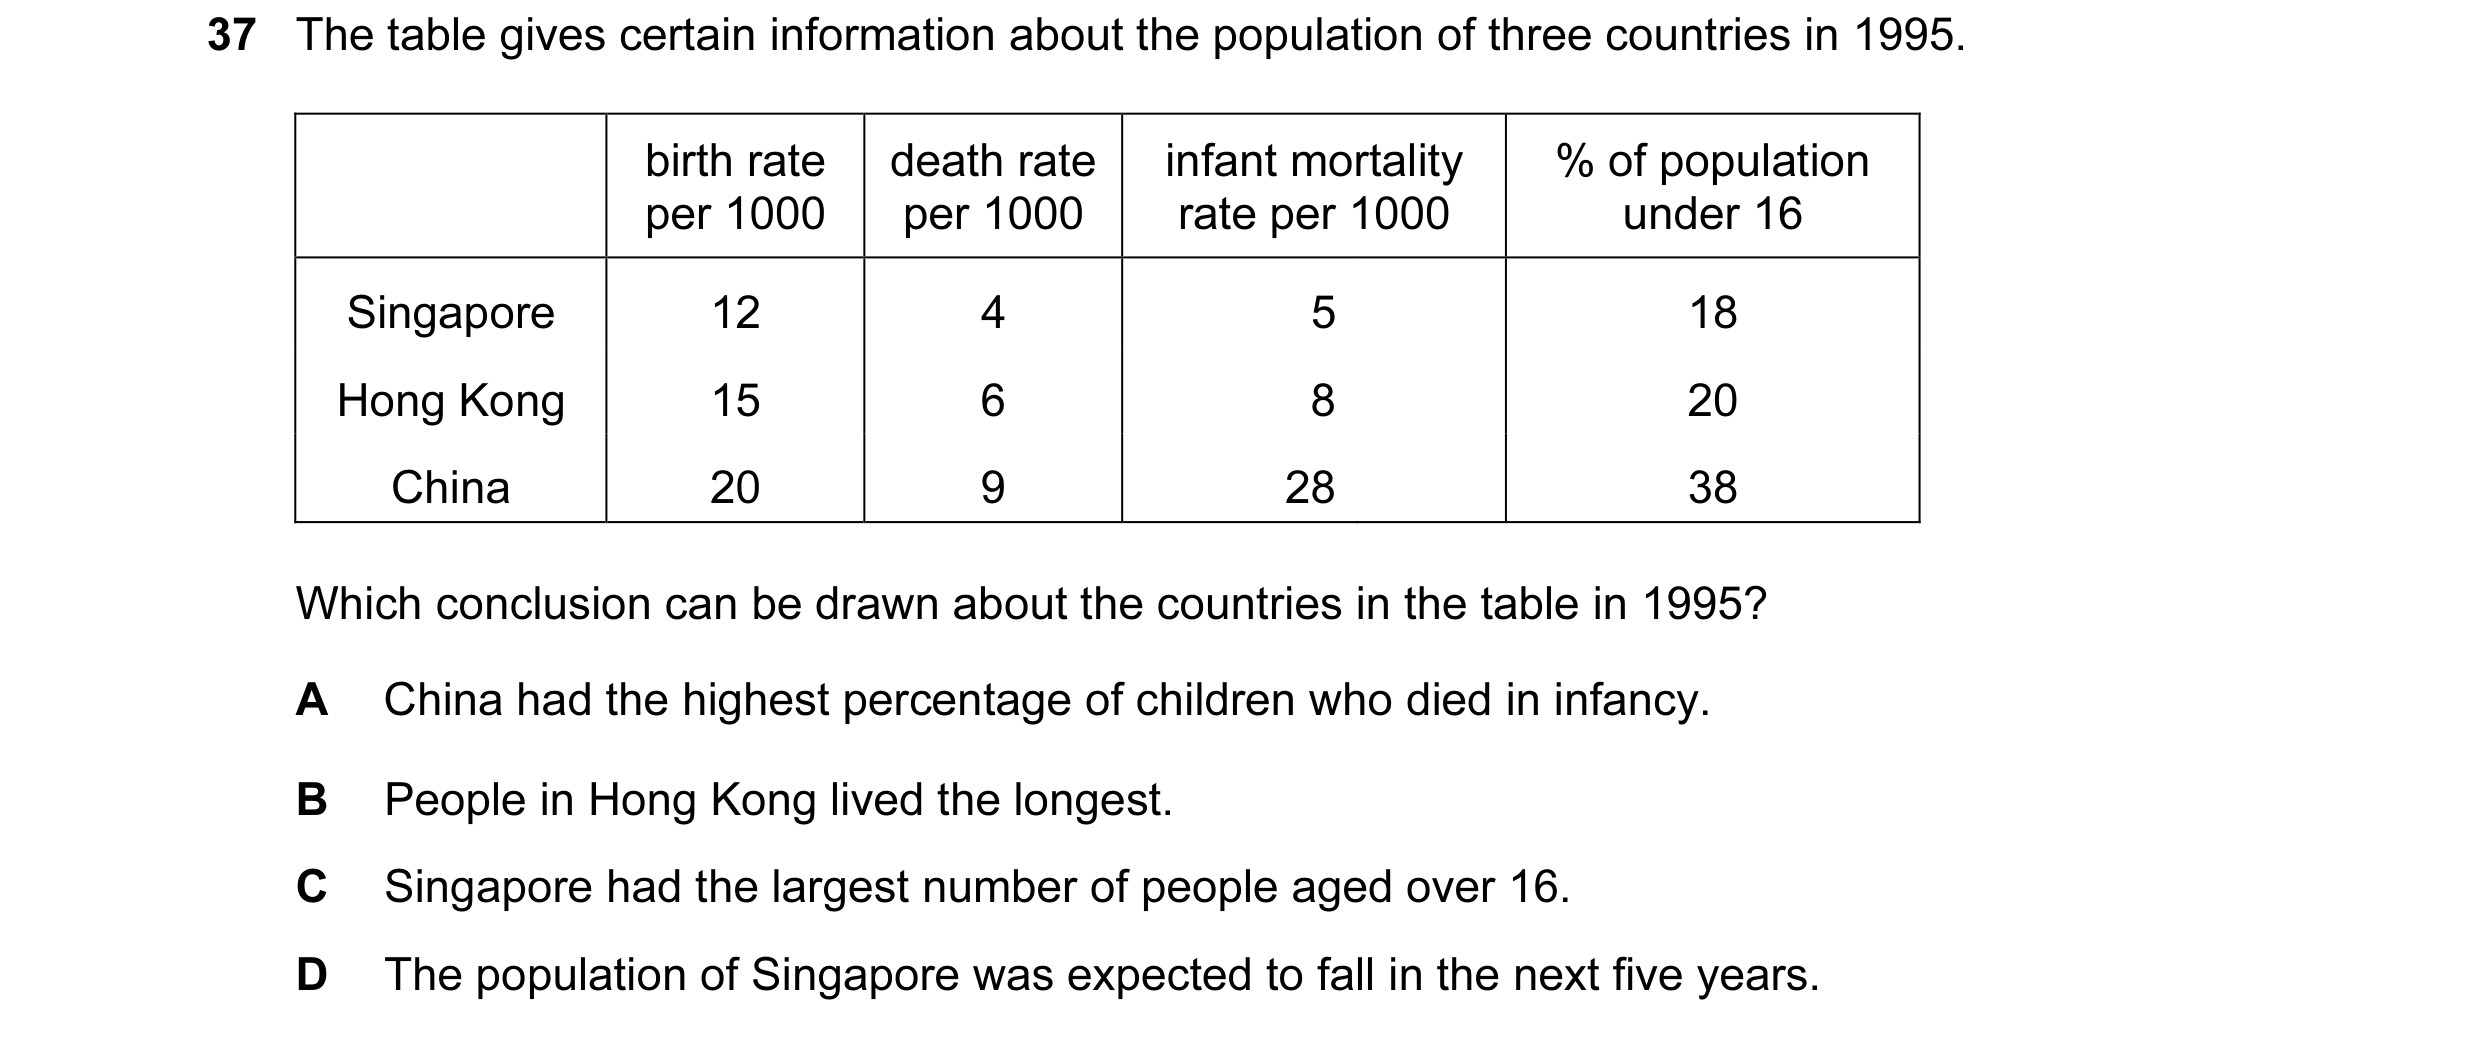
Q3 · The table gives certain information about the population of three countries in 1995 0455/11 Oct/Nov 2004
37 The table gives certain information about the population of three countries in 1995. birth rate death rate infant mortality % of population per 1000 per 1000 rate per 1000 under 16 Singapore 12 4 5 18 Hong Kong 15 6 8 20 China 20 9 28 38 Which conclusion can be drawn about the countries in the table in 1995? A China had the highest percentage of children who died in infancy. B People in Hong Kong lived the longest. C Singapore had the largest number of people aged over 16. D The population of Singapore was expected to fall in the next five years.
1 marks
Answer: A
This question in 0455/11 Oct/Nov 2004
Q4 · What is the most likely cause of population migration to cities in developing countries? 0455/11 May/June 2006
33 What is the most likely cause of population migration to cities in developing countries? A an ageing population B higher unemployment rates in cities C higher wages in cities D higher land values in cities
1 marks
Answer: C
This question in 0455/11 May/June 2006
Q5 · What is likely to be higher in a developing country, such as Kenya, than in a developed… 0455/11 May/June 2006
35 What is likely to be higher in a developing country, such as Kenya, than in a developed country, such as Switzerland? A birth rate B GDP per head C life expectancy D net investment per head
1 marks
Answer: A
This question in 0455/11 May/June 2006
Q6 · In a country the birth rate increased but the population decreased 0455/11 Oct/Nov 2006
34 In a country the birth rate increased but the population decreased. What could have happened to other factors to cause this? A no change in migration but the death rate fell B a fall in infant mortality but no change in the death rate C no change in migration but the death rate rose D a rise in net immigration but no change in the death rate
1 marks
Answer: C
This question in 0455/11 Oct/Nov 2006
Q7 · How is the death rate defined? 0455/11 Oct/Nov 2006
36 How is the death rate defined? A the excess of deaths over births in any one year B the number of deaths of infants per thousand births C the number of deaths per year D the number of deaths per year per thousand of the population
1 marks
Answer: D
This question in 0455/11 Oct/Nov 2006
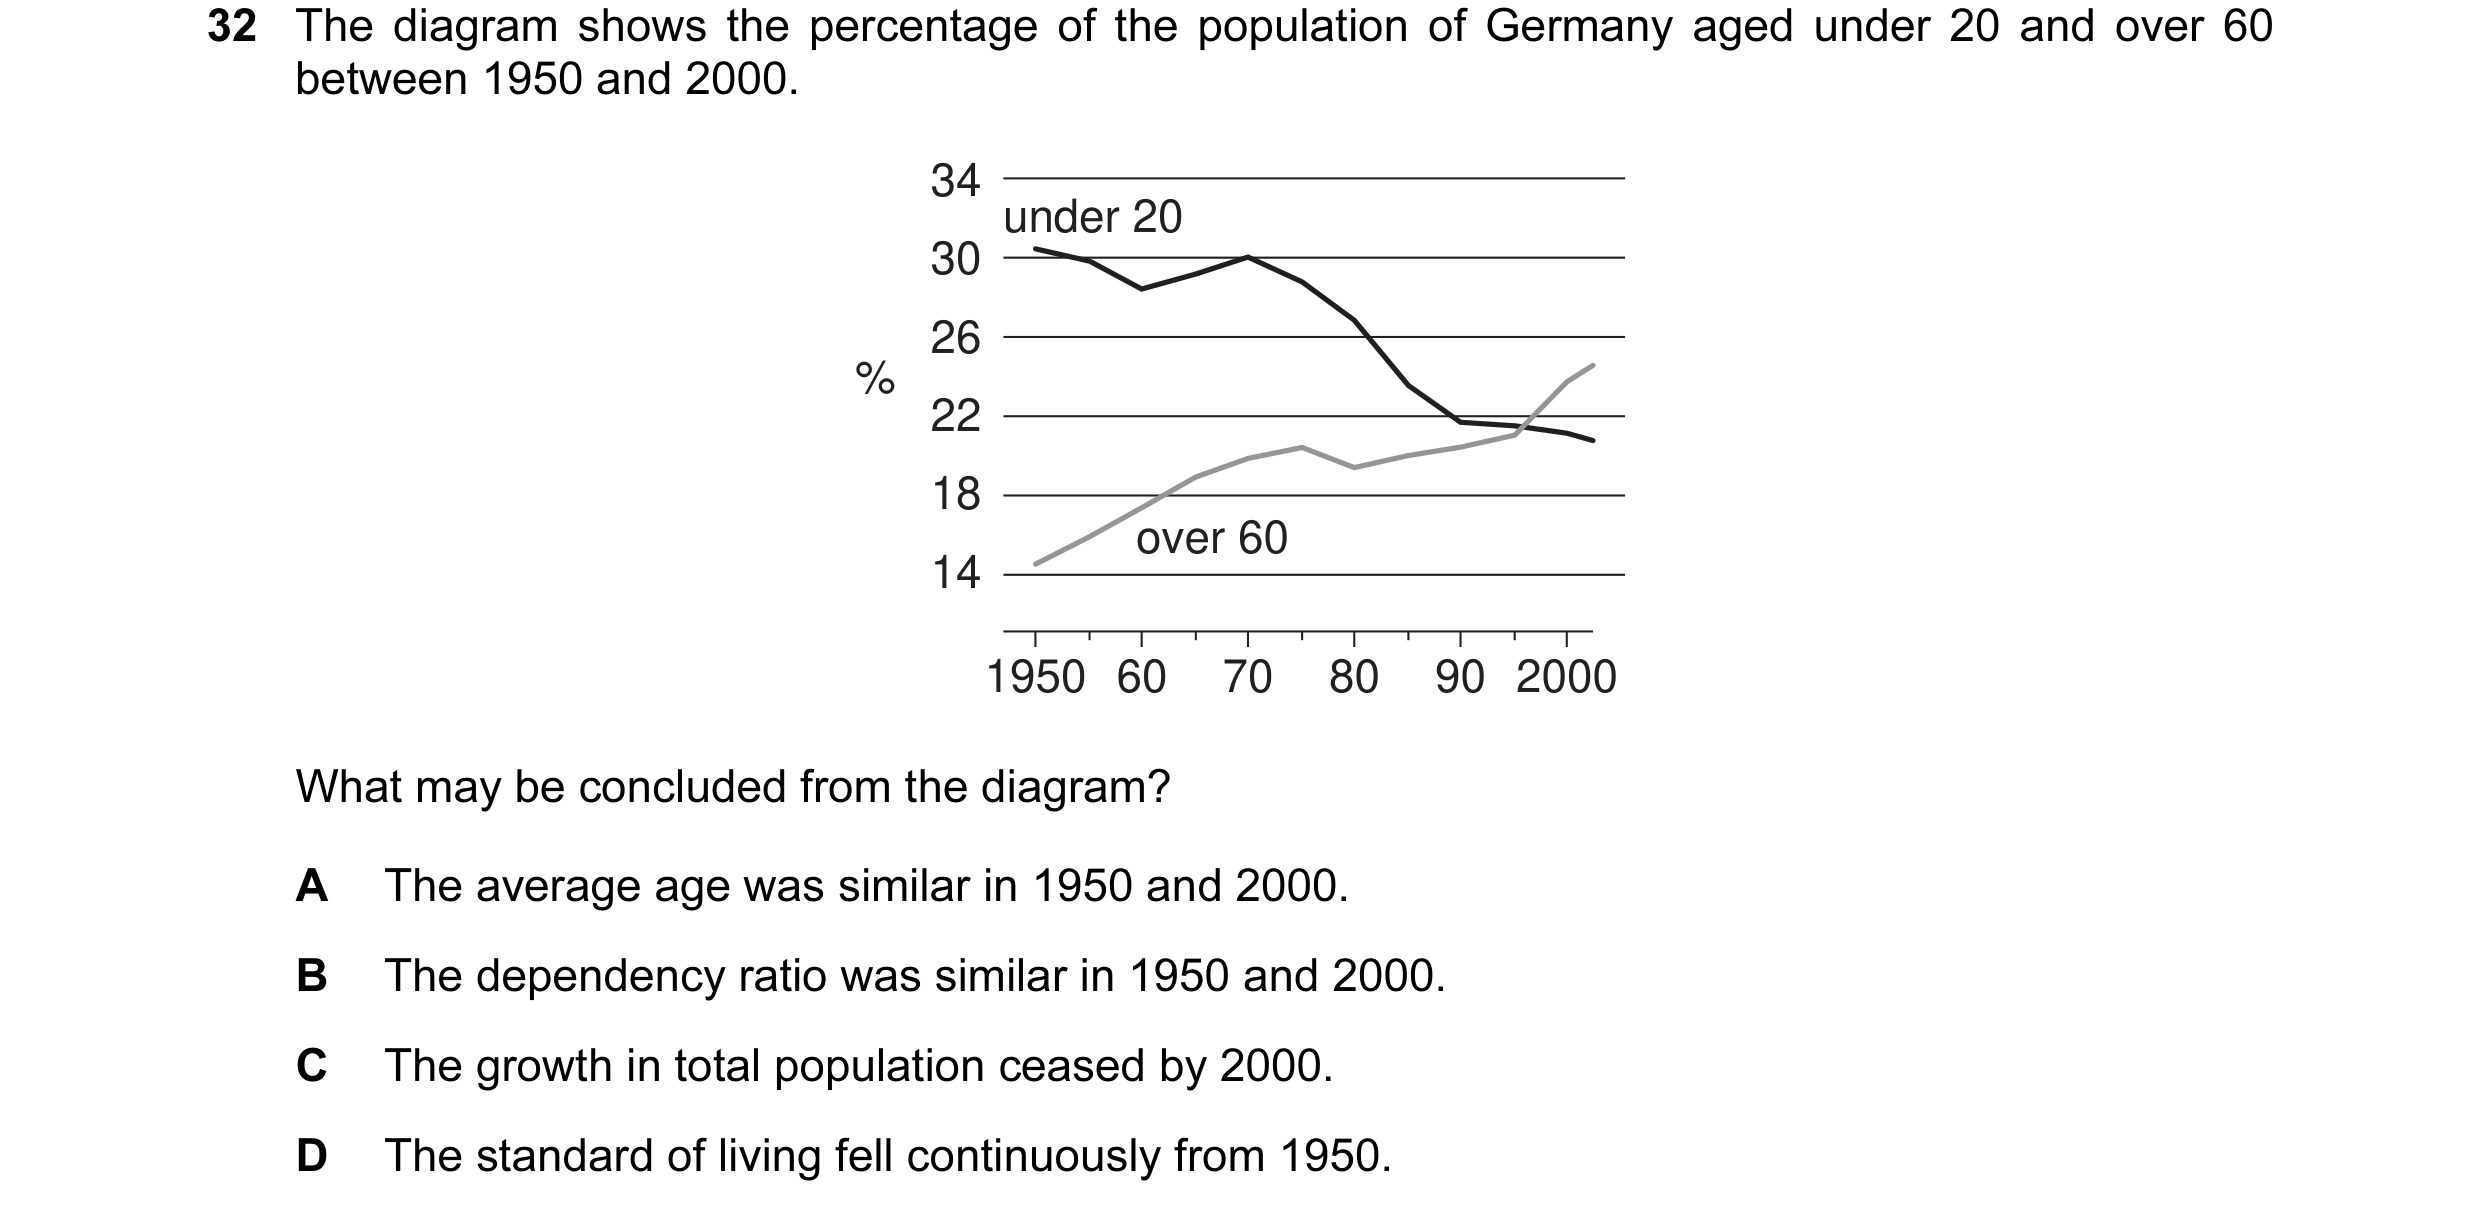
Q8 · The diagram shows the percentage of the population of Germany aged under 20 and over 60… 0455/11 May/June 2007
32 The diagram shows the percentage of the population of Germany aged under 20 and over 60 between 1950 and 2000. 34 under 20 30 26 % 22 18 over 60 14 1950 60 70 80 90 2000 What may be concluded from the diagram? A The average age was similar in 1950 and 2000. B The dependency ratio was similar in 1950 and 2000. C The growth in total population ceased by 2000. D The standard of living fell continuously from 1950.
1 marks
Answer: B
This question in 0455/11 May/June 2007
Q9 · In 2005, world population had grown to 6.5 billion with an increase of more than 4… 0455/11 May/June 2007
34 In 2005, world population had grown to 6.5 billion with an increase of more than 4 billion since 1950. What is most likely to have been the cause of this? A an increase in the death rate in developed countries B an increase in the birth rate in developing countries C an increase in migration from developing to developed countries D an increase in the death rate in developing countries
1 marks
Answer: B
This question in 0455/11 May/June 2007
Q10 · What might explain the high population growth in some developing countries? 0455/11 Oct/Nov 2007
32 What might explain the high population growth in some developing countries? A high birth rates and falling death rates B high immigration and low emigration C falling birth rates and rising death rates D falling life expectancy
1 marks
Answer: A
This question in 0455/11 Oct/Nov 2007
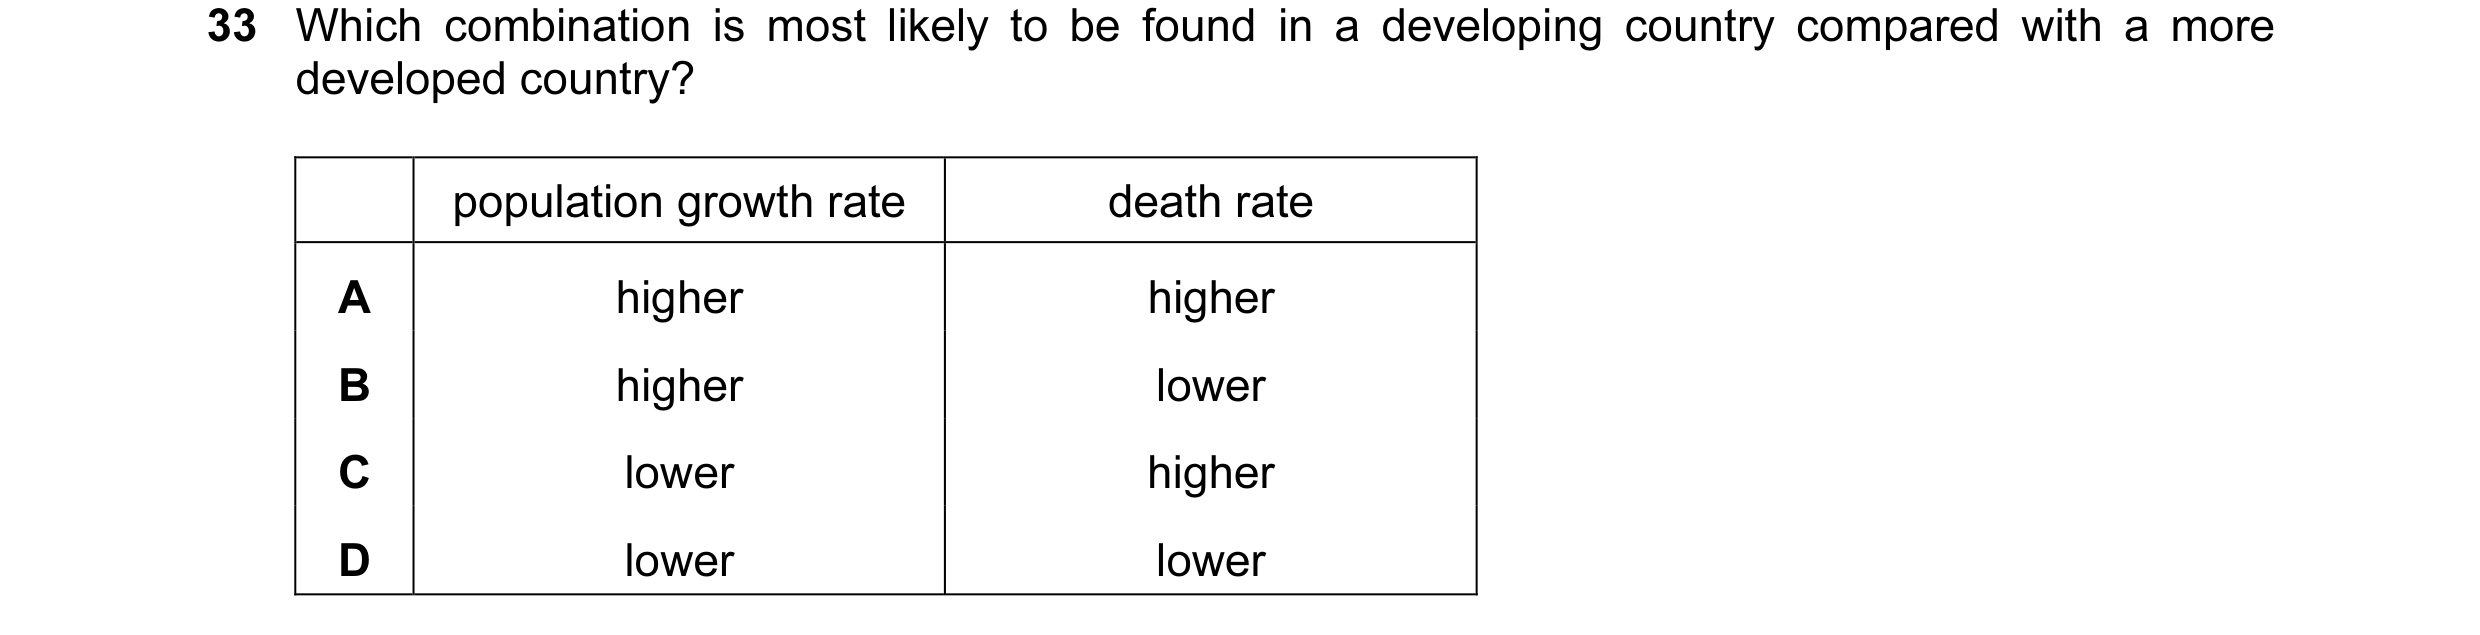
Q11 · Which combination is most likely to be found in a developing country compared with a more… 0455/11 Oct/Nov 2008
33 Which combination is most likely to be found in a developing country compared with a more developed country? population growth rate death rate A higher higher B higher lower C lower higher D lower lower
1 marks
Answer: A
This question in 0455/11 Oct/Nov 2008
Q12 · What is most likely to cause an immediate decrease in the size of the working population? 0455/11 May/June 2009
25 What is most likely to cause an immediate decrease in the size of the working population? A a fall in the average size of families B a fall in the birth rate C a reduction in the age of retirement D an increase in net immigration
1 marks
Answer: C
This question in 0455/11 May/June 2009
Q13 · The graph shows the labour force of a country from 2003-2015 0455/11 Oct/Nov 2009
21 The graph shows the labour force of a country from 2003-2015. 17 male 16 15 14 millions 13 female 12 11 0 2003 2004 2005 2006 2007 2008 2009 2010 2011 2012 2013 2014 2015 estimates projections What may be concluded from the graph? A Between 2003 and 2015, women will become a higher percentage of the labour force. B It is estimated that more girls than boys will be born between 2003 and 2005. C The labour force will remain relatively unchanged after 2006 at approximately 16 million. D The total population of the country in 2010-2011 will be approximately 28 million.
1 marks
Answer: A
This question in 0455/11 Oct/Nov 2009
Q14 · Which factor is most likely to reduce the average age of a population in a developed… 0455/11 Oct/Nov 2009
25 Which factor is most likely to reduce the average age of a population in a developed country? A a lower birth rate B a lower death rate C emigration D immigration
1 marks
Answer: D
This question in 0455/11 Oct/Nov 2009
Q15 · What is most likely to be found in a typical developing country? 0455/11 Oct/Nov 2009
26 What is most likely to be found in a typical developing country? A a good education sector B a small average family size C a small percentage of very old people D high spending on entertainment
1 marks
Answer: C
This question in 0455/11 Oct/Nov 2009
Q16 · The Chinese Government is concerned about two population problems – overpopulation and a… 0455/11 Oct/Nov 2009
27 The Chinese Government is concerned about two population problems – overpopulation and a gender imbalance, with males outnumbering females. In 2007 it reduced the number of babies that foreigners are allowed to adopt; almost all of the babies are girls. What effect might this have on the size of China’s population and gender imbalance in the short run? size of population gender imbalance A increase increase B increase reduce C reduce increase D reduce reduce
1 marks
Answer: B
This question in 0455/11 Oct/Nov 2009
Q17 · What will be the likely effect on the remaining population of a developing country when… 0455/11 Oct/Nov 2010
27 What will be the likely effect on the remaining population of a developing country when newly trained, skilled workers migrate to developed countries? A Its average age will increase. B Its mobility will increase. C Its productivity will increase. D Its total size will increase.
1 marks
Answer: A
This question in 0455/11 Oct/Nov 2010
Q18 · What will be the likely effect on the remaining population of a developing country when… 0455/12 Oct/Nov 2010
28 What will be the likely effect on the remaining population of a developing country when newly trained, skilled workers migrate to developed countries? A Its average age will increase. B Its mobility will increase. C Its productivity will increase. D Its total size will increase.
1 marks
Answer: A
This question in 0455/12 Oct/Nov 2010
Q19 · What will be the likely effect on the remaining population of a developing country when… 0455/13 Oct/Nov 2010
26 What will be the likely effect on the remaining population of a developing country when newly trained, skilled workers migrate to developed countries? A Its average age will increase. B Its mobility will increase. C Its productivity will increase. D Its total size will increase.
1 marks
Answer: A
This question in 0455/13 Oct/Nov 2010
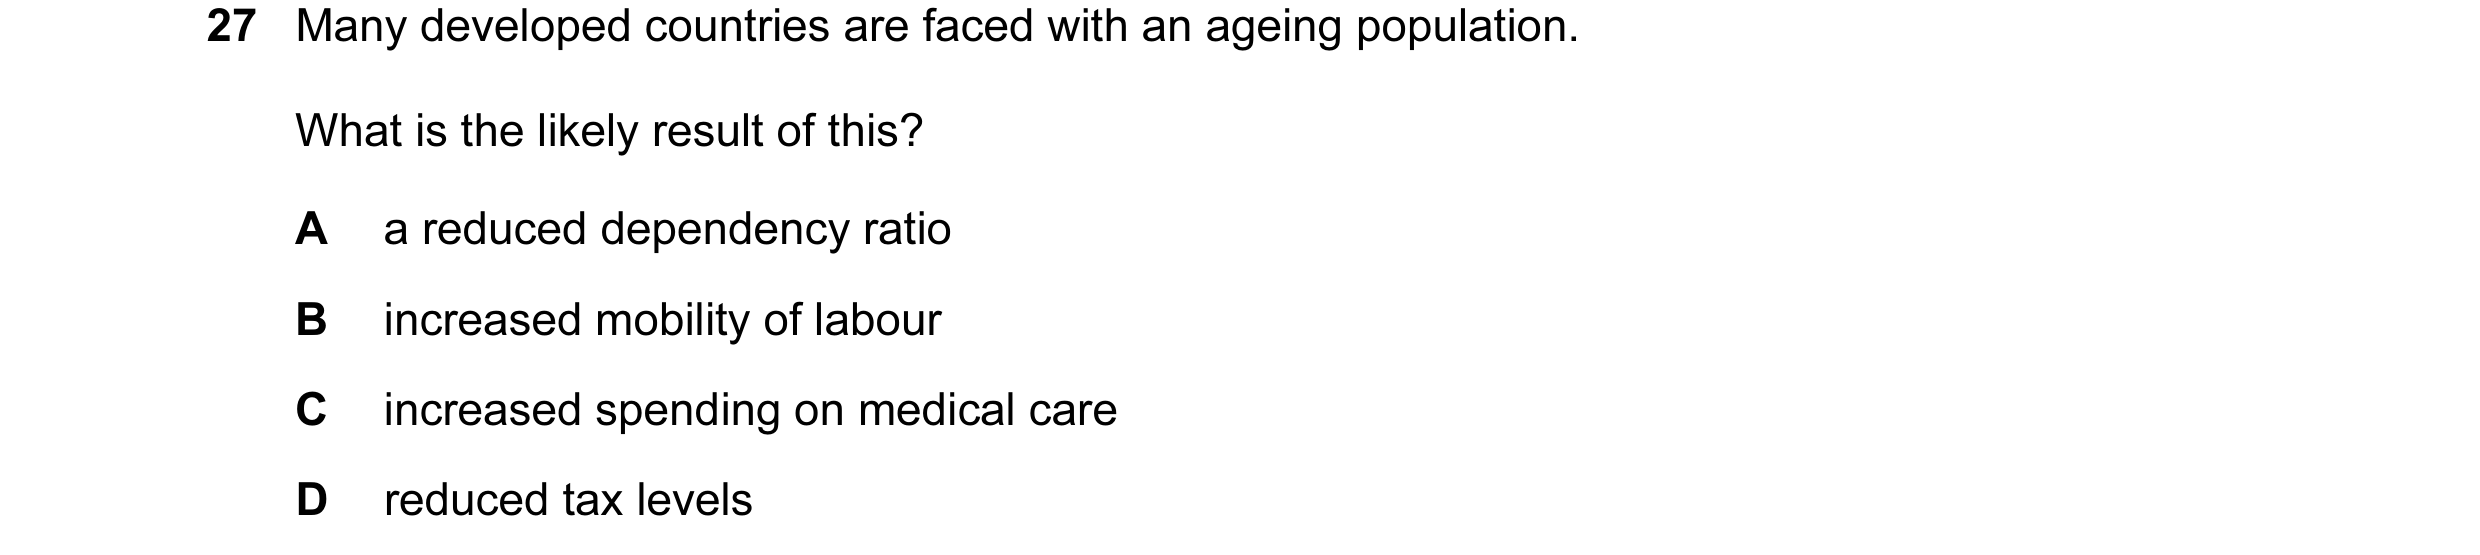
Q20 · Many developed countries are faced with an ageing population 0455/11 May/June 2011
27 Many developed countries are faced with an ageing population. What is the likely result of this? A a reduced dependency ratio B increased mobility of labour C increased spending on medical care D reduced tax levels
1 marks
Answer: C
This question in 0455/11 May/June 2011
Q21 · Many developed countries are faced with an ageing population 0455/12 May/June 2011
26 Many developed countries are faced with an ageing population. What is the likely result of this? A a reduced dependency ratio B increased mobility of labour C increased spending on medical care D reduced tax levels
1 marks
Answer: C
This question in 0455/12 May/June 2011
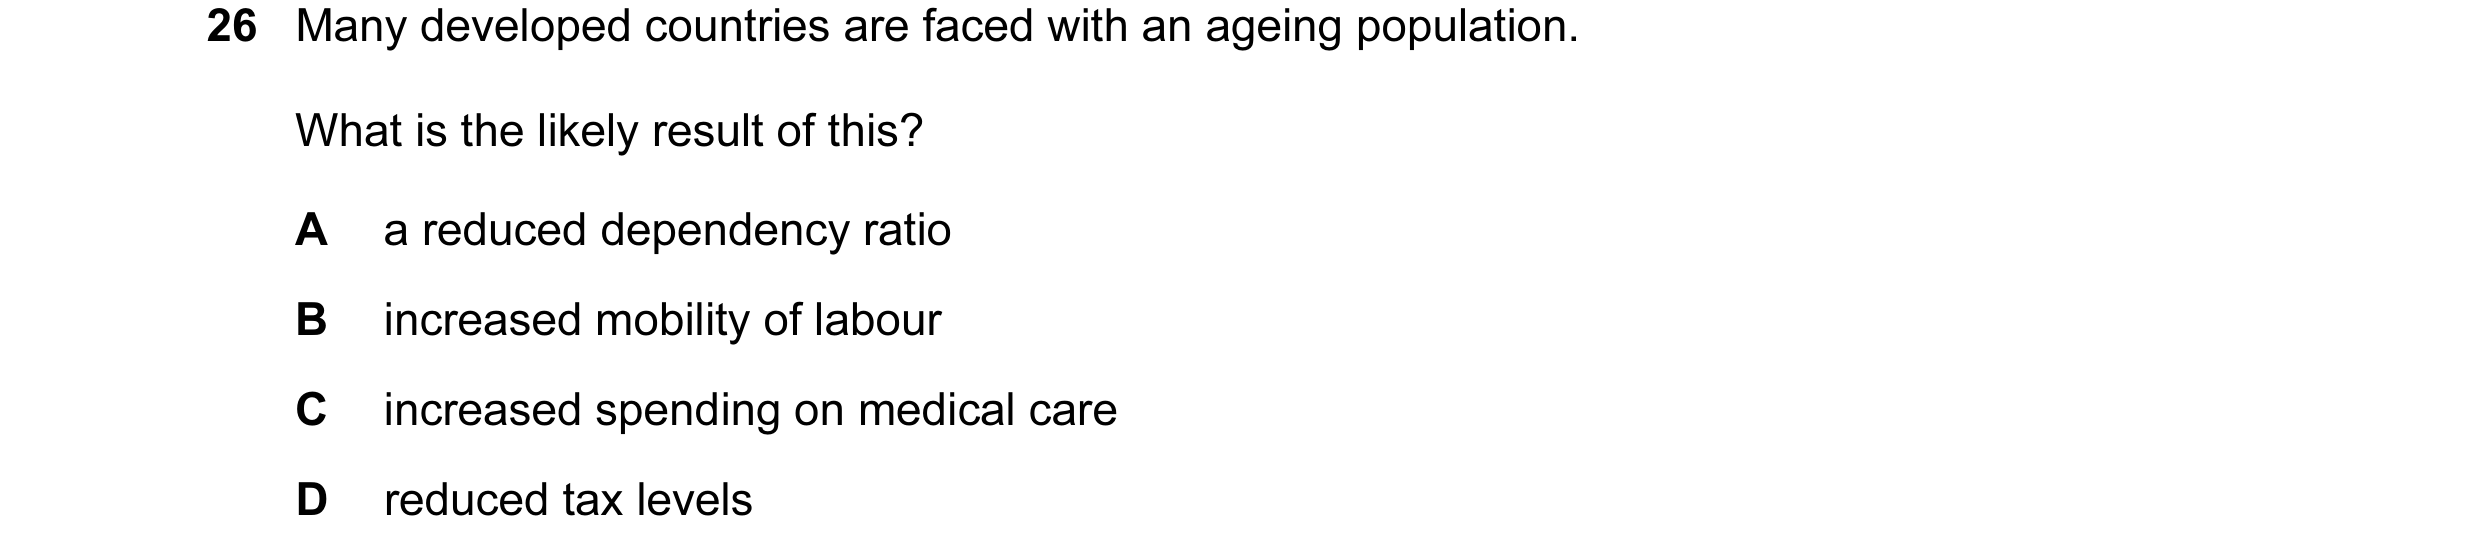
Q22 · Many developed countries are faced with an ageing population 0455/13 May/June 2011
26 Many developed countries are faced with an ageing population. What is the likely result of this? A a reduced dependency ratio B increased mobility of labour C increased spending on medical care D reduced tax levels
1 marks
Answer: C
This question in 0455/13 May/June 2011
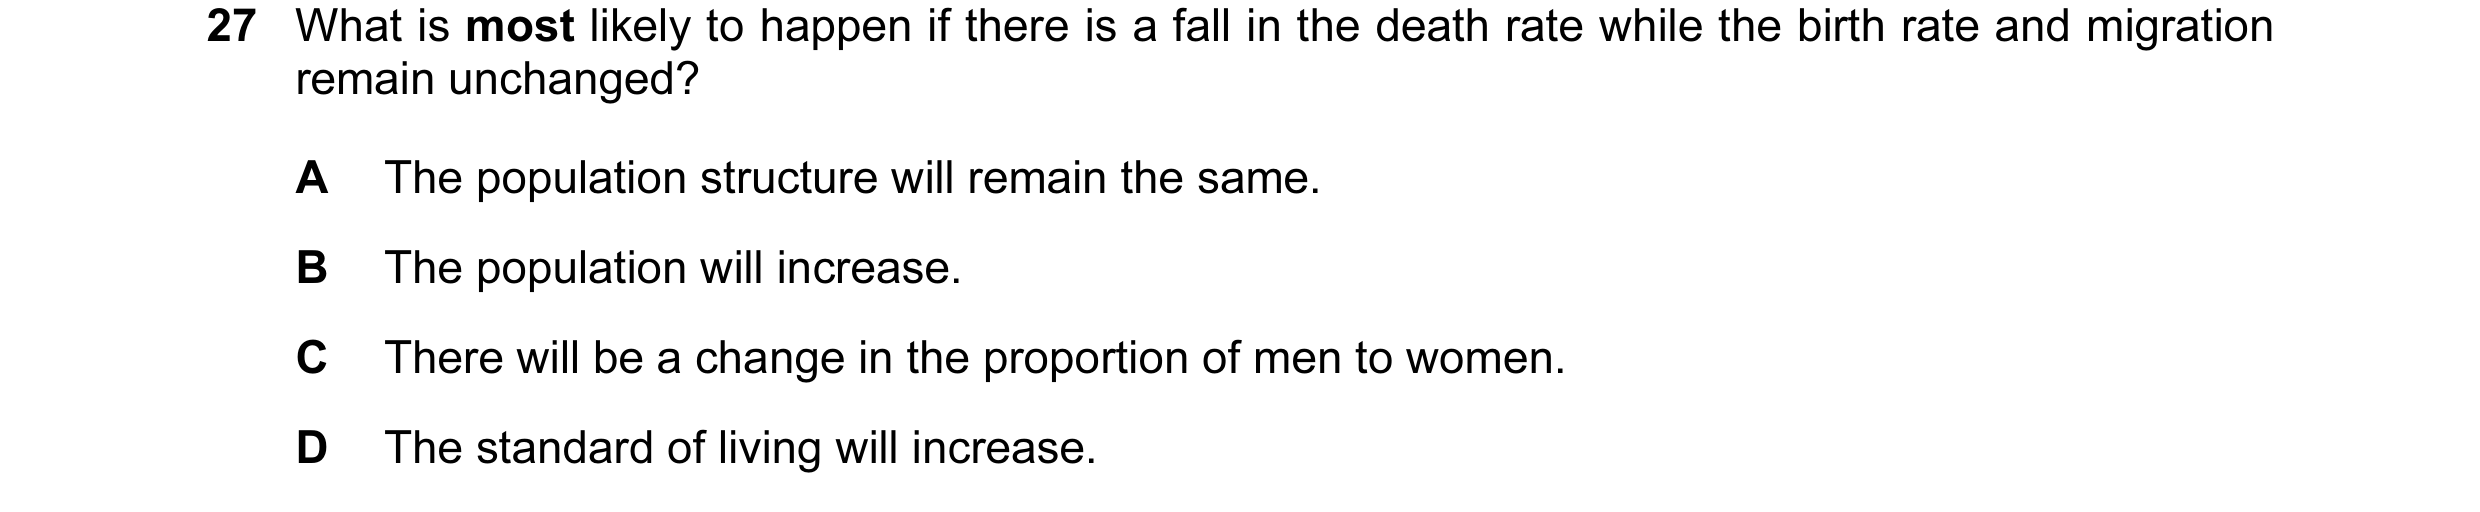
Q23 · What is most likely to happen if there is a fall in the death rate while the birth rate… 0455/11 Oct/Nov 2011
27 What is most likely to happen if there is a fall in the death rate while the birth rate and migration remain unchanged? A The population structure will remain the same. B The population will increase. C There will be a change in the proportion of men to women. D The standard of living will increase.
1 marks
Answer: B
This question in 0455/11 Oct/Nov 2011
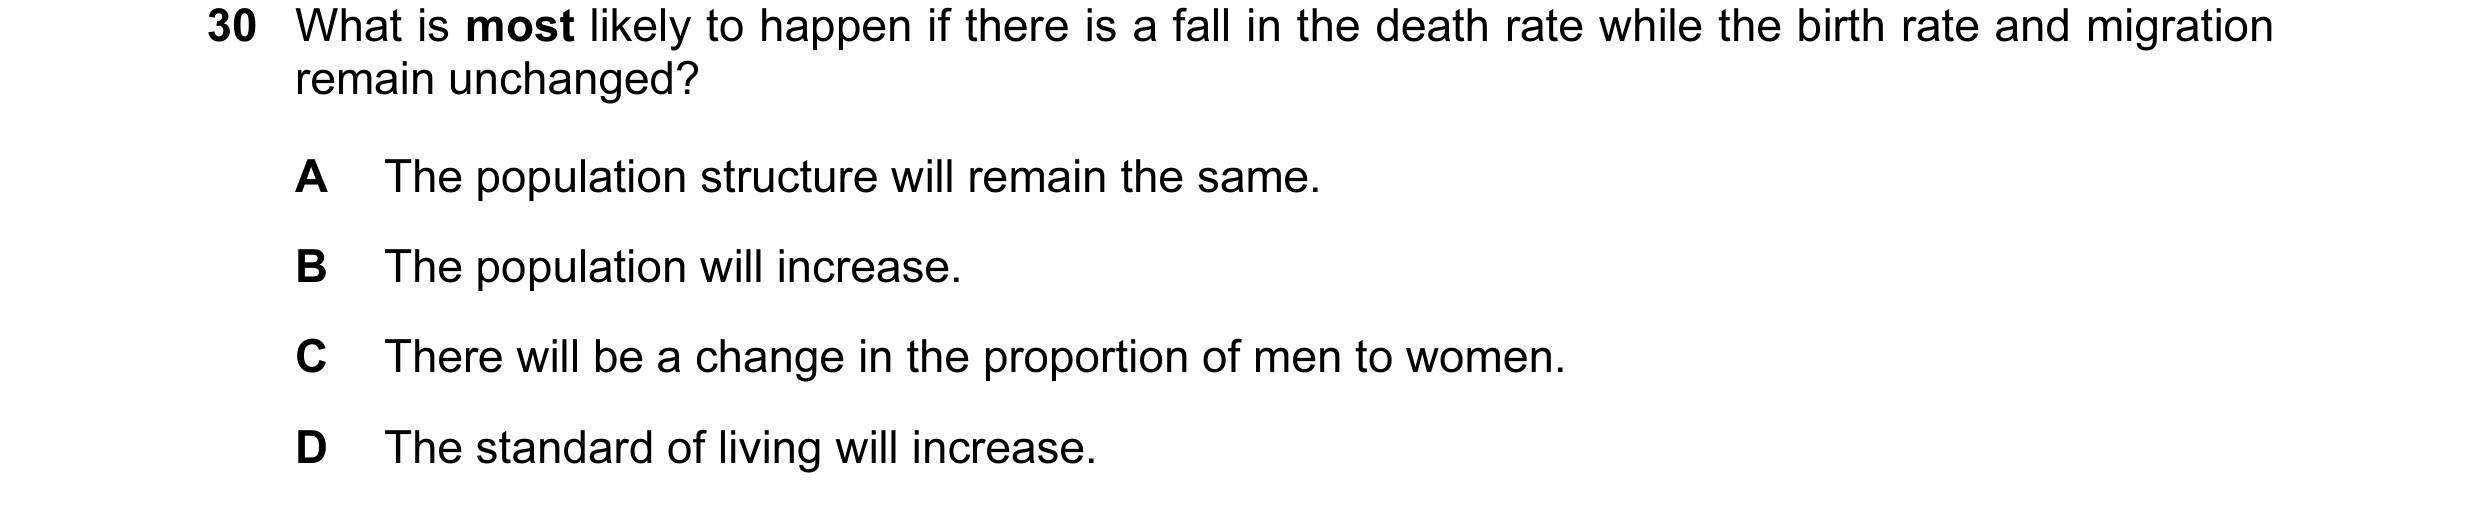
Q24 · What is most likely to happen if there is a fall in the death rate while the birth rate… 0455/12 Oct/Nov 2011
30 What is most likely to happen if there is a fall in the death rate while the birth rate and migration remain unchanged? A The population structure will remain the same. B The population will increase. C There will be a change in the proportion of men to women. D The standard of living will increase.
1 marks
Answer: B
This question in 0455/12 Oct/Nov 2011
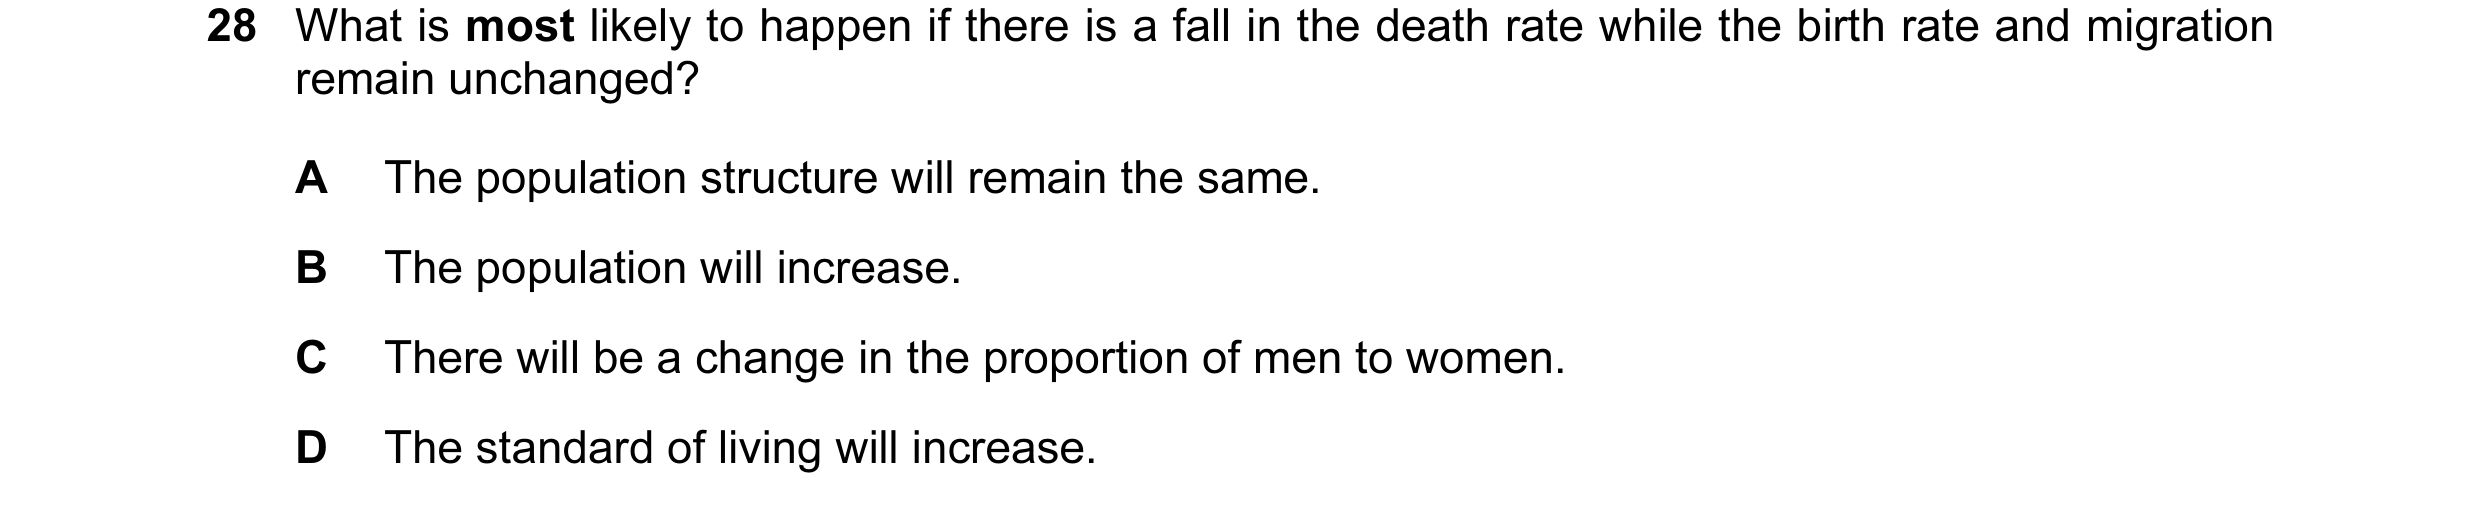
Q25 · What is most likely to happen if there is a fall in the death rate while the birth rate… 0455/13 Oct/Nov 2011
28 What is most likely to happen if there is a fall in the death rate while the birth rate and migration remain unchanged? A The population structure will remain the same. B The population will increase. C There will be a change in the proportion of men to women. D The standard of living will increase.
1 marks
Answer: B
This question in 0455/13 Oct/Nov 2011
Q26 · The charts show the population structure of a country in 1950 and 2010 0455/11 May/June 2012
28 The charts show the population structure of a country in 1950 and 2010. age age male female male female 85+ 85+ 80 – 84 80 – 84 75 – 79 75 – 79 70 – 74 70 – 74 65 – 69 65 – 69 60 – 64 60 – 64 55 – 59 55 – 59 50 – 54 50 – 54 45 – 49 45 – 49 40 – 44 40 – 44 35 – 39 35 – 39 30 – 34 30 – 34 25 – 29 25 – 29 20 – 24 20 – 24 15 – 19 15 – 19 10 – 14 10 – 14 5 – 9 5 – 9 0 – 4 0 – 4 3 2 1 0 0 1 2 3 3 2 1 0 0 1 2 3 millions millions 1950 2010 What decreased between 1950 and 2010? A average age B number of people below 15 C number of people over 60 D total population
1 marks
Answer: B
This question in 0455/11 May/June 2012
Q27 · Why is the size of the average family higher in developing countries than in developed… 0455/12 May/June 2012
27 Why is the size of the average family higher in developing countries than in developed countries? A In developing countries babies are more likely to survive at birth. B In developing countries parents start families at a later age. C In developing countries there is often a shortage of family planning advice. D In developing countries the government provides a higher level of child support.
1 marks
Answer: C
This question in 0455/12 May/June 2012
Q28 · The charts show the population structure of a country in 1950 and 2010 0455/12 May/June 2012
28 The charts show the population structure of a country in 1950 and 2010. age age male female male female 85+ 85+ 80 – 84 80 – 84 75 – 79 75 – 79 70 – 74 70 – 74 65 – 69 65 – 69 60 – 64 60 – 64 55 – 59 55 – 59 50 – 54 50 – 54 45 – 49 45 – 49 40 – 44 40 – 44 35 – 39 35 – 39 30 – 34 30 – 34 25 – 29 25 – 29 20 – 24 20 – 24 15 – 19 15 – 19 10 – 14 10 – 14 5 – 9 5 – 9 0 – 4 0 – 4 3 2 1 0 0 1 2 3 3 2 1 0 0 1 2 3 millions millions 1950 2010 What decreased between 1950 and 2010? A average age B number of people below 15 C number of people over 60 D total population
1 marks
Answer: B
This question in 0455/12 May/June 2012
Q29 · Why is the size of the average family higher in developing countries than in developed… 0455/13 May/June 2012
27 Why is the size of the average family higher in developing countries than in developed countries? A In developing countries babies are more likely to survive at birth. B In developing countries parents start families at a later age. C In developing countries there is often a shortage of family planning advice. D In developing countries the government provides a higher level of child support.
1 marks
Answer: C
This question in 0455/13 May/June 2012
Q30 · The charts show the population structure of a country in 1950 and 2010 0455/13 May/June 2012
28 The charts show the population structure of a country in 1950 and 2010. age age male female male female 85+ 85+ 80 – 84 80 – 84 75 – 79 75 – 79 70 – 74 70 – 74 65 – 69 65 – 69 60 – 64 60 – 64 55 – 59 55 – 59 50 – 54 50 – 54 45 – 49 45 – 49 40 – 44 40 – 44 35 – 39 35 – 39 30 – 34 30 – 34 25 – 29 25 – 29 20 – 24 20 – 24 15 – 19 15 – 19 10 – 14 10 – 14 5 – 9 5 – 9 0 – 4 0 – 4 3 2 1 0 0 1 2 3 3 2 1 0 0 1 2 3 millions millions 1950 2010 What decreased between 1950 and 2010? A average age B number of people below 15 C number of people over 60 D total population
1 marks
Answer: B
This question in 0455/13 May/June 2012
Q31 · In the developing economies of southern Africa, both infant mortality and life expectancy… 0455/11 Oct/Nov 2012
21 In the developing economies of southern Africa, both infant mortality and life expectancy have fallen. Life expectancy now averages only 41 years. What is the result of these changes? A Current labour supply has fallen. B Fewer primary schools are needed. C Governments will pay for more retirement pensions. D Less will need to be spent on health care.
1 marks
Answer: A
This question in 0455/11 Oct/Nov 2012
Q32 · In the developing economies of southern Africa, both infant mortality and life expectancy… 0455/12 Oct/Nov 2012
27 In the developing economies of southern Africa, both infant mortality and life expectancy have fallen. Life expectancy now averages only 41 years. What is the result of these changes? A Current labour supply has fallen. B Fewer primary schools are needed. C Governments will pay for more retirement pensions. D Less will need to be spent on health care.
1 marks
Answer: A
This question in 0455/12 Oct/Nov 2012
Q33 · In 2010, Nigeria had a birth rate of 36 and an infant mortality rate of 94 0455/13 Oct/Nov 2012
27 In 2010, Nigeria had a birth rate of 36 and an infant mortality rate of 94. What can be concluded from this information? A Nigeria experienced a natural decrease in population. B Nigeria’s population increased. C 36 children were born per hundred of the population. D 94 babies died before their first birthday out of every thousand babies born.
1 marks
Answer: D
This question in 0455/13 Oct/Nov 2012
Q34 · On 17 October 2006, the US population reached 300 million and was predicted to increase… 0455/11 May/June 2013
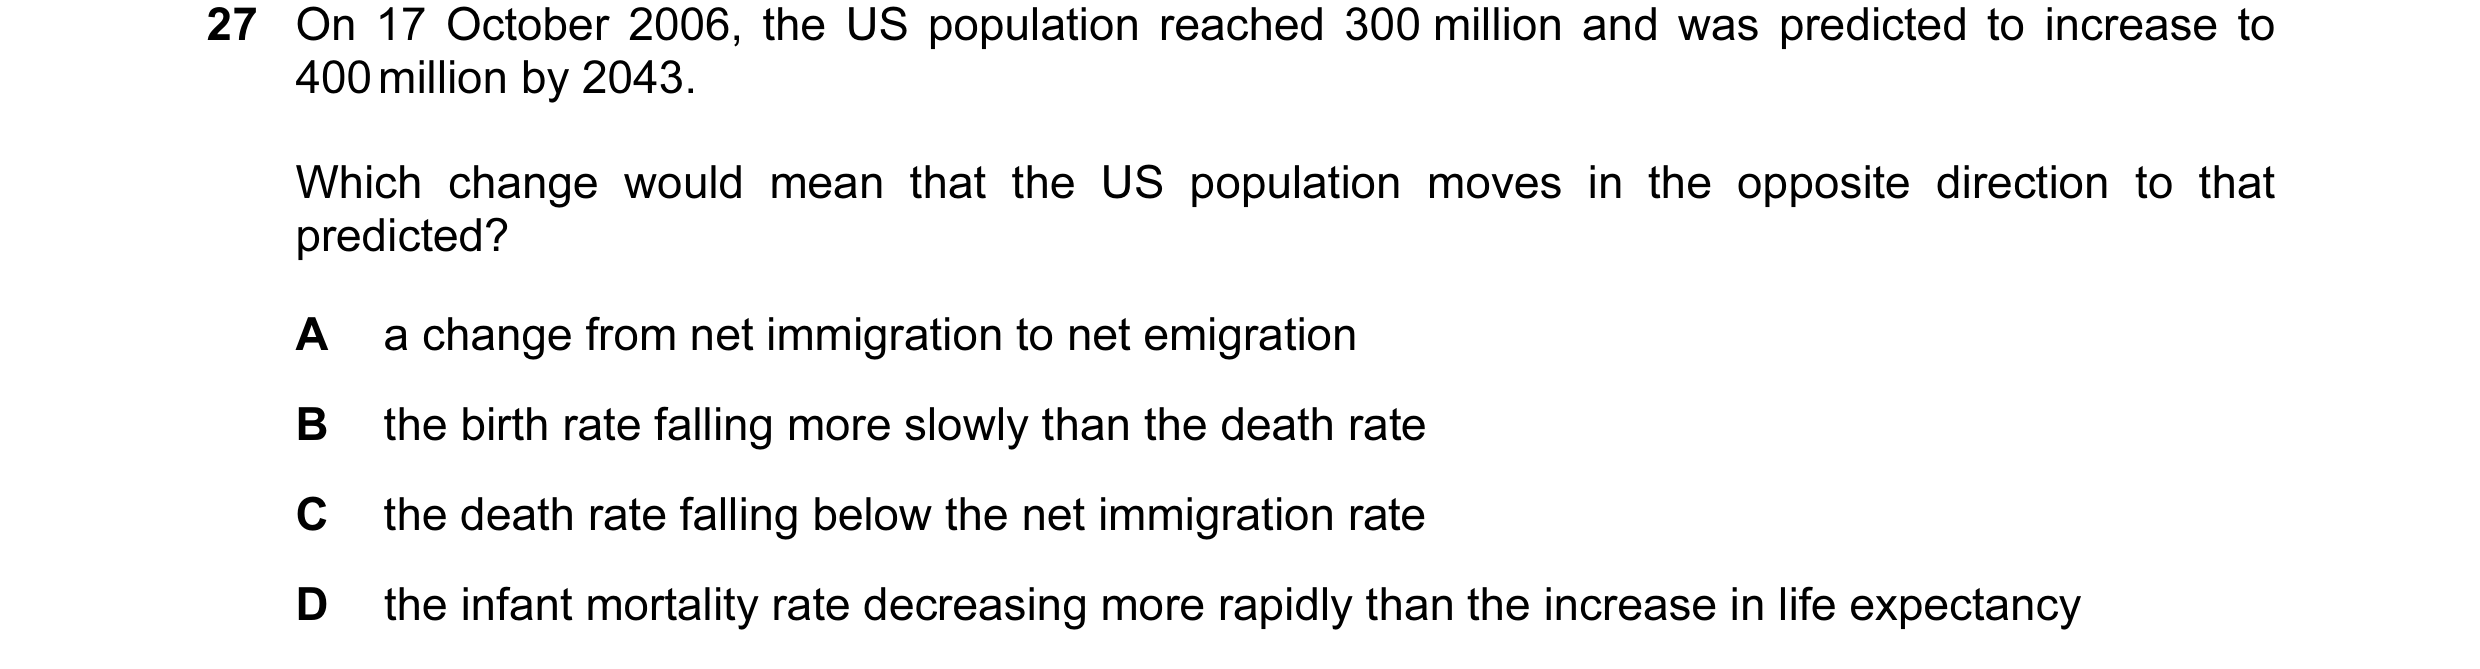
27 On 17 October 2006, the US population reached 300 million and was predicted to increase to 400 million by 2043. Which change would mean that the US population moves in the opposite direction to that predicted? A a change from net immigration to net emigration B the birth rate falling more slowly than the death rate C the death rate falling below the net immigration rate D the infant mortality rate decreasing more rapidly than the increase in life expectancy
1 marks
Answer: A
This question in 0455/11 May/June 2013
Q35 · In Botswana, better health care has meant that birth rates have been falling faster than… 0455/12 May/June 2013
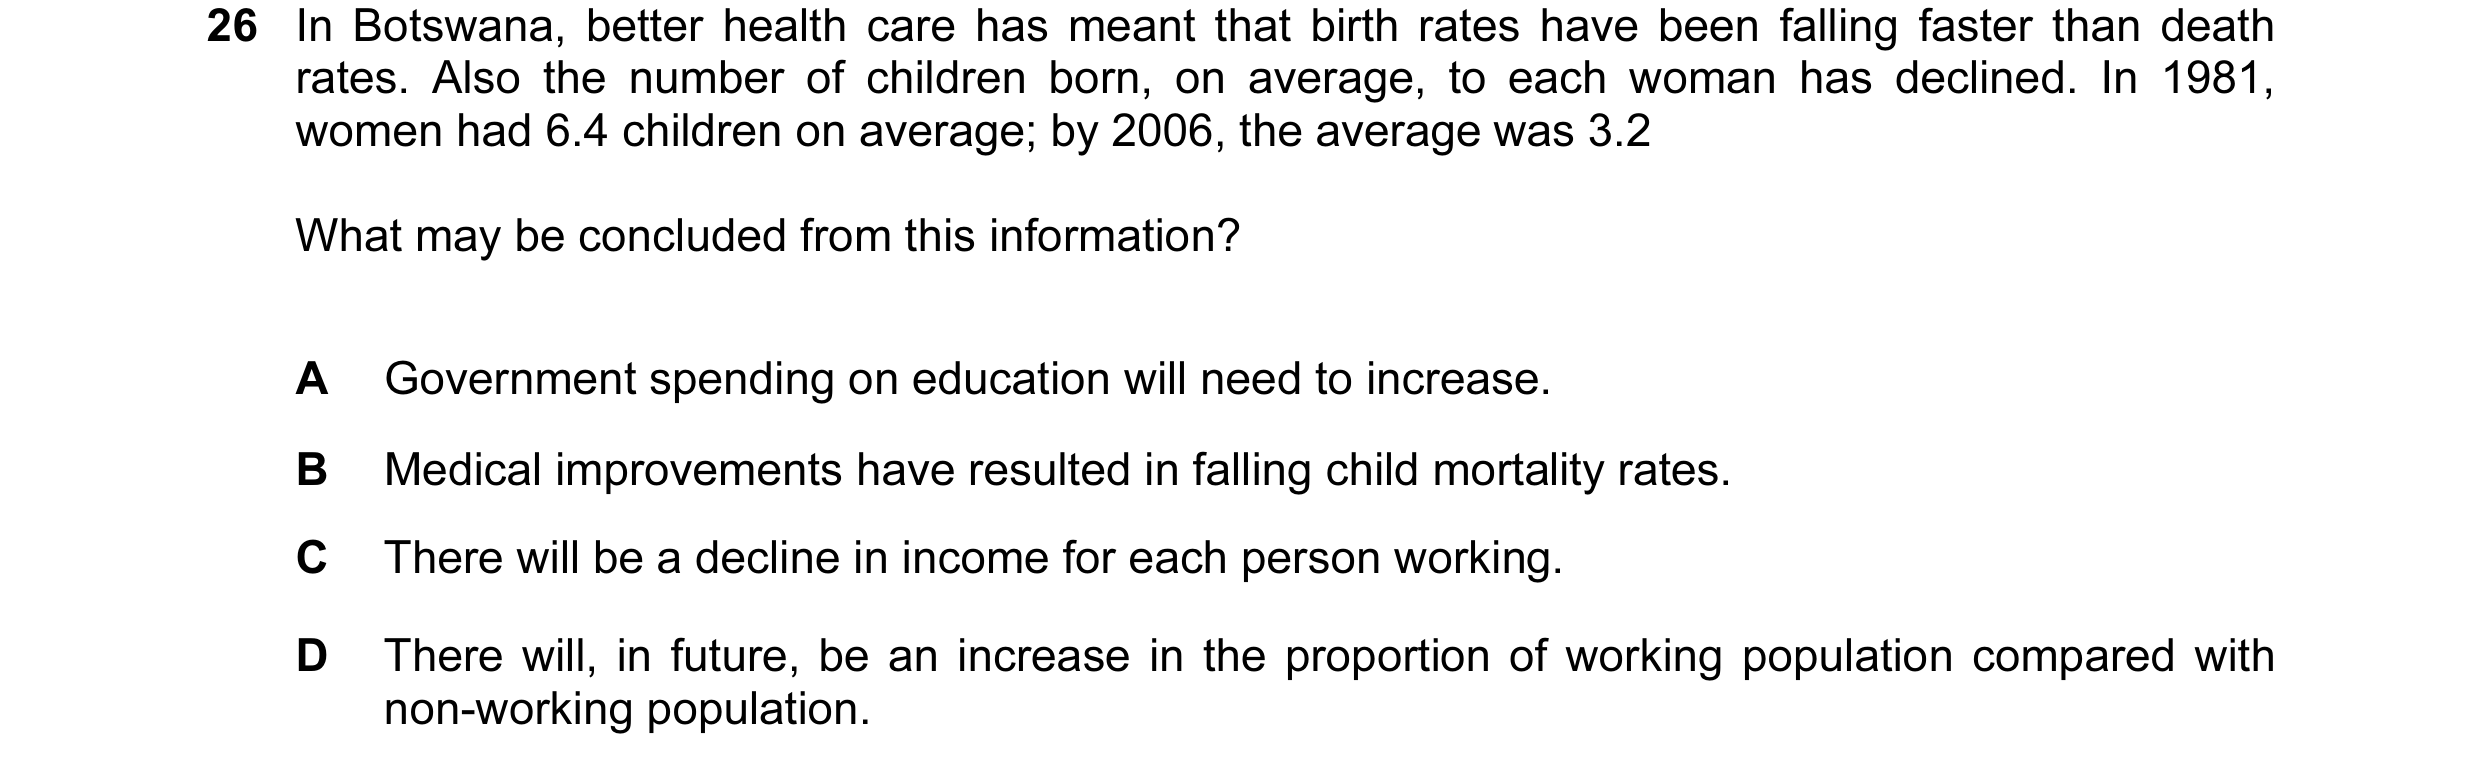
26 In Botswana, better health care has meant that birth rates have been falling faster than death rates. Also the number of children born, on average, to each woman has declined. In 1981, women had 6.4 children on average; by 2006, the average was 3.2 What may be concluded from this information? A Government spending on education will need to increase. B Medical improvements have resulted in falling child mortality rates. C There will be a decline in income for each person working. D There will, in future, be an increase in the proportion of working population compared with non-working population.
1 marks
Answer: B
This question in 0455/12 May/June 2013
Q36 · On 17 October 2006, the US population reached 300 million and was predicted to increase… 0455/13 May/June 2013
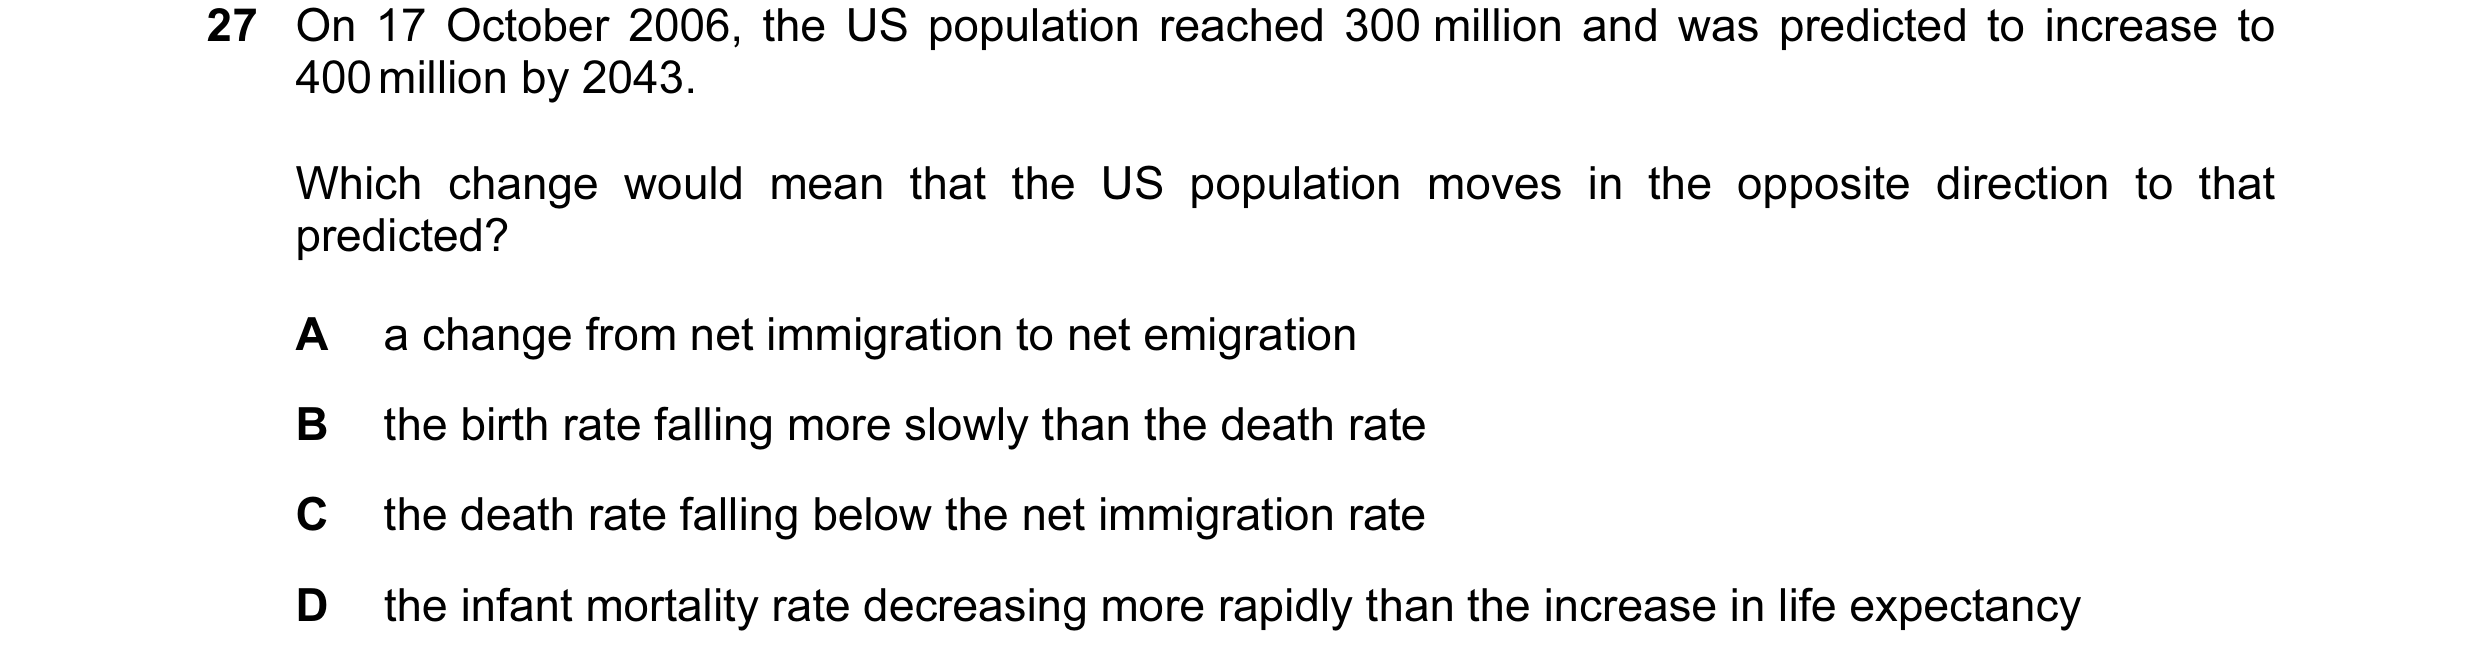
27 On 17 October 2006, the US population reached 300 million and was predicted to increase to 400 million by 2043. Which change would mean that the US population moves in the opposite direction to that predicted? A a change from net immigration to net emigration B the birth rate falling more slowly than the death rate C the death rate falling below the net immigration rate D the infant mortality rate decreasing more rapidly than the increase in life expectancy
1 marks
Answer: A
This question in 0455/13 May/June 2013
Q37 · A country has a falling birth rate and a rising death rate while an increasing number of… 0455/11 Oct/Nov 2013
28 A country has a falling birth rate and a rising death rate while an increasing number of its working age adults (16-60 years) are seeking employment abroad. How will this probably affect the numbers in the different age groups in the country? under 16 years 16-60 years over 60 years A fall fall fall B fall rise rise C rise fall rise D rise rise fall
1 marks
Answer: A
This question in 0455/11 Oct/Nov 2013
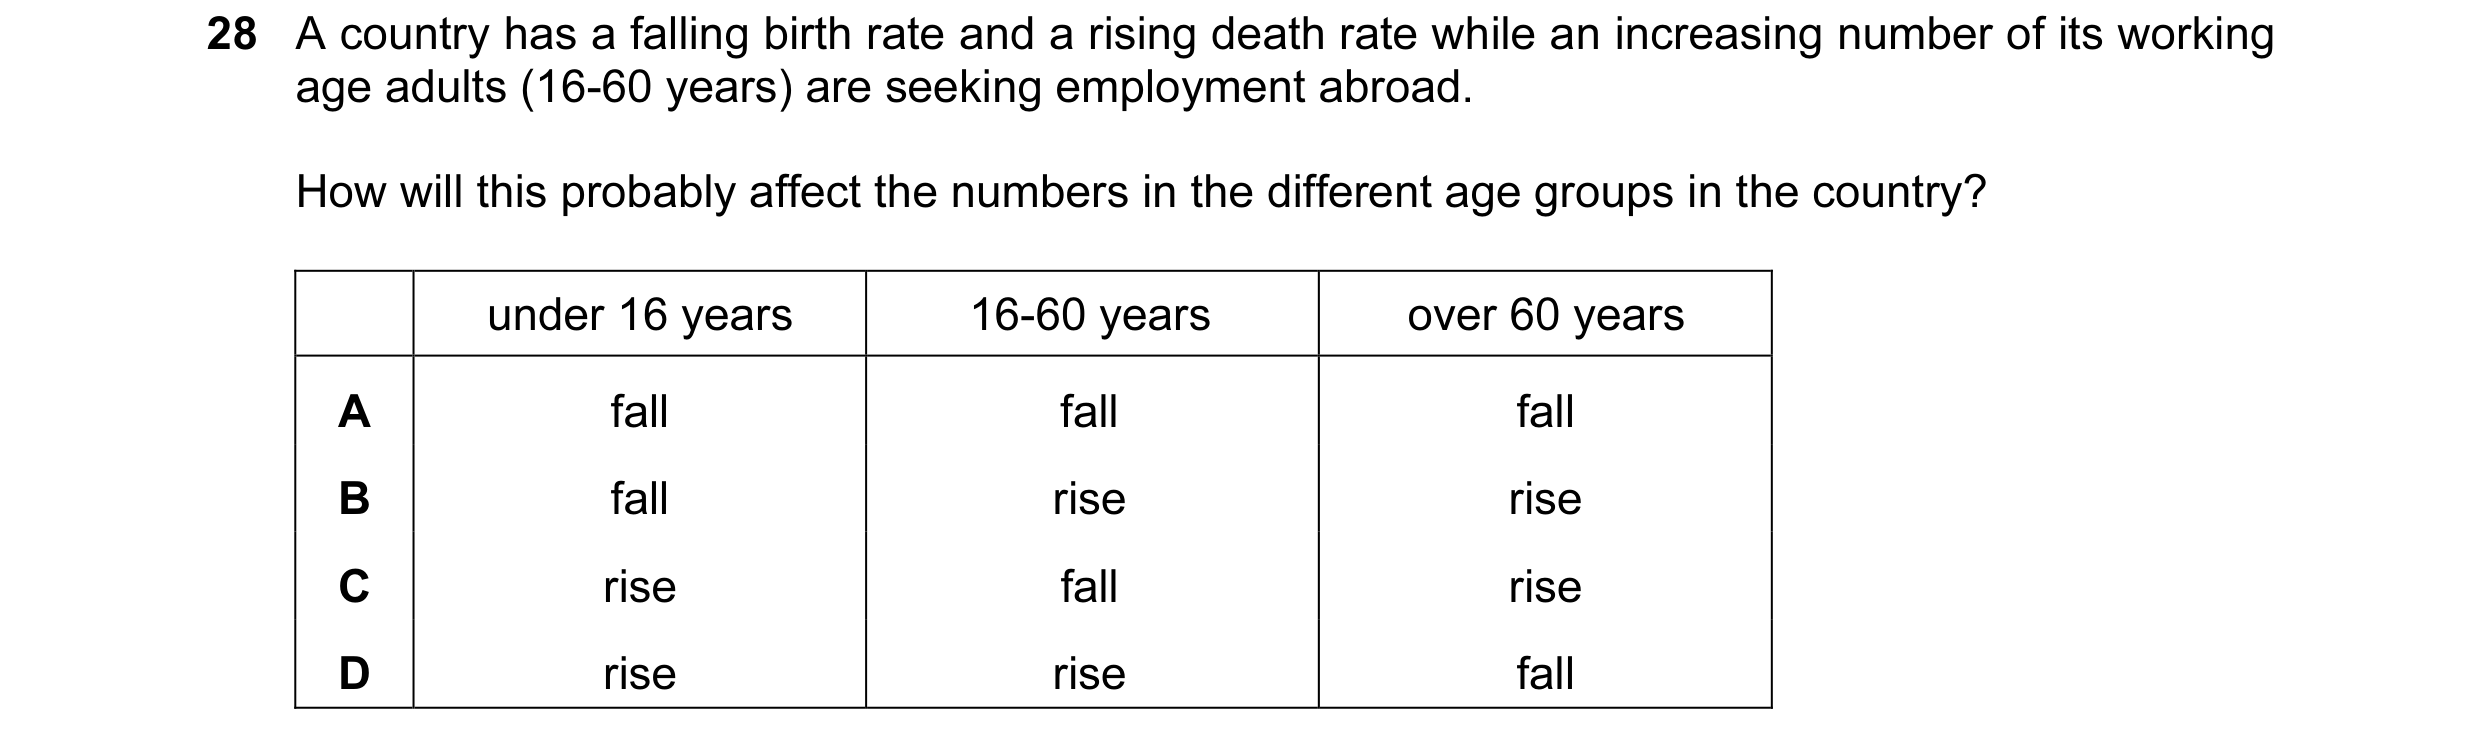
Q38 · A country has a falling birth rate and a rising death rate while an increasing number of… 0455/12 Oct/Nov 2013
28 A country has a falling birth rate and a rising death rate while an increasing number of its working age adults (16-60 years) are seeking employment abroad. How will this probably affect the numbers in the different age groups in the country? under 16 years 16-60 years over 60 years A fall fall fall B fall rise rise C rise fall rise D rise rise fall
1 marks
Answer: A
This question in 0455/12 Oct/Nov 2013
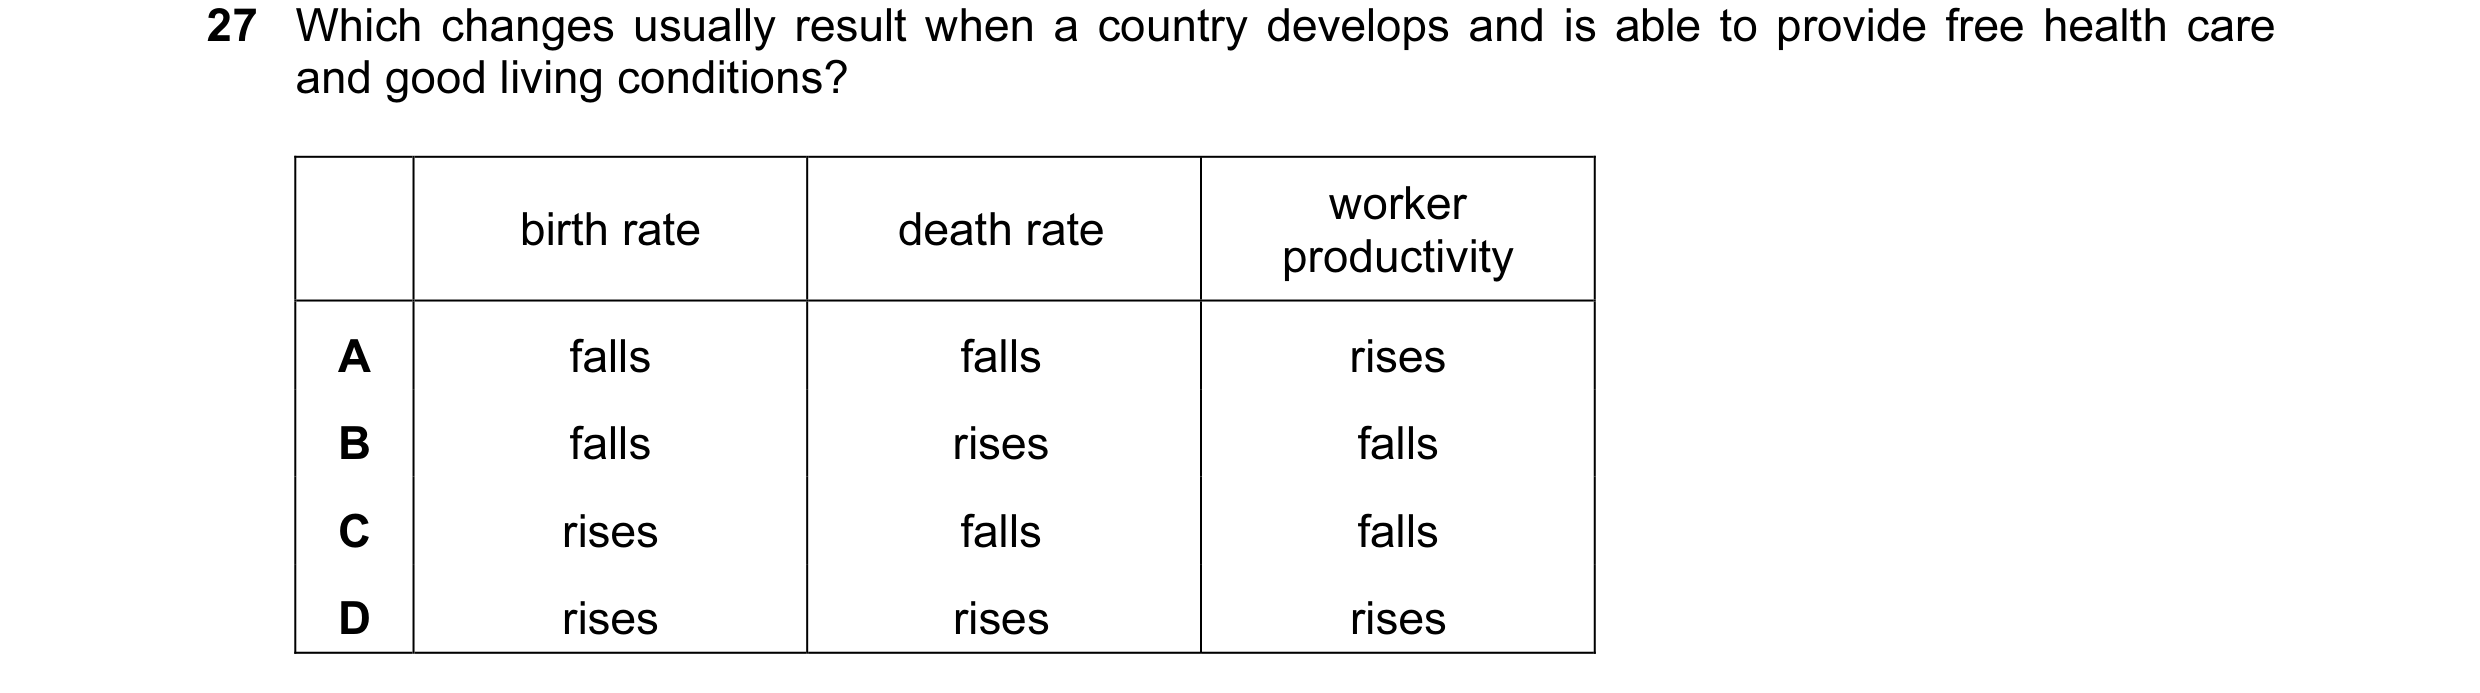
Q39 · Which changes usually result when a country develops and is able to provide free health… 0455/13 Oct/Nov 2013
27 Which changes usually result when a country develops and is able to provide free health care and good living conditions? worker birth rate death rate productivity A falls falls rises B falls rises falls C rises falls falls D rises rises rises
1 marks
Answer: A
This question in 0455/13 Oct/Nov 2013
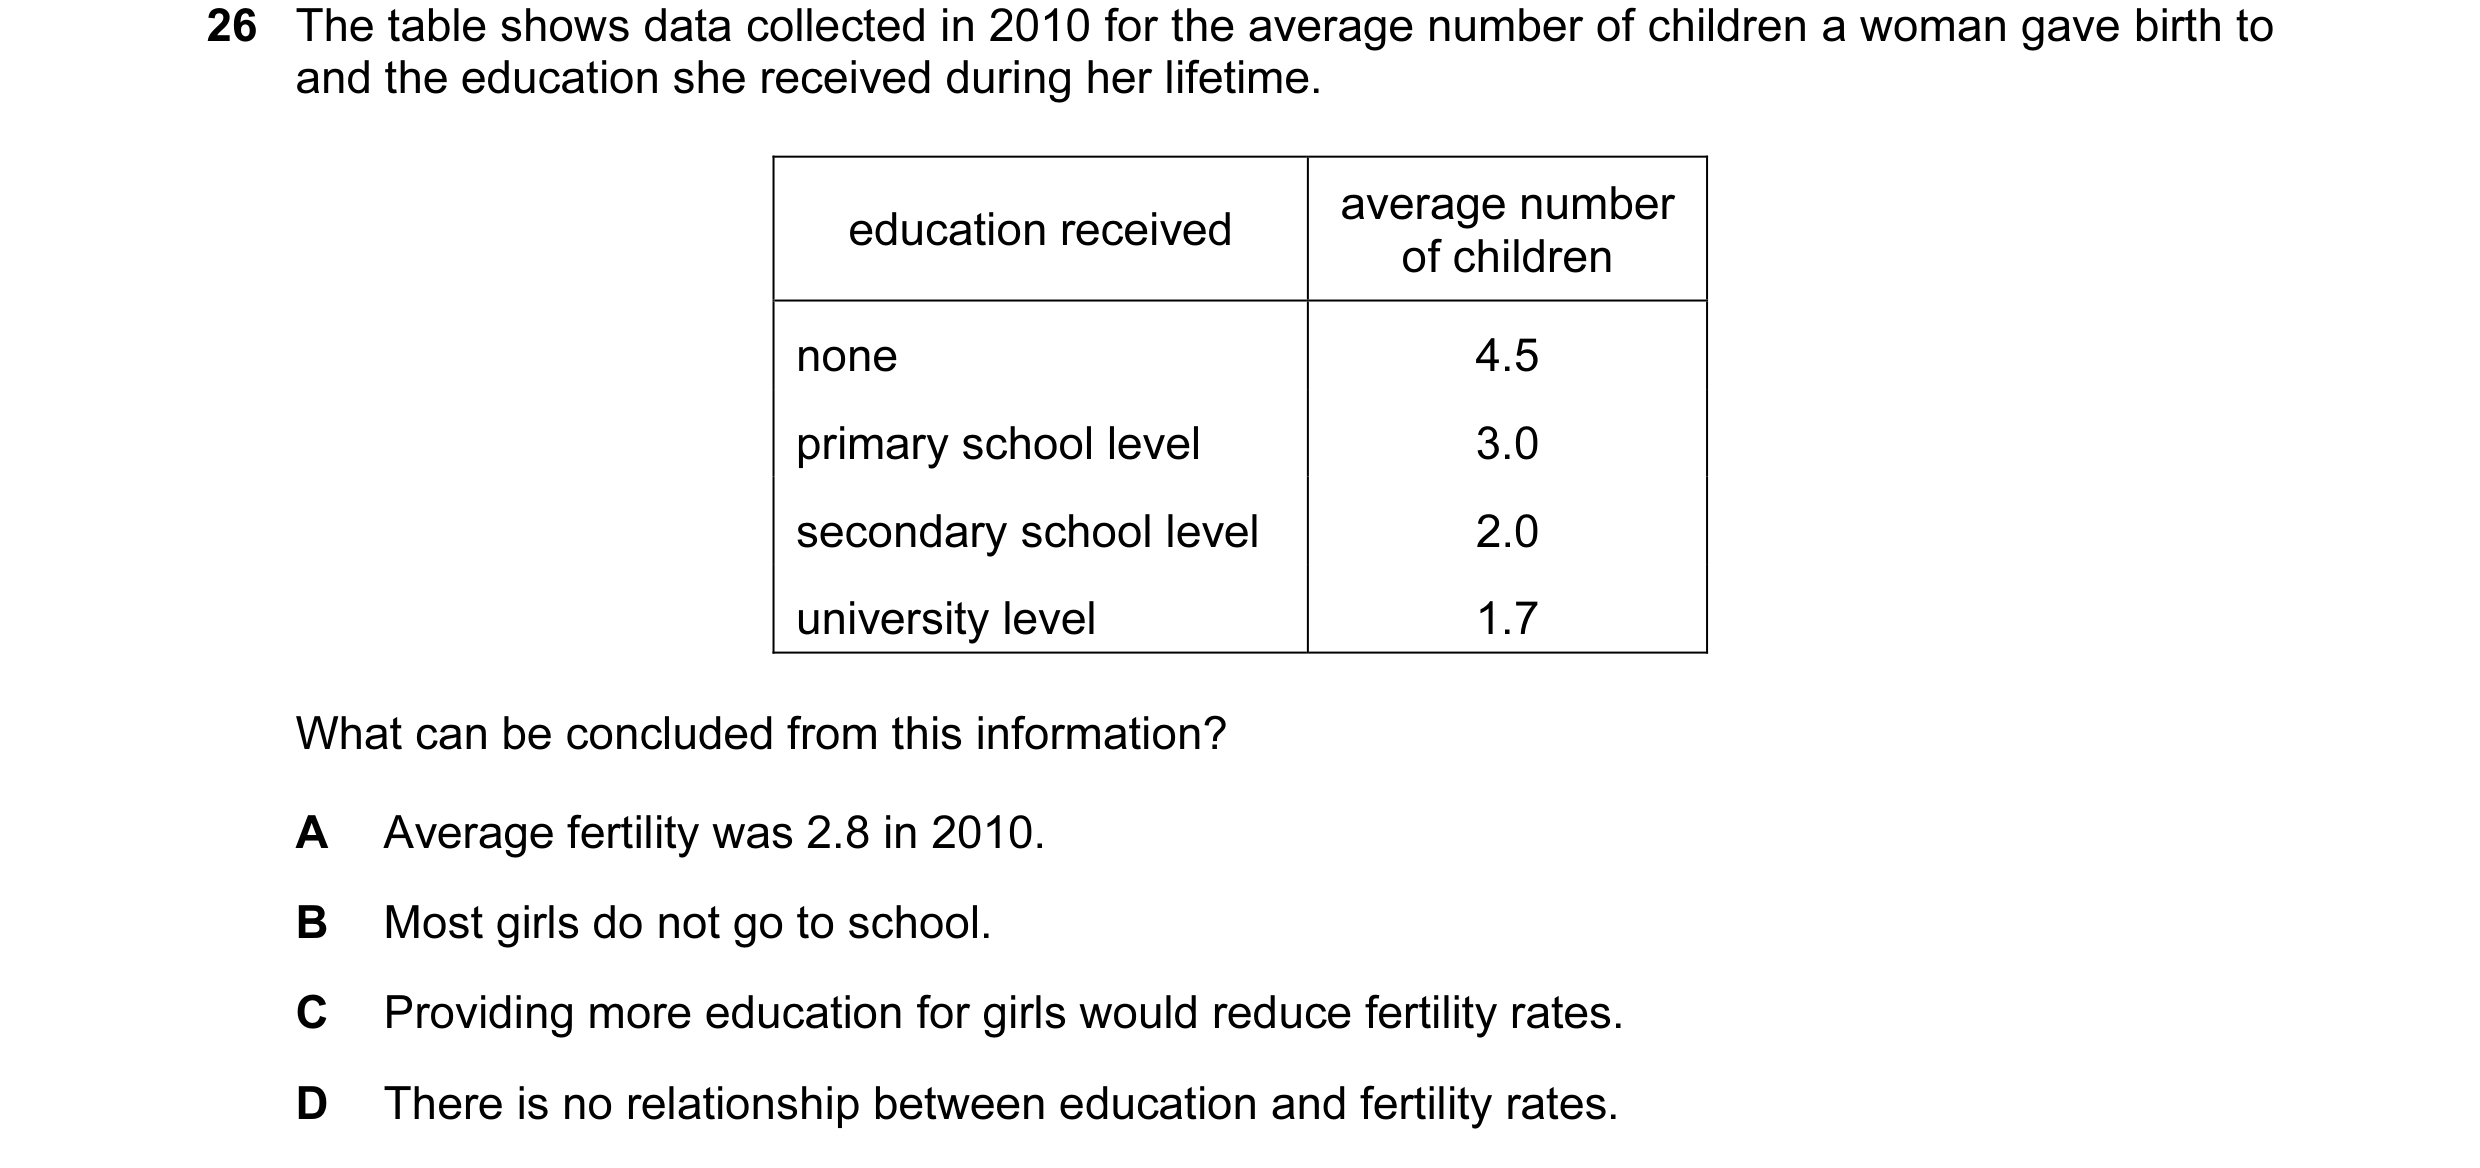
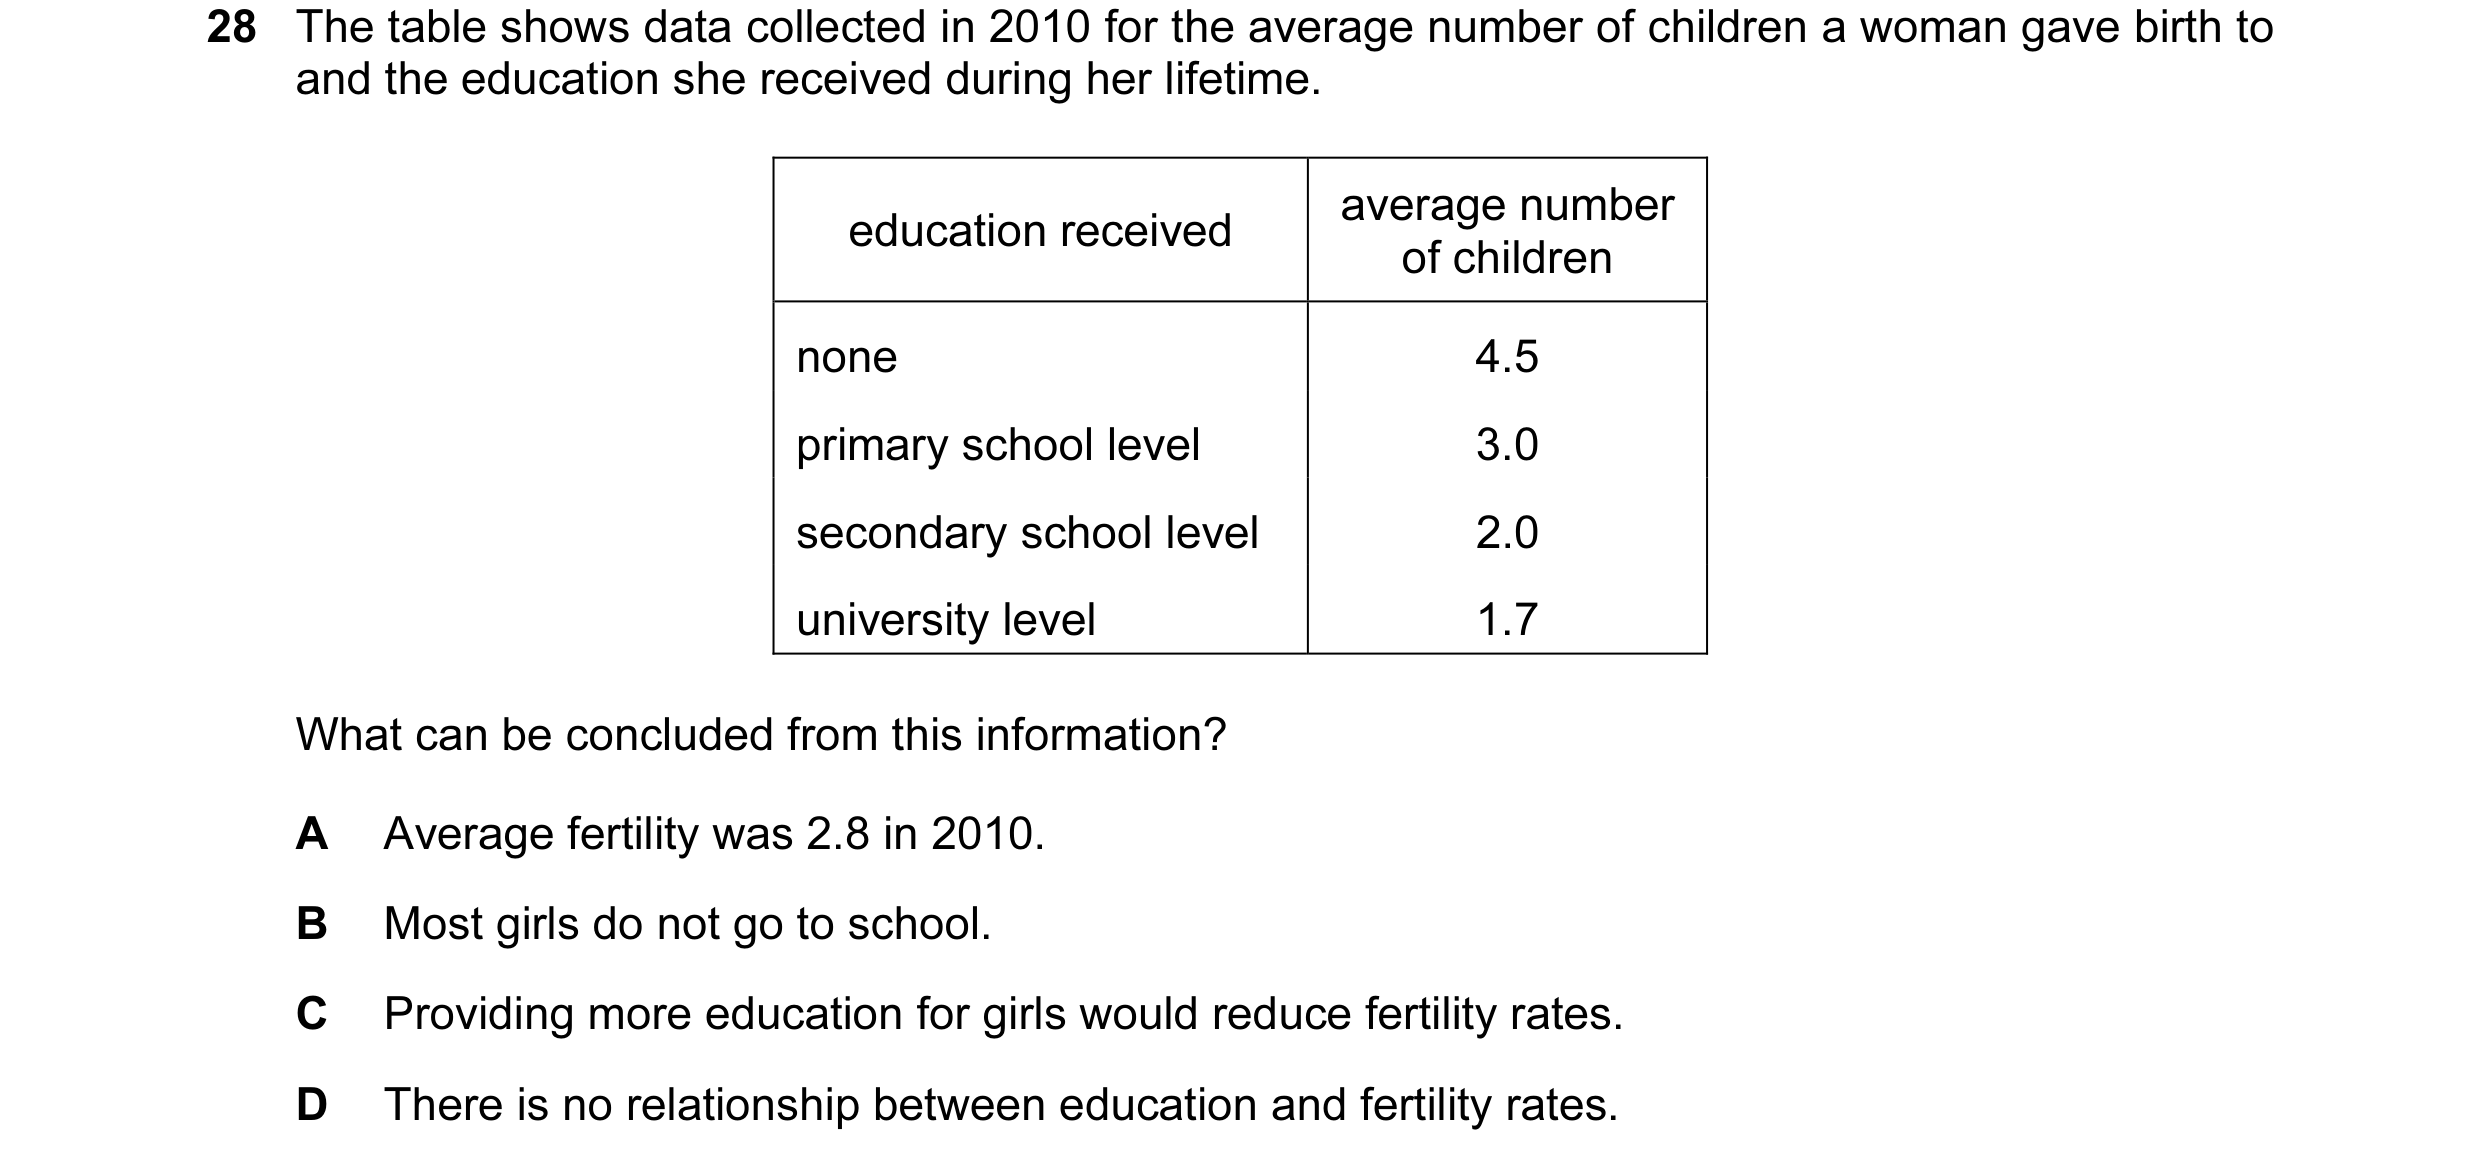
Q40 · The table shows data collected in 2010 for the average number of children a woman gave… 0455/11 May/June 2014
26 The table shows data collected in 2010 for the average number of children a woman gave birth to and the education she received during her lifetime. average number education received of children none 4.5 primary school level 3.0 secondary school level 2.0 university level 1.7 What can be concluded from this information? A Average fertility was 2.8 in 2010. B Most girls do not go to school. C Providing more education for girls would reduce fertility rates. D There is no relationship between education and fertility rates.
1 marks
Answer: C
This question in 0455/11 May/June 2014
Q41 · Which combination of influences must have occurred for a population to be falling when… 0455/12 May/June 2014
24 Which combination of influences must have occurred for a population to be falling when there is no migration? birth rate death rate fertility rate A falling falling falling B falling rising falling C falling rising rising D rising falling falling
1 marks
Answer: B
This question in 0455/12 May/June 2014
Q42 · The table shows data collected in 2010 for the average number of children a woman gave… 0455/13 May/June 2014
28 The table shows data collected in 2010 for the average number of children a woman gave birth to and the education she received during her lifetime. average number education received of children none 4.5 primary school level 3.0 secondary school level 2.0 university level 1.7 What can be concluded from this information? A Average fertility was 2.8 in 2010. B Most girls do not go to school. C Providing more education for girls would reduce fertility rates. D There is no relationship between education and fertility rates.
1 marks
Answer: C
This question in 0455/13 May/June 2014
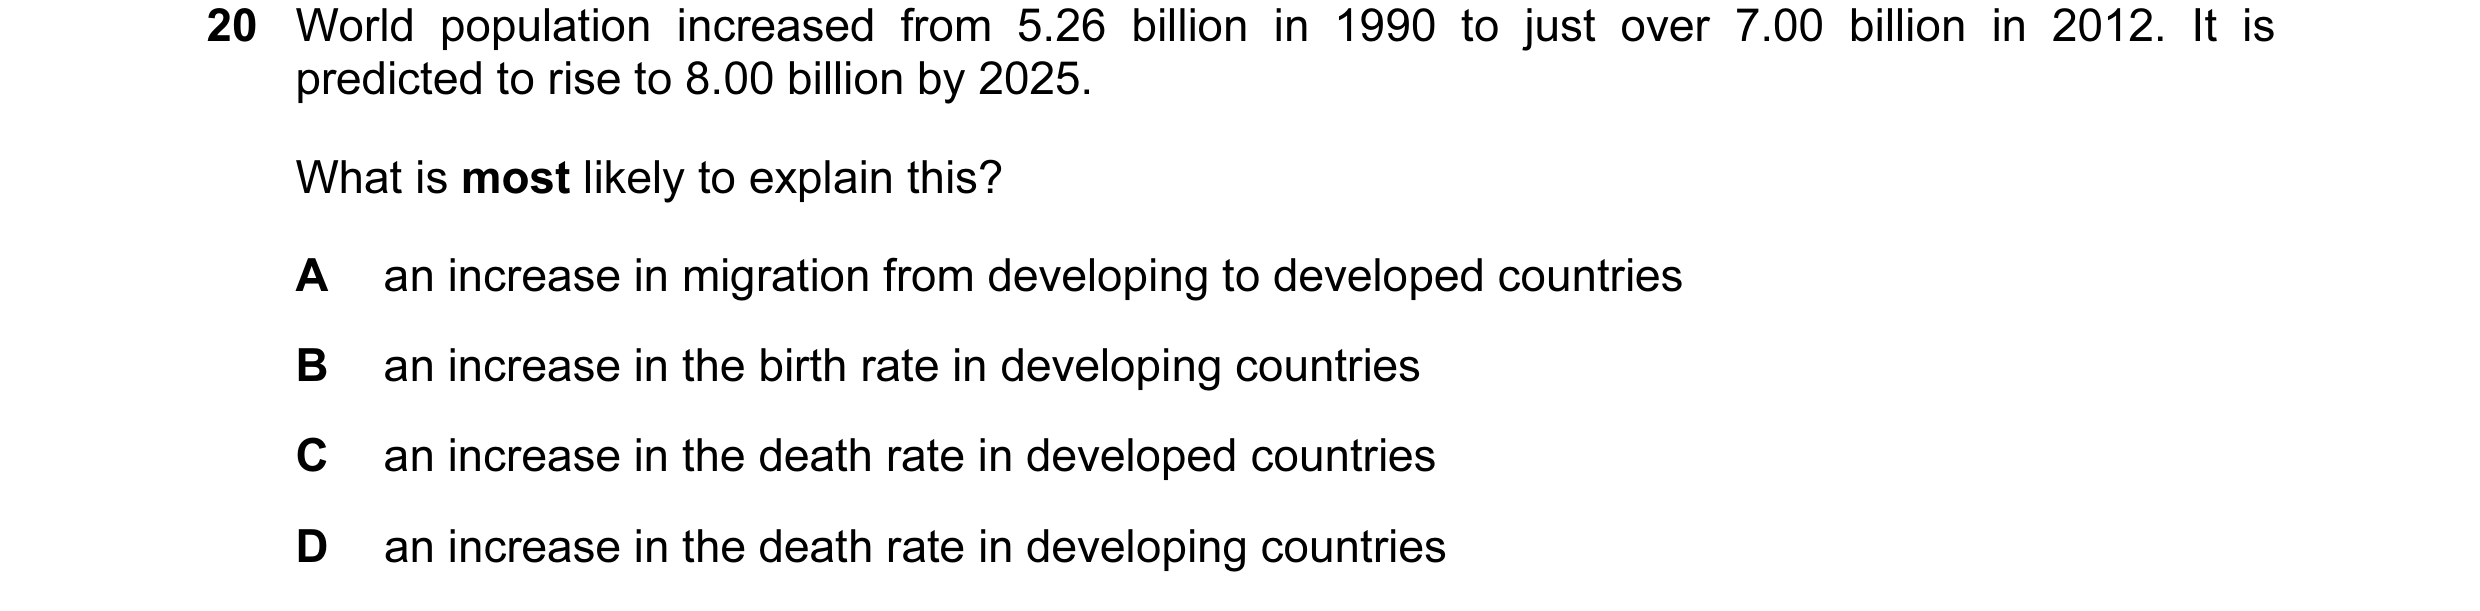
Q43 · World population increased from 5.26 billion in 1990 to just over 7.00 billion in 2012 0455/11 Oct/Nov 2014
20 World population increased from 5.26 billion in 1990 to just over 7.00 billion in 2012. It is predicted to rise to 8.00 billion by 2025. What is most likely to explain this? A an increase in migration from developing to developed countries B an increase in the birth rate in developing countries C an increase in the death rate in developed countries D an increase in the death rate in developing countries
1 marks
Answer: B
This question in 0455/11 Oct/Nov 2014
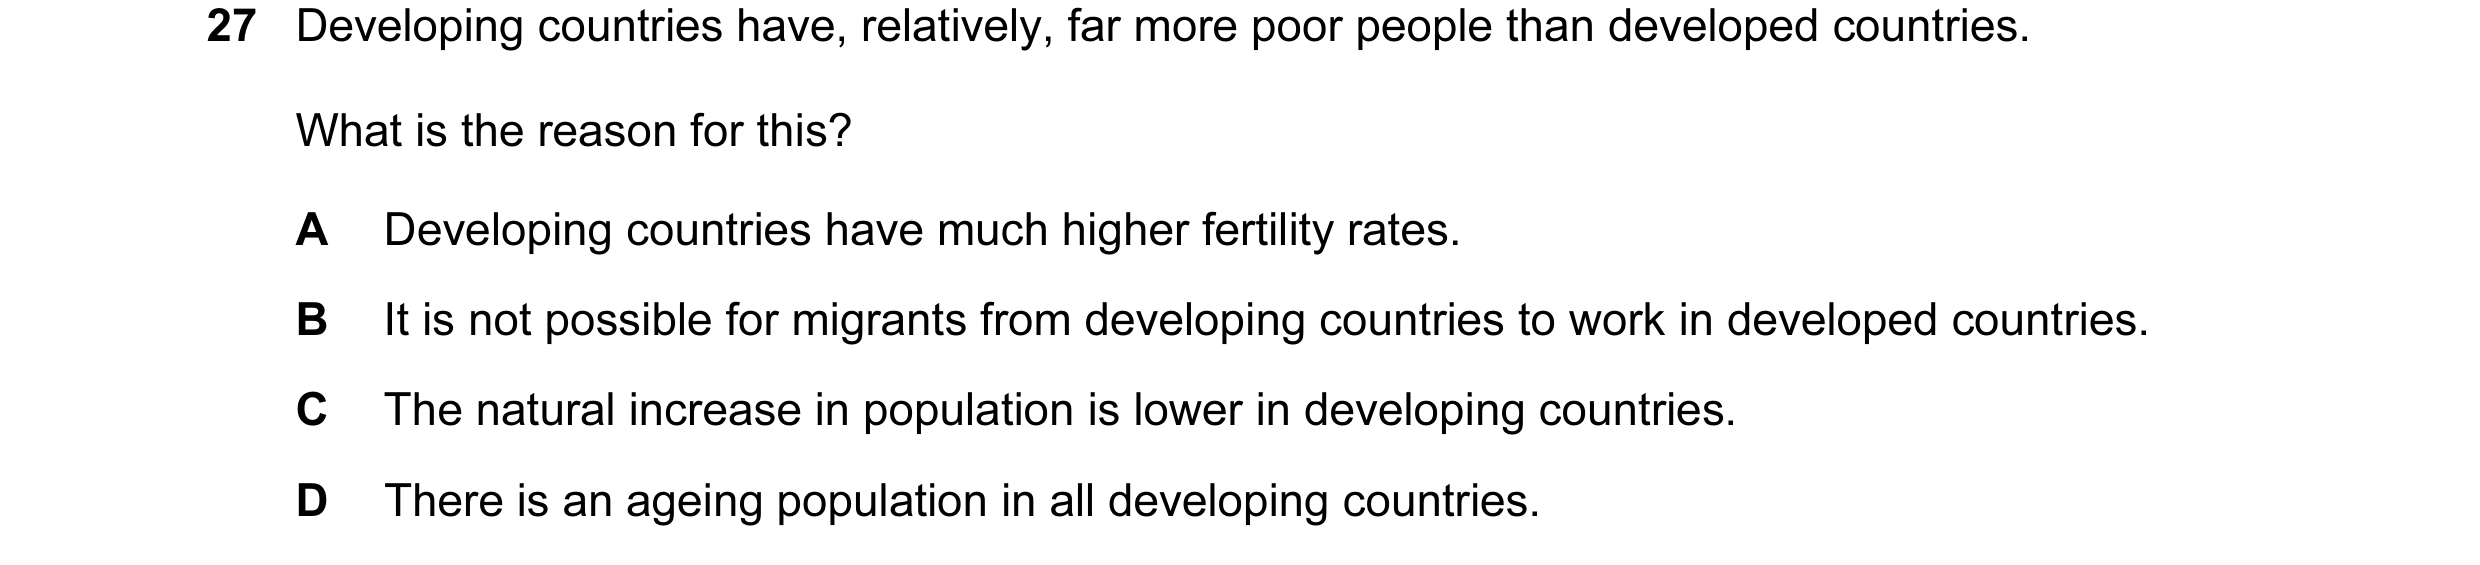
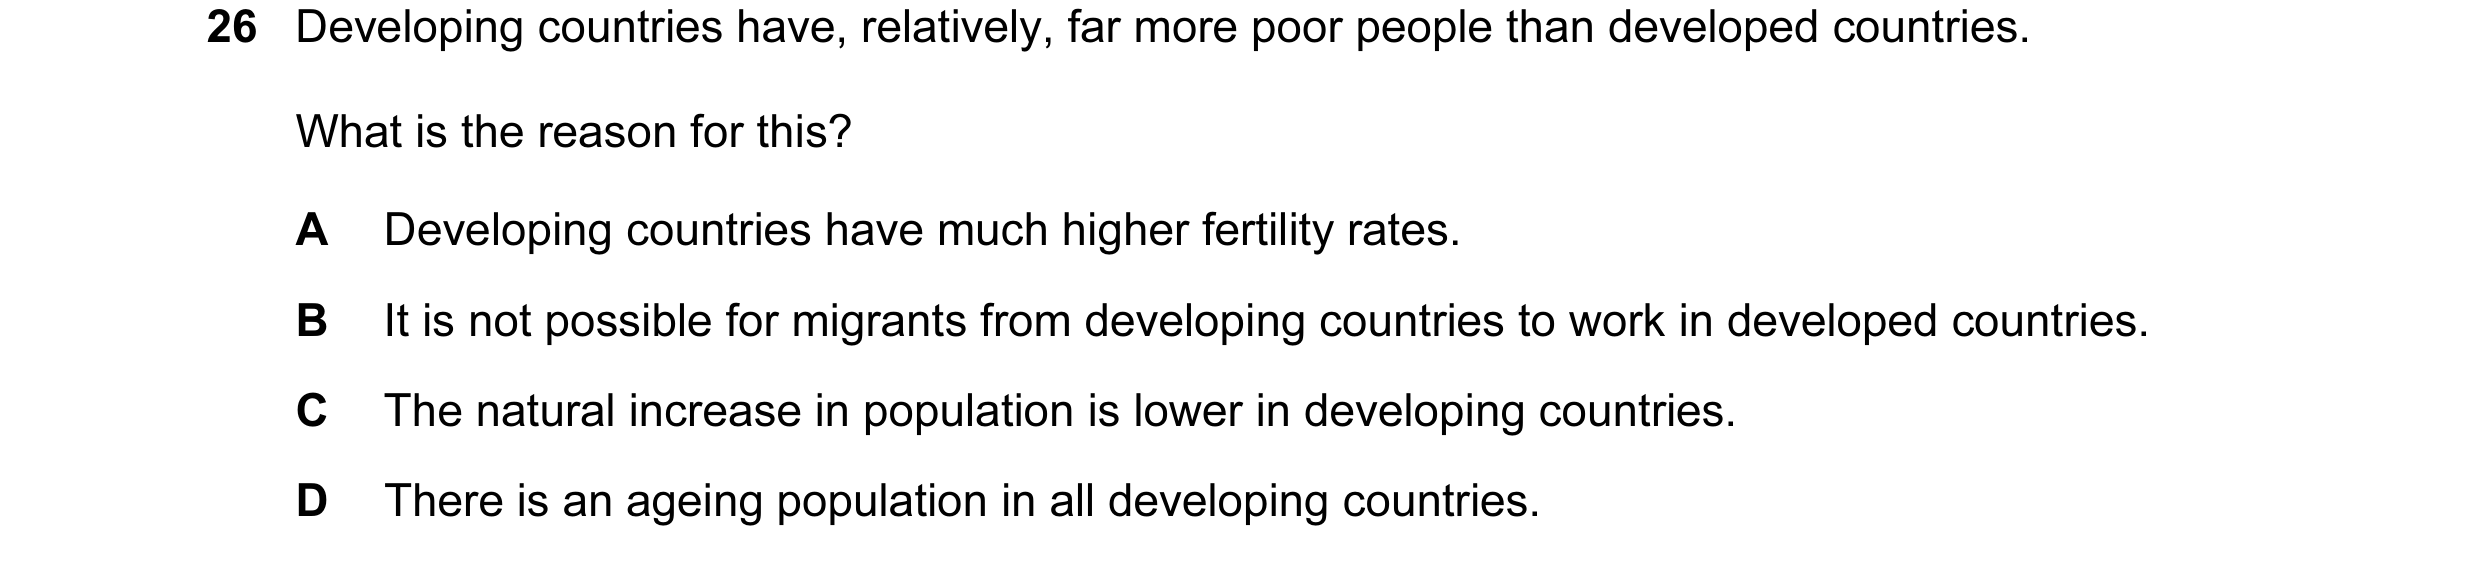
Q44 · Developing countries have, relatively, far more poor people than developed countries 0455/11 Oct/Nov 2014
27 Developing countries have, relatively, far more poor people than developed countries. What is the reason for this? A Developing countries have much higher fertility rates. B It is not possible for migrants from developing countries to work in developed countries. C The natural increase in population is lower in developing countries. D There is an ageing population in all developing countries.
1 marks
Answer: A
This question in 0455/11 Oct/Nov 2014
Q45 · World population increased from 5.26 billion in 1990 to just over 7.00 billion in 2012 0455/12 Oct/Nov 2014
21 World population increased from 5.26 billion in 1990 to just over 7.00 billion in 2012. It is predicted to rise to 8.00 billion by 2025. What is most likely to explain this? A an increase in migration from developing to developed countries B an increase in the birth rate in developing countries C an increase in the death rate in developed countries D an increase in the death rate in developing countries
1 marks
Answer: B
This question in 0455/12 Oct/Nov 2014
Q46 · Developing countries have, relatively, far more poor people than developed countries 0455/12 Oct/Nov 2014
26 Developing countries have, relatively, far more poor people than developed countries. What is the reason for this? A Developing countries have much higher fertility rates. B It is not possible for migrants from developing countries to work in developed countries. C The natural increase in population is lower in developing countries. D There is an ageing population in all developing countries.
1 marks
Answer: A
This question in 0455/12 Oct/Nov 2014
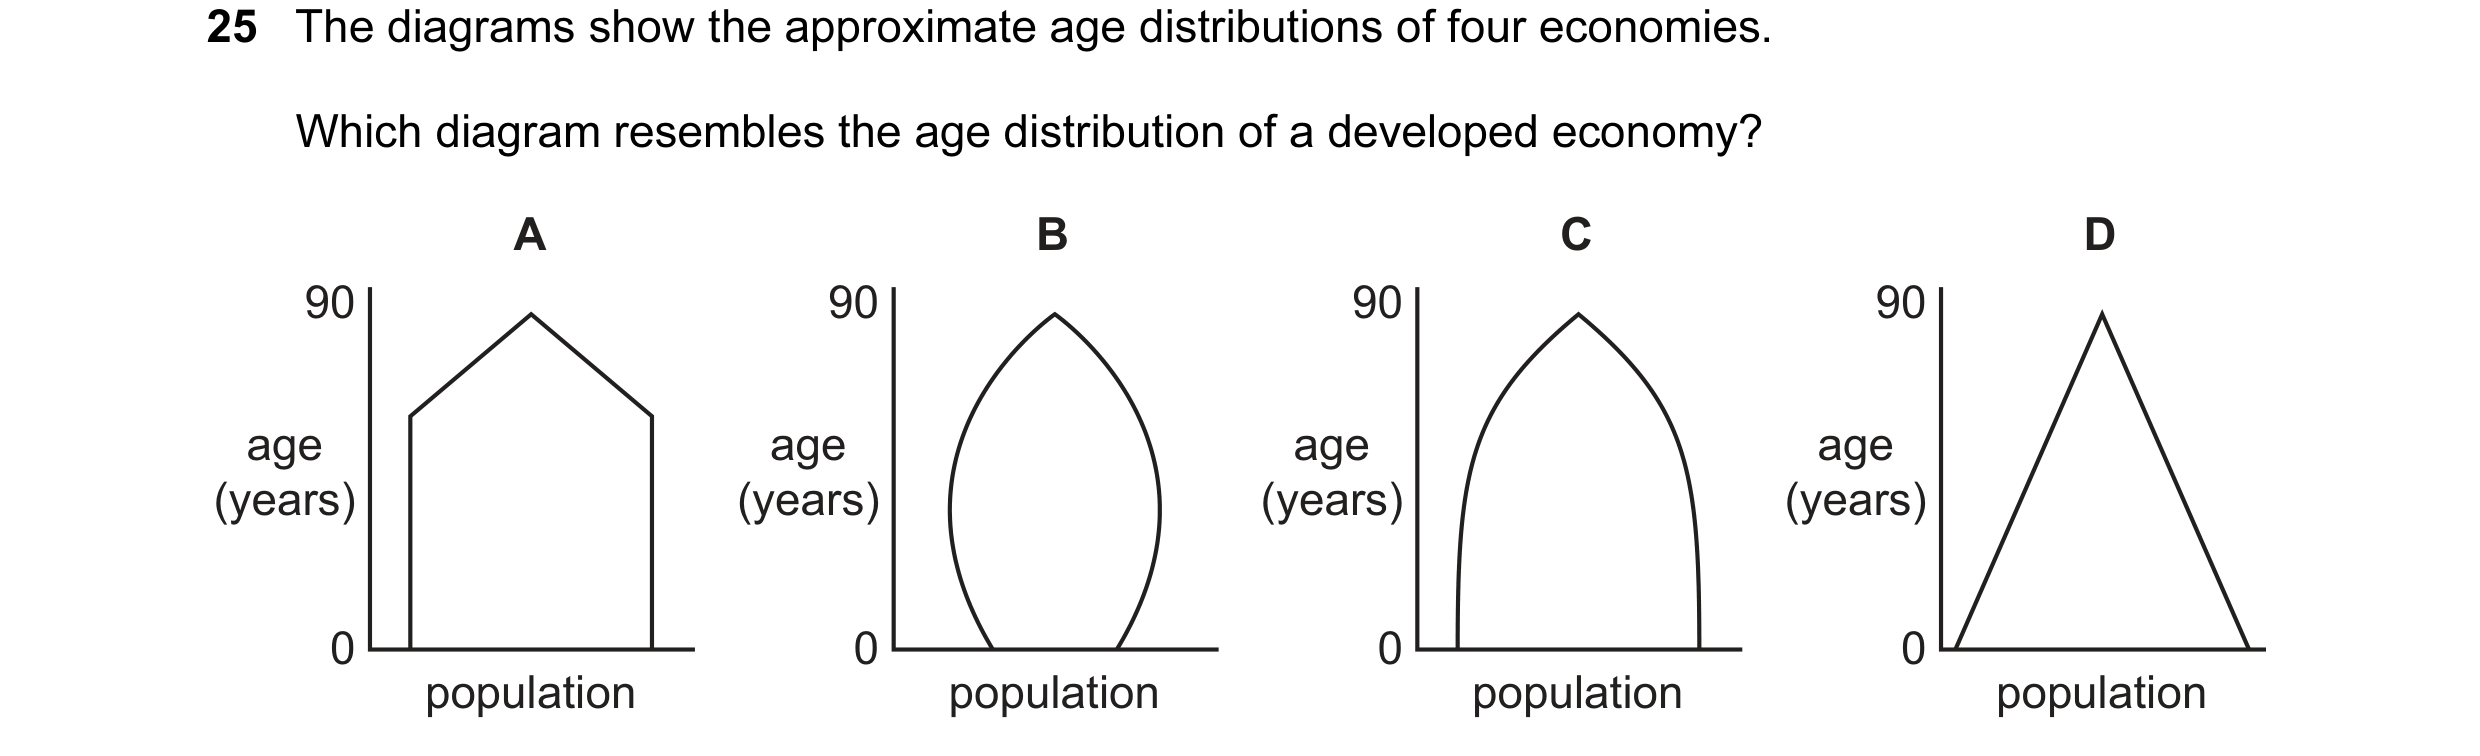
Q47 · The diagrams show the approximate age distributions of four economies 0455/13 Oct/Nov 2014
25 The diagrams show the approximate age distributions of four economies. Which diagram resembles the age distribution of a developed economy? A B C D 90 90 90 90 age age age age (years) (years) (years) (years) 0 0 0 0 population population population population
1 marks
Answer: B
This question in 0455/13 Oct/Nov 2014
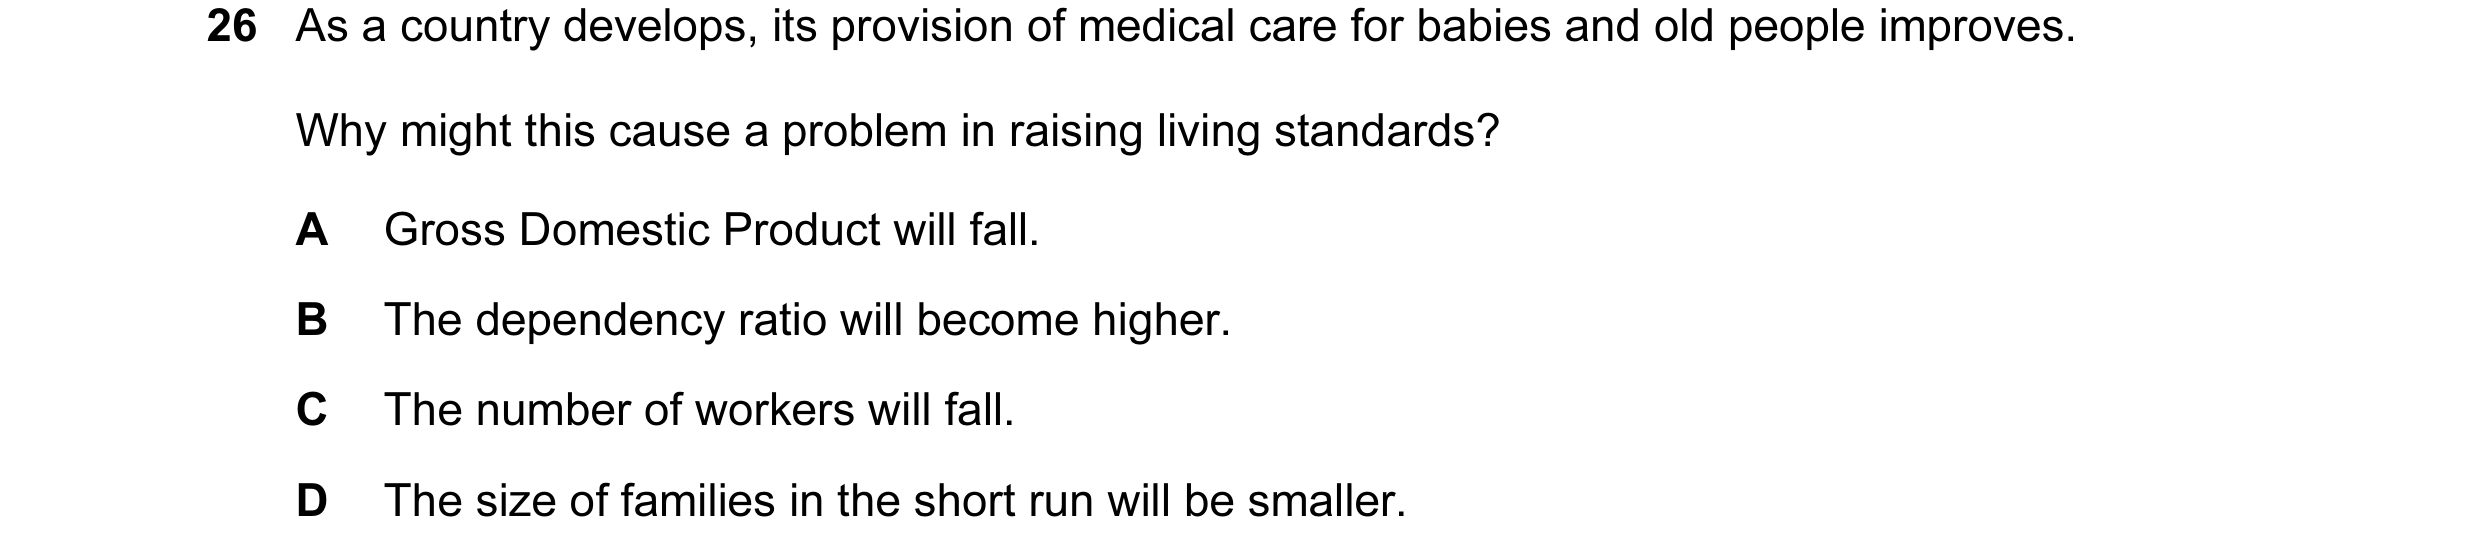
Q48 · As a country develops, its provision of medical care for babies and old people improves 0455/13 Oct/Nov 2014
26 As a country develops, its provision of medical care for babies and old people improves. Why might this cause a problem in raising living standards? A Gross Domestic Product will fall. B The dependency ratio will become higher. C The number of workers will fall. D The size of families in the short run will be smaller.
1 marks
Answer: B
This question in 0455/13 Oct/Nov 2014
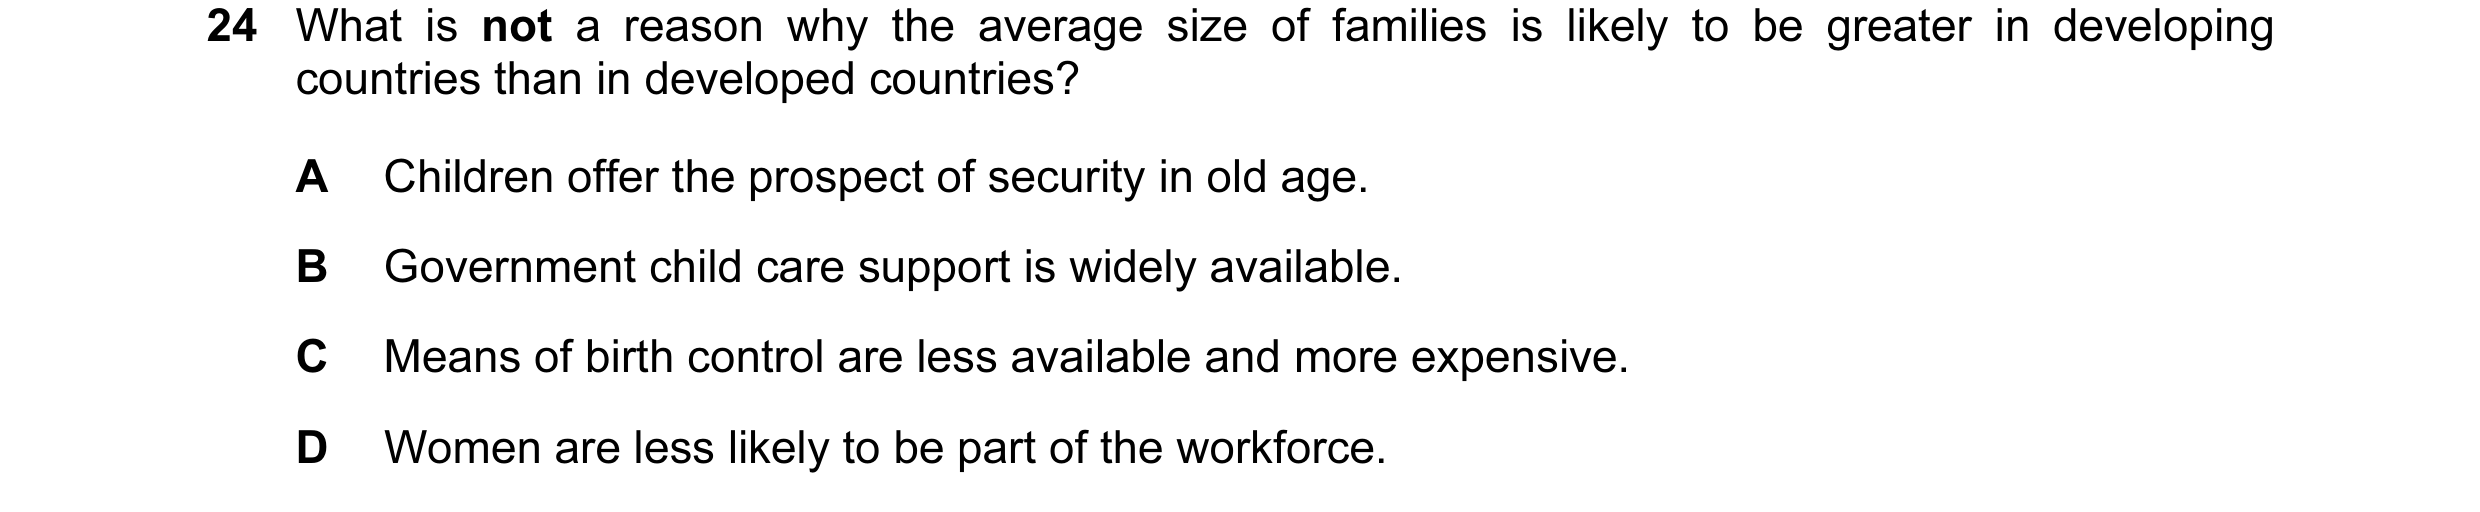
Q49 · What is not a reason why the average size of families is likely to be greater in… 0455/11 May/June 2015
24 What is not a reason why the average size of families is likely to be greater in developing countries than in developed countries? A Children offer the prospect of security in old age. B Government child care support is widely available. C Means of birth control are less available and more expensive. D Women are less likely to be part of the workforce.
1 marks
Answer: B
This question in 0455/11 May/June 2015
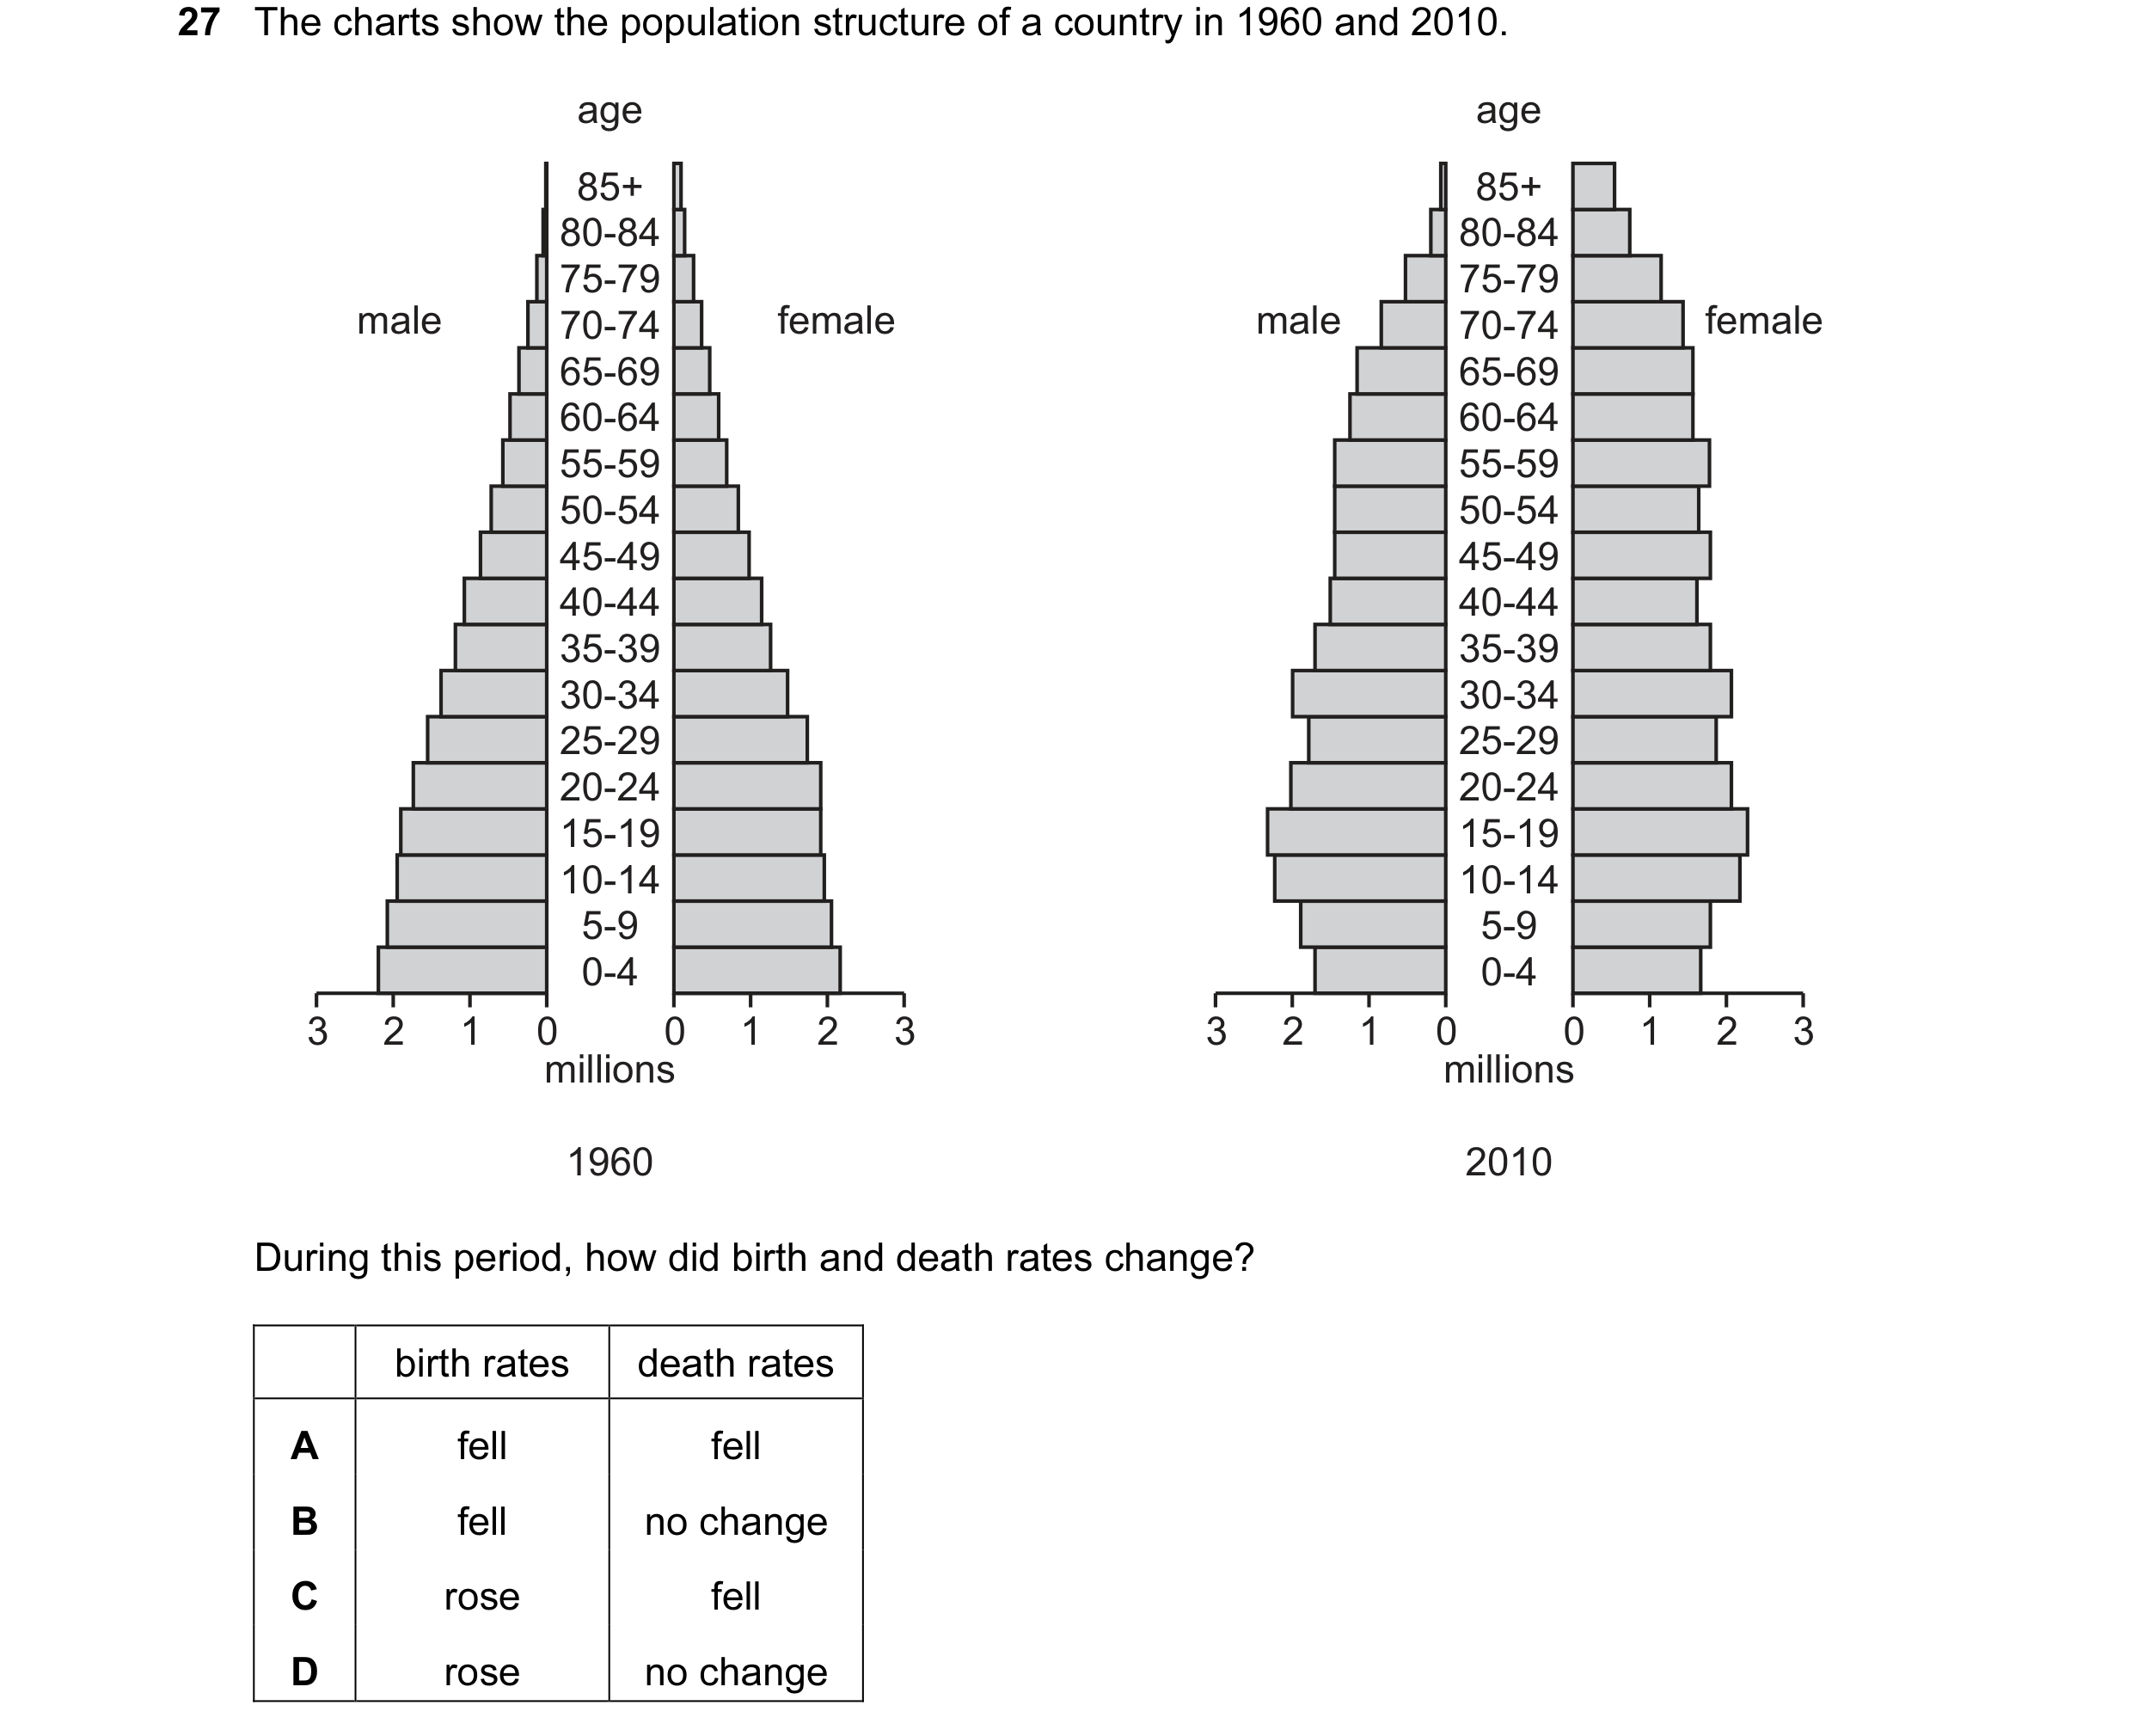
Q50 · The charts show the population structure of a country in 1960 and 2010 0455/11 May/June 2015
27 The charts show the population structure of a country in 1960 and 2010. age age 85+ 85+ 80-84 80-84 75-79 75-79 male 70-74 female male 70-74 female 65-69 65-69 60-64 60-64 55-59 55-59 50-54 50-54 45-49 45-49 40-44 40-44 35-39 35-39 30-34 30-34 25-29 25-29 20-24 20-24 15-19 15-19 10-14 10-14 5-9 5-9 0-4 0-4 3 2 1 0 0 1 2 3 3 2 1 0 0 1 2 3 millions millions 1960 2010 During this period, how did birth and death rates change? birth rates death rates A fell fell B fell no change C rose fell D rose no change
1 marks
Answer: A
This question in 0455/11 May/June 2015
Q51 · The charts show the population structure of a country in 1960 and 2010 0455/12 May/June 2015
26 The charts show the population structure of a country in 1960 and 2010. age age 85+ 85+ 80-84 80-84 75-79 75-79 male 70-74 female male 70-74 female 65-69 65-69 60-64 60-64 55-59 55-59 50-54 50-54 45-49 45-49 40-44 40-44 35-39 35-39 30-34 30-34 25-29 25-29 20-24 20-24 15-19 15-19 10-14 10-14 5-9 5-9 0-4 0-4 3 2 1 0 0 1 2 3 3 2 1 0 0 1 2 3 millions millions 1960 2010 During this period, how did birth and death rates change? birth rates death rates A fell fell B fell no change C rose fell D rose no change
1 marks
Answer: A
This question in 0455/12 May/June 2015
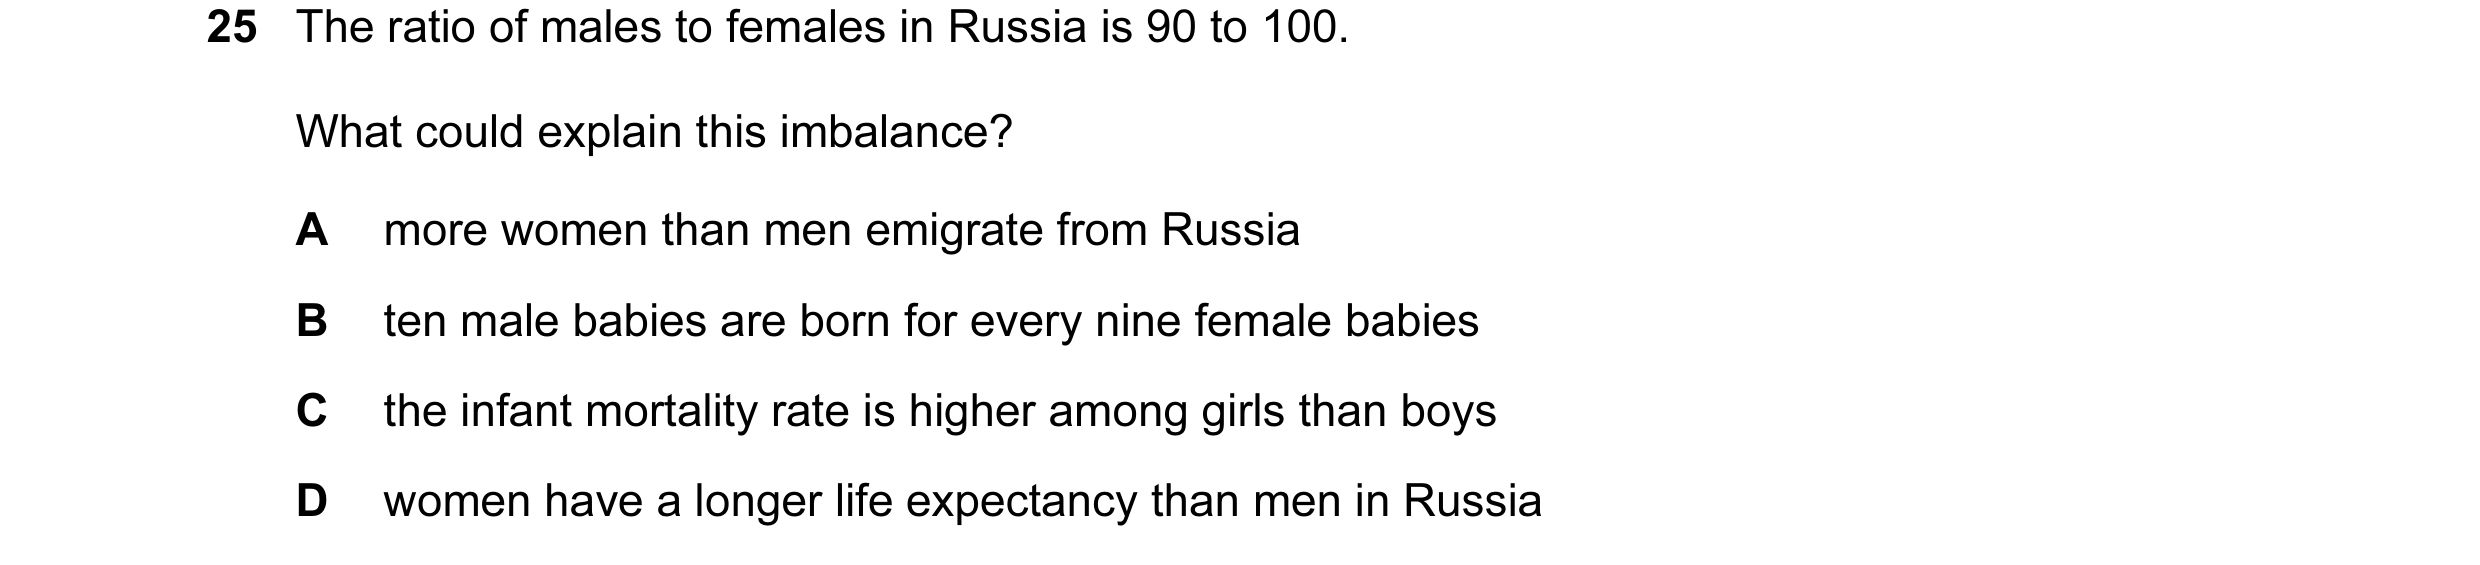
Q52 · The ratio of males to females in Russia is 90 to 100 0455/13 May/June 2015
25 The ratio of males to females in Russia is 90 to 100. What could explain this imbalance? A more women than men emigrate from Russia B ten male babies are born for every nine female babies C the infant mortality rate is higher among girls than boys D women have a longer life expectancy than men in Russia
1 marks
Answer: D
This question in 0455/13 May/June 2015
Q53 · The charts show the population structure of a country in 1960 and 2010 0455/13 May/June 2015
27 The charts show the population structure of a country in 1960 and 2010. age age 85+ 85+ 80-84 80-84 75-79 75-79 male 70-74 female male 70-74 female 65-69 65-69 60-64 60-64 55-59 55-59 50-54 50-54 45-49 45-49 40-44 40-44 35-39 35-39 30-34 30-34 25-29 25-29 20-24 20-24 15-19 15-19 10-14 10-14 5-9 5-9 0-4 0-4 3 2 1 0 0 1 2 3 3 2 1 0 0 1 2 3 millions millions 1960 2010 During this period, how did birth and death rates change? birth rates death rates A fell fell B fell no change C rose fell D rose no change
1 marks
Answer: A
This question in 0455/13 May/June 2015
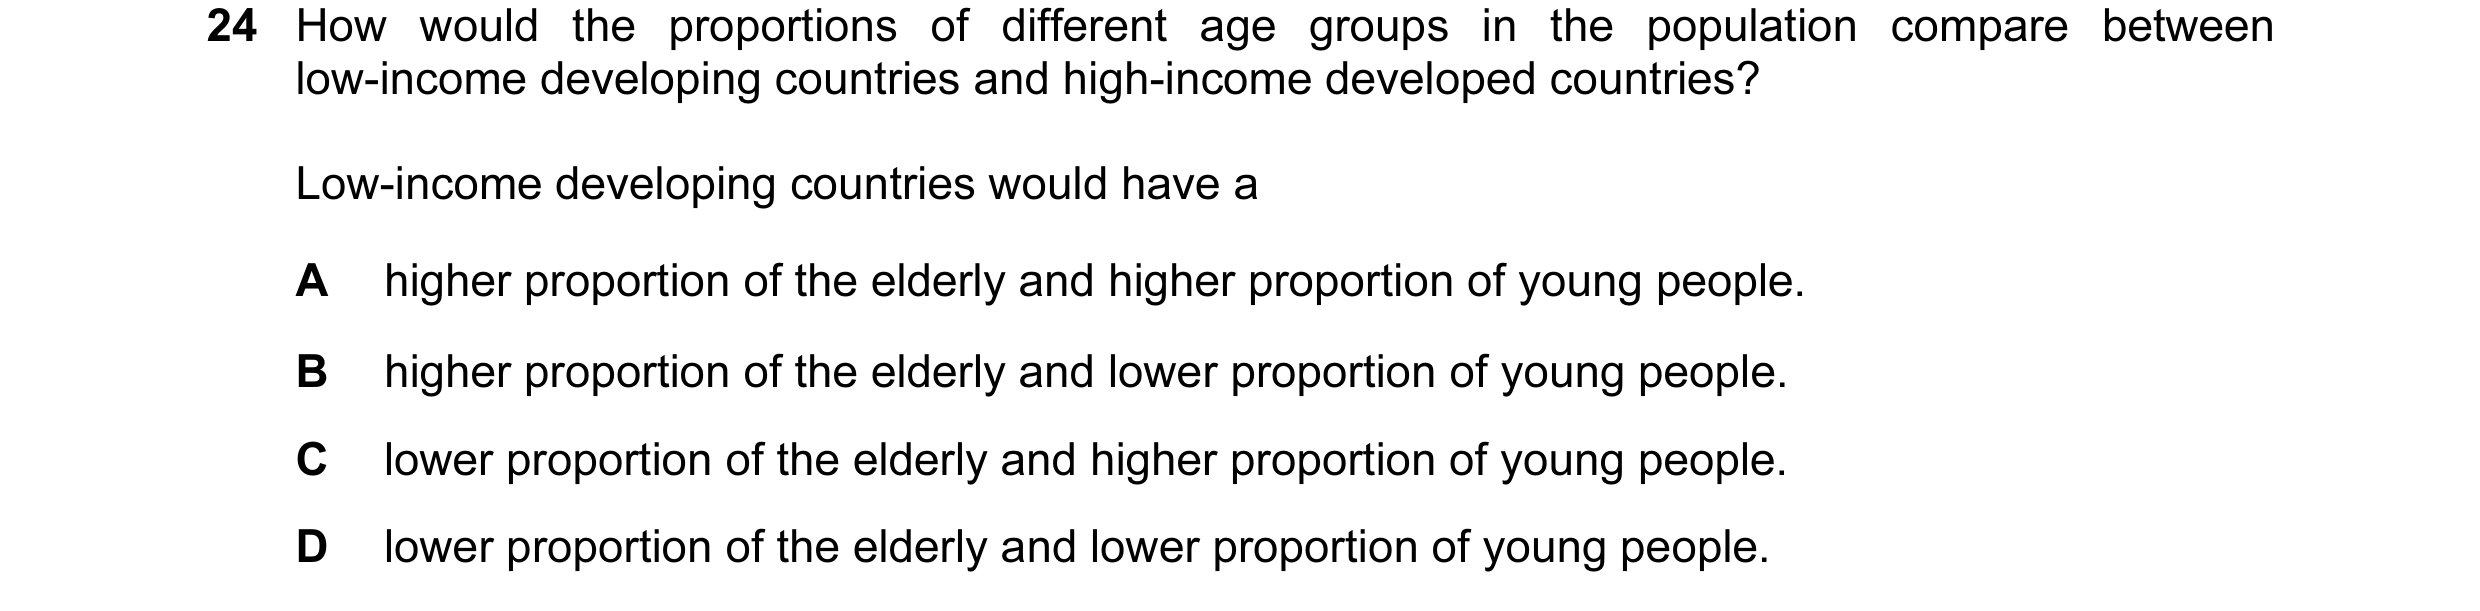
Q54 · How would the proportions of different age groups in the population compare between… 0455/11 Oct/Nov 2015
24 How would the proportions of different age groups in the population compare between low-income developing countries and high-income developed countries? Low-income developing countries would have a A higher proportion of the elderly and higher proportion of young people. B higher proportion of the elderly and lower proportion of young people. C lower proportion of the elderly and higher proportion of young people. D lower proportion of the elderly and lower proportion of young people.
1 marks
Answer: C
This question in 0455/11 Oct/Nov 2015
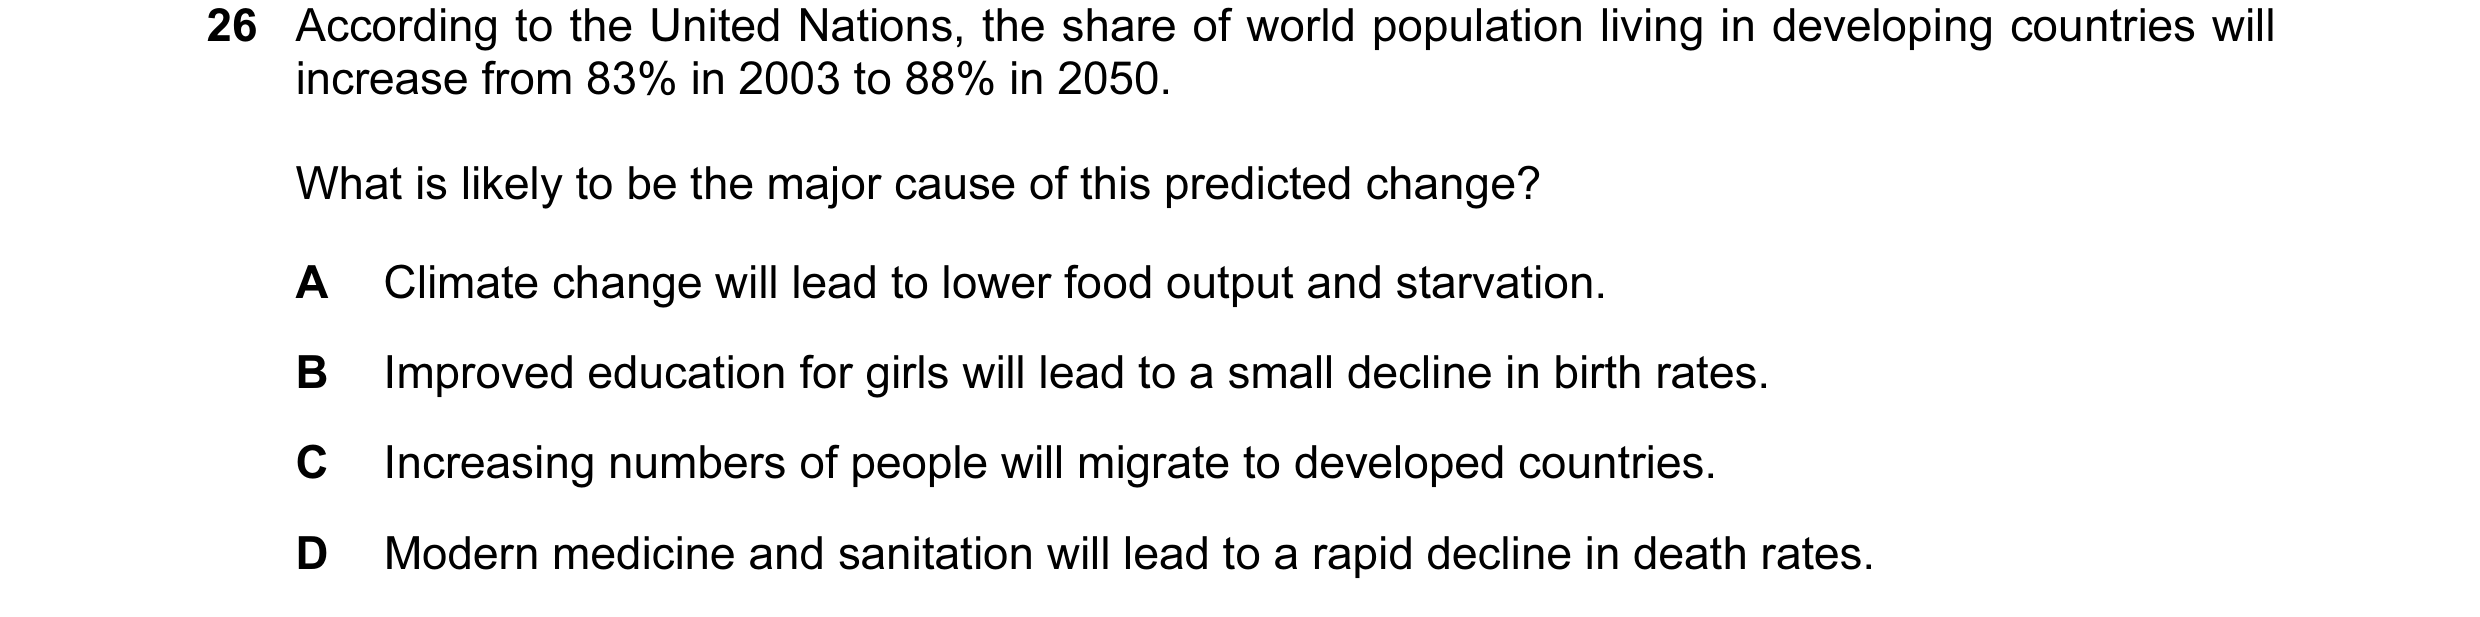
Q55 · According to the United Nations, the share of world population living in developing… 0455/12 Oct/Nov 2015
26 According to the United Nations, the share of world population living in developing countries will increase from 83% in 2003 to 88% in 2050. What is likely to be the major cause of this predicted change? A Climate change will lead to lower food output and starvation. B Improved education for girls will lead to a small decline in birth rates. C Increasing numbers of people will migrate to developed countries. D Modern medicine and sanitation will lead to a rapid decline in death rates.
1 marks
Answer: D
This question in 0455/12 Oct/Nov 2015
Q56 · In many developing economies there is a high rate of population growth 0455/12 Feb/March 2016
24 In many developing economies there is a high rate of population growth. What is a cause of this? A Jobseekers migrate from rural to urban centres. B Poor people have many children to provide labour on family farms. C There is increased resistance to life saving drugs. D There is not enough clean water.
1 marks
Answer: B
This question in 0455/12 Feb/March 2016
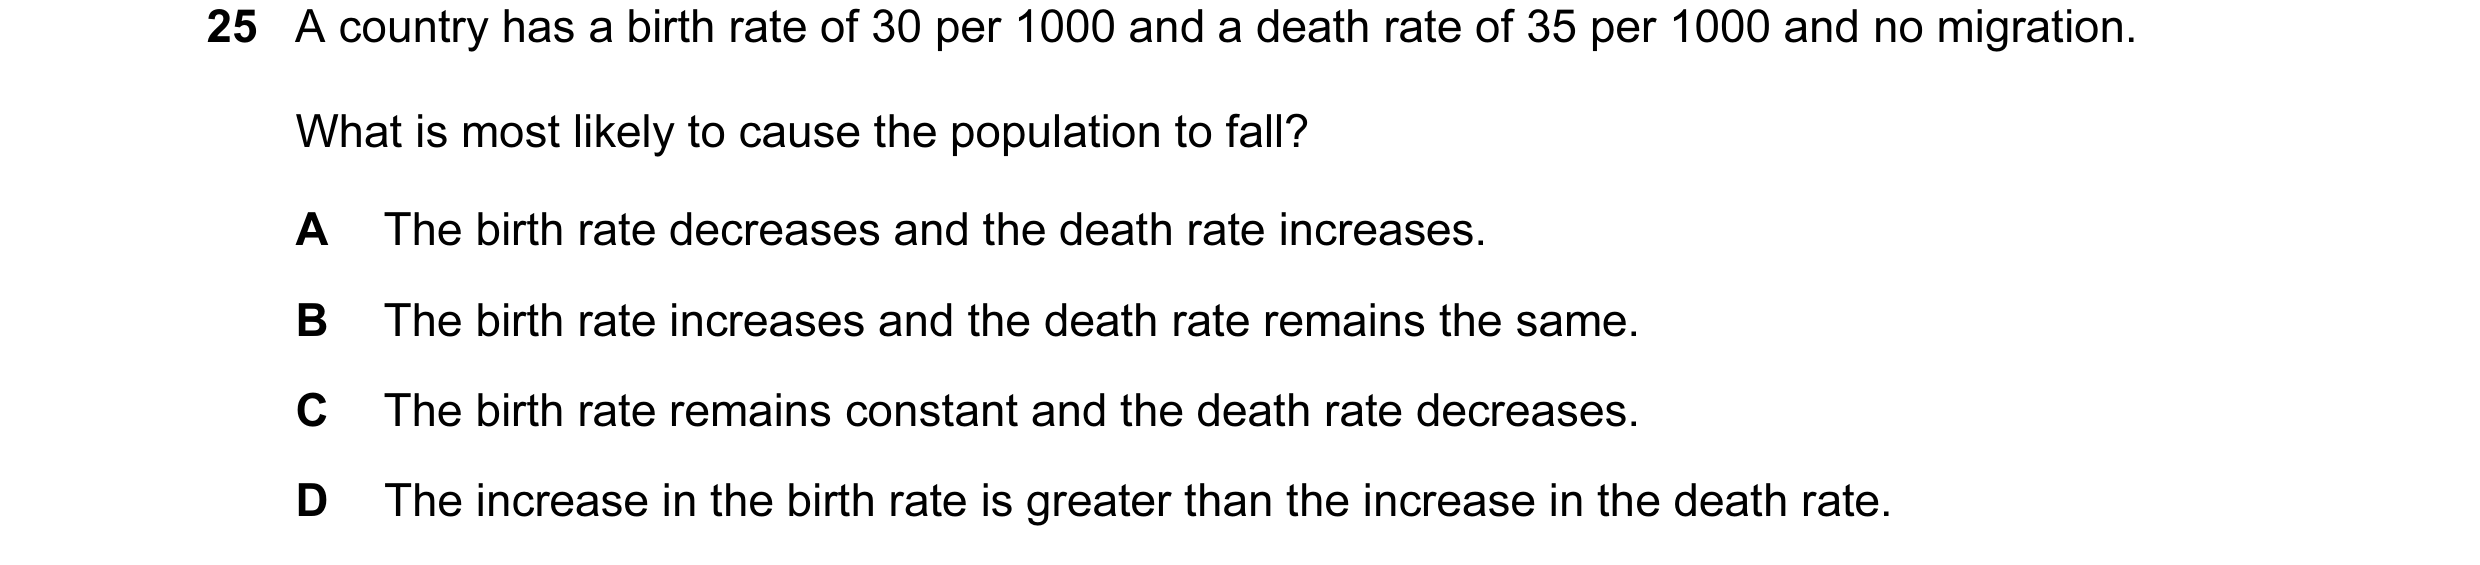
Q57 · A country has a birth rate of 30 per 1000 and a death rate of 35 per 1000 and no migration 0455/12 Feb/March 2016
25 A country has a birth rate of 30 per 1000 and a death rate of 35 per 1000 and no migration. What is most likely to cause the population to fall? A The birth rate decreases and the death rate increases. B The birth rate increases and the death rate remains the same. C The birth rate remains constant and the death rate decreases. D The increase in the birth rate is greater than the increase in the death rate.
1 marks
Answer: A
This question in 0455/12 Feb/March 2016
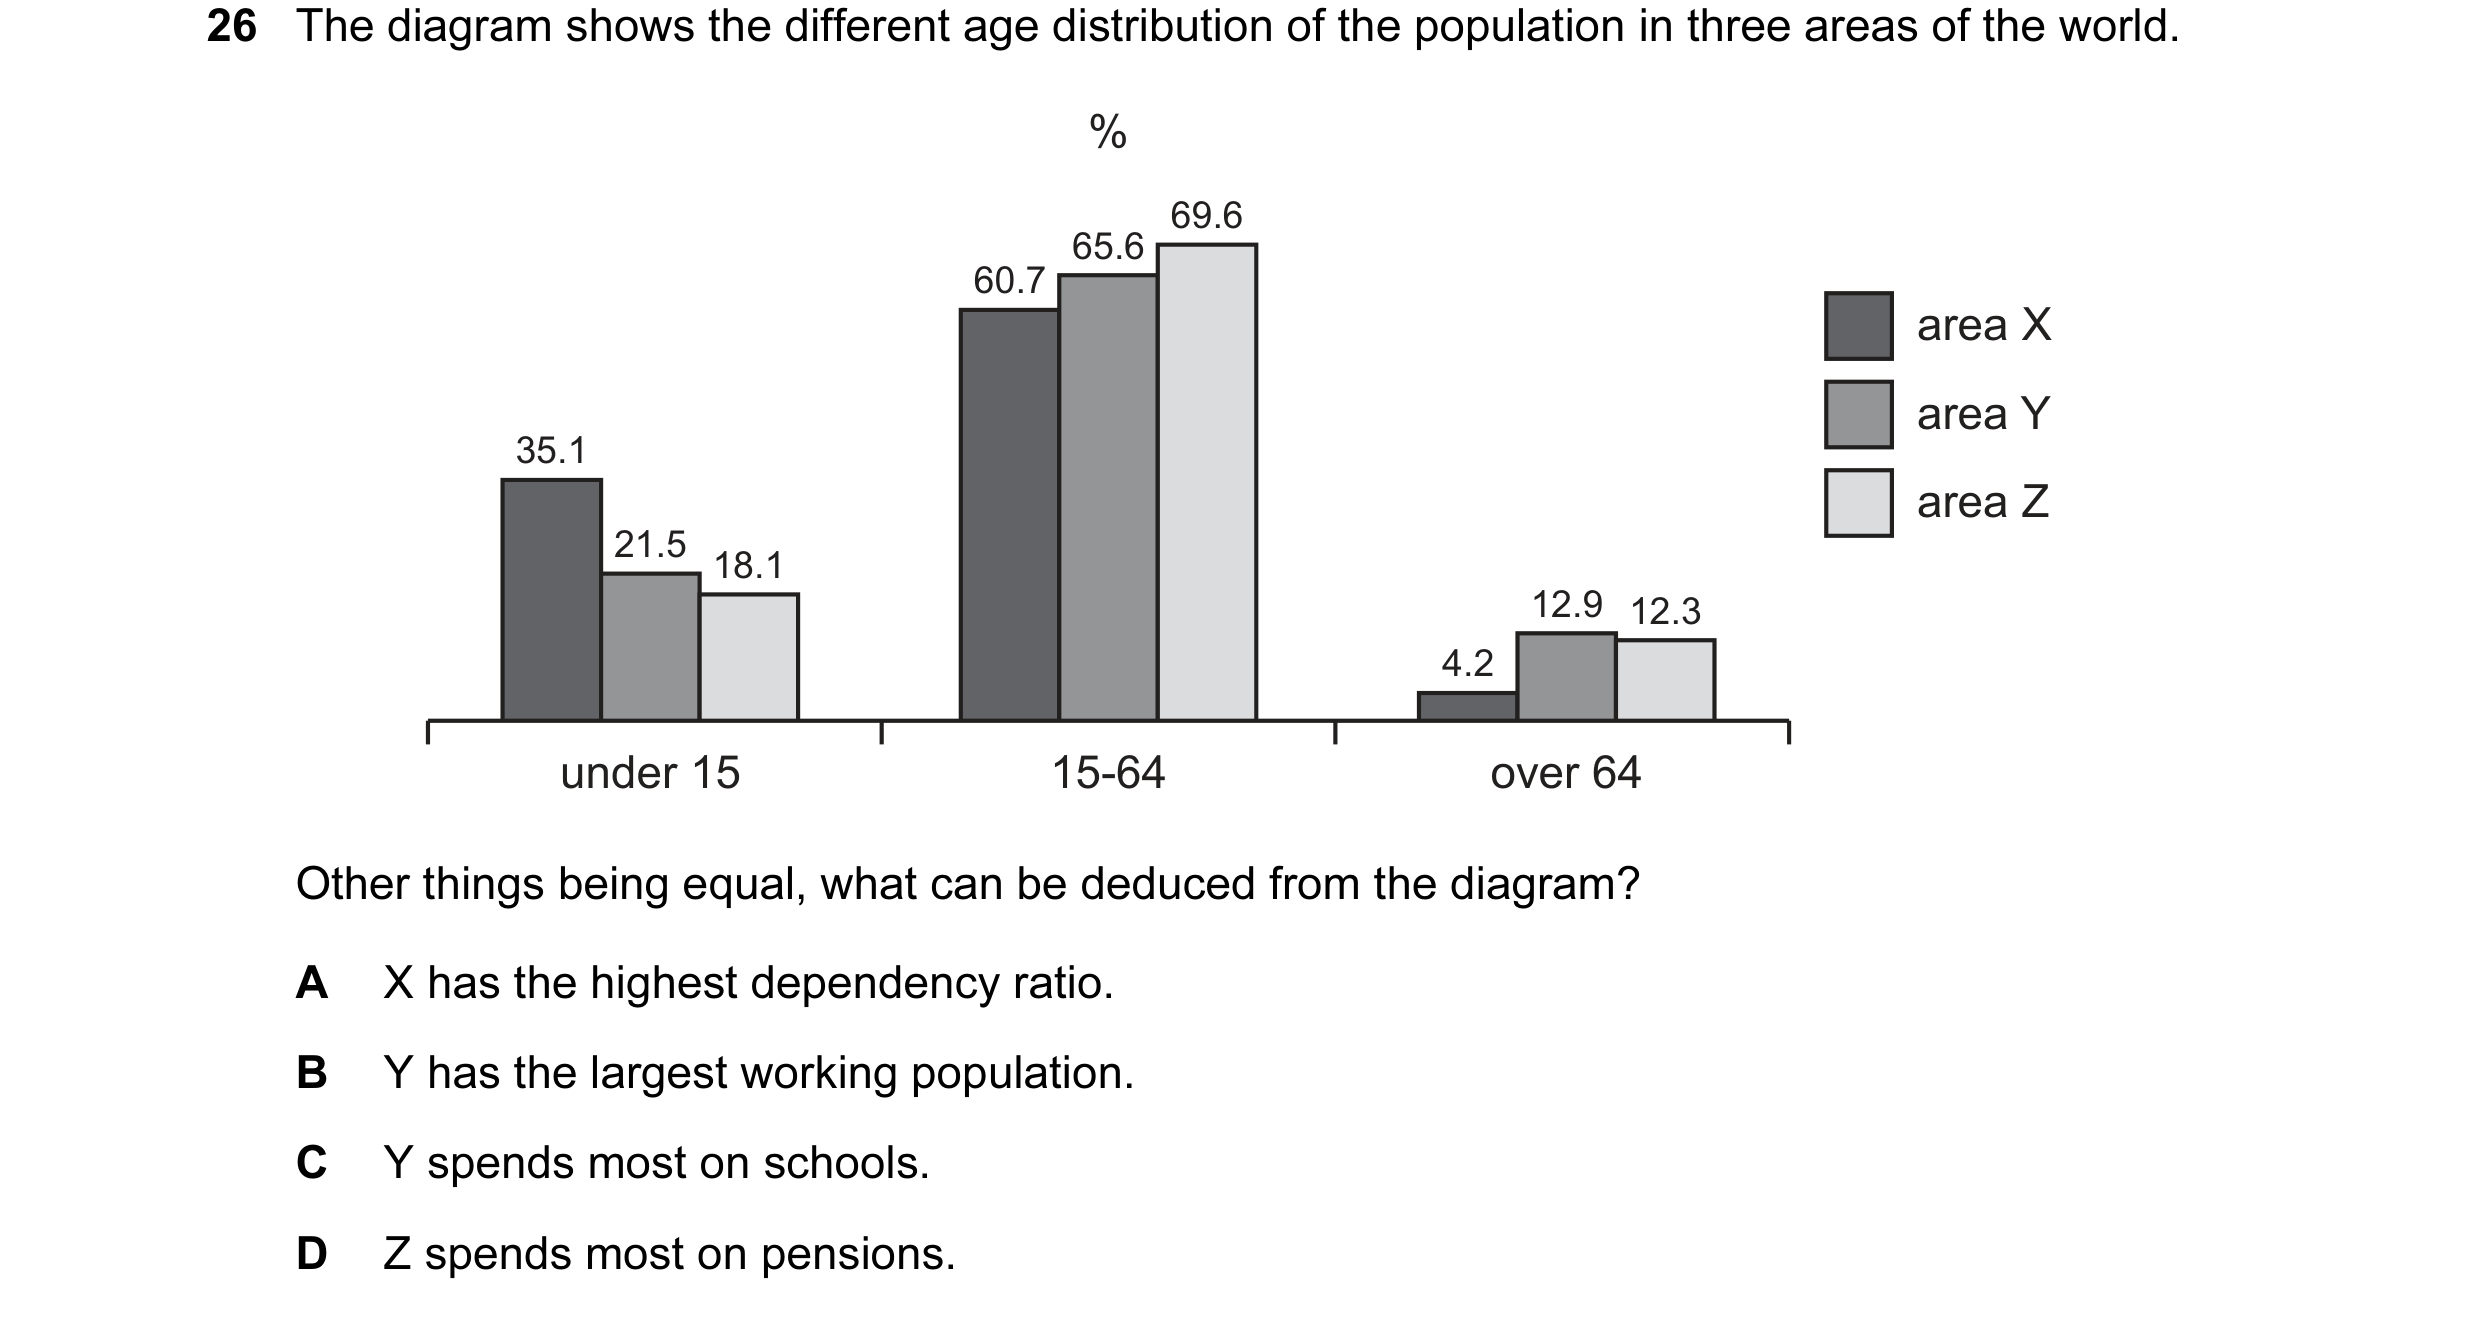
Q58 · The diagram shows the different age distribution of the population in three areas of the… 0455/12 Feb/March 2016
26 The diagram shows the different age distribution of the population in three areas of the world. % 69.6 65.6 60.7 area X area Y 35.1 area Z 21.5 18.1 12.9 12.3 4.2 under 15 15-64 over 64 Other things being equal, what can be deduced from the diagram? A X has the highest dependency ratio. B Y has the largest working population. C Y spends most on schools. D Z spends most on pensions.
1 marks
Answer: A
This question in 0455/12 Feb/March 2016
Q59 · What is Gross Domestic Product (GDP) divided by to calculate GDP per head? 0455/11 May/June 2016
20 What is Gross Domestic Product (GDP) divided by to calculate GDP per head? A net migration B the birth rate C the total population D the working population
1 marks
Answer: C
This question in 0455/11 May/June 2016
Q60 · It has been predicted that by 2050 China will have 53 million fewer children under 14… 0455/11 May/June 2016
26 It has been predicted that by 2050 China will have 53 million fewer children under 14, 100 million fewer workers and 234 million more people aged over 60. What will be the likely effect in China of these changes? A The dependency ratio will fall. B The Government’s expenditure will fall. C The Government’s income will fall. D The total population will fall.
1 marks
Answer: C
This question in 0455/11 May/June 2016
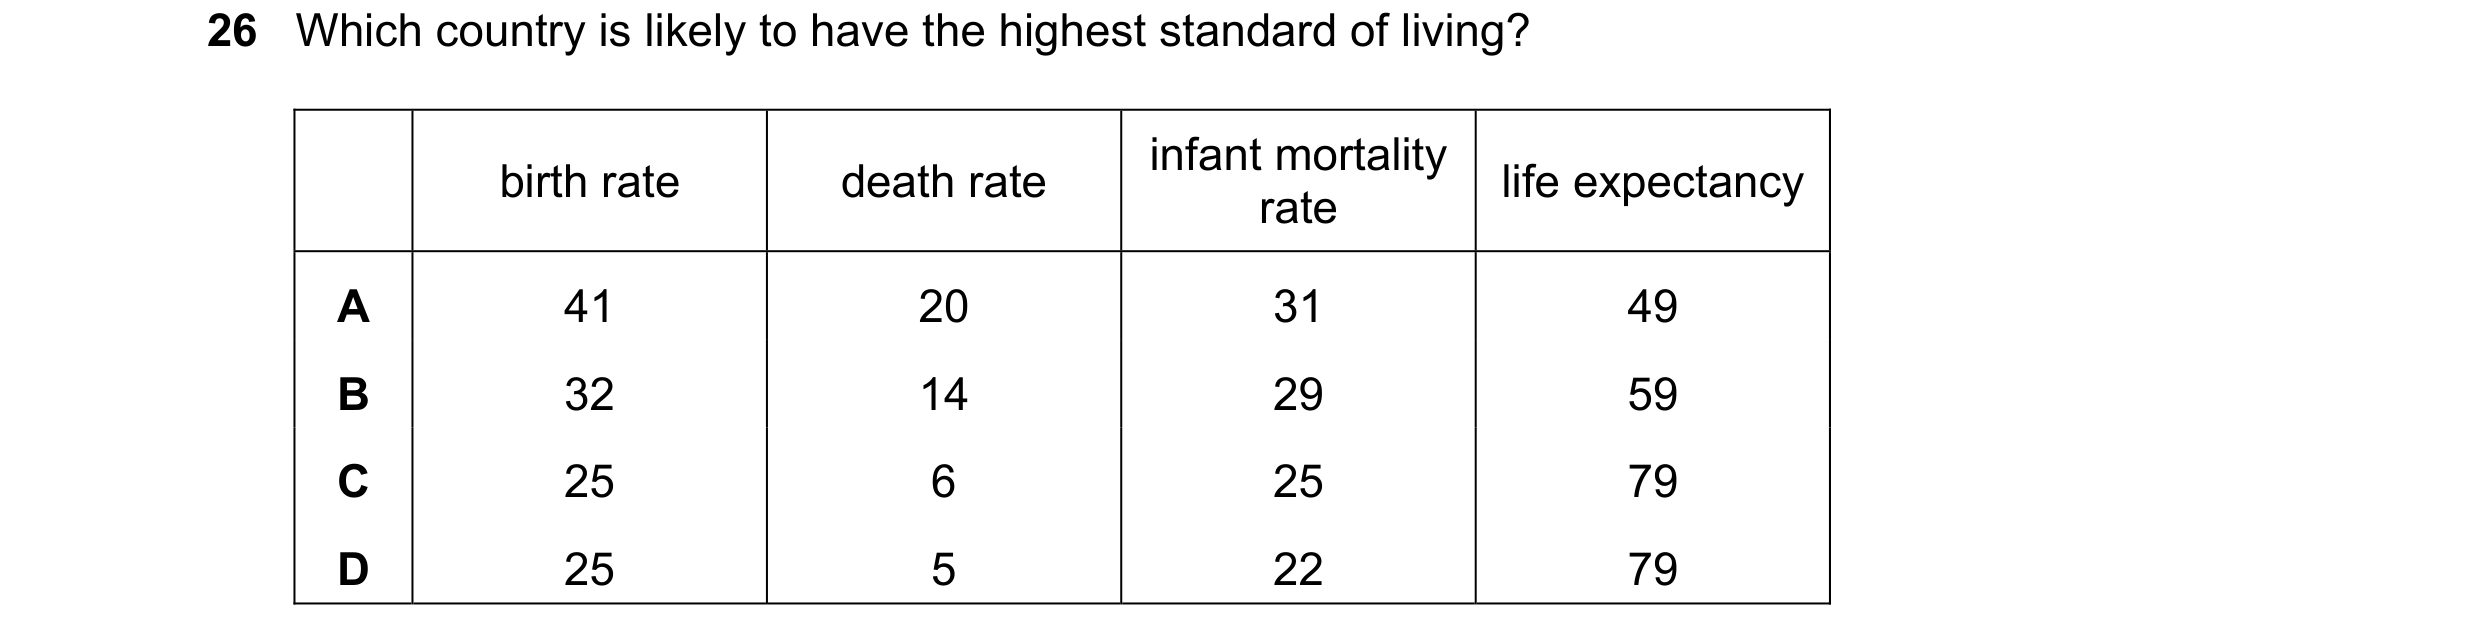
Q61 · Which country is likely to have the highest standard of living? 0455/12 May/June 2016
26 Which country is likely to have the highest standard of living? infant mortality birth rate death rate life expectancy rate A 41 20 31 49 B 32 14 29 59 C 25 6 25 79 D 25 5 22 79
1 marks
Answer: D
This question in 0455/12 May/June 2016
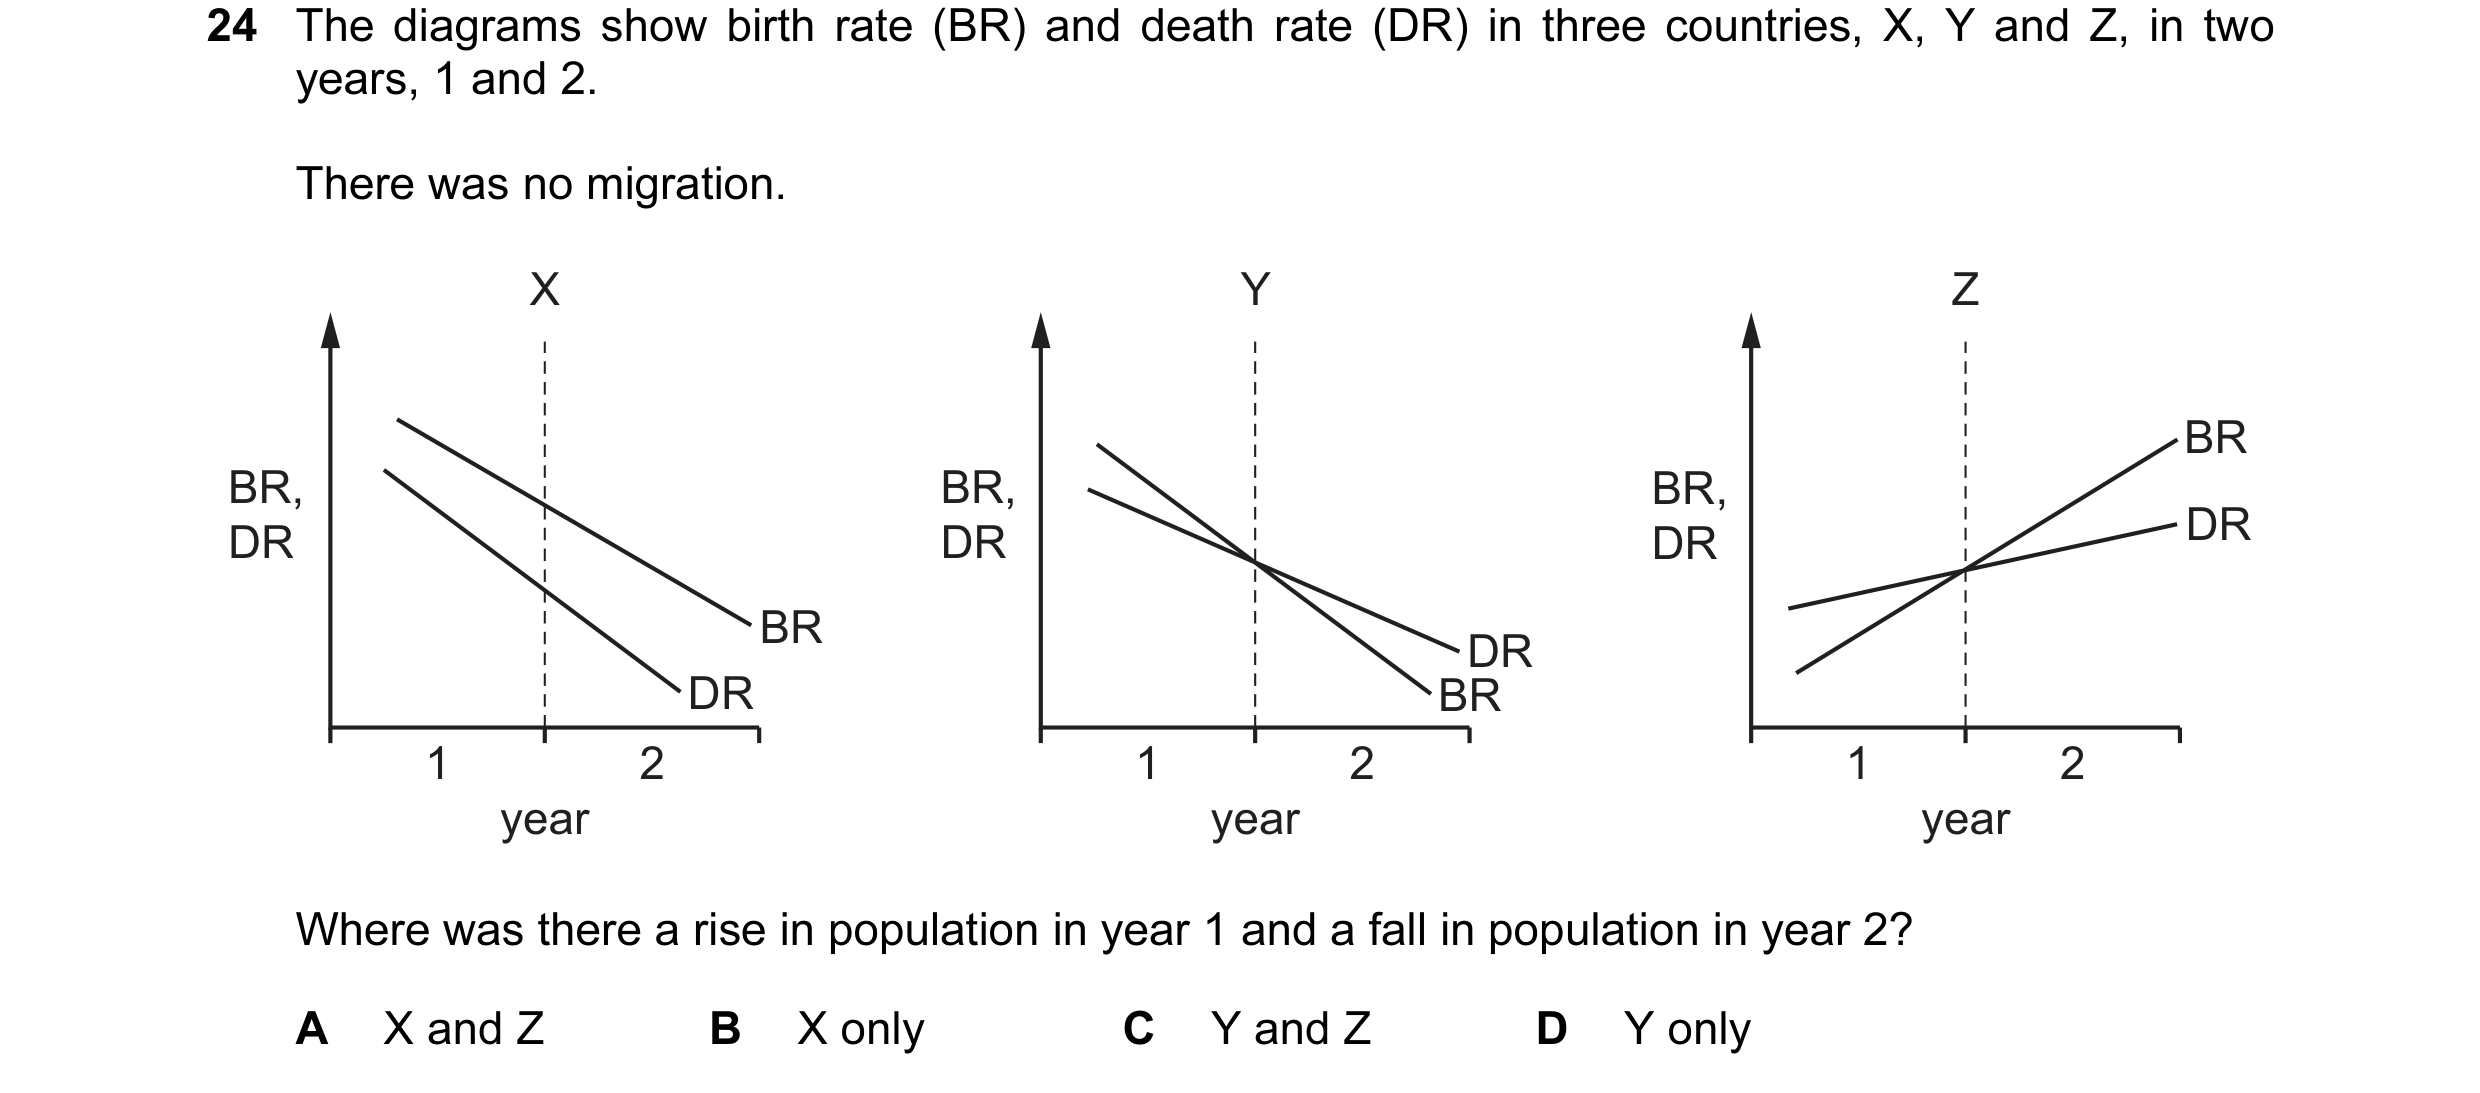
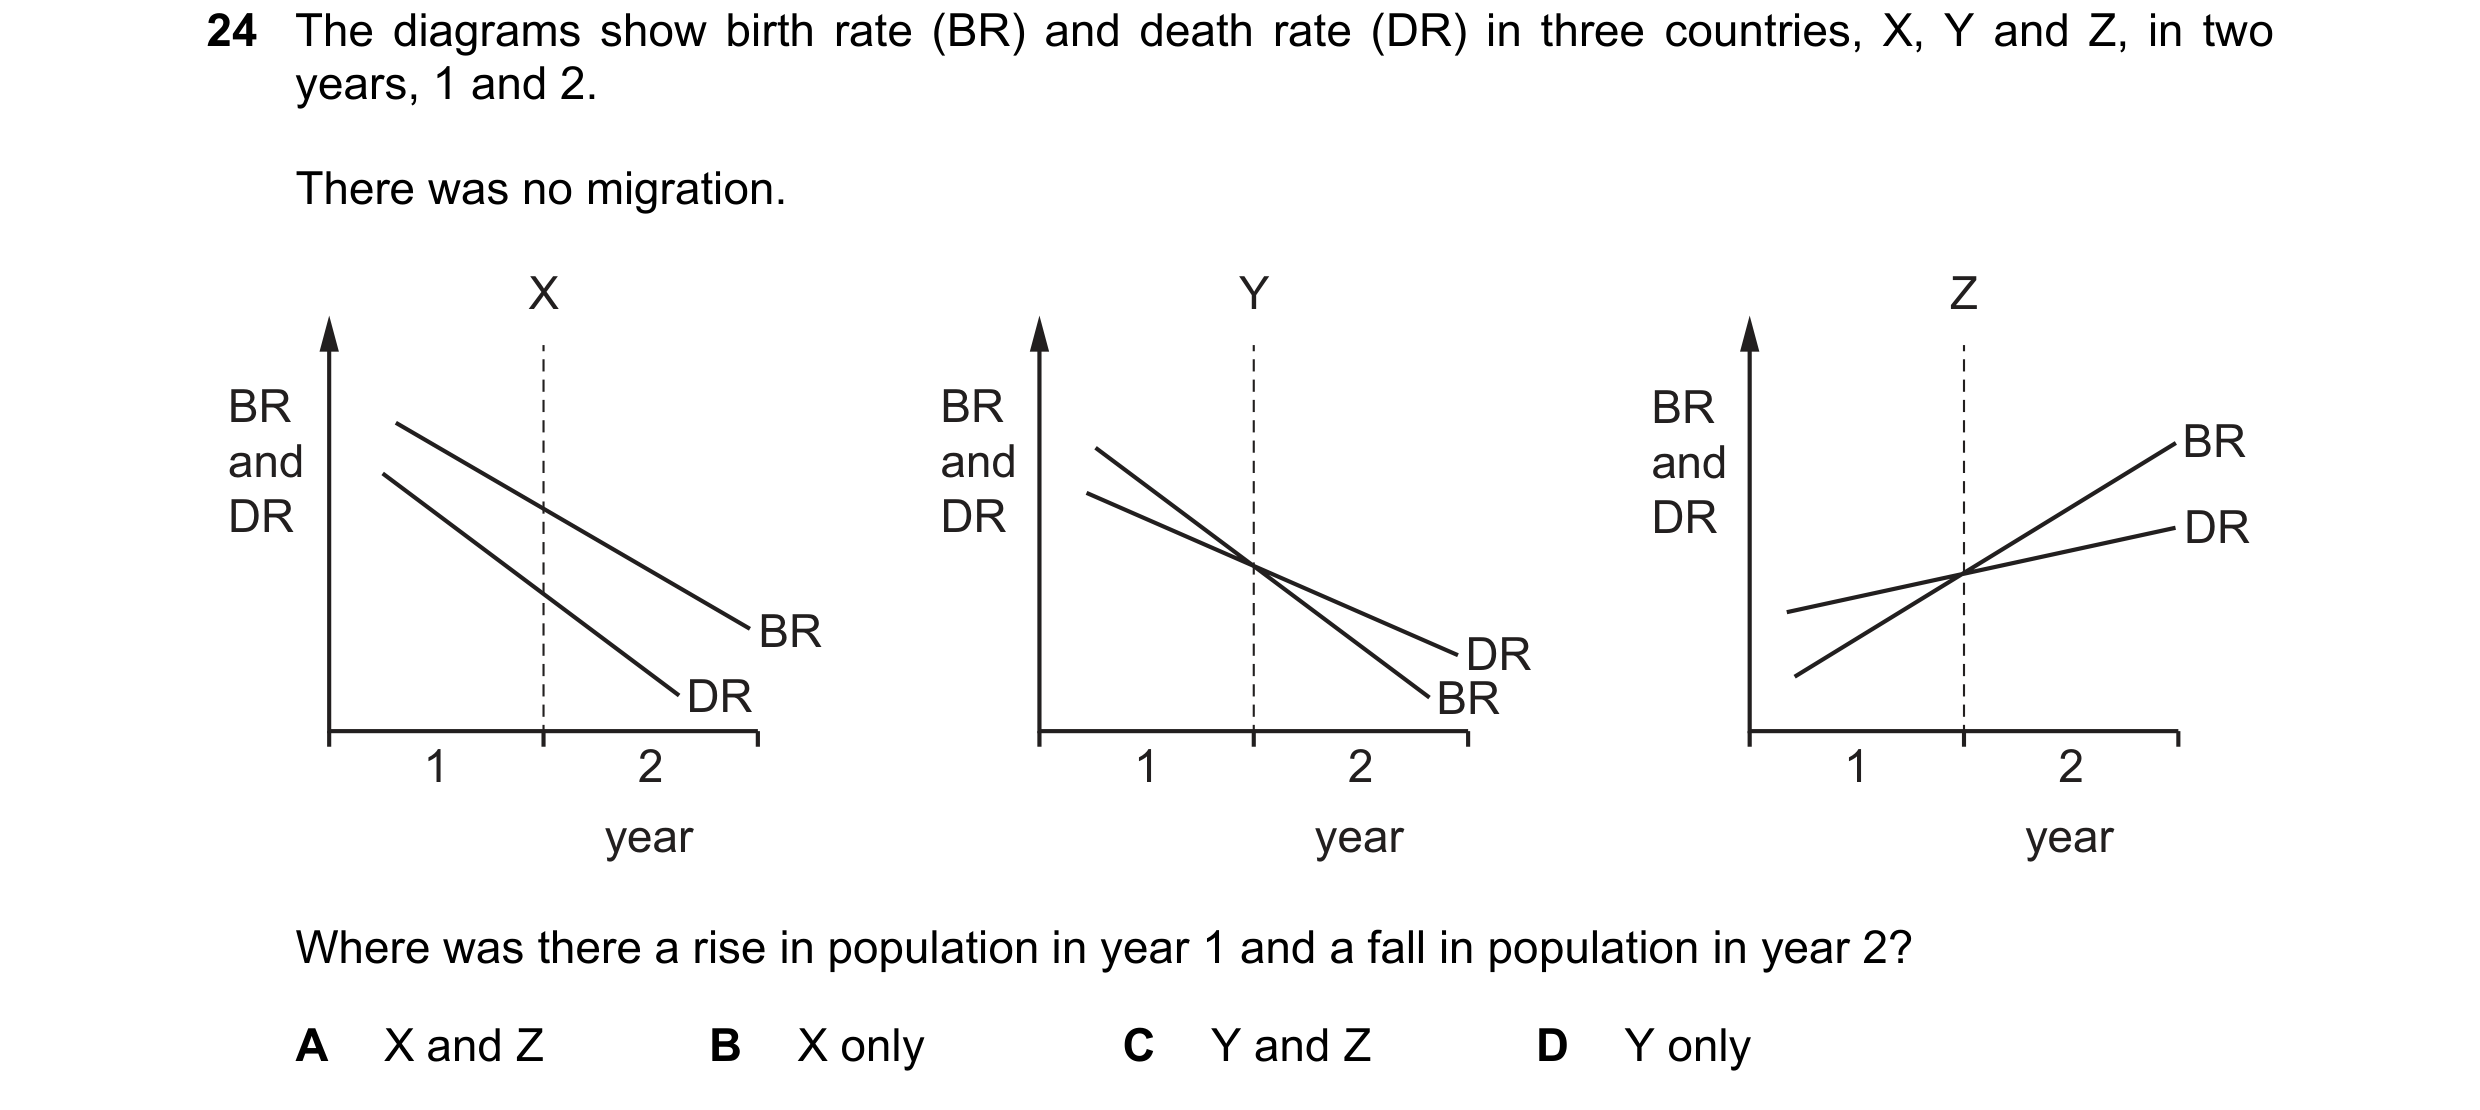
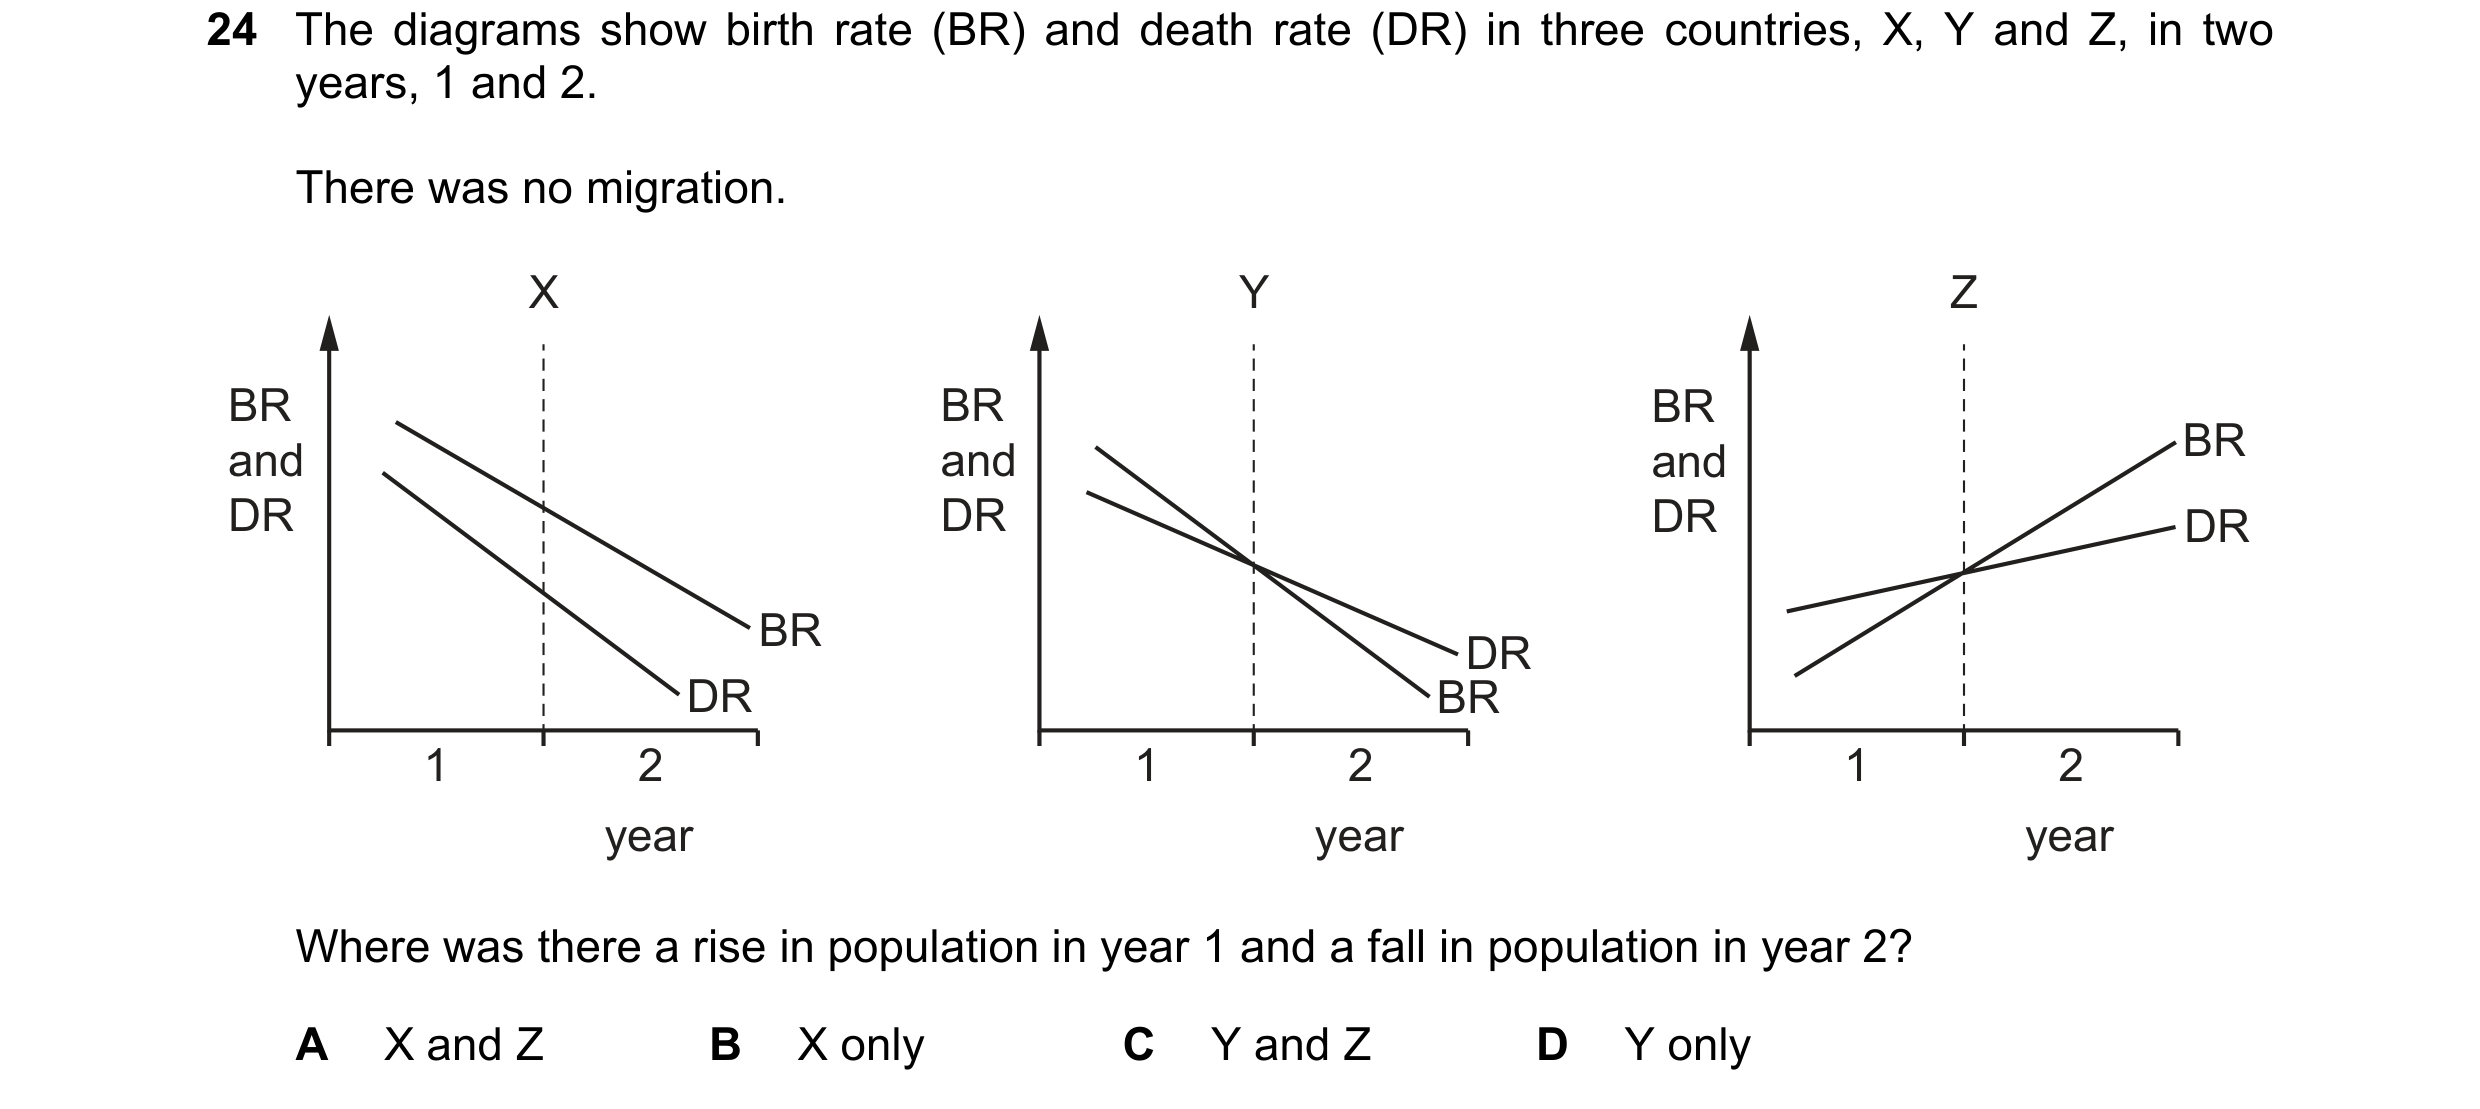
Q62 · The diagrams show birth rate (BR) and death rate (DR) in three countries, X, Y and Z, in… 0455/13 May/June 2016
24 The diagrams show birth rate (BR) and death rate (DR) in three countries, X, Y and Z, in two years, 1 and 2. There was no migration. X Y Z BR BR, BR, BR, DR DR DR DR BR DR DR BR 1 2 1 2 1 2 year year year Where was there a rise in population in year 1 and a fall in population in year 2? A X and Z B X only C Y and Z D Y only
1 marks
Answer: D
This question in 0455/13 May/June 2016
Q63 · Why might the emigration of workers help the economy of a developing country? 0455/13 May/June 2016
25 Why might the emigration of workers help the economy of a developing country? A The dependency ratio is likely to improve. B The inflow of transfers of money is likely to increase. C The least healthy workers are likely to be the last ones to leave. D The more skilled workers are likely to be the ones to leave.
1 marks
Answer: B
This question in 0455/13 May/June 2016
Q64 · What combination of changes in the birth rate and death rate is most likely to increase… 0455/13 May/June 2016
26 What combination of changes in the birth rate and death rate is most likely to increase the dependency ratio in a country? birth rate death rate A falls falls B falls rises C rises falls D rises rises
1 marks
Answer: C
This question in 0455/13 May/June 2016
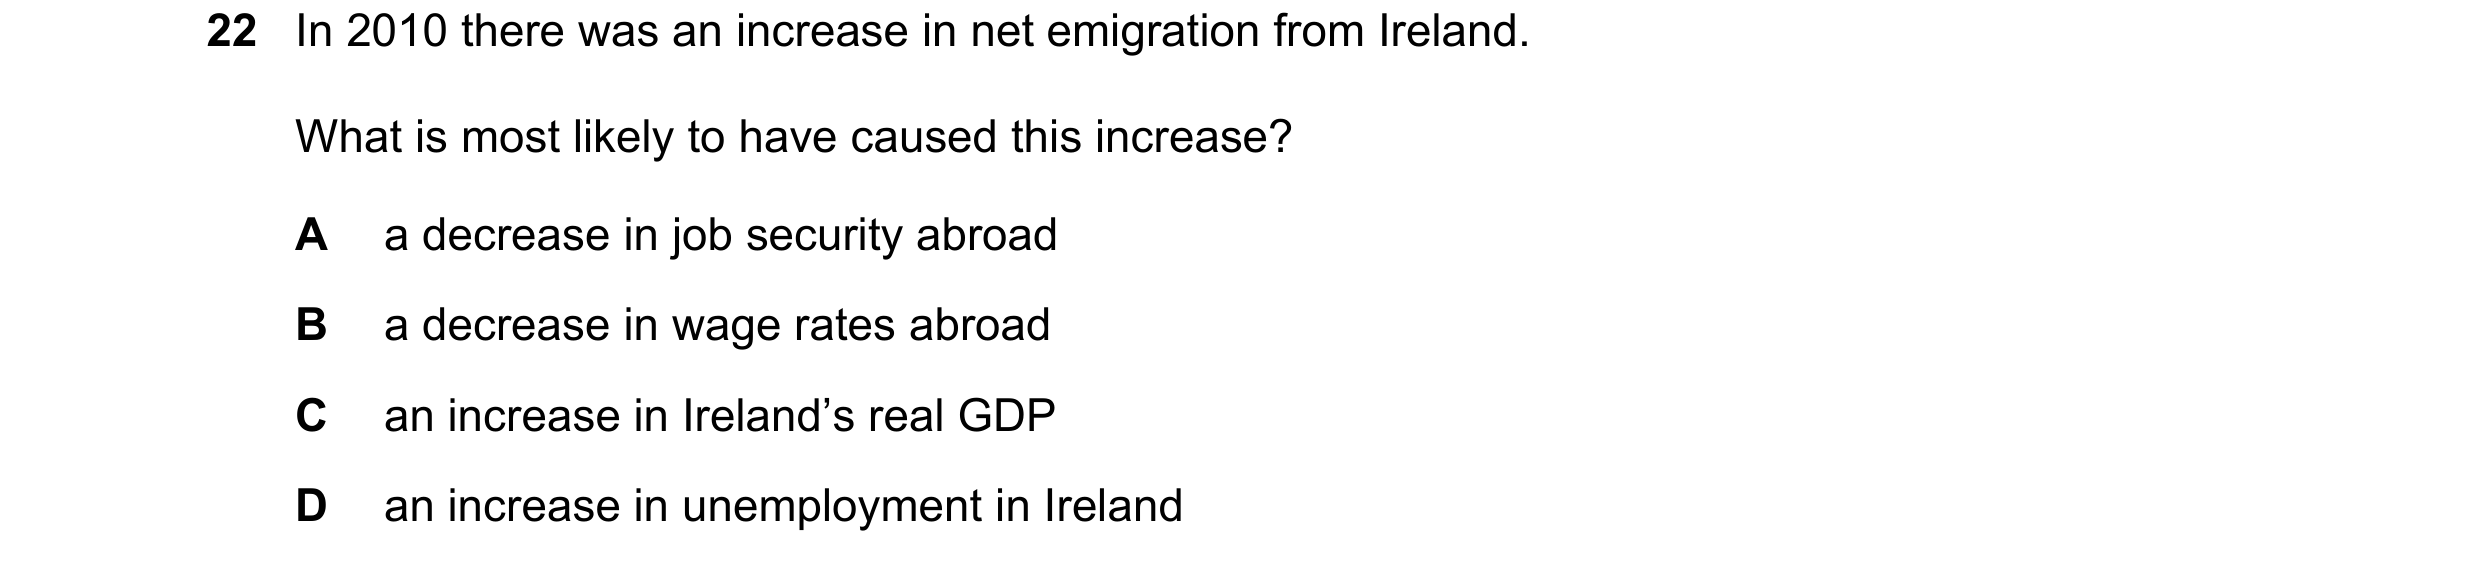
Q65 · In 2010 there was an increase in net emigration from Ireland 0455/12 Oct/Nov 2016
22 In 2010 there was an increase in net emigration from Ireland. What is most likely to have caused this increase? A a decrease in job security abroad B a decrease in wage rates abroad C an increase in Ireland’s real GDP D an increase in unemployment in Ireland
1 marks
This question in 0455/12 Oct/Nov 2016
Q66 · What would be most likely to cause the population to decrease if other things remain… 0455/13 Oct/Nov 2016
24 What would be most likely to cause the population to decrease if other things remain constant? A a decrease in the birth rate B a decrease in the death rate C an increase in net immigration D an increase in the fertility rate
1 marks
Answer: A
This question in 0455/13 Oct/Nov 2016
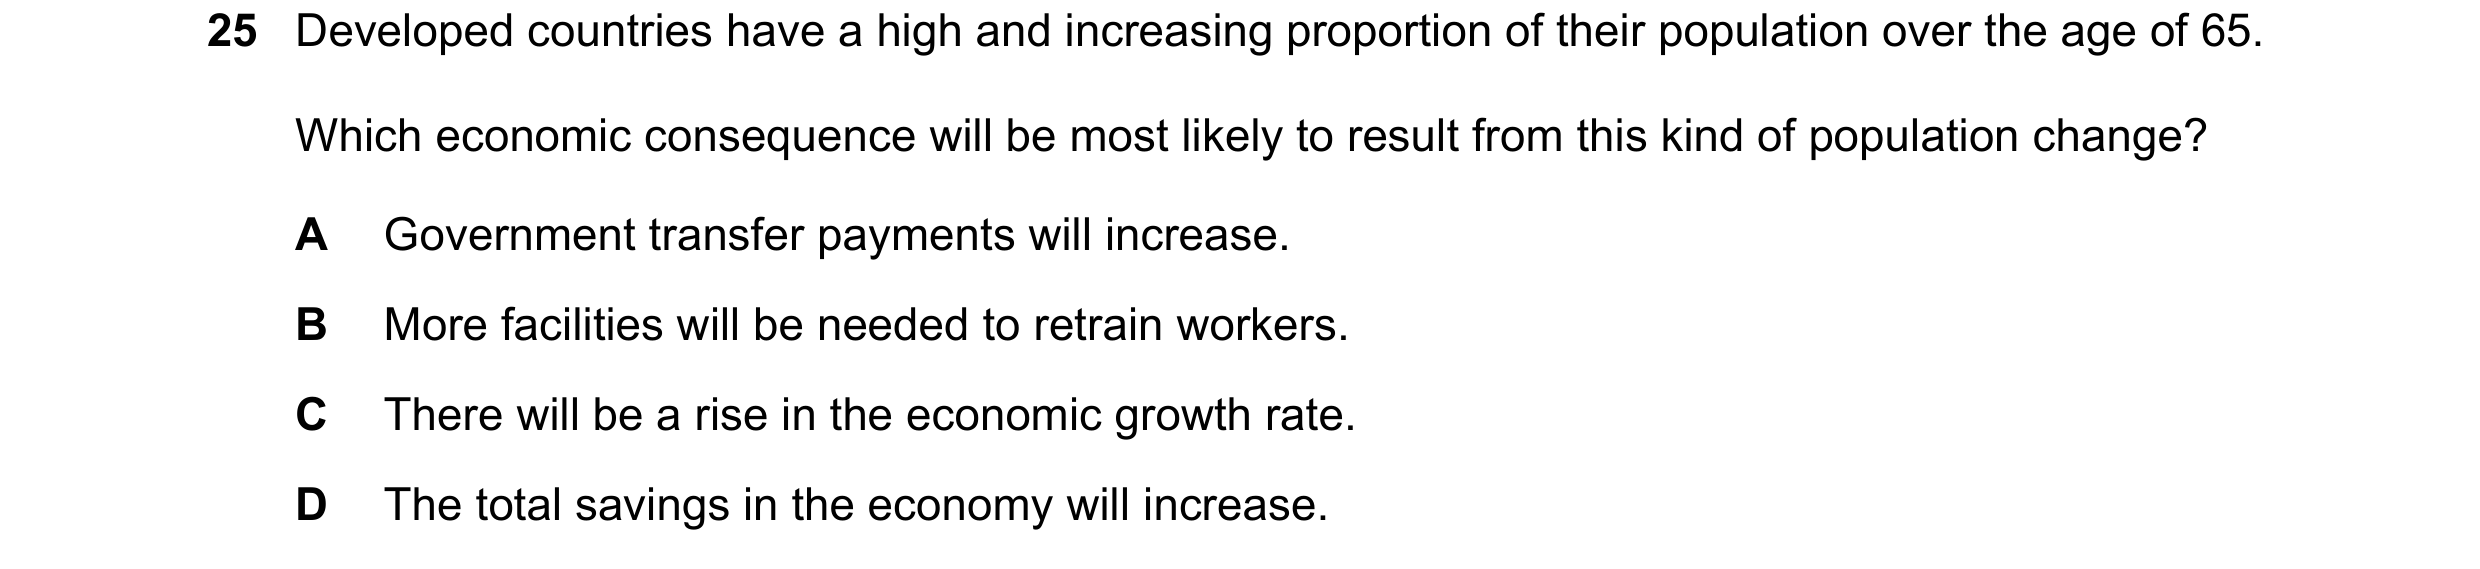
Q67 · Developed countries have a high and increasing proportion of their population over the… 0455/13 Oct/Nov 2016
25 Developed countries have a high and increasing proportion of their population over the age of 65. Which economic consequence will be most likely to result from this kind of population change? A Government transfer payments will increase. B More facilities will be needed to retrain workers. C There will be a rise in the economic growth rate. D The total savings in the economy will increase.
1 marks
Answer: A
This question in 0455/13 Oct/Nov 2016
Q68 · What may cause an immediate decrease in the working population? 0455/12 Feb/March 2017
20 What may cause an immediate decrease in the working population? A a falling death rate B a falling infant mortality rate C a rising birth rate D a rising rate of net emigration
1 marks
Answer: D
This question in 0455/12 Feb/March 2017
Q69 · The population structure of many developed countries is changing 0455/12 Feb/March 2017
25 The population structure of many developed countries is changing. Birth rates are low, those over 65 are living longer and the working population (16-65 years) is a smaller proportion of the total population. What is the most likely consequence of this changing structure? A Economic migrants make up shortages in the working population. B Overall the standard of living is gradually falling. C The population is healthier and needs less medical care. D The ratio of those under 16 dependent on the working population is rising.
1 marks
Answer: A
This question in 0455/12 Feb/March 2017
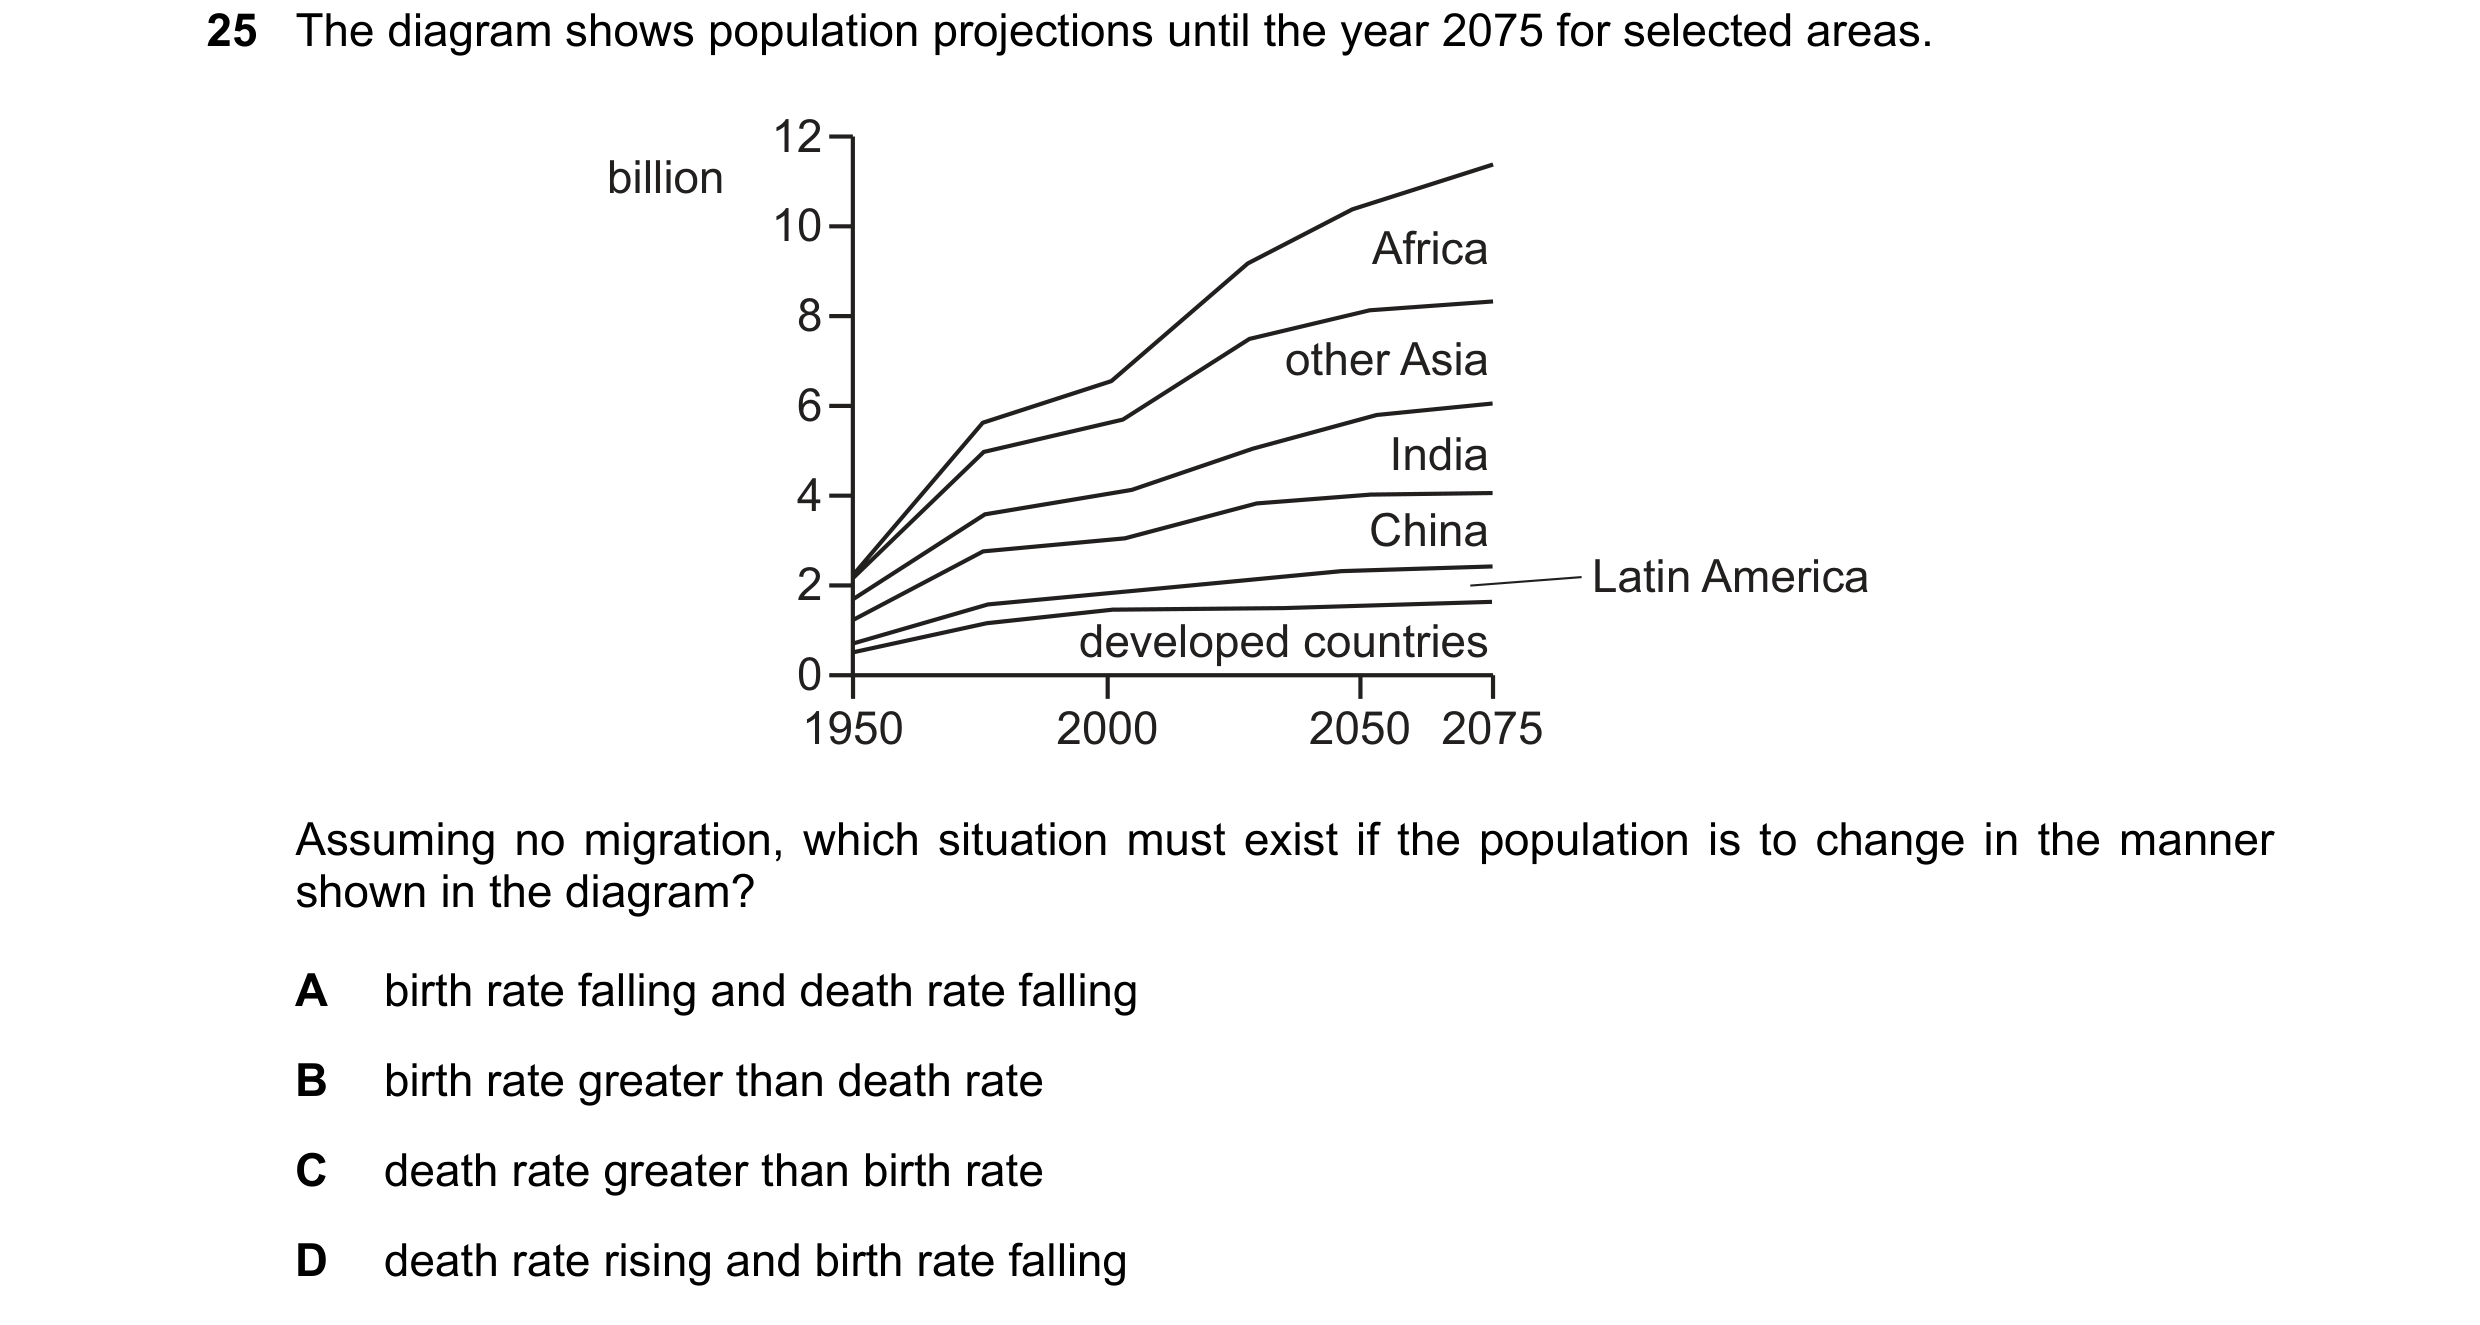
Q70 · The diagram shows population projections until the year 2075 for selected areas 0455/11 May/June 2017
25 The diagram shows population projections until the year 2075 for selected areas. 12 billion 10 Africa 8 other Asia 6 India 4 China 2 Latin America developed countries 0 1950 2000 2050 2075 Assuming no migration, which situation must exist if the population is to change in the manner shown in the diagram? A birth rate falling and death rate falling B birth rate greater than death rate C death rate greater than birth rate D death rate rising and birth rate falling
1 marks
Answer: B
This question in 0455/11 May/June 2017
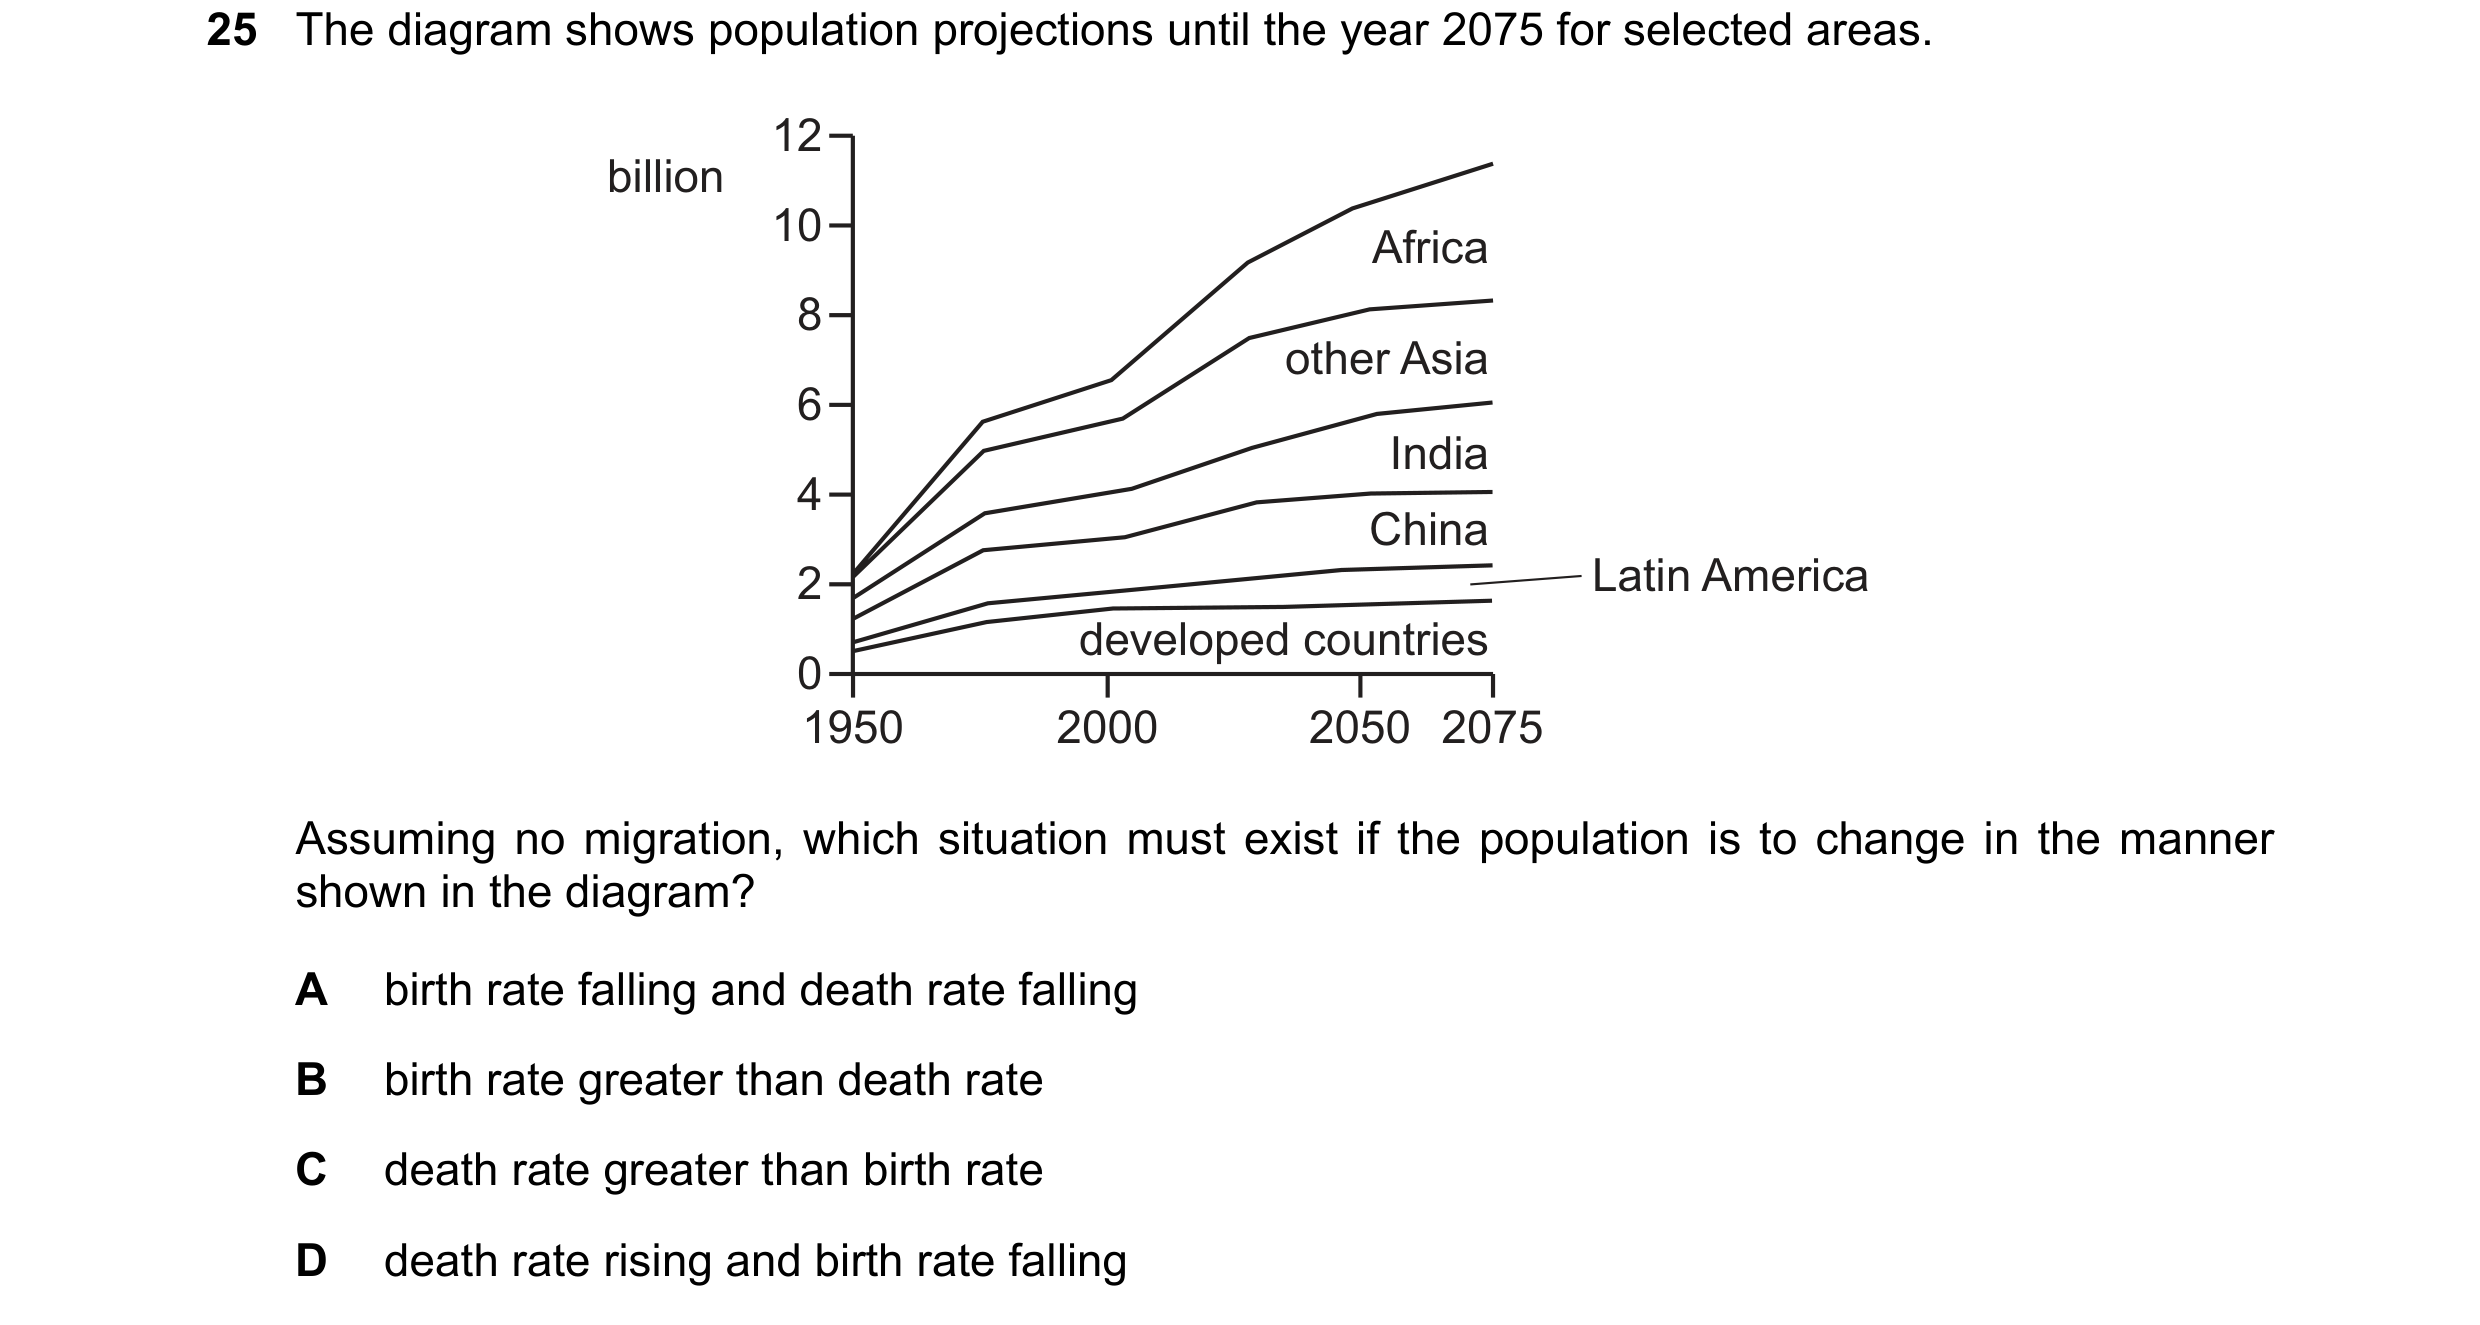
Q71 · The diagram shows population projections until the year 2075 for selected areas 0455/12 May/June 2017
25 The diagram shows population projections until the year 2075 for selected areas. 12 billion 10 Africa 8 other Asia 6 India 4 China 2 Latin America developed countries 0 1950 2000 2050 2075 Assuming no migration, which situation must exist if the population is to change in the manner shown in the diagram? A birth rate falling and death rate falling B birth rate greater than death rate C death rate greater than birth rate D death rate rising and birth rate falling
1 marks
Answer: B
This question in 0455/12 May/June 2017
Q72 · The diagram shows population projections until the year 2075 for selected areas 0455/13 May/June 2017
25 The diagram shows population projections until the year 2075 for selected areas. 12 billion 10 Africa 8 other Asia 6 India 4 China 2 Latin America developed countries 0 1950 2000 2050 2075 Assuming no migration, which situation must exist if the population is to change in the manner shown in the diagram? A birth rate falling and death rate falling B birth rate greater than death rate C death rate greater than birth rate D death rate rising and birth rate falling
1 marks
Answer: B
This question in 0455/13 May/June 2017
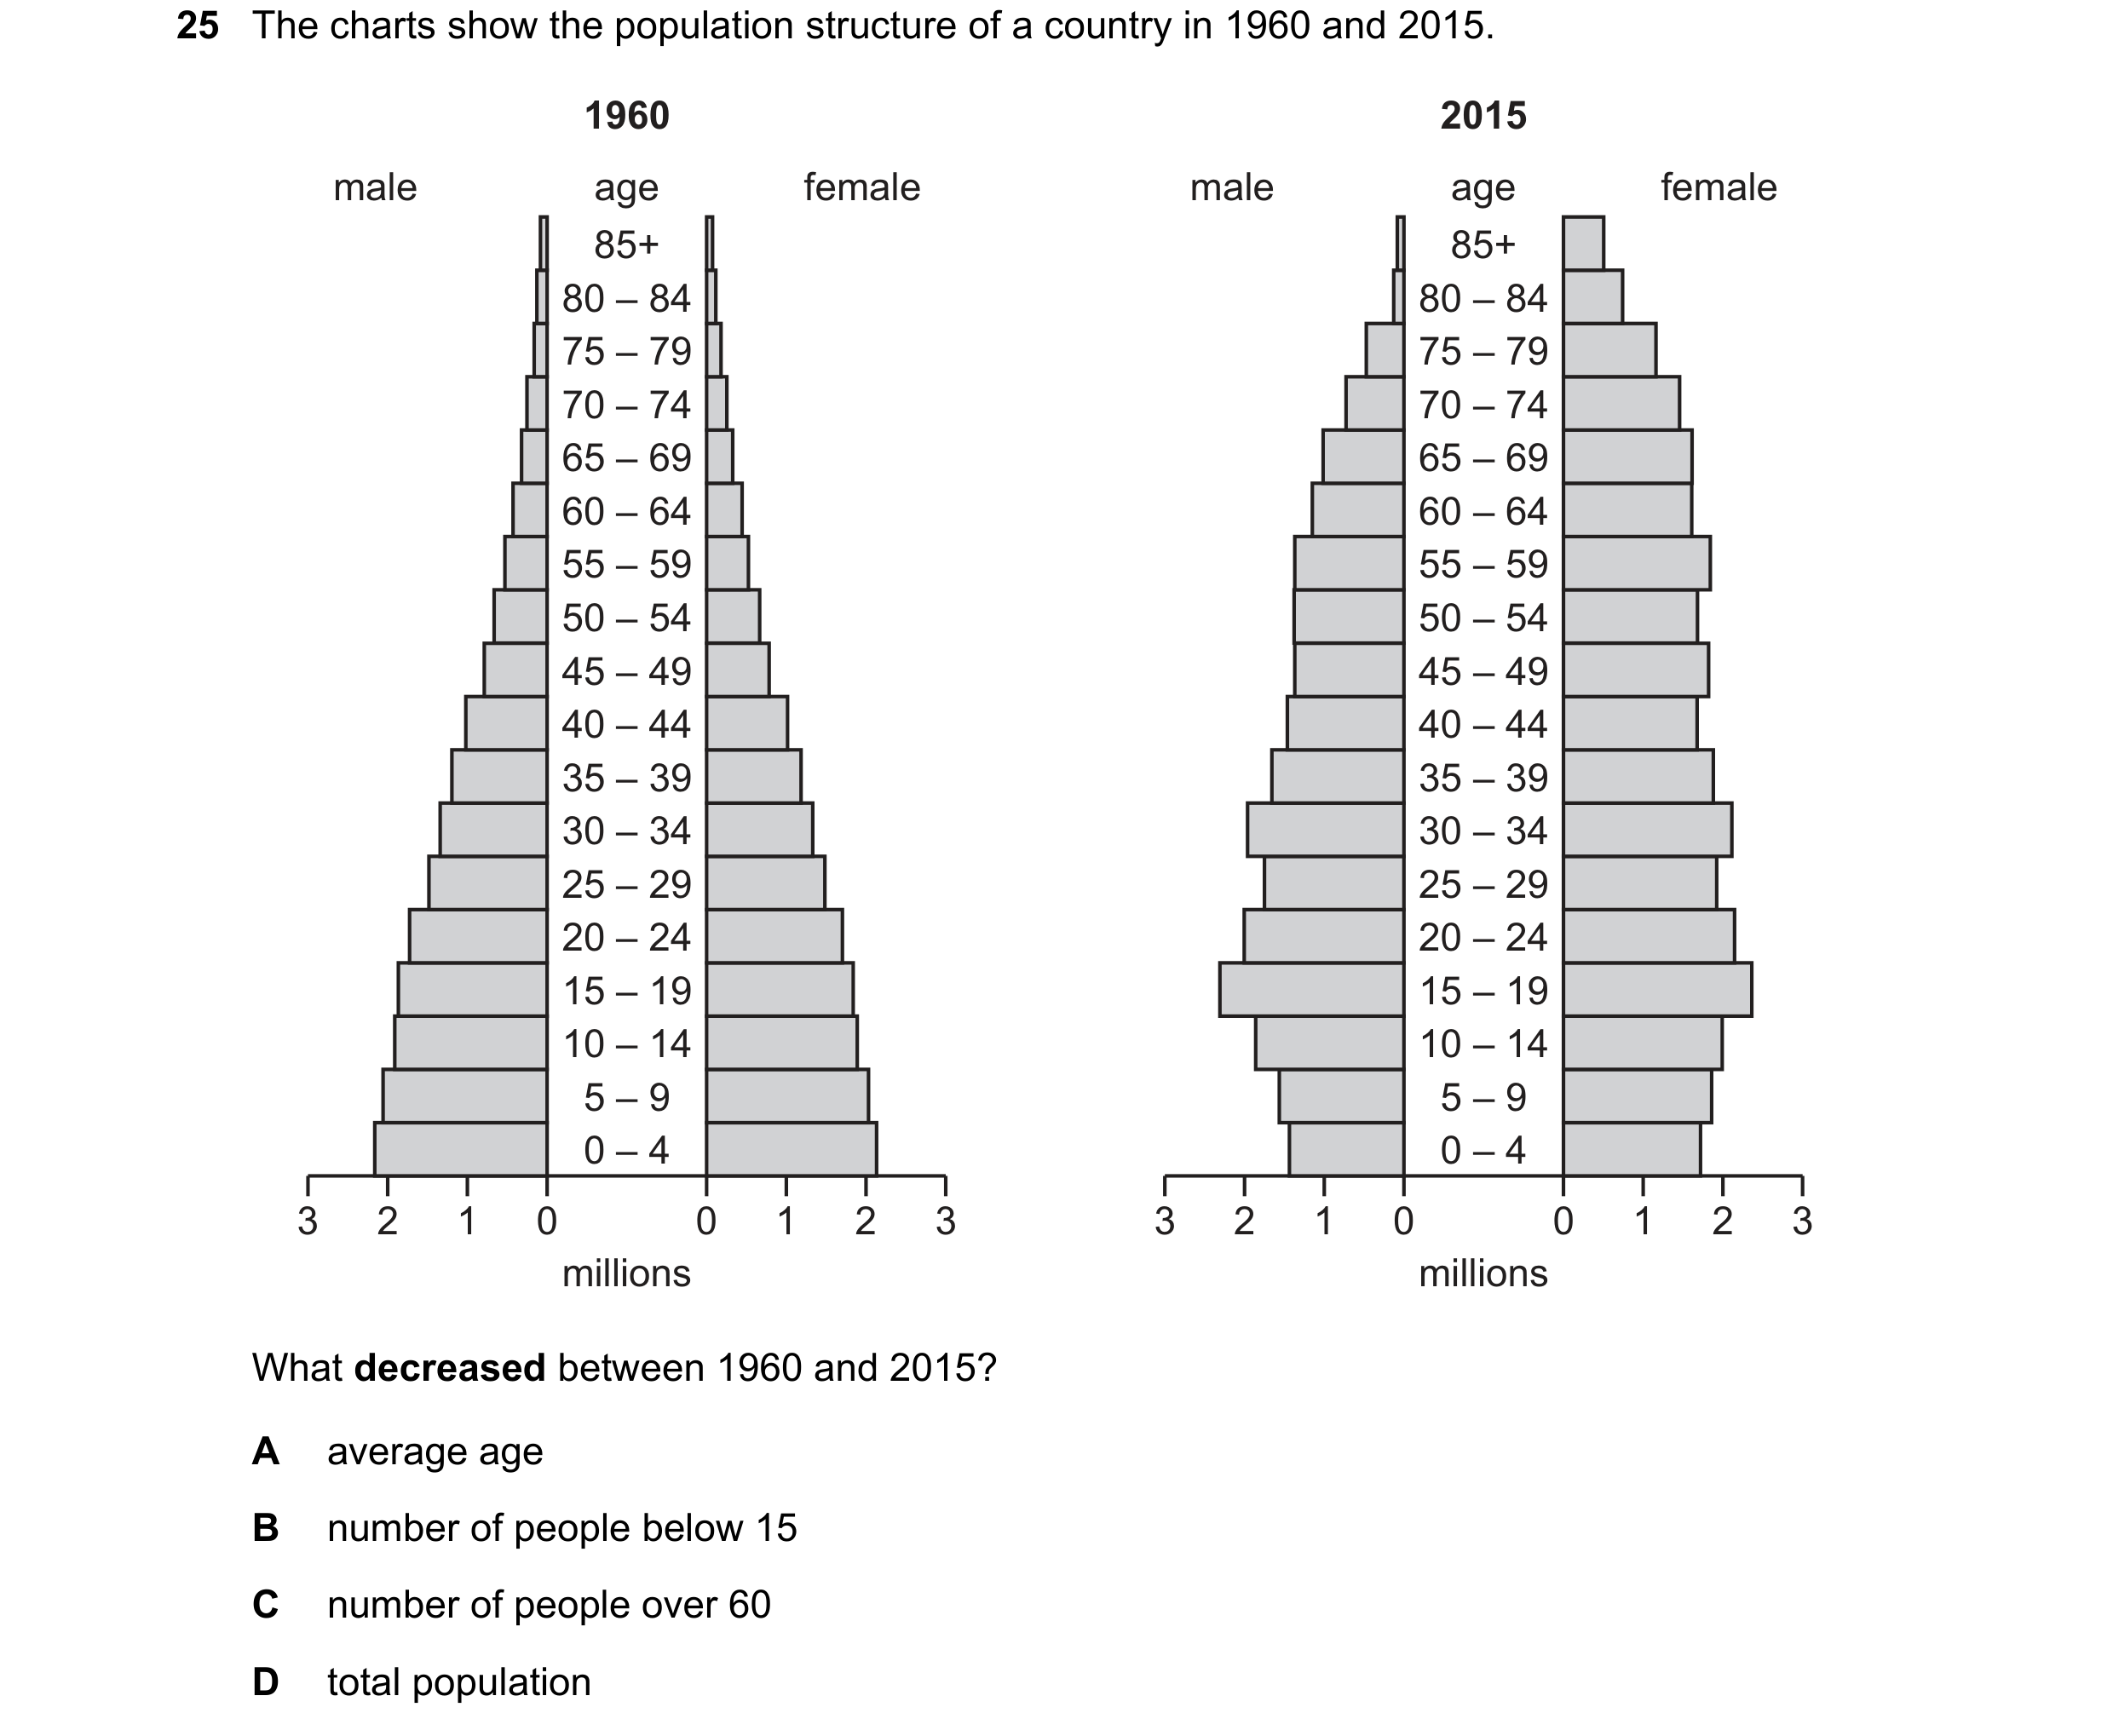
Q73 · The charts show the population structure of a country in 1960 and 2015 0455/11 Oct/Nov 2017
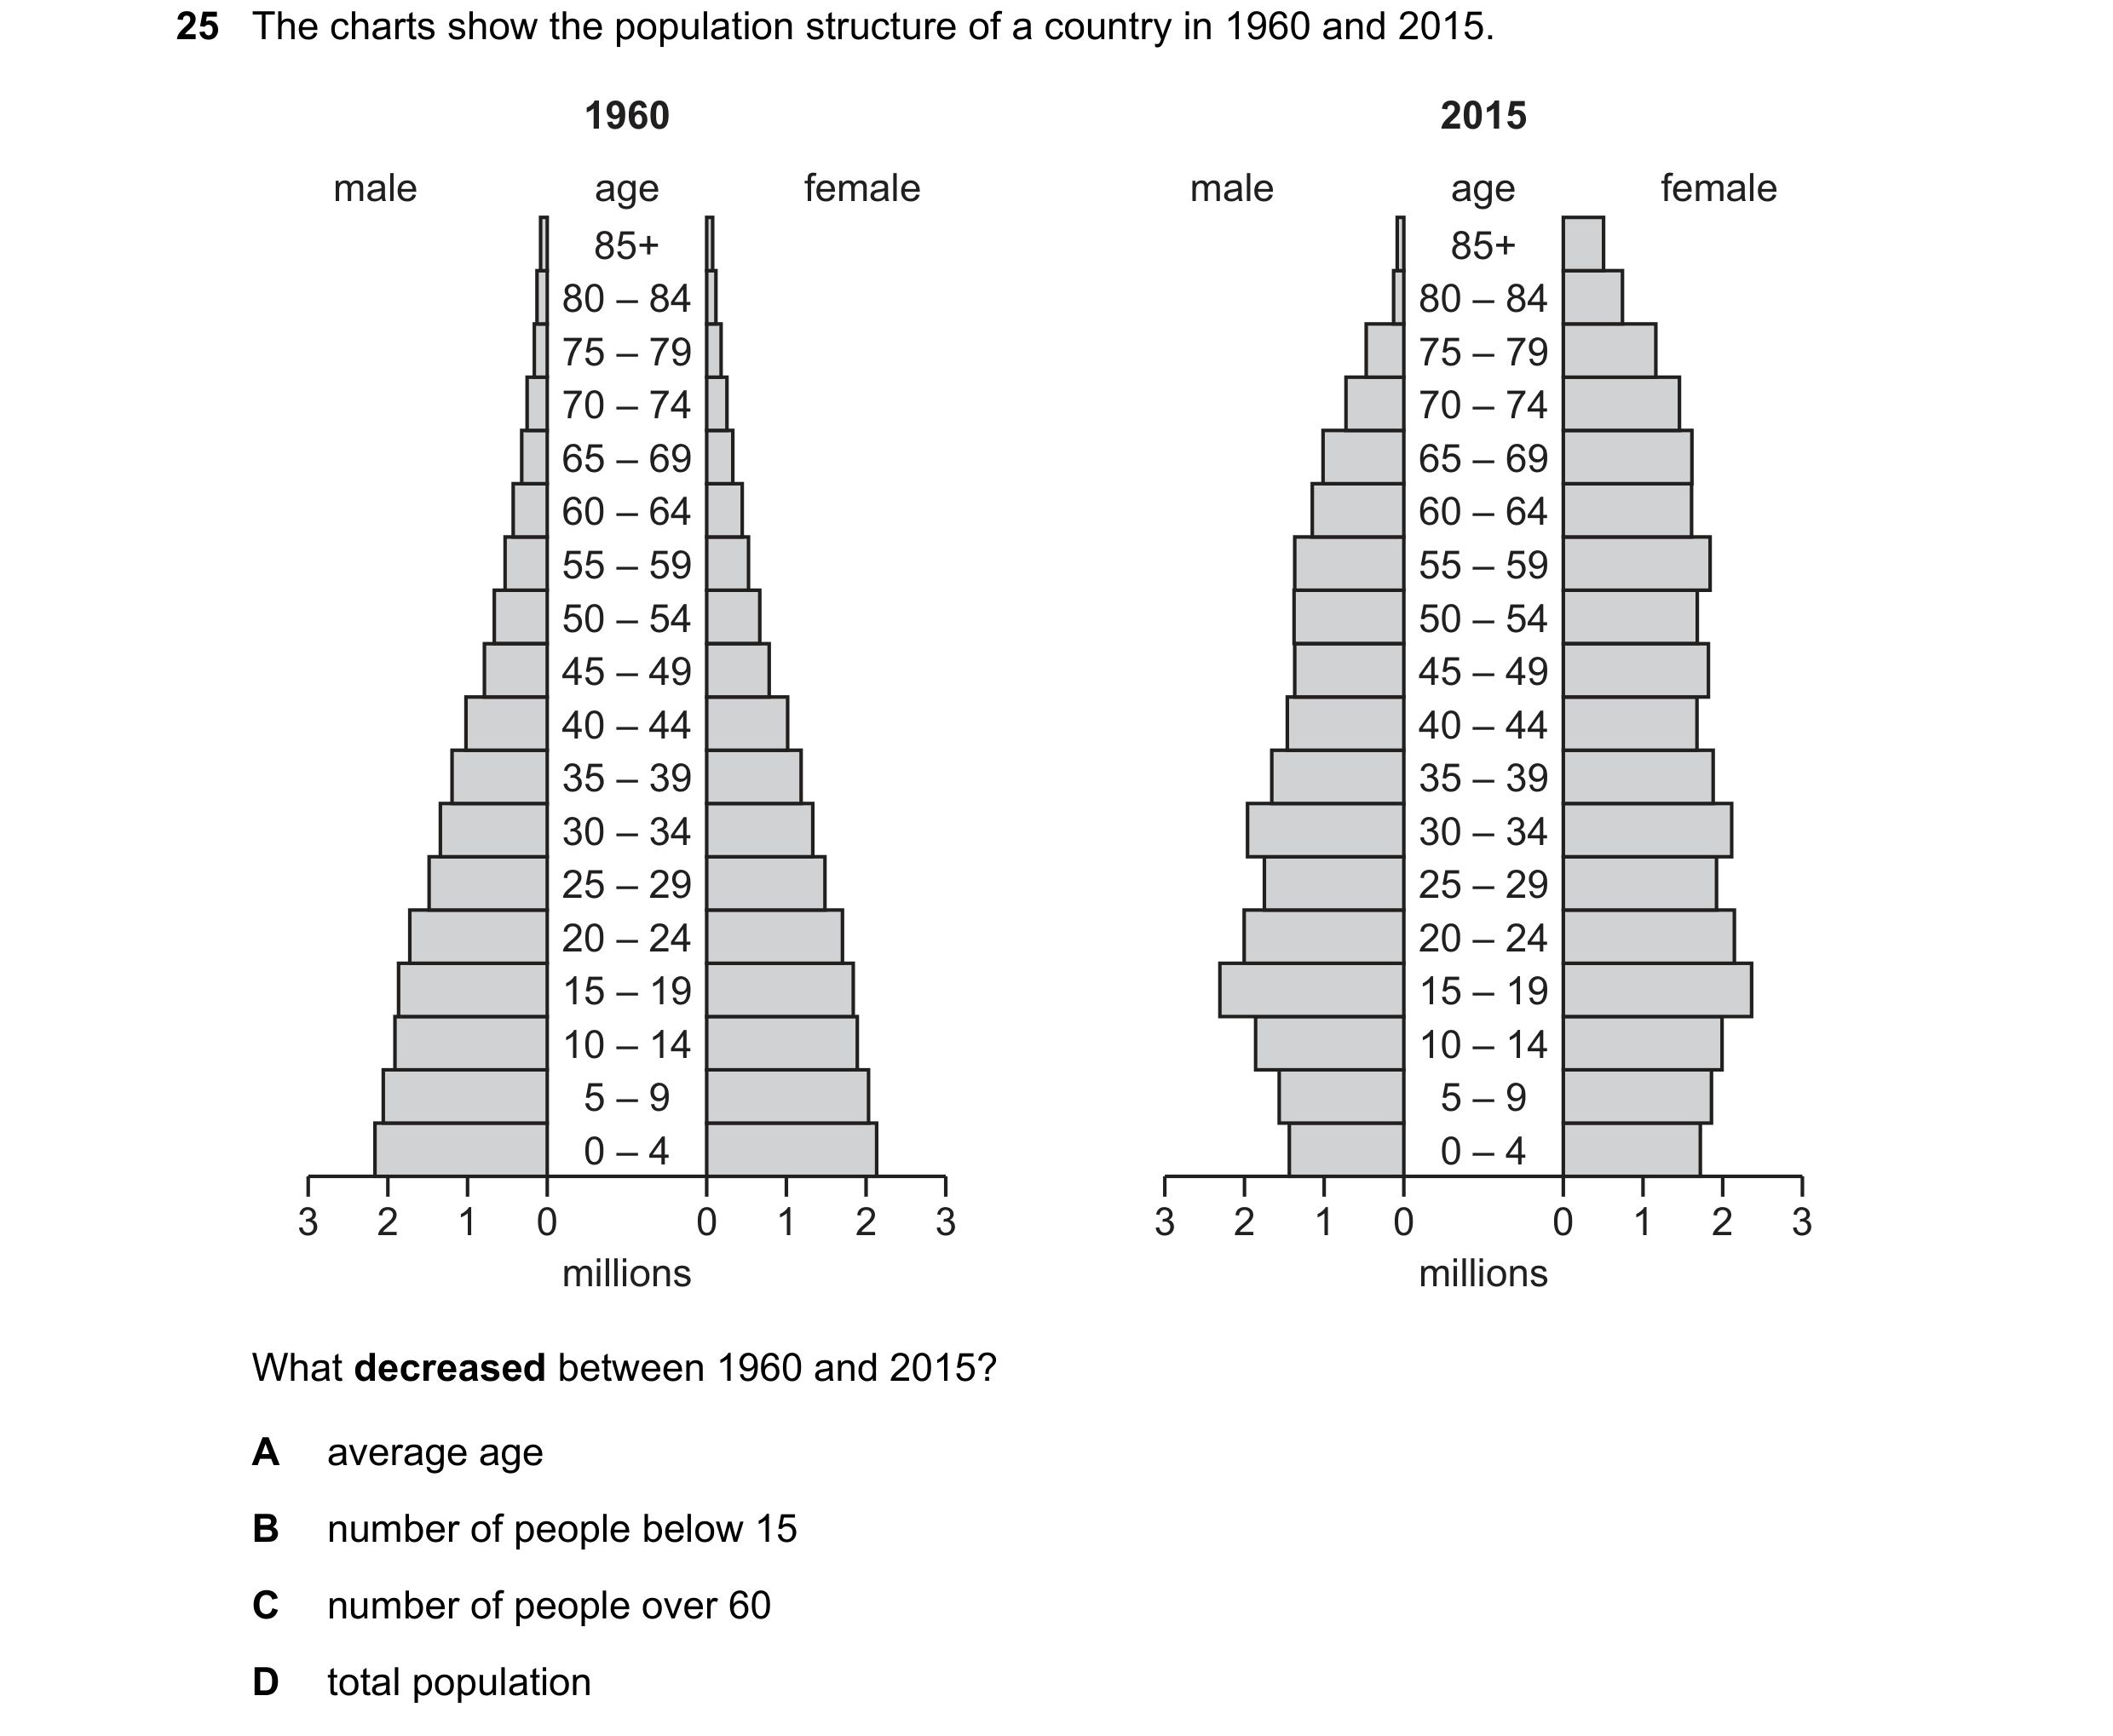
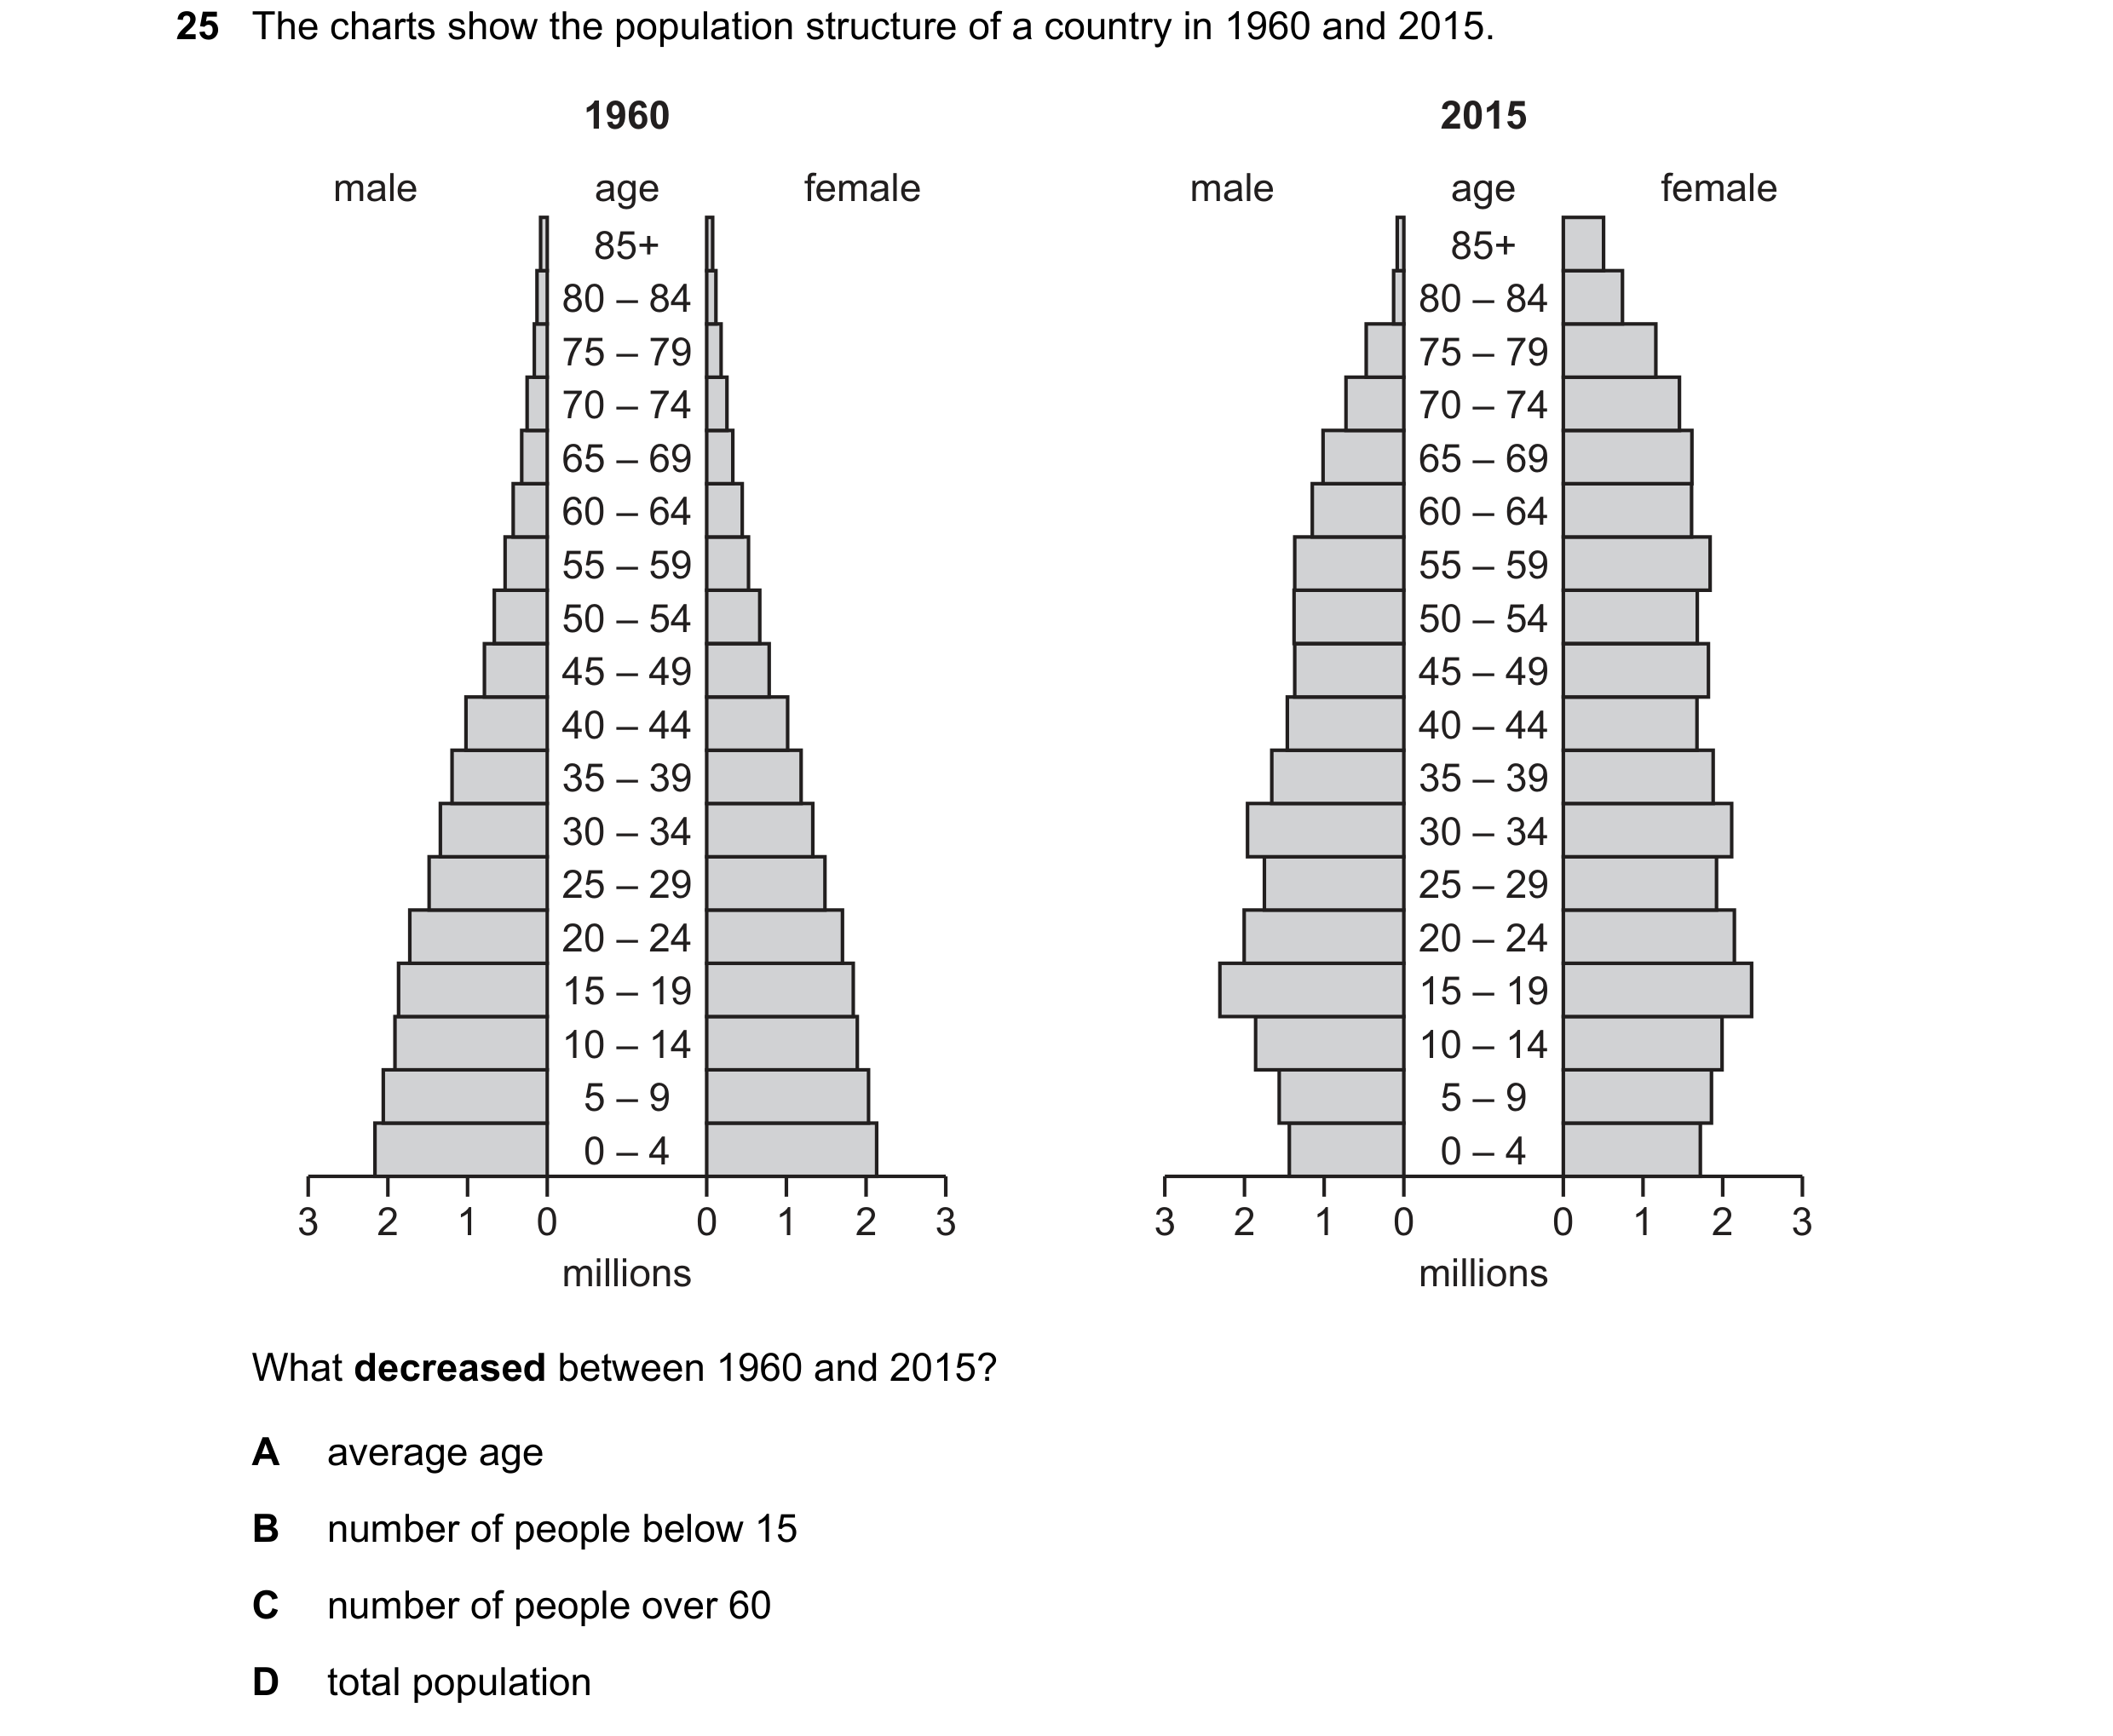
25 The charts show the population structure of a country in 1960 and 2015. 1960 2015 male age female male age female 85+ 85+ 80 – 84 80 – 84 75 – 79 75 – 79 70 – 74 70 – 74 65 – 69 65 – 69 60 – 64 60 – 64 55 – 59 55 – 59 50 – 54 50 – 54 45 – 49 45 – 49 40 – 44 40 – 44 35 – 39 35 – 39 30 – 34 30 – 34 25 – 29 25 – 29 20 – 24 20 – 24 15 – 19 15 – 19 10 – 14 10 – 14 5 – 9 5 – 9 0 – 4 0 – 4 3 2 1 0 0 1 2 3 3 2 1 0 0 1 2 3 millions millions What decreased between 1960 and 2015? A average age B number of people below 15 C number of people over 60 D total population
1 marks
Answer: B
This question in 0455/11 Oct/Nov 2017
Q74 · What is most likely to cause an increase in the population growth of a developing country? 0455/12 Oct/Nov 2017
24 What is most likely to cause an increase in the population growth of a developing country? A a decrease in immigration B a decrease in the birth rate C a decrease in the death rate D a decrease in the standard of living
1 marks
Answer: C
This question in 0455/12 Oct/Nov 2017
Q75 · The charts show the population structure of a country in 1960 and 2015 0455/12 Oct/Nov 2017
25 The charts show the population structure of a country in 1960 and 2015. 1960 2015 male age female male age female 85+ 85+ 80 – 84 80 – 84 75 – 79 75 – 79 70 – 74 70 – 74 65 – 69 65 – 69 60 – 64 60 – 64 55 – 59 55 – 59 50 – 54 50 – 54 45 – 49 45 – 49 40 – 44 40 – 44 35 – 39 35 – 39 30 – 34 30 – 34 25 – 29 25 – 29 20 – 24 20 – 24 15 – 19 15 – 19 10 – 14 10 – 14 5 – 9 5 – 9 0 – 4 0 – 4 3 2 1 0 0 1 2 3 3 2 1 0 0 1 2 3 millions millions What decreased between 1960 and 2015? A average age B number of people below 15 C number of people over 60 D total population
1 marks
Answer: B
This question in 0455/12 Oct/Nov 2017
Q76 · At the start of the year a developing country had a population of 1 000 000, its birth… 0455/12 Oct/Nov 2017
26 At the start of the year a developing country had a population of 1 000 000, its birth rate was 16.0 per thousand per annum and its death rate was 8.0 per thousand per annum. At the end of the year the population was 1 005 000. What could explain this change in the population? A The birth rate rose. B The death rate fell. C There were 3000 emigrants. D There were 5000 immigrants.
1 marks
Answer: C
This question in 0455/12 Oct/Nov 2017
Q77 · What may cause an immediate increase in the working population? 0455/13 Oct/Nov 2017
21 What may cause an immediate increase in the working population? A a higher birth rate B a higher death rate C a higher fertility rate D a higher rate of net immigration
1 marks
Answer: D
This question in 0455/13 Oct/Nov 2017
Q78 · The birth rate and death rate in a country are the same 0455/13 Oct/Nov 2017
24 The birth rate and death rate in a country are the same. What is likely to happen if there is a decrease in the birth rate, while the death rate and migration remain the same? A population structure will remain the same B population will decrease C the standard of living will decrease D the working population will increase
1 marks
Answer: B
This question in 0455/13 Oct/Nov 2017
Q79 · The charts show the population structure of a country in 1960 and 2015 0455/13 Oct/Nov 2017
25 The charts show the population structure of a country in 1960 and 2015. 1960 2015 male age female male age female 85+ 85+ 80 – 84 80 – 84 75 – 79 75 – 79 70 – 74 70 – 74 65 – 69 65 – 69 60 – 64 60 – 64 55 – 59 55 – 59 50 – 54 50 – 54 45 – 49 45 – 49 40 – 44 40 – 44 35 – 39 35 – 39 30 – 34 30 – 34 25 – 29 25 – 29 20 – 24 20 – 24 15 – 19 15 – 19 10 – 14 10 – 14 5 – 9 5 – 9 0 – 4 0 – 4 3 2 1 0 0 1 2 3 3 2 1 0 0 1 2 3 millions millions What decreased between 1960 and 2015? A average age B number of people below 15 C number of people over 60 D total population
1 marks
Answer: B
This question in 0455/13 Oct/Nov 2017
Q80 · The table shows a country’s past and predicted age structure, as a percentage (%), from… 0455/13 May/June 2018
25 The table shows a country’s past and predicted age structure, as a percentage (%), from 2000 to 2150. The working age range is 15 – 64. 2000 2050 2100 2150 age % % % % 65 and over 7 14 25 28 15 – 64 63 68 60 56 14 and under 30 18 15 16 Which statement describes the behaviour of the dependency ratio over the period? A It falls and then rises. B It falls continuously. C It rises and then falls. D It rises continuously.
1 marks
Answer: A
This question in 0455/13 May/June 2018
Q81 · Iran has recently experienced a natural increase in population 0455/11 Oct/Nov 2018
24 Iran has recently experienced a natural increase in population. What is the most likely cause of this increase? A Emigration exceeded immigration. B Immigration exceeded emigration. C The birth rate exceeded the death rate. D The death rate exceeded the birth rate.
1 marks
Answer: C
This question in 0455/11 Oct/Nov 2018
Q82 · What will lead to an ageing population if other factors remain unchanged? 0455/12 Oct/Nov 2018
24 What will lead to an ageing population if other factors remain unchanged? A a fall in the birth rate B a rise in the death rate C an increase in the age of retirement D an increase in the state pension
1 marks
Answer: A
This question in 0455/12 Oct/Nov 2018
Q83 · What is the most likely effect of raising the retirement age in a country? 0455/13 Oct/Nov 2018
24 What is the most likely effect of raising the retirement age in a country? A government spending increases B net immigration increases C spending on pensions increases D working population increases
1 marks
Answer: D
This question in 0455/13 Oct/Nov 2018
Q84 · The table shows the birth rate and death rate for four countries for a given year 0455/12 Feb/March 2019
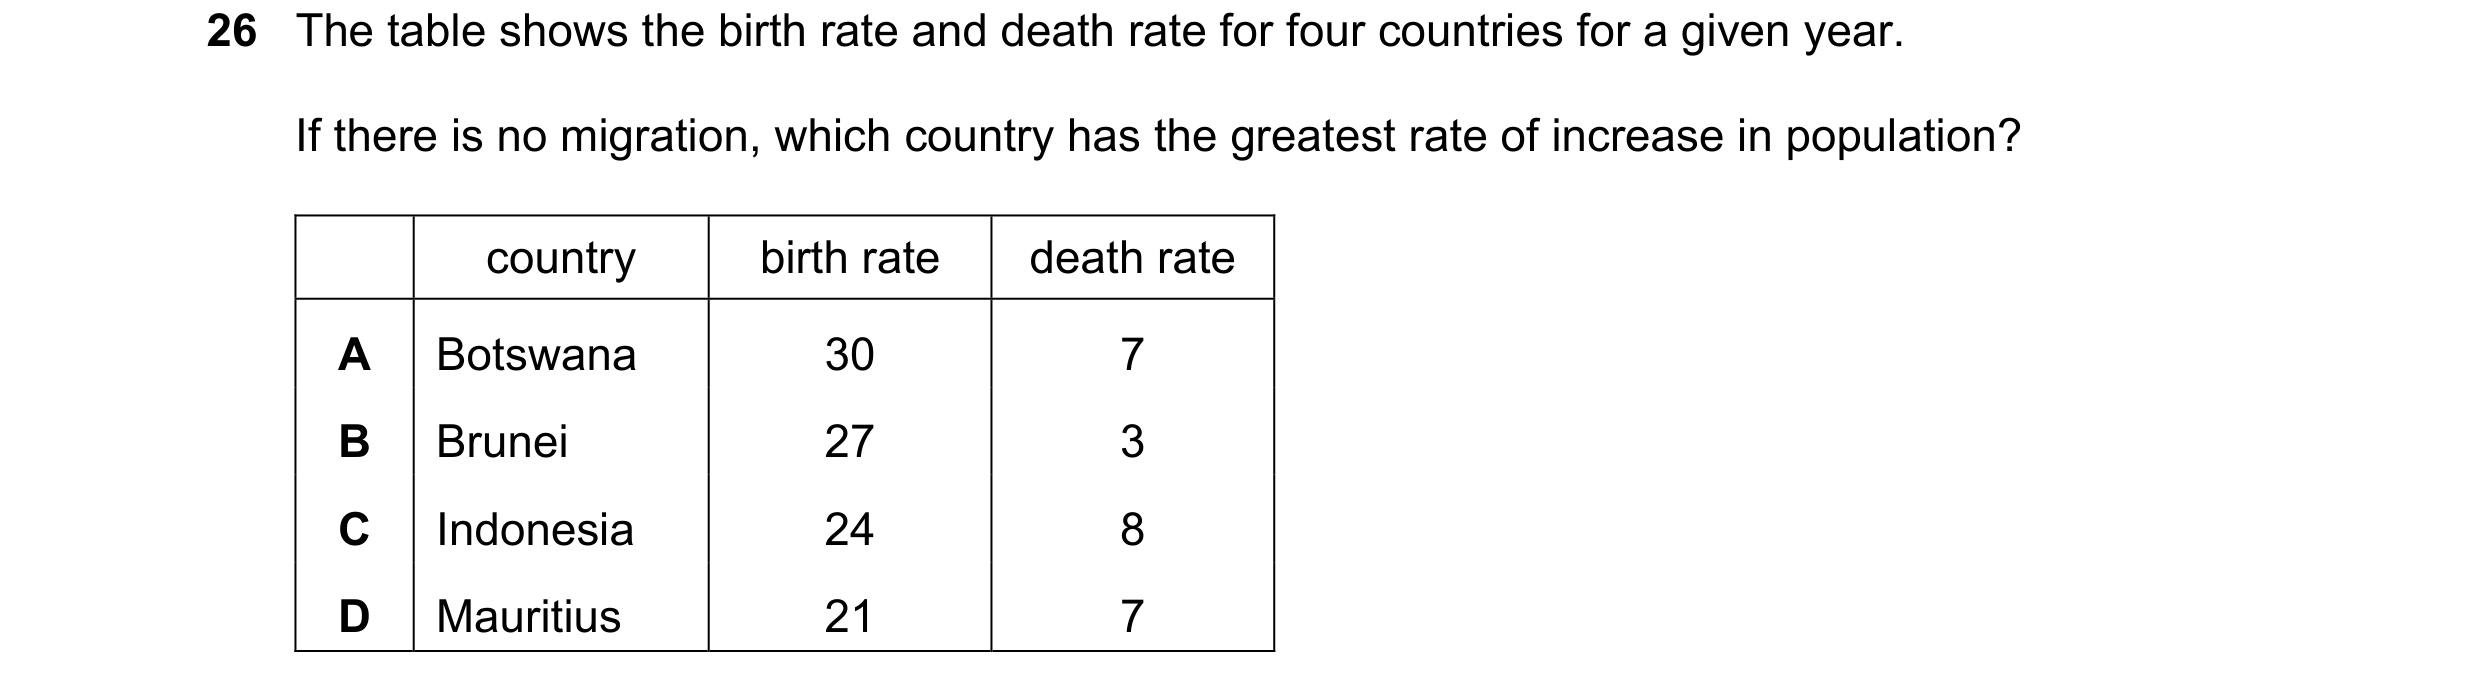
26 The table shows the birth rate and death rate for four countries for a given year. If there is no migration, which country has the greatest rate of increase in population? country birth rate death rate A Botswana 30 7 B Brunei 27 3 C Indonesia 24 8 D Mauritius 21 7
1 marks
Answer: B
This question in 0455/12 Feb/March 2019
Q85 · In a country the birth rate increased but the population decreased 0455/11 May/June 2019
26 In a country the birth rate increased but the population decreased. What could have happened to other factors to cause this? A a fall in infant mortality but no change in the death rate B a rise in net immigration but no change in the death rate C no change in migration but the death rate rose D the death rate fell with no change in migration
1 marks
Answer: C
This question in 0455/11 May/June 2019
Q86 · What usually happens as a developing country becomes more developed? 0455/12 May/June 2019
24 What usually happens as a developing country becomes more developed? A The average age of the population falls. B The fertility rate declines. C The infant mortality rate increases. D The primary sector expands.
1 marks
Answer: B
This question in 0455/12 May/June 2019
Q87 · In a country the birth rate increased but the population decreased 0455/12 May/June 2019
26 In a country the birth rate increased but the population decreased. What could have happened to other factors to cause this? A a fall in infant mortality but no change in the death rate B a rise in net immigration but no change in the death rate C no change in migration but the death rate rose D the death rate fell with no change in migration
1 marks
Answer: C
This question in 0455/12 May/June 2019
Q88 · In a country the birth rate increased but the population decreased 0455/13 May/June 2019
26 In a country the birth rate increased but the population decreased. What could have happened to other factors to cause this? A a fall in infant mortality but no change in the death rate B a rise in net immigration but no change in the death rate C no change in migration but the death rate rose D the death rate fell with no change in migration
1 marks
Answer: C
This question in 0455/13 May/June 2019
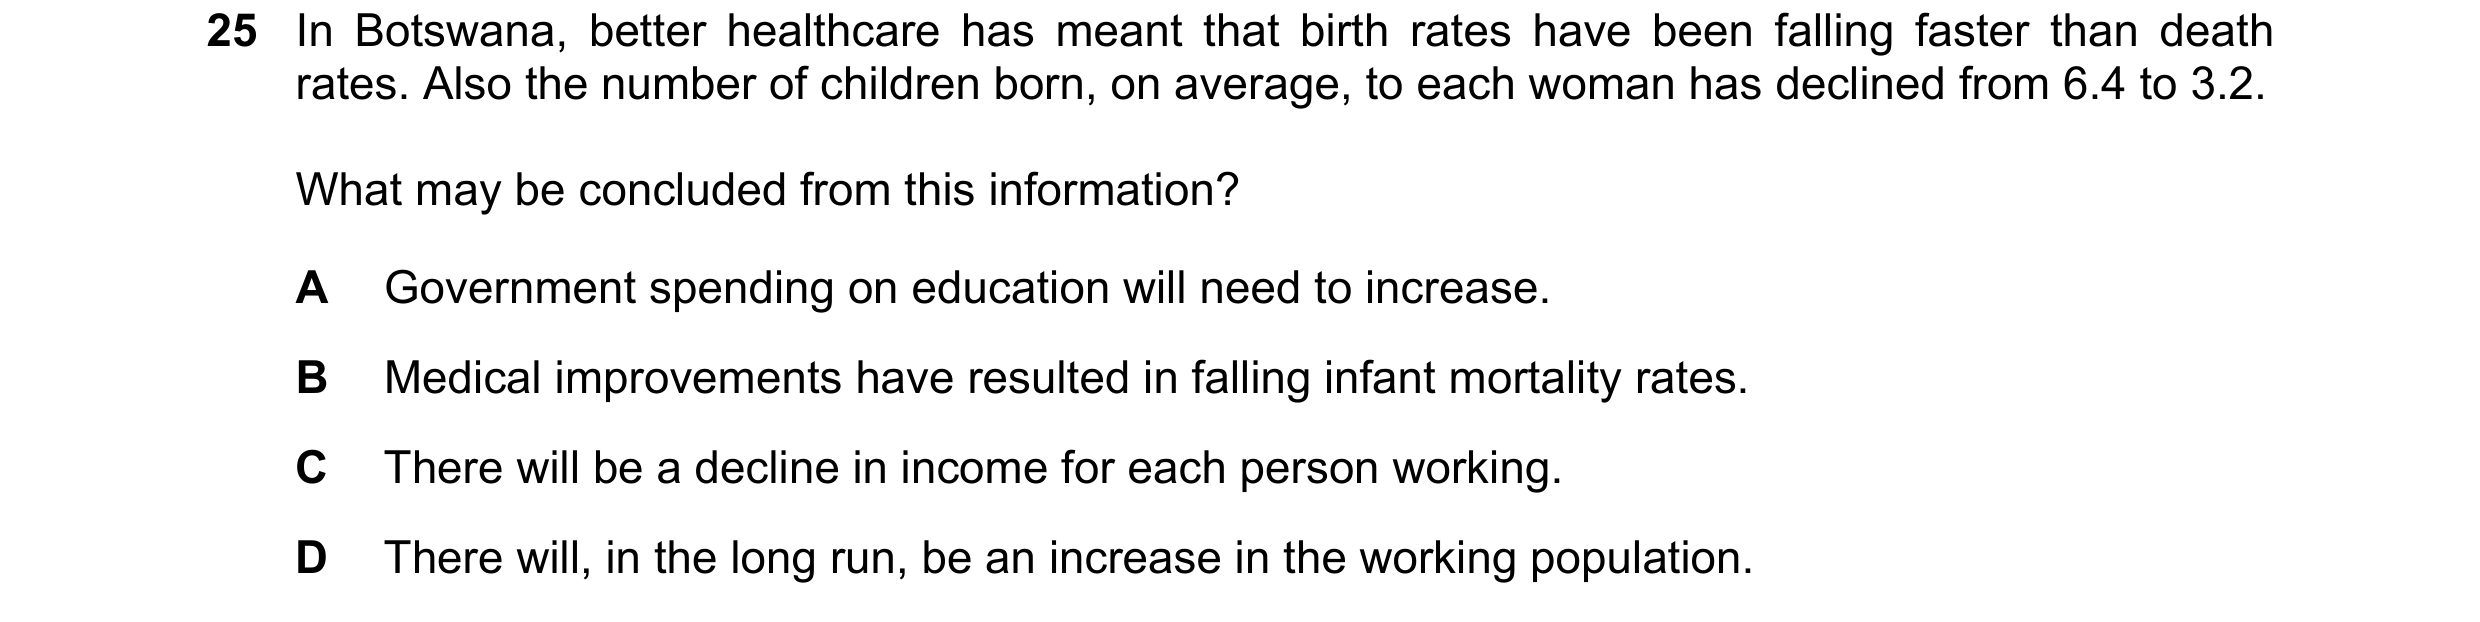
Q89 · In Botswana, better healthcare has meant that birth rates have been falling faster than… 0455/11 Oct/Nov 2019
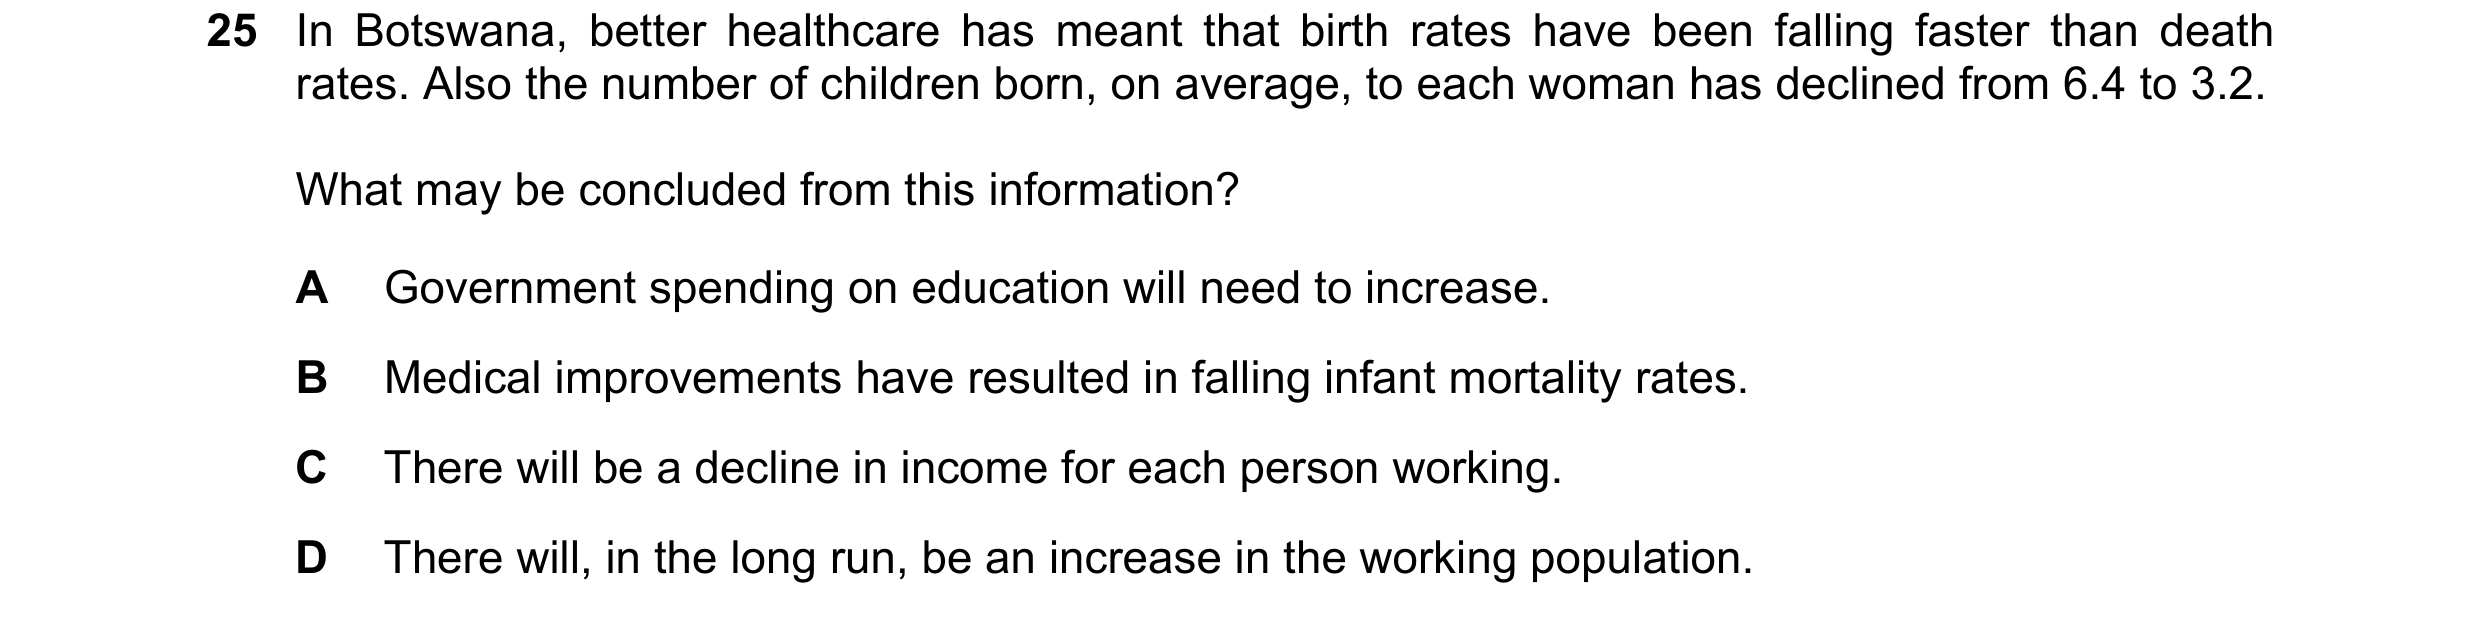
25 In Botswana, better healthcare has meant that birth rates have been falling faster than death rates. Also the number of children born, on average, to each woman has declined from 6.4 to 3.2. What may be concluded from this information? A Government spending on education will need to increase. B Medical improvements have resulted in falling infant mortality rates. C There will be a decline in income for each person working. D There will, in the long run, be an increase in the working population.
1 marks
Answer: B
This question in 0455/11 Oct/Nov 2019
Q90 · In Botswana, better healthcare has meant that birth rates have been falling faster than… 0455/12 Oct/Nov 2019
25 In Botswana, better healthcare has meant that birth rates have been falling faster than death rates. Also the number of children born, on average, to each woman has declined from 6.4 to 3.2. What may be concluded from this information? A Government spending on education will need to increase. B Medical improvements have resulted in falling infant mortality rates. C There will be a decline in income for each person working. D There will, in the long run, be an increase in the working population.
1 marks
Answer: B
This question in 0455/12 Oct/Nov 2019
Q91 · In Botswana, better healthcare has meant that birth rates have been falling faster than… 0455/13 Oct/Nov 2019
25 In Botswana, better healthcare has meant that birth rates have been falling faster than death rates. Also the number of children born, on average, to each woman has declined from 6.4 to 3.2. What may be concluded from this information? A Government spending on education will need to increase. B Medical improvements have resulted in falling infant mortality rates. C There will be a decline in income for each person working. D There will, in the long run, be an increase in the working population.
1 marks
Answer: B
This question in 0455/13 Oct/Nov 2019
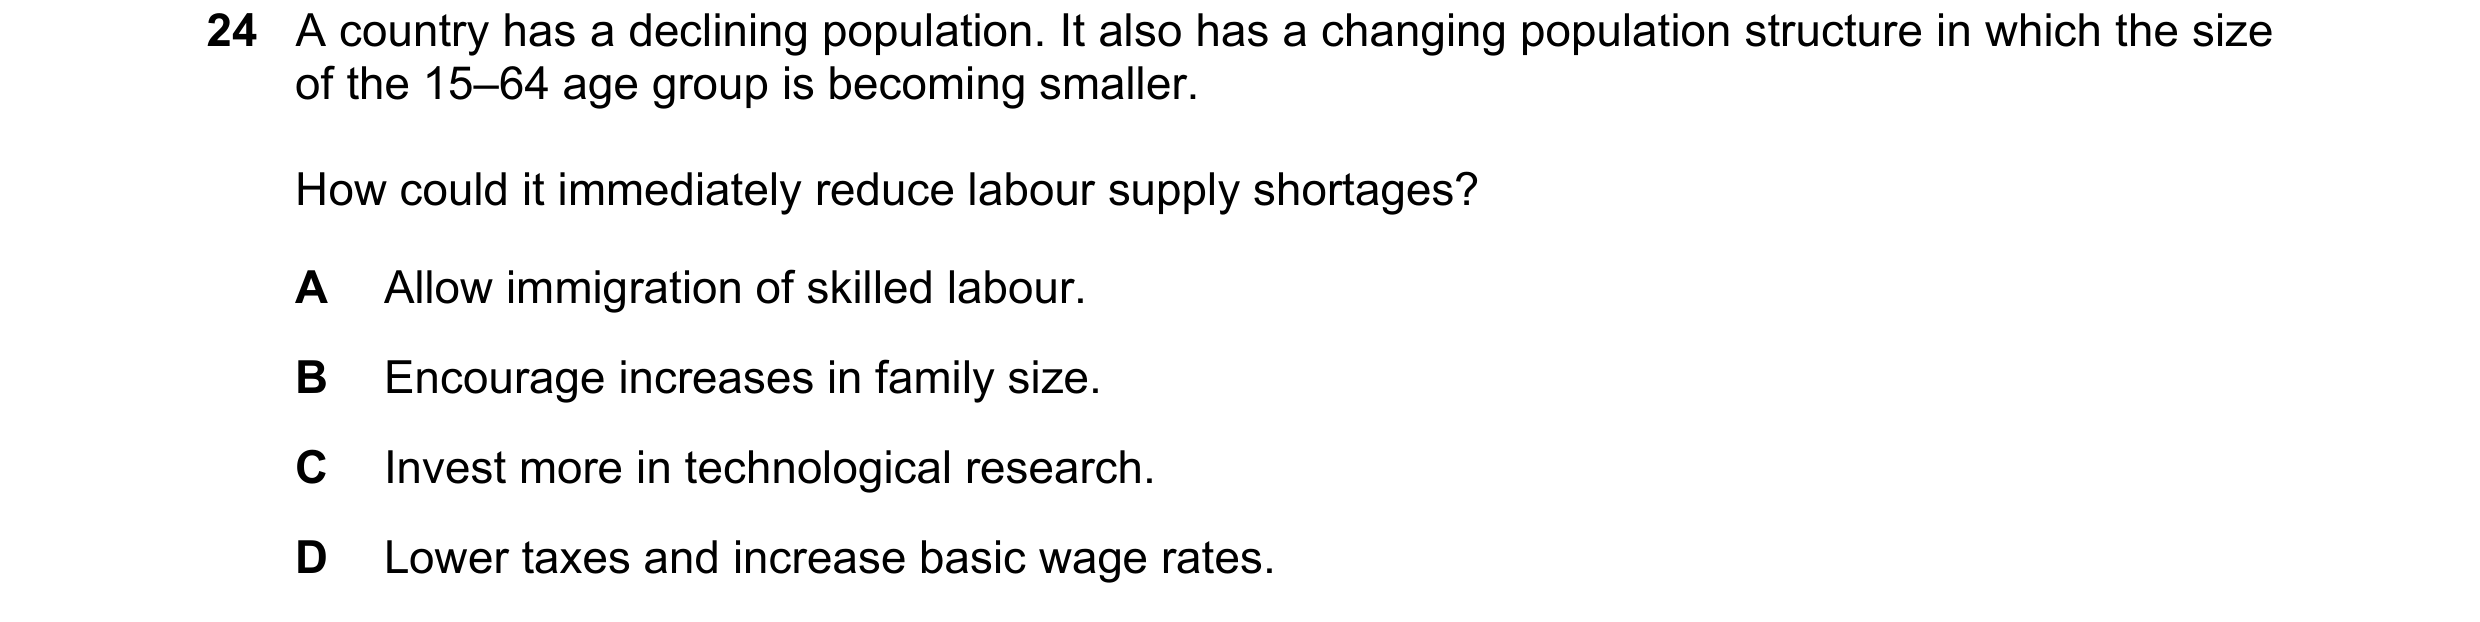
Q92 · A country has a declining population 0455/12 Feb/March 2020
24 A country has a declining population. It also has a changing population structure in which the size of the 15–64 age group is becoming smaller. How could it immediately reduce labour supply shortages? A Allow immigration of skilled labour. B Encourage increases in family size. C Invest more in technological research. D Lower taxes and increase basic wage rates.
1 marks
This question in 0455/12 Feb/March 2020
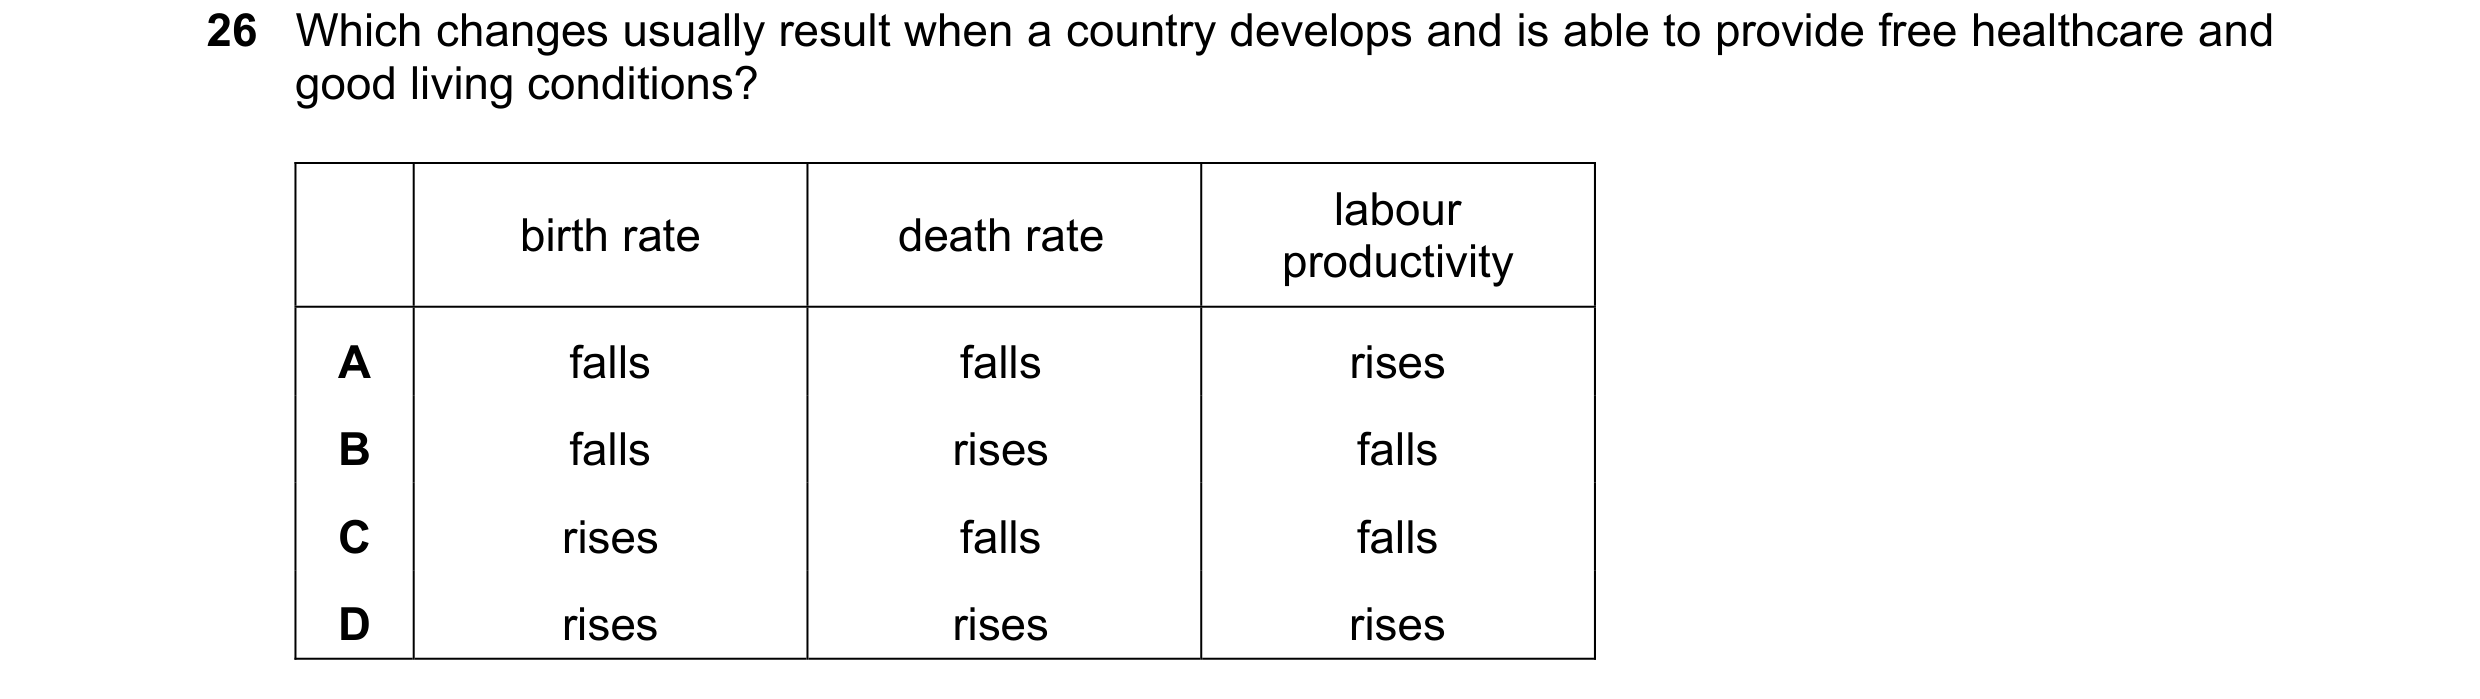
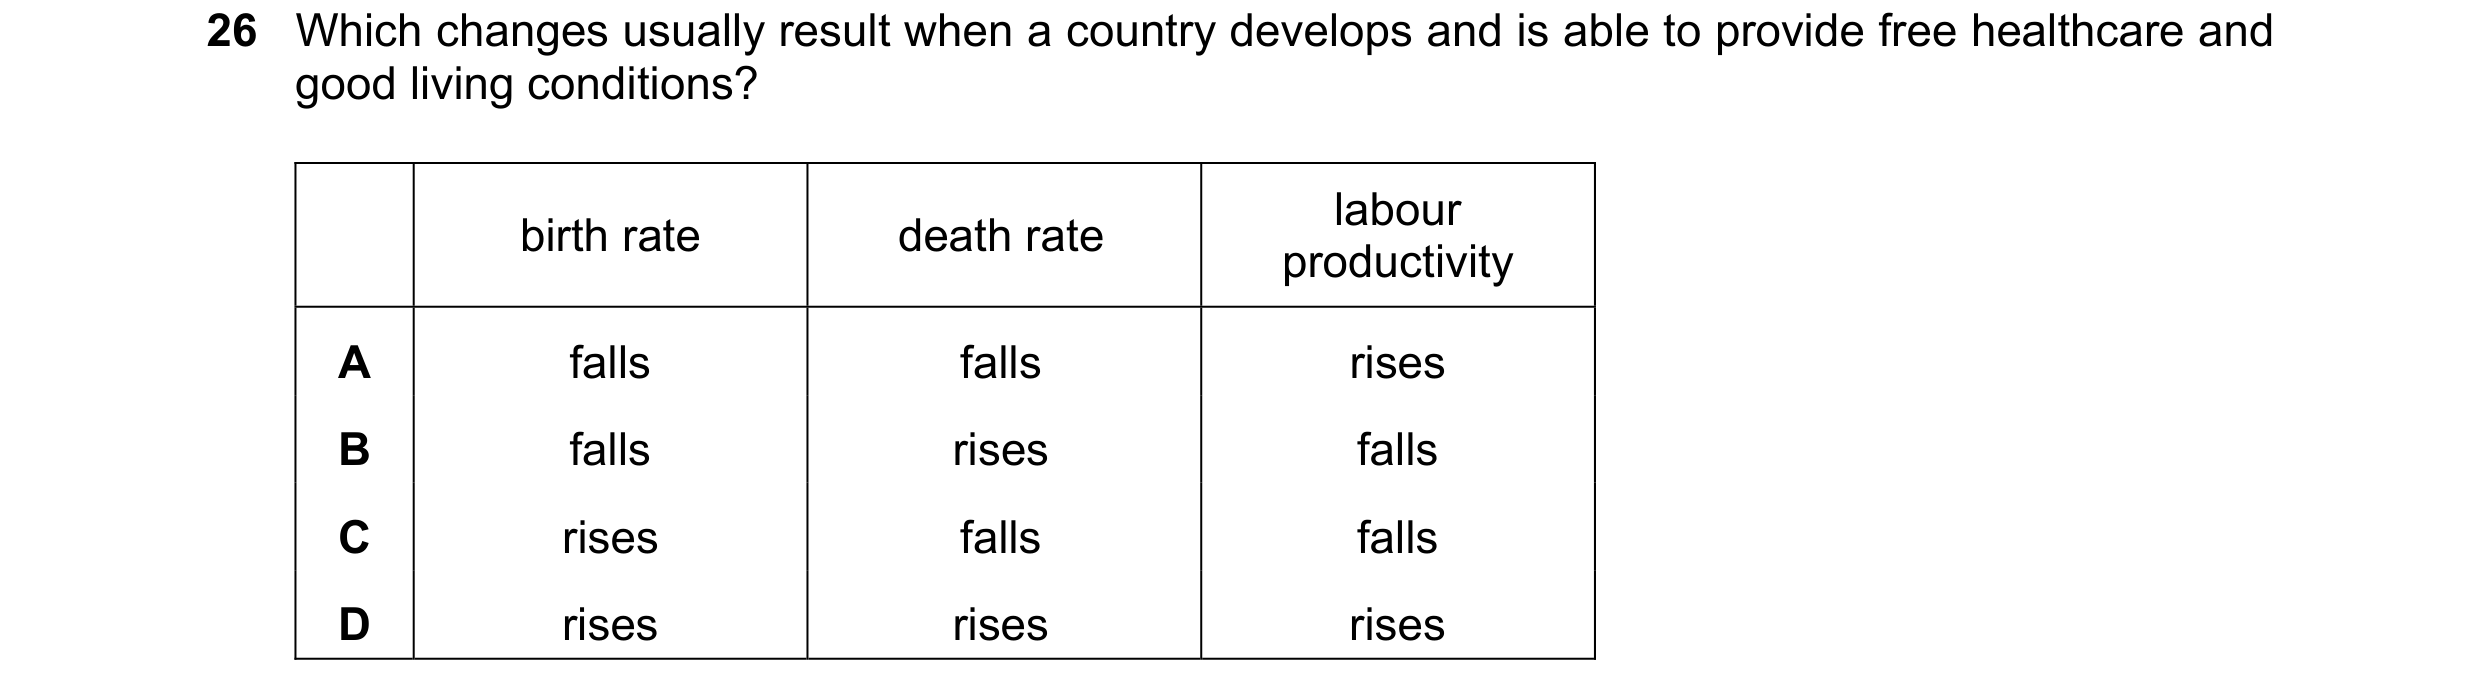
Q93 · Which changes usually result when a country develops and is able to provide free… 0455/11 May/June 2020
26 Which changes usually result when a country develops and is able to provide free healthcare and good living conditions? labour birth rate death rate productivity A falls falls rises B falls rises falls C rises falls falls D rises rises rises
1 marks
Answer: A
This question in 0455/11 May/June 2020
Q94 · Which changes usually result when a country develops and is able to provide free… 0455/12 May/June 2020
26 Which changes usually result when a country develops and is able to provide free healthcare and good living conditions? labour birth rate death rate productivity A falls falls rises B falls rises falls C rises falls falls D rises rises rises
1 marks
Answer: A
This question in 0455/12 May/June 2020
Q95 · Which changes usually result when a country develops and is able to provide free… 0455/13 May/June 2020
26 Which changes usually result when a country develops and is able to provide free healthcare and good living conditions? labour birth rate death rate productivity A falls falls rises B falls rises falls C rises falls falls D rises rises rises
1 marks
Answer: A
This question in 0455/13 May/June 2020
Q96 · Which factor in the world’s low-income countries limits their economic development? 0455/11 Oct/Nov 2020
25 Which factor in the world’s low-income countries limits their economic development? A balance of payments surpluses B high saving ratios C large inflows of foreign investment D rapid population growth
1 marks
Answer: D
This question in 0455/11 Oct/Nov 2020
Q97 · What causes the birth rate to fall in a country? 0455/12 Oct/Nov 2020
27 What causes the birth rate to fall in a country? A Fewer women work. B Infant mortality rates rise. C Medical supplies and healthcare improve. D The optimum population increases.
1 marks
Answer: C
This question in 0455/12 Oct/Nov 2020
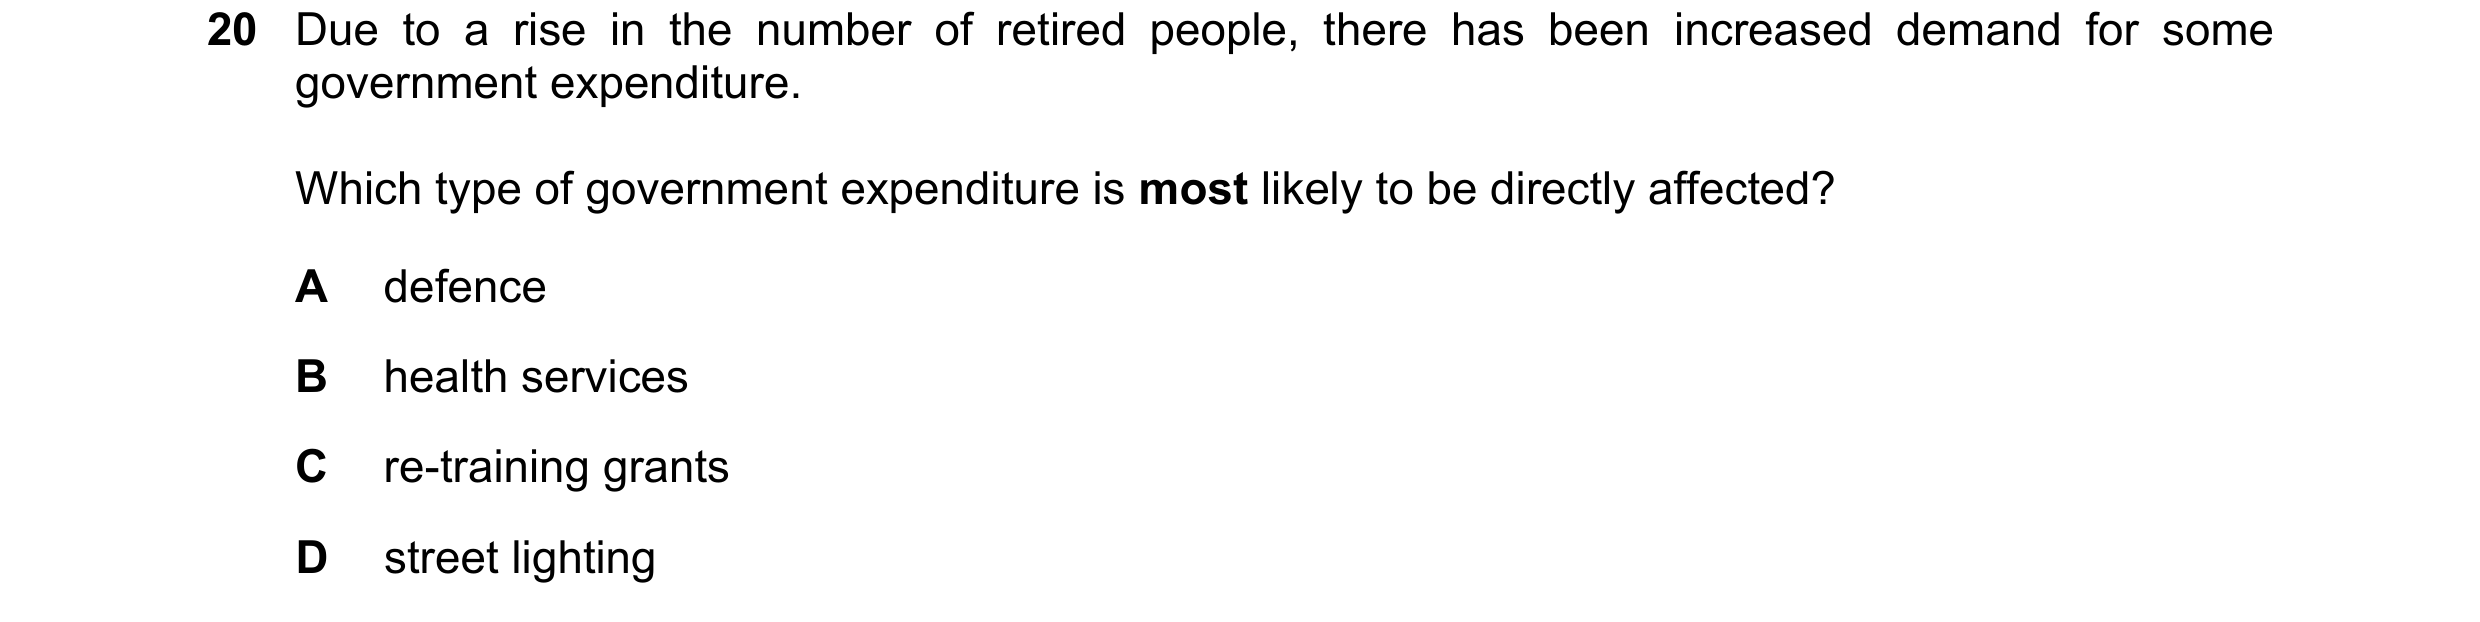
Q98 · Due to a rise in the number of retired people, there has been increased demand for some… 0455/13 Oct/Nov 2020
20 Due to a rise in the number of retired people, there has been increased demand for some government expenditure. Which type of government expenditure is most likely to be directly affected? A defence B health services C re-training grants D street lighting
1 marks
Answer: B
This question in 0455/13 Oct/Nov 2020
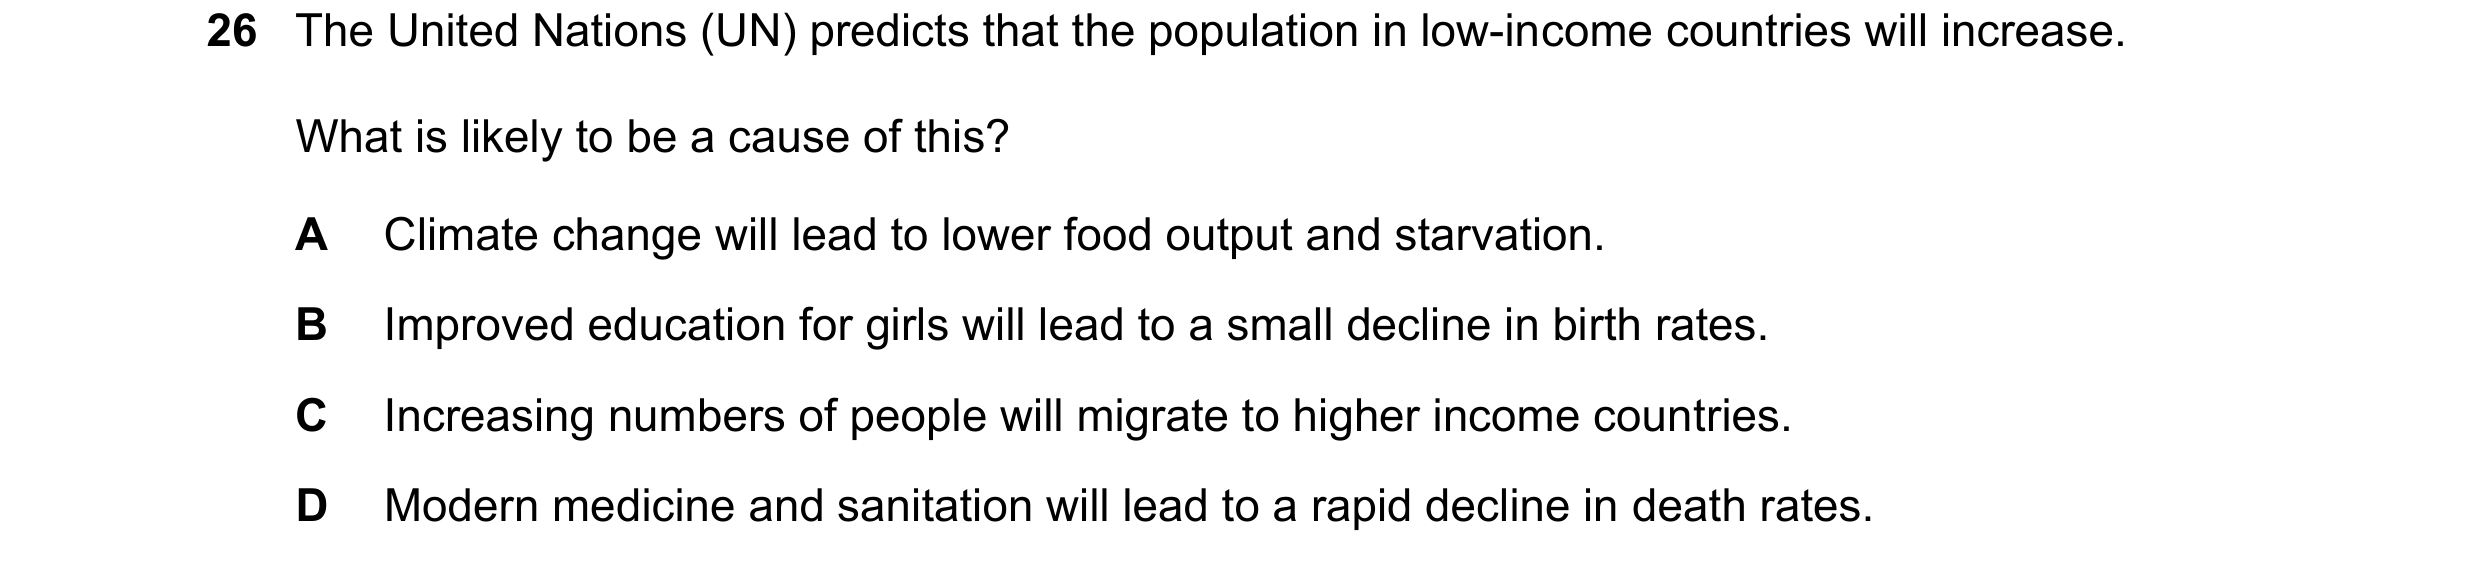
Q99 · The United Nations (UN) predicts that the population in low-income countries will increase 0455/12 Feb/March 2021
26 The United Nations (UN) predicts that the population in low-income countries will increase. What is likely to be a cause of this? A Climate change will lead to lower food output and starvation. B Improved education for girls will lead to a small decline in birth rates. C Increasing numbers of people will migrate to higher income countries. D Modern medicine and sanitation will lead to a rapid decline in death rates.
1 marks
Answer: D
This question in 0455/12 Feb/March 2021
Q100 · The diagrams show birth rate (BR) and death rate (DR) in three countries, X, Y and Z, in… 0455/11 May/June 2021
24 The diagrams show birth rate (BR) and death rate (DR) in three countries, X, Y and Z, in two years, 1 and 2. There was no migration. X Y Z BR BR BR and and BR and DR DR DR DR BR DR DR BR 1 2 1 2 1 2 year year year Where was there a rise in population in year 1 and a fall in population in year 2? A X and Z B X only C Y and Z D Y only
1 marks
Answer: D
This question in 0455/11 May/June 2021
Q101 · The diagrams show birth rate (BR) and death rate (DR) in three countries, X, Y and Z, in… 0455/12 May/June 2021
24 The diagrams show birth rate (BR) and death rate (DR) in three countries, X, Y and Z, in two years, 1 and 2. There was no migration. X Y Z BR BR BR and and BR and DR DR DR DR BR DR DR BR 1 2 1 2 1 2 year year year Where was there a rise in population in year 1 and a fall in population in year 2? A X and Z B X only C Y and Z D Y only
1 marks
Answer: D
This question in 0455/12 May/June 2021
Q102 · The diagrams show birth rate (BR) and death rate (DR) in three countries, X, Y and Z, in… 0455/13 May/June 2021
24 The diagrams show birth rate (BR) and death rate (DR) in three countries, X, Y and Z, in two years, 1 and 2. There was no migration. X Y Z BR BR BR and and BR and DR DR DR DR BR DR DR BR 1 2 1 2 1 2 year year year Where was there a rise in population in year 1 and a fall in population in year 2? A X and Z B X only C Y and Z D Y only
1 marks
Answer: D
This question in 0455/13 May/June 2021
Q103 · The birth rate in a country is higher than the death rate 0455/11 Oct/Nov 2021
25 The birth rate in a country is higher than the death rate. What might prevent the country’s population from rising? A Emigration is greater than immigration. B The birth rate is falling. C The country’s medical care improves. D The death rate is rising.
1 marks
Answer: A
This question in 0455/11 Oct/Nov 2021
Q104 · What is the effect on an economy of net emigration of people aged 20–40? 0455/12 Oct/Nov 2021
25 What is the effect on an economy of net emigration of people aged 20–40? A a more mobile labour force B an ageing population C higher government tax revenue D rising house prices
1 marks
Answer: B
This question in 0455/12 Oct/Nov 2021
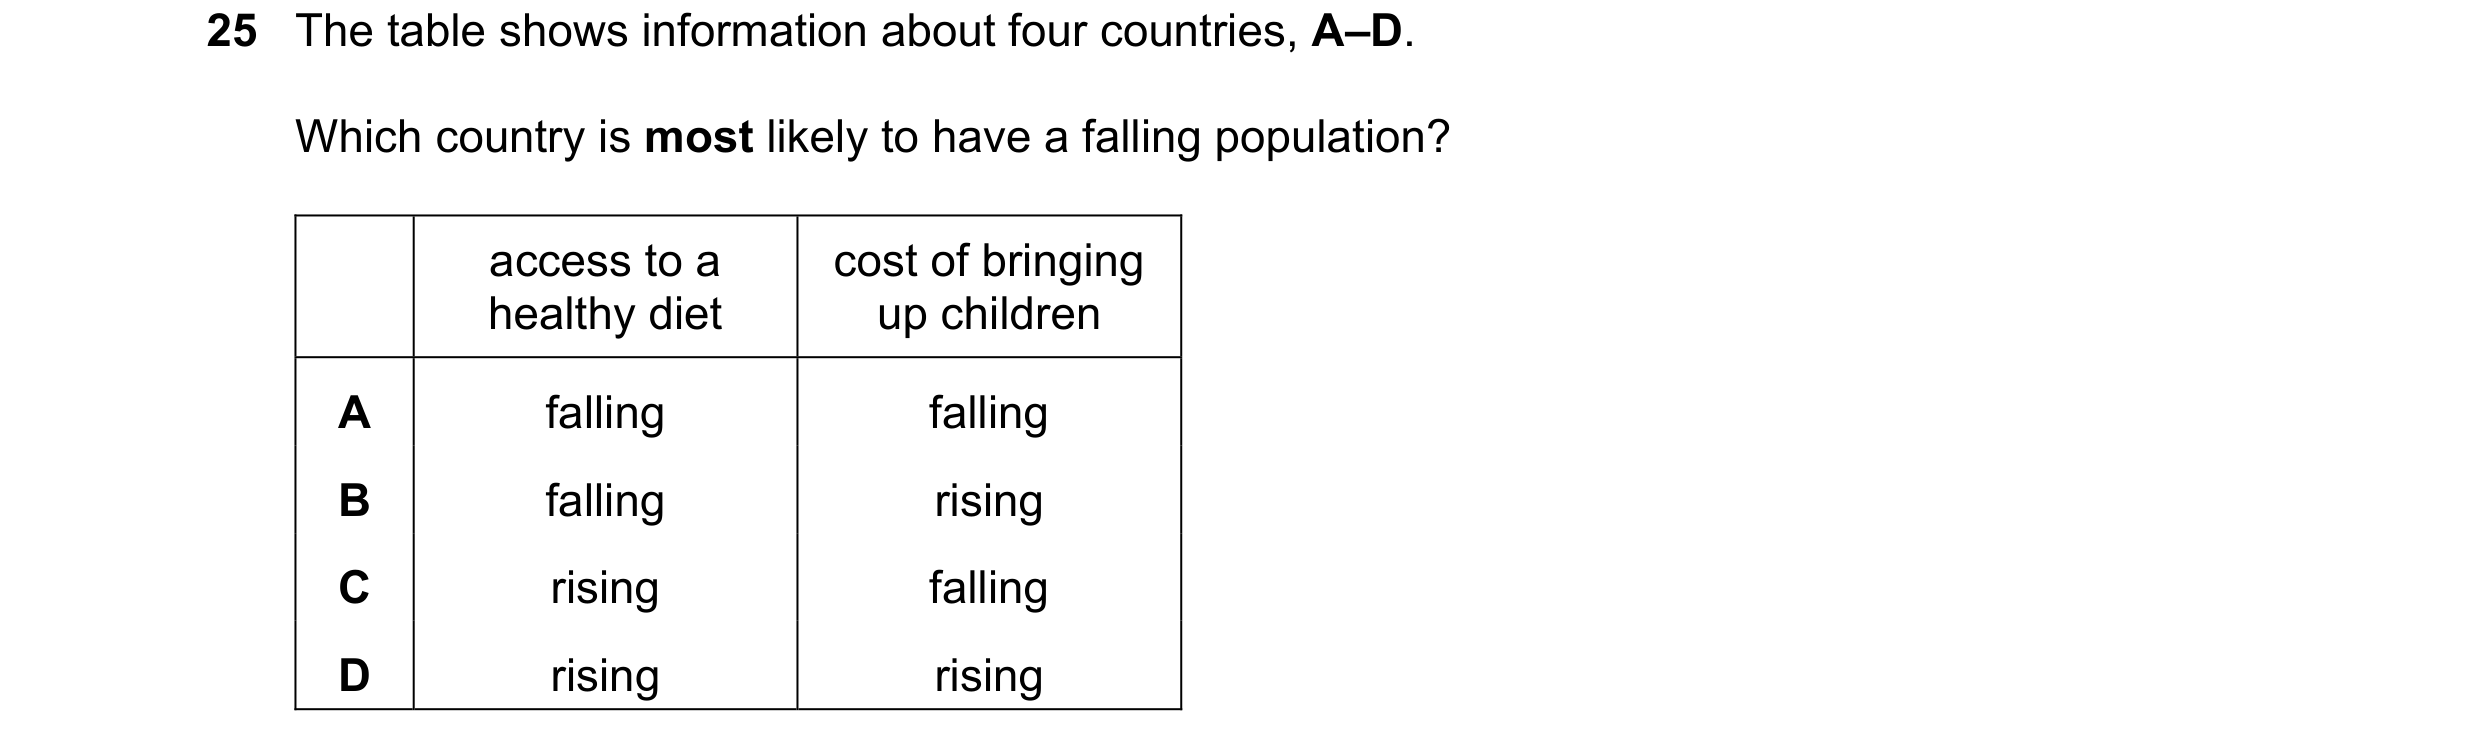
Q105 · The table shows information about four countries, A–D 0455/13 Oct/Nov 2021
25 The table shows information about four countries, A–D. Which country is most likely to have a falling population? access to a cost of bringing healthy diet up children A falling falling B falling rising C rising falling D rising rising
1 marks
Answer: B
This question in 0455/13 Oct/Nov 2021
Q106 · What is likely to cause an immediate decrease in the size of the labour force? 0455/11 May/June 2022
30 What is likely to cause an immediate decrease in the size of the labour force? A a fall in the average size of families B a fall in the birth rate C a reduction in the age of retirement D an increase in net immigration
1 marks
Answer: C
This question in 0455/11 May/June 2022
Q107 · What is likely to cause an immediate decrease in the size of the labour force? 0455/12 May/June 2022
25 What is likely to cause an immediate decrease in the size of the labour force? A a fall in the average size of families B a fall in the birth rate C a reduction in the age of retirement D an increase in net immigration
1 marks
Answer: C
This question in 0455/12 May/June 2022
Q108 · What is likely to cause an immediate decrease in the size of the labour force? 0455/13 May/June 2022
25 What is likely to cause an immediate decrease in the size of the labour force? A a fall in the average size of families B a fall in the birth rate C a reduction in the age of retirement D an increase in net immigration
1 marks
Answer: C
This question in 0455/13 May/June 2022
Q109 · What is the usual effect of net immigration for a high-income country? 0455/13 Oct/Nov 2022
26 What is the usual effect of net immigration for a high-income country? A an increase in the size of the labour force B a rise in the average age of the population C lower economic growth D reduced demand for housing
1 marks
Answer: A
This question in 0455/13 Oct/Nov 2022
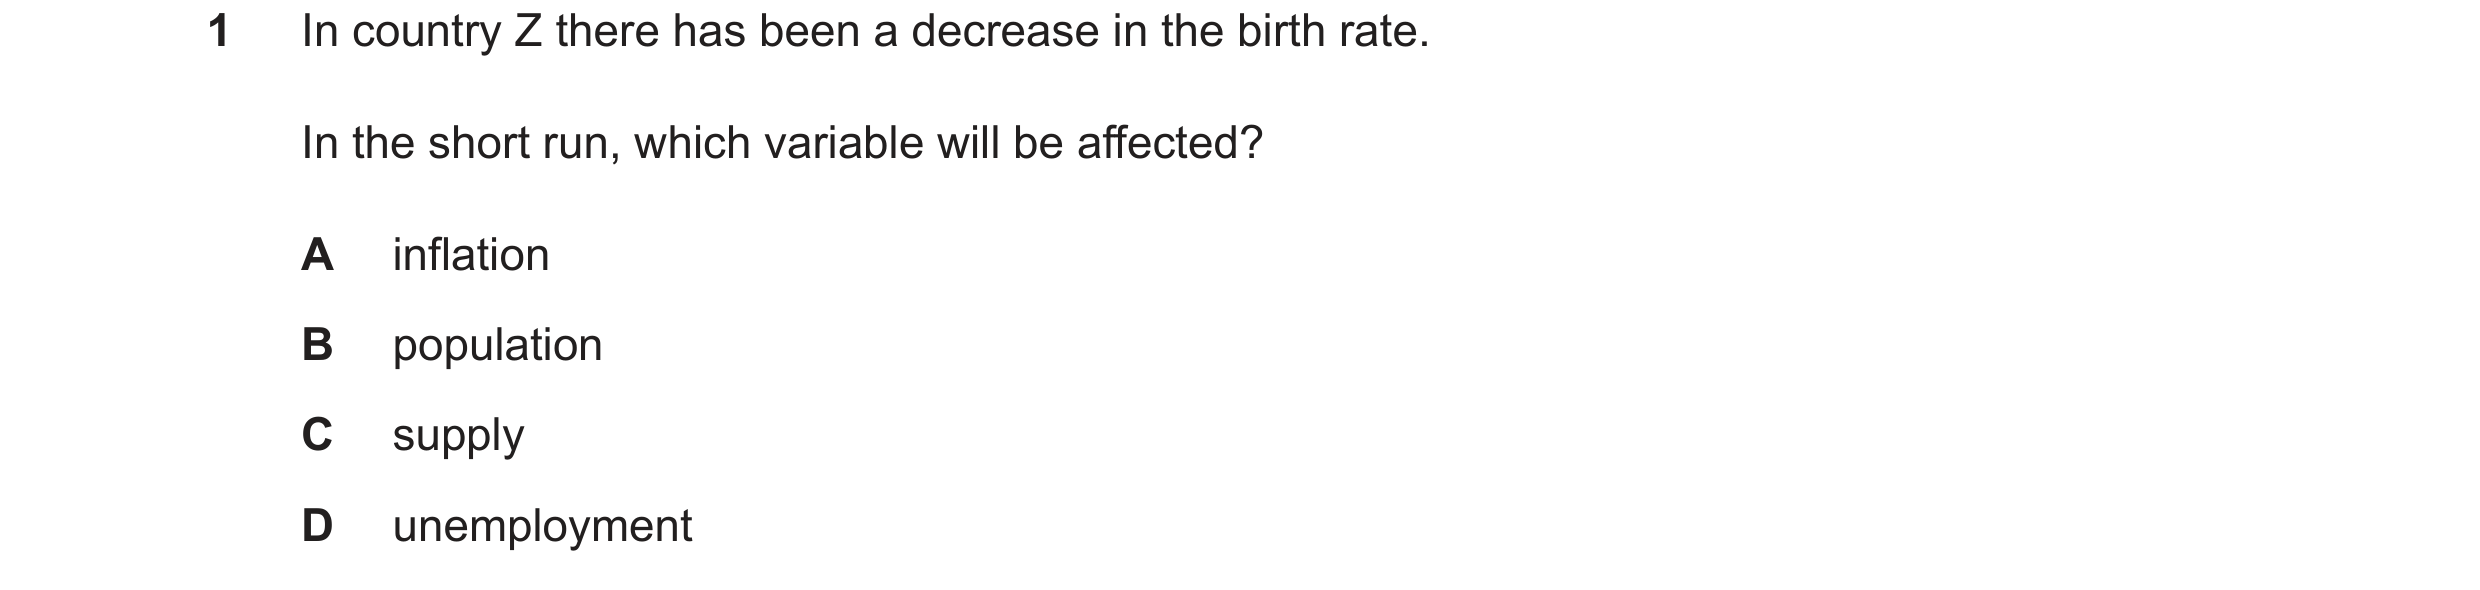
Q110 · In country Z there has been a decrease in the birth rate 0455/12 Feb/March 2023
1 In country Z there has been a decrease in the birth rate. In the short run, which variable will be affected? A inflation B population C supply D unemployment
1 marks
Answer: B
This question in 0455/12 Feb/March 2023
Q111 · A town has a population of 20000 0455/12 Feb/March 2023
25 A town has a population of 20000. The birth rate is 25 per thousand and the death rate is 15 per thousand. The number of people moving in and out of the town exactly balances. What will the population be at the end of one year? A 19800 B 20010 C 20200 D 22000
1 marks
Answer: C
This question in 0455/12 Feb/March 2023
Q112 · Other things being equal, what will cause a population both to increase and to age? 0455/11 May/June 2023
25 Other things being equal, what will cause a population both to increase and to age? A a fall in the birth rate B a fall in the death rate C a rise in both the birth rate and the death rate D a rise in the death rate and a fall in the birth rate
1 marks
Answer: B
This question in 0455/11 May/June 2023
Q113 · What might explain the high population growth in some developing countries? 0455/13 May/June 2023
25 What might explain the high population growth in some developing countries? A high birth rates and falling death rates B low immigration and high emigration C falling birth rates and rising death rates D falling life expectancy
1 marks
Answer: A
This question in 0455/13 May/June 2023
Q114 · Which situation must produce an ageing population? 0455/11 Oct/Nov 2023
25 Which situation must produce an ageing population? A a falling birth rate and a falling death rate B a rising birth rate and a rising death rate C a rising marriage rate and a falling death rate D a falling marriage rate and a rising death rate
1 marks
Answer: A
This question in 0455/11 Oct/Nov 2023
Q115 · What is the most likely consequence of an ageing population for a high-income economy? 0455/12 Oct/Nov 2023
25 What is the most likely consequence of an ageing population for a high-income economy? A There will be a fall in the dependency ratio. B There will be a fall in the level of immigration. C There will be an increase in geographic mobility. D There will be an increase in spending on healthcare.
1 marks
Answer: D
This question in 0455/12 Oct/Nov 2023
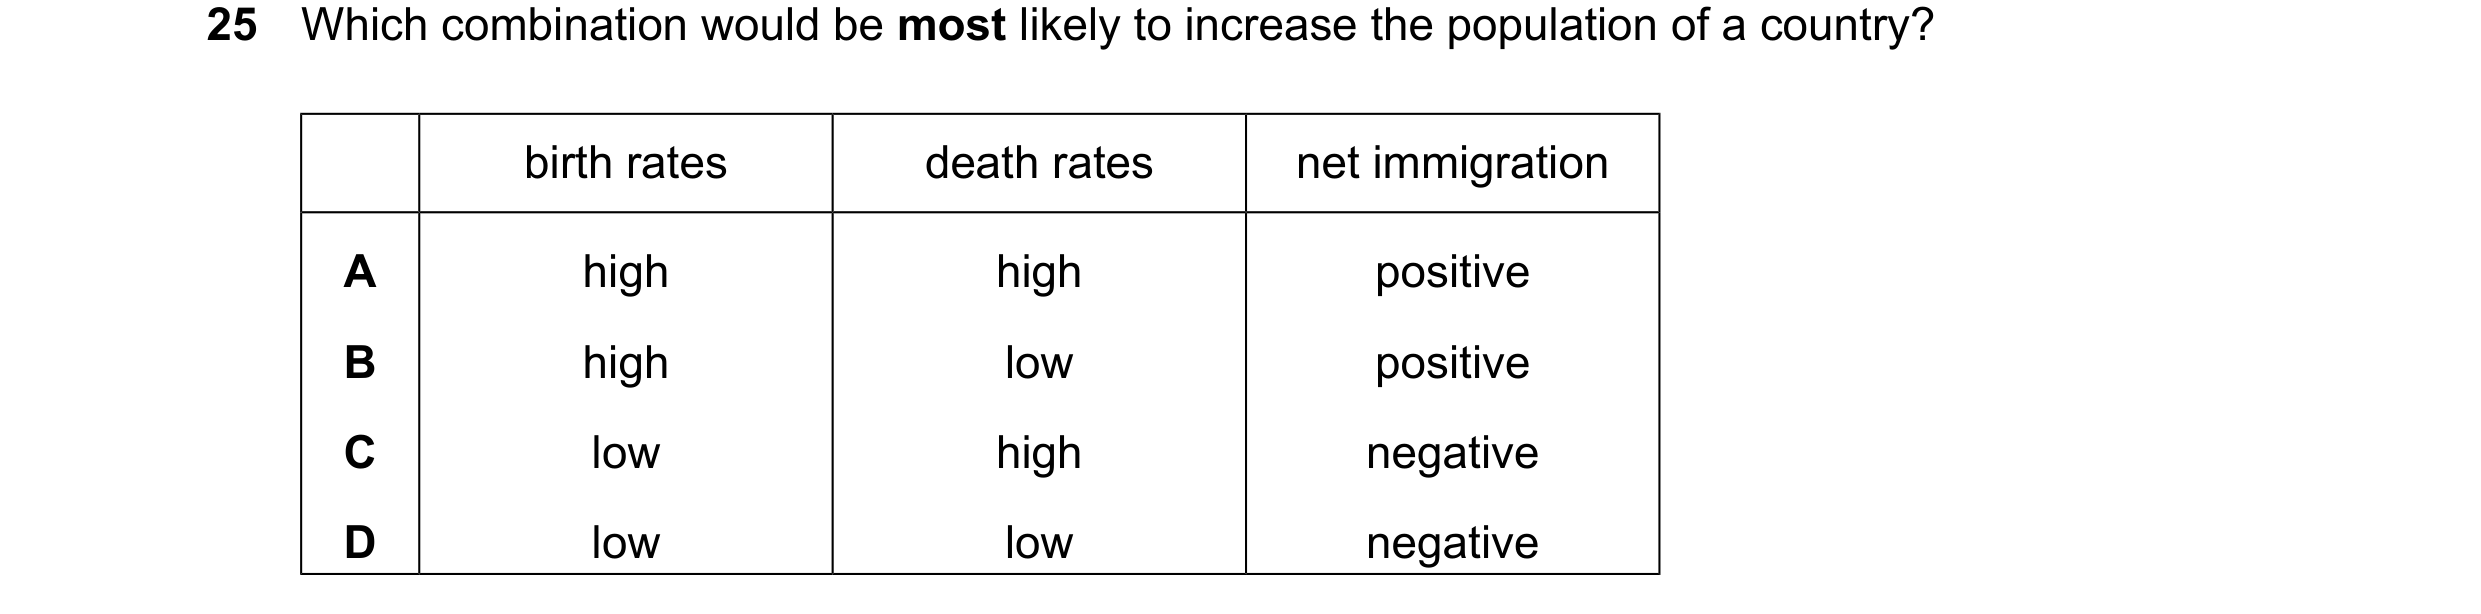
Q116 · Which combination would be most likely to increase the population of a country? 0455/13 Oct/Nov 2023
25 Which combination would be most likely to increase the population of a country? birth rates death rates net immigration A high high positive B high low positive C low high negative D low low negative
1 marks
Answer: B
This question in 0455/13 Oct/Nov 2023
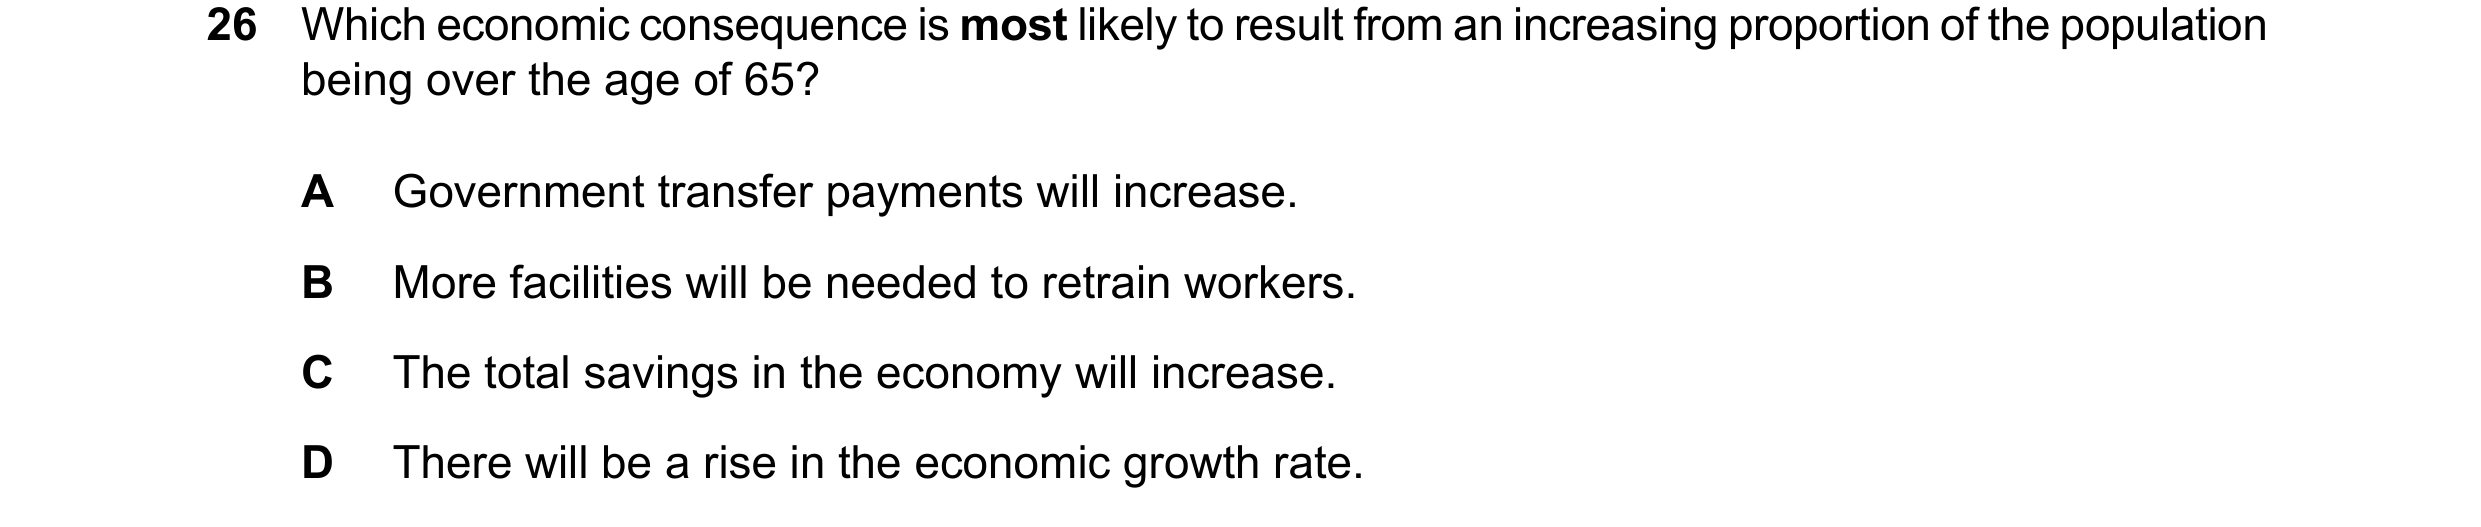
Q117 · Which economic consequence is most likely to result from an increasing proportion of the… 0455/13 Oct/Nov 2023
26 Which economic consequence is most likely to result from an increasing proportion of the population being over the age of 65? A Government transfer payments will increase. B More facilities will be needed to retrain workers. C The total savings in the economy will increase. D There will be a rise in the economic growth rate.
1 marks
Answer: A
This question in 0455/13 Oct/Nov 2023
Q118 · An economy has a high rate of population growth 0455/12 Feb/March 2024
25 An economy has a high rate of population growth. What is most likely to have caused this? A The average years of schooling is relatively high. B The birth rate is lower than the death rate. C The retirement age has increased. D There are more immigrants than emigrants.
1 marks
Answer: D
This question in 0455/12 Feb/March 2024
Q119 · A rise in which factor would cause an increase in the population growth rate of a country? 0455/12 May/June 2024
26 A rise in which factor would cause an increase in the population growth rate of a country? A birth rate B death rate C infant mortality rate D net emigration
1 marks
Answer: A
This question in 0455/12 May/June 2024
Q120 · The table shows population statistics for three countries in a particular year 0455/13 May/June 2024
26 The table shows population statistics for three countries in a particular year. birth rate death rate population size (per thousand (per thousand country net migration (millions) of population of population per year) per year) X 20 10 8 +20 000 Y 30 20 18 +50 000 Z 40 40 35 −1 000 000 What can be concluded from the table? A country X has fewer females than country Y B country Y has the smallest population increase C country Y has the highest living standards D country Z has a decreasing population
1 marks
Answer: D
This question in 0455/13 May/June 2024
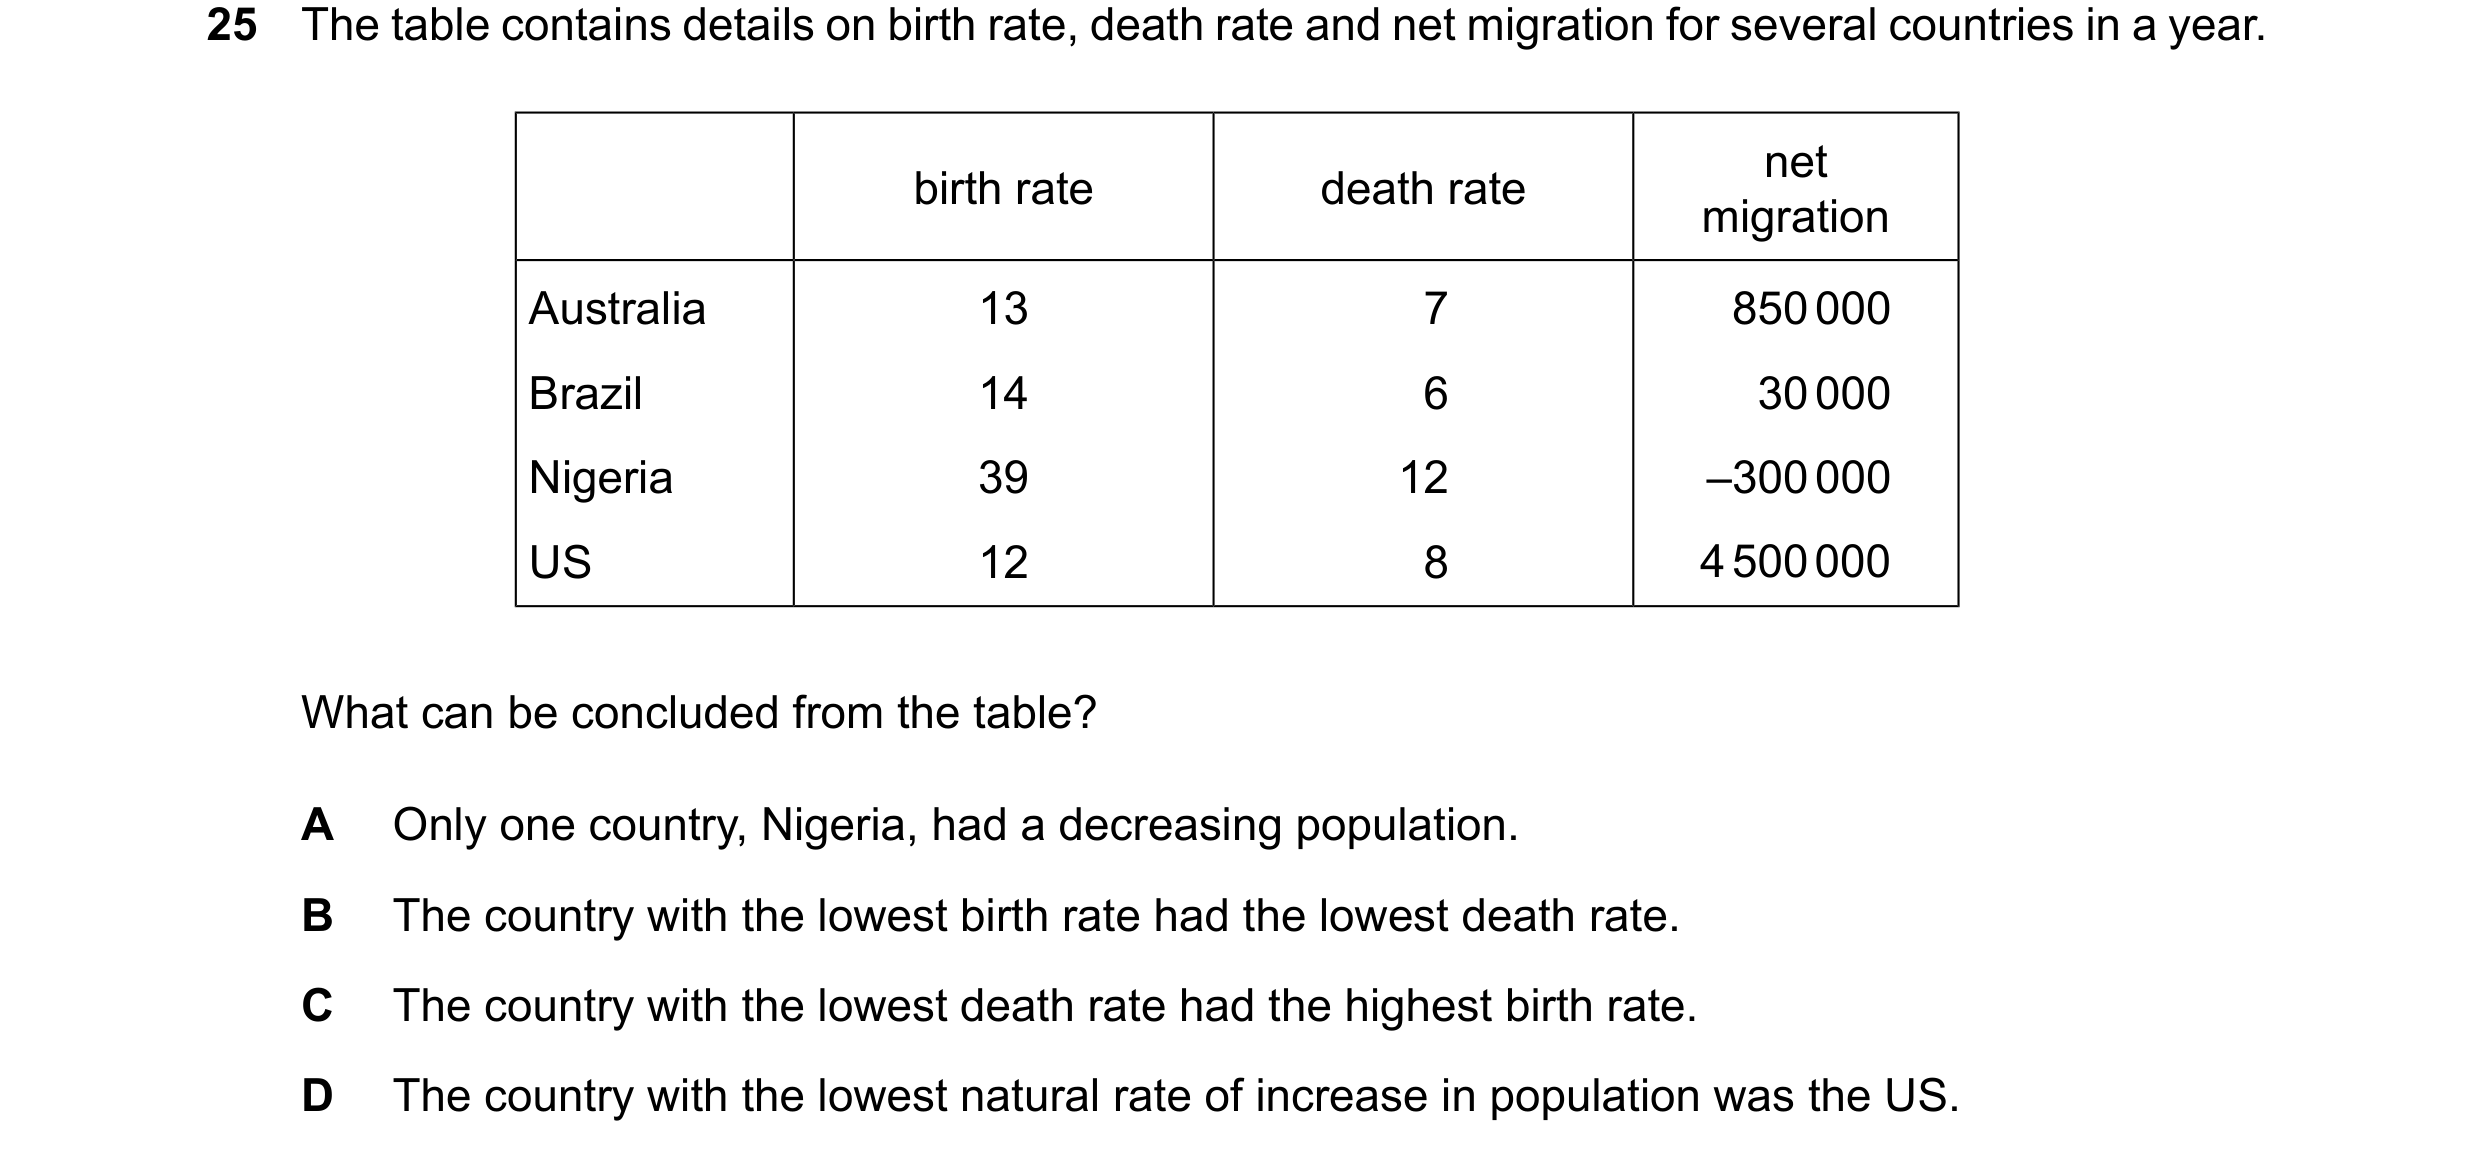
Q121 · The table contains details on birth rate, death rate and net migration for several… 0455/12 Oct/Nov 2024
25 The table contains details on birth rate, death rate and net migration for several countries in a year. net birth rate death rate migration Australia 13 7 850 000 Brazil 14 6 30 000 Nigeria 39 12 –300 000 US 12 8 4 500 000 What can be concluded from the table? A Only one country, Nigeria, had a decreasing population. B The country with the lowest birth rate had the lowest death rate. C The country with the lowest death rate had the highest birth rate. D The country with the lowest natural rate of increase in population was the US.
1 marks
Answer: D
This question in 0455/12 Oct/Nov 2024
Q122 · What is Gross Domestic Product (GDP) divided by in order to calculate GDP per head? 0455/13 Oct/Nov 2024
20 What is Gross Domestic Product (GDP) divided by in order to calculate GDP per head? A the adult population B the dependent population C the total population D the working population
1 marks
Answer: C
This question in 0455/13 Oct/Nov 2024
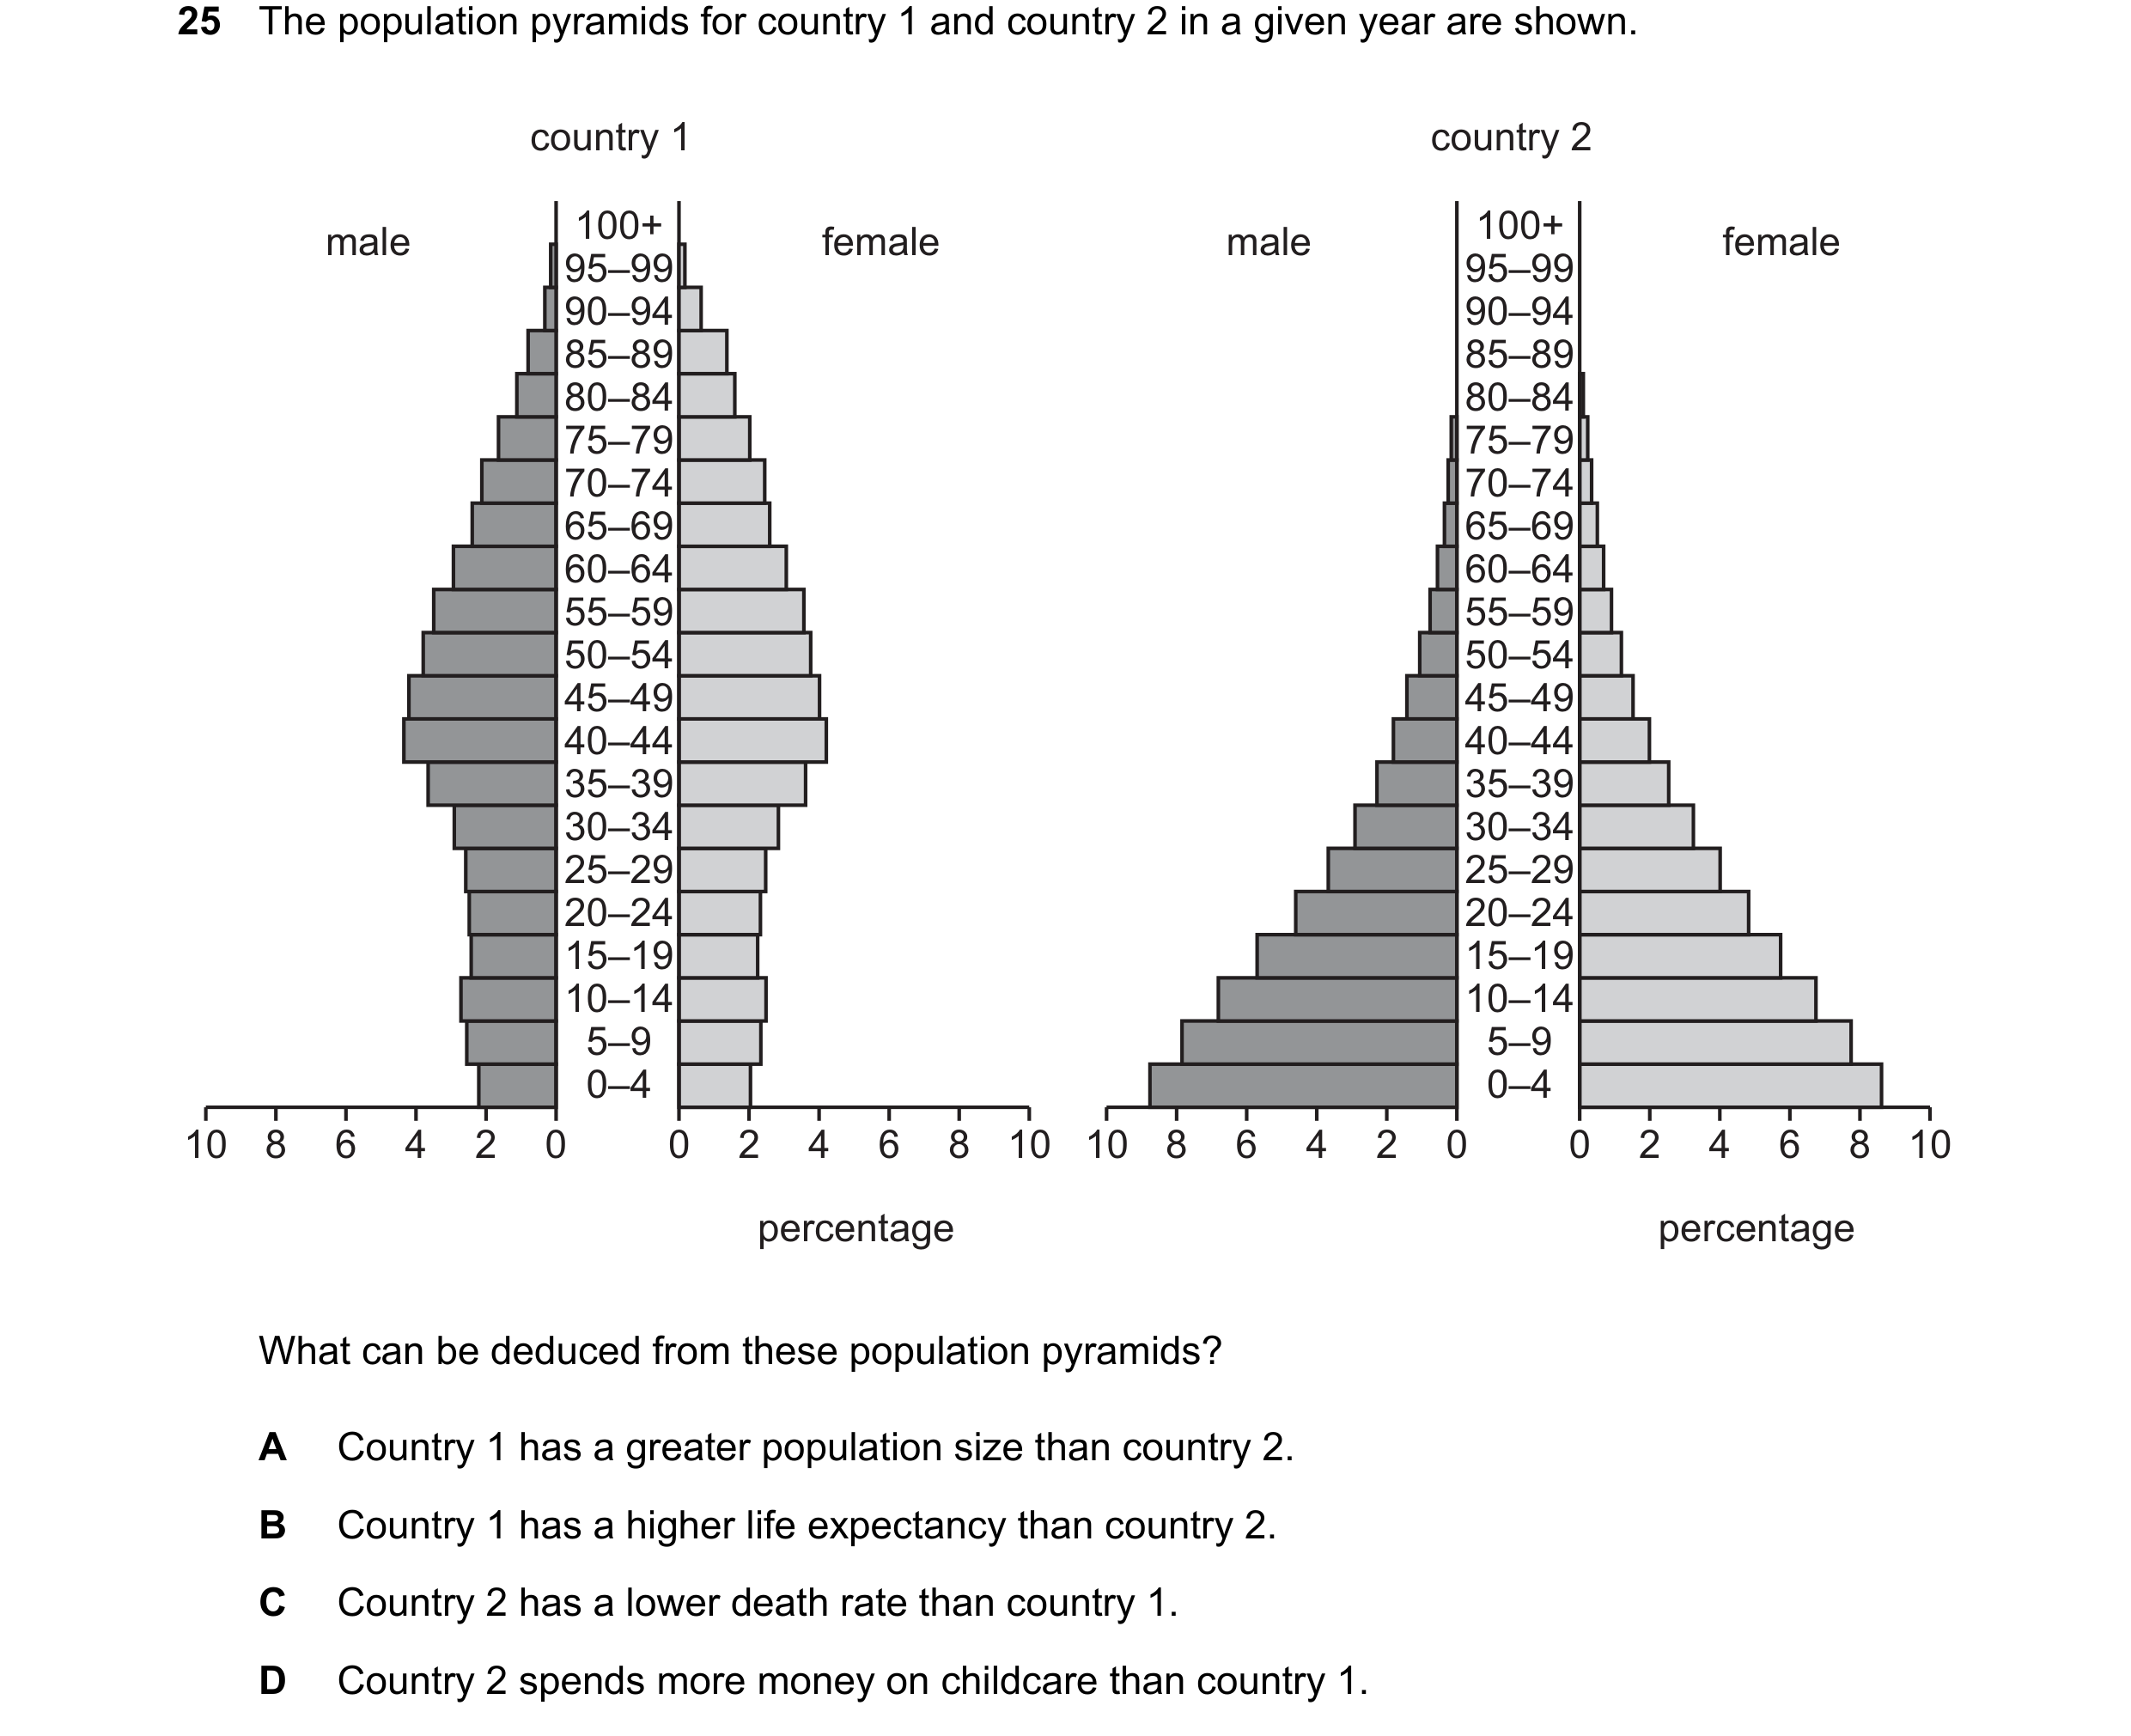
Q123 · The population pyramids for country 1 and country 2 in a given year are shown 0455/13 Oct/Nov 2024
25 The population pyramids for country 1 and country 2 in a given year are shown. country 1 country 2 male 100+ female male 100+ female 95–99 95–99 90–94 90–94 85–89 85–89 80–84 80–84 75–79 75–79 70–74 70–74 65–69 65–69 60–64 60–64 55–59 55–59 50–54 50–54 45–49 45–49 40–44 40–44 35–39 35–39 30–34 30–34 25–29 25–29 20–24 20–24 15–19 15–19 10–14 10–14 5–9 5–9 0–4 0–4 10 8 6 4 2 0 0 2 4 6 8 10 10 8 6 4 2 0 0 2 4 6 8 10 percentage percentage What can be deduced from these population pyramids? A Country 1 has a greater population size than country 2. B Country 1 has a higher life expectancy than country 2. C Country 2 has a lower death rate than country 1. D Country 2 spends more money on childcare than country 1.
1 marks
Answer: B
This question in 0455/13 Oct/Nov 2024
Q124 · The diagram shows population data for a country for 1950, 2005 and 2050 0455/12 Feb/March 2025
26 The diagram shows population data for a country for 1950, 2005 and 2050. age age age men women men women men women 100 100 100 80 80 80 60 60 60 40 40 40 20 20 20 0 0 0 1.2 0.8 0.4 0 0 0.4 0.8 1.2 1.2 0.8 0.4 0 0 0.4 0.8 1.2 0.8 0.4 0 0 0.4 0.8 population population population millions millions millions 1950 2005 2050 (forecast) What can be concluded from the diagram? A Men outnumber women in each year. B People are living longer over the period. C The population has grown continuously. D The workforce has grown continuously.
1 marks
Answer: B
This question in 0455/12 Feb/March 2025
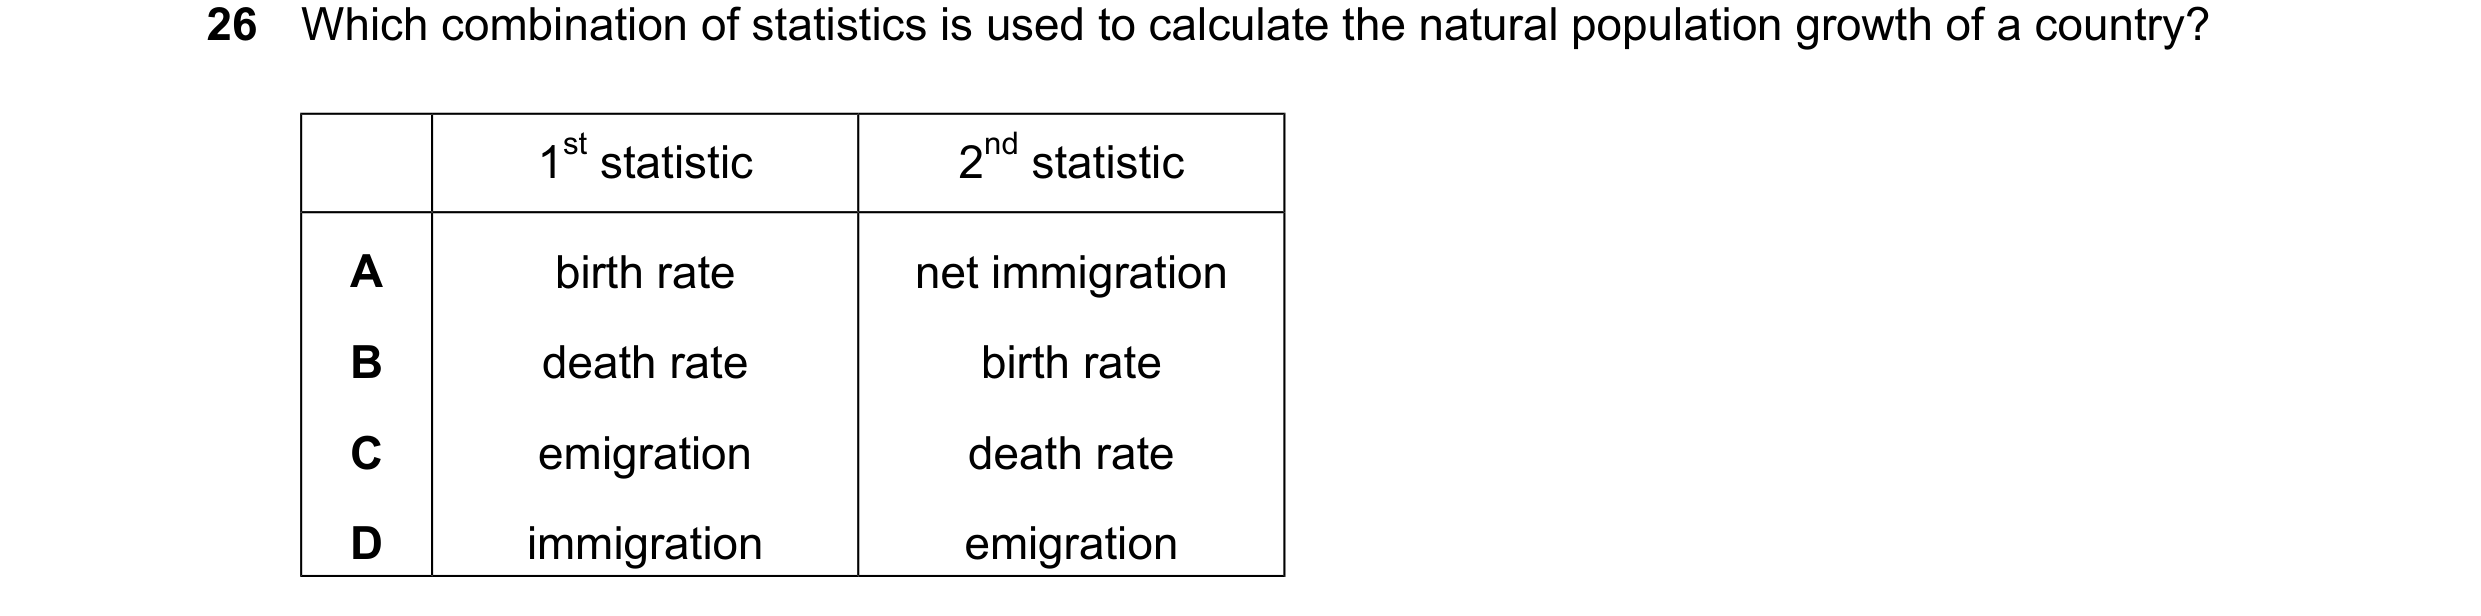
Q125 · Which combination of statistics is used to calculate the natural population growth of a… 0455/11 May/June 2025
26 Which combination of statistics is used to calculate the natural population growth of a country? 1st statistic 2nd statistic A birth rate net immigration B death rate birth rate C emigration death rate D immigration emigration
1 marks
Answer: B
This question in 0455/11 May/June 2025
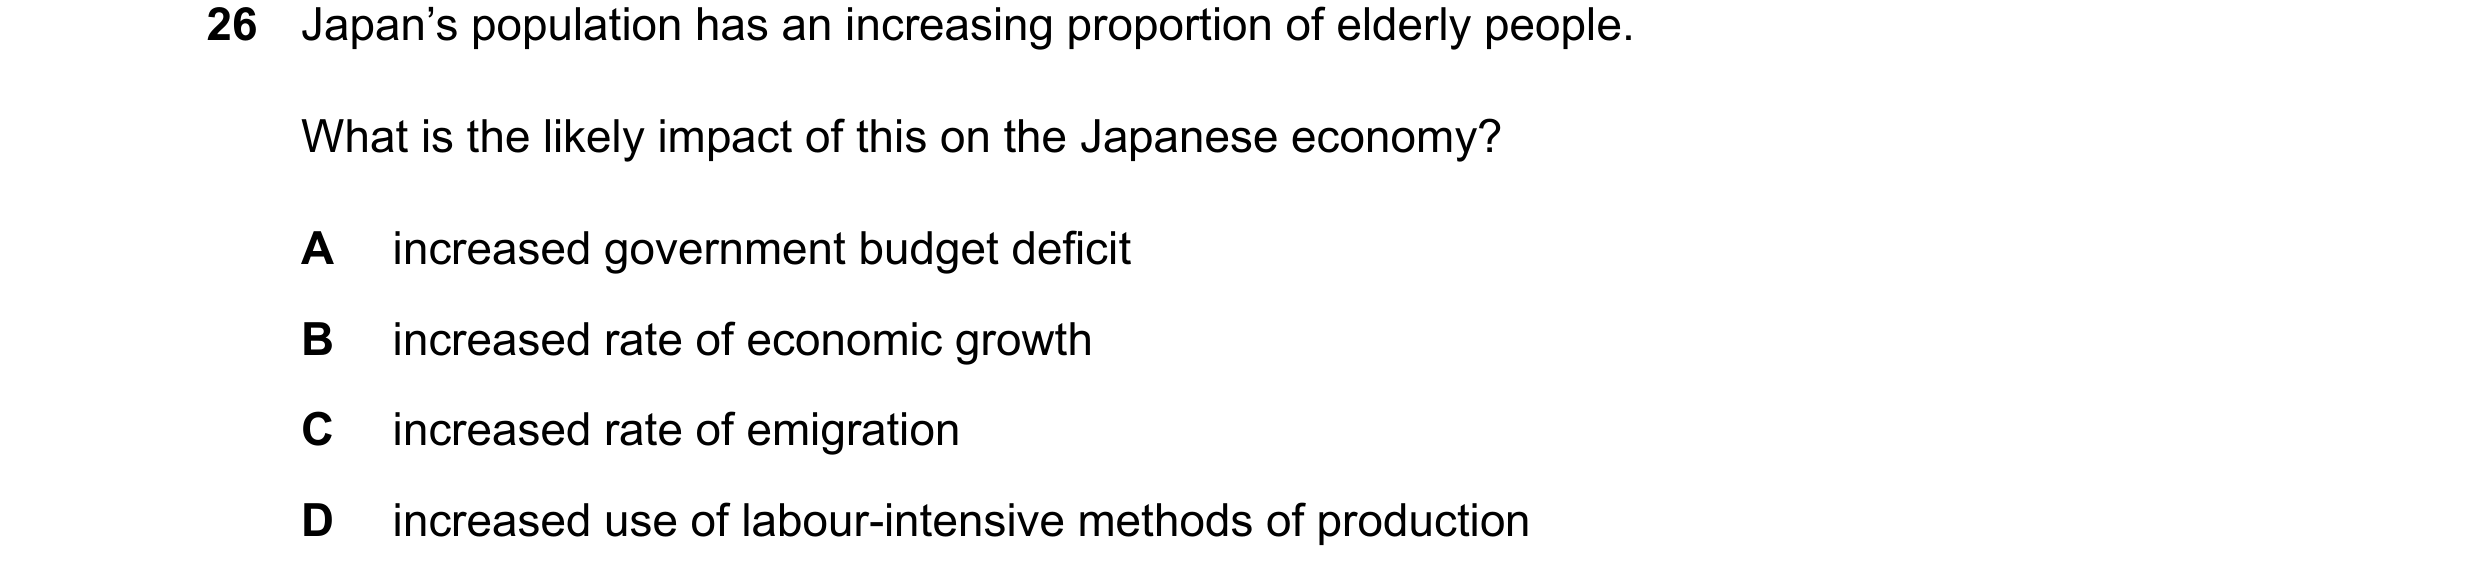
Q126 · Japan’s population has an increasing proportion of elderly people 0455/12 May/June 2025
26 Japan’s population has an increasing proportion of elderly people. What is the likely impact of this on the Japanese economy? A increased government budget deficit B increased rate of economic growth C increased rate of emigration D increased use of labour-intensive methods of production
1 marks
Answer: A
This question in 0455/12 May/June 2025
Q127 · What will increase a country's population, all other things being equal? 0455/13 May/June 2025
26 What will increase a country's population, all other things being equal? A a rise in emigration B a rise in immigration C death rates higher than birth rates D decreased life expectancy
1 marks
Answer: B
This question in 0455/13 May/June 2025
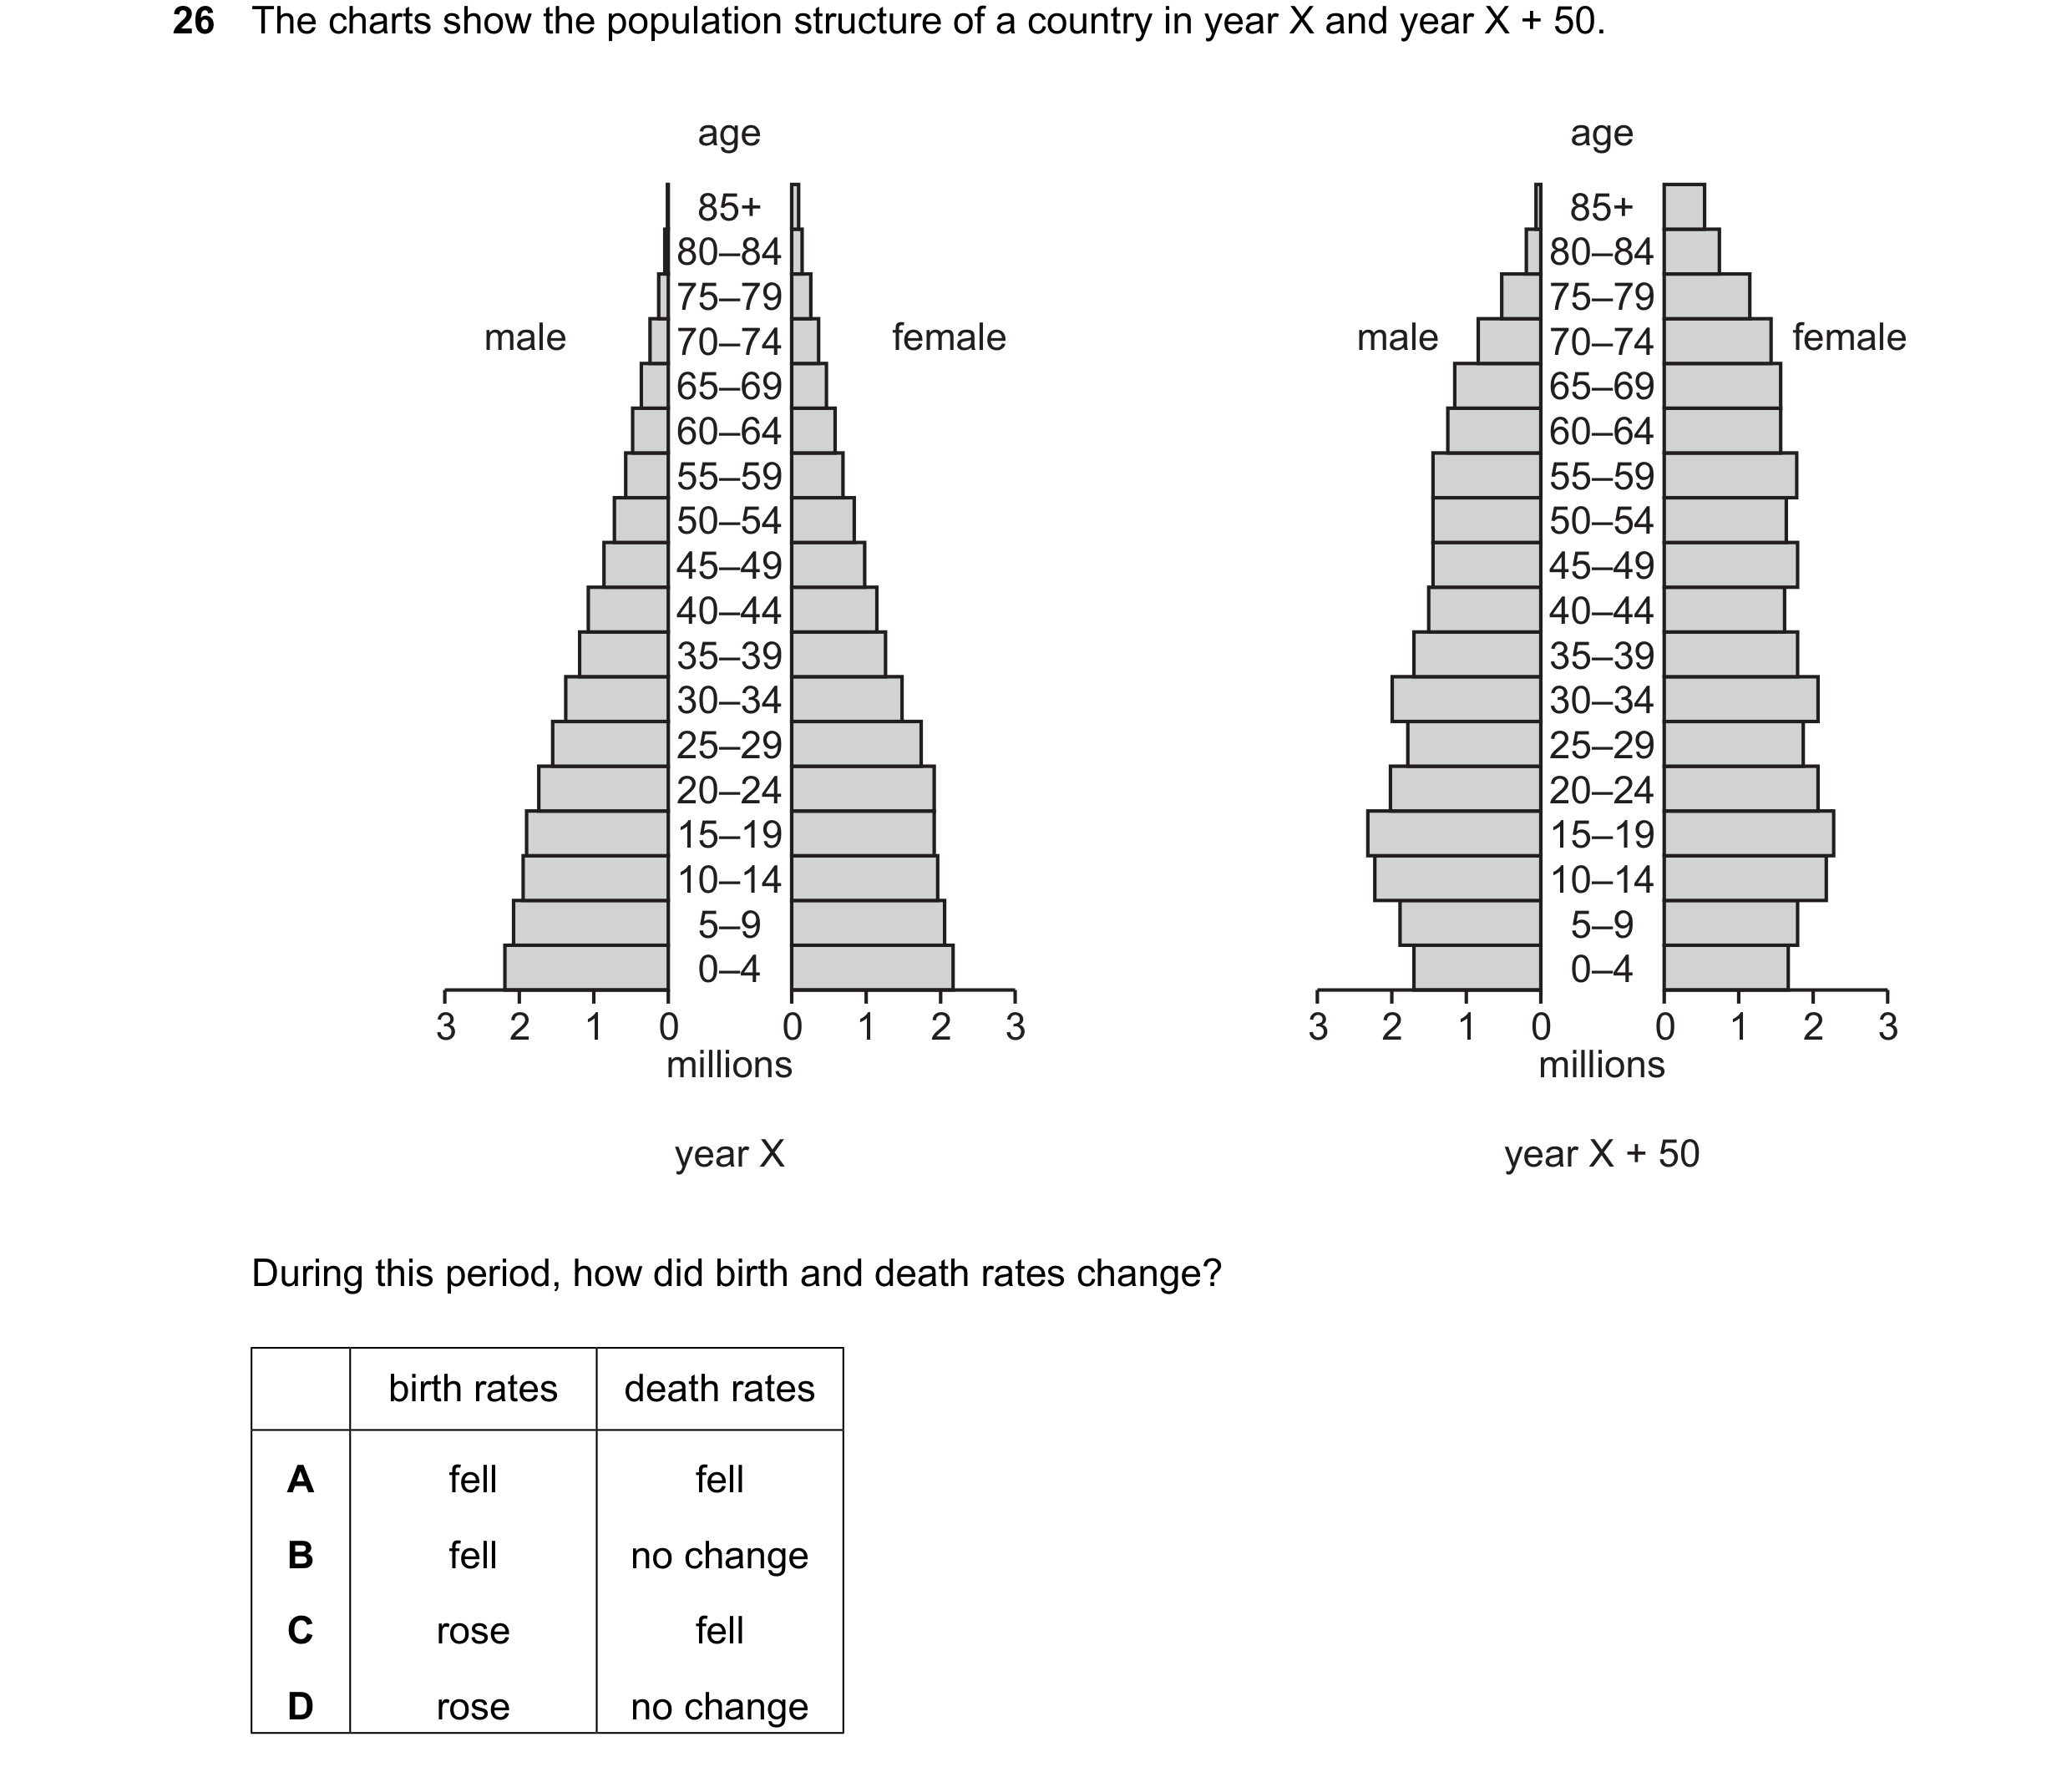
Q128 · The charts show the population structure of a country in year X and year X + 50 0455/11 Oct/Nov 2025
26 The charts show the population structure of a country in year X and year X + 50. age age 85+ 85+ 80–84 80–84 75–79 75–79 male 70–74 female male 70–74 female 65–69 65–69 60–64 60–64 55–59 55–59 50–54 50–54 45–49 45–49 40–44 40–44 35–39 35–39 30–34 30–34 25–29 25–29 20–24 20–24 15–19 15–19 10–14 10–14 5–9 5–9 0–4 0–4 3 2 1 0 0 1 2 3 3 2 1 0 0 1 2 3 millions millions year X year X + 50 During this period, how did birth and death rates change? birth rates death rates A fell fell B fell no change C rose fell D rose no change
1 marks
Answer: A
This question in 0455/11 Oct/Nov 2025
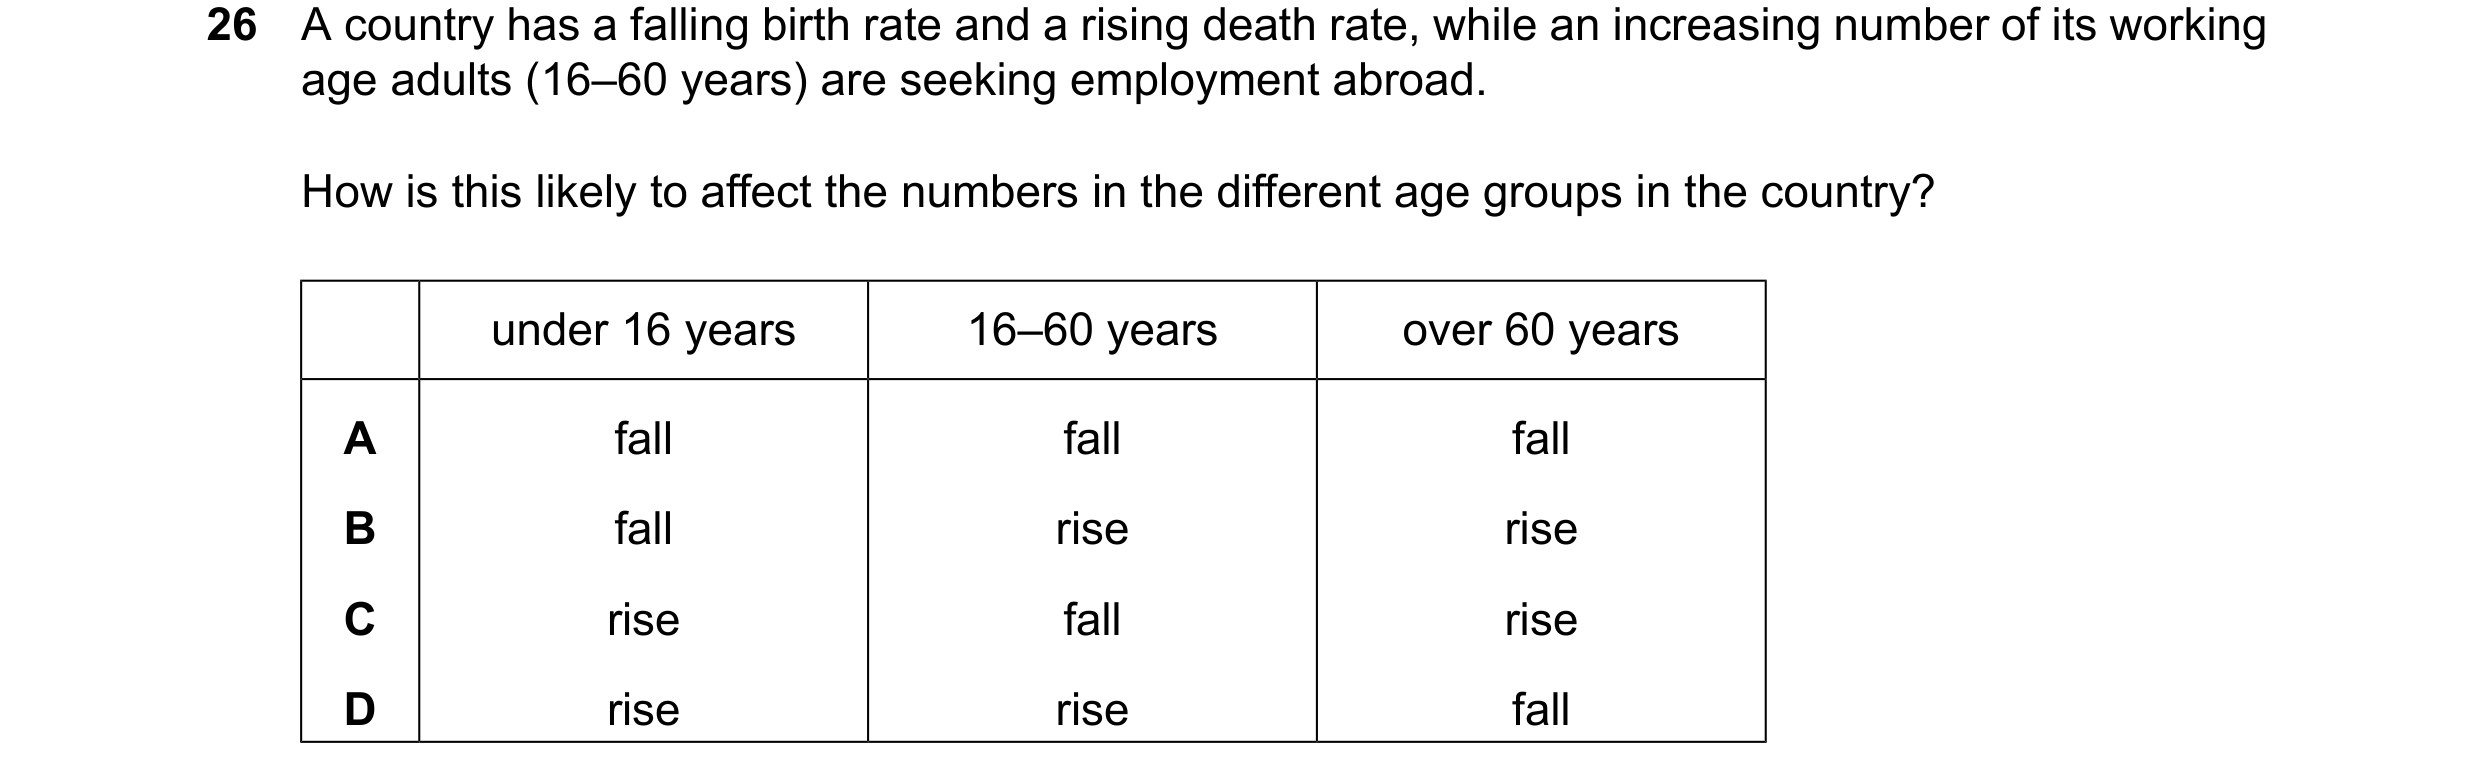
Q129 · A country has a falling birth rate and a rising death rate, while an increasing number of… 0455/12 Oct/Nov 2025
26 A country has a falling birth rate and a rising death rate, while an increasing number of its working age adults (16–60 years) are seeking employment abroad. How is this likely to affect the numbers in the different age groups in the country? under 16 years 16–60 years over 60 years A fall fall fall B fall rise rise C rise fall rise D rise rise fall
1 marks
Answer: A
This question in 0455/12 Oct/Nov 2025
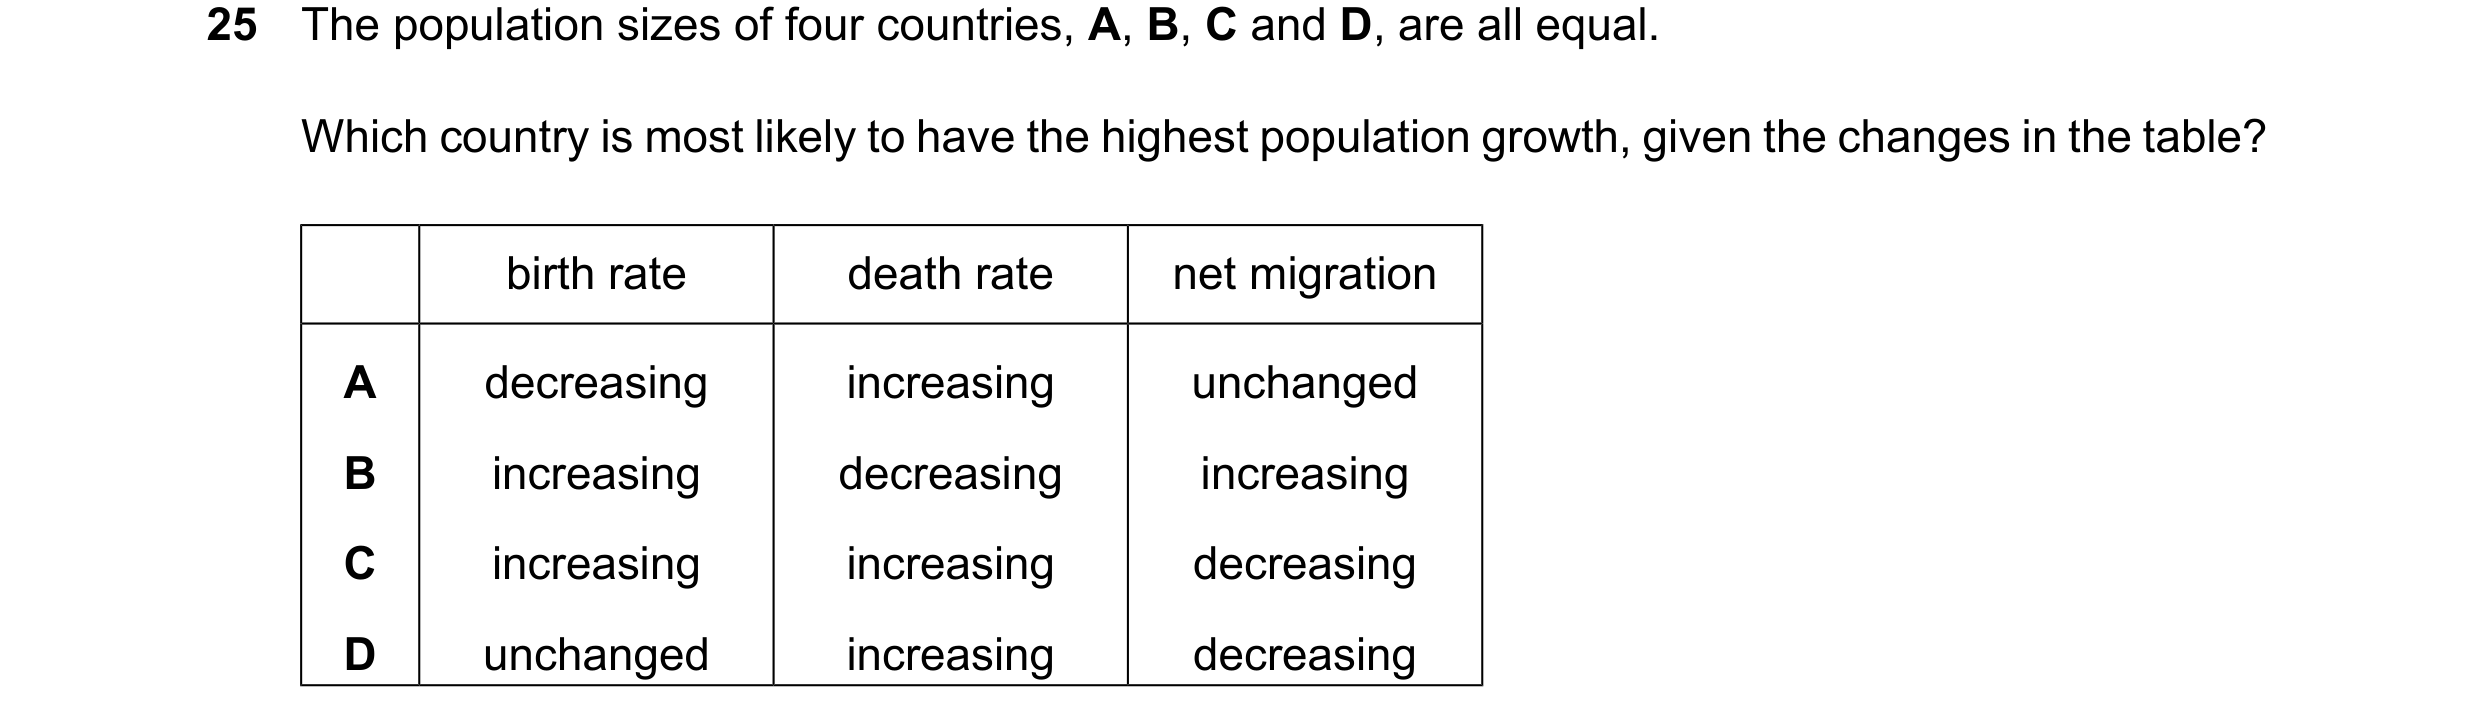
Q130 · The population sizes of four countries, A, B, C and D, are all equal 0455/13 Oct/Nov 2025
25 The population sizes of four countries, A, B, C and D, are all equal. Which country is most likely to have the highest population growth, given the changes in the table? birth rate death rate net migration A decreasing increasing unchanged B increasing decreasing increasing C increasing increasing decreasing D unchanged increasing decreasing
1 marks
Answer: B
This question in 0455/13 Oct/Nov 2025
 1 / 36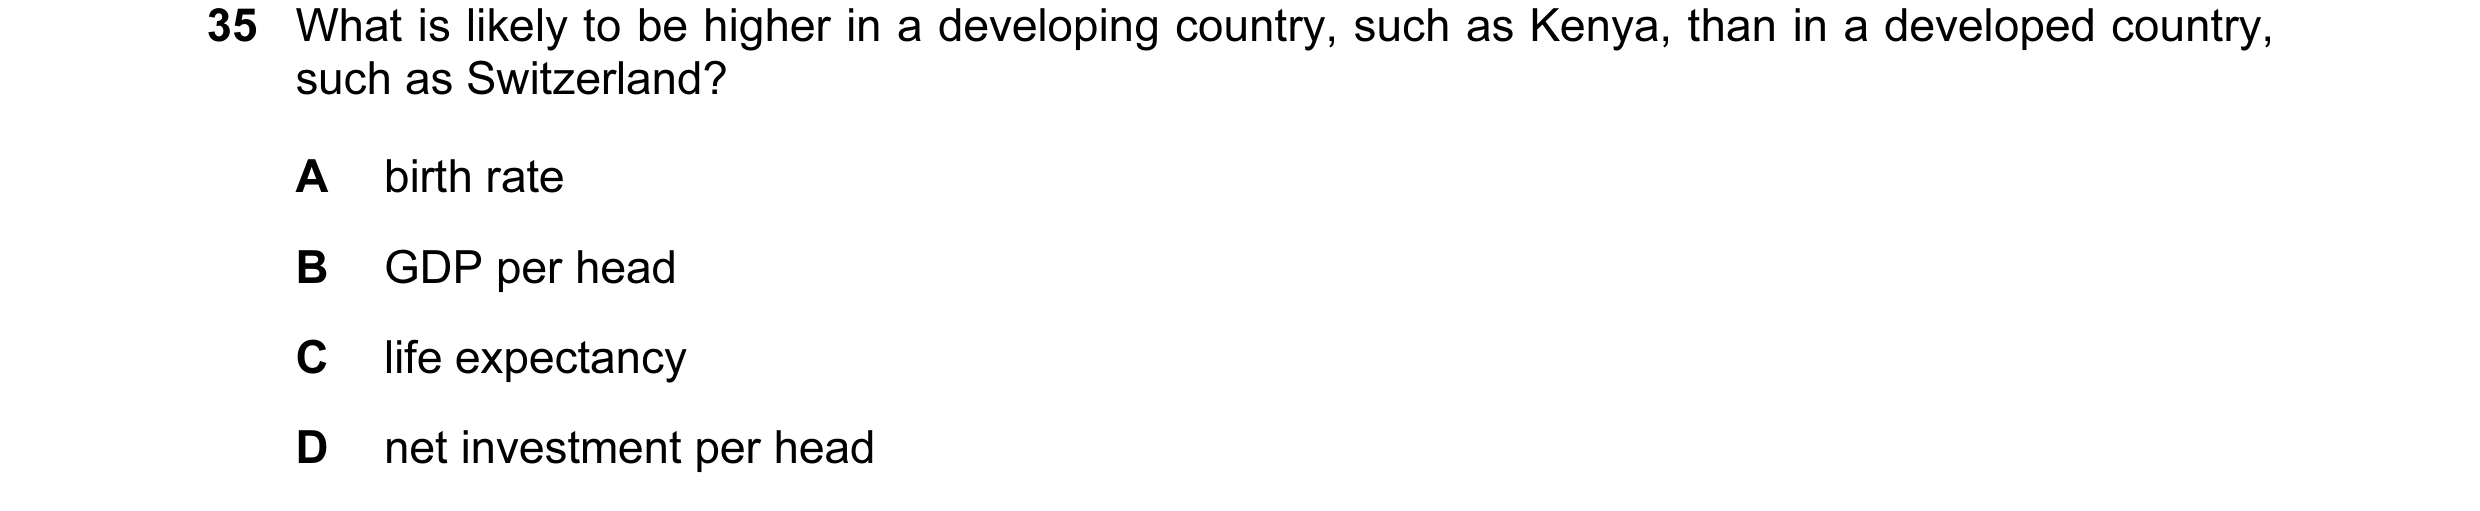


 2 / 36

 3 / 36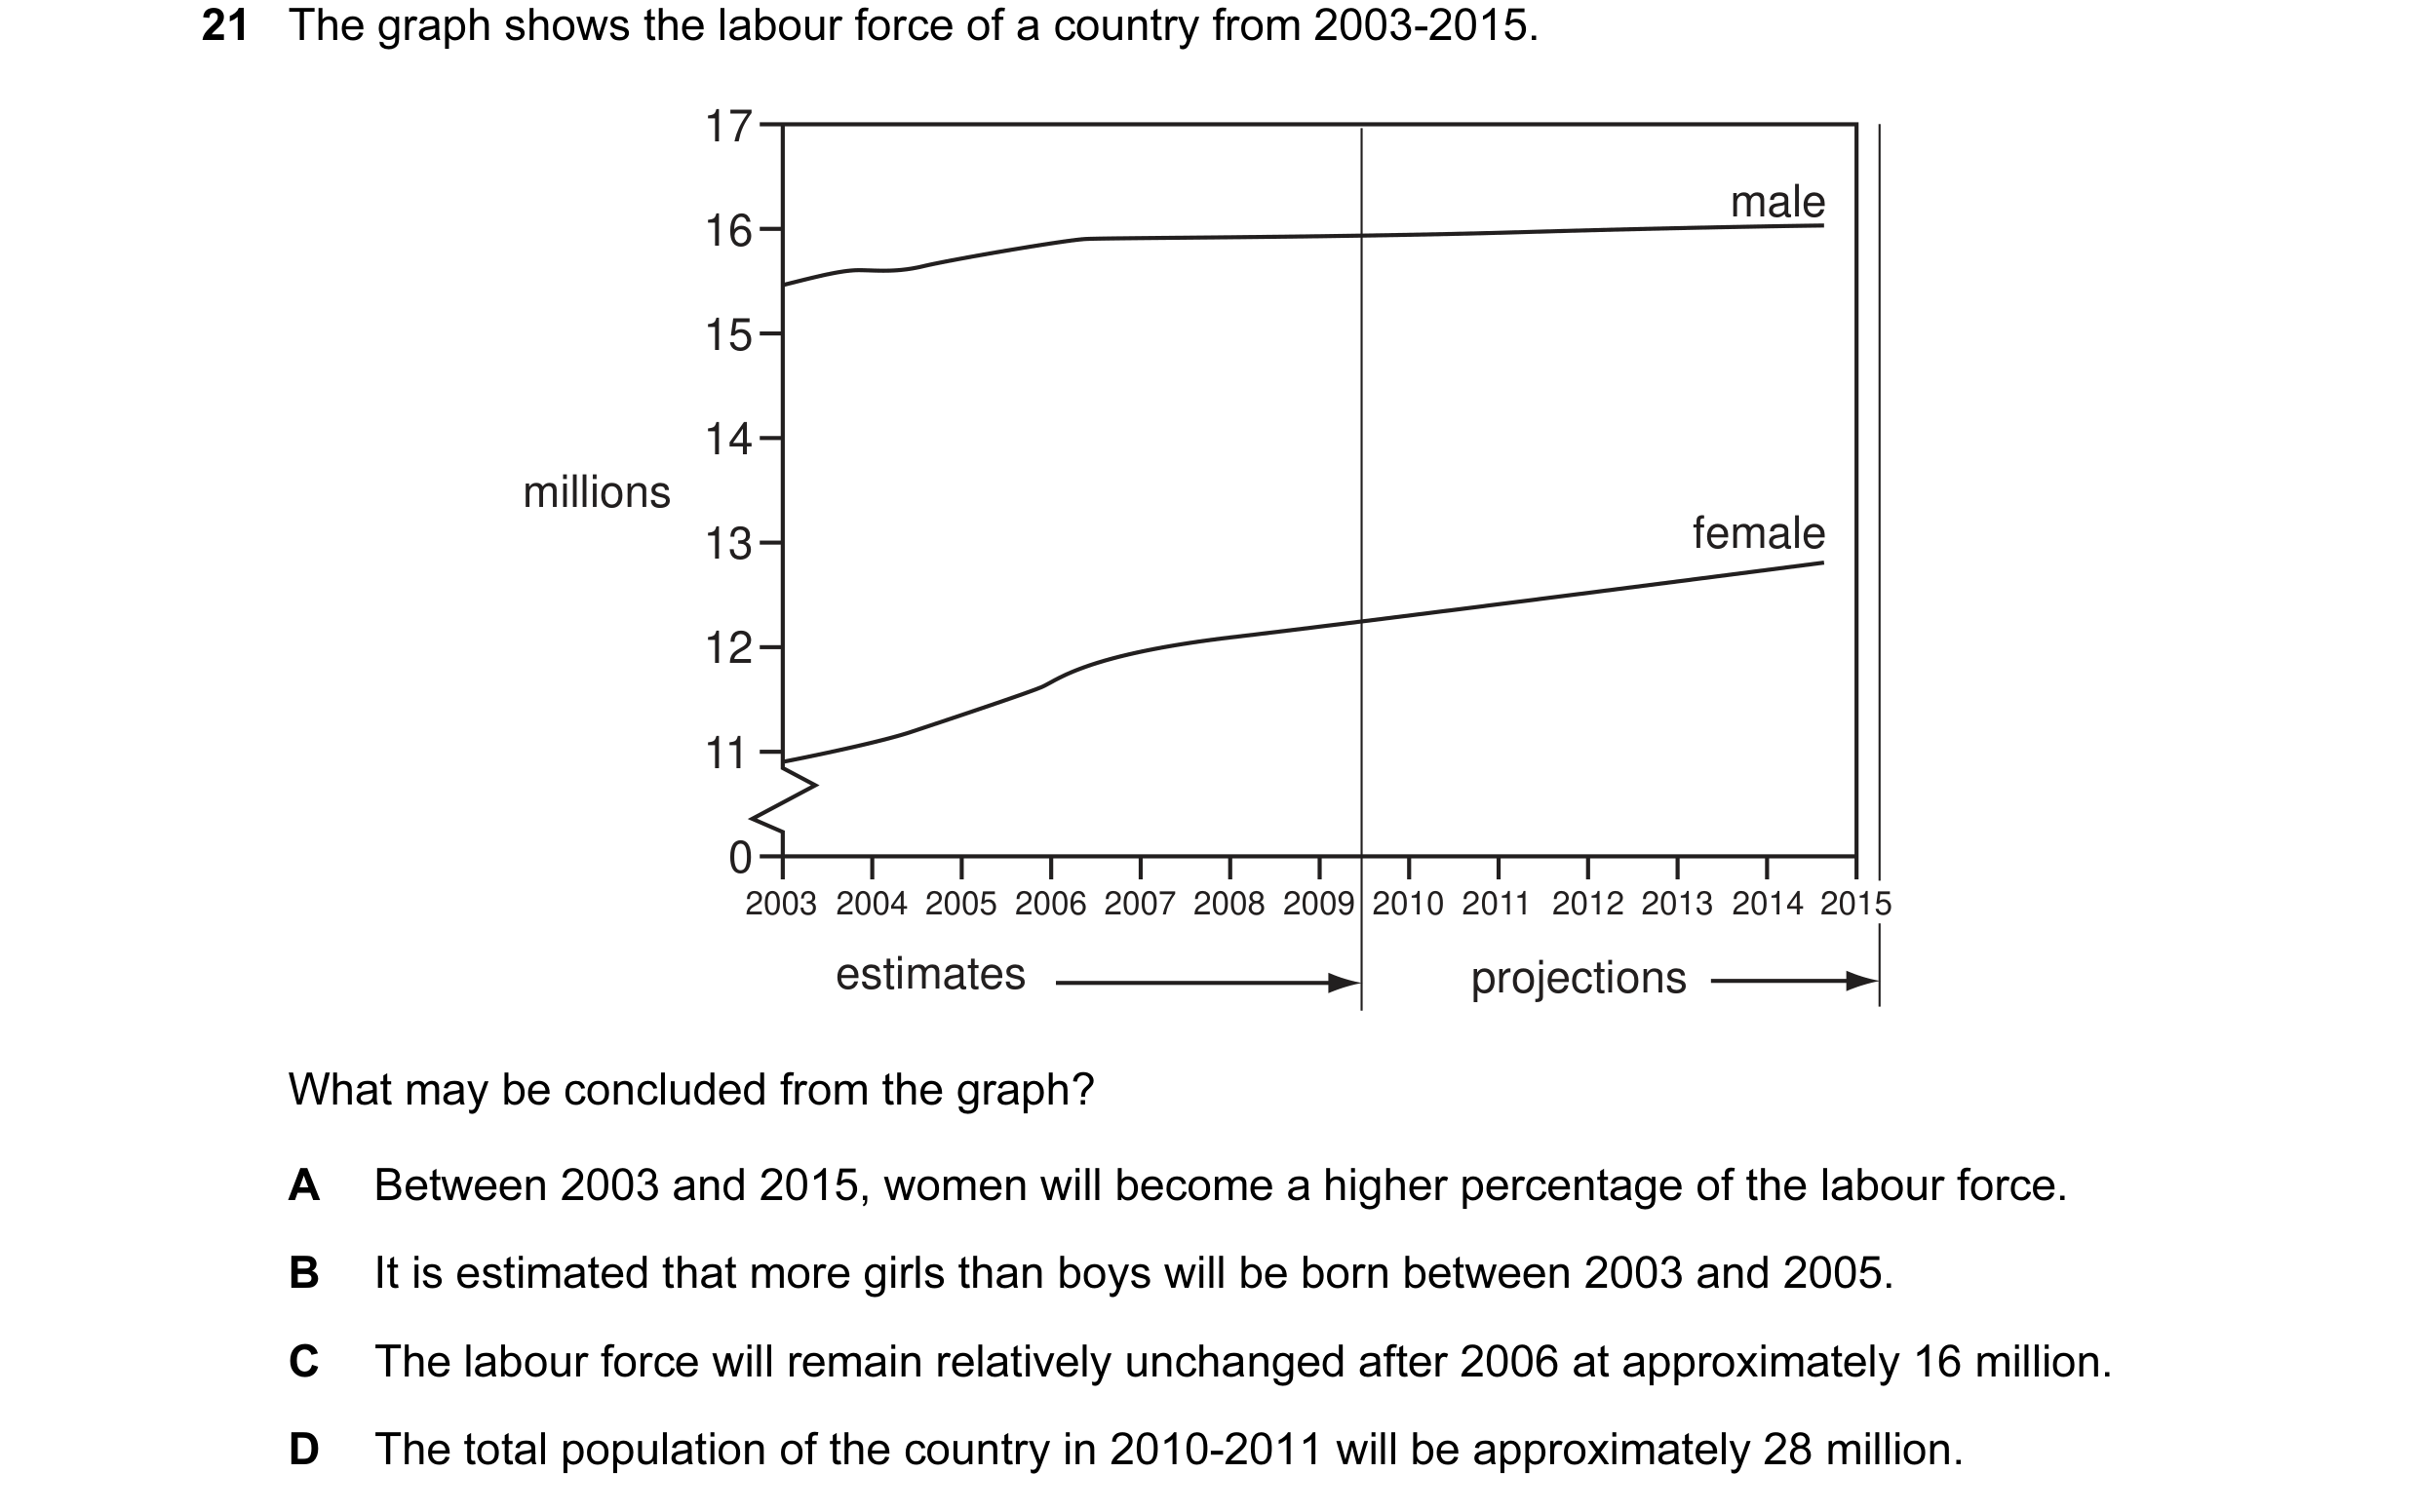

 4 / 36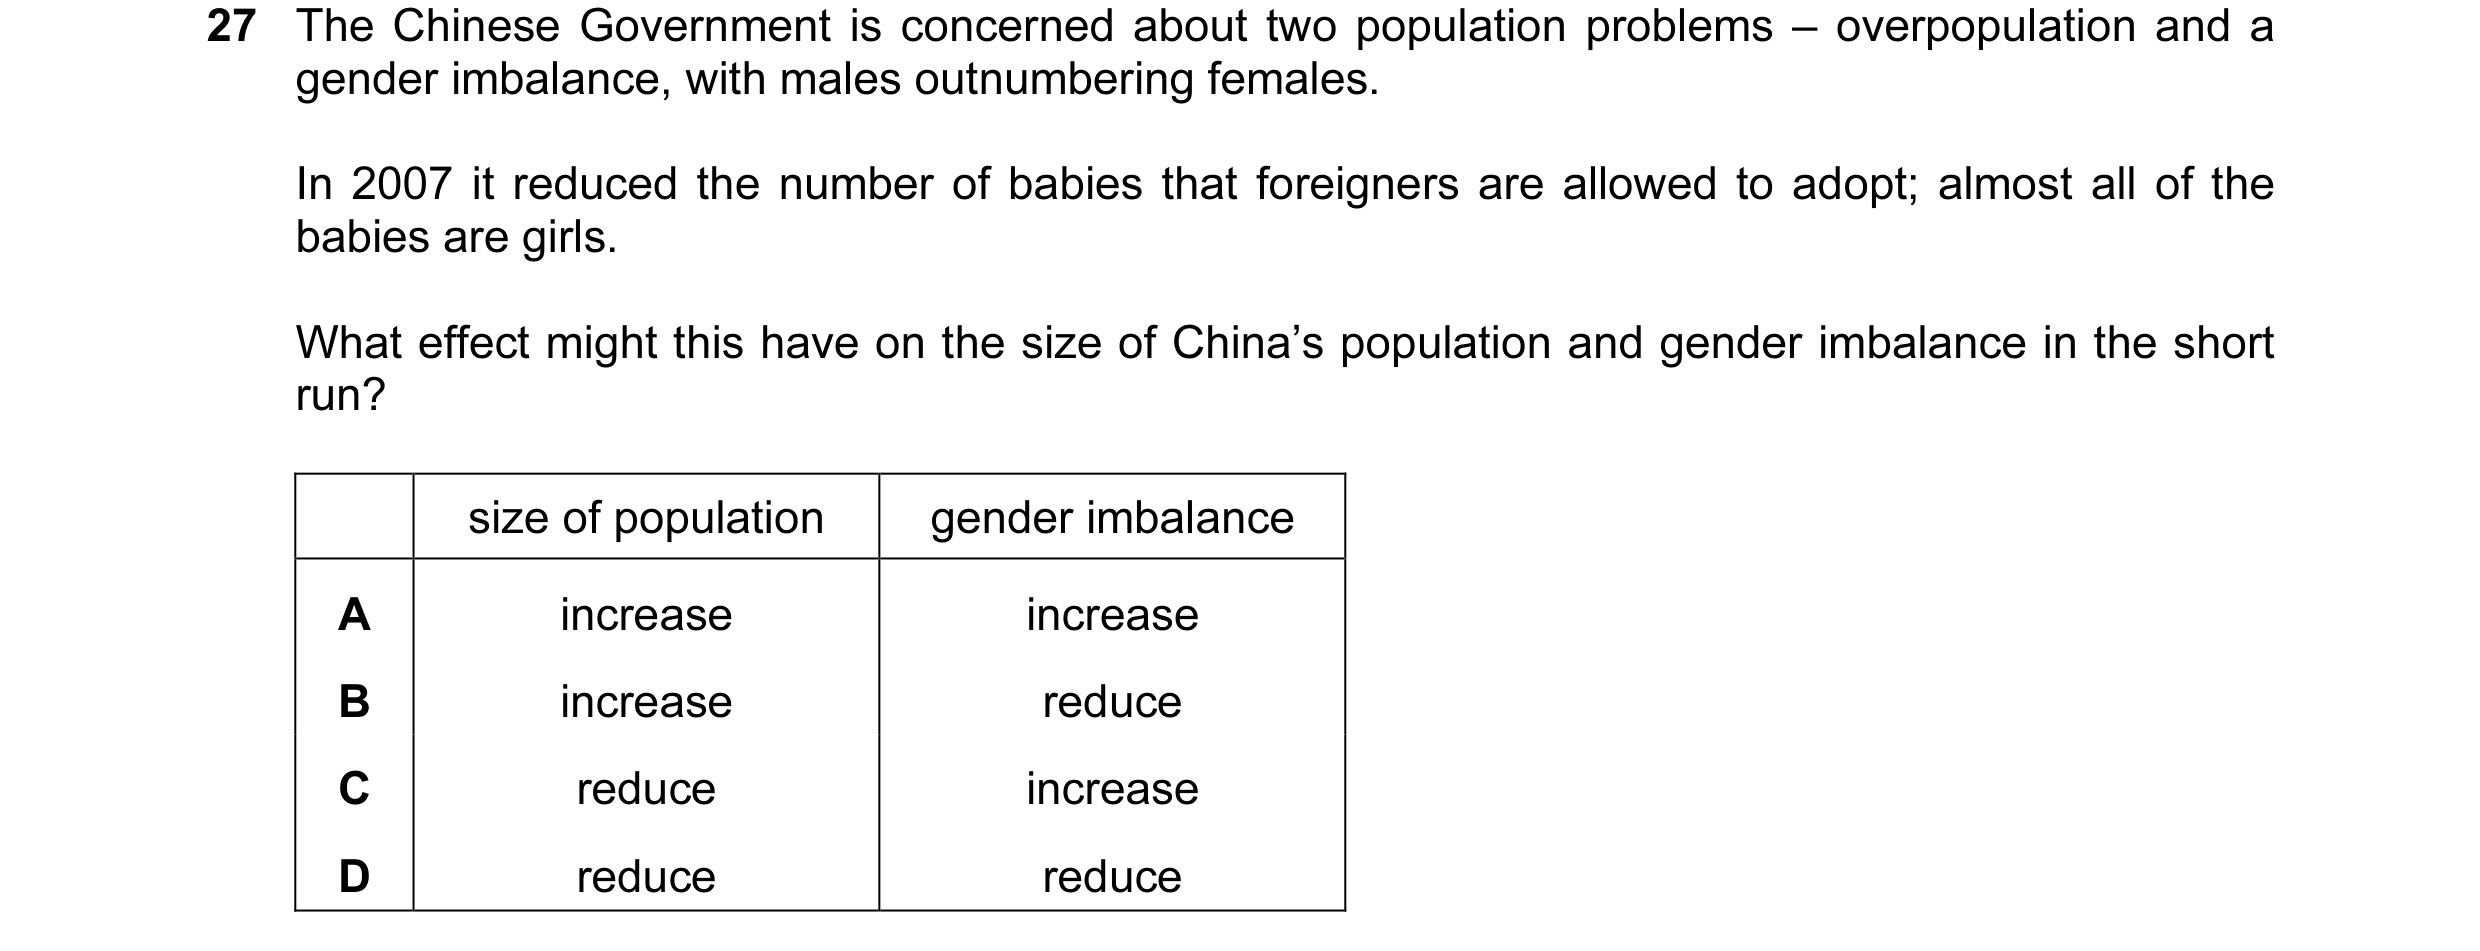



 5 / 36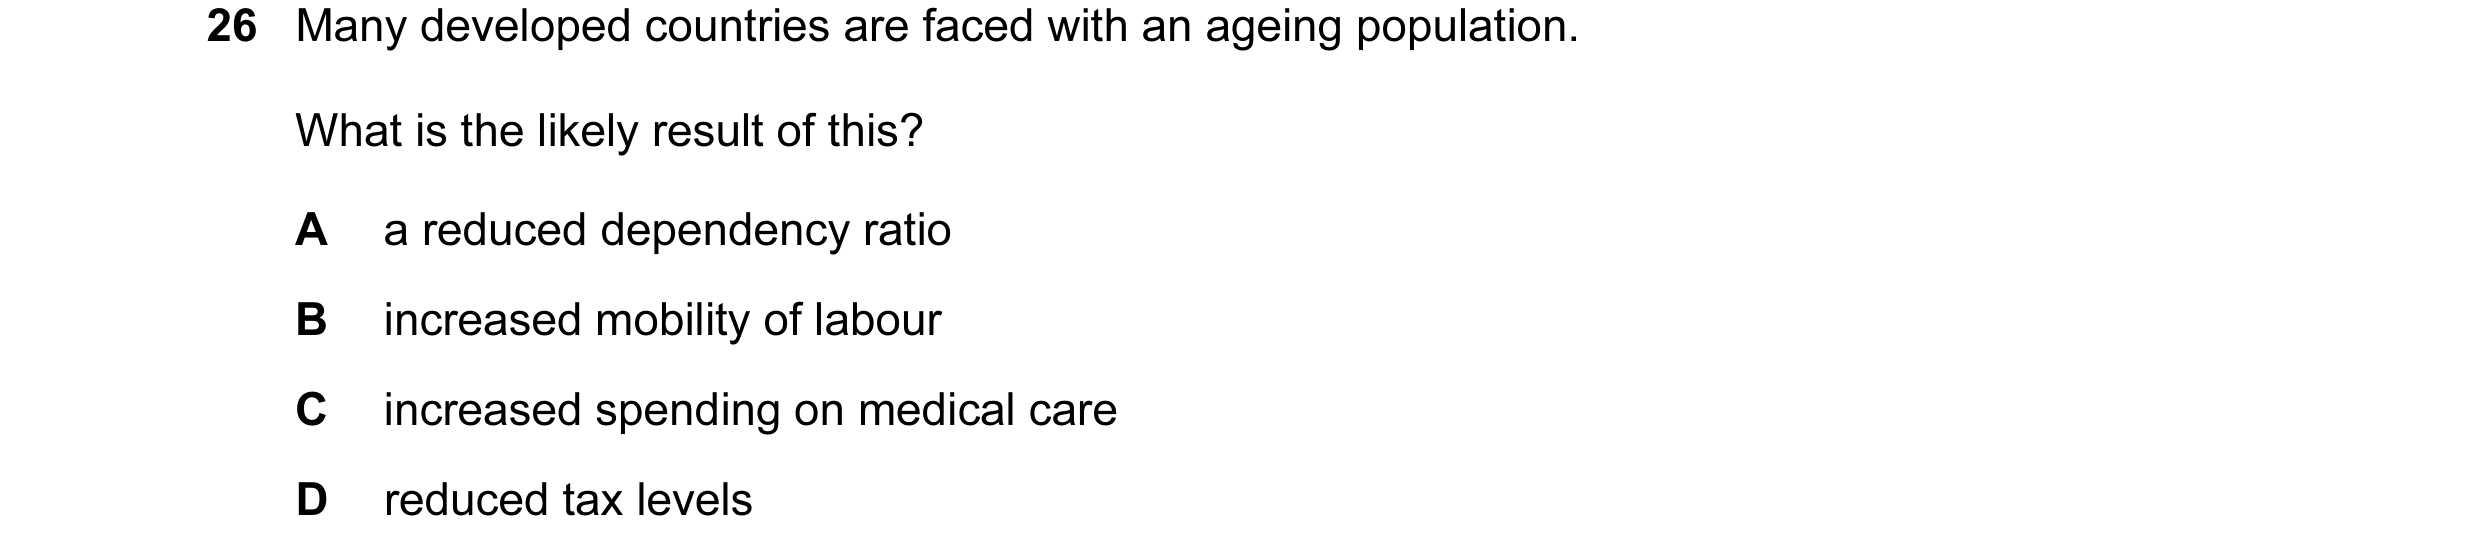
 6 / 36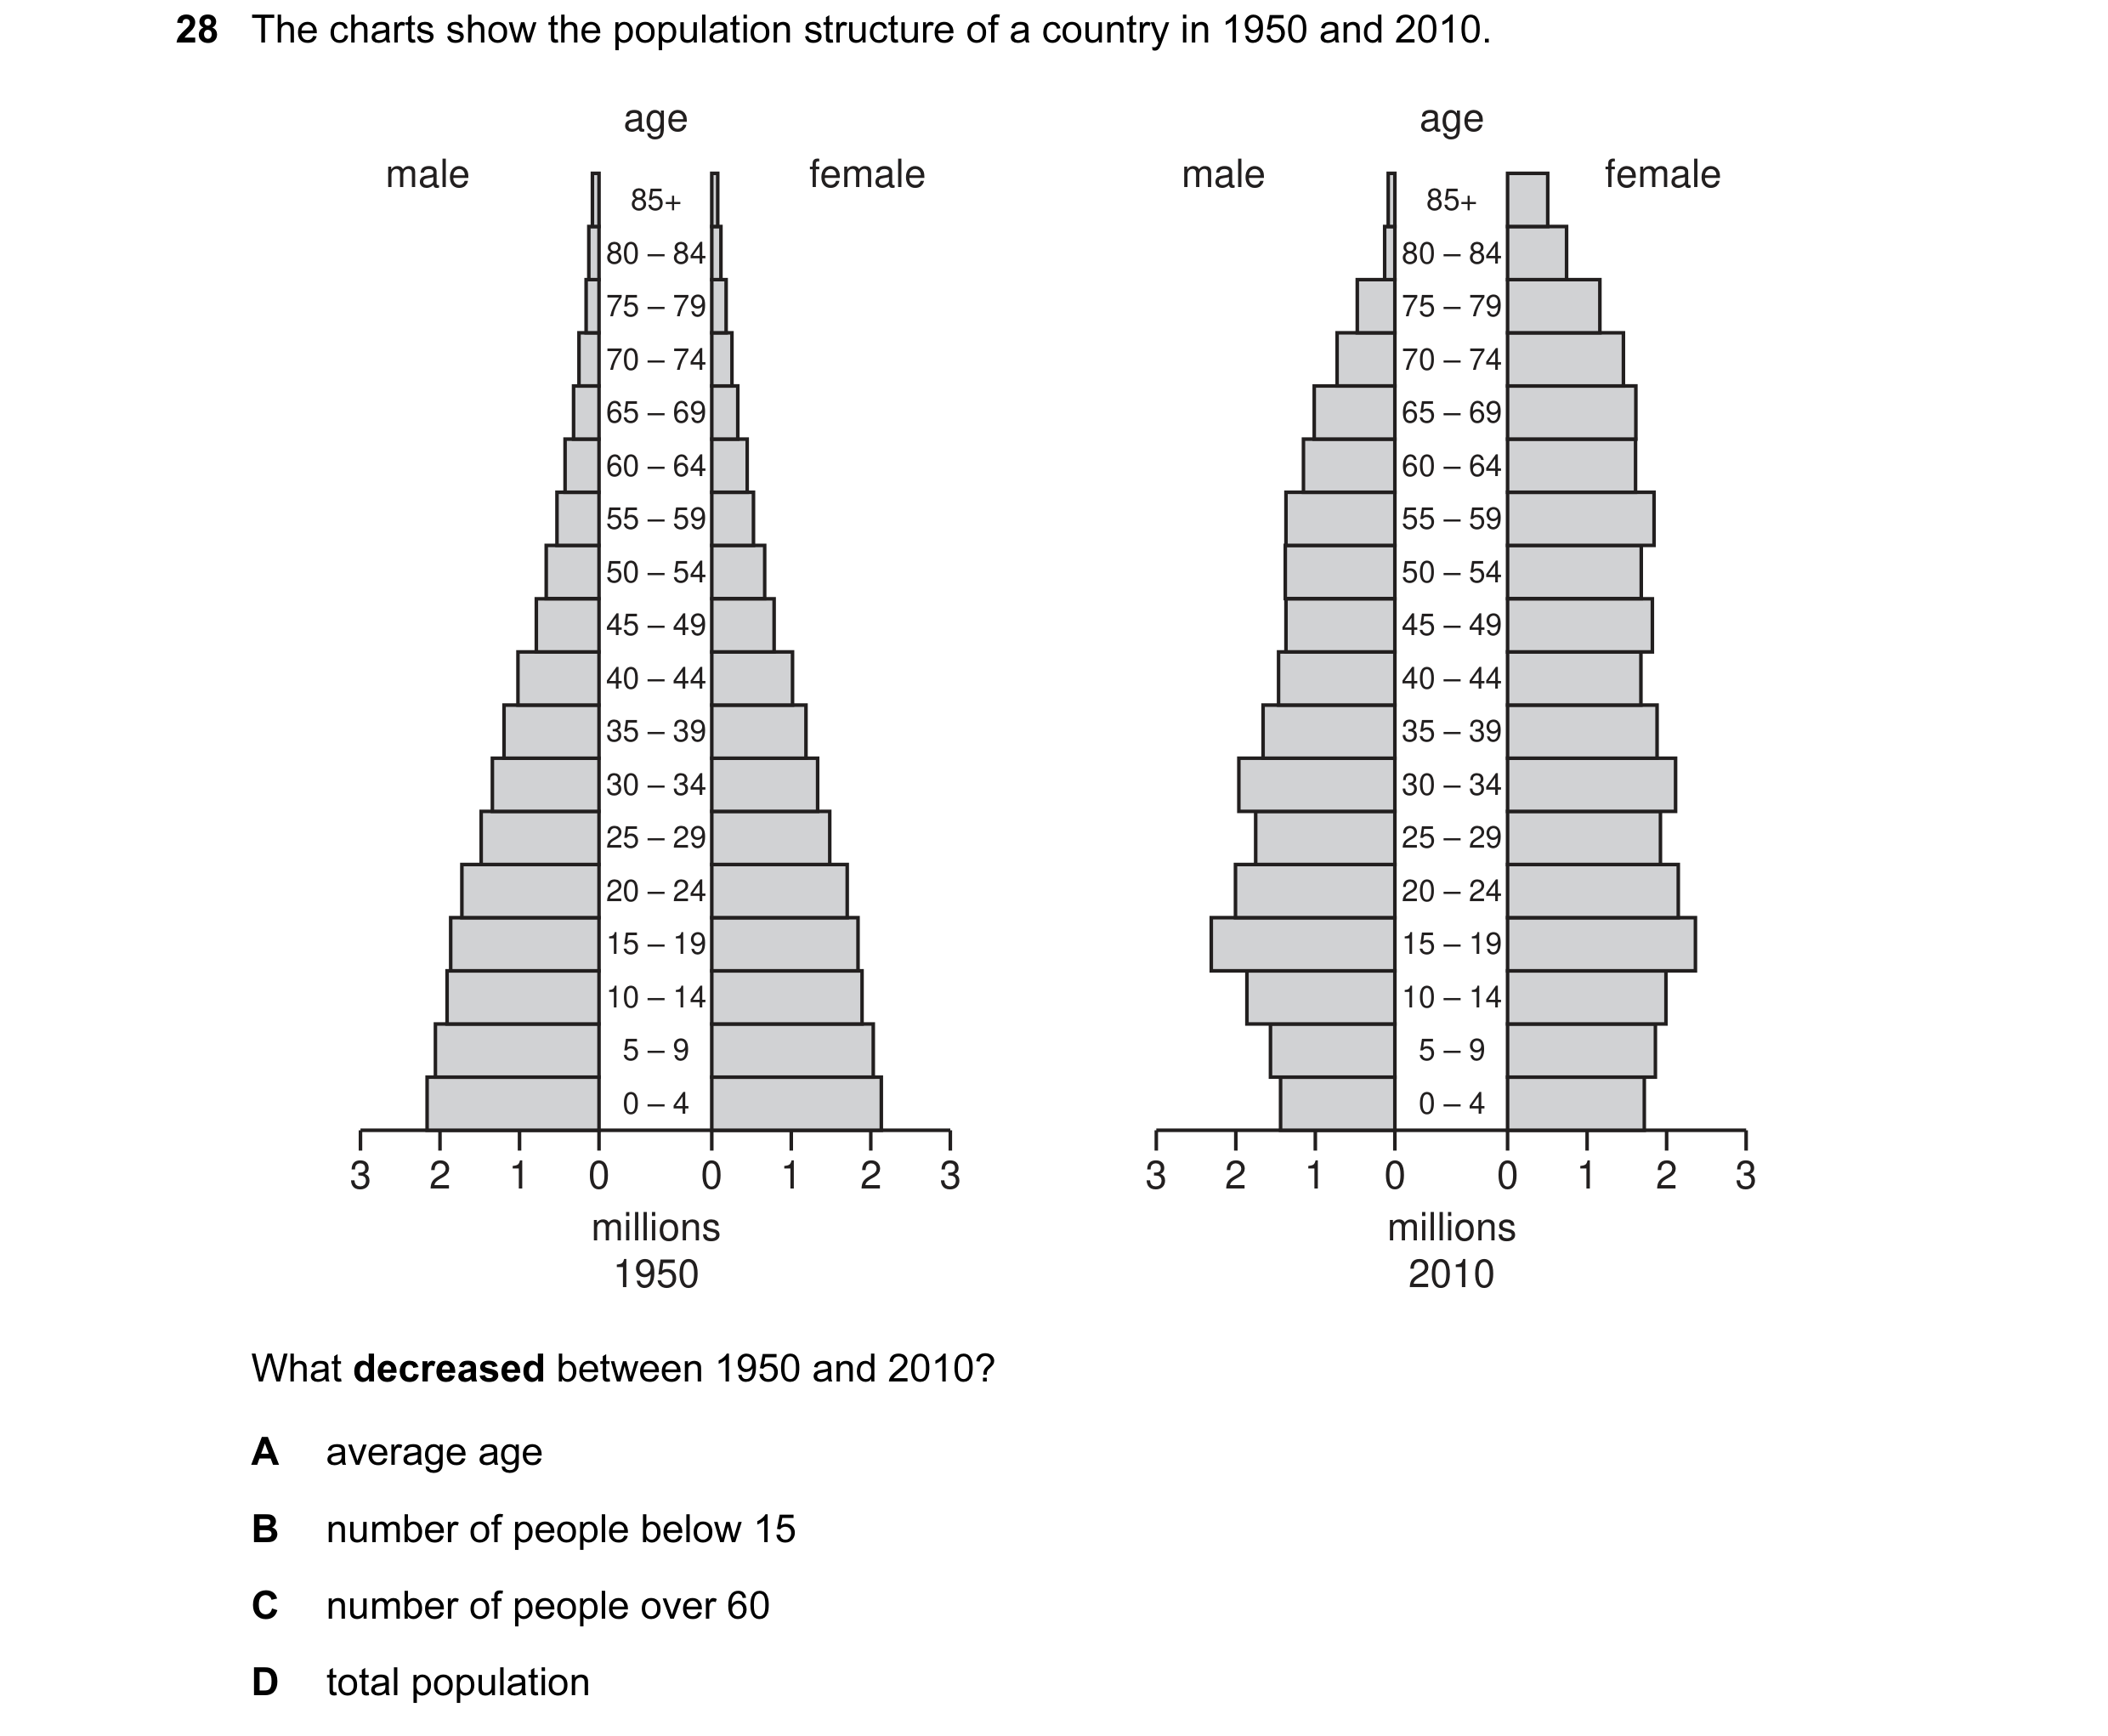
 7 / 36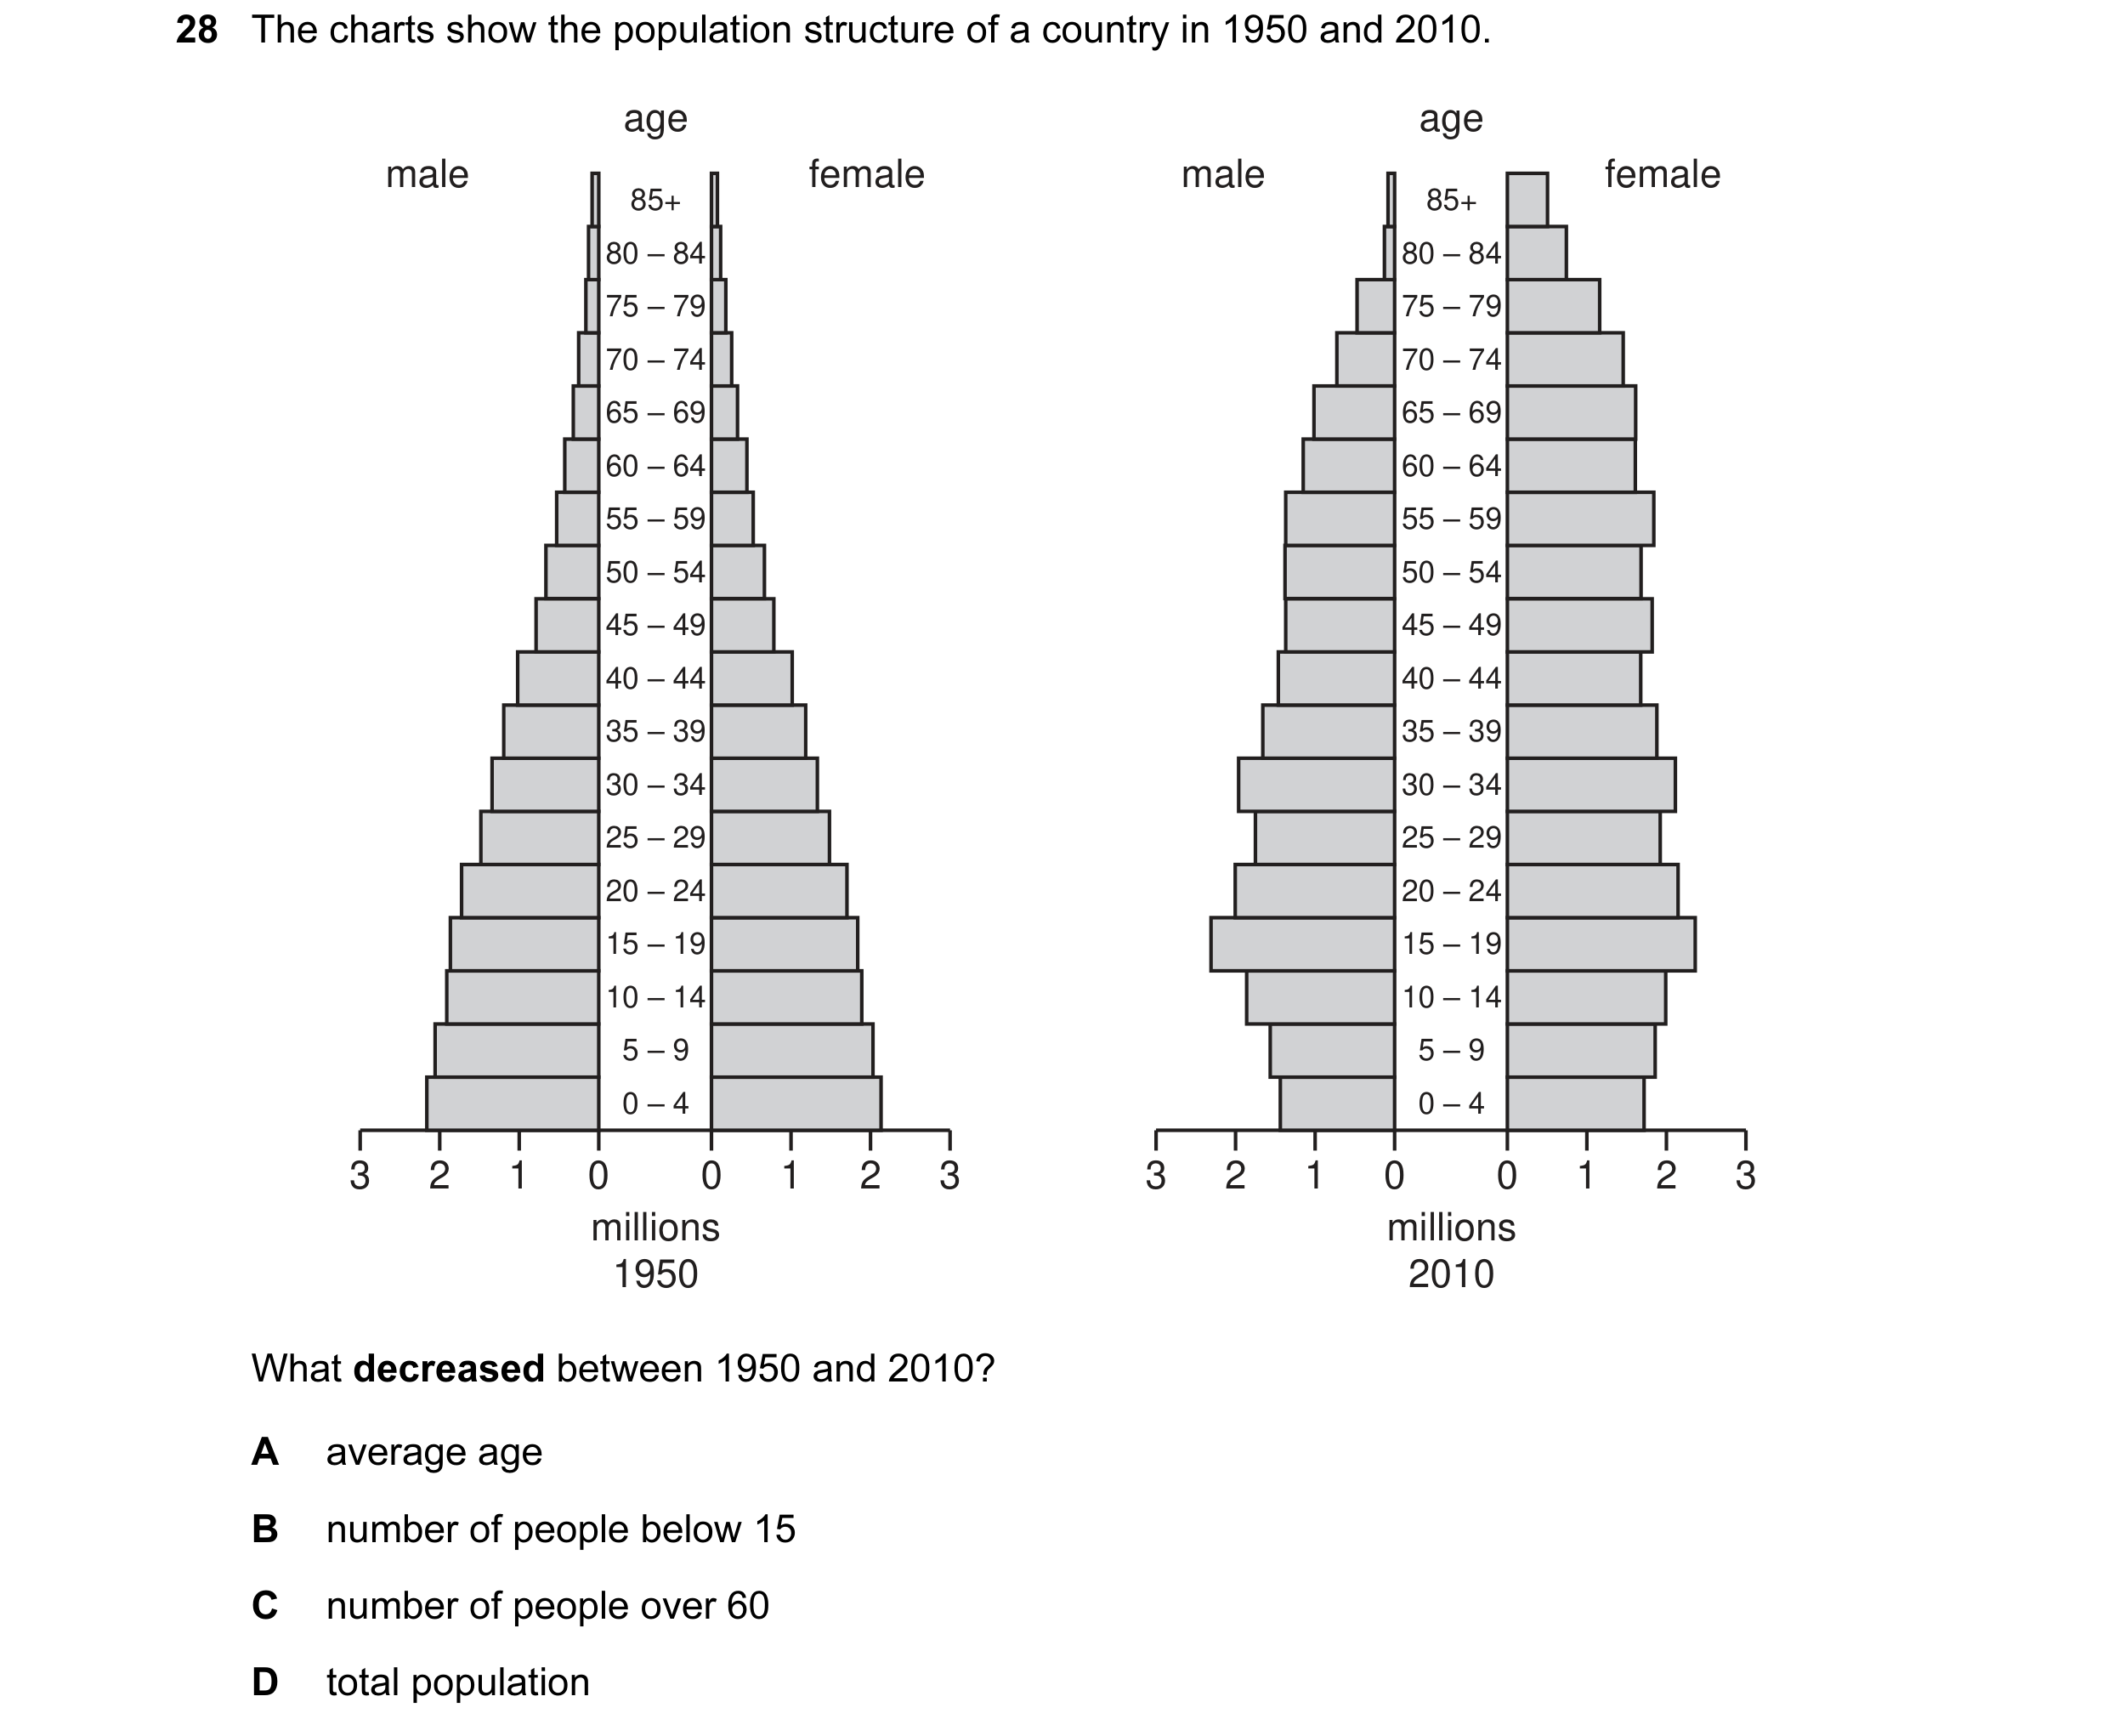
 8 / 36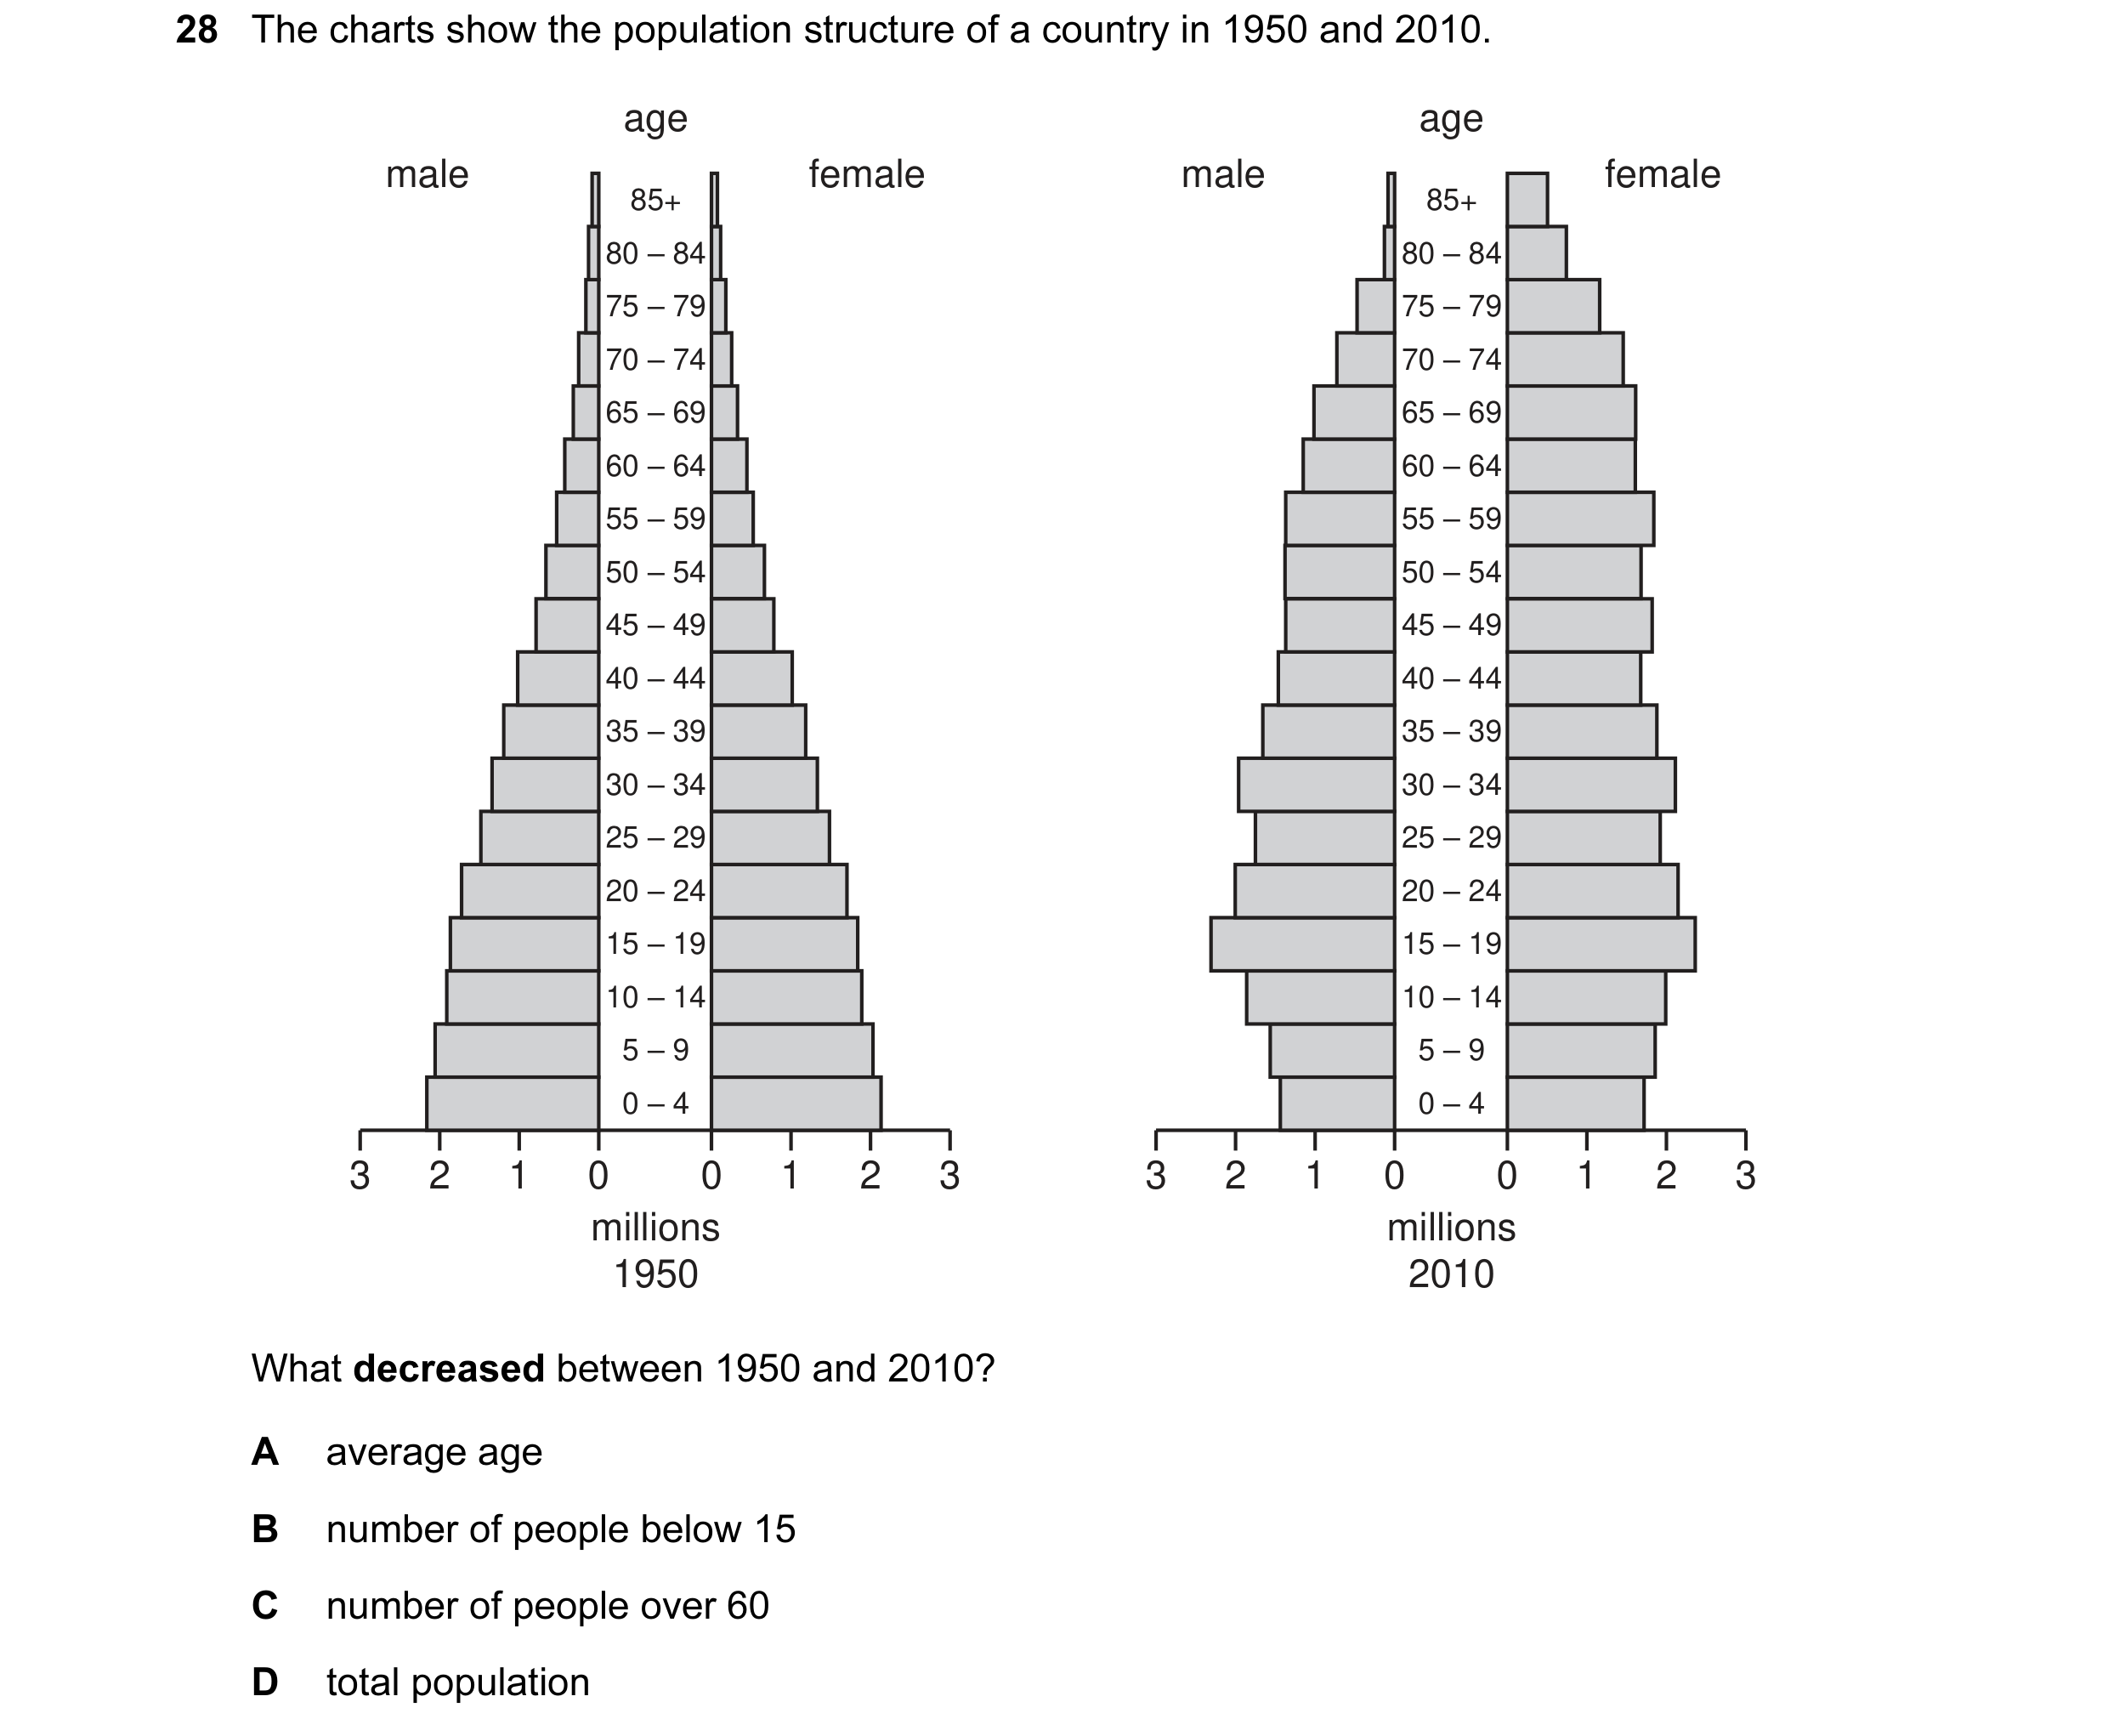
 9 / 36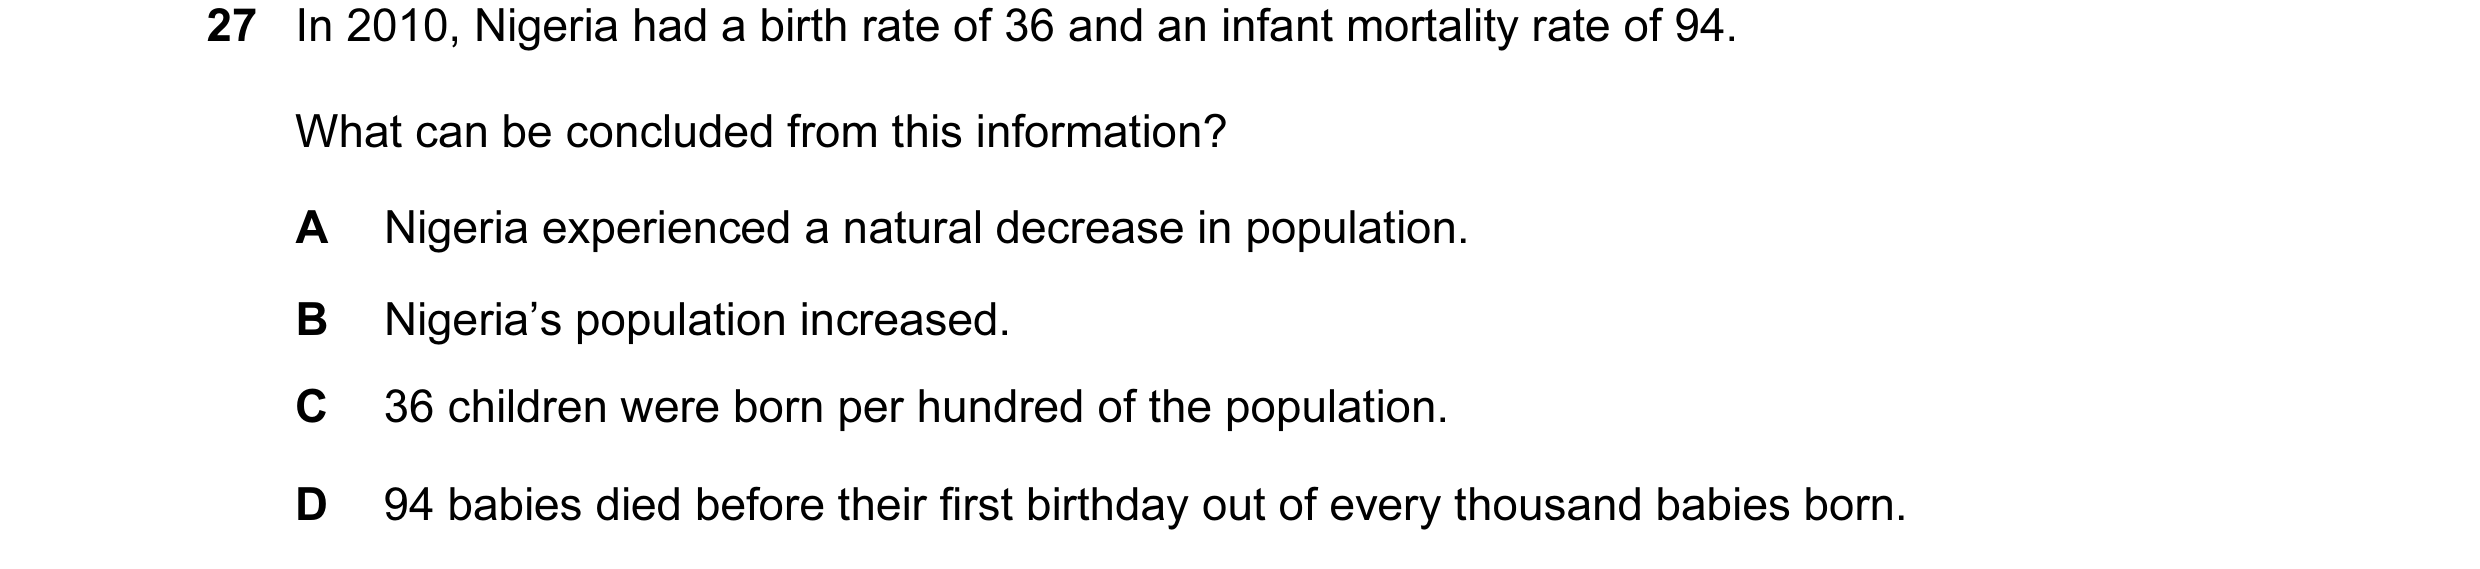
 10 / 36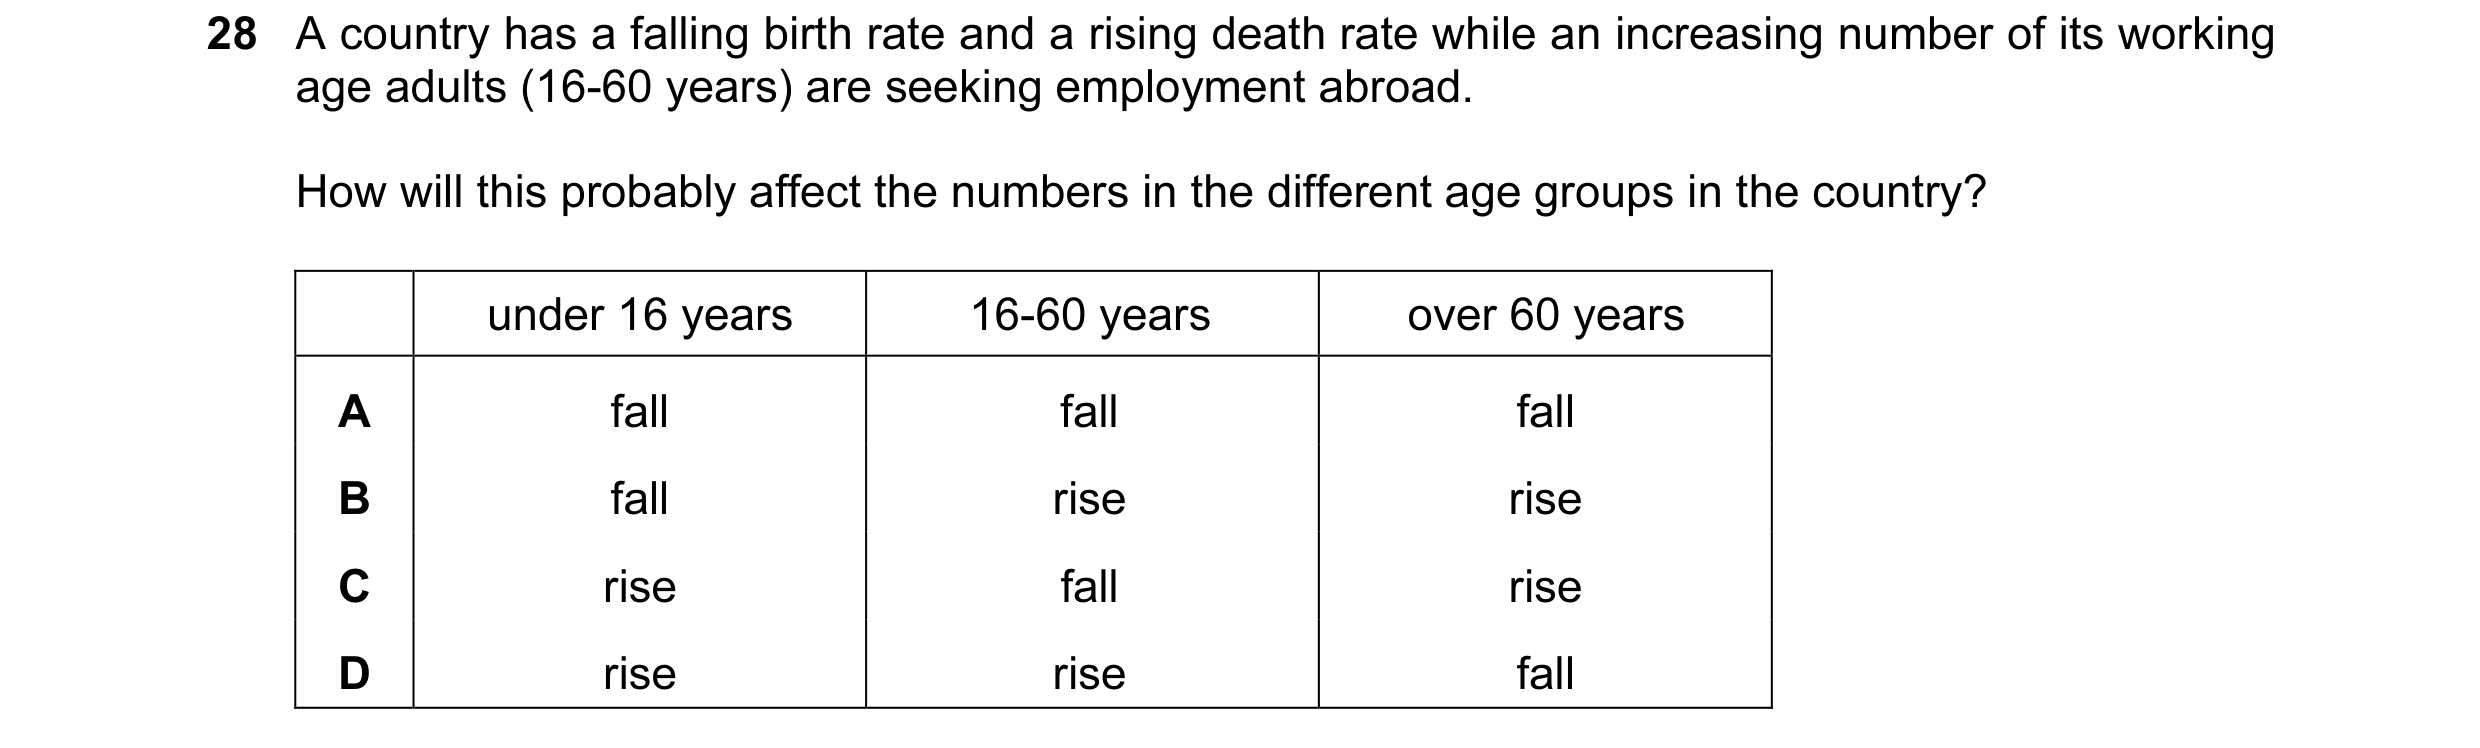
 11 / 36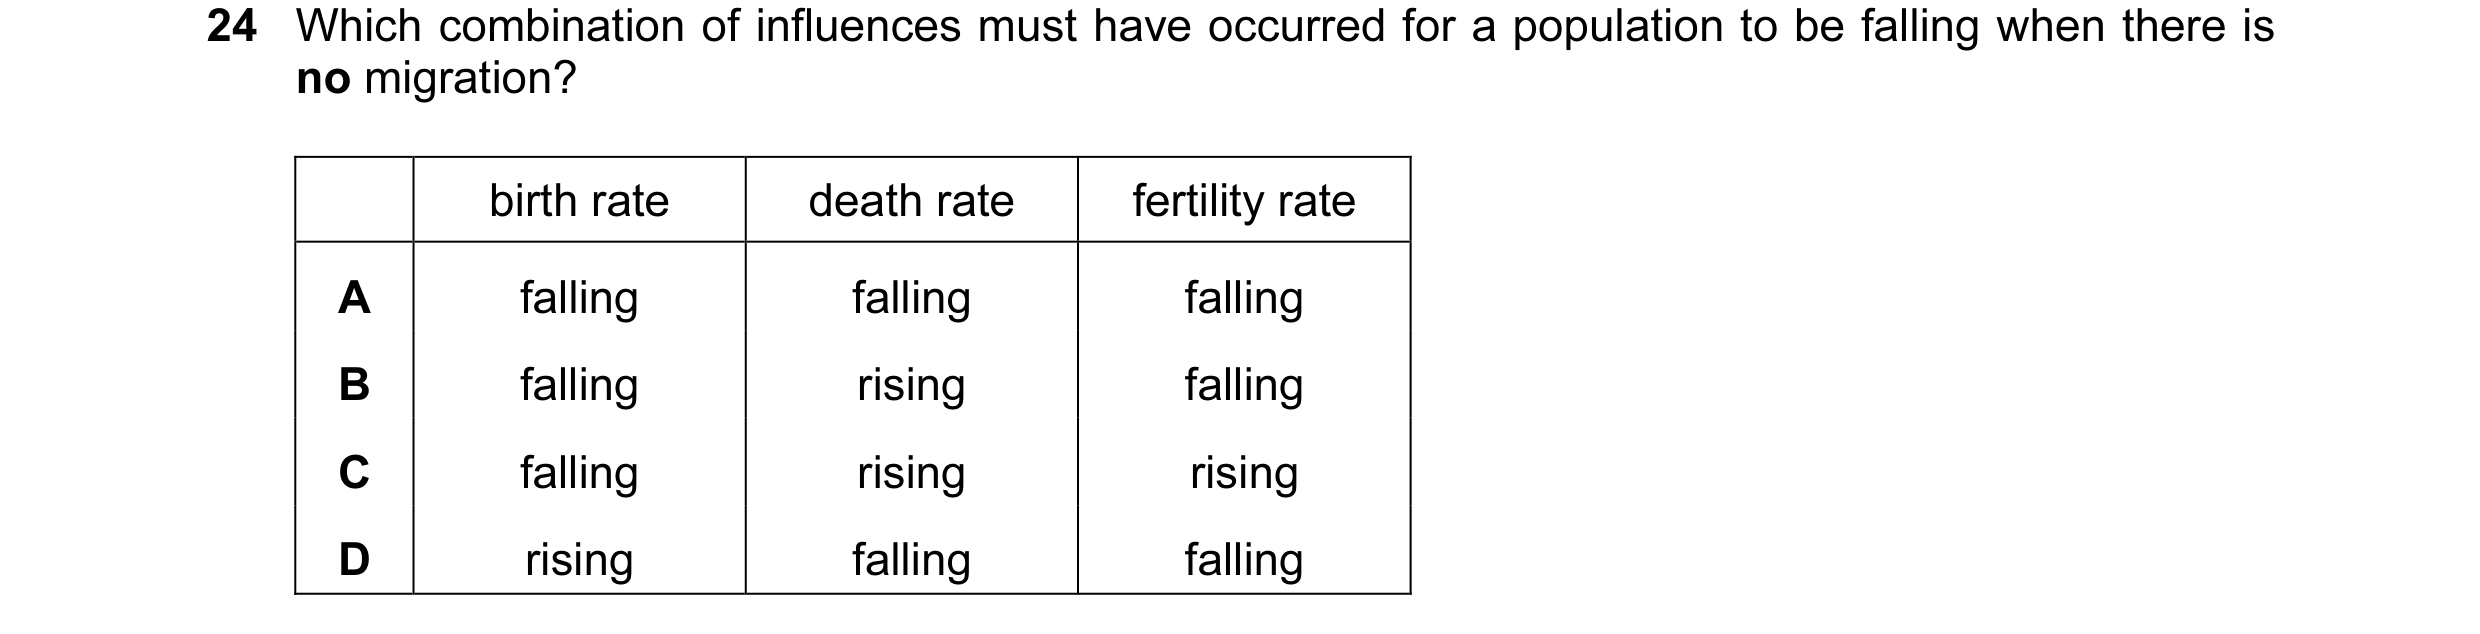
 12 / 36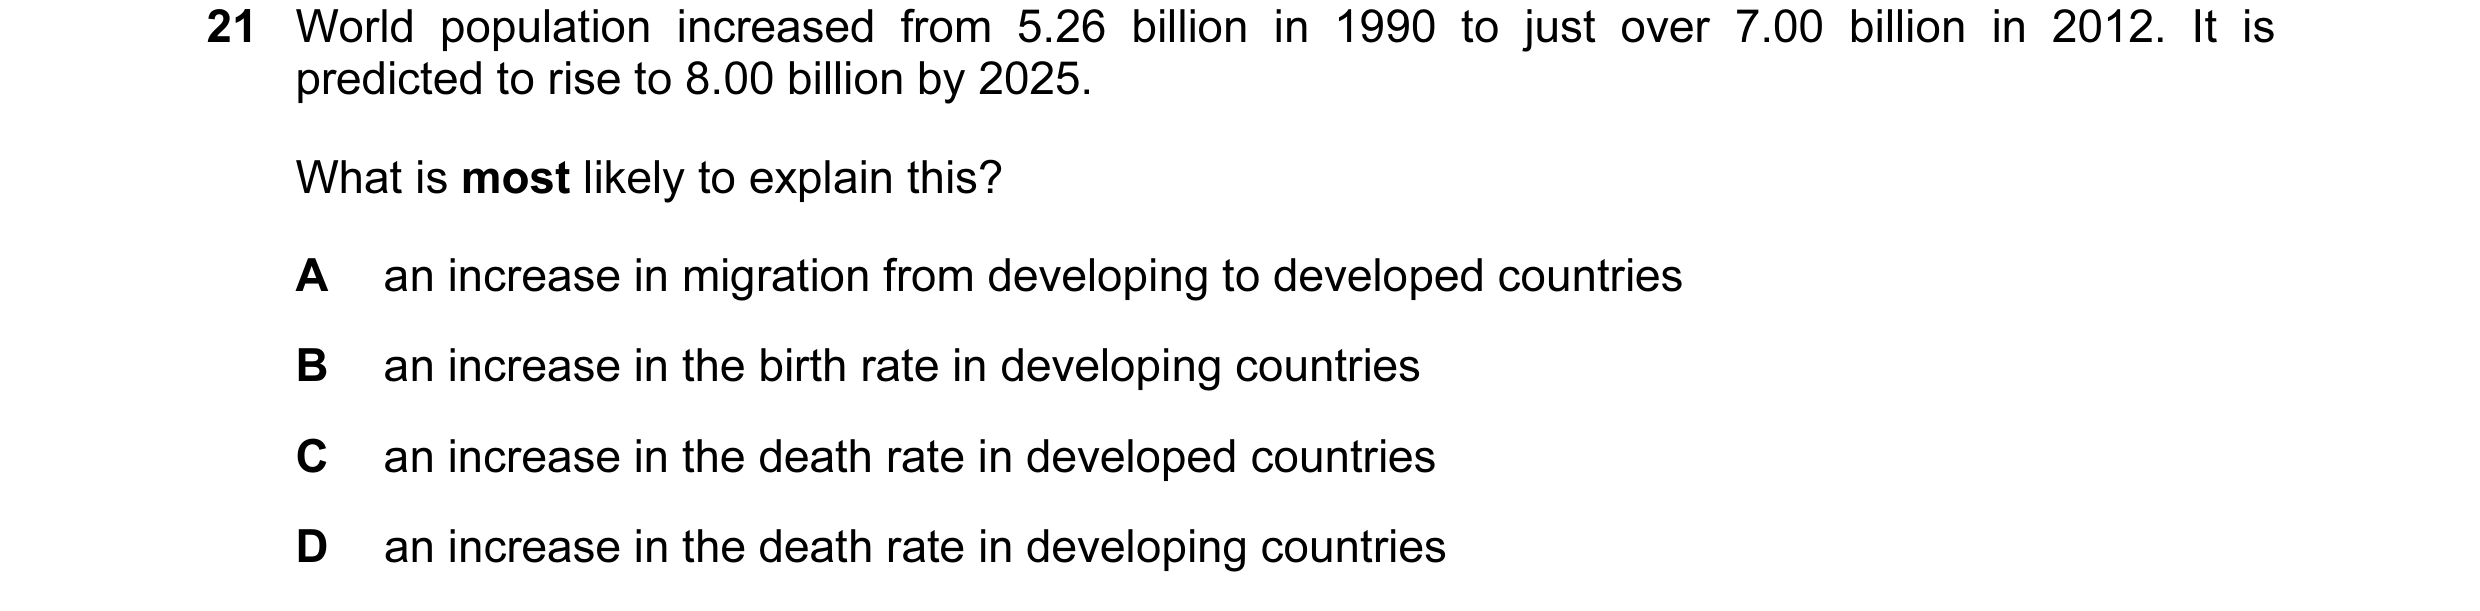
 13 / 36
 14 / 36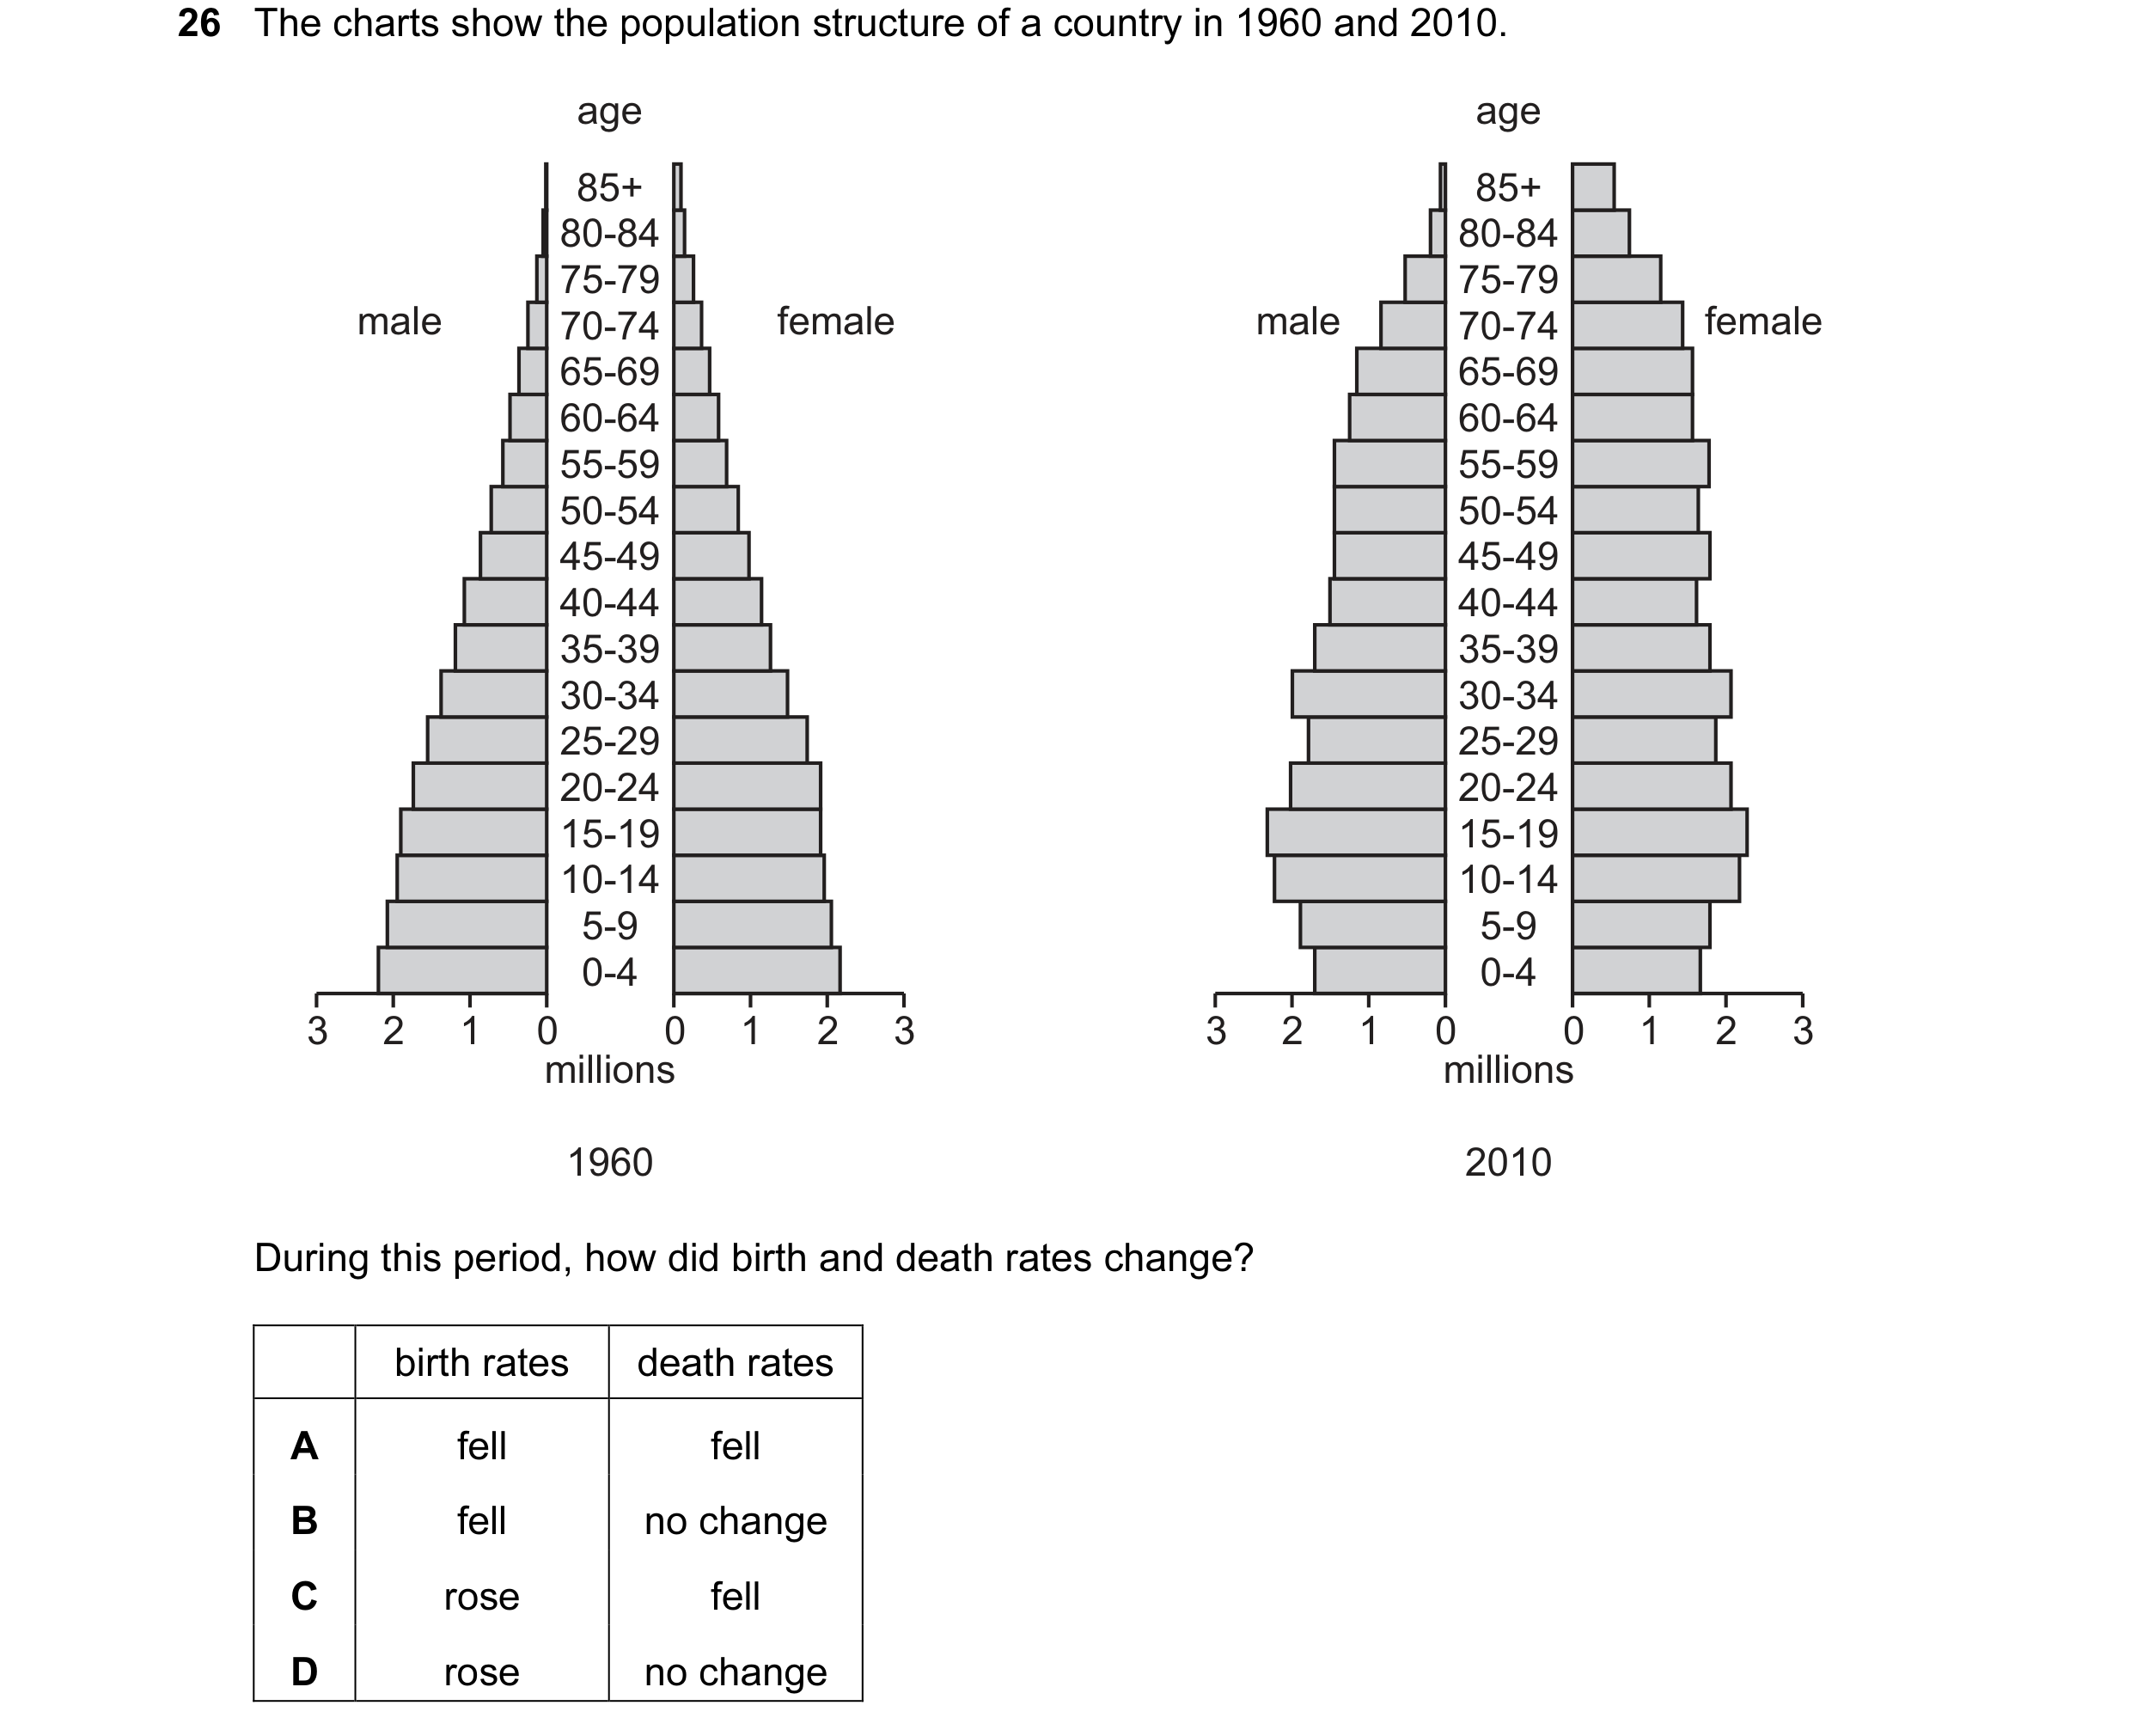
 15 / 36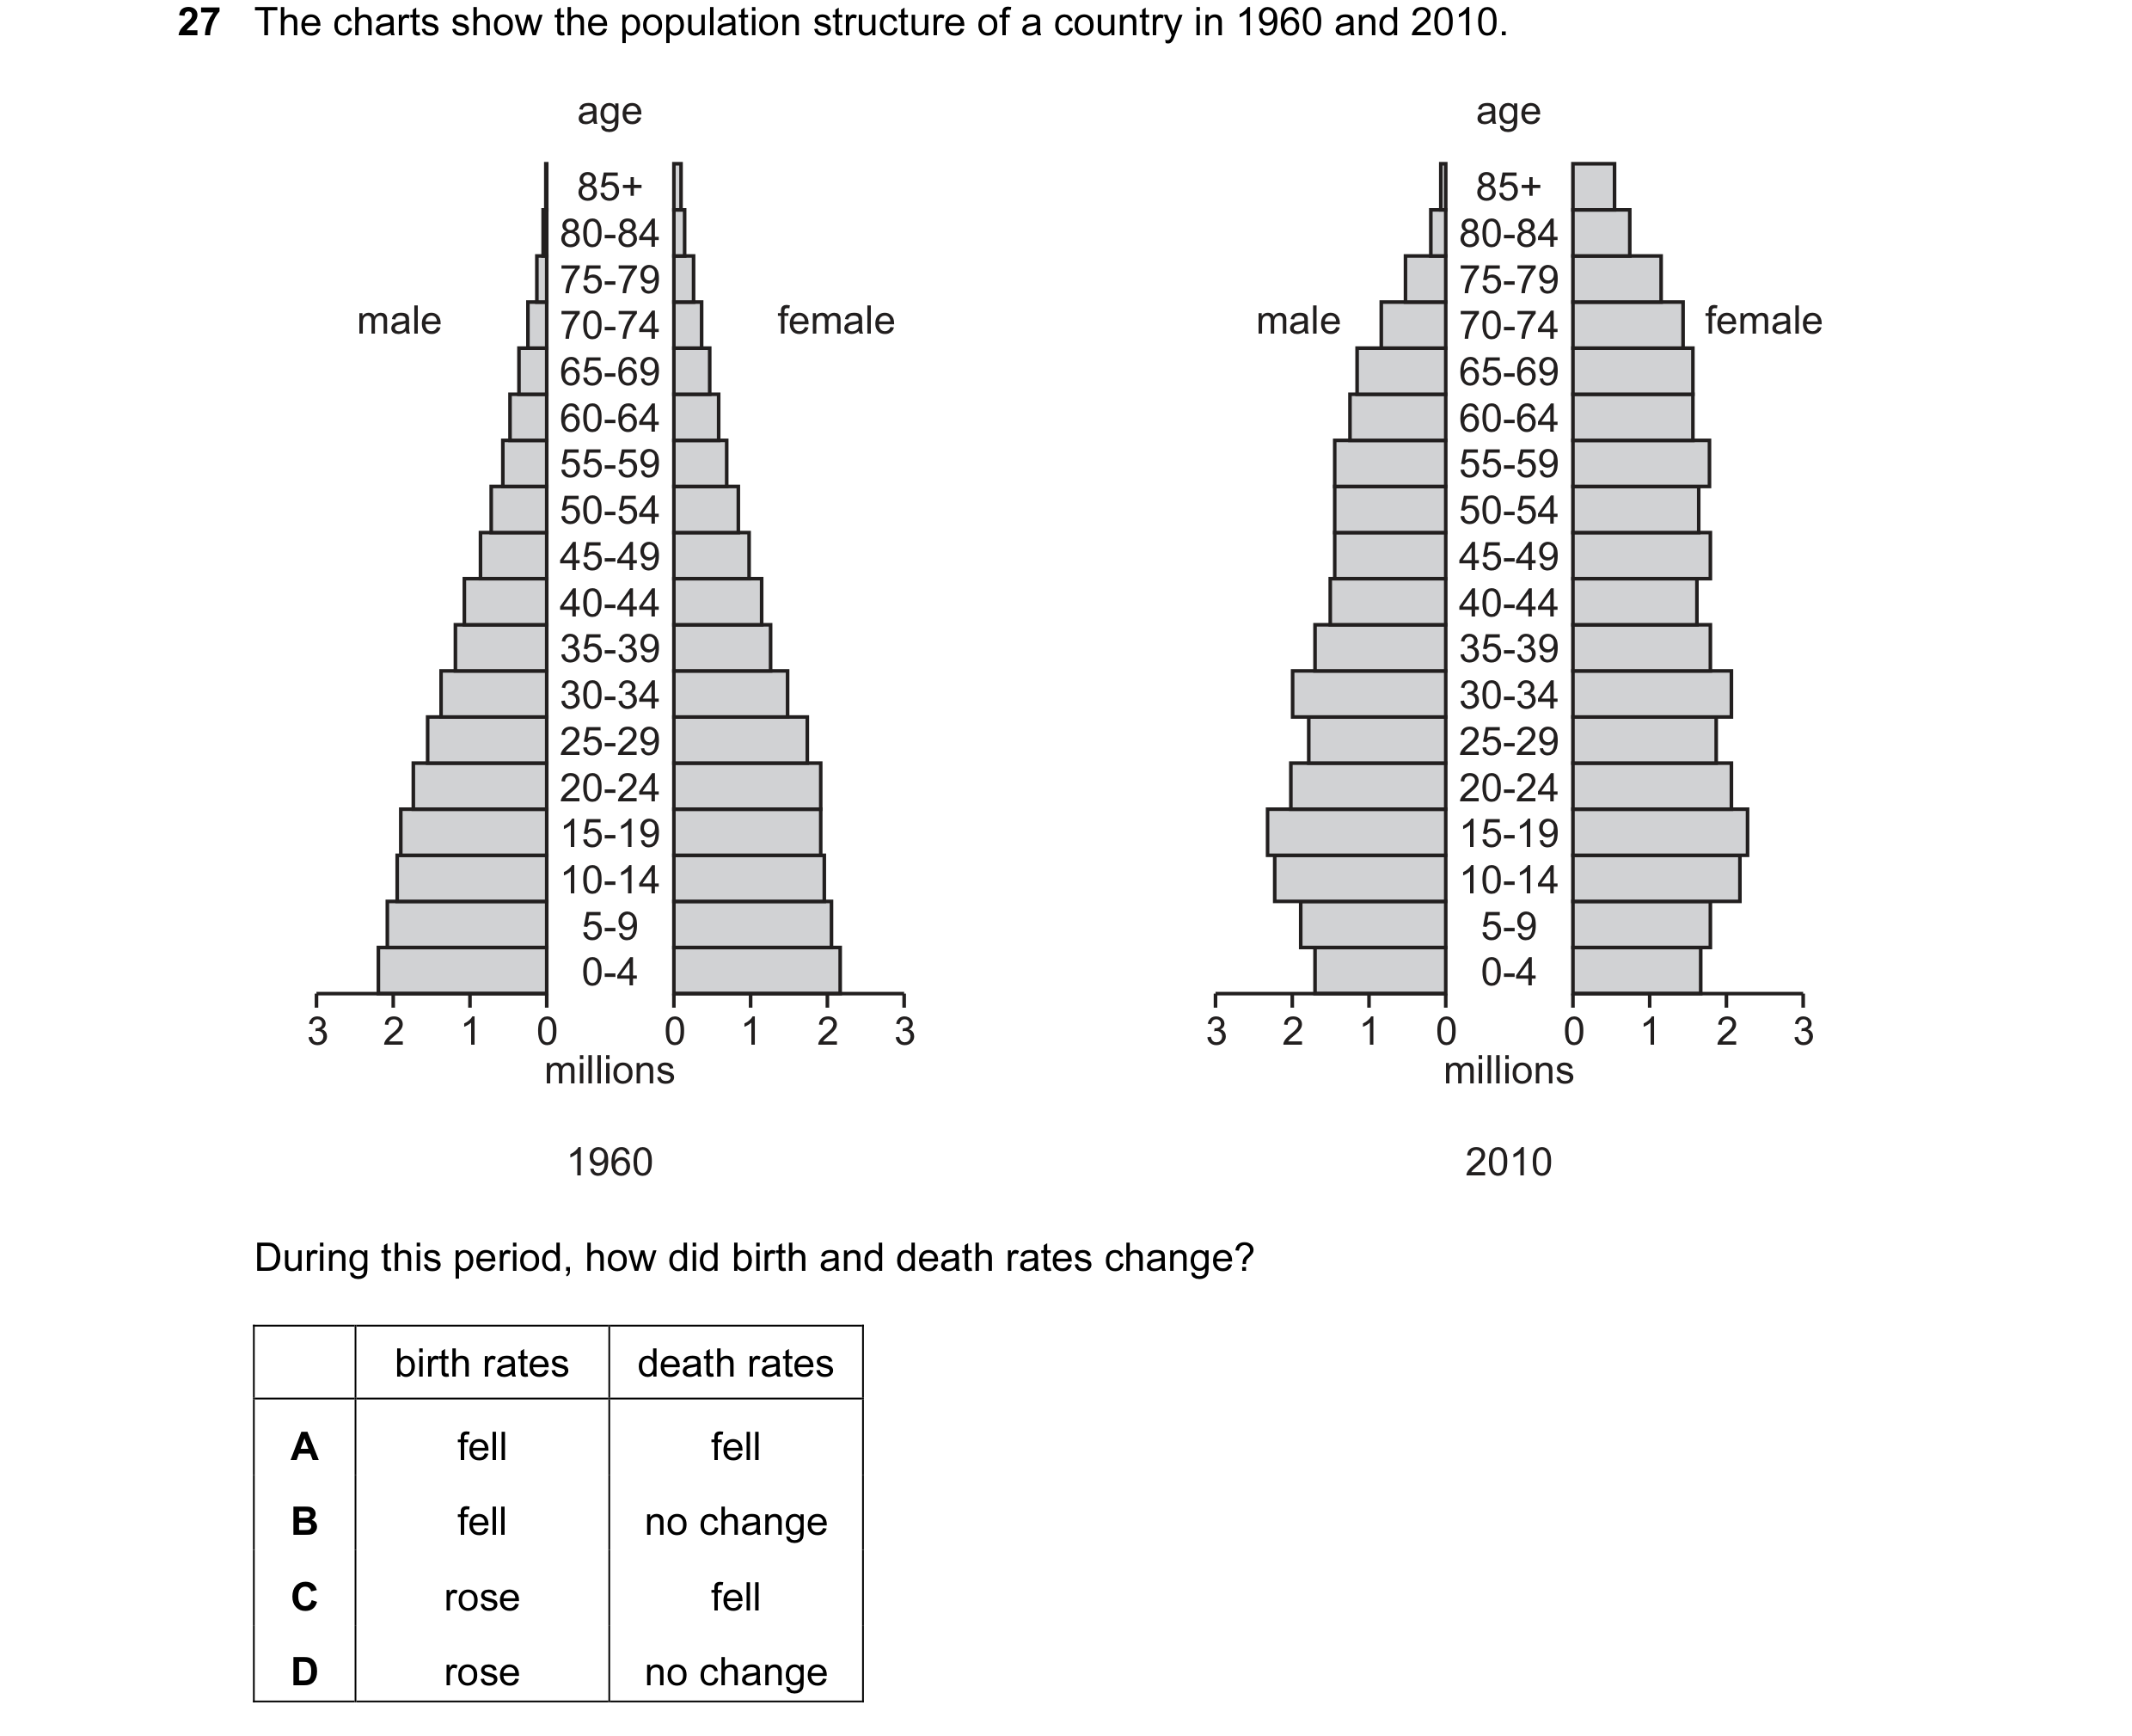
 16 / 36
 17 / 36
 18 / 36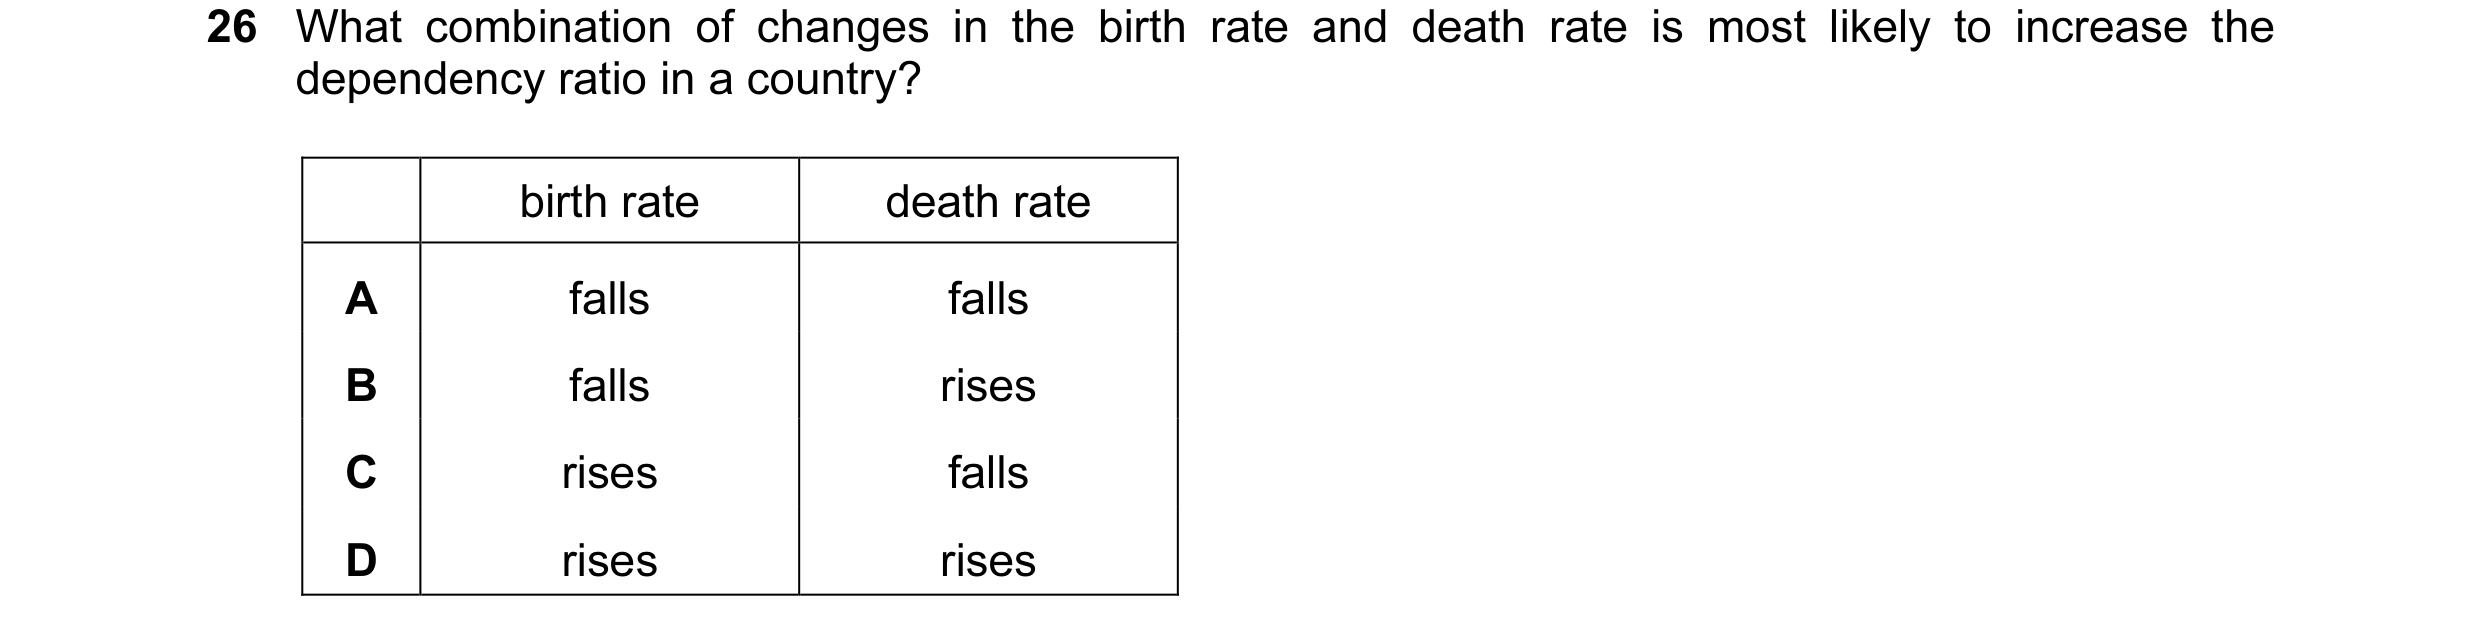

 19 / 36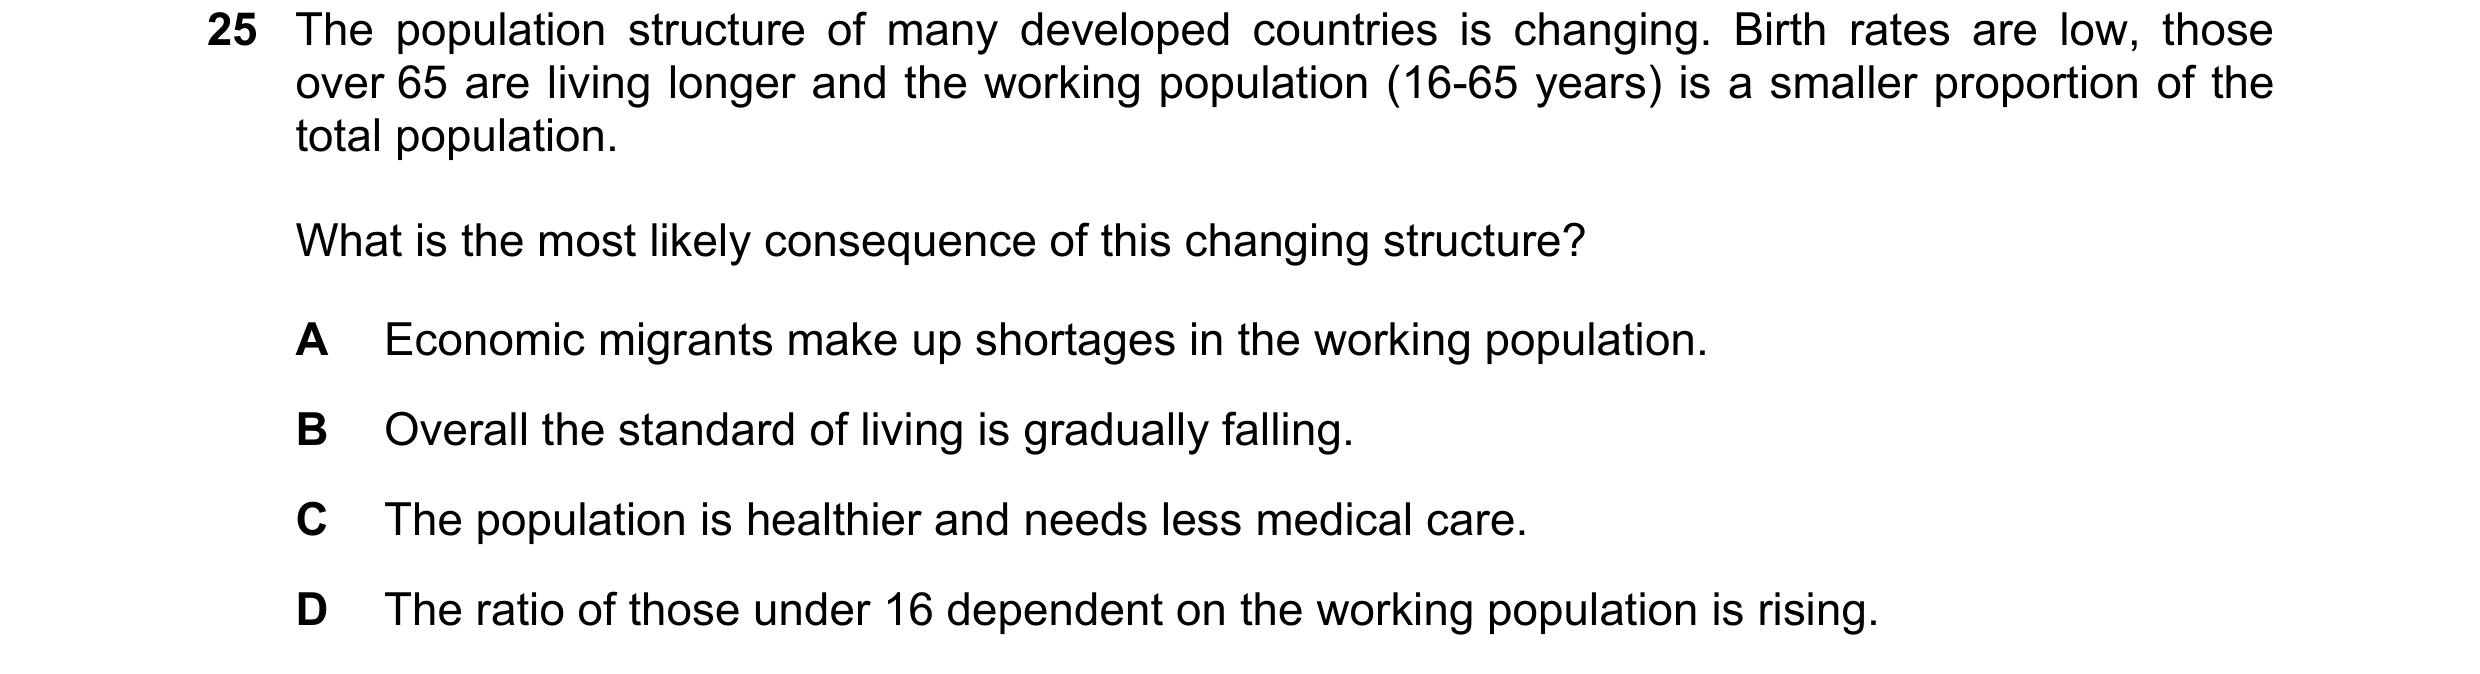
 20 / 36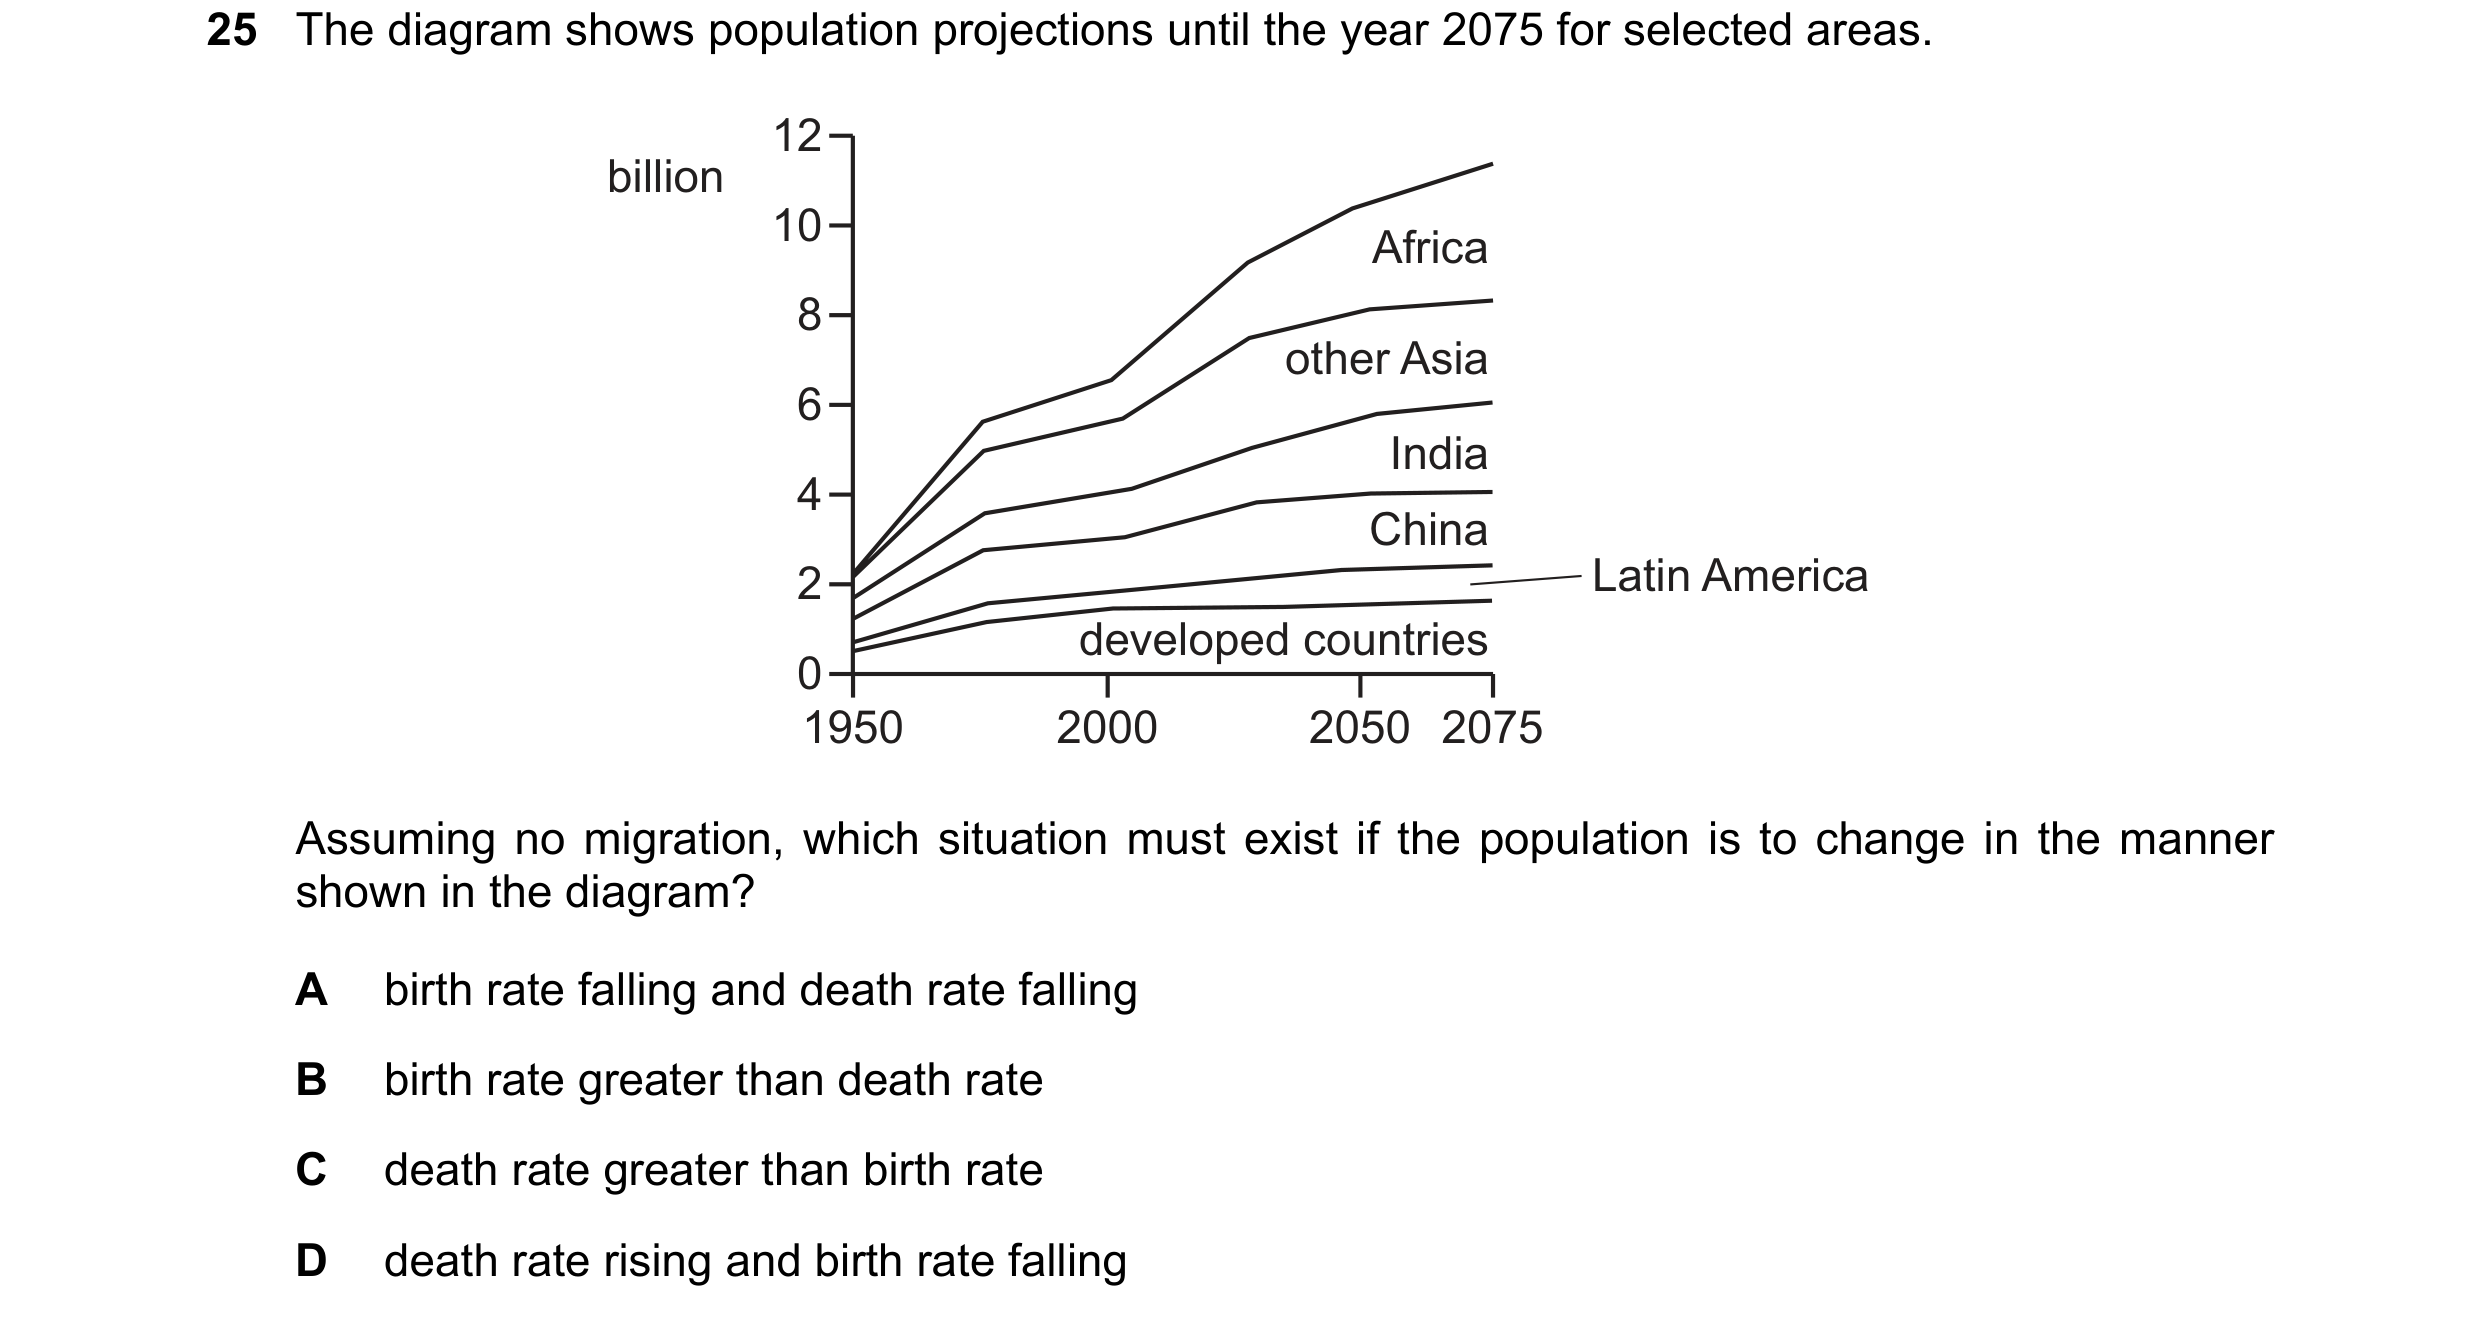
 21 / 36
 22 / 36
 23 / 36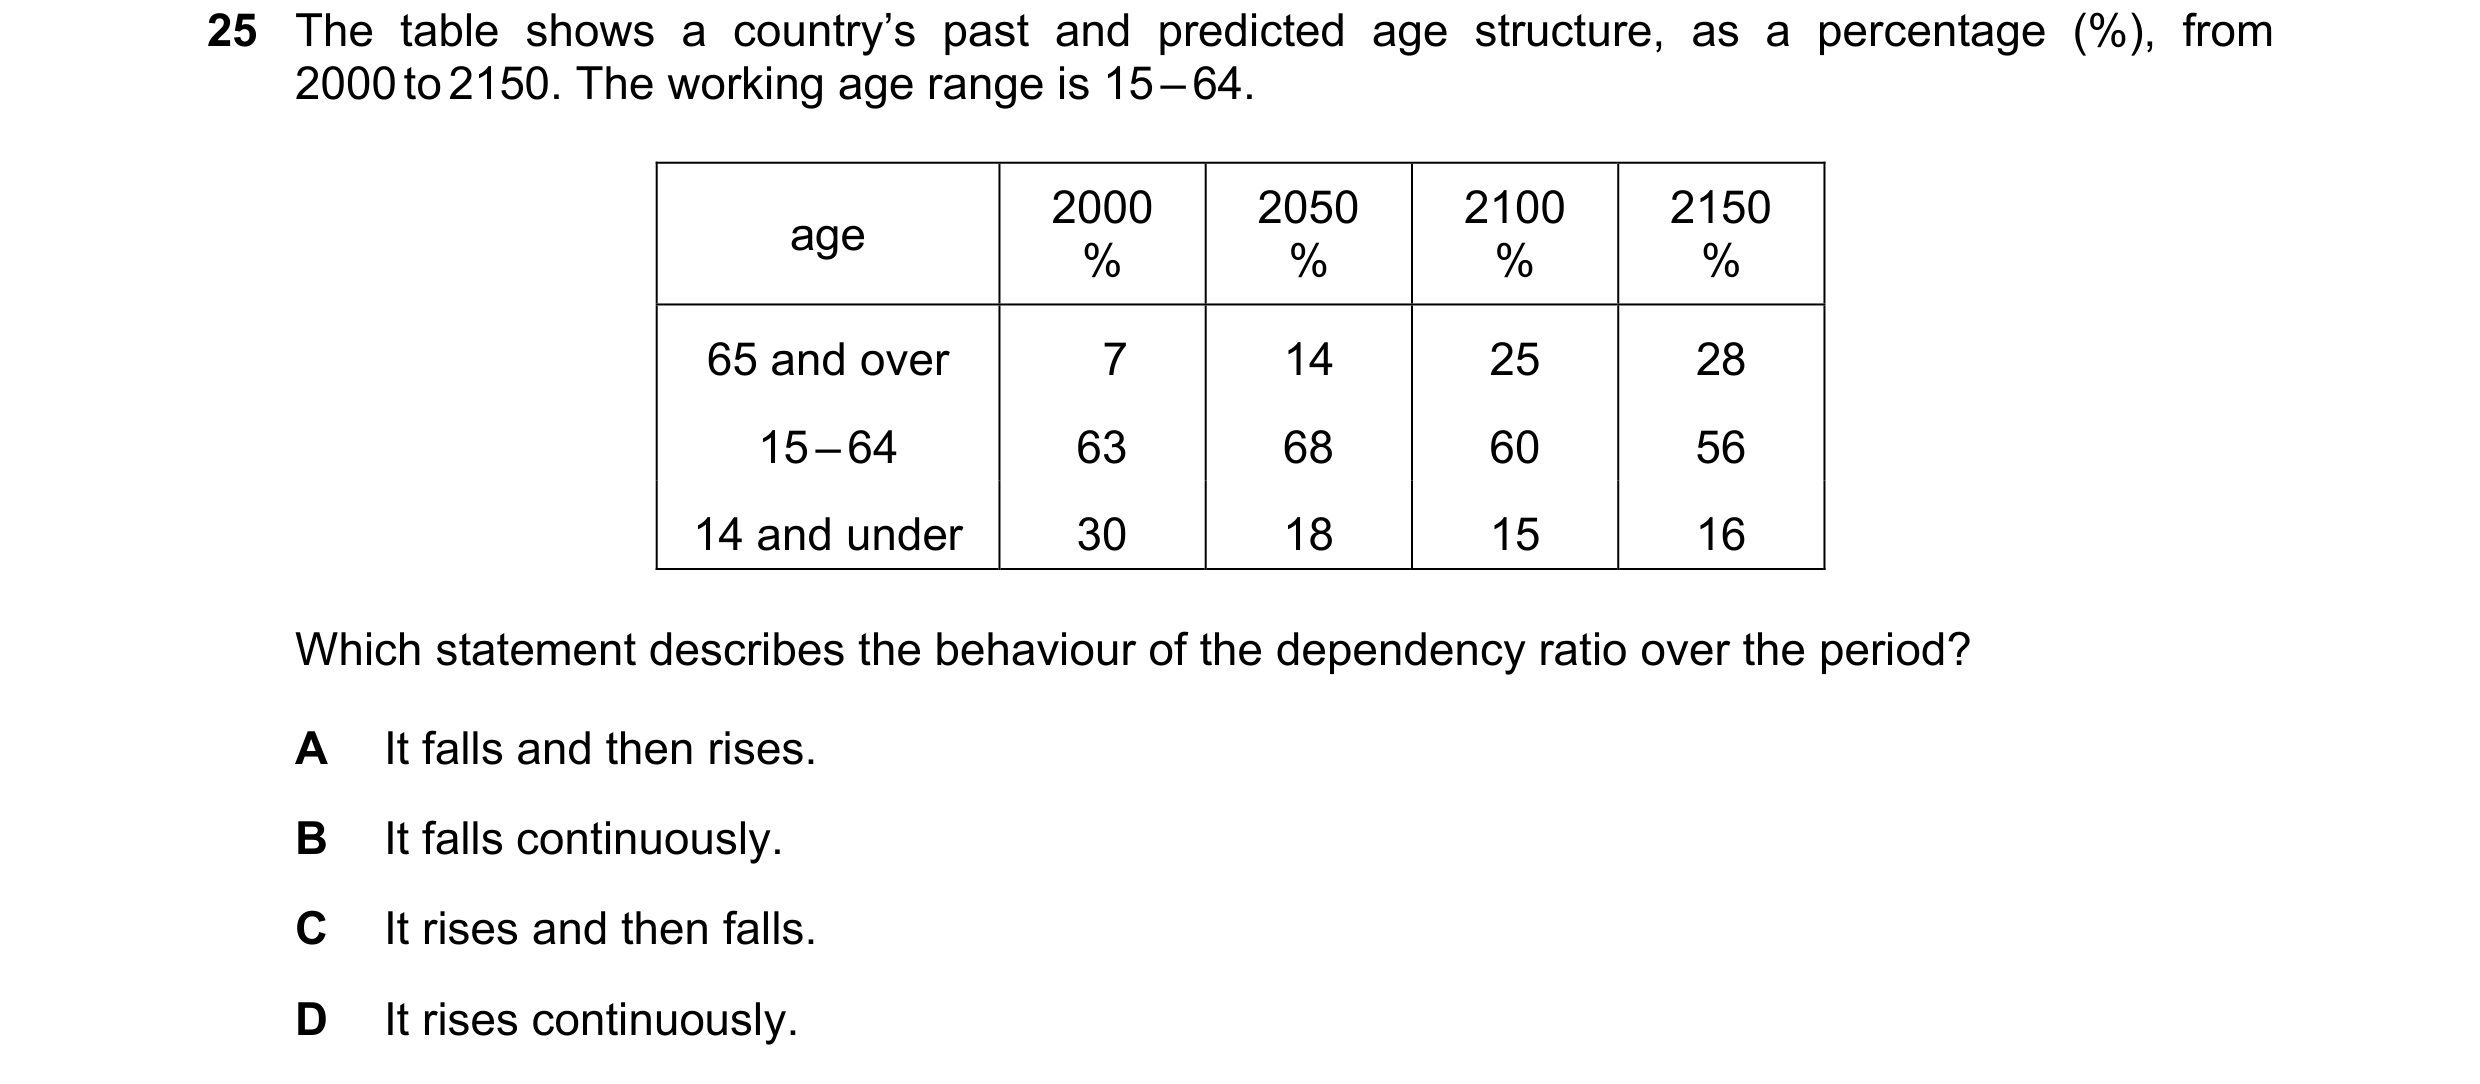



 24 / 36



 25 / 36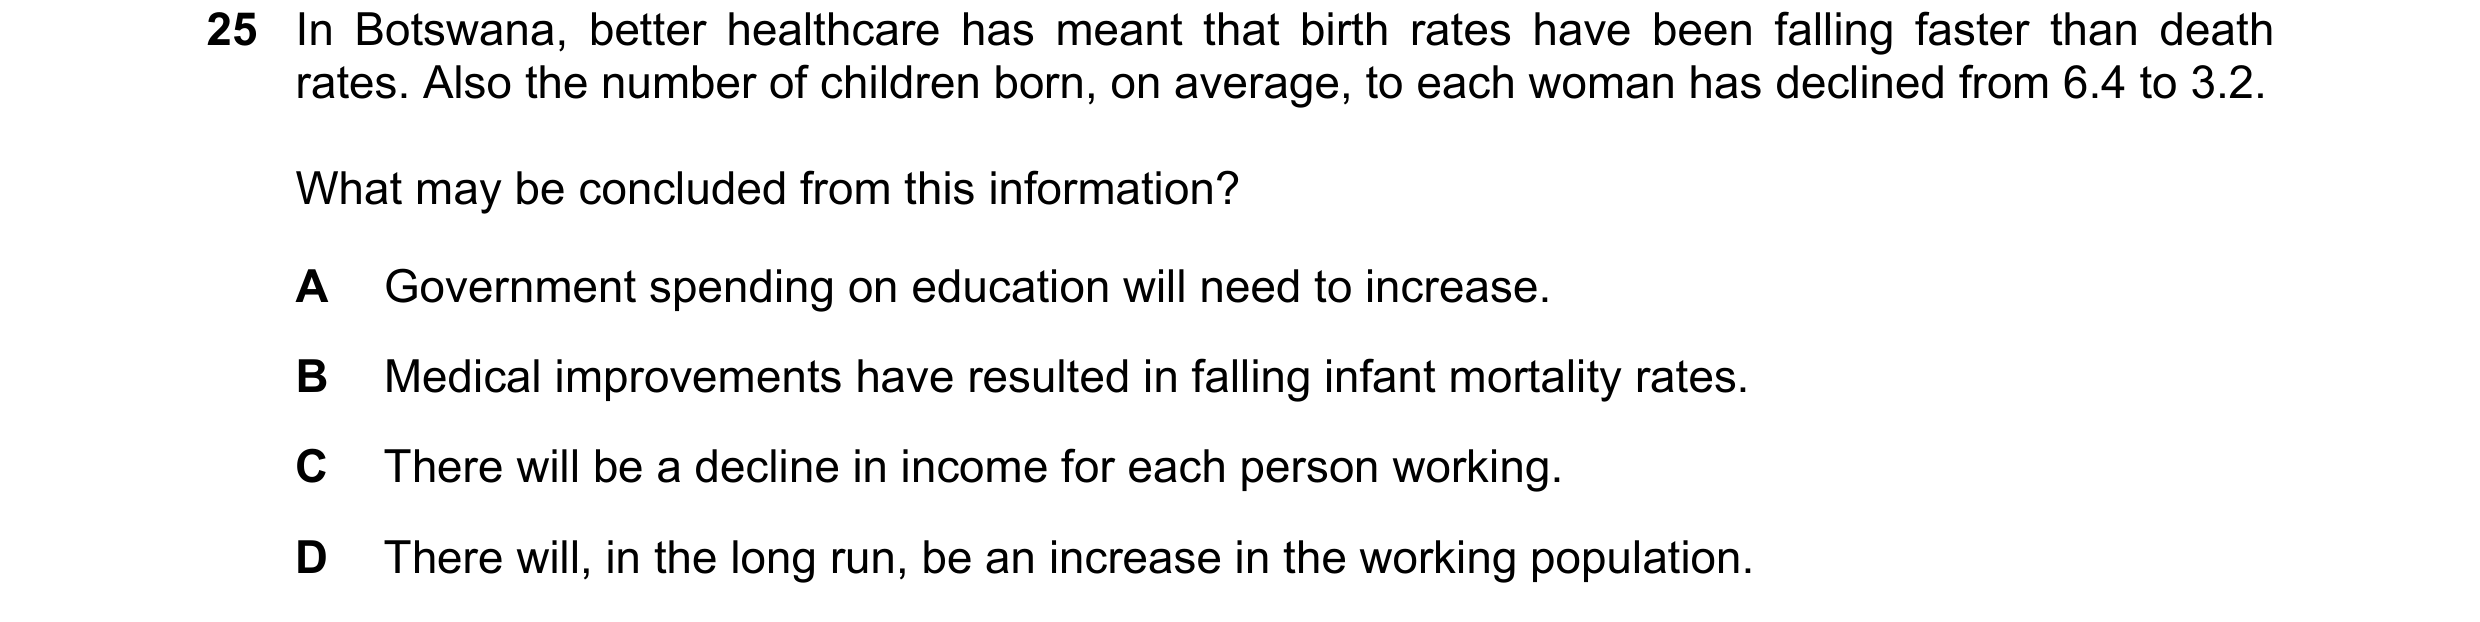
 26 / 36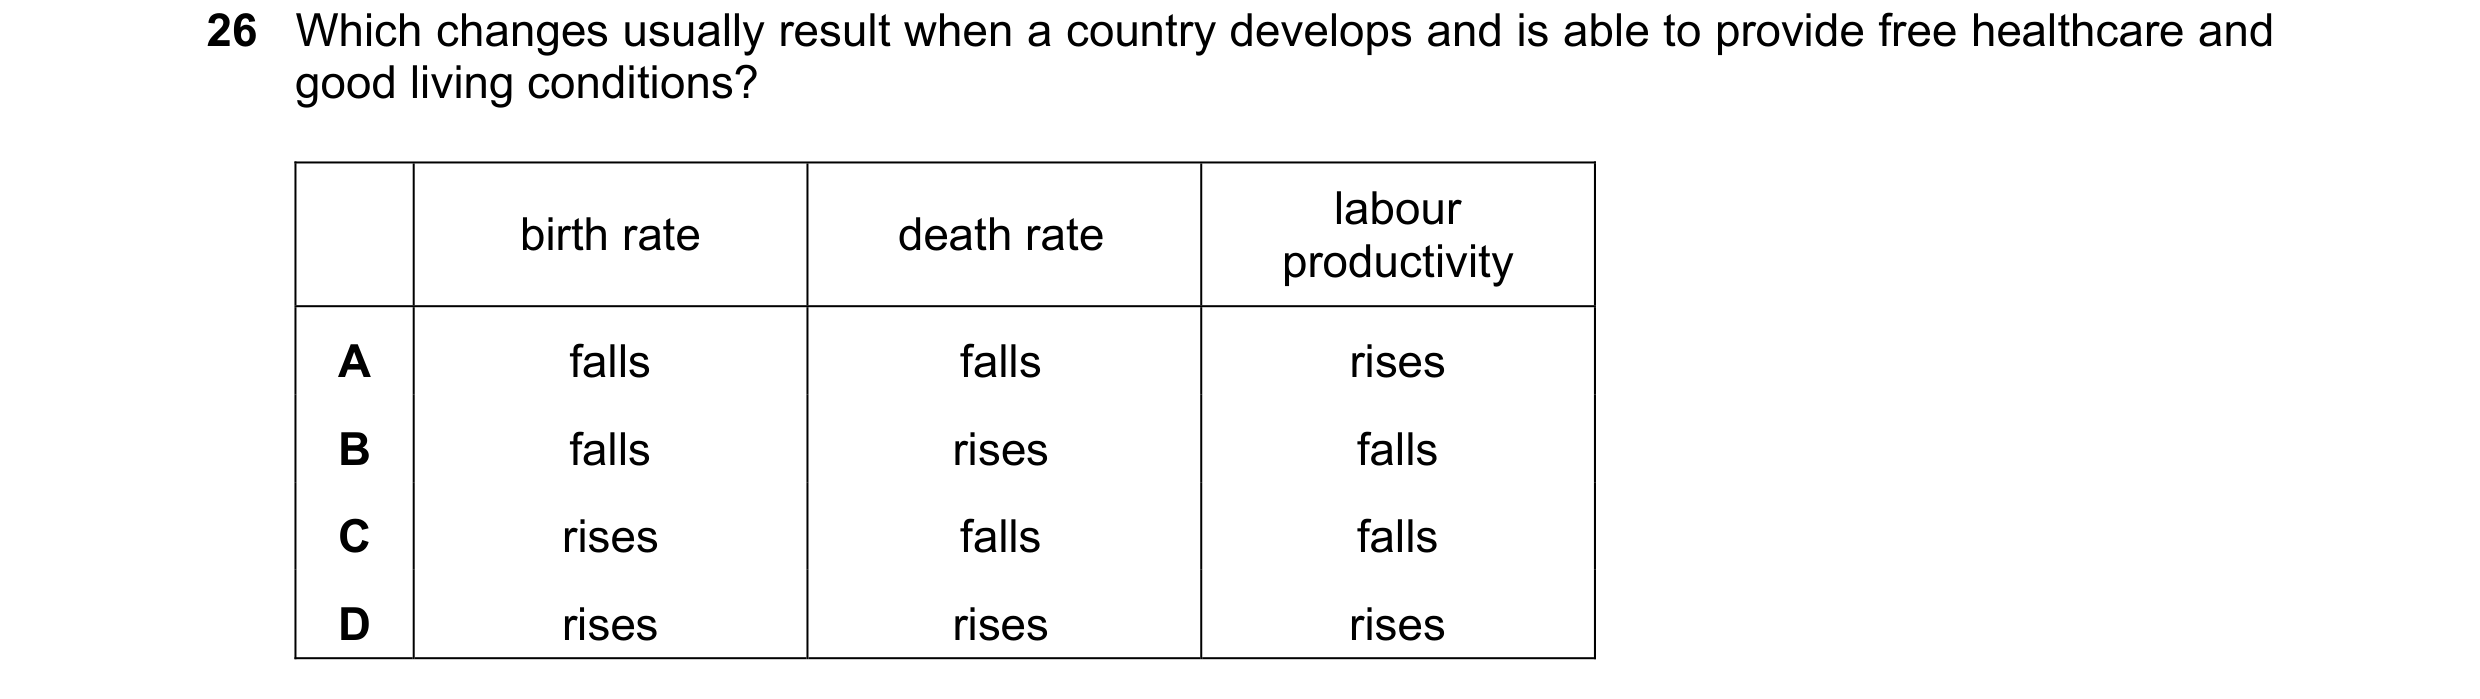


 27 / 36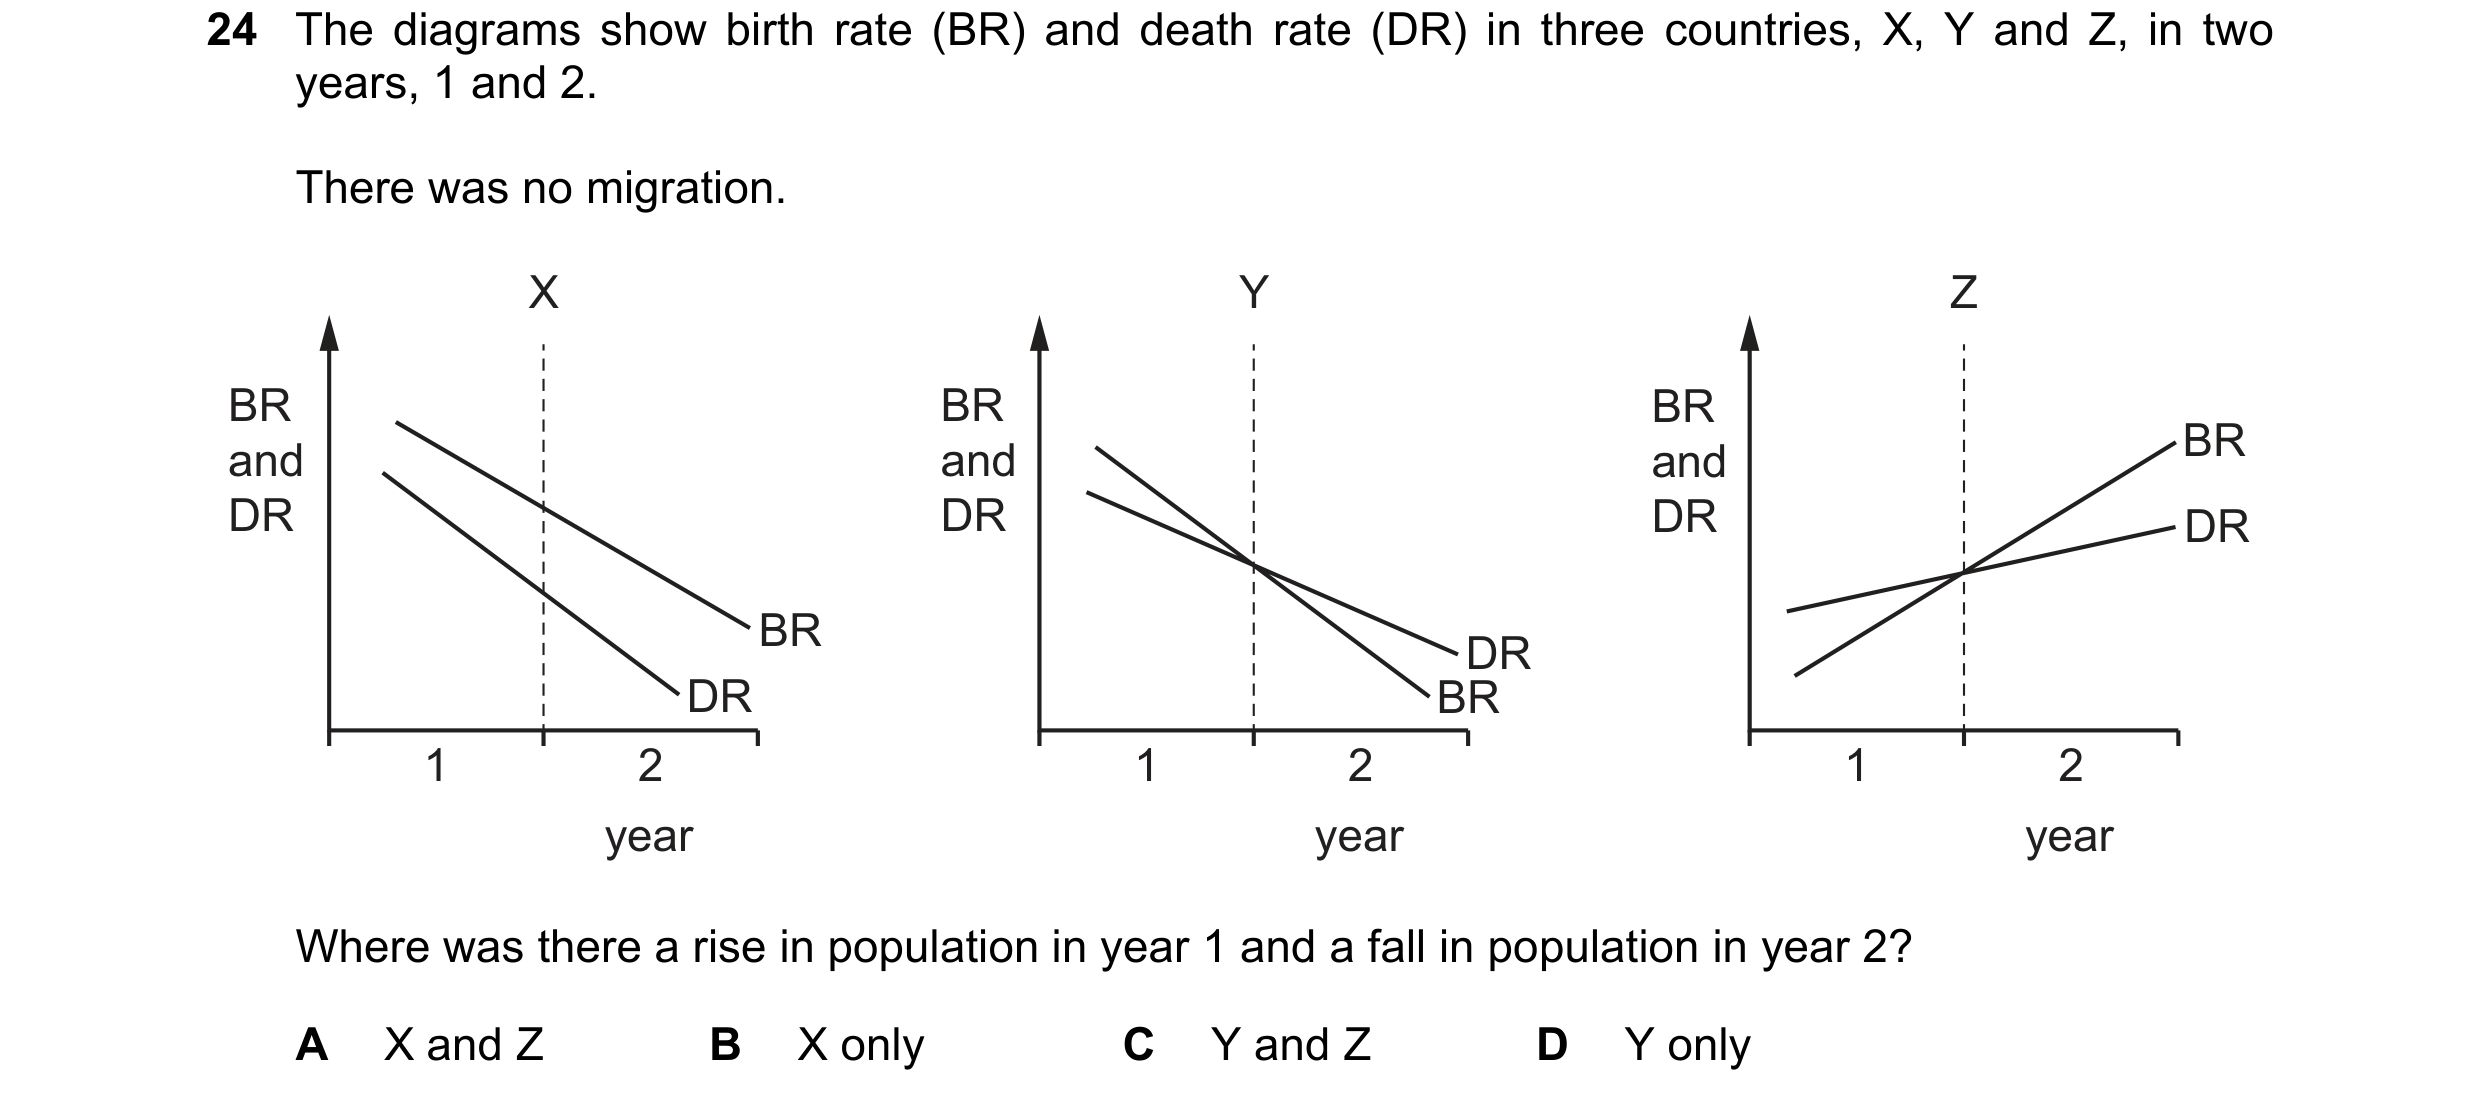
 28 / 36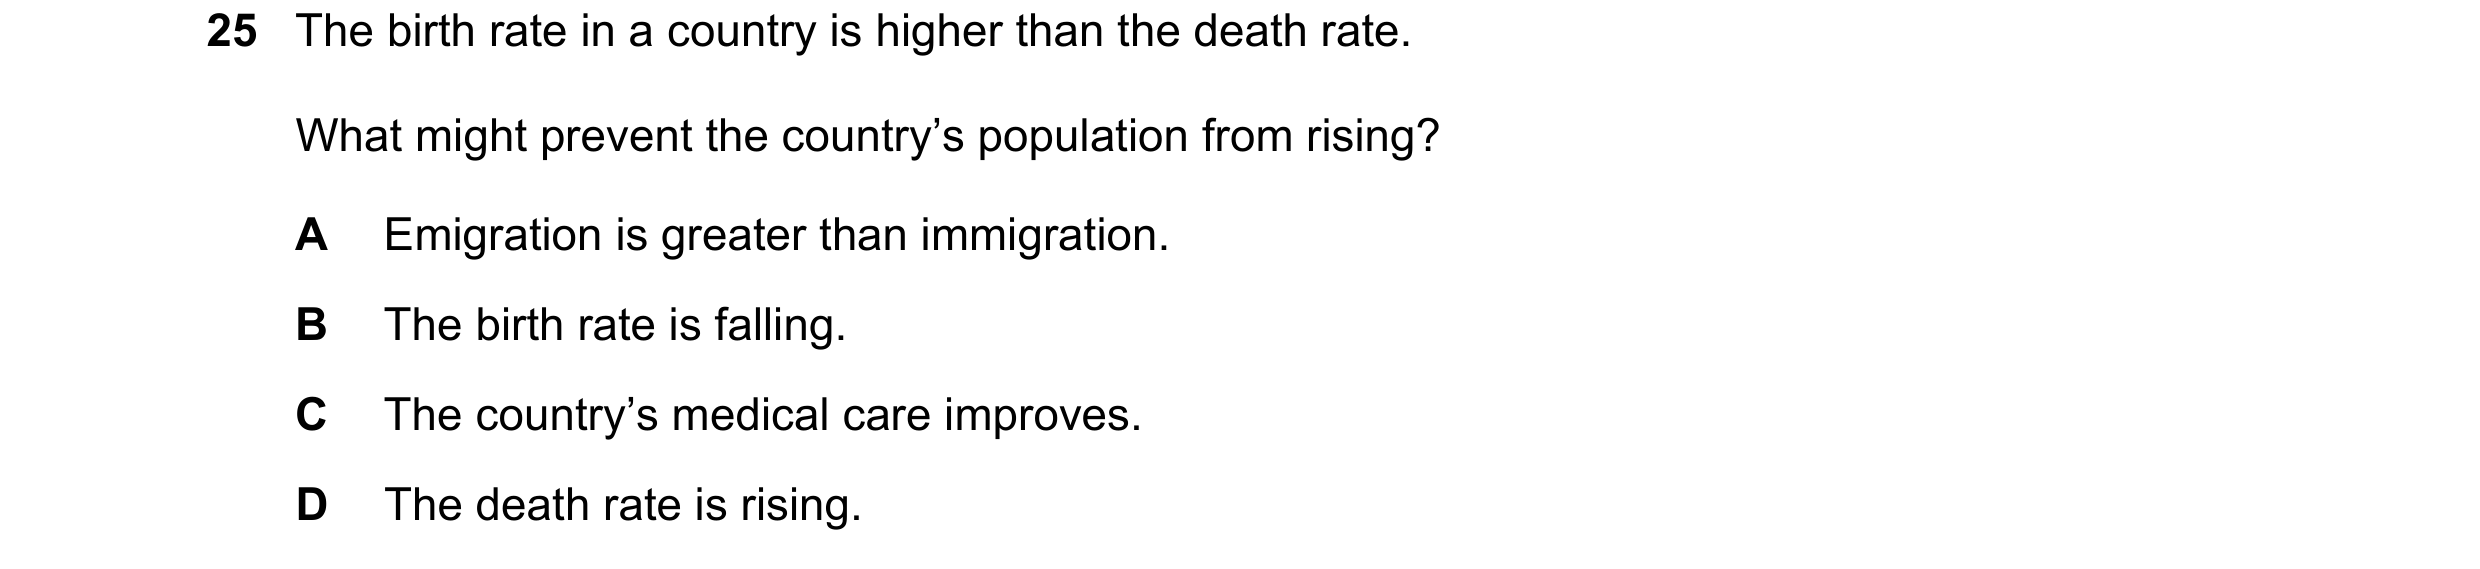



 29 / 36



 30 / 36

 31 / 36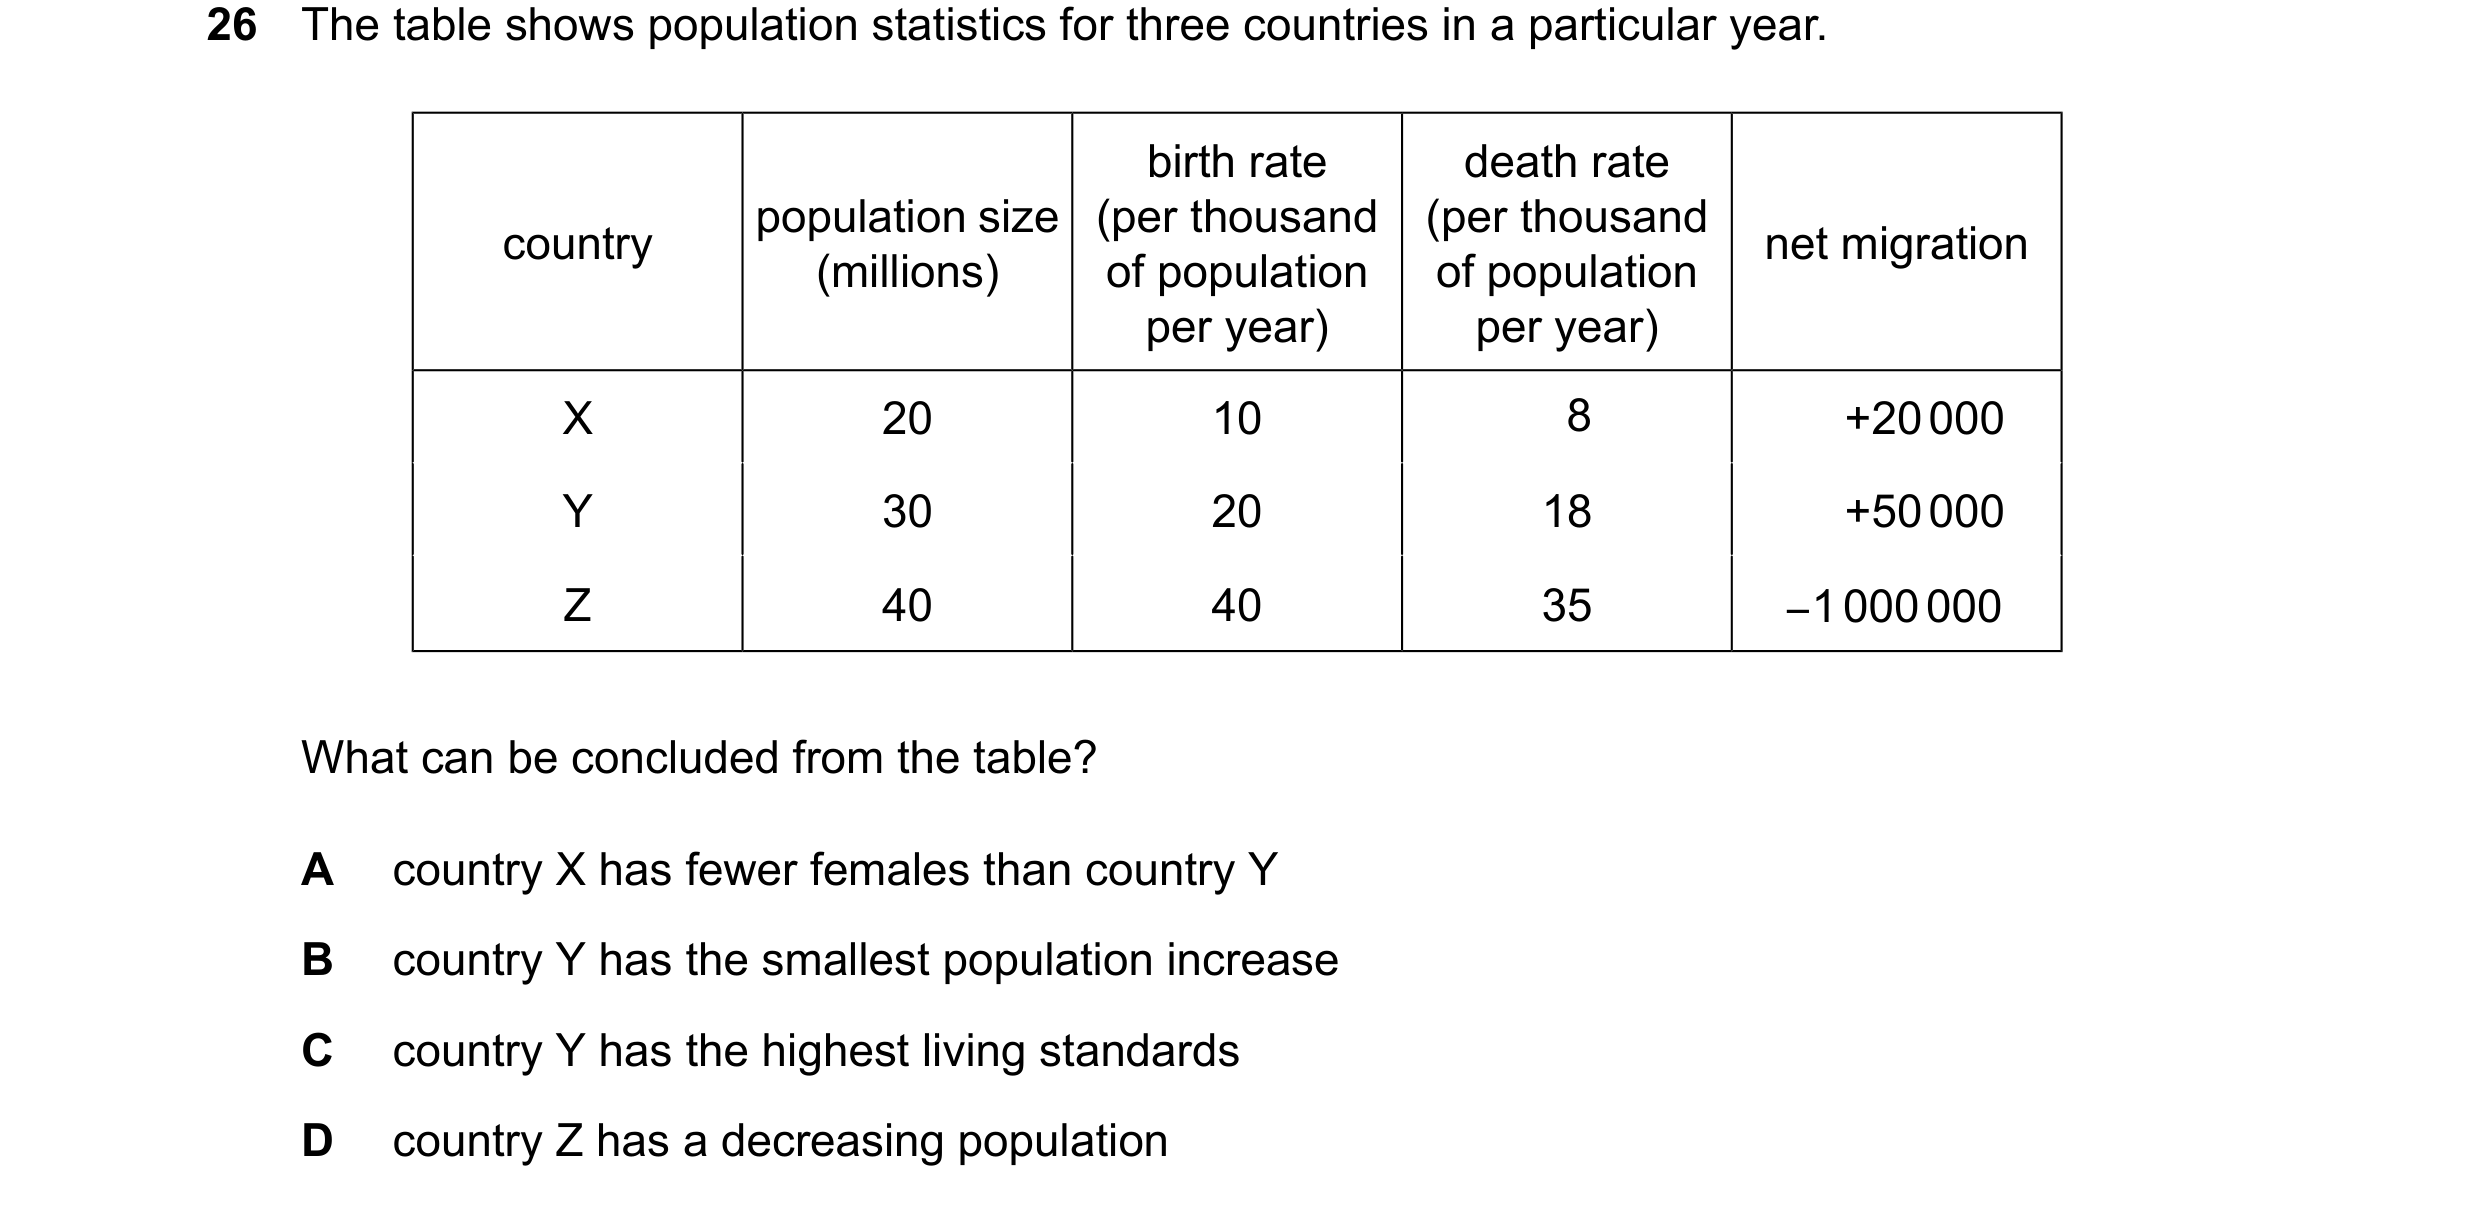
 32 / 36
 33 / 36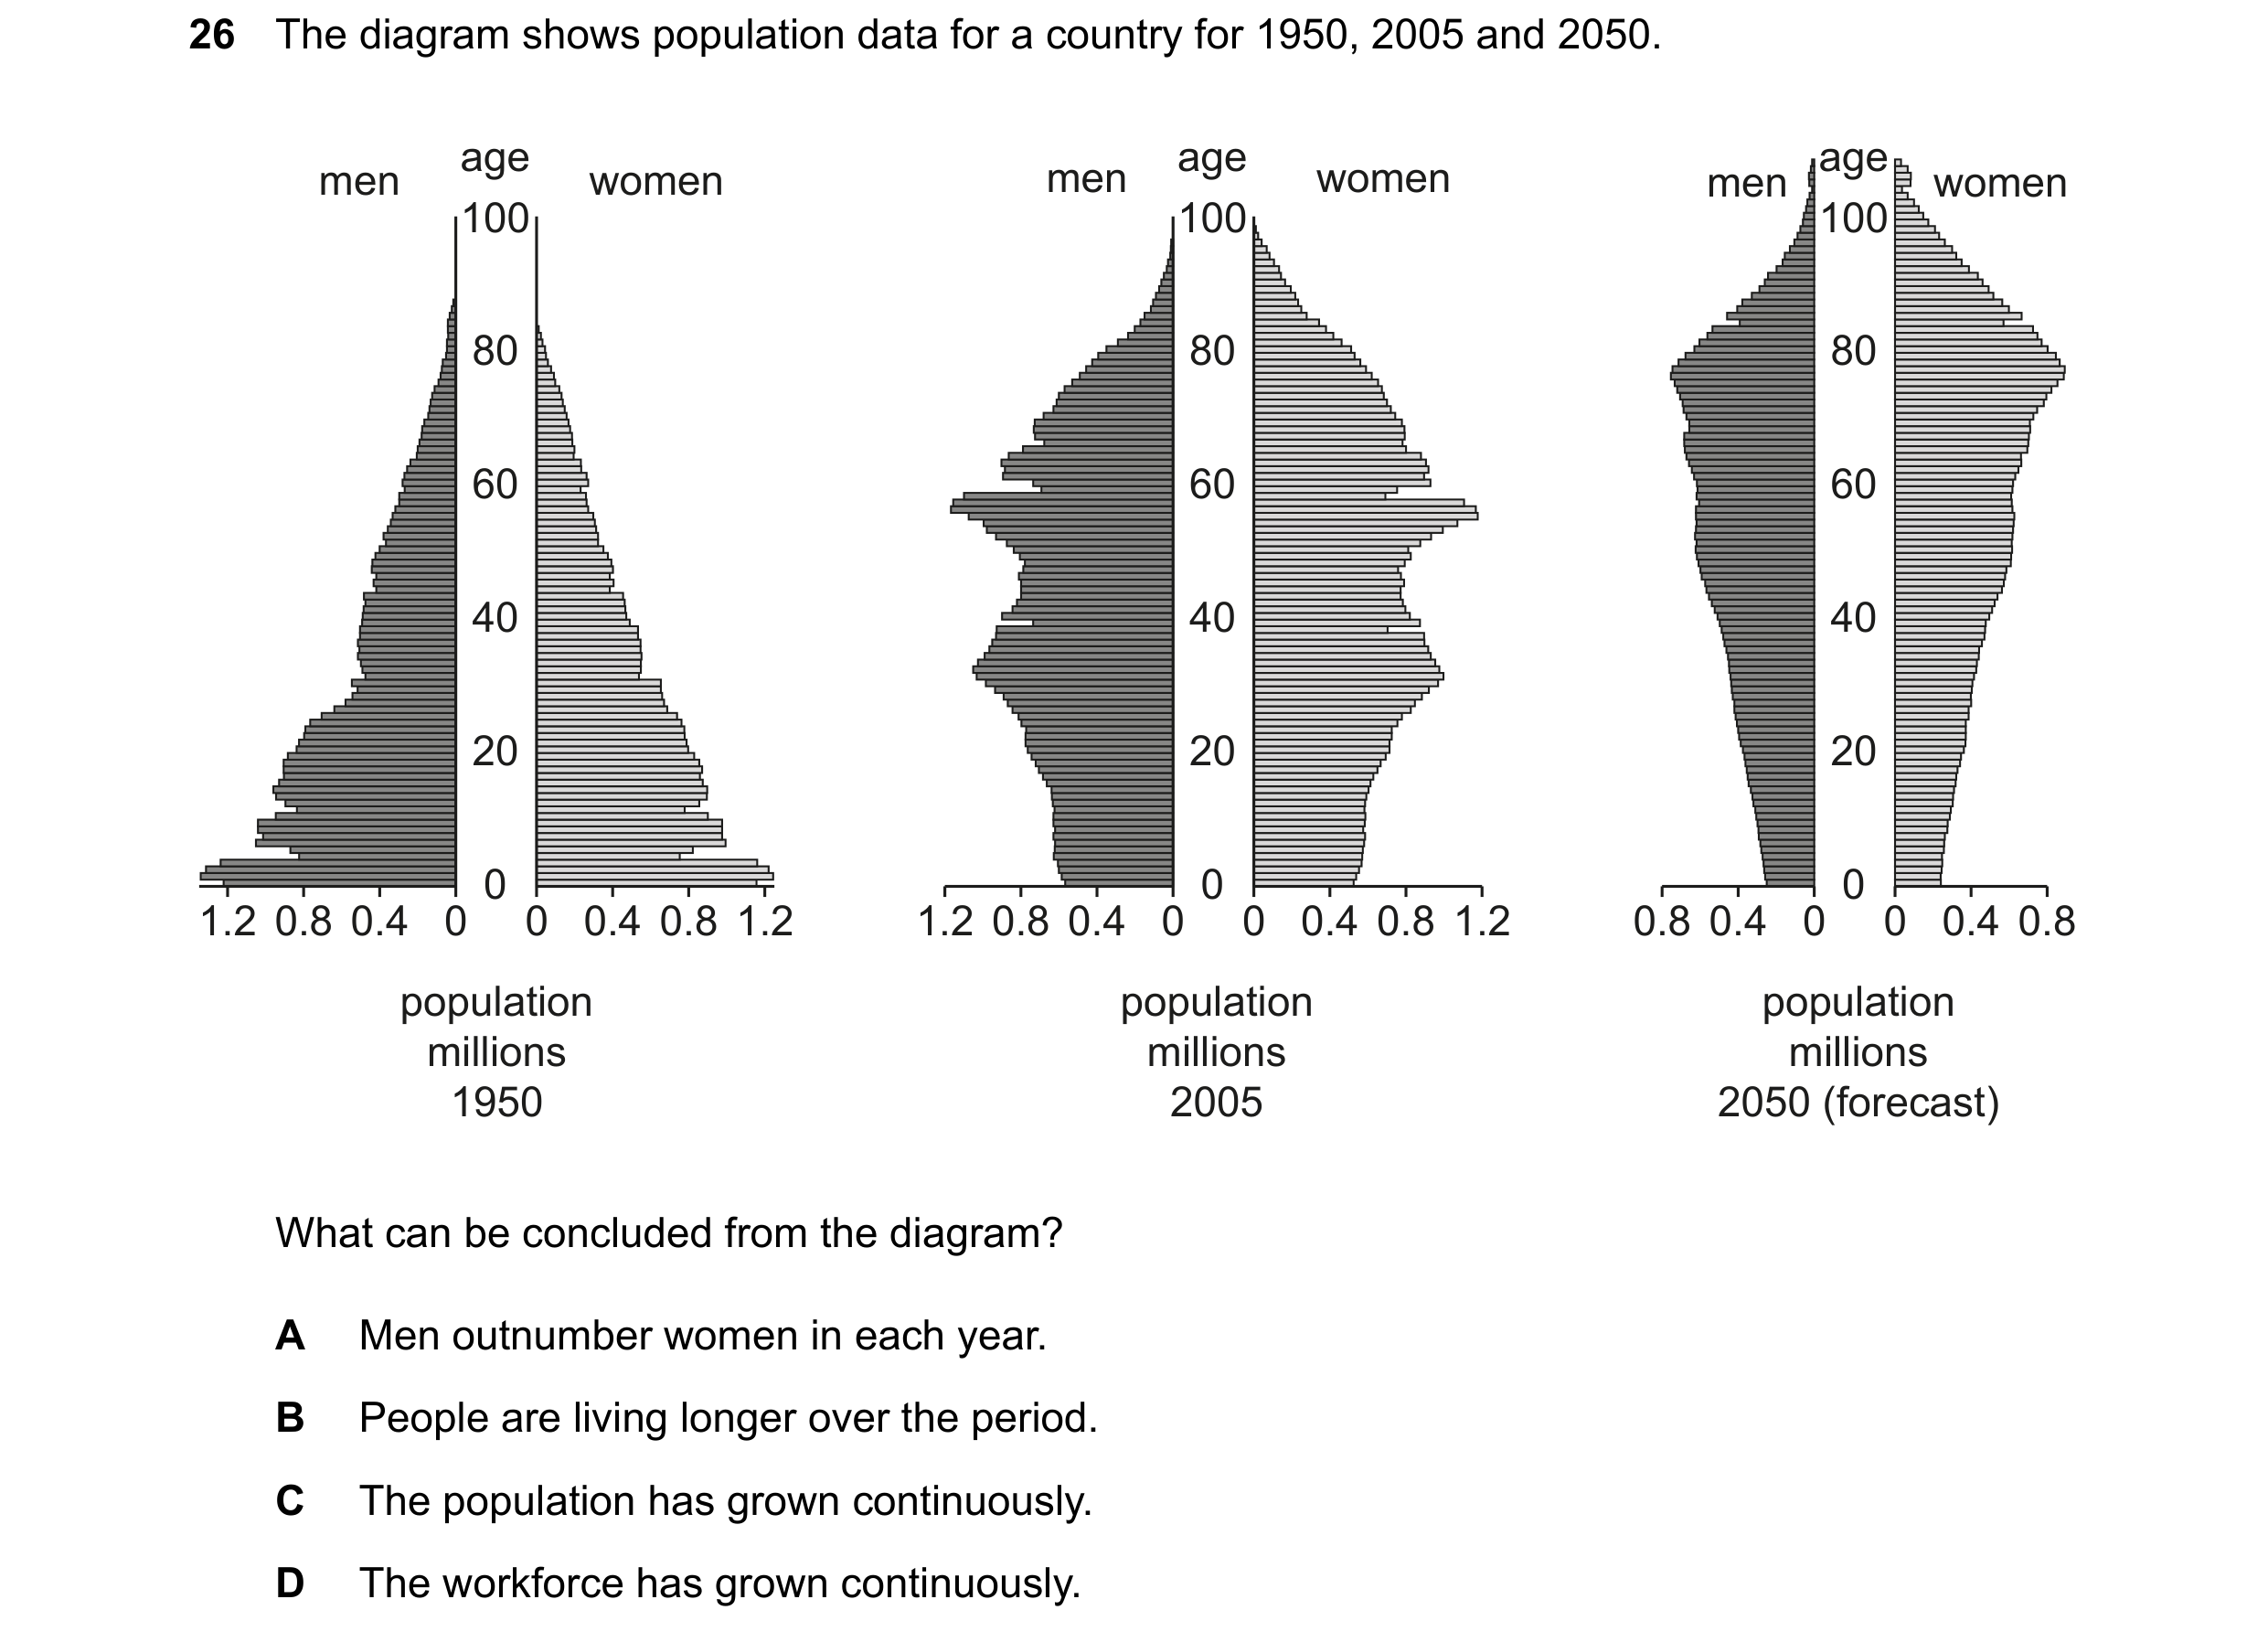
 34 / 36
 35 / 36
 36 / 36