Cambridge IGCSE Economics 0455 — 2016 Feb/March Paper 1 · Variant 2
0455/12/F/M/16 · 30 questions · 30 marks · ≈34 min
The question paper and its mark scheme, free to read here and free to download. This is Cambridge’s own paper, exactly as it was sat.
Question paper12 pages

Mark scheme2 pages
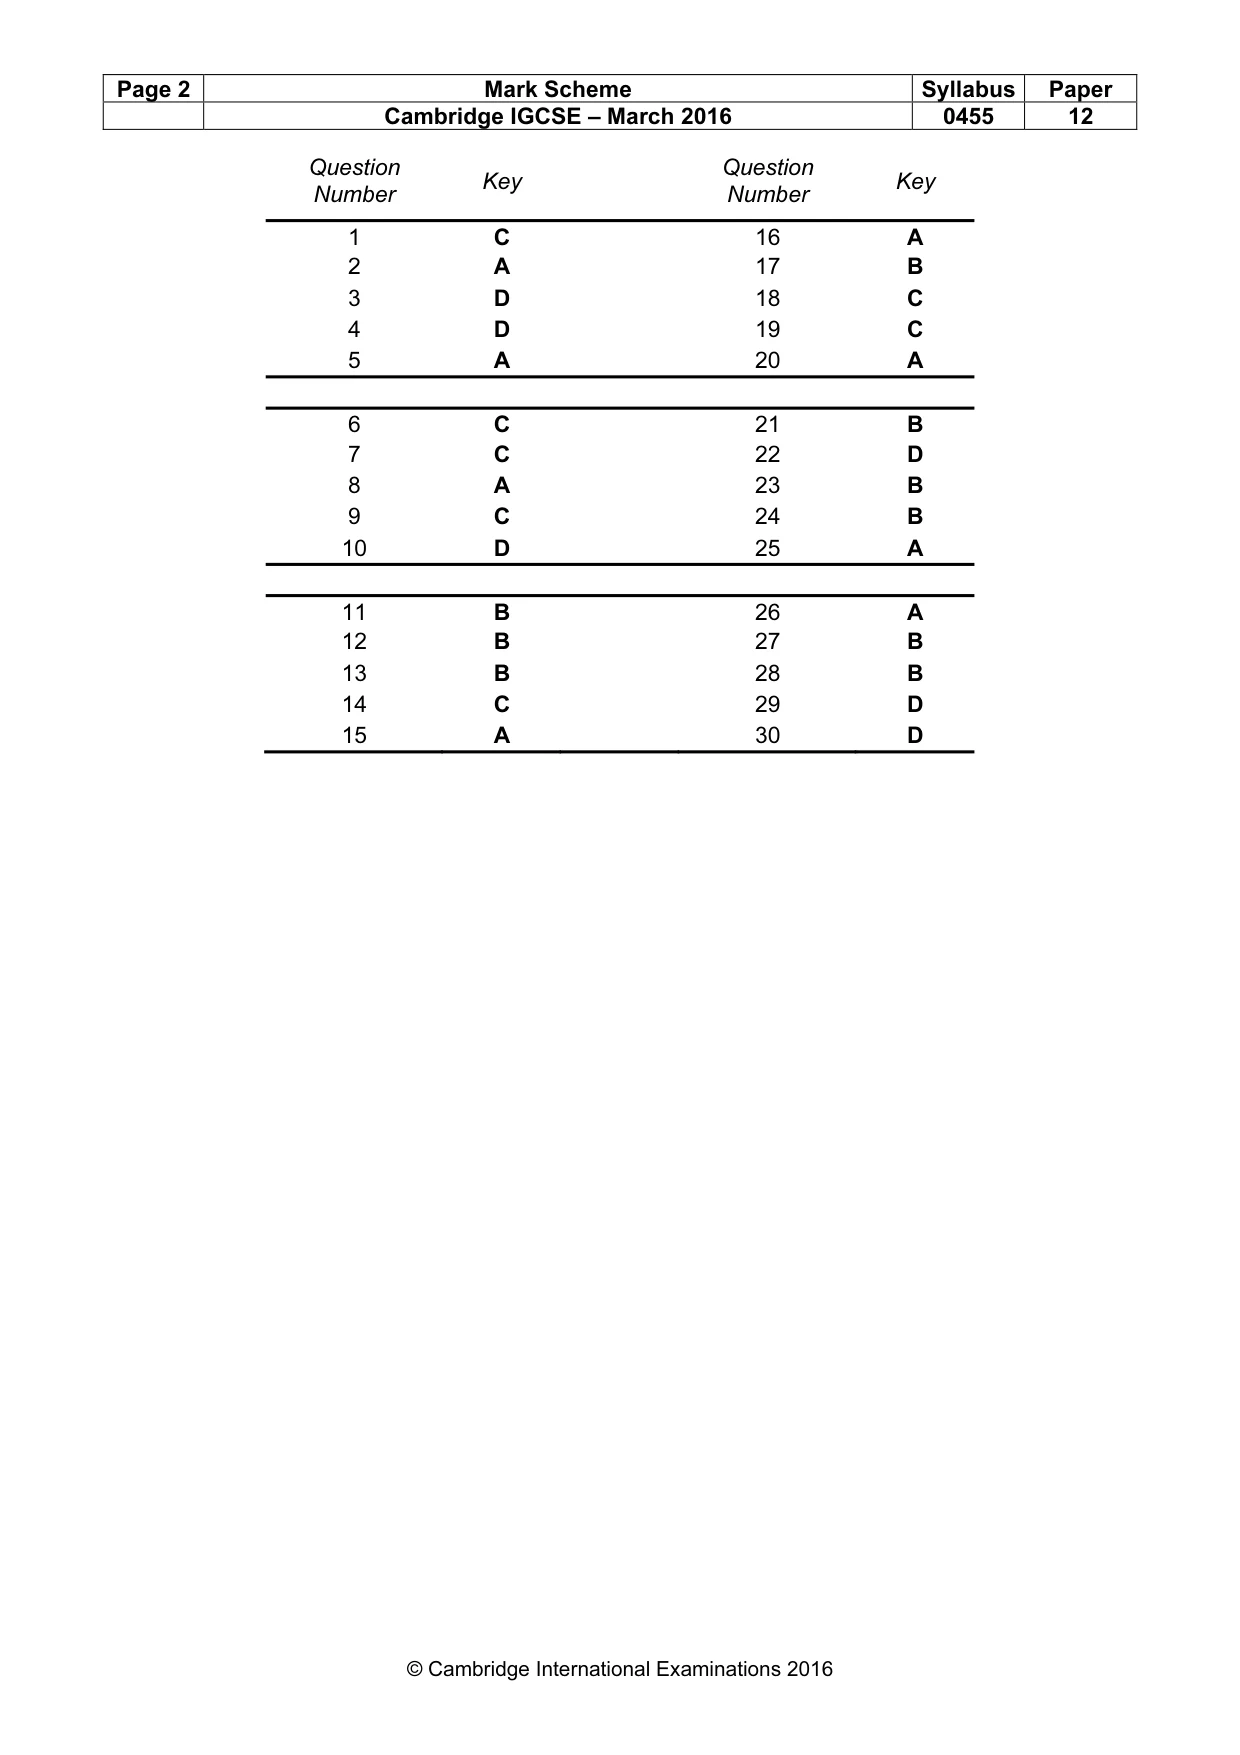
Answers below. Sit the paper first if you are practising.
Questions as text
Q1 · An economy with few resources is encouraged to improve the quality of its human resources
1 An economy with few resources is encouraged to improve the quality of its human resources. Which policy will lead to such an improvement? A conserving and protecting more of its natural resources B limiting the immigration of skilled labour C providing more opportunities for education and training D reducing the use of machines in production
Mark scheme: C
Q2 · The diagram shows a country’s production possibility curve for rice and wheat
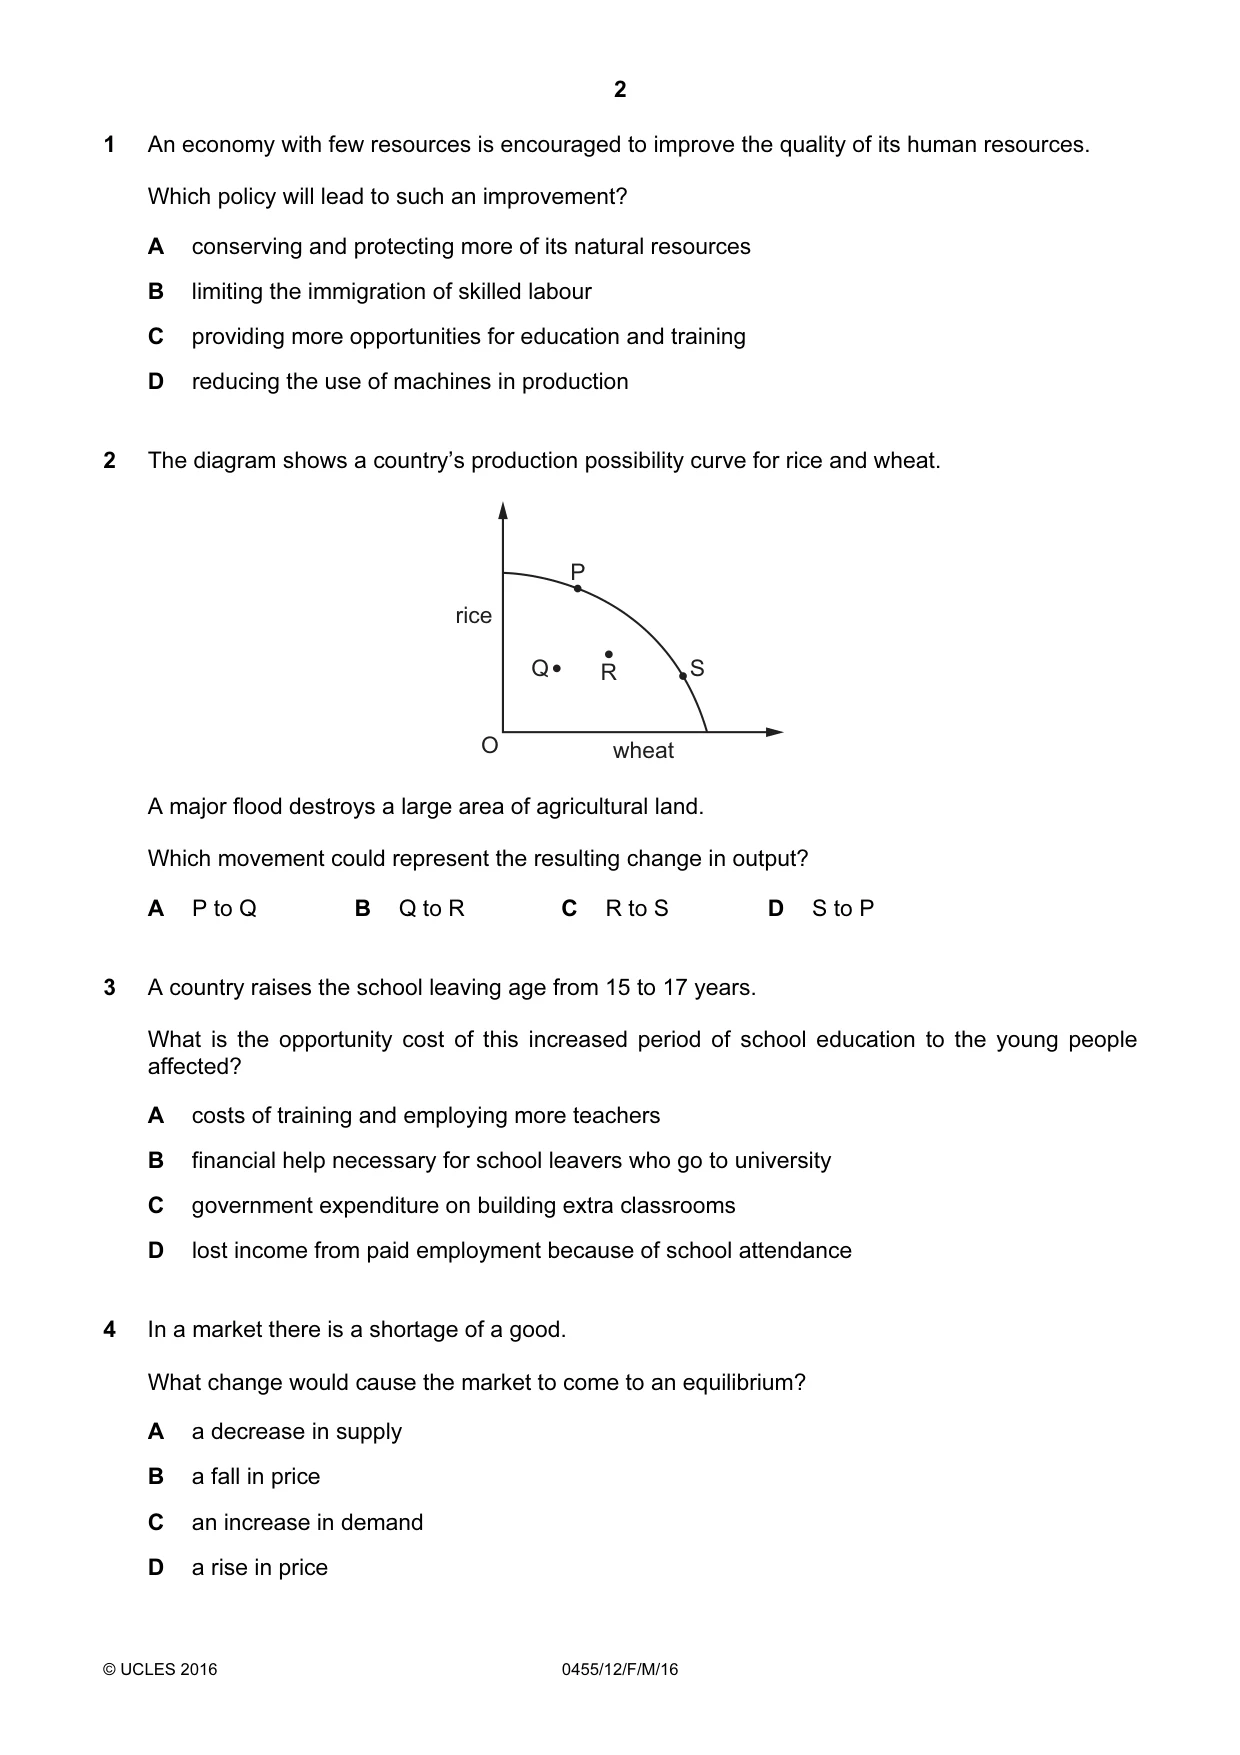
2 The diagram shows a country’s production possibility curve for rice and wheat. P rice Q R S O wheat A major flood destroys a large area of agricultural land. Which movement could represent the resulting change in output? A P to Q B Q to R C R to S D S to P
Mark scheme: A
More questions on Production possibility curve (PPC) diagrams
Q3 · A country raises the school leaving age from 15 to 17 years
3 A country raises the school leaving age from 15 to 17 years. What is the opportunity cost of this increased period of school education to the young people affected? A costs of training and employing more teachers B financial help necessary for school leavers who go to university C government expenditure on building extra classrooms D lost income from paid employment because of school attendance
Mark scheme: D
Q4 · In a market there is a shortage of a good
4 In a market there is a shortage of a good. What change would cause the market to come to an equilibrium? A a decrease in supply B a fall in price C an increase in demand D a rise in price
Mark scheme: D
Q5 · A product has a totally inelastic price elasticity of demand
5 A product has a totally inelastic price elasticity of demand. What will happen to total revenue if the price of the product falls by 25%? A It will fall by 25%. B It will fall to zero. C It will remain unchanged. D It will rise by 25%.
Mark scheme: A
Q6 · In 2014, a plan for a major new rail link funded by central and regional government was…
6 In 2014, a plan for a major new rail link funded by central and regional government was announced. It would involve the redevelopment of a city area, generate 14 000 jobs and allow the development of 2000 homes and offices for private businesses. What economic concepts are indicated directly in the above statement? A budget surplus and inflation B factors of production and multinational companies C fiscal policy and mixed economy D regional unemployment and average wage rates
Mark scheme: C
Q7 · How are social costs calculated?
7 How are social costs calculated? A fixed costs plus variable costs B private benefits less private costs C private costs plus external costs D social benefits less external costs
Mark scheme: C
Q8 · What is a disadvantage for a trade union representing workers in a company that has…
8 What is a disadvantage for a trade union representing workers in a company that has increased specialisation? A Capital equipment can be substituted for labour. B Different abilities can be used fully. C Production levels are decreased. D Workers are able to gain a higher level of skill.
Mark scheme: A
Q9 · A government finance minister said that the purchasing power of most people’s incomes had…
9 A government finance minister said that the purchasing power of most people’s incomes had risen in the last year. What must have increased for the purchasing power to rise? A money wages B net income after tax C real wages D wage rates
Mark scheme: C
Q10 · The table shows the change in incomes for a number of occupations between 2003 and 2013
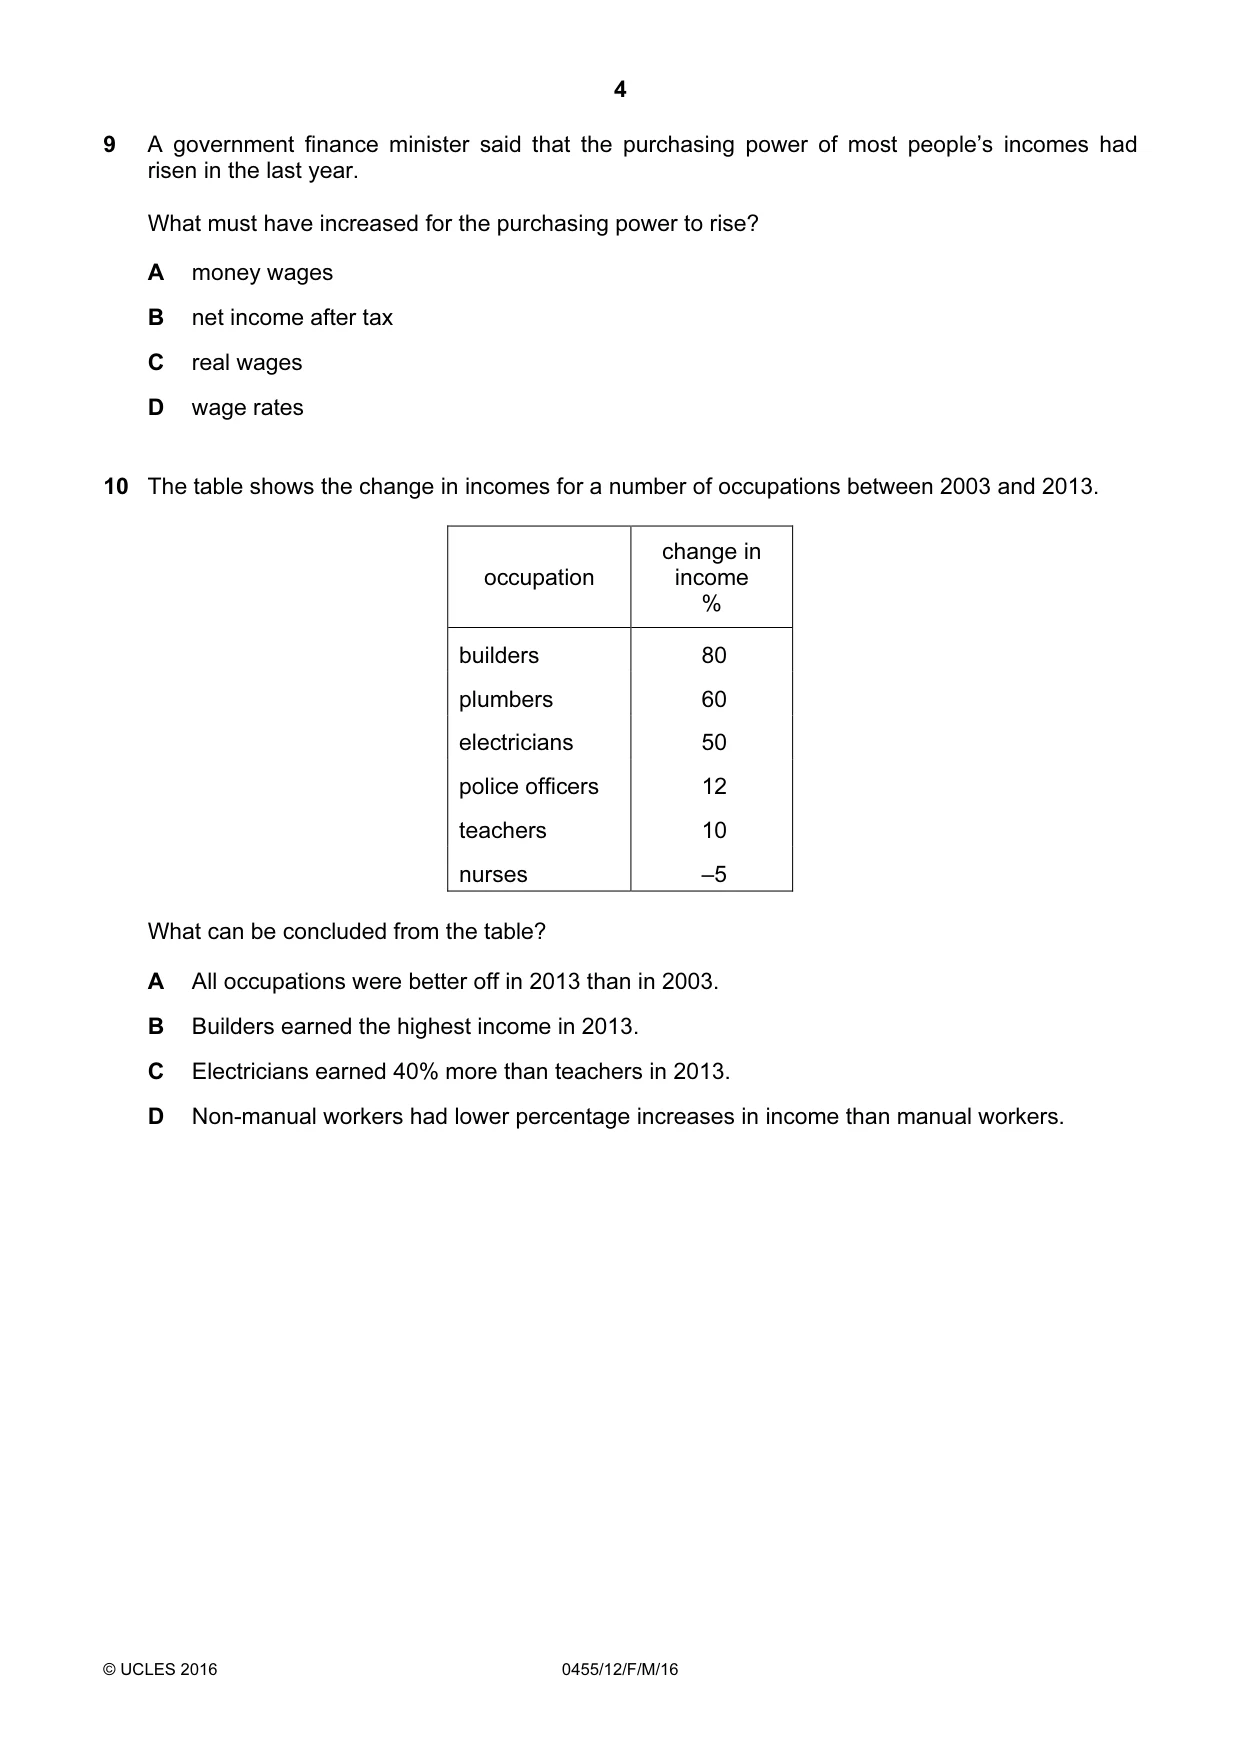
10 The table shows the change in incomes for a number of occupations between 2003 and 2013. change in occupation income % builders 80 plumbers 60 electricians 50 police officers 12 teachers 10 nurses –5 What can be concluded from the table? A All occupations were better off in 2013 than in 2003. B Builders earned the highest income in 2013. C Electricians earned 40% more than teachers in 2013. D Non-manual workers had lower percentage increases in income than manual workers.
Mark scheme: D
Q11 · The table shows information for two workers
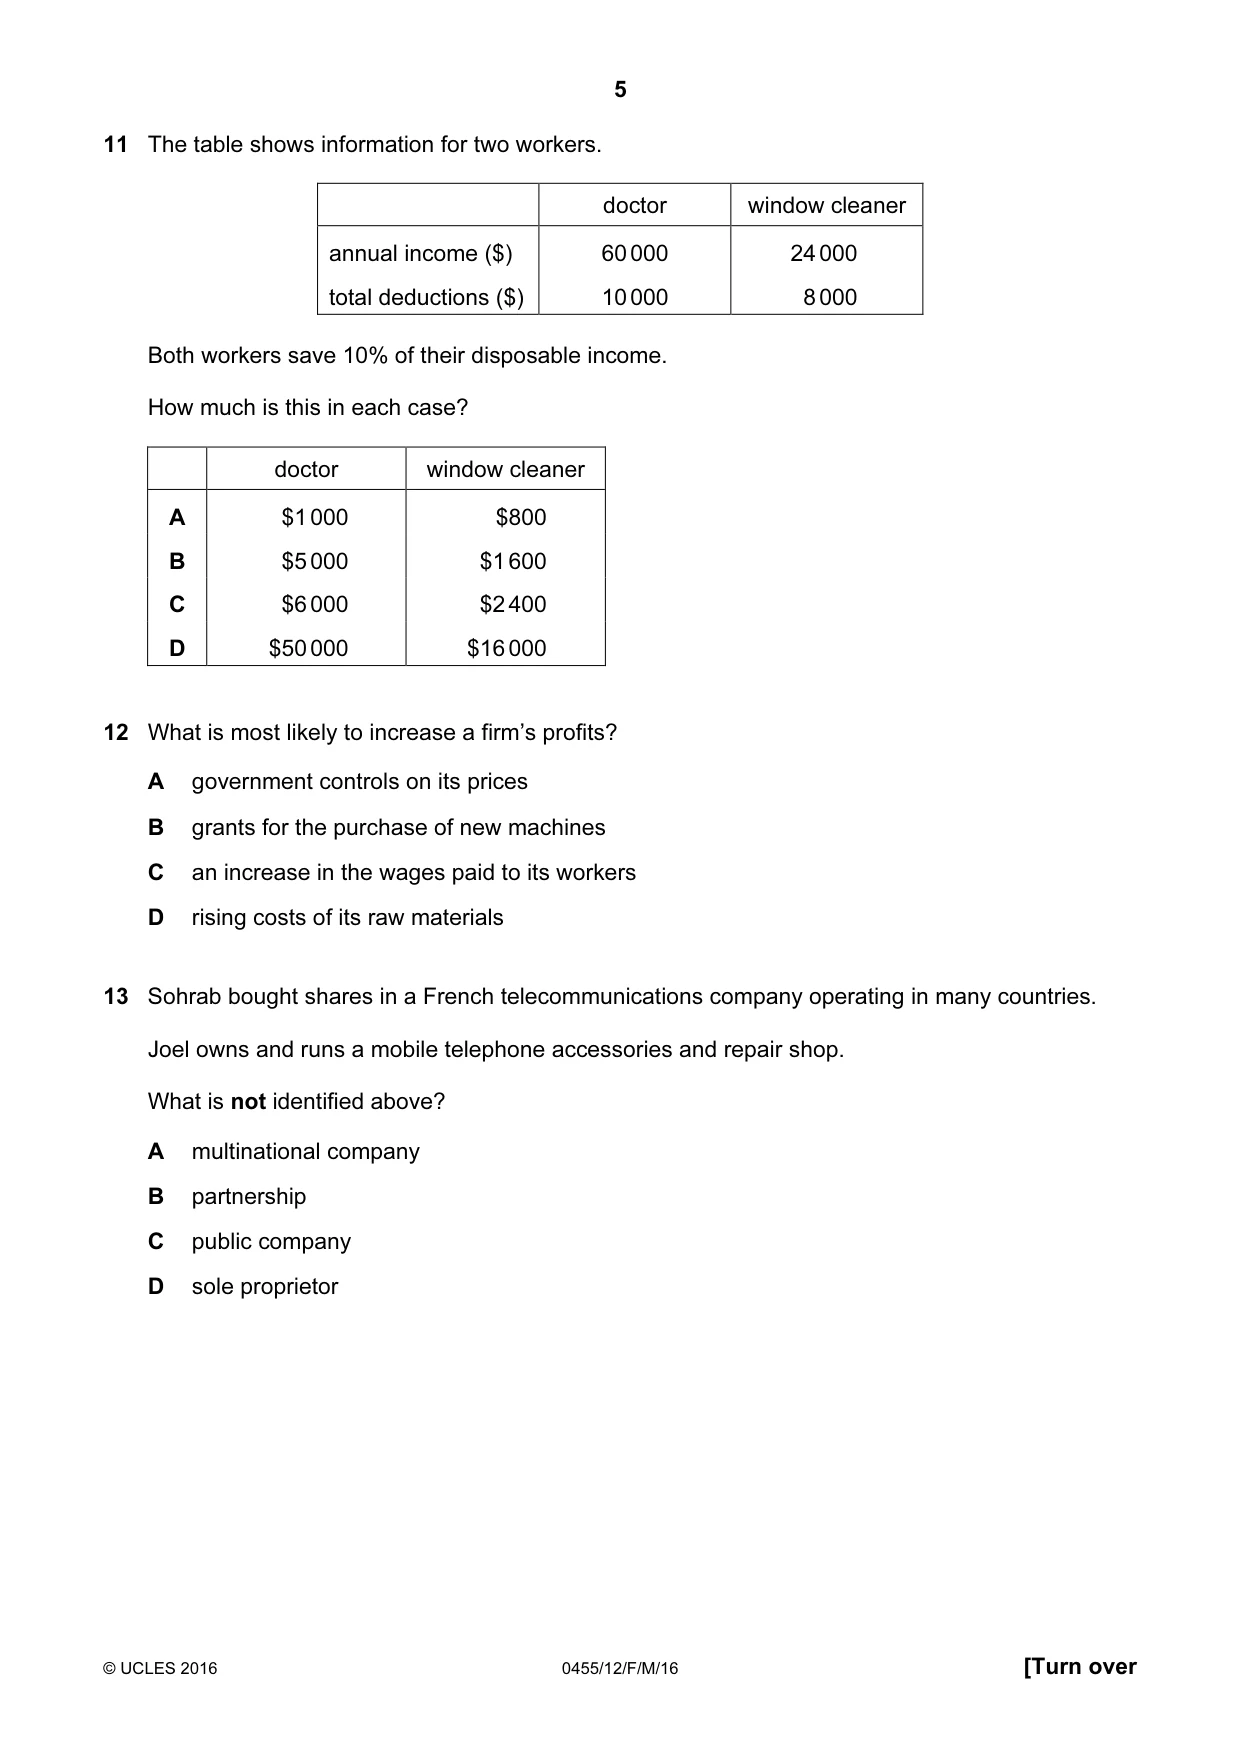
11 The table shows information for two workers. doctor window cleaner annual income ($) 60 000 24 000 total deductions ($) 10 000 8 000 Both workers save 10% of their disposable income. How much is this in each case? doctor window cleaner A $1 000 $800 B $5 000 $1 600 C $6 000 $2 400 D $50 000 $16 000
Mark scheme: B
Q12 · What is most likely to increase a firm’s profits?
12 What is most likely to increase a firm’s profits? A government controls on its prices B grants for the purchase of new machines C an increase in the wages paid to its workers D rising costs of its raw materials
Mark scheme: B
Q13 · Sohrab bought shares in a French telecommunications company operating in many countries
13 Sohrab bought shares in a French telecommunications company operating in many countries. Joel owns and runs a mobile telephone accessories and repair shop. What is not identified above? A multinational company B partnership C public company D sole proprietor
Mark scheme: B
Q14 · A firm’s average revenue is $20
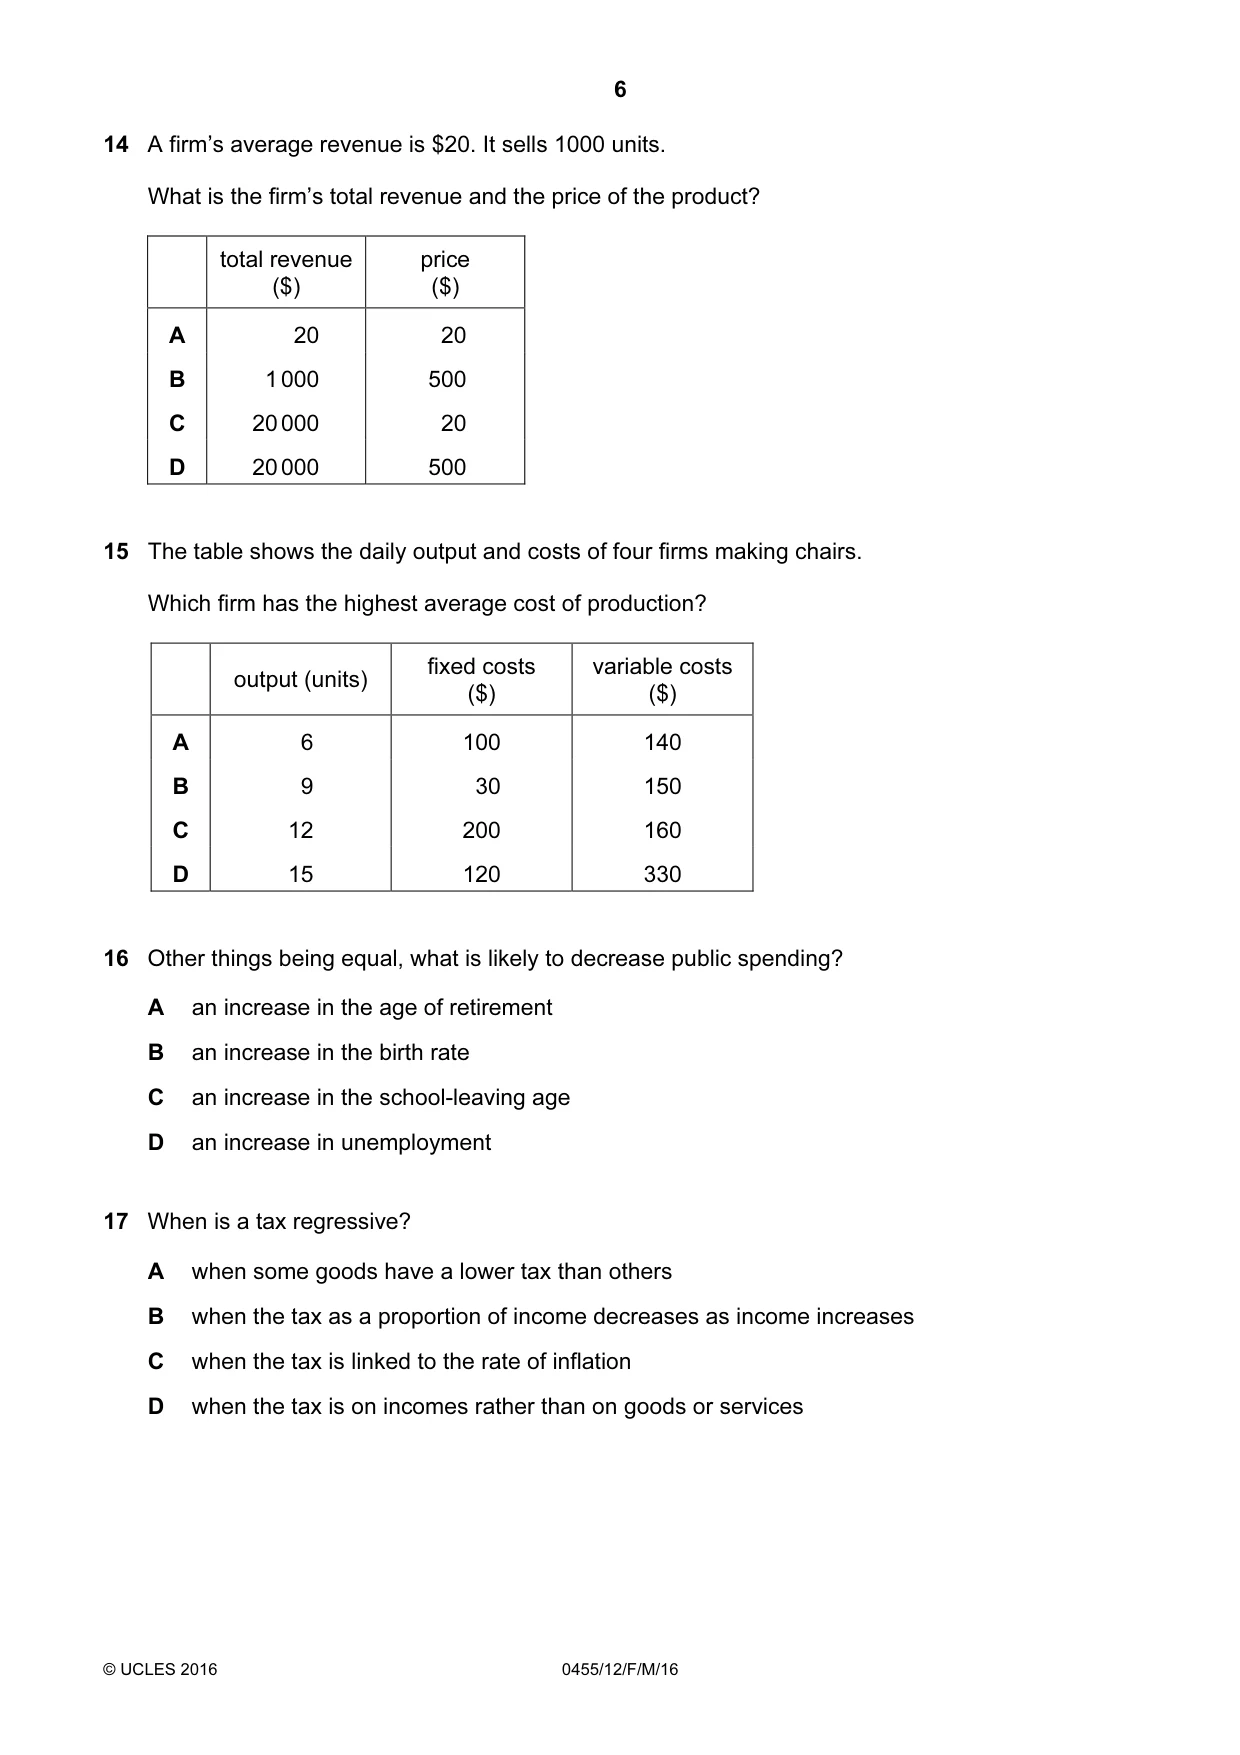
14 A firm’s average revenue is $20. It sells 1000 units. What is the firm’s total revenue and the price of the product? total revenue price ($) ($) A 20 20 B 1 000 500 C 20 000 20 D 20 000 500
Mark scheme: C
Q15 · The table shows the daily output and costs of four firms making chairs
15 The table shows the daily output and costs of four firms making chairs. Which firm has the highest average cost of production? fixed costs variable costs output (units) ($) ($) A 6 100 140 B 9 30 150 C 12 200 160 D 15 120 330
Mark scheme: A
Q16 · Other things being equal, what is likely to decrease public spending?
16 Other things being equal, what is likely to decrease public spending? A an increase in the age of retirement B an increase in the birth rate C an increase in the school-leaving age D an increase in unemployment
Mark scheme: A
Q17 · When is a tax regressive?
17 When is a tax regressive? A when some goods have a lower tax than others B when the tax as a proportion of income decreases as income increases C when the tax is linked to the rate of inflation D when the tax is on incomes rather than on goods or services
Mark scheme: B
Q18 · The Government of India wishes to help the very poorest people
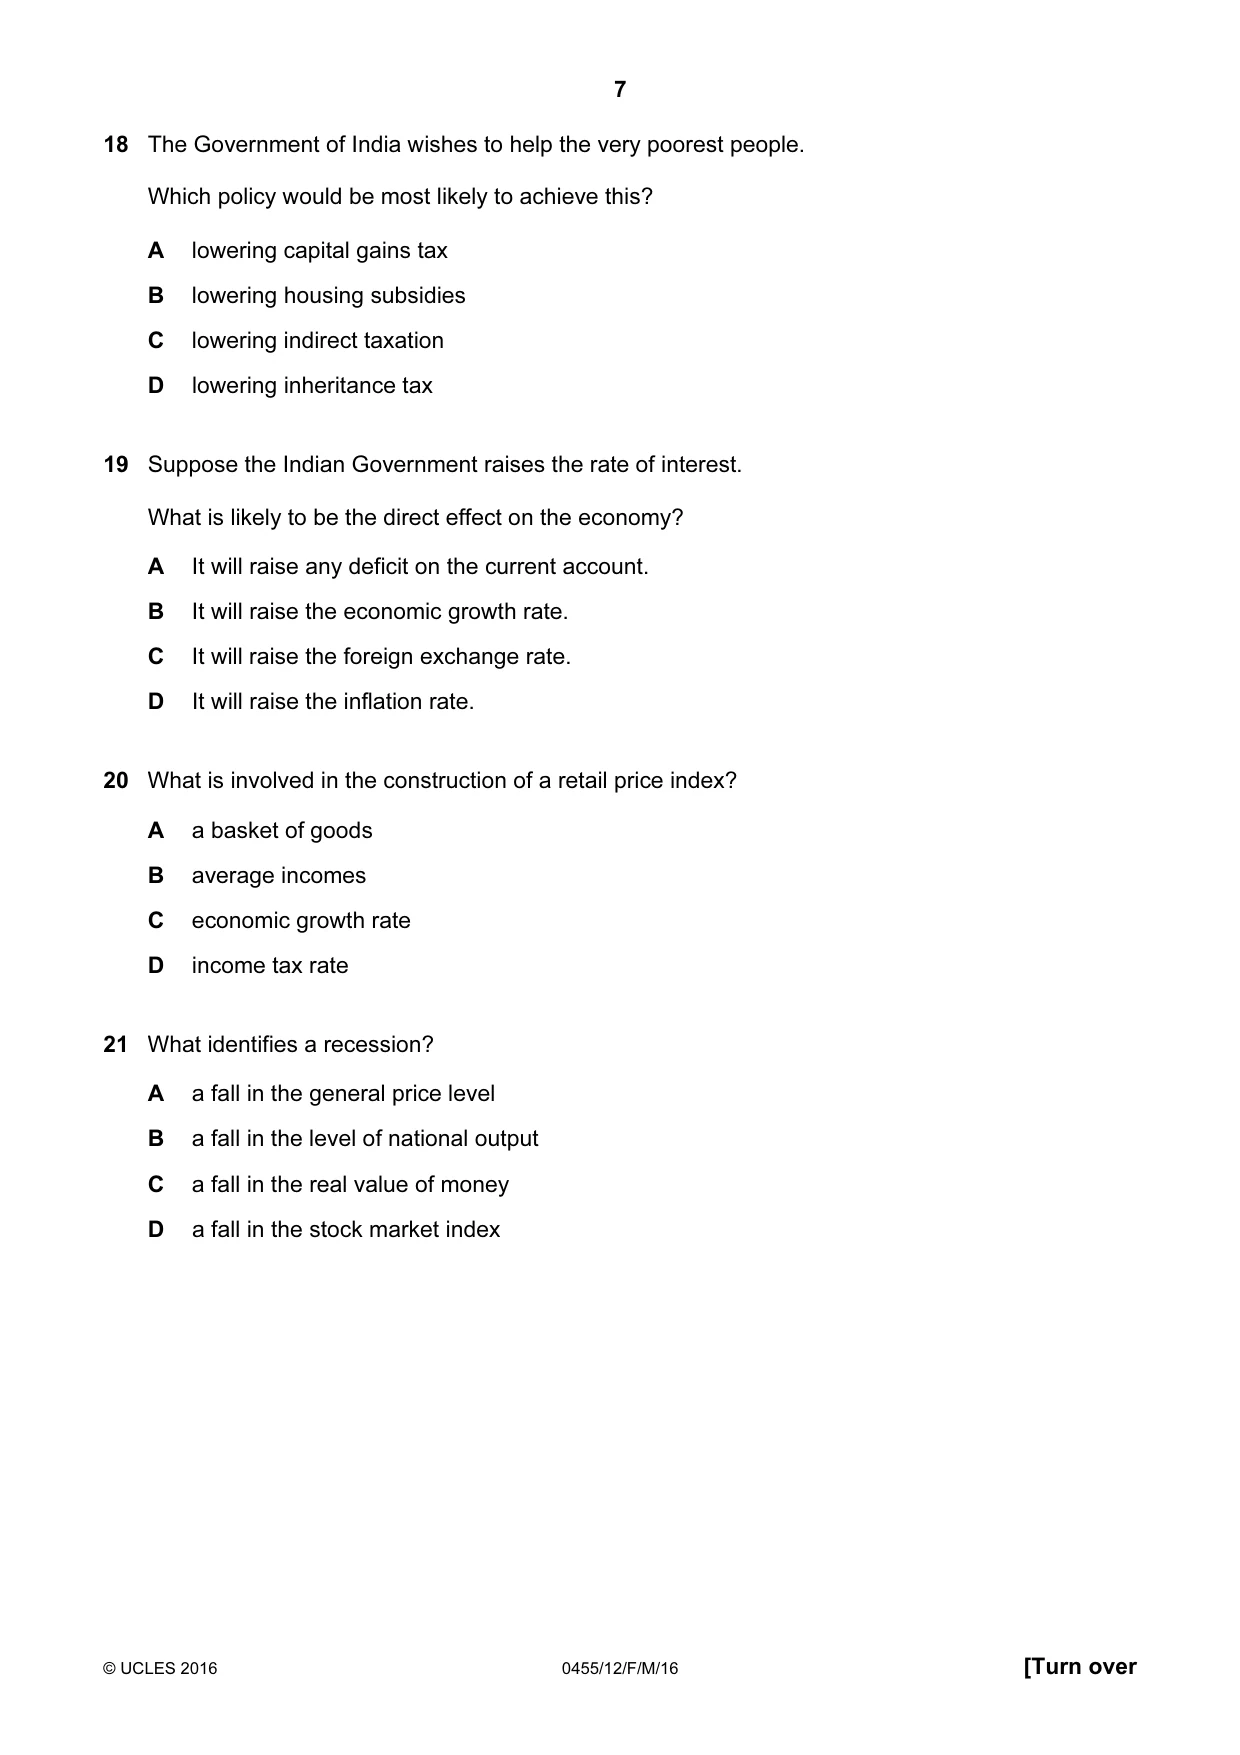
18 The Government of India wishes to help the very poorest people. Which policy would be most likely to achieve this? A lowering capital gains tax B lowering housing subsidies C lowering indirect taxation D lowering inheritance tax
Mark scheme: C
Q19 · Suppose the Indian Government raises the rate of interest
19 Suppose the Indian Government raises the rate of interest. What is likely to be the direct effect on the economy? A It will raise any deficit on the current account. B It will raise the economic growth rate. C It will raise the foreign exchange rate. D It will raise the inflation rate.
Mark scheme: C
Q20 · What is involved in the construction of a retail price index?
20 What is involved in the construction of a retail price index? A a basket of goods B average incomes C economic growth rate D income tax rate
Mark scheme: A
Q21 · What identifies a recession?
21 What identifies a recession? A a fall in the general price level B a fall in the level of national output C a fall in the real value of money D a fall in the stock market index
Mark scheme: B
Q22 · The table shows the percentage changes in earnings and consumer prices for four countries…
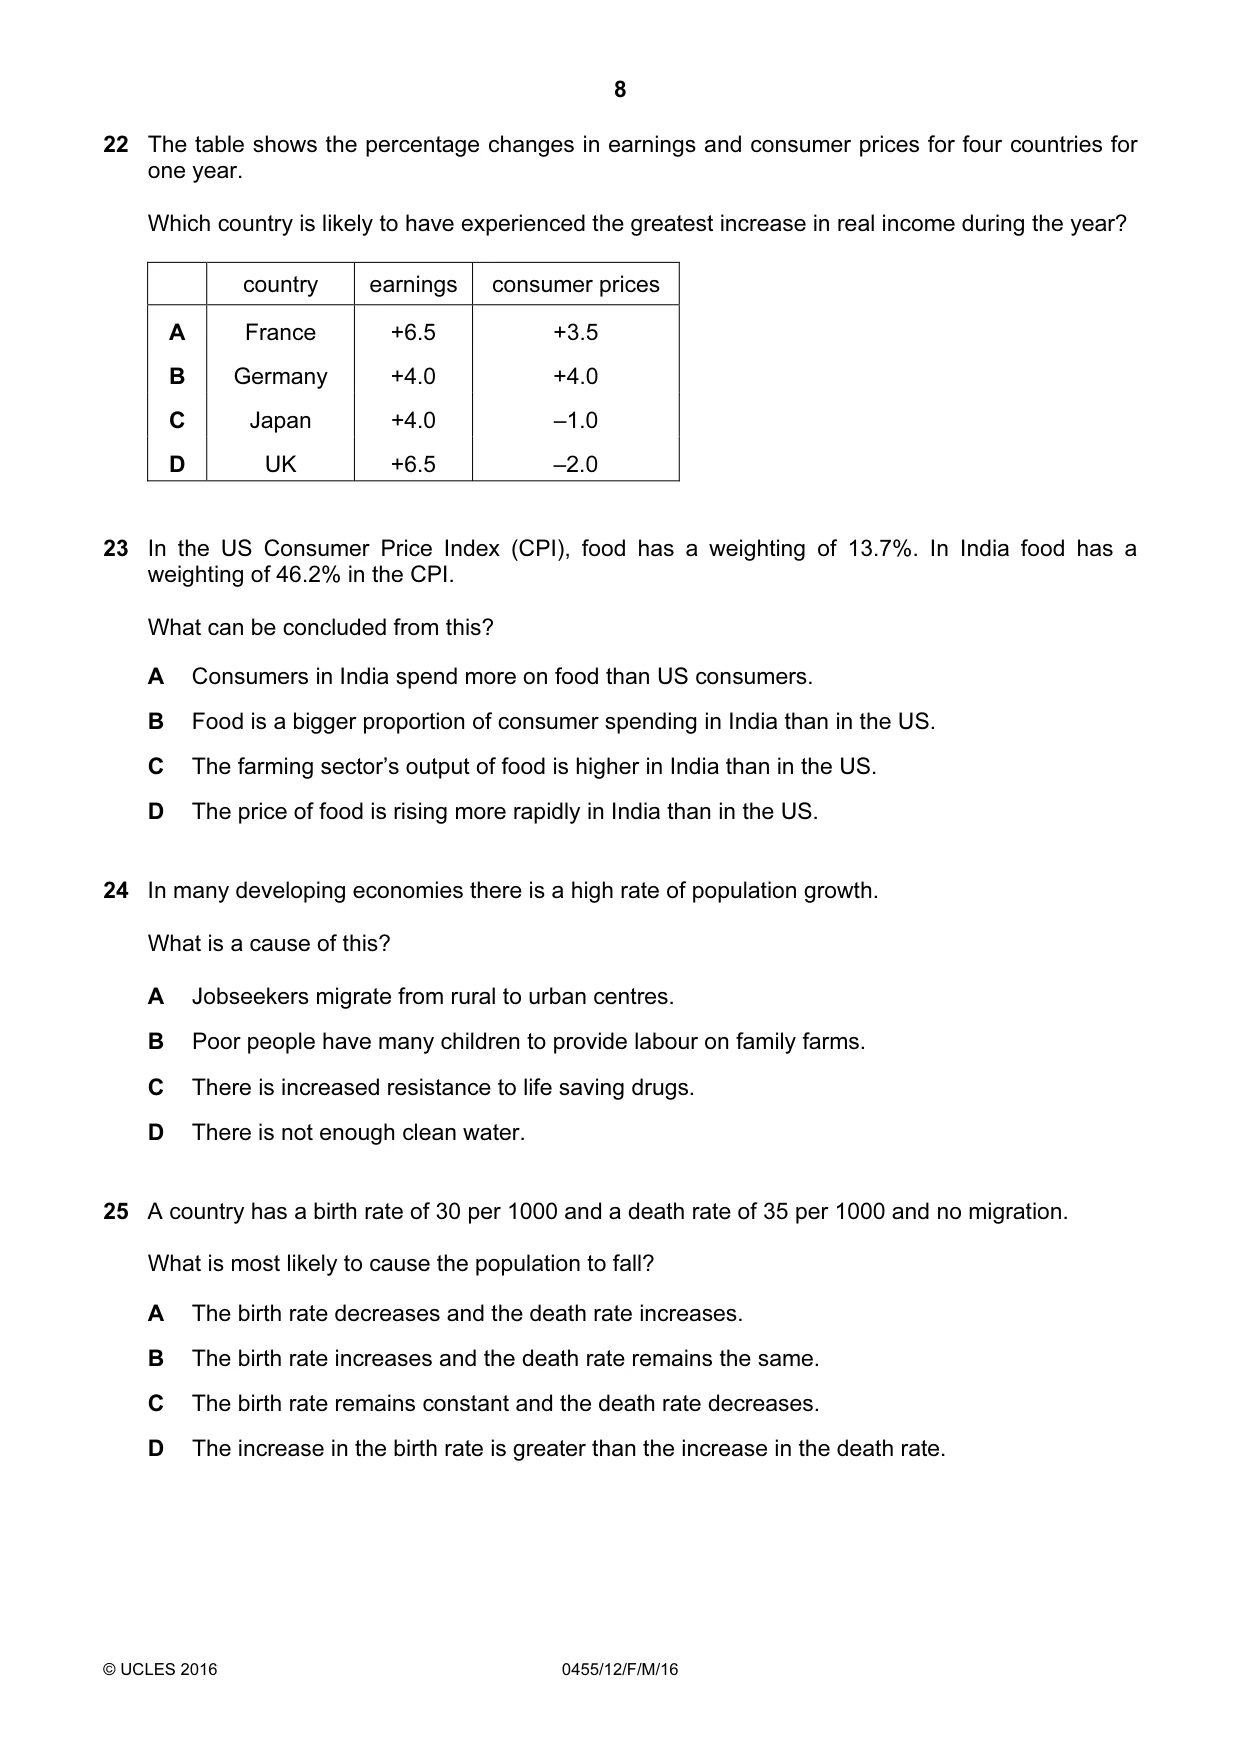
22 The table shows the percentage changes in earnings and consumer prices for four countries for one year. Which country is likely to have experienced the greatest increase in real income during the year? country earnings consumer prices A France +6.5 +3.5 B Germany +4.0 +4.0 C Japan +4.0 –1.0 D UK +6.5 –2.0
Mark scheme: D
Q23 · In the US Consumer Price Index (CPI), food has a weighting of 13.7%
23 In the US Consumer Price Index (CPI), food has a weighting of 13.7%. In India food has a weighting of 46.2% in the CPI. What can be concluded from this? A Consumers in India spend more on food than US consumers. B Food is a bigger proportion of consumer spending in India than in the US. C The farming sector’s output of food is higher in India than in the US. D The price of food is rising more rapidly in India than in the US.
Mark scheme: B
Q24 · In many developing economies there is a high rate of population growth
24 In many developing economies there is a high rate of population growth. What is a cause of this? A Jobseekers migrate from rural to urban centres. B Poor people have many children to provide labour on family farms. C There is increased resistance to life saving drugs. D There is not enough clean water.
Mark scheme: B
Q25 · A country has a birth rate of 30 per 1000 and a death rate of 35 per 1000 and no migration
25 A country has a birth rate of 30 per 1000 and a death rate of 35 per 1000 and no migration. What is most likely to cause the population to fall? A The birth rate decreases and the death rate increases. B The birth rate increases and the death rate remains the same. C The birth rate remains constant and the death rate decreases. D The increase in the birth rate is greater than the increase in the death rate.
Mark scheme: A
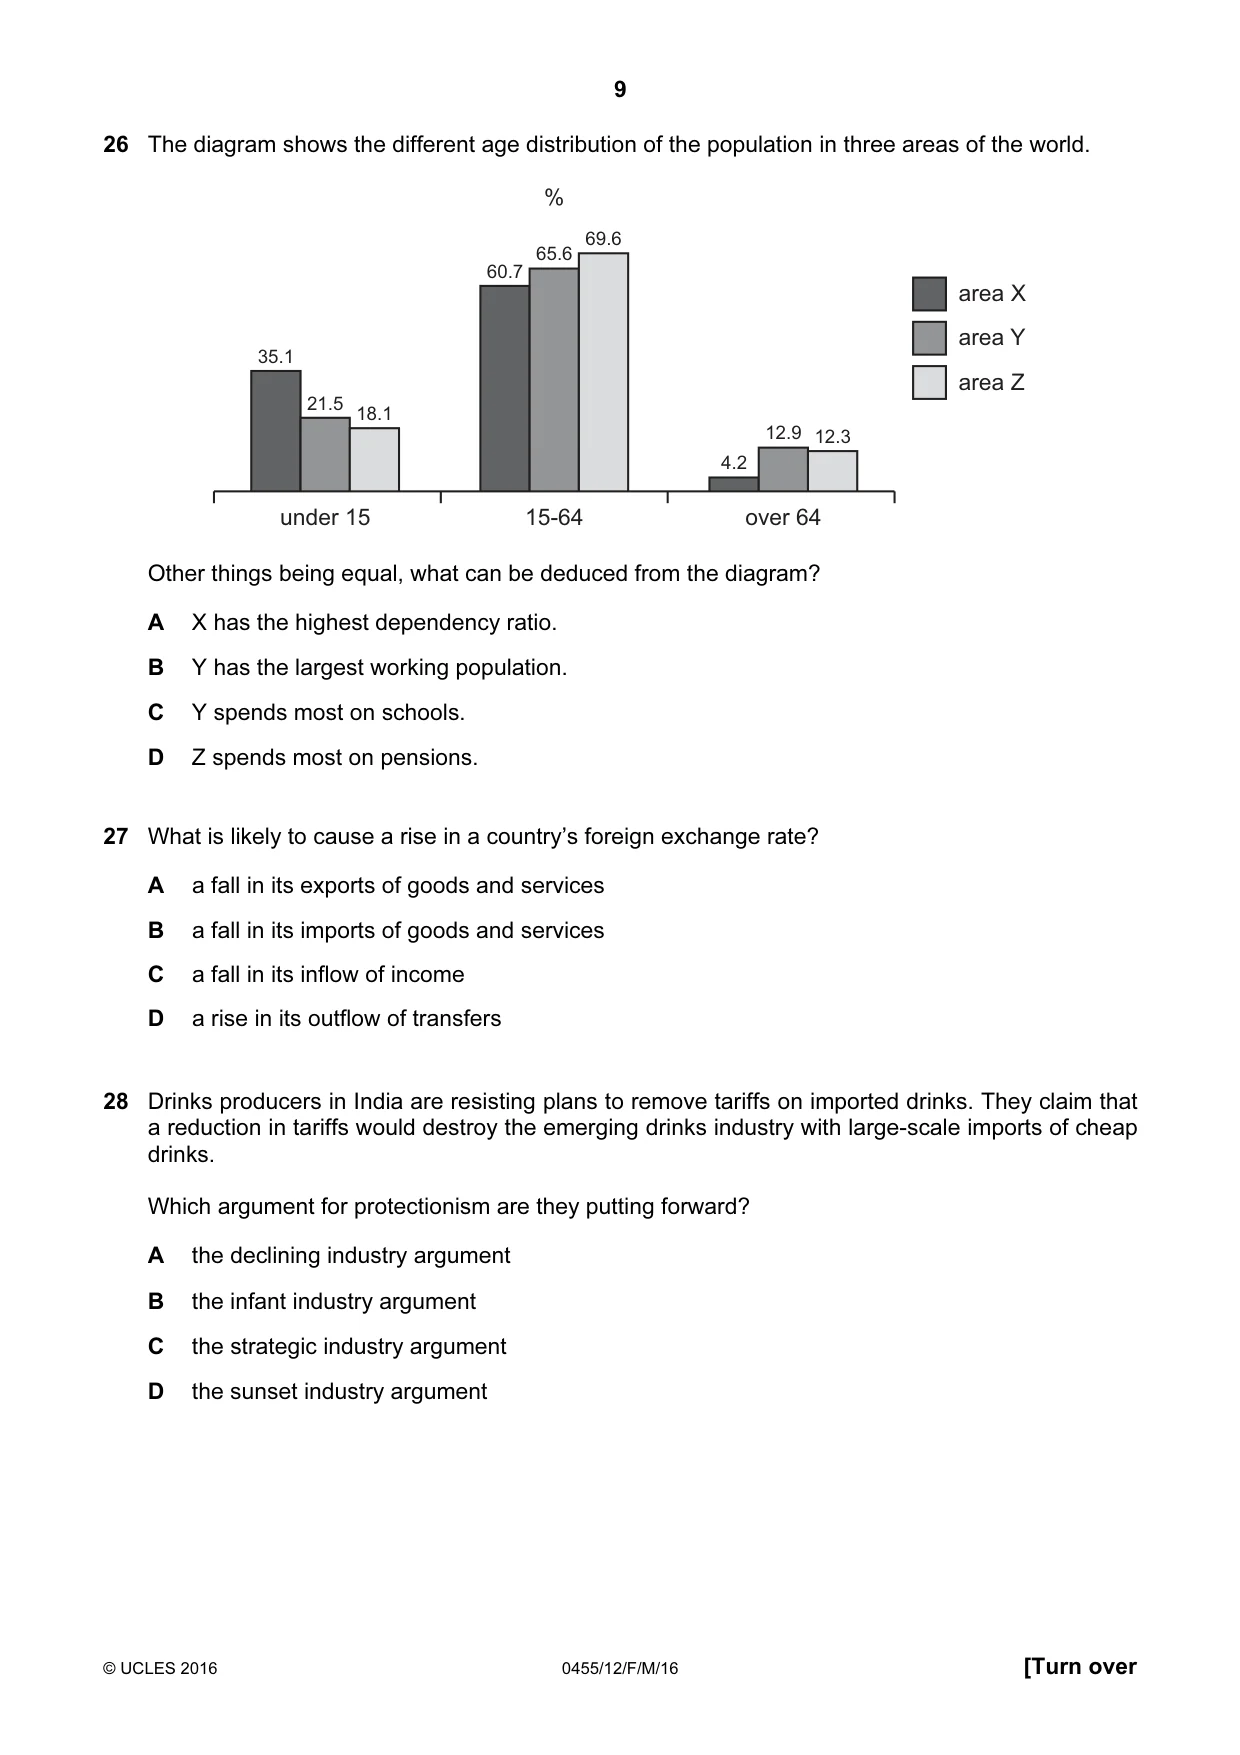
Q26 · The diagram shows the different age distribution of the population in three areas of the…
26 The diagram shows the different age distribution of the population in three areas of the world. % 69.6 65.6 60.7 area X area Y 35.1 area Z 21.5 18.1 12.9 12.3 4.2 under 15 15-64 over 64 Other things being equal, what can be deduced from the diagram? A X has the highest dependency ratio. B Y has the largest working population. C Y spends most on schools. D Z spends most on pensions.
Mark scheme: A
Q27 · What is likely to cause a rise in a country’s foreign exchange rate?
27 What is likely to cause a rise in a country’s foreign exchange rate? A a fall in its exports of goods and services B a fall in its imports of goods and services C a fall in its inflow of income D a rise in its outflow of transfers
Mark scheme: B
Q28 · Drinks producers in India are resisting plans to remove tariffs on imported drinks
28 Drinks producers in India are resisting plans to remove tariffs on imported drinks. They claim that a reduction in tariffs would destroy the emerging drinks industry with large-scale imports of cheap drinks. Which argument for protectionism are they putting forward? A the declining industry argument B the infant industry argument C the strategic industry argument D the sunset industry argument
Mark scheme: B
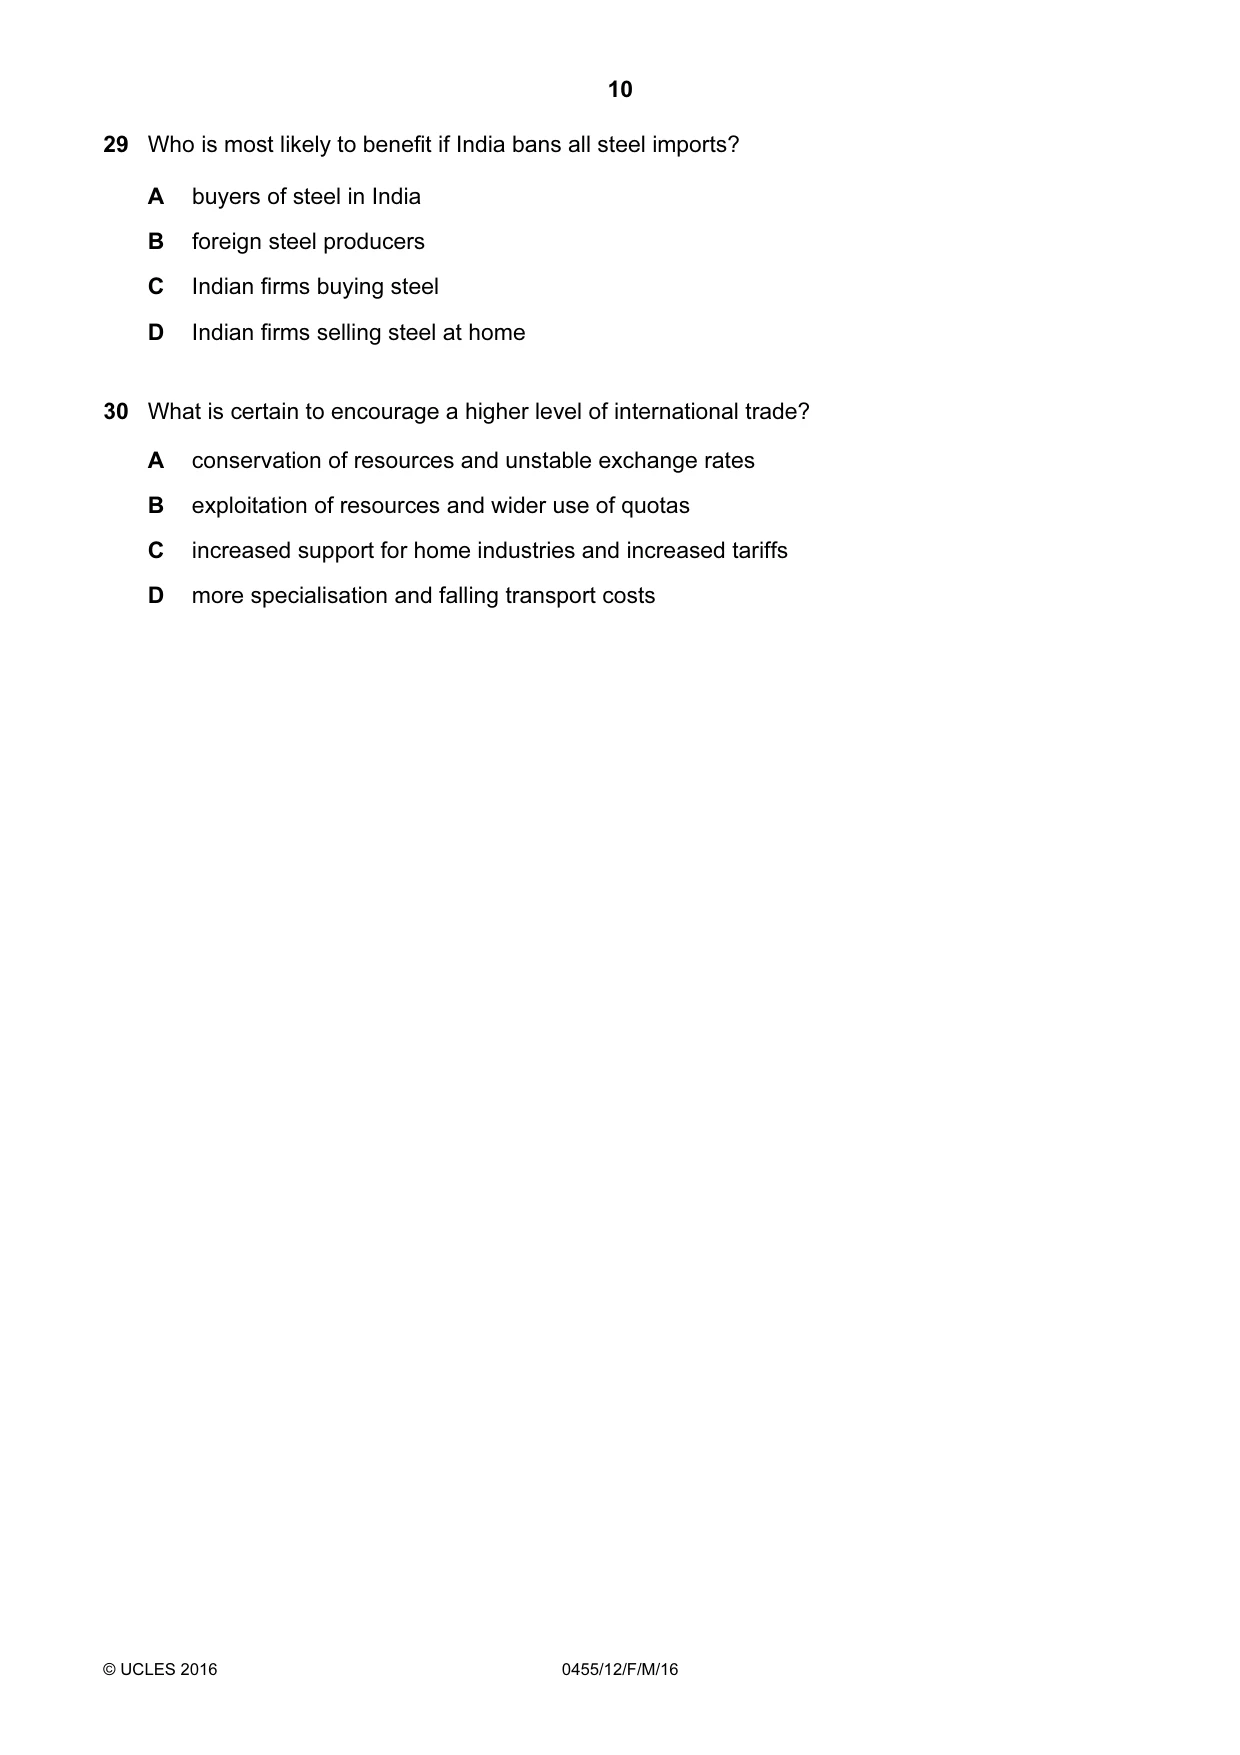
Q29 · Who is most likely to benefit if India bans all steel imports?
29 Who is most likely to benefit if India bans all steel imports? A buyers of steel in India B foreign steel producers C Indian firms buying steel D Indian firms selling steel at home
Mark scheme: D
Q30 · What is certain to encourage a higher level of international trade?
30 What is certain to encourage a higher level of international trade? A conservation of resources and unstable exchange rates B exploitation of resources and wider use of quotas C increased support for home industries and increased tariffs D more specialisation and falling transport costs
Mark scheme: D
What was in this paper
The subtopics covered by these 30 questions, and how many questions each got. Open one in a new tab to see every Cambridge question on it.
3Globalisation, free trade and protection3Population3Fiscal policy2Inflation and deflation2Workers2Economic growth1Firms1Foreign exchange rates1Households1Living standards1Market failure1Mixed economic system1Monetary policy1Opportunity cost1Poverty1Price determination1Price elasticity of demand (PED)1Production possibility curve (PPC) diagrams1Supply-side policy1Trade unions1What you needed in this session
Cambridge’s own grade thresholds for 2016 Feb/March, Paper 1 · Variant 2. A higher threshold means an easier paper — the bar moves with how the cohort did.