Cambridge IGCSE Economics 0455 — 2024 Feb/March Paper 1 · Variant 2
0455/12/F/M/24 · 30 questions · 30 marks · ≈34 min
The question paper and its mark scheme, free to read here and free to download. This is Cambridge’s own paper, exactly as it was sat.
Question paper12 pages

Mark scheme3 pages
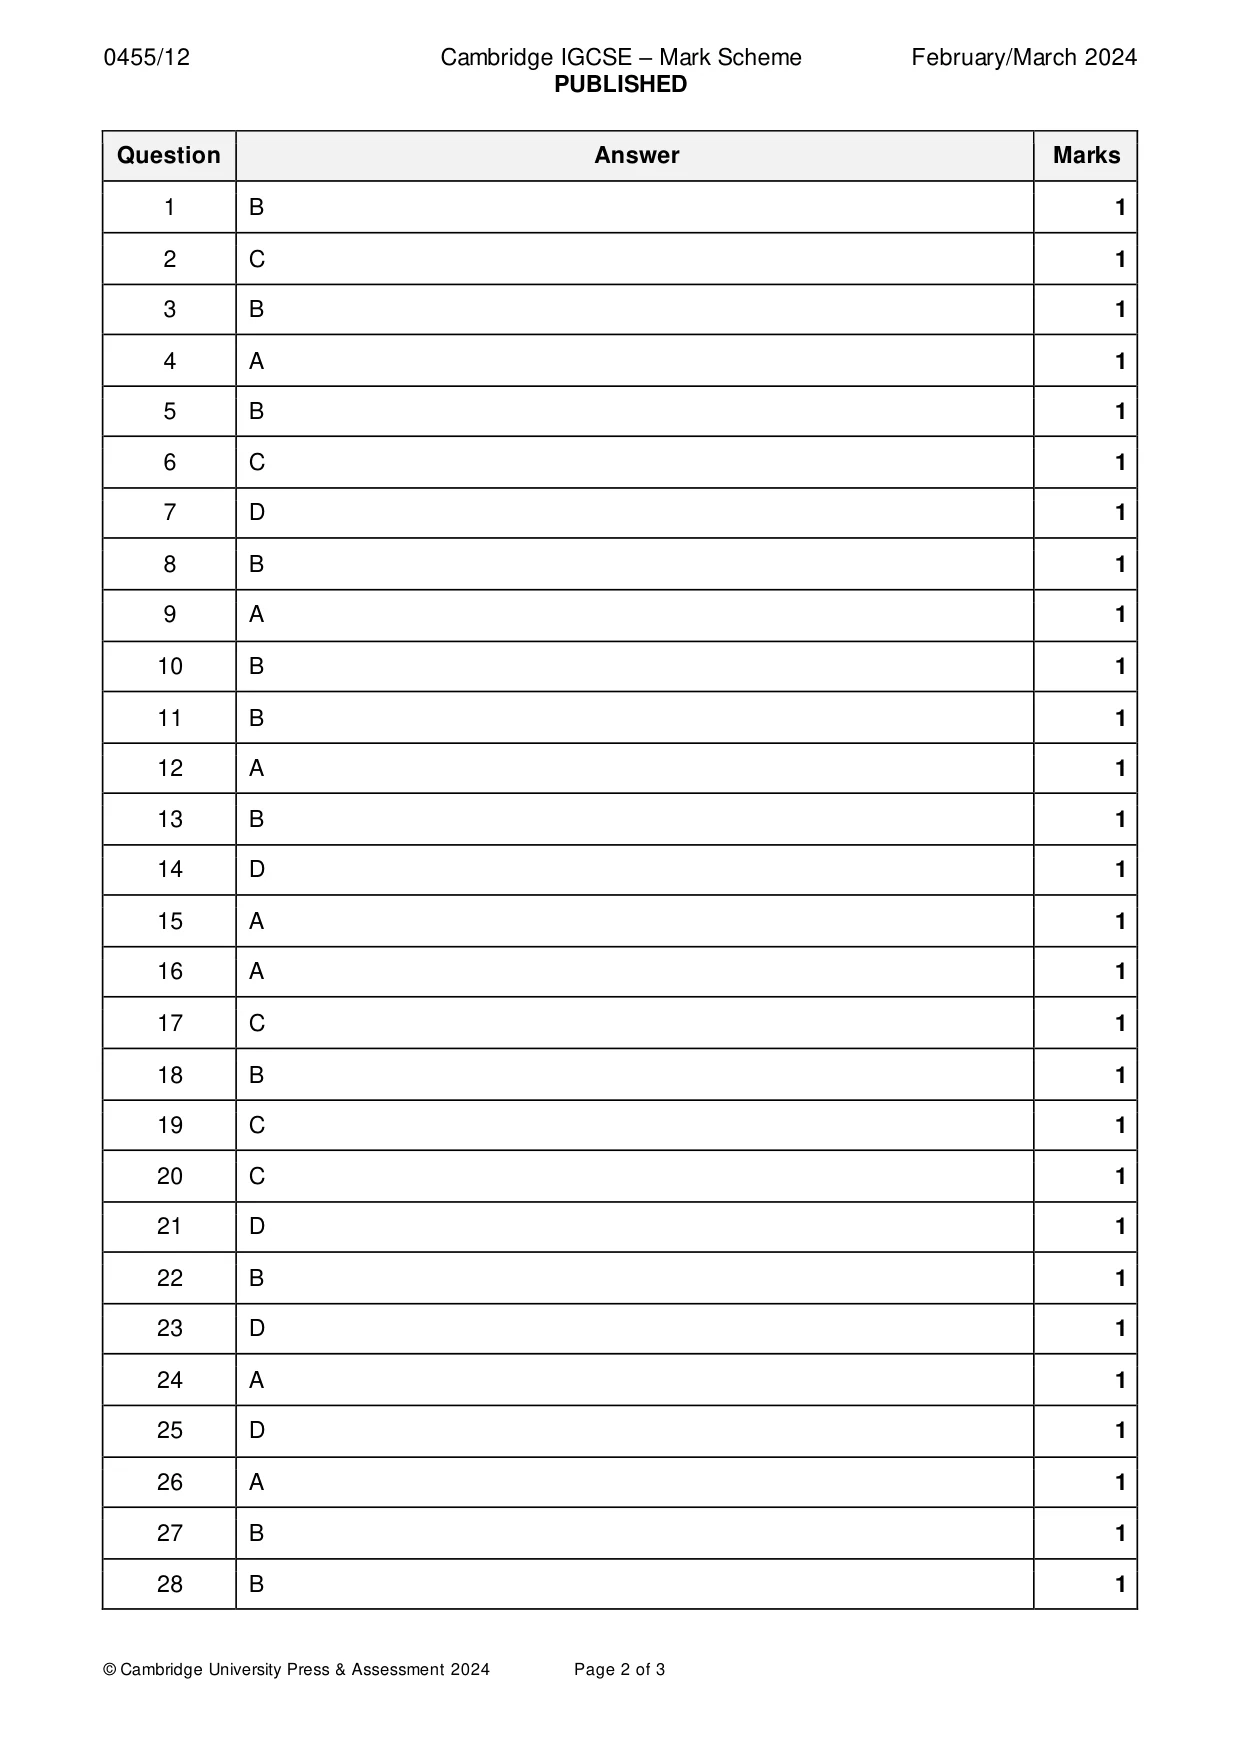
Answers below. Sit the paper first if you are practising.
Questions as text
Q1 · What causes economic agents to make choices?
1 What causes economic agents to make choices? A limited needs and wants B the existence of finite resources C the existence of free goods D the market mechanism
Mark scheme: B
Q2 · A government announces that it will spend an extra $10bn on healthcare, financed by…
2 A government announces that it will spend an extra $10bn on healthcare, financed by reducing expenditure on defence. What is the economic concept represented by this decision? A expansionary monetary policy B increased spending on a public good C opportunity cost D the operation of the market mechanism
Mark scheme: C
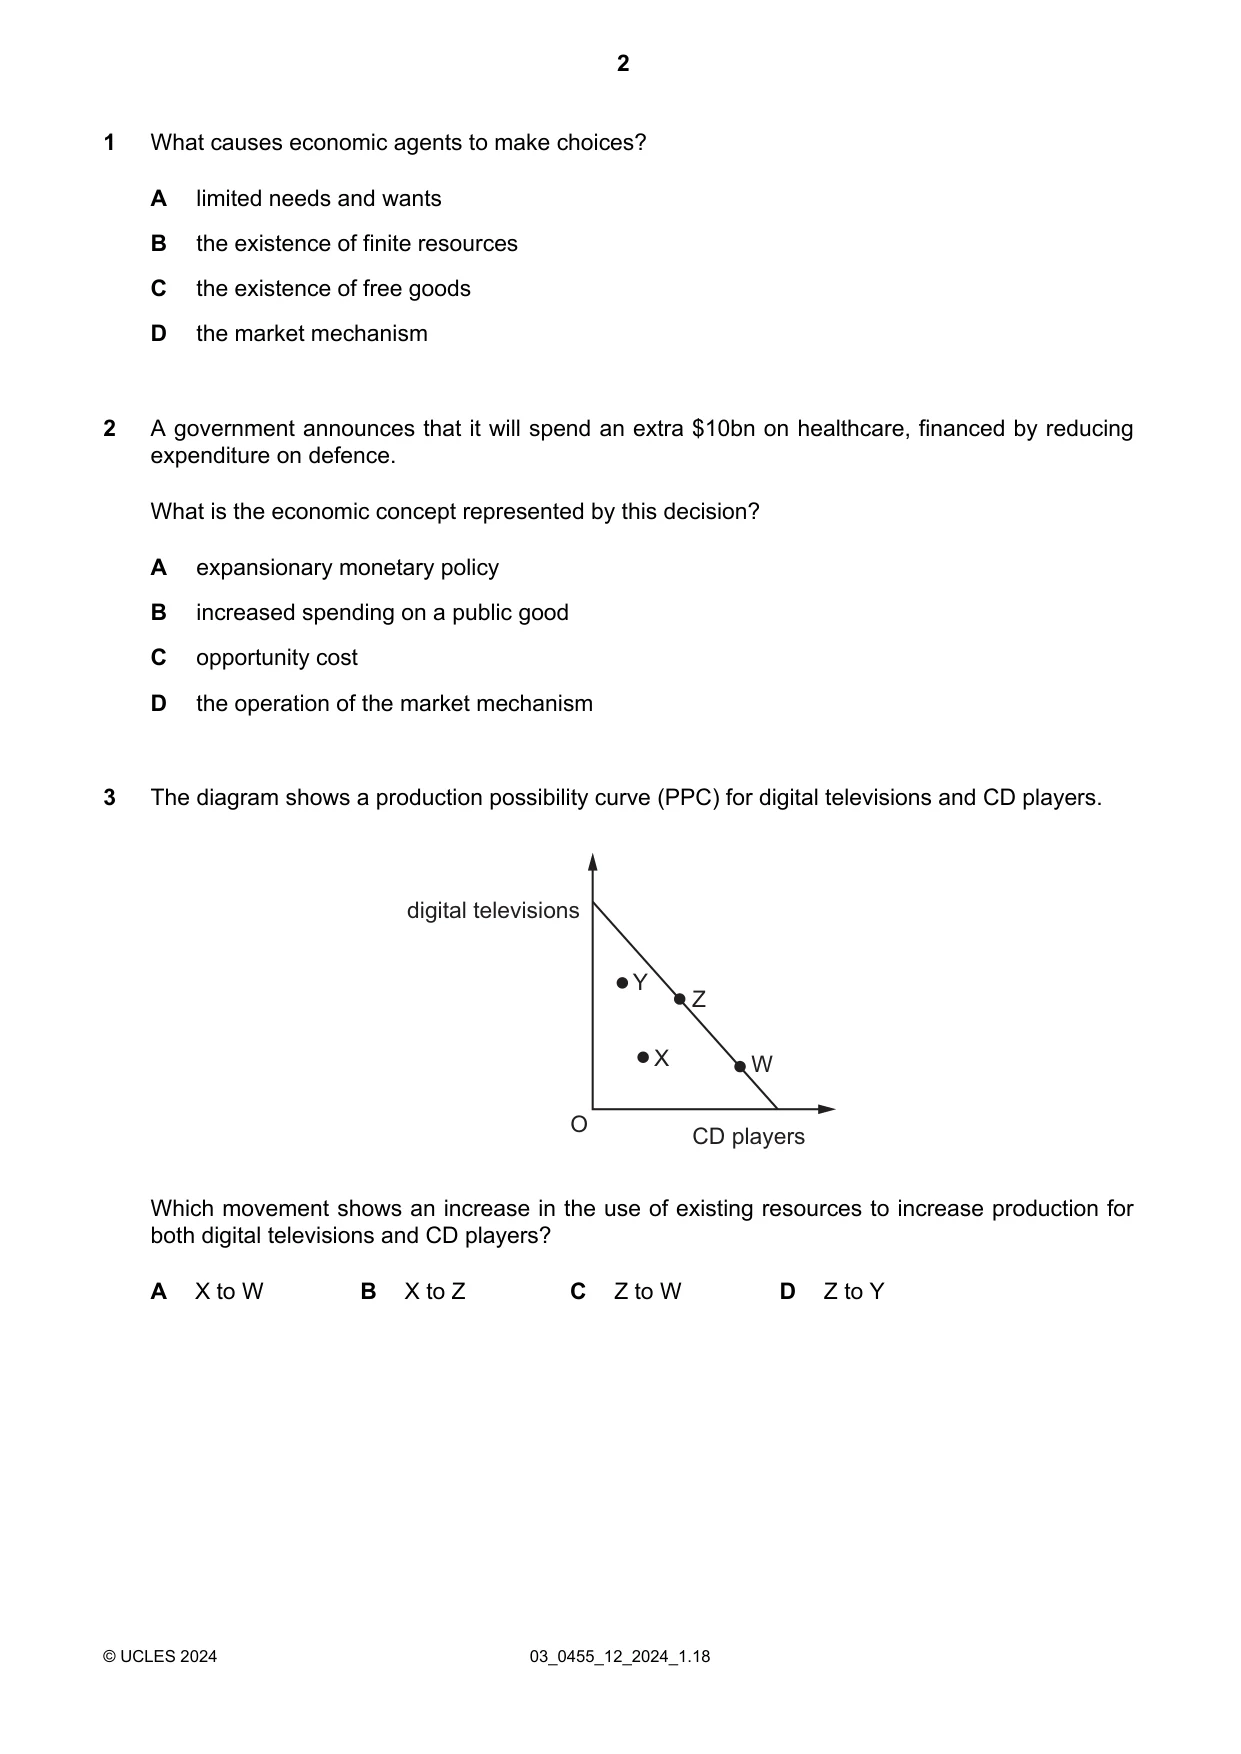
Q3 · The diagram shows a production possibility curve (PPC) for digital televisions and CD…
3 The diagram shows a production possibility curve (PPC) for digital televisions and CD players. digital televisions Y Z X W O CD players Which movement shows an increase in the use of existing resources to increase production for both digital televisions and CD players? A X to W B X to Z C Z to W D Z to Y
Mark scheme: B
More questions on Production possibility curve (PPC) diagrams
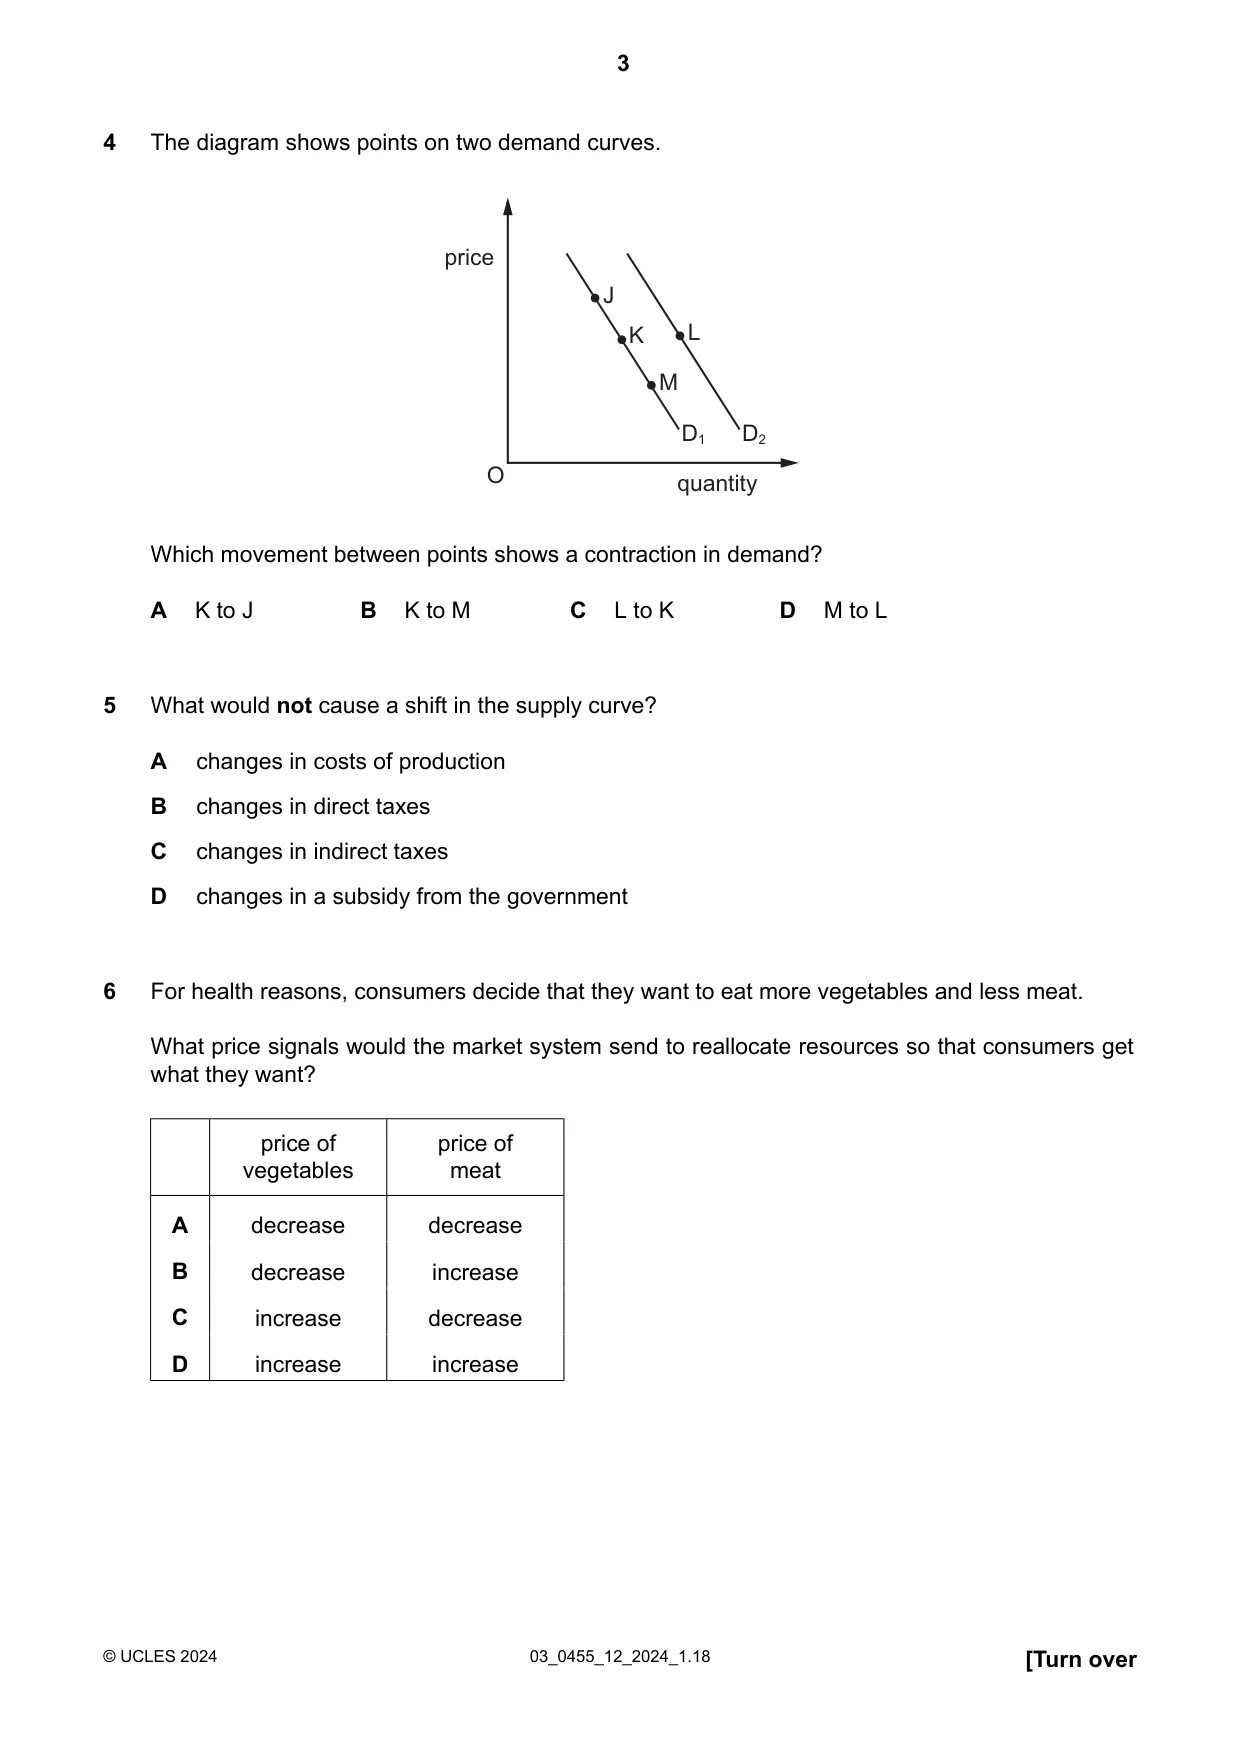
Q4 · The diagram shows points on two demand curves
4 The diagram shows points on two demand curves. price J K L M D1 D2 O quantity Which movement between points shows a contraction in demand? A K to J B K to M C L to K D M to L
Mark scheme: A
Q5 · What would not cause a shift in the supply curve?
5 What would not cause a shift in the supply curve? A changes in costs of production B changes in direct taxes C changes in indirect taxes D changes in a subsidy from the government
Mark scheme: B
Q6 · For health reasons, consumers decide that they want to eat more vegetables and less meat
6 For health reasons, consumers decide that they want to eat more vegetables and less meat. What price signals would the market system send to reallocate resources so that consumers get what they want? price of price of vegetables meat A decrease decrease B decrease increase C increase decrease D increase increase
Mark scheme: C
More questions on The role of markets in allocating resources
Q7 · What is a likely benefit of a country moving from a mixed economy to a market economy?
7 What is a likely benefit of a country moving from a mixed economy to a market economy? A less inequality B more nationalisation C more public goods D reduced costs of production
Mark scheme: D
Q8 · What is an external cost of smoking cigarettes?
8 What is an external cost of smoking cigarettes? A the cost of the cigarette packaging B the cost to non-smokers’ health C the cost to smokers D the tax on cigarettes
Mark scheme: B
Q9 · A firm is considering doubling the price of its product
9 A firm is considering doubling the price of its product. Which price elasticity of demand (PED) for its product would give it the greatest increase in revenue? A 0.0 B −0.5 C −1.0 D −2.0
Mark scheme: A
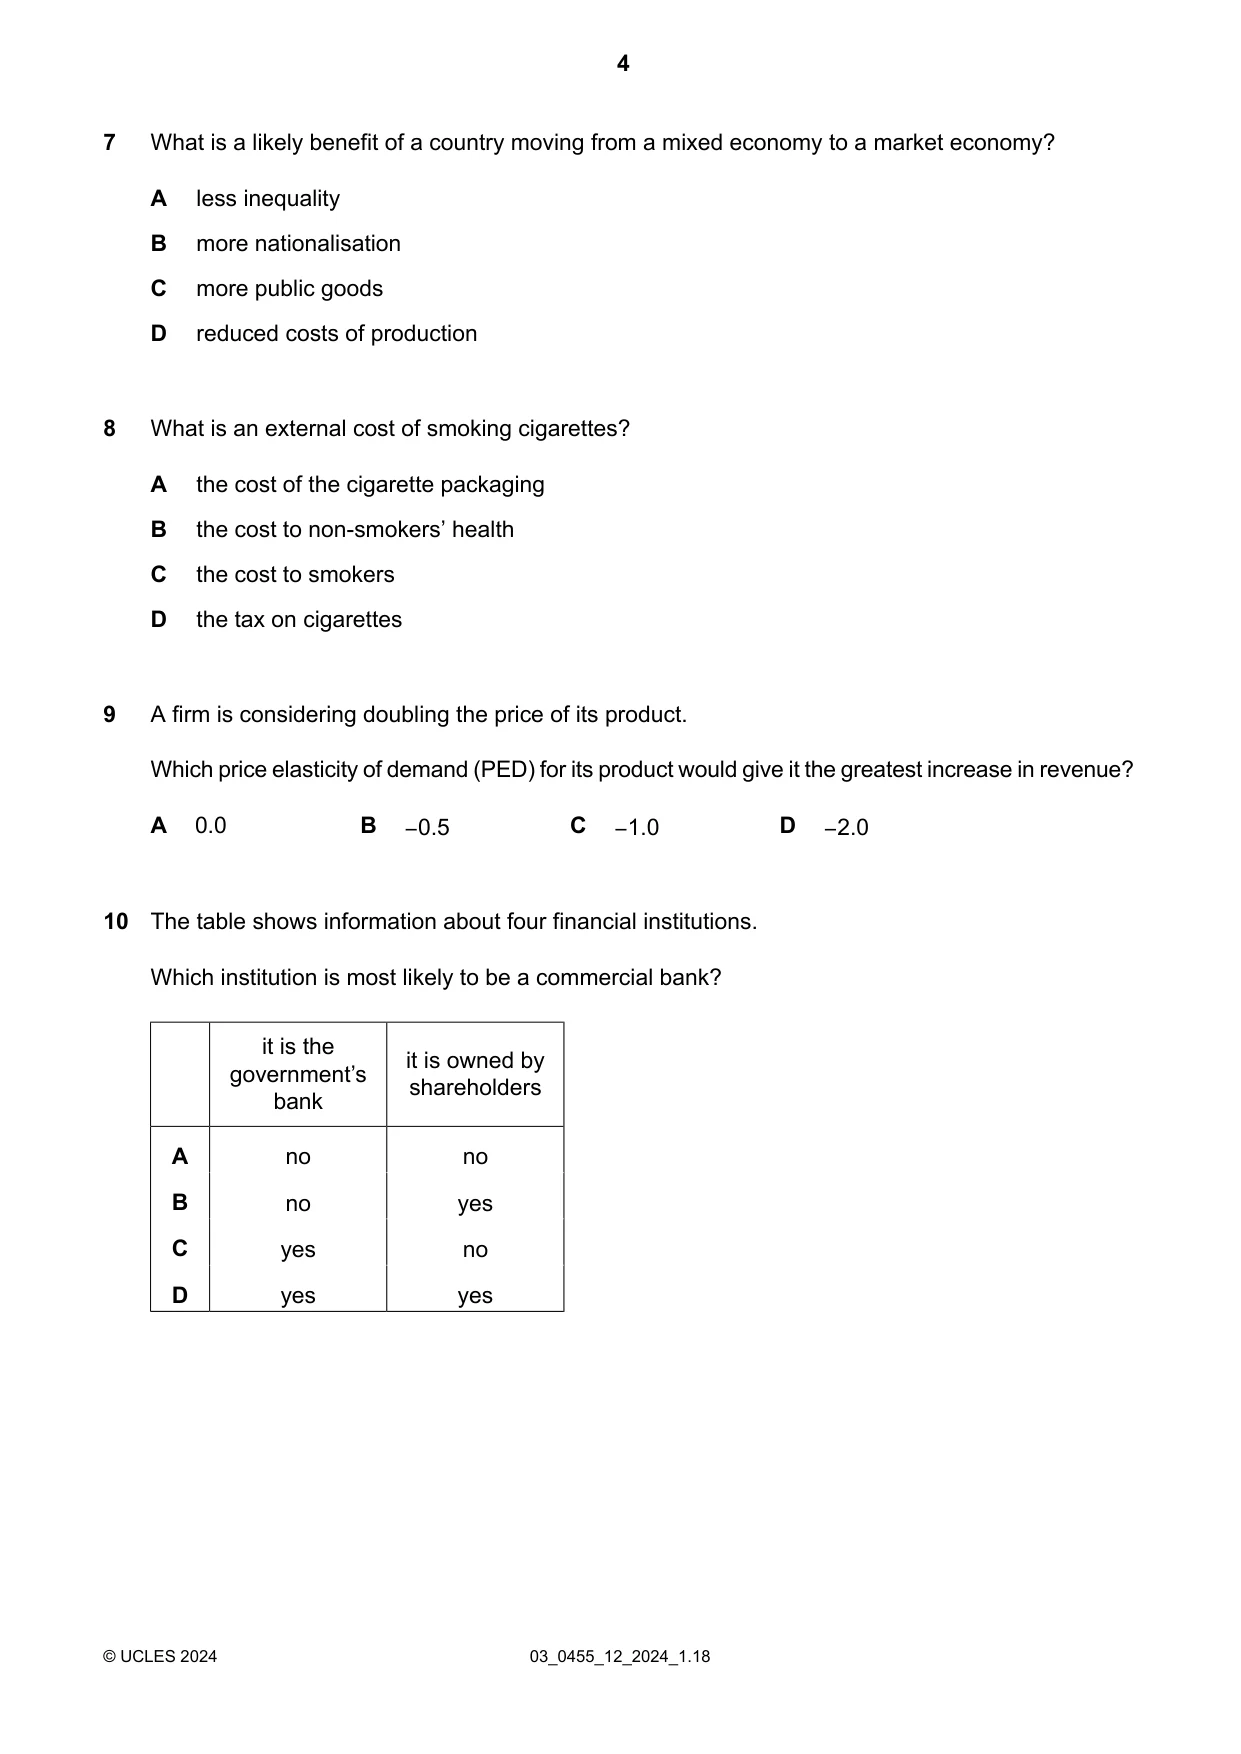
Q10 · The table shows information about four financial institutions
10 The table shows information about four financial institutions. Which institution is most likely to be a commercial bank? it is the it is owned by government’s shareholders bank A no no B no yes C yes no D yes yes
Mark scheme: B
Q11 · What shows a forwards vertical merger?
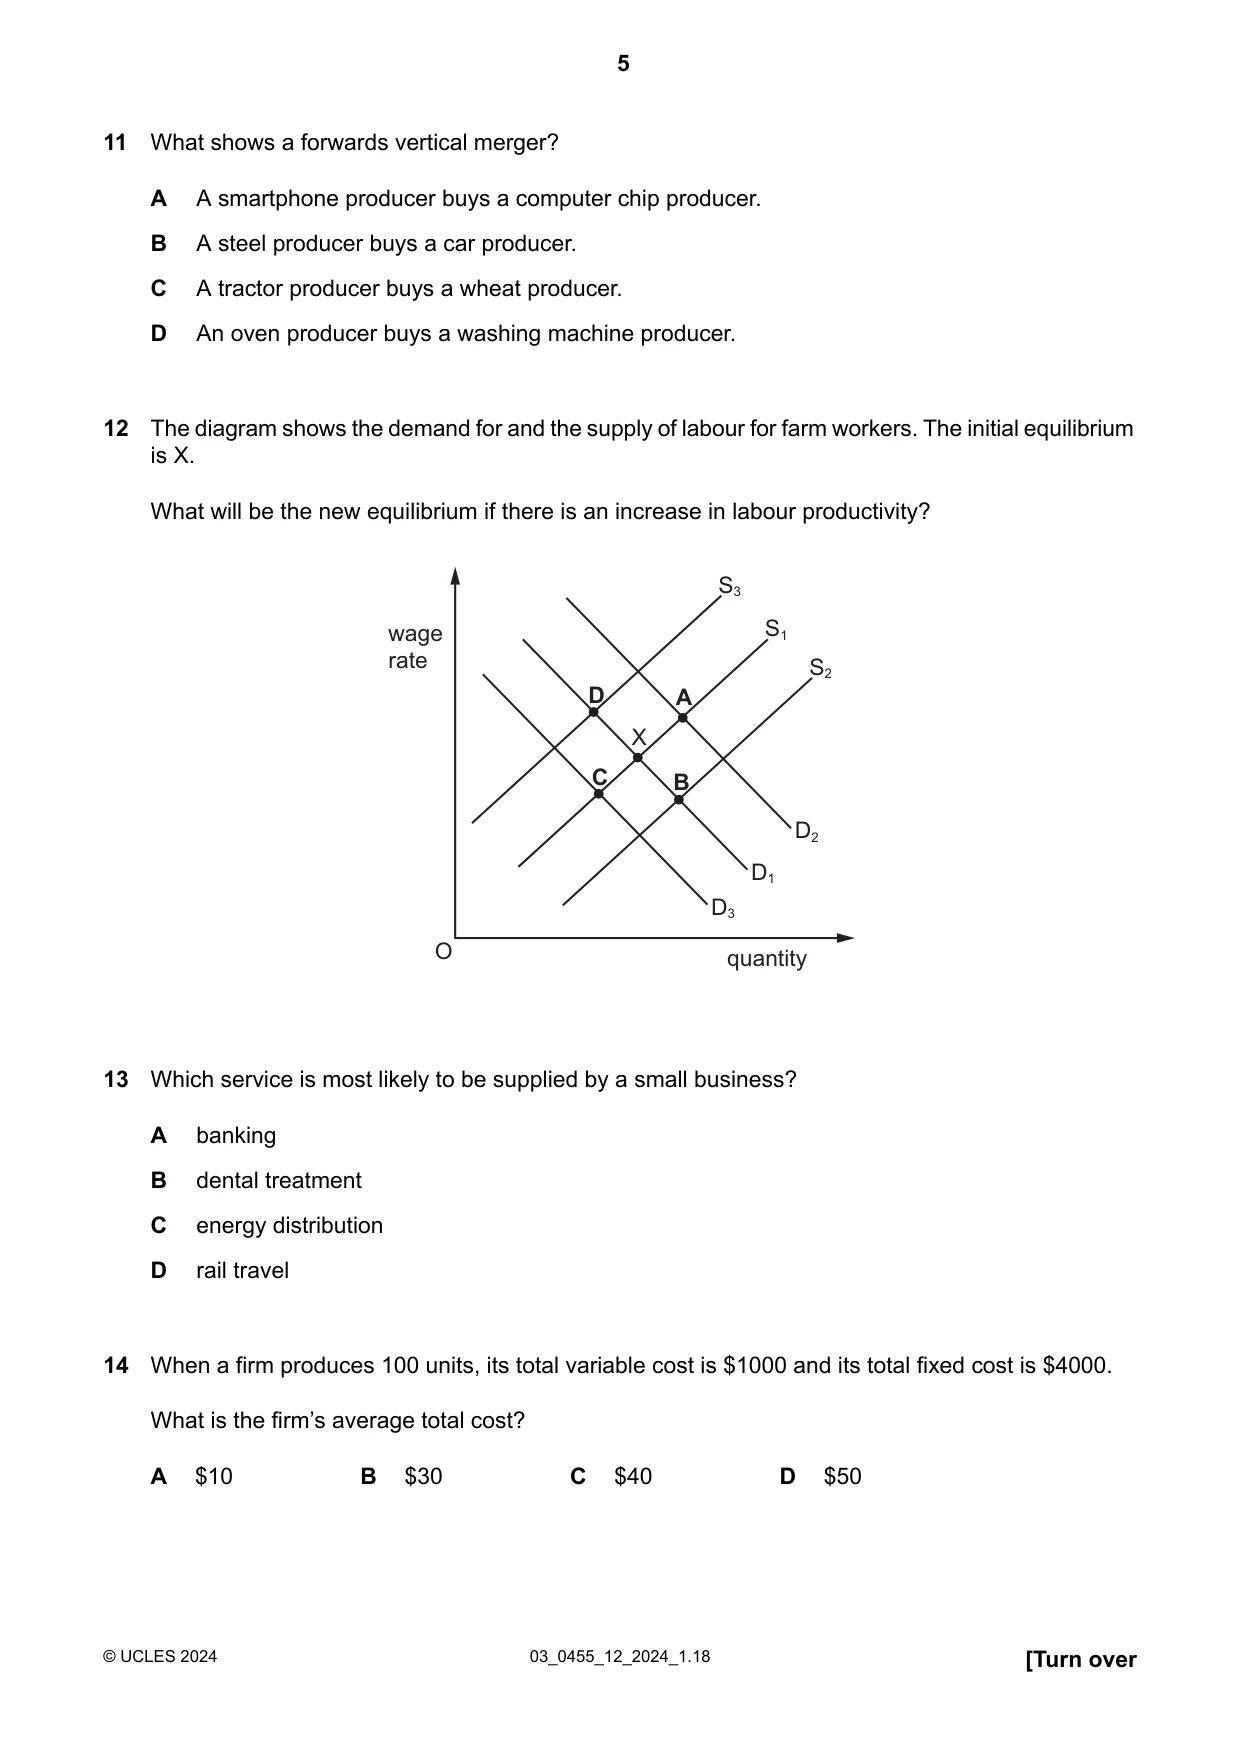
11 What shows a forwards vertical merger? A A smartphone producer buys a computer chip producer. B A steel producer buys a car producer. C A tractor producer buys a wheat producer. D An oven producer buys a washing machine producer.
Mark scheme: B
Q12 · The diagram shows the demand for and the supply of labour for farm workers
12 The diagram shows the demand for and the supply of labour for farm workers. The initial equilibrium is X. What will be the new equilibrium if there is an increase in labour productivity? S3 wage S1 rate S2 D A X C B D2 D1 D3 O quantity
Mark scheme: A
Q13 · Which service is most likely to be supplied by a small business?
13 Which service is most likely to be supplied by a small business? A banking B dental treatment C energy distribution D rail travel
Mark scheme: B
Q14 · When a firm produces 100 units, its total variable cost is $1000 and its total fixed cost…
14 When a firm produces 100 units, its total variable cost is $1000 and its total fixed cost is $4000. What is the firm’s average total cost? A $10 B $30 C $40 D $50
Mark scheme: D
Q15 · At a price of $5, the demand for a firm’s product is 1000 units per week
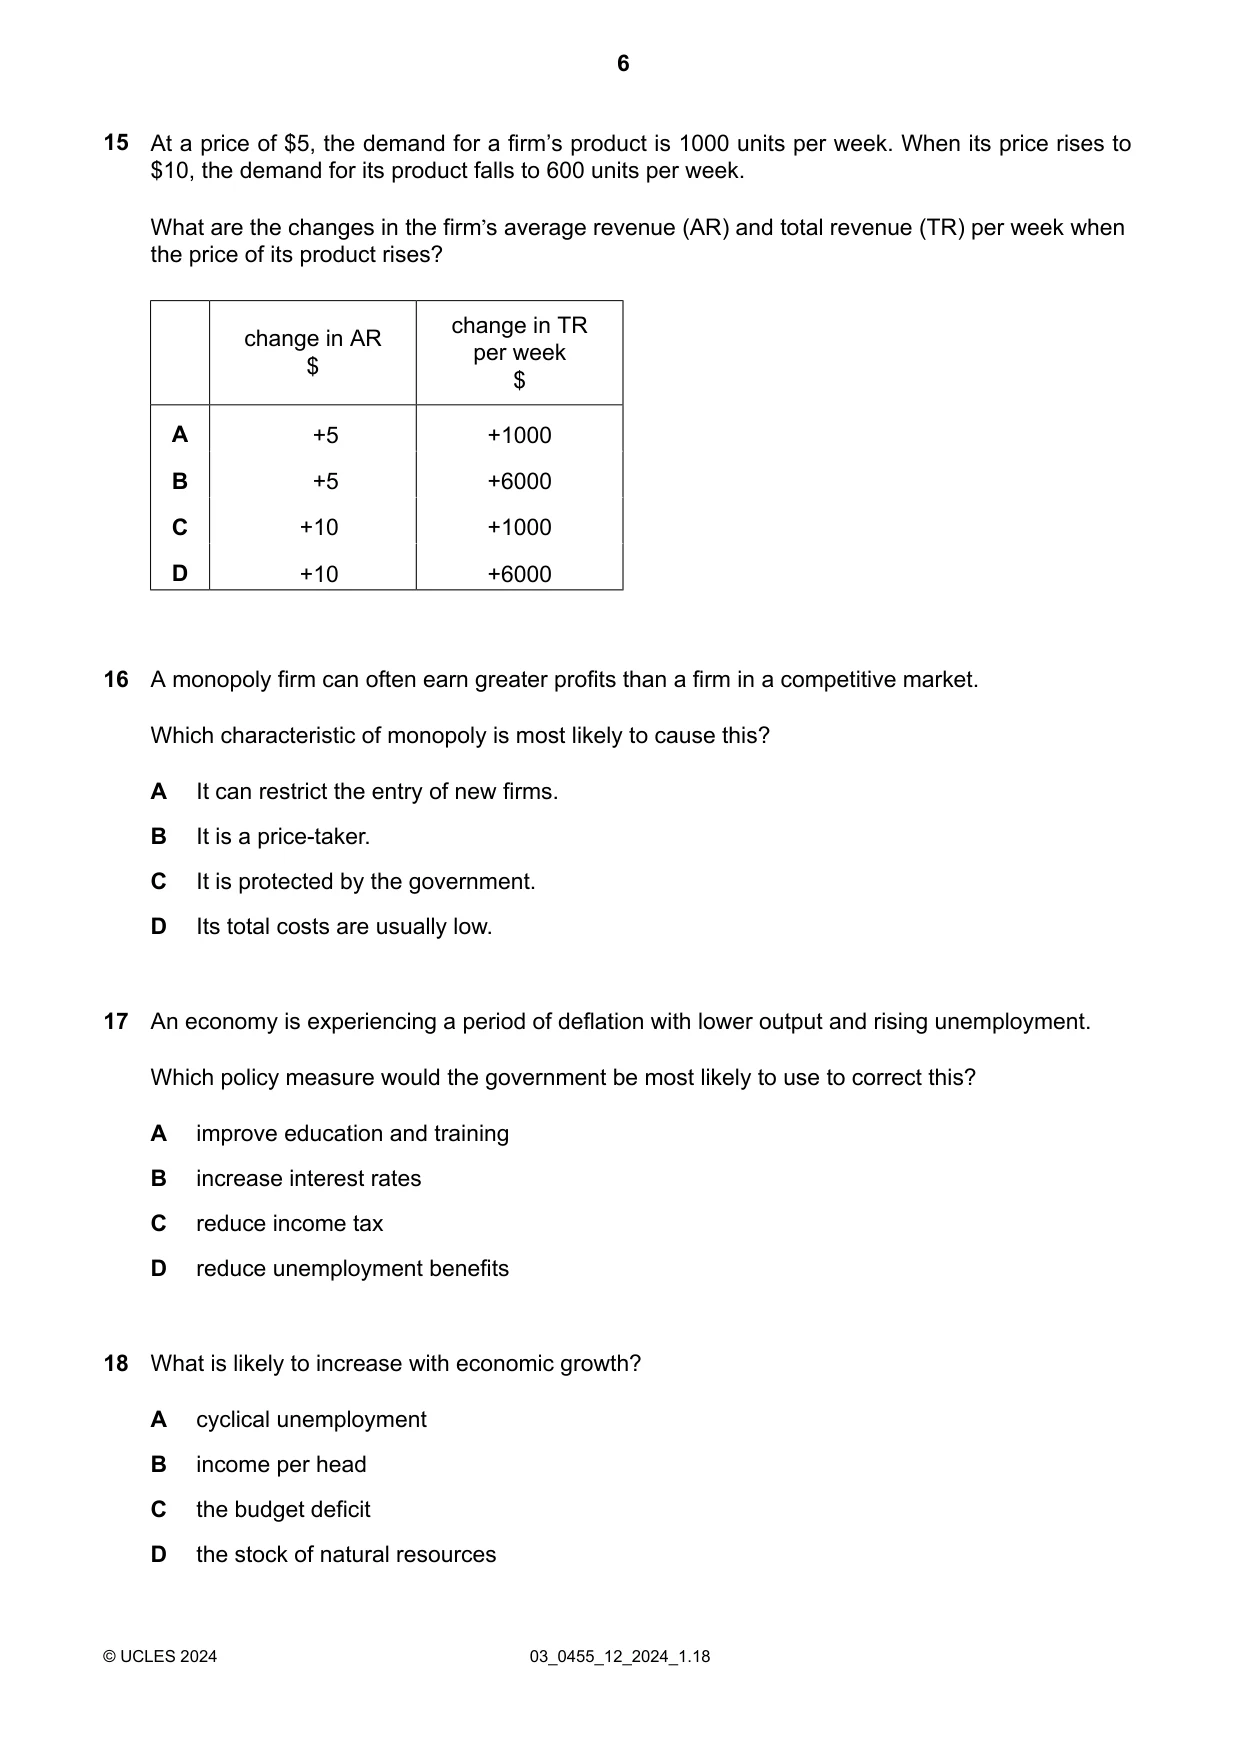
15 At a price of $5, the demand for a firm’s product is 1000 units per week. When its price rises to $10, the demand for its product falls to 600 units per week. What are the changes in the firm’s average revenue (AR) and total revenue (TR) per week when the price of its product rises? change in TR change in AR per week $ $ A +5 +1000 B +5 +6000 C +10 +1000 D +10 +6000
Mark scheme: A
Q16 · A monopoly firm can often earn greater profits than a firm in a competitive market
16 A monopoly firm can often earn greater profits than a firm in a competitive market. Which characteristic of monopoly is most likely to cause this? A It can restrict the entry of new firms. B It is a price-taker. C It is protected by the government. D Its total costs are usually low.
Mark scheme: A
Q17 · An economy is experiencing a period of deflation with lower output and rising unemployment
17 An economy is experiencing a period of deflation with lower output and rising unemployment. Which policy measure would the government be most likely to use to correct this? A improve education and training B increase interest rates C reduce income tax D reduce unemployment benefits
Mark scheme: C
Q18 · What is likely to increase with economic growth?
18 What is likely to increase with economic growth? A cyclical unemployment B income per head C the budget deficit D the stock of natural resources
Mark scheme: B
Q19 · An economy has a high rate of inflation
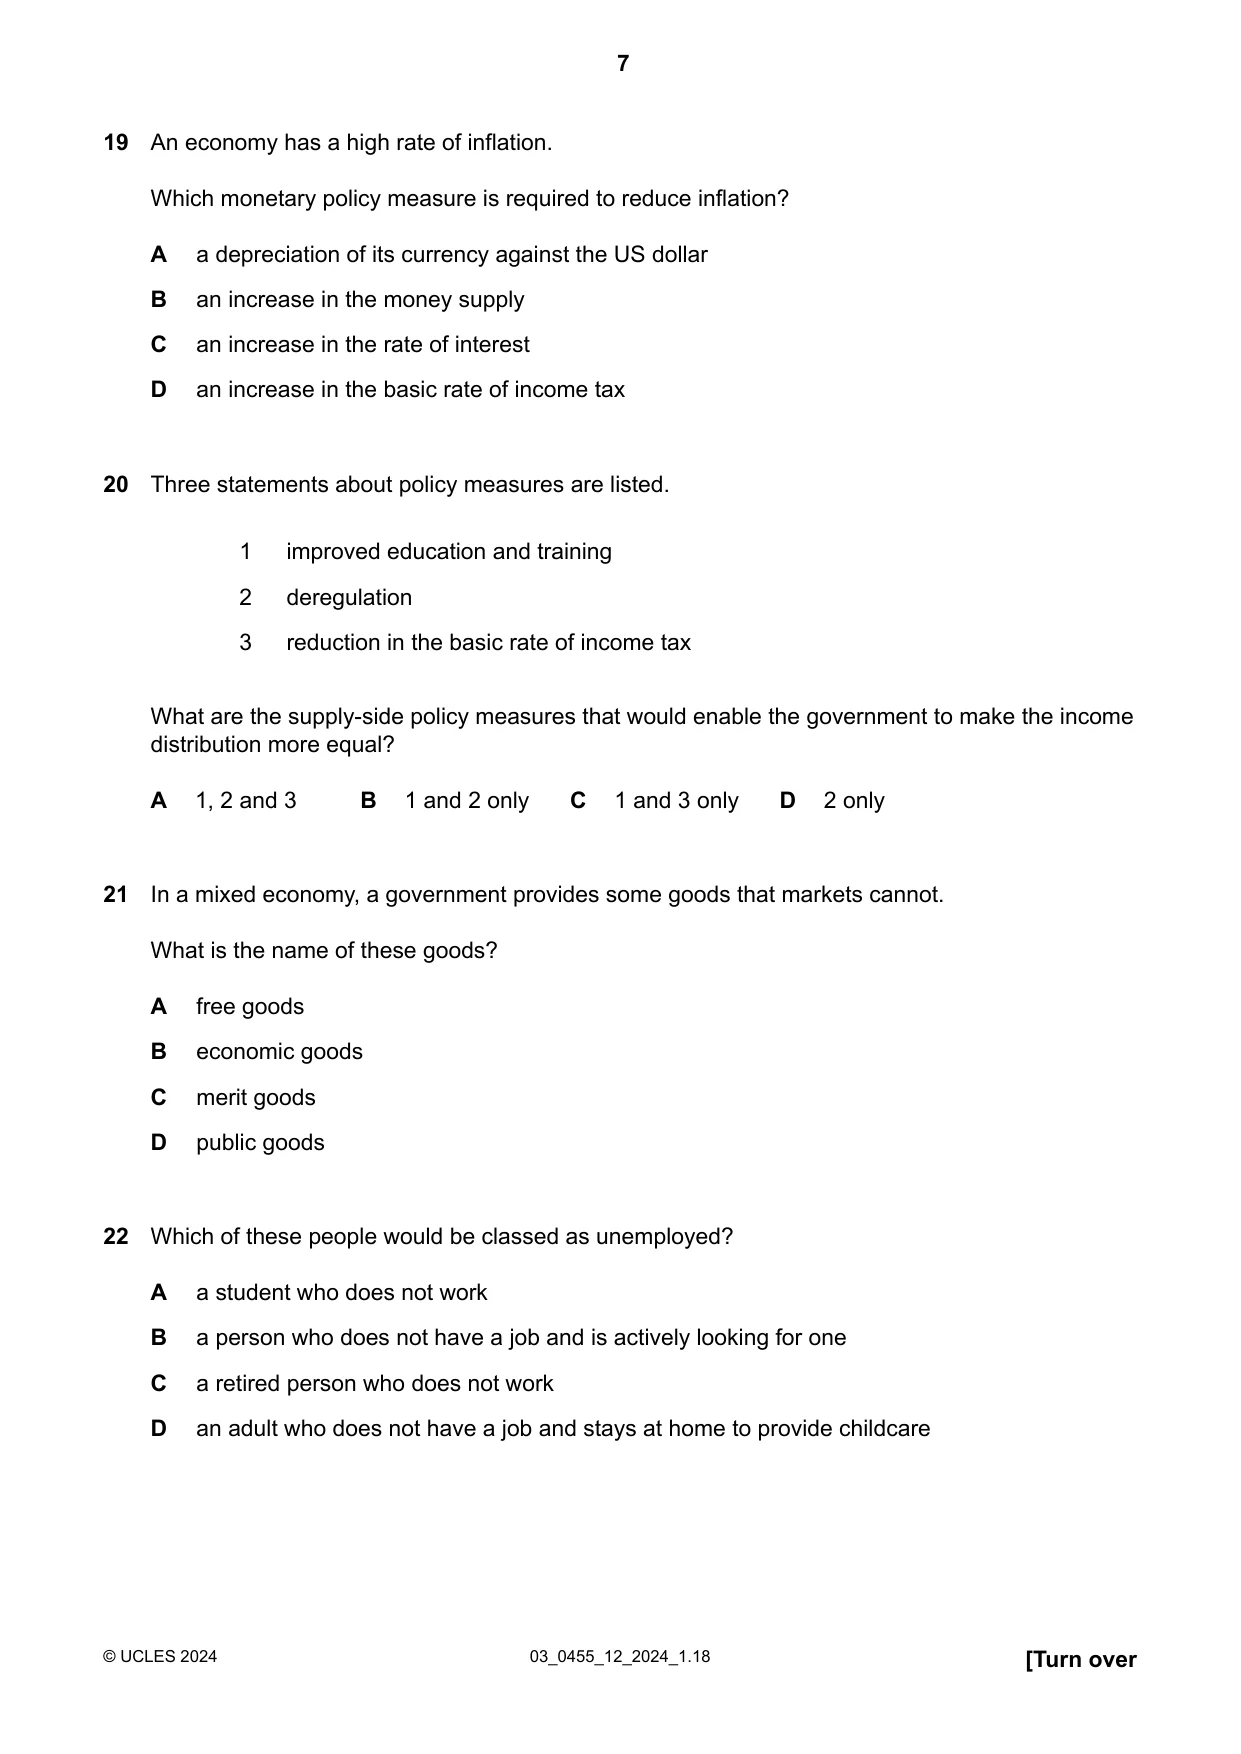
19 An economy has a high rate of inflation. Which monetary policy measure is required to reduce inflation? A a depreciation of its currency against the US dollar B an increase in the money supply C an increase in the rate of interest D an increase in the basic rate of income tax
Mark scheme: C
Q20 · Three statements about policy measures are listed
20 Three statements about policy measures are listed. 1 improved education and training 2 deregulation 3 reduction in the basic rate of income tax What are the supply-side policy measures that would enable the government to make the income distribution more equal? A 1, 2 and 3 B 1 and 2 only C 1 and 3 only D 2 only
Mark scheme: C
Q21 · In a mixed economy, a government provides some goods that markets cannot
21 In a mixed economy, a government provides some goods that markets cannot. What is the name of these goods? A free goods B economic goods C merit goods D public goods
Mark scheme: D
Q22 · Which of these people would be classed as unemployed?
22 Which of these people would be classed as unemployed? A a student who does not work B a person who does not have a job and is actively looking for one C a retired person who does not work D an adult who does not have a job and stays at home to provide childcare
Mark scheme: B
Q23 · The table shows the weights attached to four items in the Consumer Prices Index of a…
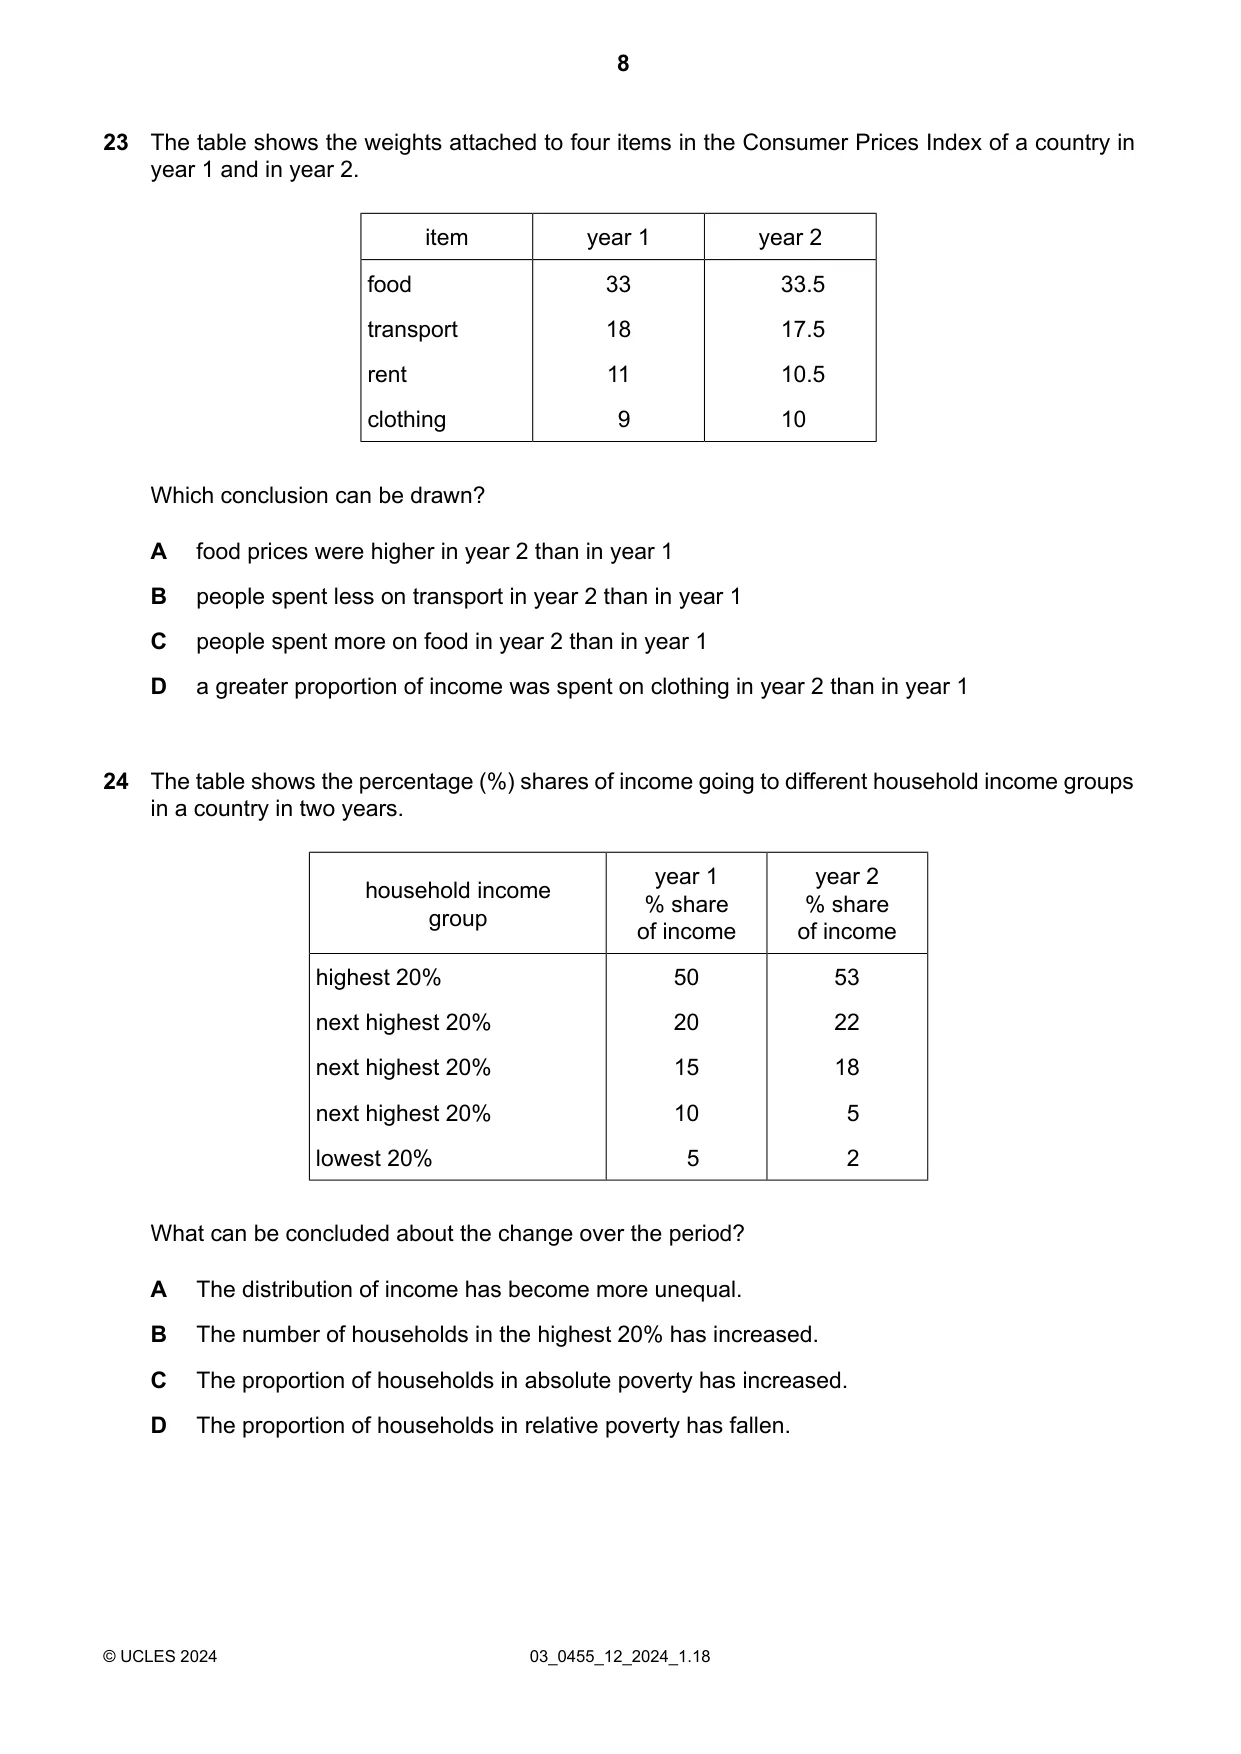
23 The table shows the weights attached to four items in the Consumer Prices Index of a country in year 1 and in year 2. item year 1 year 2 food 33 33.5 transport 18 17.5 rent 11 10.5 clothing 9 10 Which conclusion can be drawn? A food prices were higher in year 2 than in year 1 B people spent less on transport in year 2 than in year 1 C people spent more on food in year 2 than in year 1 D a greater proportion of income was spent on clothing in year 2 than in year 1
Mark scheme: D
Q24 · The table shows the percentage (%) shares of income going to different household income…
24 The table shows the percentage (%) shares of income going to different household income groups in a country in two years. year 1 year 2 household income % share % share group of income of income highest 20% 50 53 next highest 20% 20 22 next highest 20% 15 18 next highest 20% 10 5 lowest 20% 5 2 What can be concluded about the change over the period? A The distribution of income has become more unequal. B The number of households in the highest 20% has increased. C The proportion of households in absolute poverty has increased. D The proportion of households in relative poverty has fallen.
Mark scheme: A
Q25 · An economy has a high rate of population growth
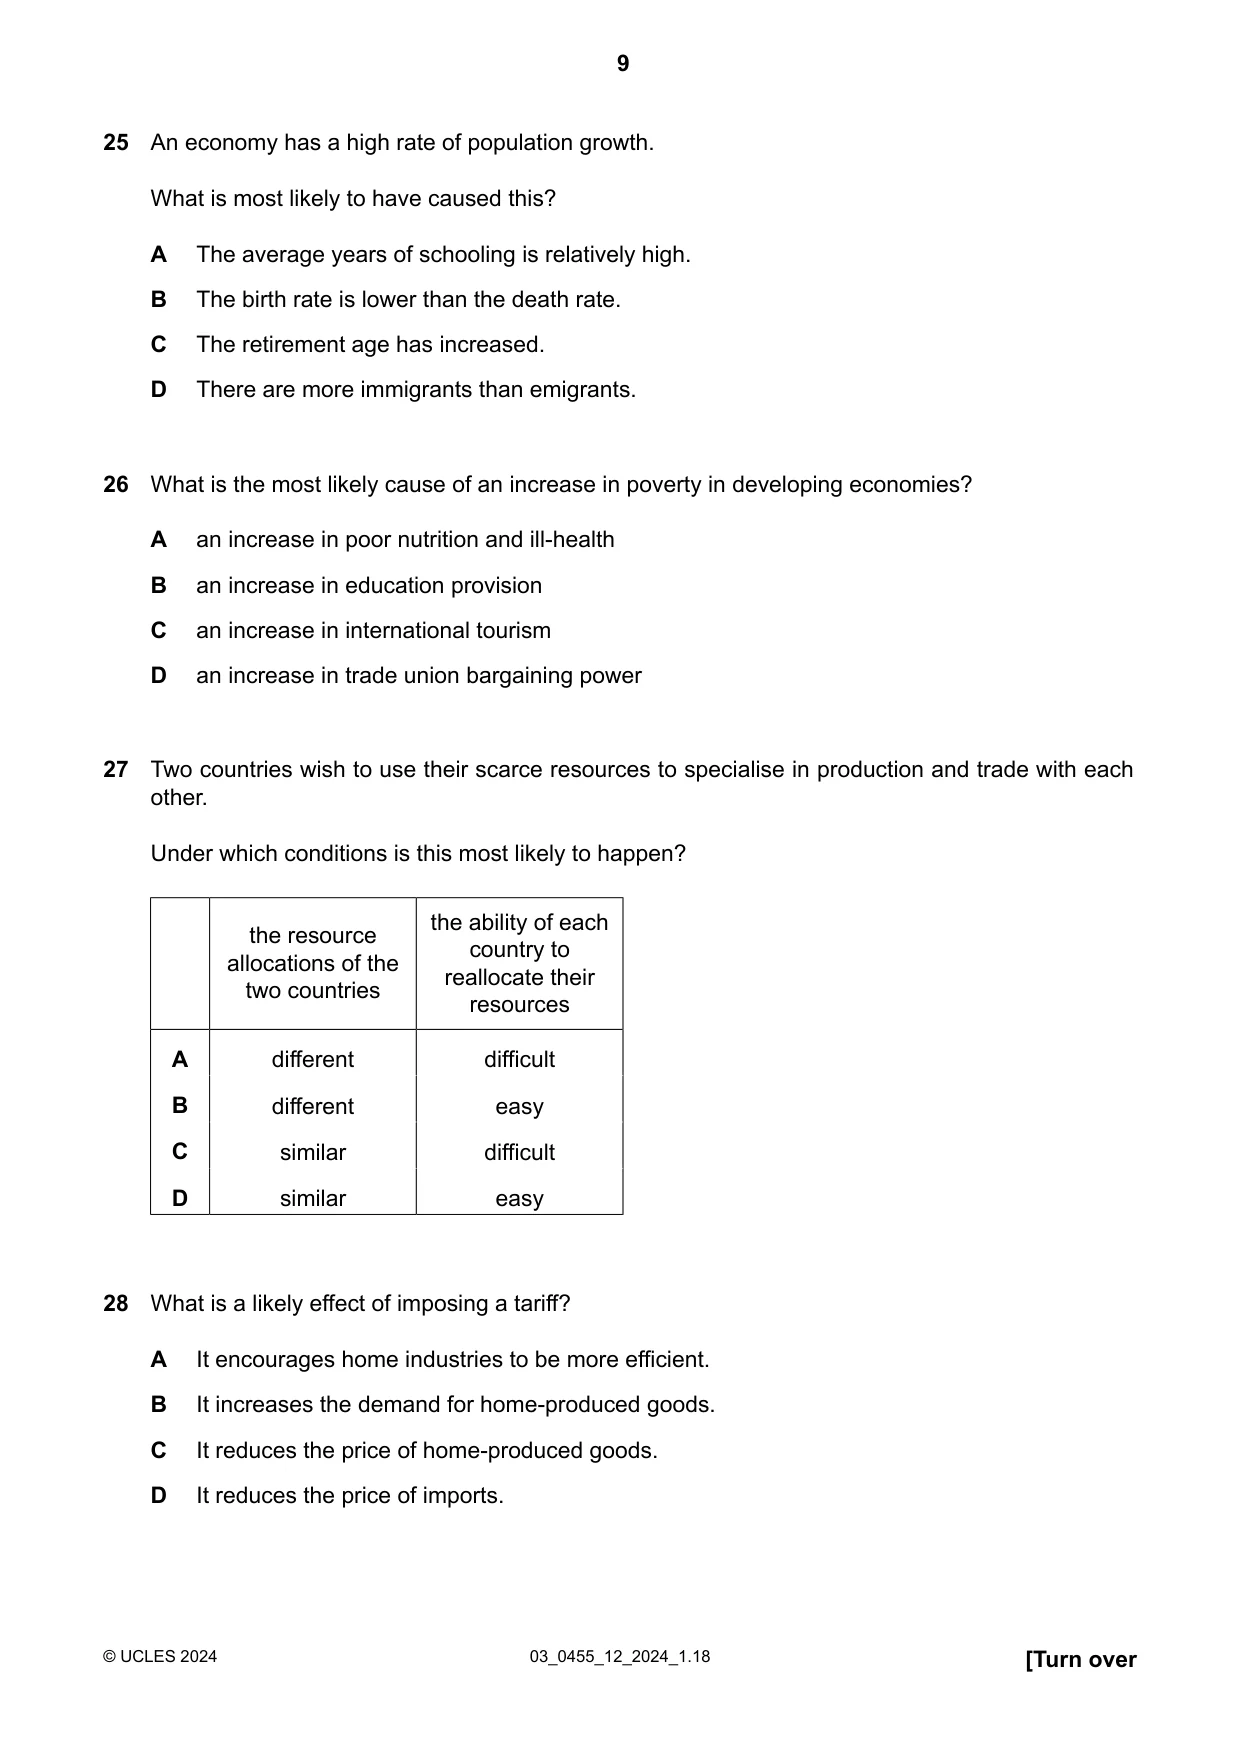
25 An economy has a high rate of population growth. What is most likely to have caused this? A The average years of schooling is relatively high. B The birth rate is lower than the death rate. C The retirement age has increased. D There are more immigrants than emigrants.
Mark scheme: D
Q26 · What is the most likely cause of an increase in poverty in developing economies?
26 What is the most likely cause of an increase in poverty in developing economies? A an increase in poor nutrition and ill-health B an increase in education provision C an increase in international tourism D an increase in trade union bargaining power
Mark scheme: A
Q27 · Two countries wish to use their scarce resources to specialise in production and trade…
27 Two countries wish to use their scarce resources to specialise in production and trade with each other. Under which conditions is this most likely to happen? the ability of each the resource country to allocations of the reallocate their two countries resources A different difficult B different easy C similar difficult D similar easy
Mark scheme: B
Q28 · What is a likely effect of imposing a tariff?
28 What is a likely effect of imposing a tariff? A It encourages home industries to be more efficient. B It increases the demand for home-produced goods. C It reduces the price of home-produced goods. D It reduces the price of imports.
Mark scheme: B
Q29 · The diagram shows the foreign exchange market for the Singapore dollar (S$) in exchange…
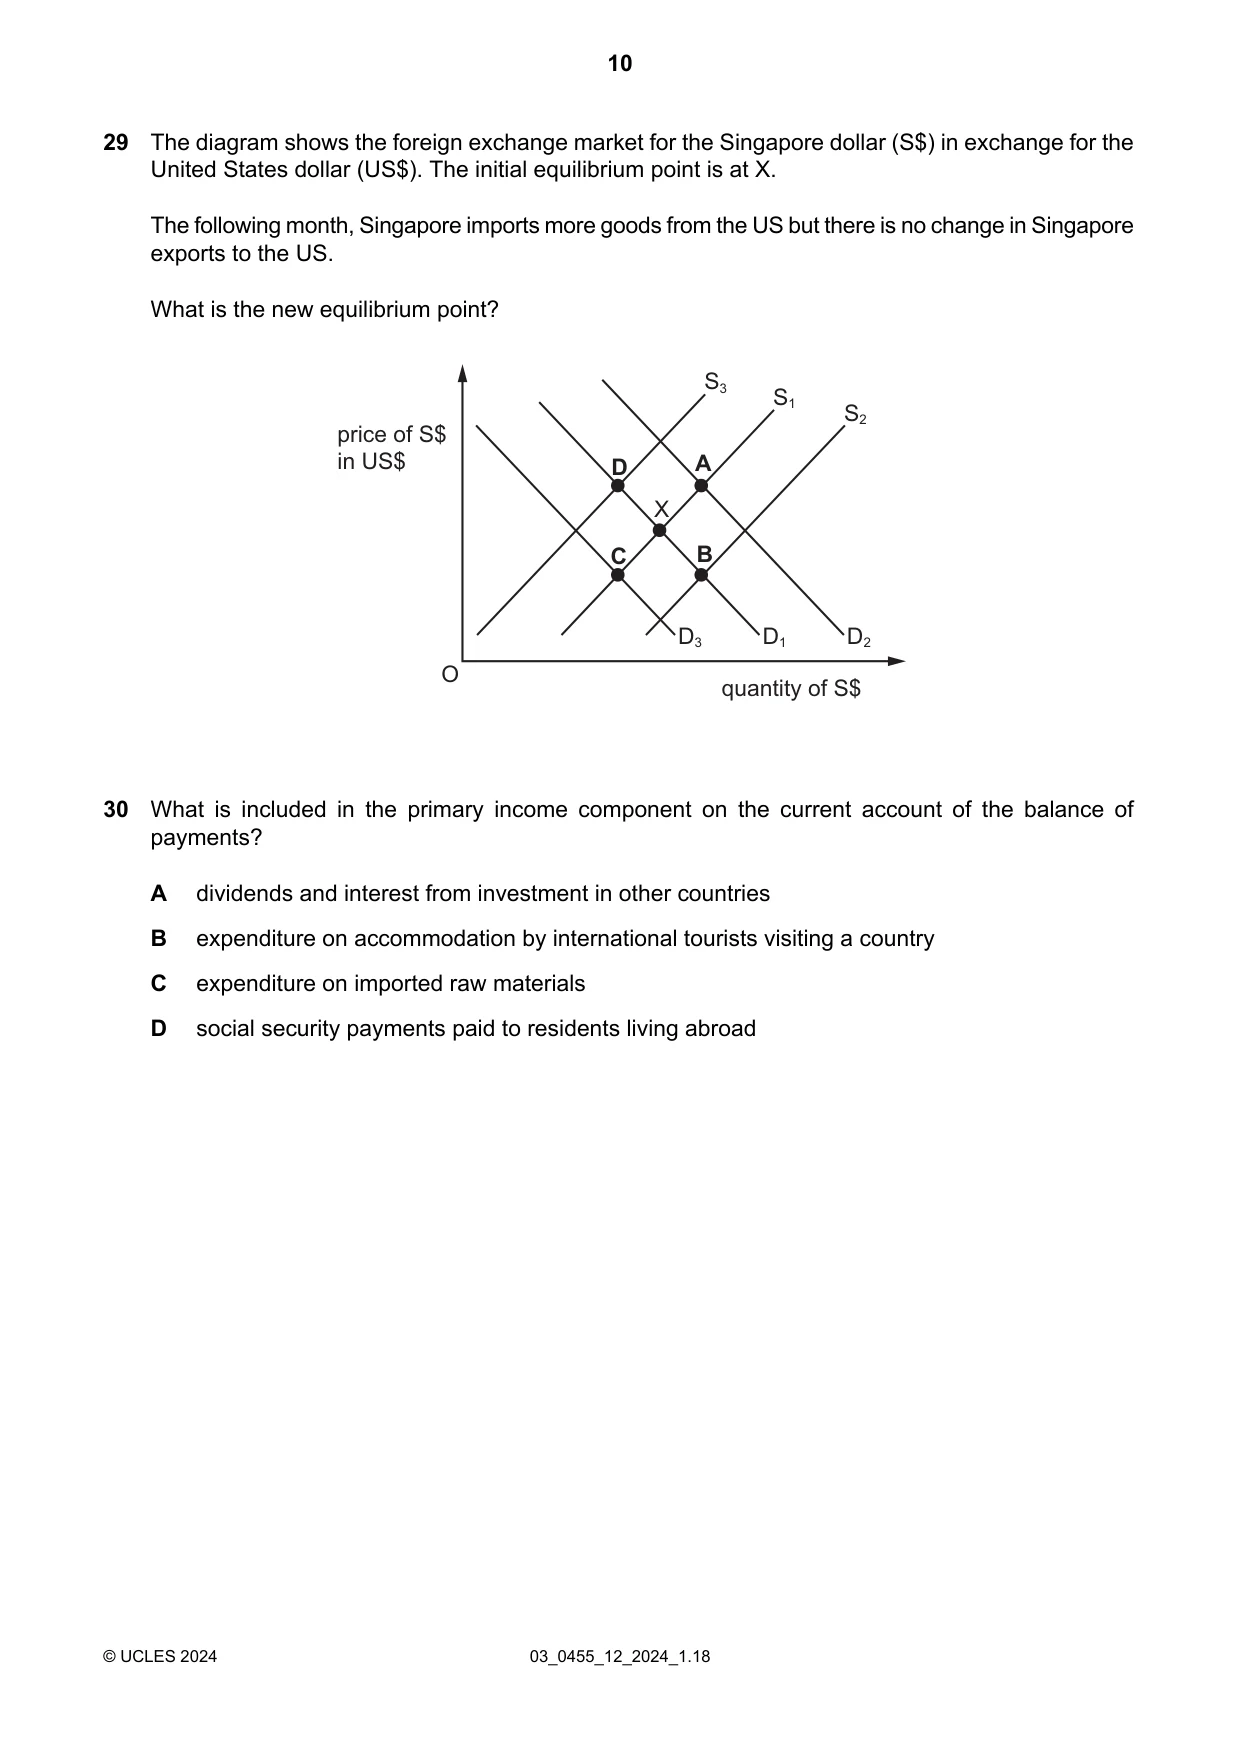
29 The diagram shows the foreign exchange market for the Singapore dollar (S$) in exchange for the United States dollar (US$). The initial equilibrium point is at X. The following month, Singapore imports more goods from the US but there is no change in Singapore exports to the US. What is the new equilibrium point? S3 S1 S2 price of S$ in US$ D A X C B D3 D1 D2 O quantity of S$
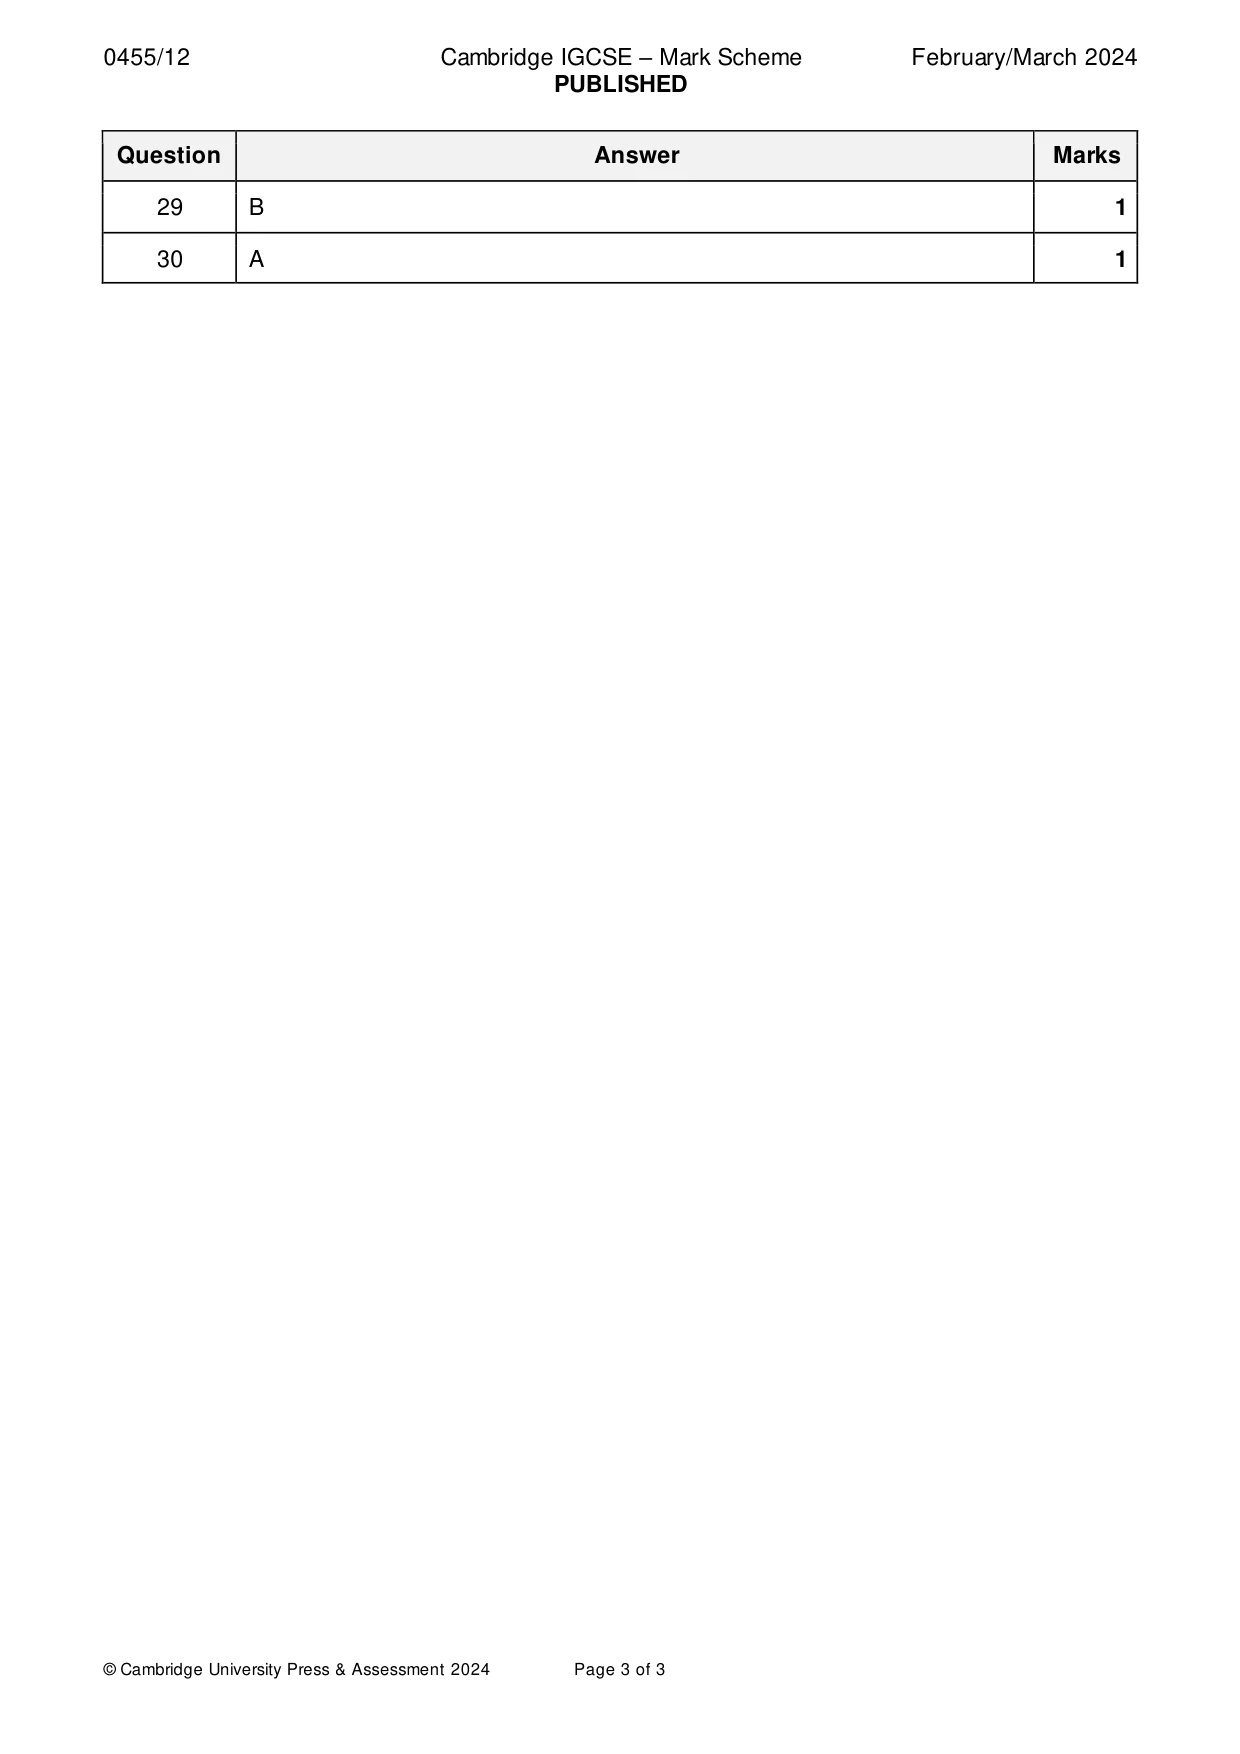
Mark scheme: B
Q30 · What is included in the primary income component on the current account of the balance of…
30 What is included in the primary income component on the current account of the balance of payments? A dividends and interest from investment in other countries B expenditure on accommodation by international tourists visiting a country C expenditure on imported raw materials D social security payments paid to residents living abroad
Mark scheme: A
What was in this paper
The subtopics covered by these 30 questions, and how many questions each got. Open one in a new tab to see every Cambridge question on it.
2Firms’ costs, revenue and objectives2Market failure2Poverty2Supply2Current account of balance of payments1Demand1Economic growth1Employment and unemployment1Fiscal policy1Foreign exchange rates1Globalisation, free trade and protection1Inflation and deflation1International specialisation1Market economic system1Market structure1Monetary policy1Money and banking1Opportunity cost1Population1Price elasticity of demand (PED)1Production possibility curve (PPC) diagrams1Supply-side policy1The nature of the economic problem1The role of markets in allocating resources1What you needed in this session
Cambridge’s own grade thresholds for 2024 Feb/March, Paper 1 · Variant 2. A higher threshold means an easier paper — the bar moves with how the cohort did.