Cambridge IGCSE Economics 0455 — 2020 May/June Paper 1 · Variant 3
0455/13/M/J/20 · 30 questions · 30 marks · ≈34 min
The question paper and its mark scheme, free to read here and free to download. This is Cambridge’s own paper, exactly as it was sat.
Question paper12 pages

Mark scheme3 pages
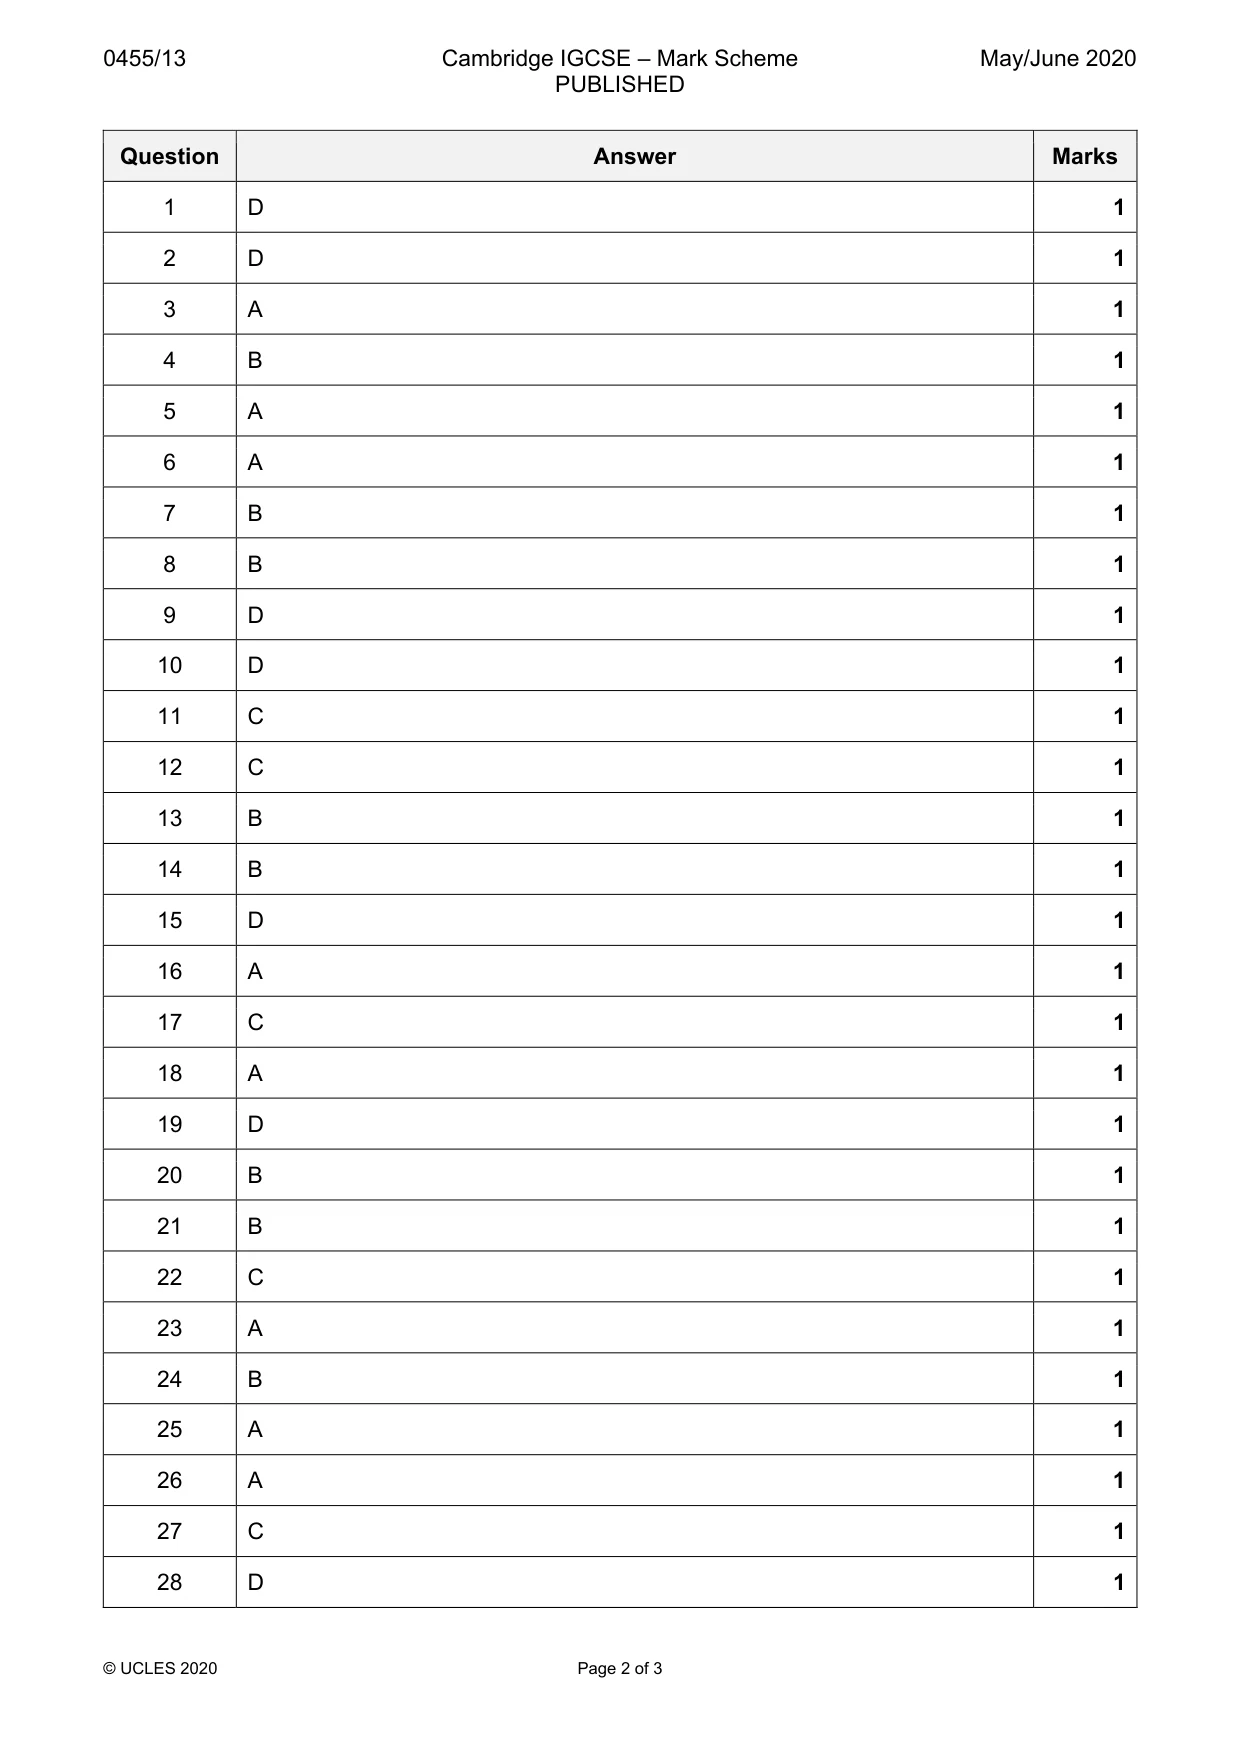
Answers below. Sit the paper first if you are practising.
Questions as text
Q1 · A natural resource was discovered in a country
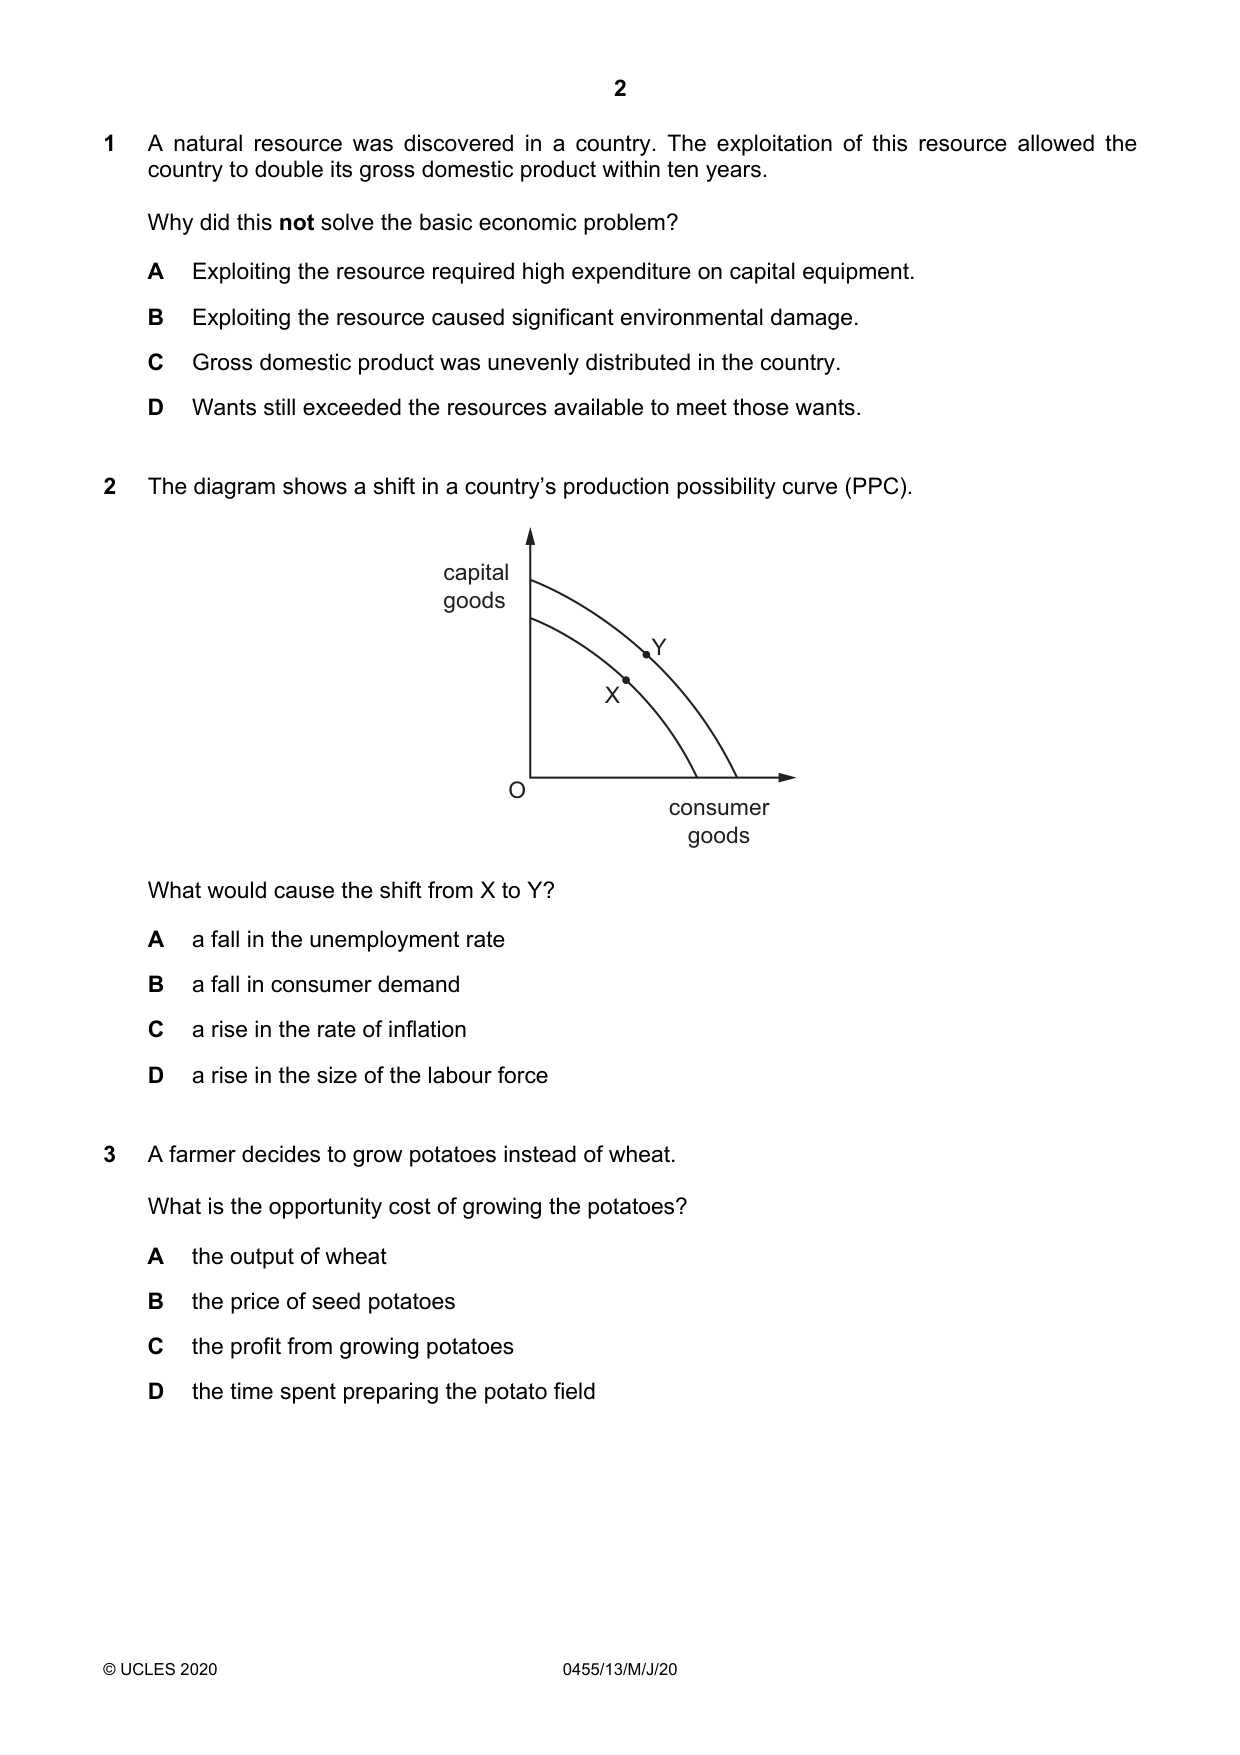
1 A natural resource was discovered in a country. The exploitation of this resource allowed the country to double its gross domestic product within ten years. Why did this not solve the basic economic problem? A Exploiting the resource required high expenditure on capital equipment. B Exploiting the resource caused significant environmental damage. C Gross domestic product was unevenly distributed in the country. D Wants still exceeded the resources available to meet those wants.
Mark scheme: D
Q2 · The diagram shows a shift in a country’s production possibility curve (PPC)
2 The diagram shows a shift in a country’s production possibility curve (PPC). capital goods Y X O consumer goods What would cause the shift from X to Y? A a fall in the unemployment rate B a fall in consumer demand C a rise in the rate of inflation D a rise in the size of the labour force
Mark scheme: D
Q3 · A farmer decides to grow potatoes instead of wheat
3 A farmer decides to grow potatoes instead of wheat. What is the opportunity cost of growing the potatoes? A the output of wheat B the price of seed potatoes C the profit from growing potatoes D the time spent preparing the potato field
Mark scheme: A
Q4 · Which are both macroeconomic decisions?
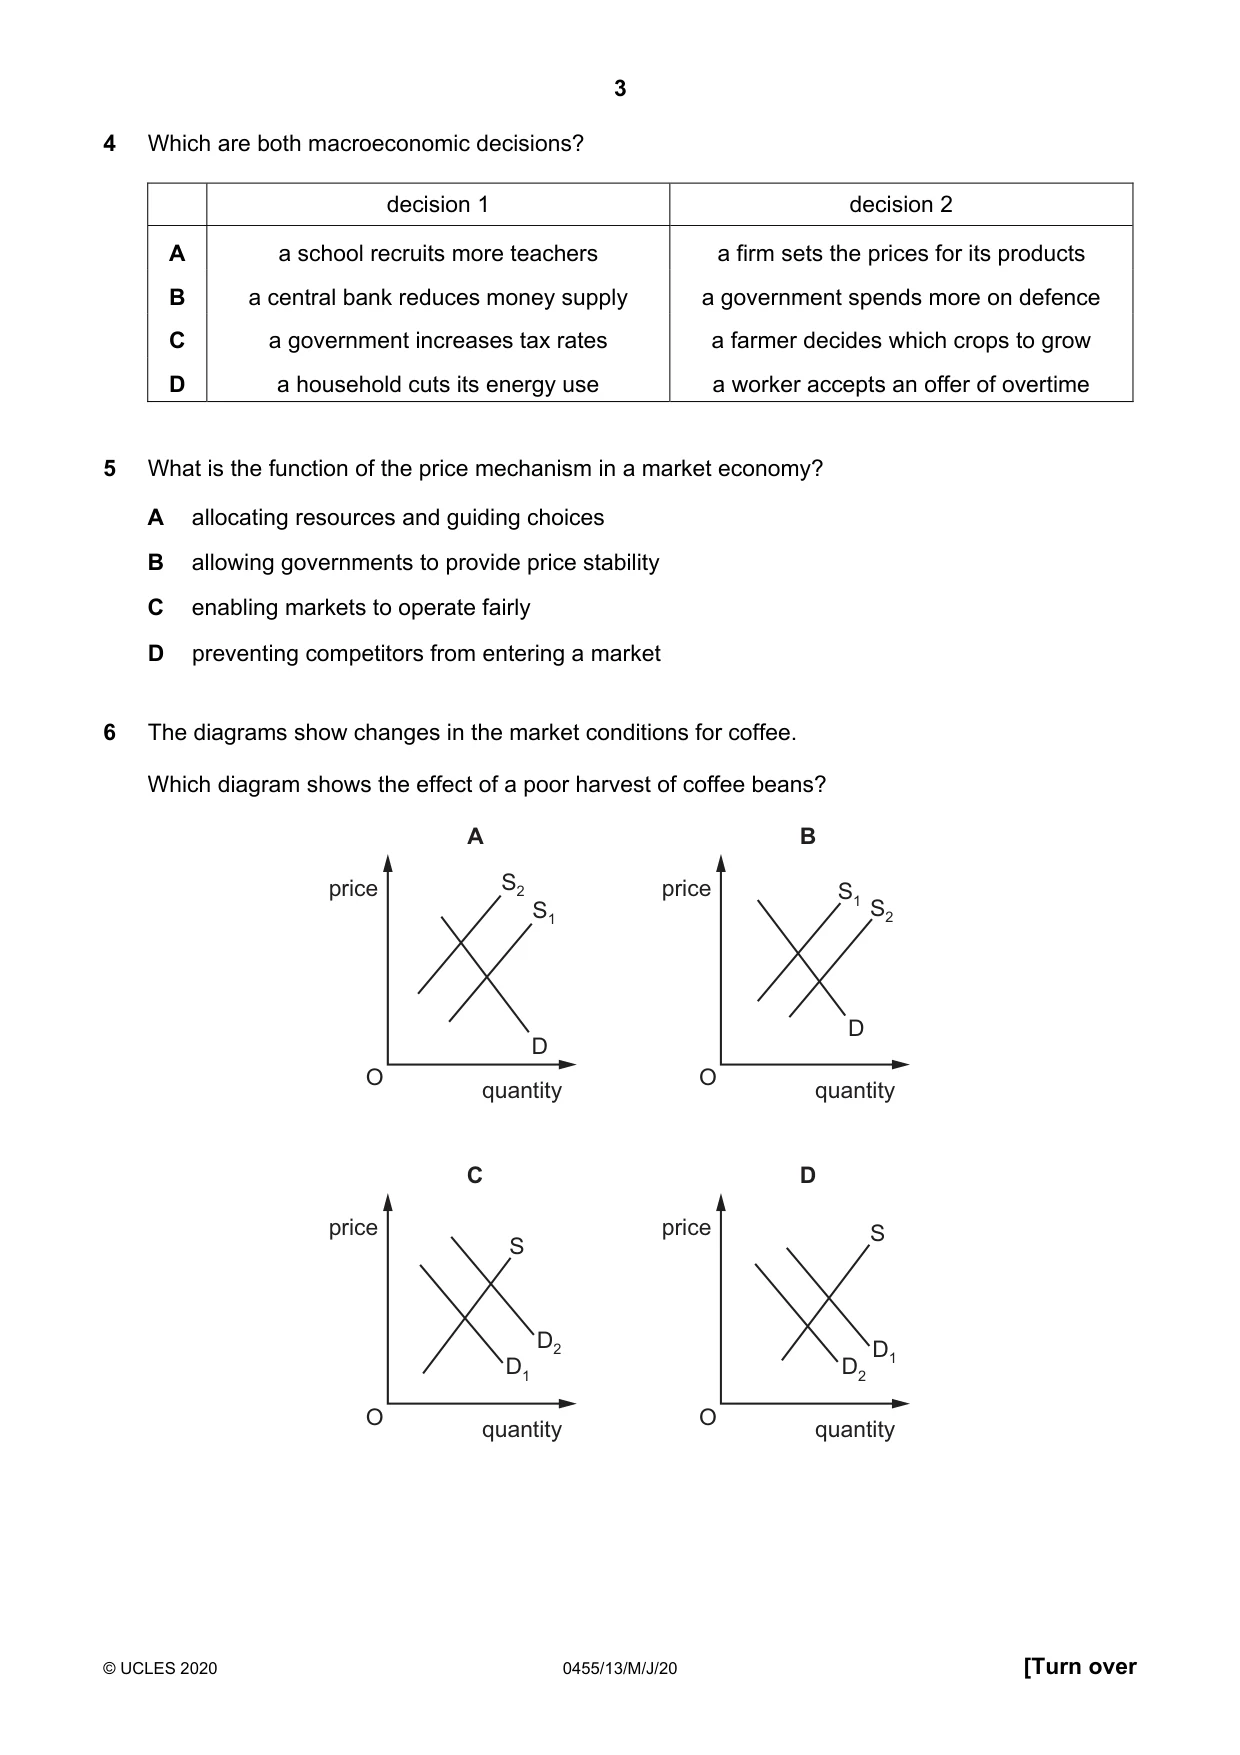
4 Which are both macroeconomic decisions? decision 1 decision 2 A a school recruits more teachers a firm sets the prices for its products B a central bank reduces money supply a government spends more on defence C a government increases tax rates a farmer decides which crops to grow D a household cuts its energy use a worker accepts an offer of overtime
Mark scheme: B
Q5 · What is the function of the price mechanism in a market economy?
5 What is the function of the price mechanism in a market economy? A allocating resources and guiding choices B allowing governments to provide price stability C enabling markets to operate fairly D preventing competitors from entering a market
Mark scheme: A
More questions on The role of markets in allocating resources
Q6 · The diagrams show changes in the market conditions for coffee
6 The diagrams show changes in the market conditions for coffee. Which diagram shows the effect of a poor harvest of coffee beans? A B price S2 price S1 S1 S2 D D O O quantity quantity C D price price S S D2 D1 D1 D2 O O quantity quantity
Mark scheme: A
Q7 · The price elasticity of supply of good X is 0.1
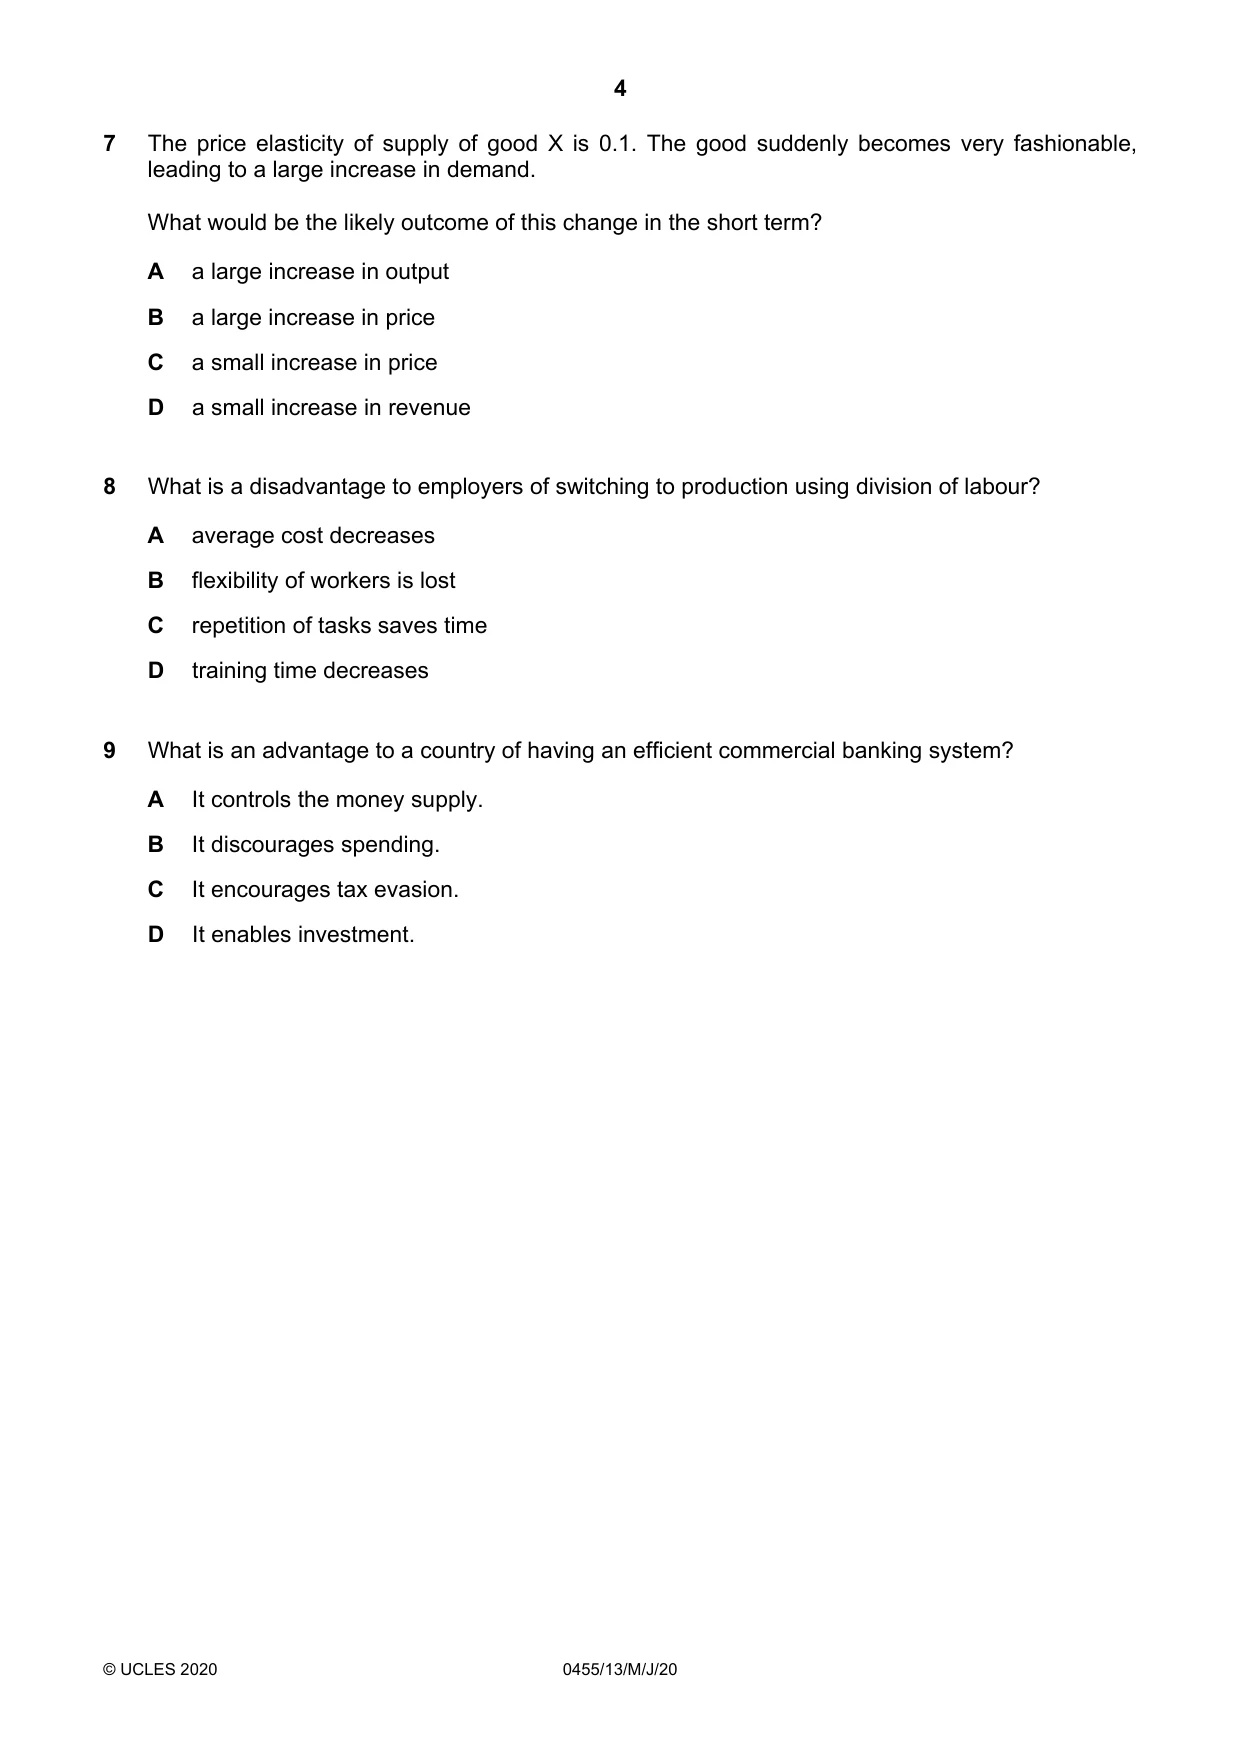
7 The price elasticity of supply of good X is 0.1. The good suddenly becomes very fashionable, leading to a large increase in demand. What would be the likely outcome of this change in the short term? A a large increase in output B a large increase in price C a small increase in price D a small increase in revenue
Mark scheme: B
Q8 · What is a disadvantage to employers of switching to production using division of labour?
8 What is a disadvantage to employers of switching to production using division of labour? A average cost decreases B flexibility of workers is lost C repetition of tasks saves time D training time decreases
Mark scheme: B
Q9 · What is an advantage to a country of having an efficient commercial banking system?
9 What is an advantage to a country of having an efficient commercial banking system? A It controls the money supply. B It discourages spending. C It encourages tax evasion. D It enables investment.
Mark scheme: D
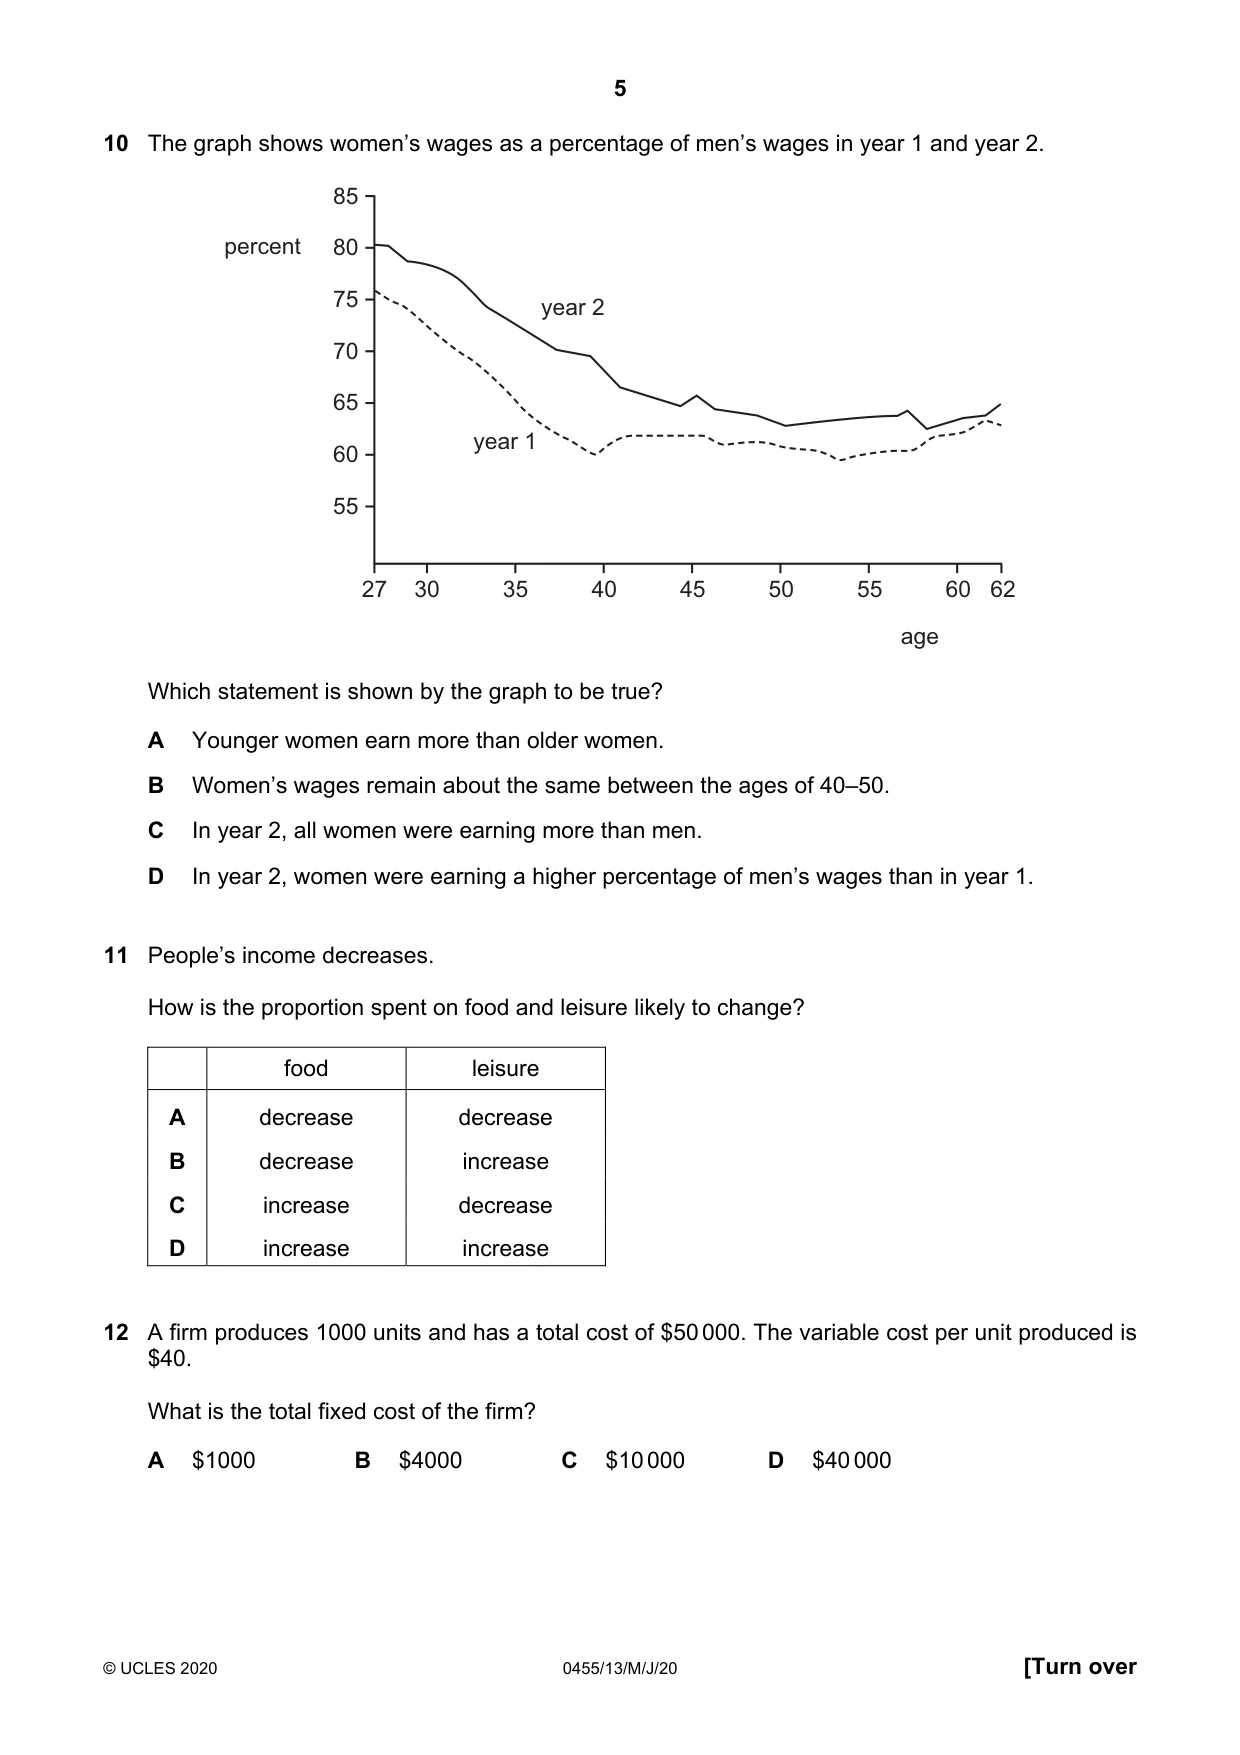
Q10 · The graph shows women’s wages as a percentage of men’s wages in year 1 and year 2
10 The graph shows women’s wages as a percentage of men’s wages in year 1 and year 2. 85 percent 80 75 year 2 70 65 year 1 60 55 27 30 35 40 45 50 55 60 62 age Which statement is shown by the graph to be true? A Younger women earn more than older women. B Women’s wages remain about the same between the ages of 40–50. C In year 2, all women were earning more than men. D In year 2, women were earning a higher percentage of men’s wages than in year 1.
Mark scheme: D
Question 11
11 People’s income decreases. How is the proportion spent on food and leisure likely to change? food leisure A decrease decrease B decrease increase C increase decrease D increase increase
Mark scheme: C
Q12 · A firm produces 1000 units and has a total cost of $50 000
12 A firm produces 1000 units and has a total cost of $50 000. The variable cost per unit produced is $40. What is the total fixed cost of the firm? A $1000 B $4000 C $10 000 D $40 000
Mark scheme: C
Q13 · The following information refers to a firm producing shoes
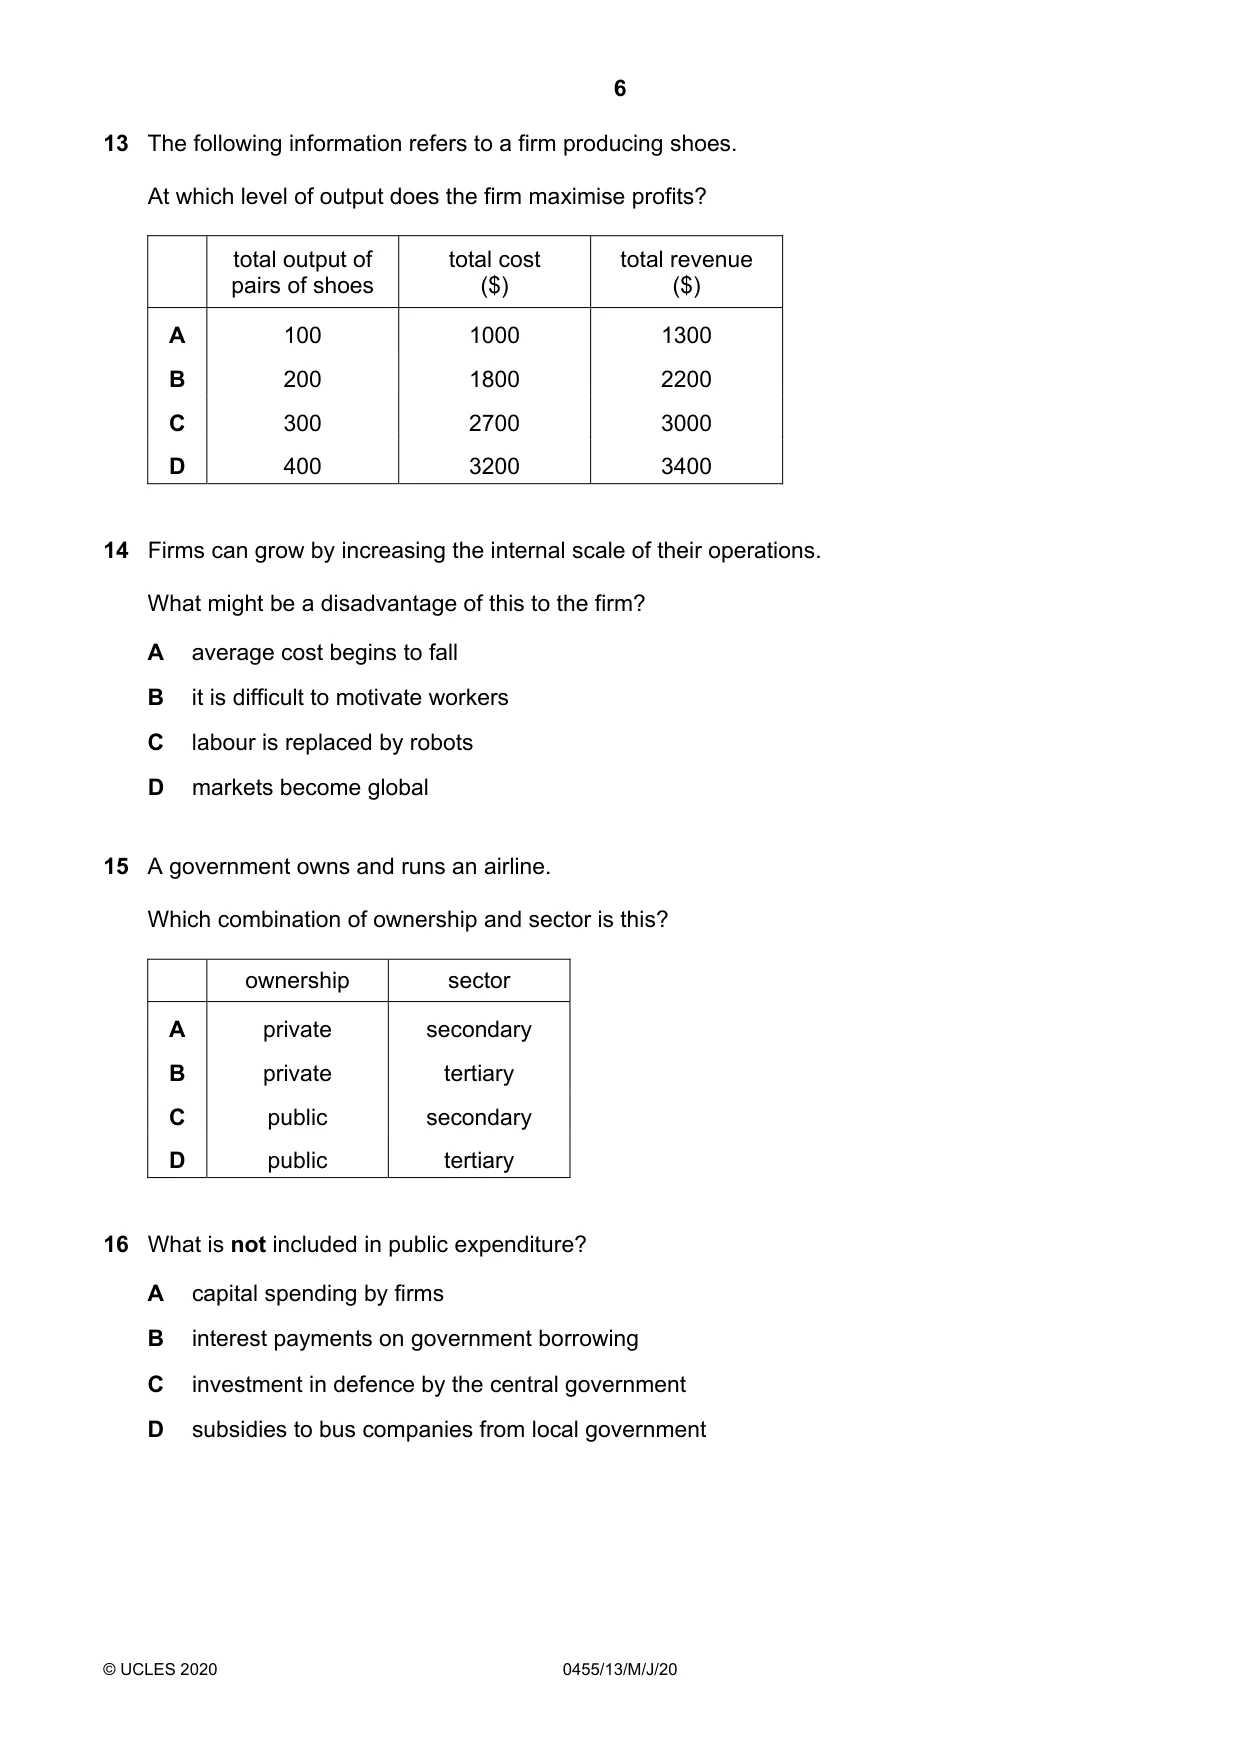
13 The following information refers to a firm producing shoes. At which level of output does the firm maximise profits? total output of total cost total revenue pairs of shoes ($) ($) A 100 1000 1300 B 200 1800 2200 C 300 2700 3000 D 400 3200 3400
Mark scheme: B
Q14 · Firms can grow by increasing the internal scale of their operations
14 Firms can grow by increasing the internal scale of their operations. What might be a disadvantage of this to the firm? A average cost begins to fall B it is difficult to motivate workers C labour is replaced by robots D markets become global
Mark scheme: B
Q15 · A government owns and runs an airline
15 A government owns and runs an airline. Which combination of ownership and sector is this? ownership sector A private secondary B private tertiary C public secondary D public tertiary
Mark scheme: D
Q16 · What is not included in public expenditure?
16 What is not included in public expenditure? A capital spending by firms B interest payments on government borrowing C investment in defence by the central government D subsidies to bus companies from local government
Mark scheme: A
Q17 · When is the budget described as balanced?
17 When is the budget described as balanced? A when direct taxes and indirect taxes are equal B when exports and imports are equal C when government spending and government revenue are equal D when the demand for money and the supply of money are equal
Mark scheme: C
Q18 · What is the main aim of supply-side policy?
18 What is the main aim of supply-side policy? A increasing economic growth by raising productivity B increasing the balance of payments surplus by restricting free trade C reducing the government’s budget deficit by increasing taxation D reducing the money supply by increasing the rate of interest
Mark scheme: A
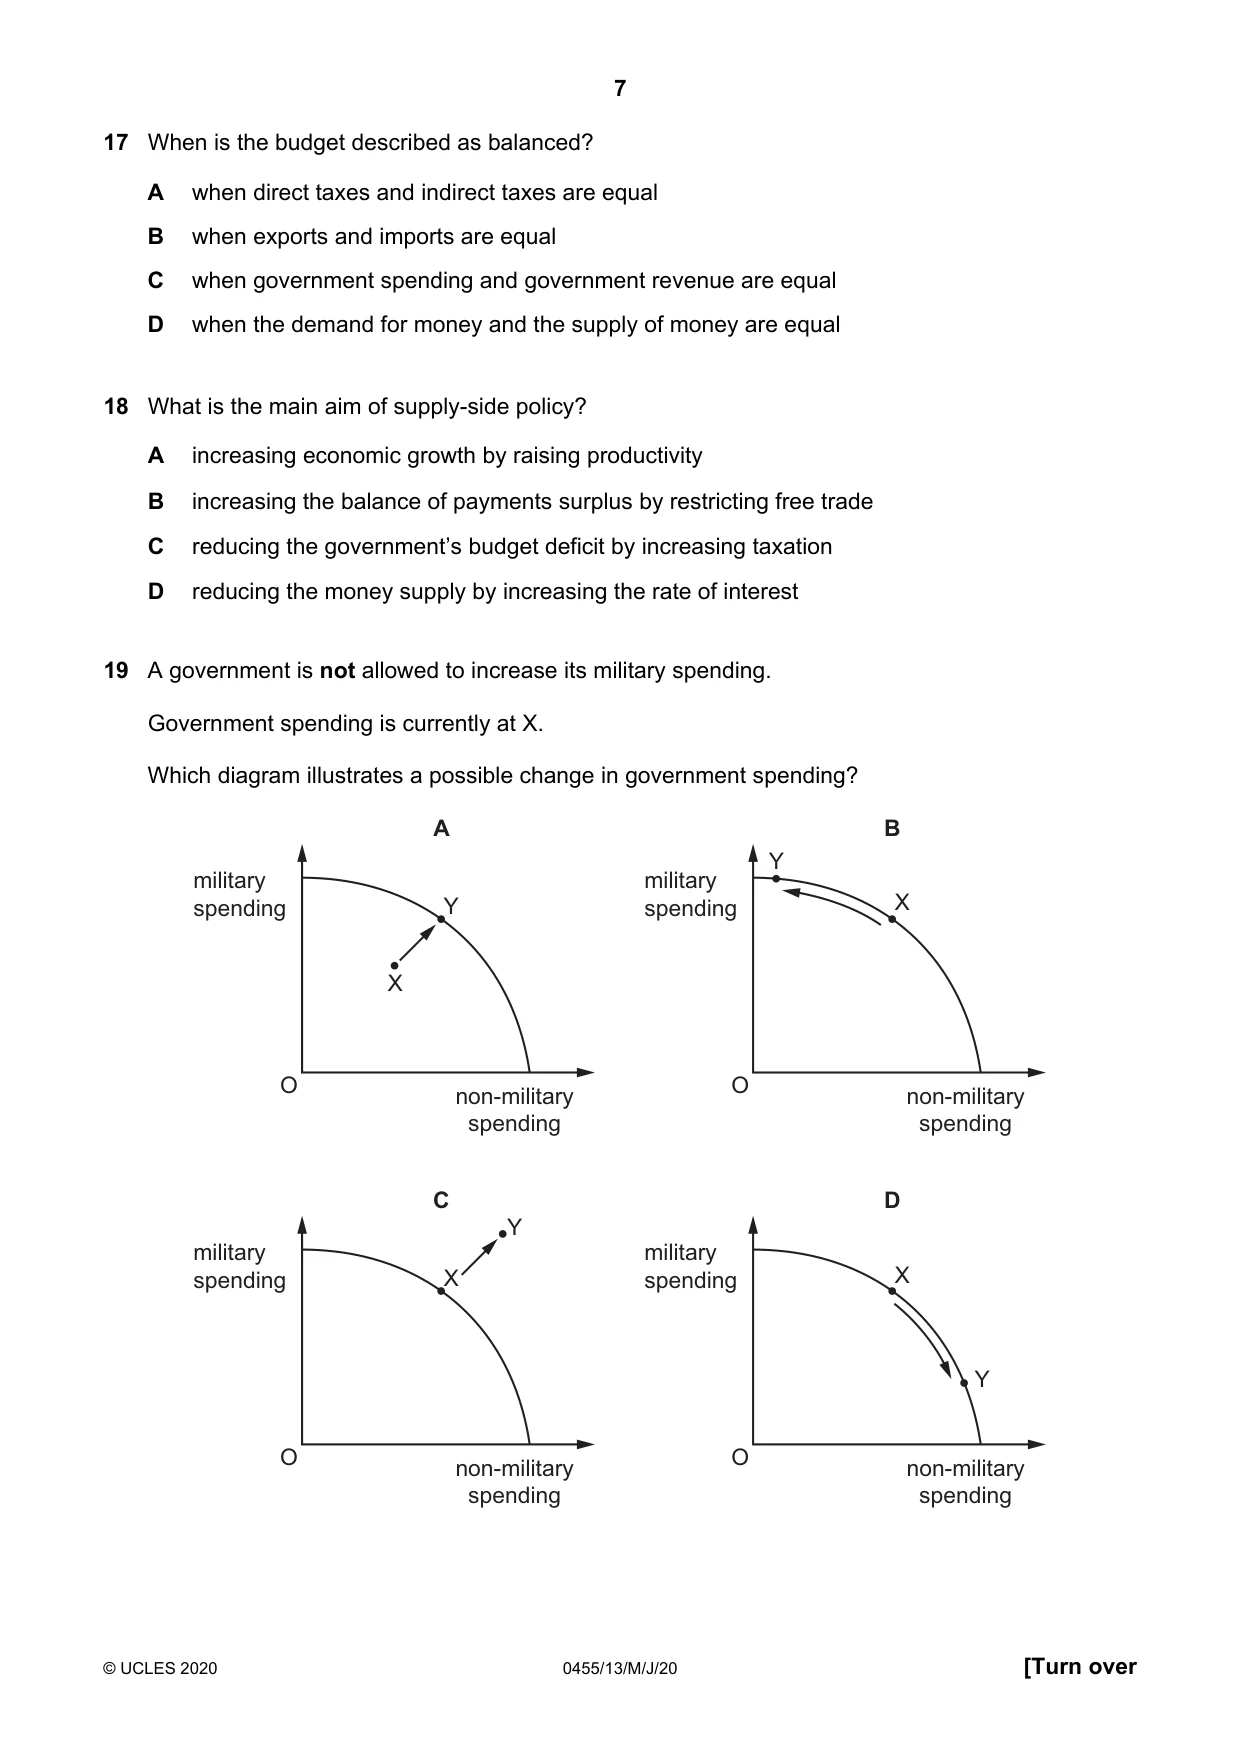
Q19 · A government is not allowed to increase its military spending
19 A government is not allowed to increase its military spending. Government spending is currently at X. Which diagram illustrates a possible change in government spending? A B Y military military spending Y spending X X O O non-military non-military spending spending C D Y military military spending X spending X Y O O non-military non-military spending spending
Mark scheme: D
More questions on Production possibility curve (PPC) diagrams
Q20 · A country has full employment
20 A country has full employment. Which policy is most likely to lead to a fall in economic growth in the short run but an increase in economic growth in the long run? A lowering the retirement age B raising the school leaving age C restricting the immigration of key workers D selling assets owned in other countries
Mark scheme: B
Q21 · A government has a contractionary fiscal policy to reduce inflation
21 A government has a contractionary fiscal policy to reduce inflation. What will the government increase? A expenditure on infrastructure B income tax rates C personal tax allowances D unemployment benefits
Mark scheme: B
Q22 · What would not be required in the construction of an index of consumer prices?
22 What would not be required in the construction of an index of consumer prices? A the selection of a base year B the selection of a representative range of items C the calculation of average wage levels D the weighting of each item in the index
Mark scheme: C
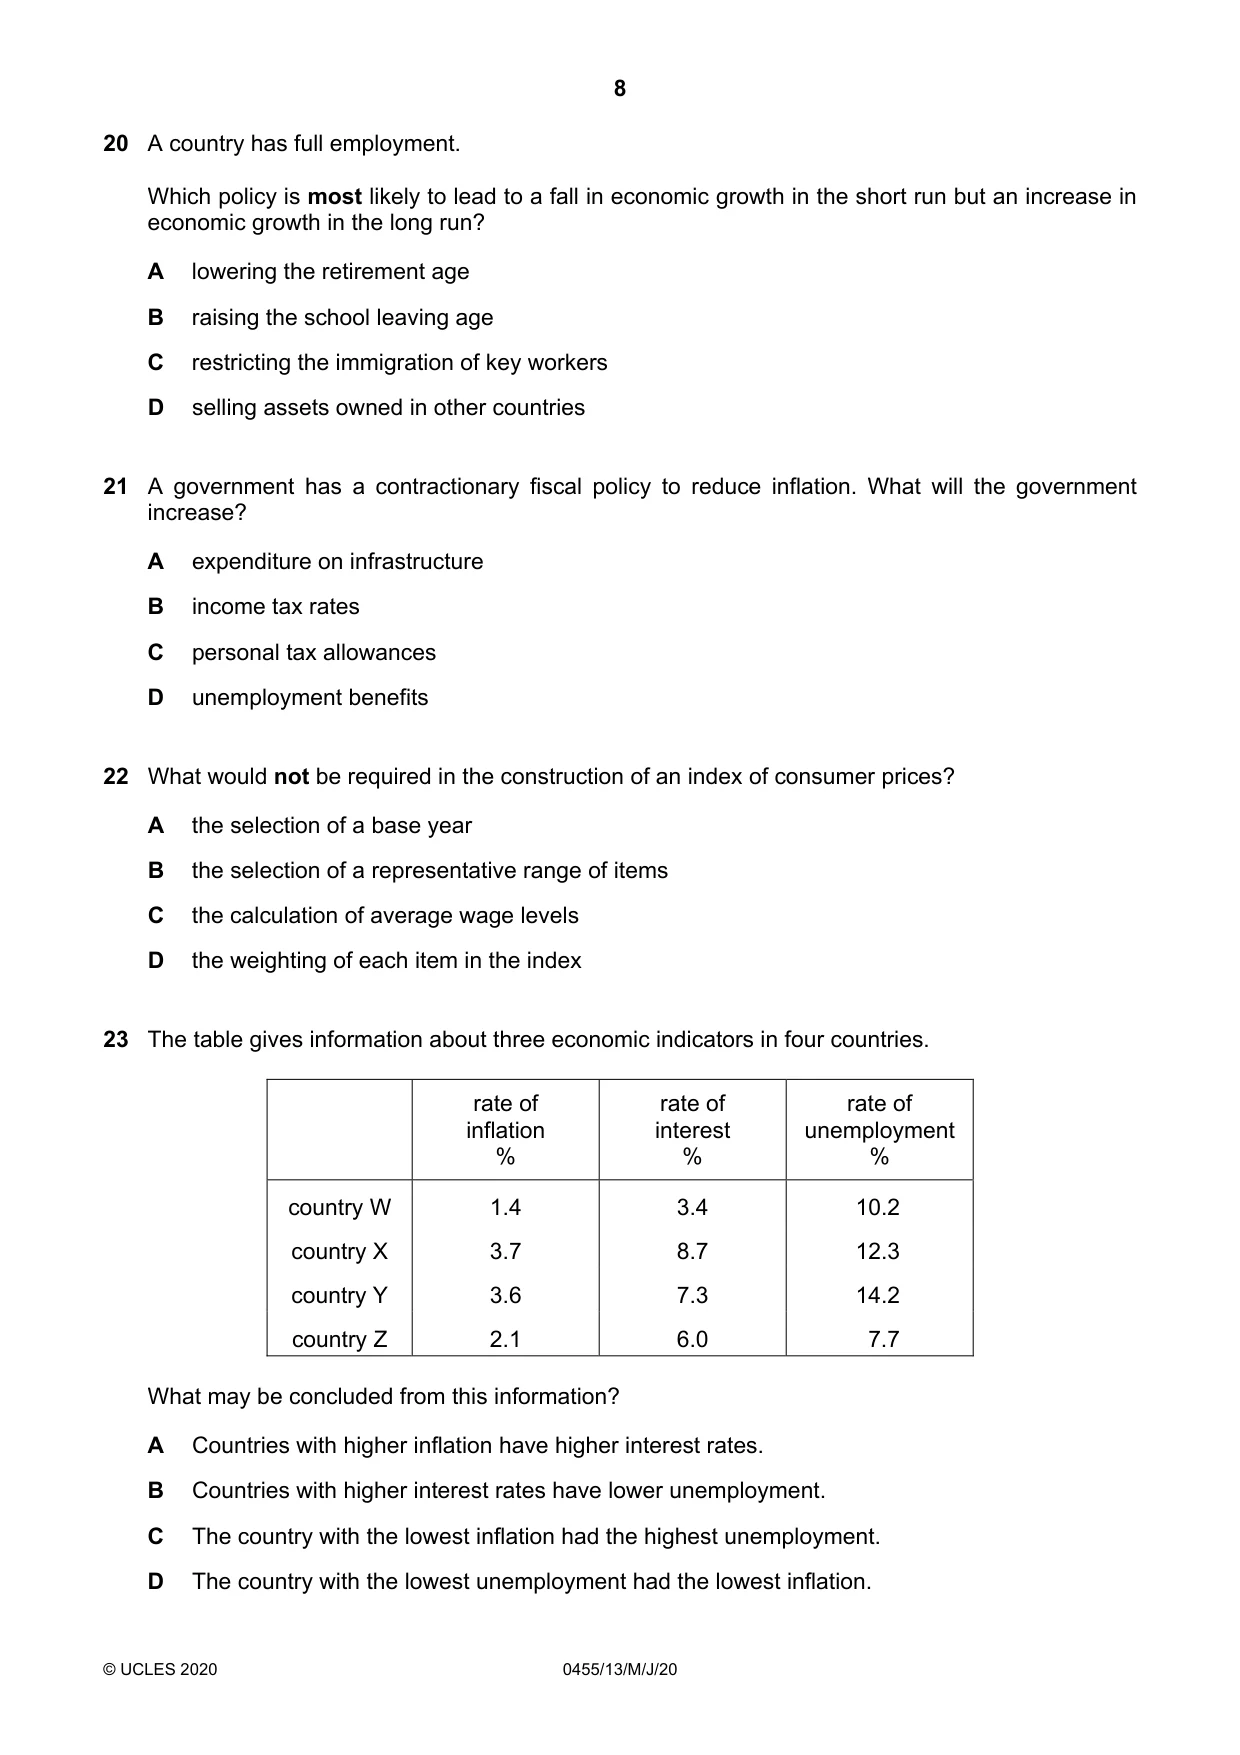
Q23 · The table gives information about three economic indicators in four countries
23 The table gives information about three economic indicators in four countries. rate of rate of rate of inflation interest unemployment % % % country W 1.4 3.4 10.2 country X 3.7 8.7 12.3 country Y 3.6 7.3 14.2 country Z 2.1 6.0 7.7 What may be concluded from this information? A Countries with higher inflation have higher interest rates. B Countries with higher interest rates have lower unemployment. C The country with the lowest inflation had the highest unemployment. D The country with the lowest unemployment had the lowest inflation.
Mark scheme: A
Q24 · Real incomes have risen in a country
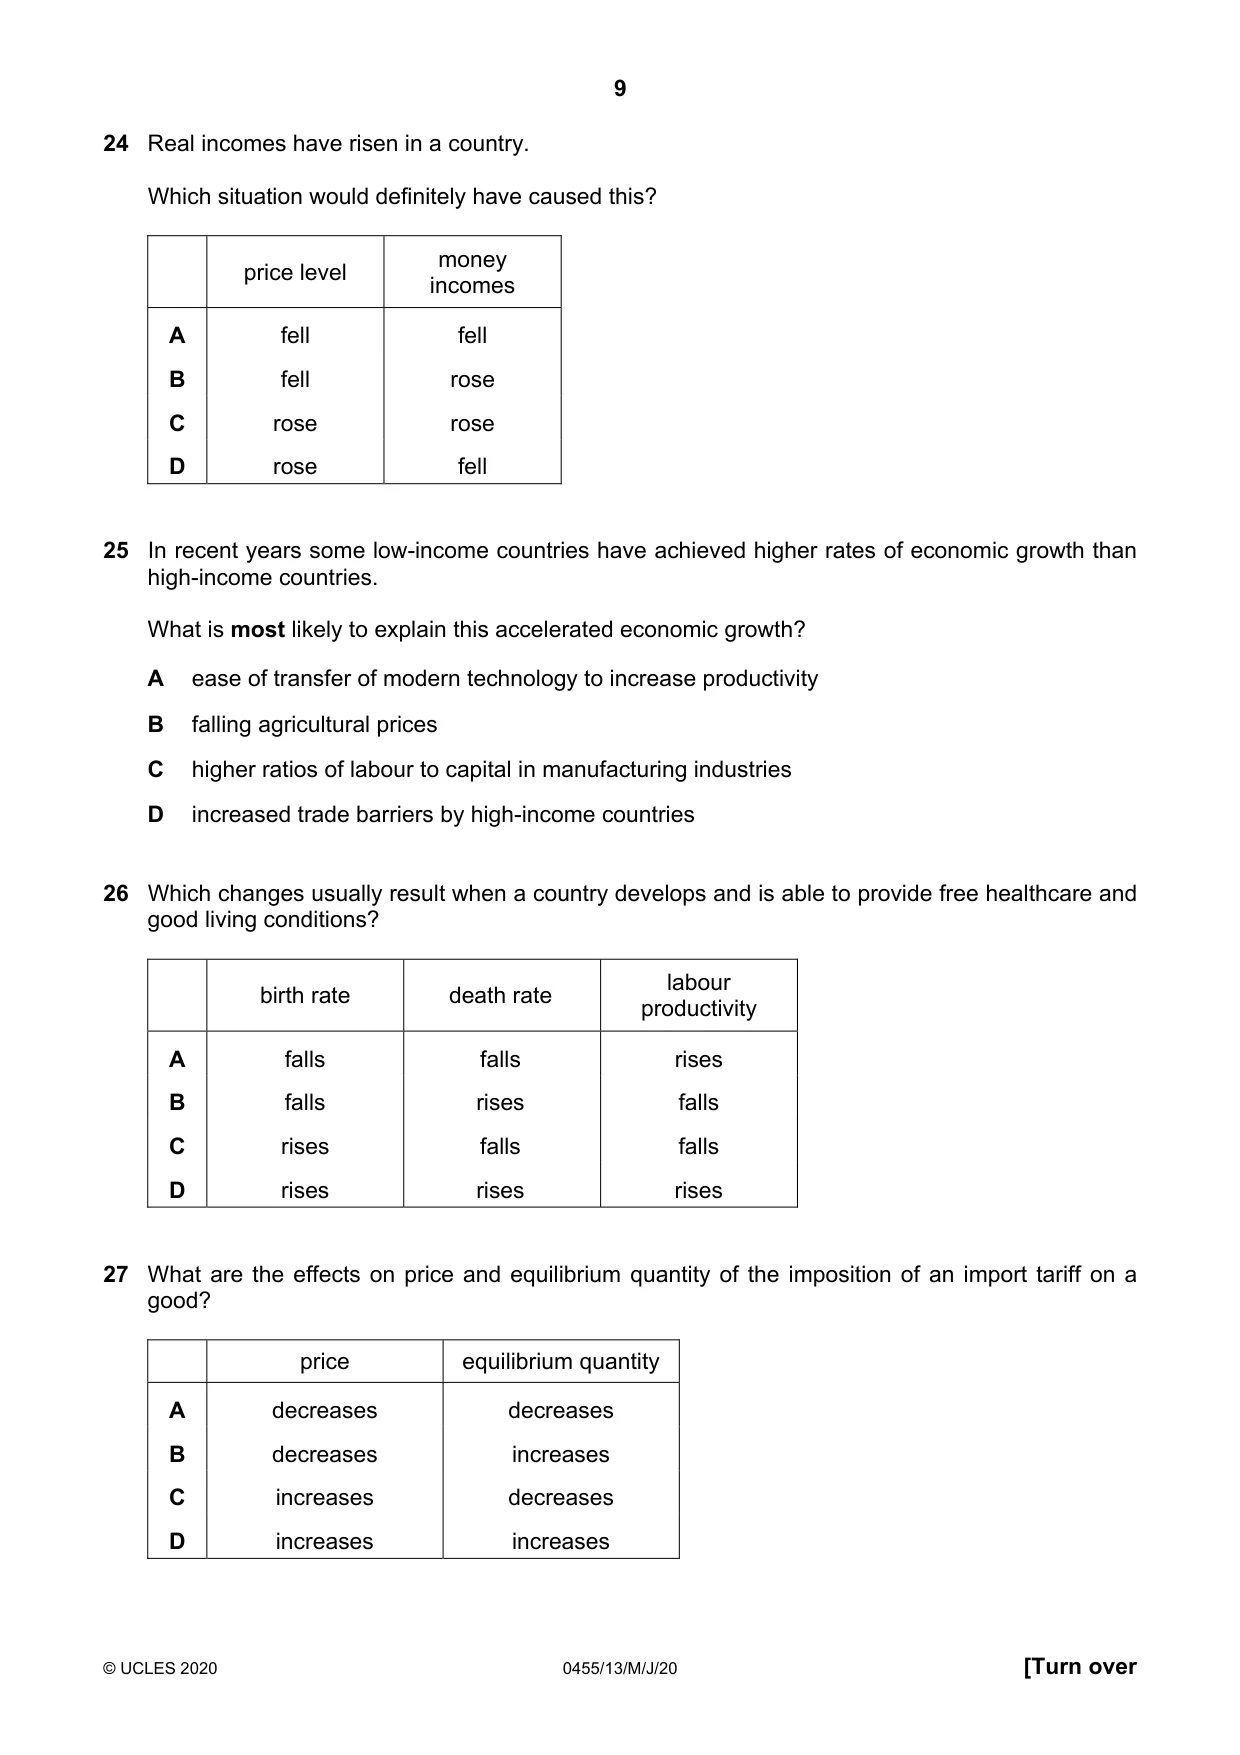
24 Real incomes have risen in a country. Which situation would definitely have caused this? money price level incomes A fell fell B fell rose C rose rose D rose fell
Mark scheme: B
Q25 · In recent years some low-income countries have achieved higher rates of economic growth…
25 In recent years some low-income countries have achieved higher rates of economic growth than high-income countries. What is most likely to explain this accelerated economic growth? A ease of transfer of modern technology to increase productivity B falling agricultural prices C higher ratios of labour to capital in manufacturing industries D increased trade barriers by high-income countries
Mark scheme: A
More questions on Differences in economic development between countries
Q26 · Which changes usually result when a country develops and is able to provide free…
26 Which changes usually result when a country develops and is able to provide free healthcare and good living conditions? labour birth rate death rate productivity A falls falls rises B falls rises falls C rises falls falls D rises rises rises
Mark scheme: A
Q27 · What are the effects on price and equilibrium quantity of the imposition of an import…
27 What are the effects on price and equilibrium quantity of the imposition of an import tariff on a good? price equilibrium quantity A decreases decreases B decreases increases C increases decreases D increases increases
Mark scheme: C
Q28 · Which change will not increase a surplus on the current account of the balance of…
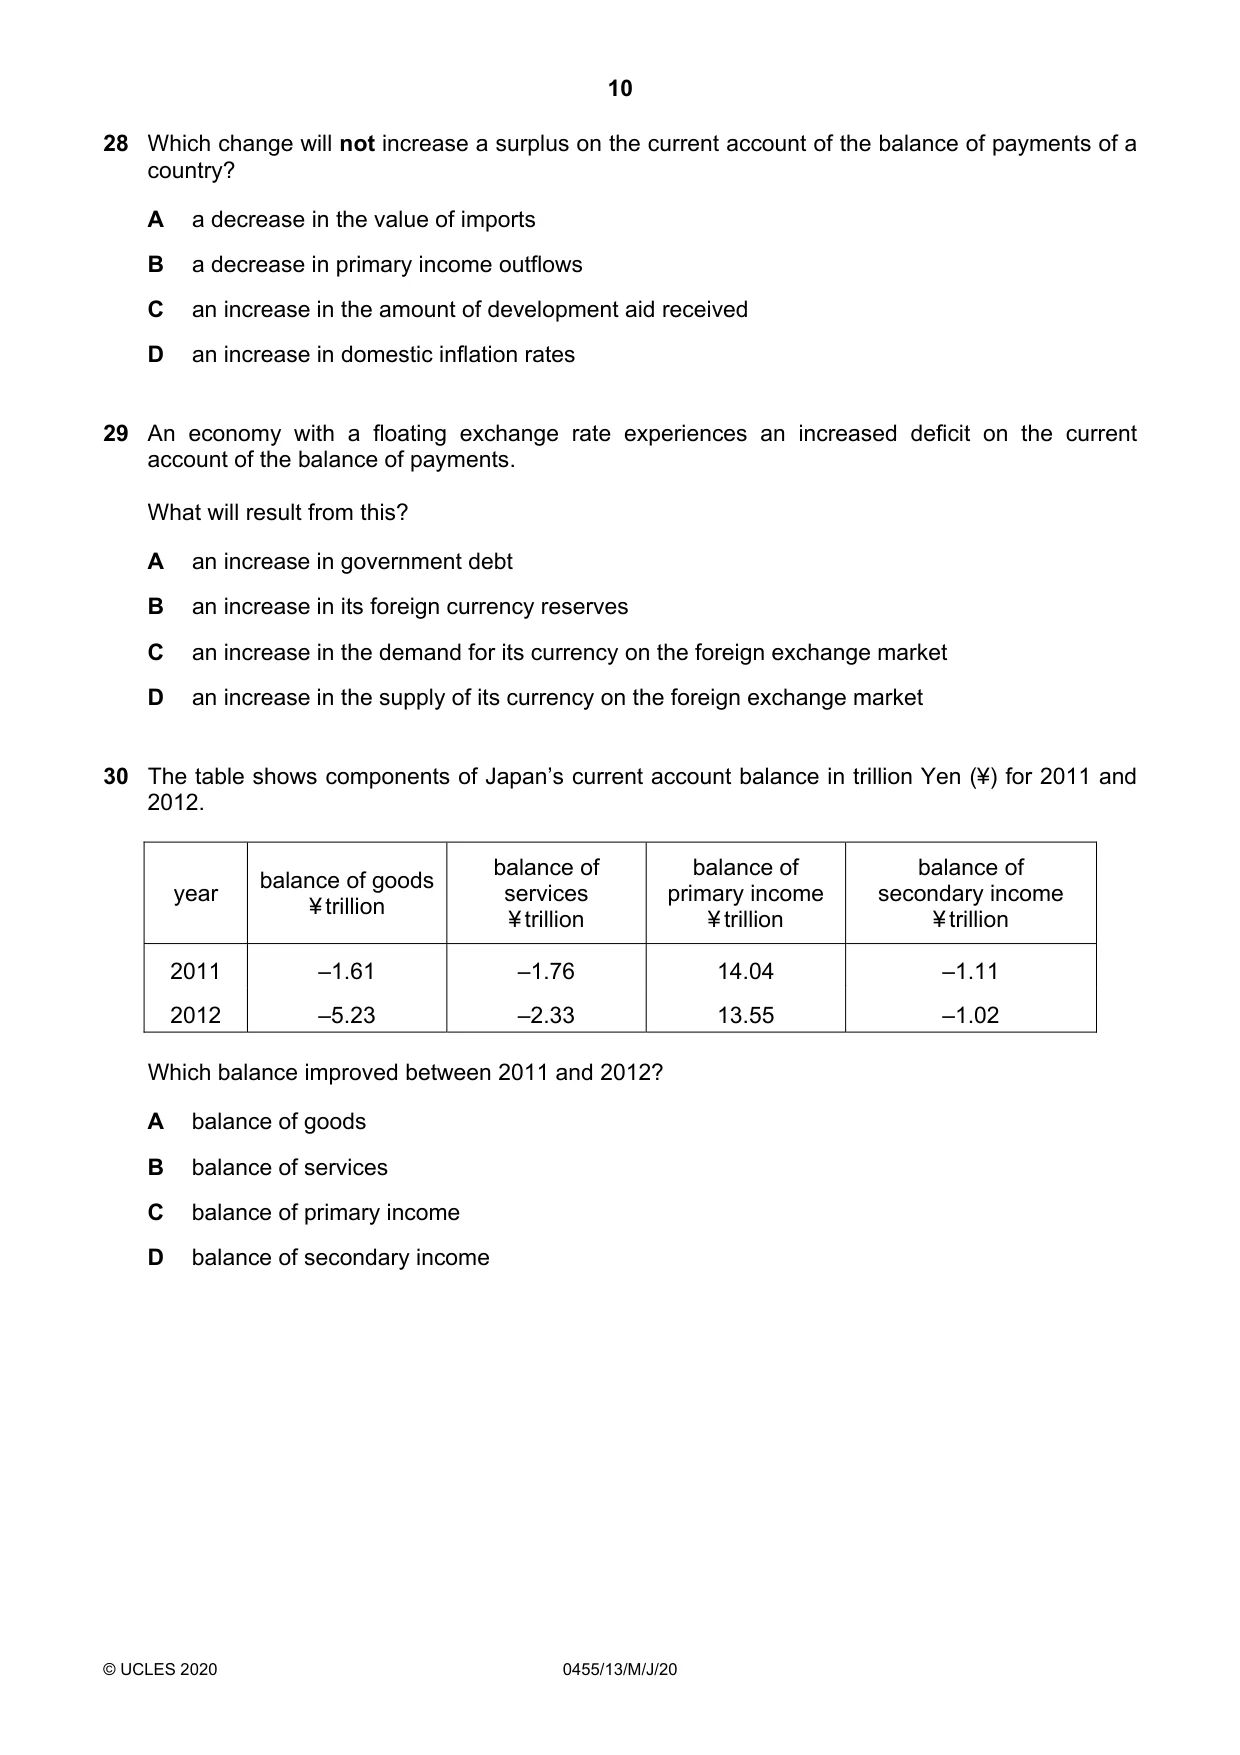
28 Which change will not increase a surplus on the current account of the balance of payments of a country? A a decrease in the value of imports B a decrease in primary income outflows C an increase in the amount of development aid received D an increase in domestic inflation rates
Mark scheme: D
Q29 · An economy with a floating exchange rate experiences an increased deficit on the current…
29 An economy with a floating exchange rate experiences an increased deficit on the current account of the balance of payments. What will result from this? A an increase in government debt B an increase in its foreign currency reserves C an increase in the demand for its currency on the foreign exchange market D an increase in the supply of its currency on the foreign exchange market
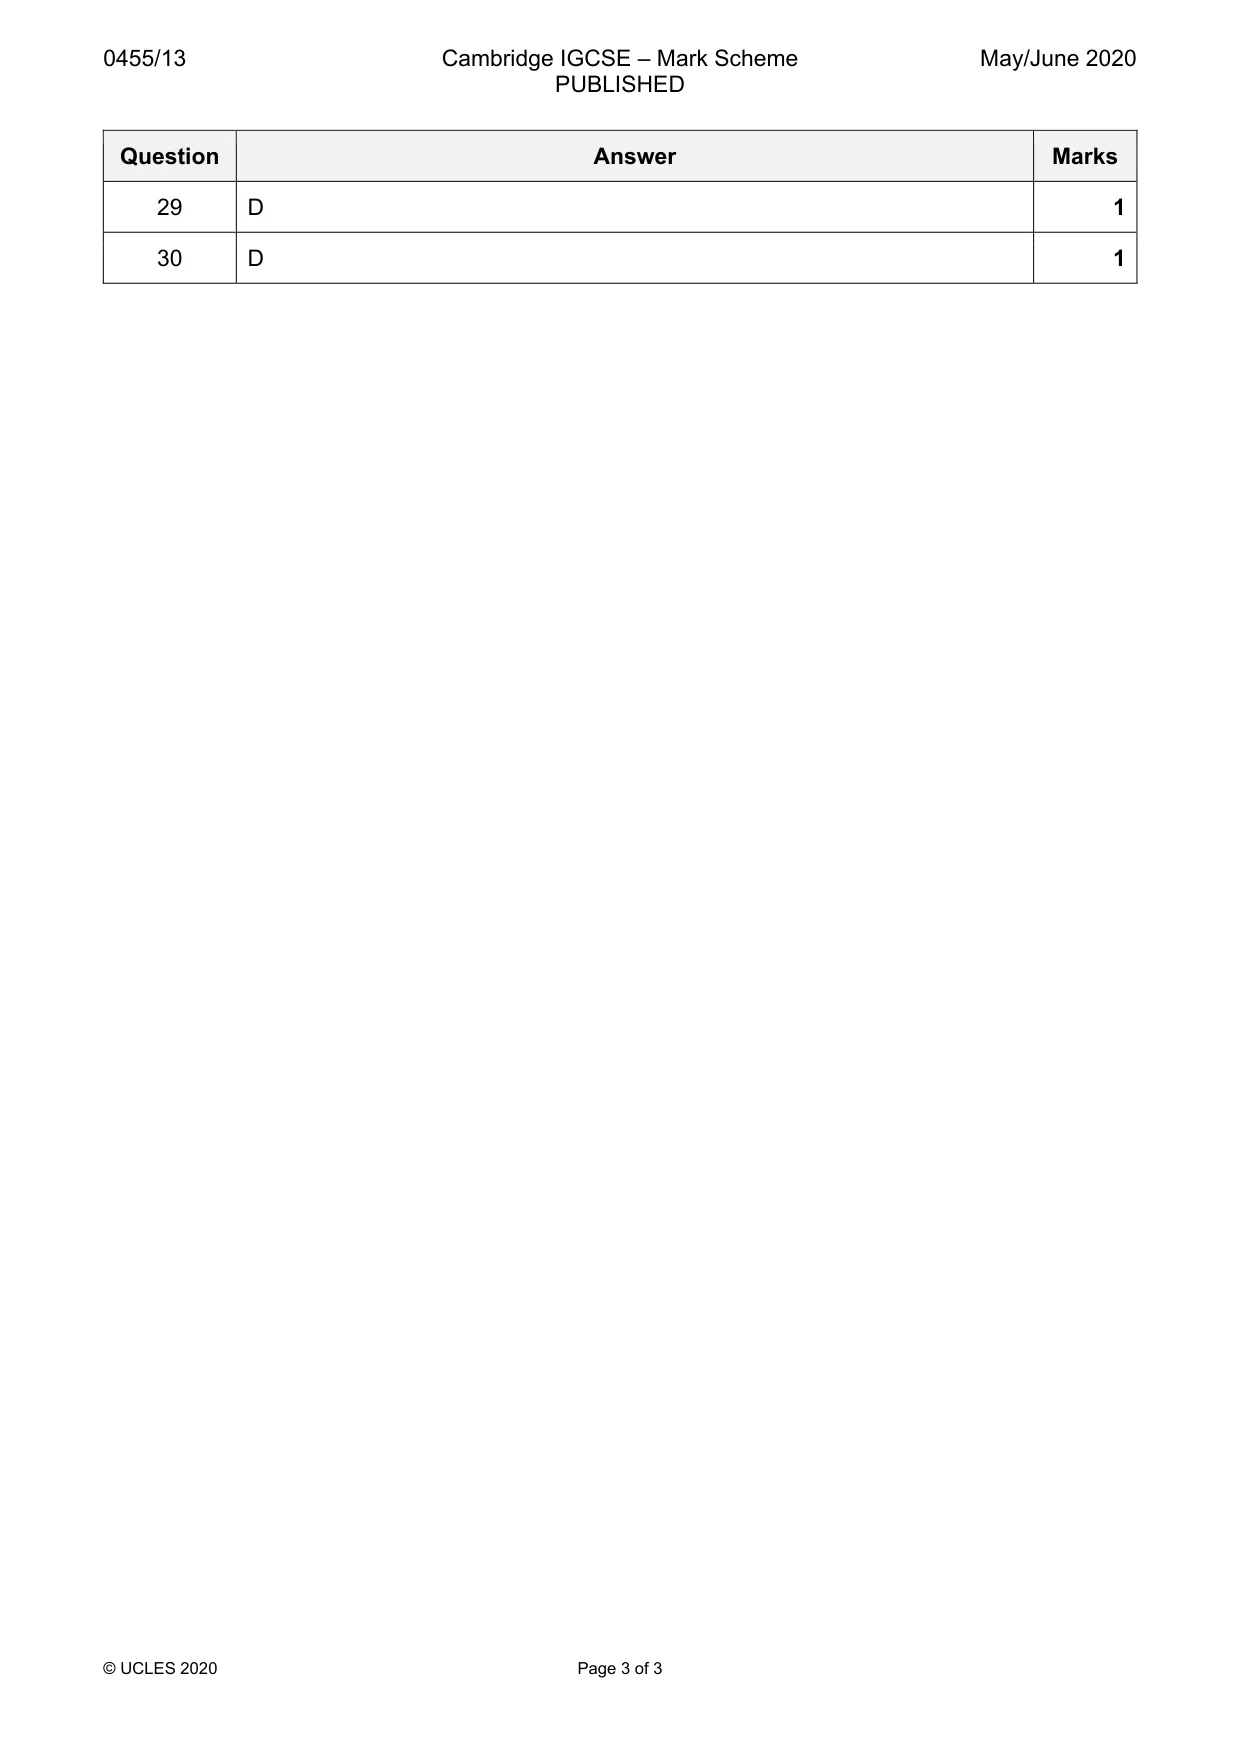
Mark scheme: D
Q30 · The table shows components of Japan’s current account balance in trillion Yen (¥) for…
30 The table shows components of Japan’s current account balance in trillion Yen (¥) for 2011 and 2012. balance of balance of balance of balance of goods year services primary income secondary income ¥ trillion ¥ trillion ¥ trillion ¥ trillion 2011 –1.61 –1.76 14.04 –1.11 2012 –5.23 –2.33 13.55 –1.02 Which balance improved between 2011 and 2012? A balance of goods B balance of services C balance of primary income D balance of secondary income
Mark scheme: D
What was in this paper
The subtopics covered by these 30 questions, and how many questions each got. Open one in a new tab to see every Cambridge question on it.
3Current account of balance of payments2Firms’ costs, revenue and objectives2Inflation and deflation2Supply-side policy2Workers2Differences in economic development between countries1Economic growth1Firms1Firms and production1Foreign exchange rates1Globalisation, free trade and protection1Living standards1Microeconomics and macroeconomics1Money and banking1Opportunity cost1Population1Price elasticity of demand (PED)1Price elasticity of supply (PES)1Production possibility curve (PPC) diagrams1Supply1The nature of the economic problem1The role of markets in allocating resources1