Cambridge IGCSE Economics 0455 — 2016 Oct/Nov Paper 1 · Variant 2
0455/12/O/N/16 · 30 questions · 30 marks · ≈34 min
The question paper and its mark scheme, free to read here and free to download. This is Cambridge’s own paper, exactly as it was sat.
Question paper12 pages

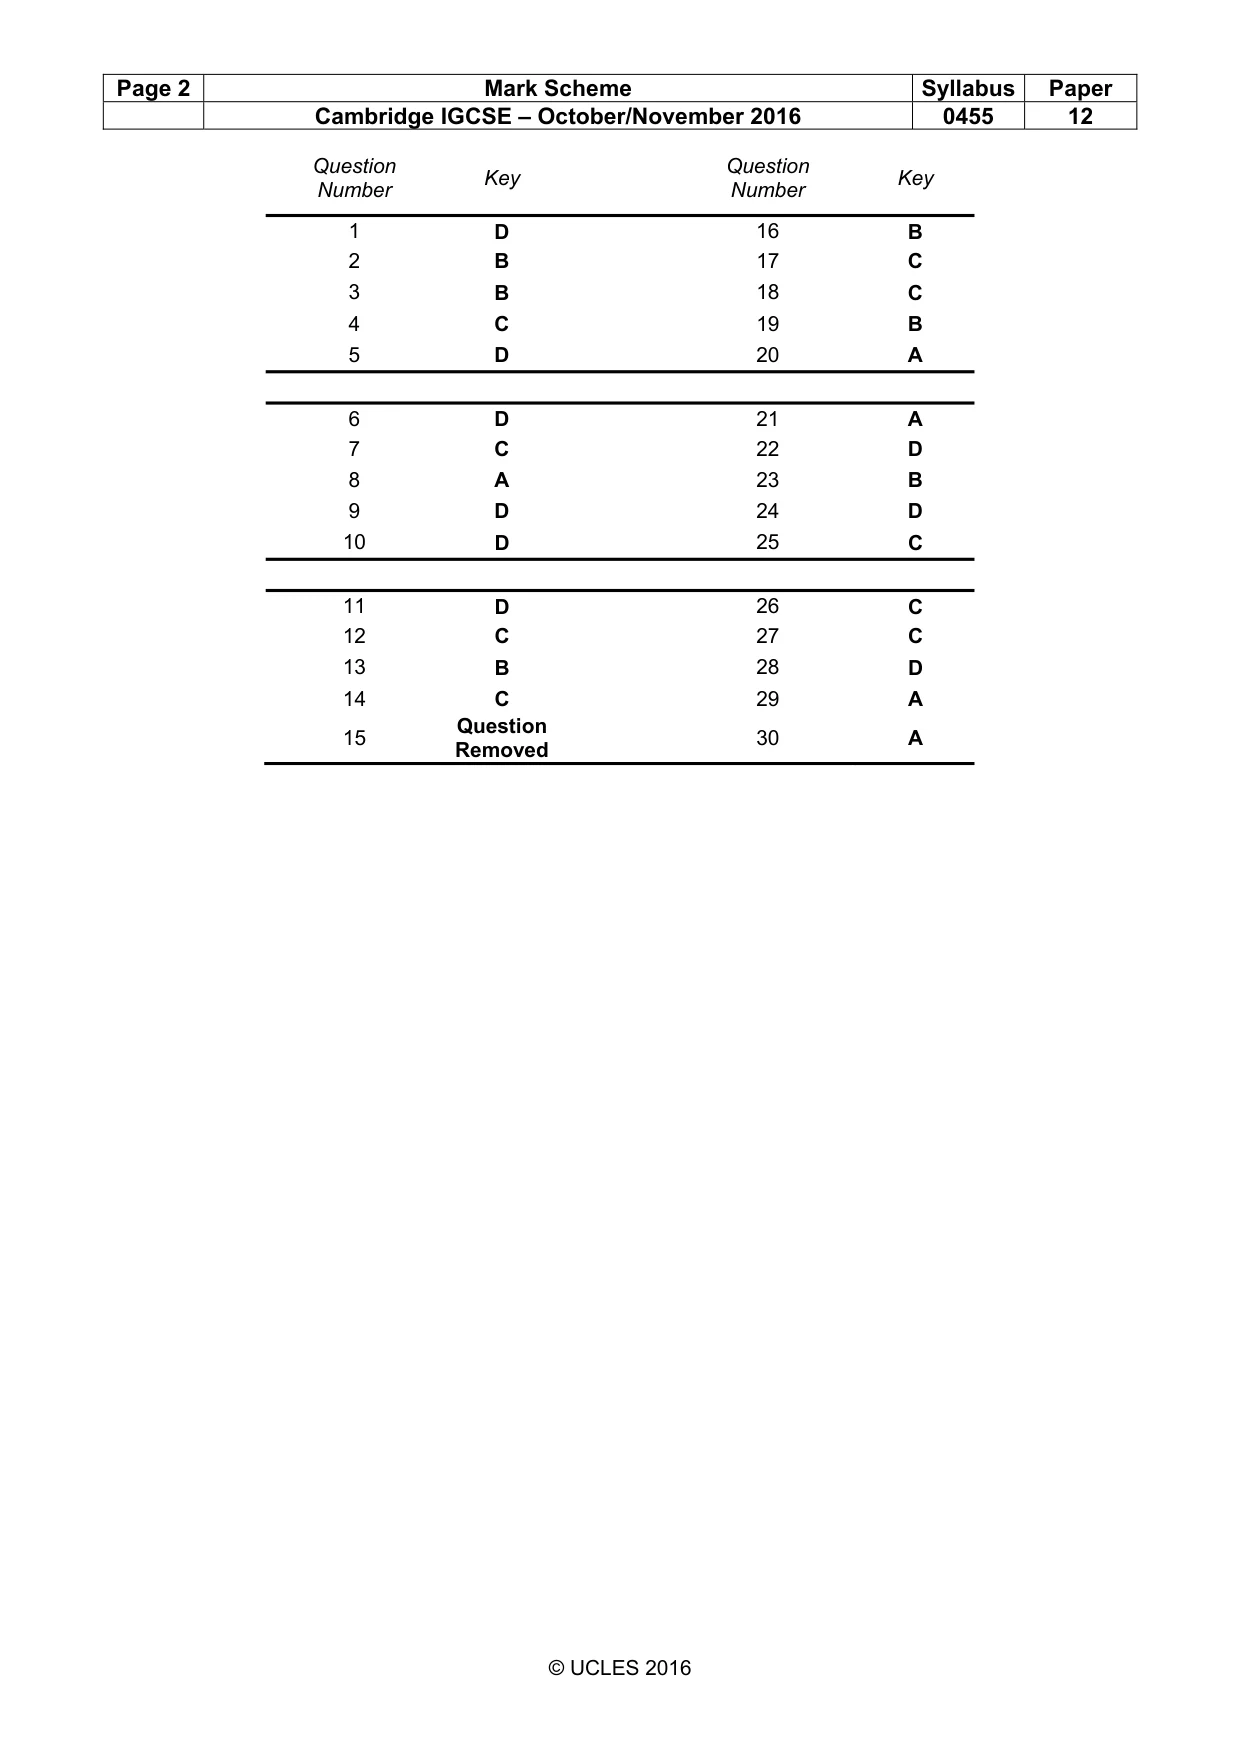
Mark scheme2 pages
Answers below. Sit the paper first if you are practising.
Questions as text
Q1 · Each factor of production earns an income
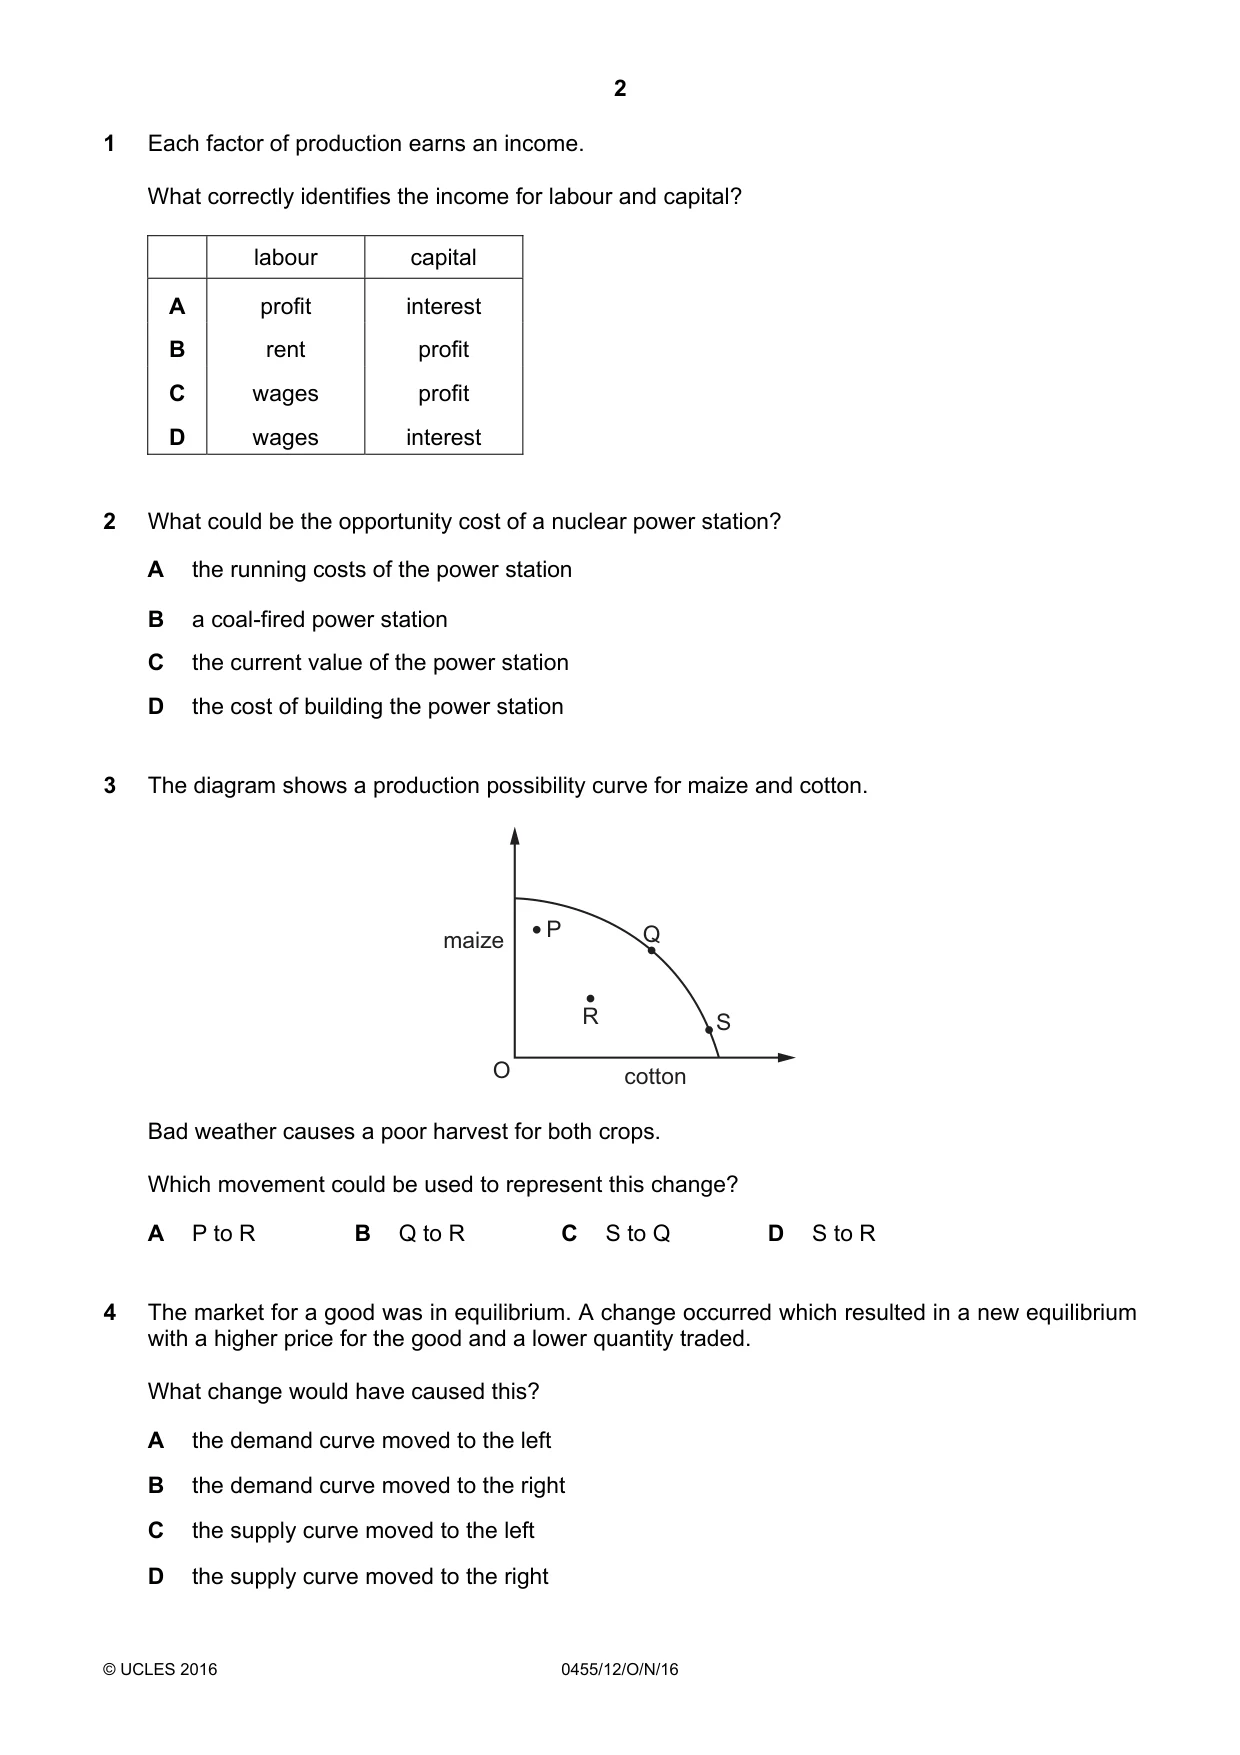
1 Each factor of production earns an income. What correctly identifies the income for labour and capital? labour capital A profit interest B rent profit C wages profit D wages interest
Q2 · What could be the opportunity cost of a nuclear power station?
2 What could be the opportunity cost of a nuclear power station? A the running costs of the power station B a coal-fired power station C the current value of the power station D the cost of building the power station
Q3 · The diagram shows a production possibility curve for maize and cotton
3 The diagram shows a production possibility curve for maize and cotton. P Q maize R S O cotton Bad weather causes a poor harvest for both crops. Which movement could be used to represent this change? A P to R B Q to R C S to Q D S to R
More questions on Production possibility curve (PPC) diagrams
Q4 · The market for a good was in equilibrium
4 The market for a good was in equilibrium. A change occurred which resulted in a new equilibrium with a higher price for the good and a lower quantity traded. What change would have caused this? A the demand curve moved to the left B the demand curve moved to the right C the supply curve moved to the left D the supply curve moved to the right
Q5 · A demand curve shows the relationship between the quantity demanded and A a change in…
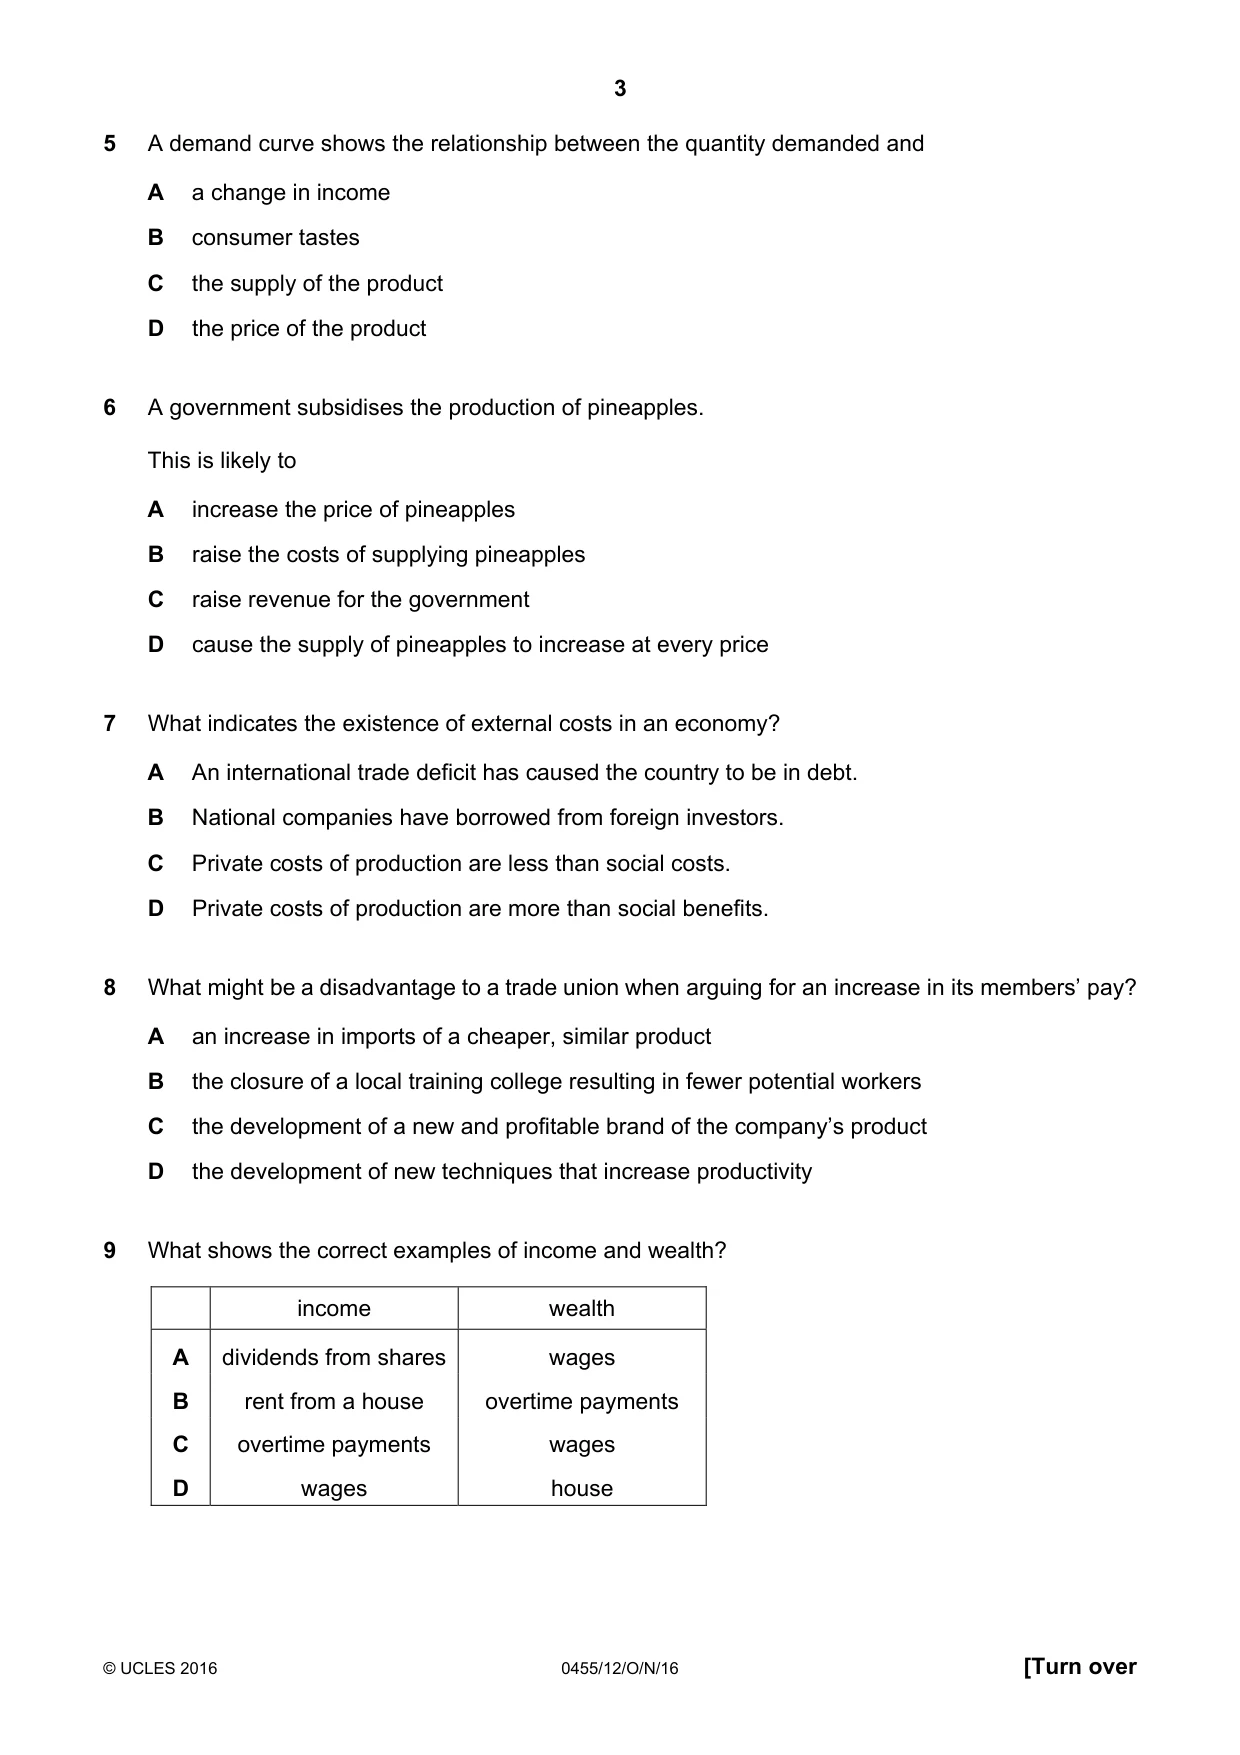
5 A demand curve shows the relationship between the quantity demanded and A a change in income B consumer tastes C the supply of the product D the price of the product
Q6 · A government subsidises the production of pineapples
6 A government subsidises the production of pineapples. This is likely to A increase the price of pineapples B raise the costs of supplying pineapples C raise revenue for the government D cause the supply of pineapples to increase at every price
Q7 · What indicates the existence of external costs in an economy?
7 What indicates the existence of external costs in an economy? A An international trade deficit has caused the country to be in debt. B National companies have borrowed from foreign investors. C Private costs of production are less than social costs. D Private costs of production are more than social benefits.
Q8 · What might be a disadvantage to a trade union when arguing for an increase in its…
8 What might be a disadvantage to a trade union when arguing for an increase in its members’ pay? A an increase in imports of a cheaper, similar product B the closure of a local training college resulting in fewer potential workers C the development of a new and profitable brand of the company’s product D the development of new techniques that increase productivity
Q9 · What shows the correct examples of income and wealth?
9 What shows the correct examples of income and wealth? income wealth A dividends from shares wages B rent from a house overtime payments C overtime payments wages D wages house
Q10 · Nazmin Uddin works in a local office as a secretary three days a week
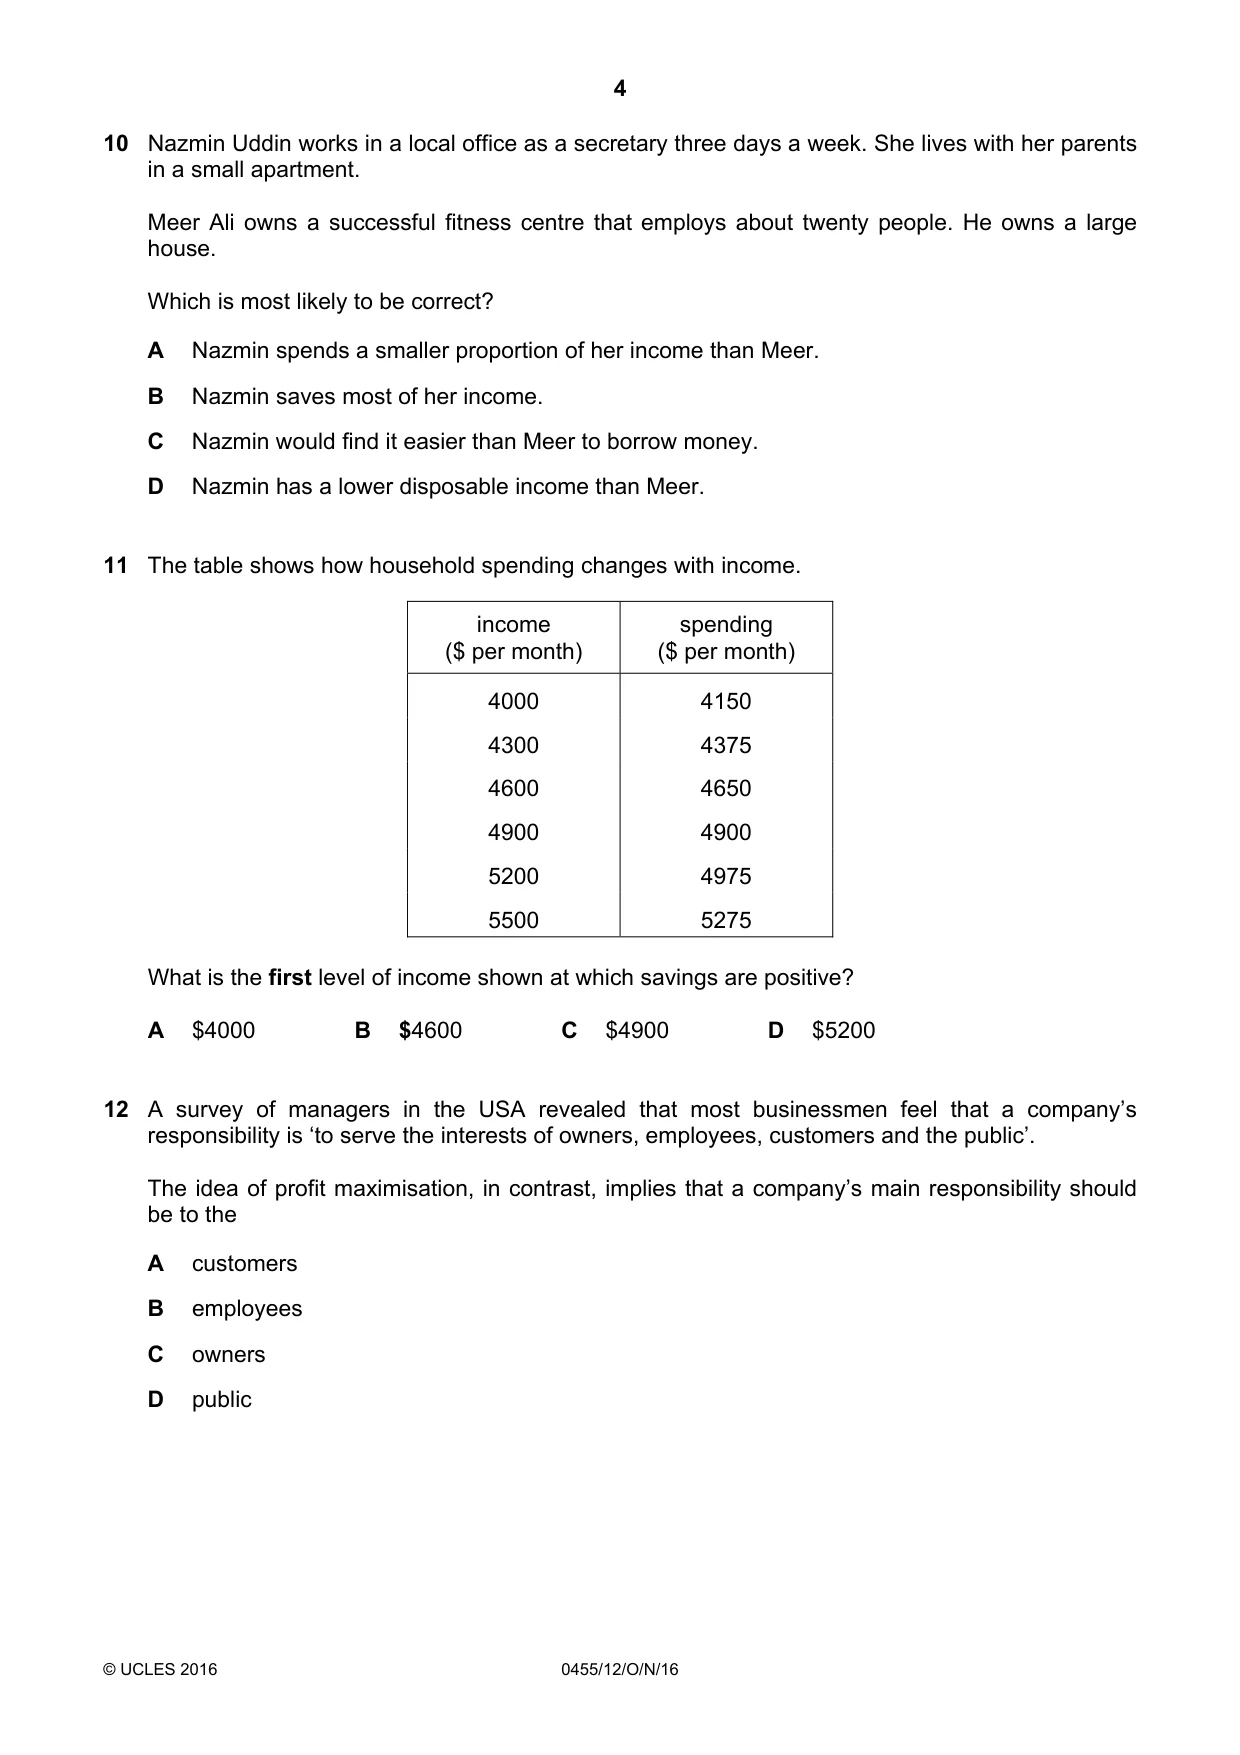
10 Nazmin Uddin works in a local office as a secretary three days a week. She lives with her parents in a small apartment. Meer Ali owns a successful fitness centre that employs about twenty people. He owns a large house. Which is most likely to be correct? A Nazmin spends a smaller proportion of her income than Meer. B Nazmin saves most of her income. C Nazmin would find it easier than Meer to borrow money. D Nazmin has a lower disposable income than Meer.
Q11 · The table shows how household spending changes with income
11 The table shows how household spending changes with income. income spending ($ per month) ($ per month) 4000 4150 4300 4375 4600 4650 4900 4900 5200 4975 5500 5275 What is the first level of income shown at which savings are positive? A $4000 B $4600 C $4900 D $5200
Q12 · A survey of managers in the USA revealed that most businessmen feel that a company’s…
12 A survey of managers in the USA revealed that most businessmen feel that a company’s responsibility is ‘to serve the interests of owners, employees, customers and the public’. The idea of profit maximisation, in contrast, implies that a company’s main responsibility should be to the A customers B employees C owners D public
Q13 · Some agricultural co-operatives have changed from labour-intensive to capital-intensive…
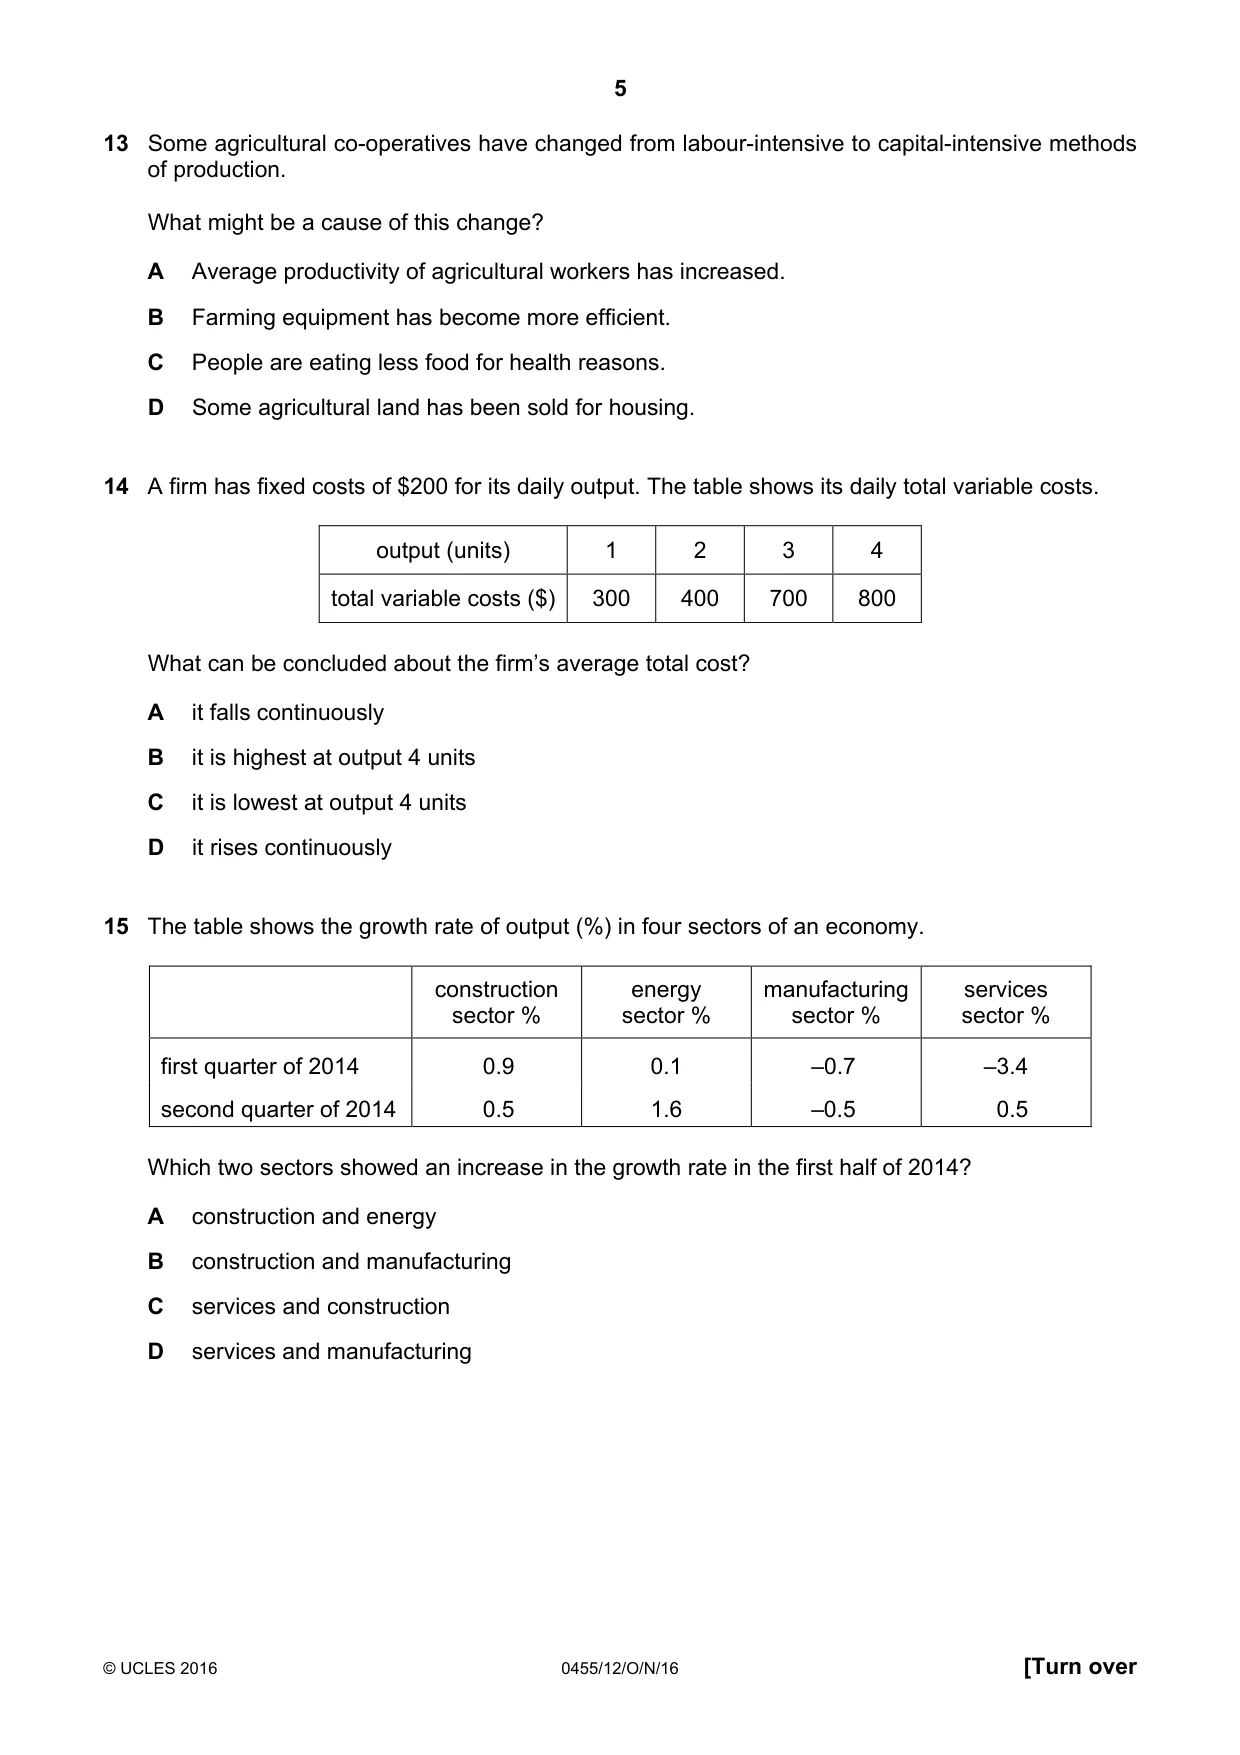
13 Some agricultural co-operatives have changed from labour-intensive to capital-intensive methods of production. What might be a cause of this change? A Average productivity of agricultural workers has increased. B Farming equipment has become more efficient. C People are eating less food for health reasons. D Some agricultural land has been sold for housing.
Q14 · A firm has fixed costs of $200 for its daily output
14 A firm has fixed costs of $200 for its daily output. The table shows its daily total variable costs. output (units) 1 2 3 4 total variable costs ($) 300 400 700 800 What can be concluded about the firm’s average total cost? A it falls continuously B it is highest at output 4 units C it is lowest at output 4 units D it rises continuously
Q15 · The table shows the growth rate of output (%) in four sectors of an economy
15 The table shows the growth rate of output (%) in four sectors of an economy. construction energy manufacturing services sector % sector % sector % sector % first quarter of 2014 0.9 0.1 –0.7 –3.4 second quarter of 2014 0.5 1.6 –0.5 0.5 Which two sectors showed an increase in the growth rate in the first half of 2014? A construction and energy B construction and manufacturing C services and construction D services and manufacturing
Q16 · A government decides to sell the monopoly supply of gas to households to a private firm
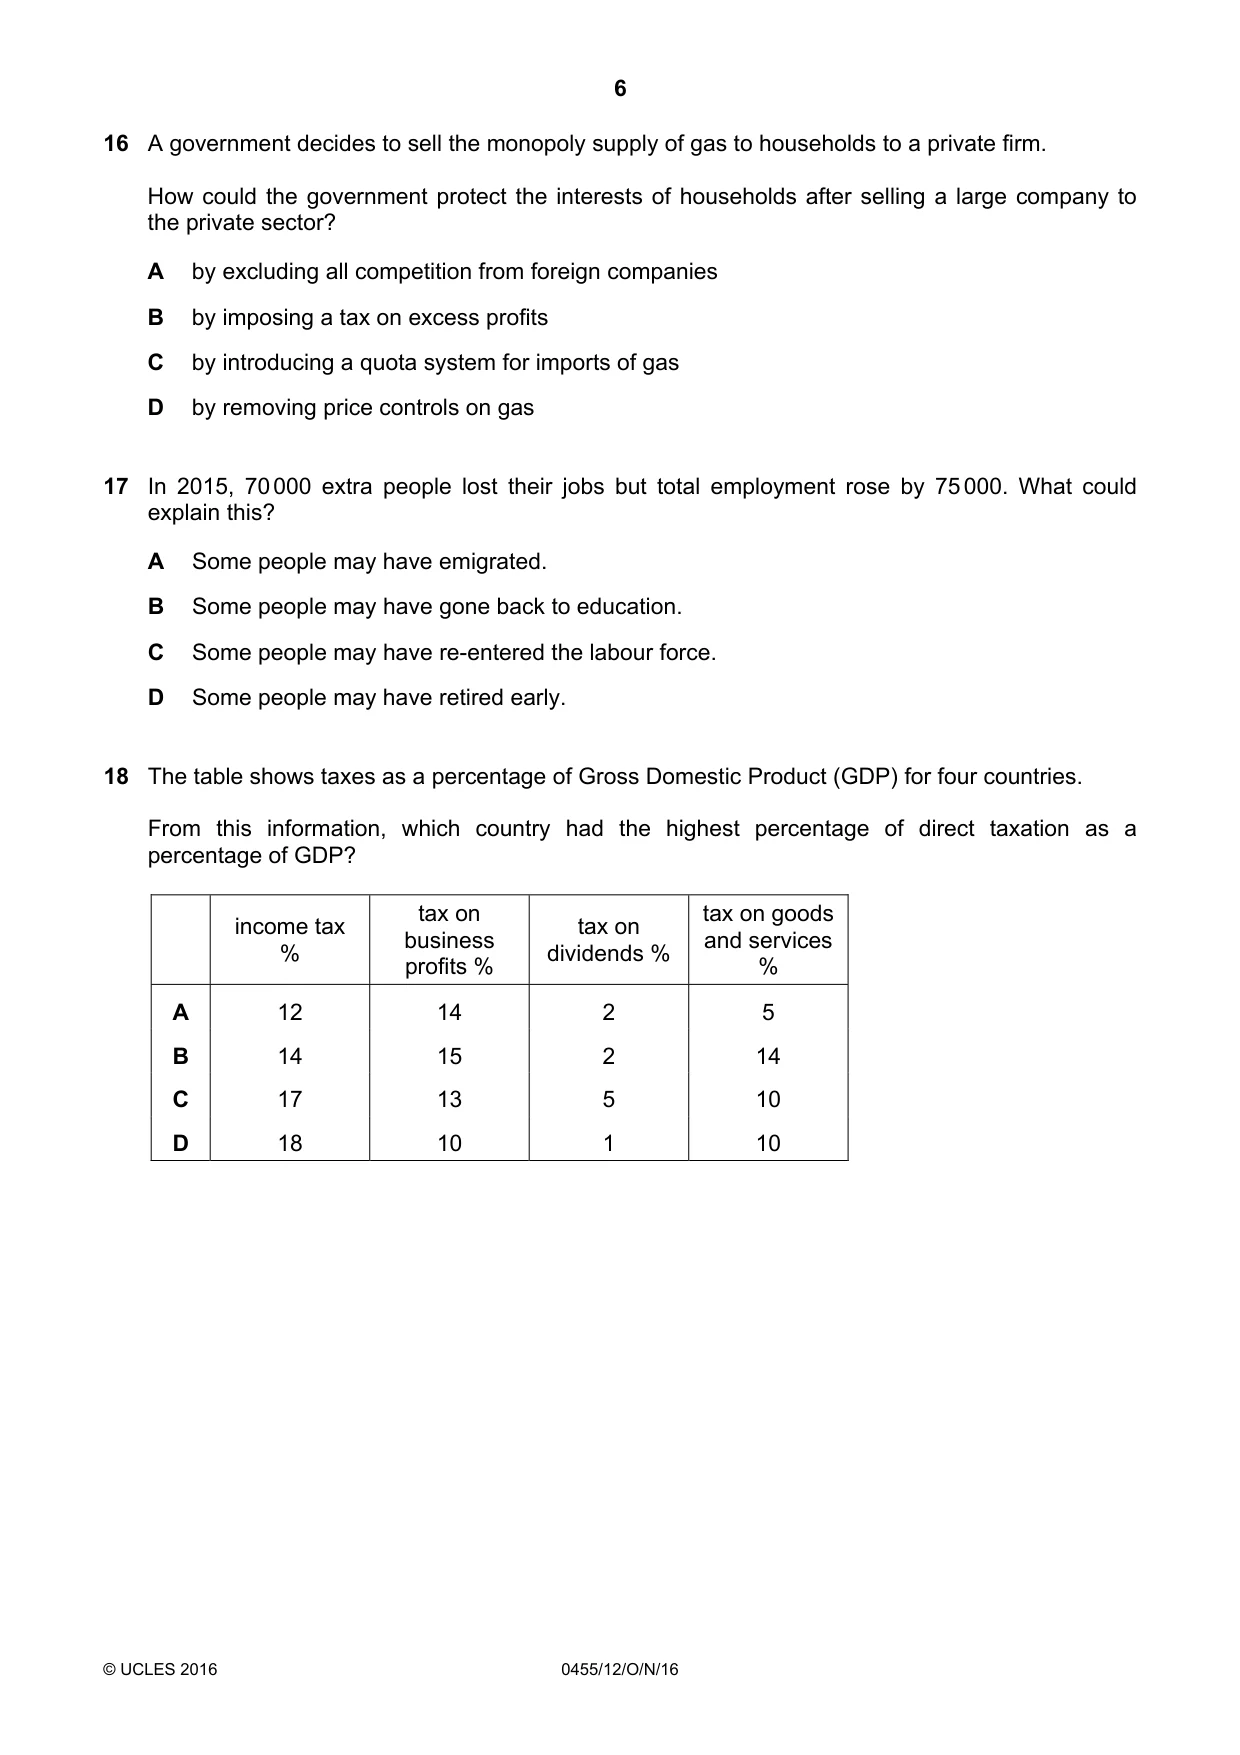
16 A government decides to sell the monopoly supply of gas to households to a private firm. How could the government protect the interests of households after selling a large company to the private sector? A by excluding all competition from foreign companies B by imposing a tax on excess profits C by introducing a quota system for imports of gas D by removing price controls on gas
Q17 · In 2015, 70 000 extra people lost their jobs but total employment rose by 75 000
17 In 2015, 70 000 extra people lost their jobs but total employment rose by 75 000. What could explain this? A Some people may have emigrated. B Some people may have gone back to education. C Some people may have re-entered the labour force. D Some people may have retired early.
Q18 · The table shows taxes as a percentage of Gross Domestic Product (GDP) for four countries
18 The table shows taxes as a percentage of Gross Domestic Product (GDP) for four countries. From this information, which country had the highest percentage of direct taxation as a percentage of GDP? tax on tax on goods income tax tax on business and services % dividends % profits % % A 12 14 2 5 B 14 15 2 14 C 17 13 5 10 D 18 10 1 10
Q19 · A government gives farmers a subsidy of $5 per kilo to supply food on the open market…
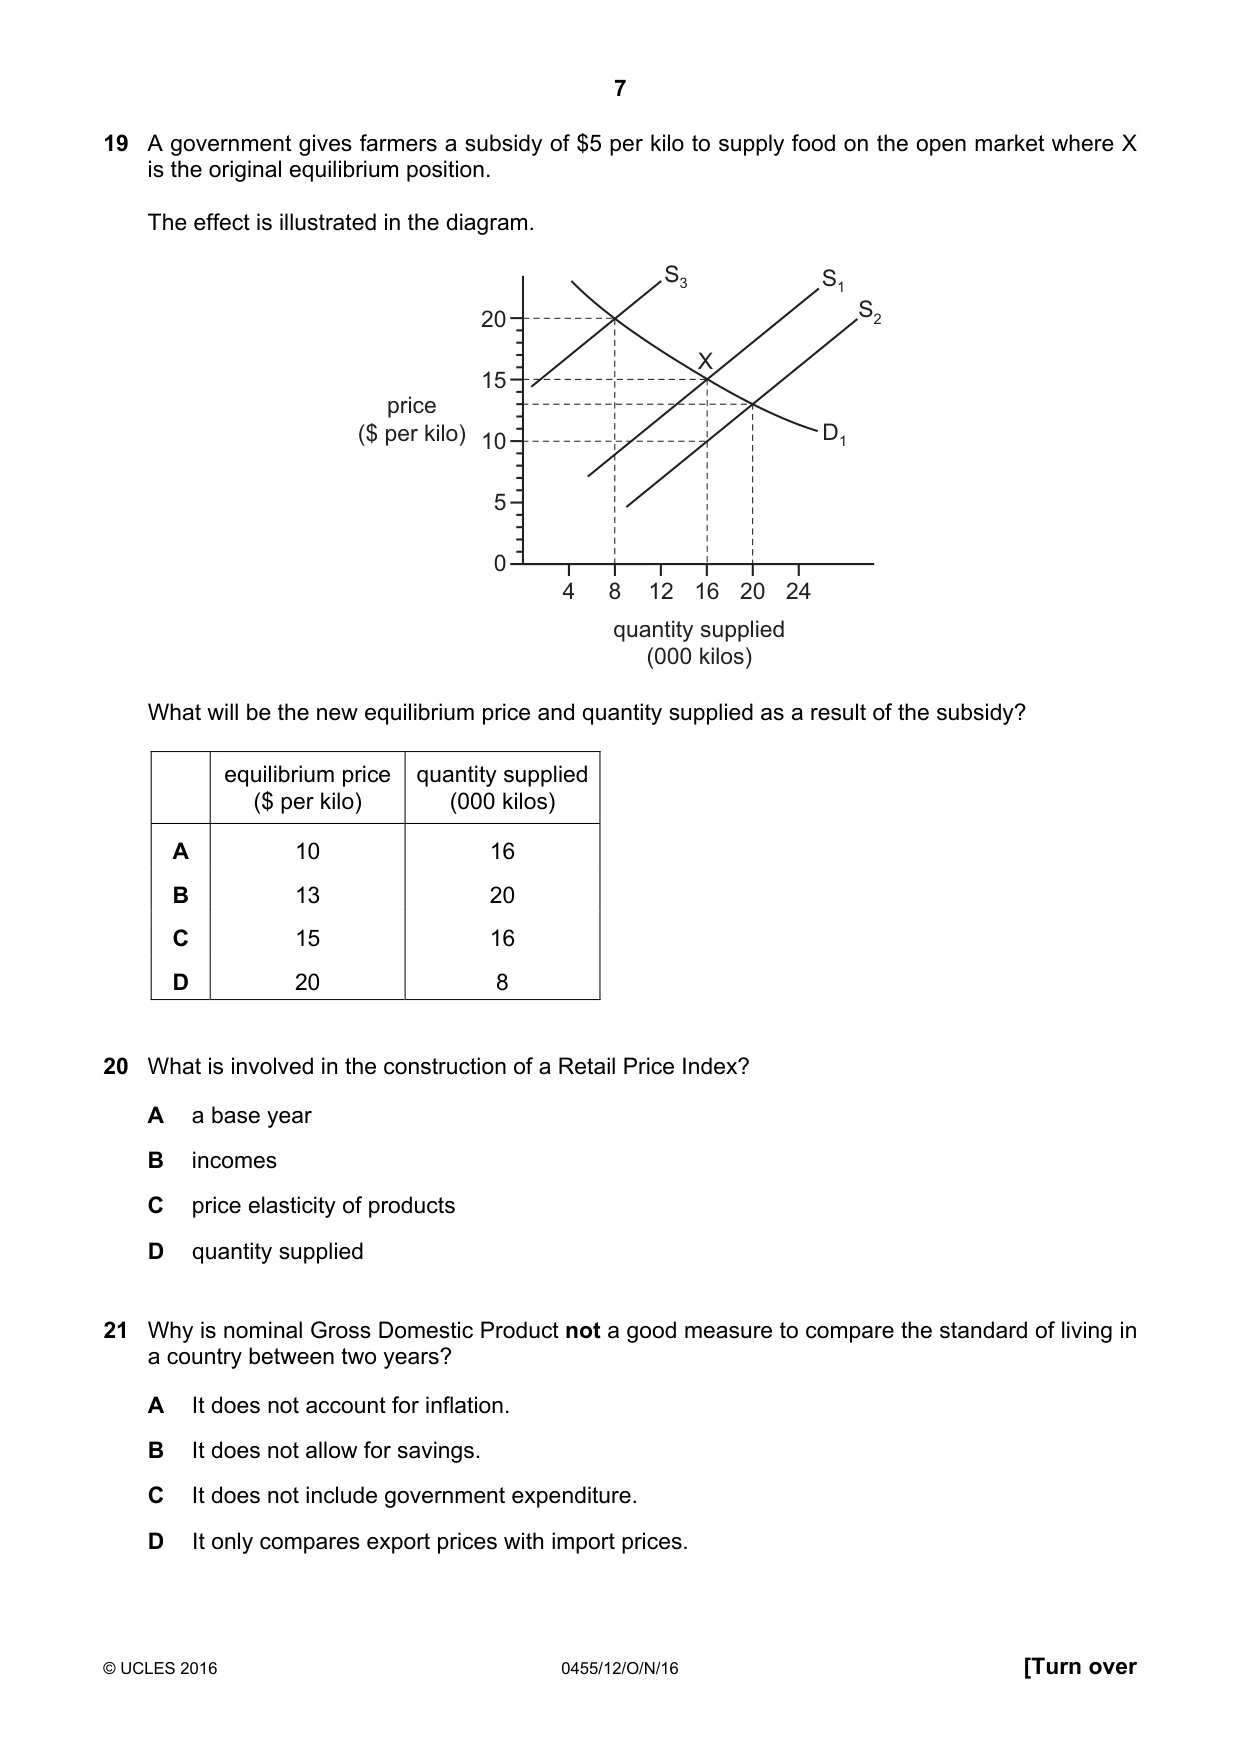
19 A government gives farmers a subsidy of $5 per kilo to supply food on the open market where X is the original equilibrium position. The effect is illustrated in the diagram. S3 S1 20 S2 X 15 price ($ per kilo) 10 D1 5 0 4 8 12 16 20 24 quantity supplied (000 kilos) What will be the new equilibrium price and quantity supplied as a result of the subsidy? equilibrium price quantity supplied ($ per kilo) (000 kilos) A 10 16 B 13 20 C 15 16 D 20 8
Q20 · What is involved in the construction of a Retail Price Index?
20 What is involved in the construction of a Retail Price Index? A a base year B incomes C price elasticity of products D quantity supplied
Q21 · Why is nominal Gross Domestic Product not a good measure to compare the standard of…
21 Why is nominal Gross Domestic Product not a good measure to compare the standard of living in a country between two years? A It does not account for inflation. B It does not allow for savings. C It does not include government expenditure. D It only compares export prices with import prices.
Q22 · In 2010 there was an increase in net emigration from Ireland
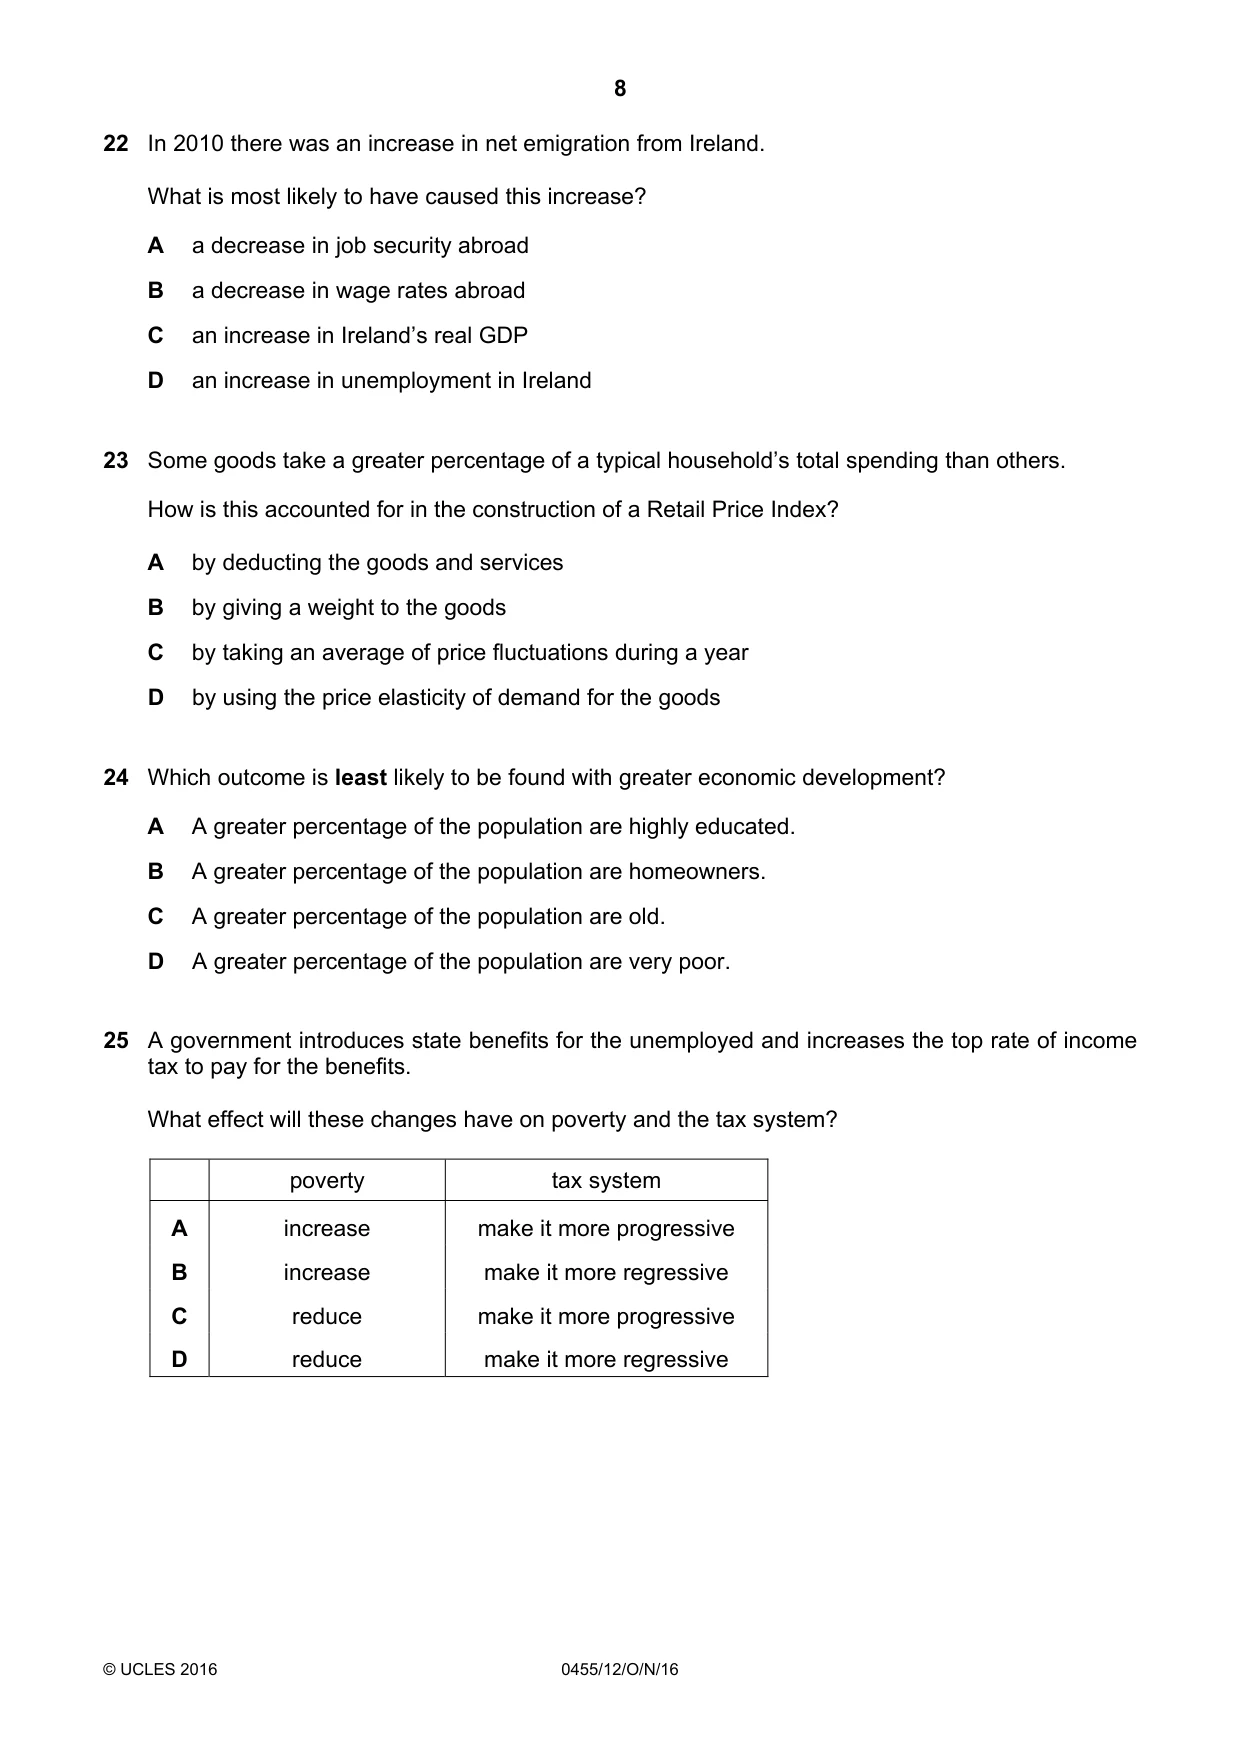
22 In 2010 there was an increase in net emigration from Ireland. What is most likely to have caused this increase? A a decrease in job security abroad B a decrease in wage rates abroad C an increase in Ireland’s real GDP D an increase in unemployment in Ireland
Q23 · Some goods take a greater percentage of a typical household’s total spending than others
23 Some goods take a greater percentage of a typical household’s total spending than others. How is this accounted for in the construction of a Retail Price Index? A by deducting the goods and services B by giving a weight to the goods C by taking an average of price fluctuations during a year D by using the price elasticity of demand for the goods
Q24 · Which outcome is least likely to be found with greater economic development?
24 Which outcome is least likely to be found with greater economic development? A A greater percentage of the population are highly educated. B A greater percentage of the population are homeowners. C A greater percentage of the population are old. D A greater percentage of the population are very poor.
More questions on Differences in economic development between countries
Q25 · A government introduces state benefits for the unemployed and increases the top rate of…
25 A government introduces state benefits for the unemployed and increases the top rate of income tax to pay for the benefits. What effect will these changes have on poverty and the tax system? poverty tax system A increase make it more progressive B increase make it more regressive C reduce make it more progressive D reduce make it more regressive
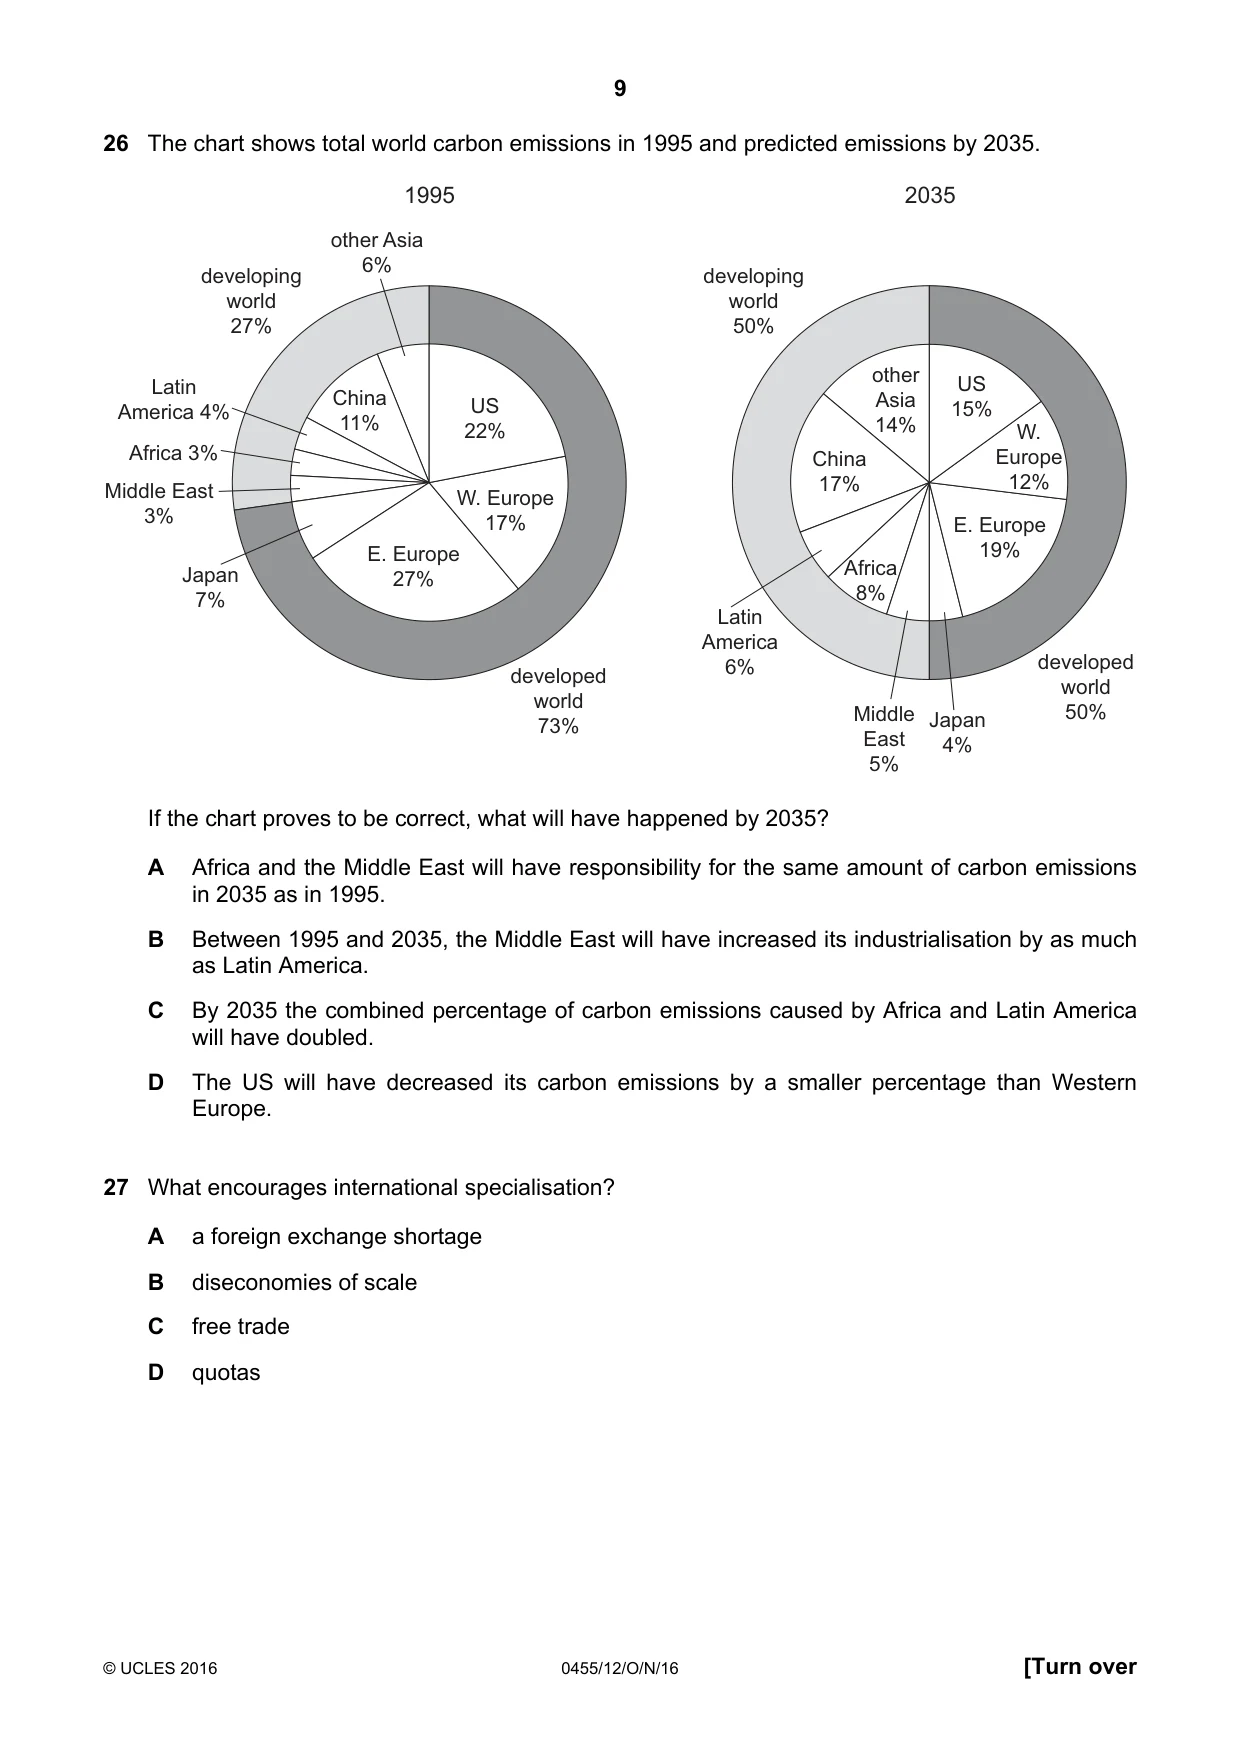
Q26 · The chart shows total world carbon emissions in 1995 and predicted emissions by 2035
26 The chart shows total world carbon emissions in 1995 and predicted emissions by 2035. 1995 2035 other Asia 6% developing developing world world 27% 50% other US Latin China US Asia America 4% 15% 11% 22% 14% W. Africa 3% China Europe Middle East 17% 12% W. Europe 3% 17% E. Europe E. Europe 19% Japan Africa 27% 7% 8% Latin America 6% developed developed world world 50% Middle Japan 73% East 4% 5% If the chart proves to be correct, what will have happened by 2035? A Africa and the Middle East will have responsibility for the same amount of carbon emissions in 2035 as in 1995. B Between 1995 and 2035, the Middle East will have increased its industrialisation by as much as Latin America. C By 2035 the combined percentage of carbon emissions caused by Africa and Latin America will have doubled. D The US will have decreased its carbon emissions by a smaller percentage than Western Europe.
More questions on Differences in economic development between countries
Q27 · What encourages international specialisation?
27 What encourages international specialisation? A a foreign exchange shortage B diseconomies of scale C free trade D quotas
Q28 · A Japanese car manufacturer decided to produce its cars in a factory in Europe
28 A Japanese car manufacturer decided to produce its cars in a factory in Europe. What would not be a reason why they might have chosen to do this? A cheaper wage costs in Europe B the availability of raw materials C to gain external economies from skilled labour in Europe D to increase Japanese self-sufficiency
Q29 · A government removed the quota on goods imported into the country
29 A government removed the quota on goods imported into the country. What is the most likely result of this? A a decrease in demand for domestic production B a decrease in domestic unemployment C a decrease in exports D a decrease in the balance of trade deficit
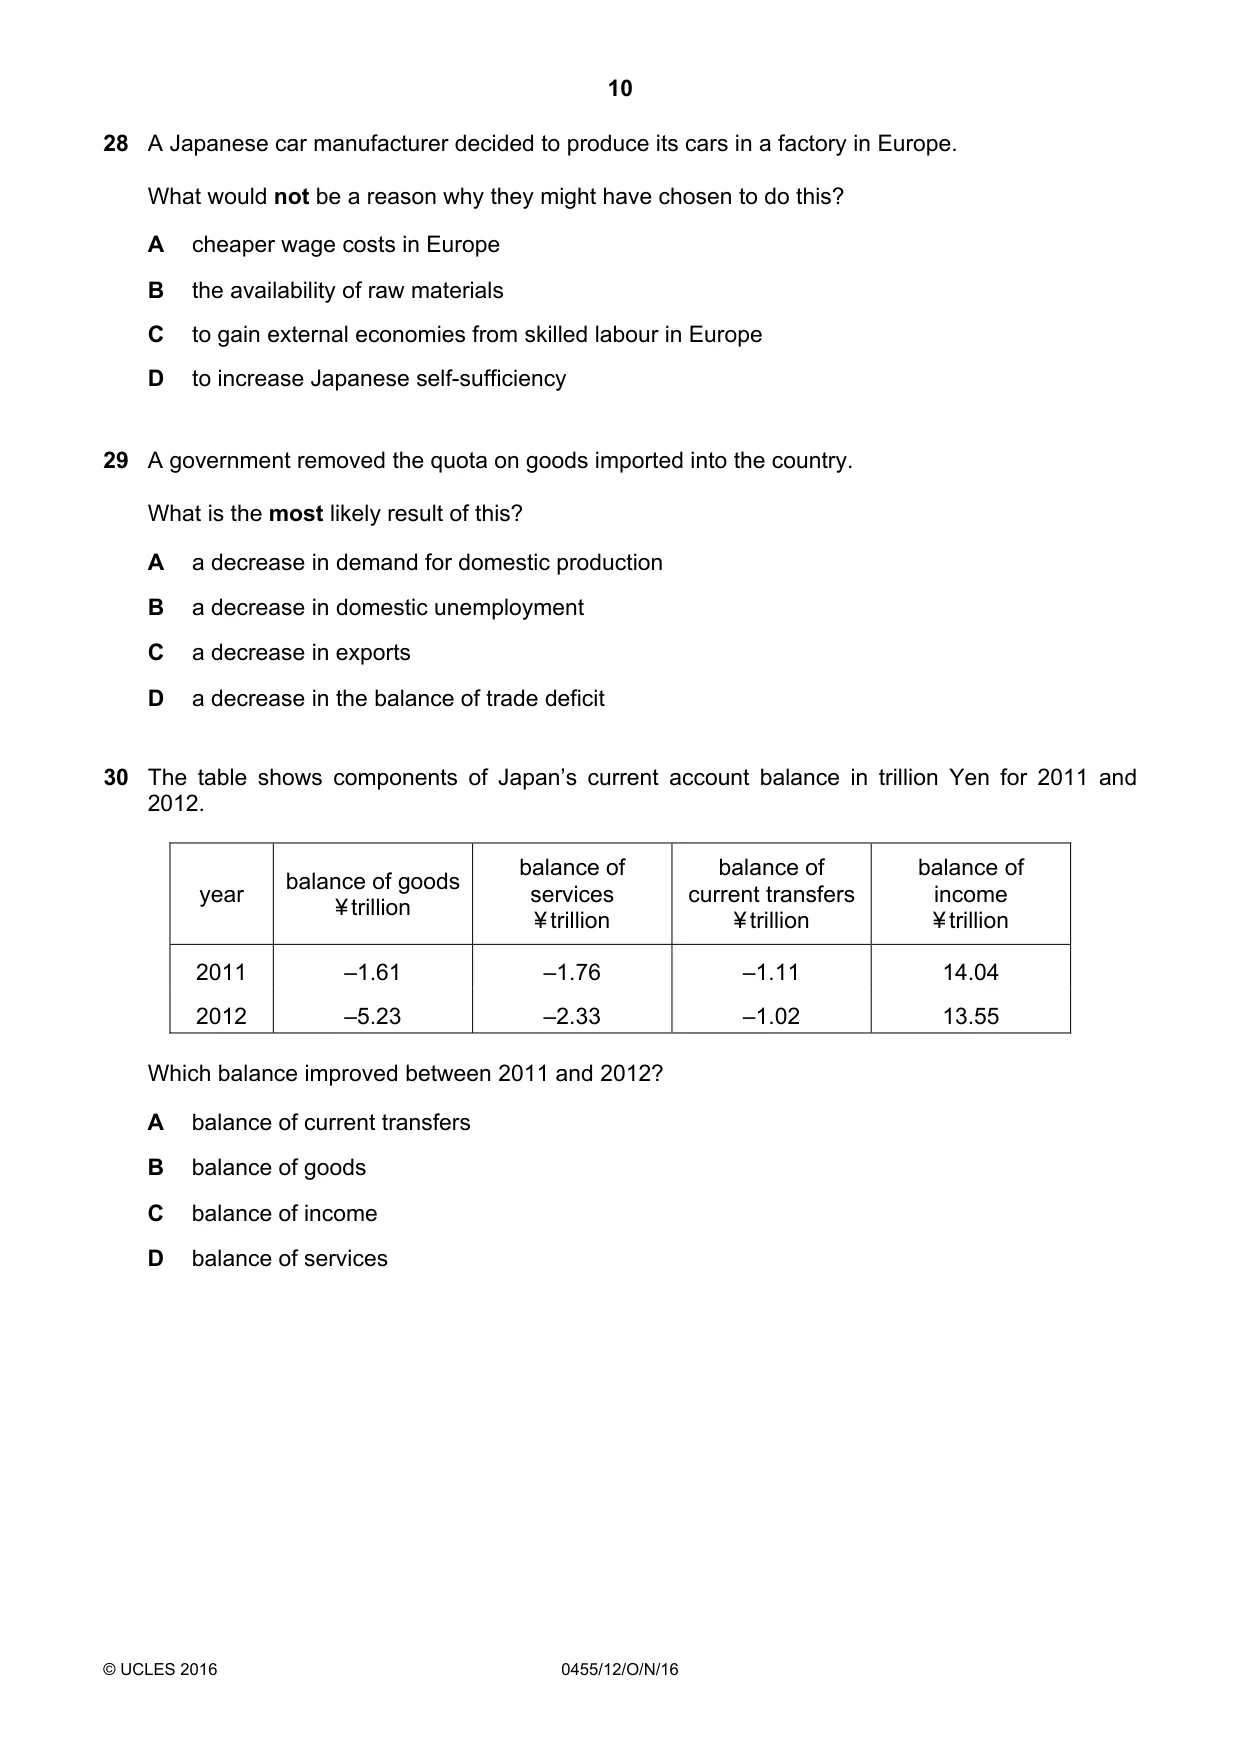
Q30 · The table shows components of Japan’s current account balance in trillion Yen for 2011…
30 The table shows components of Japan’s current account balance in trillion Yen for 2011 and 2012. balance of balance of balance of balance of goods year services current transfers income ¥ trillion ¥ trillion ¥ trillion ¥ trillion 2011 –1.61 –1.76 –1.11 14.04 2012 –5.23 –2.33 –1.02 13.55 Which balance improved between 2011 and 2012? A balance of current transfers B balance of goods C balance of income D balance of services
What was in this paper
The subtopics covered by these 30 questions, and how many questions each got. Open one in a new tab to see every Cambridge question on it.
3Differences in economic development between countries2Firms’ costs, revenue and objectives2Inflation and deflation2Market failure2Supply2Current account of balance of payments1Demand1Economic growth1Employment and unemployment1Firms1Firms and production1Fiscal policy1Globalisation, free trade and protection1International specialisation1Living standards1Opportunity cost1Population1Poverty1Price determination1Production possibility curve (PPC) diagrams1The factors of production1Trade unions1What you needed in this session
Cambridge’s own grade thresholds for 2016 Oct/Nov, Paper 1 · Variant 2. A higher threshold means an easier paper — the bar moves with how the cohort did.