Cambridge IGCSE Economics 0455 — 2021 May/June Paper 1 · Variant 1
0455/11/M/J/21 · 30 questions · 30 marks · ≈34 min
The question paper and its mark scheme, free to read here and free to download. This is Cambridge’s own paper, exactly as it was sat.
Question paper12 pages




Mark scheme3 pages
Answers below. Sit the paper first if you are practising.

Questions as text
Q1 · Which statement about the factors of production is correct?
1 Which statement about the factors of production is correct? A Capital is a financial resource and includes savings in banks. B Enterprise is limited in supply and includes office workers. C Labour is a human resource and includes pensioners and children. D Land is a natural resource and includes trees and fish.
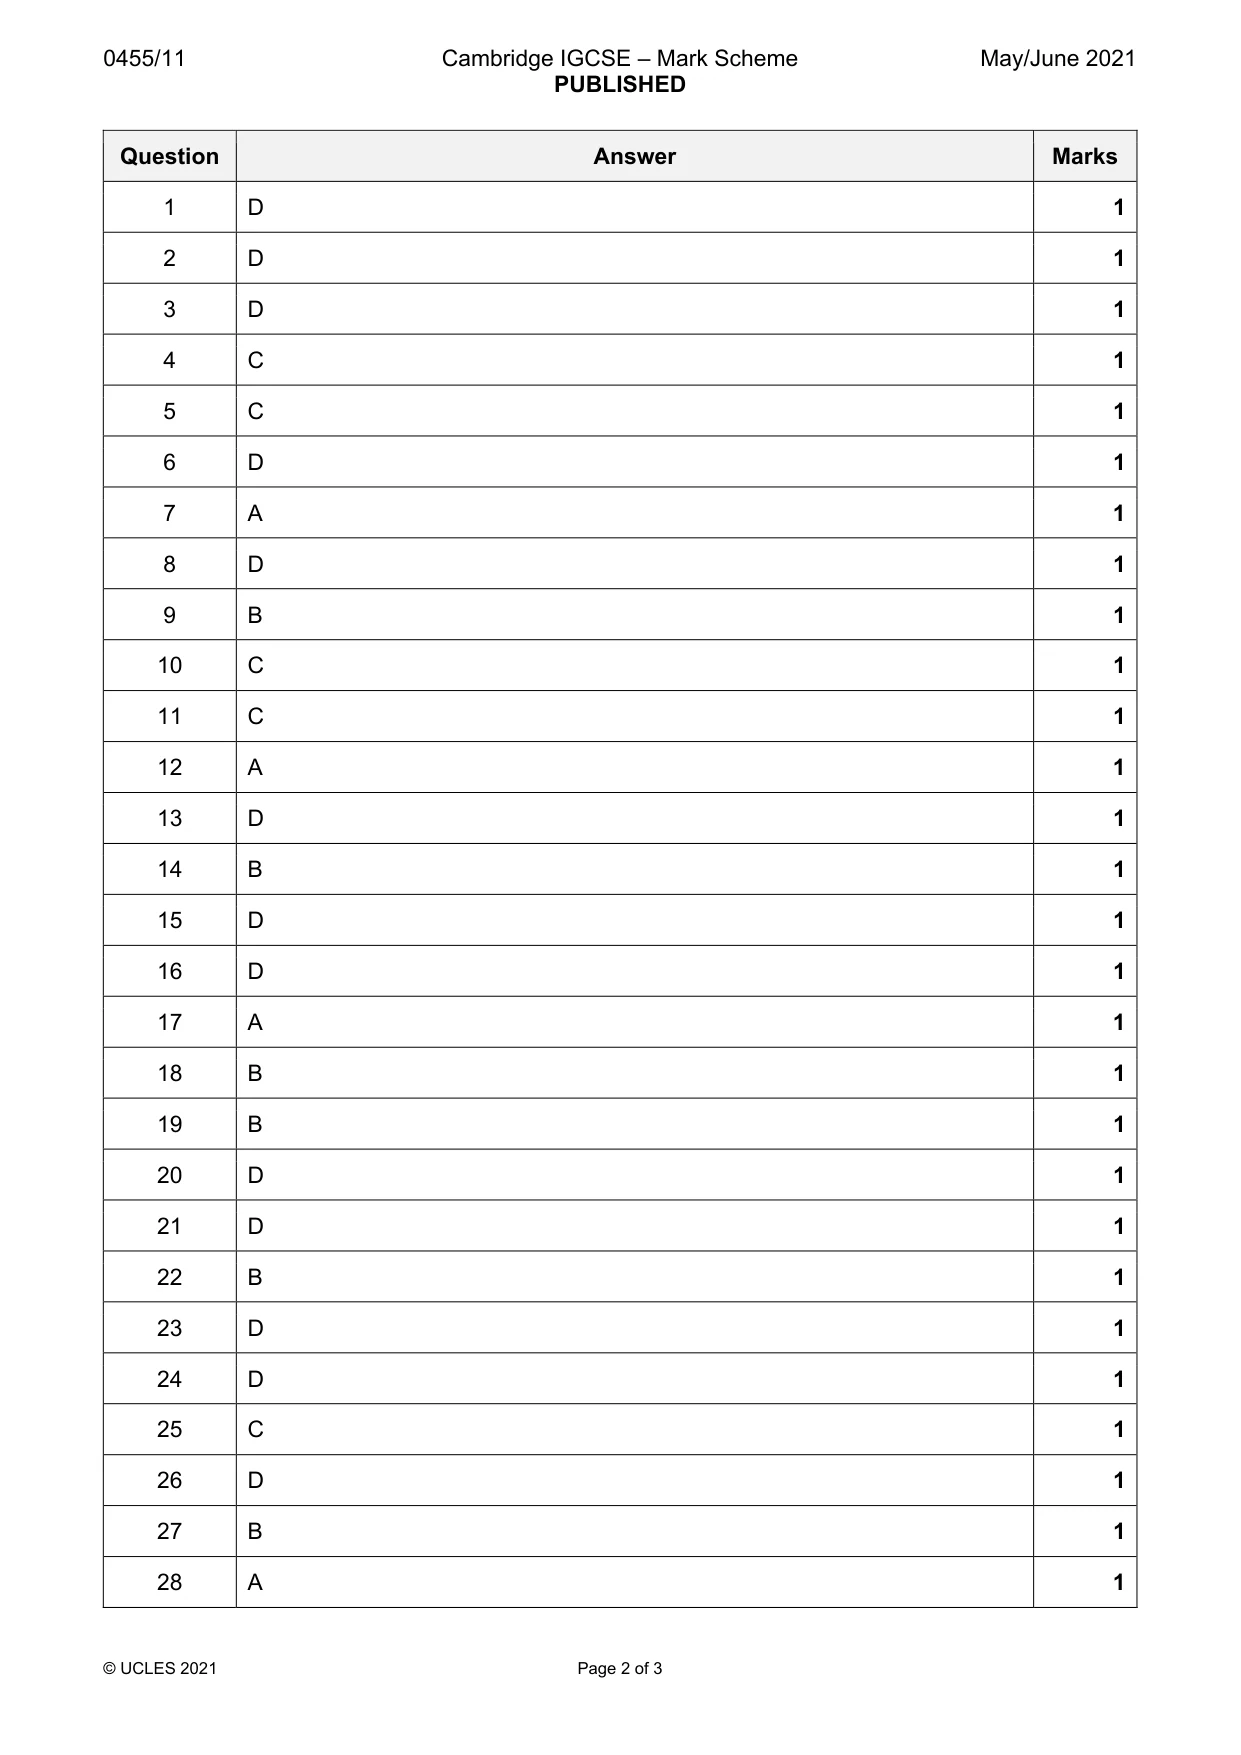
Mark scheme: D
Q2 · A builder spends one hour travelling to and from work
2 A builder spends one hour travelling to and from work. He works 40 hours per week for $200. He is given a choice to work 50 hours a week for an extra $75. What would be the opportunity cost to the builder of working the extra hours? A the ability to increase his purchasing power B the additional time travelling to and from work C the increased hourly earnings of $7.50 D the ten hours of leisure time
Mark scheme: D
Q3 · A country’s infrastructure was damaged by a natural disaster
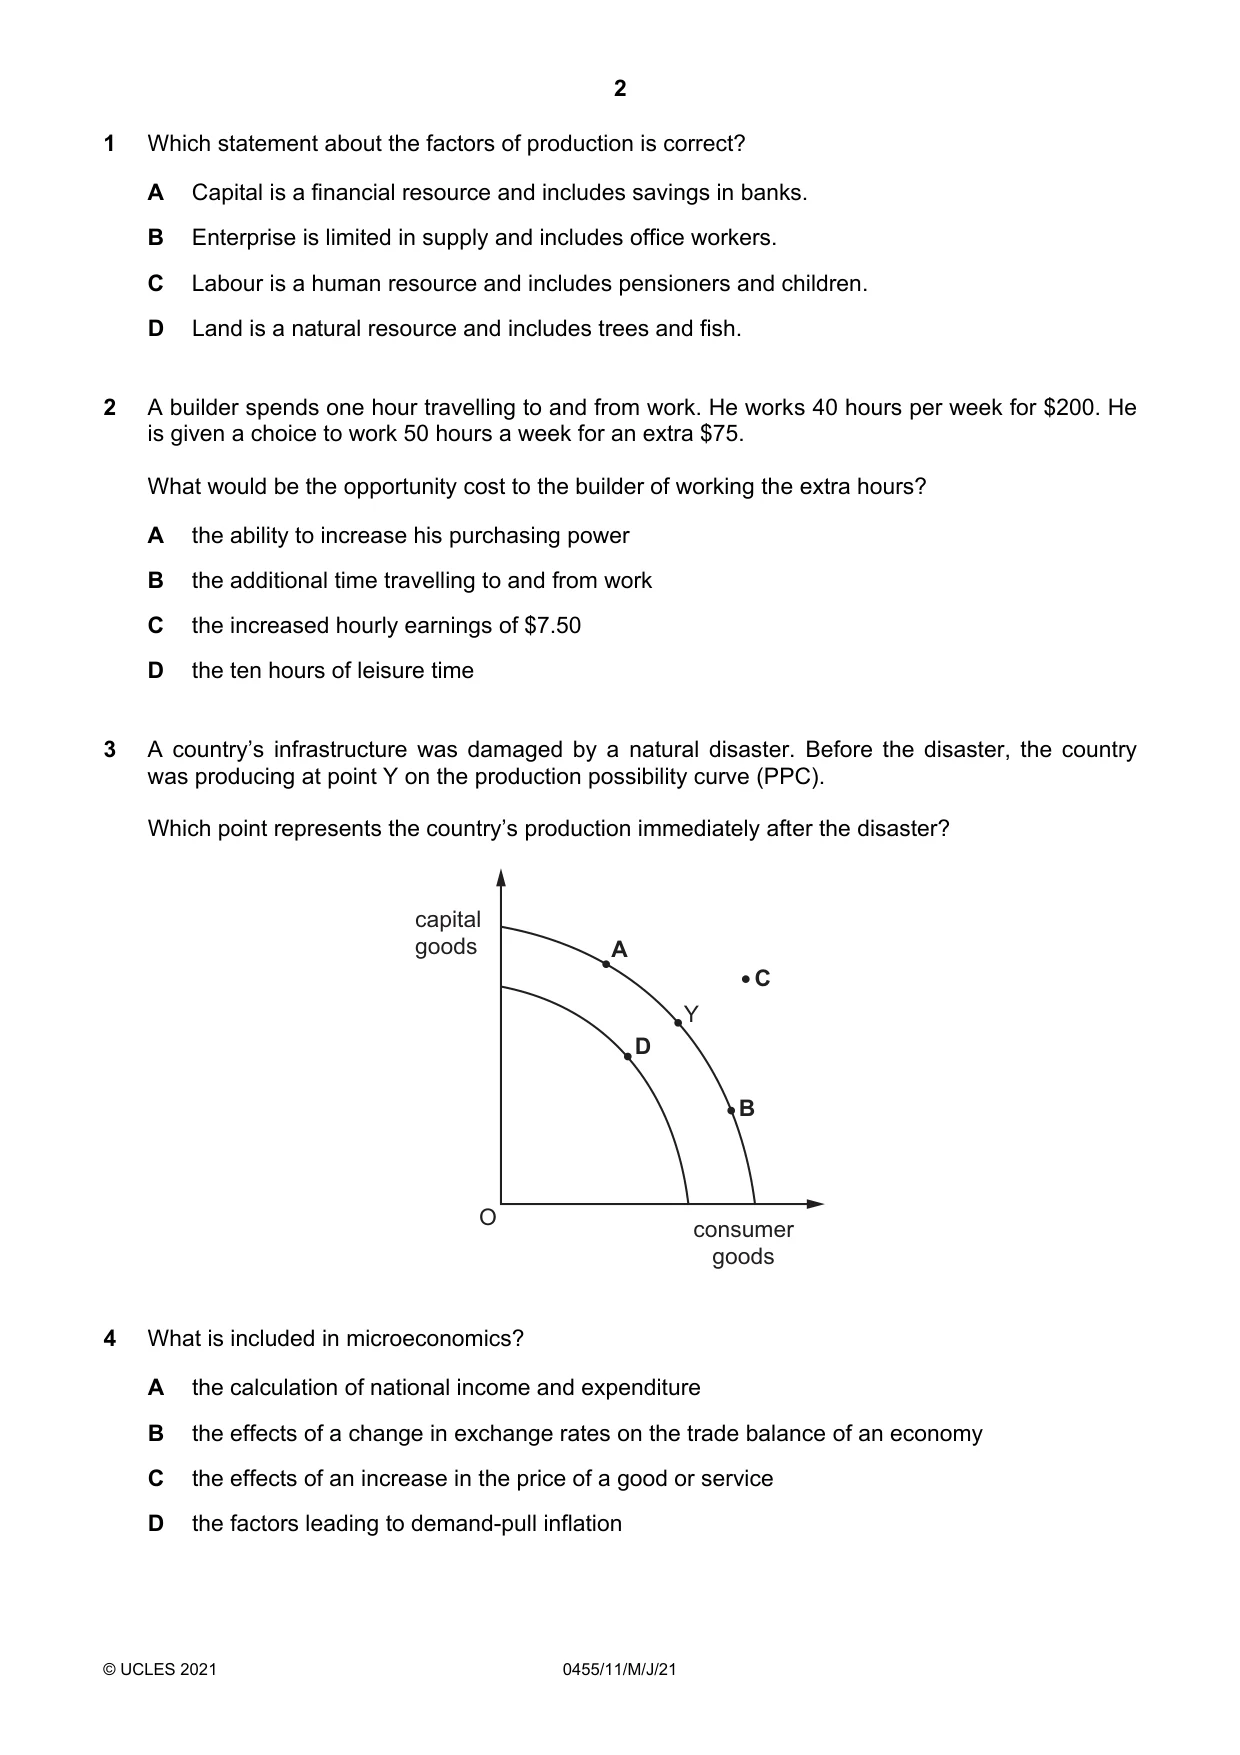
3 A country’s infrastructure was damaged by a natural disaster. Before the disaster, the country was producing at point Y on the production possibility curve (PPC). Which point represents the country’s production immediately after the disaster? capital goods A C Y D B O consumer goods
Mark scheme: D
More questions on Production possibility curve (PPC) diagrams
Q4 · What is included in microeconomics?
4 What is included in microeconomics? A the calculation of national income and expenditure B the effects of a change in exchange rates on the trade balance of an economy C the effects of an increase in the price of a good or service D the factors leading to demand-pull inflation
Mark scheme: C
Q5 · What is an economist’s definition of a market?
5 What is an economist’s definition of a market? A a collection of informal retail outlets run by small firms B a place where traders gather regularly for short periods C a system that enables individuals and firms to buy and sell goods D the existence of consumer demand for a good
Mark scheme: C
More questions on The role of markets in allocating resources
Q6 · What is an example of an external benefit from an individual cycling, rather than…
6 What is an example of an external benefit from an individual cycling, rather than driving, to work? A higher cost of building cycle lanes B improved physical fitness to the individual from cycling C lower cost of cycling compared with driving to work D reduced congestion for other road users
Mark scheme: D
Q7 · A tailor has four customers for her range of suits
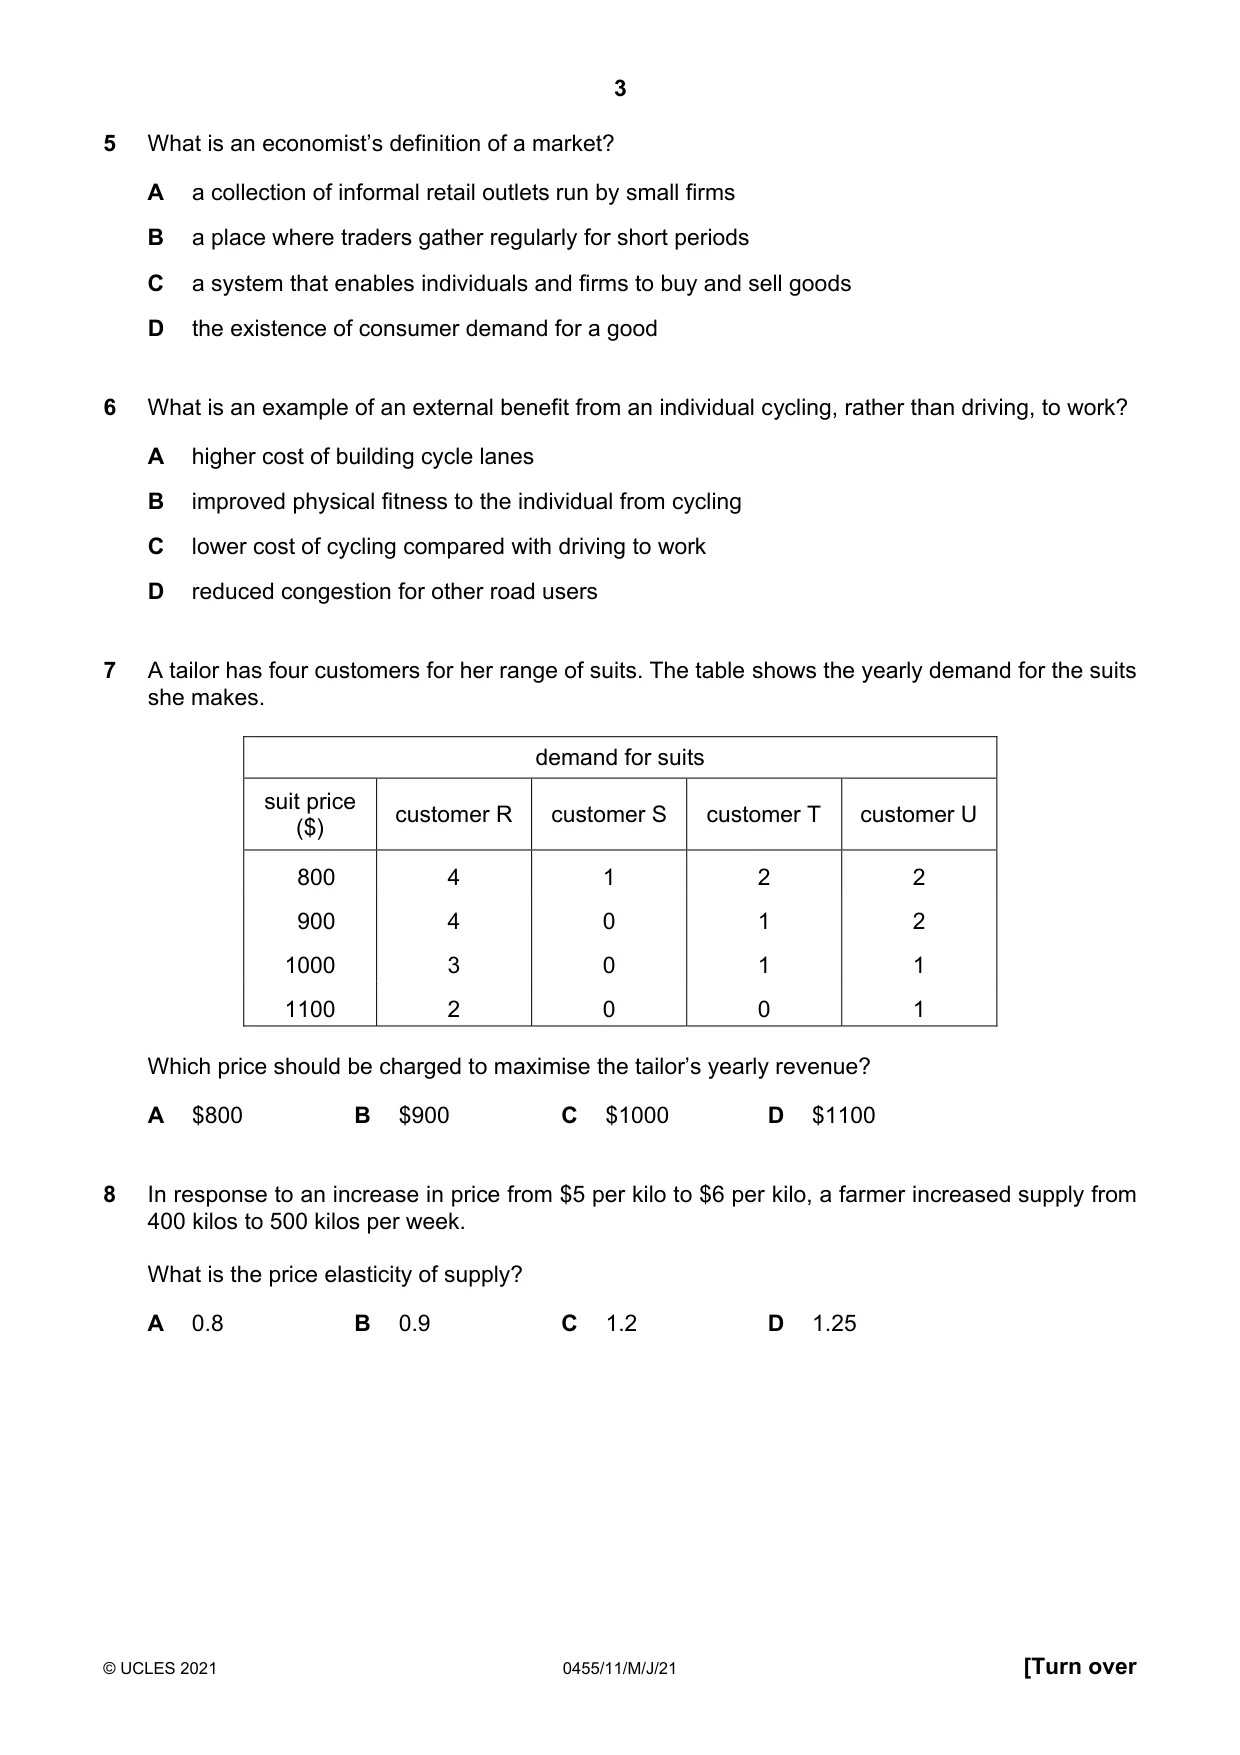
7 A tailor has four customers for her range of suits. The table shows the yearly demand for the suits she makes. demand for suits suit price customer R customer S customer T customer U ($) 800 4 1 2 2 900 4 0 1 2 1000 3 0 1 1 1100 2 0 0 1 Which price should be charged to maximise the tailor’s yearly revenue? A $800 B $900 C $1000 D $1100
Mark scheme: A
Q8 · In response to an increase in price from $5 per kilo to $6 per kilo, a farmer increased…
8 In response to an increase in price from $5 per kilo to $6 per kilo, a farmer increased supply from 400 kilos to 500 kilos per week. What is the price elasticity of supply? A 0.8 B 0.9 C 1.2 D 1.25
Mark scheme: D
Q9 · It is expected that consumers will use less paper money
9 It is expected that consumers will use less paper money. What is the most likely reason for this? A Inflation reduces the value of paper money. B More ways of making payments will be available. C Other forms of money are more durable. D Paper money will have less intrinsic value.
Mark scheme: B
Q10 · In low-income countries, fewer girls than boys become skilled design engineers
10 In low-income countries, fewer girls than boys become skilled design engineers. What might explain this situation? A Girls are only interested in low-wage jobs. B Girls do not favour heavy manual work. C Girls have fewer opportunities to complete higher education. D It costs more for girls to be trained as design engineers.
Mark scheme: C
Q11 · The diagram shows the demand for and supply of labour in an industry
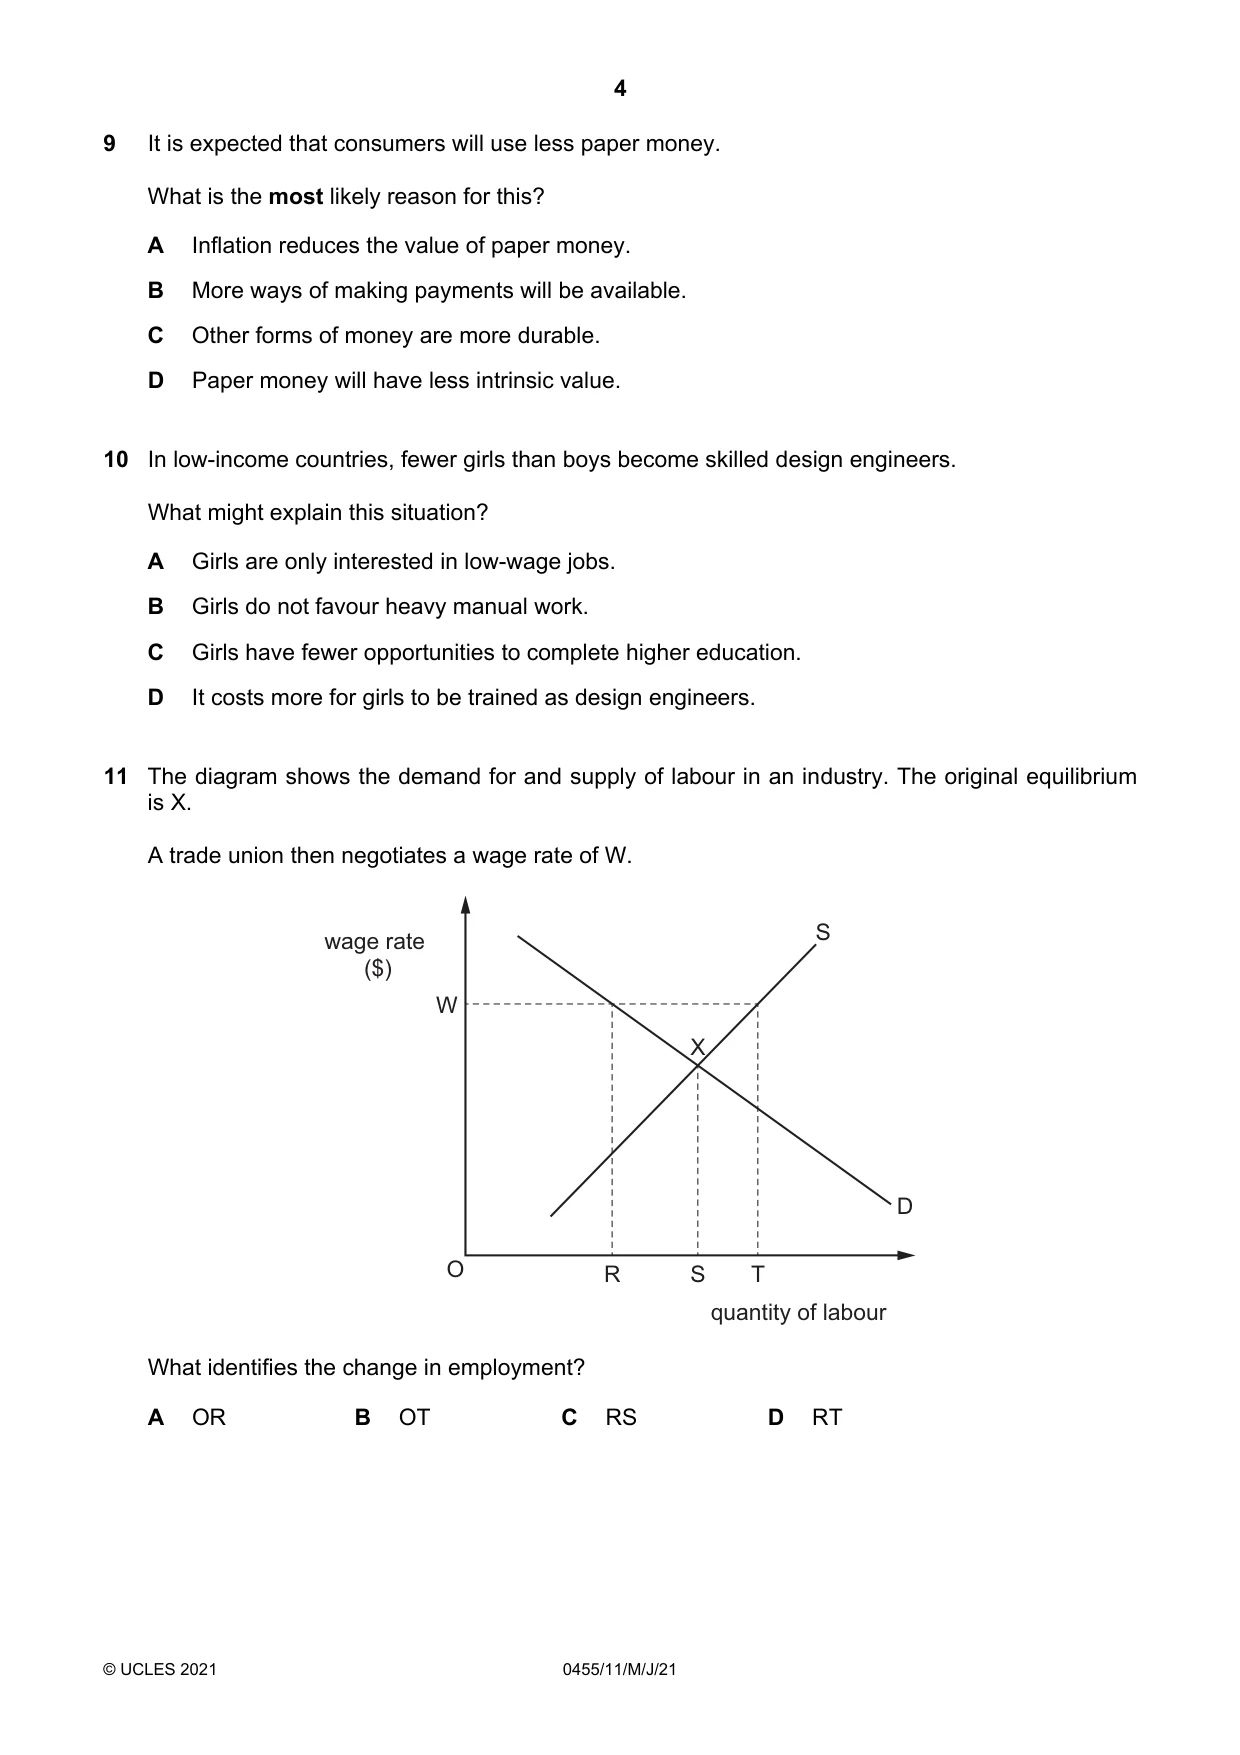
11 The diagram shows the demand for and supply of labour in an industry. The original equilibrium is X. A trade union then negotiates a wage rate of W. wage rate S ($) W X D O R S T quantity of labour What identifies the change in employment? A OR B OT C RS D RT
Mark scheme: C
Q12 · A company mining cobalt, invests in machinery to replace some workers
12 A company mining cobalt, invests in machinery to replace some workers. Eventually diseconomies of scale occur. What could cause this situation? A As more cobalt is mined average costs increase. B Fewer workers are needed to produce the required output. C Output per hour increases as more machinery is used. D Overhead costs are spread as output increases.
Mark scheme: A
Q13 · Why are many hairdressers able to operate as small businesses?
13 Why are many hairdressers able to operate as small businesses? A high level of competition B high scope for economies of scale C long period of training required D low start-up and running costs
Mark scheme: D
Q14 · Dimitry owns a firm that produces and sells bottles of lemonade
14 Dimitry owns a firm that produces and sells bottles of lemonade. He only sells one size of bottle. How would Dimitry calculate the total revenue of the firm? A multiply the quantity sold by the cost per bottle B multiply the quantity sold by the price per bottle C multiply the quantity sold by the profit per bottle D multiply the quantity sold by the tax per bottle
Mark scheme: B
Q15 · Which market is likely to be the most competitive?
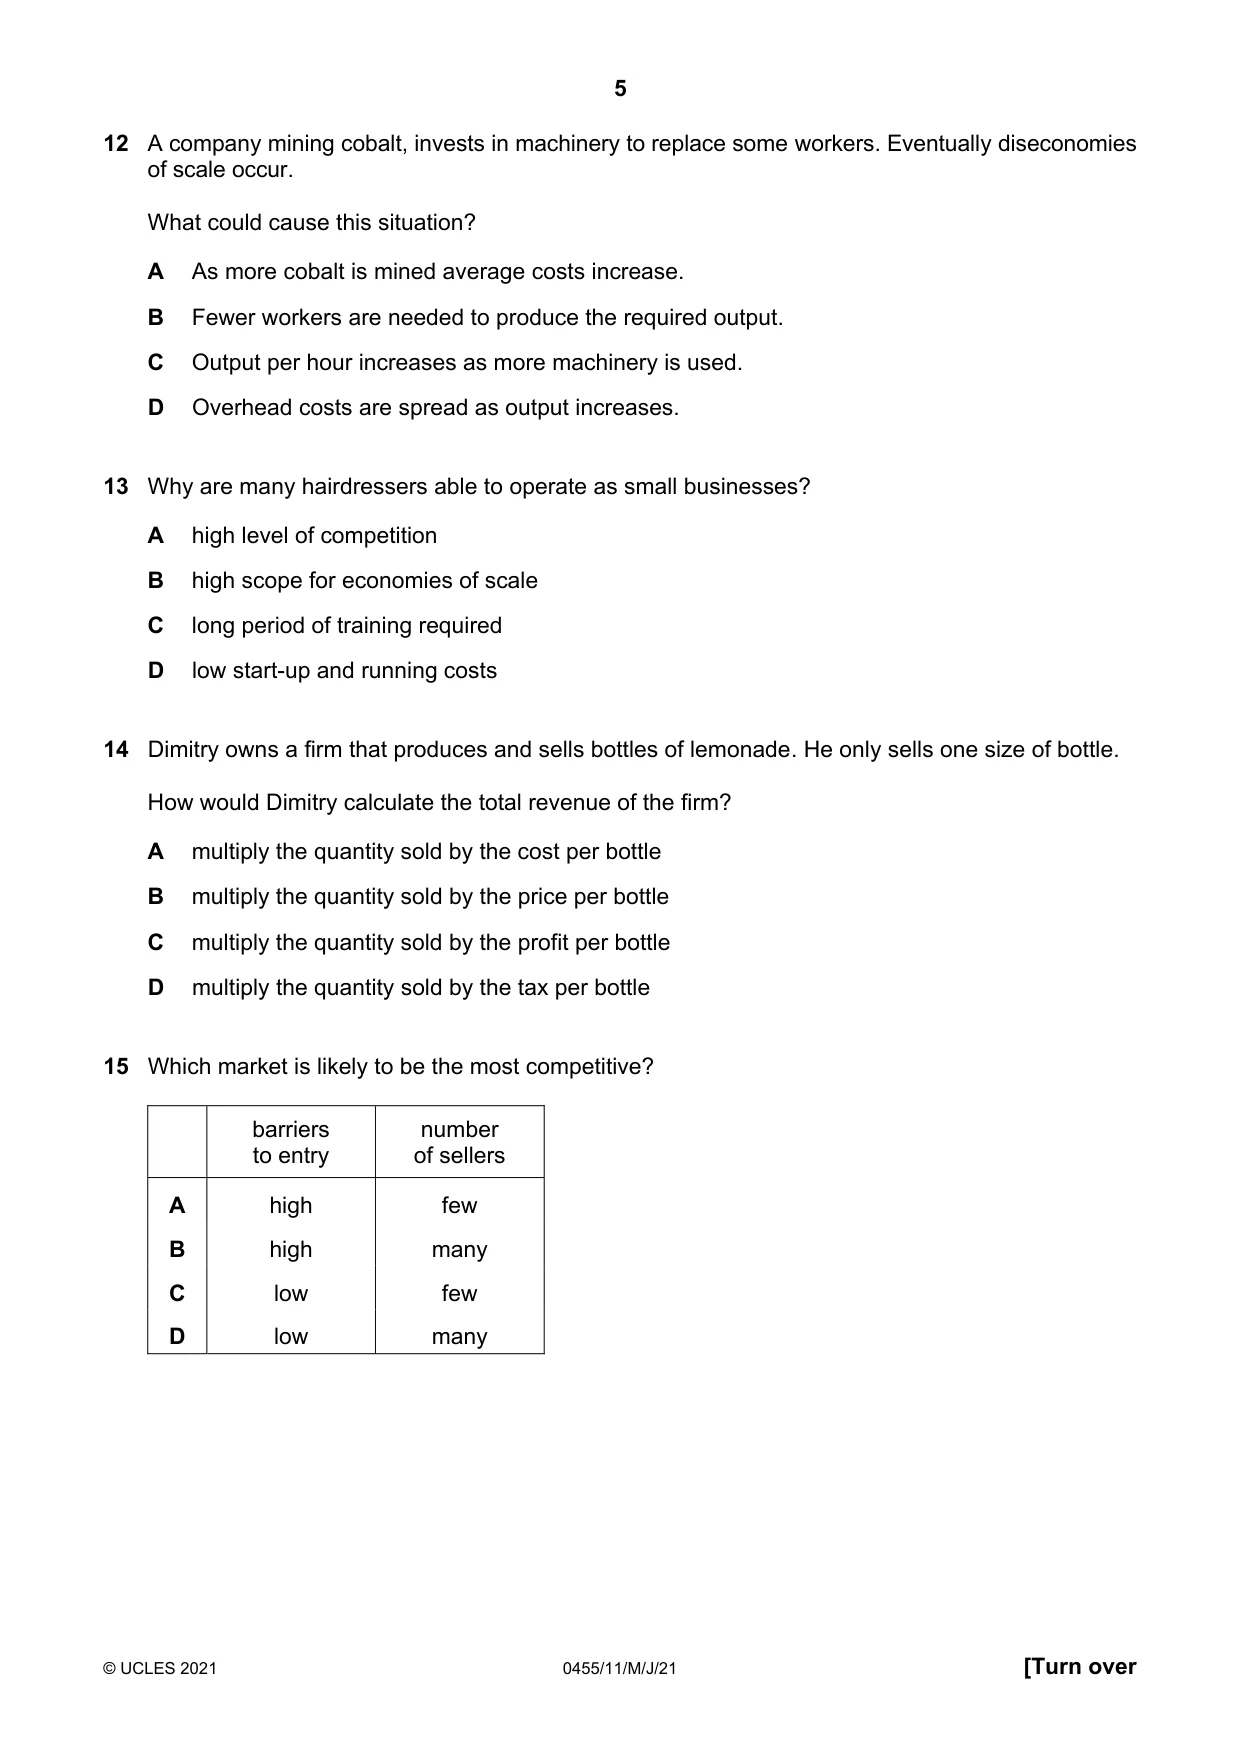
15 Which market is likely to be the most competitive? barriers number to entry of sellers A high few B high many C low few D low many
Mark scheme: D
Q16 · An economy has a high rate of inflation
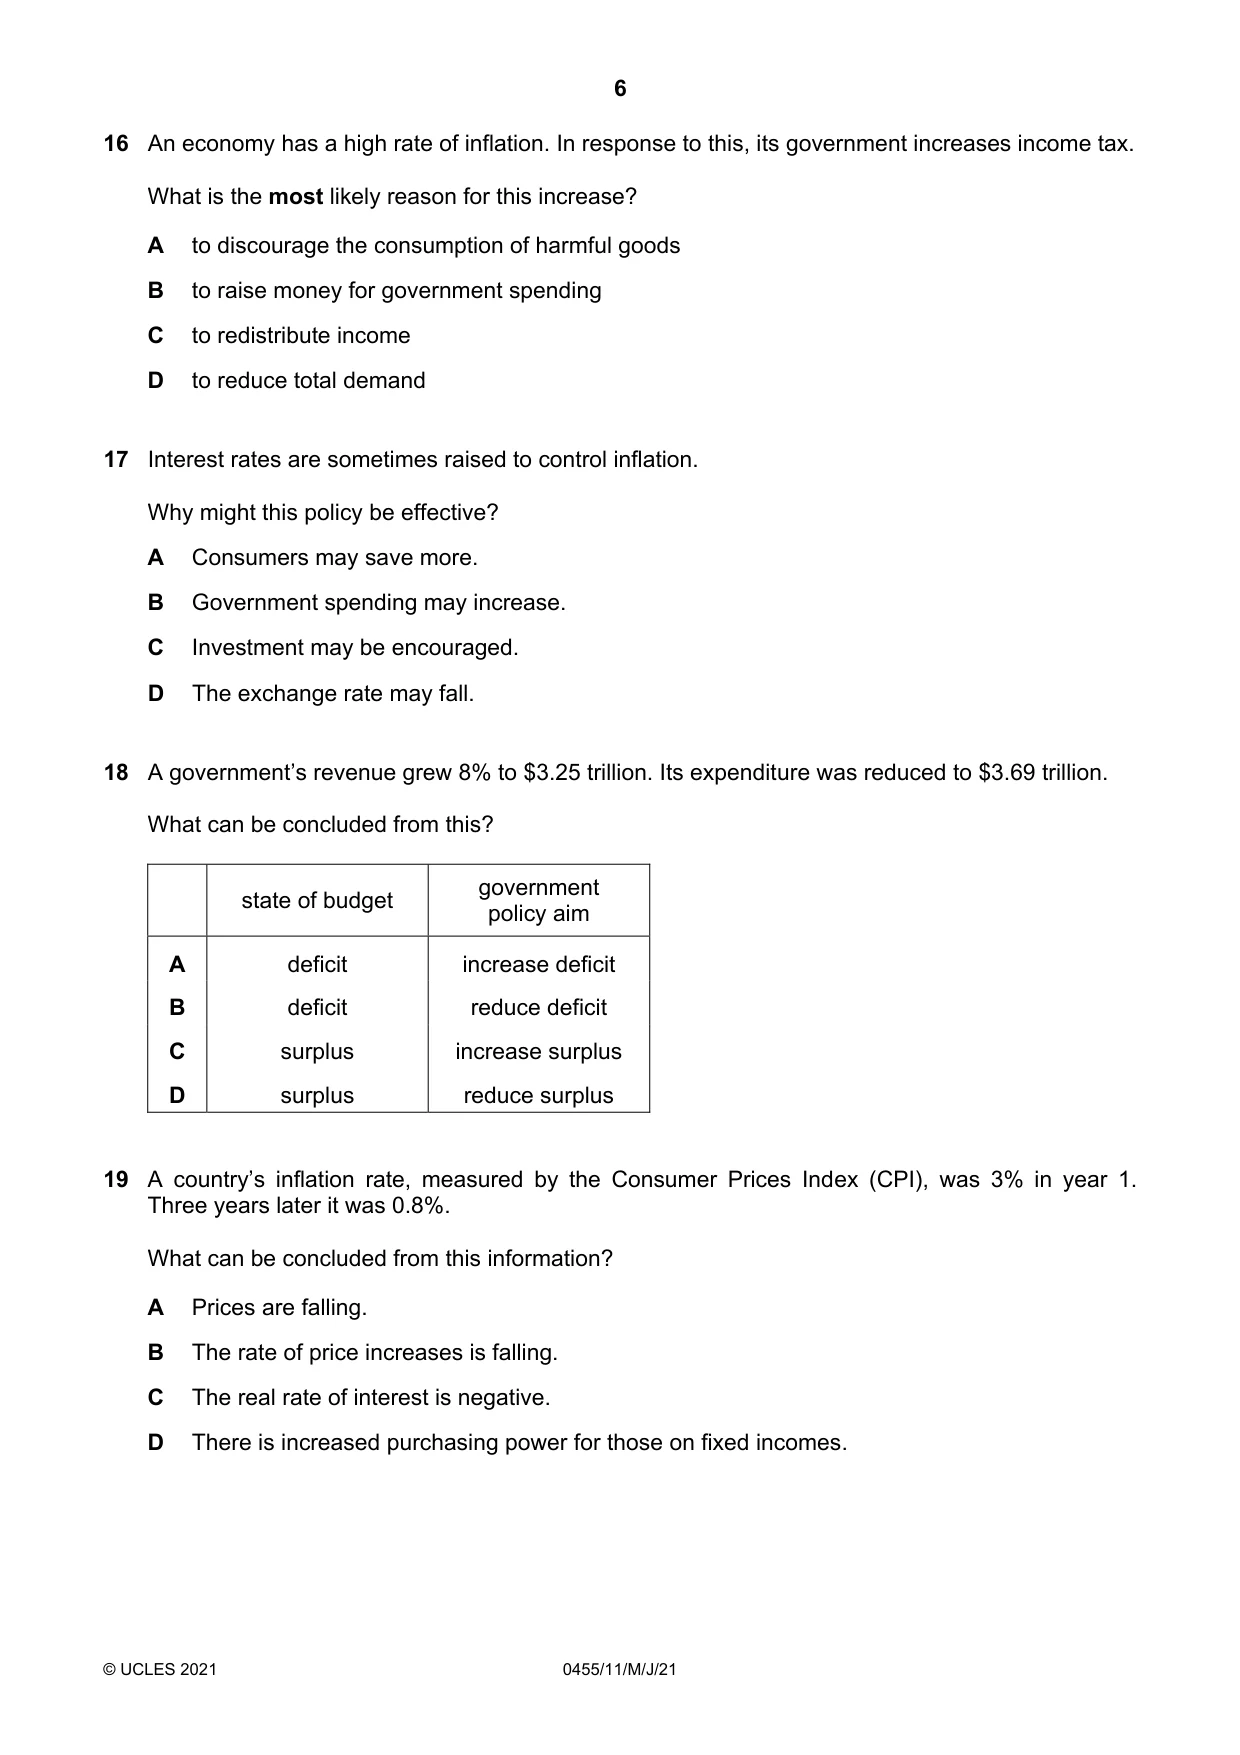
16 An economy has a high rate of inflation. In response to this, its government increases income tax. What is the most likely reason for this increase? A to discourage the consumption of harmful goods B to raise money for government spending C to redistribute income D to reduce total demand
Mark scheme: D
Q17 · Interest rates are sometimes raised to control inflation
17 Interest rates are sometimes raised to control inflation. Why might this policy be effective? A Consumers may save more. B Government spending may increase. C Investment may be encouraged. D The exchange rate may fall.
Mark scheme: A
Q18 · A government’s revenue grew 8% to $3.25 trillion
18 A government’s revenue grew 8% to $3.25 trillion. Its expenditure was reduced to $3.69 trillion. What can be concluded from this? government state of budget policy aim A deficit increase deficit B deficit reduce deficit C surplus increase surplus D surplus reduce surplus
Mark scheme: B
Q19 · A country’s inflation rate, measured by the Consumer Prices Index (CPI), was 3% in year 1
19 A country’s inflation rate, measured by the Consumer Prices Index (CPI), was 3% in year 1. Three years later it was 0.8%. What can be concluded from this information? A Prices are falling. B The rate of price increases is falling. C The real rate of interest is negative. D There is increased purchasing power for those on fixed incomes.
Mark scheme: B
Q20 · What will deflation most likely lead to?
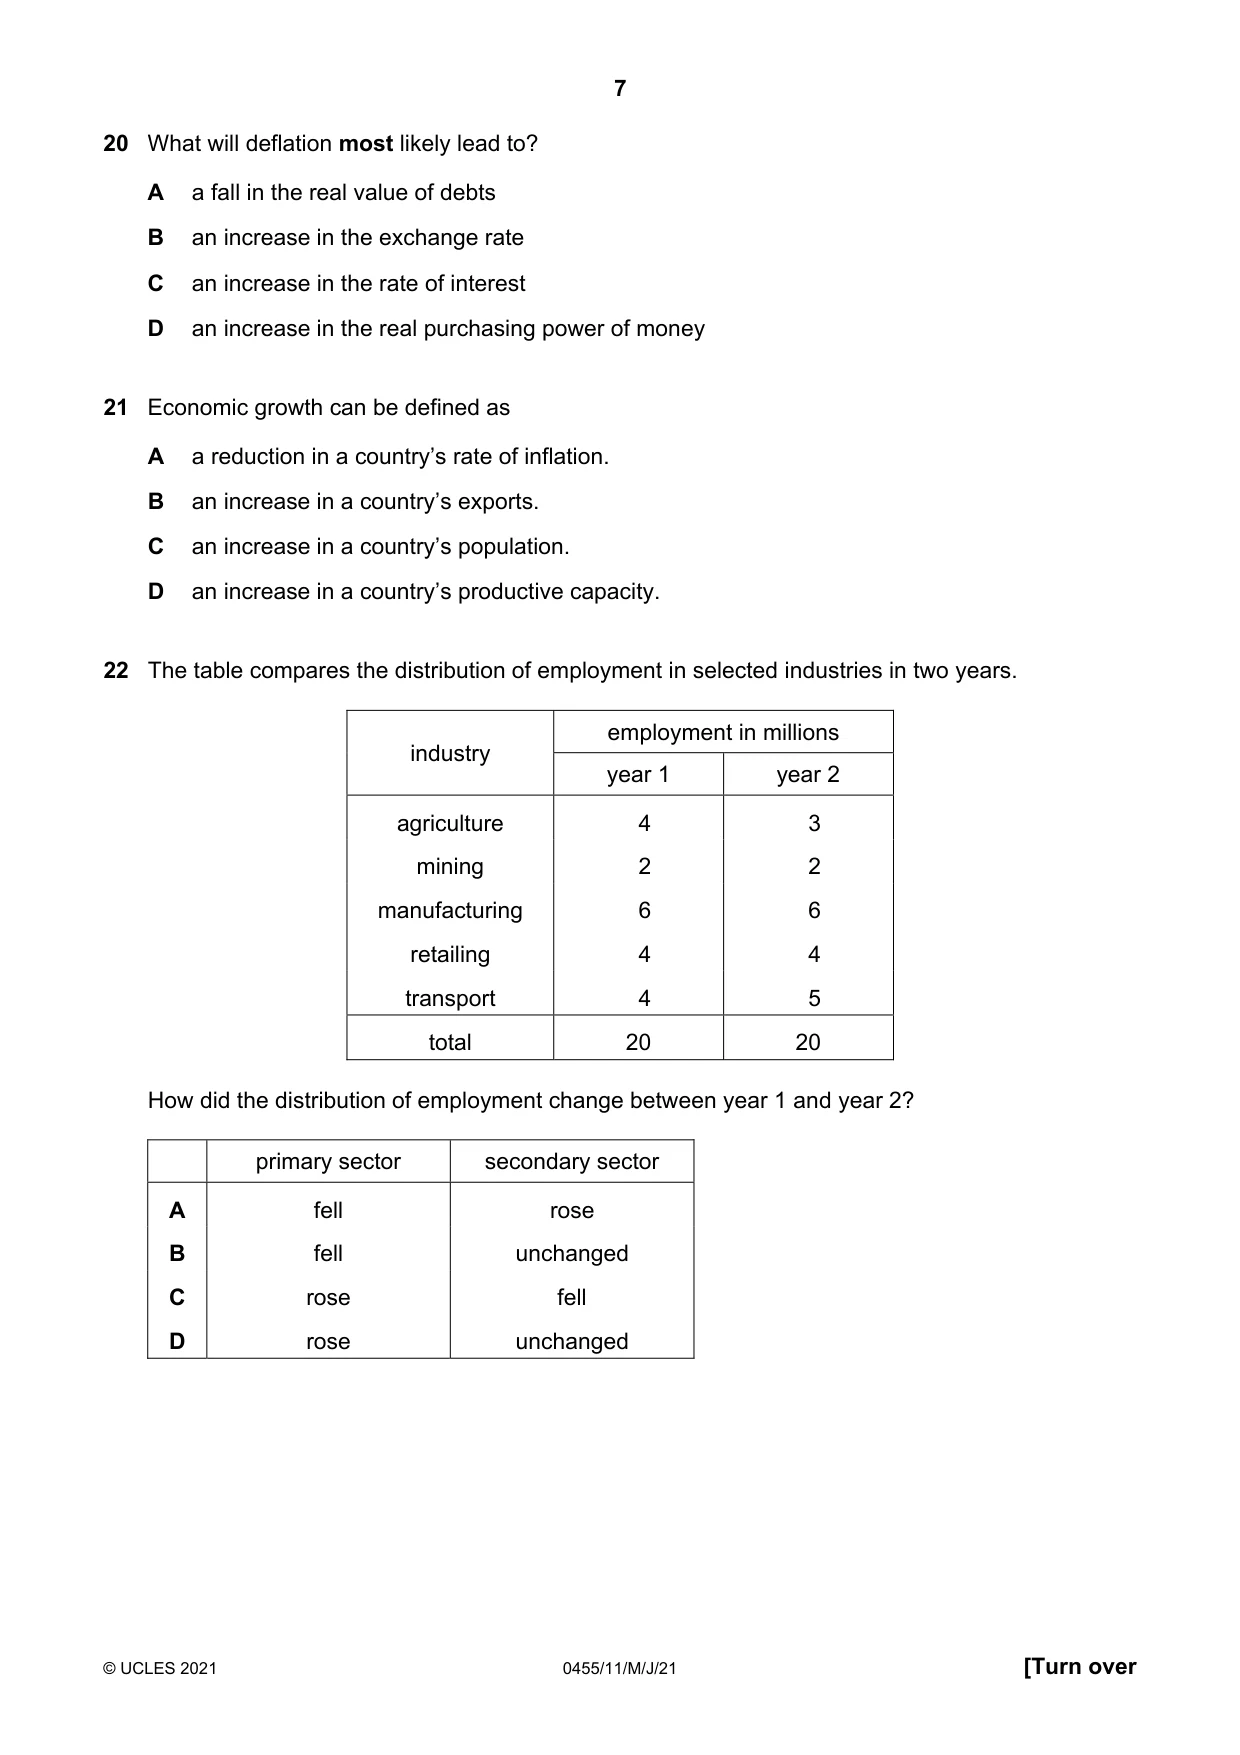
20 What will deflation most likely lead to? A a fall in the real value of debts B an increase in the exchange rate C an increase in the rate of interest D an increase in the real purchasing power of money
Mark scheme: D
Q21 · Economic growth can be defined as A a reduction in a country’s rate of inflation
21 Economic growth can be defined as A a reduction in a country’s rate of inflation. B an increase in a country’s exports. C an increase in a country’s population. D an increase in a country’s productive capacity.
Mark scheme: D
Q22 · The table compares the distribution of employment in selected industries in two years
22 The table compares the distribution of employment in selected industries in two years. employment in millions industry year 1 year 2 agriculture 4 3 mining 2 2 manufacturing 6 6 retailing 4 4 transport 4 5 total 20 20 How did the distribution of employment change between year 1 and year 2? primary sector secondary sector A fell rose B fell unchanged C rose fell D rose unchanged
Mark scheme: B
Q23 · In a year, two changes occurred in a company
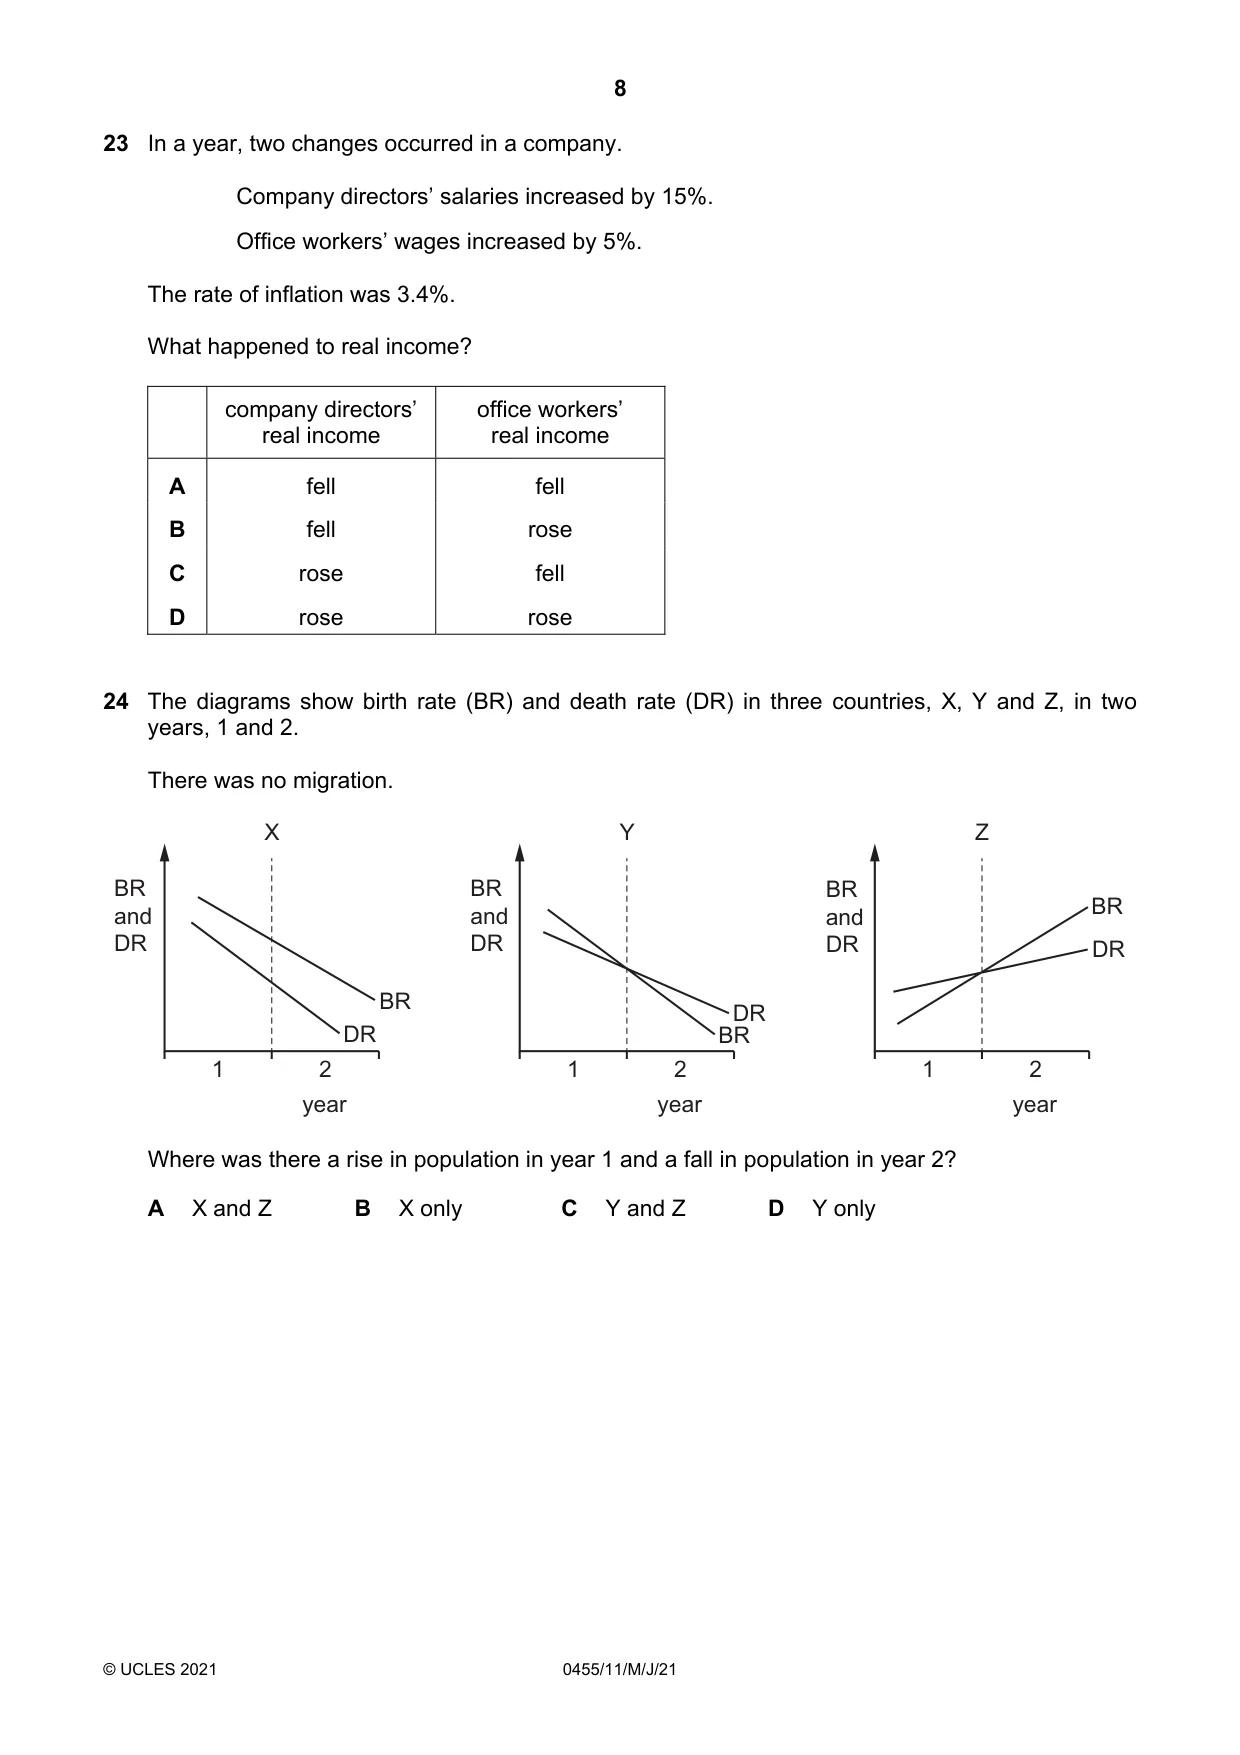
23 In a year, two changes occurred in a company. Company directors’ salaries increased by 15%. Office workers’ wages increased by 5%. The rate of inflation was 3.4%. What happened to real income? company directors’ office workers’ real income real income A fell fell B fell rose C rose fell D rose rose
Mark scheme: D
Q24 · The diagrams show birth rate (BR) and death rate (DR) in three countries, X, Y and Z, in…
24 The diagrams show birth rate (BR) and death rate (DR) in three countries, X, Y and Z, in two years, 1 and 2. There was no migration. X Y Z BR BR BR and and BR and DR DR DR DR BR DR DR BR 1 2 1 2 1 2 year year year Where was there a rise in population in year 1 and a fall in population in year 2? A X and Z B X only C Y and Z D Y only
Mark scheme: D
Q25 · The richest 60% of the population of a high-income economy received an increase in income
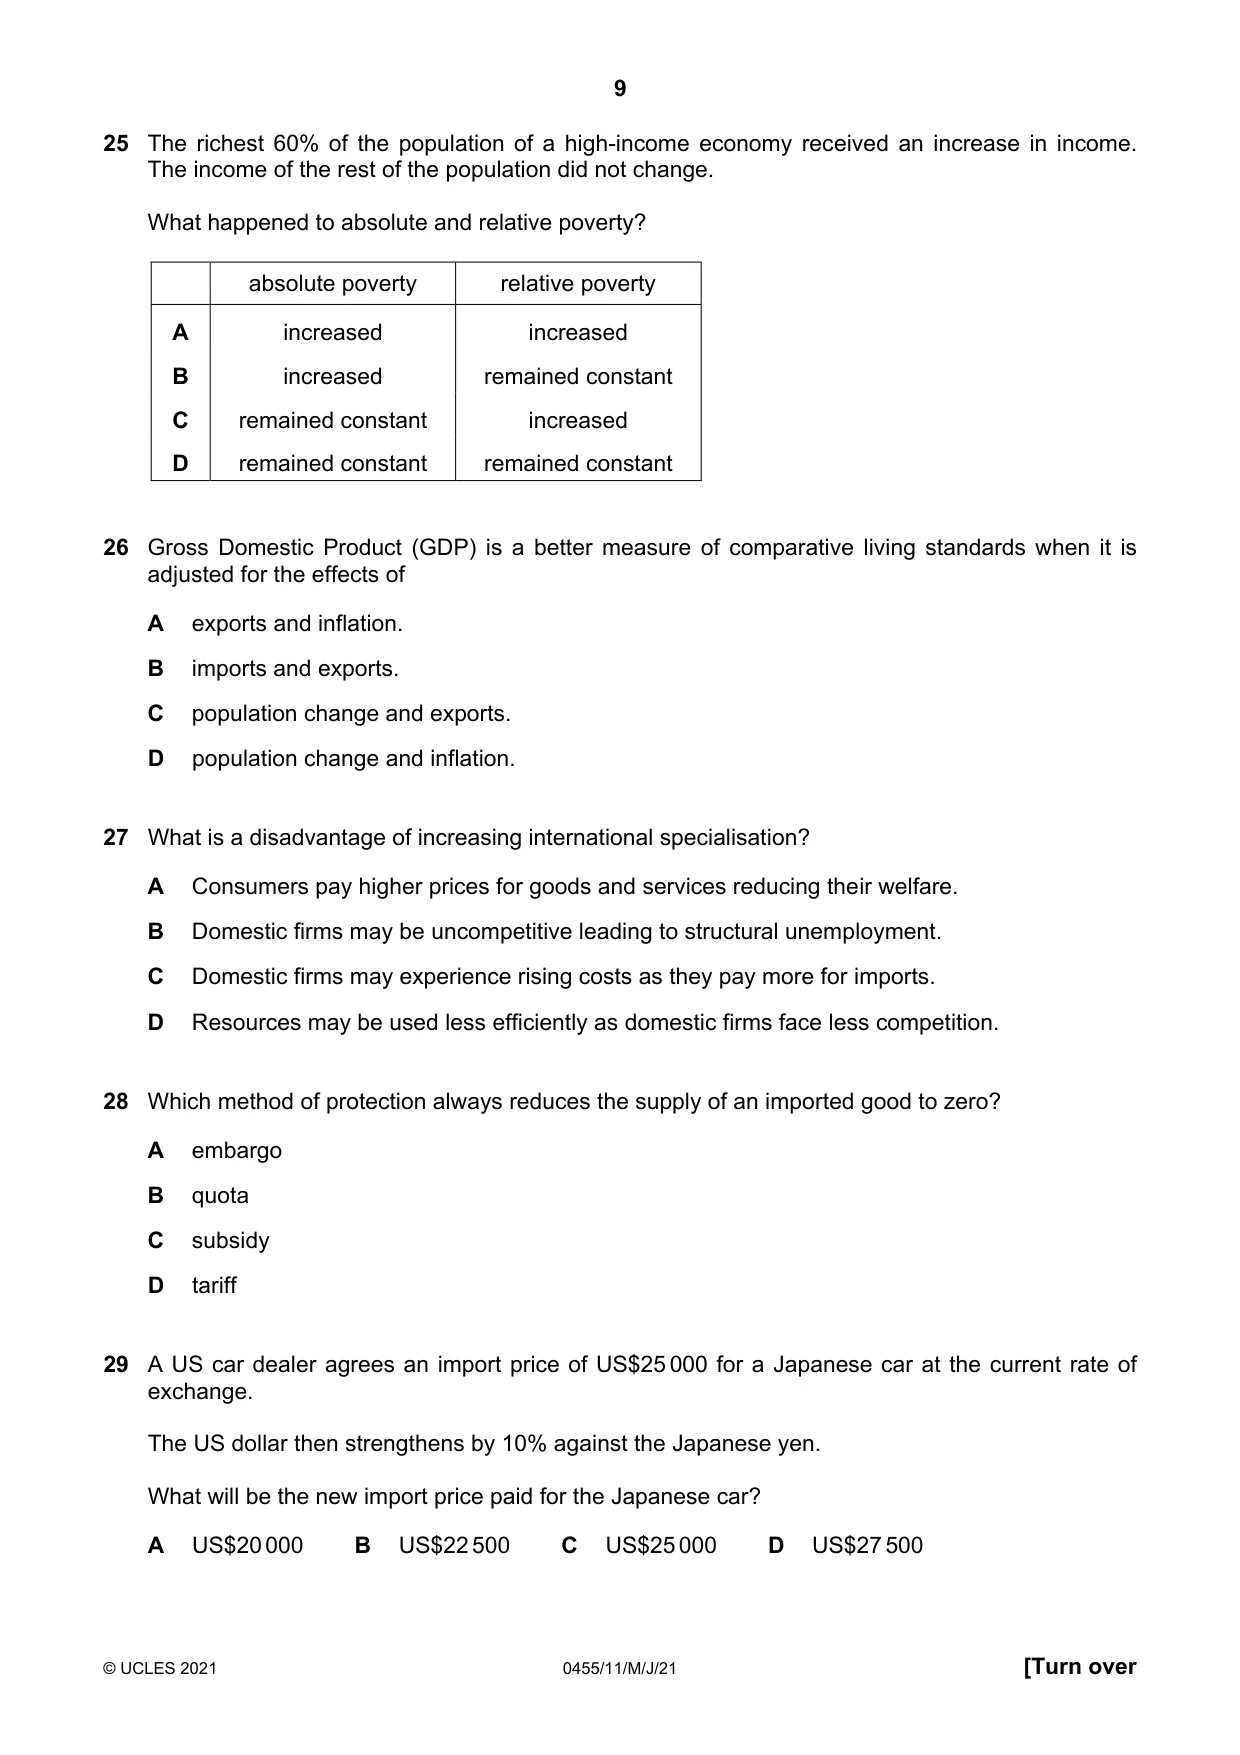
25 The richest 60% of the population of a high-income economy received an increase in income. The income of the rest of the population did not change. What happened to absolute and relative poverty? absolute poverty relative poverty A increased increased B increased remained constant C remained constant increased D remained constant remained constant
Mark scheme: C
Q26 · Gross Domestic Product (GDP) is a better measure of comparative living standards when it…
26 Gross Domestic Product (GDP) is a better measure of comparative living standards when it is adjusted for the effects of A exports and inflation. B imports and exports. C population change and exports. D population change and inflation.
Mark scheme: D
Q27 · What is a disadvantage of increasing international specialisation?
27 What is a disadvantage of increasing international specialisation? A Consumers pay higher prices for goods and services reducing their welfare. B Domestic firms may be uncompetitive leading to structural unemployment. C Domestic firms may experience rising costs as they pay more for imports. D Resources may be used less efficiently as domestic firms face less competition.
Mark scheme: B
Q28 · Which method of protection always reduces the supply of an imported good to zero?
28 Which method of protection always reduces the supply of an imported good to zero? A embargo B quota C subsidy D tariff
Mark scheme: A
Q29 · A US car dealer agrees an import price of US$25 000 for a Japanese car at the current…
29 A US car dealer agrees an import price of US$25 000 for a Japanese car at the current rate of exchange. The US dollar then strengthens by 10% against the Japanese yen. What will be the new import price paid for the Japanese car? A US$20 000 B US$22 500 C US$25 000 D US$27 500
Mark scheme: B
Q30 · A country has a deficit on its current account of its balance of payments
30 A country has a deficit on its current account of its balance of payments. What could increase the size of its deficit? A increased exports of its services B increased international competitiveness of its goods C increased numbers of visitors from abroad D increased spending on its military bases abroad
Mark scheme: D
What was in this paper
The subtopics covered by these 30 questions, and how many questions each got. Open one in a new tab to see every Cambridge question on it.
3Inflation and deflation3Fiscal policy2Current account of balance of payments1Demand1Economic growth1Employment and unemployment1Foreign exchange rates1Globalisation, free trade and protection1International specialisation1Living standards1Market failure1Market structure1Microeconomics and macroeconomics1Monetary policy1Money and banking1Opportunity cost1Population1Poverty1Price elasticity of supply (PES)1Production possibility curve (PPC) diagrams1The factors of production1The role of markets in allocating resources1Trade unions1Workers1What you needed in this session
Cambridge’s own grade thresholds for 2021 May/June, Paper 1 · Variant 1. A higher threshold means an easier paper — the bar moves with how the cohort did.