Cambridge IGCSE Economics 0455 — 2025 Feb/March Paper 1 · Variant 2
0455/12/F/M/25 · 30 questions · 30 marks · ≈34 min
The question paper and its mark scheme, free to read here and free to download. This is Cambridge’s own paper, exactly as it was sat.
Question paper12 pages

Mark scheme3 pages
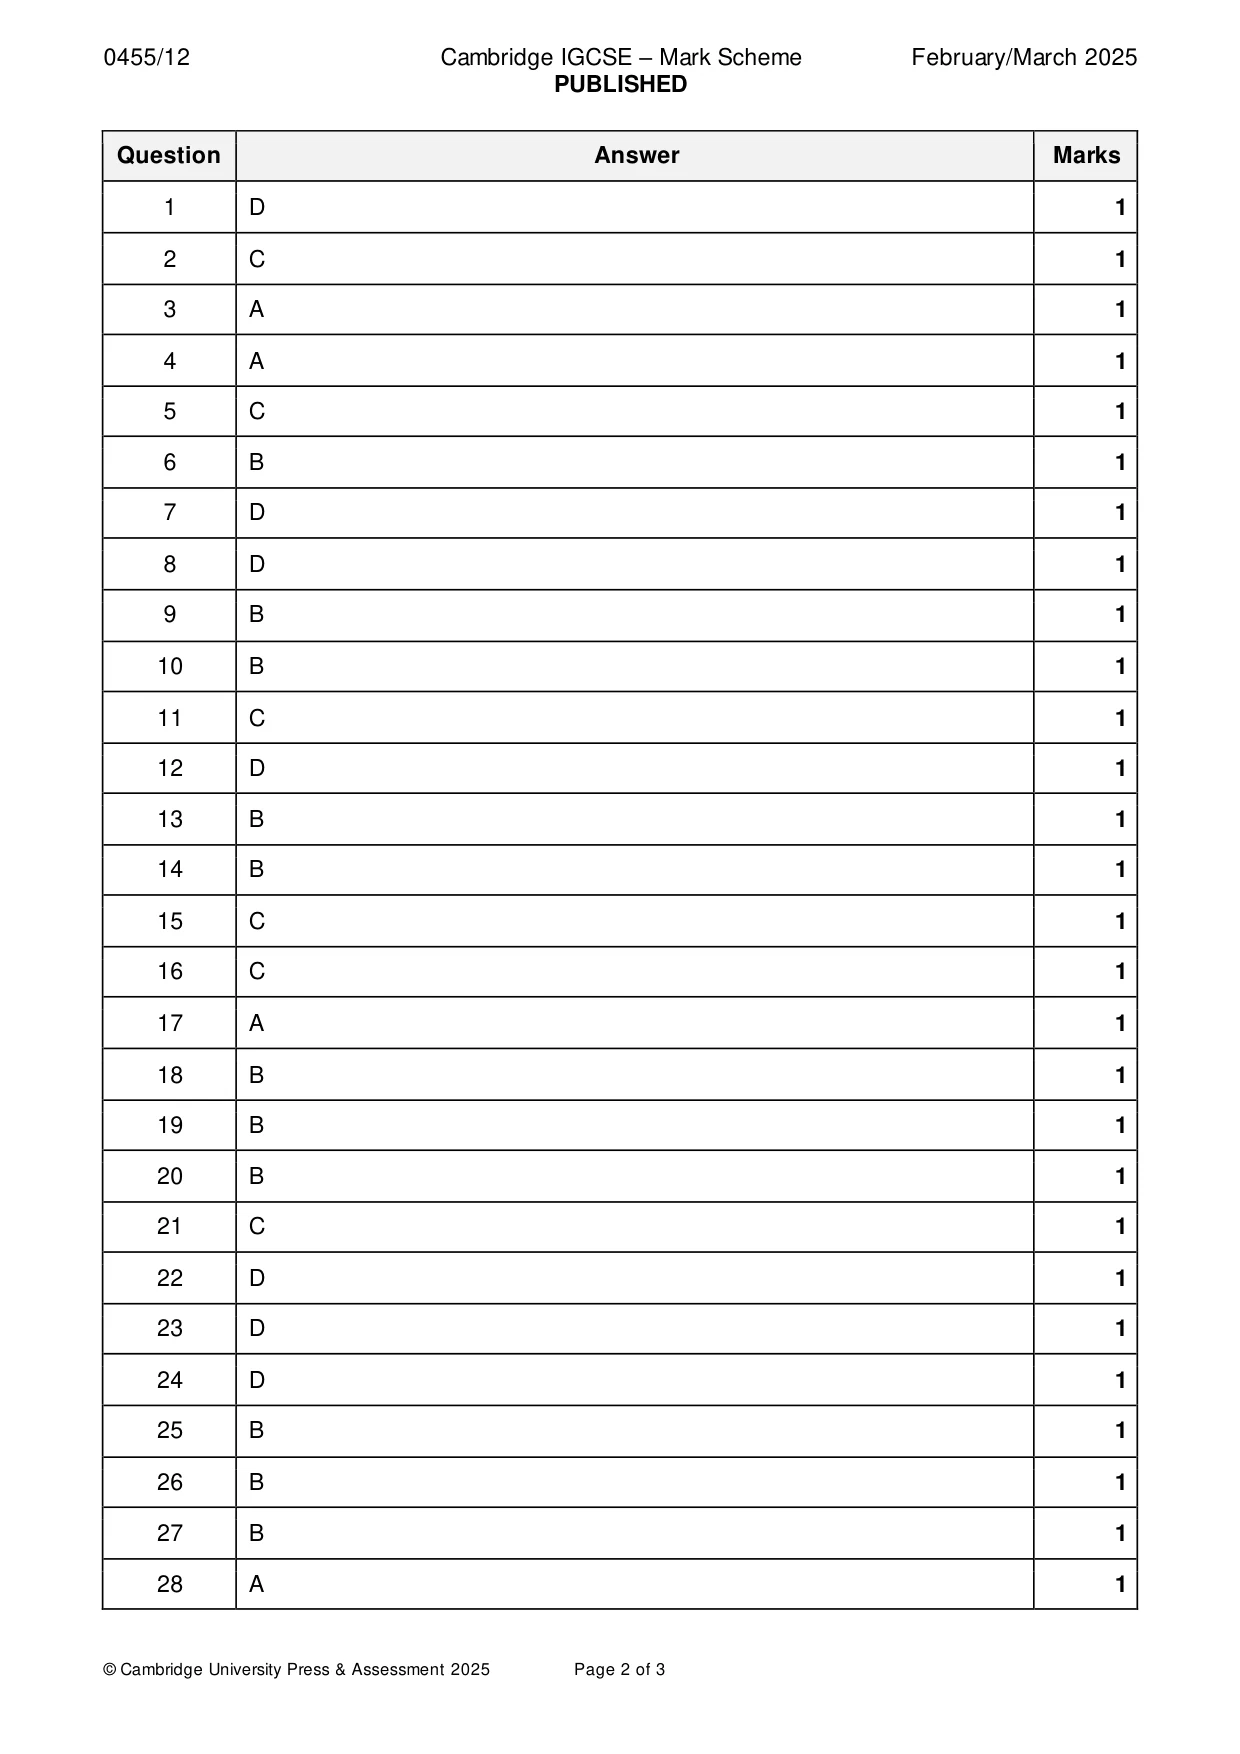
Answers below. Sit the paper first if you are practising.

Questions as text
Q1 · What is classed as the factor of production land?
1 What is classed as the factor of production land? A an airport B a car park C a doctor’s office D a forest
Mark scheme: D
Q2 · An economics graduate chooses to work in a bank rather than teach economics which was the…
2 An economics graduate chooses to work in a bank rather than teach economics which was the next best alternative. Which cost is incurred as a result of this decision? A external cost B internal cost C opportunity cost D private cost
Mark scheme: C
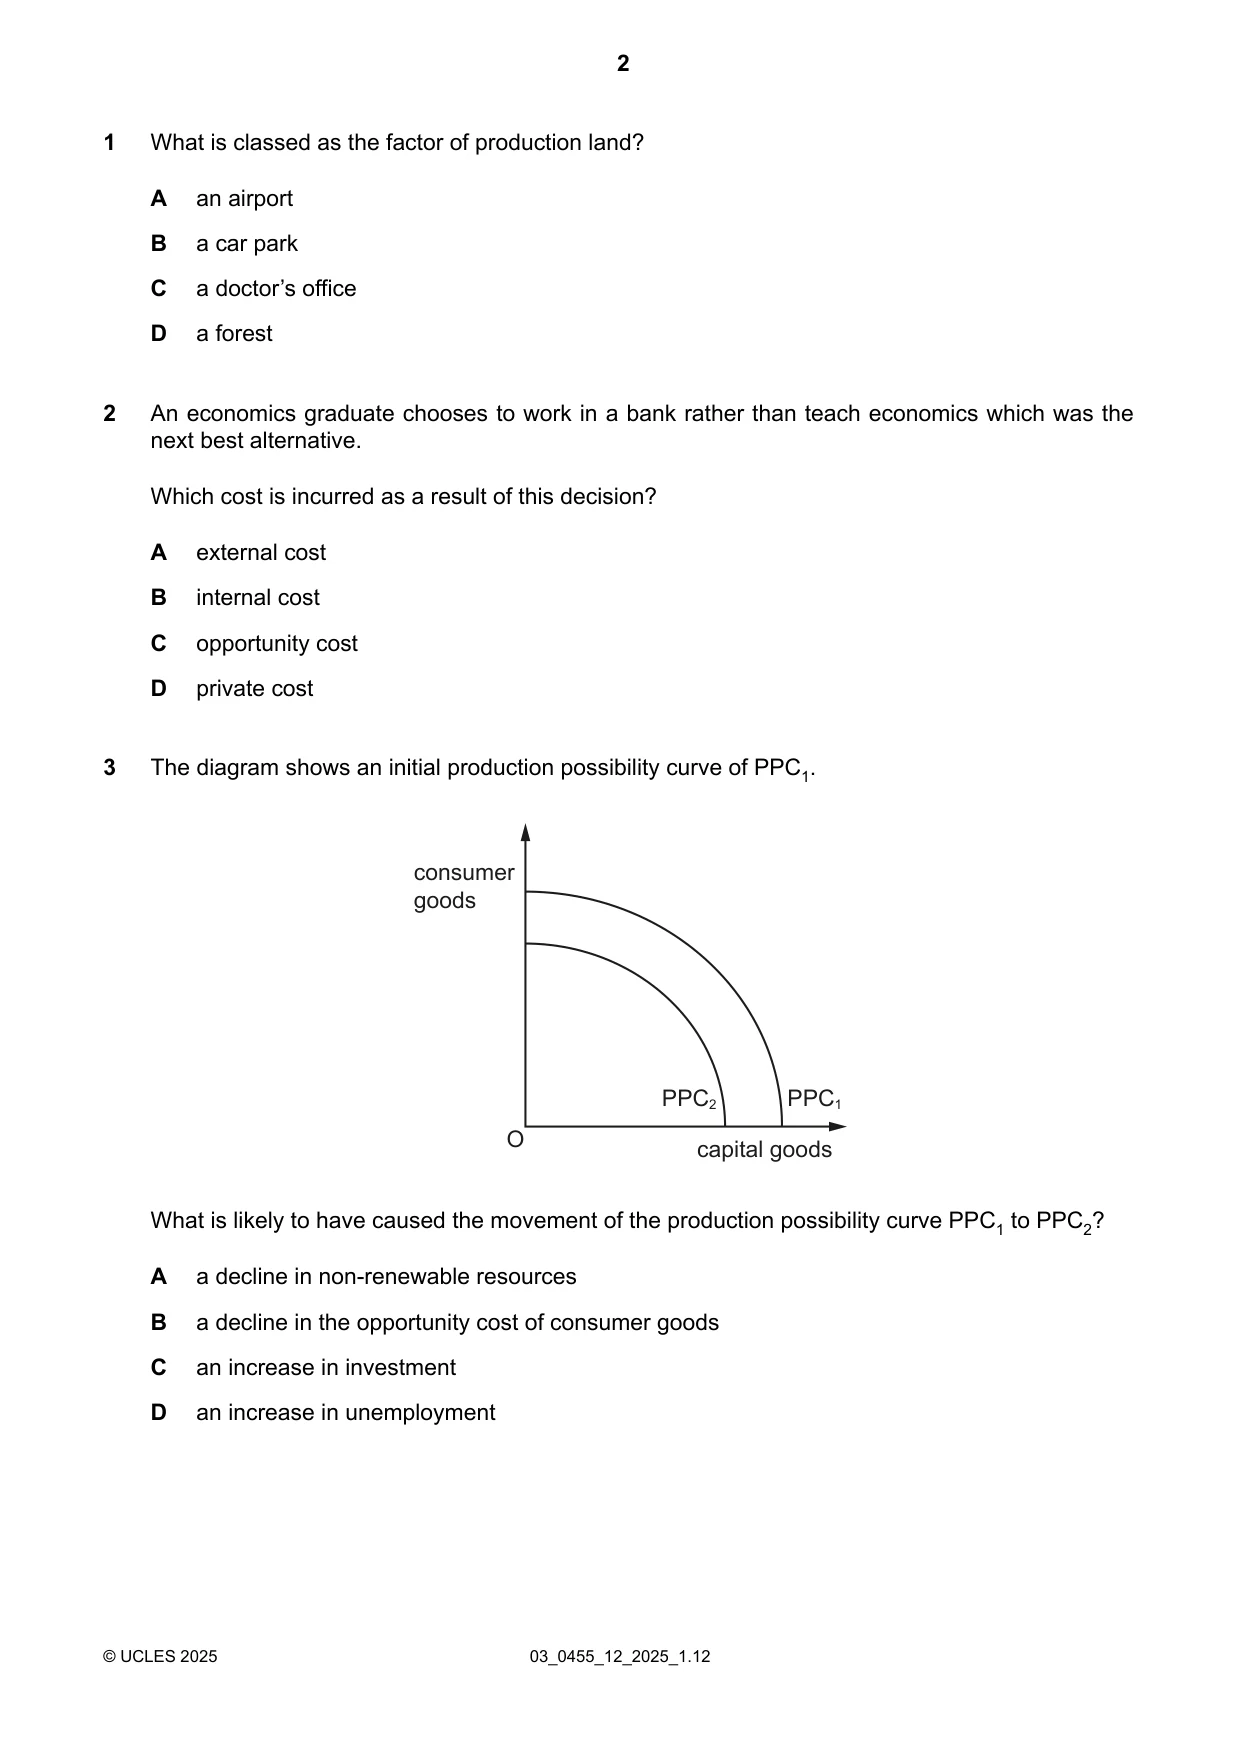
Q3 · The diagram shows an initial production possibility curve of PPC1
3 The diagram shows an initial production possibility curve of PPC1. consumer goods PPC2 PPC1 O capital goods What is likely to have caused the movement of the production possibility curve PPC1 to PPC2? A a decline in non-renewable resources B a decline in the opportunity cost of consumer goods C an increase in investment D an increase in unemployment
Mark scheme: A
More questions on Production possibility curve (PPC) diagrams
Q4 · What is an example of microeconomics?
4 What is an example of microeconomics? A a fall in the cost of growing wheat B a fall in the unemployment rate C an increase in the rate of inflation D an increase in government spending
Mark scheme: A
Q5 · There are three key questions to be decided in determining resource allocation within an…
5 There are three key questions to be decided in determining resource allocation within an economy. What does not relate to one of the choices in the three key questions? A whether all income groups receive the output B whether consumer or industrial goods are produced C whether economic goods or free goods are supplied D whether labour or capital is used in production
Mark scheme: C
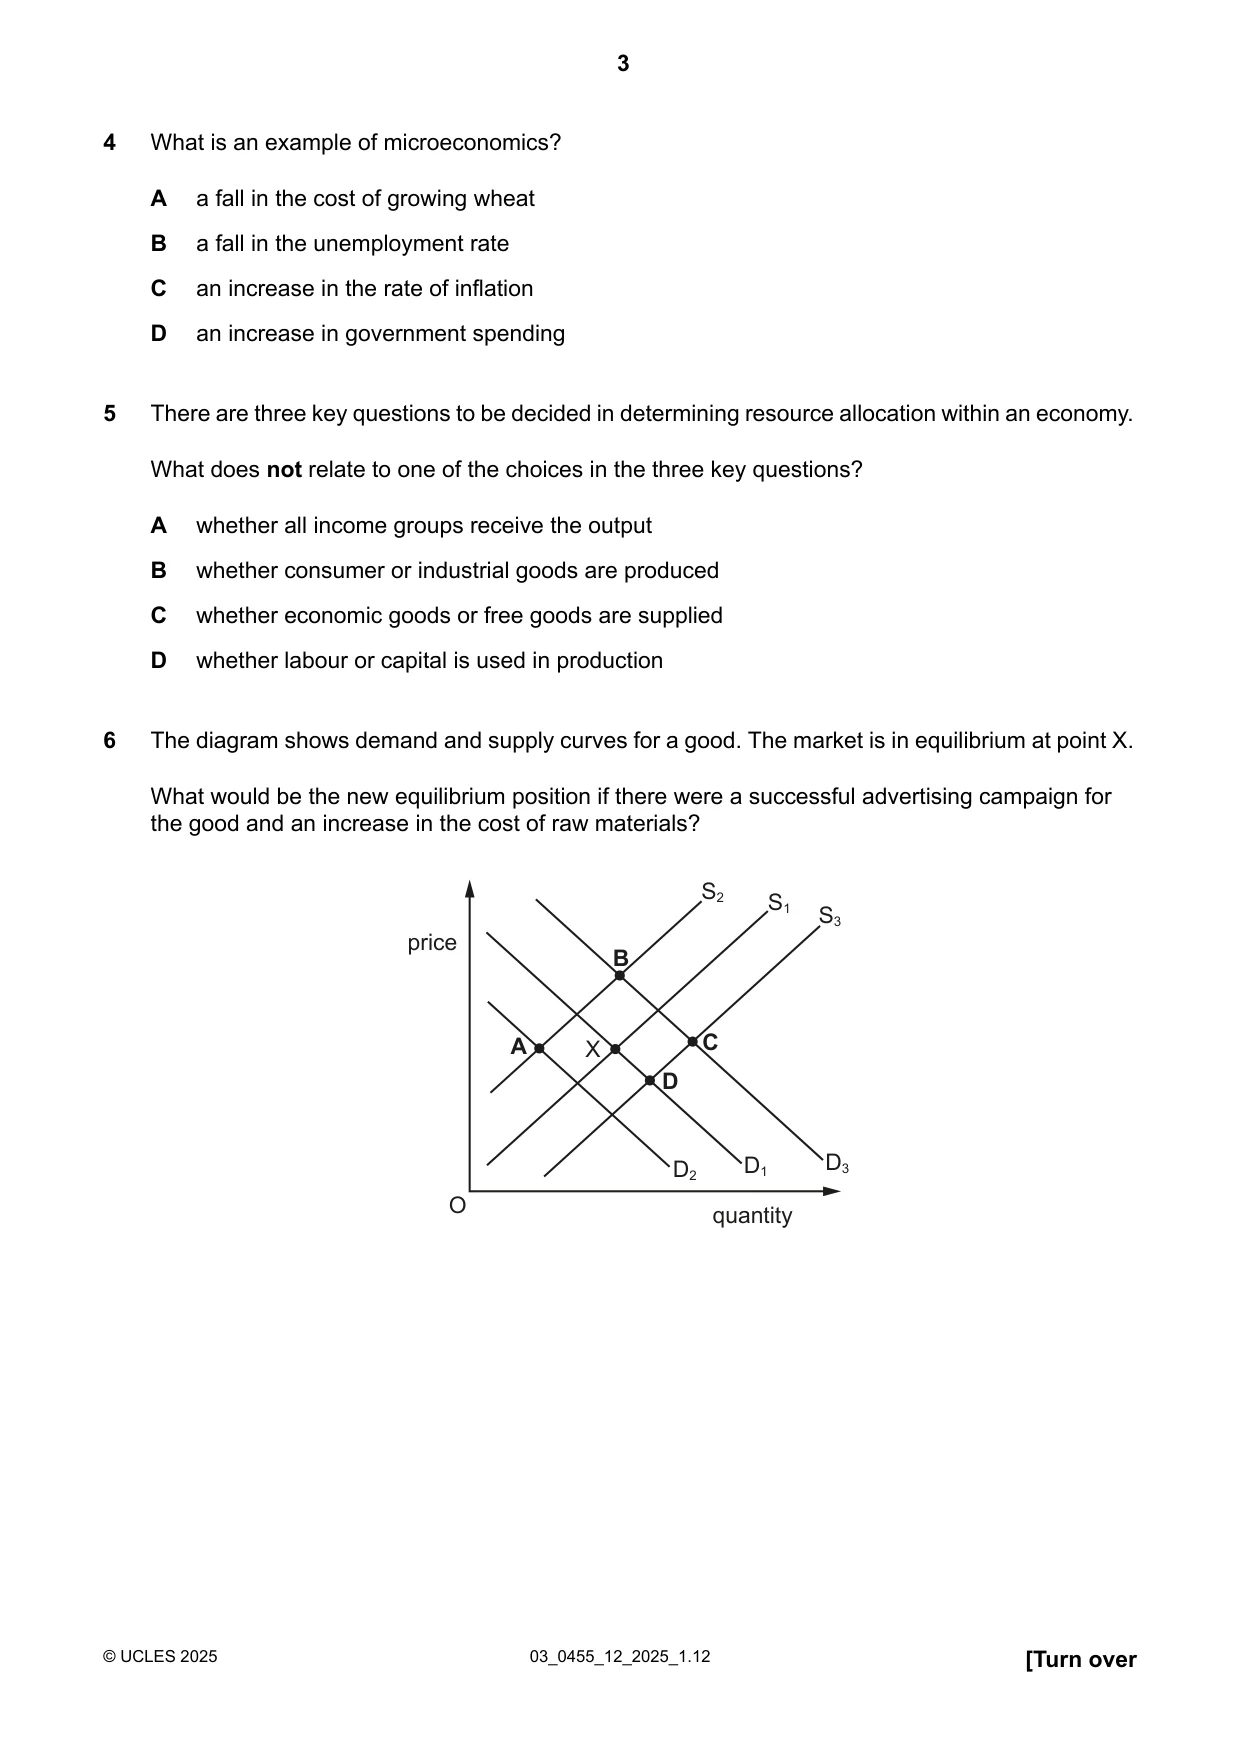
Q6 · The diagram shows demand and supply curves for a good
6 The diagram shows demand and supply curves for a good. The market is in equilibrium at point X. What would be the new equilibrium position if there were a successful advertising campaign for the good and an increase in the cost of raw materials? S2 S1 S3 price B A X C D D2 D1 D3 O quantity
Mark scheme: B
Q7 · The price elasticity of demand for smartphones is believed to be −2.0
7 The price elasticity of demand for smartphones is believed to be −2.0. A manufacturer decides to cut prices by 10%. What will be the effect of this change in price? A demand will fall by 20% B demand will rise by 5% C quantity supplied will remain unchanged D revenue will increase
Mark scheme: D
Q8 · What is a characteristic of a market economic system?
8 What is a characteristic of a market economic system? A consumers decide whether production is labour-intensive or capital-intensive B factors of production are government-owned C high levels of government intervention D land and capital are privately owned
Mark scheme: D
Q9 · A government intends to build a new road through a forest
9 A government intends to build a new road through a forest. What will be an external cost of this? A the cost of building the road B the loss suffered by those who would have used the forest C the cost of maintaining the road D the new jobs created from the construction of the road
Mark scheme: B
Q10 · Which function does a central bank provide for the general public?
10 Which function does a central bank provide for the general public? A accepting deposits B issuing banknotes C making loans D providing overdrafts
Mark scheme: B
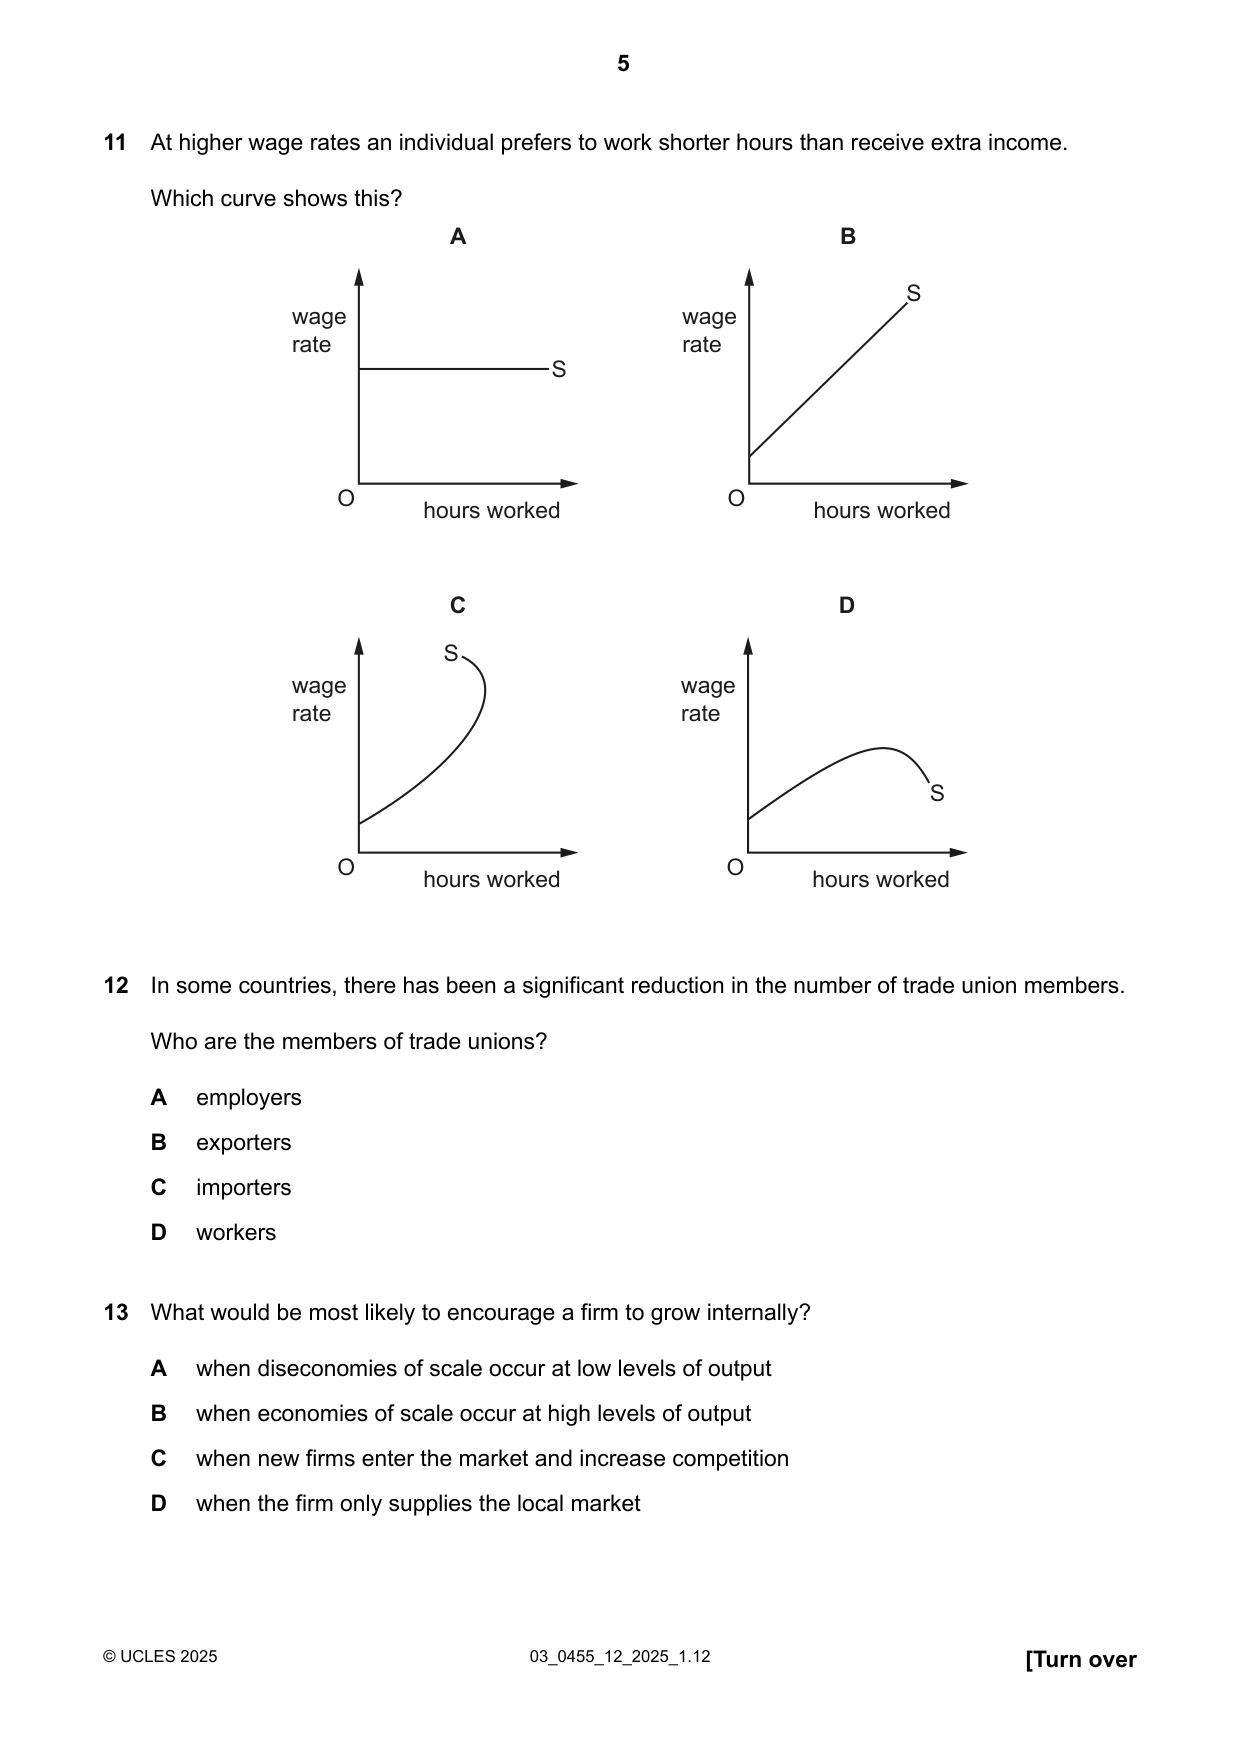
Q11 · At higher wage rates an individual prefers to work shorter hours than receive extra income
11 At higher wage rates an individual prefers to work shorter hours than receive extra income. Which curve shows this? A B S wage wage rate rate S O O hours worked hours worked C D S wage wage rate rate S O O hours worked hours worked
Mark scheme: C
Q12 · In some countries, there has been a significant reduction in the number of trade union…
12 In some countries, there has been a significant reduction in the number of trade union members. Who are the members of trade unions? A employers B exporters C importers D workers
Mark scheme: D
Q13 · What would be most likely to encourage a firm to grow internally?
13 What would be most likely to encourage a firm to grow internally? A when diseconomies of scale occur at low levels of output B when economies of scale occur at high levels of output C when new firms enter the market and increase competition D when the firm only supplies the local market
Mark scheme: B
Q14 · A car-wash firm has 3 workers
14 A car-wash firm has 3 workers. Before specialisation, each worker washed 5 cars per day. After specialisation, 30 cars per day are washed. What is the percentage increase in productivity? A 50% B 100% C 200% D 600%
Mark scheme: B
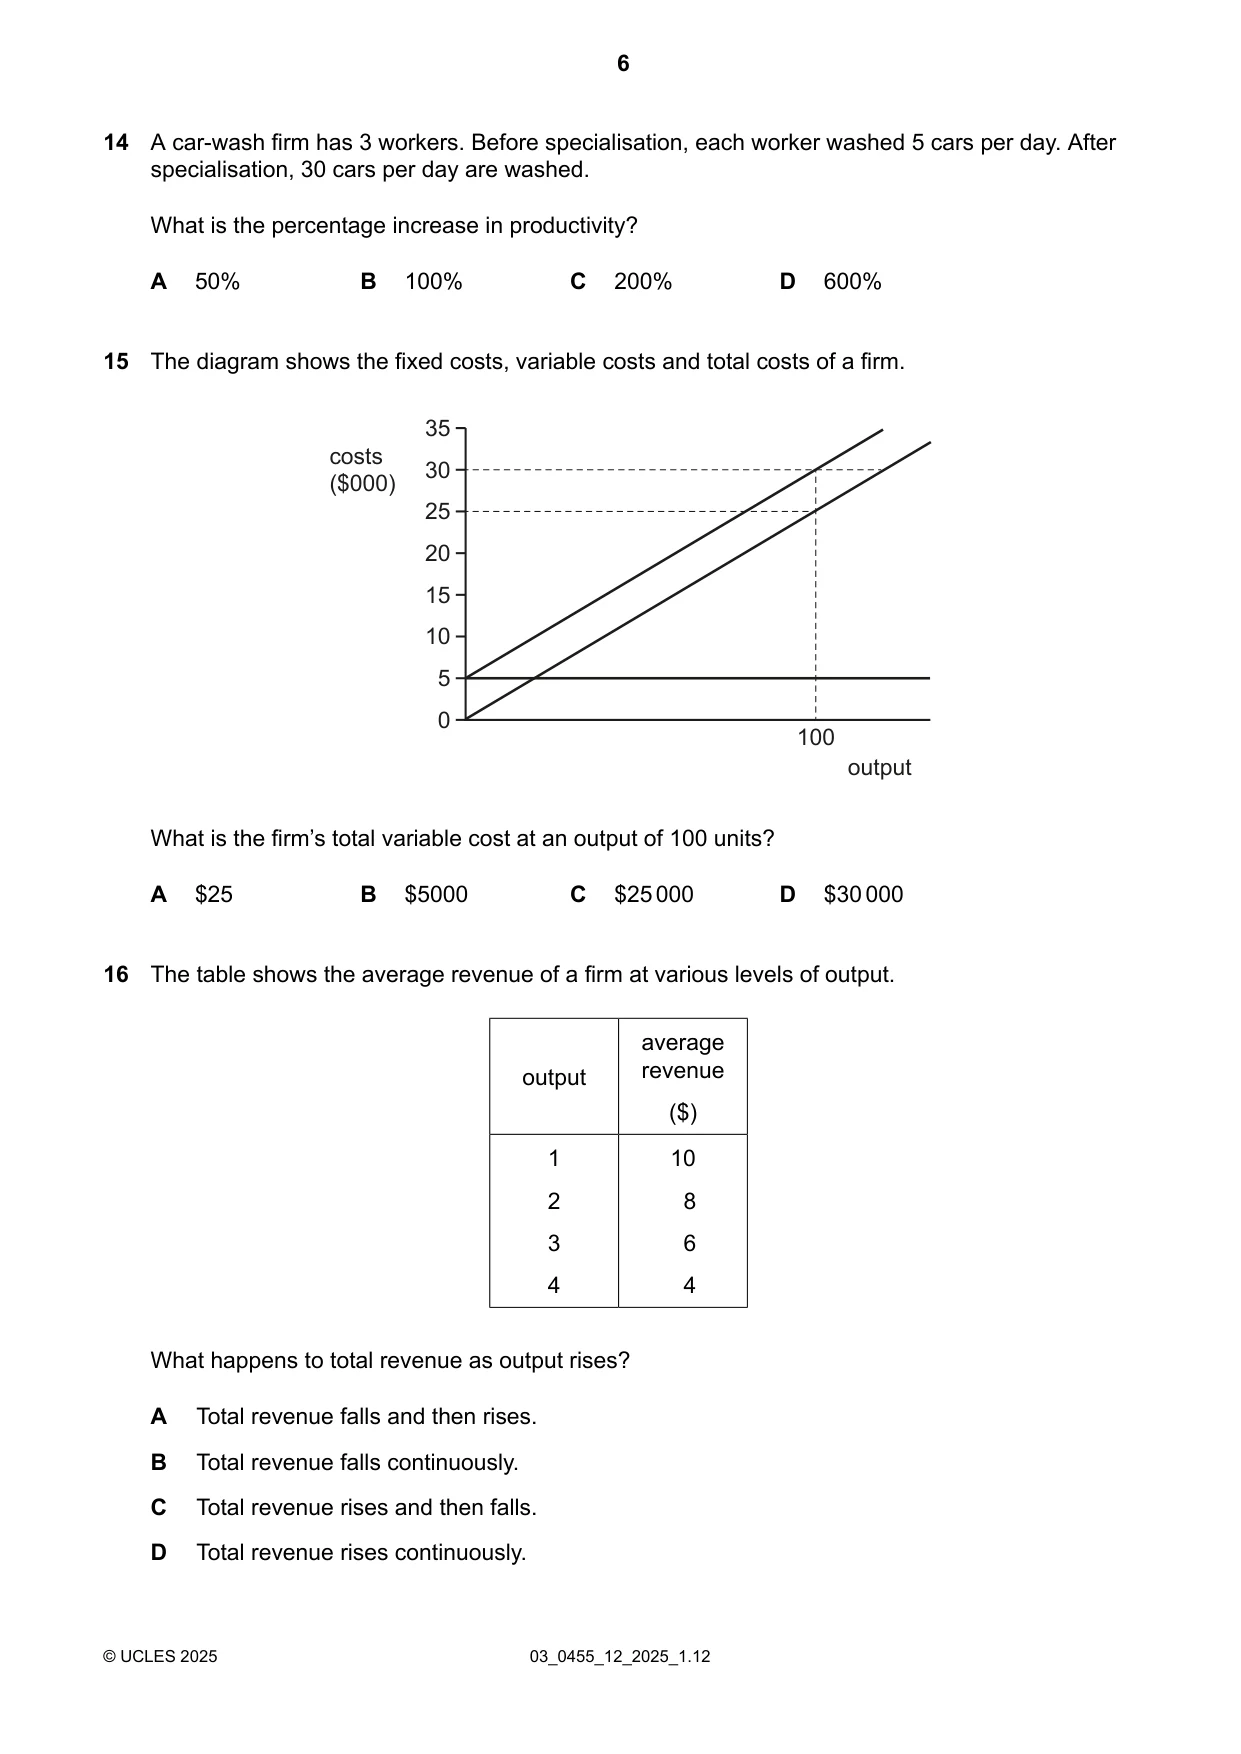
Q15 · The diagram shows the fixed costs, variable costs and total costs of a firm
15 The diagram shows the fixed costs, variable costs and total costs of a firm. 35 costs 30 ($000) 25 20 15 10 5 0 100 output What is the firm’s total variable cost at an output of 100 units? A $25 B $5000 C $25000 D $30000
Mark scheme: C
Q16 · The table shows the average revenue of a firm at various levels of output
16 The table shows the average revenue of a firm at various levels of output. average output revenue ($) 1 10 2 8 3 6 4 4 What happens to total revenue as output rises? A Total revenue falls and then rises. B Total revenue falls continuously. C Total revenue rises and then falls. D Total revenue rises continuously.
Mark scheme: C
Q17 · What is the definition of a government budget?
17 What is the definition of a government budget? A a forecast of government spending and revenue for the following financial year B an account of government taxation revenues for the current financial year C an estimate of government capital spending for the current financial year D an explanation of government spending for the following financial year
Mark scheme: A
Q18 · A government decides to increase defence expenditure and reduce direct taxes
18 A government decides to increase defence expenditure and reduce direct taxes. Which type of policy is this? A exchange rate policy B fiscal policy C monetary policy D trade protection policy
Mark scheme: B
Q19 · Governments use monetary policy such as increasing the rate of interest
19 Governments use monetary policy such as increasing the rate of interest. What is a result of increasing the rate of interest? A It creates disincentives for wage earners. B It discourages investment by entrepreneurs. C It reduces the disposable income of consumers. D It reduces government transfer payments.
Mark scheme: B
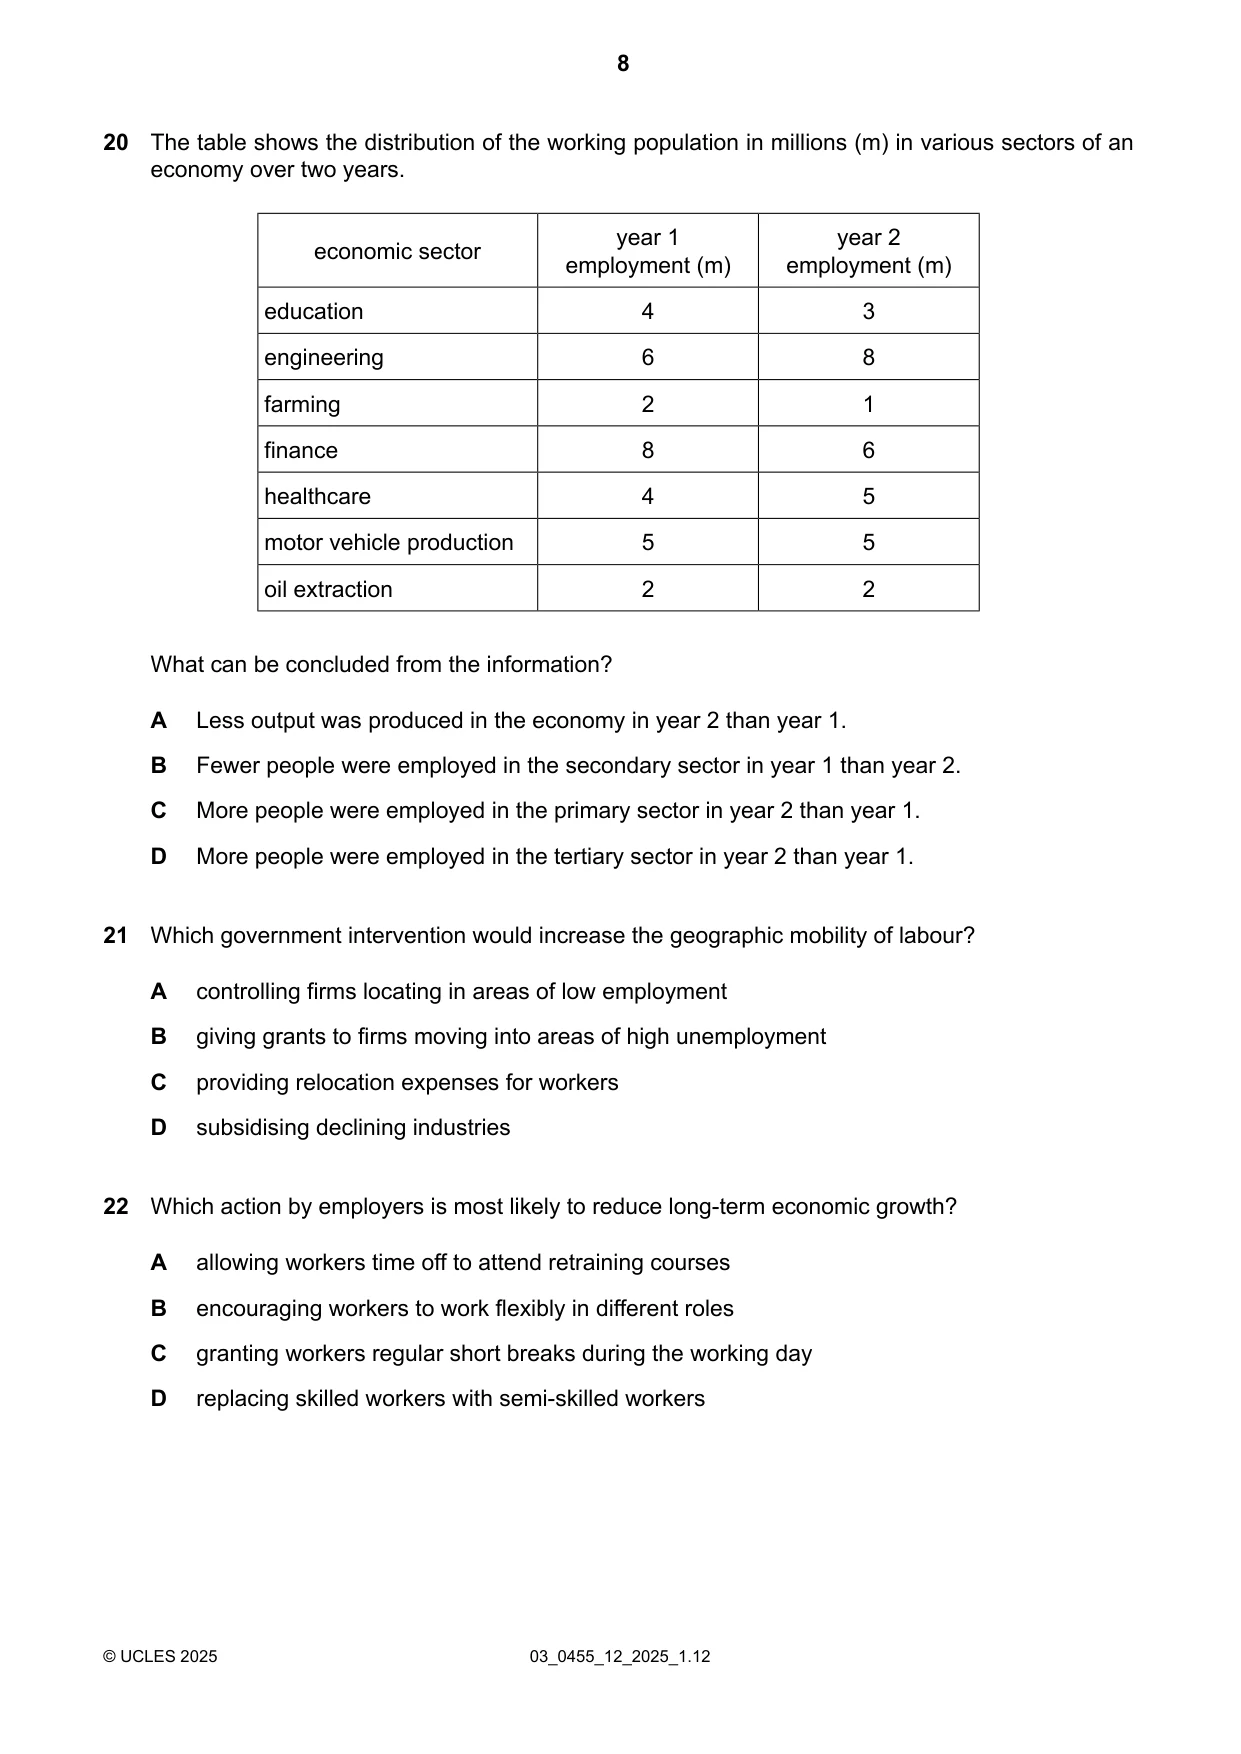
Q20 · The table shows the distribution of the working population in millions (m) in various…
20 The table shows the distribution of the working population in millions (m) in various sectors of an economy over two years. year 1 year 2 economic sector employment (m) employment (m) education 4 3 engineering 6 8 farming 2 1 finance 8 6 healthcare 4 5 motor vehicle production 5 5 oil extraction 2 2 What can be concluded from the information? A Less output was produced in the economy in year 2 than year 1. B Fewer people were employed in the secondary sector in year 1 than year 2. C More people were employed in the primary sector in year 2 than year 1. D More people were employed in the tertiary sector in year 2 than year 1.
Mark scheme: B
Q21 · Which government intervention would increase the geographic mobility of labour?
21 Which government intervention would increase the geographic mobility of labour? A controlling firms locating in areas of low employment B giving grants to firms moving into areas of high unemployment C providing relocation expenses for workers D subsidising declining industries
Mark scheme: C
Q22 · Which action by employers is most likely to reduce long-term economic growth?
22 Which action by employers is most likely to reduce long-term economic growth? A allowing workers time off to attend retraining courses B encouraging workers to work flexibly in different roles C granting workers regular short breaks during the working day D replacing skilled workers with semi-skilled workers
Mark scheme: D
Q23 · The table shows the weights attached to various categories of goods in a Consumer Prices…
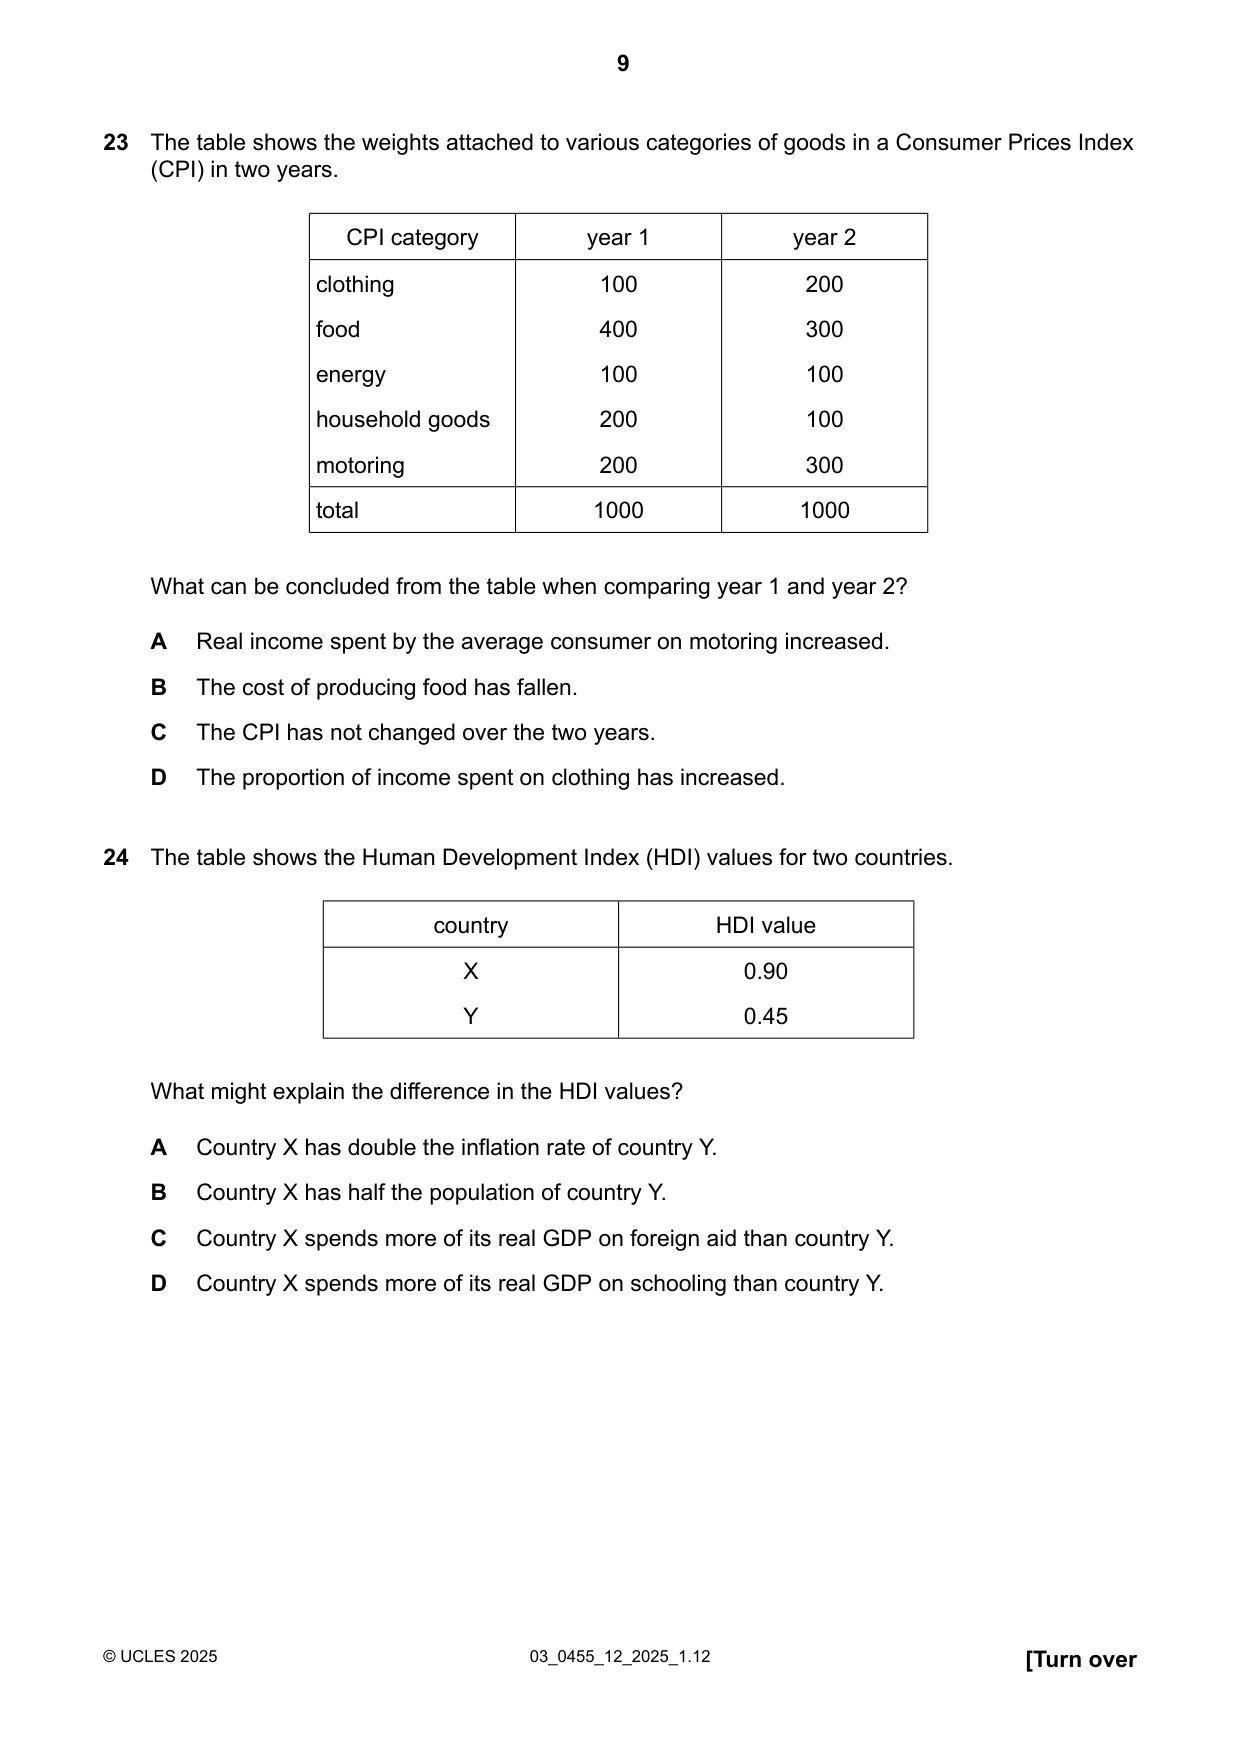
23 The table shows the weights attached to various categories of goods in a Consumer Prices Index (CPI) in two years. CPI category year 1 year 2 clothing 100 200 food 400 300 energy 100 100 household goods 200 100 motoring 200 300 total 1000 1000 What can be concluded from the table when comparing year 1 and year 2? A Real income spent by the average consumer on motoring increased. B The cost of producing food has fallen. C The CPI has not changed over the two years. D The proportion of income spent on clothing has increased.
Mark scheme: D
Q24 · The table shows the Human Development Index (HDI) values for two countries
24 The table shows the Human Development Index (HDI) values for two countries. country HDI value X 0.90 Y 0.45 What might explain the difference in the HDI values? A Country X has double the inflation rate of country Y. B Country X has half the population of country Y. C Country X spends more of its real GDP on foreign aid than country Y. D Country X spends more of its real GDP on schooling than country Y.
Mark scheme: D
More questions on Differences in economic development between countries
Q25 · Wealthy countries have people who live in relative poverty
25 Wealthy countries have people who live in relative poverty. What is the most likely cause of this? A generous state pensions B low national minimum wage C progressive taxation D subsidised healthcare
Mark scheme: B
Q26 · The diagram shows population data for a country for 1950, 2005 and 2050
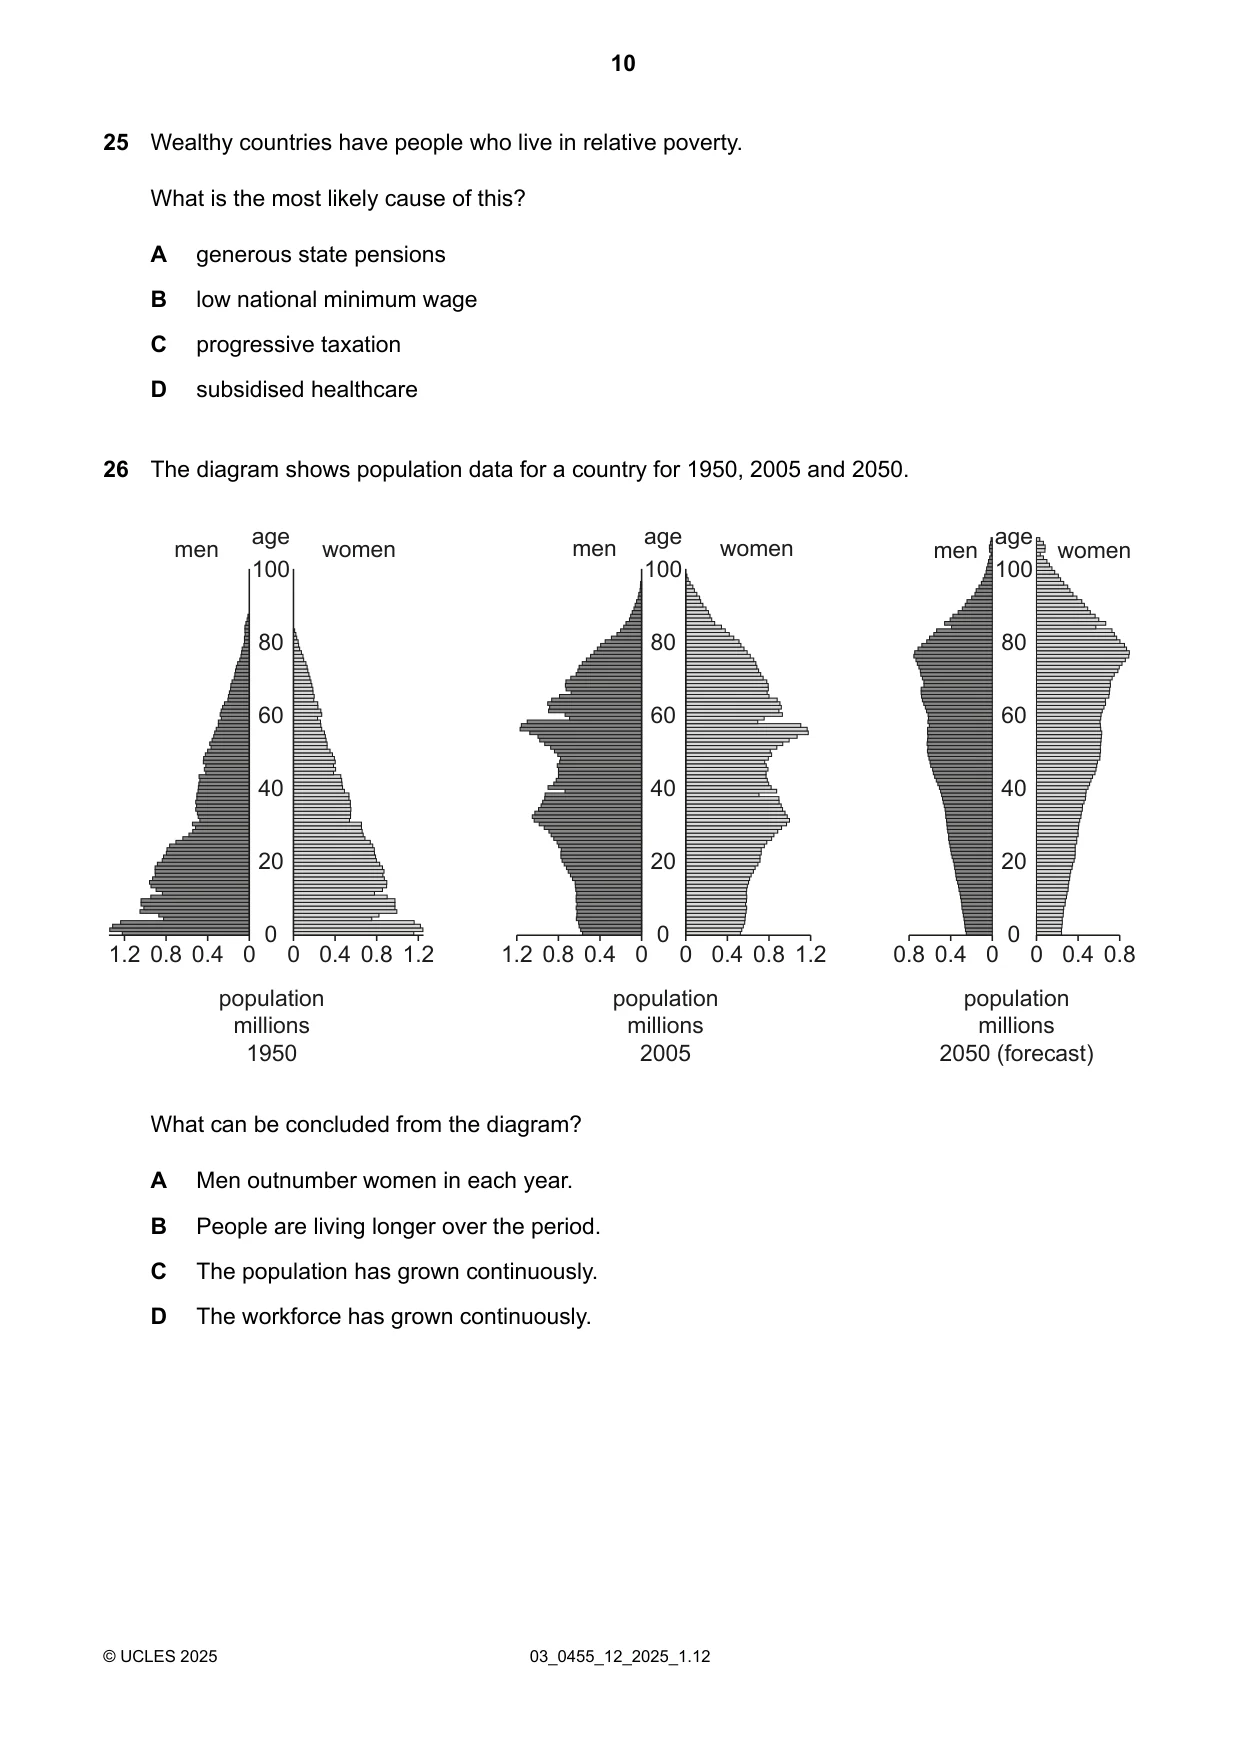
26 The diagram shows population data for a country for 1950, 2005 and 2050. age age age men women men women men women 100 100 100 80 80 80 60 60 60 40 40 40 20 20 20 0 0 0 1.2 0.8 0.4 0 0 0.4 0.8 1.2 1.2 0.8 0.4 0 0 0.4 0.8 1.2 0.8 0.4 0 0 0.4 0.8 population population population millions millions millions 1950 2005 2050 (forecast) What can be concluded from the diagram? A Men outnumber women in each year. B People are living longer over the period. C The population has grown continuously. D The workforce has grown continuously.
Mark scheme: B
Q27 · A country has large reserves of oil
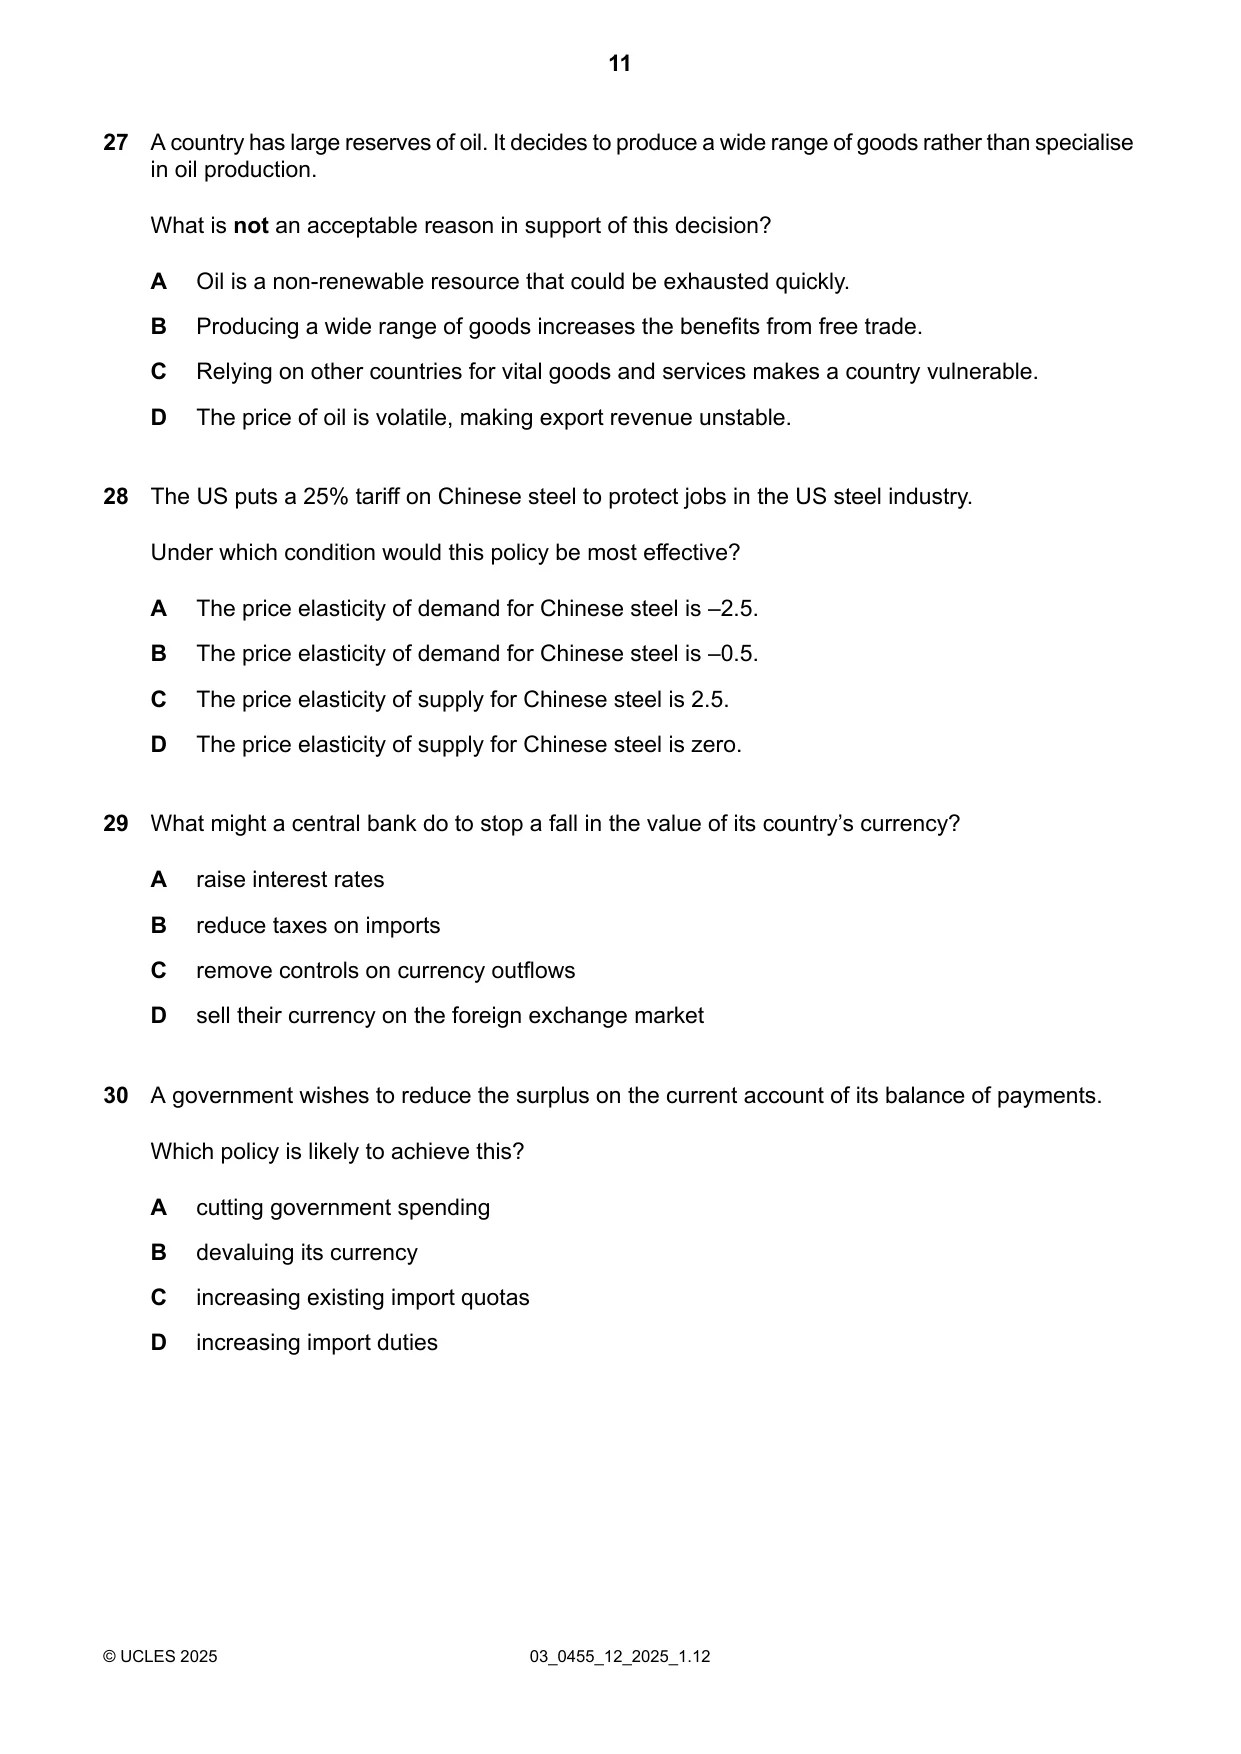
27 A country has large reserves of oil. It decides to produce a wide range of goods rather than specialise in oil production. What is not an acceptable reason in support of this decision? A Oil is a non-renewable resource that could be exhausted quickly. B Producing a wide range of goods increases the benefits from free trade. C Relying on other countries for vital goods and services makes a country vulnerable. D The price of oil is volatile, making export revenue unstable.
Mark scheme: B
Q28 · The US puts a 25% tariff on Chinese steel to protect jobs in the US steel industry
28 The US puts a 25% tariff on Chinese steel to protect jobs in the US steel industry. Under which condition would this policy be most effective? A The price elasticity of demand for Chinese steel is –2.5. B The price elasticity of demand for Chinese steel is –0.5. C The price elasticity of supply for Chinese steel is 2.5. D The price elasticity of supply for Chinese steel is zero.
Mark scheme: A
Q29 · What might a central bank do to stop a fall in the value of its country’s currency?
29 What might a central bank do to stop a fall in the value of its country’s currency? A raise interest rates B reduce taxes on imports C remove controls on currency outflows D sell their currency on the foreign exchange market
Mark scheme: A
Q30 · A government wishes to reduce the surplus on the current account of its balance of…
30 A government wishes to reduce the surplus on the current account of its balance of payments. Which policy is likely to achieve this? A cutting government spending B devaluing its currency C increasing existing import quotas D increasing import duties
Mark scheme: C
What was in this paper
The subtopics covered by these 30 questions, and how many questions each got. Open one in a new tab to see every Cambridge question on it.
2Firms’ costs, revenue and objectives2Fiscal policy2Current account of balance of payments1Differences in economic development between countries1Economic growth1Employment and unemployment1Firms and production1Foreign exchange rates1Globalisation, free trade and protection1Inflation and deflation1International specialisation1Market economic system1Market failure1Microeconomics and macroeconomics1Monetary policy1Money and banking1Opportunity cost1Population1Poverty1Price changes1Price elasticity of demand (PED)1Production possibility curve (PPC) diagrams1The factors of production1The nature of the economic problem1Trade unions1Workers1What you needed in this session
Cambridge’s own grade thresholds for 2025 Feb/March, Paper 1 · Variant 2. A higher threshold means an easier paper — the bar moves with how the cohort did.