Cambridge IGCSE Economics 0455 — 2017 Feb/March Paper 1 · Variant 2
0455/12/F/M/17 · 30 questions · 30 marks · ≈34 min
The question paper and its mark scheme, free to read here and free to download. This is Cambridge’s own paper, exactly as it was sat.
Question paper12 pages
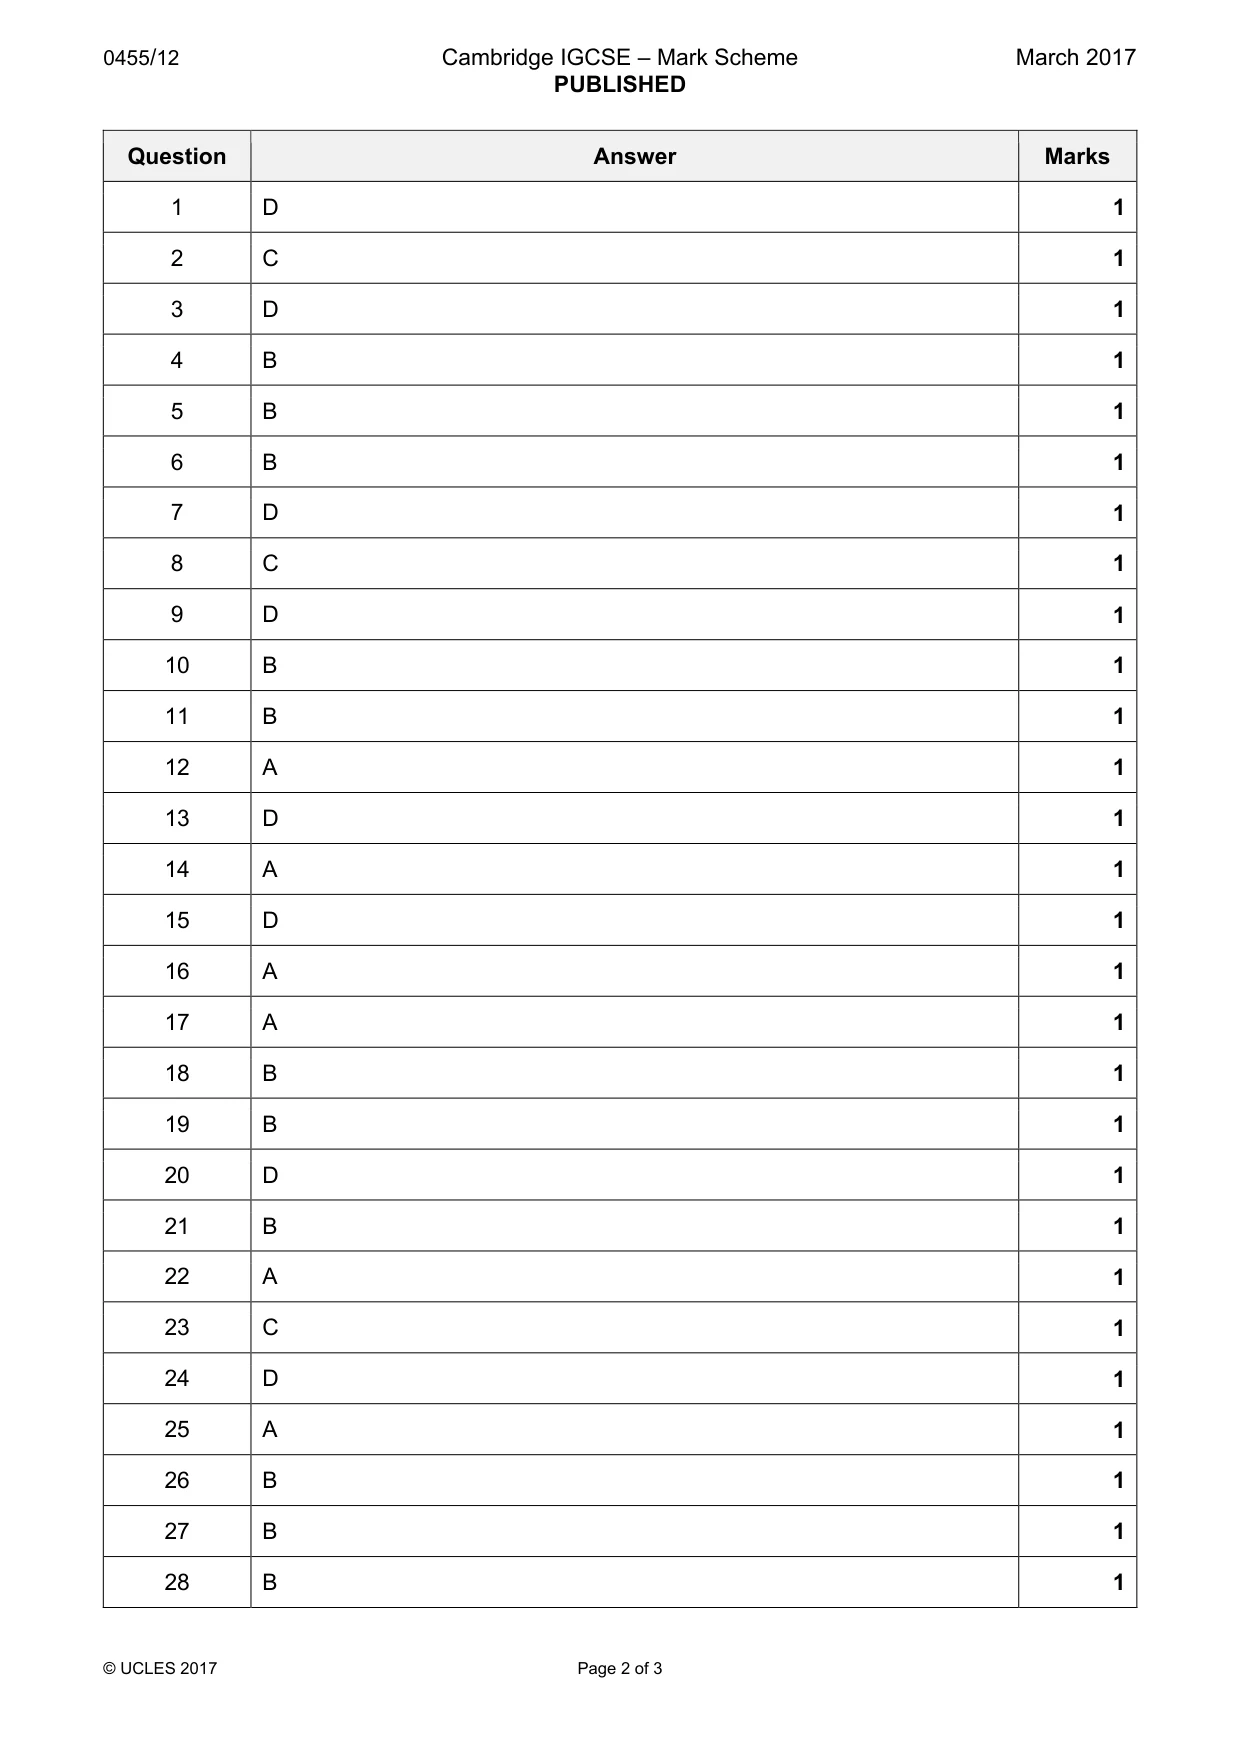
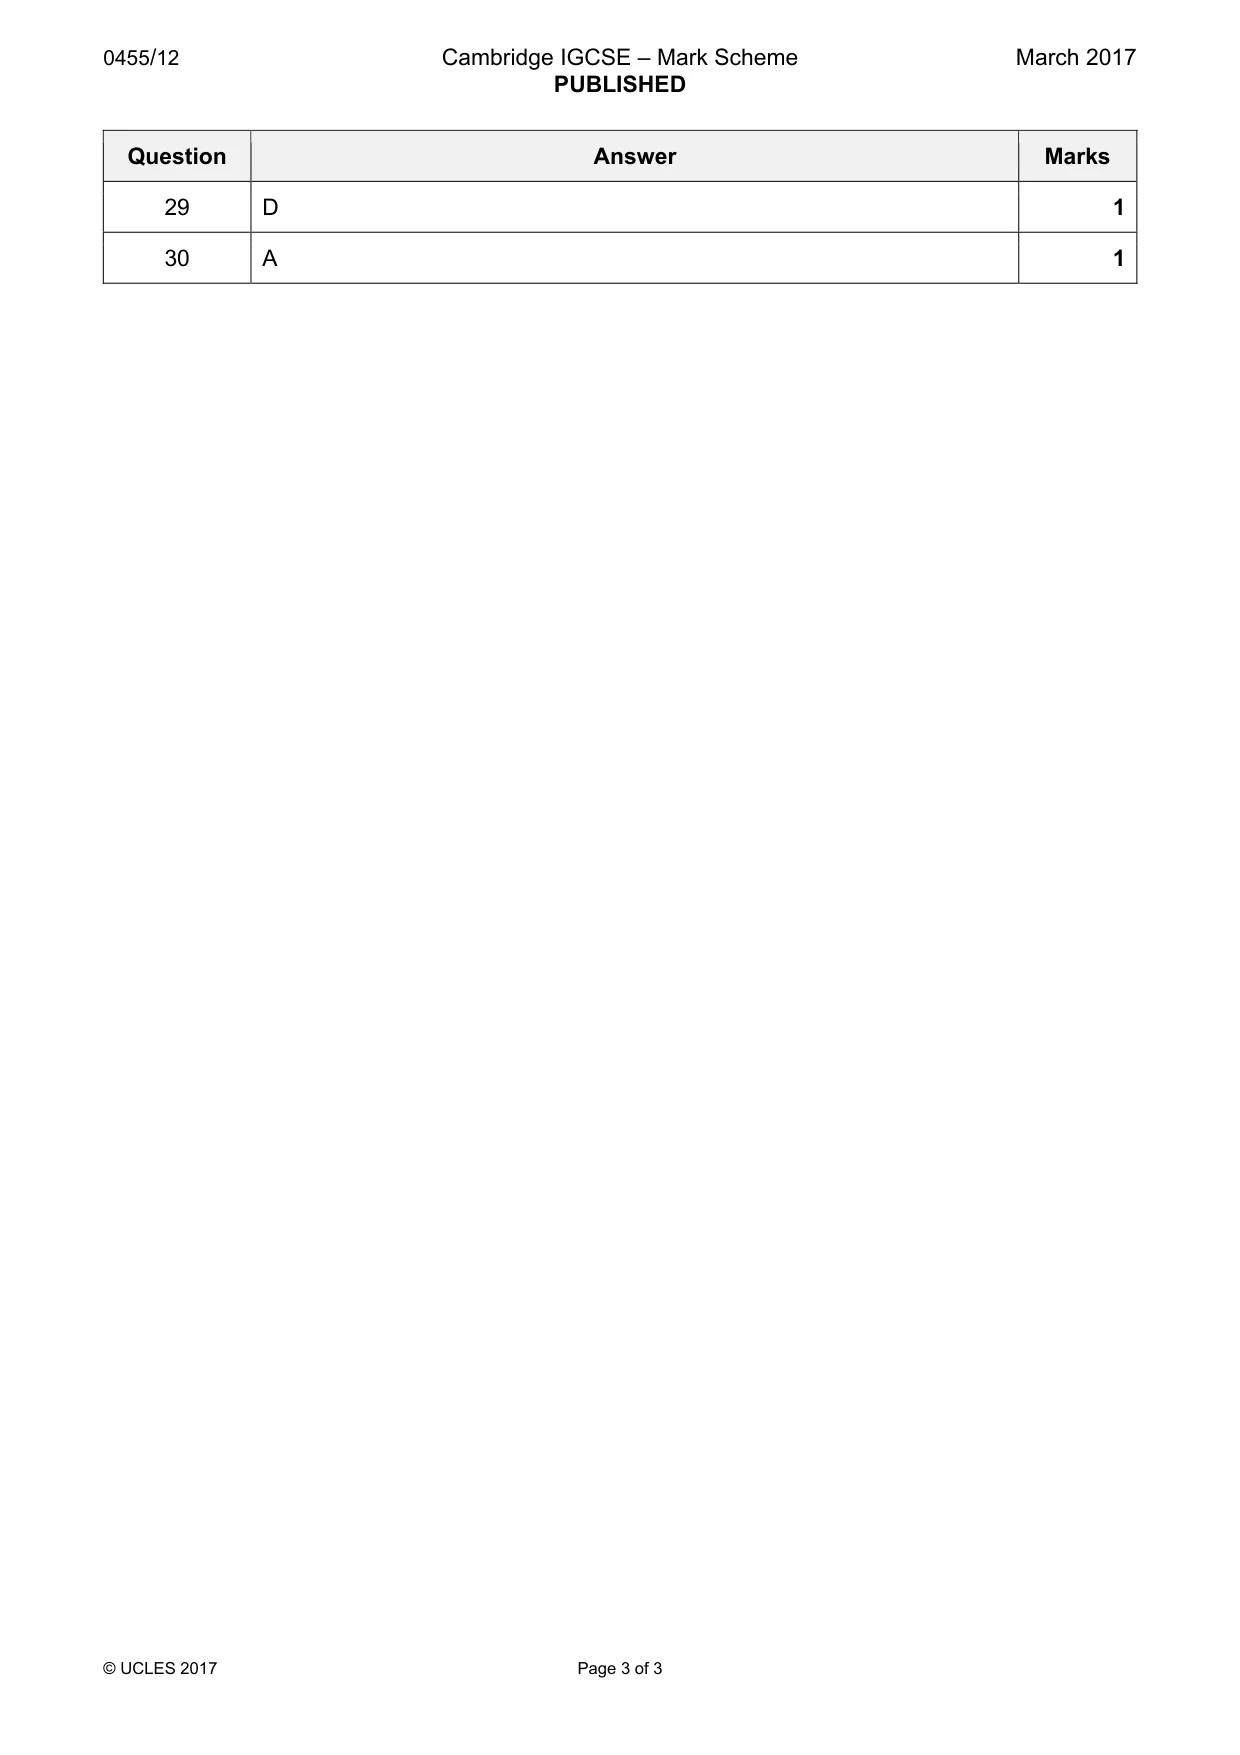
Mark scheme3 pages
Answers below. Sit the paper first if you are practising.
Questions as text
Q1 · A person bought a shop and stocked it with fresh fruit
1 A person bought a shop and stocked it with fresh fruit. He employed one member of his family to help in the shop. Which factors of production have been used? A labour and capital only B labour, capital and enterprise only C land and labour only D land, labour, capital and enterprise
Mark scheme: D
Q2 · The diagram shows a production possibility curve for a country
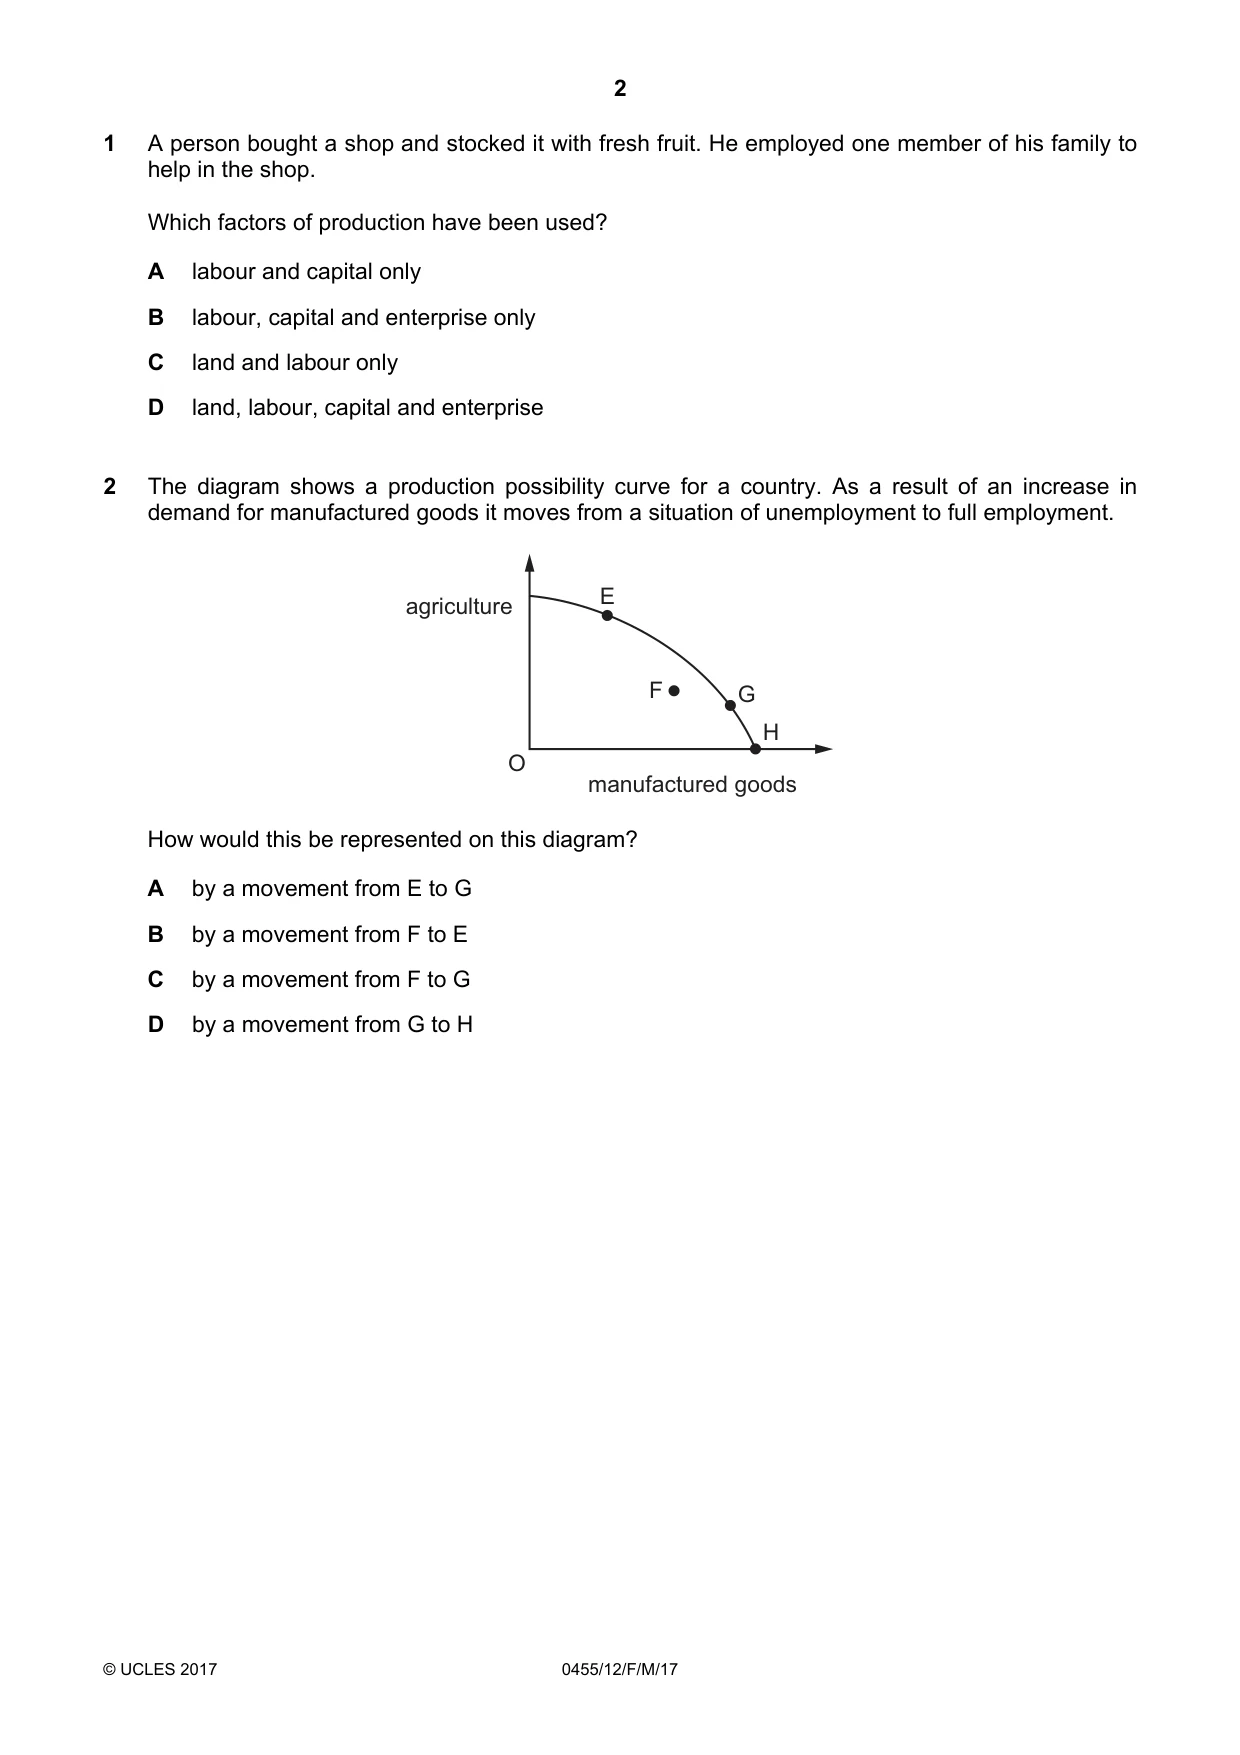
2 The diagram shows a production possibility curve for a country. As a result of an increase in demand for manufactured goods it moves from a situation of unemployment to full employment. agriculture E F G H O manufactured goods How would this be represented on this diagram? A by a movement from E to G B by a movement from F to E C by a movement from F to G D by a movement from G to H
Mark scheme: C
More questions on Production possibility curve (PPC) diagrams
Q3 · The diagram shows the choices for an individual between leisure and earnings
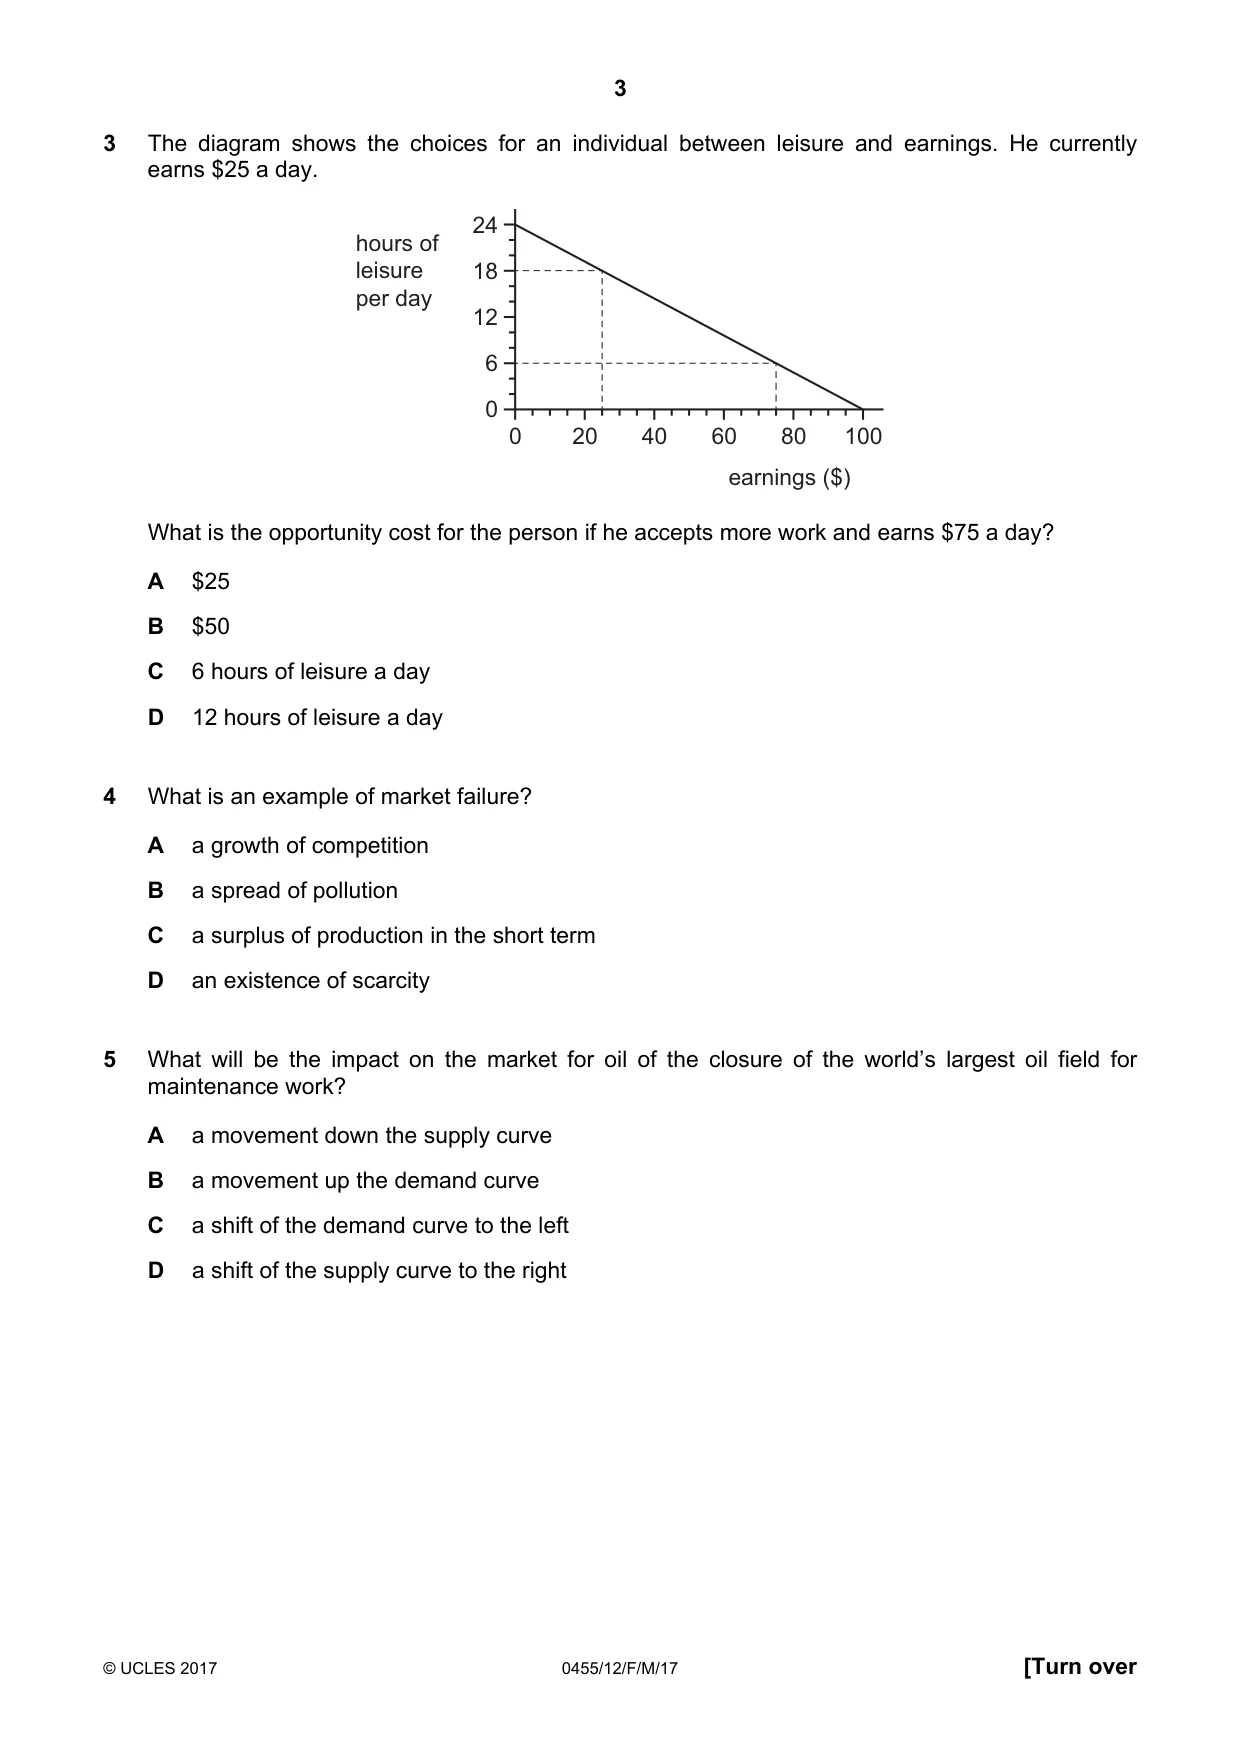
3 The diagram shows the choices for an individual between leisure and earnings. He currently earns $25 a day. 24 hours of leisure 18 per day 12 6 0 0 20 40 60 80 100 earnings ($) What is the opportunity cost for the person if he accepts more work and earns $75 a day? A $25 B $50 C 6 hours of leisure a day D 12 hours of leisure a day
Mark scheme: D
Q4 · What is an example of market failure?
4 What is an example of market failure? A a growth of competition B a spread of pollution C a surplus of production in the short term D an existence of scarcity
Mark scheme: B
Q5 · What will be the impact on the market for oil of the closure of the world’s largest oil…
5 What will be the impact on the market for oil of the closure of the world’s largest oil field for maintenance work? A a movement down the supply curve B a movement up the demand curve C a shift of the demand curve to the left D a shift of the supply curve to the right
Mark scheme: B
Q6 · The diagram shows a market for rice that is in equilibrium
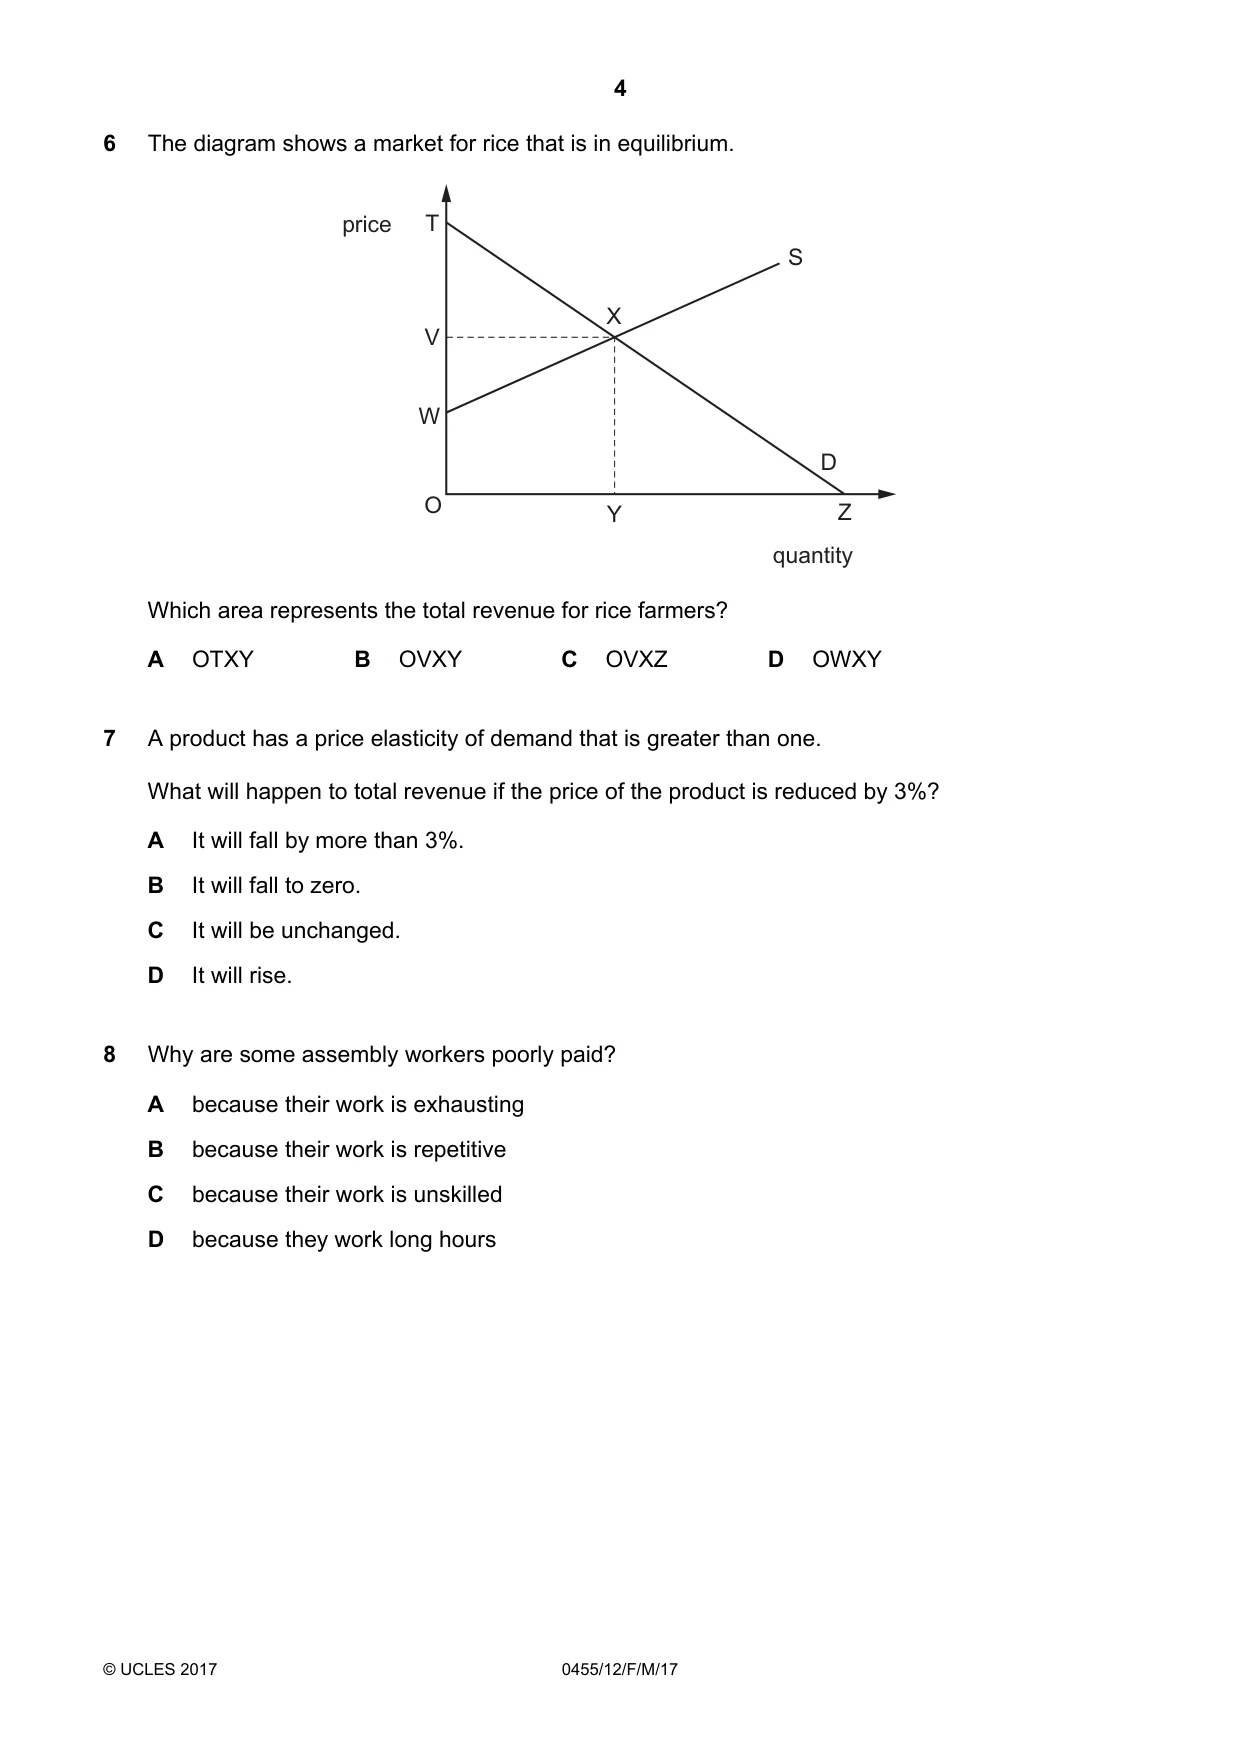
6 The diagram shows a market for rice that is in equilibrium. price T S X V W D O Y Z quantity Which area represents the total revenue for rice farmers? A OTXY B OVXY C OVXZ D OWXY
Mark scheme: B
Q7 · A product has a price elasticity of demand that is greater than one
7 A product has a price elasticity of demand that is greater than one. What will happen to total revenue if the price of the product is reduced by 3%? A It will fall by more than 3%. B It will fall to zero. C It will be unchanged. D It will rise.
Mark scheme: D
Q8 · Why are some assembly workers poorly paid?
8 Why are some assembly workers poorly paid? A because their work is exhausting B because their work is repetitive C because their work is unskilled D because they work long hours
Mark scheme: C
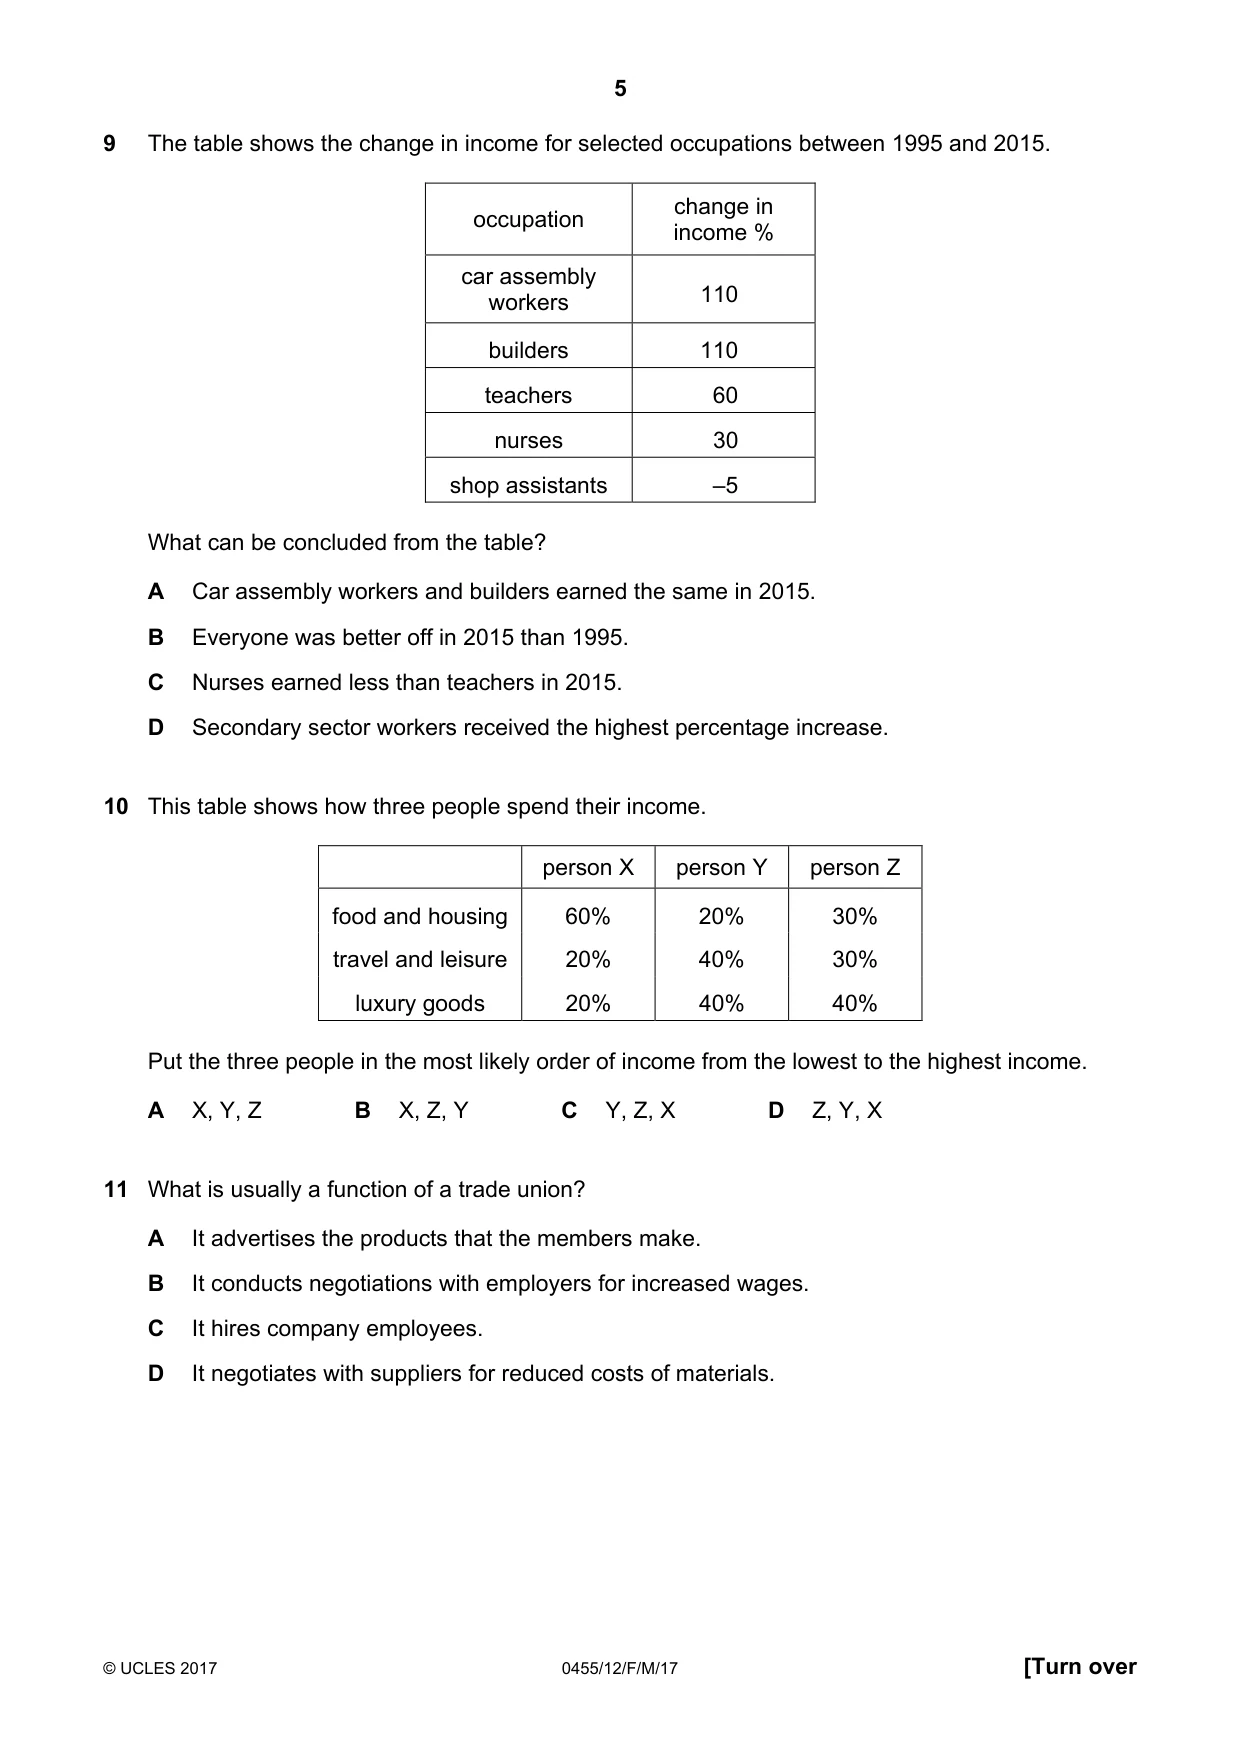
Q9 · The table shows the change in income for selected occupations between 1995 and 2015
9 The table shows the change in income for selected occupations between 1995 and 2015. change in occupation income % car assembly workers 110 builders 110 teachers 60 nurses 30 shop assistants –5 What can be concluded from the table? A Car assembly workers and builders earned the same in 2015. B Everyone was better off in 2015 than 1995. C Nurses earned less than teachers in 2015. D Secondary sector workers received the highest percentage increase.
Mark scheme: D
Q10 · This table shows how three people spend their income
10 This table shows how three people spend their income. person X person Y person Z food and housing 60% 20% 30% travel and leisure 20% 40% 30% luxury goods 20% 40% 40% Put the three people in the most likely order of income from the lowest to the highest income. A X, Y, Z B X, Z, Y C Y, Z, X D Z, Y, X
Mark scheme: B
Q11 · What is usually a function of a trade union?
11 What is usually a function of a trade union? A It advertises the products that the members make. B It conducts negotiations with employers for increased wages. C It hires company employees. D It negotiates with suppliers for reduced costs of materials.
Mark scheme: B
Q12 · A firm’s aim is to become a monopoly supplier
12 A firm’s aim is to become a monopoly supplier. Which policy is it most likely to use to eliminate competition? A adopt price reductions and advertising B avoid diseconomies of scale C maximise output and profit D reduce financial barriers to entry
Mark scheme: A
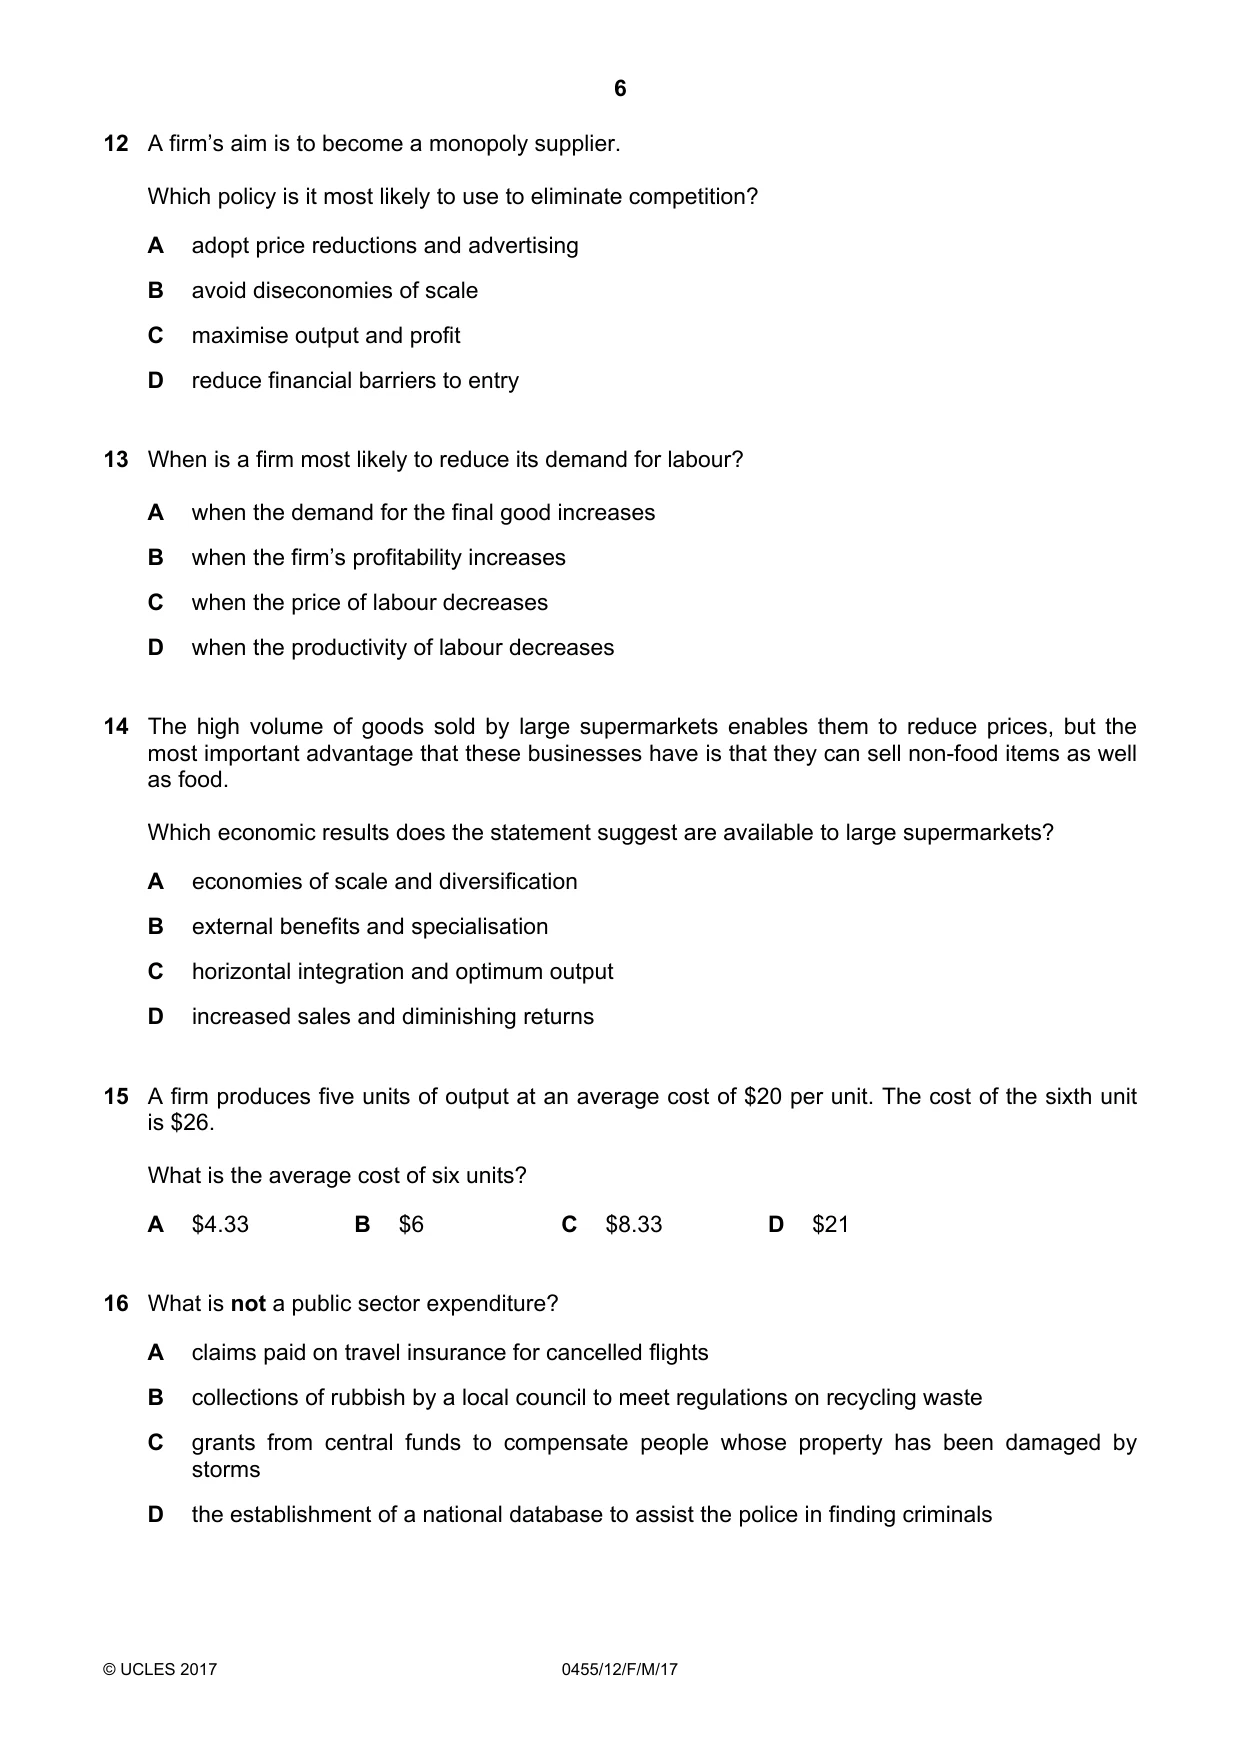
Q13 · When is a firm most likely to reduce its demand for labour?
13 When is a firm most likely to reduce its demand for labour? A when the demand for the final good increases B when the firm’s profitability increases C when the price of labour decreases D when the productivity of labour decreases
Mark scheme: D
Q14 · The high volume of goods sold by large supermarkets enables them to reduce prices, but…
14 The high volume of goods sold by large supermarkets enables them to reduce prices, but the most important advantage that these businesses have is that they can sell non-food items as well as food. Which economic results does the statement suggest are available to large supermarkets? A economies of scale and diversification B external benefits and specialisation C horizontal integration and optimum output D increased sales and diminishing returns
Mark scheme: A
Q15 · A firm produces five units of output at an average cost of $20 per unit
15 A firm produces five units of output at an average cost of $20 per unit. The cost of the sixth unit is $26. What is the average cost of six units? A $4.33 B $6 C $8.33 D $21
Mark scheme: D
Q16 · What is not a public sector expenditure?
16 What is not a public sector expenditure? A claims paid on travel insurance for cancelled flights B collections of rubbish by a local council to meet regulations on recycling waste C grants from central funds to compensate people whose property has been damaged by storms D the establishment of a national database to assist the police in finding criminals
Mark scheme: A
Q17 · The Indian government uses direct and indirect taxation
17 The Indian government uses direct and indirect taxation. Which is a direct tax? A corporate (profits) tax B customs duty C goods and services tax D petrol tax
Mark scheme: A
Q18 · A worker earns $60 000 a year and pays 25% income tax
18 A worker earns $60 000 a year and pays 25% income tax. He spent $2000 on furniture and $5000 on a computer and paid 20% sales tax on each. How much indirect tax did he pay? A $1000 B $1400 C $15 000 D $16 400
Mark scheme: B
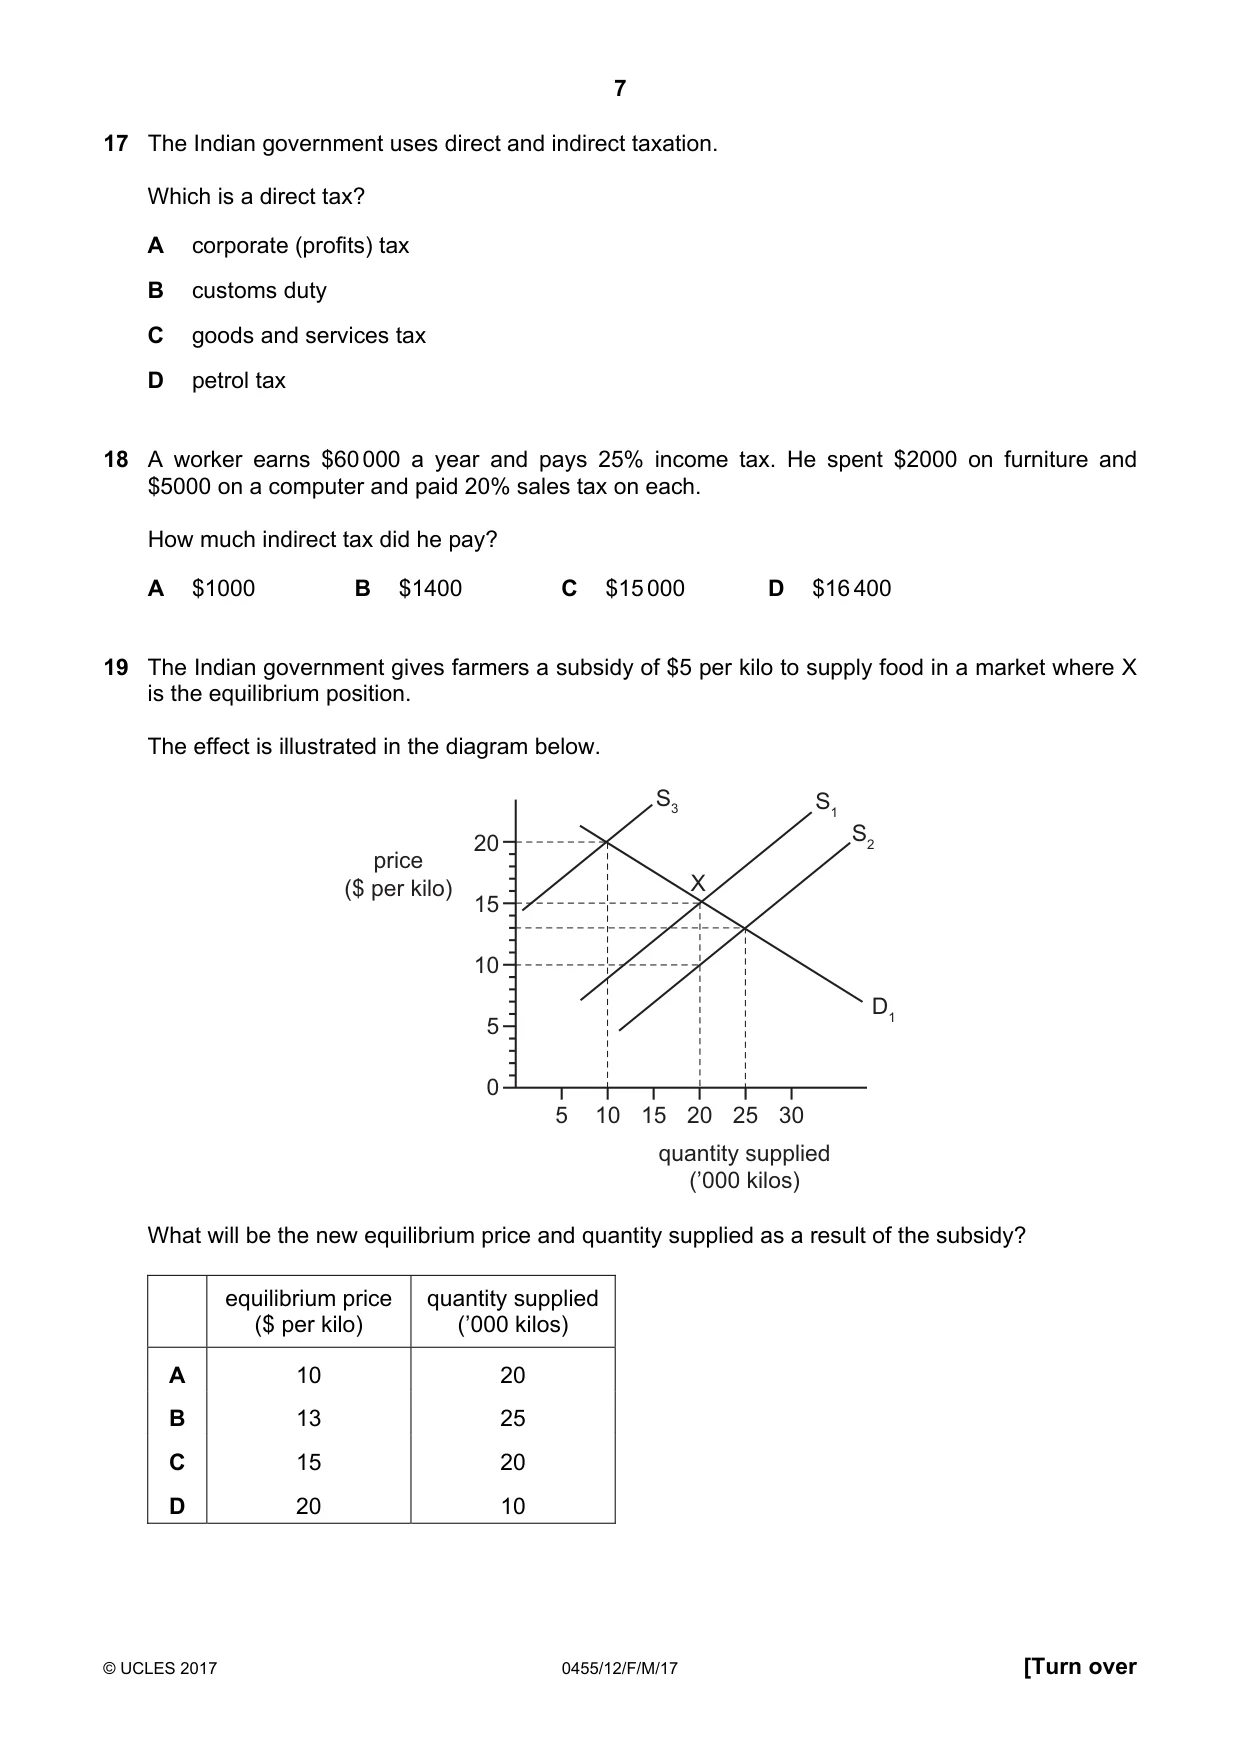
Q19 · The Indian government gives farmers a subsidy of $5 per kilo to supply food in a market…
19 The Indian government gives farmers a subsidy of $5 per kilo to supply food in a market where X is the equilibrium position. The effect is illustrated in the diagram below. S3 S1 20 S2 price ($ per kilo) X 15 10 D1 5 0 5 10 15 20 25 30 quantity supplied (’000 kilos) What will be the new equilibrium price and quantity supplied as a result of the subsidy? equilibrium price quantity supplied ($ per kilo) (’000 kilos) A 10 20 B 13 25 C 15 20 D 20 10
Mark scheme: B
Q20 · What may cause an immediate decrease in the working population?
20 What may cause an immediate decrease in the working population? A a falling death rate B a falling infant mortality rate C a rising birth rate D a rising rate of net emigration
Mark scheme: D
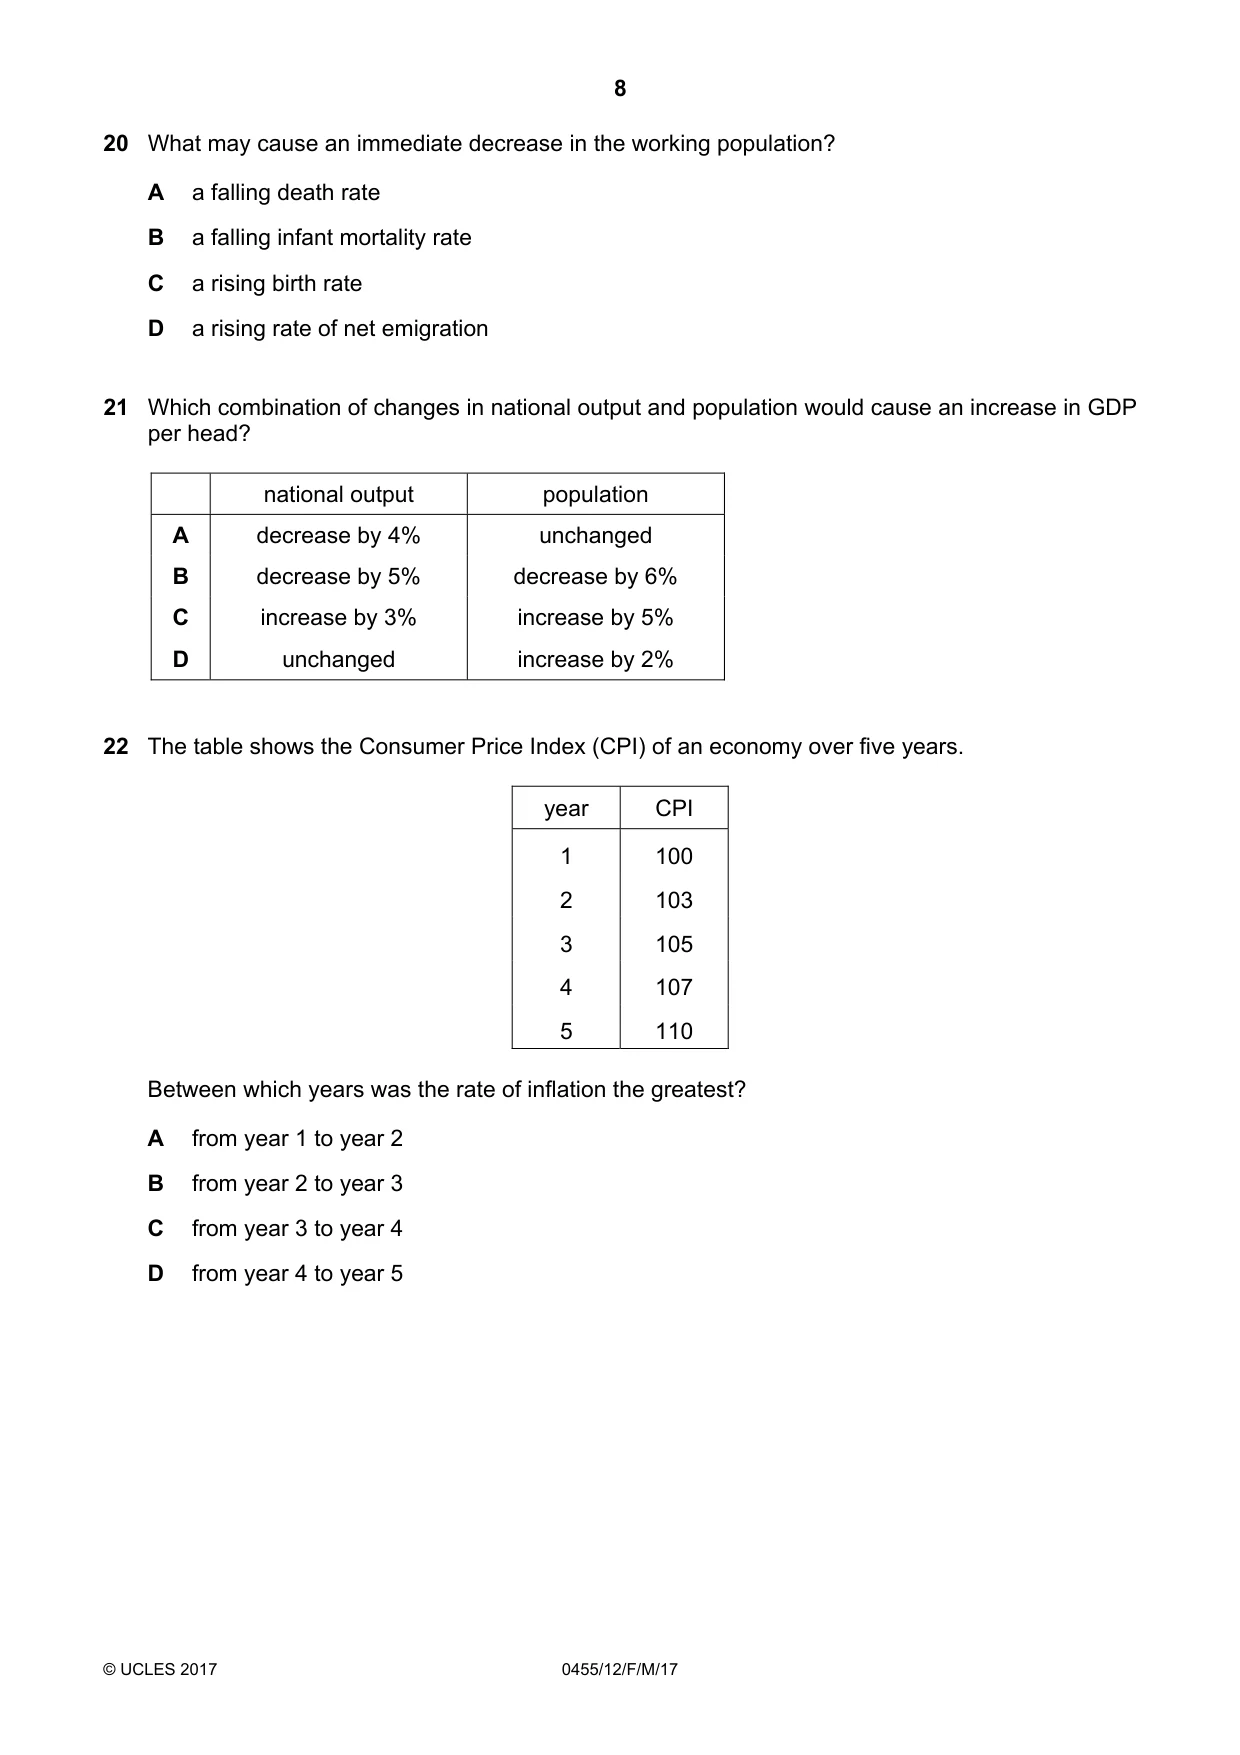
Q21 · Which combination of changes in national output and population would cause an increase in…
21 Which combination of changes in national output and population would cause an increase in GDP per head? national output population A decrease by 4% unchanged B decrease by 5% decrease by 6% C increase by 3% increase by 5% D unchanged increase by 2%
Mark scheme: B
Q22 · The table shows the Consumer Price Index (CPI) of an economy over five years
22 The table shows the Consumer Price Index (CPI) of an economy over five years. year CPI 1 100 2 103 3 105 4 107 5 110 Between which years was the rate of inflation the greatest? A from year 1 to year 2 B from year 2 to year 3 C from year 3 to year 4 D from year 4 to year 5
Mark scheme: A
Q23 · In a year the rate of inflation in a country was 3%
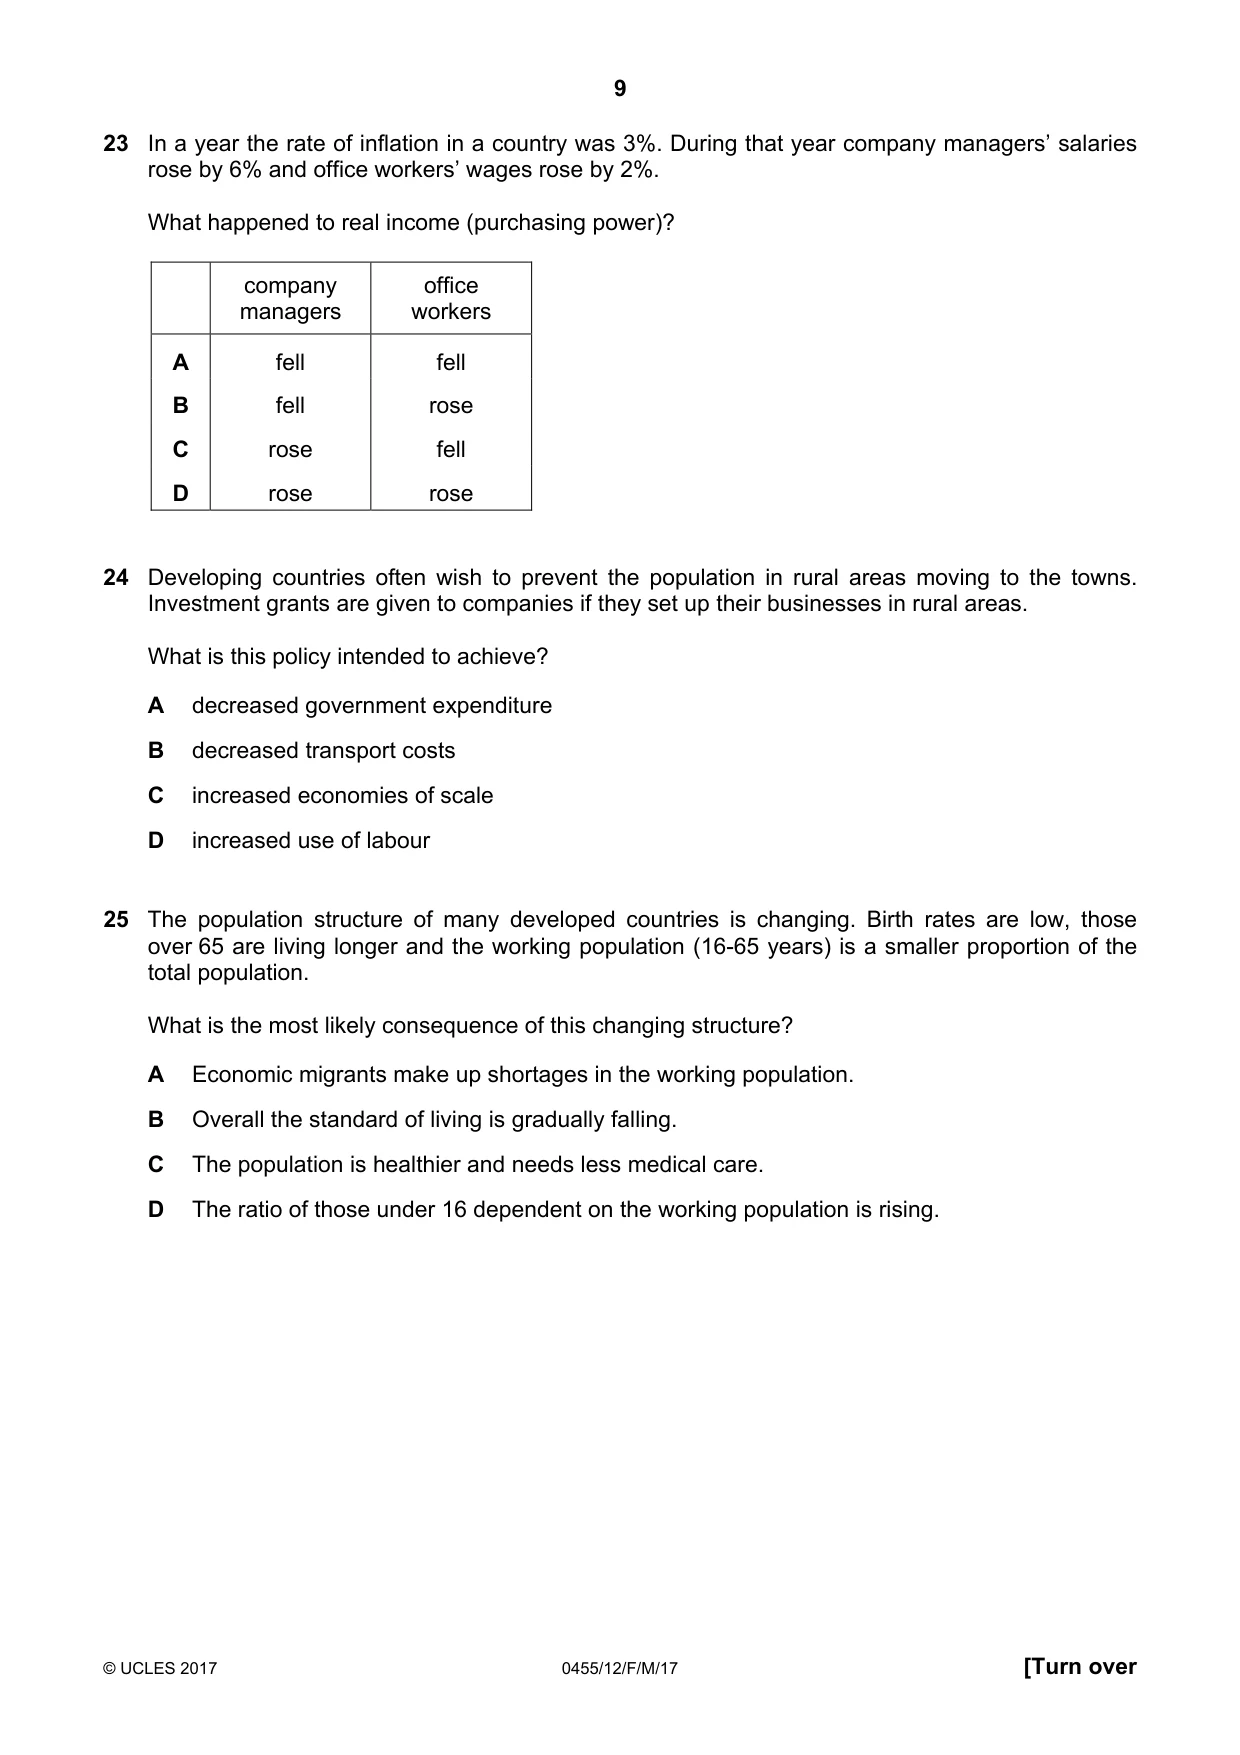
23 In a year the rate of inflation in a country was 3%. During that year company managers’ salaries rose by 6% and office workers’ wages rose by 2%. What happened to real income (purchasing power)? company office managers workers A fell fell B fell rose C rose fell D rose rose
Mark scheme: C
Q24 · Developing countries often wish to prevent the population in rural areas moving to the…
24 Developing countries often wish to prevent the population in rural areas moving to the towns. Investment grants are given to companies if they set up their businesses in rural areas. What is this policy intended to achieve? A decreased government expenditure B decreased transport costs C increased economies of scale D increased use of labour
Mark scheme: D
Q25 · The population structure of many developed countries is changing
25 The population structure of many developed countries is changing. Birth rates are low, those over 65 are living longer and the working population (16-65 years) is a smaller proportion of the total population. What is the most likely consequence of this changing structure? A Economic migrants make up shortages in the working population. B Overall the standard of living is gradually falling. C The population is healthier and needs less medical care. D The ratio of those under 16 dependent on the working population is rising.
Mark scheme: A
Q26 · The table shows data for four countries in 2006
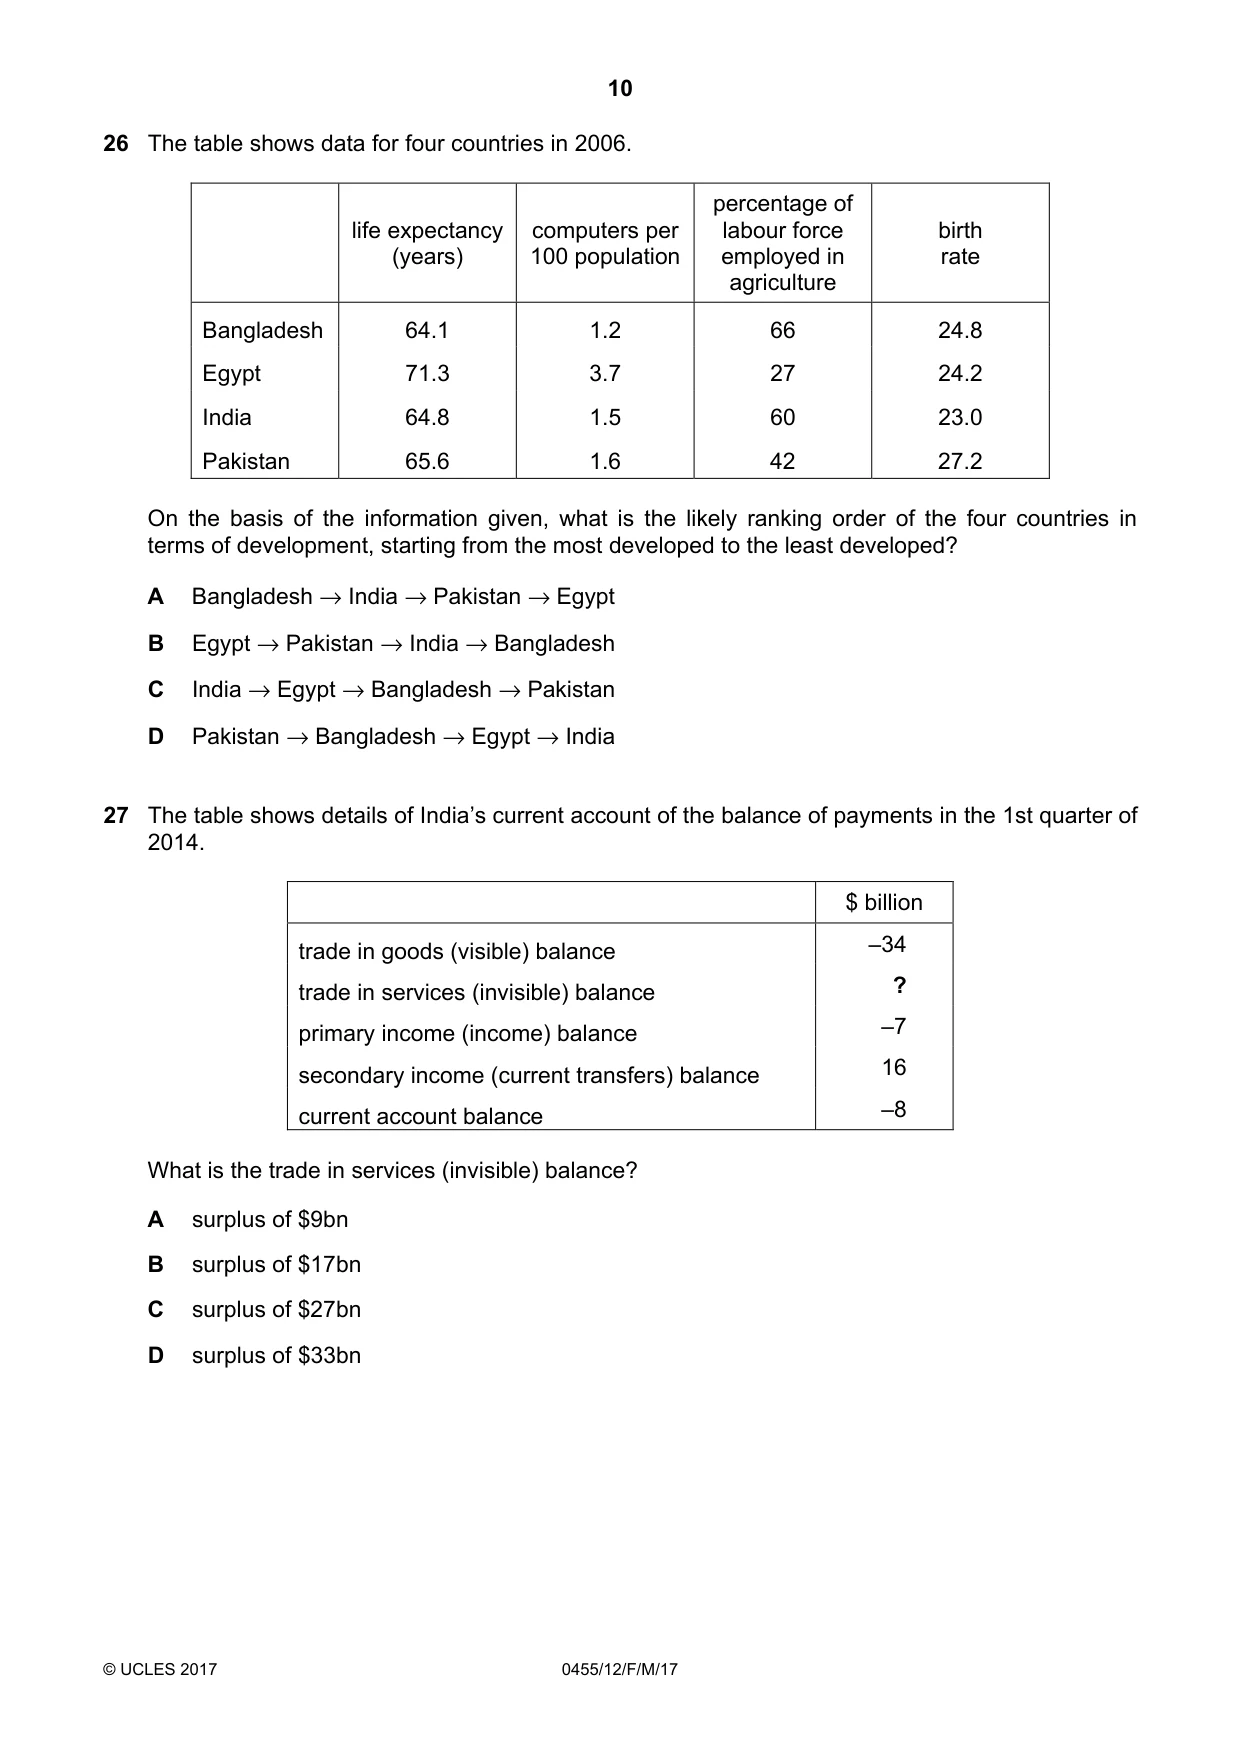
26 The table shows data for four countries in 2006. percentage of life expectancy computers per labour force birth (years) 100 population employed in rate agriculture Bangladesh 64.1 1.2 66 24.8 Egypt 71.3 3.7 27 24.2 India 64.8 1.5 60 23.0 Pakistan 65.6 1.6 42 27.2 On the basis of the information given, what is the likely ranking order of the four countries in terms of development, starting from the most developed to the least developed? A Bangladesh → India → Pakistan → Egypt B Egypt → Pakistan → India → Bangladesh C India → Egypt → Bangladesh → Pakistan D Pakistan → Bangladesh → Egypt → India
Mark scheme: B
More questions on Differences in economic development between countries
Q27 · The table shows details of India’s current account of the balance of payments in the 1st…
27 The table shows details of India’s current account of the balance of payments in the 1st quarter of 2014. $ billion trade in goods (visible) balance –34 trade in services (invisible) balance ? primary income (income) balance –7 secondary income (current transfers) balance 16 current account balance –8 What is the trade in services (invisible) balance? A surplus of $9bn B surplus of $17bn C surplus of $27bn D surplus of $33bn
Mark scheme: B
Q28 · Which policy is a form of protectionism?
28 Which policy is a form of protectionism? A a tax on emissions B a tax on imports C a tax on income D a tax on property
Mark scheme: B
Q29 · When does free trade occur?
29 When does free trade occur? A when goods are exported with government subsidies B when goods are given as part of an aid programme C when goods are traded using barter D when goods face no import barriers
Mark scheme: D
Q30 · The diagram shows the market for the Indian rupee priced in US dollars
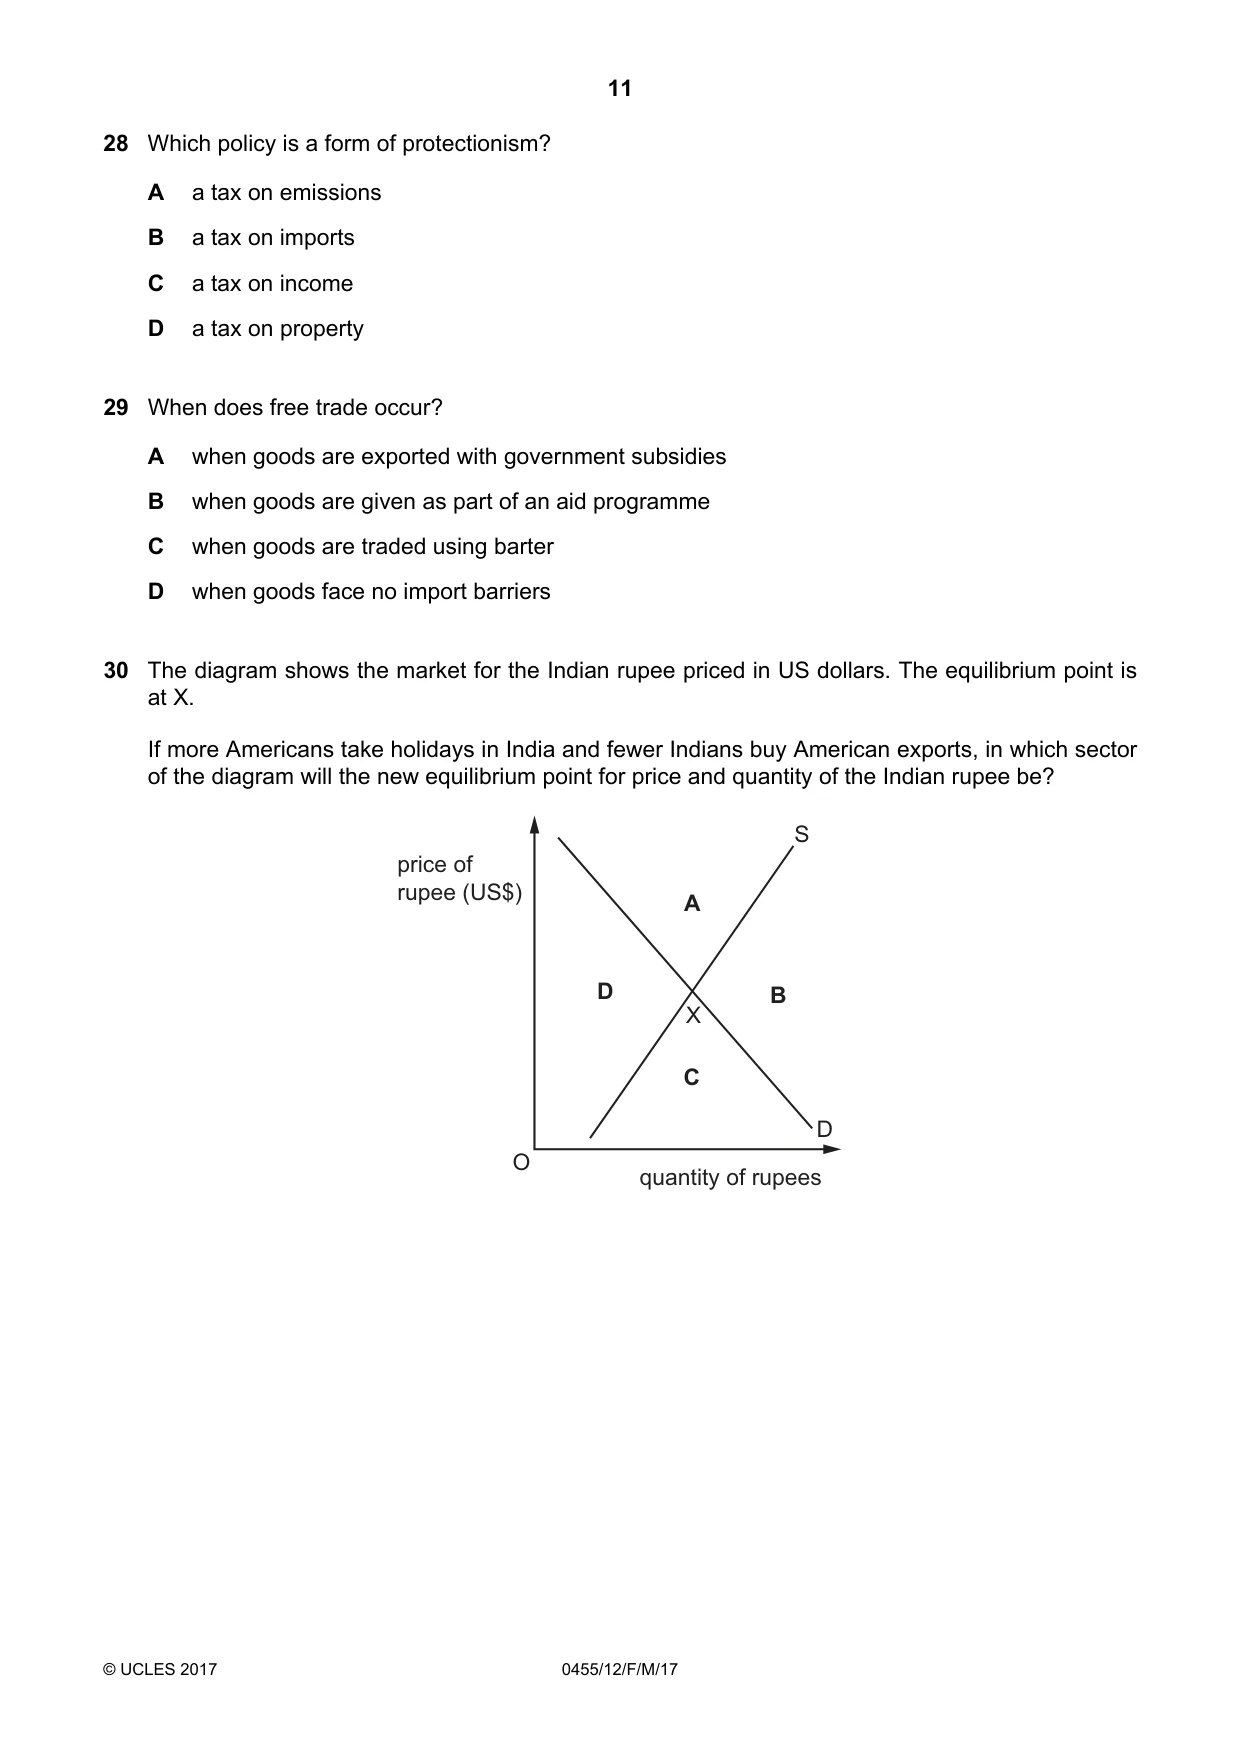
30 The diagram shows the market for the Indian rupee priced in US dollars. The equilibrium point is at X. If more Americans take holidays in India and fewer Indians buy American exports, in which sector of the diagram will the new equilibrium point for price and quantity of the Indian rupee be? S price of rupee (US$) A D B X C D O quantity of rupees
Mark scheme: A
What was in this paper
The subtopics covered by these 30 questions, and how many questions each got. Open one in a new tab to see every Cambridge question on it.
3Firms’ costs, revenue and objectives2Fiscal policy2Globalisation, free trade and protection2Inflation and deflation2Population2Current account of balance of payments1Differences in economic development between countries1Economic growth1Firms and production1Foreign exchange rates1Living standards1Market failure1Market structure1Opportunity cost1Price changes1Price elasticity of demand (PED)1Production possibility curve (PPC) diagrams1Supply1Supply-side policy1The factors of production1The role of government1Trade unions1What you needed in this session
Cambridge’s own grade thresholds for 2017 Feb/March, Paper 1 · Variant 2. A higher threshold means an easier paper — the bar moves with how the cohort did.