Cambridge IGCSE Economics 0455 — 2023 Feb/March Paper 1 · Variant 2
0455/12/F/M/23 · 30 questions · 30 marks · ≈34 min
The question paper and its mark scheme, free to read here and free to download. This is Cambridge’s own paper, exactly as it was sat.
Question paper12 pages
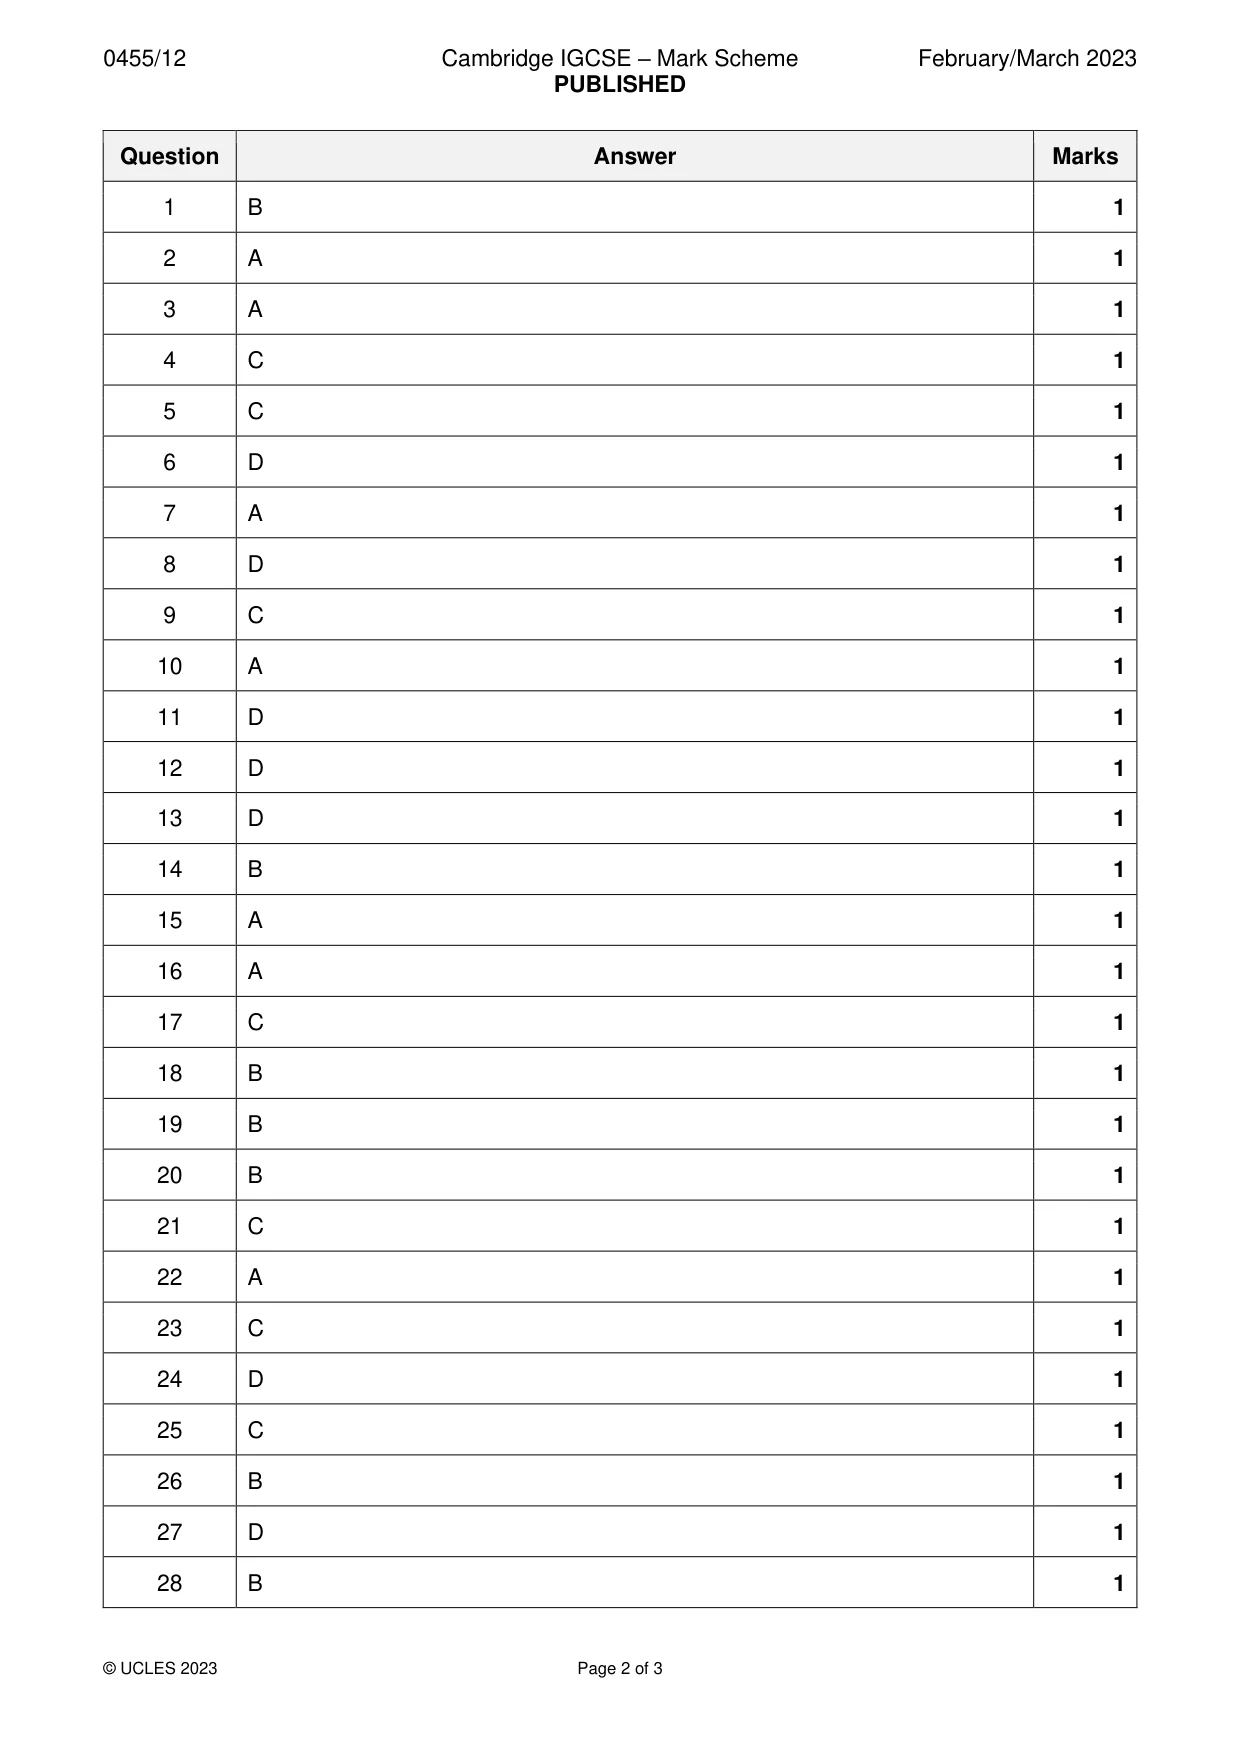
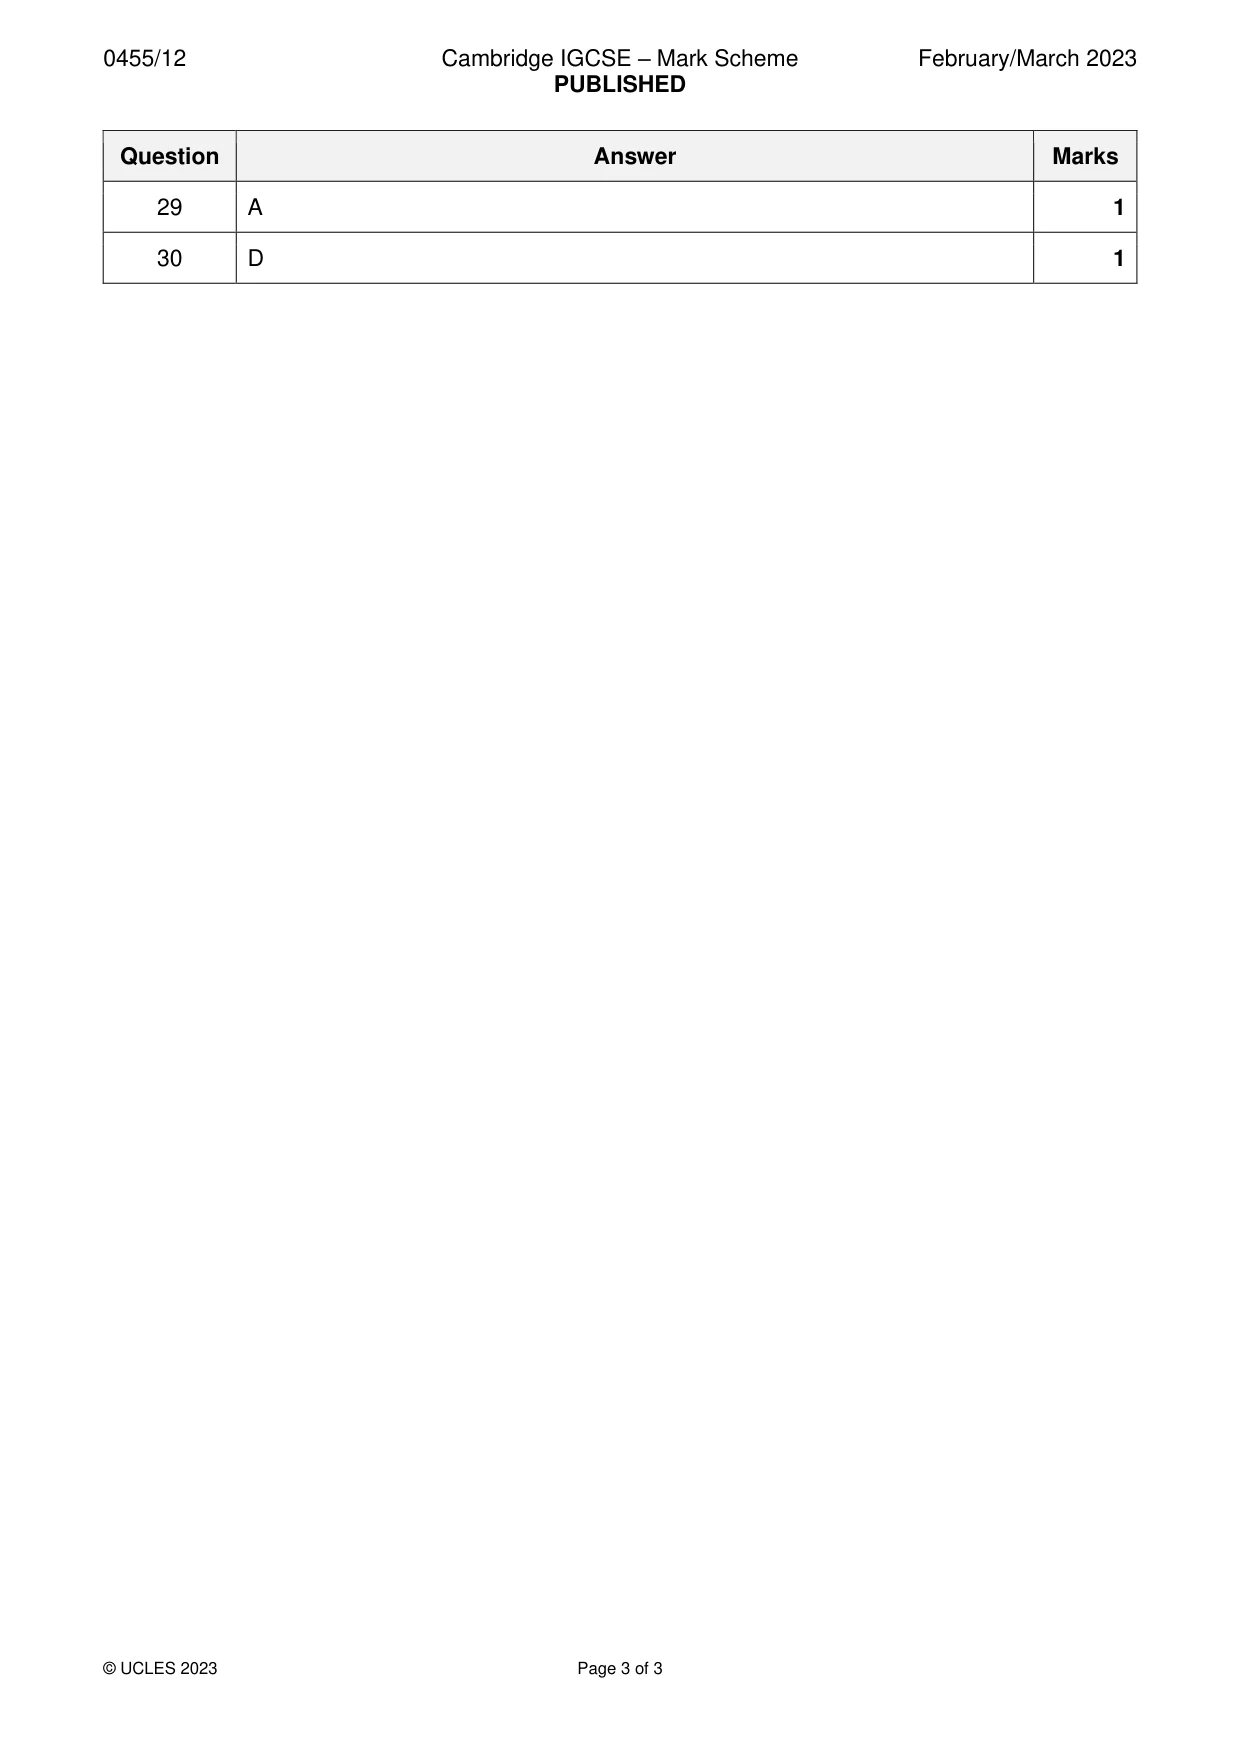
Mark scheme3 pages
Answers below. Sit the paper first if you are practising.
Questions as text
Q1 · In country Z there has been a decrease in the birth rate
1 In country Z there has been a decrease in the birth rate. In the short run, which variable will be affected? A inflation B population C supply D unemployment
Mark scheme: B
Q2 · The diagram shows the choices for an individual between leisure and earnings
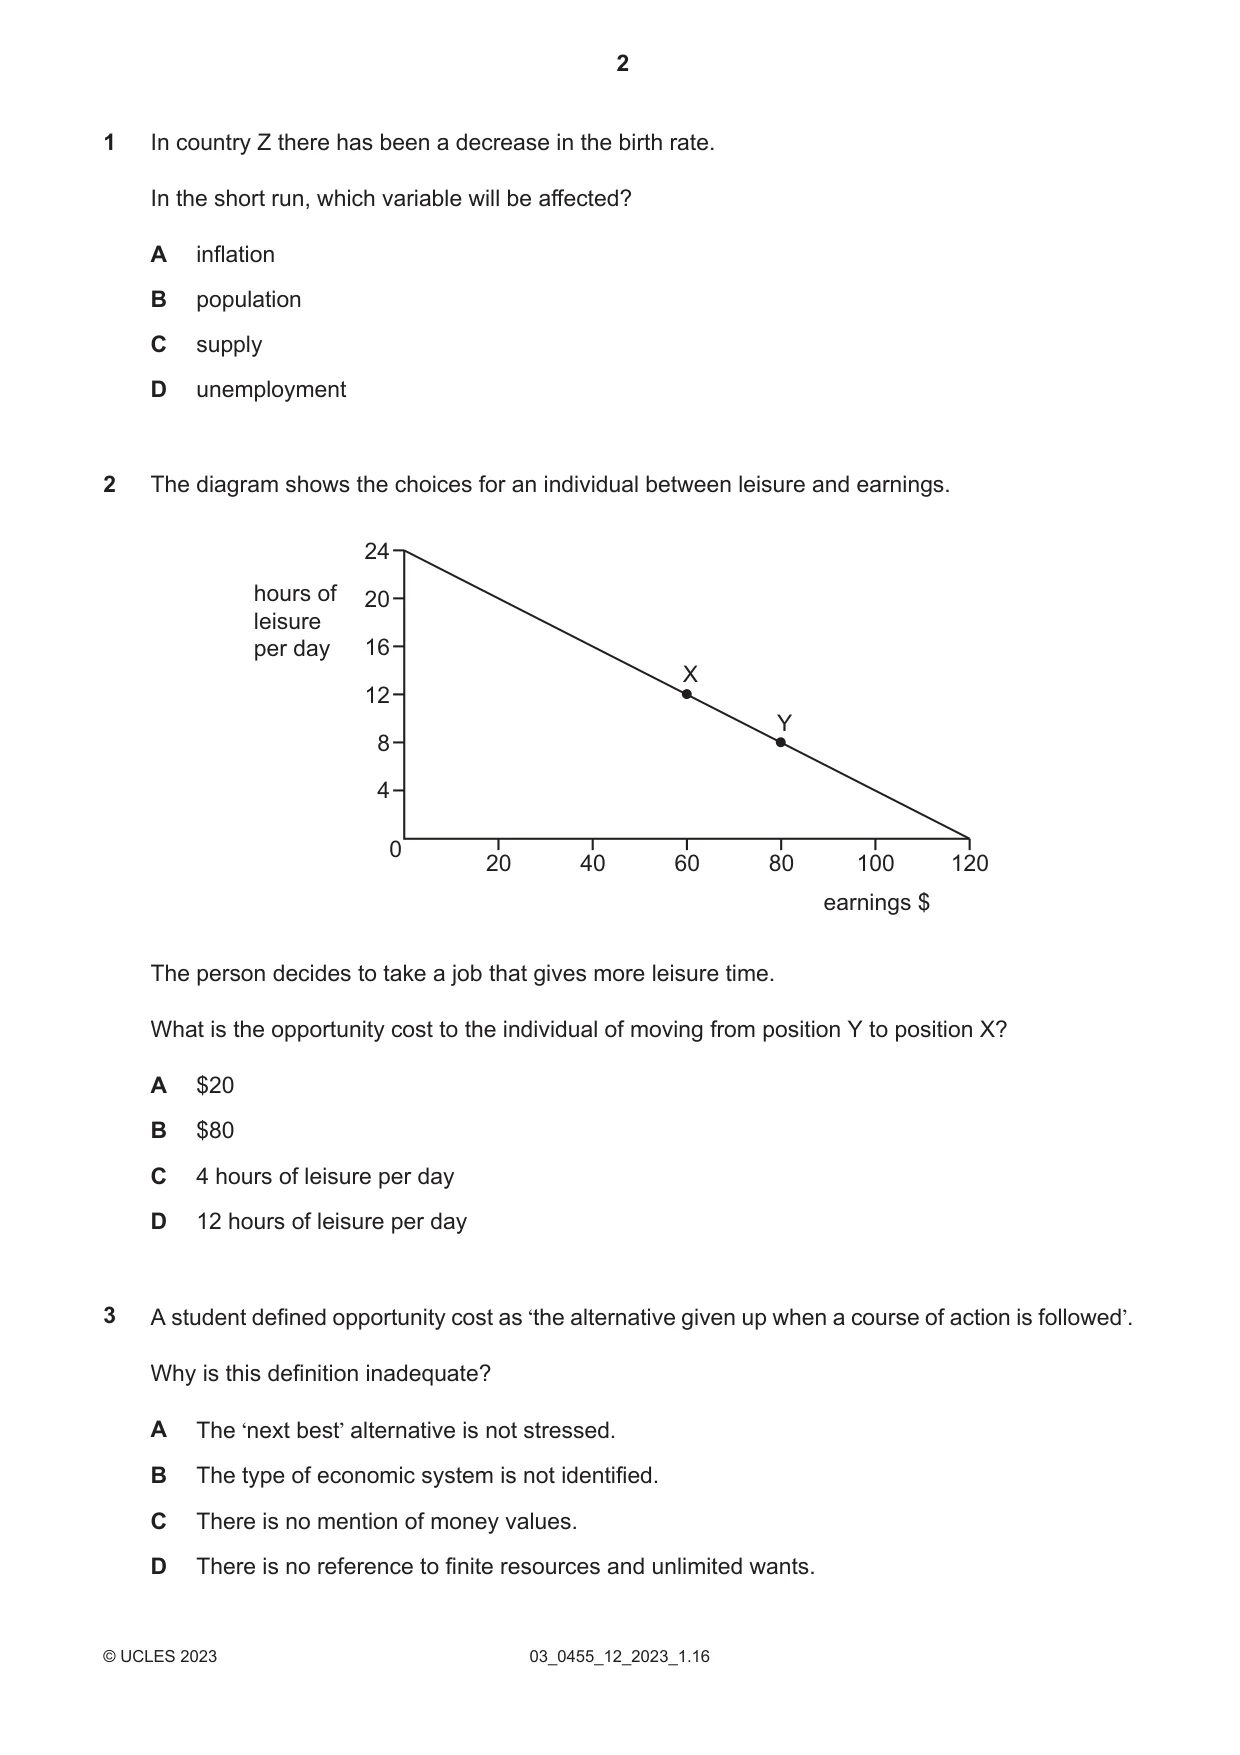
2 The diagram shows the choices for an individual between leisure and earnings. 24 hours of 20 leisure per day 16 X 12 Y 8 4 0 20 40 60 80 100 120 earnings $ The person decides to take a job that gives more leisure time. What is the opportunity cost to the individual of moving from position Y to position X? A $20 B $80 C 4 hours of leisure per day D 12 hours of leisure per day
Mark scheme: A
Q3 · A student defined opportunity cost as ‘the alternative given up when a course of action…
3 A student defined opportunity cost as ‘the alternative given up when a course of action is followed’. Why is this definition inadequate? A The ‘next best’ alternative is not stressed. B The type of economic system is not identified. C There is no mention of money values. D There is no reference to finite resources and unlimited wants.
Mark scheme: A
Q4 · The market for a good was in equilibrium
4 The market for a good was in equilibrium. A change occurred which resulted in a new equilibrium with a higher price for the good and a lower quantity traded. Which change would have caused this? A The demand curve moved to the left. B The demand curve moved to the right. C The supply curve moved to the left. D The supply curve moved to the right.
Mark scheme: C
Q5 · What will result in a movement along the demand curve for a product?
5 What will result in a movement along the demand curve for a product? A a change in tastes B an increase in income C a rise in the price of the product D a successful advertising campaign for the product
Mark scheme: C
Q6 · In a year when there were big increases in demand for new cars, many used cars also came…
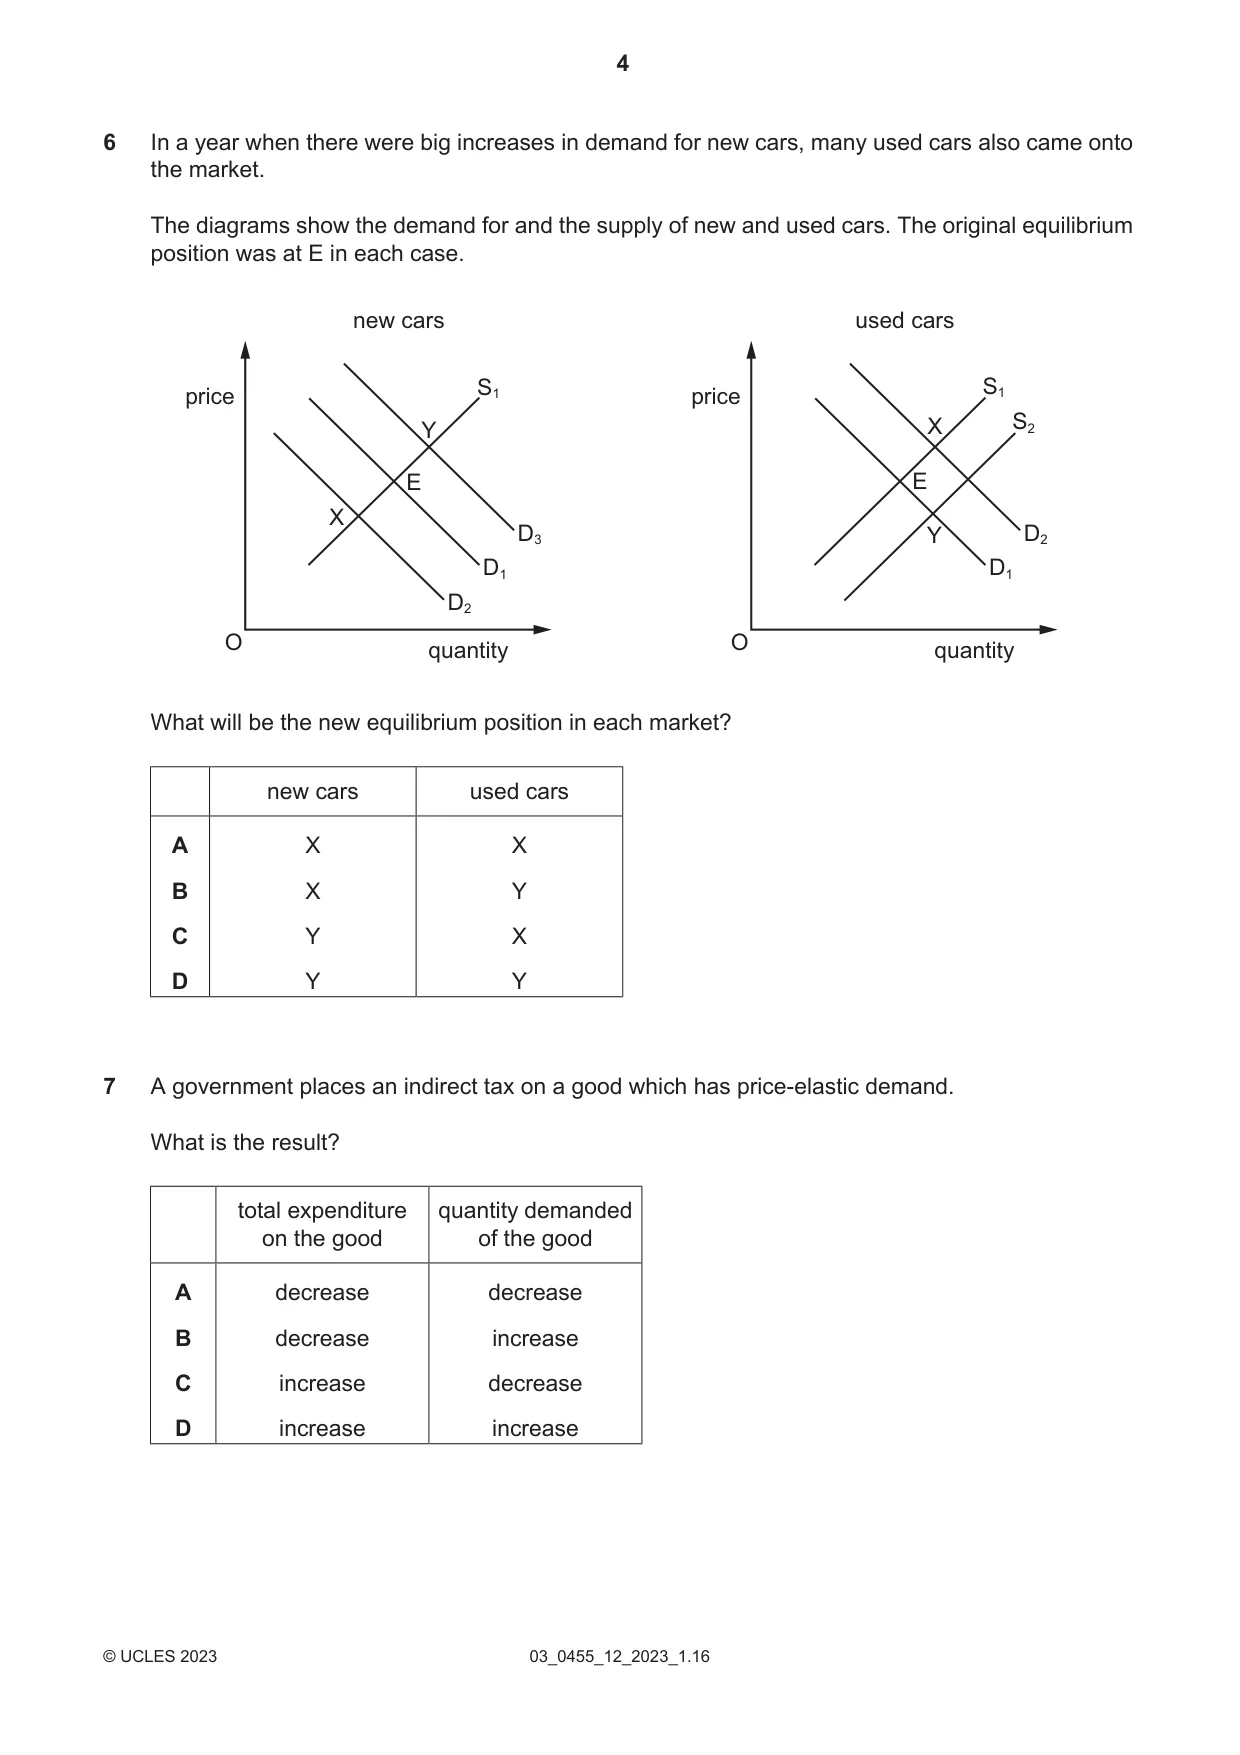
6 In a year when there were big increases in demand for new cars, many used cars also came onto the market. The diagrams show the demand for and the supply of new and used cars. The original equilibrium position was at E in each case. new cars used cars price S1 price S1 Y X S2 E E X D3 Y D2 D1 D1 D2 O quantity O quantity What will be the new equilibrium position in each market? new cars used cars A X X B X Y C Y X D Y Y
Mark scheme: D
Q7 · A government places an indirect tax on a good which has price-elastic demand
7 A government places an indirect tax on a good which has price-elastic demand. What is the result? total expenditure quantity demanded on the good of the good A decrease decrease B decrease increase C increase decrease D increase increase
Mark scheme: A
Q8 · The price elasticity of demand for cigarettes is estimated to be 0.5
8 The price elasticity of demand for cigarettes is estimated to be 0.5. The government introduces a tax on cigarettes to reduce consumption. By how much must the price of cigarettes rise to reduce consumption by 10%? A 5% B 10% C 15% D 20%
Mark scheme: D
Q9 · The diagram shows the demand for and the supply of bread
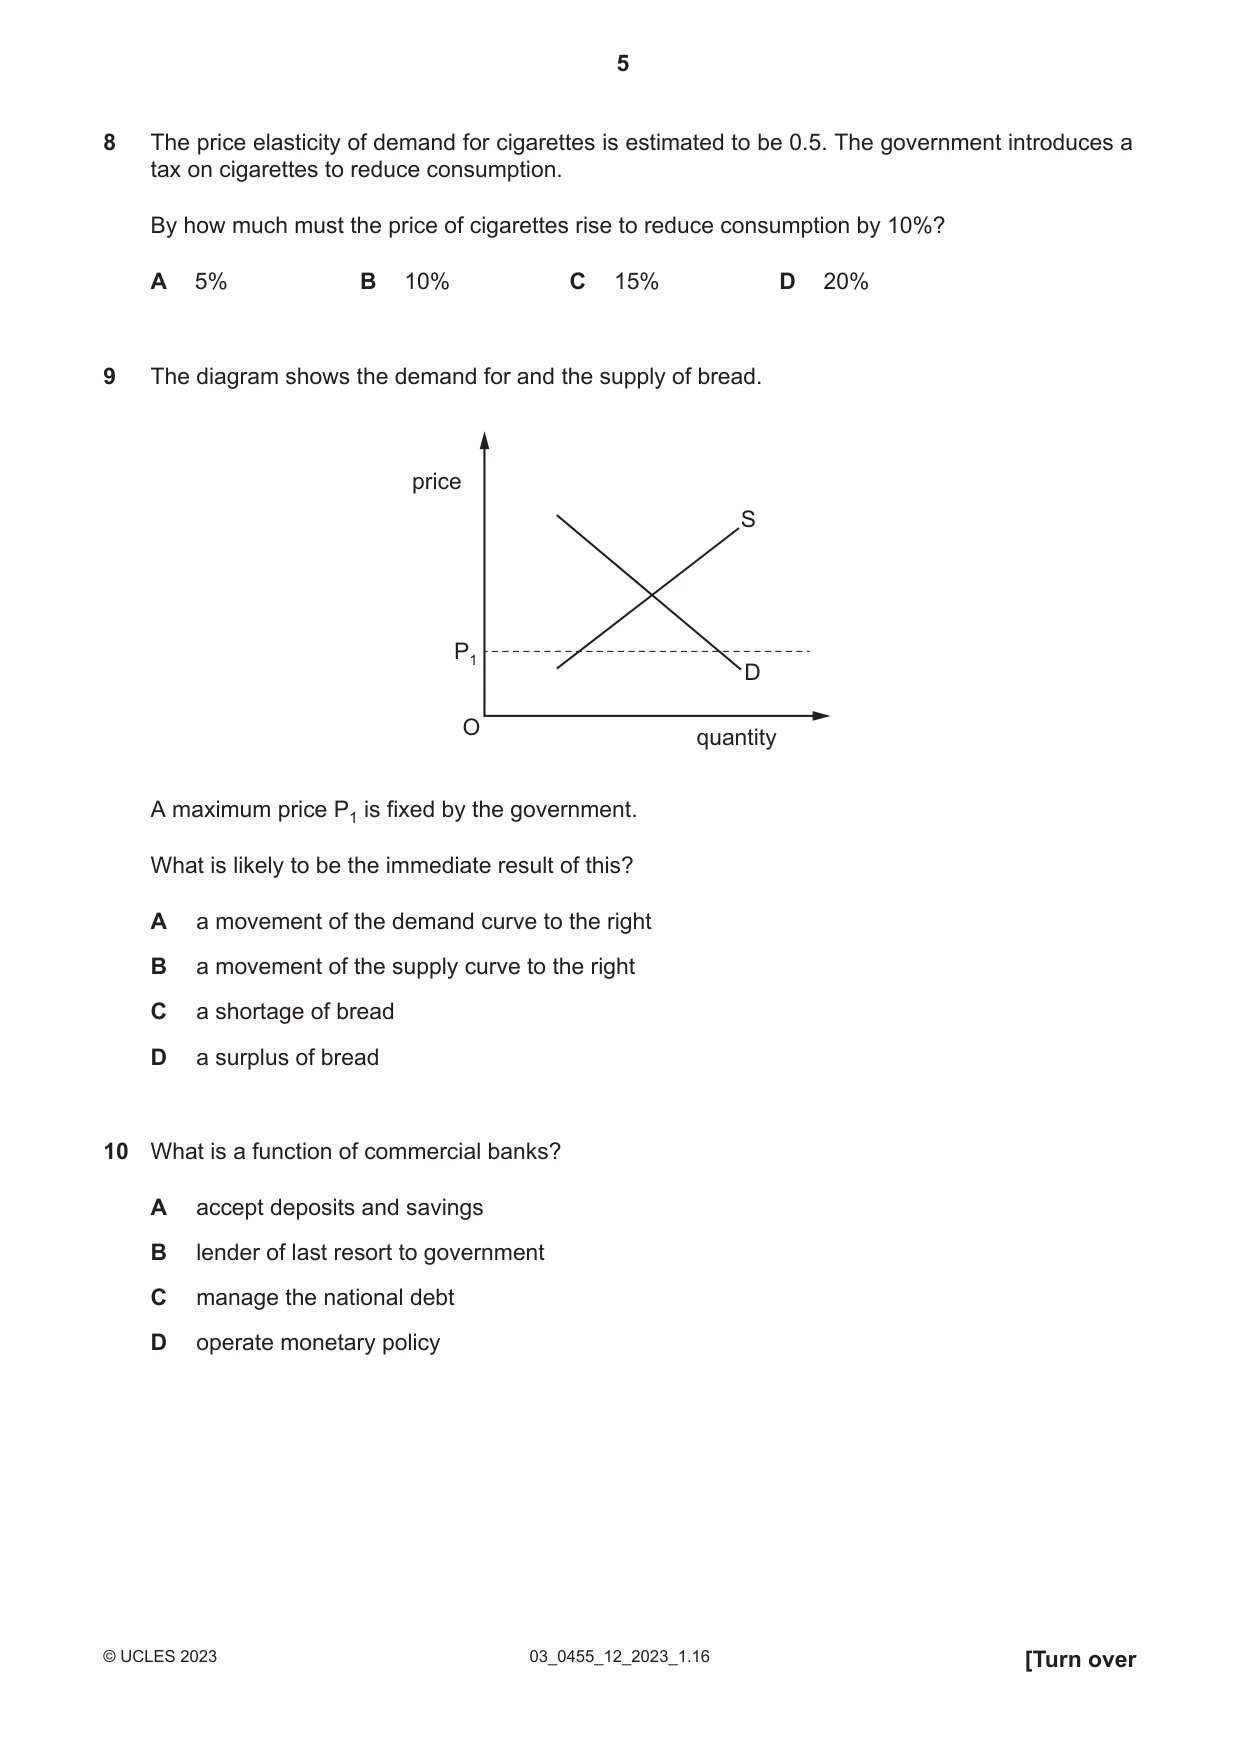
9 The diagram shows the demand for and the supply of bread. price S P1 D O quantity A maximum price P1 is fixed by the government. What is likely to be the immediate result of this? A a movement of the demand curve to the right B a movement of the supply curve to the right C a shortage of bread D a surplus of bread
Mark scheme: C
Q10 · What is a function of commercial banks?
10 What is a function of commercial banks? A accept deposits and savings B lender of last resort to government C manage the national debt D operate monetary policy
Mark scheme: A
Q11 · The table shows spending in the leisure sector of a country in 1995, 1999 and 2005
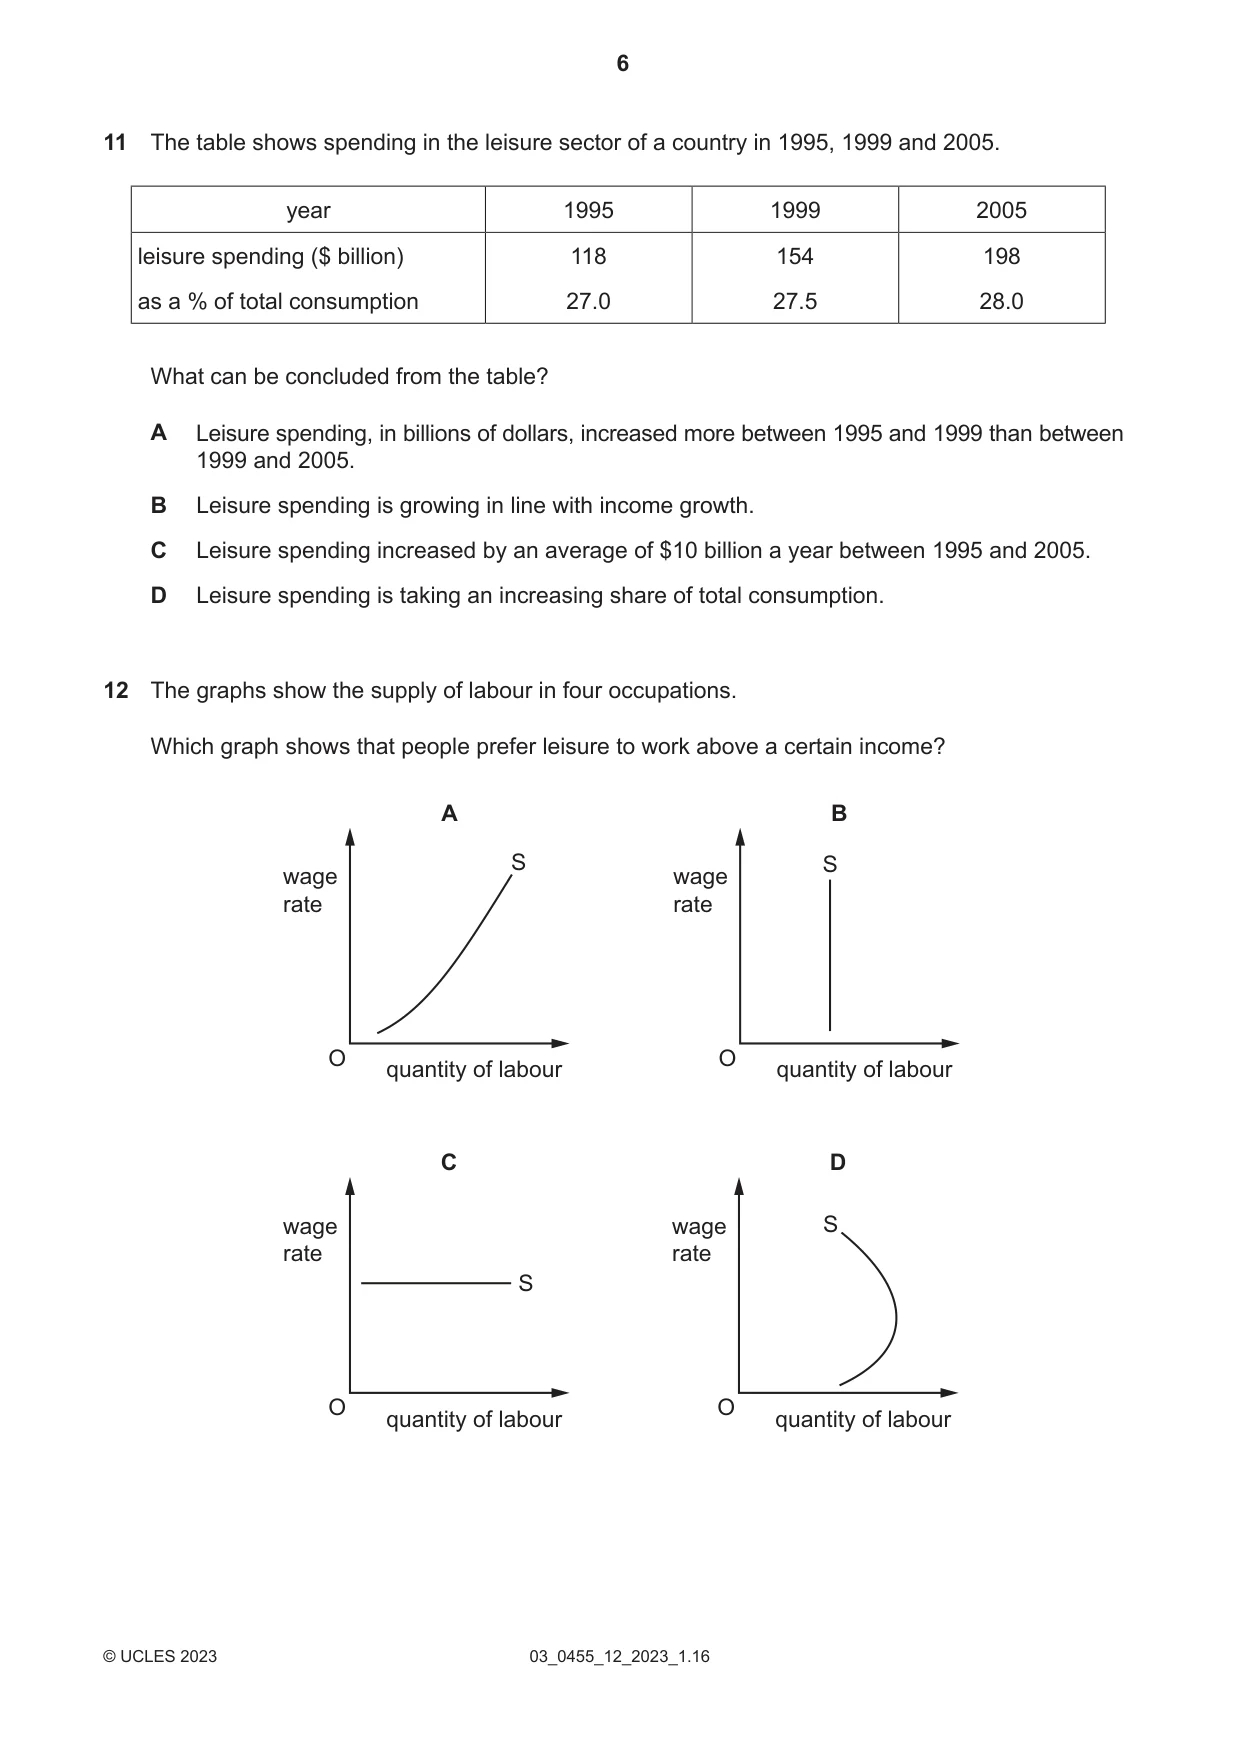
11 The table shows spending in the leisure sector of a country in 1995, 1999 and 2005. year 1995 1999 leisure spending ($ billion) 118 154 as a % of total consumption What can be concluded from the table? A Leisure spending, in billions of dollars, increased more between 1995 and 1999 than between 1999 and 2005. B Leisure spending is growing in line with income growth. Leisure spending increased by an average of $10 billion a year between 1995 and 2005. Leisure spending is taking an increasing share of total consumption.
Mark scheme: D
Q12 · The graphs show the supply of labour in four occupations
12 The graphs show the supply of labour in four occupations. Which graph shows that people prefer leisure to work above a certain income? A B S S wage wage rate rate O O quantity of labour quantity of labour C D wage wage S rate rate S O O quantity of labour quantity of labour
Mark scheme: D
Q13 · What would be likely to happen within a country if its government granted more work…
13 What would be likely to happen within a country if its government granted more work permits to doctors coming from other countries? A increased demand for doctors B increased productivity of doctors C increased salaries for doctors D increased supply of doctors
Mark scheme: D
Q14 · What is not a benefit of trade union membership for a worker?
14 What is not a benefit of trade union membership for a worker? A achieving higher wages for workers B negotiating a higher rate of interest on a bank loan for workers C providing support to workers when being made unemployed D an improvement in health and safety standards at work
Mark scheme: B
Q15 · What will happen to a firm that expands to take advantage of economies of scale?
15 What will happen to a firm that expands to take advantage of economies of scale? A Average costs of production will decrease. B Average costs of production will increase. C Profits will decrease. D The price of the firm’s products will increase.
Mark scheme: A
Q16 · The table shows total fixed and total variable costs at different levels of output for a…
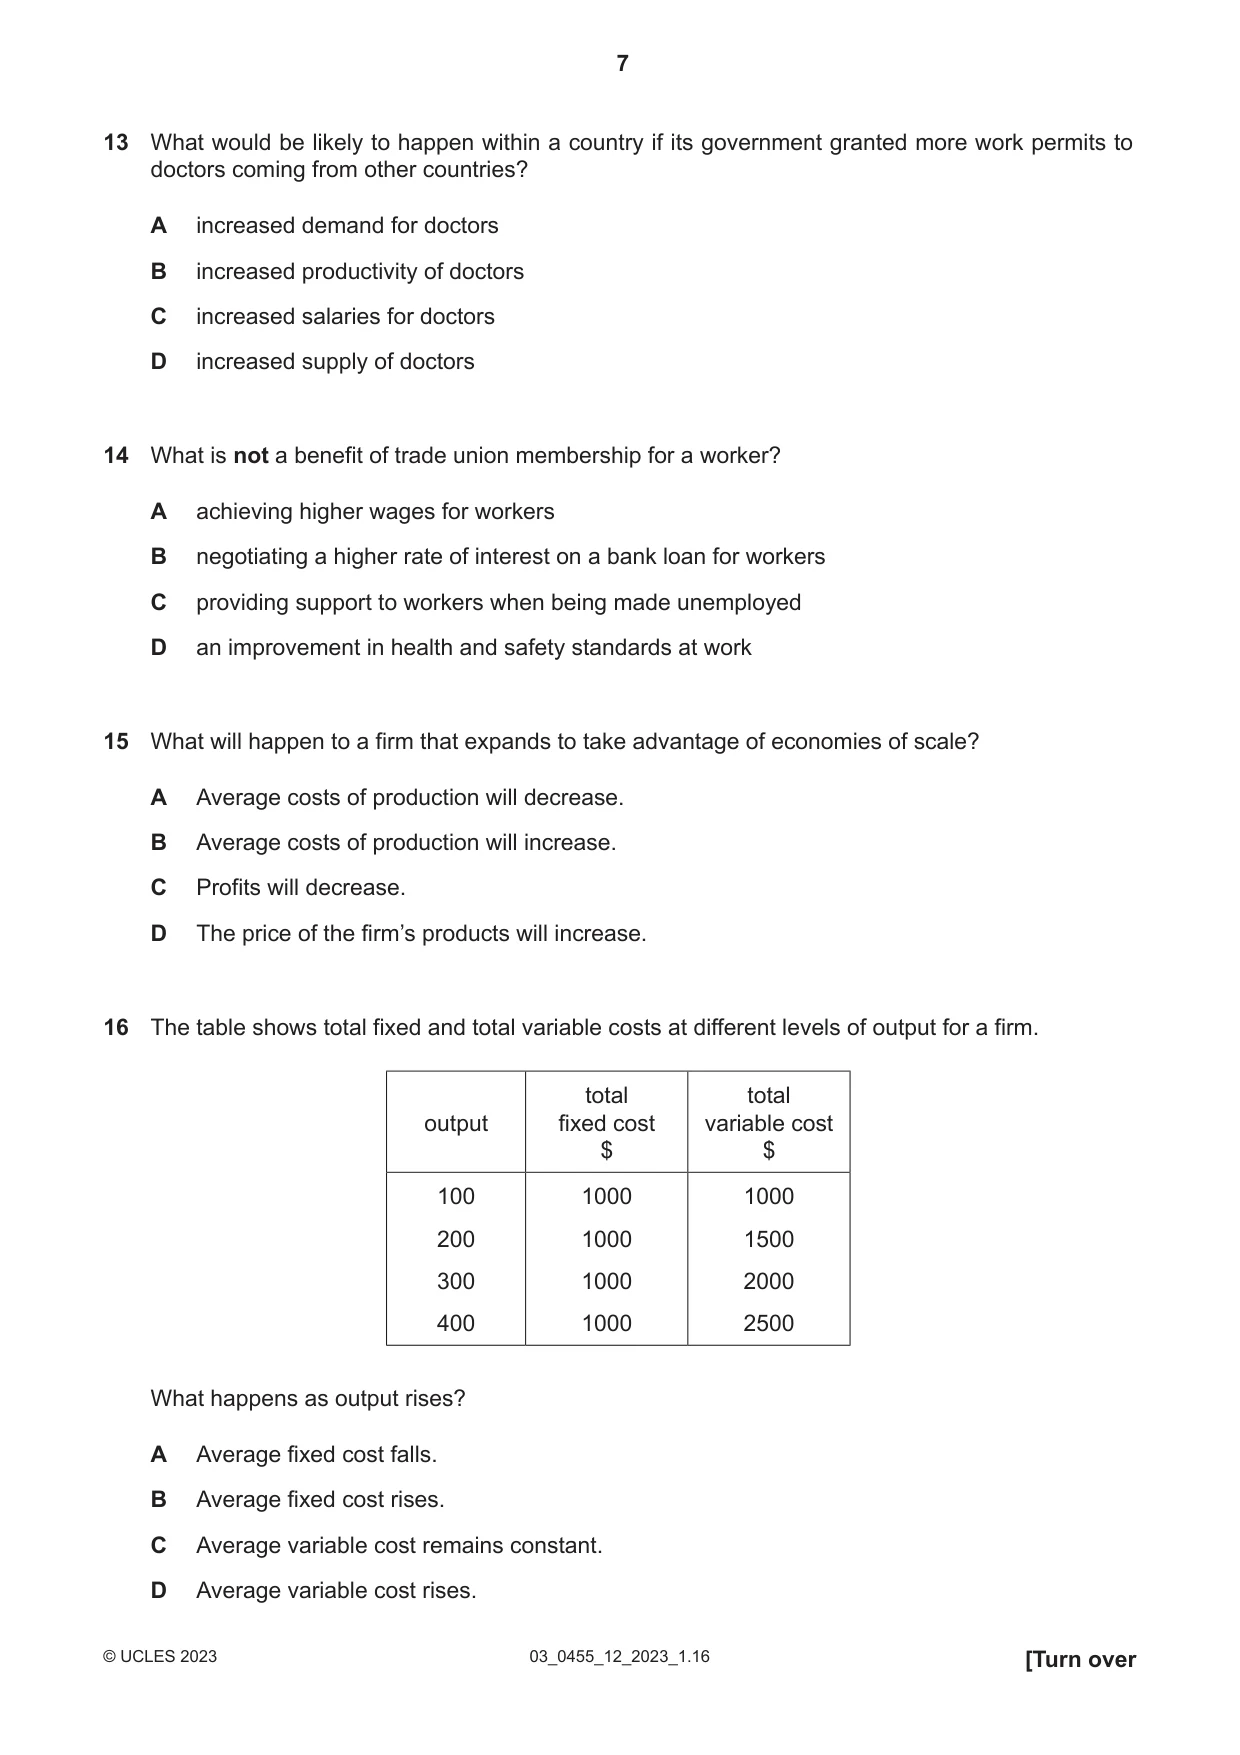
16 The table shows total fixed and total variable costs at different levels of output for a firm. total total output fixed cost variable cost $ $ 100 1000 1000 200 1000 1500 300 1000 2000 400 1000 2500 What happens as output rises? A Average fixed cost falls. B Average fixed cost rises. C Average variable cost remains constant. D Average variable cost rises.
Mark scheme: A
Q17 · Which characteristics are found in a monopoly?
17 Which characteristics are found in a monopoly? A freedom of entry to the market and a single seller B freedom of entry to the market and many sellers C many buyers and a single seller D many buyers and many sellers
Mark scheme: C
Question 18
18 What is deflation? A a decrease in the claimant count B a decrease in the Consumer Prices Index C a decrease in the Human Development Index D a decrease in the real Gross Domestic Product
Mark scheme: B
Q19 · What is the likely outcome of an expansionary monetary policy?
19 What is the likely outcome of an expansionary monetary policy? A Borrowing by consumers falls as the money supply increases. B Firms expand to meet higher consumer demand. C Prices fall as total supply exceeds total demand. D Wages rise due to a lower rate of inflation.
Mark scheme: B
Q20 · In the past, governments have adopted policies to try to end a recession in their country…
20 In the past, governments have adopted policies to try to end a recession in their country and increase economic growth. Which combination of policies is most likely to achieve this? A lower taxes and decrease government spending B lower taxes and increase government spending C raise taxes and decrease government spending D raise taxes and increase government spending
Mark scheme: B
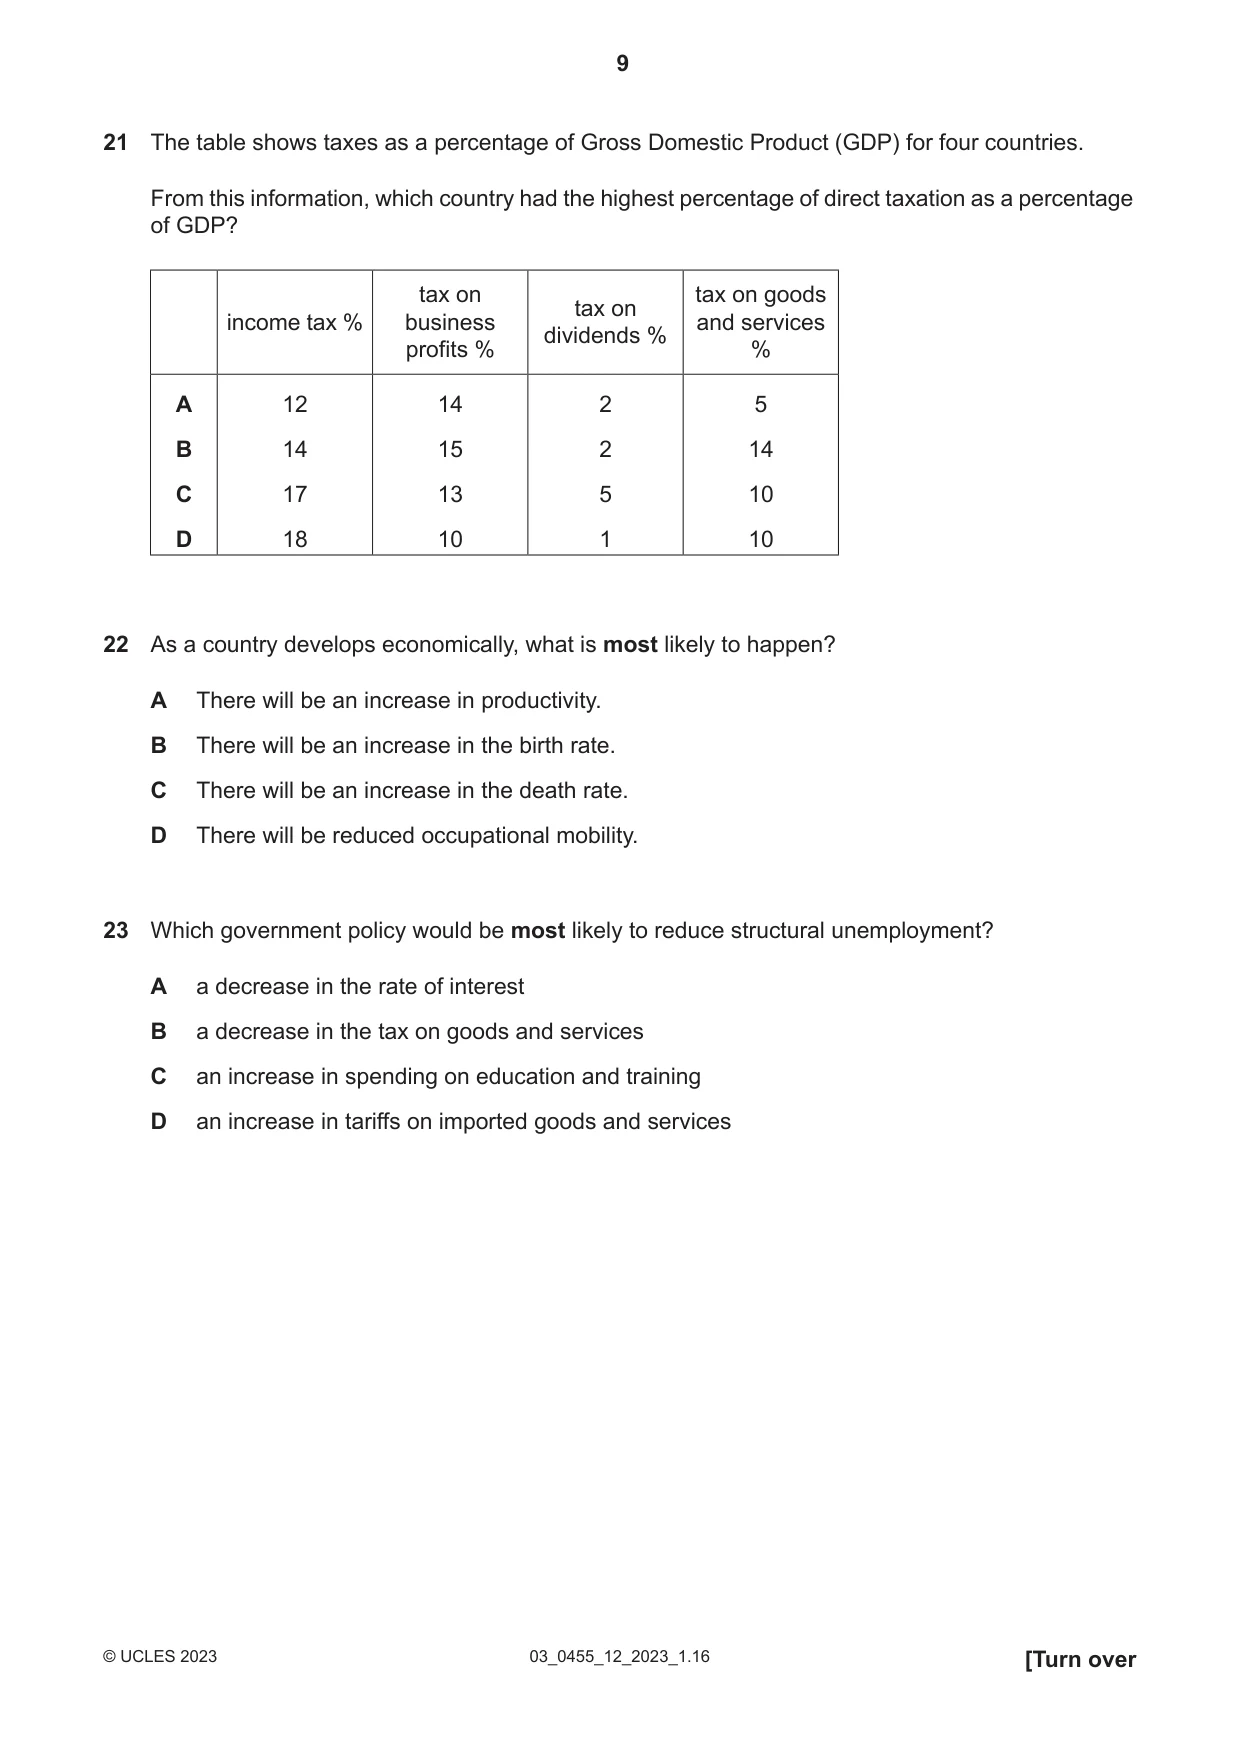
Q21 · The table shows taxes as a percentage of Gross Domestic Product (GDP) for four countries
21 The table shows taxes as a percentage of Gross Domestic Product (GDP) for four countries. From this information, which country had the highest percentage of direct taxation as a percentage of GDP? tax on tax on goods tax on income tax % business and services dividends % profits % % A 12 14 2 5 B 14 15 2 14 C 17 13 5 10 D 18 10 1 10
Mark scheme: C
Q22 · As a country develops economically, what is most likely to happen?
22 As a country develops economically, what is most likely to happen? A There will be an increase in productivity. B There will be an increase in the birth rate. C There will be an increase in the death rate. D There will be reduced occupational mobility.
Mark scheme: A
More questions on Differences in economic development between countries
Q23 · Which government policy would be most likely to reduce structural unemployment?
23 Which government policy would be most likely to reduce structural unemployment? A a decrease in the rate of interest B a decrease in the tax on goods and services C an increase in spending on education and training D an increase in tariffs on imported goods and services
Mark scheme: C
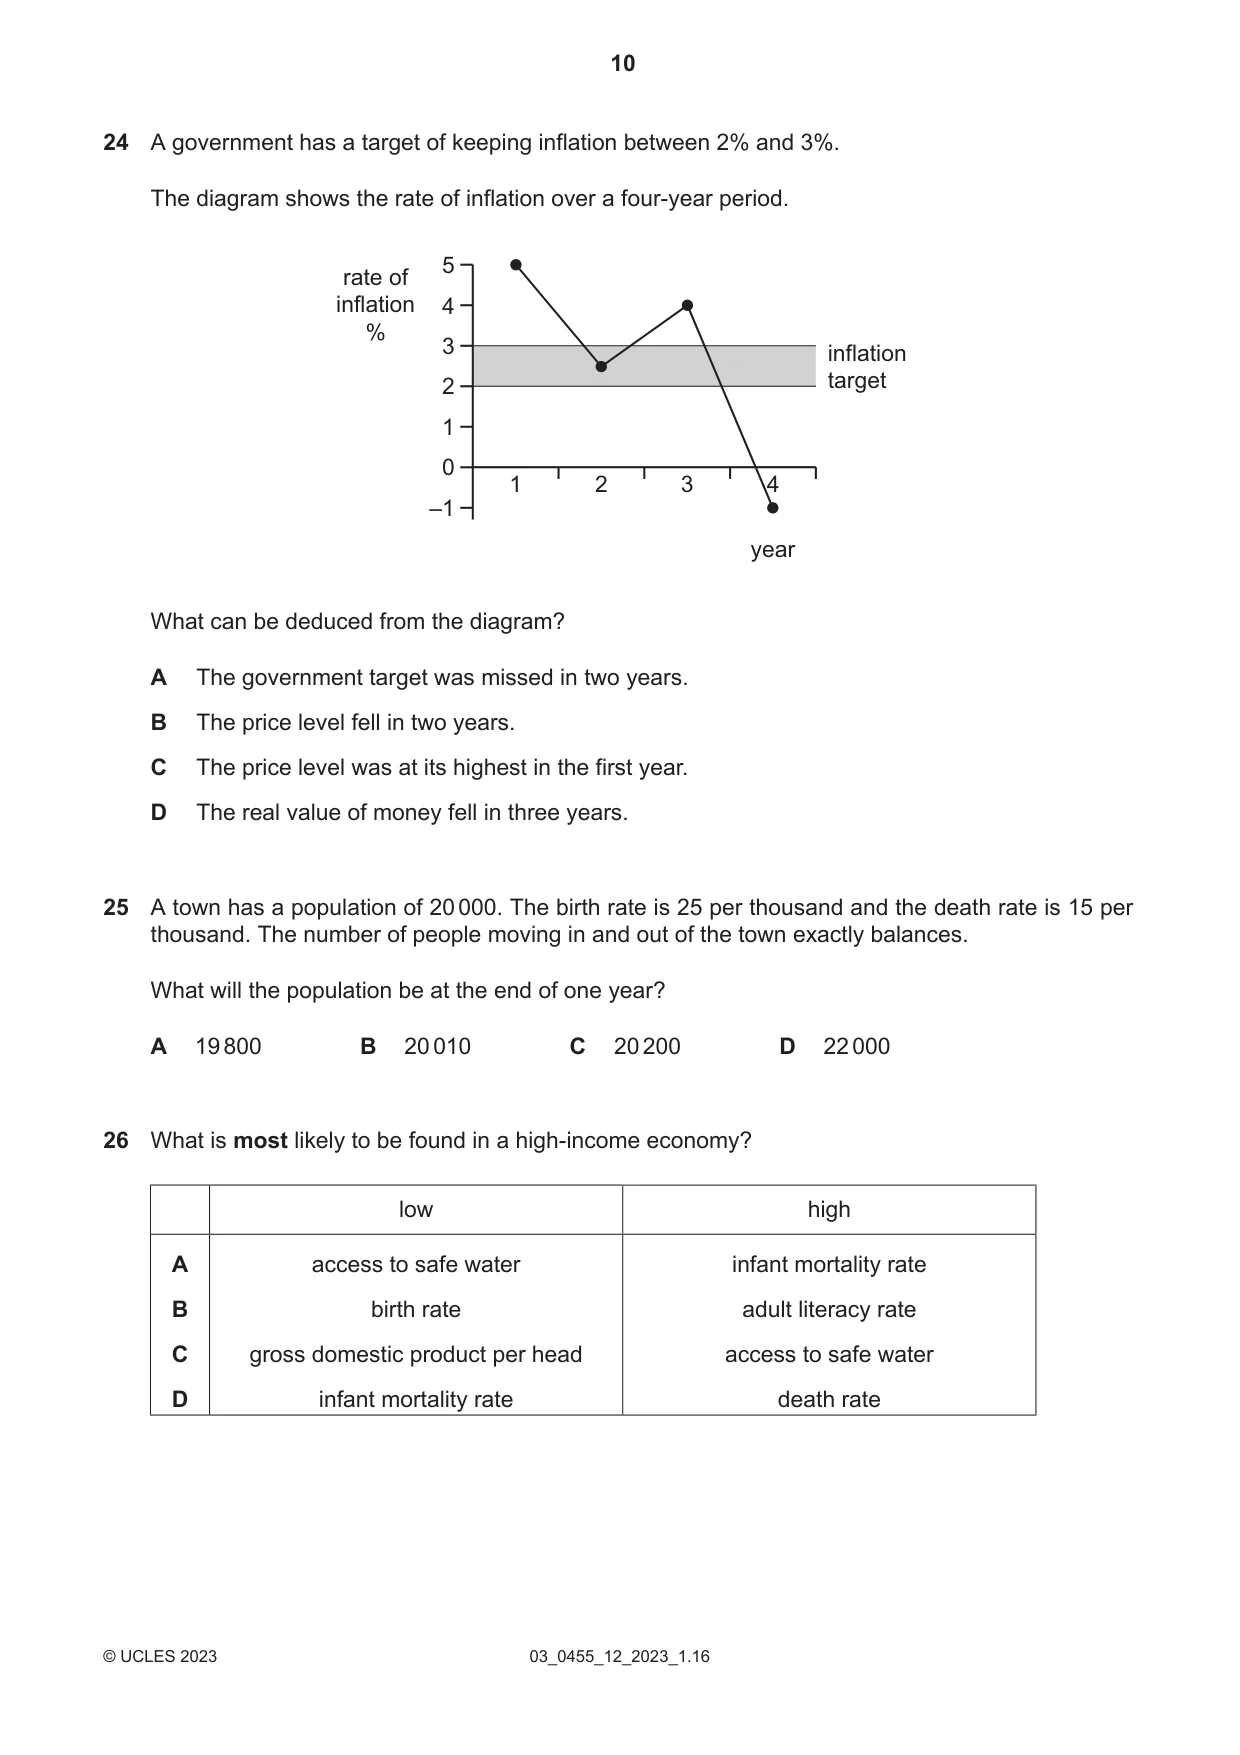
Q24 · A government has a target of keeping inflation between 2% and 3%
24 A government has a target of keeping inflation between 2% and 3%. The diagram shows the rate of inflation over a four-year period. 5 rate of inflation 4 % 3 inflation 2 target 1 0 1 2 3 4 –1 year What can be deduced from the diagram? A The government target was missed in two years. B The price level fell in two years. C The price level was at its highest in the first year. D The real value of money fell in three years.
Mark scheme: D
Q25 · A town has a population of 20000
25 A town has a population of 20000. The birth rate is 25 per thousand and the death rate is 15 per thousand. The number of people moving in and out of the town exactly balances. What will the population be at the end of one year? A 19800 B 20010 C 20200 D 22000
Mark scheme: C
Q26 · What is most likely to be found in a high-income economy?
26 What is most likely to be found in a high-income economy? low high A access to safe water infant mortality rate B birth rate adult literacy rate C gross domestic product per head access to safe water D infant mortality rate death rate
Mark scheme: B
More questions on Differences in economic development between countries
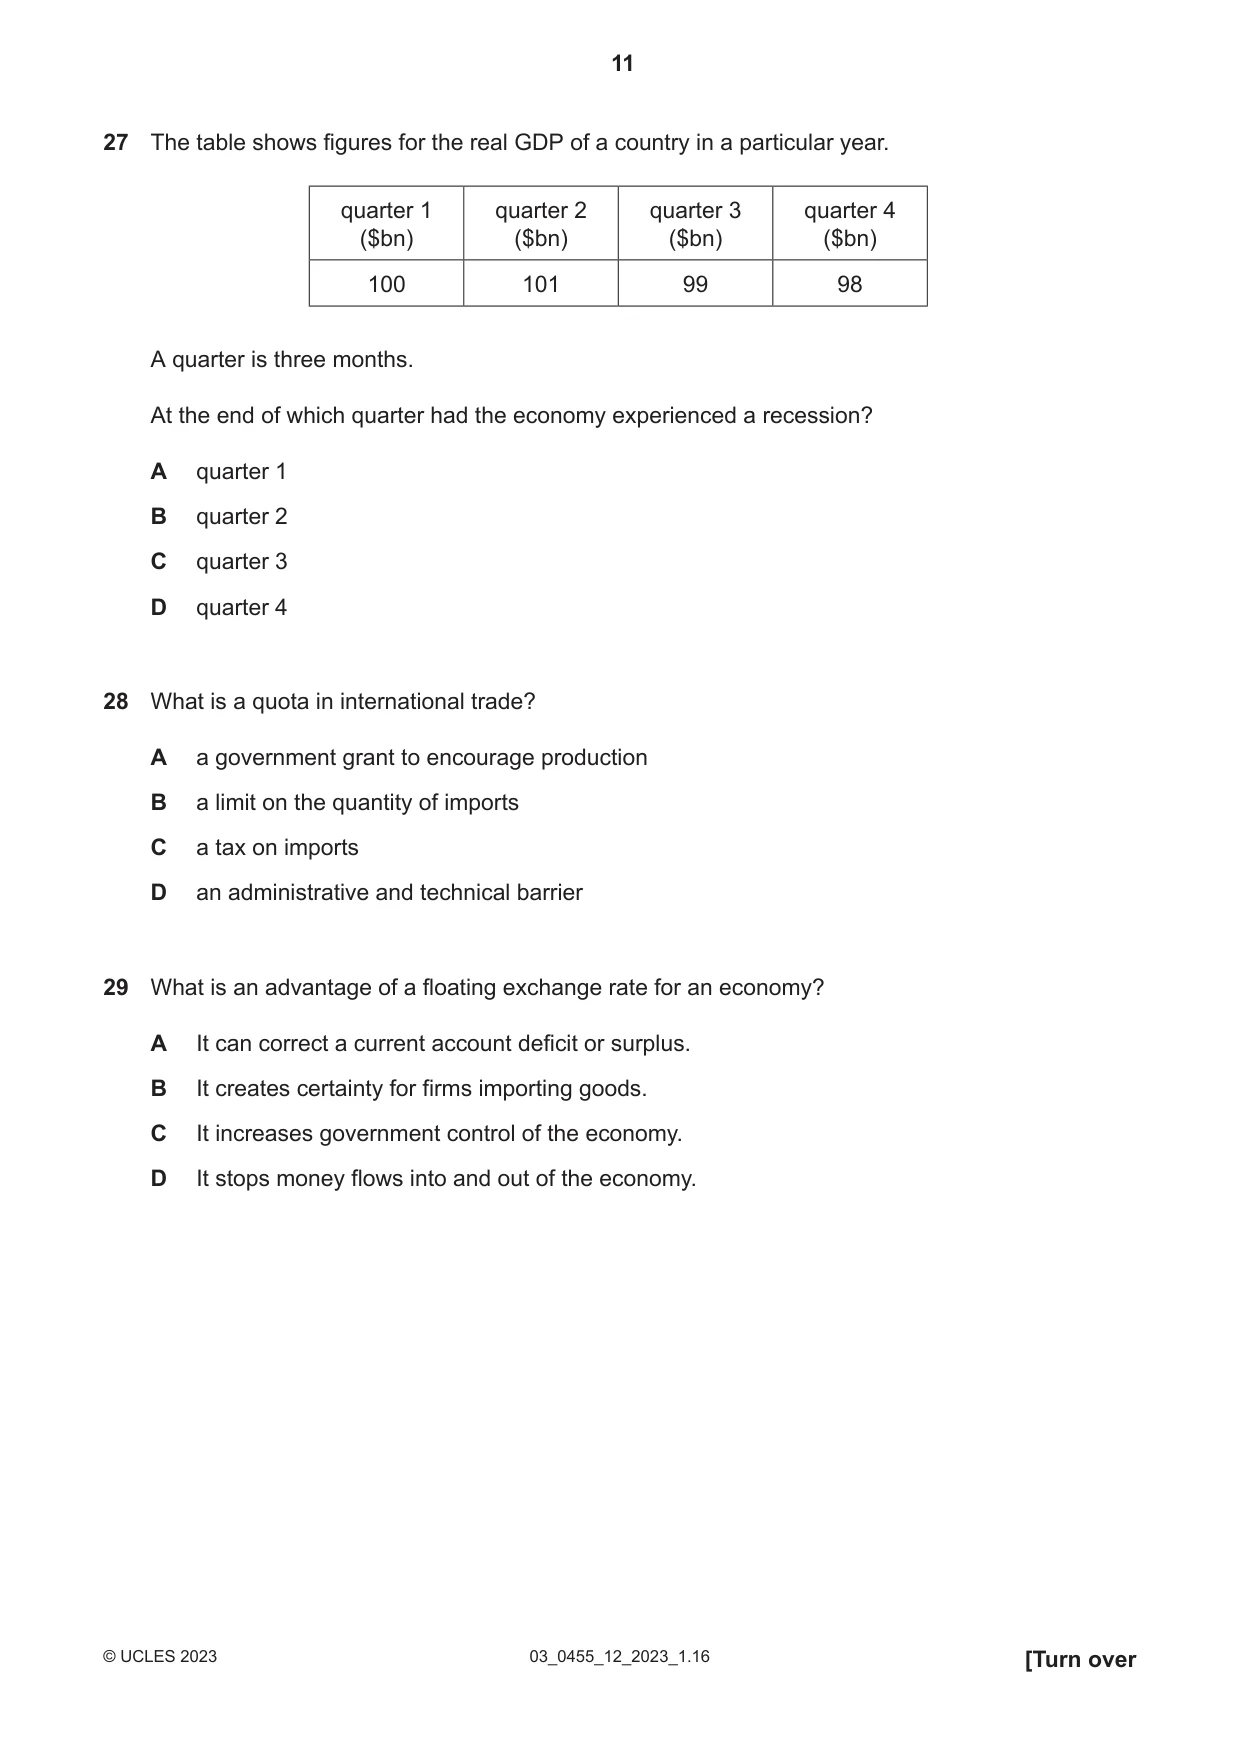
Q27 · The table shows figures for the real GDP of a country in a particular year
27 The table shows figures for the real GDP of a country in a particular year. quarter 1 quarter 2 quarter 3 quarter 4 ($bn) ($bn) ($bn) ($bn) 100 101 99 98 A quarter is three months. At the end of which quarter had the economy experienced a recession? A quarter 1 B quarter 2 C quarter 3 D quarter 4
Mark scheme: D
Q28 · What is a quota in international trade?
28 What is a quota in international trade? A a government grant to encourage production B a limit on the quantity of imports C a tax on imports D an administrative and technical barrier
Mark scheme: B
Q29 · What is an advantage of a floating exchange rate for an economy?
29 What is an advantage of a floating exchange rate for an economy? A It can correct a current account deficit or surplus. B It creates certainty for firms importing goods. C It increases government control of the economy. D It stops money flows into and out of the economy.
Mark scheme: A
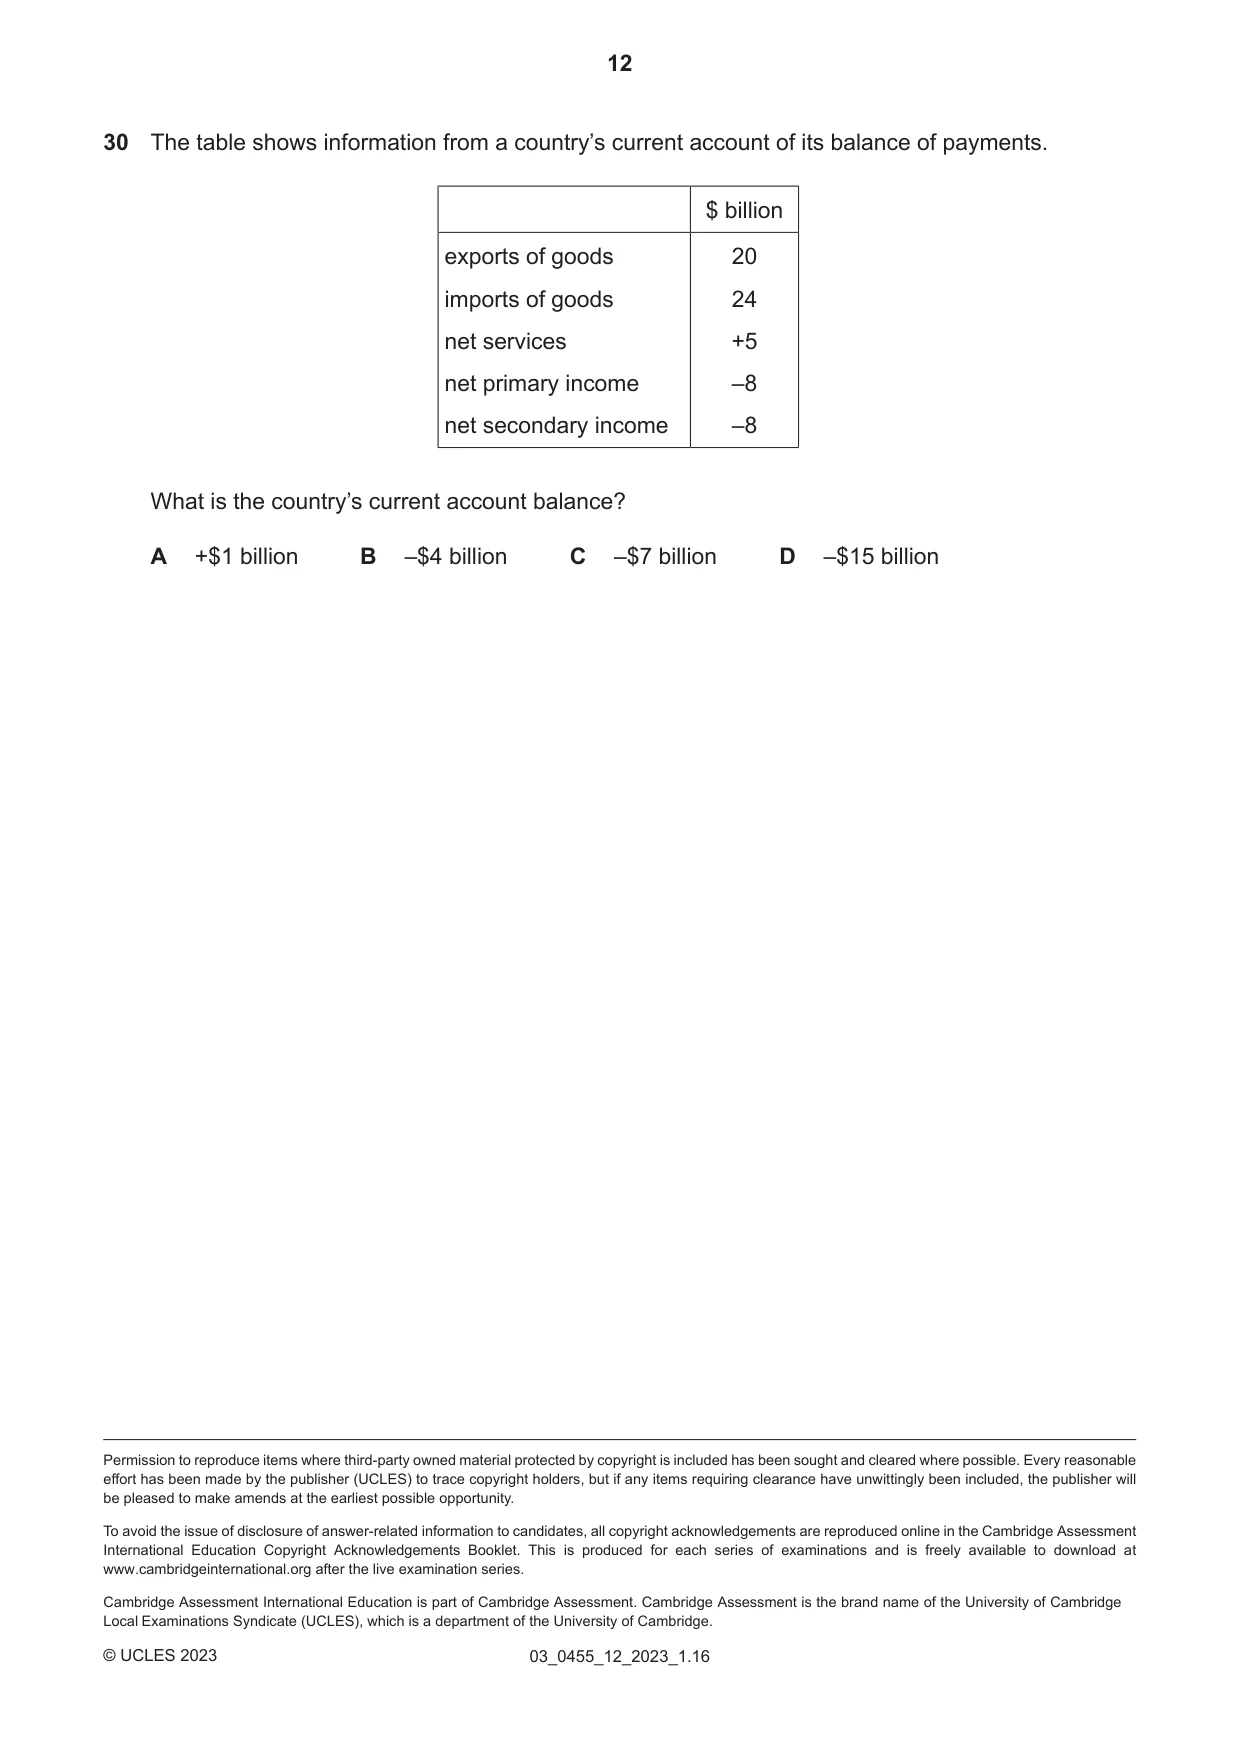
Q30 · The table shows information from a country’s current account of its balance of payments
30 The table shows information from a country’s current account of its balance of payments. $ billion exports of goods 20 imports of goods 24 net services +5 net primary income –8 net secondary income –8 What is the country’s current account balance? A +$1 billion B –$4 billion C –$7 billion D –$15 billion
Mark scheme: D
What was in this paper
The subtopics covered by these 30 questions, and how many questions each got. Open one in a new tab to see every Cambridge question on it.
2Firms’ costs, revenue and objectives2Fiscal policy2Inflation and deflation2Opportunity cost2Population2Price elasticity of demand (PED)2Workers2Current account of balance of payments1Demand1Economic growth1Foreign exchange rates1Globalisation, free trade and protection1Households1Market failure1Market structure1Monetary policy1Money and banking1Price determination1Supply1Supply-side policy1Trade unions1What you needed in this session
Cambridge’s own grade thresholds for 2023 Feb/March, Paper 1 · Variant 2. A higher threshold means an easier paper — the bar moves with how the cohort did.