Cambridge IGCSE Economics 0455 — 2019 Oct/Nov Paper 1 · Variant 1
0455/11/O/N/19 · 30 questions · 30 marks · ≈34 min
The question paper and its mark scheme, free to read here and free to download. This is Cambridge’s own paper, exactly as it was sat.
Question paper12 pages
Mark scheme3 pages
Answers below. Sit the paper first if you are practising.

Questions as text
Q1 · What is classified as one of the four economic resources?
1 What is classified as one of the four economic resources? A consumption B enterprise C production D trade
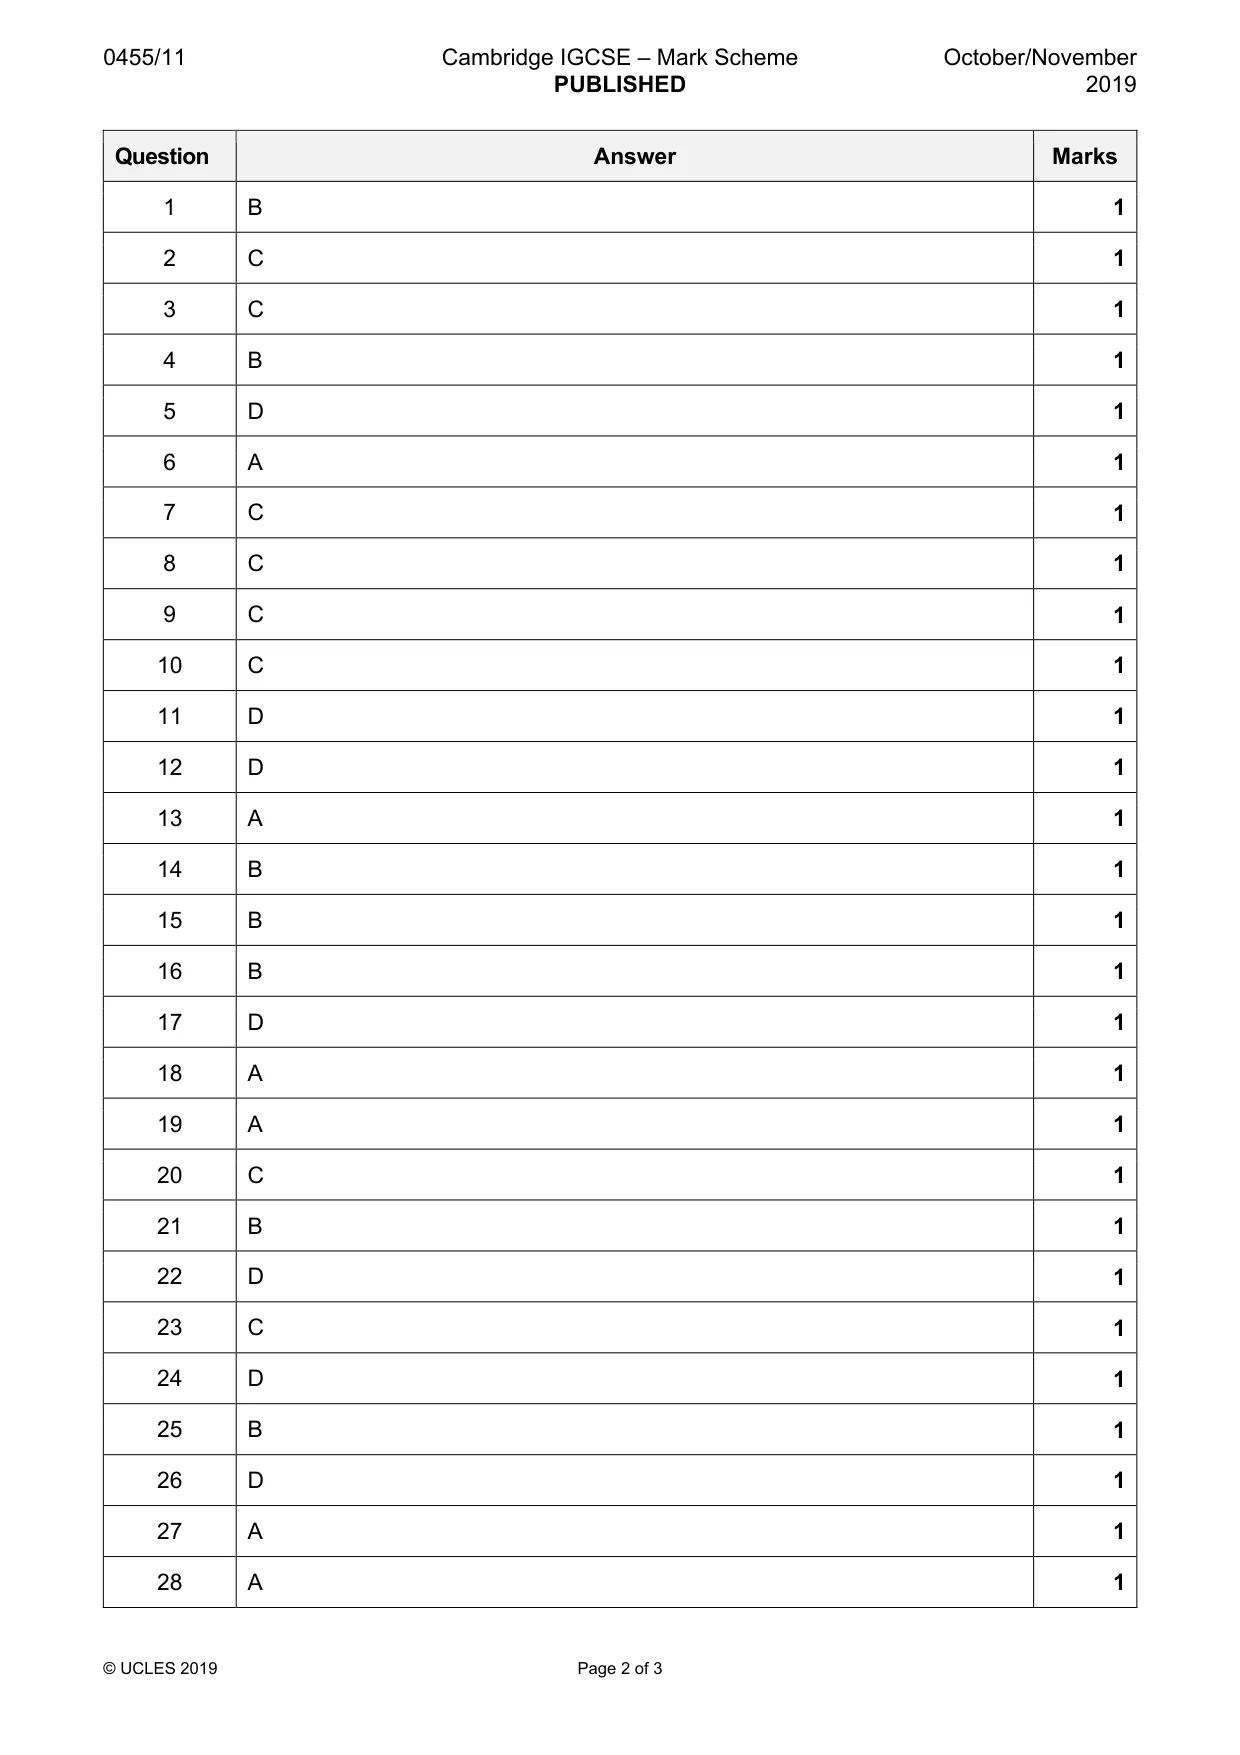
Mark scheme: B
Q2 · Countries X and Y have identical resources
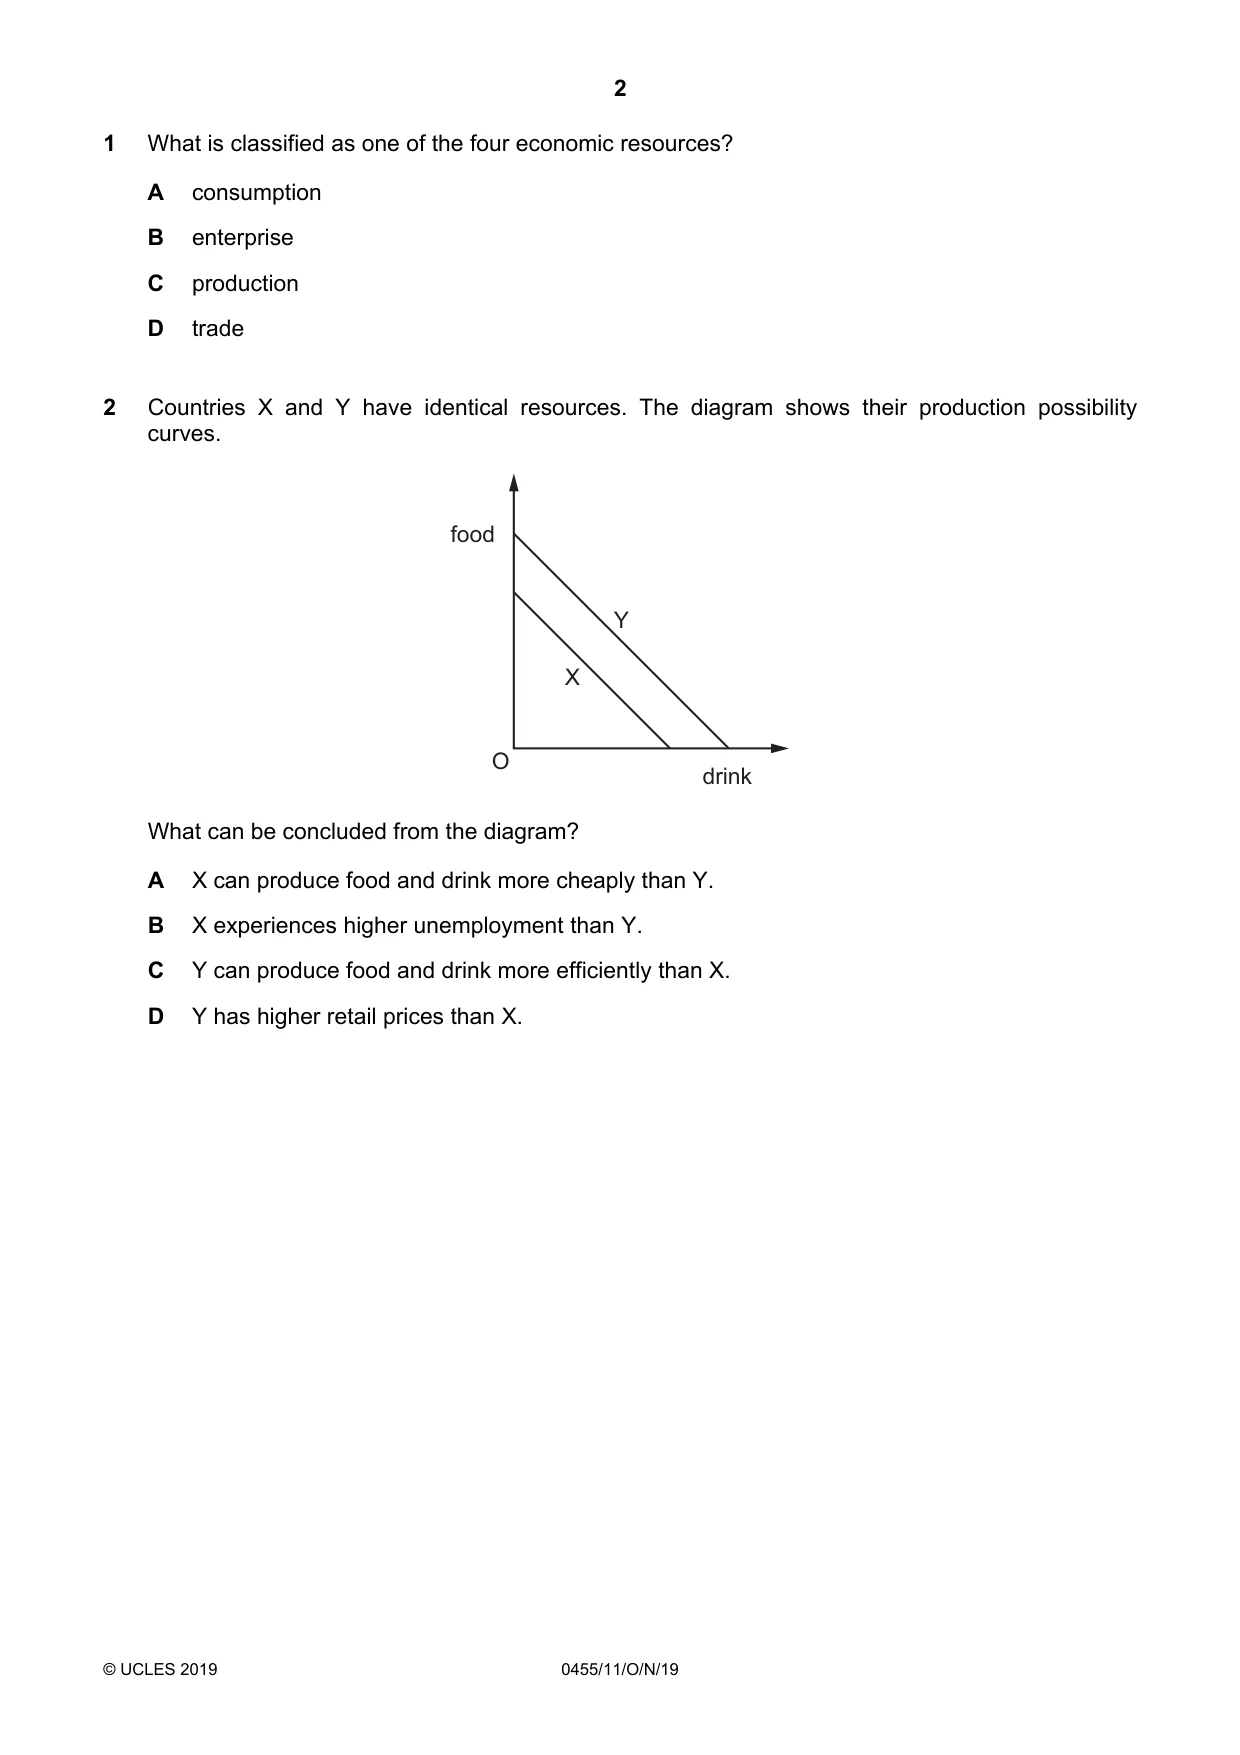
2 Countries X and Y have identical resources. The diagram shows their production possibility curves. food Y X O drink What can be concluded from the diagram? A X can produce food and drink more cheaply than Y. B X experiences higher unemployment than Y. C Y can produce food and drink more efficiently than X. D Y has higher retail prices than X.
Mark scheme: C
More questions on Production possibility curve (PPC) diagrams
Q3 · Sam wrote a list of how he would prefer to spend his Saturday afternoon
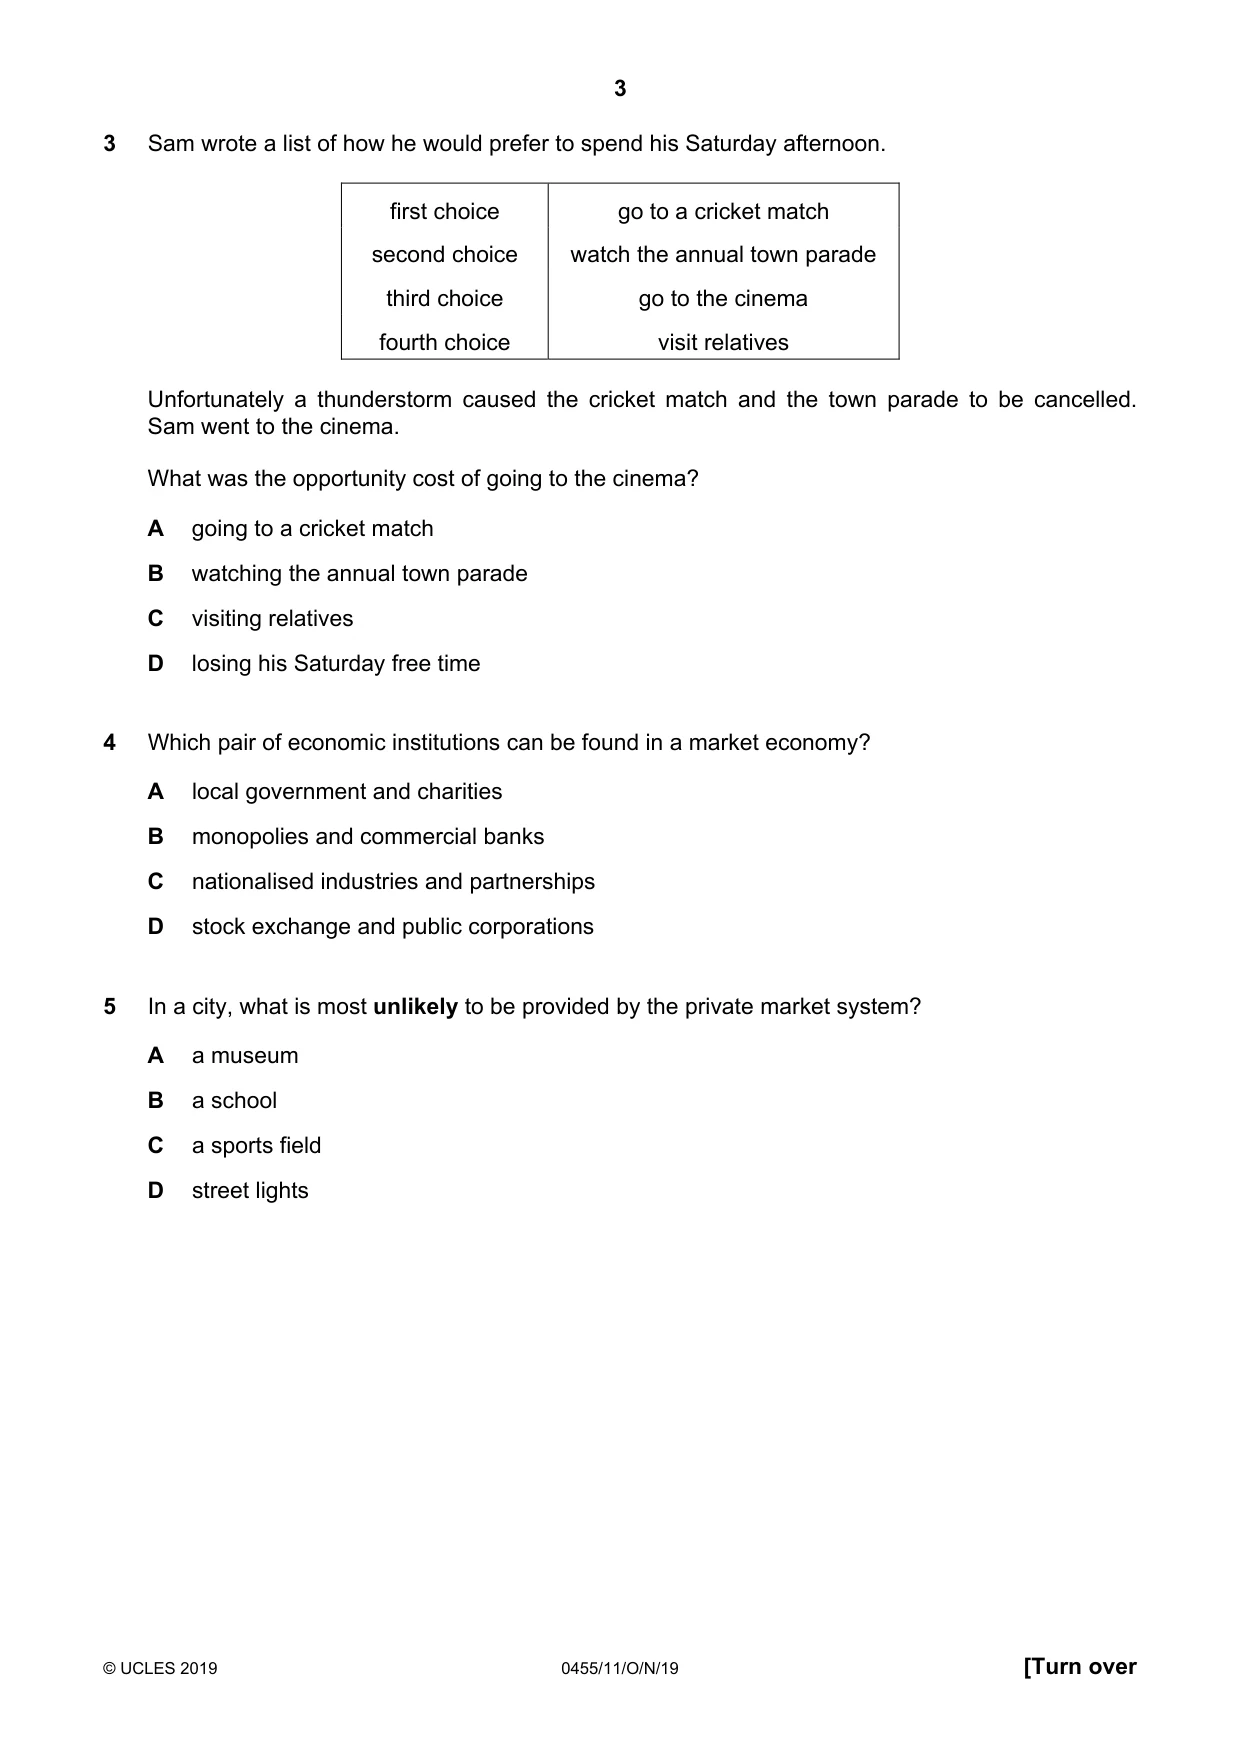
3 Sam wrote a list of how he would prefer to spend his Saturday afternoon. first choice go to a cricket match second choice watch the annual town parade third choice go to the cinema fourth choice visit relatives Unfortunately a thunderstorm caused the cricket match and the town parade to be cancelled. Sam went to the cinema. What was the opportunity cost of going to the cinema? A going to a cricket match B watching the annual town parade C visiting relatives D losing his Saturday free time
Mark scheme: C
Q4 · Which pair of economic institutions can be found in a market economy?
4 Which pair of economic institutions can be found in a market economy? A local government and charities B monopolies and commercial banks C nationalised industries and partnerships D stock exchange and public corporations
Mark scheme: B
Q5 · In a city, what is most unlikely to be provided by the private market system?
5 In a city, what is most unlikely to be provided by the private market system? A a museum B a school C a sports field D street lights
Mark scheme: D
Q6 · The table shows the quantity demanded and supplied for a commodity at different prices
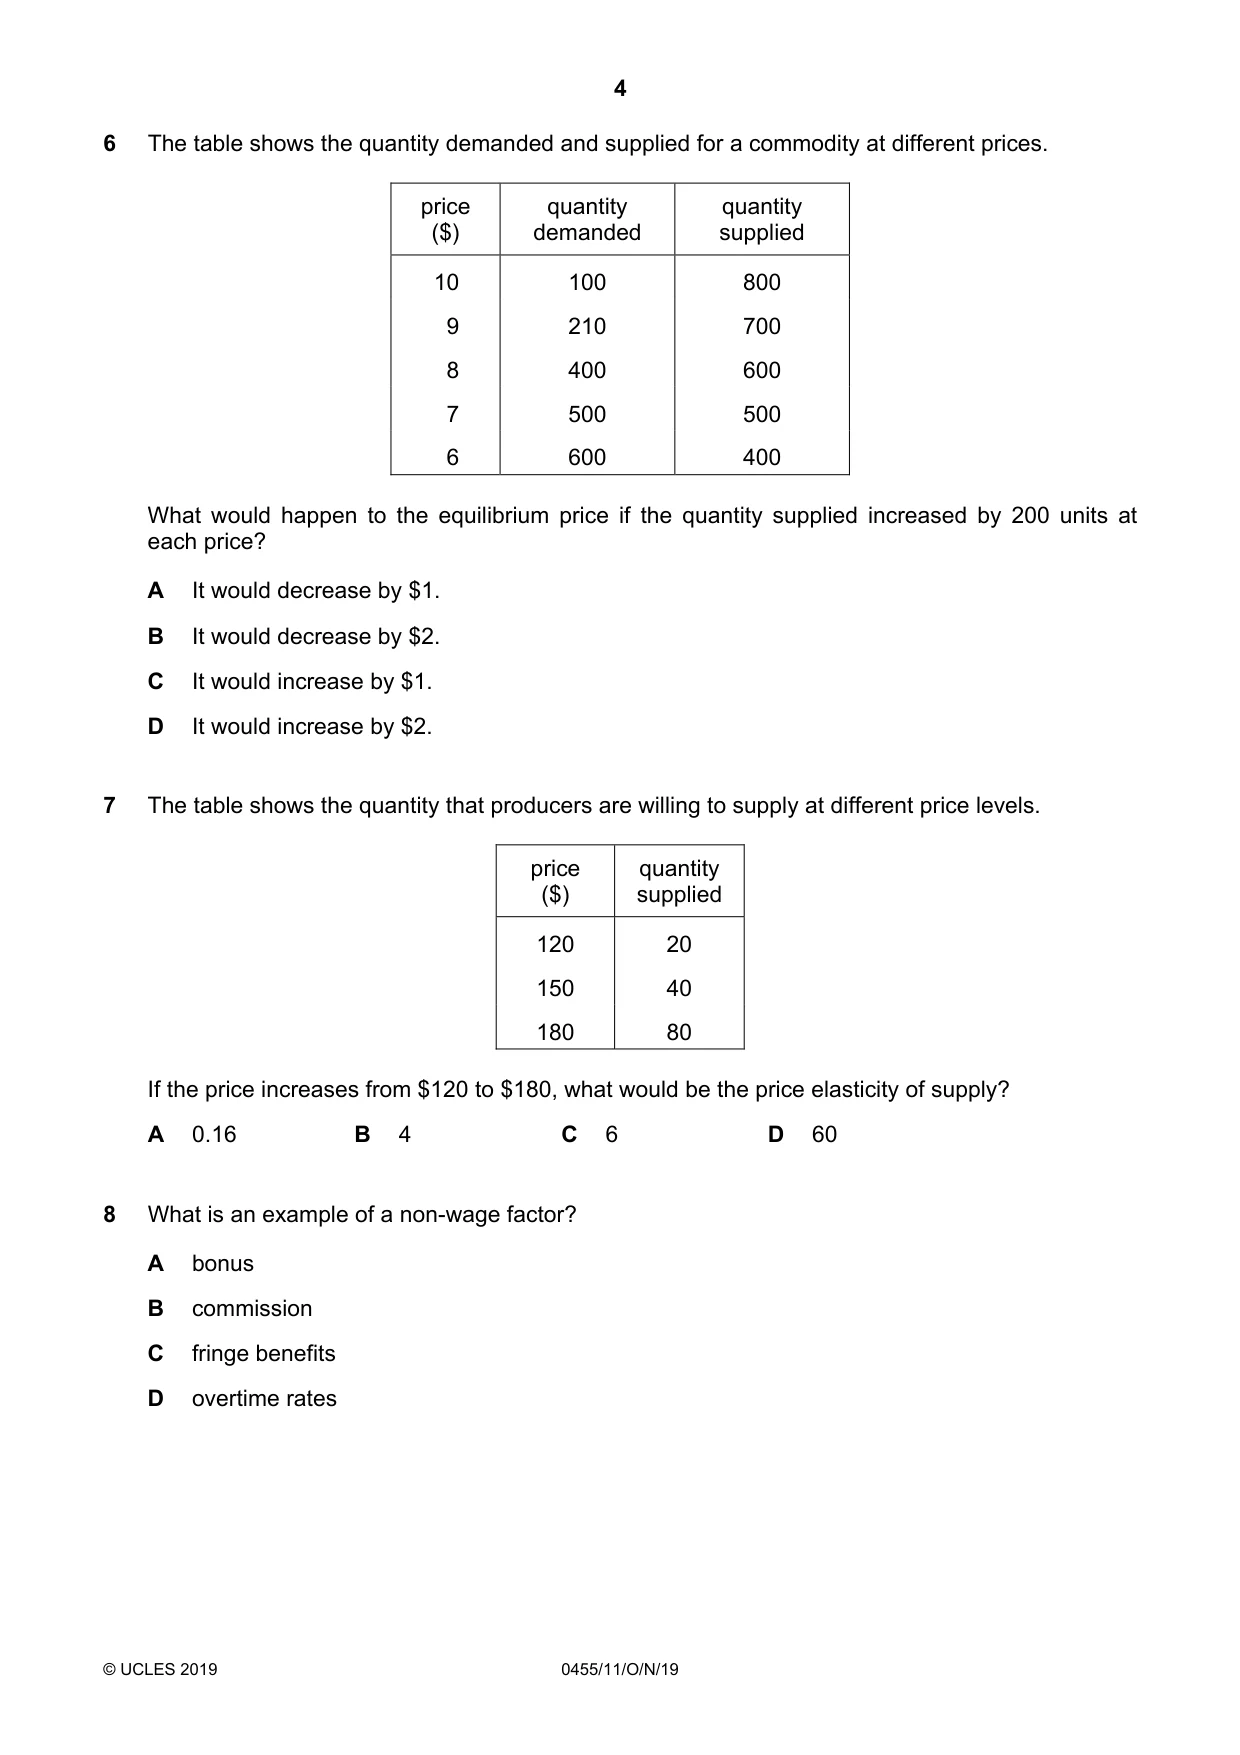
6 The table shows the quantity demanded and supplied for a commodity at different prices. price quantity quantity ($) demanded supplied 10 100 800 9 210 700 8 400 600 7 500 500 6 600 400 What would happen to the equilibrium price if the quantity supplied increased by 200 units at each price? A It would decrease by $1. B It would decrease by $2. C It would increase by $1. D It would increase by $2.
Mark scheme: A
Q7 · The table shows the quantity that producers are willing to supply at different price…
7 The table shows the quantity that producers are willing to supply at different price levels. price quantity ($) supplied 120 20 150 40 180 80 If the price increases from $120 to $180, what would be the price elasticity of supply? A 0.16 B 4 C 6 D 60
Mark scheme: C
Q8 · What is an example of a non-wage factor?
8 What is an example of a non-wage factor? A bonus B commission C fringe benefits D overtime rates
Mark scheme: C
Q9 · An African government has abandoned its own dollar and now uses the US dollar as its…
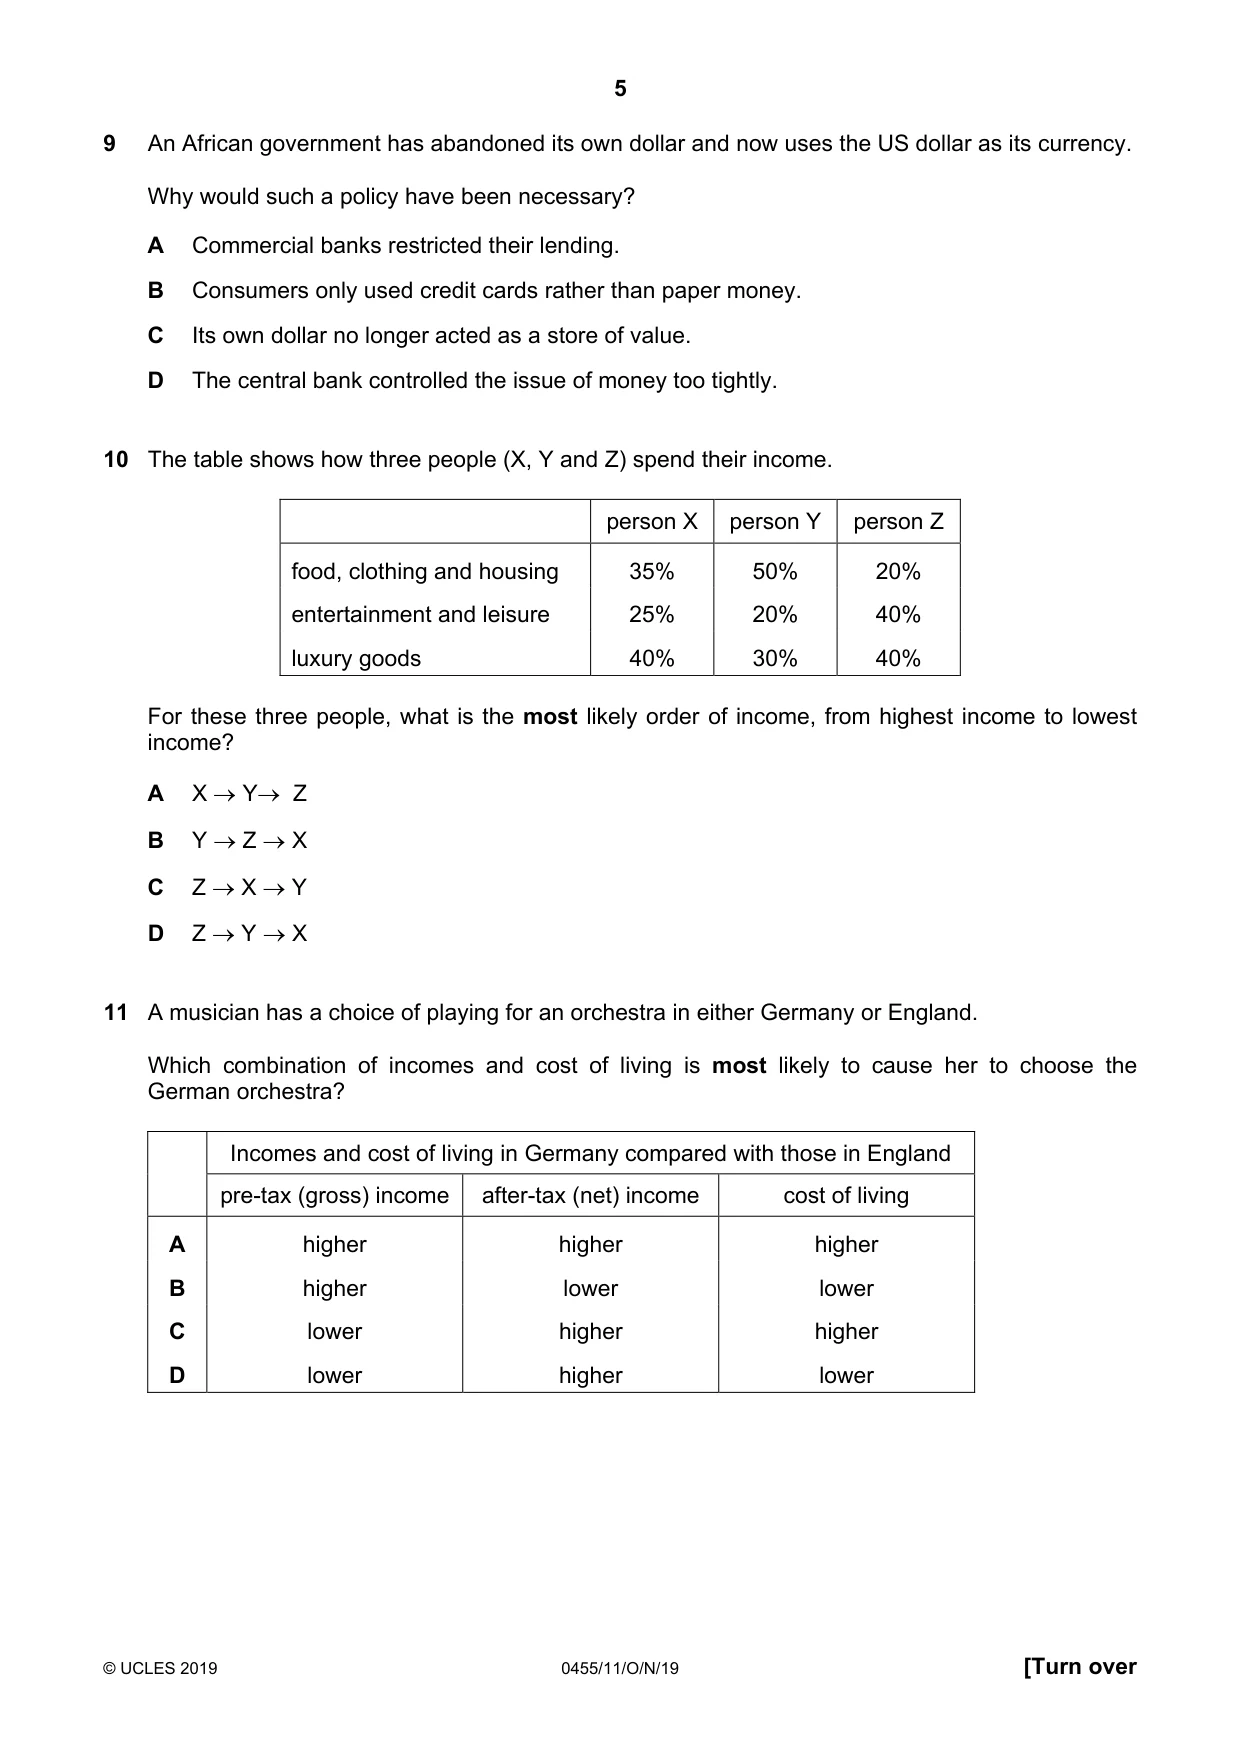
9 An African government has abandoned its own dollar and now uses the US dollar as its currency. Why would such a policy have been necessary? A Commercial banks restricted their lending. B Consumers only used credit cards rather than paper money. C Its own dollar no longer acted as a store of value. D The central bank controlled the issue of money too tightly.
Mark scheme: C
Q10 · The table shows how three people (X, Y and Z) spend their income
10 The table shows how three people (X, Y and Z) spend their income. person X person Y person Z food, clothing and housing 35% 50% 20% entertainment and leisure 25% 20% 40% luxury goods 40% 30% 40% For these three people, what is the most likely order of income, from highest income to lowest income? A X → Y→ Z B Y → Z → X C Z → X → Y D Z → Y → X
Mark scheme: C
Q11 · A musician has a choice of playing for an orchestra in either Germany or England
11 A musician has a choice of playing for an orchestra in either Germany or England. Which combination of incomes and cost of living is most likely to cause her to choose the German orchestra? Incomes and cost of living in Germany compared with those in England pre-tax (gross) income after-tax (net) income cost of living A higher higher higher B higher lower lower C lower higher higher D lower higher lower
Mark scheme: D
Q12 · What must result from an increase in output?
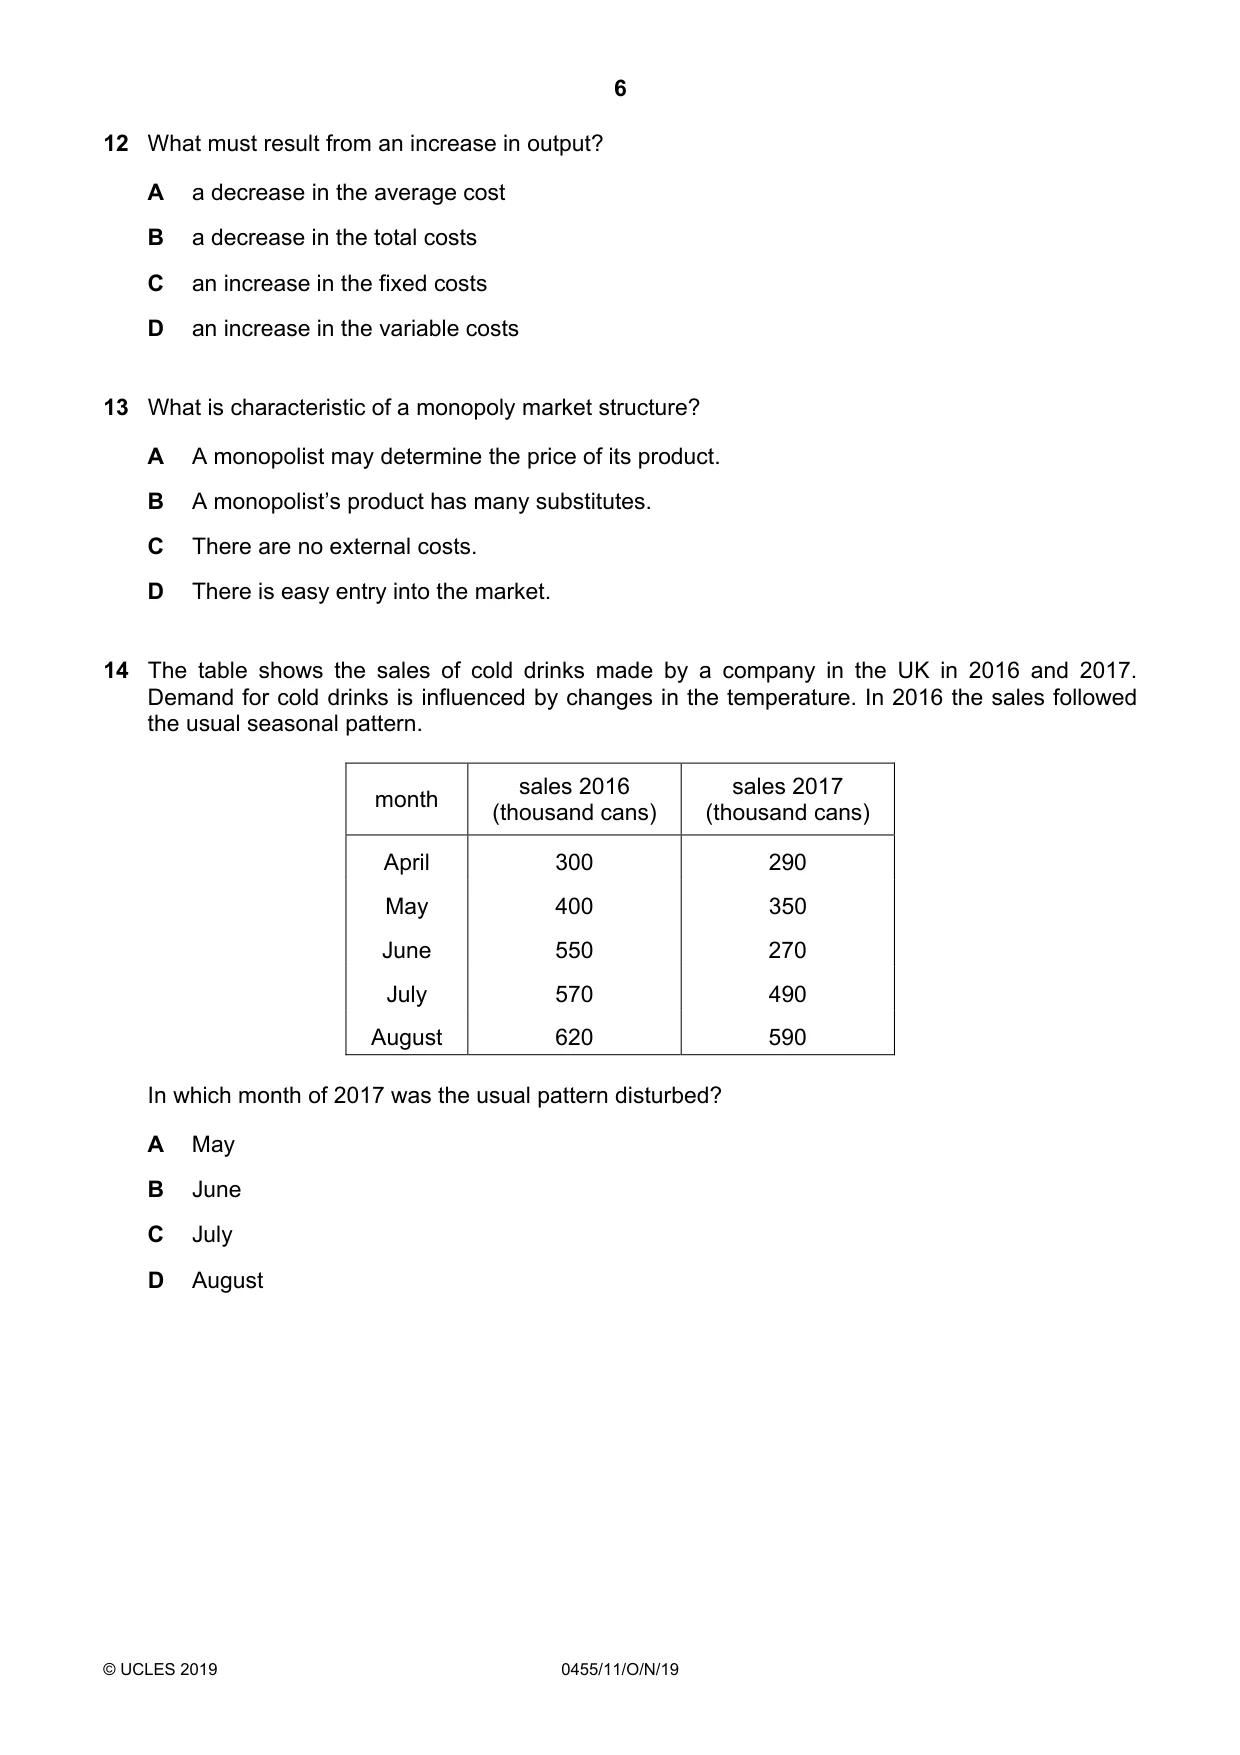
12 What must result from an increase in output? A a decrease in the average cost B a decrease in the total costs C an increase in the fixed costs D an increase in the variable costs
Mark scheme: D
Q13 · What is characteristic of a monopoly market structure?
13 What is characteristic of a monopoly market structure? A A monopolist may determine the price of its product. B A monopolist’s product has many substitutes. C There are no external costs. D There is easy entry into the market.
Mark scheme: A
Q14 · The table shows the sales of cold drinks made by a company in the UK in 2016 and 2017
14 The table shows the sales of cold drinks made by a company in the UK in 2016 and 2017. Demand for cold drinks is influenced by changes in the temperature. In 2016 the sales followed the usual seasonal pattern. sales 2016 sales 2017 month (thousand cans) (thousand cans) April 300 290 May 400 350 June 550 270 July 570 490 August 620 590 In which month of 2017 was the usual pattern disturbed? A May B June C July D August
Mark scheme: B
Q15 · A firm producing bicycles has the following costs at different levels of output
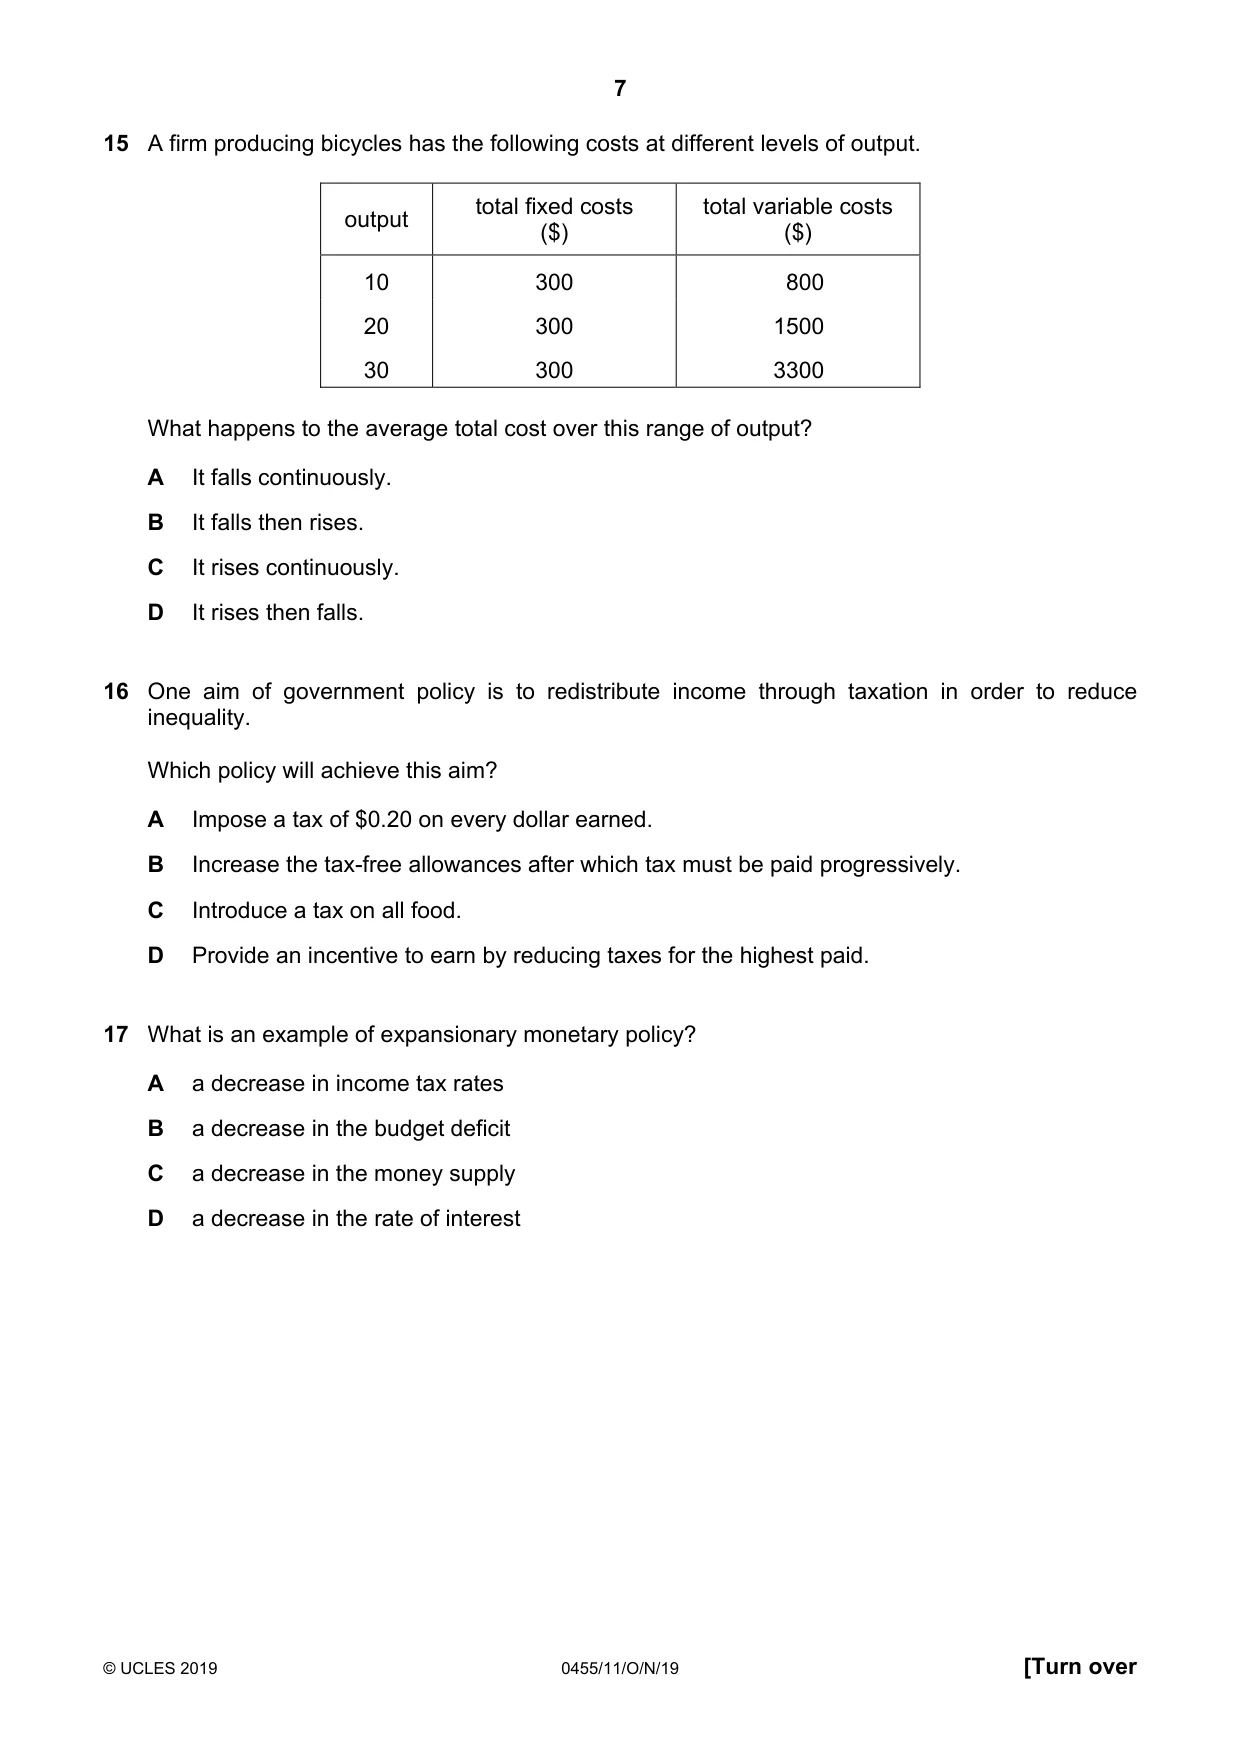
15 A firm producing bicycles has the following costs at different levels of output. total fixed costs total variable costs output ($) ($) 10 300 800 20 300 1500 30 300 3300 What happens to the average total cost over this range of output? A It falls continuously. B It falls then rises. C It rises continuously. D It rises then falls.
Mark scheme: B
Q16 · One aim of government policy is to redistribute income through taxation in order to…
16 One aim of government policy is to redistribute income through taxation in order to reduce inequality. Which policy will achieve this aim? A Impose a tax of $0.20 on every dollar earned. B Increase the tax-free allowances after which tax must be paid progressively. C Introduce a tax on all food. D Provide an incentive to earn by reducing taxes for the highest paid.
Mark scheme: B
Q17 · What is an example of expansionary monetary policy?
17 What is an example of expansionary monetary policy? A a decrease in income tax rates B a decrease in the budget deficit C a decrease in the money supply D a decrease in the rate of interest
Mark scheme: D
Q18 · Which actions would be likely to increase government expenditure and reduce revenues from…
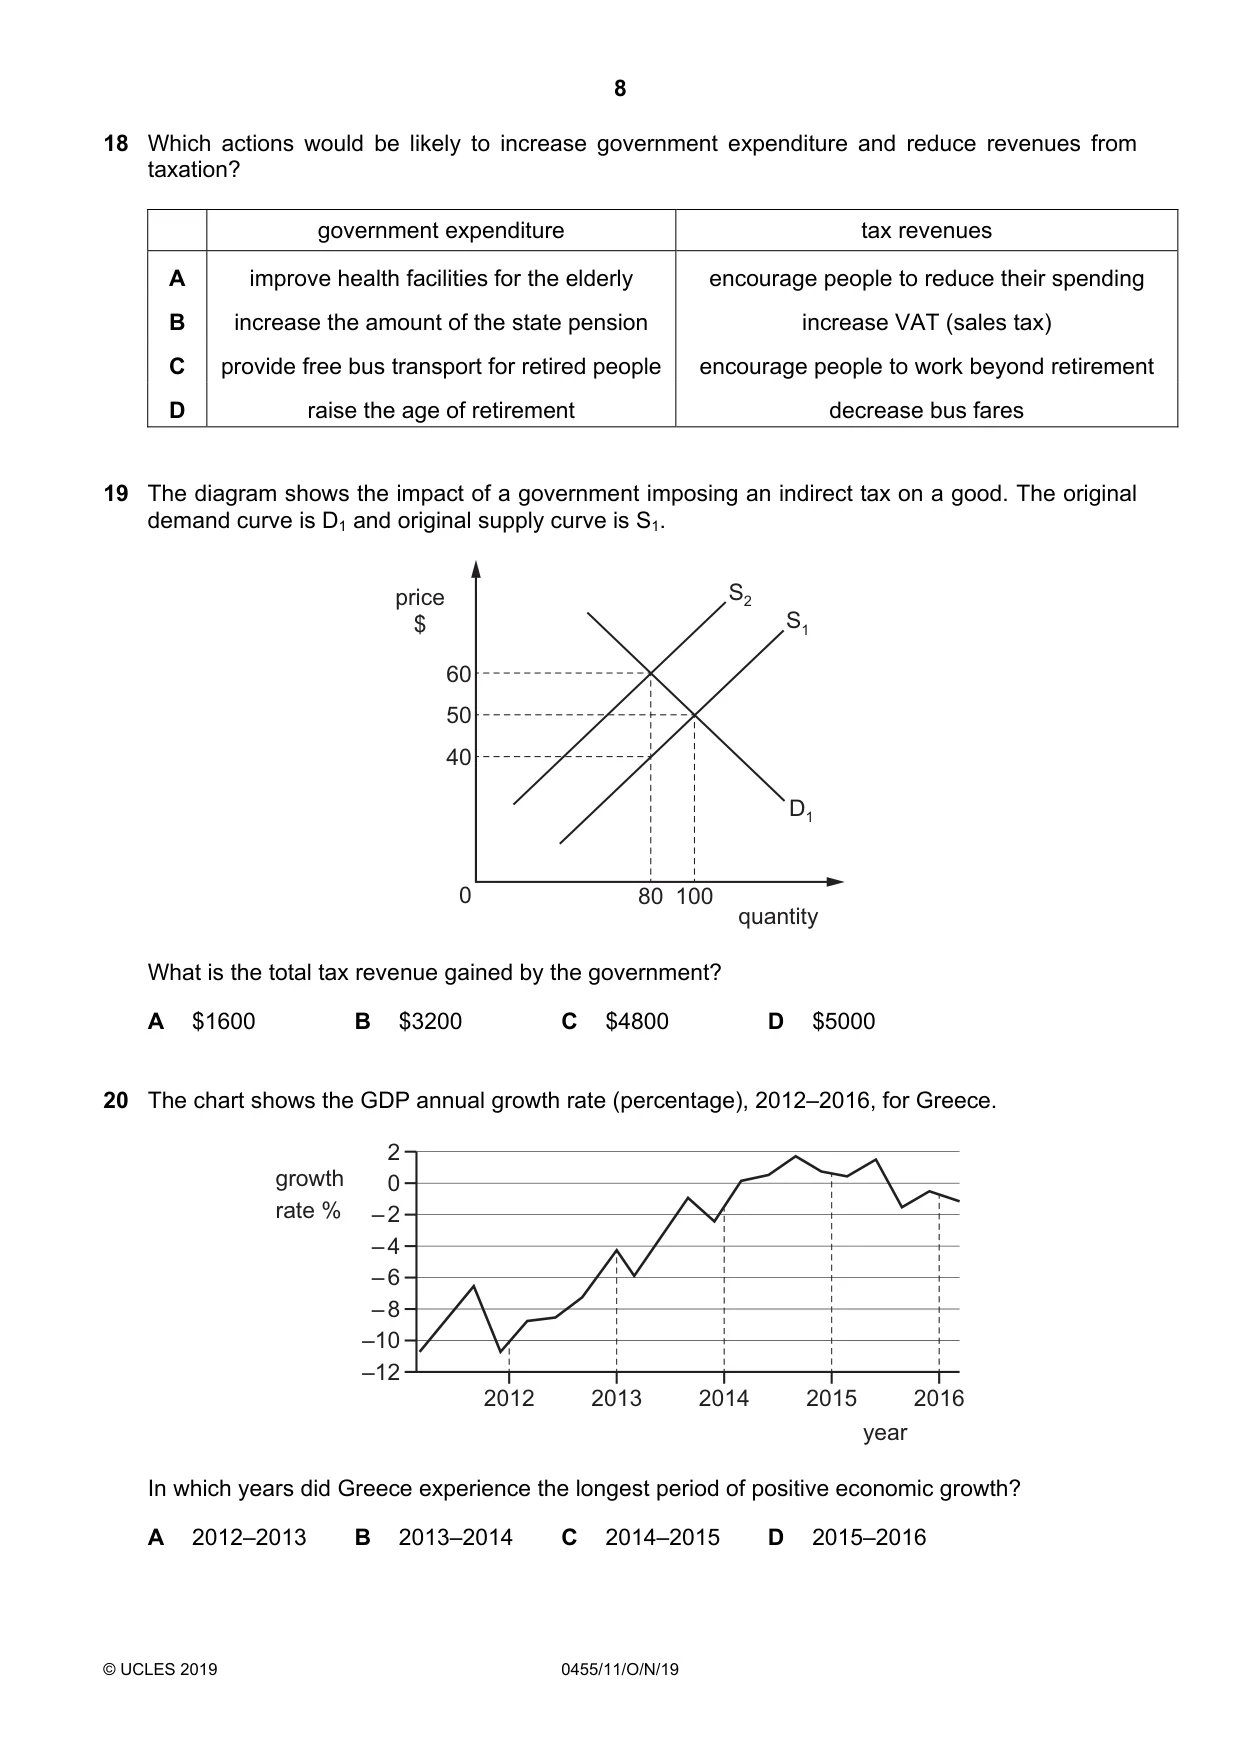
18 Which actions would be likely to increase government expenditure and reduce revenues from taxation? government expenditure tax revenues A improve health facilities for the elderly encourage people to reduce their spending B increase the amount of the state pension increase VAT (sales tax) C provide free bus transport for retired people encourage people to work beyond retirement D raise the age of retirement decrease bus fares
Mark scheme: A
Q19 · The diagram shows the impact of a government imposing an indirect tax on a good
19 The diagram shows the impact of a government imposing an indirect tax on a good. The original demand curve is D1 and original supply curve is S1. price S2 $ S1 60 50 40 D1 0 80 100 quantity What is the total tax revenue gained by the government? A $1600 B $3200 C $4800 D $5000
Mark scheme: A
Q20 · The chart shows the GDP annual growth rate (percentage), 2012–2016, for Greece
20 The chart shows the GDP annual growth rate (percentage), 2012–2016, for Greece. 2 growth 0 rate % – 2 – 4 – 6 – 8 –10 –12 2012 2013 2014 2015 2016 year In which years did Greece experience the longest period of positive economic growth? A 2012–2013 B 2013–2014 C 2014–2015 D 2015–2016
Mark scheme: C
Q21 · What are the components of the Human Development Index (HDI)?
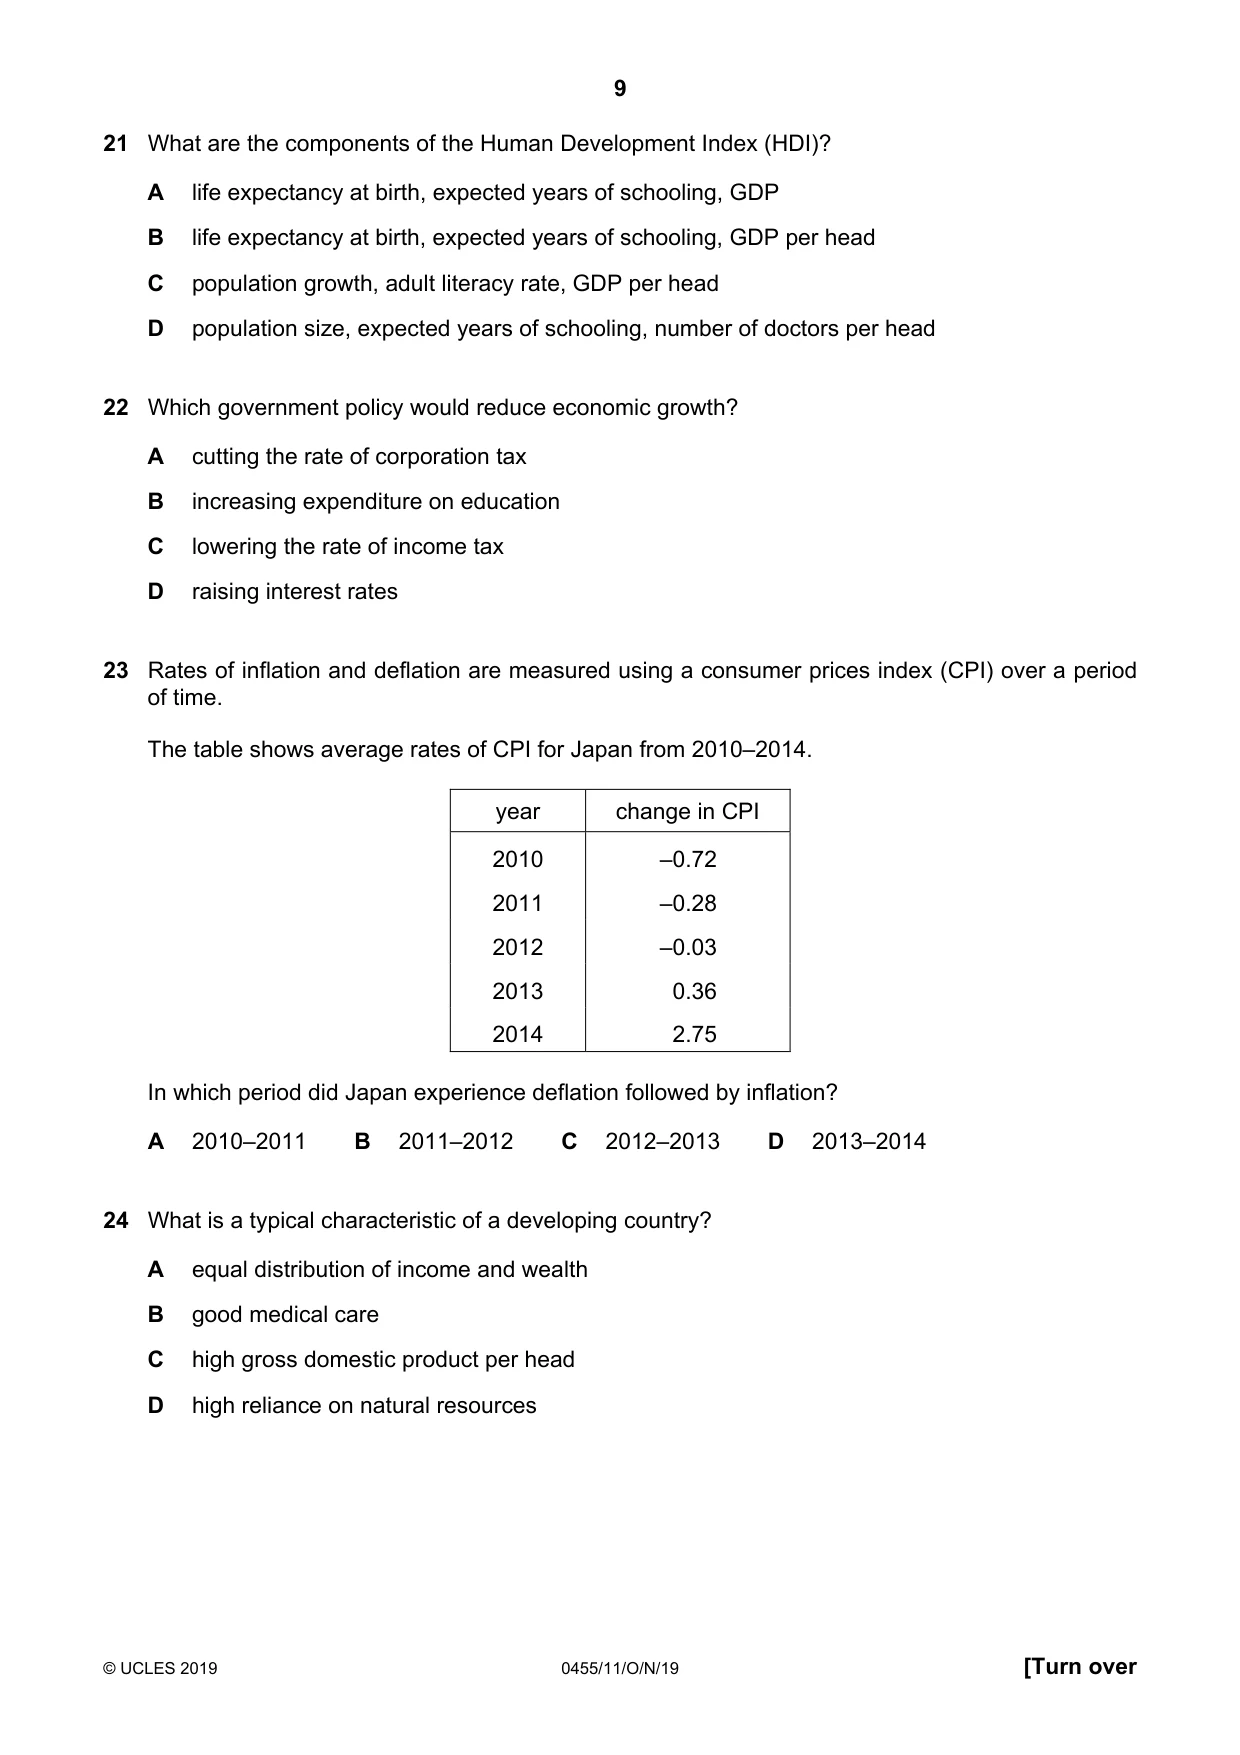
21 What are the components of the Human Development Index (HDI)? A life expectancy at birth, expected years of schooling, GDP B life expectancy at birth, expected years of schooling, GDP per head C population growth, adult literacy rate, GDP per head D population size, expected years of schooling, number of doctors per head
Mark scheme: B
More questions on Differences in economic development between countries
Q22 · Which government policy would reduce economic growth?
22 Which government policy would reduce economic growth? A cutting the rate of corporation tax B increasing expenditure on education C lowering the rate of income tax D raising interest rates
Mark scheme: D
Q23 · Rates of inflation and deflation are measured using a consumer prices index (CPI) over a…
23 Rates of inflation and deflation are measured using a consumer prices index (CPI) over a period of time. The table shows average rates of CPI for Japan from 2010–2014. year change in CPI 2010 –0.72 2011 –0.28 2012 –0.03 2013 0.36 2014 2.75 In which period did Japan experience deflation followed by inflation? A 2010–2011 B 2011–2012 C 2012–2013 D 2013–2014
Mark scheme: C
Q24 · What is a typical characteristic of a developing country?
24 What is a typical characteristic of a developing country? A equal distribution of income and wealth B good medical care C high gross domestic product per head D high reliance on natural resources
Mark scheme: D
More questions on Differences in economic development between countries
Q25 · In Botswana, better healthcare has meant that birth rates have been falling faster than…
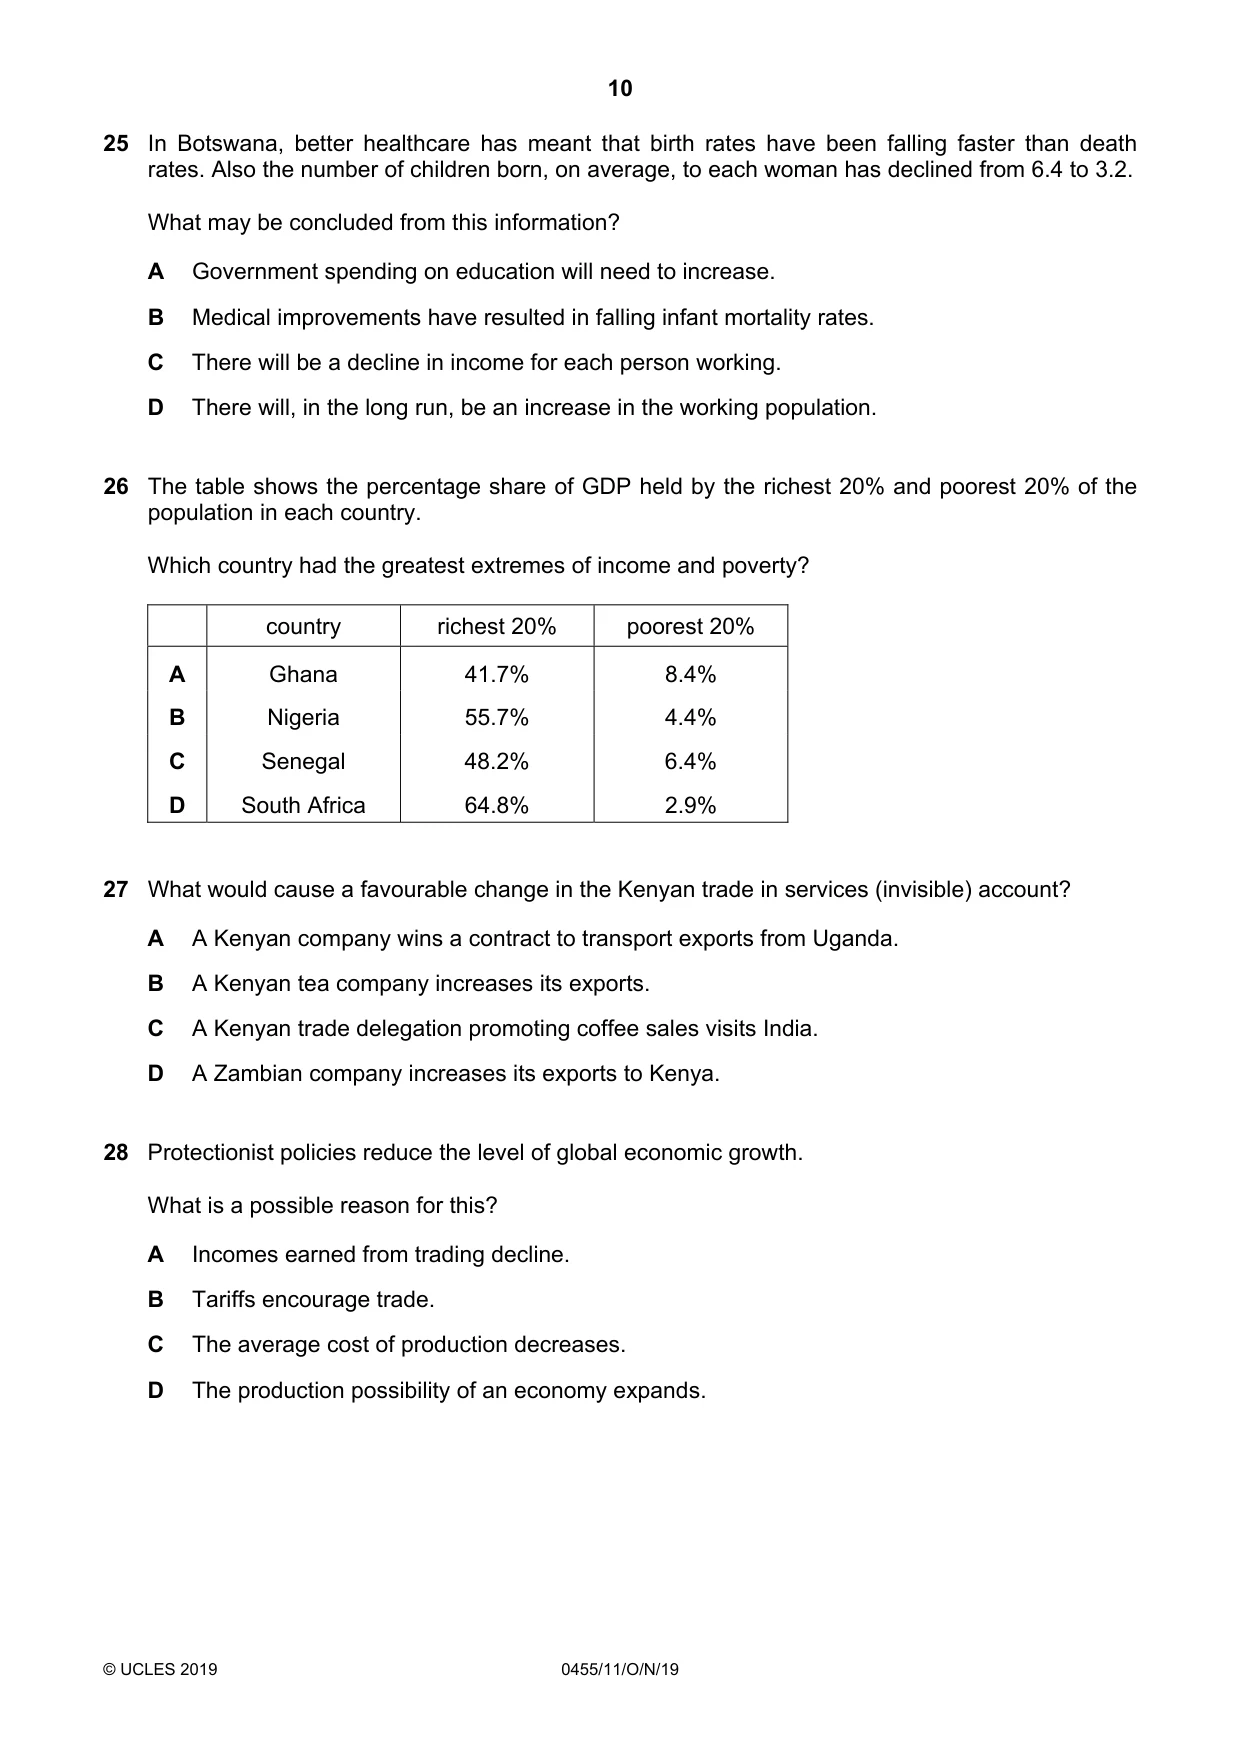
25 In Botswana, better healthcare has meant that birth rates have been falling faster than death rates. Also the number of children born, on average, to each woman has declined from 6.4 to 3.2. What may be concluded from this information? A Government spending on education will need to increase. B Medical improvements have resulted in falling infant mortality rates. C There will be a decline in income for each person working. D There will, in the long run, be an increase in the working population.
Mark scheme: B
Q26 · The table shows the percentage share of GDP held by the richest 20% and poorest 20% of…
26 The table shows the percentage share of GDP held by the richest 20% and poorest 20% of the population in each country. Which country had the greatest extremes of income and poverty? country richest 20% poorest 20% A Ghana 41.7% 8.4% B Nigeria 55.7% 4.4% C Senegal 48.2% 6.4% D South Africa 64.8% 2.9%
Mark scheme: D
Q27 · What would cause a favourable change in the Kenyan trade in services (invisible) account?
27 What would cause a favourable change in the Kenyan trade in services (invisible) account? A A Kenyan company wins a contract to transport exports from Uganda. B A Kenyan tea company increases its exports. C A Kenyan trade delegation promoting coffee sales visits India. D A Zambian company increases its exports to Kenya.
Mark scheme: A
Q28 · Protectionist policies reduce the level of global economic growth
28 Protectionist policies reduce the level of global economic growth. What is a possible reason for this? A Incomes earned from trading decline. B Tariffs encourage trade. C The average cost of production decreases. D The production possibility of an economy expands.
Mark scheme: A
Q29 · The table shows the current account balance for four countries in 2016
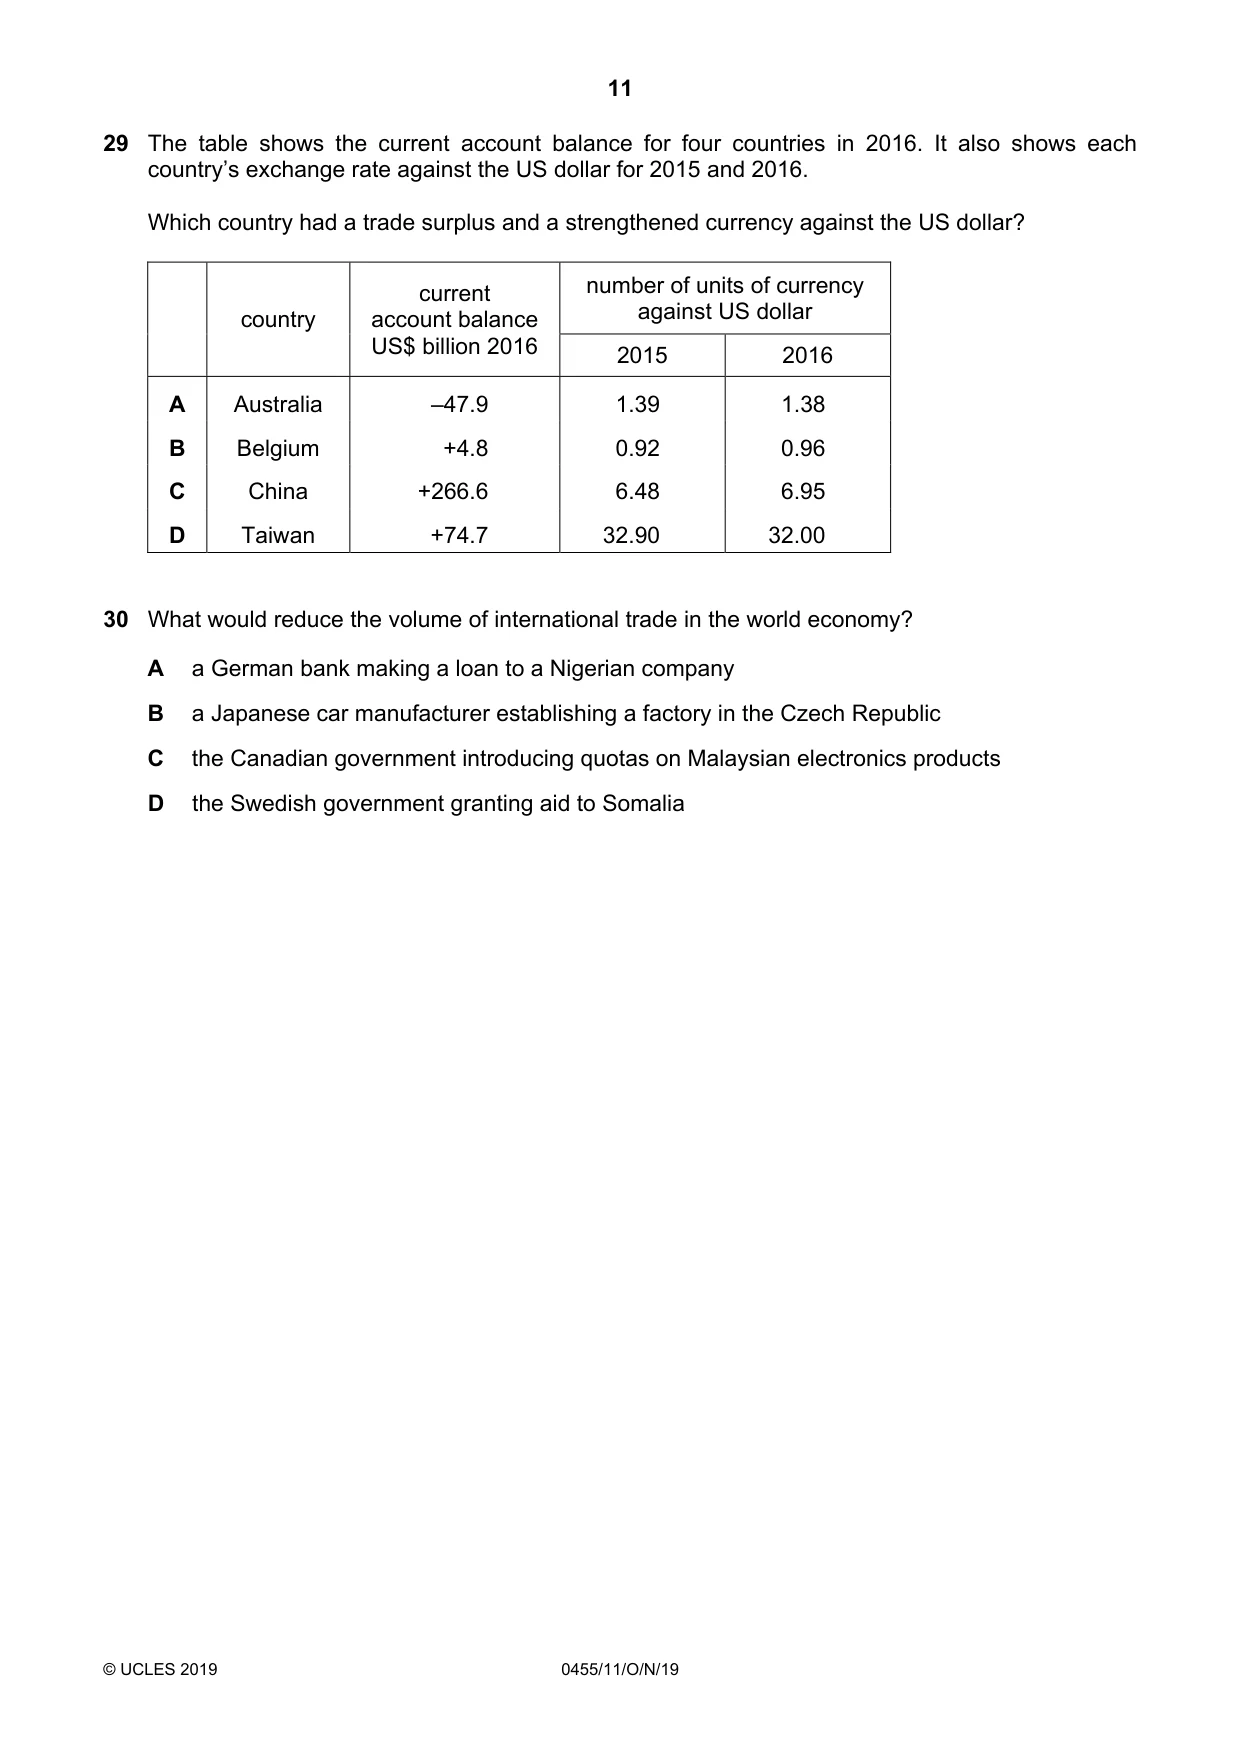
29 The table shows the current account balance for four countries in 2016. It also shows each country’s exchange rate against the US dollar for 2015 and 2016. Which country had a trade surplus and a strengthened currency against the US dollar? current number of units of currency country account balance against US dollar US$ billion 2016 2015 2016 A Australia –47.9 1.39 1.38 B Belgium +4.8 0.92 0.96 C China +266.6 6.48 6.95 D Taiwan +74.7 32.90 32.00
Mark scheme: D
Q30 · What would reduce the volume of international trade in the world economy?
30 What would reduce the volume of international trade in the world economy? A a German bank making a loan to a Nigerian company B a Japanese car manufacturer establishing a factory in the Czech Republic C the Canadian government introducing quotas on Malaysian electronics products D the Swedish government granting aid to Somalia
Mark scheme: C
What was in this paper
The subtopics covered by these 30 questions, and how many questions each got. Open one in a new tab to see every Cambridge question on it.
2Differences in economic development between countries2Economic growth2Firms’ costs, revenue and objectives2Fiscal policy2Globalisation, free trade and protection2Market failure2Workers2Demand1Inflation and deflation1Living standards1Market economic system1Market structure1Monetary policy1Money and banking1Opportunity cost1Population1Poverty1Price determination1Price elasticity of supply (PES)1Production possibility curve (PPC) diagrams1The factors of production1What you needed in this session
Cambridge’s own grade thresholds for 2019 Oct/Nov, Paper 1 · Variant 1. A higher threshold means an easier paper — the bar moves with how the cohort did.