Cambridge IGCSE Economics 0455 — 2017 Oct/Nov Paper 1 · Variant 2
0455/12/O/N/17 · 30 questions · 30 marks · ≈34 min
The question paper and its mark scheme, free to read here and free to download. This is Cambridge’s own paper, exactly as it was sat.
Question paper12 pages



Mark scheme3 pages
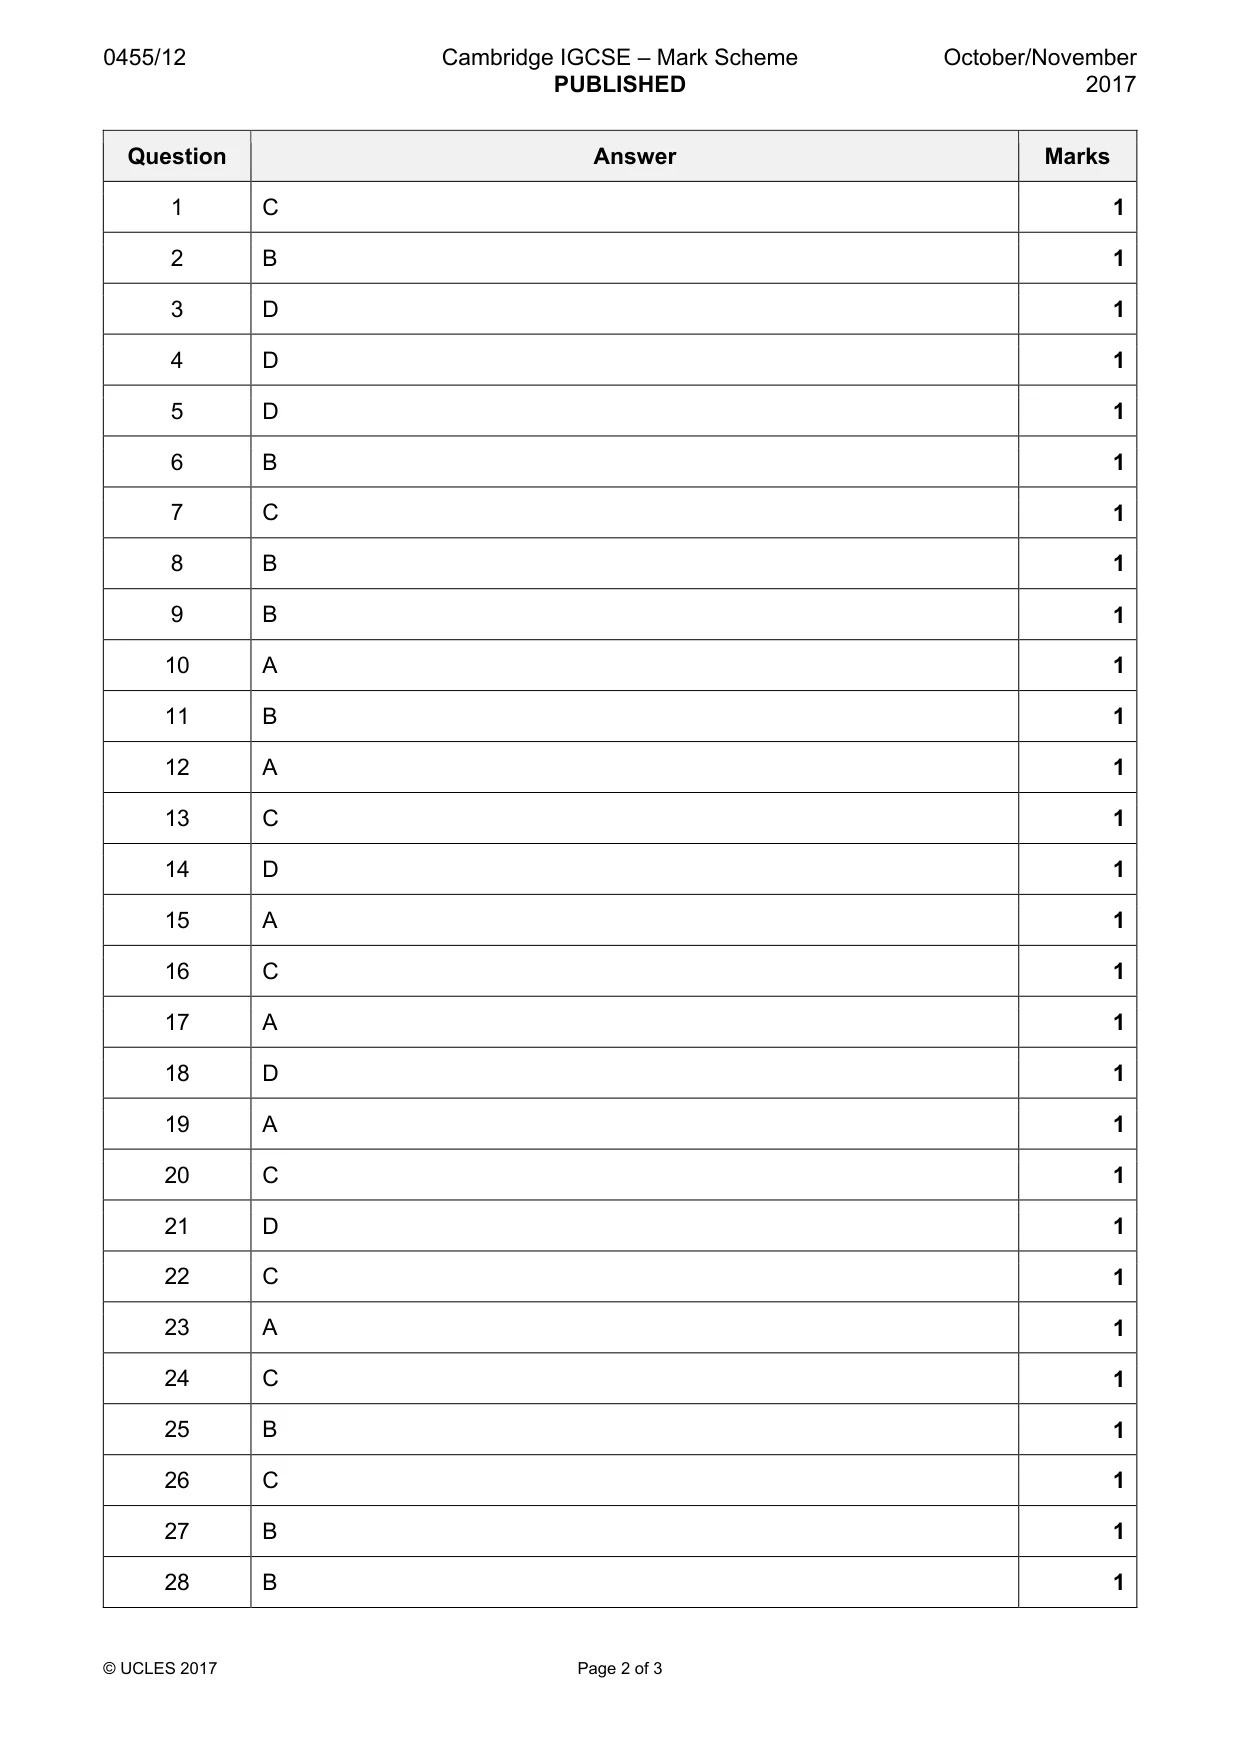
Answers below. Sit the paper first if you are practising.

Questions as text
Q1 · Economists refer to factors of production
1 Economists refer to factors of production. Which is not a factor of production? A the fields of a farm B the machinery in a factory C the shares of a company D the staff in an office
Mark scheme: C
Q2 · A government allowed a building company to construct new houses which destroyed an area…
2 A government allowed a building company to construct new houses which destroyed an area designated as an area of natural beauty. Which concepts can be applied to this statement? A budget surplus; public sector B external cost; opportunity cost C government subsidy; mixed economy D private enterprise; budget deficit
Mark scheme: B
Q3 · The diagram shows a production possibility curve
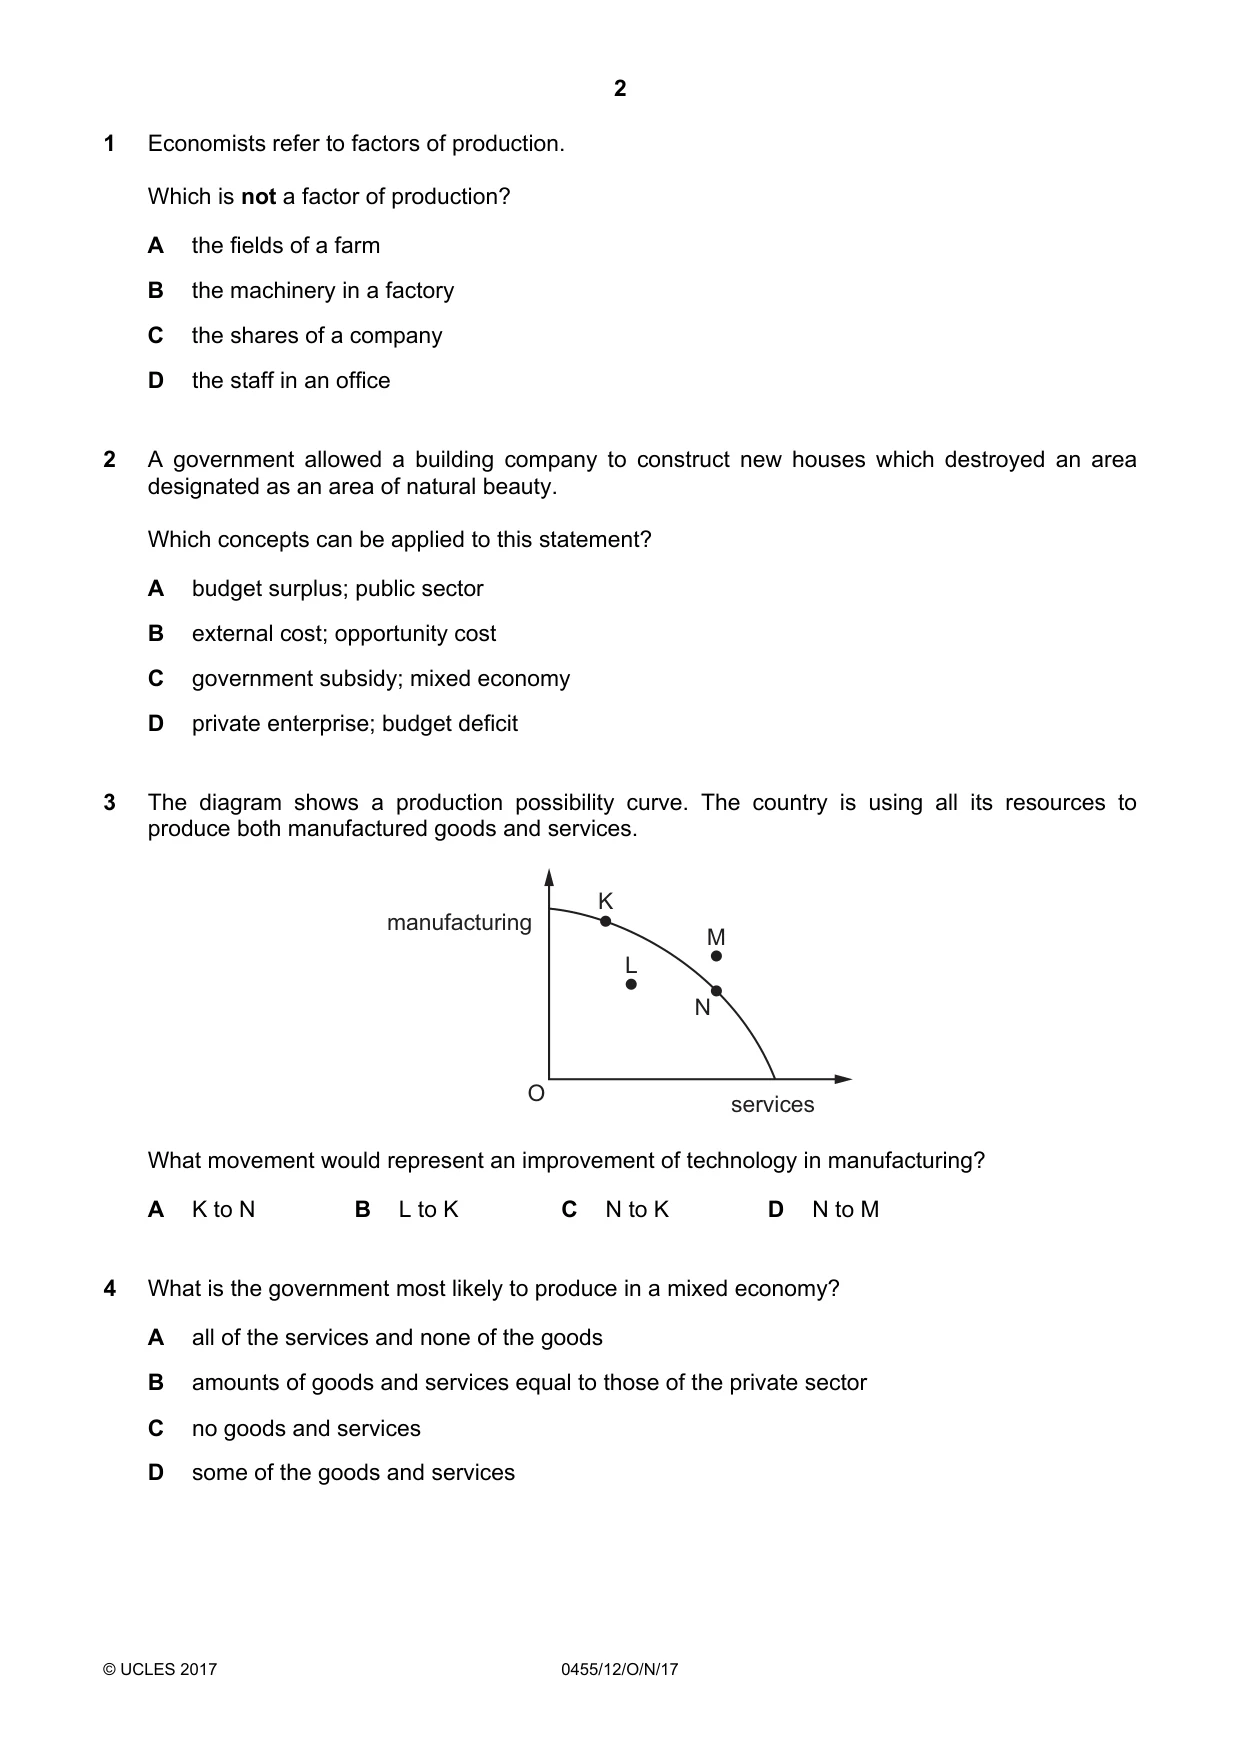
3 The diagram shows a production possibility curve. The country is using all its resources to produce both manufactured goods and services. K manufacturing M L N O services What movement would represent an improvement of technology in manufacturing? A K to N B L to K C N to K D N to M
Mark scheme: D
More questions on Production possibility curve (PPC) diagrams
Q4 · What is the government most likely to produce in a mixed economy?
4 What is the government most likely to produce in a mixed economy? A all of the services and none of the goods B amounts of goods and services equal to those of the private sector C no goods and services D some of the goods and services
Mark scheme: D
Q5 · Which of the effects of economic development is an external cost?
5 Which of the effects of economic development is an external cost? A higher employment B higher fixed costs C increased production D increased traffic congestion
Mark scheme: D
Q6 · The table illustrates the demand and supply for coffee in a market in Africa
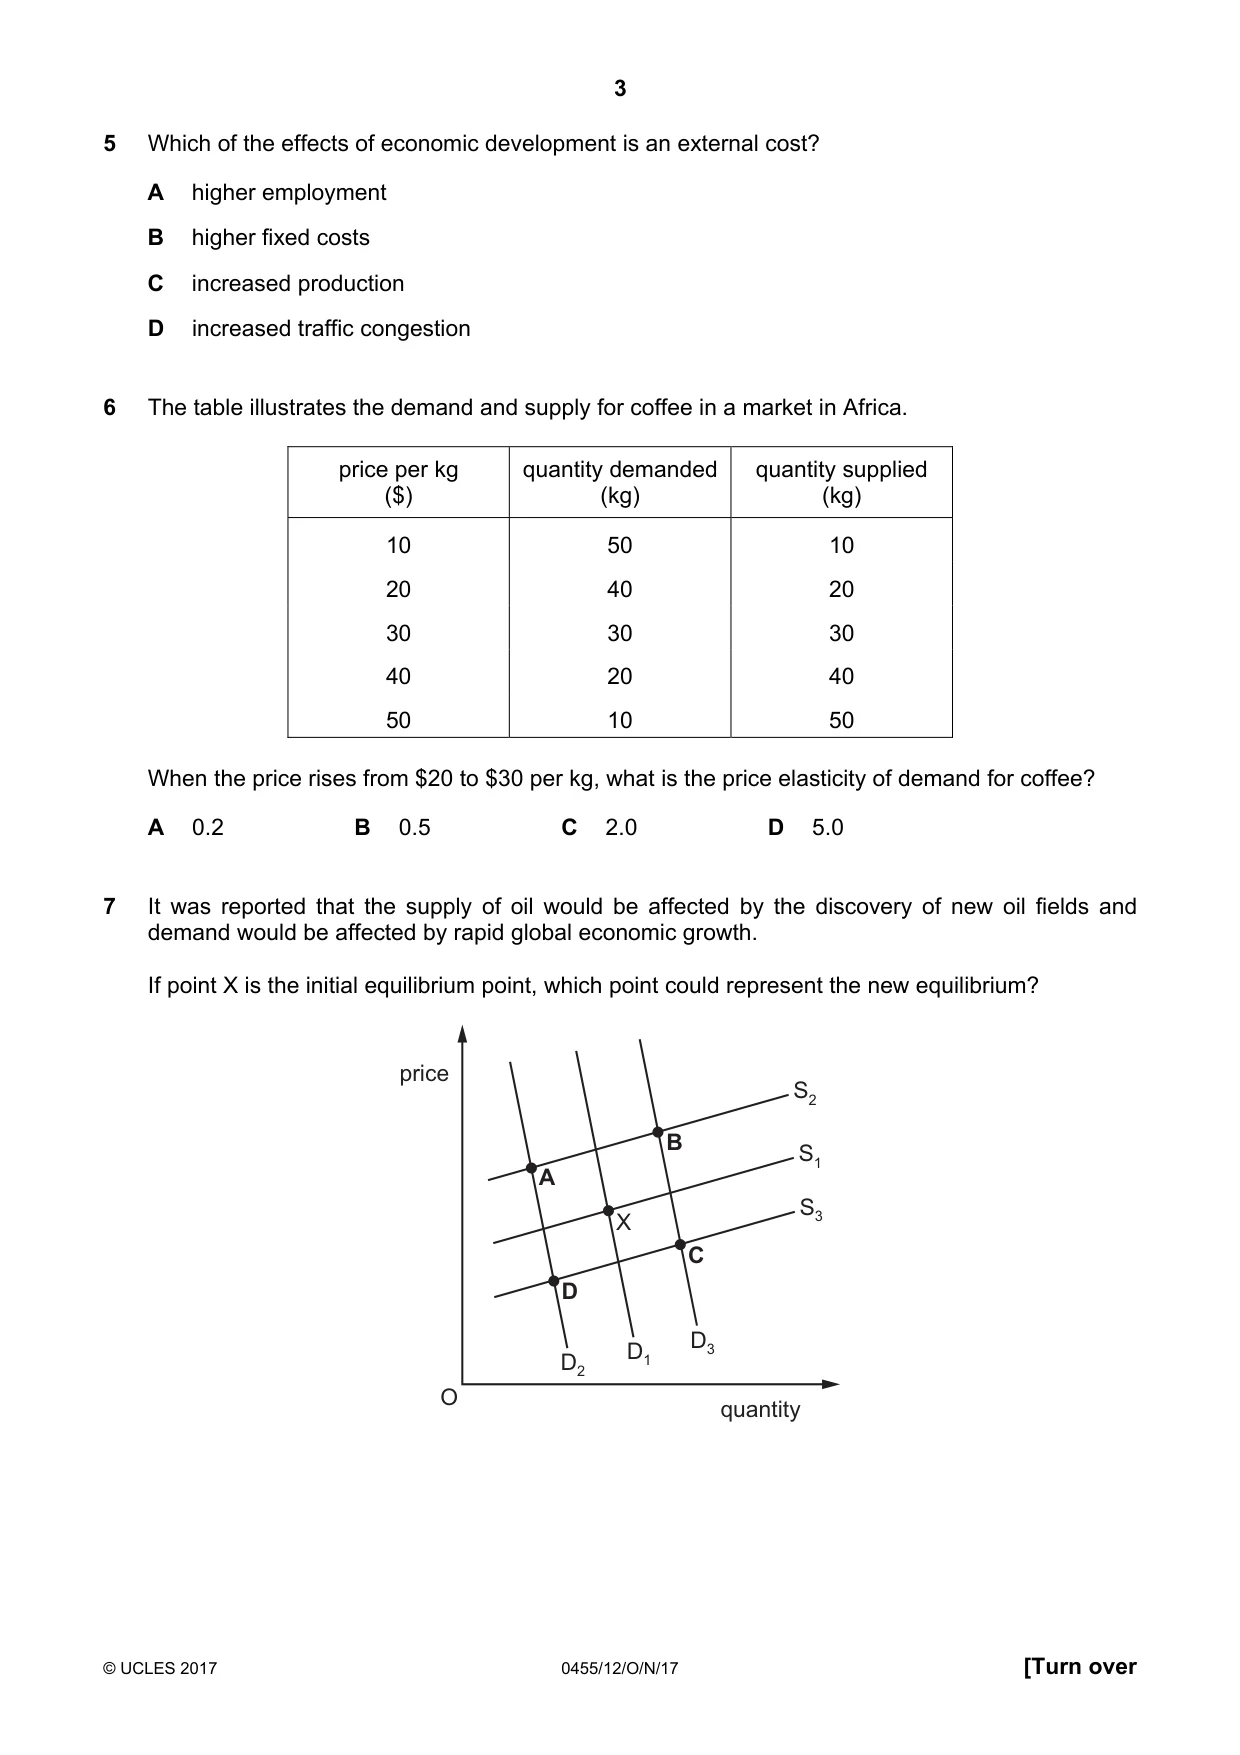
6 The table illustrates the demand and supply for coffee in a market in Africa. price per kg quantity demanded quantity supplied ($) (kg) (kg) 10 50 10 20 40 20 30 30 30 40 20 40 50 10 50 When the price rises from $20 to $30 per kg, what is the price elasticity of demand for coffee? A 0.2 B 0.5 C 2.0 D 5.0
Mark scheme: B
Q7 · It was reported that the supply of oil would be affected by the discovery of new oil…
7 It was reported that the supply of oil would be affected by the discovery of new oil fields and demand would be affected by rapid global economic growth. If point X is the initial equilibrium point, which point could represent the new equilibrium? price S2 B S1 A S3 X C D D3 D1 D2 O quantity
Mark scheme: C
Q8 · What is likely to decrease the level of saving in an economy?
8 What is likely to decrease the level of saving in an economy? A an increase in the general level of income B an increase in the number of cheap offers in shops C a redistribution of income from poor to rich households D a rise in the rate of interest
Mark scheme: B
Q9 · Which change will make a manufacturing company replace machines with labour to maintain…
9 Which change will make a manufacturing company replace machines with labour to maintain the most efficient combination of factors of production? A The price of the product manufactured has increased. B The productivity of labour has increased. C The productivity of machinery has increased. D The wages of labour have increased.
Mark scheme: B
Q10 · Although there are higher paid jobs in offices many workers stay in low-paid jobs on farms
10 Although there are higher paid jobs in offices many workers stay in low-paid jobs on farms. What might explain this in developing economies? A Agricultural workers lack the necessary education and skills. B Governments plan to increase indirect taxes on services. C Manual workers are being replaced by machines. D Workers on farms have high labour mobility.
Mark scheme: A
Q11 · The diagram shows two curves
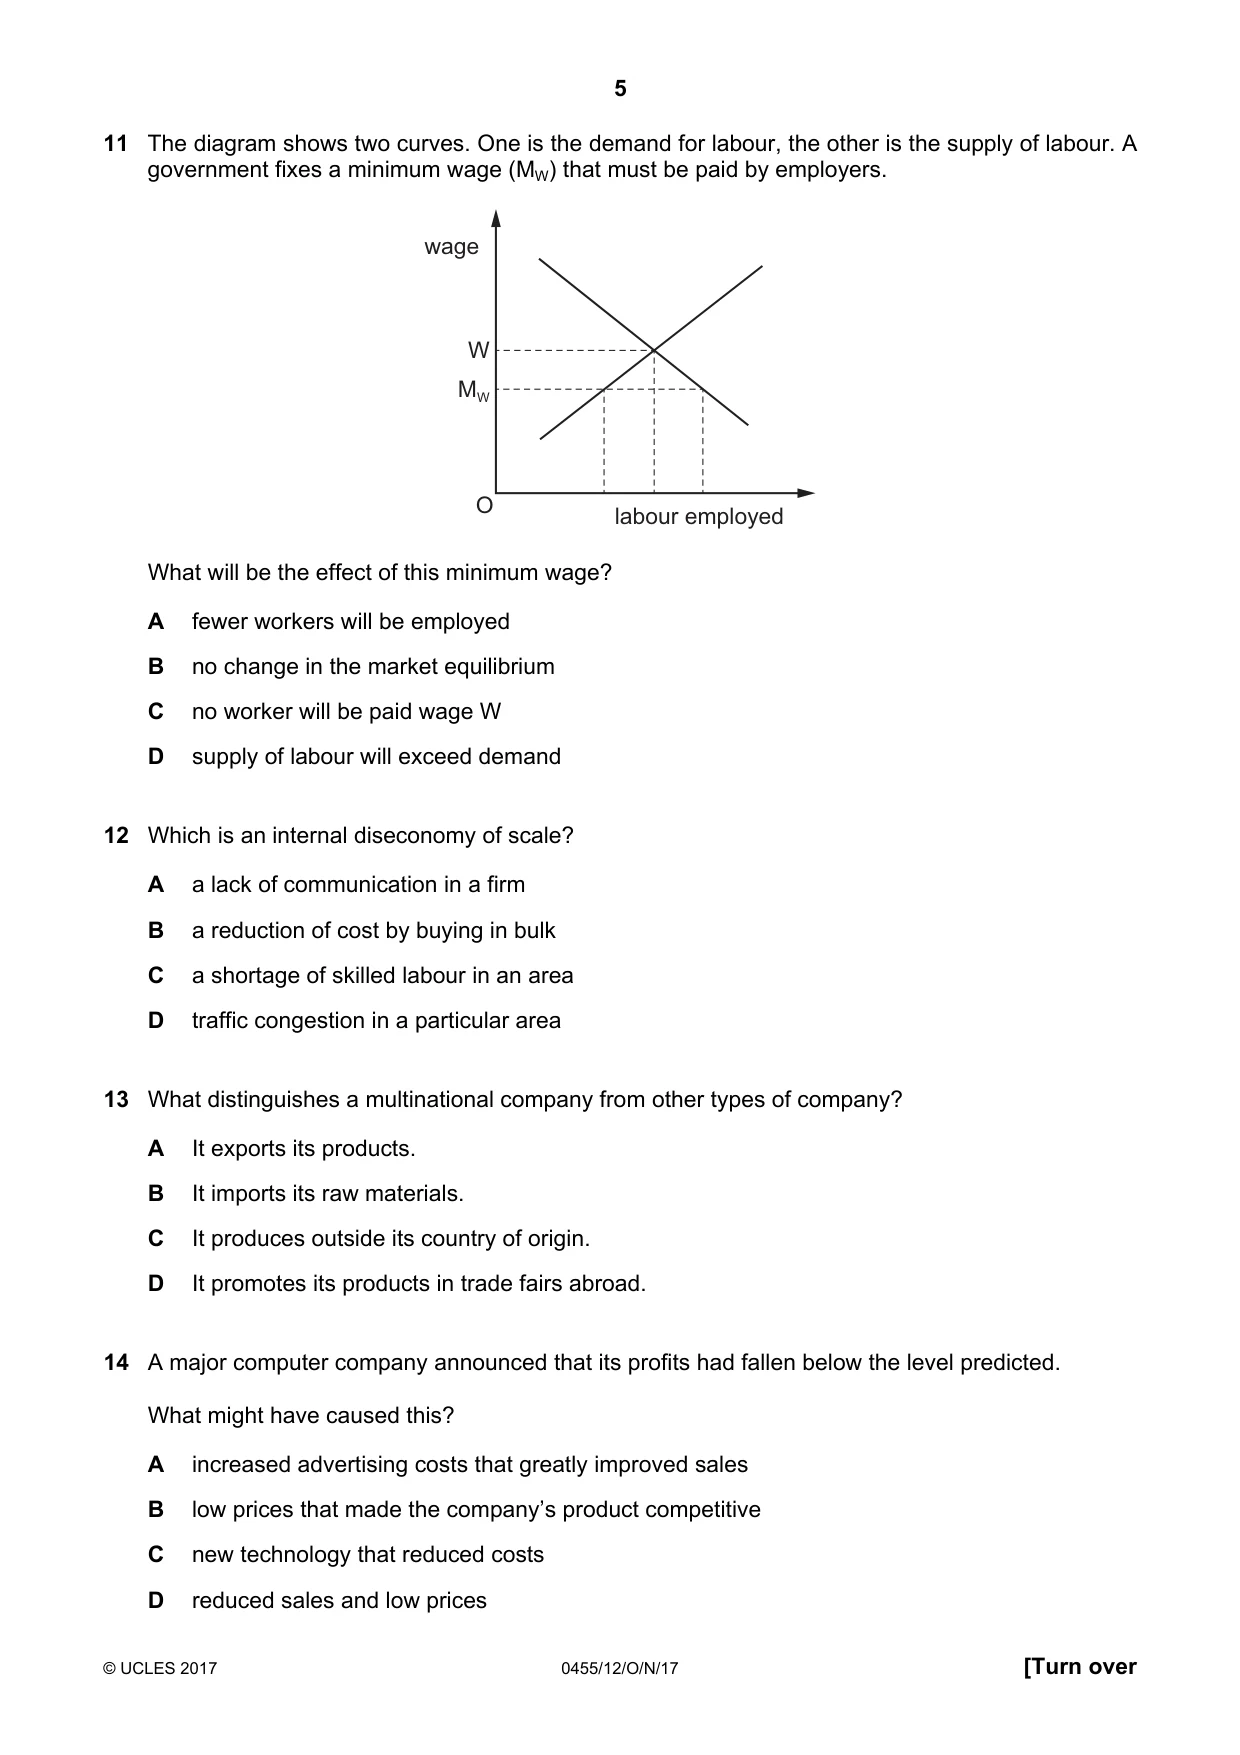
11 The diagram shows two curves. One is the demand for labour, the other is the supply of labour. A government fixes a minimum wage (MW) that must be paid by employers. wage W MW O labour employed What will be the effect of this minimum wage? A fewer workers will be employed B no change in the market equilibrium C no worker will be paid wage W D supply of labour will exceed demand
Mark scheme: B
Q12 · Which is an internal diseconomy of scale?
12 Which is an internal diseconomy of scale? A a lack of communication in a firm B a reduction of cost by buying in bulk C a shortage of skilled labour in an area D traffic congestion in a particular area
Mark scheme: A
Q13 · What distinguishes a multinational company from other types of company?
13 What distinguishes a multinational company from other types of company? A It exports its products. B It imports its raw materials. C It produces outside its country of origin. D It promotes its products in trade fairs abroad.
Mark scheme: C
Q14 · A major computer company announced that its profits had fallen below the level predicted
14 A major computer company announced that its profits had fallen below the level predicted. What might have caused this? A increased advertising costs that greatly improved sales B low prices that made the company’s product competitive C new technology that reduced costs D reduced sales and low prices
Mark scheme: D
Q15 · The table shows the variable costs of a firm
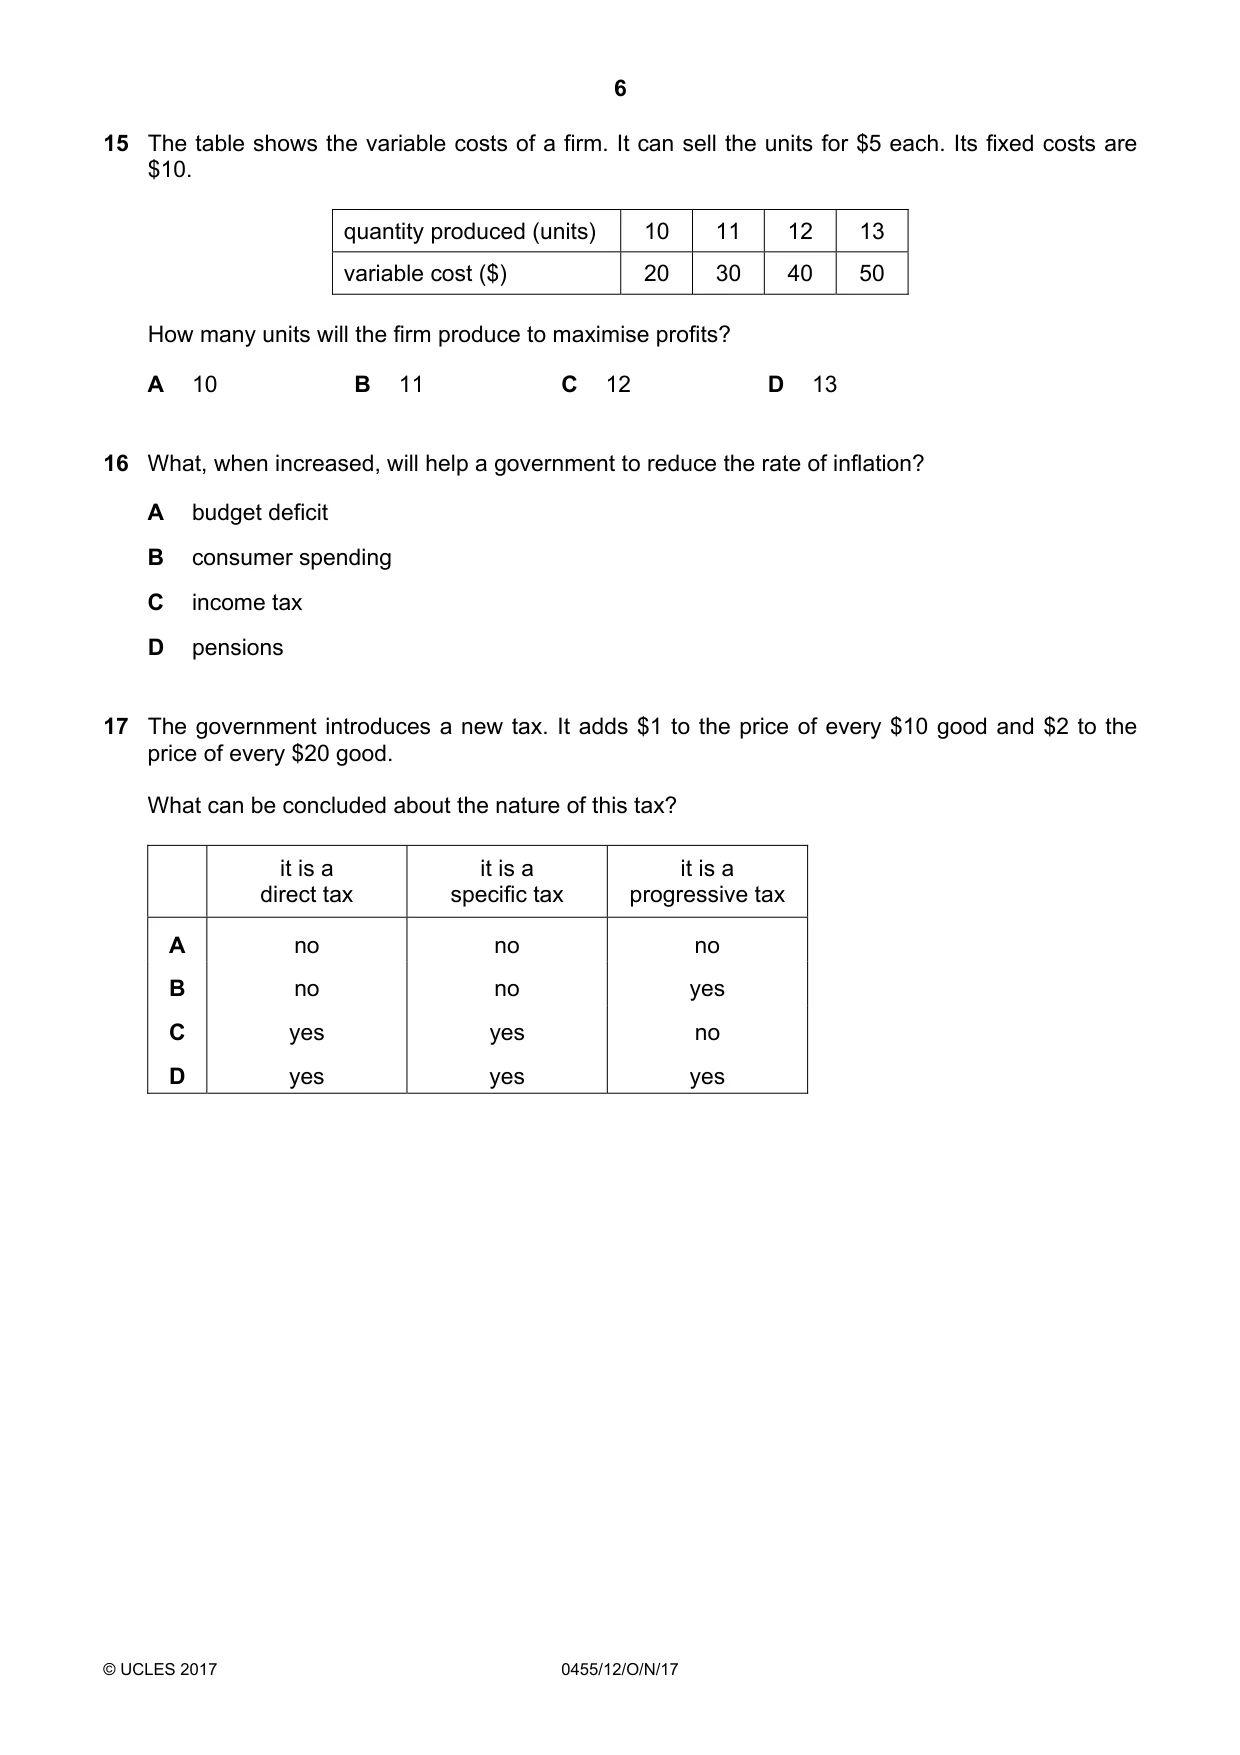
15 The table shows the variable costs of a firm. It can sell the units for $5 each. Its fixed costs are $10. quantity produced (units) 10 11 12 13 variable cost ($) 20 30 40 50 How many units will the firm produce to maximise profits? A 10 B 11 C 12 D 13
Mark scheme: A
Q16 · What, when increased, will help a government to reduce the rate of inflation?
16 What, when increased, will help a government to reduce the rate of inflation? A budget deficit B consumer spending C income tax D pensions
Mark scheme: C
Q17 · The government introduces a new tax
17 The government introduces a new tax. It adds $1 to the price of every $10 good and $2 to the price of every $20 good. What can be concluded about the nature of this tax? it is a it is a it is a direct tax specific tax progressive tax A no no no B no no yes C yes yes no D yes yes yes
Mark scheme: A
Q18 · The graph shows the percentage of income paid in taxation
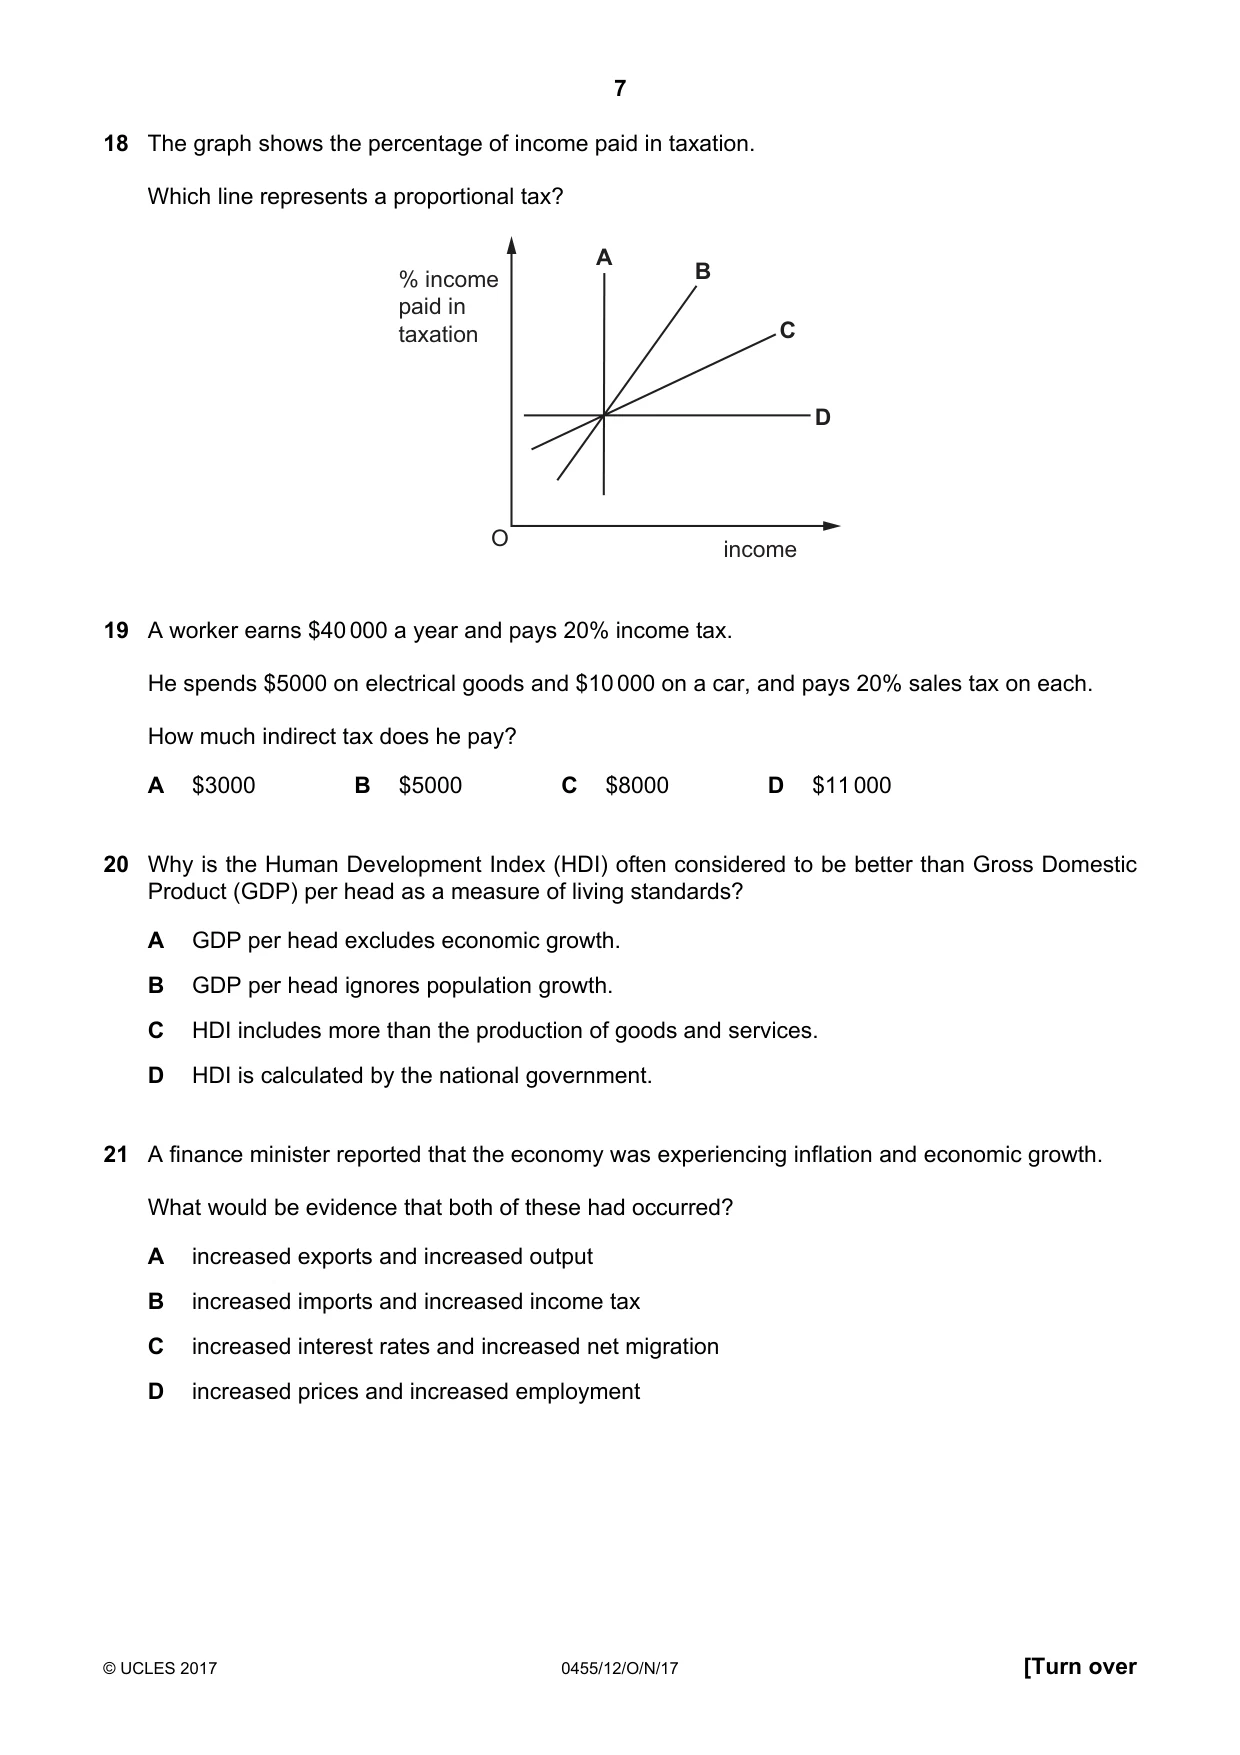
18 The graph shows the percentage of income paid in taxation. Which line represents a proportional tax? A % income B paid in taxation C D O income
Mark scheme: D
Q19 · A worker earns $40 000 a year and pays 20% income tax
19 A worker earns $40 000 a year and pays 20% income tax. He spends $5000 on electrical goods and $10 000 on a car, and pays 20% sales tax on each. How much indirect tax does he pay? A $3000 B $5000 C $8000 D $11 000
Mark scheme: A
Q20 · Why is the Human Development Index (HDI) often considered to be better than Gross…
20 Why is the Human Development Index (HDI) often considered to be better than Gross Domestic Product (GDP) per head as a measure of living standards? A GDP per head excludes economic growth. B GDP per head ignores population growth. C HDI includes more than the production of goods and services. D HDI is calculated by the national government.
Mark scheme: C
Q21 · A finance minister reported that the economy was experiencing inflation and economic…
21 A finance minister reported that the economy was experiencing inflation and economic growth. What would be evidence that both of these had occurred? A increased exports and increased output B increased imports and increased income tax C increased interest rates and increased net migration D increased prices and increased employment
Mark scheme: D
Q22 · The diagrams show percentage employment in different sectors in two countries
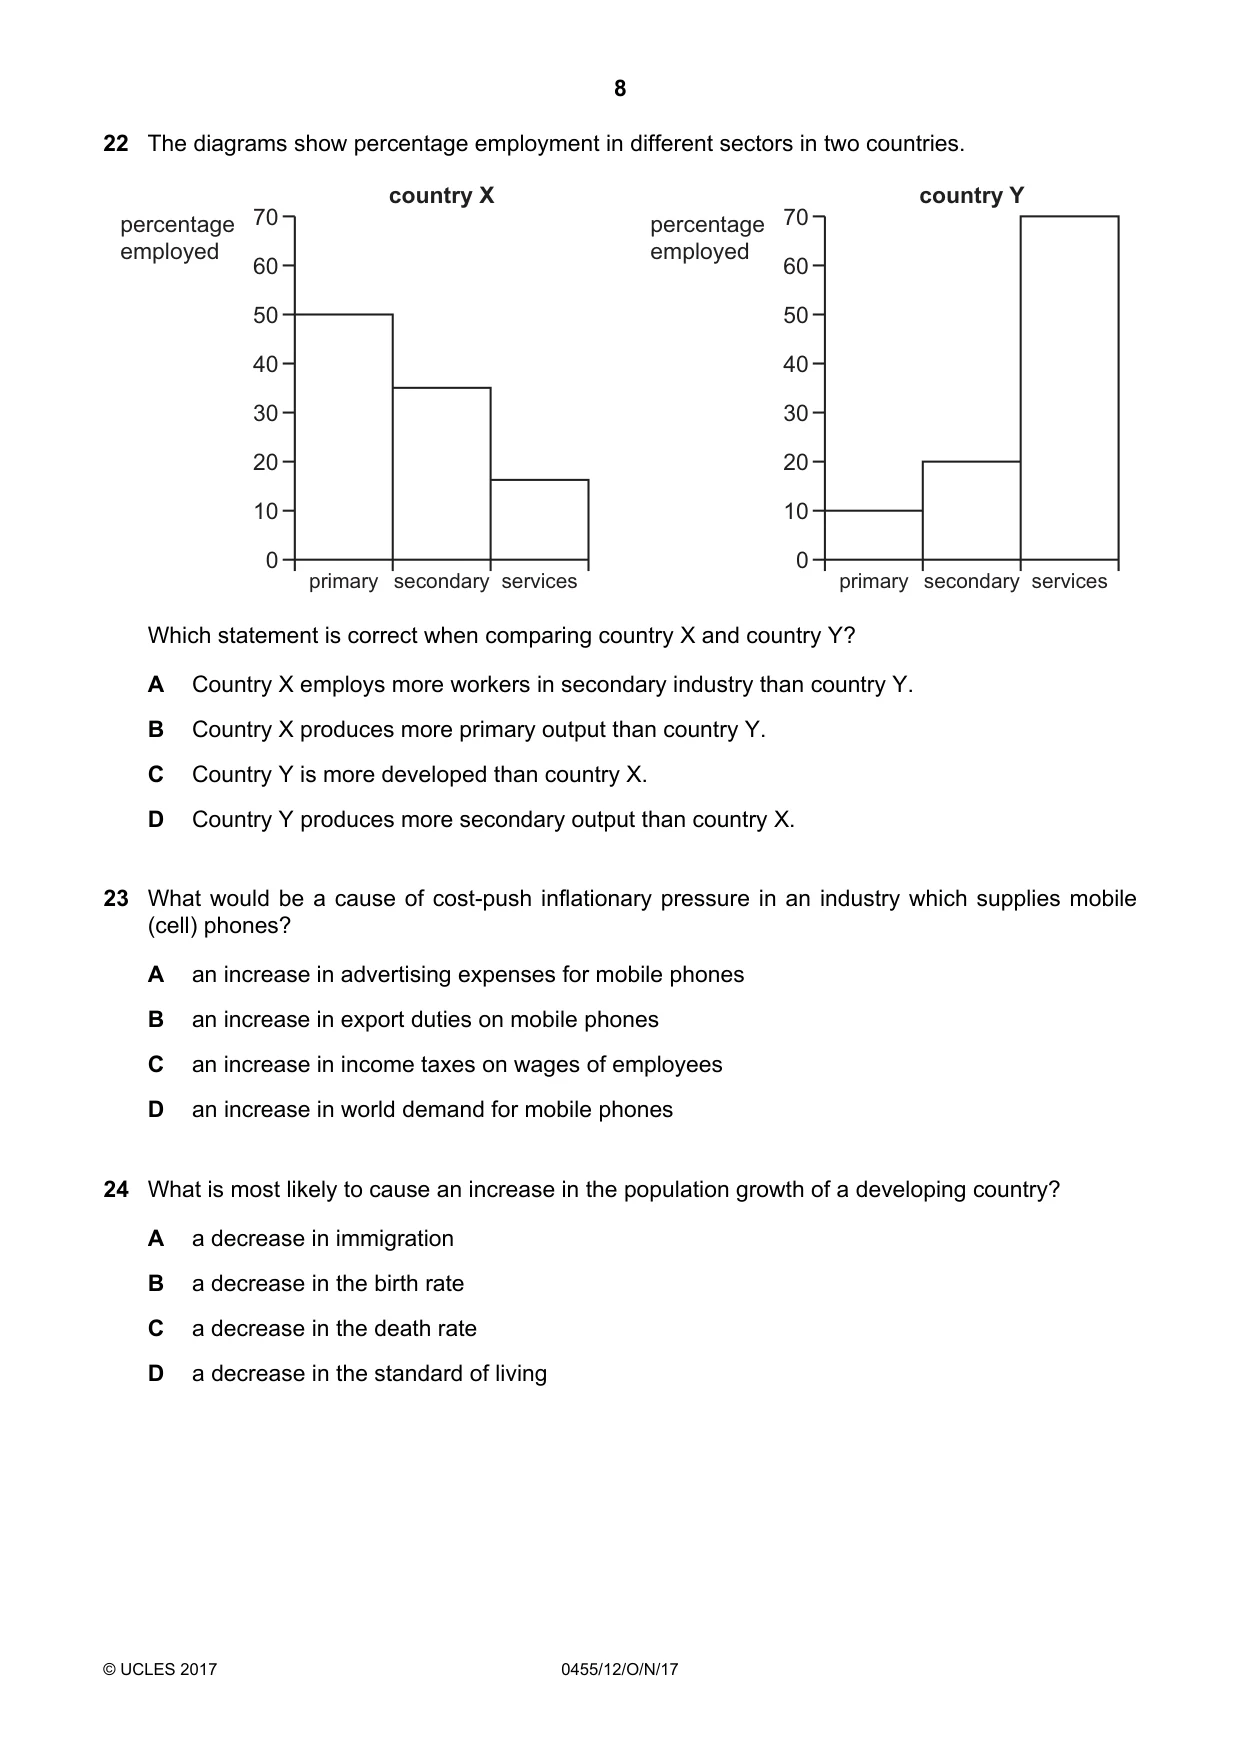
22 The diagrams show percentage employment in different sectors in two countries. country X country Y percentage 70 percentage 70 employed employed 60 60 50 50 40 40 30 30 20 20 10 10 0 0 primary secondary services primary secondary services Which statement is correct when comparing country X and country Y? A Country X employs more workers in secondary industry than country Y. B Country X produces more primary output than country Y. C Country Y is more developed than country X. D Country Y produces more secondary output than country X.
Mark scheme: C
More questions on Differences in economic development between countries
Q23 · What would be a cause of cost-push inflationary pressure in an industry which supplies…
23 What would be a cause of cost-push inflationary pressure in an industry which supplies mobile (cell) phones? A an increase in advertising expenses for mobile phones B an increase in export duties on mobile phones C an increase in income taxes on wages of employees D an increase in world demand for mobile phones
Mark scheme: A
Q24 · What is most likely to cause an increase in the population growth of a developing country?
24 What is most likely to cause an increase in the population growth of a developing country? A a decrease in immigration B a decrease in the birth rate C a decrease in the death rate D a decrease in the standard of living
Mark scheme: C
Q25 · The charts show the population structure of a country in 1960 and 2015
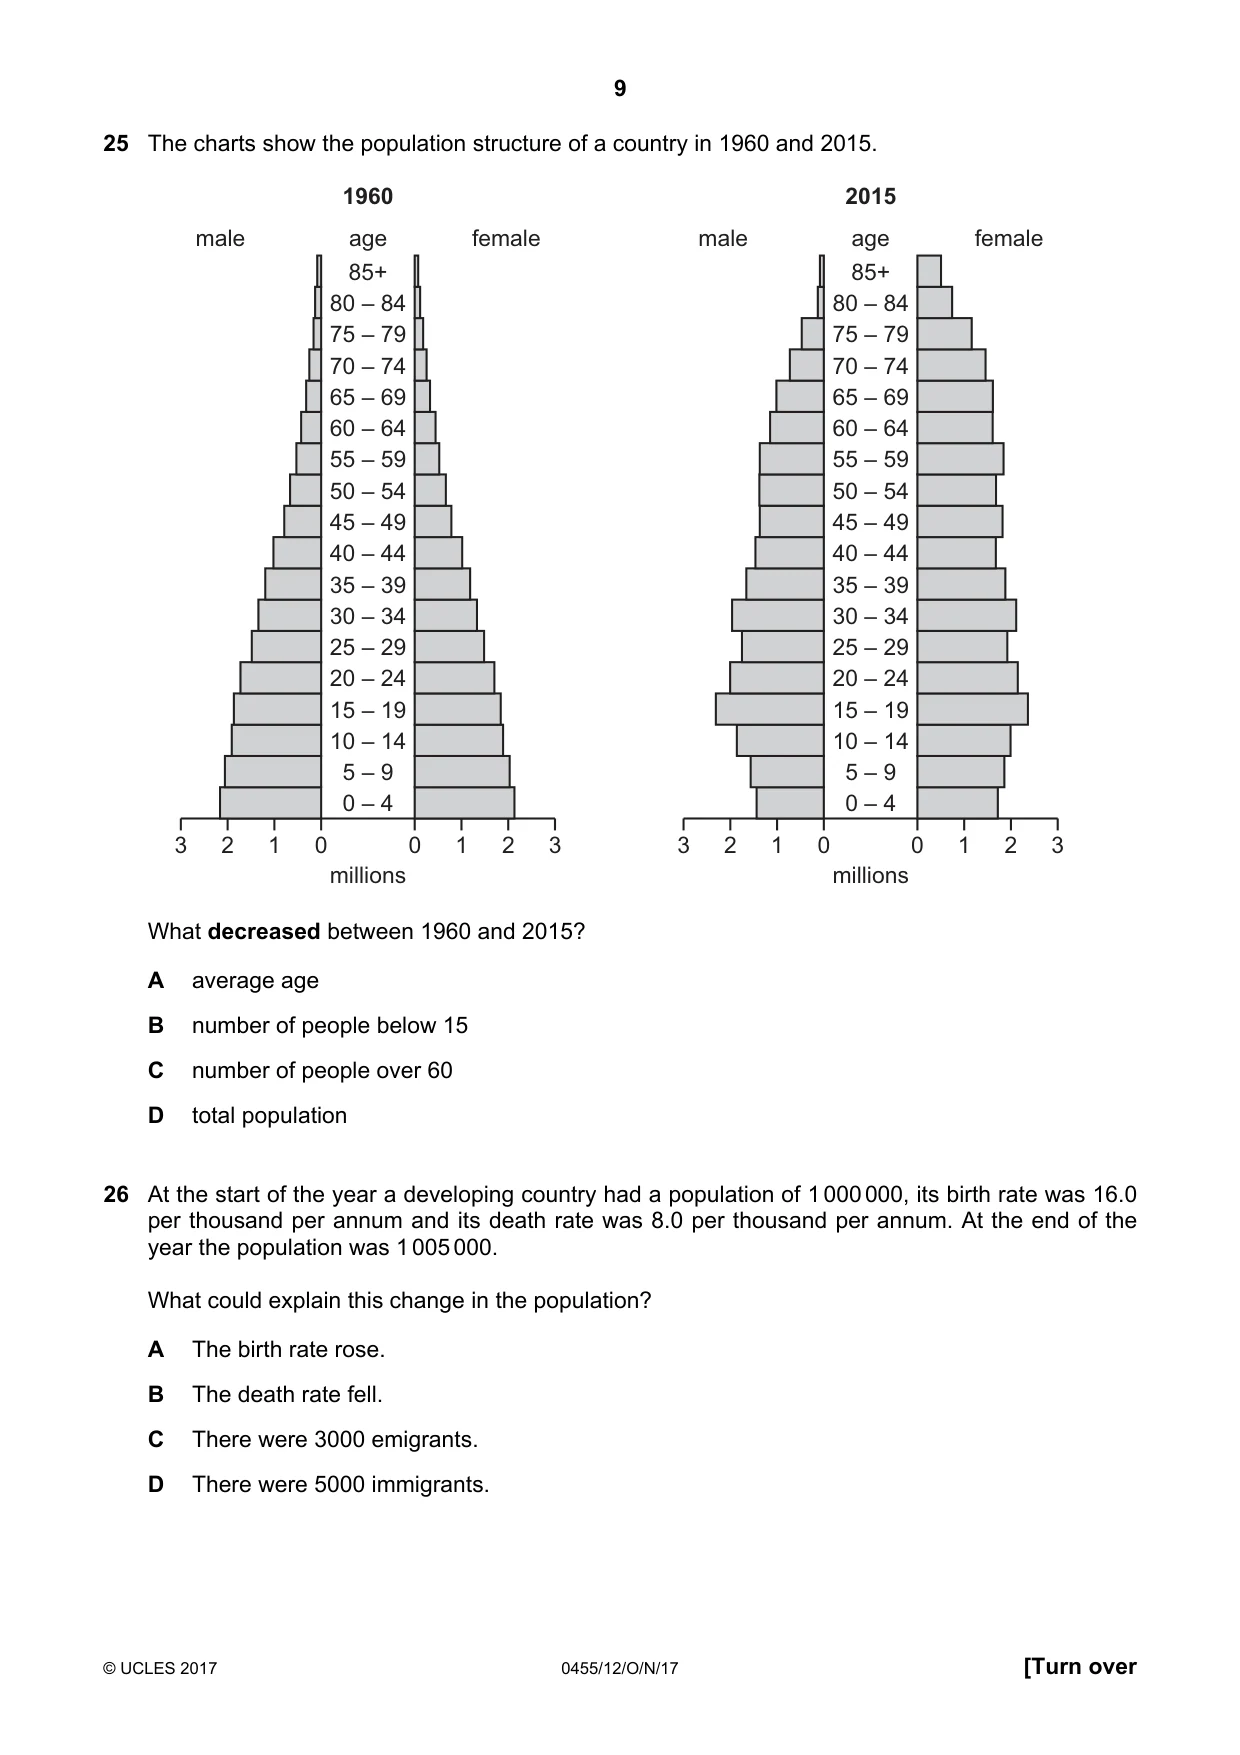
25 The charts show the population structure of a country in 1960 and 2015. 1960 2015 male age female male age female 85+ 85+ 80 – 84 80 – 84 75 – 79 75 – 79 70 – 74 70 – 74 65 – 69 65 – 69 60 – 64 60 – 64 55 – 59 55 – 59 50 – 54 50 – 54 45 – 49 45 – 49 40 – 44 40 – 44 35 – 39 35 – 39 30 – 34 30 – 34 25 – 29 25 – 29 20 – 24 20 – 24 15 – 19 15 – 19 10 – 14 10 – 14 5 – 9 5 – 9 0 – 4 0 – 4 3 2 1 0 0 1 2 3 3 2 1 0 0 1 2 3 millions millions What decreased between 1960 and 2015? A average age B number of people below 15 C number of people over 60 D total population
Mark scheme: B
Q26 · At the start of the year a developing country had a population of 1 000 000, its birth…
26 At the start of the year a developing country had a population of 1 000 000, its birth rate was 16.0 per thousand per annum and its death rate was 8.0 per thousand per annum. At the end of the year the population was 1 005 000. What could explain this change in the population? A The birth rate rose. B The death rate fell. C There were 3000 emigrants. D There were 5000 immigrants.
Mark scheme: C
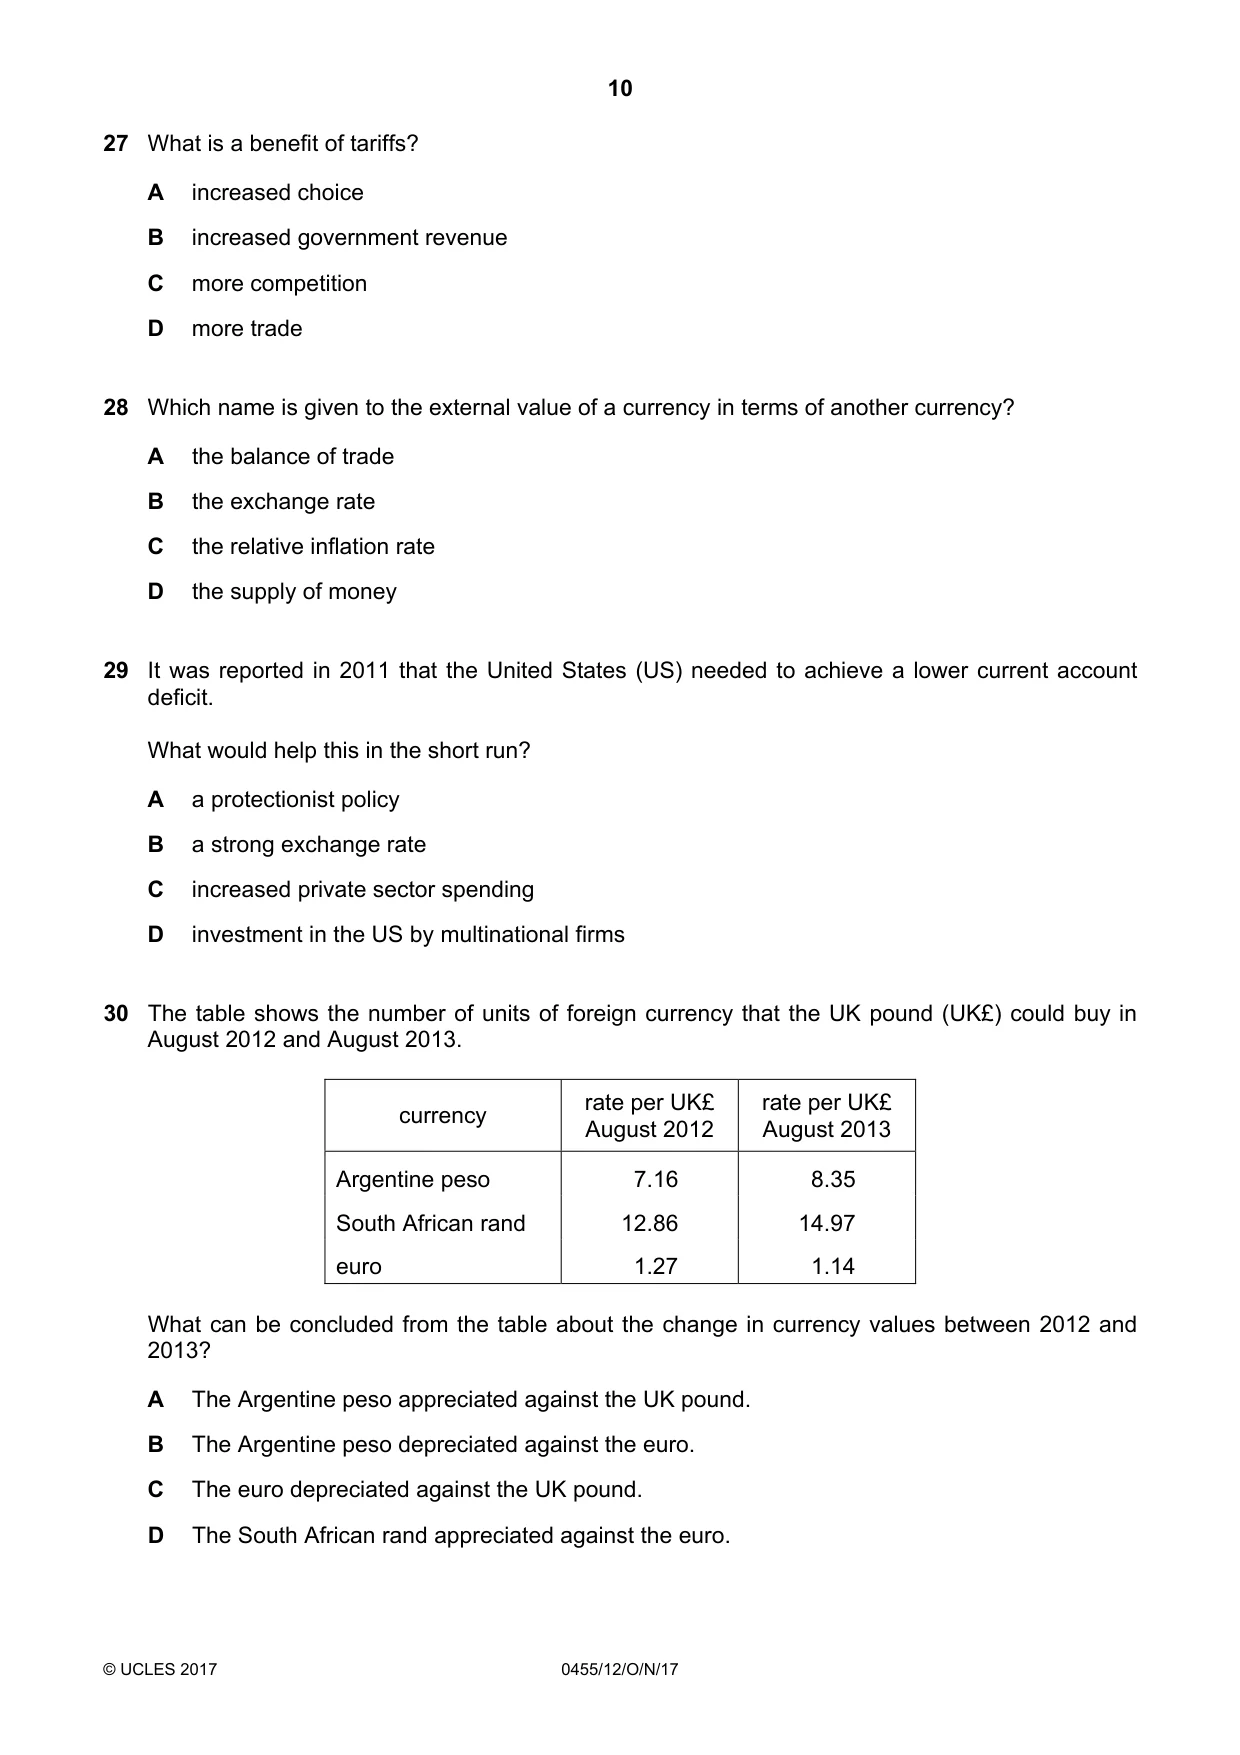
Q27 · What is a benefit of tariffs?
27 What is a benefit of tariffs? A increased choice B increased government revenue C more competition D more trade
Mark scheme: B
Q28 · Which name is given to the external value of a currency in terms of another currency?
28 Which name is given to the external value of a currency in terms of another currency? A the balance of trade B the exchange rate C the relative inflation rate D the supply of money
Mark scheme: B
Q29 · It was reported in 2011 that the United States (US) needed to achieve a lower current…
29 It was reported in 2011 that the United States (US) needed to achieve a lower current account deficit. What would help this in the short run? A a protectionist policy B a strong exchange rate C increased private sector spending D investment in the US by multinational firms
Mark scheme: A
Q30 · The table shows the number of units of foreign currency that the UK pound (UK£) could buy…
30 The table shows the number of units of foreign currency that the UK pound (UK£) could buy in August 2012 and August 2013. rate per UK£ rate per UK£ currency August 2012 August 2013 Argentine peso 7.16 8.35 South African rand 12.86 14.97 euro 1.27 1.14 What can be concluded from the table about the change in currency values between 2012 and 2013? A The Argentine peso appreciated against the UK pound. B The Argentine peso depreciated against the euro. C The euro depreciated against the UK pound. D The South African rand appreciated against the euro.
Mark scheme: B
What was in this paper
The subtopics covered by these 30 questions, and how many questions each got. Open one in a new tab to see every Cambridge question on it.
3Firms and production2Firms’ costs, revenue and objectives2Fiscal policy2Foreign exchange rates2Market failure2The role of government2Workers2Current account of balance of payments1Differences in economic development between countries1Economic growth1Firms1Globalisation, free trade and protection1Households1Inflation and deflation1Living standards1Mixed economic system1Price changes1Price elasticity of demand (PED)1Production possibility curve (PPC) diagrams1The factors of production1What you needed in this session
Cambridge’s own grade thresholds for 2017 Oct/Nov, Paper 1 · Variant 2. A higher threshold means an easier paper — the bar moves with how the cohort did.