Cambridge IGCSE Economics 0455 — 2024 Oct/Nov Paper 1 · Variant 3
0455/13/O/N/24 · 30 questions · 30 marks · ≈34 min
The question paper and its mark scheme, free to read here and free to download. This is Cambridge’s own paper, exactly as it was sat.
Question paper12 pages




Mark scheme3 pages
Answers below. Sit the paper first if you are practising.

Questions as text
Q1 · What is the cause of the economic problem facing the global market for gold?
1 What is the cause of the economic problem facing the global market for gold? A Consumer wants for gold are limited. B Gold is a limited resource. C Only governments can sell gold. D There is an unlimited supply of gold.
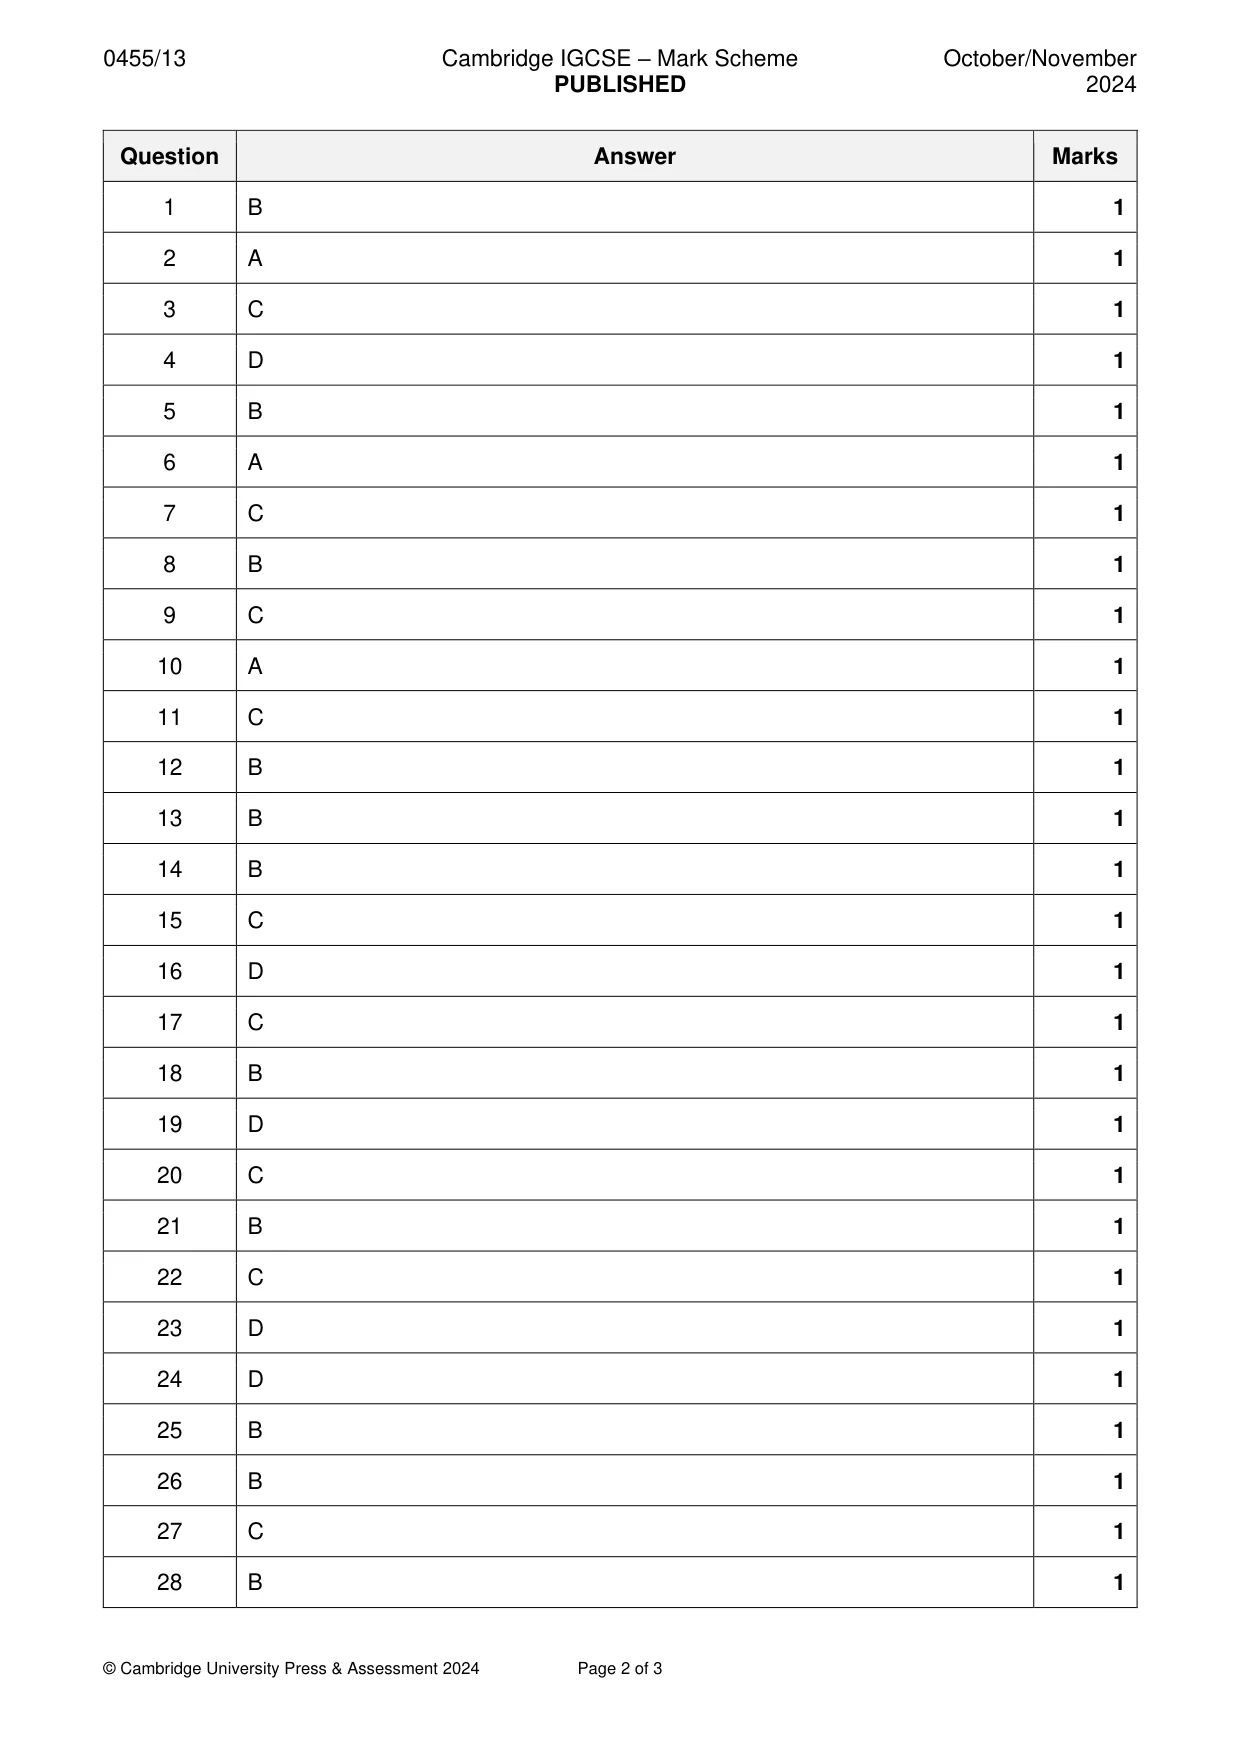
Mark scheme: B
Q2 · The management of an airline decided to replace its aeroplanes with more technologically…
2 The management of an airline decided to replace its aeroplanes with more technologically advanced aircraft. At the same time, the company retrained its pilots. Which factors of production has the airline improved? A capital and labour B capital and land C labour and enterprise D land and enterprise
Mark scheme: A
Q3 · The diagram shows the choices for an individual between leisure and earnings
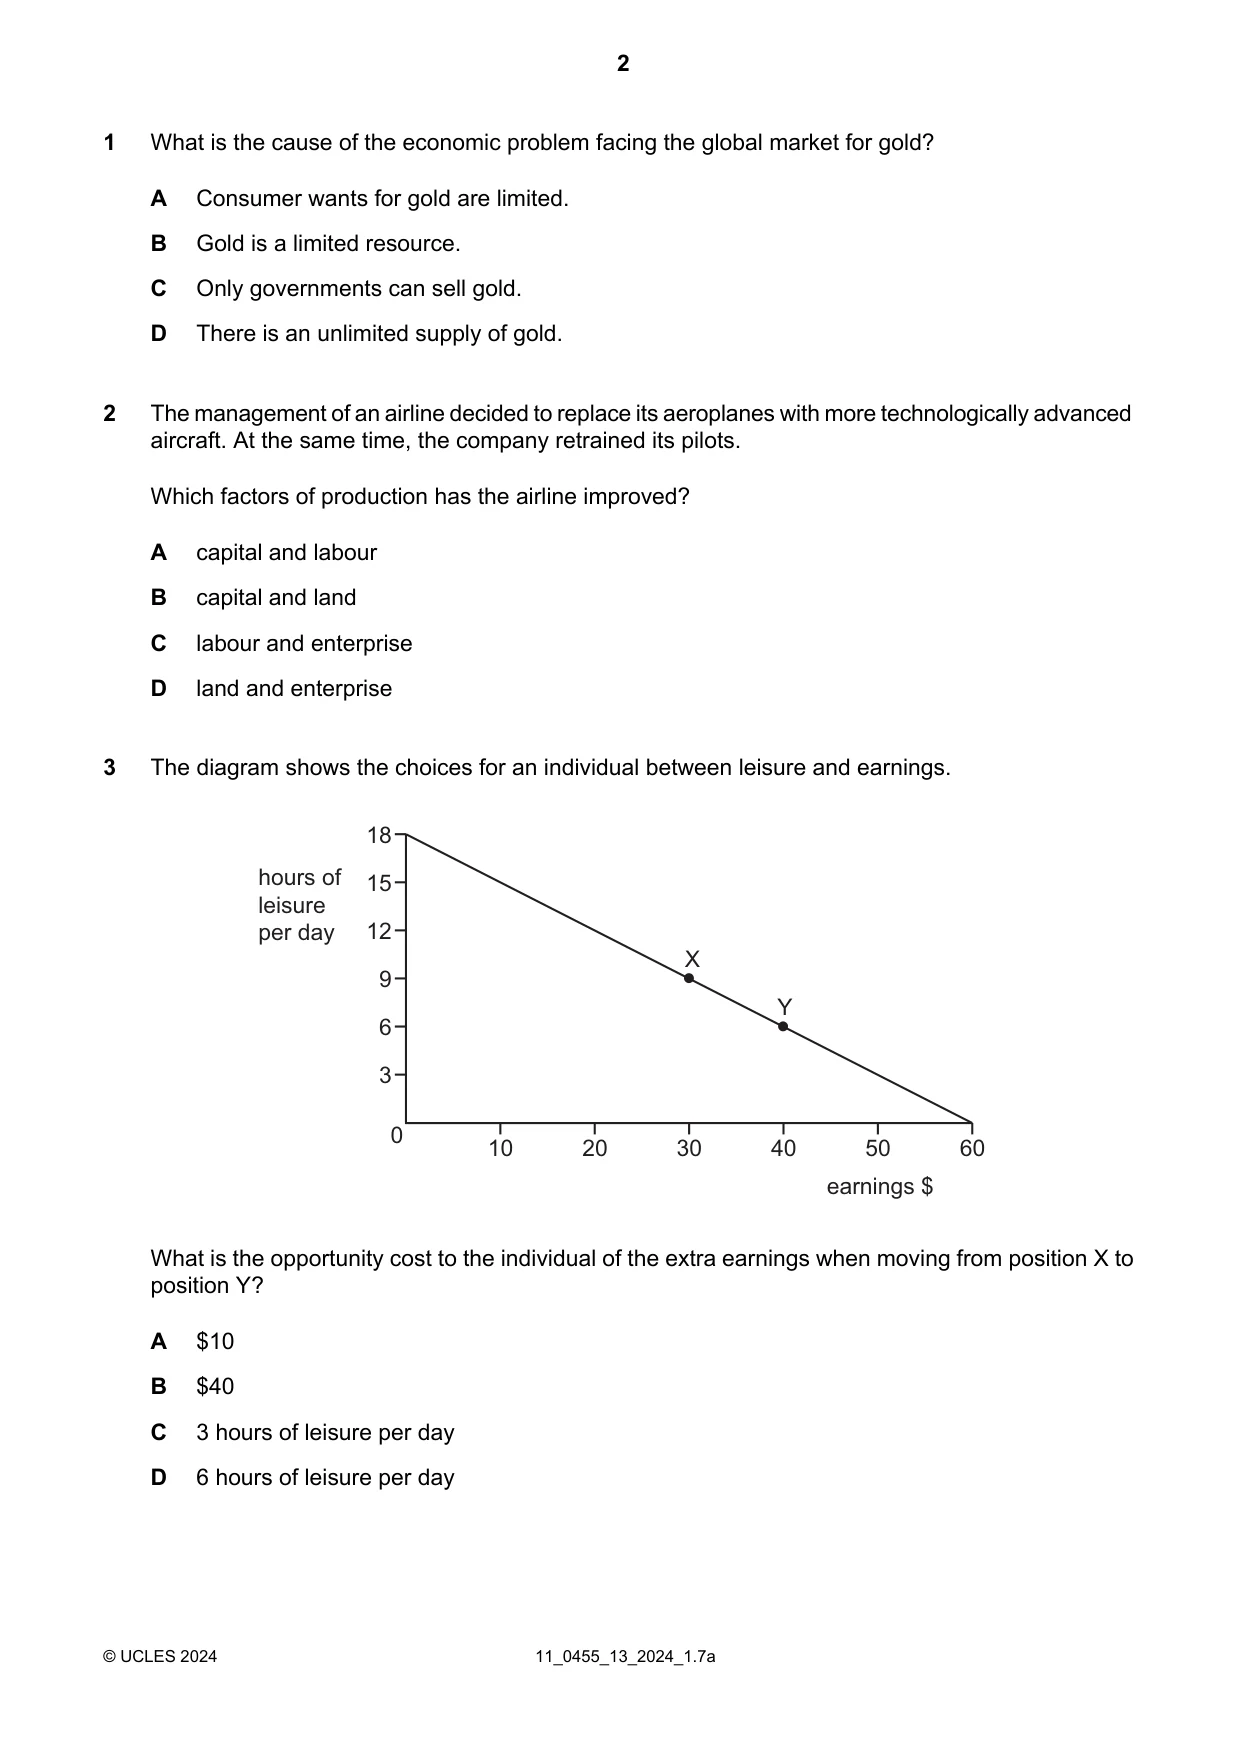
3 The diagram shows the choices for an individual between leisure and earnings. 18 hours of 15 leisure per day 12 X 9 Y 6 3 0 10 20 30 40 50 60 earnings $ What is the opportunity cost to the individual of the extra earnings when moving from position X to position Y? A $10 B $40 C 3 hours of leisure per day D 6 hours of leisure per day
Mark scheme: C
Q4 · The world price of cocoa has been falling while the prices of products made from cocoa…
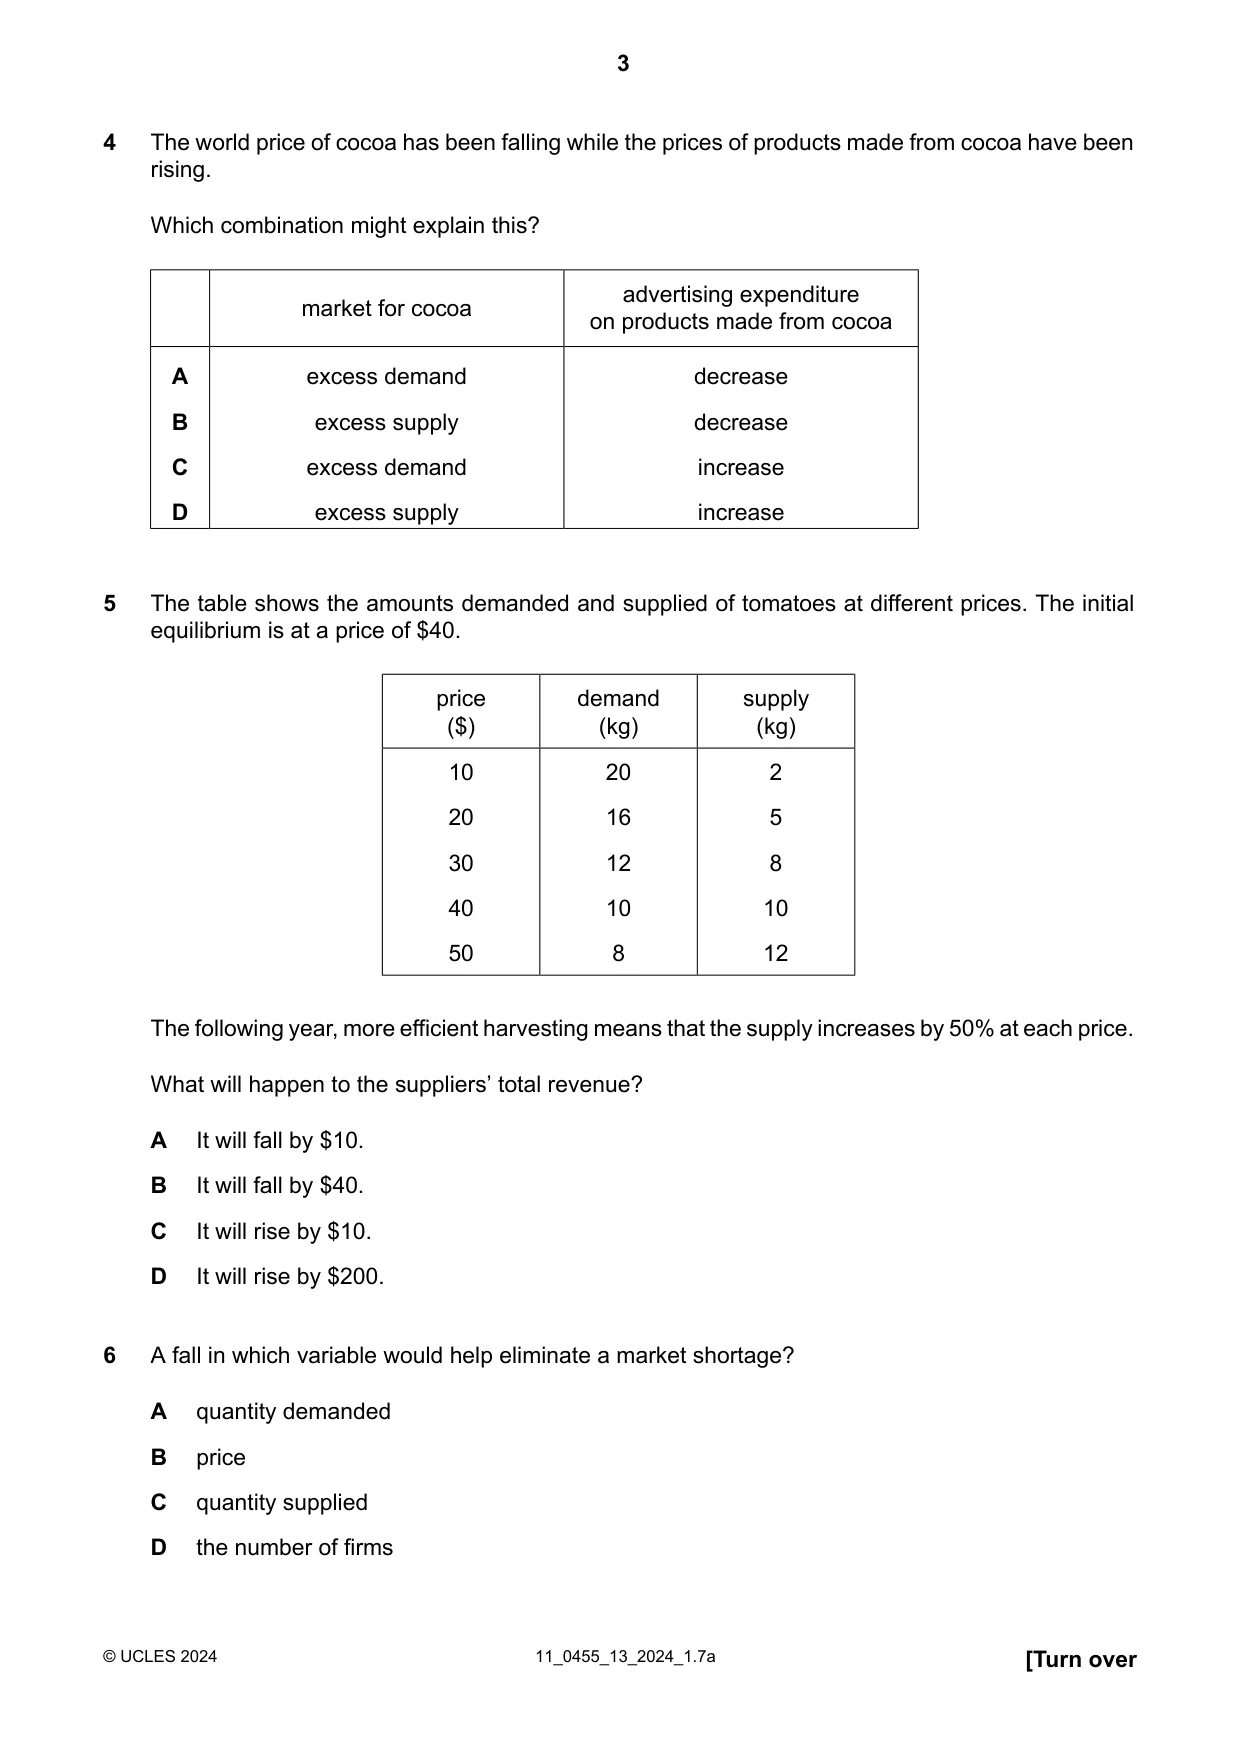
4 The world price of cocoa has been falling while the prices of products made from cocoa have been rising. Which combination might explain this? advertising expenditure market for cocoa on products made from cocoa A excess demand decrease B excess supply decrease C excess demand increase D excess supply increase
Mark scheme: D
Q5 · The table shows the amounts demanded and supplied of tomatoes at different prices
5 The table shows the amounts demanded and supplied of tomatoes at different prices. The initial equilibrium is at a price of $40. price demand supply ($) (kg) (kg) 10 20 2 20 16 5 30 12 8 40 10 10 50 8 12 The following year, more efficient harvesting means that the supply increases by 50% at each price. What will happen to the suppliers’ total revenue? A It will fall by $10. B It will fall by $40. C It will rise by $10. D It will rise by $200.
Mark scheme: B
Q6 · A fall in which variable would help eliminate a market shortage?
6 A fall in which variable would help eliminate a market shortage? A quantity demanded B price C quantity supplied D the number of firms
Mark scheme: A
Q7 · When the price of meat increased from $5 to $6 per kg, Joe decreased his purchase of meat…
7 When the price of meat increased from $5 to $6 per kg, Joe decreased his purchase of meat from 40kg to 20kg a month. What was Joe’s price elasticity of demand for meat? A 0.4 B 2.0 C 2.5 D 20
Mark scheme: C
Q8 · In the diagram, which line represents perfectly inelastic supply?
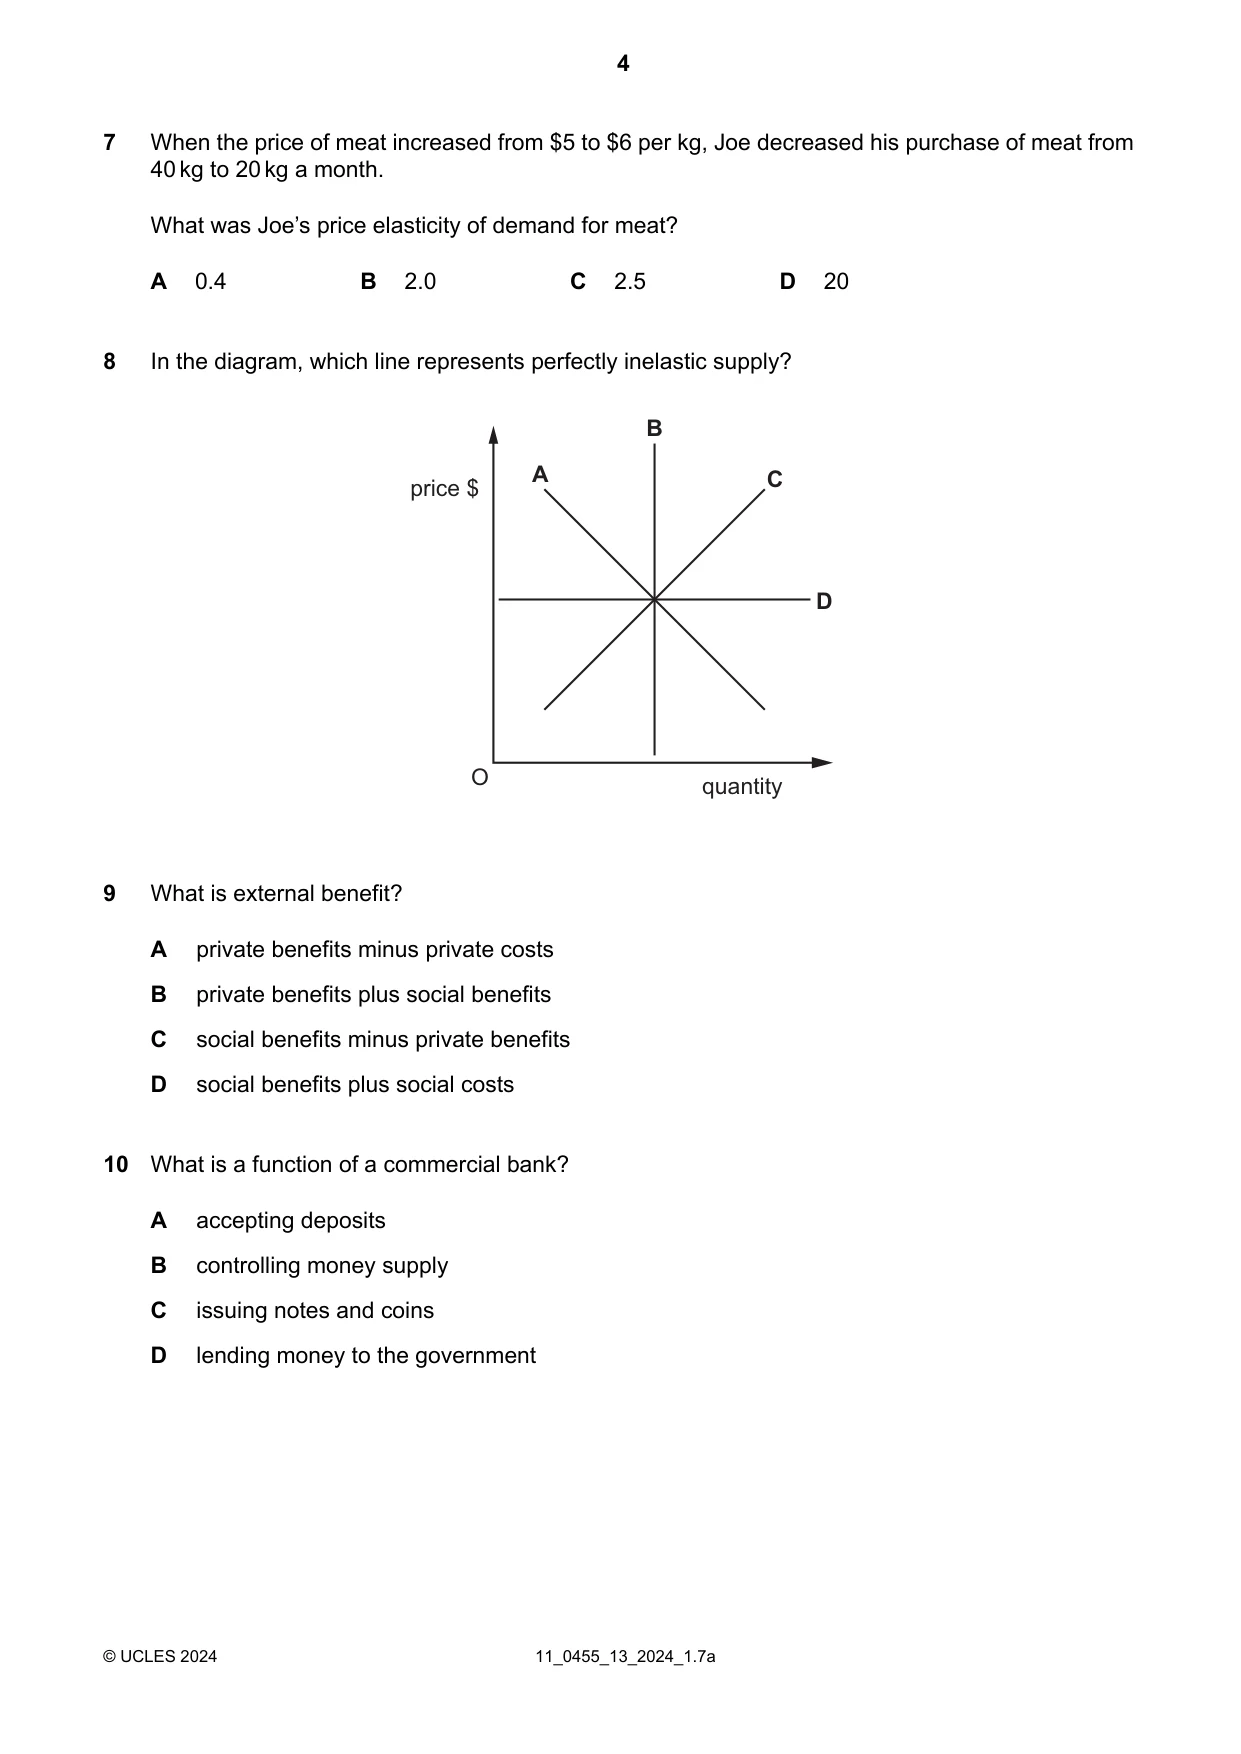
8 In the diagram, which line represents perfectly inelastic supply? B A C price $ D O quantity
Mark scheme: B
Q9 · What is external benefit?
9 What is external benefit? A private benefits minus private costs B private benefits plus social benefits C social benefits minus private benefits D social benefits plus social costs
Mark scheme: C
Q10 · What is a function of a commercial bank?
10 What is a function of a commercial bank? A accepting deposits B controlling money supply C issuing notes and coins D lending money to the government
Mark scheme: A
Q11 · Under which circumstances are households more likely to save?
11 Under which circumstances are households more likely to save? unemployment inflation rate interest rate rate A high high high B high high low C low high low D low low low
Mark scheme: C
Q12 · A country wishes to increase the supply of nurses
12 A country wishes to increase the supply of nurses. What would be the most effective way of achieving this? A extending the training period for nurses B improving the working conditions of nurses C increasing the national minimum wage D reducing grants for trainee nurses
Mark scheme: B
Q13 · Employers based in large cities often pay employees special allowances above standard pay…
13 Employers based in large cities often pay employees special allowances above standard pay rates. What is the most likely reason for this? A Job security and promotion prospects tend to be restricted. B Living costs and transport costs tend to be high. C There are few alternative job opportunities available. D Trade unions negotiate nationwide wage levels.
Mark scheme: B
Q14 · Workers in a country have been concerned about their wages not keeping pace with inflation
14 Workers in a country have been concerned about their wages not keeping pace with inflation. How can trade unions assist workers in getting a pay rise? A advise the workers to ask individually for a pay rise B negotiate on behalf of their members to secure a pay rise C offer to contribute financially to a pay rise D request improved working conditions
Mark scheme: B
Q15 · How is total revenue calculated?
15 How is total revenue calculated? A price divided by the total output B total output divided by the price C total output multiplied by the price D total output multiplied by total costs
Mark scheme: C
Q16 · There is a number of cafés selling snacks and drinks in a city centre
16 There is a number of cafés selling snacks and drinks in a city centre. Several of these cafés close due to their owners retiring. What is the likely effect on the prices and profits of the remaining cafés? prices profits A decrease decrease B decrease increase C increase decrease D increase increase
Mark scheme: D
Q17 · What is a macroeconomic aim of government?
17 What is a macroeconomic aim of government? A equilibrium prices in markets B high wages C low inflation D profit maximisation
Mark scheme: C
Q18 · The table shows earnings and total income tax paid per year
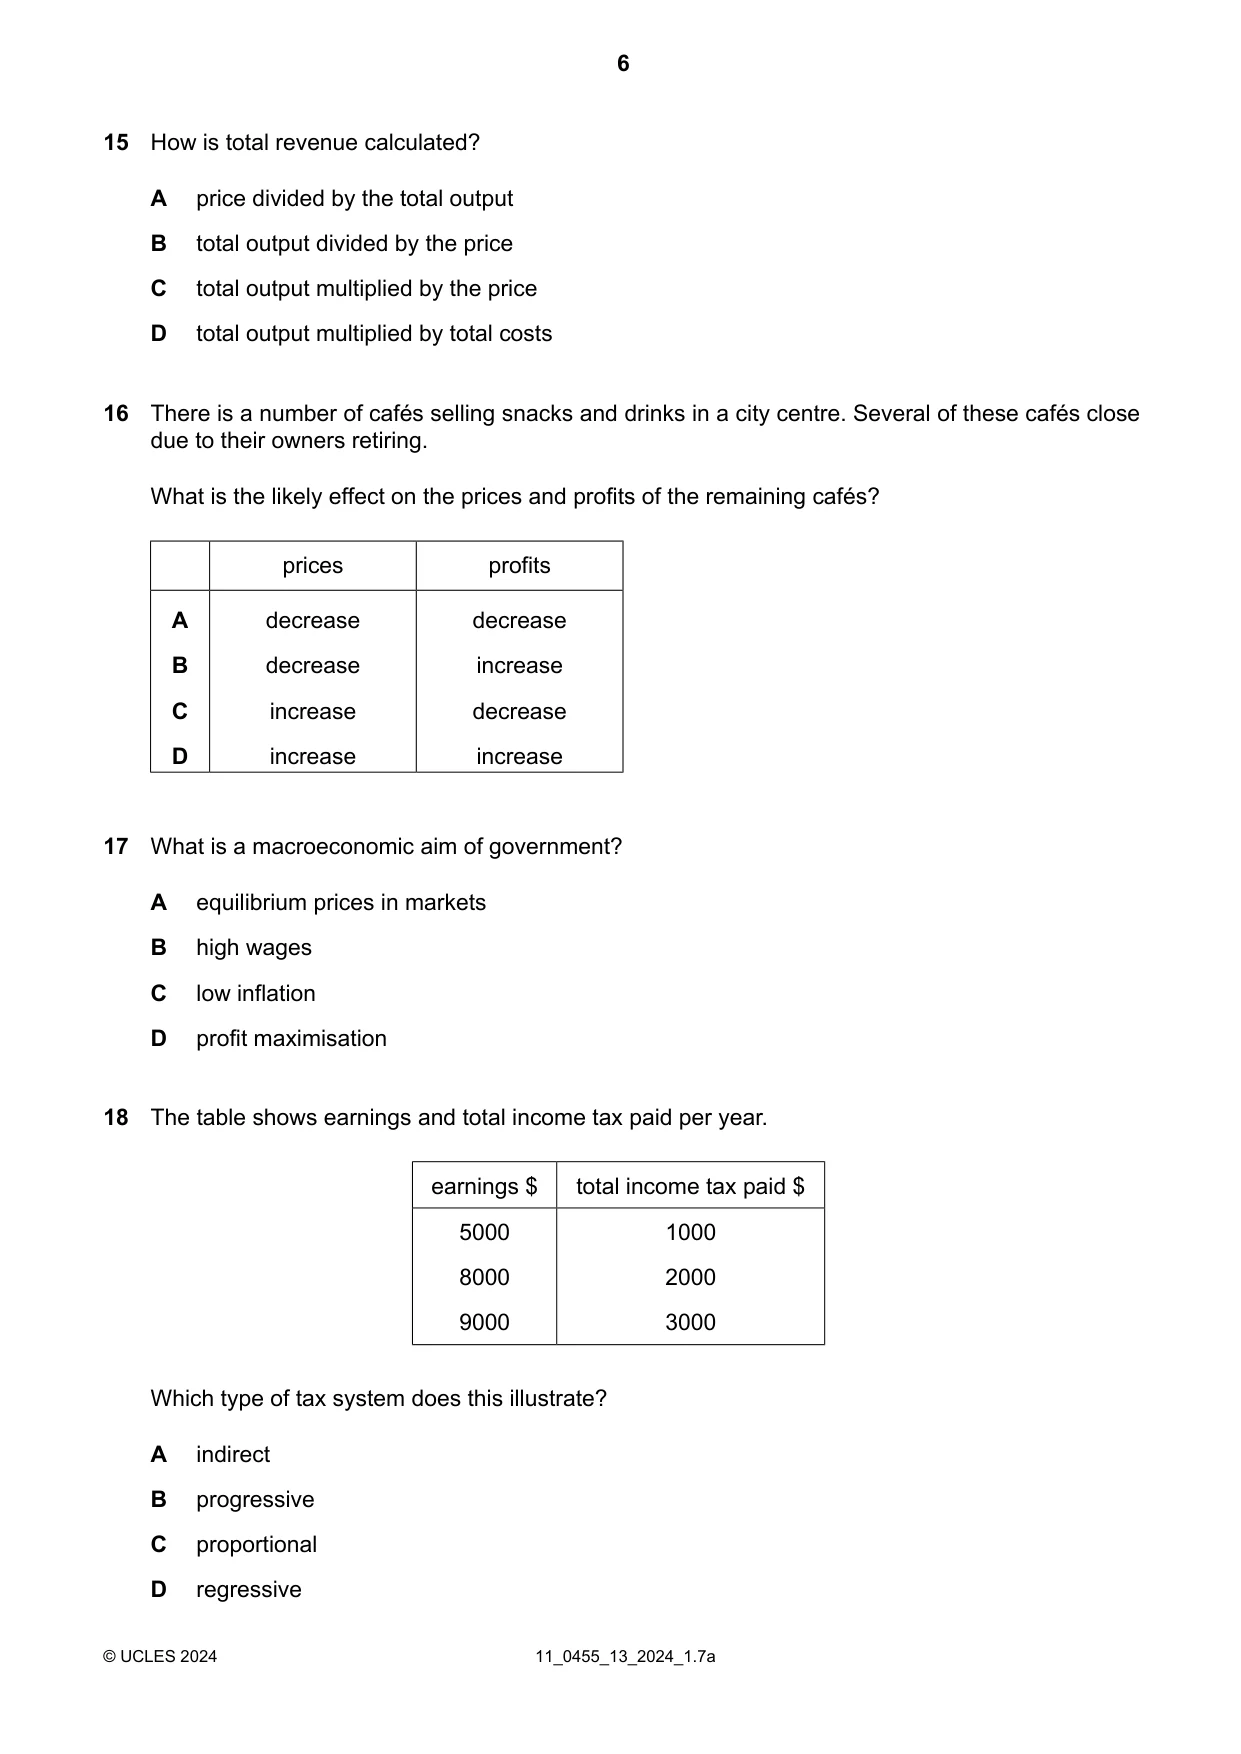
18 The table shows earnings and total income tax paid per year. earnings $ total income tax paid $ 5000 1000 8000 2000 9000 3000 Which type of tax system does this illustrate? A indirect B progressive C proportional D regressive
Mark scheme: B
Q19 · What is an example of monetary policy?
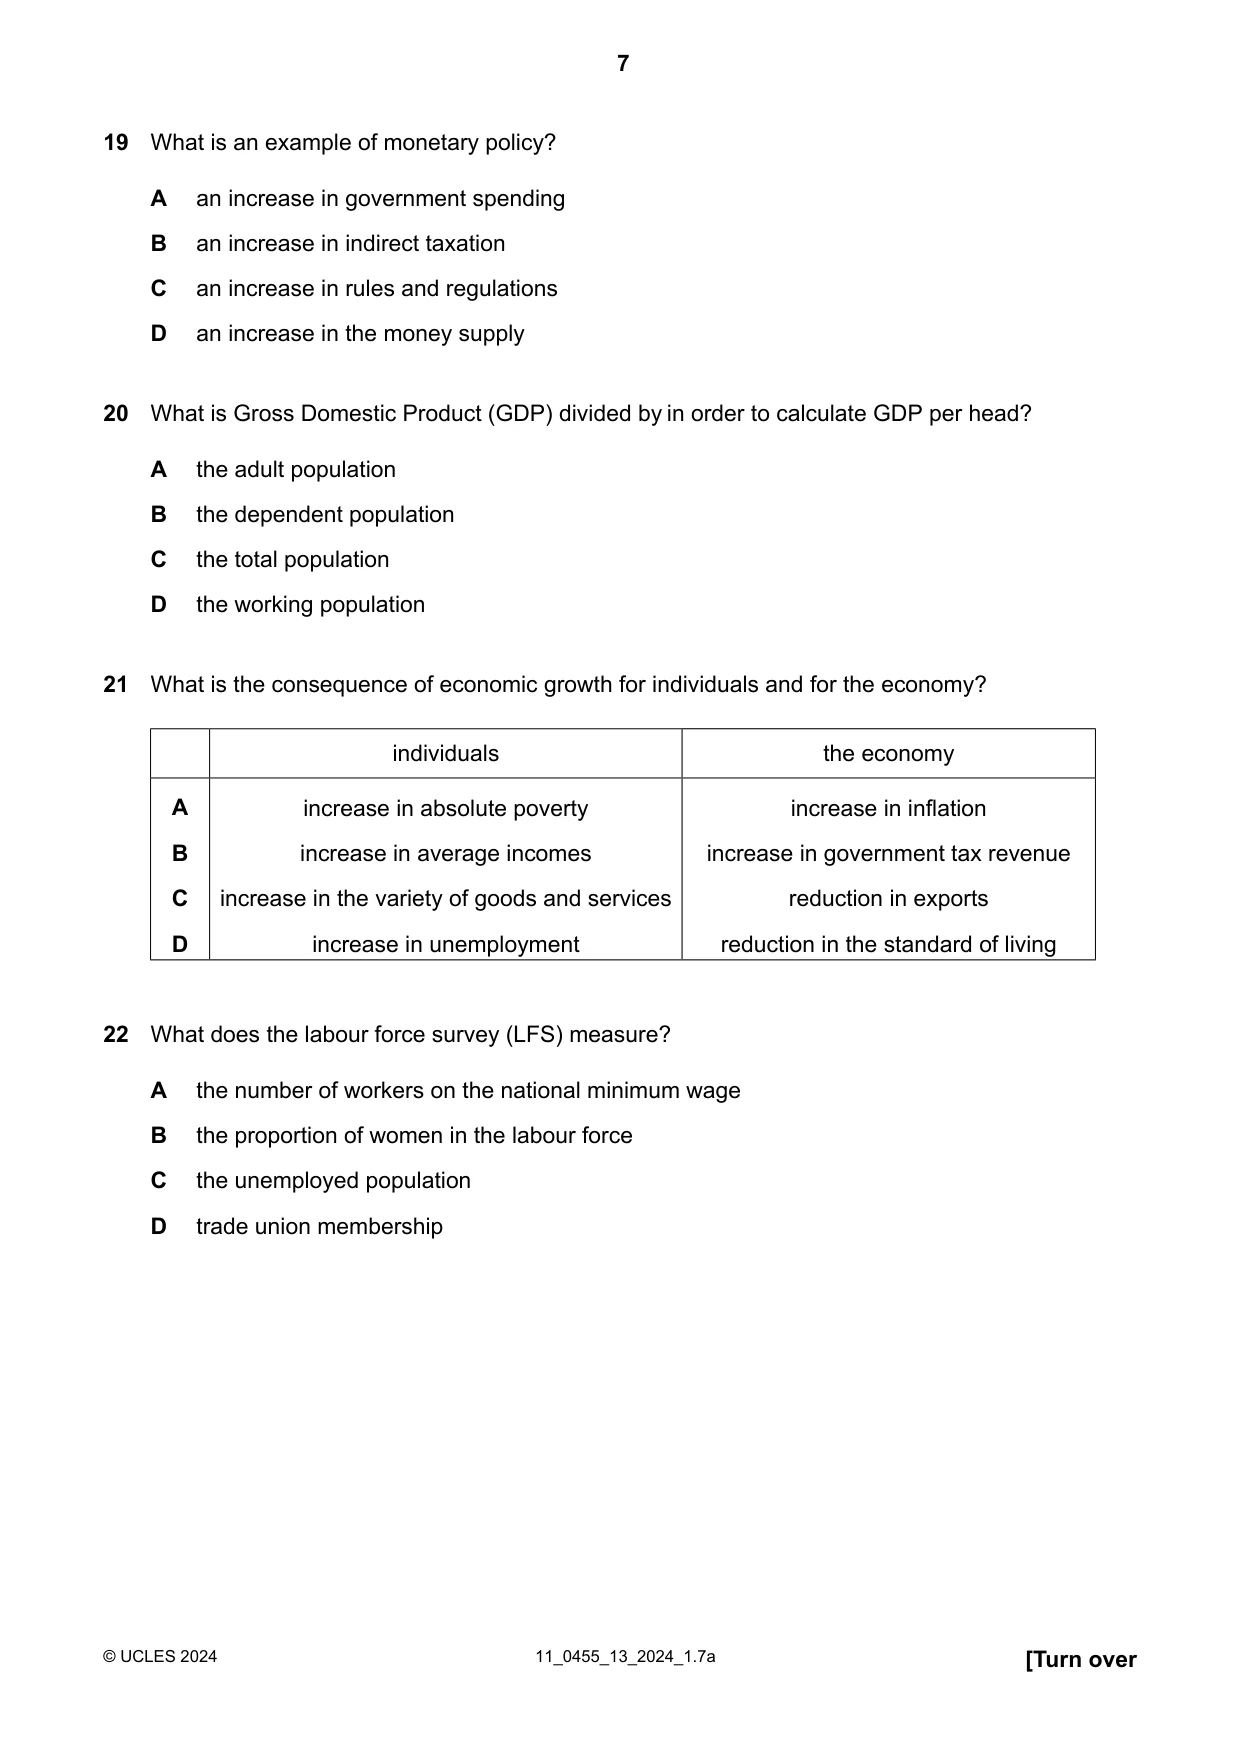
19 What is an example of monetary policy? A an increase in government spending B an increase in indirect taxation C an increase in rules and regulations D an increase in the money supply
Mark scheme: D
Q20 · What is Gross Domestic Product (GDP) divided by in order to calculate GDP per head?
20 What is Gross Domestic Product (GDP) divided by in order to calculate GDP per head? A the adult population B the dependent population C the total population D the working population
Mark scheme: C
Q21 · What is the consequence of economic growth for individuals and for the economy?
21 What is the consequence of economic growth for individuals and for the economy? individuals the economy A increase in absolute poverty increase in inflation B increase in average incomes increase in government tax revenue C increase in the variety of goods and services reduction in exports D increase in unemployment reduction in the standard of living
Mark scheme: B
Q22 · What does the labour force survey (LFS) measure?
22 What does the labour force survey (LFS) measure? A the number of workers on the national minimum wage B the proportion of women in the labour force C the unemployed population D trade union membership
Mark scheme: C
Q23 · The table shows the weights allocated to the three items in a Consumer Prices Index (CPI)…
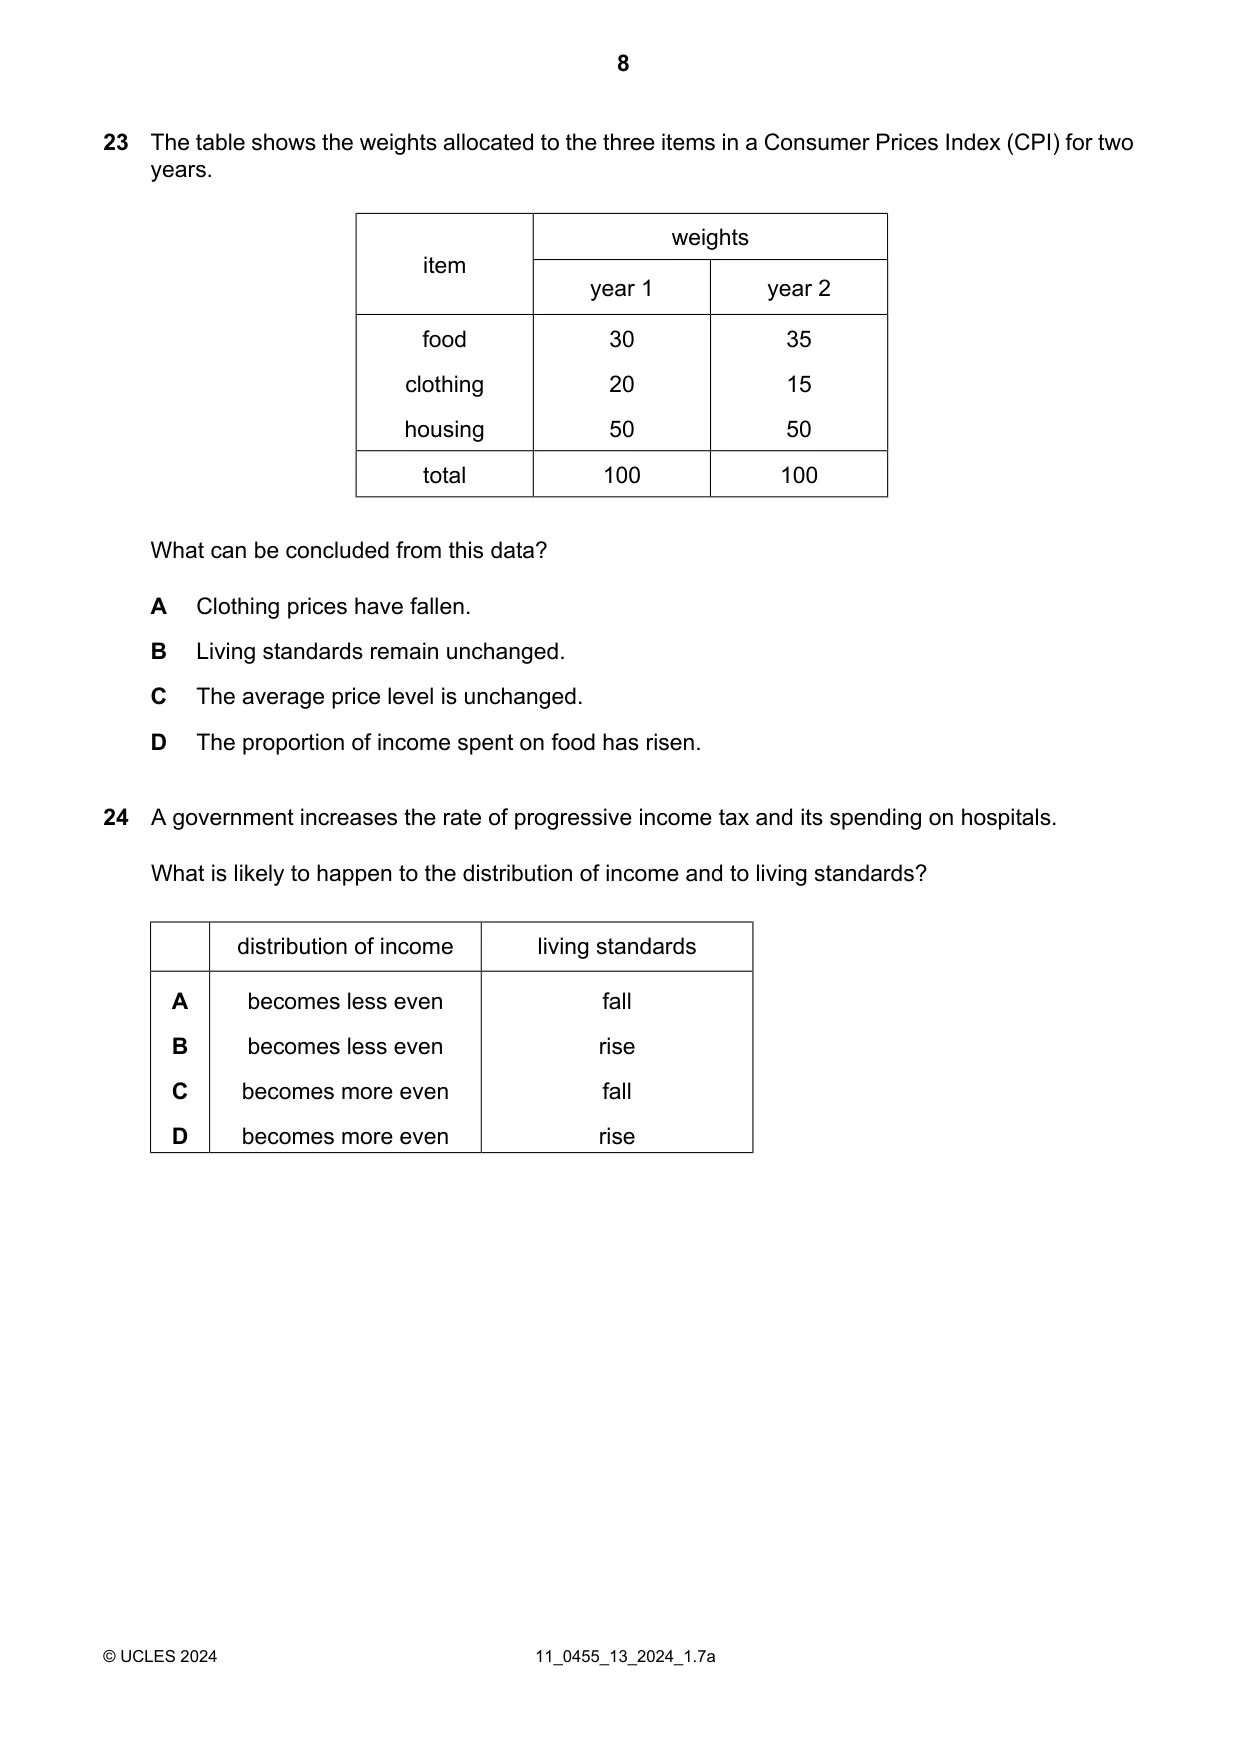
23 The table shows the weights allocated to the three items in a Consumer Prices Index (CPI) for two years. weights item year 1 year 2 food 30 35 clothing 20 15 housing 50 50 total 100 100 What can be concluded from this data? A Clothing prices have fallen. B Living standards remain unchanged. C The average price level is unchanged. D The proportion of income spent on food has risen.
Mark scheme: D
Q24 · A government increases the rate of progressive income tax and its spending on hospitals
24 A government increases the rate of progressive income tax and its spending on hospitals. What is likely to happen to the distribution of income and to living standards? distribution of income living standards A becomes less even fall B becomes less even rise C becomes more even fall D becomes more even rise
Mark scheme: D
Q25 · The population pyramids for country 1 and country 2 in a given year are shown
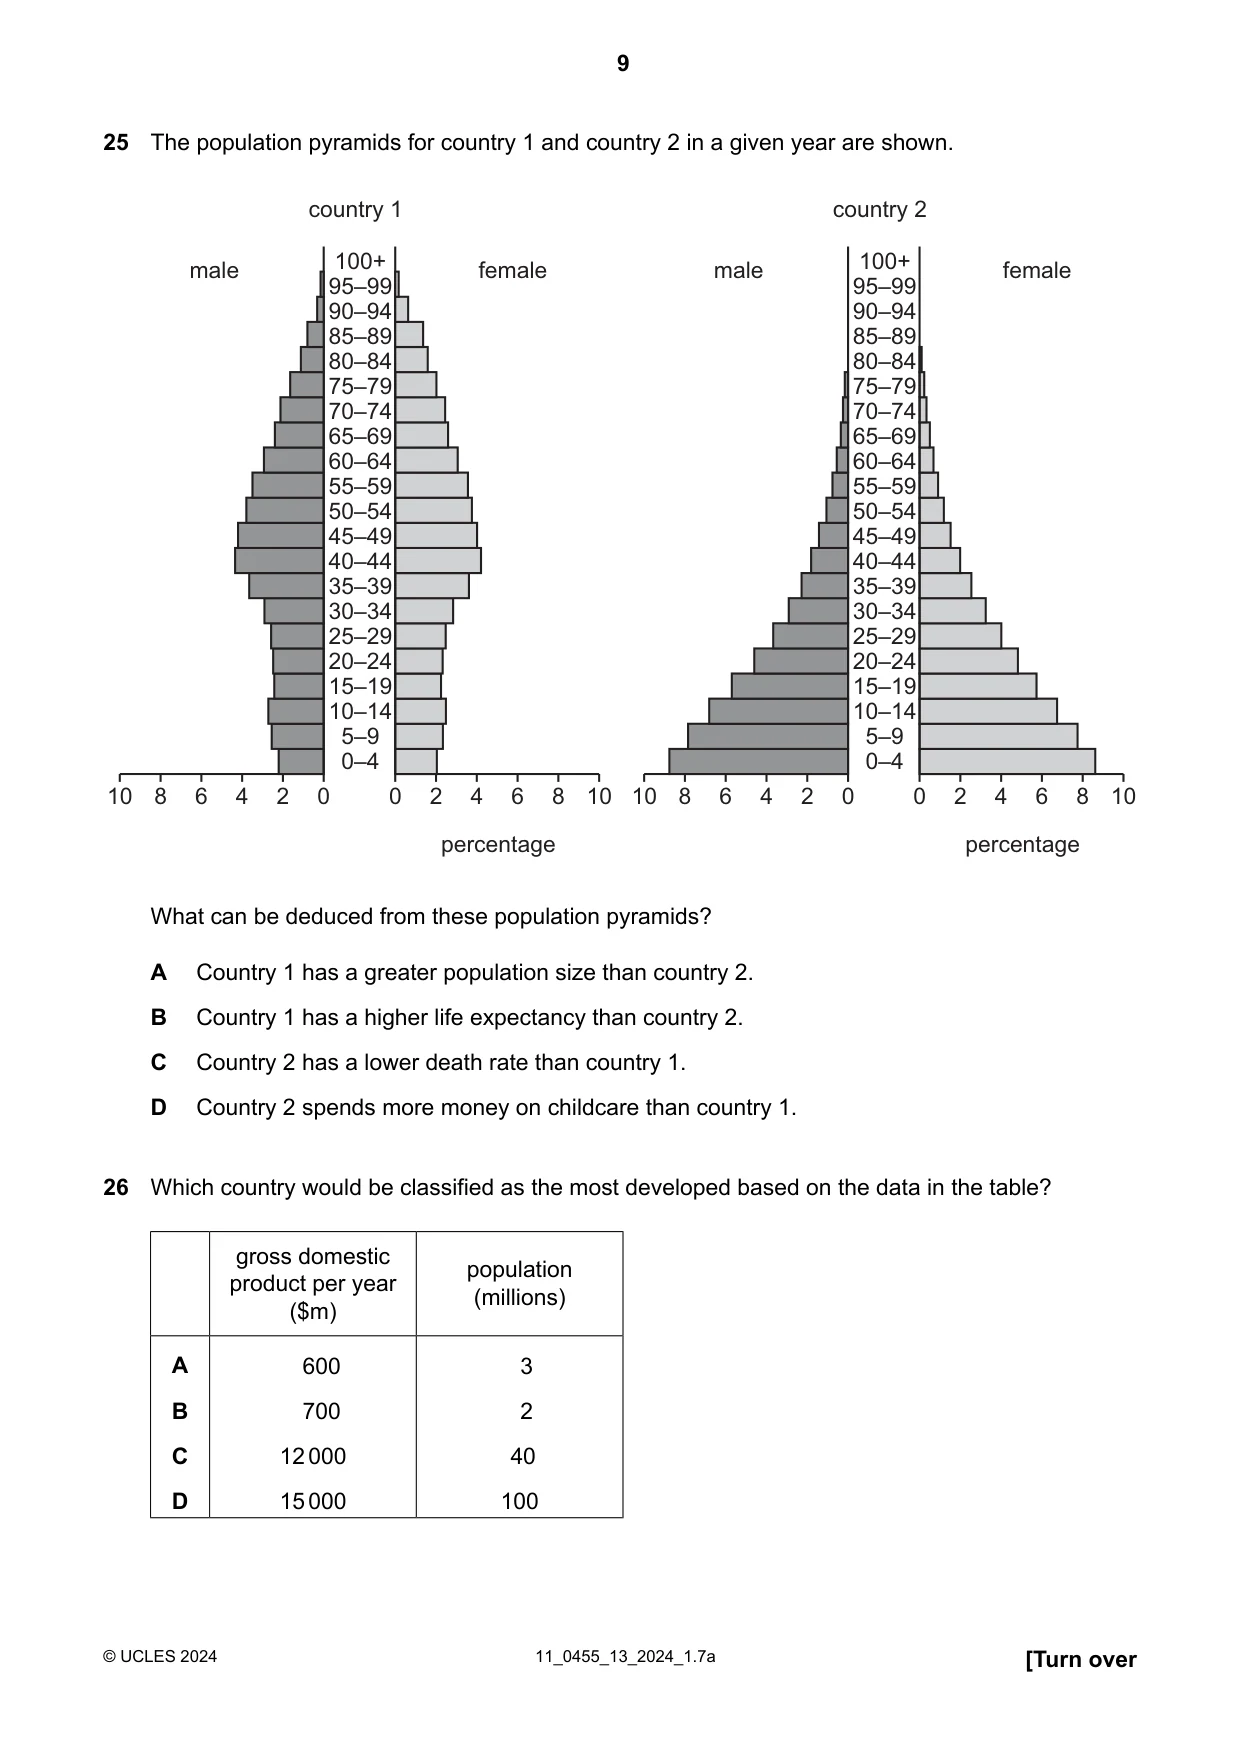
25 The population pyramids for country 1 and country 2 in a given year are shown. country 1 country 2 male 100+ female male 100+ female 95–99 95–99 90–94 90–94 85–89 85–89 80–84 80–84 75–79 75–79 70–74 70–74 65–69 65–69 60–64 60–64 55–59 55–59 50–54 50–54 45–49 45–49 40–44 40–44 35–39 35–39 30–34 30–34 25–29 25–29 20–24 20–24 15–19 15–19 10–14 10–14 5–9 5–9 0–4 0–4 10 8 6 4 2 0 0 2 4 6 8 10 10 8 6 4 2 0 0 2 4 6 8 10 percentage percentage What can be deduced from these population pyramids? A Country 1 has a greater population size than country 2. B Country 1 has a higher life expectancy than country 2. C Country 2 has a lower death rate than country 1. D Country 2 spends more money on childcare than country 1.
Mark scheme: B
Q26 · Which country would be classified as the most developed based on the data in the table?
26 Which country would be classified as the most developed based on the data in the table? gross domestic population product per year (millions) ($m) A 600 3 B 700 2 C 12000 40 D 15000 100
Mark scheme: B
More questions on Differences in economic development between countries
Q27 · What encourages international specialisation?
27 What encourages international specialisation? A a foreign exchange shortage B diseconomies of scale C free trade D quotas
Mark scheme: C
Q28 · A country wants to limit the number of imported cars to a maximum of 100 000 in a year
28 A country wants to limit the number of imported cars to a maximum of 100 000 in a year. Which measure is most likely to achieve this objective? A an embargo B an import quota C an import tariff D a subsidy
Mark scheme: B
Q29 · The diagram shows a change in the exchange rate for the Indian rupee against the US$
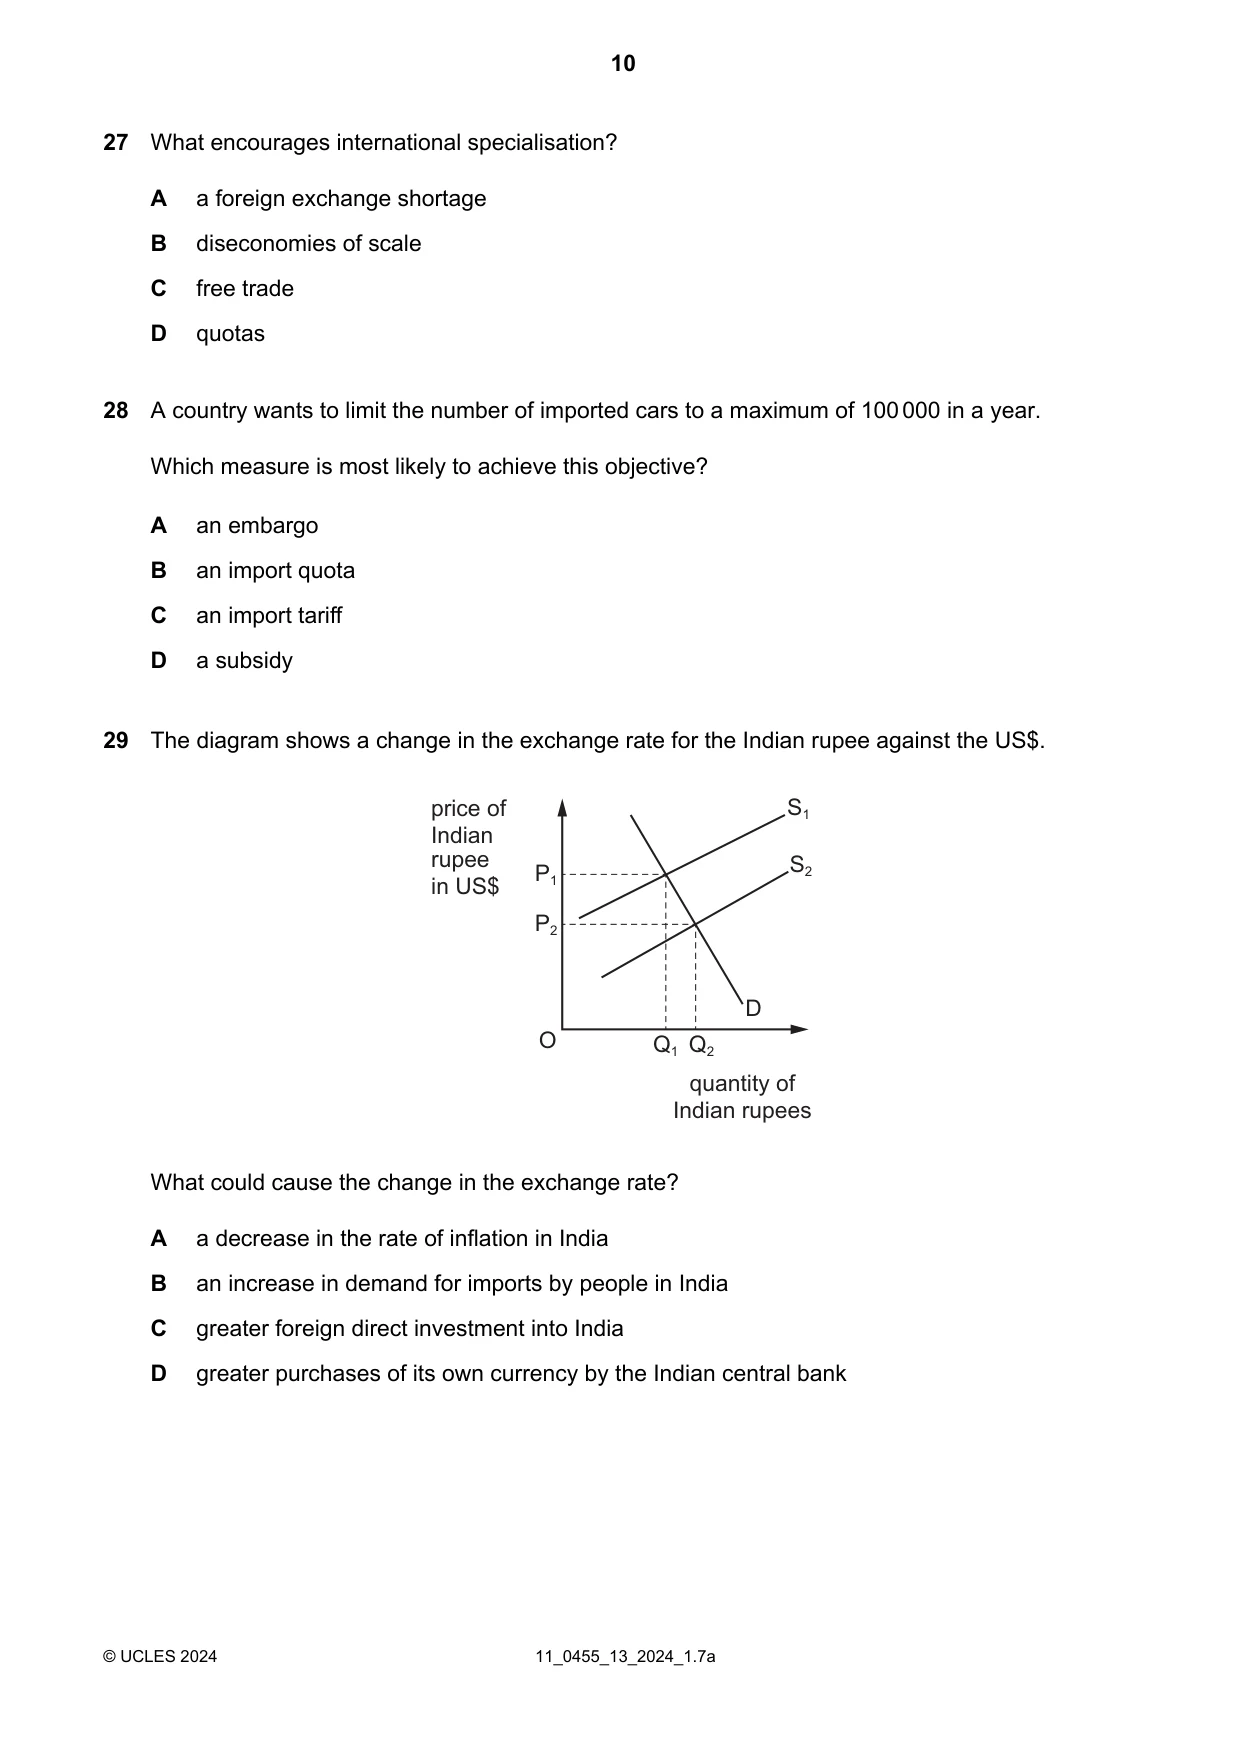
29 The diagram shows a change in the exchange rate for the Indian rupee against the US$. price of S1 Indian rupee S2 P1 in US$ P2 D O Q1 Q2 quantity of Indian rupees What could cause the change in the exchange rate? A a decrease in the rate of inflation in India B an increase in demand for imports by people in India C greater foreign direct investment into India D greater purchases of its own currency by the Indian central bank
Mark scheme: B
Q30 · Country X records these selected items in the current account of its balance of payments
30 Country X records these selected items in the current account of its balance of payments. • Country X exports $200m of goods. • Country X imports $50m of services. • Country Y’s citizens working in country X send home to relatives $25m. • Country X sends country Y $75m of aid. By how much did the balance on the current account of country X increase? A $50m B $100m C $200m D $350m
Mark scheme: A
What was in this paper
The subtopics covered by these 30 questions, and how many questions each got. Open one in a new tab to see every Cambridge question on it.
2Fiscal policy2Price determination2Current account of balance of payments1Differences in economic development between countries1Economic growth1Employment and unemployment1Foreign exchange rates1Globalisation, free trade and protection1Households1Inflation and deflation1International specialisation1Living standards1Market failure1Monetary policy1Money and banking1Opportunity cost1Population1Price changes1Price elasticity of demand (PED)1Price elasticity of supply (PES)1Supply1The factors of production1The macroeconomic aims of government1The nature of the economic problem1Trade unions1Workers1What you needed in this session
Cambridge’s own grade thresholds for 2024 Oct/Nov, Paper 1 · Variant 3. A higher threshold means an easier paper — the bar moves with how the cohort did.