Cambridge IGCSE Economics 0455 — 2019 May/June Paper 1 · Variant 2
0455/12/M/J/19 · 30 questions · 30 marks · ≈34 min
The question paper and its mark scheme, free to read here and free to download. This is Cambridge’s own paper, exactly as it was sat.
Question paper12 pages
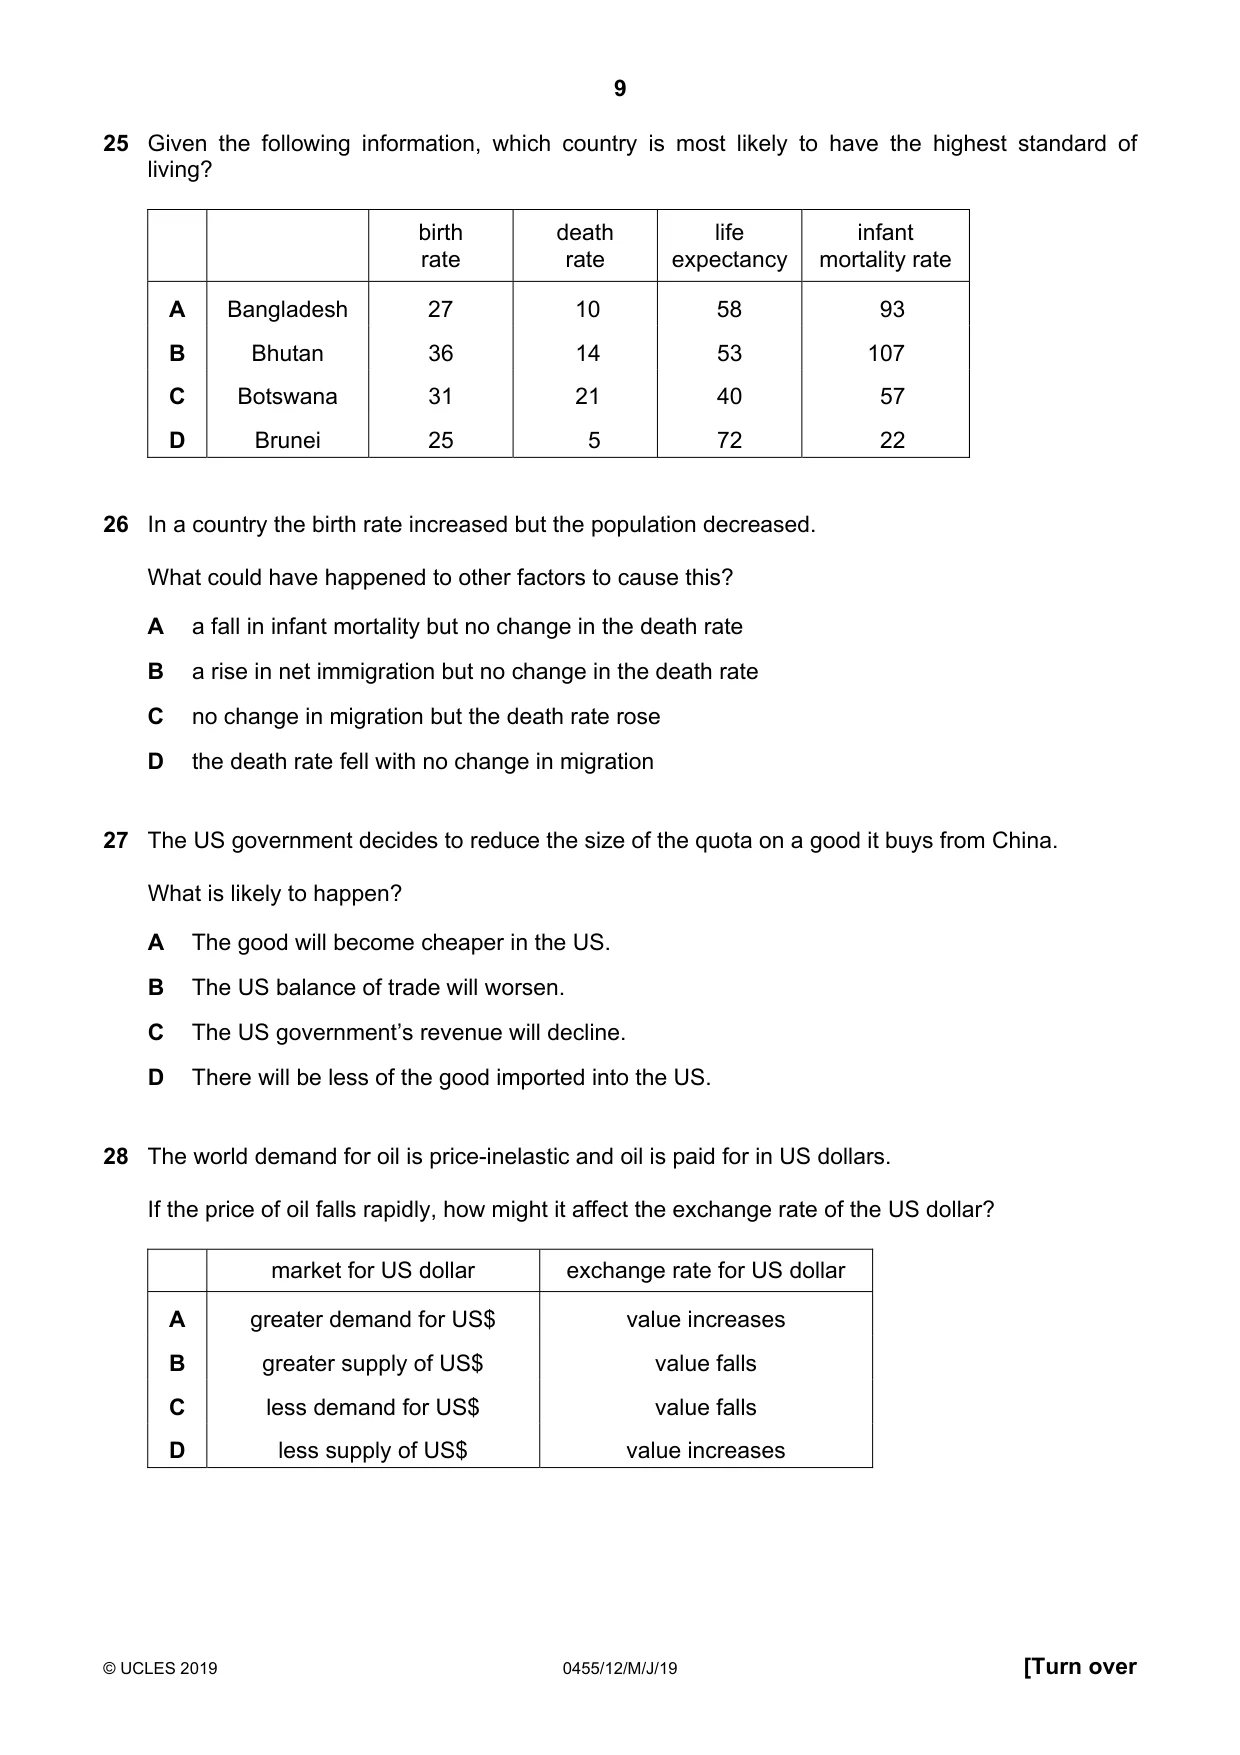
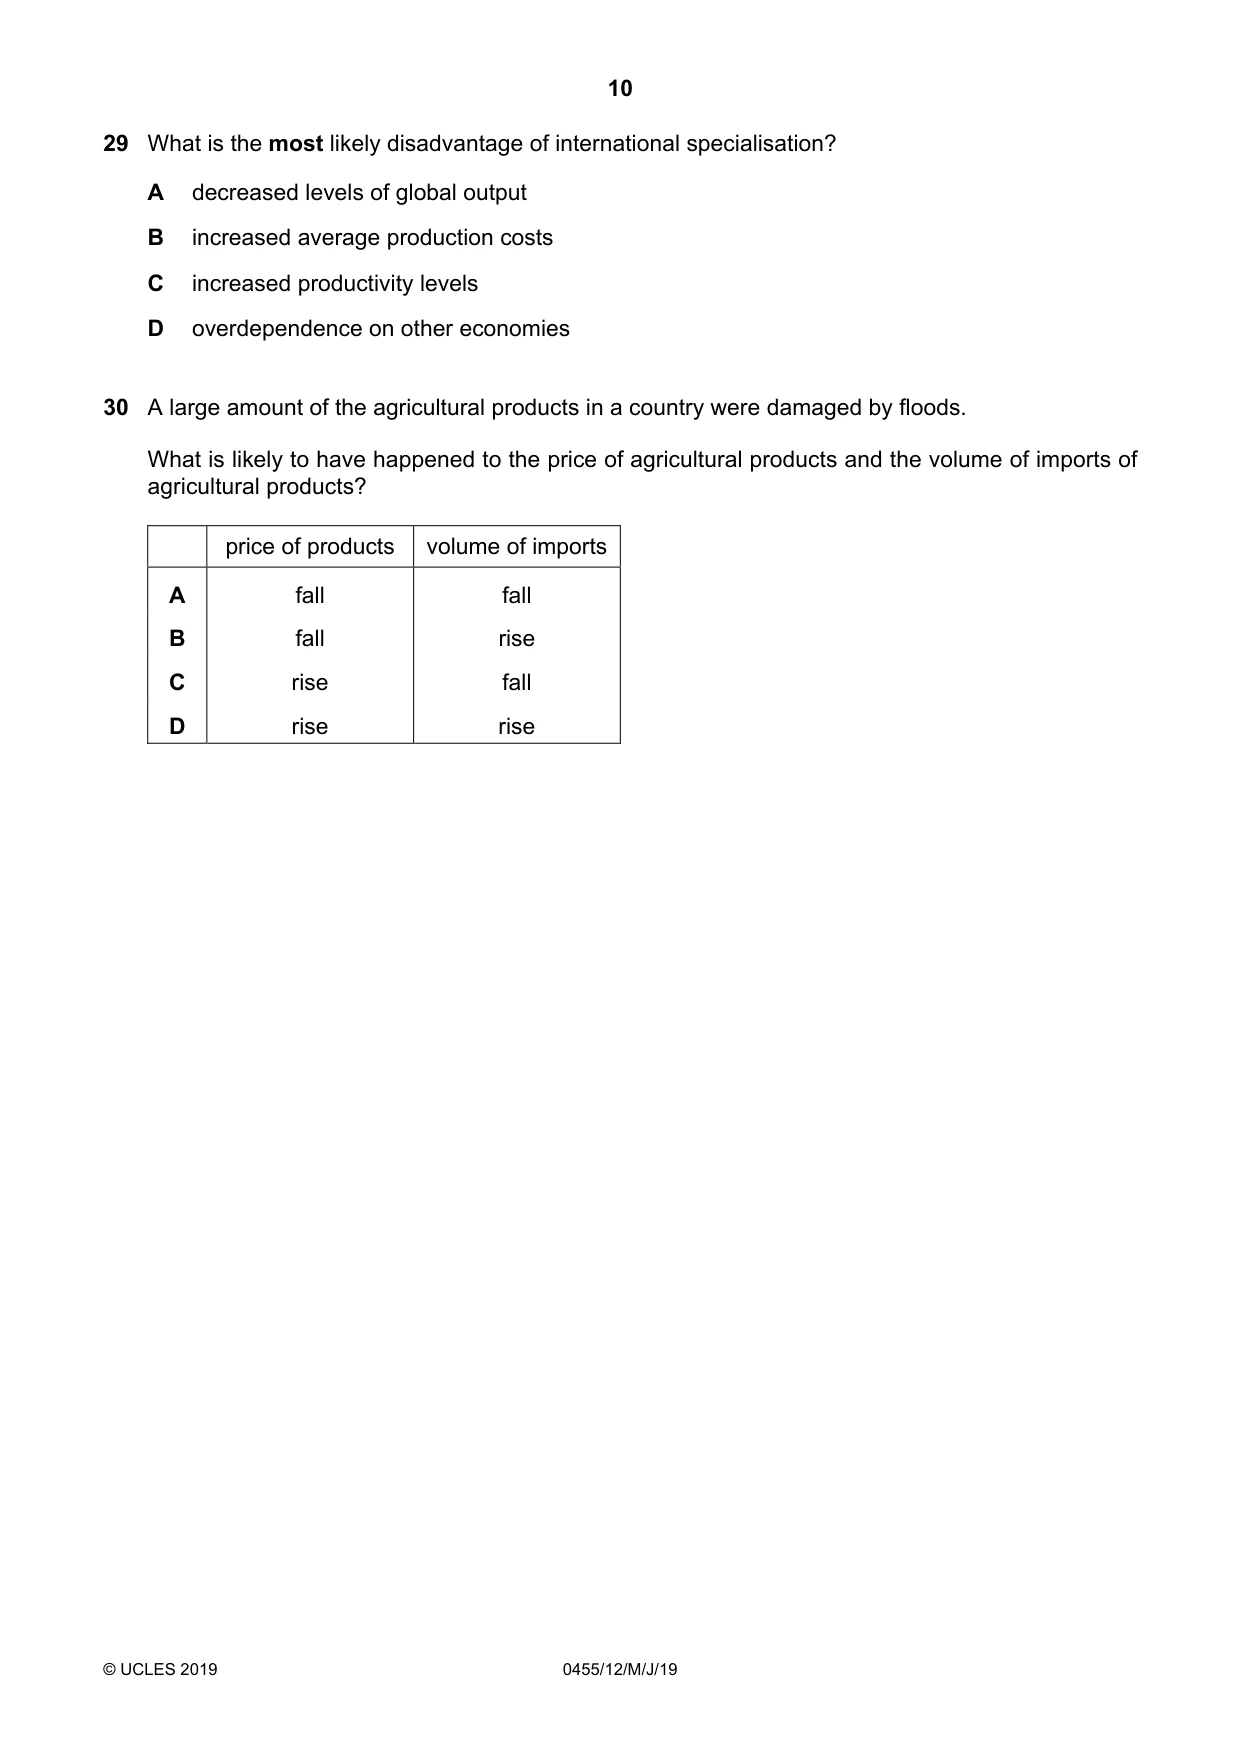


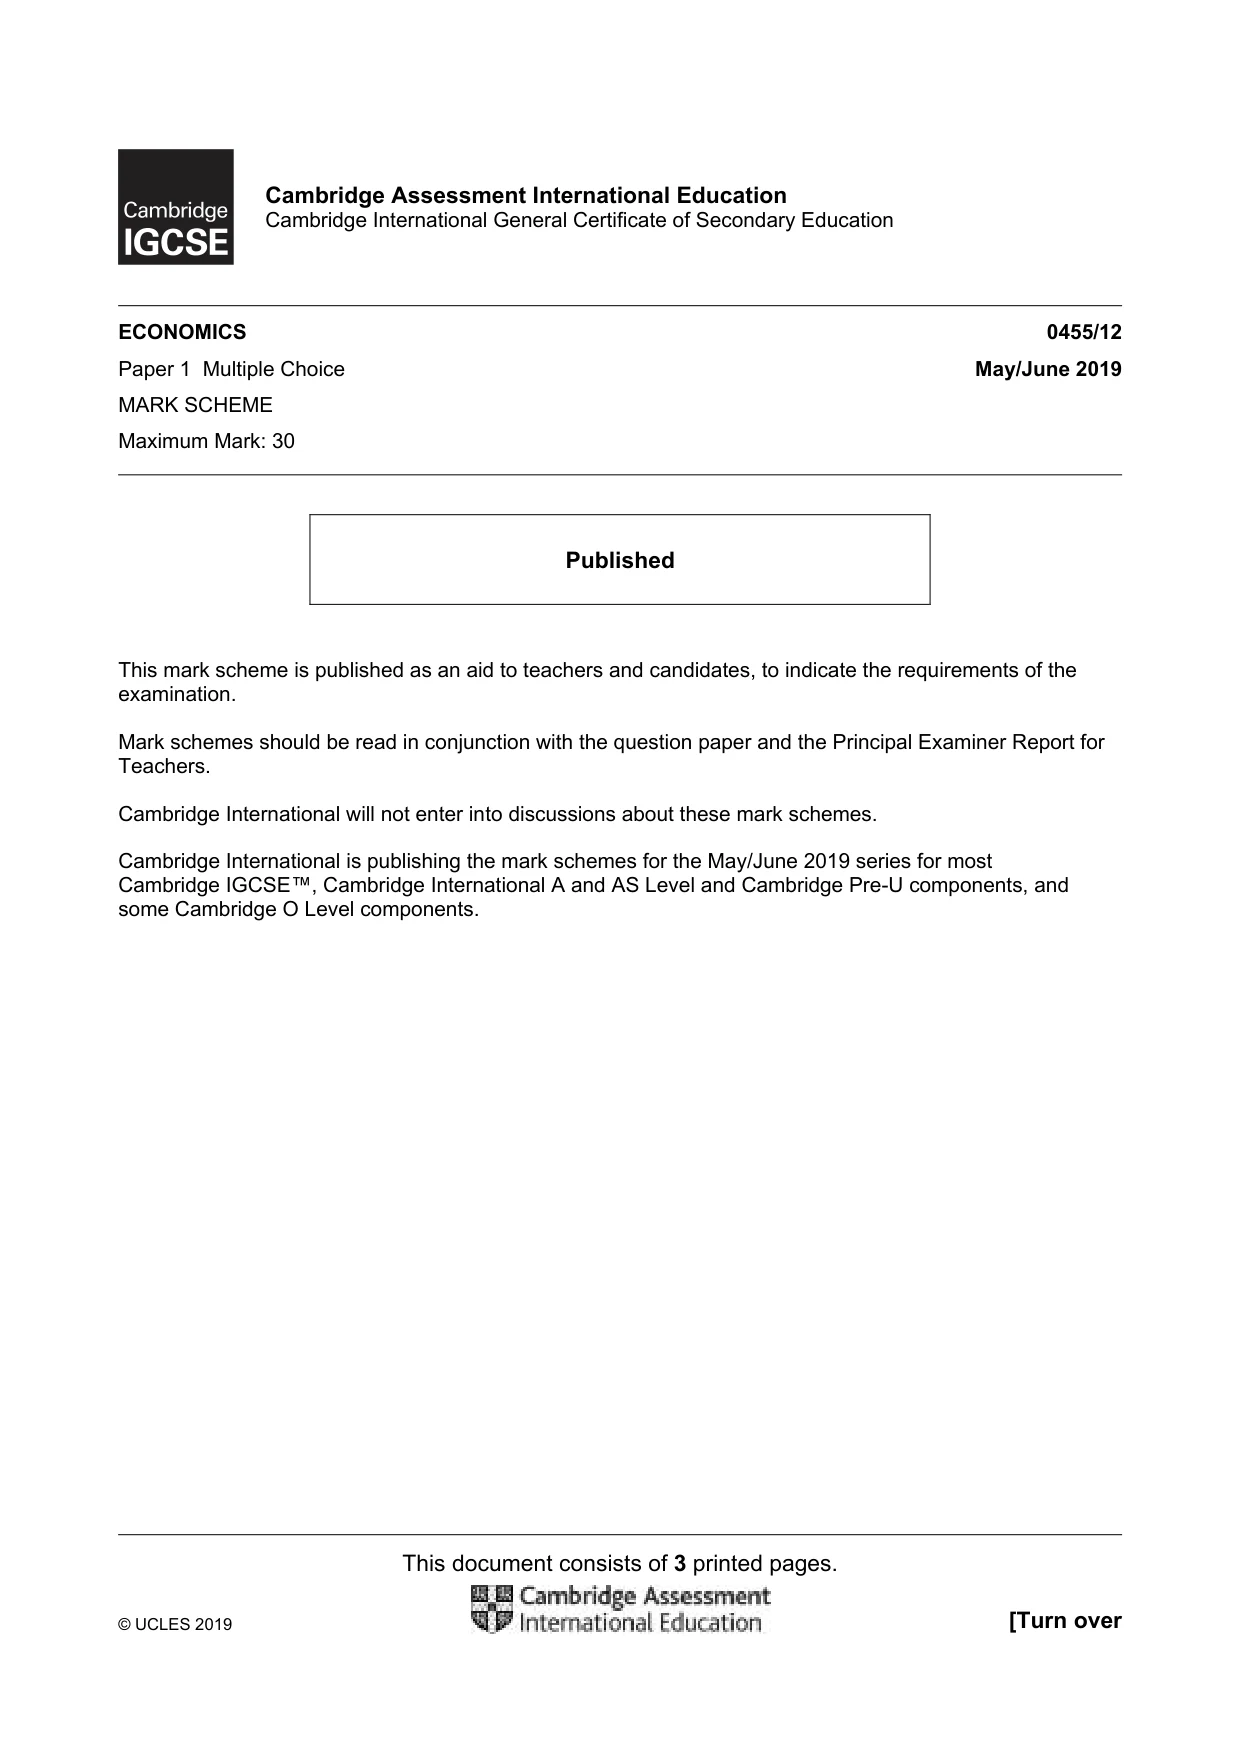
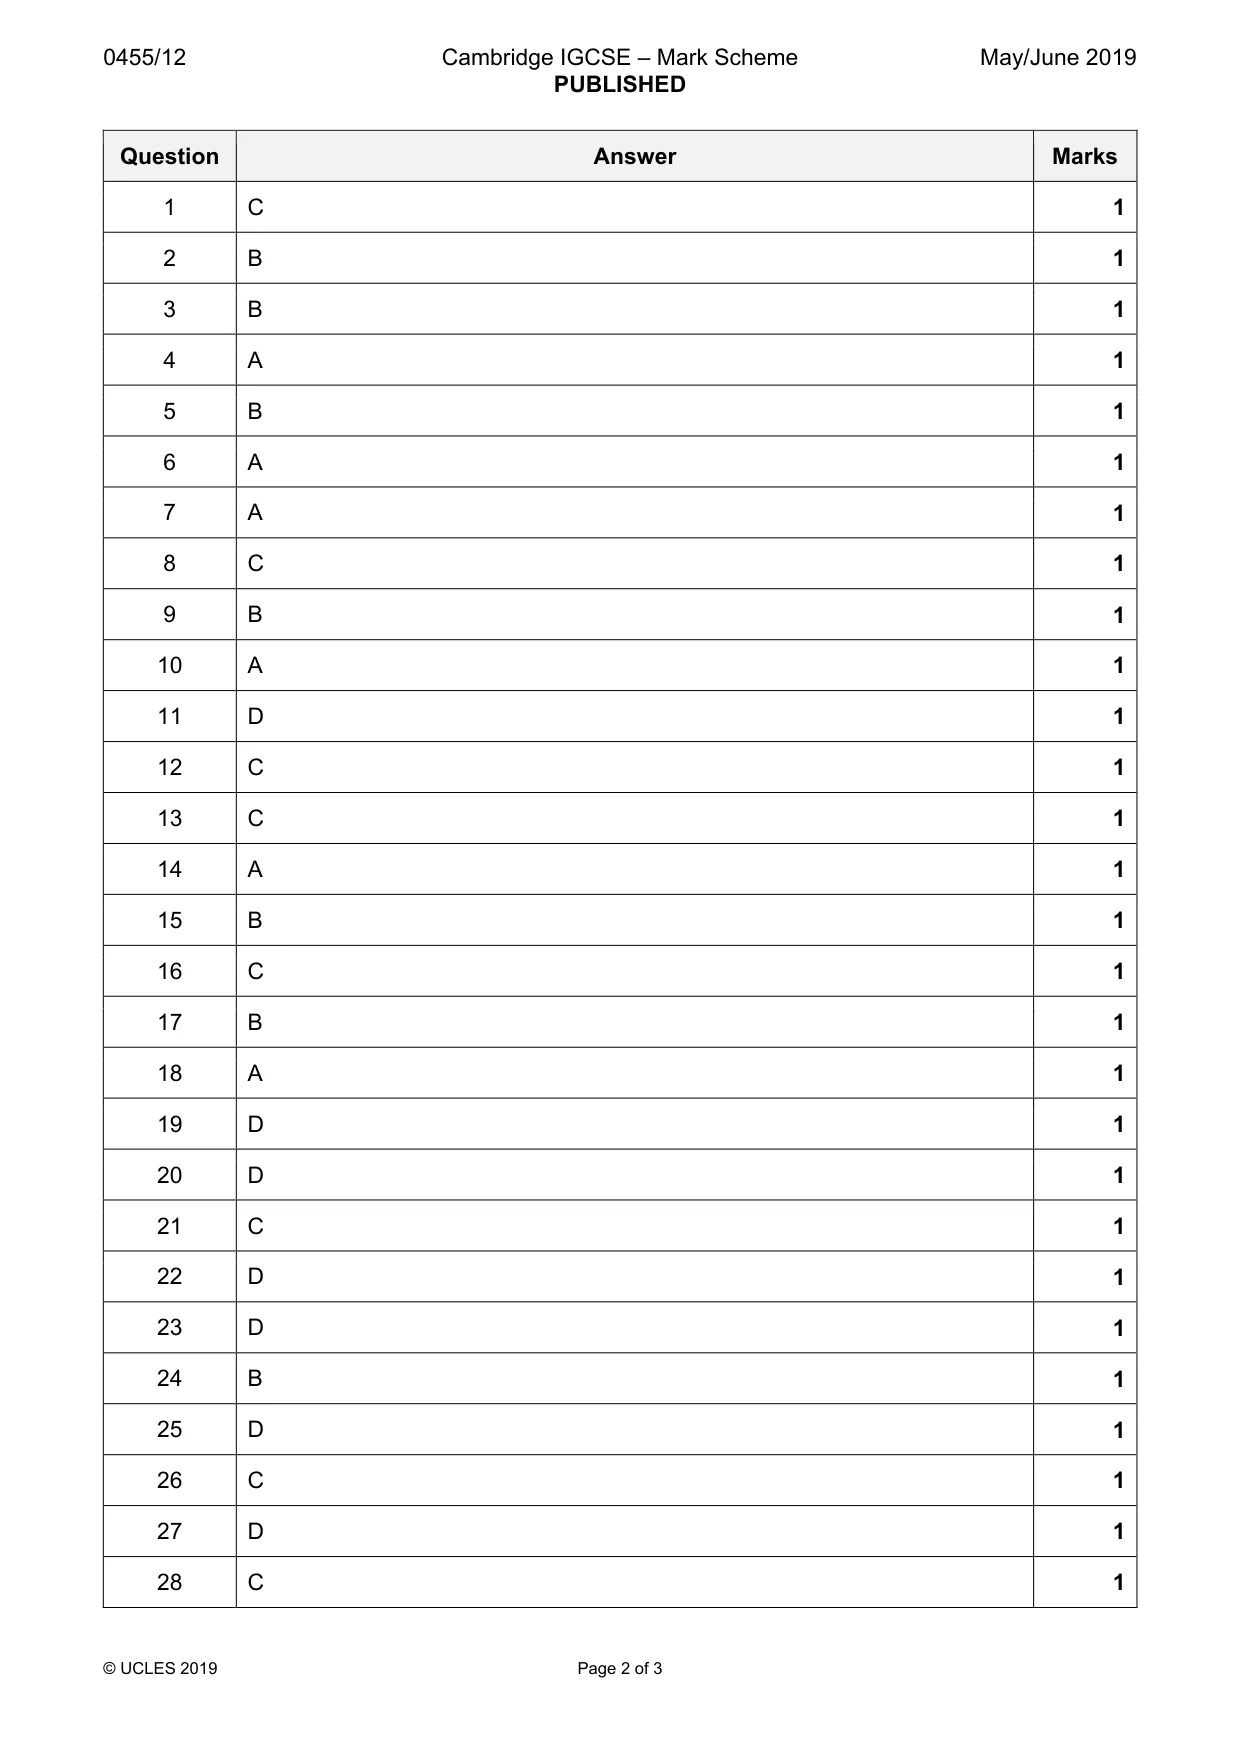
Mark scheme3 pages
Answers below. Sit the paper first if you are practising.

Questions as text
Q1 · A government wishes to increase agricultural output
1 A government wishes to increase agricultural output. It gives farmers the tools to irrigate the farmers’ fields. Which factors of production are provided by the farmers? A capital and enterprise B enterprise and labour C labour and land D land and capital
Mark scheme: C
Q2 · The diagram shows a production possibility curve (PPC) for an economy that produces both…
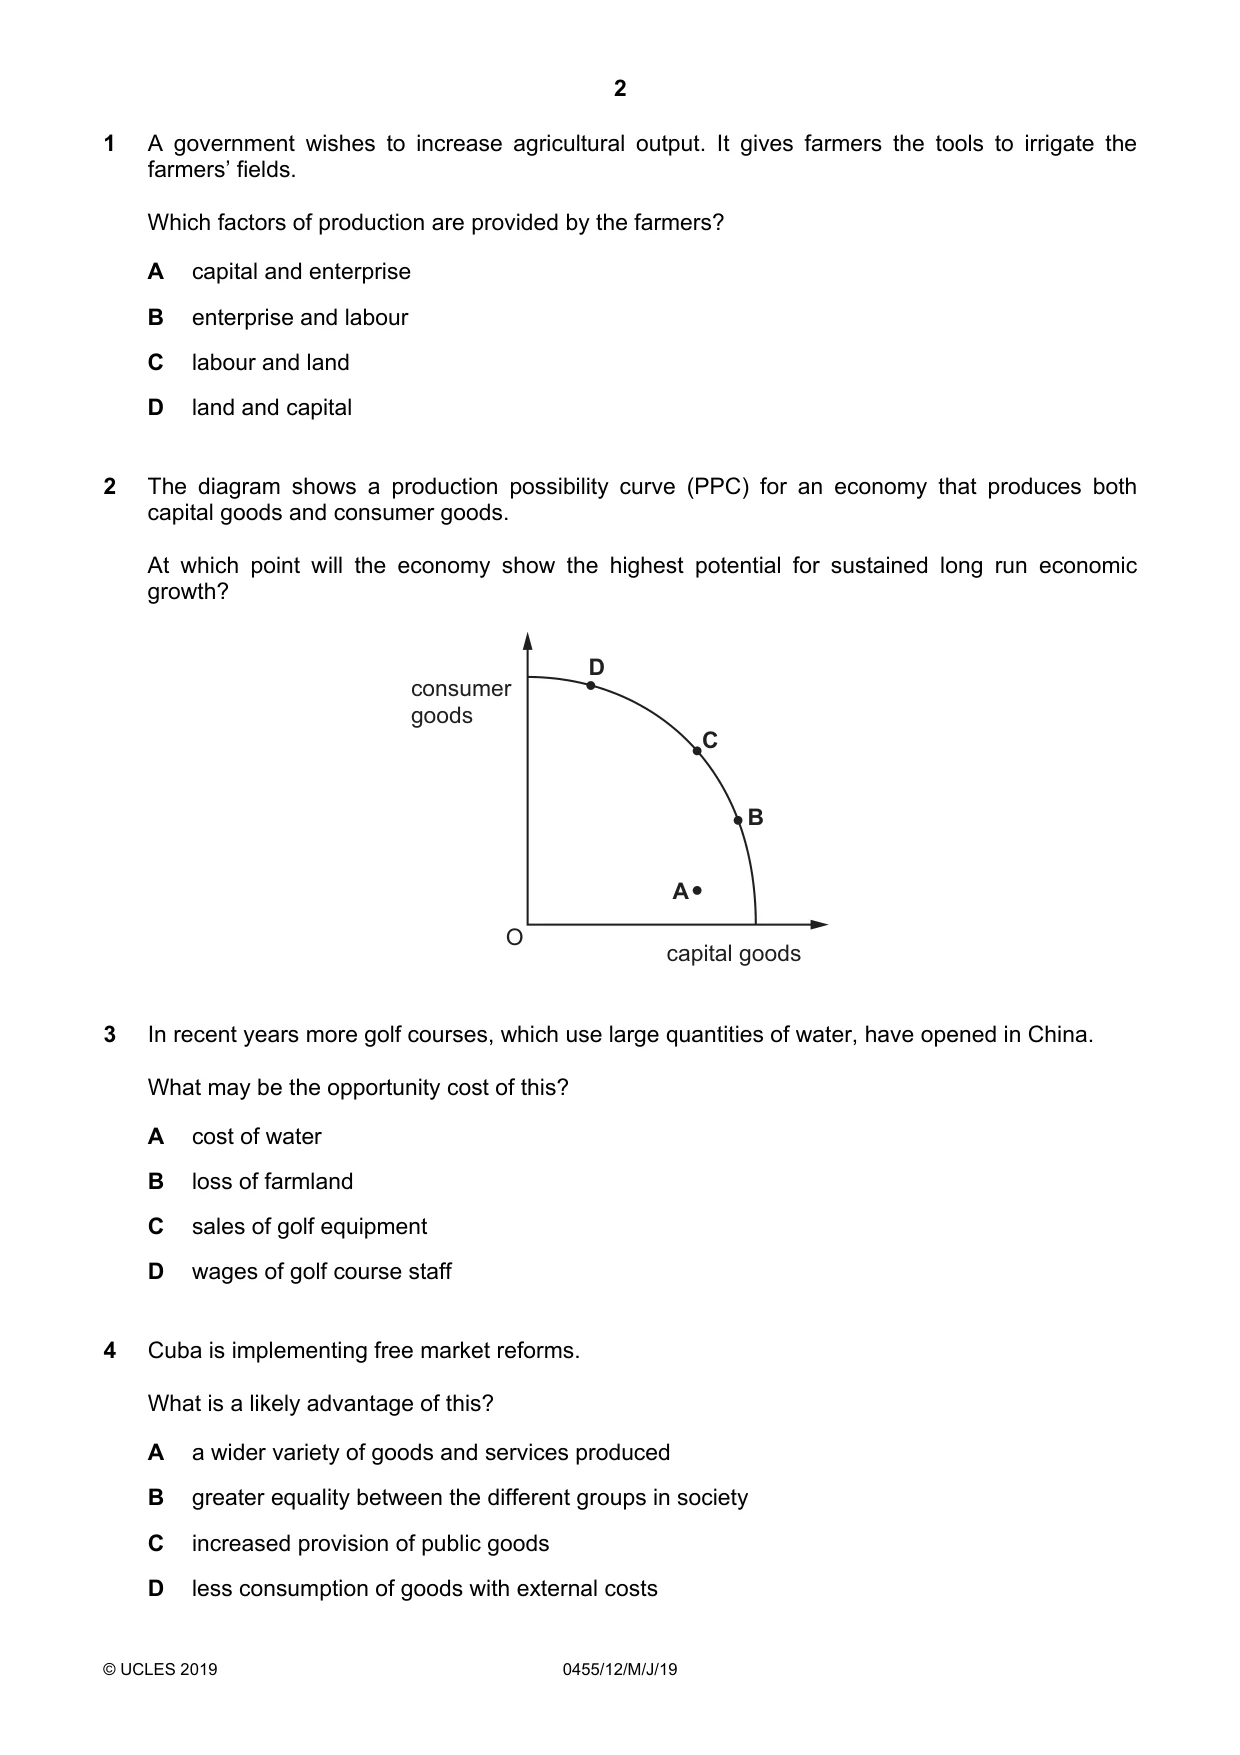
2 The diagram shows a production possibility curve (PPC) for an economy that produces both capital goods and consumer goods. At which point will the economy show the highest potential for sustained long run economic growth? D consumer goods C B A O capital goods
Mark scheme: B
More questions on Production possibility curve (PPC) diagrams
Q3 · In recent years more golf courses, which use large quantities of water, have opened in…
3 In recent years more golf courses, which use large quantities of water, have opened in China. What may be the opportunity cost of this? A cost of water B loss of farmland C sales of golf equipment D wages of golf course staff
Mark scheme: B
Q4 · Cuba is implementing free market reforms
4 Cuba is implementing free market reforms. What is a likely advantage of this? A a wider variety of goods and services produced B greater equality between the different groups in society C increased provision of public goods D less consumption of goods with external costs
Mark scheme: A
Q5 · An airline upgrades its services by providing bigger aircraft
5 An airline upgrades its services by providing bigger aircraft. The airline claims it will reduce catering waste and lower carbon (CO2) emissions per passenger journey although fares may rise. What is a private cost and an external benefit of this decision? private cost external benefit A bigger aircraft higher fares B higher fares lower CO2 C less catering waste bigger aircraft D lower CO2 less catering waste
Mark scheme: B
Q6 · What can be concluded from the demand curve for the product shown in the diagram?
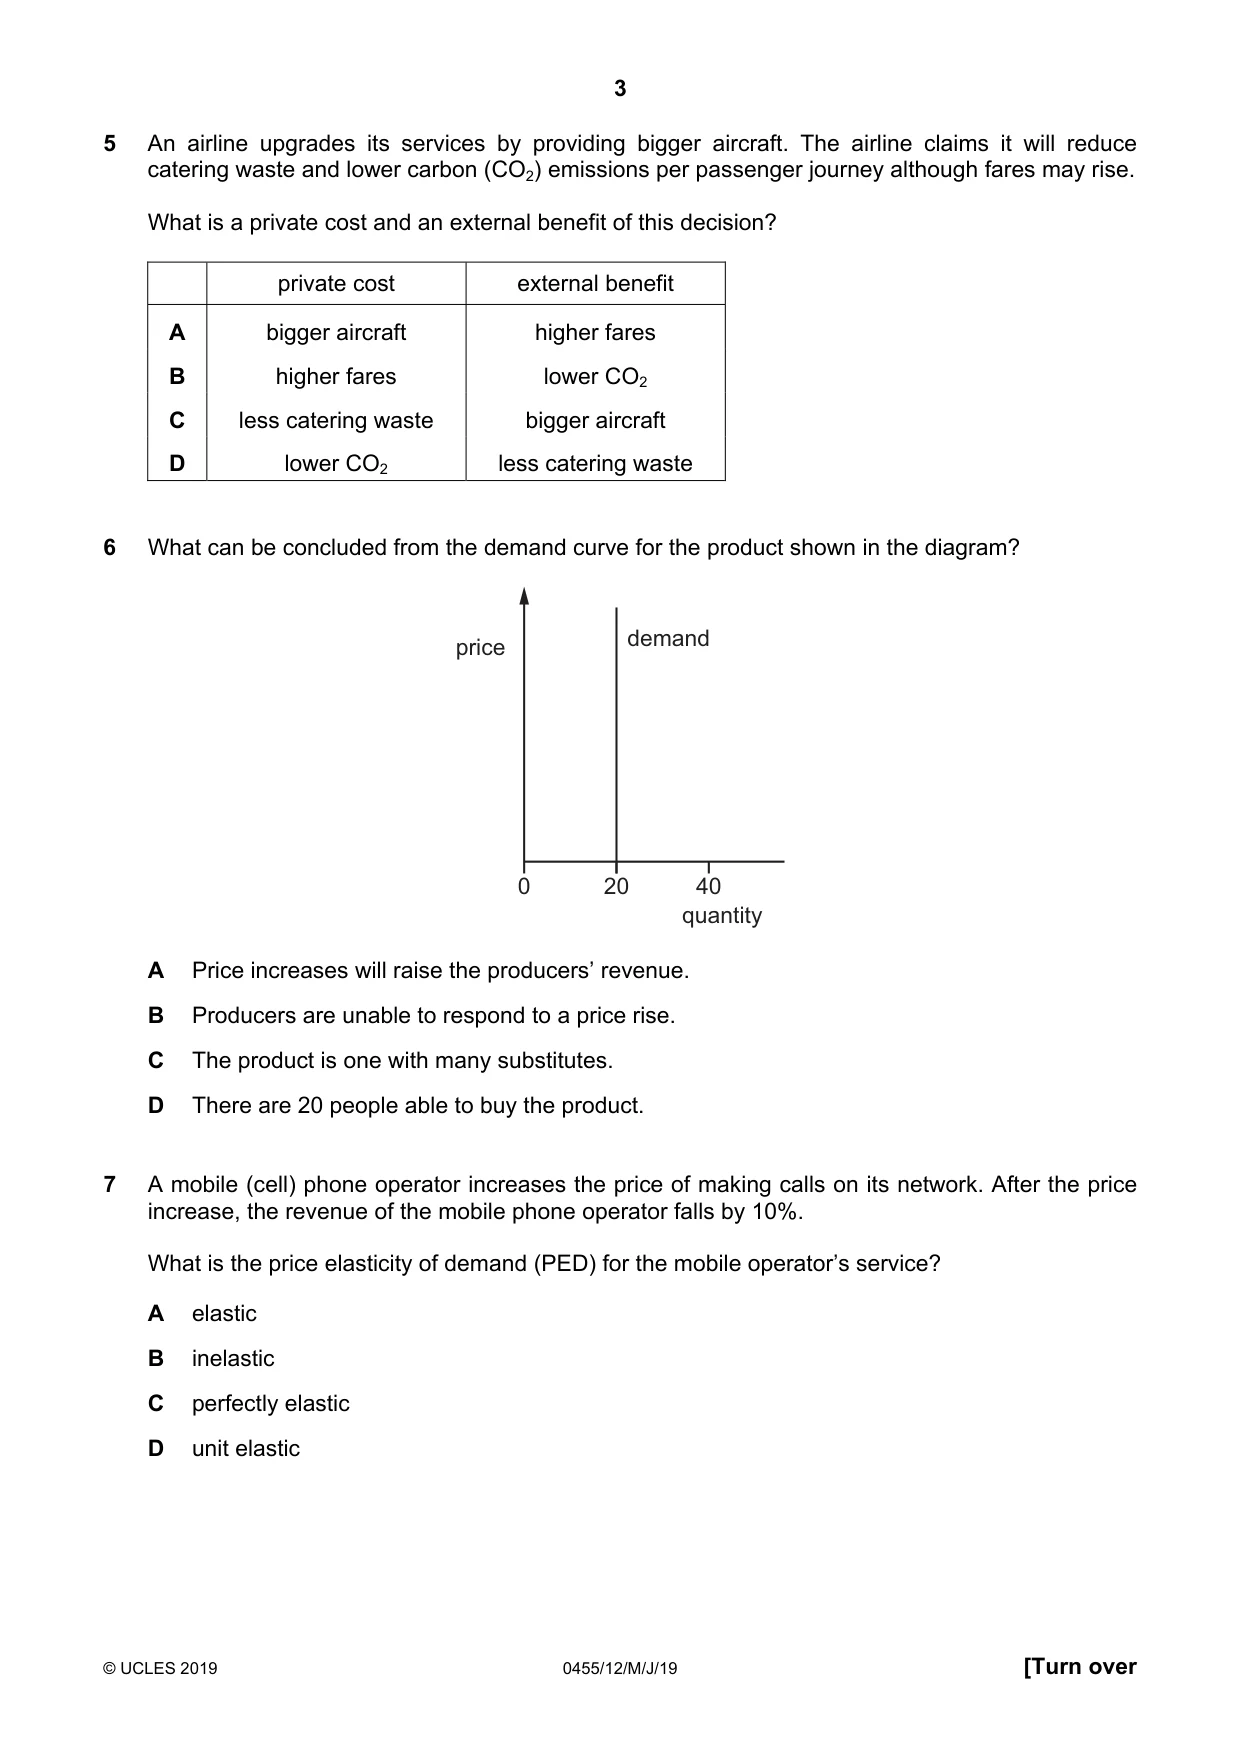
6 What can be concluded from the demand curve for the product shown in the diagram? price demand 0 20 40 quantity A Price increases will raise the producers’ revenue. B Producers are unable to respond to a price rise. C The product is one with many substitutes. D There are 20 people able to buy the product.
Mark scheme: A
Q7 · A mobile (cell) phone operator increases the price of making calls on its network
7 A mobile (cell) phone operator increases the price of making calls on its network. After the price increase, the revenue of the mobile phone operator falls by 10%. What is the price elasticity of demand (PED) for the mobile operator’s service? A elastic B inelastic C perfectly elastic D unit elastic
Mark scheme: A
Q8 · Why does specialisation increase the productivity of employees?
8 Why does specialisation increase the productivity of employees? A Average cost of production increases. B Staff turnover is high. C Time is saved by not moving between tasks. D Workers lose interest in their job.
Mark scheme: C
Q9 · In recent years some central banks have reduced interest rates below 1% per year
9 In recent years some central banks have reduced interest rates below 1% per year. What is the purpose of this monetary policy? A to discourage lending by the commercial banks B to encourage investment to stimulate the economy C to increase individual savings D to reduce inflation
Mark scheme: B
Q10 · What is the most important factor that affects how much a family saves?
10 What is the most important factor that affects how much a family saves? A the income of the family B the level of taxation C the rate of inflation D the reliability of banks
Mark scheme: A
Q11 · The table shows the change in real incomes for a number of occupations between 1985 and…
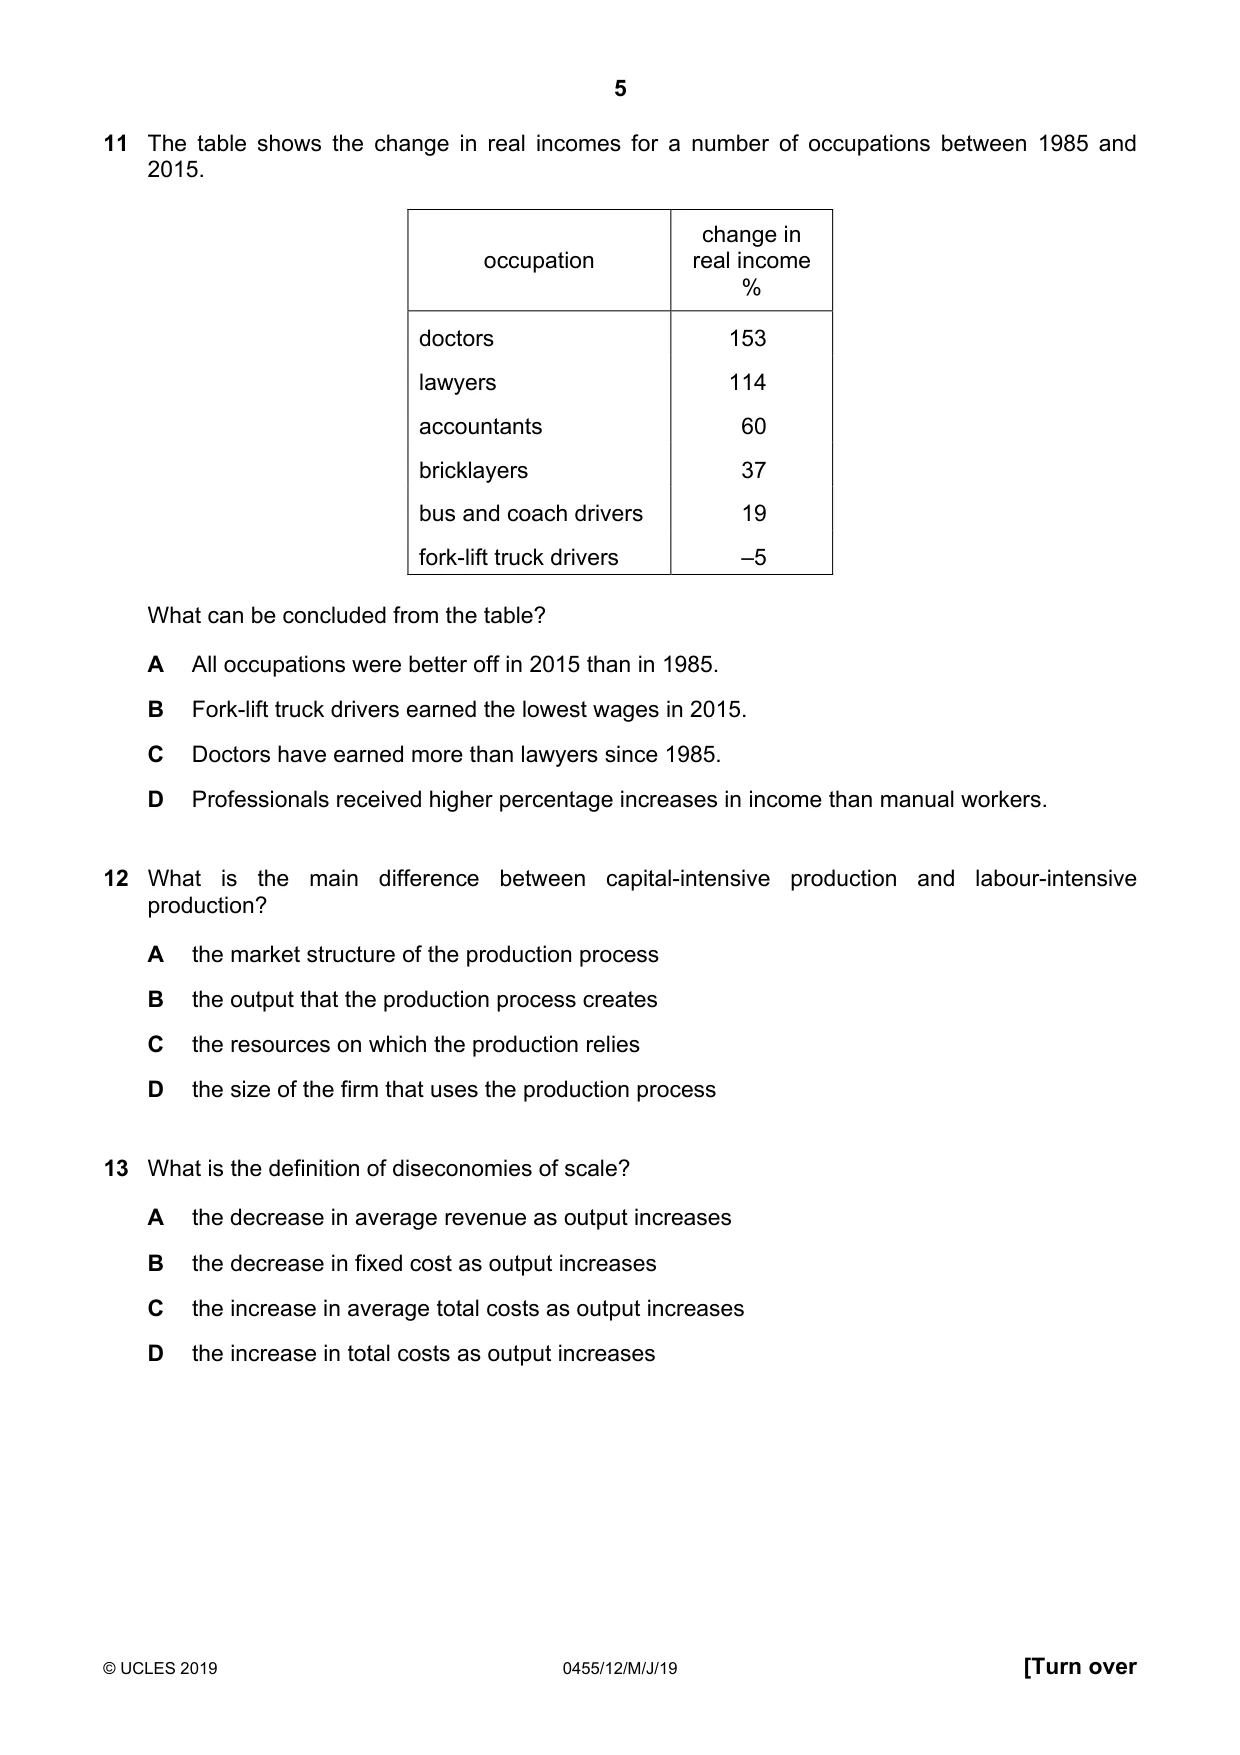
11 The table shows the change in real incomes for a number of occupations between 1985 and 2015. change in occupation real income % doctors 153 lawyers 114 accountants 60 bricklayers 37 bus and coach drivers 19 fork-lift truck drivers –5 What can be concluded from the table? A All occupations were better off in 2015 than in 1985. B Fork-lift truck drivers earned the lowest wages in 2015. C Doctors have earned more than lawyers since 1985. D Professionals received higher percentage increases in income than manual workers.
Mark scheme: D
Q12 · What is the main difference between capital-intensive production and labour-intensive…
12 What is the main difference between capital-intensive production and labour-intensive production? A the market structure of the production process B the output that the production process creates C the resources on which the production relies D the size of the firm that uses the production process
Mark scheme: C
Q13 · What is the definition of diseconomies of scale?
13 What is the definition of diseconomies of scale? A the decrease in average revenue as output increases B the decrease in fixed cost as output increases C the increase in average total costs as output increases D the increase in total costs as output increases
Mark scheme: C
Q14 · The diagram shows the fixed costs, variable costs and total costs of a firm
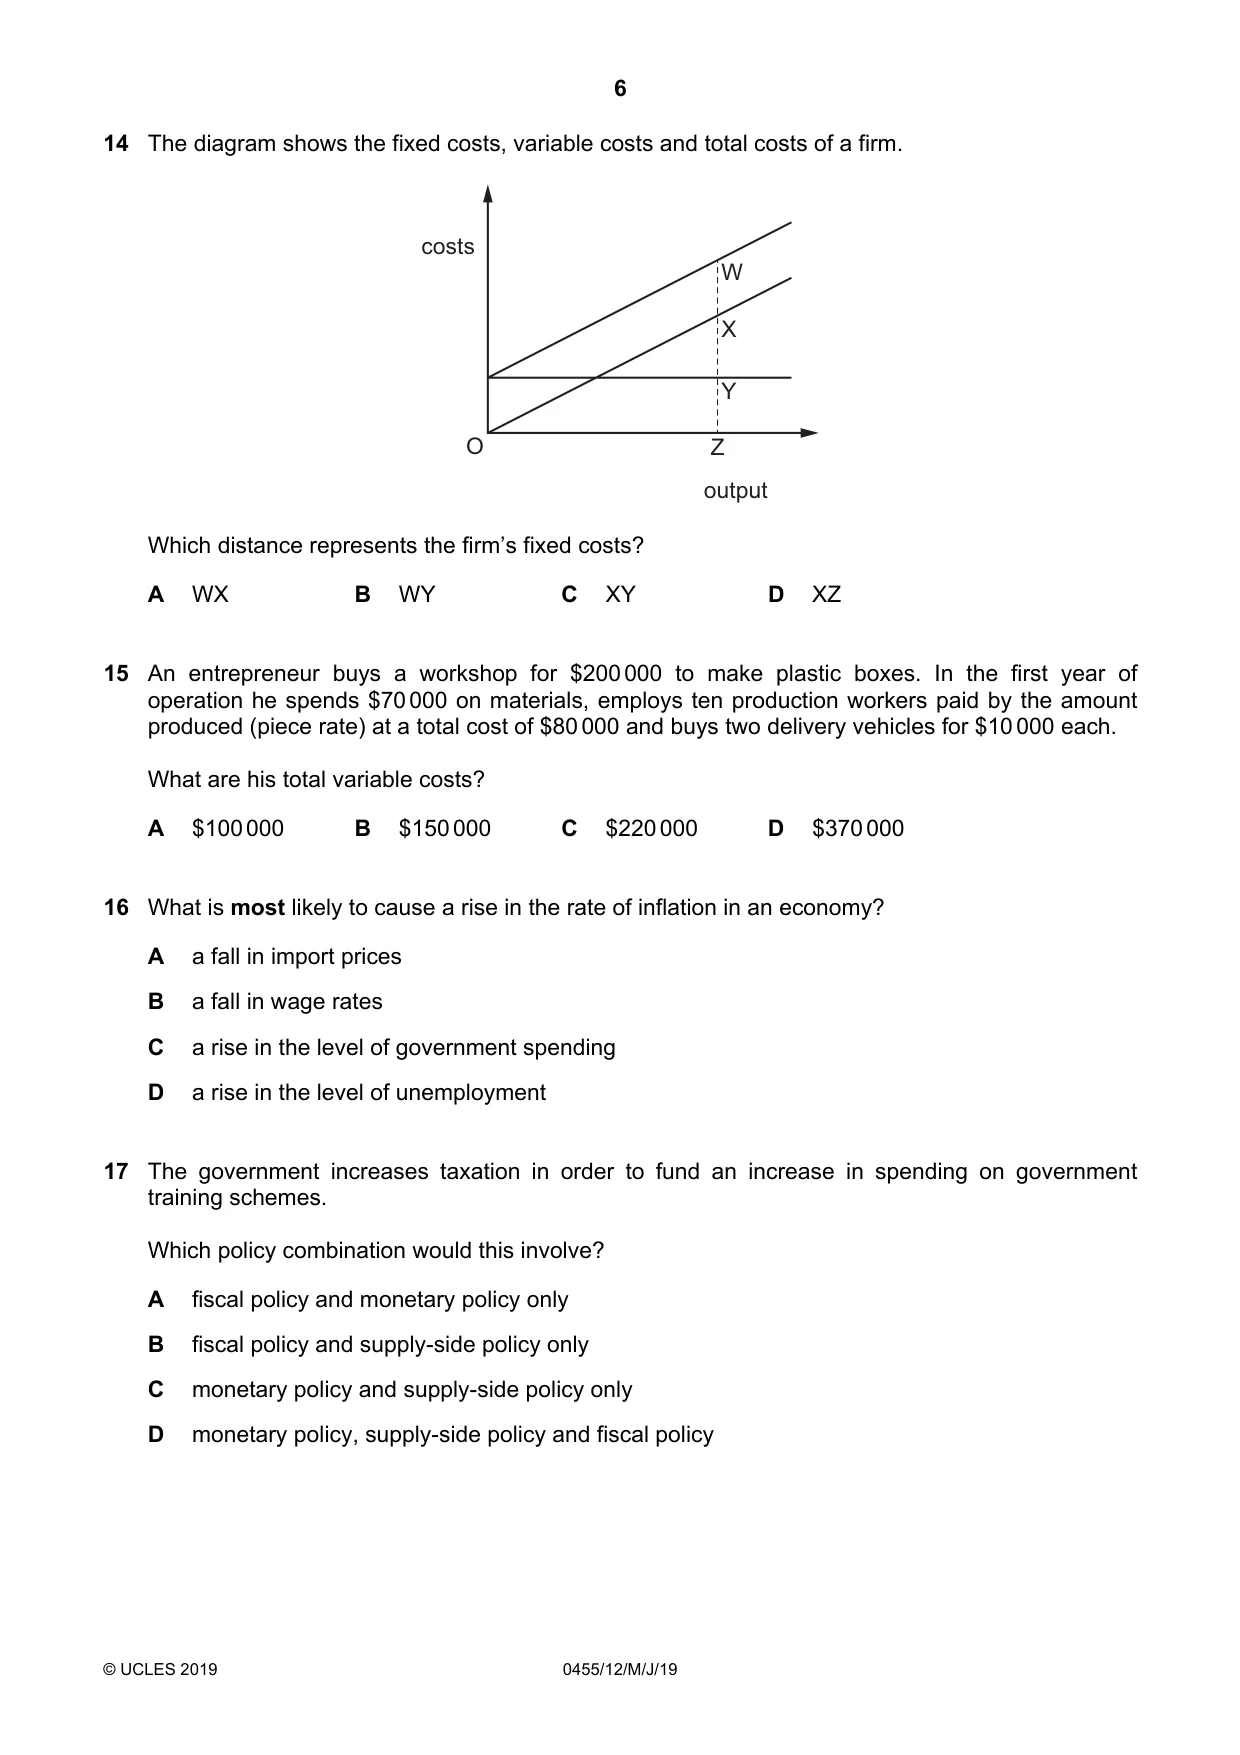
14 The diagram shows the fixed costs, variable costs and total costs of a firm. costs W X Y O Z output Which distance represents the firm’s fixed costs? A WX B WY C XY D XZ
Mark scheme: A
Q15 · An entrepreneur buys a workshop for $200 000 to make plastic boxes
15 An entrepreneur buys a workshop for $200 000 to make plastic boxes. In the first year of operation he spends $70 000 on materials, employs ten production workers paid by the amount produced (piece rate) at a total cost of $80 000 and buys two delivery vehicles for $10 000 each. What are his total variable costs? A $100 000 B $150 000 C $220 000 D $370 000
Mark scheme: B
Q16 · What is most likely to cause a rise in the rate of inflation in an economy?
16 What is most likely to cause a rise in the rate of inflation in an economy? A a fall in import prices B a fall in wage rates C a rise in the level of government spending D a rise in the level of unemployment
Mark scheme: C
Q17 · The government increases taxation in order to fund an increase in spending on government…
17 The government increases taxation in order to fund an increase in spending on government training schemes. Which policy combination would this involve? A fiscal policy and monetary policy only B fiscal policy and supply-side policy only C monetary policy and supply-side policy only D monetary policy, supply-side policy and fiscal policy
Mark scheme: B
Q18 · The diagram shows the effect of the imposition of a tax on a product
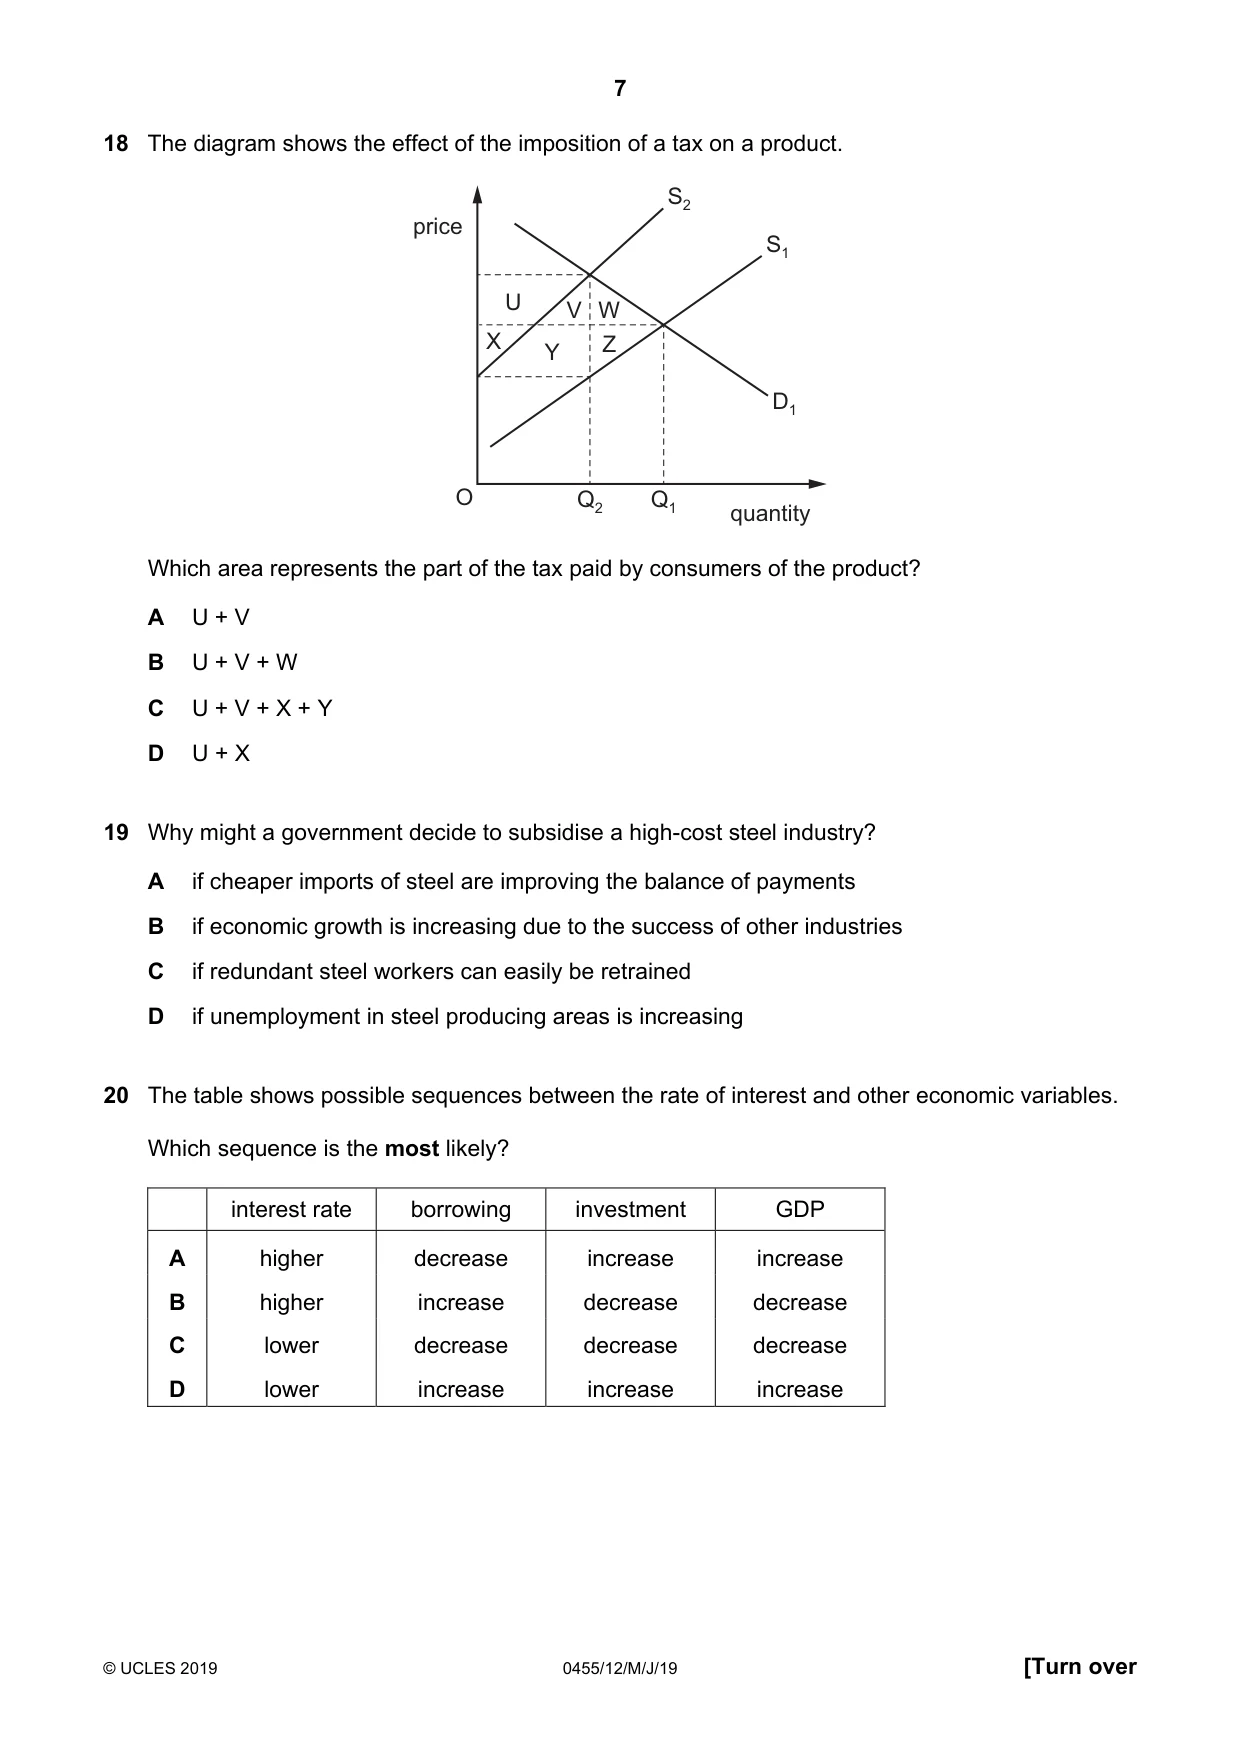
18 The diagram shows the effect of the imposition of a tax on a product. S2 price S1 U V W X Y Z D1 O Q2 Q1 quantity Which area represents the part of the tax paid by consumers of the product? A U + V B U + V + W C U + V + X + Y D U + X
Mark scheme: A
Q19 · Why might a government decide to subsidise a high-cost steel industry?
19 Why might a government decide to subsidise a high-cost steel industry? A if cheaper imports of steel are improving the balance of payments B if economic growth is increasing due to the success of other industries C if redundant steel workers can easily be retrained D if unemployment in steel producing areas is increasing
Mark scheme: D
Q20 · The table shows possible sequences between the rate of interest and other economic…
20 The table shows possible sequences between the rate of interest and other economic variables. Which sequence is the most likely? interest rate borrowing investment GDP A higher decrease increase increase B higher increase decrease decrease C lower decrease decrease decrease D lower increase increase increase
Mark scheme: D
Q21 · Why is the Human Development Index (HDI) a better measure of living standards than GDP…
21 Why is the Human Development Index (HDI) a better measure of living standards than GDP per head? A It takes into account changes in output. B It takes into account changes in population. C It takes into account health and education data. D It takes into account inflation.
Mark scheme: C
Q22 · What describes frictional unemployment?
22 What describes frictional unemployment? A unemployment caused by a general fall in economic activity B unemployment caused by the time of year C unemployment caused by wages being too high D unemployment caused by workers searching for jobs
Mark scheme: D
Q23 · In January 2016 the rate of inflation in a country changed from 3% to 2%
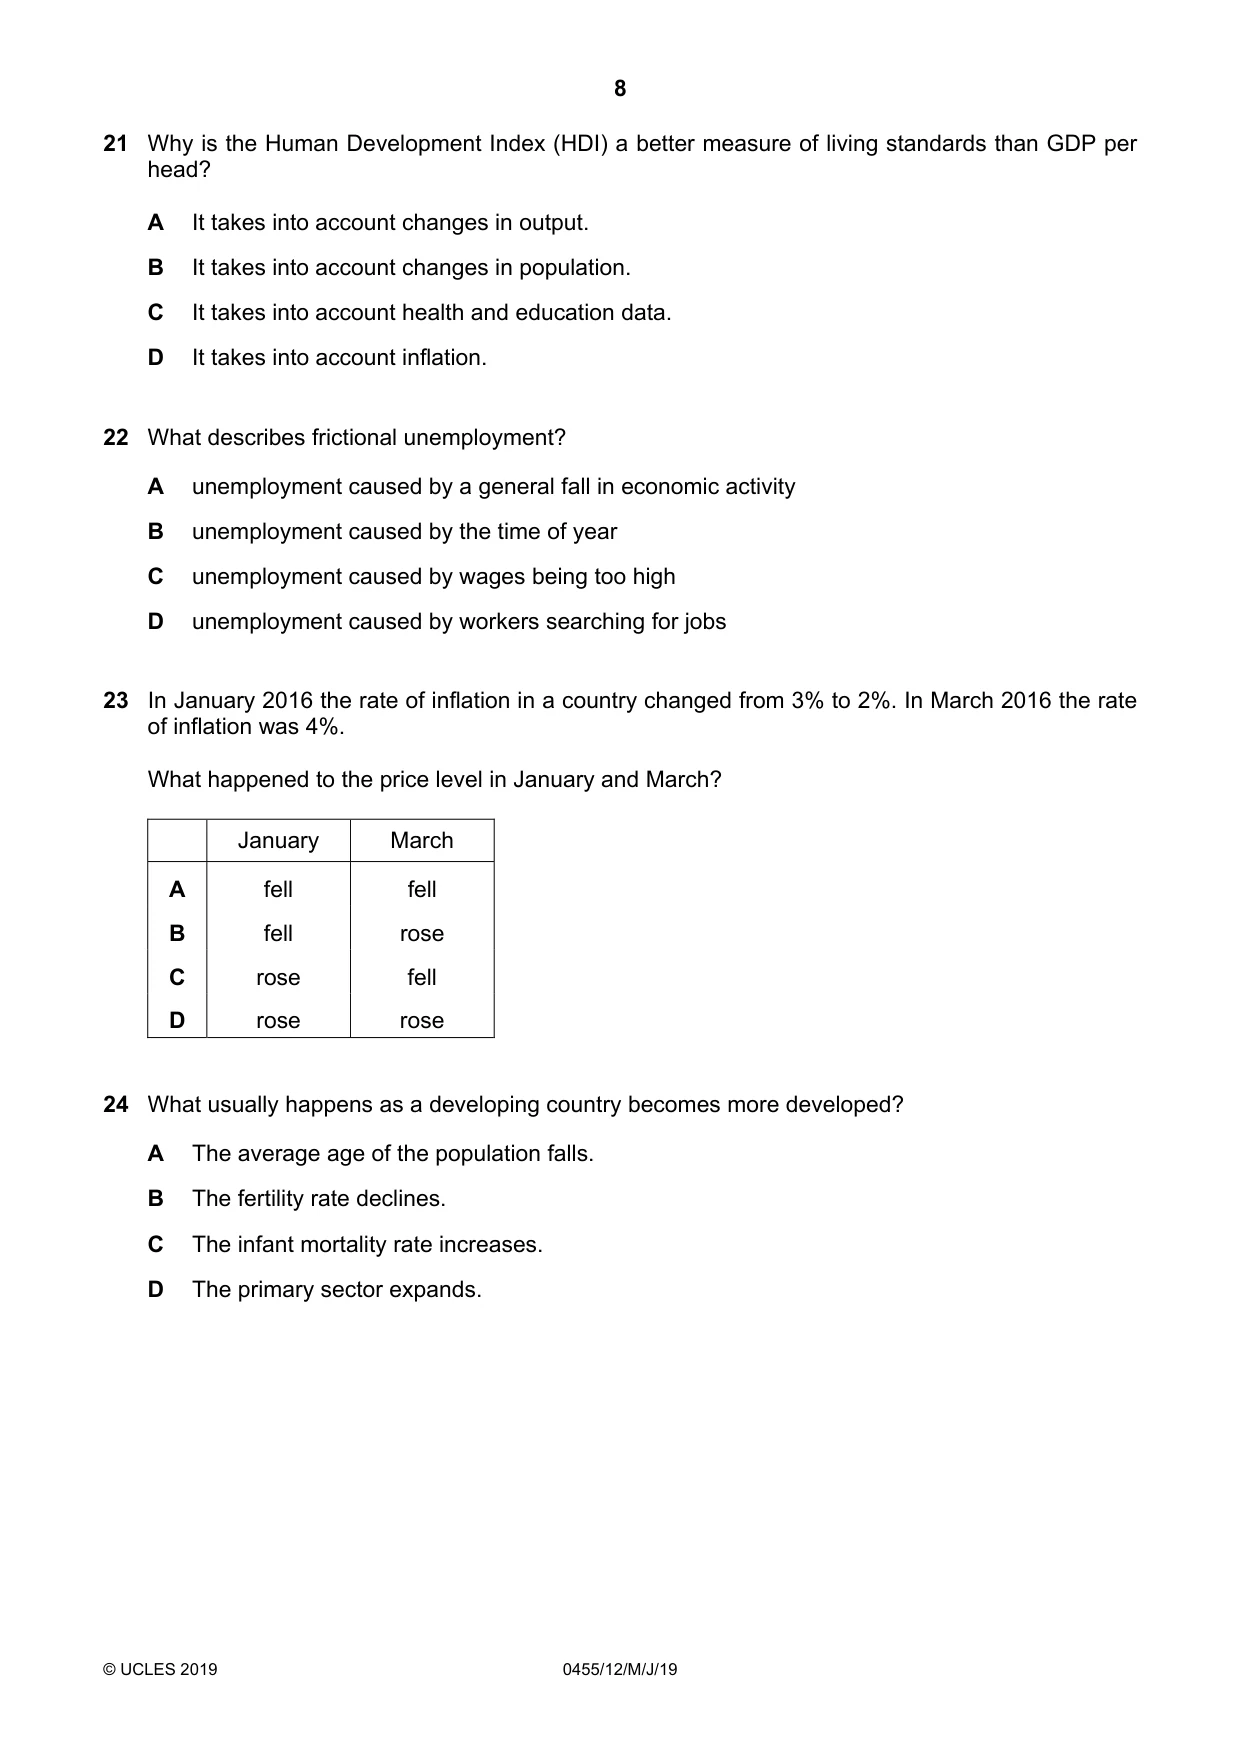
23 In January 2016 the rate of inflation in a country changed from 3% to 2%. In March 2016 the rate of inflation was 4%. What happened to the price level in January and March? January March A fell fell B fell rose C rose fell D rose rose
Mark scheme: D
Q24 · What usually happens as a developing country becomes more developed?
24 What usually happens as a developing country becomes more developed? A The average age of the population falls. B The fertility rate declines. C The infant mortality rate increases. D The primary sector expands.
Mark scheme: B
Q25 · Given the following information, which country is most likely to have the highest…
25 Given the following information, which country is most likely to have the highest standard of living? birth death life infant rate rate expectancy mortality rate A Bangladesh 27 10 58 93 B Bhutan 36 14 53 107 C Botswana 31 21 40 57 D Brunei 25 5 72 22
Mark scheme: D
Q26 · In a country the birth rate increased but the population decreased
26 In a country the birth rate increased but the population decreased. What could have happened to other factors to cause this? A a fall in infant mortality but no change in the death rate B a rise in net immigration but no change in the death rate C no change in migration but the death rate rose D the death rate fell with no change in migration
Mark scheme: C
Q27 · The US government decides to reduce the size of the quota on a good it buys from China
27 The US government decides to reduce the size of the quota on a good it buys from China. What is likely to happen? A The good will become cheaper in the US. B The US balance of trade will worsen. C The US government’s revenue will decline. D There will be less of the good imported into the US.
Mark scheme: D
Q28 · The world demand for oil is price-inelastic and oil is paid for in US dollars
28 The world demand for oil is price-inelastic and oil is paid for in US dollars. If the price of oil falls rapidly, how might it affect the exchange rate of the US dollar? market for US dollar exchange rate for US dollar A greater demand for US$ value increases B greater supply of US$ value falls C less demand for US$ value falls D less supply of US$ value increases
Mark scheme: C
Q29 · What is the most likely disadvantage of international specialisation?
29 What is the most likely disadvantage of international specialisation? A decreased levels of global output B increased average production costs C increased productivity levels D overdependence on other economies
Mark scheme: D
Q30 · A large amount of the agricultural products in a country were damaged by floods
30 A large amount of the agricultural products in a country were damaged by floods. What is likely to have happened to the price of agricultural products and the volume of imports of agricultural products? price of products volume of imports A fall fall B fall rise C rise fall D rise rise
Mark scheme: D
What was in this paper
The subtopics covered by these 30 questions, and how many questions each got. Open one in a new tab to see every Cambridge question on it.
3Employment and unemployment2Firms and production2Inflation and deflation2Living standards2Market failure2Monetary policy2Population2Demand1Fiscal policy1Foreign exchange rates1Globalisation, free trade and protection1Households1International specialisation1Market economic system1Opportunity cost1Price determination1Price elasticity of demand (PED)1Production possibility curve (PPC) diagrams1The factors of production1Workers1What you needed in this session
Cambridge’s own grade thresholds for 2019 May/June, Paper 1 · Variant 2. A higher threshold means an easier paper — the bar moves with how the cohort did.