Cambridge IGCSE Economics 0455 — 2024 May/June Paper 1 · Variant 3
0455/13/M/J/24 · 30 questions · 30 marks · ≈34 min
The question paper and its mark scheme, free to read here and free to download. This is Cambridge’s own paper, exactly as it was sat.
Question paper12 pages


Mark scheme3 pages
Answers below. Sit the paper first if you are practising.

Questions as text
Q1 · How can the economic problem be described?
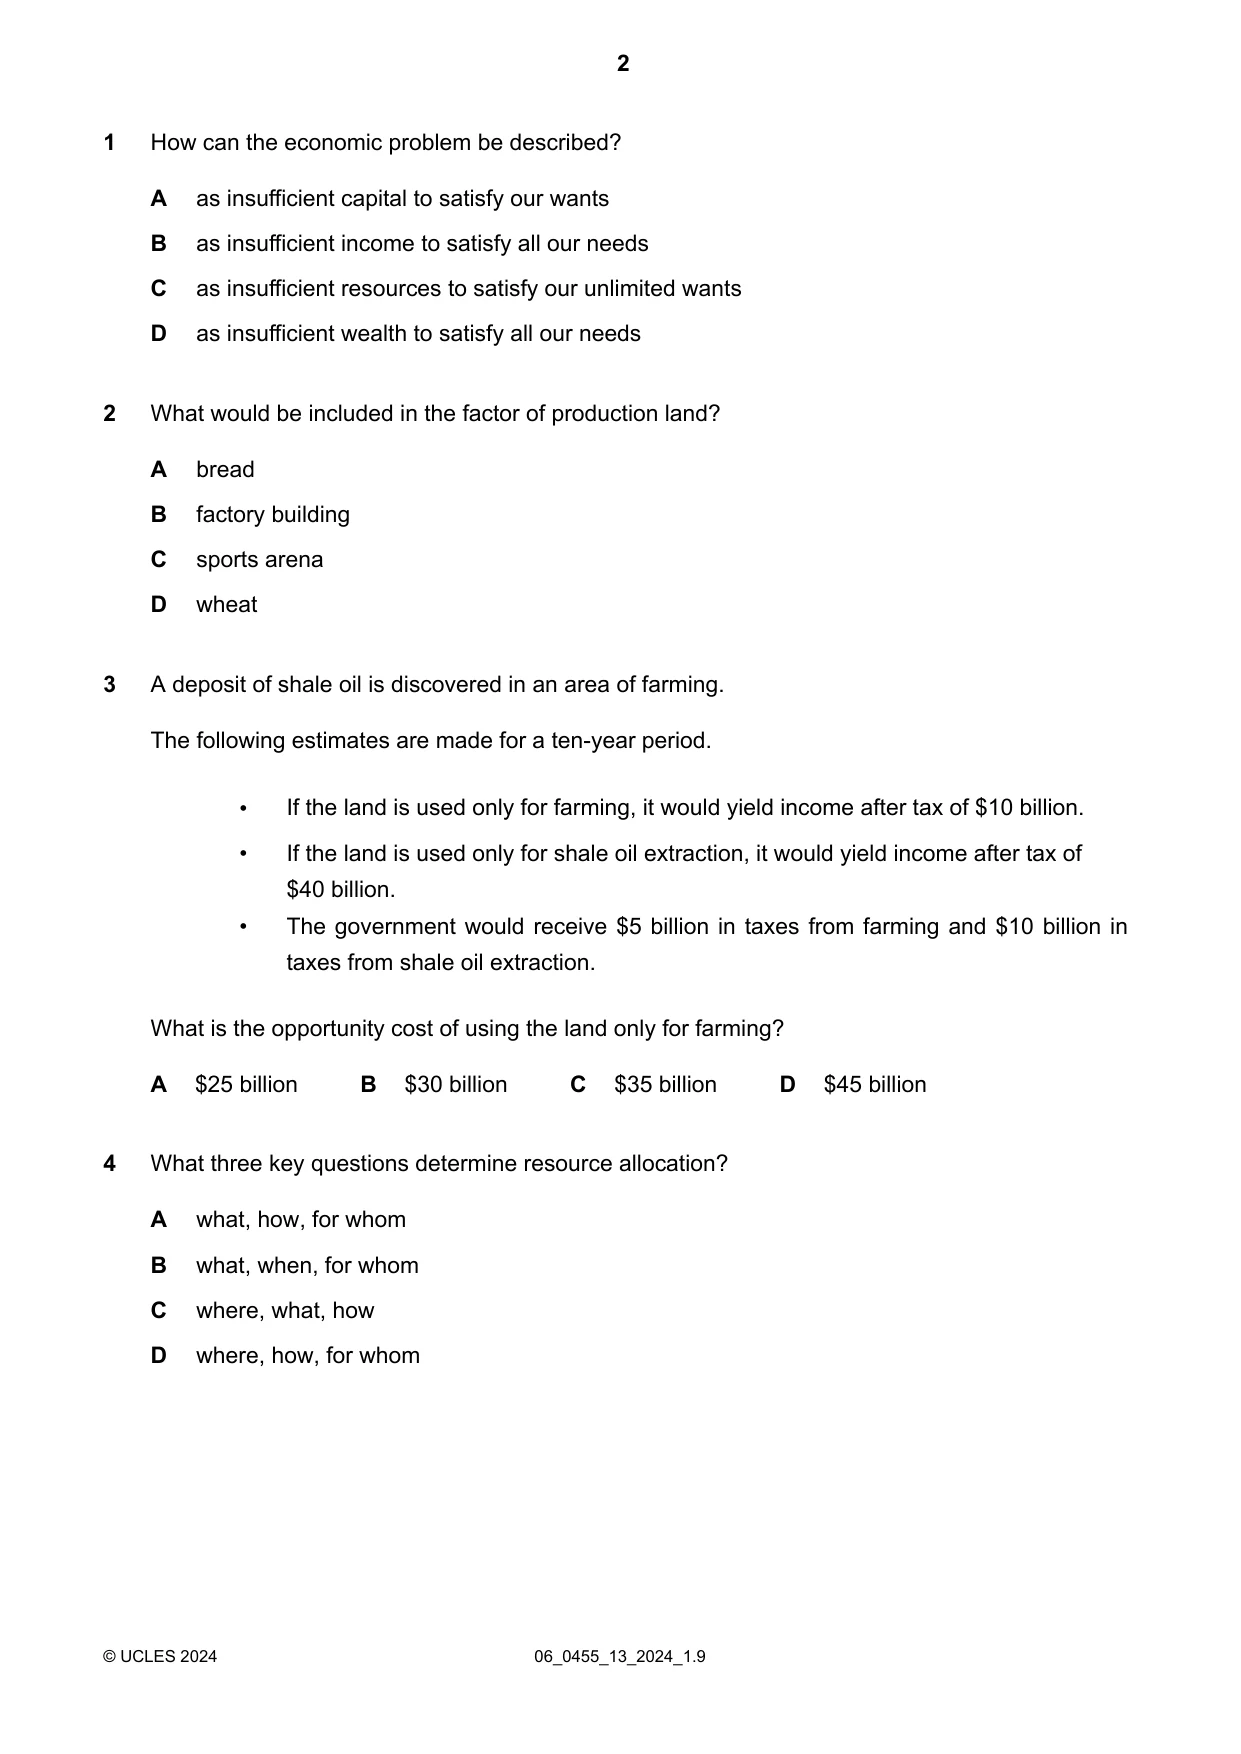
1 How can the economic problem be described? A as insufficient capital to satisfy our wants B as insufficient income to satisfy all our needs C as insufficient resources to satisfy our unlimited wants D as insufficient wealth to satisfy all our needs
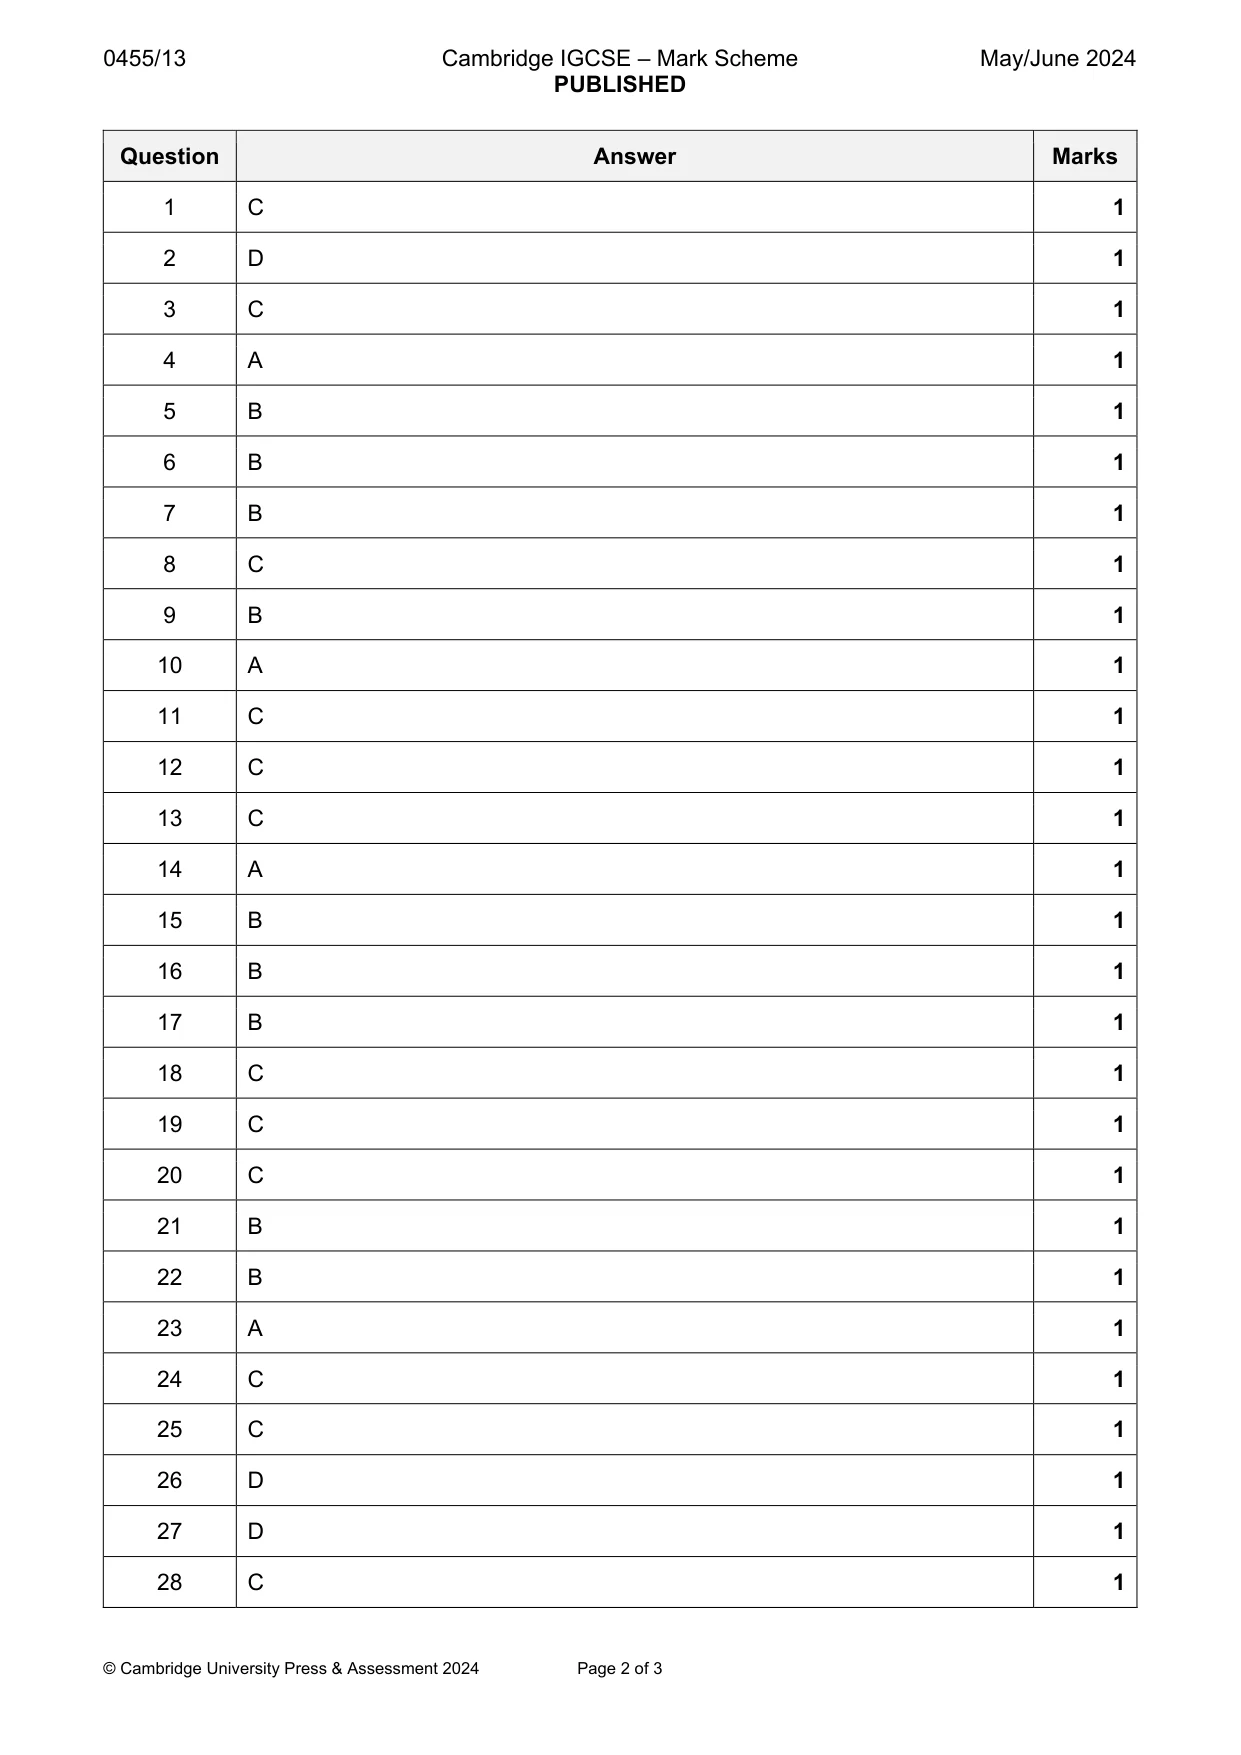
Mark scheme: C
Q2 · What would be included in the factor of production land?
2 What would be included in the factor of production land? A bread B factory building C sports arena D wheat
Mark scheme: D
Q3 · A deposit of shale oil is discovered in an area of farming
3 A deposit of shale oil is discovered in an area of farming. The following estimates are made for a ten-year period. • If the land is used only for farming, it would yield income after tax of $10 billion. • If the land is used only for shale oil extraction, it would yield income after tax of $40 billion. • The government would receive $5 billion in taxes from farming and $10 billion in taxes from shale oil extraction. What is the opportunity cost of using the land only for farming? A $25 billion B $30 billion C $35 billion D $45 billion
Mark scheme: C
Q4 · What three key questions determine resource allocation?
4 What three key questions determine resource allocation? A what, how, for whom B what, when, for whom C where, what, how D where, how, for whom
Mark scheme: A
Q5 · In the diagram, X represents the original equilibrium point in the labour market for…
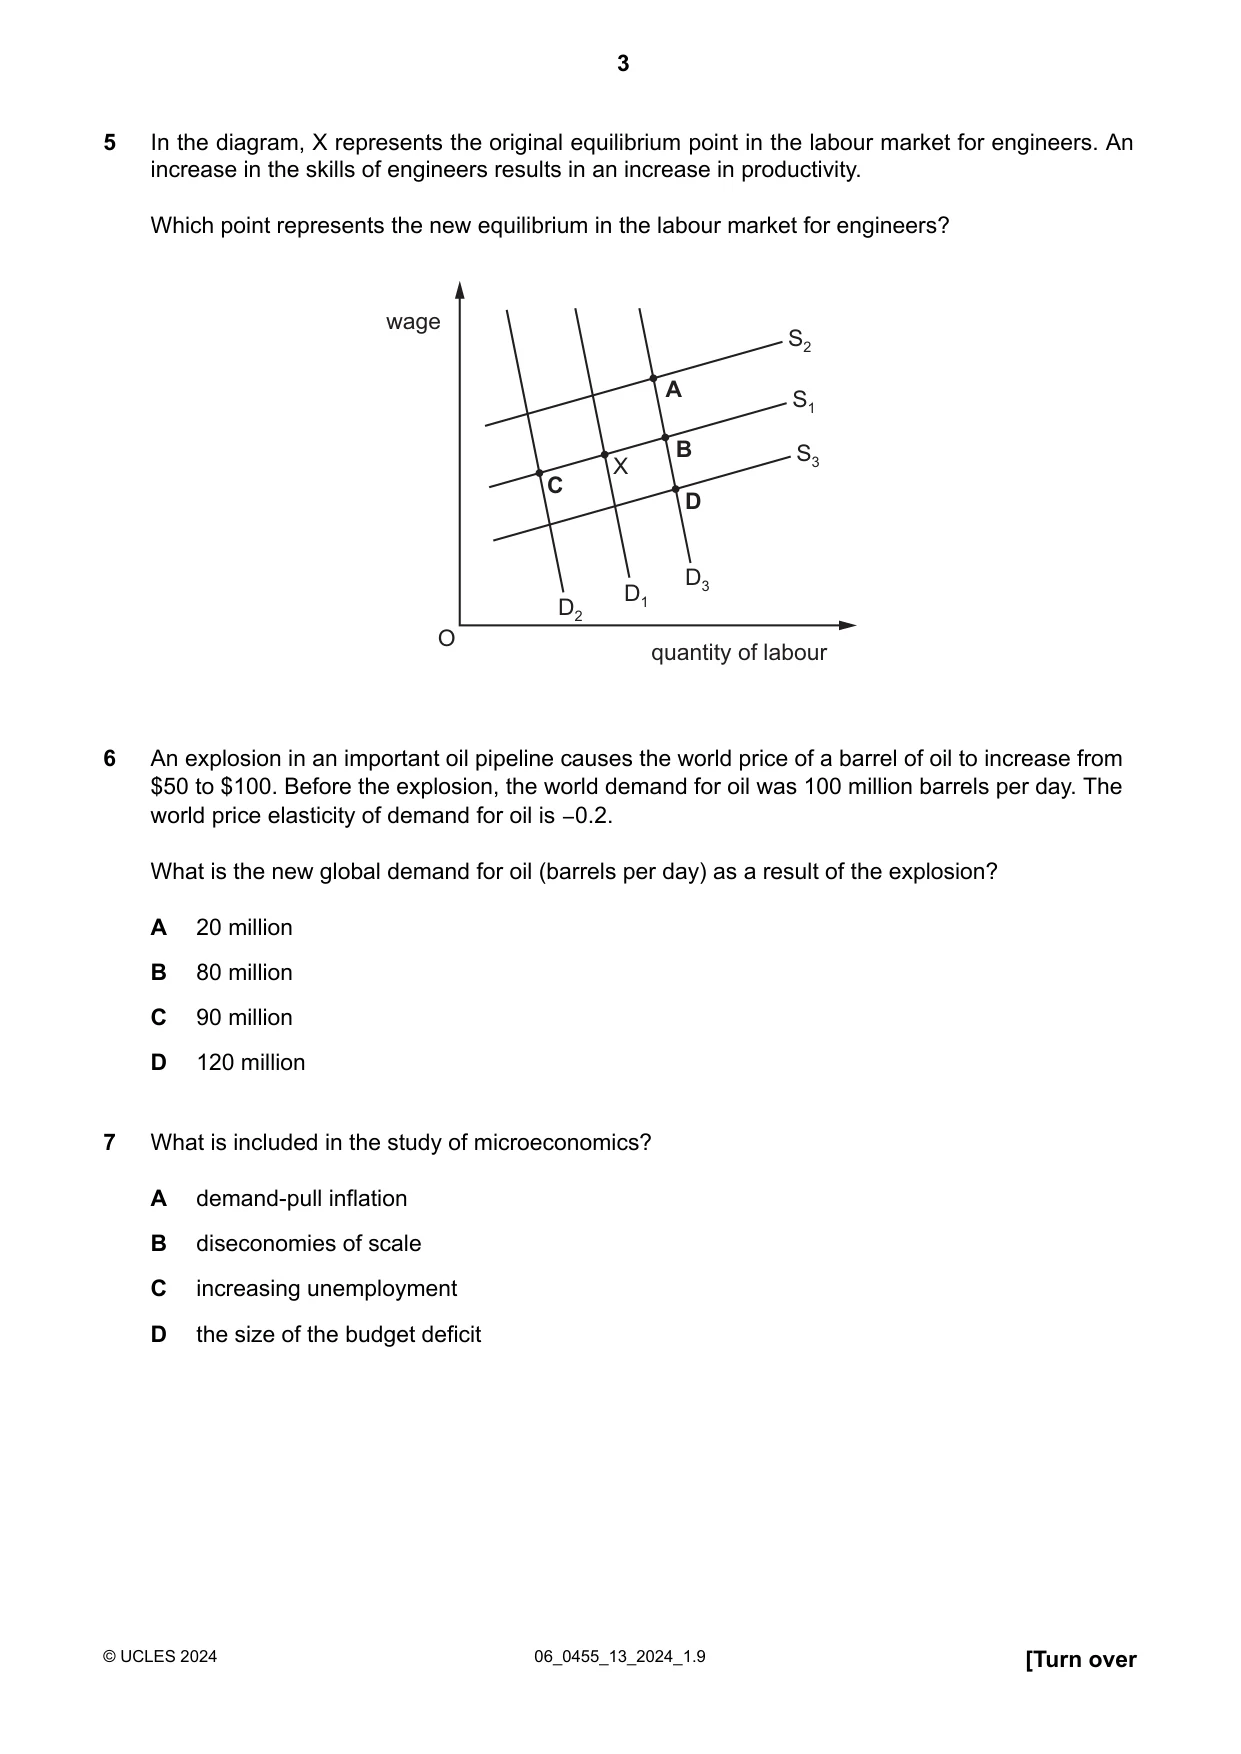
5 In the diagram, X represents the original equilibrium point in the labour market for engineers. An increase in the skills of engineers results in an increase in productivity. Which point represents the new equilibrium in the labour market for engineers? wage S2 A S1 B S3 X C D D3 D1 D2 O quantity of labour
Mark scheme: B
Q6 · An explosion in an important oil pipeline causes the world price of a barrel of oil to…
6 An explosion in an important oil pipeline causes the world price of a barrel of oil to increase from $50 to $100. Before the explosion, the world demand for oil was 100 million barrels per day. The world price elasticity of demand for oil is −0.2. What is the new global demand for oil (barrels per day) as a result of the explosion? A 20 million B 80 million C 90 million D 120 million
Mark scheme: B
Q7 · What is included in the study of microeconomics?
7 What is included in the study of microeconomics? A demand-pull inflation B diseconomies of scale C increasing unemployment D the size of the budget deficit
Mark scheme: B
Q8 · The price elasticity of supply (PES) of a product is 1.0
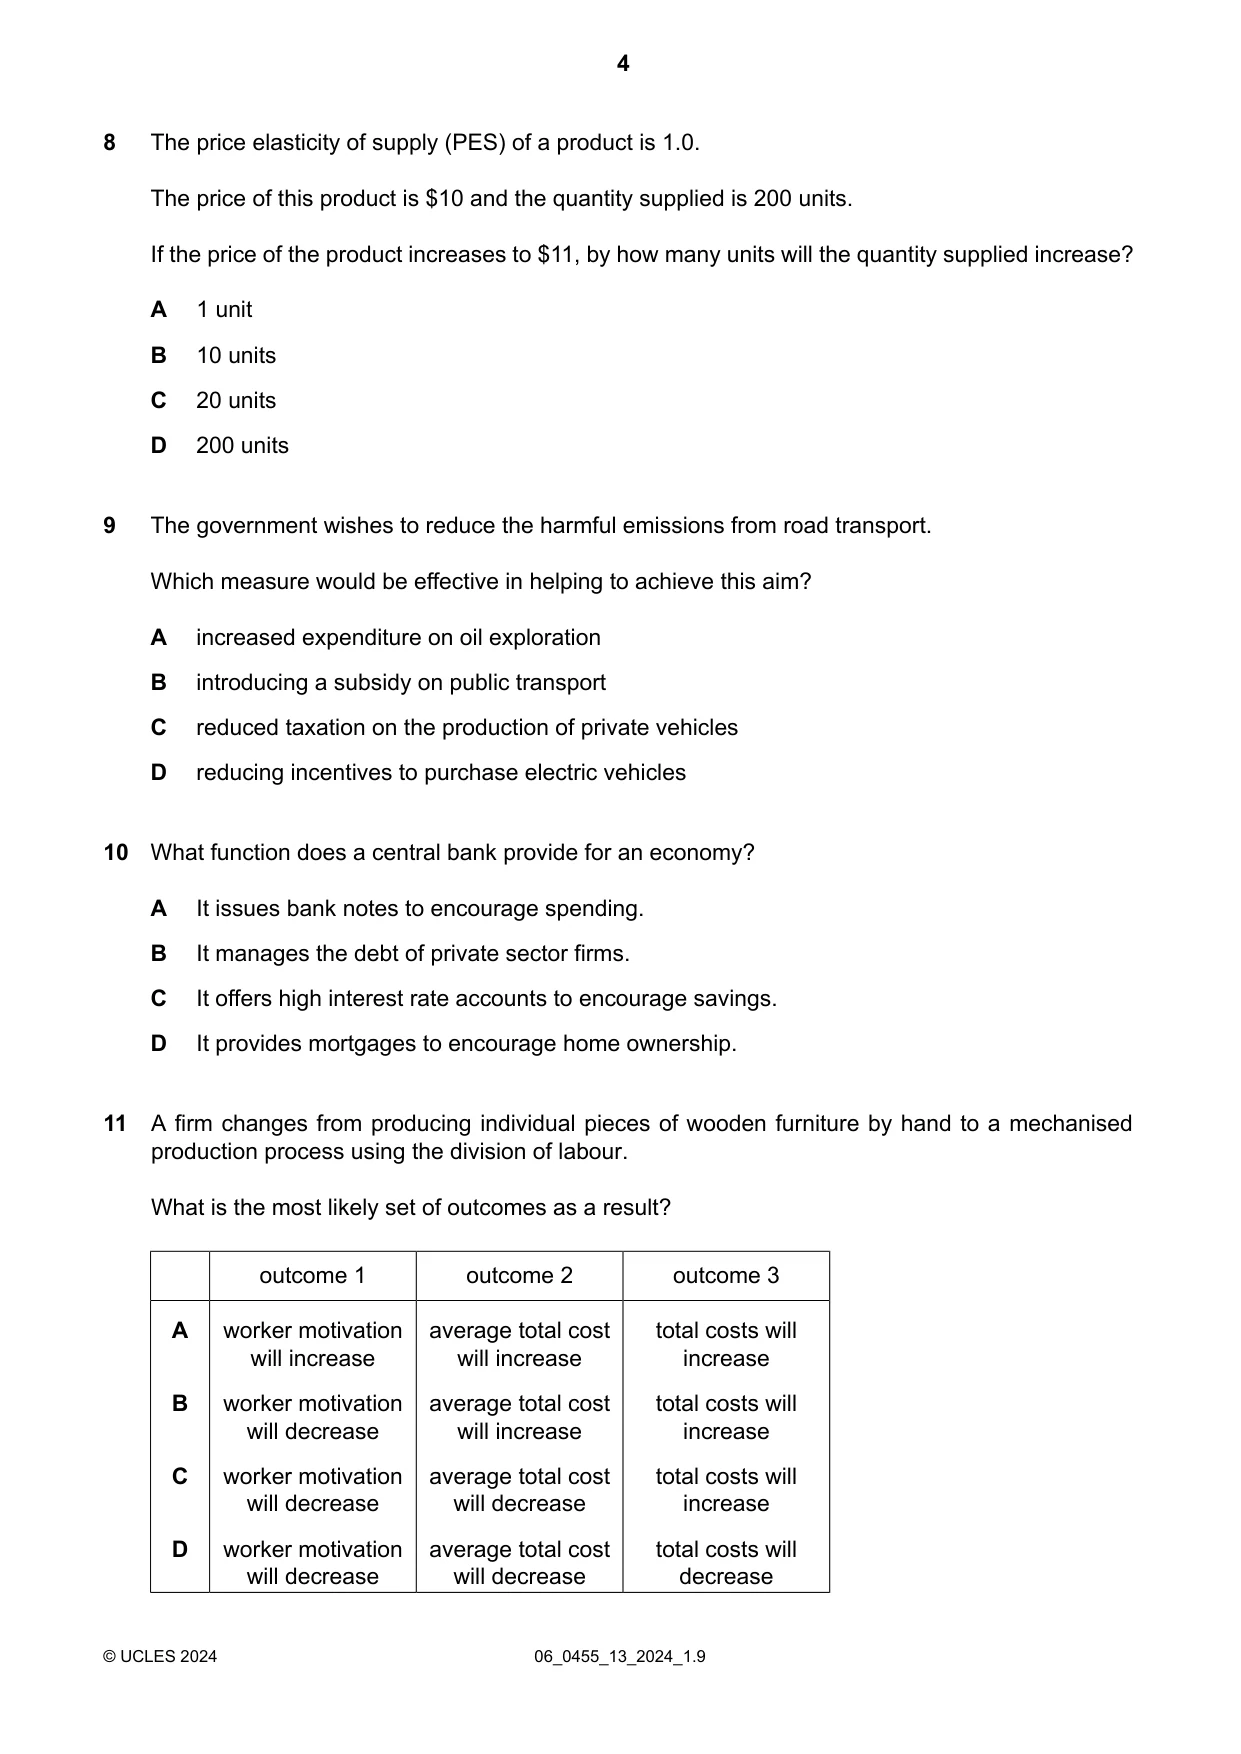
8 The price elasticity of supply (PES) of a product is 1.0. The price of this product is $10 and the quantity supplied is 200 units. If the price of the product increases to $11, by how many units will the quantity supplied increase? A 1 unit B 10 units C 20 units D 200 units
Mark scheme: C
Q9 · The government wishes to reduce the harmful emissions from road transport
9 The government wishes to reduce the harmful emissions from road transport. Which measure would be effective in helping to achieve this aim? A increased expenditure on oil exploration B introducing a subsidy on public transport C reduced taxation on the production of private vehicles D reducing incentives to purchase electric vehicles
Mark scheme: B
Q10 · What function does a central bank provide for an economy?
10 What function does a central bank provide for an economy? A It issues bank notes to encourage spending. B It manages the debt of private sector firms. C It offers high interest rate accounts to encourage savings. D It provides mortgages to encourage home ownership.
Mark scheme: A
Q11 · A firm changes from producing individual pieces of wooden furniture by hand to a…
11 A firm changes from producing individual pieces of wooden furniture by hand to a mechanised production process using the division of labour. What is the most likely set of outcomes as a result? outcome 1 outcome 2 outcome 3 A worker motivation average total cost total costs will will increase will increase increase B worker motivation average total cost total costs will will decrease will increase increase C worker motivation average total cost total costs will will decrease will decrease increase D worker motivation average total cost total costs will will decrease will decrease decrease
Mark scheme: C
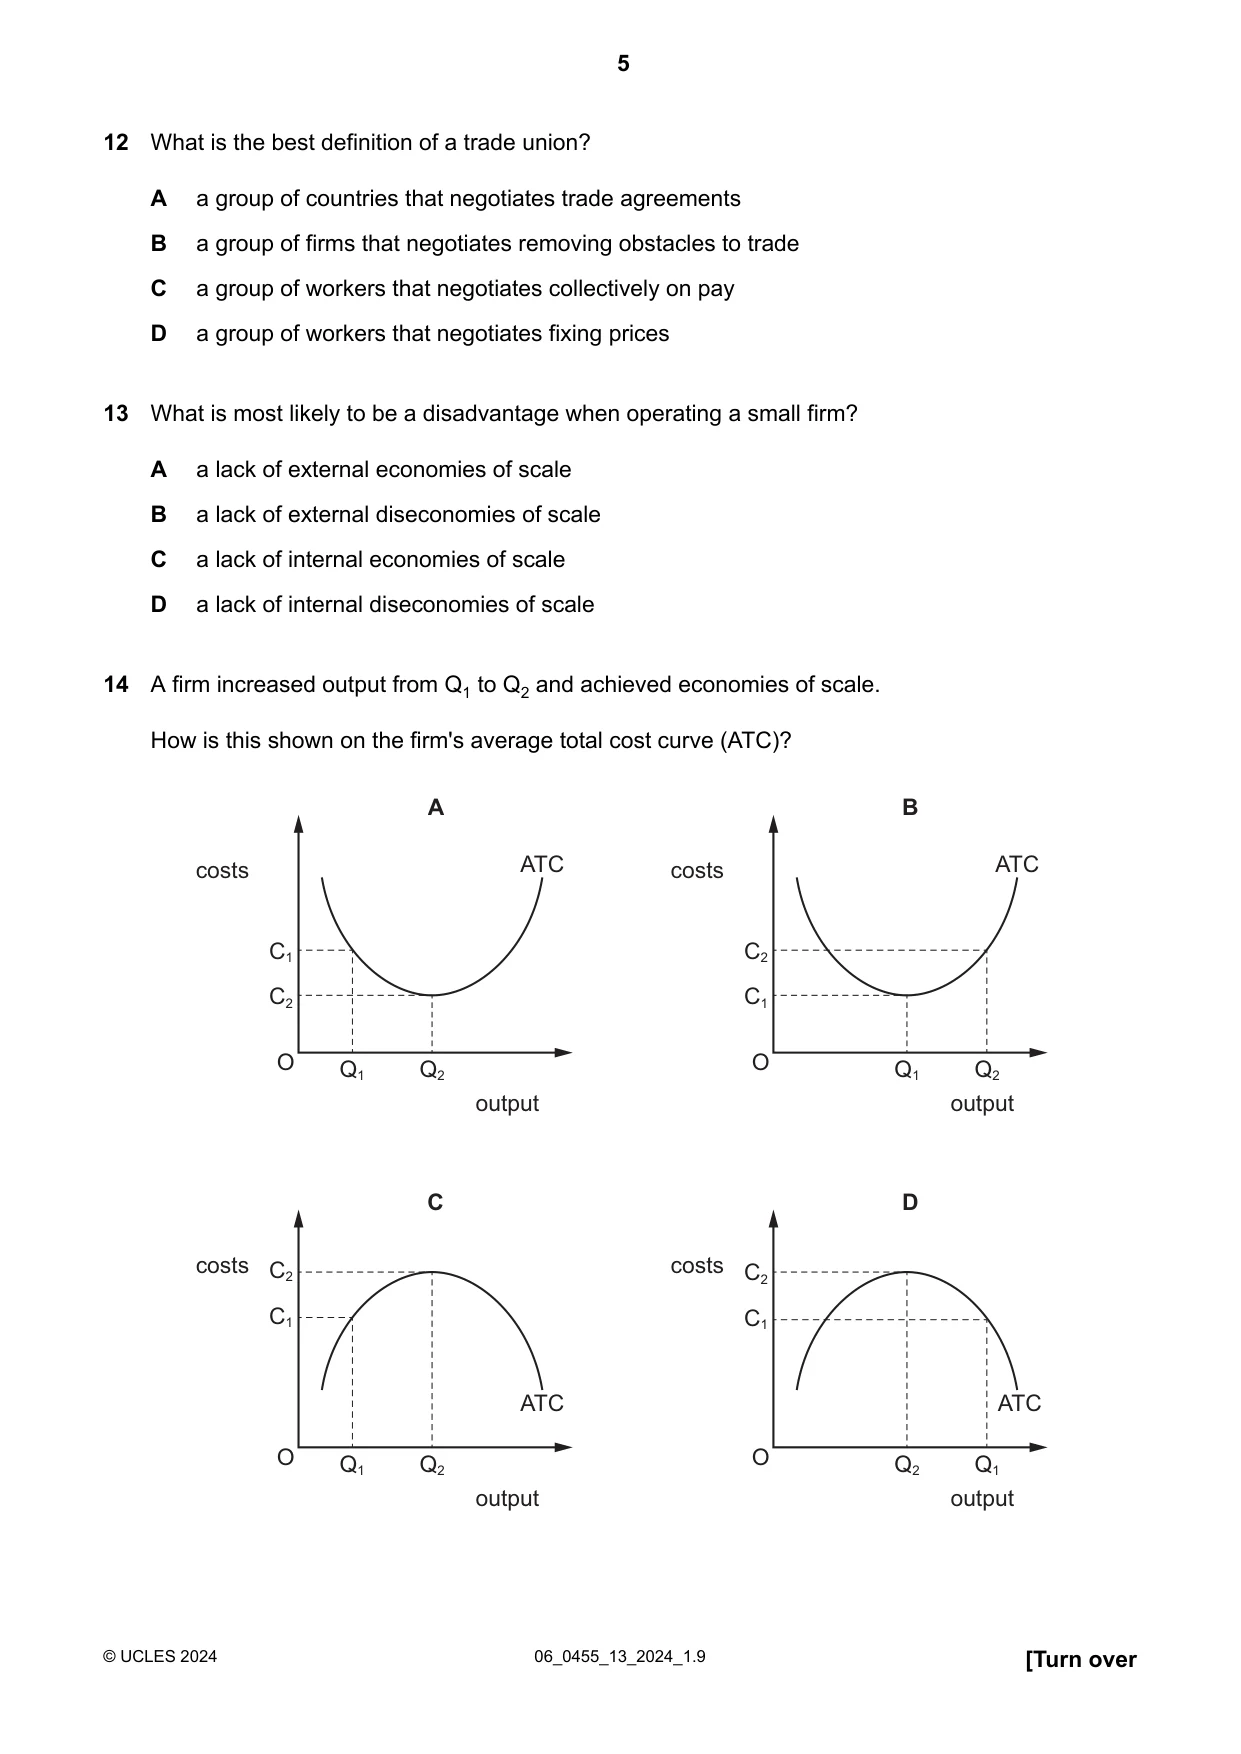
Q12 · What is the best definition of a trade union?
12 What is the best definition of a trade union? A a group of countries that negotiates trade agreements B a group of firms that negotiates removing obstacles to trade C a group of workers that negotiates collectively on pay D a group of workers that negotiates fixing prices
Mark scheme: C
Q13 · What is most likely to be a disadvantage when operating a small firm?
13 What is most likely to be a disadvantage when operating a small firm? A a lack of external economies of scale B a lack of external diseconomies of scale C a lack of internal economies of scale D a lack of internal diseconomies of scale
Mark scheme: C
Q14 · A firm increased output from Q1 to Q2 and achieved economies of scale
14 A firm increased output from Q1 to Q2 and achieved economies of scale. How is this shown on the firm's average total cost curve (ATC)? A B costs ATC costs ATC C1 C2 C2 C1 O Q1 Q2 O Q1 Q2 output output C D costs C2 costs C2 C1 C1 ATC ATC O Q1 Q2 O Q2 Q1 output output
Mark scheme: A
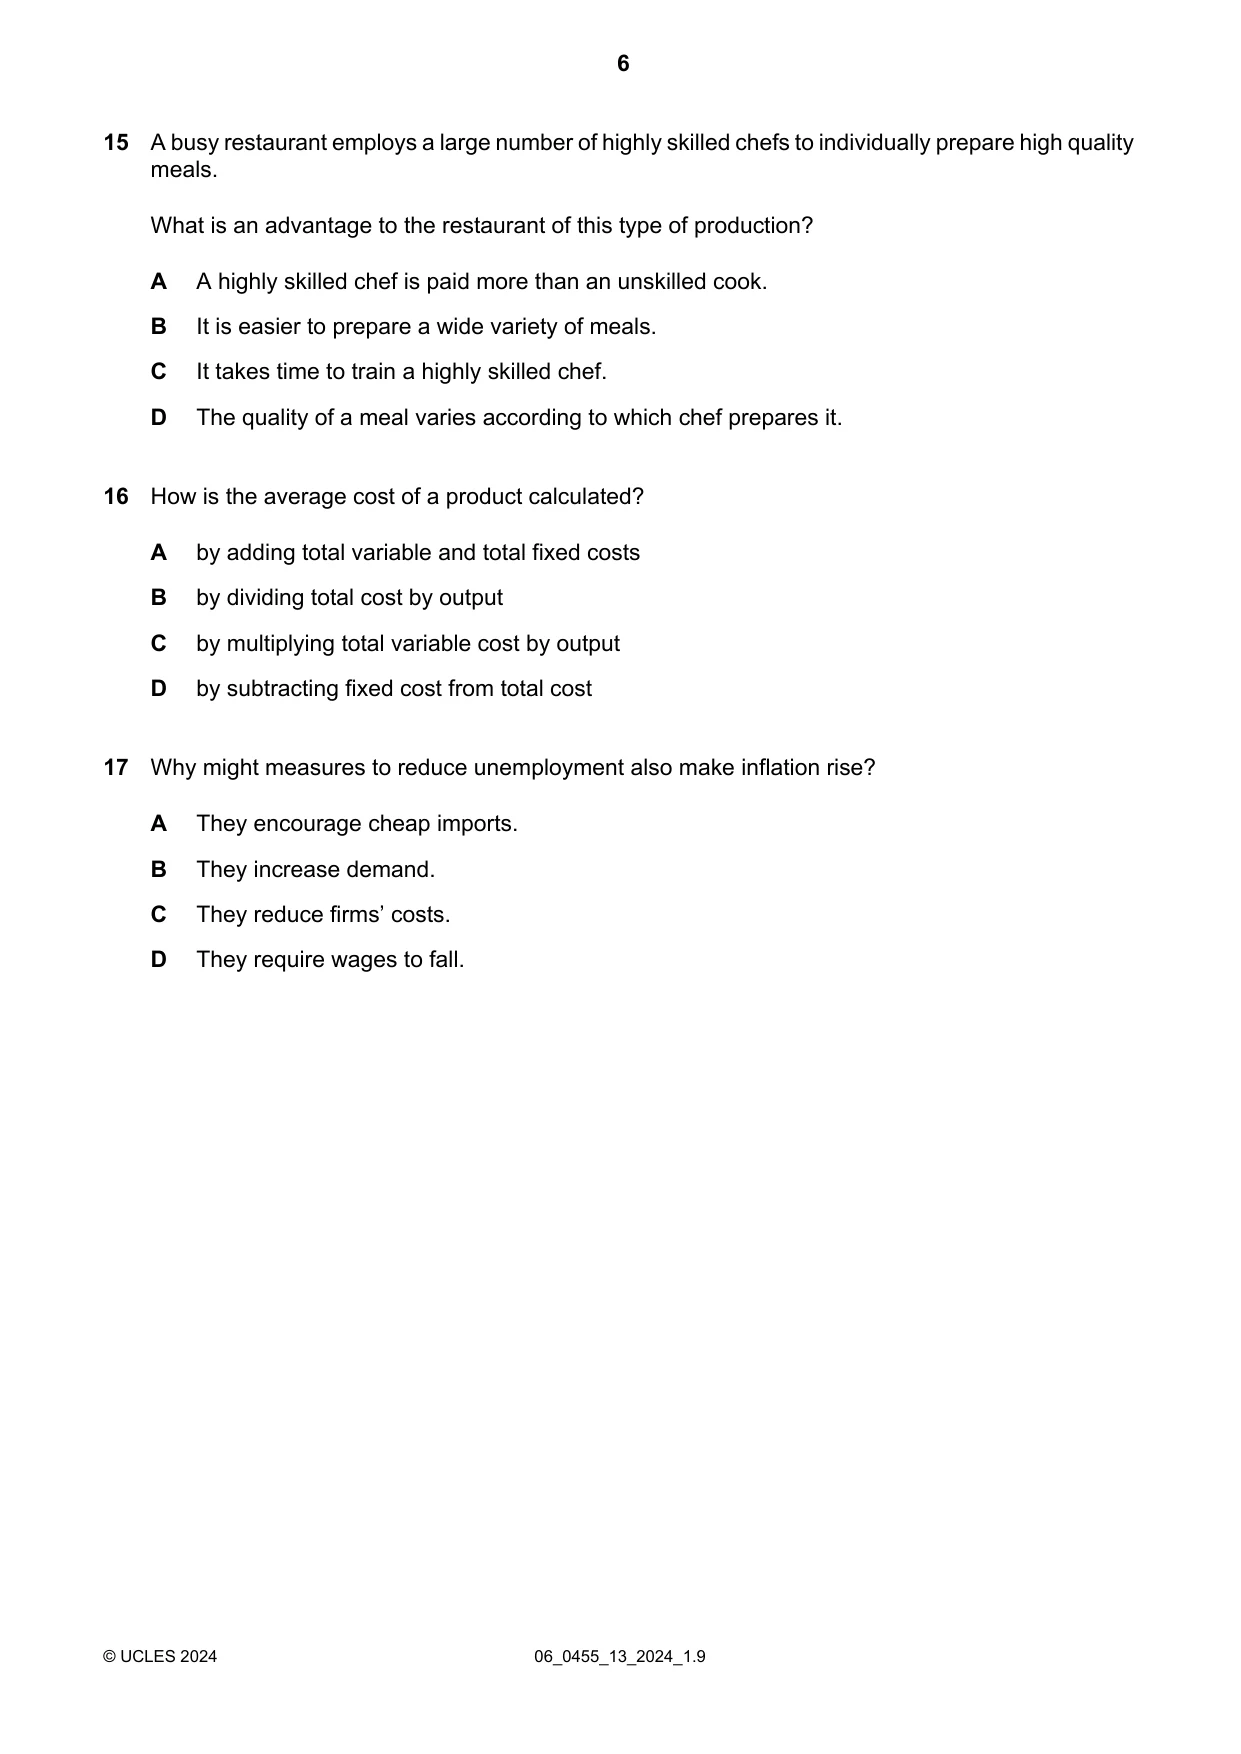
Q15 · A busy restaurant employs a large number of highly skilled chefs to individually prepare…
15 A busy restaurant employs a large number of highly skilled chefs to individually prepare high quality meals. What is an advantage to the restaurant of this type of production? A A highly skilled chef is paid more than an unskilled cook. B It is easier to prepare a wide variety of meals. C It takes time to train a highly skilled chef. D The quality of a meal varies according to which chef prepares it.
Mark scheme: B
Q16 · How is the average cost of a product calculated?
16 How is the average cost of a product calculated? A by adding total variable and total fixed costs B by dividing total cost by output C by multiplying total variable cost by output D by subtracting fixed cost from total cost
Mark scheme: B
Q17 · Why might measures to reduce unemployment also make inflation rise?
17 Why might measures to reduce unemployment also make inflation rise? A They encourage cheap imports. B They increase demand. C They reduce firms’ costs. D They require wages to fall.
Mark scheme: B
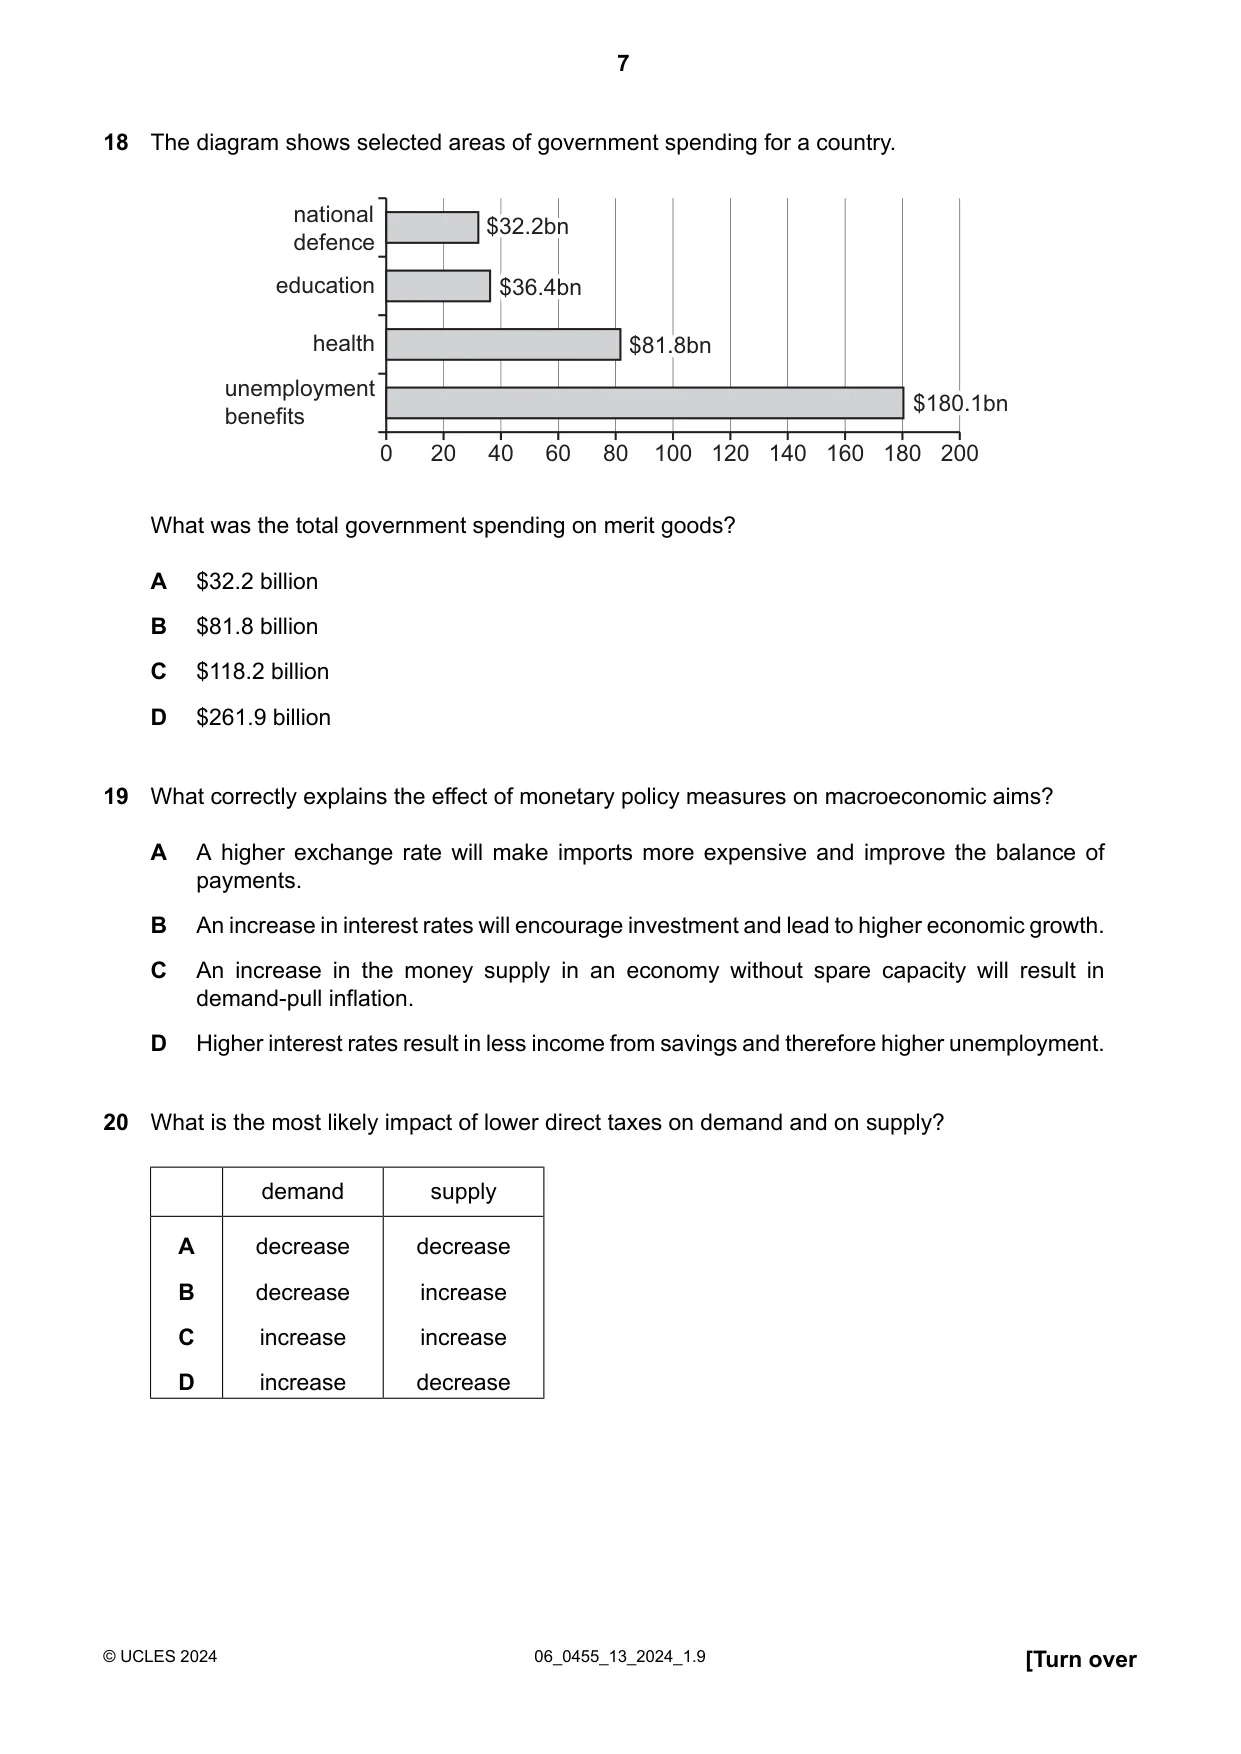
Q18 · The diagram shows selected areas of government spending for a country
18 The diagram shows selected areas of government spending for a country. national $32.2bn $32.2 bn defence education $36.4bn $36.4 bn health $81.8bn $81.8 bn unemployment $180.1bn $180.1 bn benefits 0 20 40 60 80 100 120 140 160 180 200 What was the total government spending on merit goods? A $32.2 billion B $81.8 billion C $118.2 billion D $261.9 billion
Mark scheme: C
Q19 · What correctly explains the effect of monetary policy measures on macroeconomic aims?
19 What correctly explains the effect of monetary policy measures on macroeconomic aims? A A higher exchange rate will make imports more expensive and improve the balance of payments. B An increase in interest rates will encourage investment and lead to higher economic growth. C An increase in the money supply in an economy without spare capacity will result in demand-pull inflation. D Higher interest rates result in less income from savings and therefore higher unemployment.
Mark scheme: C
Q20 · What is the most likely impact of lower direct taxes on demand and on supply?
20 What is the most likely impact of lower direct taxes on demand and on supply? demand supply A decrease decrease B decrease increase C increase increase D increase decrease
Mark scheme: C
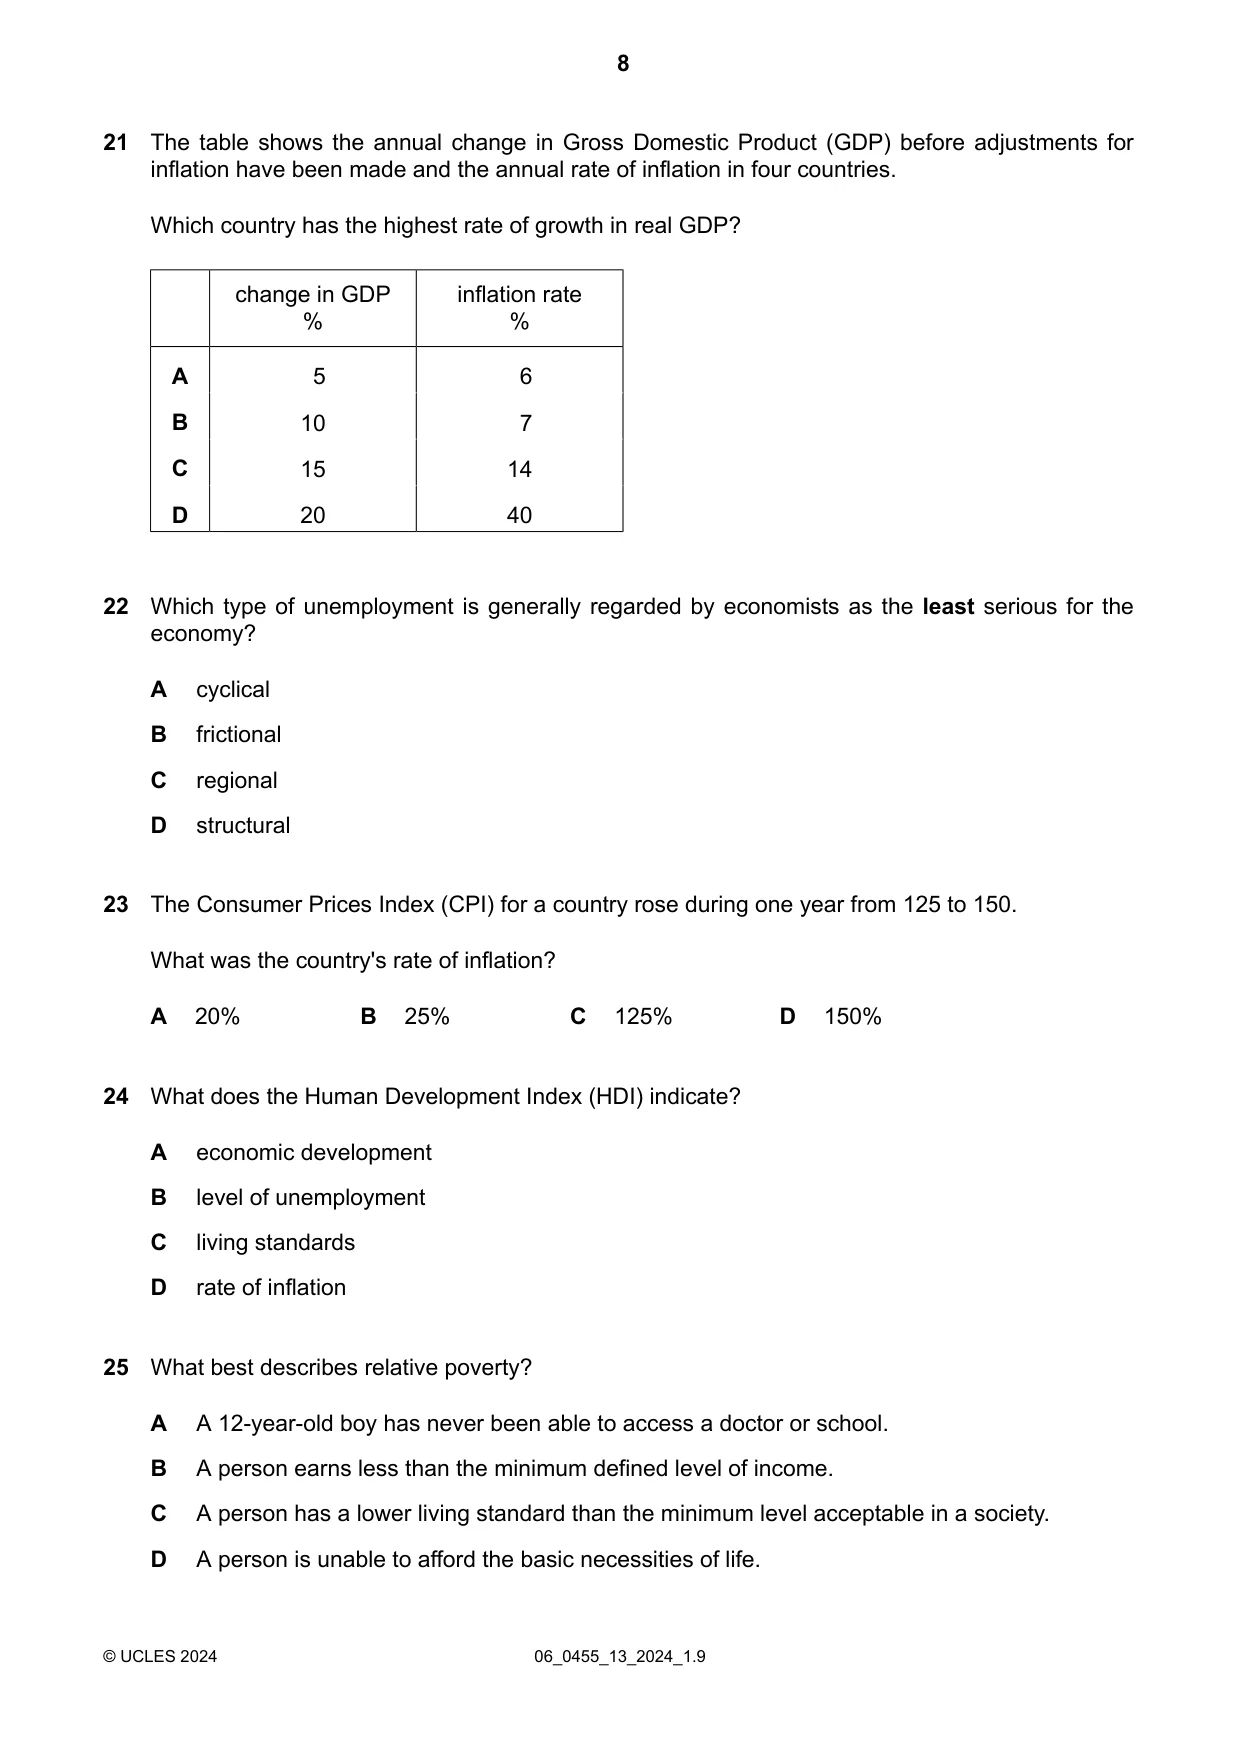
Q21 · The table shows the annual change in Gross Domestic Product (GDP) before adjustments for…
21 The table shows the annual change in Gross Domestic Product (GDP) before adjustments for inflation have been made and the annual rate of inflation in four countries. Which country has the highest rate of growth in real GDP? change in GDP inflation rate % % A 5 6 B 10 7 C 15 14 D 20 40
Mark scheme: B
Q22 · Which type of unemployment is generally regarded by economists as the least serious for…
22 Which type of unemployment is generally regarded by economists as the least serious for the economy? A cyclical B frictional C regional D structural
Mark scheme: B
Q23 · The Consumer Prices Index (CPI) for a country rose during one year from 125 to 150
23 The Consumer Prices Index (CPI) for a country rose during one year from 125 to 150. What was the country's rate of inflation? A 20% B 25% C 125% D 150%
Mark scheme: A
Q24 · What does the Human Development Index (HDI) indicate?
24 What does the Human Development Index (HDI) indicate? A economic development B level of unemployment C living standards D rate of inflation
Mark scheme: C
More questions on Differences in economic development between countries
Q25 · What best describes relative poverty?
25 What best describes relative poverty? A A 12-year-old boy has never been able to access a doctor or school. B A person earns less than the minimum defined level of income. C A person has a lower living standard than the minimum level acceptable in a society. D A person is unable to afford the basic necessities of life.
Mark scheme: C
Q26 · The table shows population statistics for three countries in a particular year
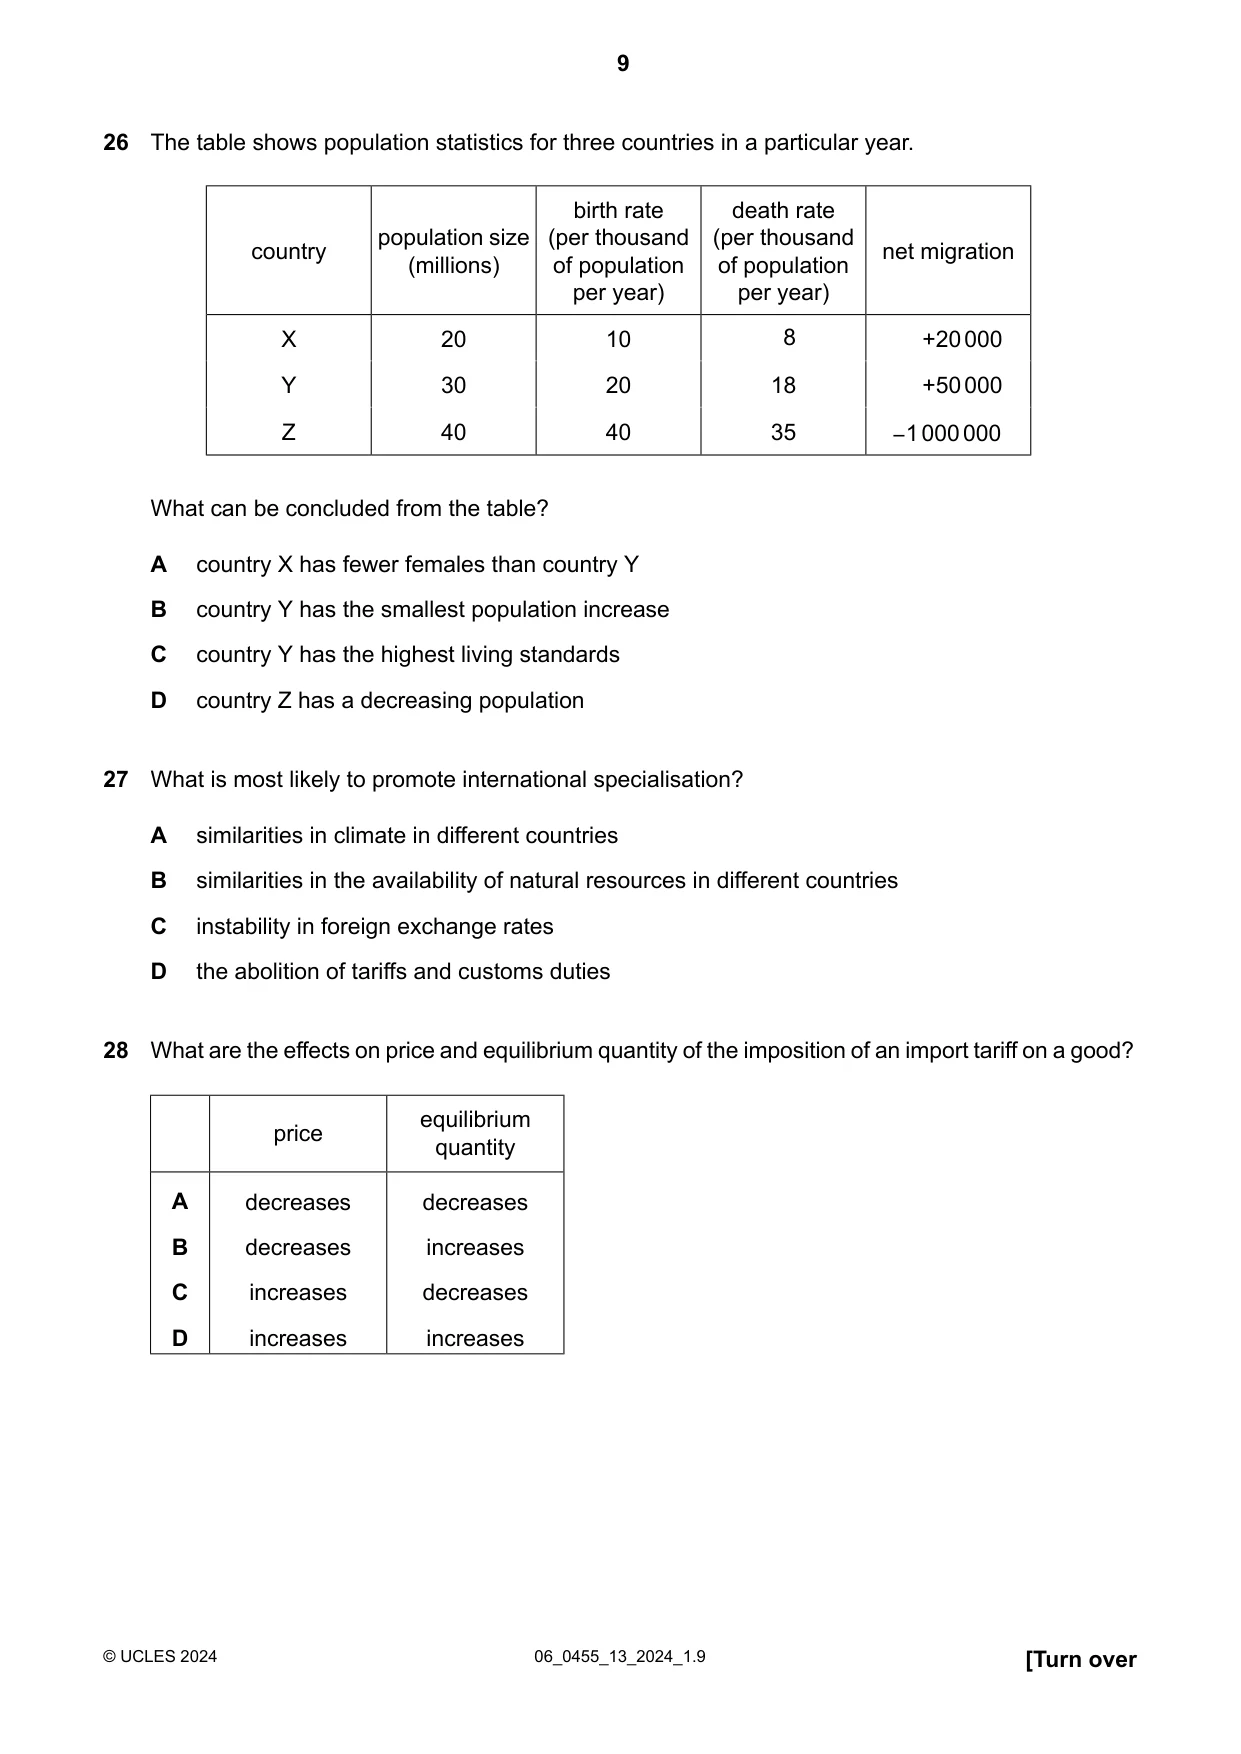
26 The table shows population statistics for three countries in a particular year. birth rate death rate population size (per thousand (per thousand country net migration (millions) of population of population per year) per year) X 20 10 8 +20 000 Y 30 20 18 +50 000 Z 40 40 35 −1 000 000 What can be concluded from the table? A country X has fewer females than country Y B country Y has the smallest population increase C country Y has the highest living standards D country Z has a decreasing population
Mark scheme: D
Q27 · What is most likely to promote international specialisation?
27 What is most likely to promote international specialisation? A similarities in climate in different countries B similarities in the availability of natural resources in different countries C instability in foreign exchange rates D the abolition of tariffs and customs duties
Mark scheme: D
Q28 · What are the effects on price and equilibrium quantity of the imposition of an import…
28 What are the effects on price and equilibrium quantity of the imposition of an import tariff on a good? equilibrium price quantity A decreases decreases B decreases increases C increases decreases D increases increases
Mark scheme: C
Q29 · The diagram shows the market for the Indian rupee in US$
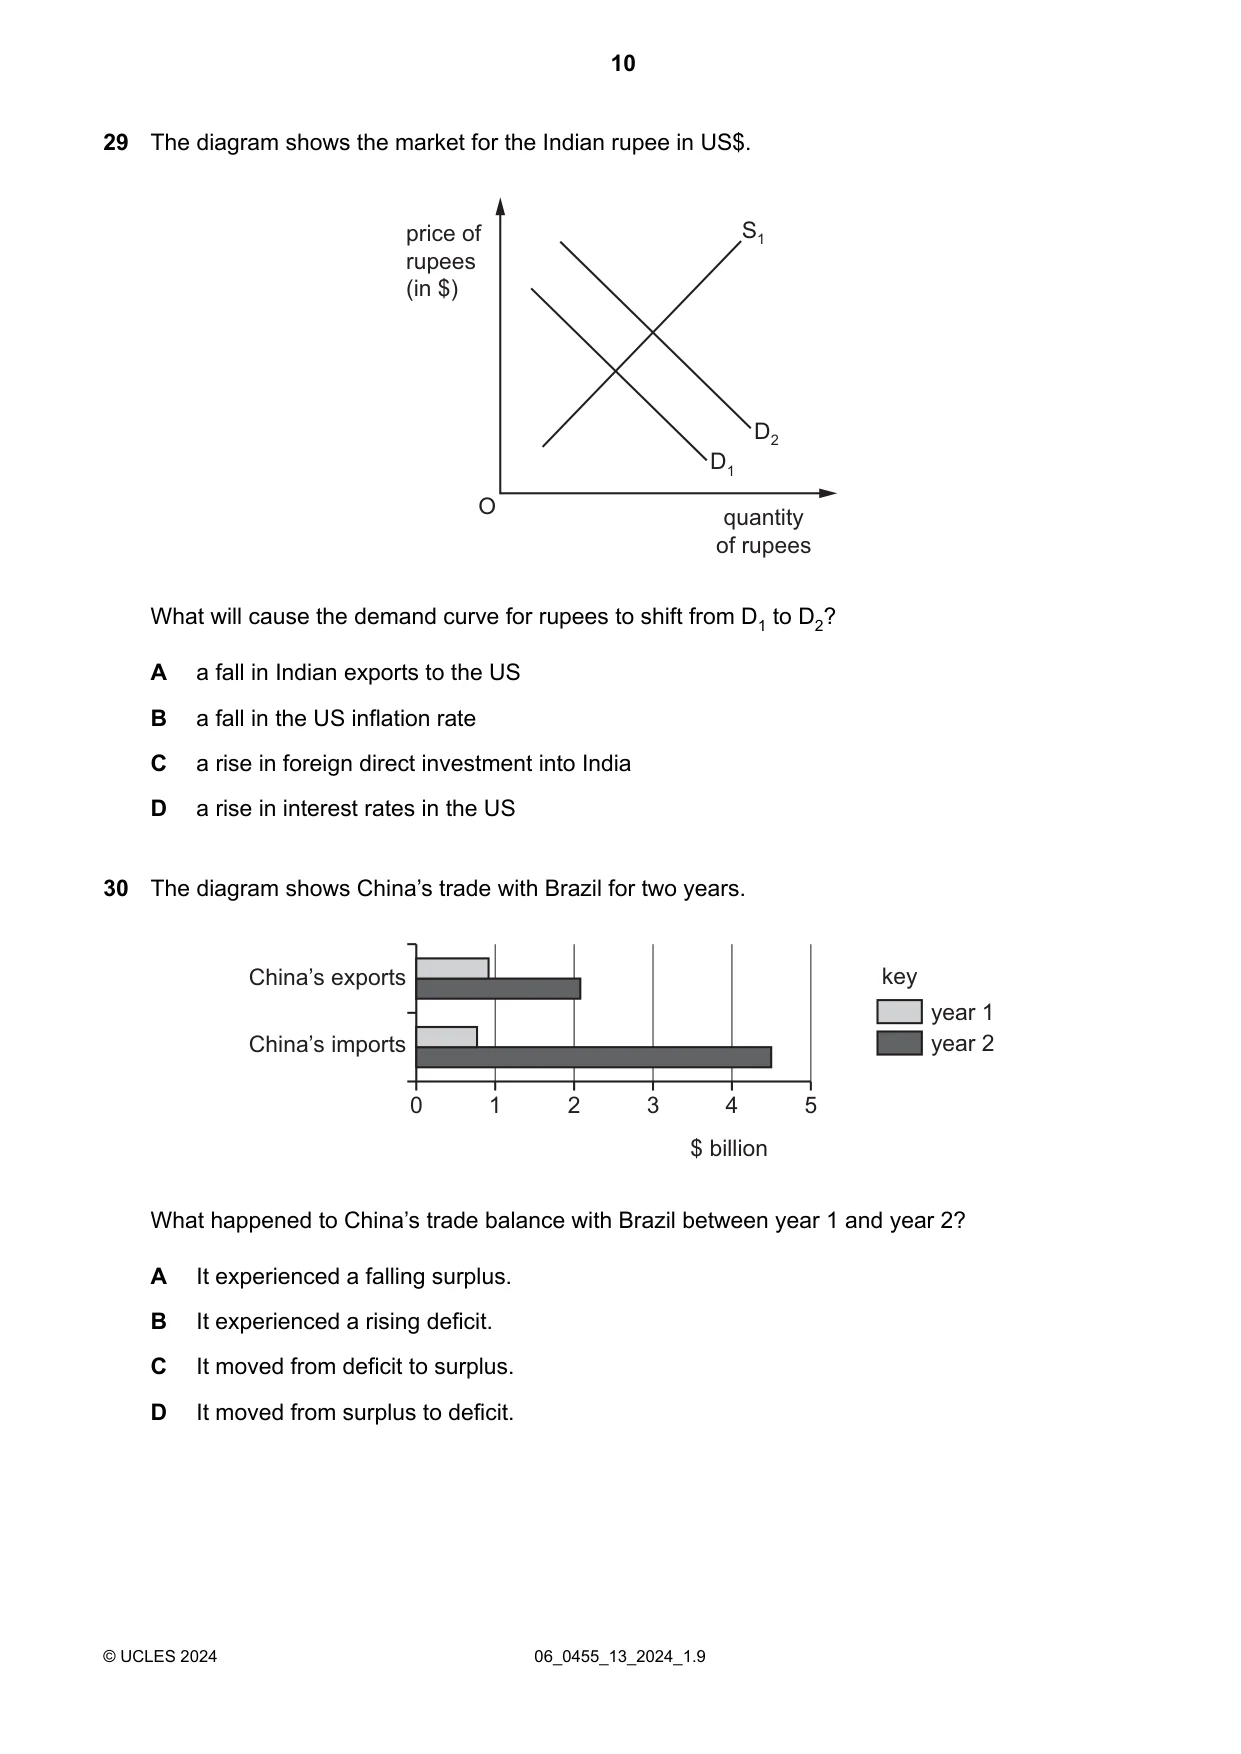
29 The diagram shows the market for the Indian rupee in US$. price of S1 rupees (in $) D2 D1 O quantity of rupees What will cause the demand curve for rupees to shift from D1 to D2? A a fall in Indian exports to the US B a fall in the US inflation rate C a rise in foreign direct investment into India D a rise in interest rates in the US
Mark scheme: C
Q30 · The diagram shows China’s trade with Brazil for two years
30 The diagram shows China’s trade with Brazil for two years. China’s exports key year 1 China’s imports year 2 0 1 2 3 4 5 $ billion What happened to China’s trade balance with Brazil between year 1 and year 2? A It experienced a falling surplus. B It experienced a rising deficit. C It moved from deficit to surplus. D It moved from surplus to deficit.
Mark scheme: D
What was in this paper
The subtopics covered by these 30 questions, and how many questions each got. Open one in a new tab to see every Cambridge question on it.
3Firms and production2Inflation and deflation2Market failure2The nature of the economic problem2Current account of balance of payments1Differences in economic development between countries1Economic growth1Employment and unemployment1Fiscal policy1Foreign exchange rates1Globalisation, free trade and protection1International specialisation1Microeconomics and macroeconomics1Monetary policy1Money and banking1Opportunity cost1Population1Poverty1Price determination1Price elasticity of demand (PED)1Price elasticity of supply (PES)1The factors of production1Trade unions1What you needed in this session
Cambridge’s own grade thresholds for 2024 May/June, Paper 1 · Variant 3. A higher threshold means an easier paper — the bar moves with how the cohort did.