Cambridge IGCSE Economics 0455 — 2025 May/June Paper 1 · Variant 1
0455/11/M/J/25 · 30 questions · 30 marks · ≈34 min
The question paper and its mark scheme, free to read here and free to download. This is Cambridge’s own paper, exactly as it was sat.
Question paper12 pages
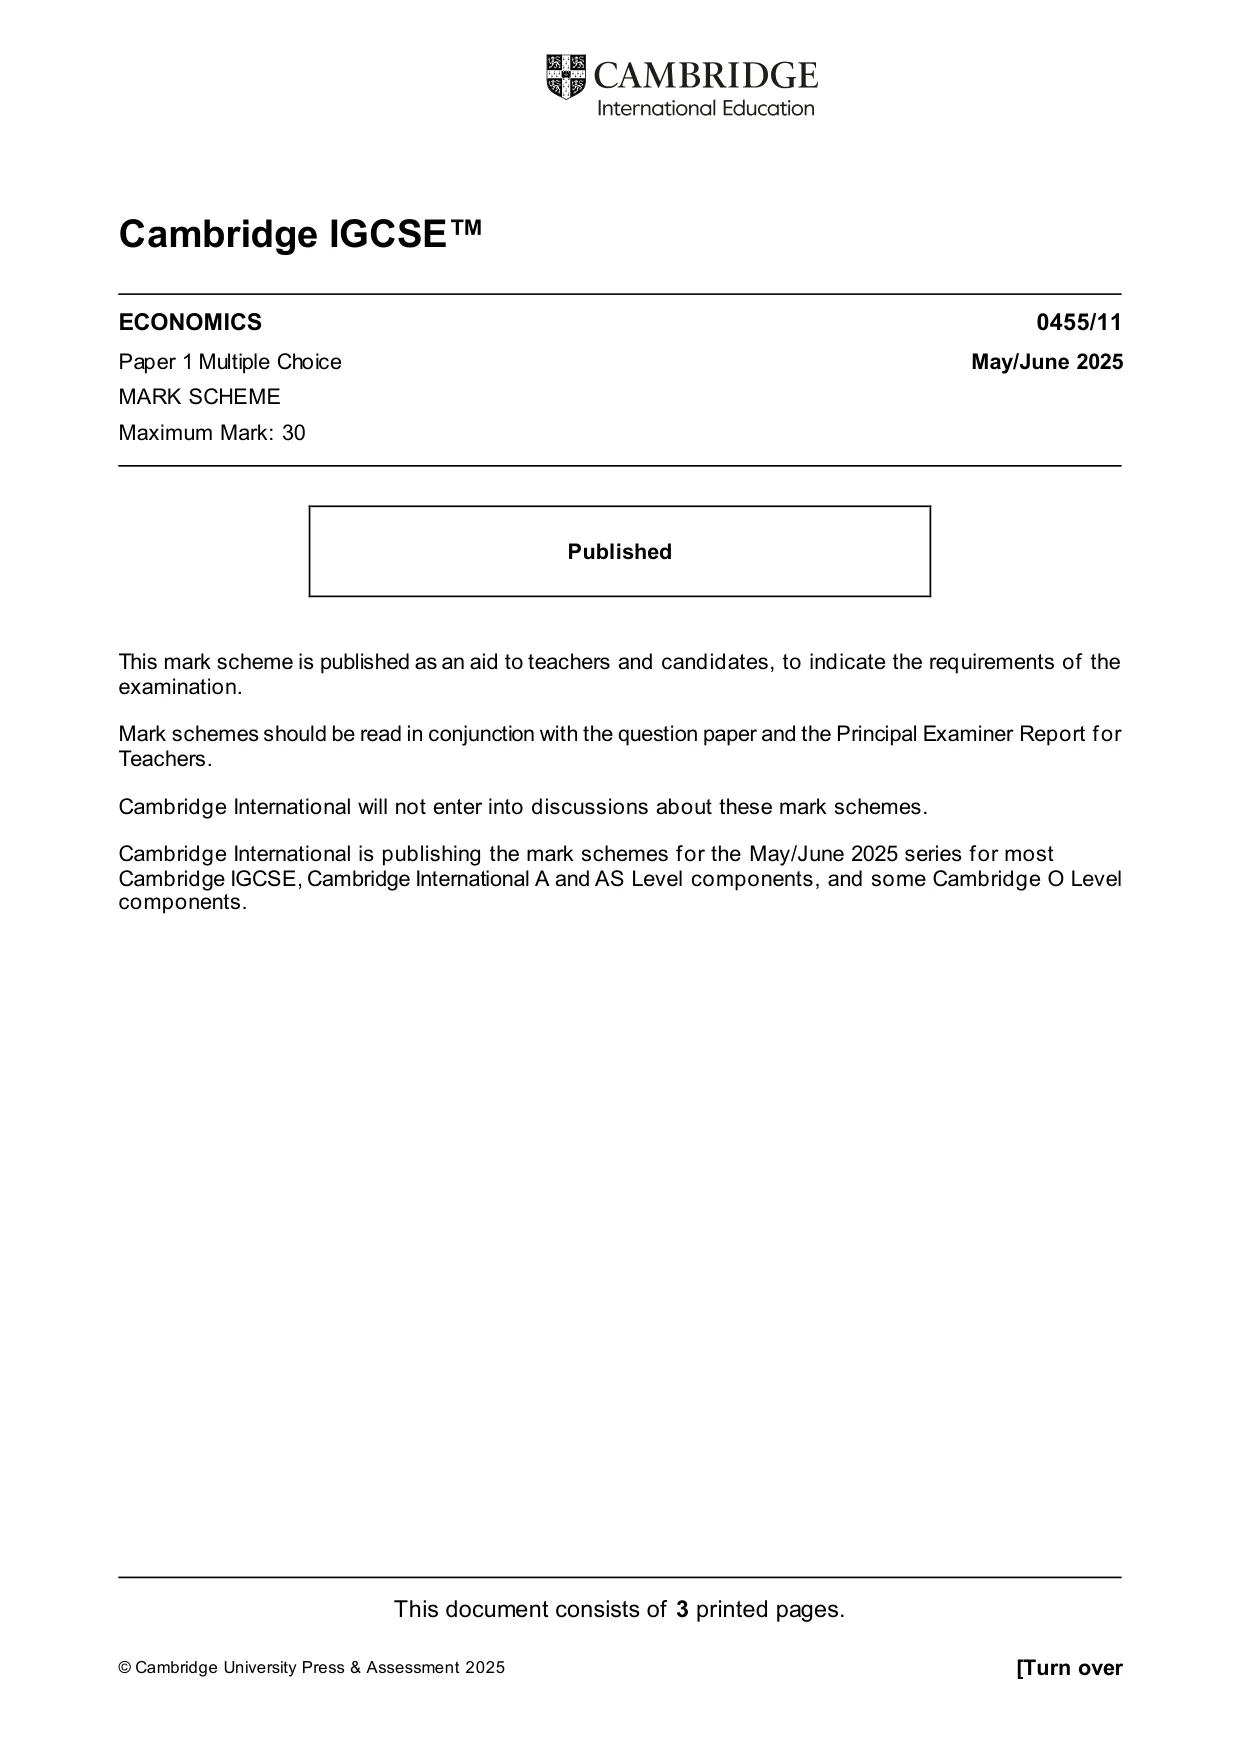
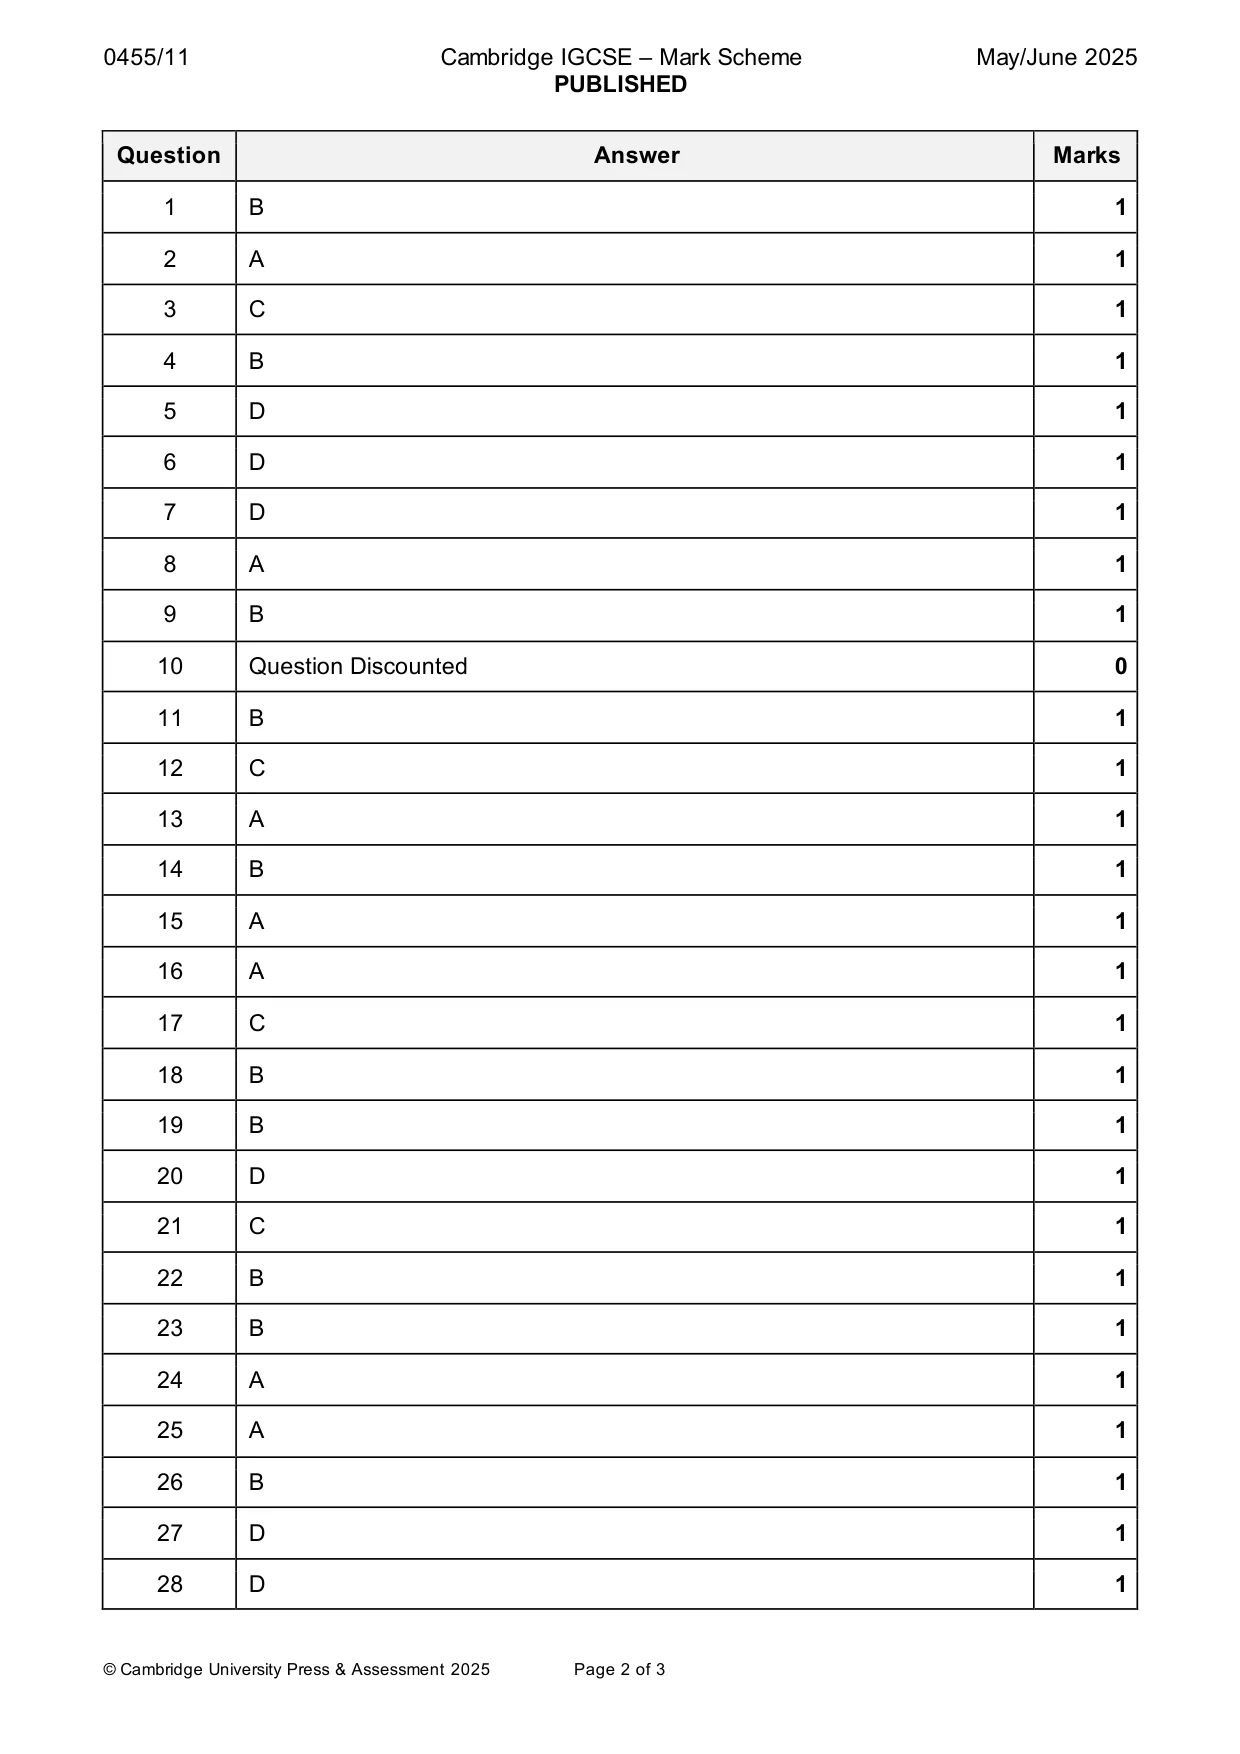
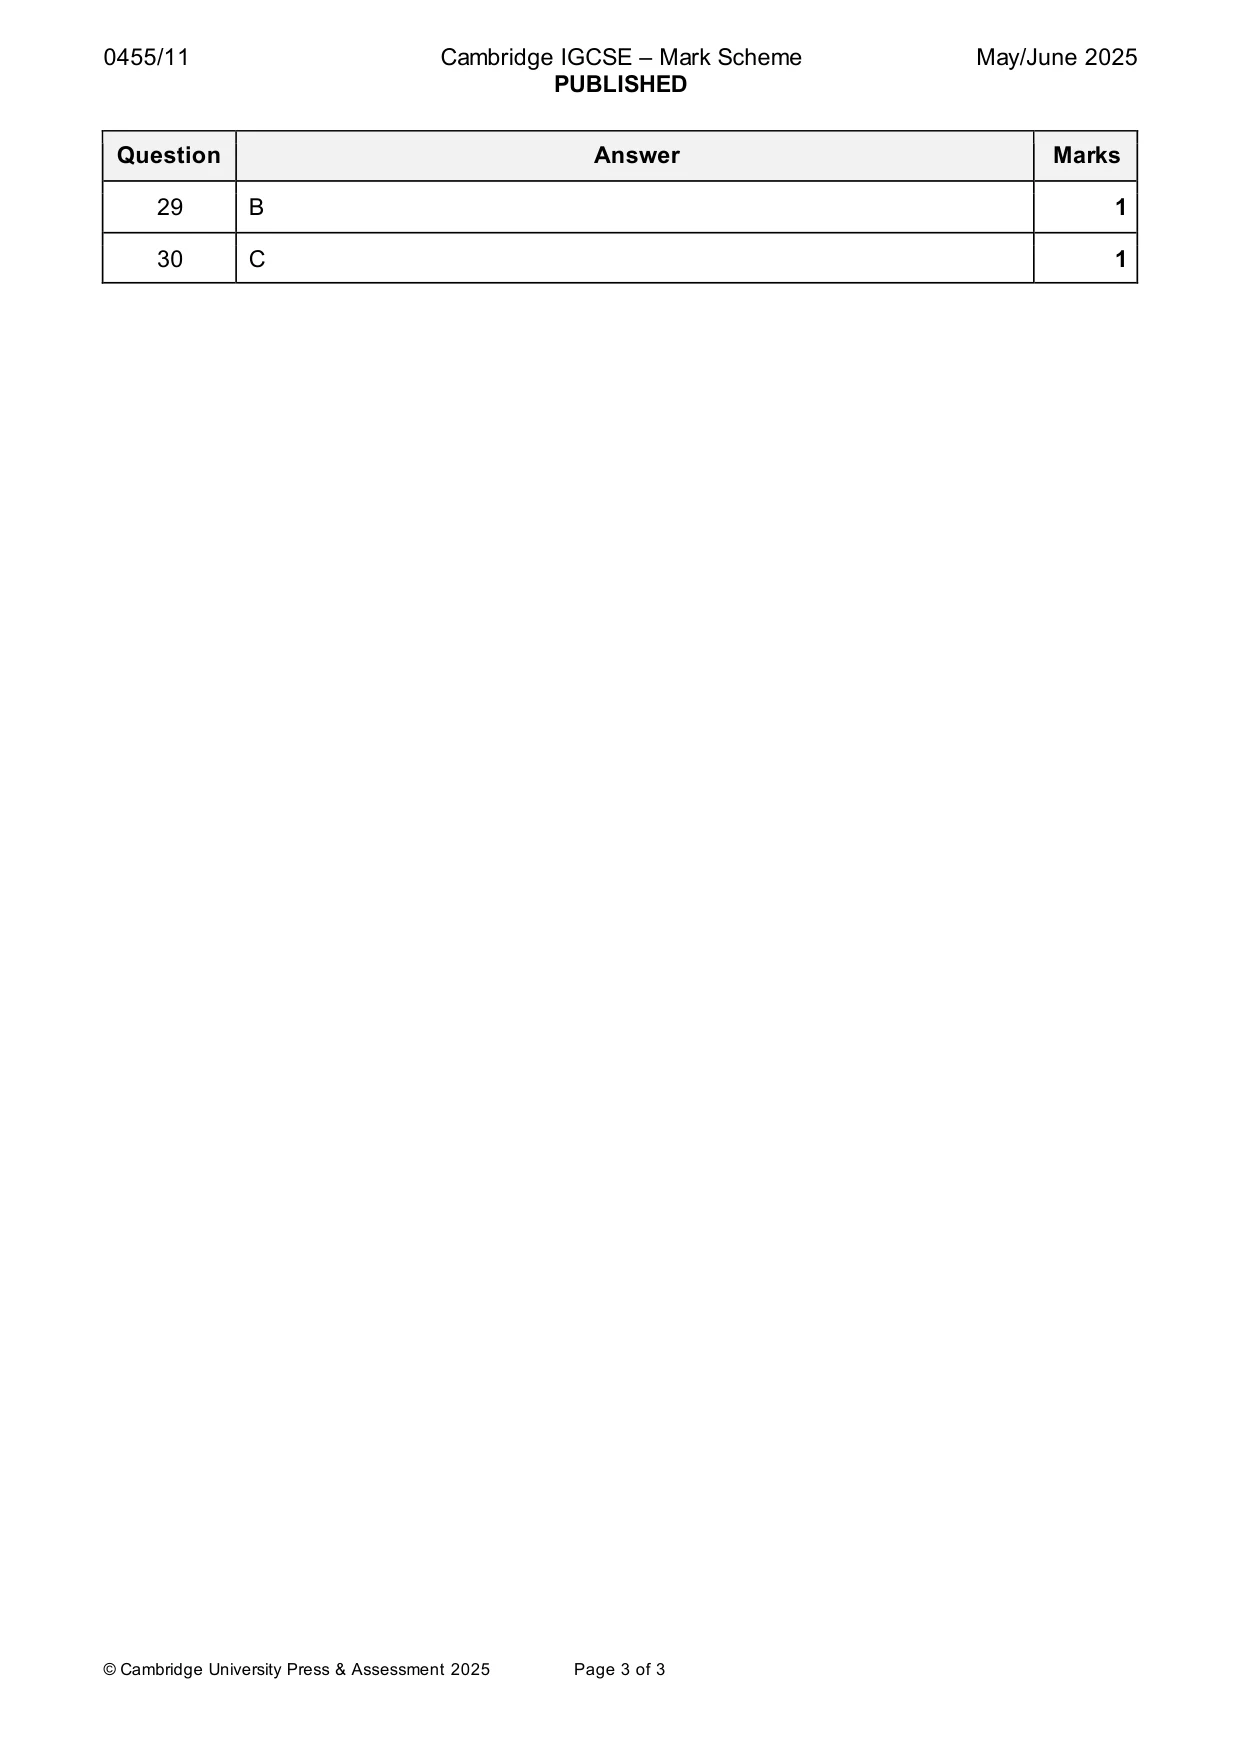
Mark scheme3 pages
Answers below. Sit the paper first if you are practising.
Questions as text
Q1 · What is likely to increase the occupational mobility of labour?
1 What is likely to increase the occupational mobility of labour? A increasing entry requirements to professions B increasing retraining of workers C introducing job specialisation D introducing subsidised transport
Mark scheme: B
Q2 · Sonia owns a takeaway food delivery service
2 Sonia owns a takeaway food delivery service. She decides to expand the firm, buying more vans and hiring additional drivers. Which factors of production were changed? A capital and labour B capital and land C enterprise and capital D labour and land
Mark scheme: A
Q3 · The diagram shows a production possibility curve (PPC)
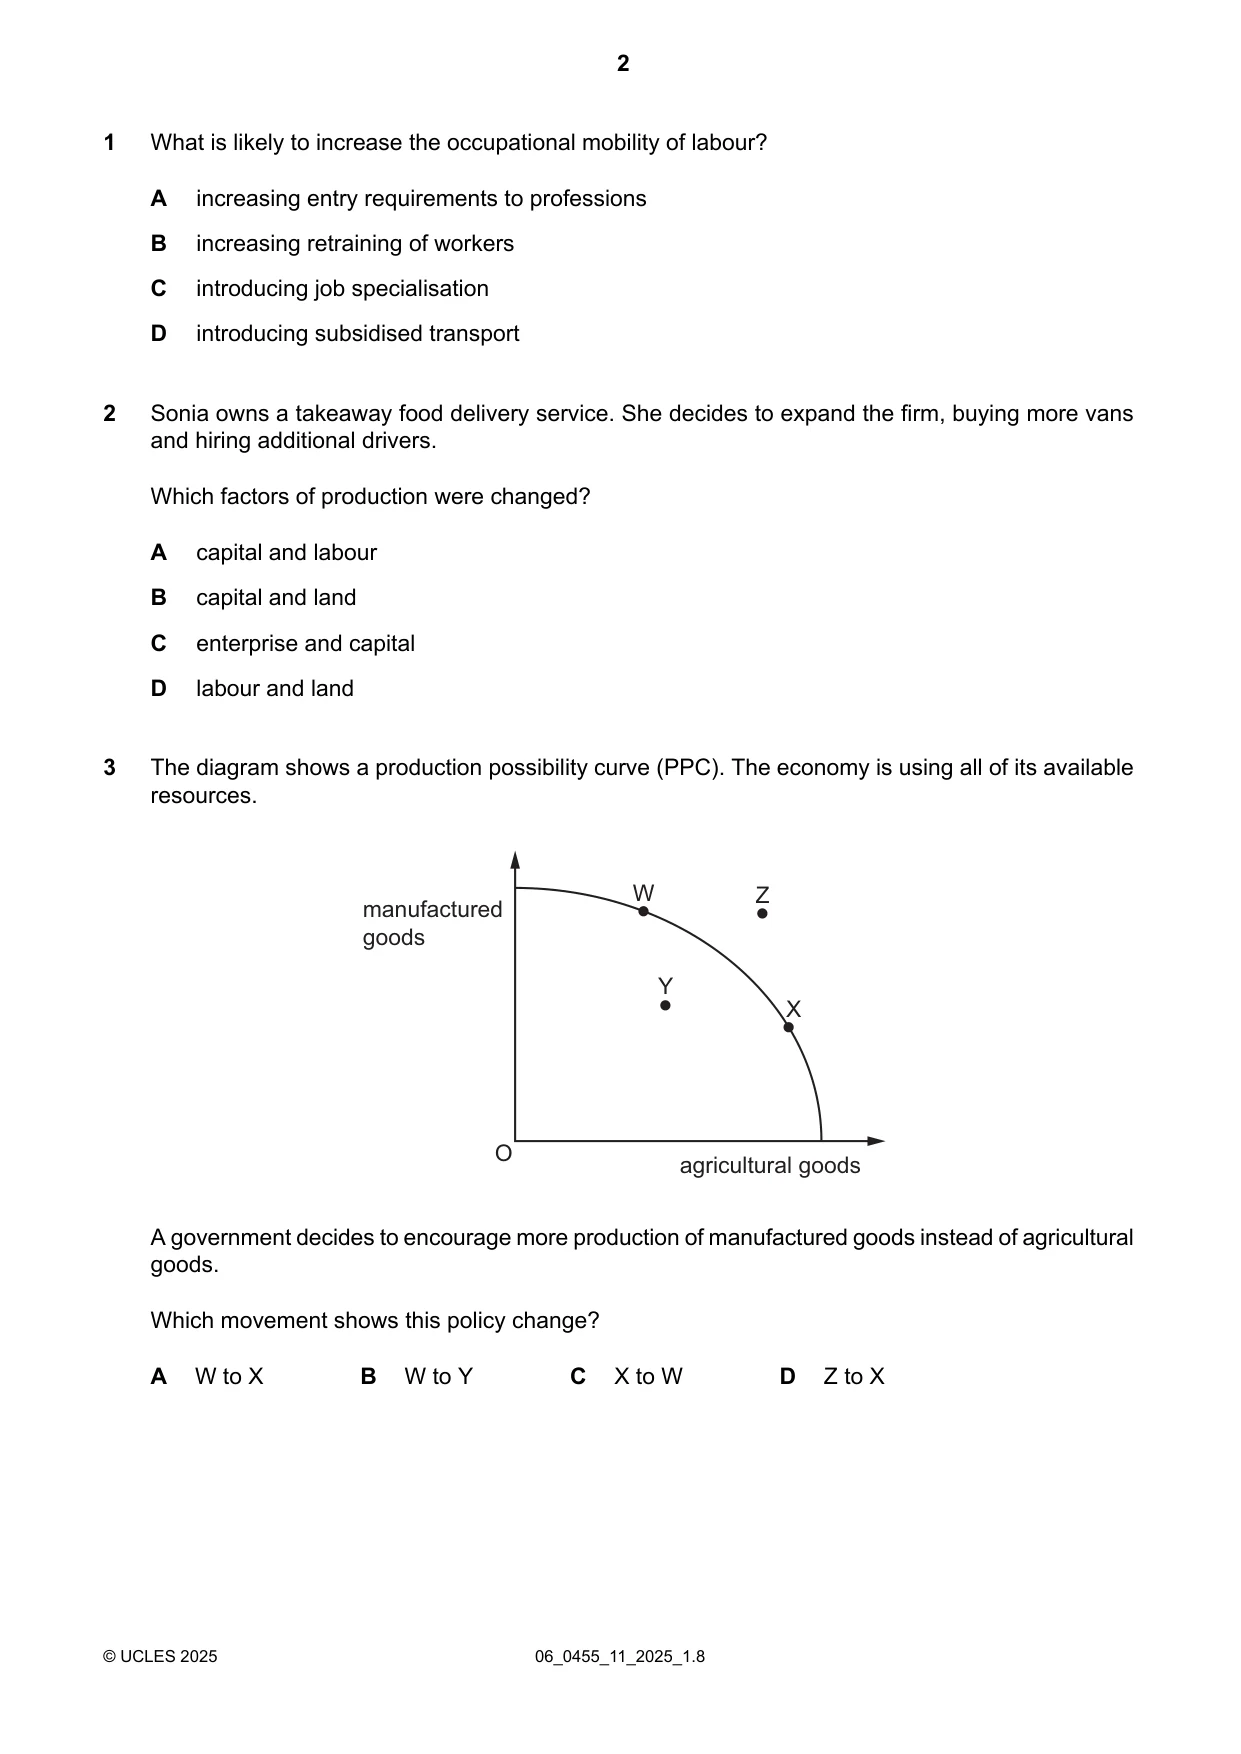
3 The diagram shows a production possibility curve (PPC). The economy is using all of its available resources. W Z manufactured goods Y X O agricultural goods A government decides to encourage more production of manufactured goods instead of agricultural goods. Which movement shows this policy change? A W to X B W to Y C X to W D Z to X
Mark scheme: C
More questions on Production possibility curve (PPC) diagrams
Q4 · In 2020, to prevent the spread of a pandemic, many governments temporarily closed…
4 In 2020, to prevent the spread of a pandemic, many governments temporarily closed restaurants and cafés. What would be a macroeconomic impact of such a policy? A Demand for food to be consumed at home would rise. B Gross Domestic Product (GDP) would fall. C The profits from restaurants and cafés would fall. D Staff working in restaurants and cafés would lose income.
Mark scheme: B
Q5 · Good weather results in an increase in the demand for and supply of peaches
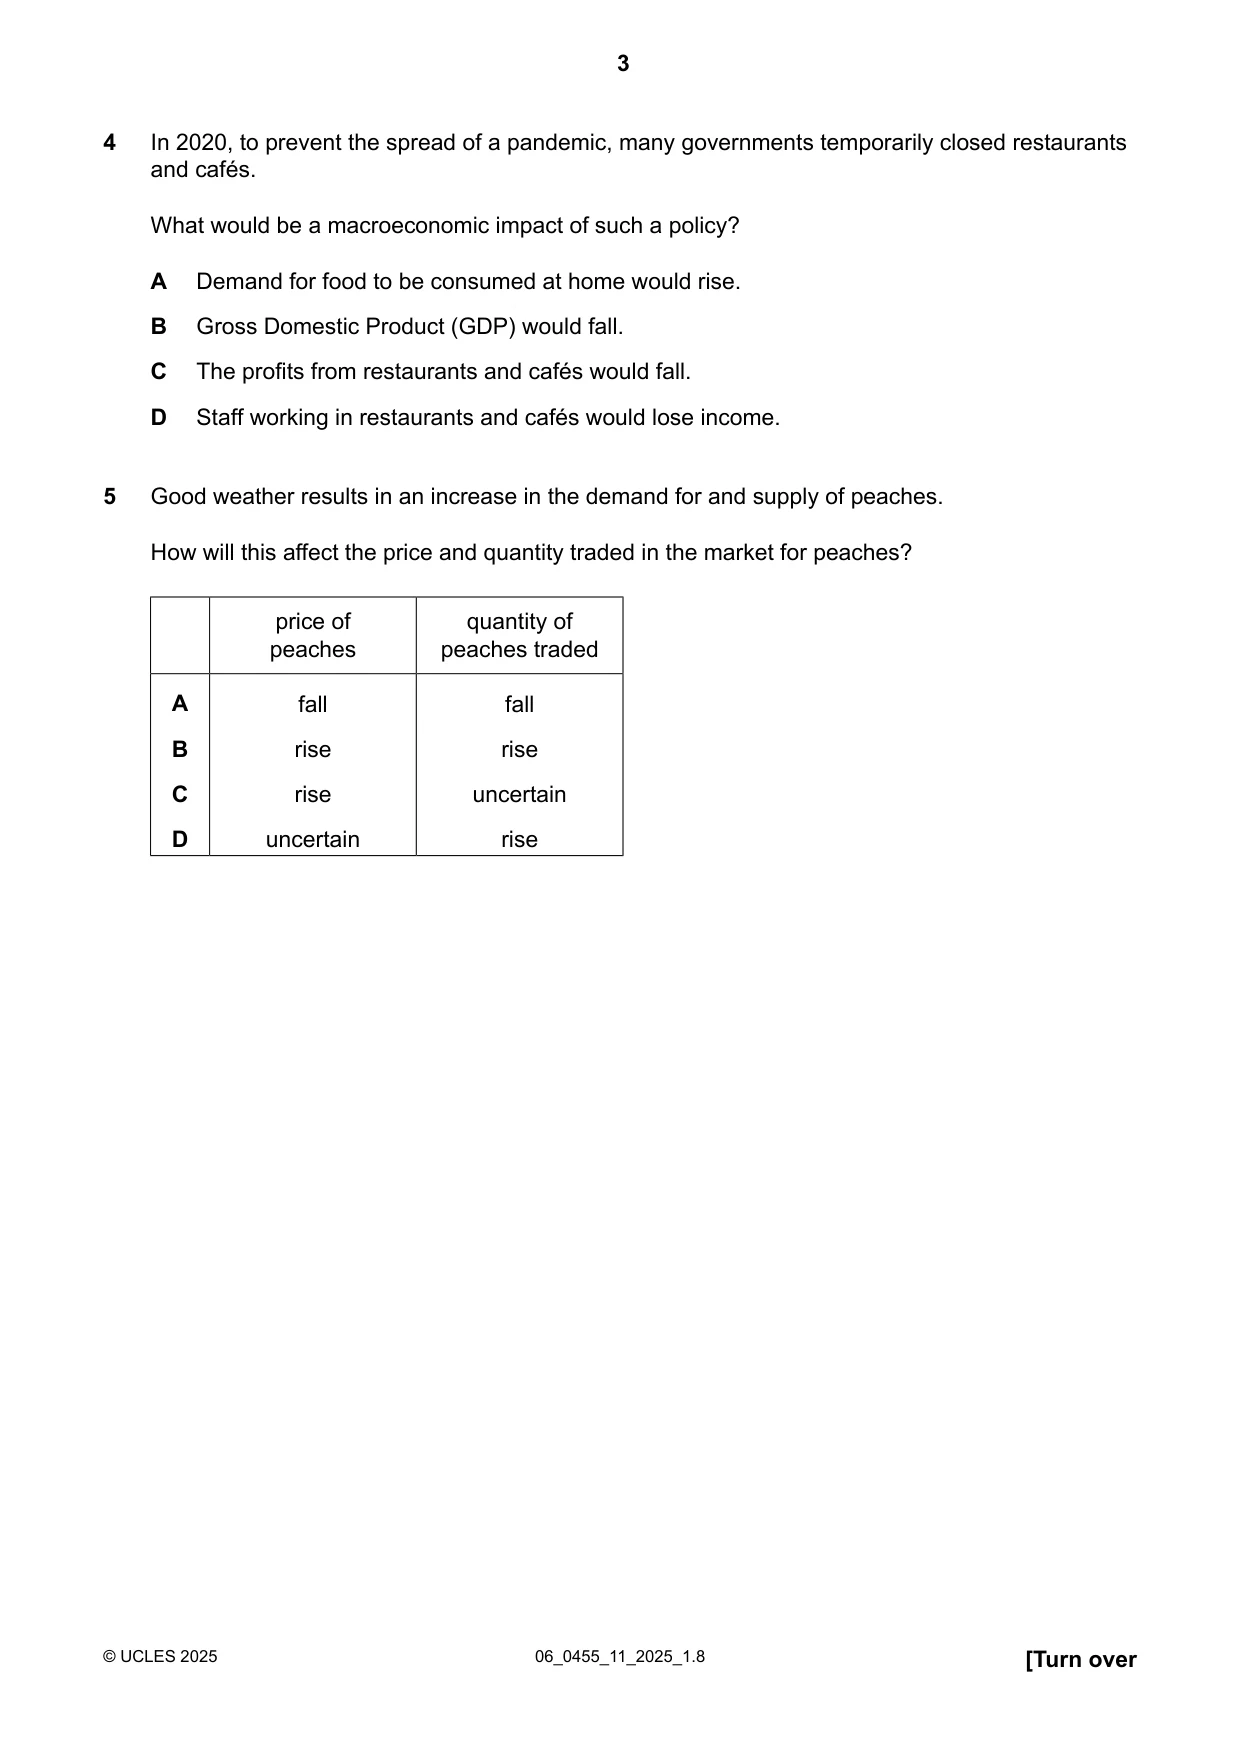
5 Good weather results in an increase in the demand for and supply of peaches. How will this affect the price and quantity traded in the market for peaches? price of quantity of peaches peaches traded A fall fall B rise rise C rise uncertain D uncertain rise
Mark scheme: D
Q6 · The diagram shows demand and supply curves for a product at its equilibrium price P
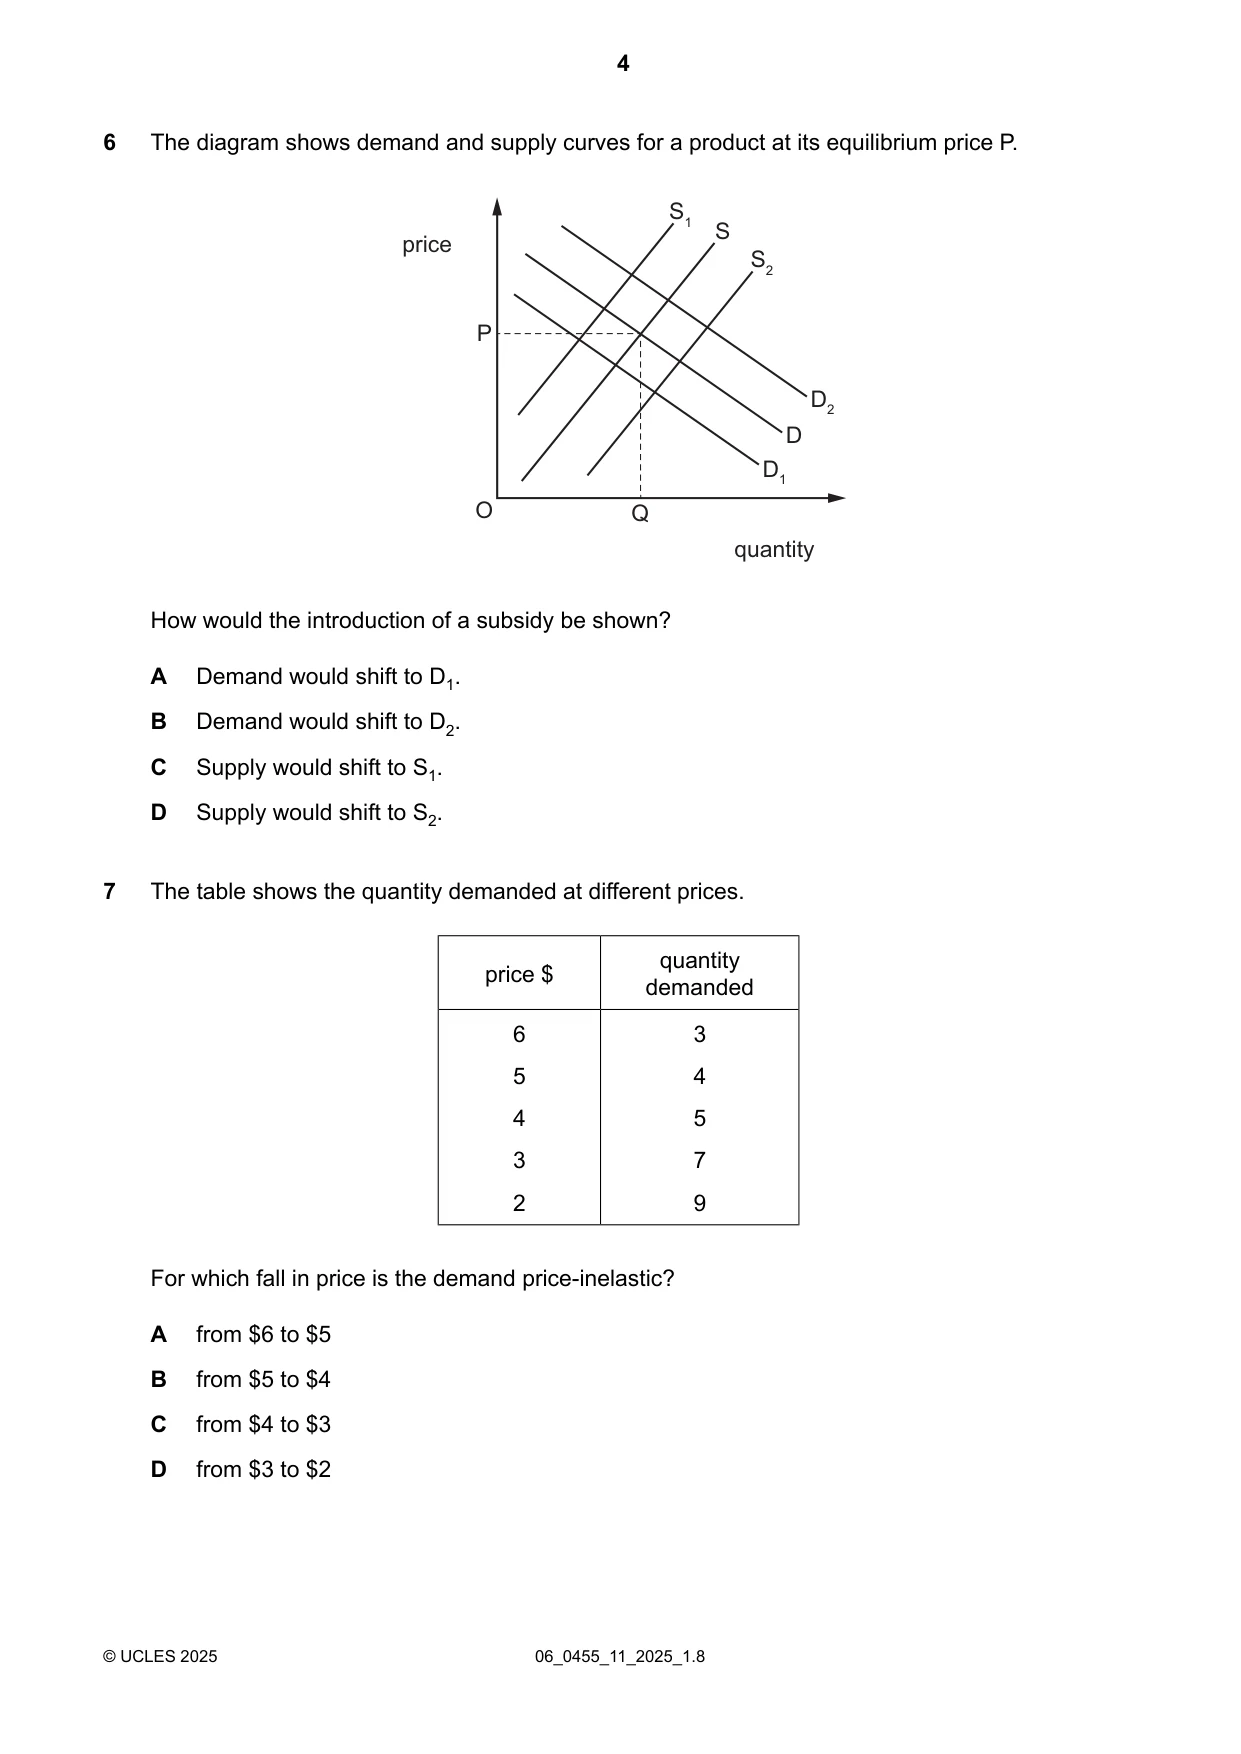
6 The diagram shows demand and supply curves for a product at its equilibrium price P. S1 S price S2 P D2 D D1 O Q quantity How would the introduction of a subsidy be shown? A Demand would shift to D1. B Demand would shift to D2. C Supply would shift to S1. D Supply would shift to S2.
Mark scheme: D
Q7 · The table shows the quantity demanded at different prices
7 The table shows the quantity demanded at different prices. quantity price $ demanded 6 3 5 4 4 5 3 7 2 9 For which fall in price is the demand price-inelastic? A from $6 to $5 B from $5 to $4 C from $4 to $3 D from $3 to $2
Mark scheme: D
Q8 · The price elasticity of supply (PES) of coffee is calculated as +0.2 for the current year…
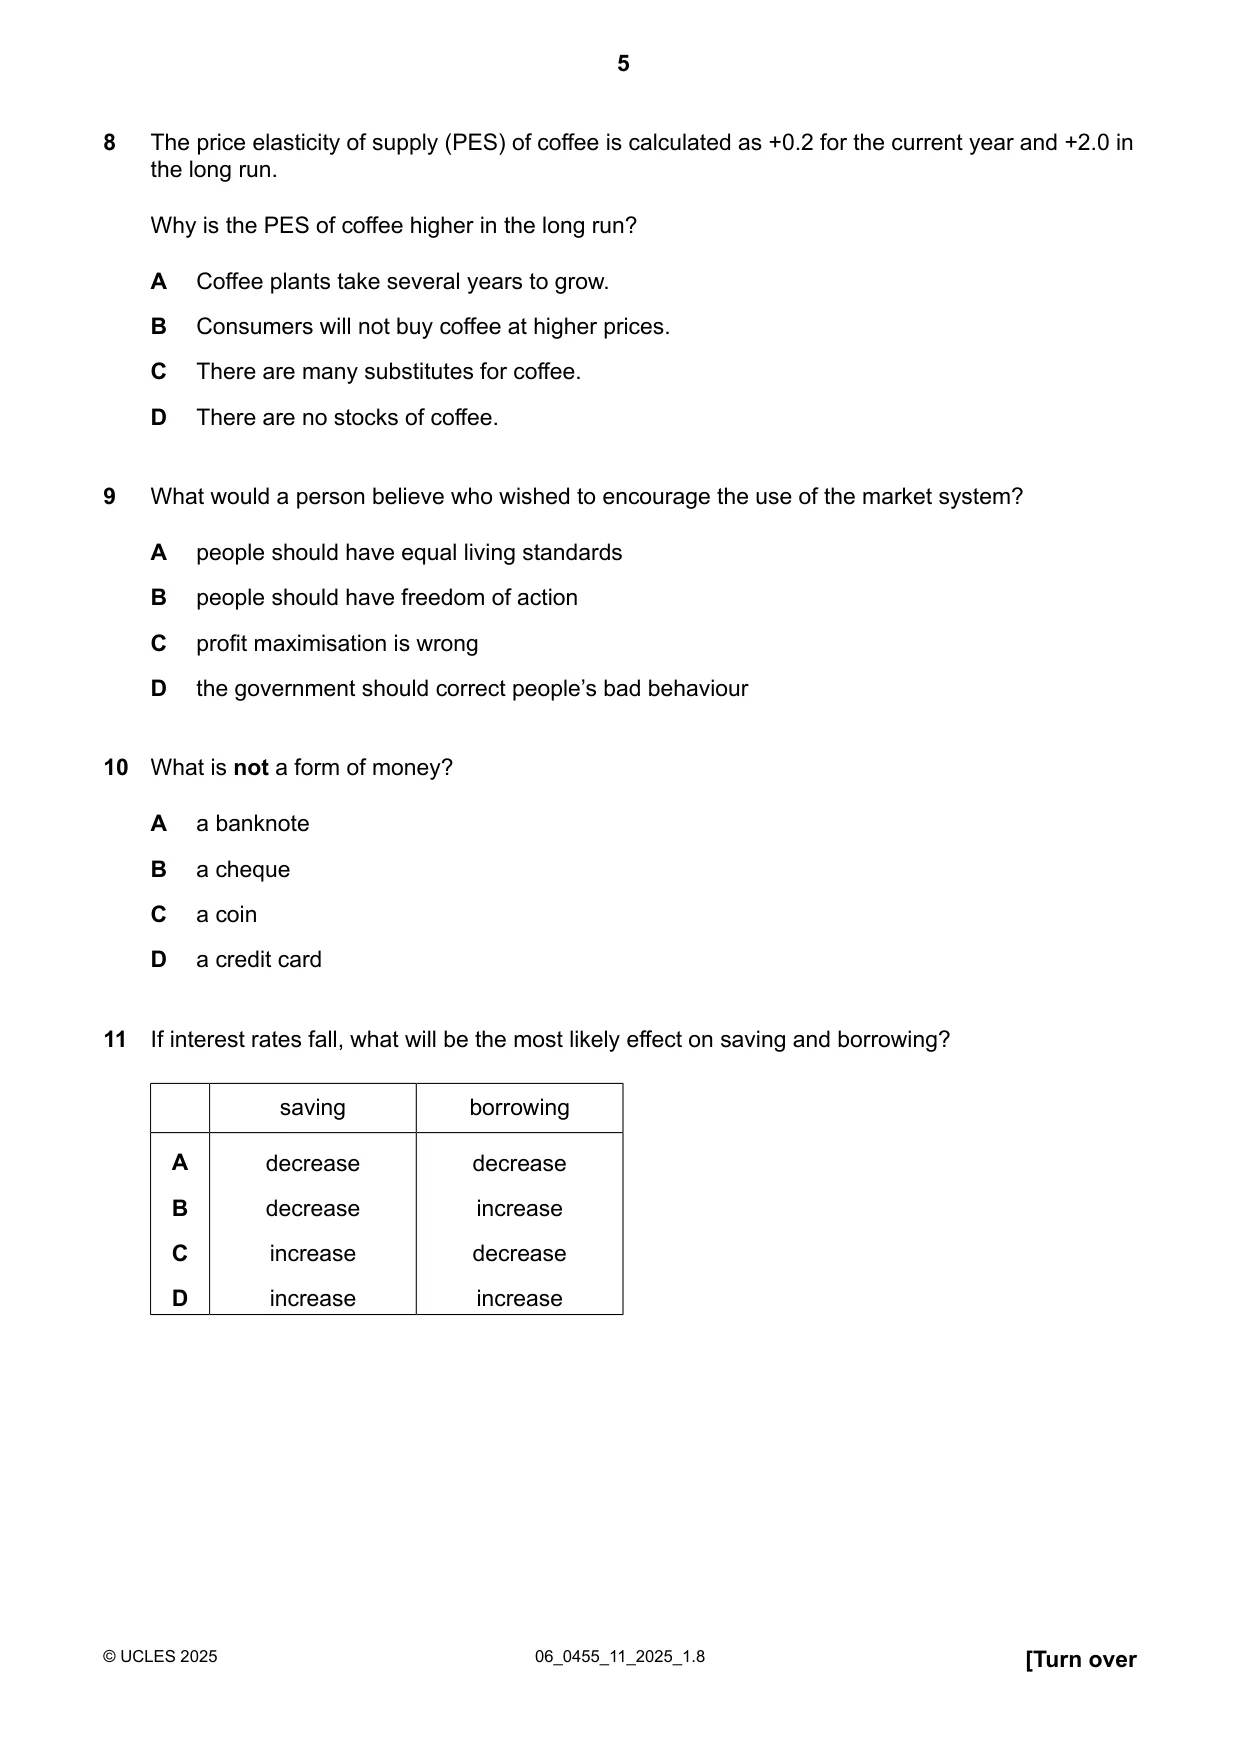
8 The price elasticity of supply (PES) of coffee is calculated as +0.2 for the current year and +2.0 in the long run. Why is the PES of coffee higher in the long run? A Coffee plants take several years to grow. B Consumers will not buy coffee at higher prices. C There are many substitutes for coffee. D There are no stocks of coffee.
Mark scheme: A
Q9 · What would a person believe who wished to encourage the use of the market system?
9 What would a person believe who wished to encourage the use of the market system? A people should have equal living standards B people should have freedom of action C profit maximisation is wrong D the government should correct people’s bad behaviour
Mark scheme: B
Q10 · What is not a form of money?
10 What is not a form of money? A a banknote B a cheque C a coin D a credit card
Q11 · If interest rates fall, what will be the most likely effect on saving and borrowing?
11 If interest rates fall, what will be the most likely effect on saving and borrowing? saving borrowing A decrease decrease B decrease increase C increase decrease D increase increase
Mark scheme: B
Q12 · A bus driver initially works longer hours if the wage rate increases
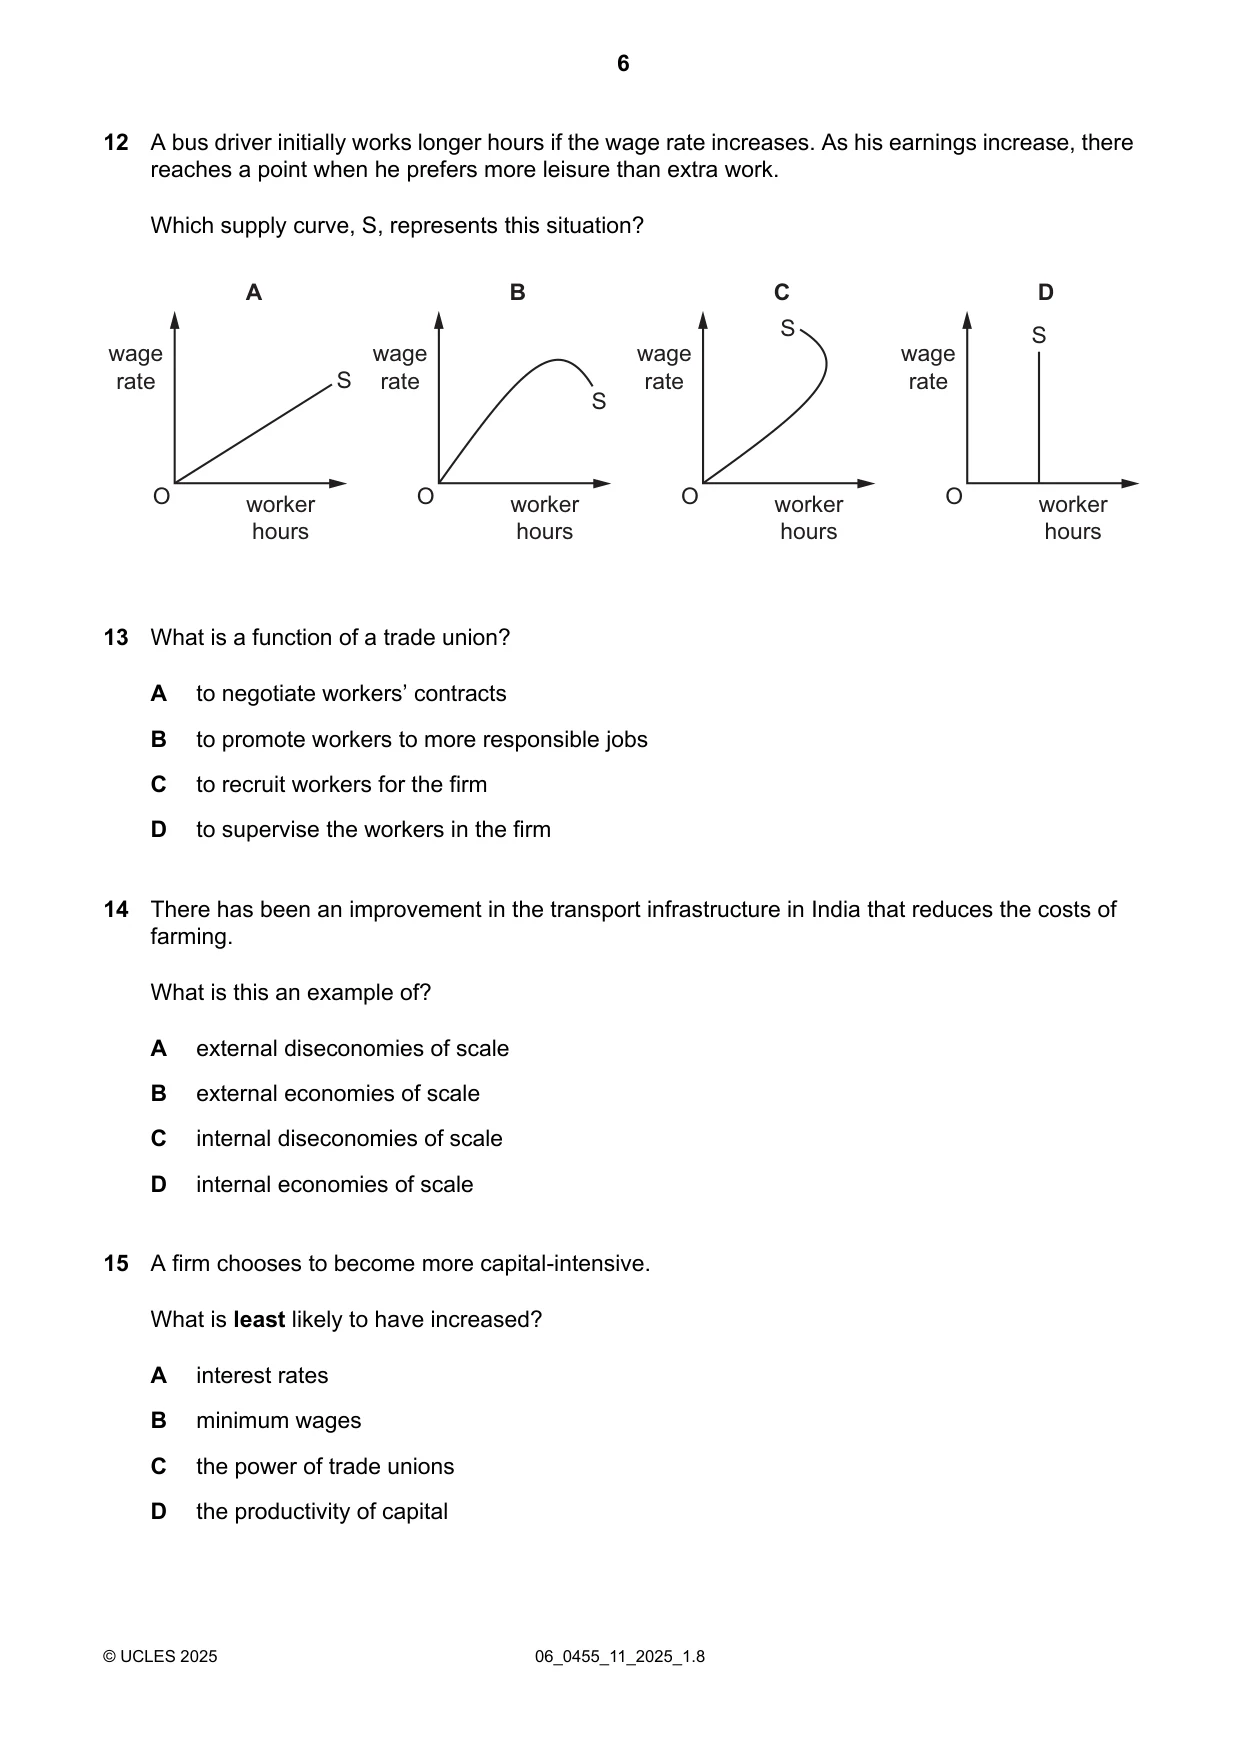
12 A bus driver initially works longer hours if the wage rate increases. As his earnings increase, there reaches a point when he prefers more leisure than extra work. Which supply curve, S, represents this situation? A B C D S S wage wage wage wage rate S rate rate rate S O worker O worker O worker O worker hours hours hours hours
Mark scheme: C
Q13 · What is a function of a trade union?
13 What is a function of a trade union? A to negotiate workers’ contracts B to promote workers to more responsible jobs C to recruit workers for the firm D to supervise the workers in the firm
Mark scheme: A
Q14 · There has been an improvement in the transport infrastructure in India that reduces the…
14 There has been an improvement in the transport infrastructure in India that reduces the costs of farming. What is this an example of? A external diseconomies of scale B external economies of scale C internal diseconomies of scale D internal economies of scale
Mark scheme: B
Q15 · A firm chooses to become more capital-intensive
15 A firm chooses to become more capital-intensive. What is least likely to have increased? A interest rates B minimum wages C the power of trade unions D the productivity of capital
Mark scheme: A
Q16 · The diagram shows the average total costs (ATC) and average fixed costs (AFC) for a firm
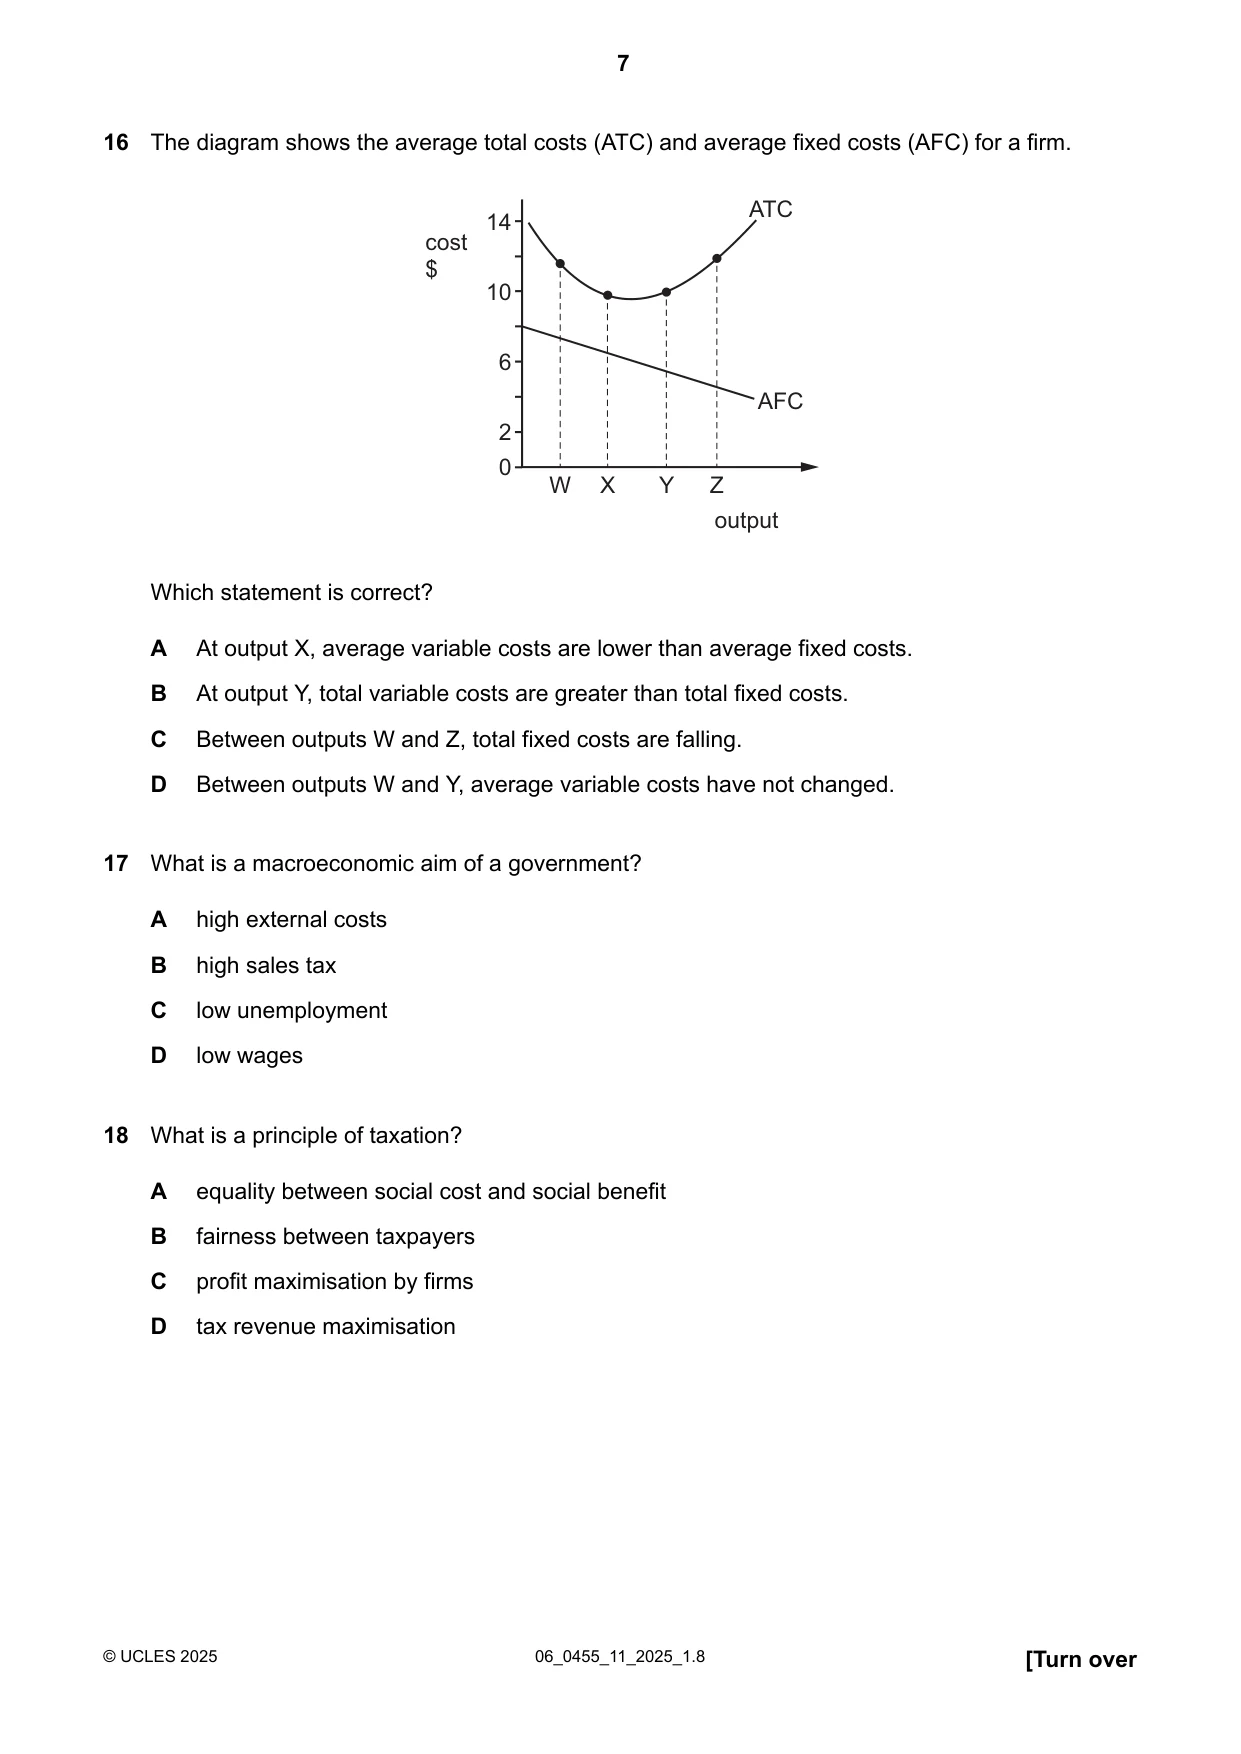
16 The diagram shows the average total costs (ATC) and average fixed costs (AFC) for a firm. ATC 14 cost $ 10 6 AFC 2 0 W X Y Z output Which statement is correct? A At output X, average variable costs are lower than average fixed costs. B At output Y, total variable costs are greater than total fixed costs. C Between outputs W and Z, total fixed costs are falling. D Between outputs W and Y, average variable costs have not changed.
Mark scheme: A
Q17 · What is a macroeconomic aim of a government?
17 What is a macroeconomic aim of a government? A high external costs B high sales tax C low unemployment D low wages
Mark scheme: C
Q18 · What is a principle of taxation?
18 What is a principle of taxation? A equality between social cost and social benefit B fairness between taxpayers C profit maximisation by firms D tax revenue maximisation
Mark scheme: B
Q19 · Monetary policy often involves a change in which variables?
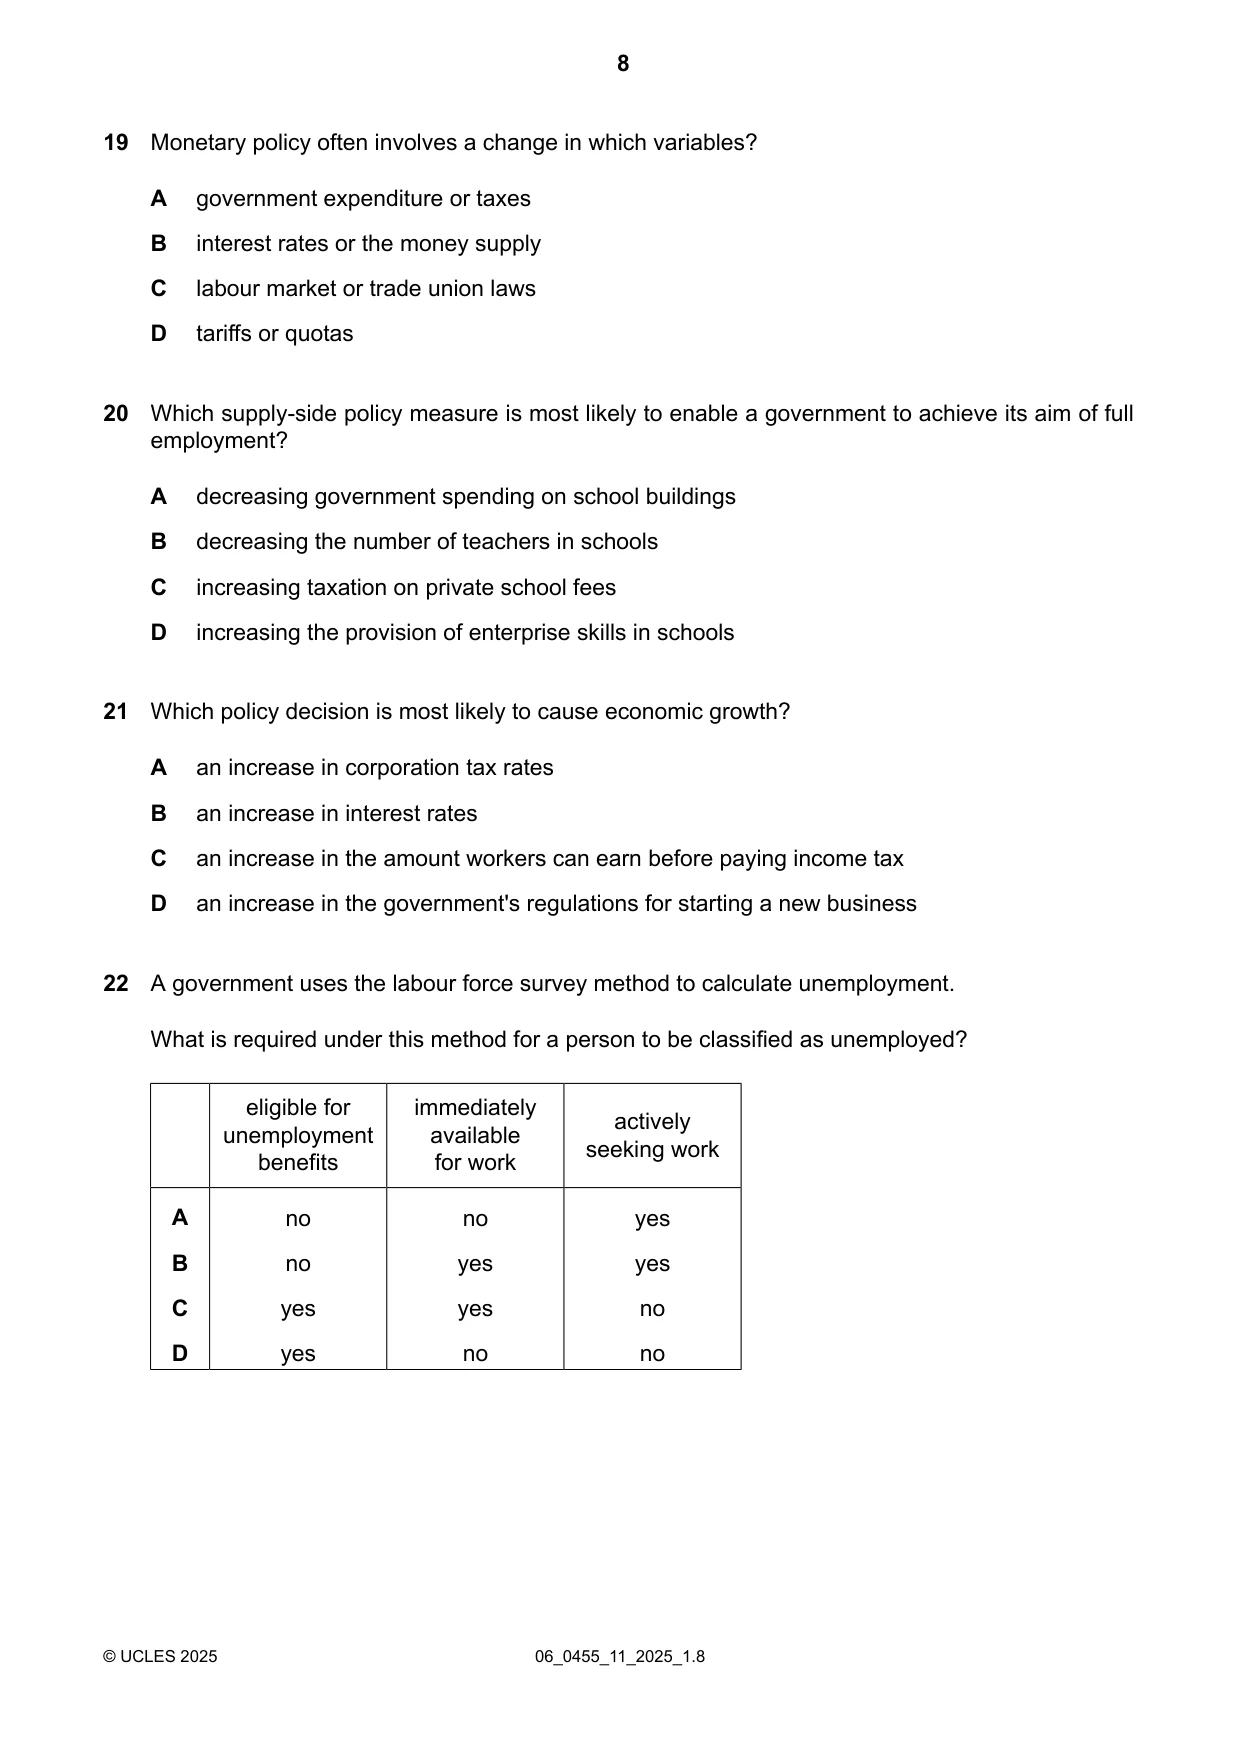
19 Monetary policy often involves a change in which variables? A government expenditure or taxes B interest rates or the money supply C labour market or trade union laws D tariffs or quotas
Mark scheme: B
Q20 · Which supply-side policy measure is most likely to enable a government to achieve its aim…
20 Which supply-side policy measure is most likely to enable a government to achieve its aim of full employment? A decreasing government spending on school buildings B decreasing the number of teachers in schools C increasing taxation on private school fees D increasing the provision of enterprise skills in schools
Mark scheme: D
Q21 · Which policy decision is most likely to cause economic growth?
21 Which policy decision is most likely to cause economic growth? A an increase in corporation tax rates B an increase in interest rates C an increase in the amount workers can earn before paying income tax D an increase in the government's regulations for starting a new business
Mark scheme: C
Q22 · A government uses the labour force survey method to calculate unemployment
22 A government uses the labour force survey method to calculate unemployment. What is required under this method for a person to be classified as unemployed? eligible for immediately actively unemployment available seeking work benefits for work A no no yes B no yes yes C yes yes no D yes no no
Mark scheme: B
Q23 · What is most likely to rise when the level of employment falls in a high-income economy?
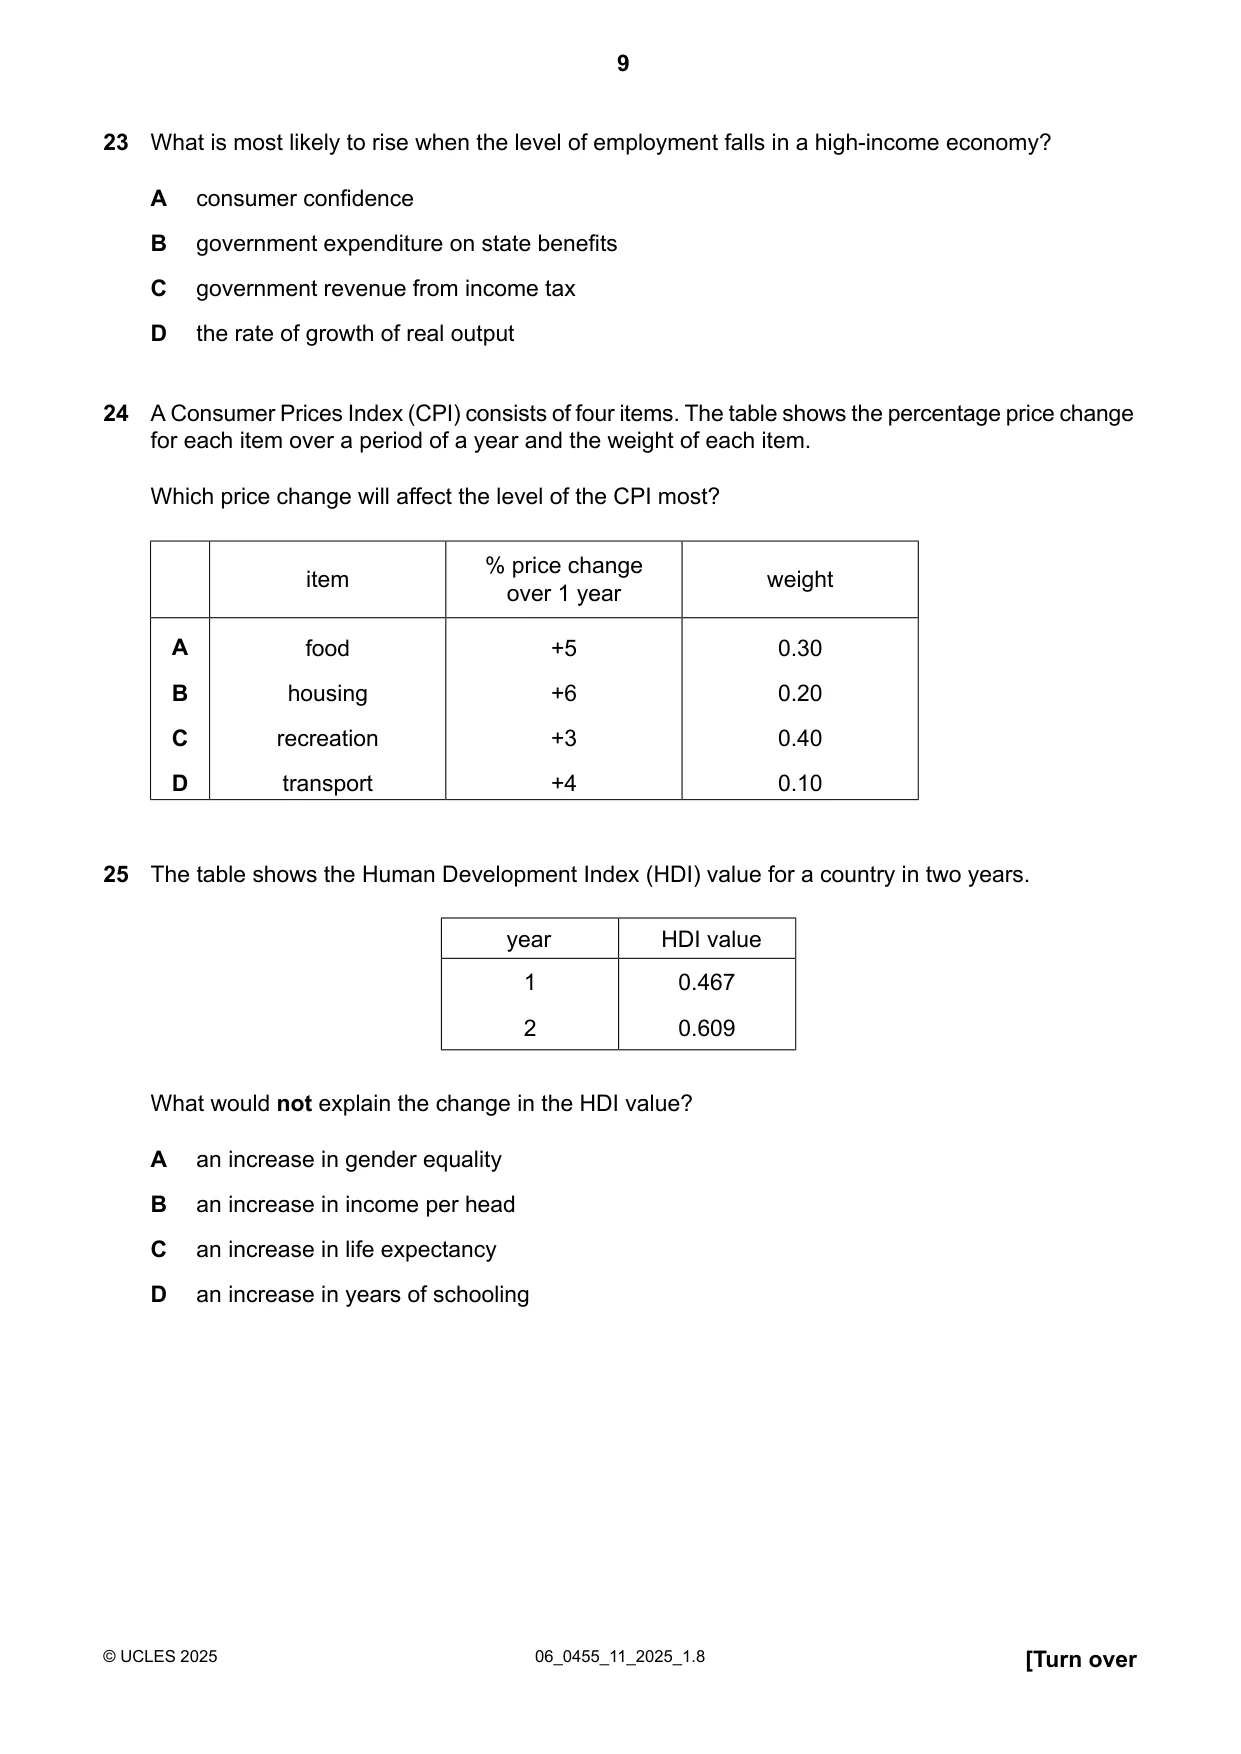
23 What is most likely to rise when the level of employment falls in a high-income economy? A consumer confidence B government expenditure on state benefits C government revenue from income tax D the rate of growth of real output
Mark scheme: B
Q24 · A Consumer Prices Index (CPI) consists of four items
24 A Consumer Prices Index (CPI) consists of four items. The table shows the percentage price change for each item over a period of a year and the weight of each item. Which price change will affect the level of the CPI most? % price change item weight over 1 year A food +5 0.30 B housing +6 0.20 C recreation +3 0.40 D transport +4 0.10
Mark scheme: A
Q25 · The table shows the Human Development Index (HDI) value for a country in two years
25 The table shows the Human Development Index (HDI) value for a country in two years. year HDI value 1 0.467 2 0.609 What would not explain the change in the HDI value? A an increase in gender equality B an increase in income per head C an increase in life expectancy D an increase in years of schooling
Mark scheme: A
Q26 · Which combination of statistics is used to calculate the natural population growth of a…
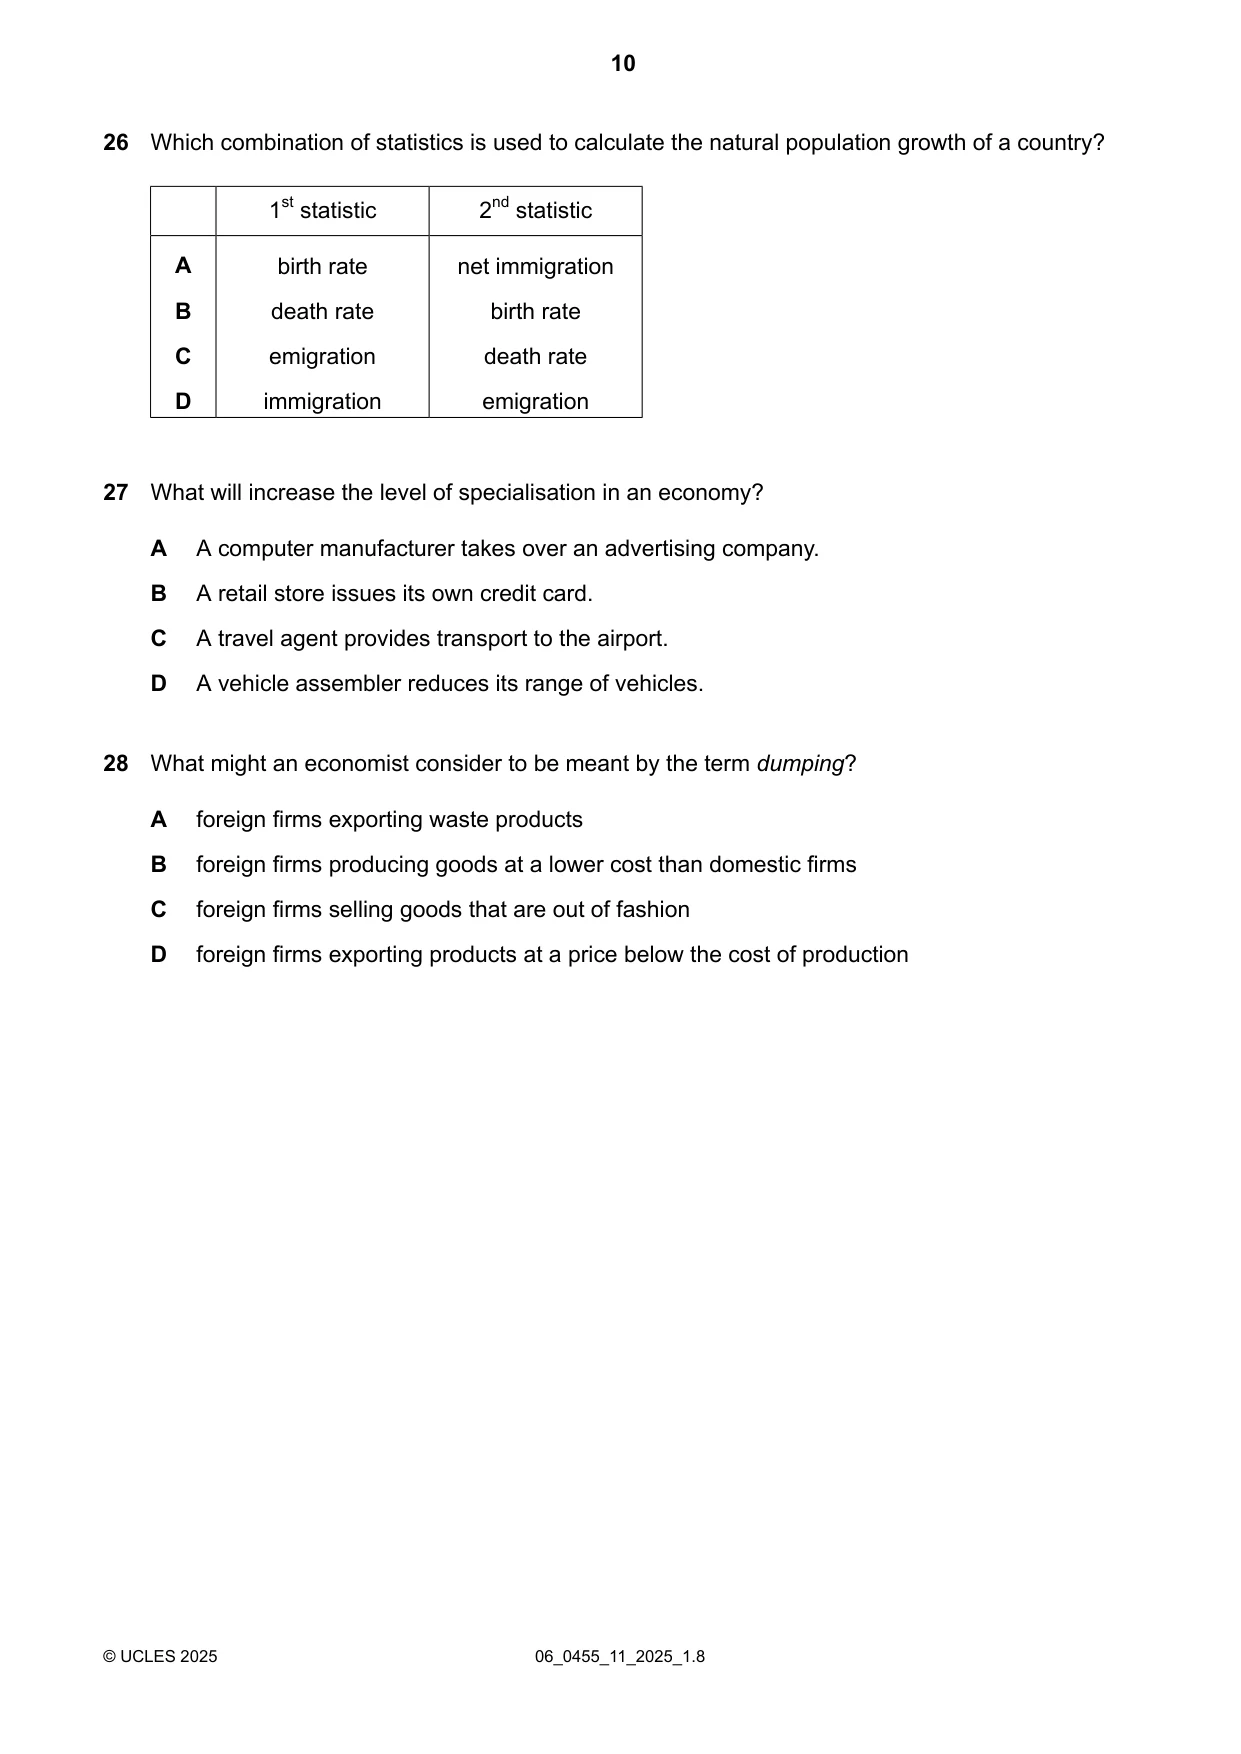
26 Which combination of statistics is used to calculate the natural population growth of a country? 1st statistic 2nd statistic A birth rate net immigration B death rate birth rate C emigration death rate D immigration emigration
Mark scheme: B
Q27 · What will increase the level of specialisation in an economy?
27 What will increase the level of specialisation in an economy? A A computer manufacturer takes over an advertising company. B A retail store issues its own credit card. C A travel agent provides transport to the airport. D A vehicle assembler reduces its range of vehicles.
Mark scheme: D
Q28 · What might an economist consider to be meant by the term dumping?
28 What might an economist consider to be meant by the term dumping? A foreign firms exporting waste products B foreign firms producing goods at a lower cost than domestic firms C foreign firms selling goods that are out of fashion D foreign firms exporting products at a price below the cost of production
Mark scheme: D
Q29 · In the diagram, D is the demand curve for the Chinese yuan and S is the supply curve of…
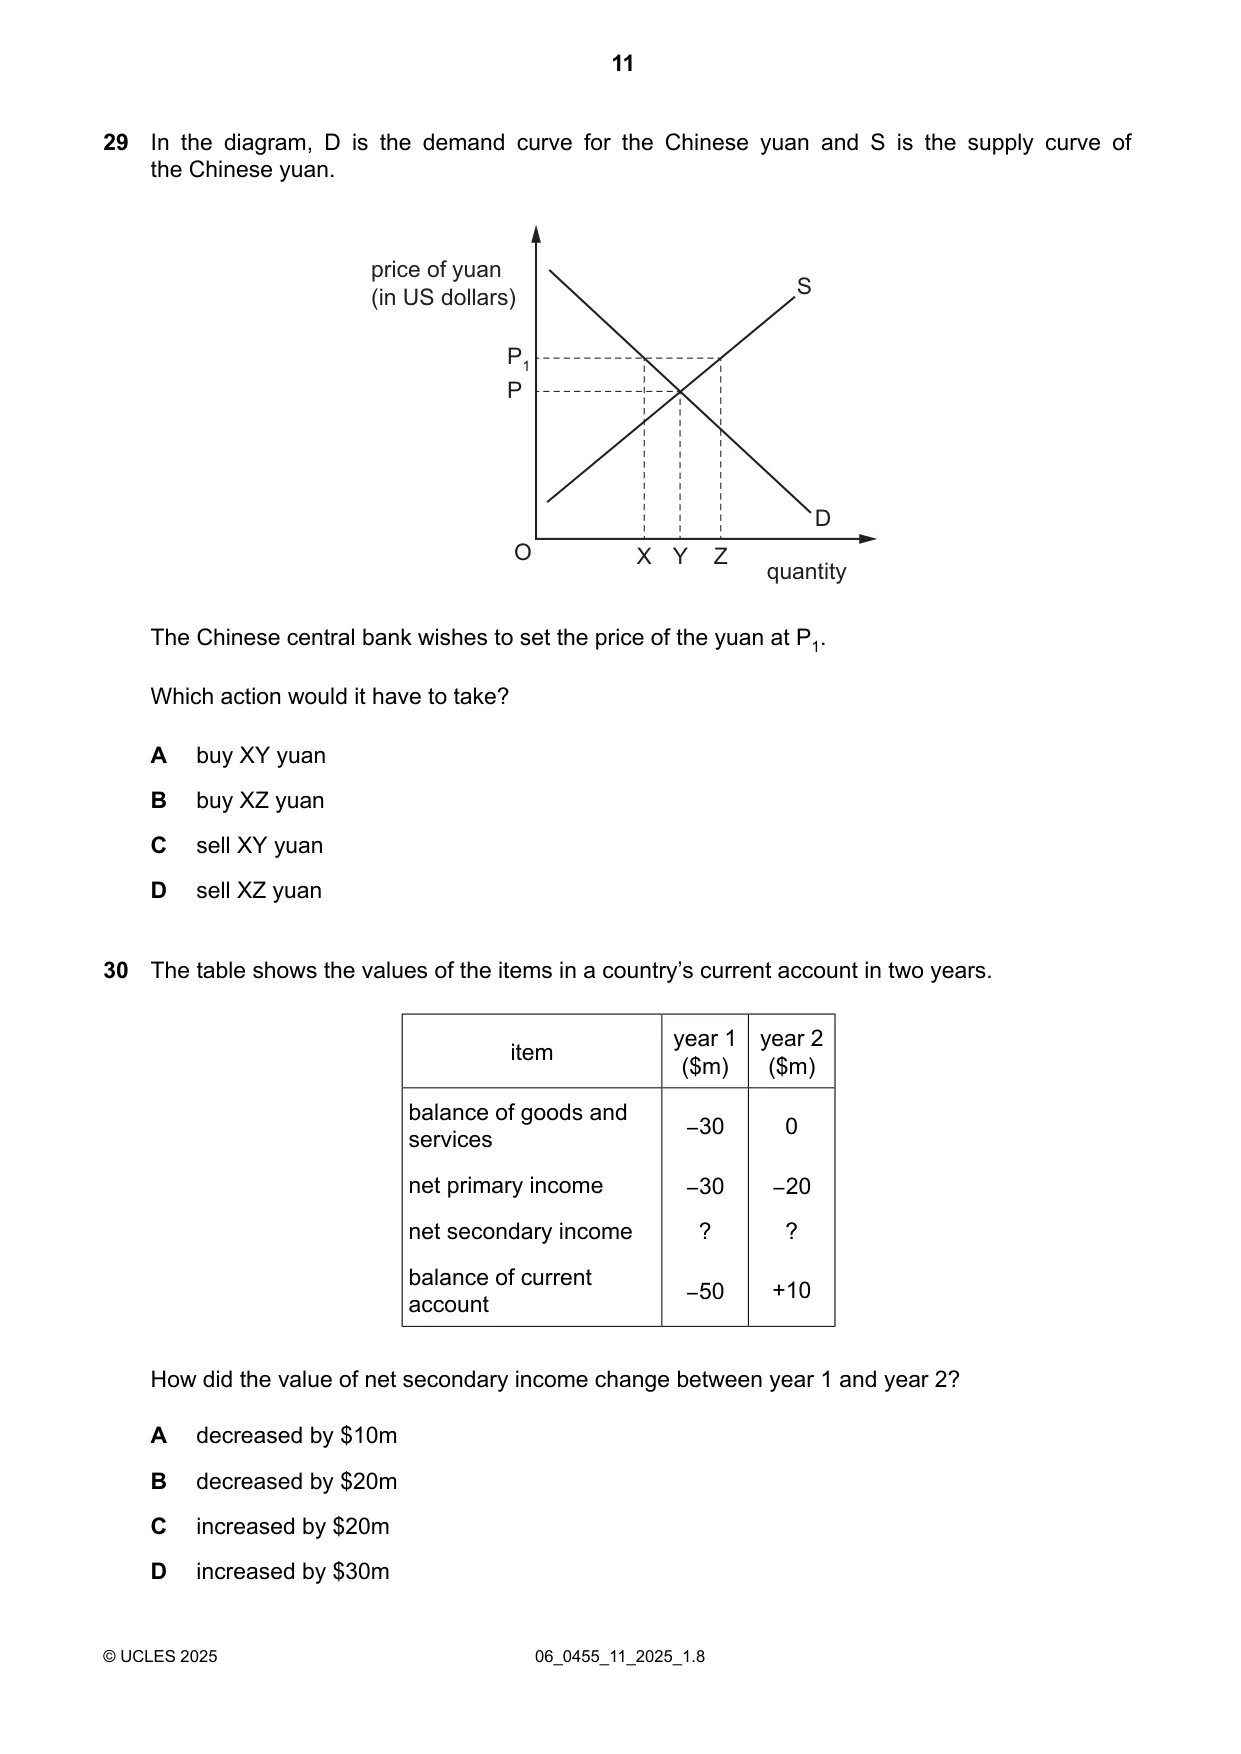
29 In the diagram, D is the demand curve for the Chinese yuan and S is the supply curve of the Chinese yuan. price of yuan (in US dollars) S P1 P D O X Y Z quantity The Chinese central bank wishes to set the price of the yuan at P1. Which action would it have to take? A buy XY yuan B buy XZ yuan C sell XY yuan D sell XZ yuan
Mark scheme: B
Q30 · The table shows the values of the items in a country’s current account in two years
30 The table shows the values of the items in a country’s current account in two years. year 1 year 2 item ($m) ($m) balance of goods and −30 0 services net primary income −30 −20 net secondary income ? ? balance of current −50 +10 account How did the value of net secondary income change between year 1 and year 2? A decreased by $10m B decreased by $20m C increased by $20m D increased by $30m
Mark scheme: C
What was in this paper
The subtopics covered by these 30 questions, and how many questions each got. Open one in a new tab to see every Cambridge question on it.
2Firms and production2Monetary policy2Supply-side policy2The macroeconomic aims of government2Workers2Current account of balance of payments1Firms’ costs, revenue and objectives1Foreign exchange rates1Globalisation, free trade and protection1Inflation and deflation1International specialisation1Living standards1Market economic system1Money and banking1Population1Price determination1Price elasticity of demand (PED)1Price elasticity of supply (PES)1Production possibility curve (PPC) diagrams1Supply1The factors of production1The role of government1Trade unions1What you needed in this session
Cambridge’s own grade thresholds for 2025 May/June, Paper 1 · Variant 1. A higher threshold means an easier paper — the bar moves with how the cohort did.