Cambridge IGCSE Economics 0455 — 2024 May/June Paper 1 · Variant 2
0455/12/M/J/24 · 30 questions · 30 marks · ≈34 min
The question paper and its mark scheme, free to read here and free to download. This is Cambridge’s own paper, exactly as it was sat.
Question paper12 pages

Mark scheme3 pages
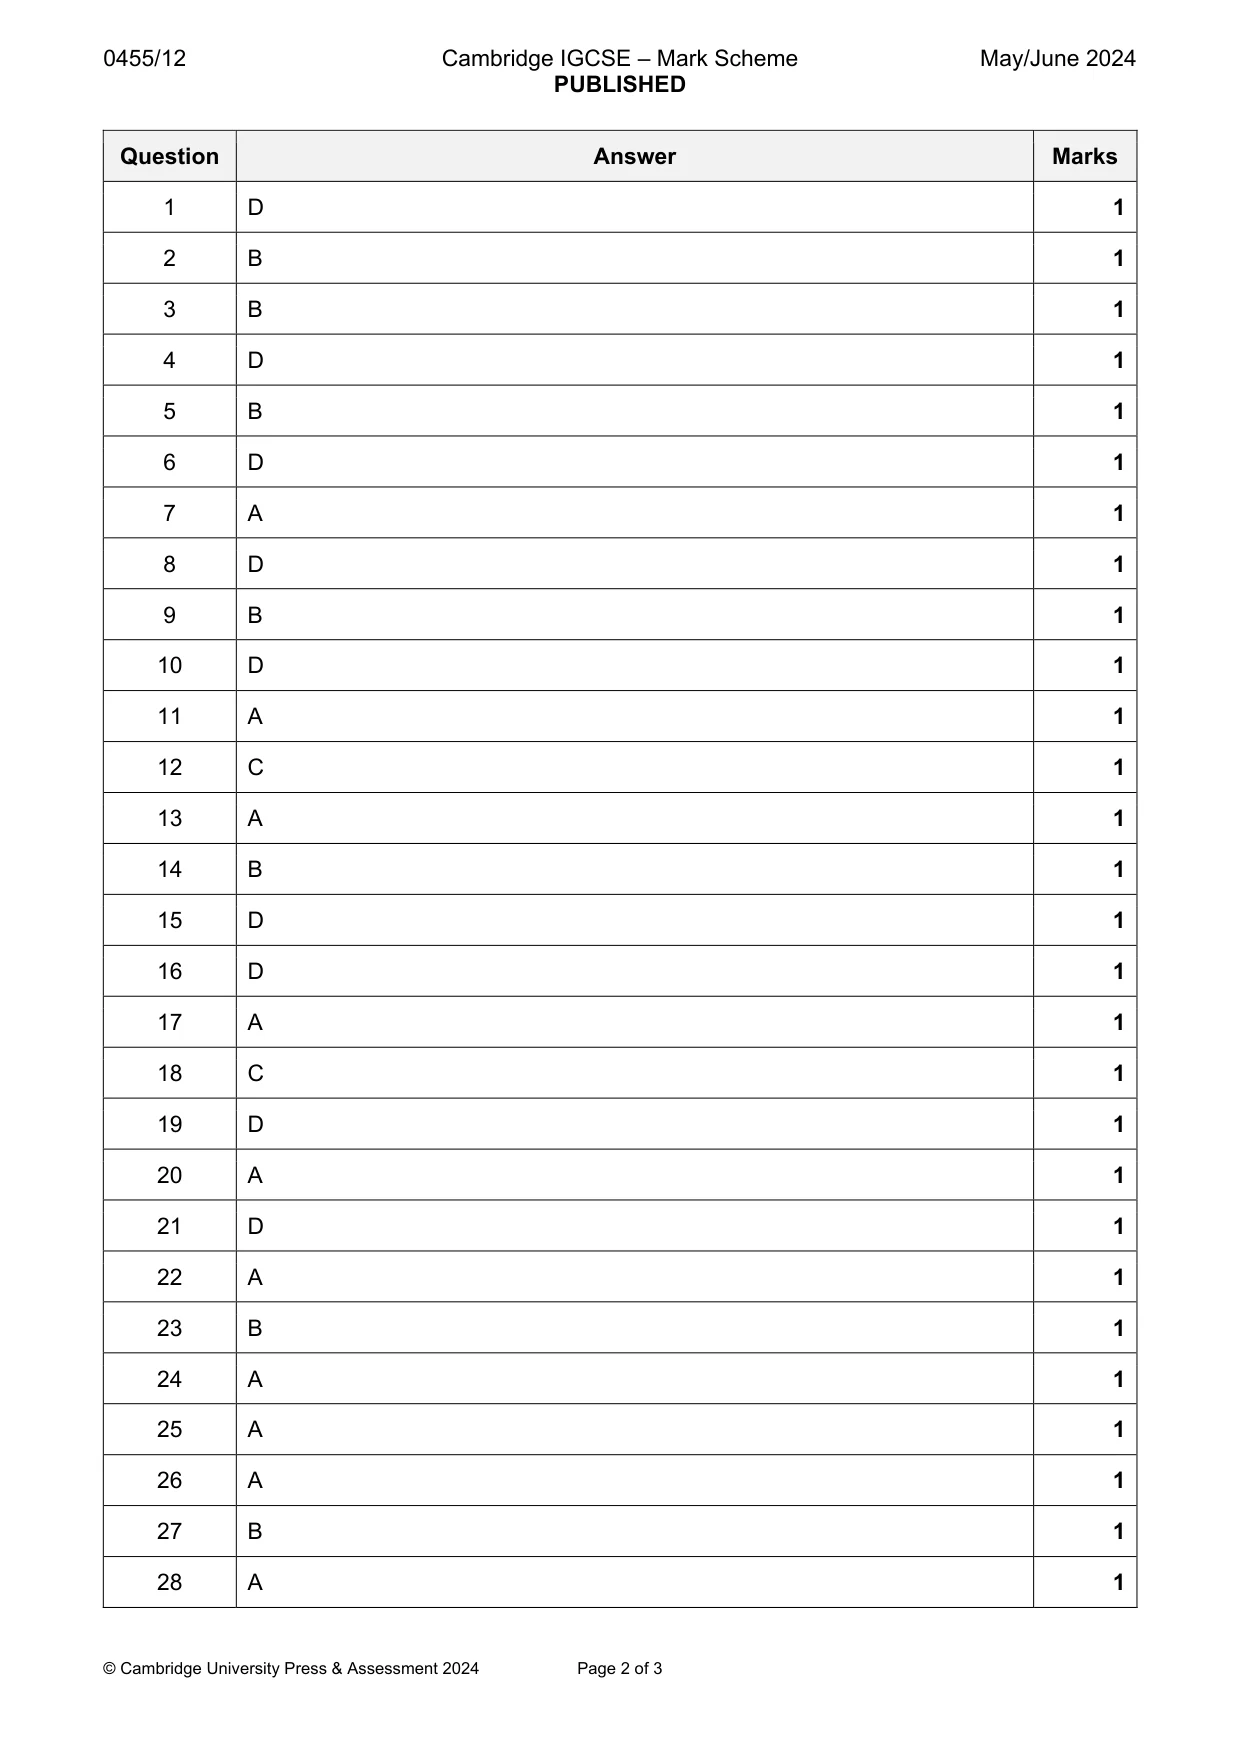
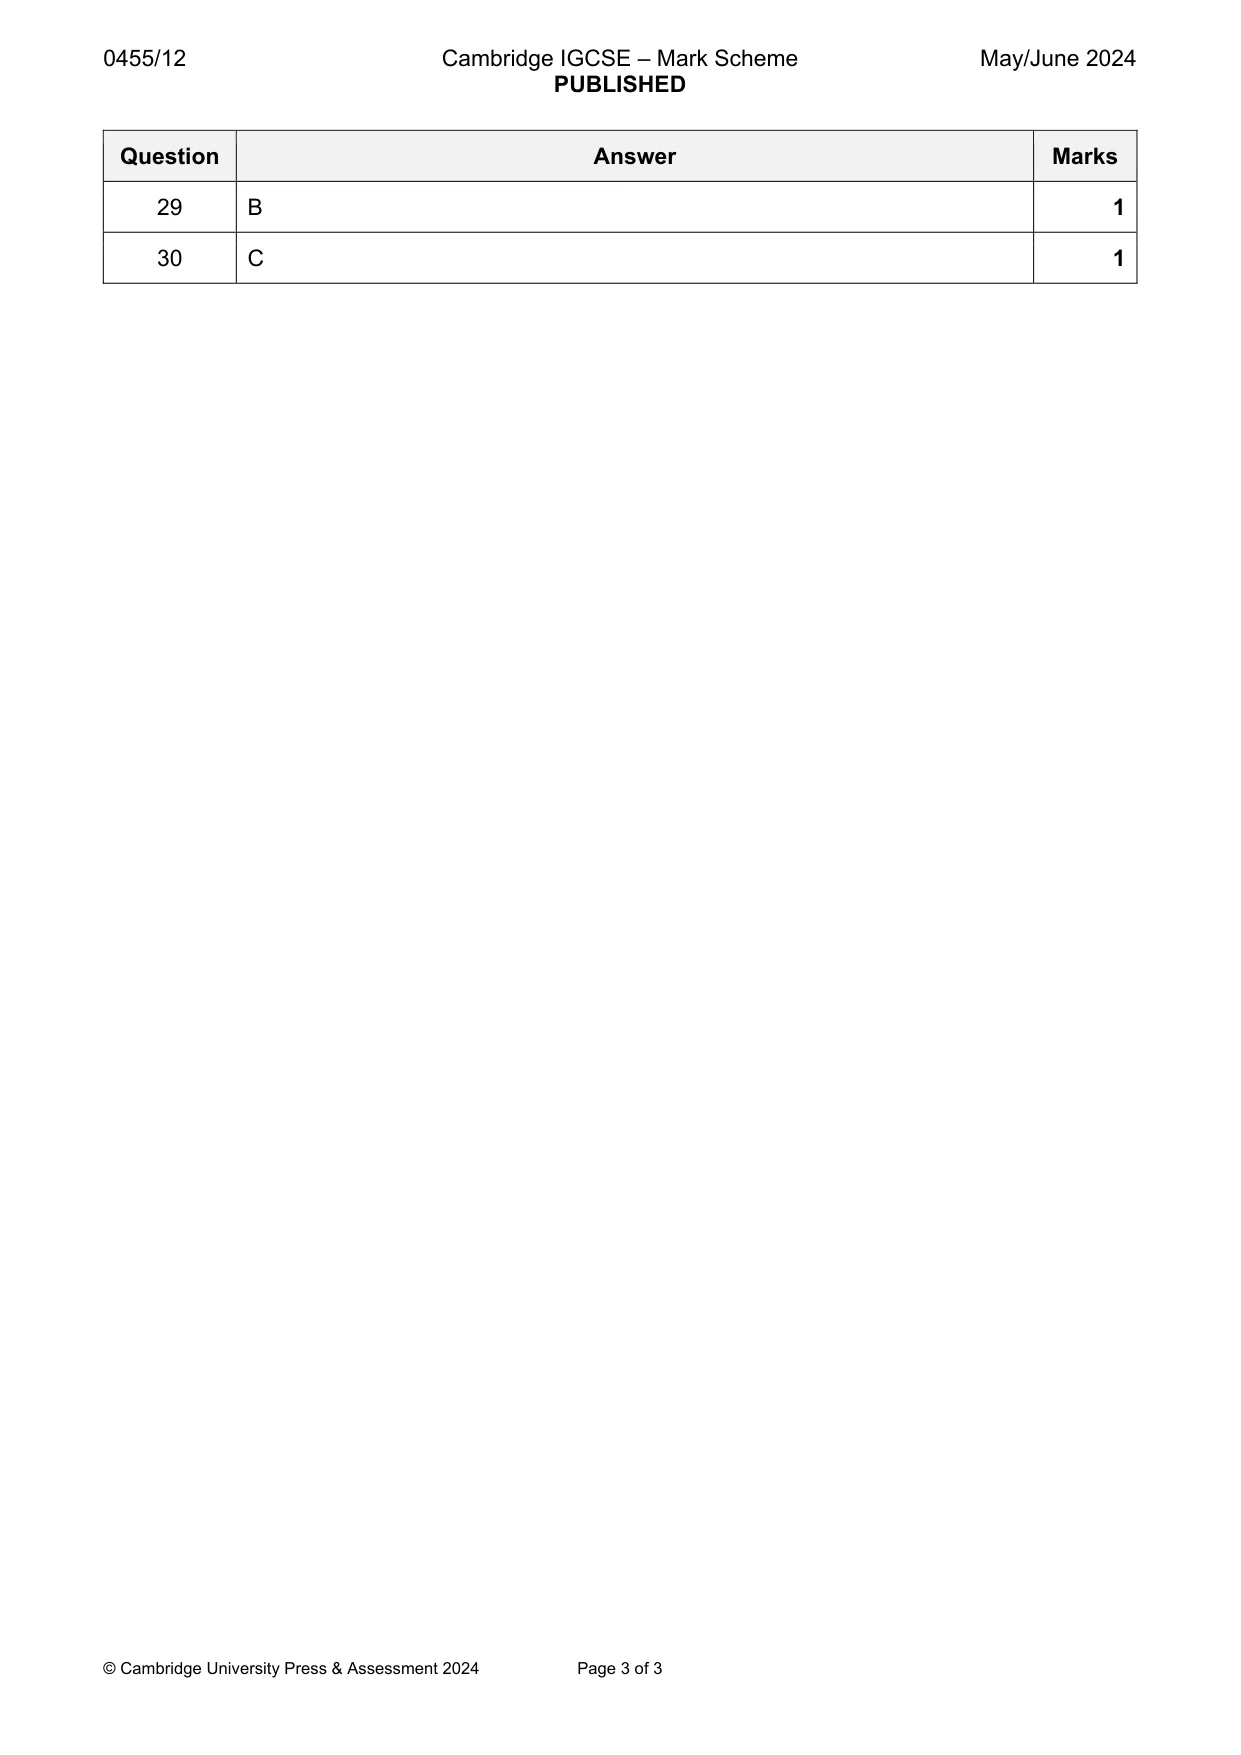
Answers below. Sit the paper first if you are practising.
Questions as text
Q1 · Why will scarcity always exist?
1 Why will scarcity always exist? A There are high costs of production. B There are low levels of education. C There are unlimited resources. D There are unlimited wants.
Mark scheme: D
Q2 · A student decides to take up a two-year apprenticeship for which she will earn $10 000…
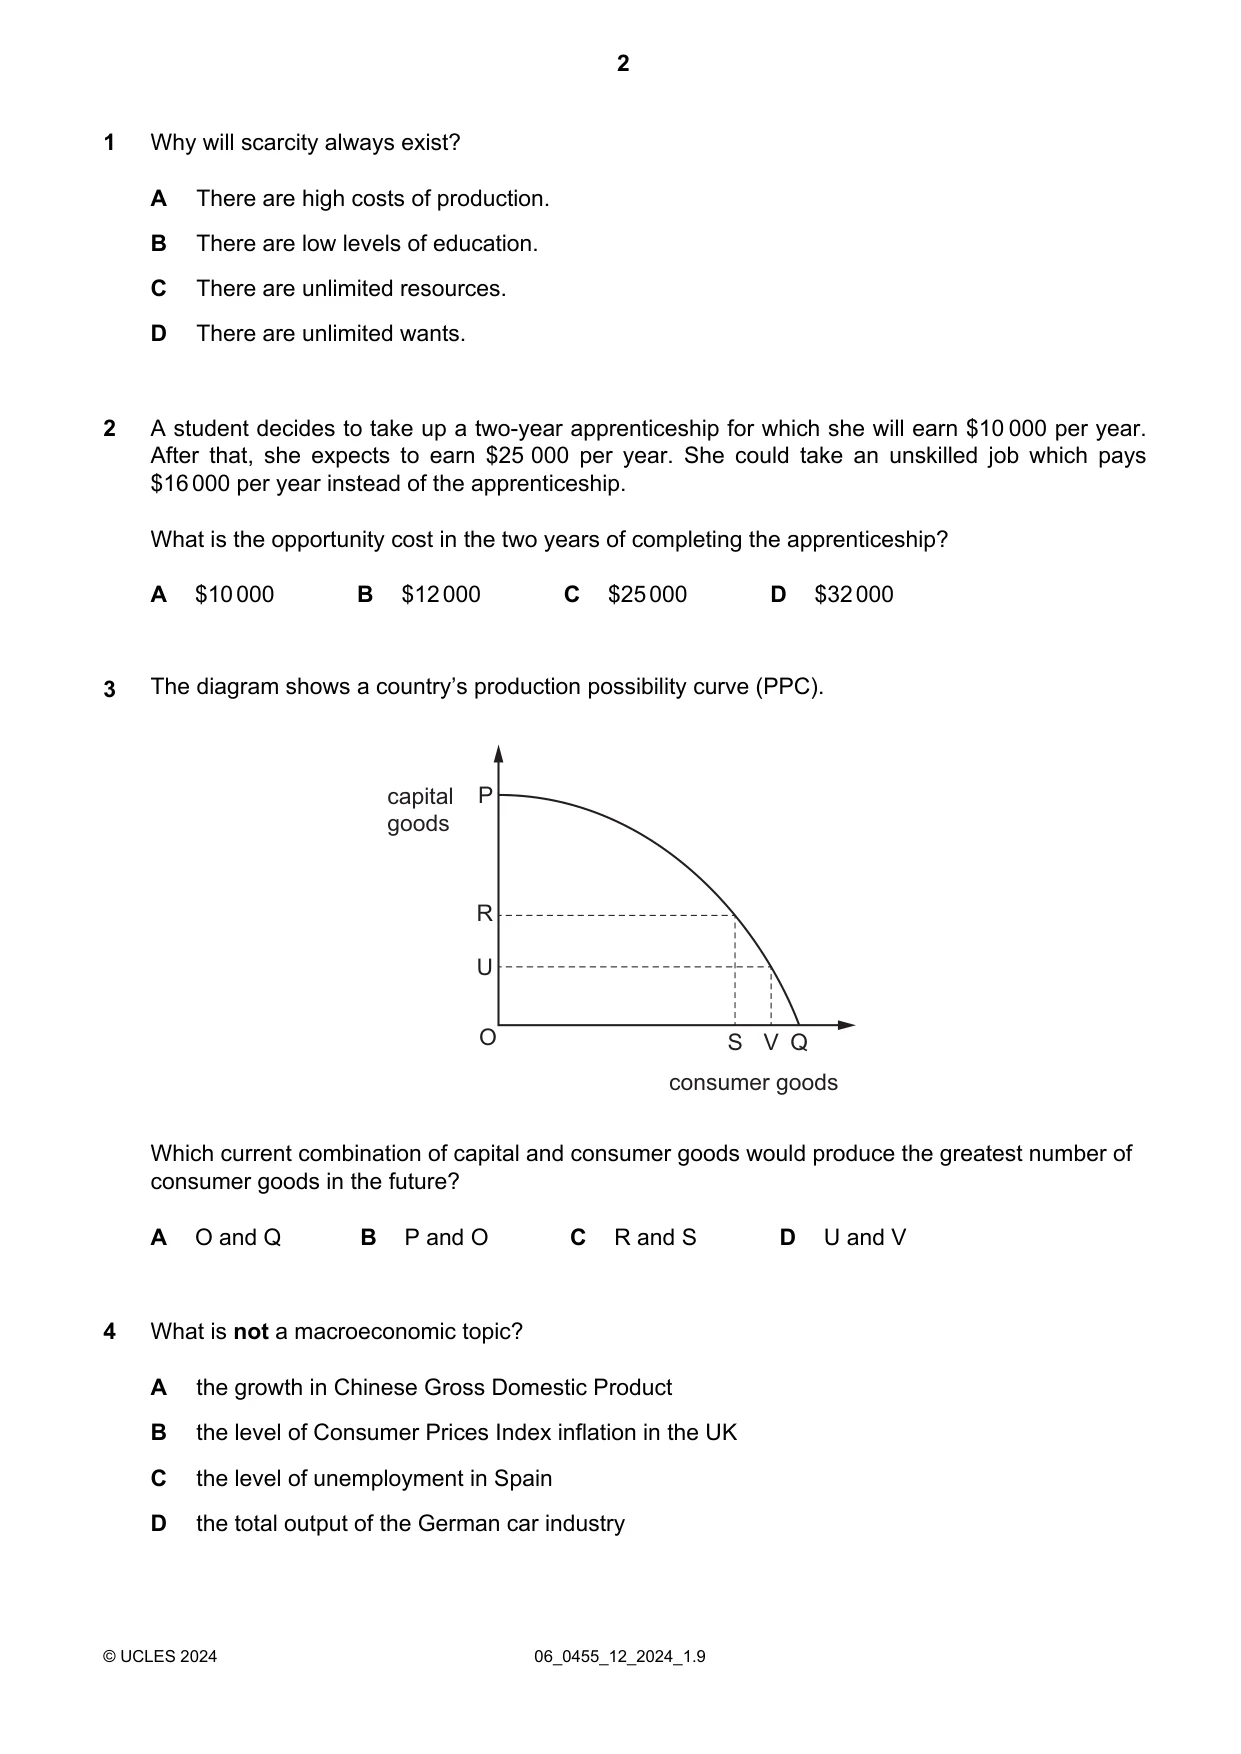
2 A student decides to take up a two-year apprenticeship for which she will earn $10 000 per year. After that, she expects to earn $25 000 per year. She could take an unskilled job which pays $16 000 per year instead of the apprenticeship. What is the opportunity cost in the two years of completing the apprenticeship? A $10 000 B $12 000 C $25 000 D $32 000 The diagram shows a country’s production possibility curve (PPC).
Mark scheme: B
Q3 · Capital P goods R U O S V Q consumer goods Which current combination of capital and…
3 capital P goods R U O S V Q consumer goods Which current combination of capital and consumer goods would produce the greatest number of consumer goods in the future? A O and Q B P and O C R and S D U and V
Mark scheme: B
More questions on Production possibility curve (PPC) diagrams
Q4 · What is not a macroeconomic topic?
4 What is not a macroeconomic topic? A the growth in Chinese Gross Domestic Product B the level of Consumer Prices Index inflation in the UK C the level of unemployment in Spain D the total output of the German car industry
Mark scheme: D
Q5 · What is likely to cause an extension in demand for a firm’s fruit drink?
5 What is likely to cause an extension in demand for a firm’s fruit drink? A a period of hot weather B a reduction in the cost of producing the drink C a rival firm leaving the market D a successful advertising campaign by the firm
Mark scheme: B
Q6 · Supermarkets sell petrol (gas) outside their stores
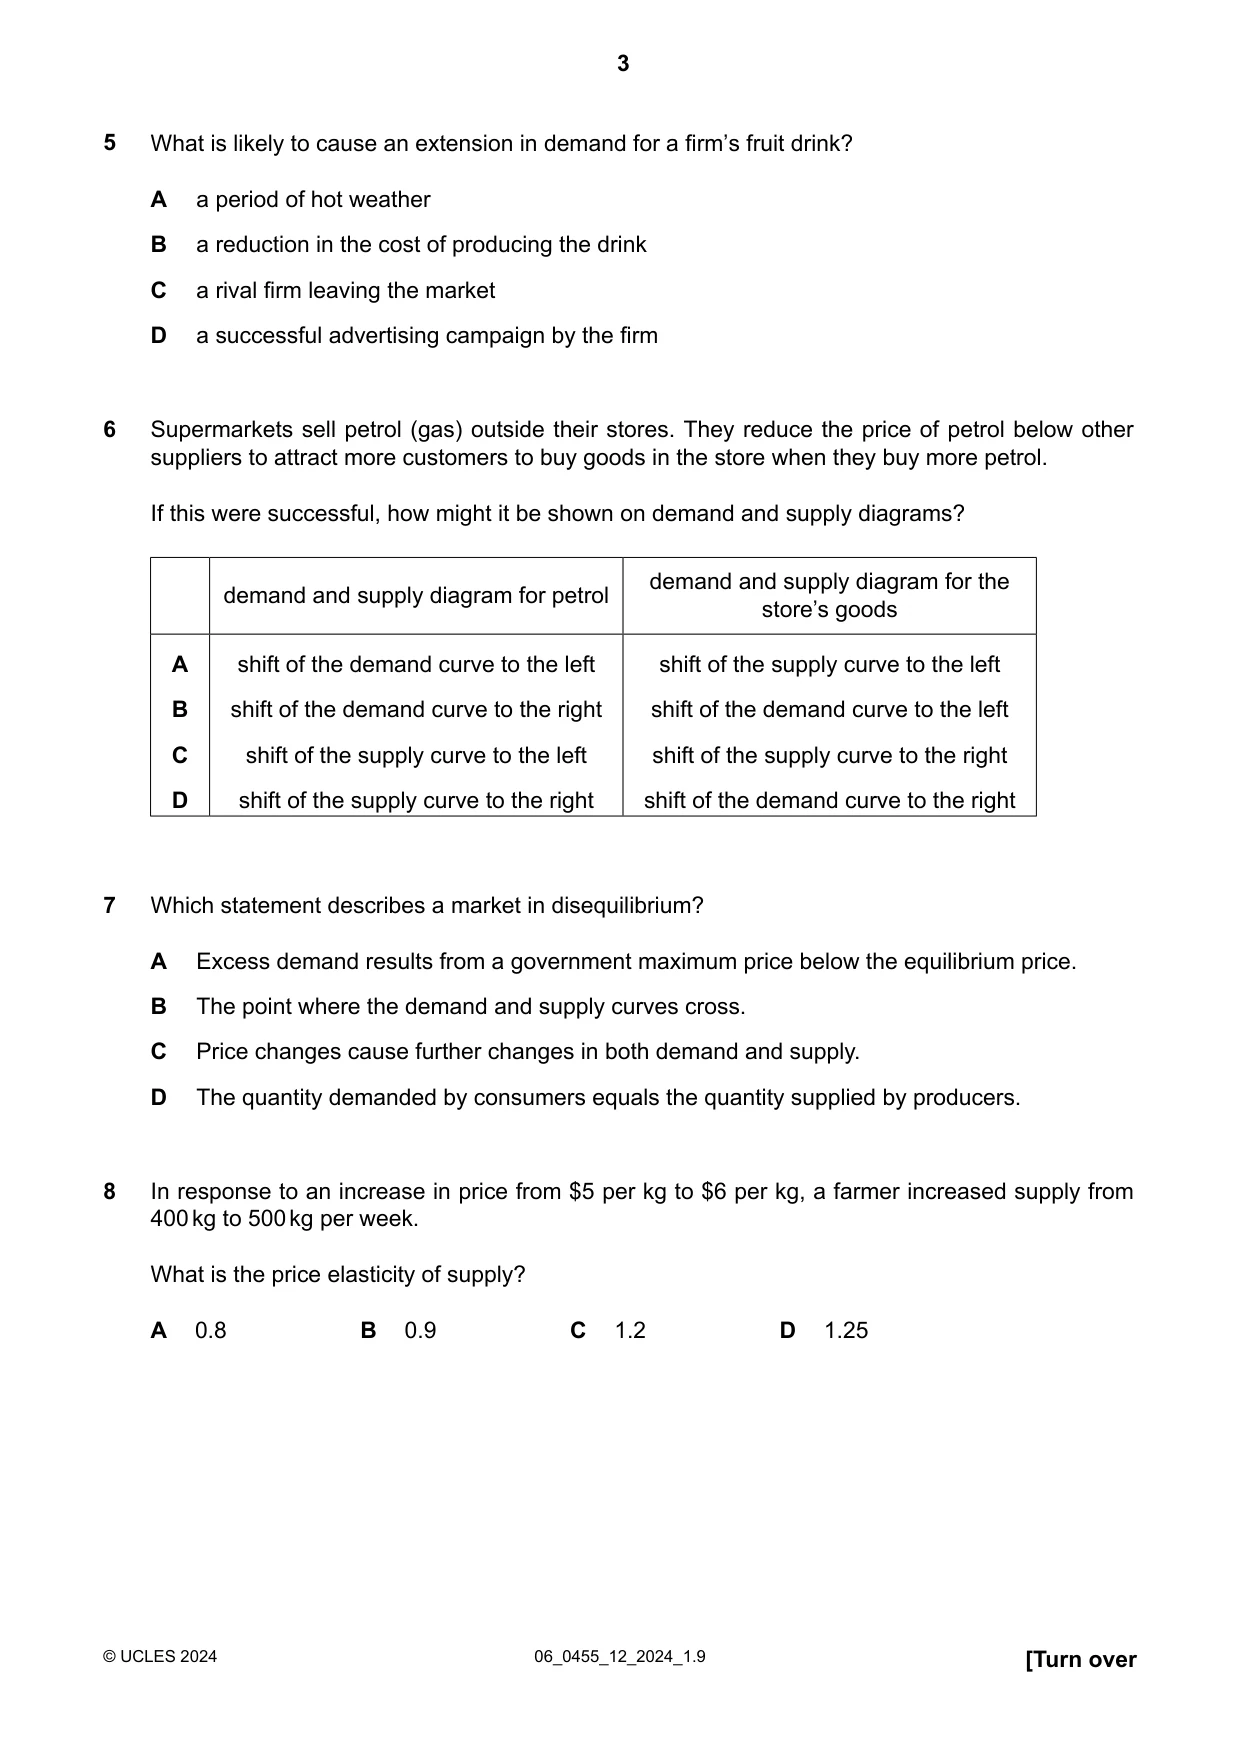
6 Supermarkets sell petrol (gas) outside their stores. They reduce the price of petrol below other suppliers to attract more customers to buy goods in the store when they buy more petrol. If this were successful, how might it be shown on demand and supply diagrams? demand and supply diagram for the demand and supply diagram for petrol store’s goods A shift of the demand curve to the left shift of the supply curve to the left B shift of the demand curve to the right shift of the demand curve to the left C shift of the supply curve to the left shift of the supply curve to the right D shift of the supply curve to the right shift of the demand curve to the right
Mark scheme: D
Q7 · Which statement describes a market in disequilibrium?
7 Which statement describes a market in disequilibrium? A Excess demand results from a government maximum price below the equilibrium price. B The point where the demand and supply curves cross. C Price changes cause further changes in both demand and supply. D The quantity demanded by consumers equals the quantity supplied by producers.
Mark scheme: A
Q8 · In response to an increase in price from $5 per kg to $6 per kg, a farmer increased…
8 In response to an increase in price from $5 per kg to $6 per kg, a farmer increased supply from 400 kg to 500 kg per week. What is the price elasticity of supply? A 0.8 B 0.9 C 1.2 D 1.25
Mark scheme: D
Q9 · Which government measure is most likely to cause a fall both in price and in quantity…
9 Which government measure is most likely to cause a fall both in price and in quantity traded? A indirect tax B maximum price C minimum price D subsidy
Mark scheme: B
Q10 · The diagrams show the wage rates of cleaners (OWc) and nurses (OWn)
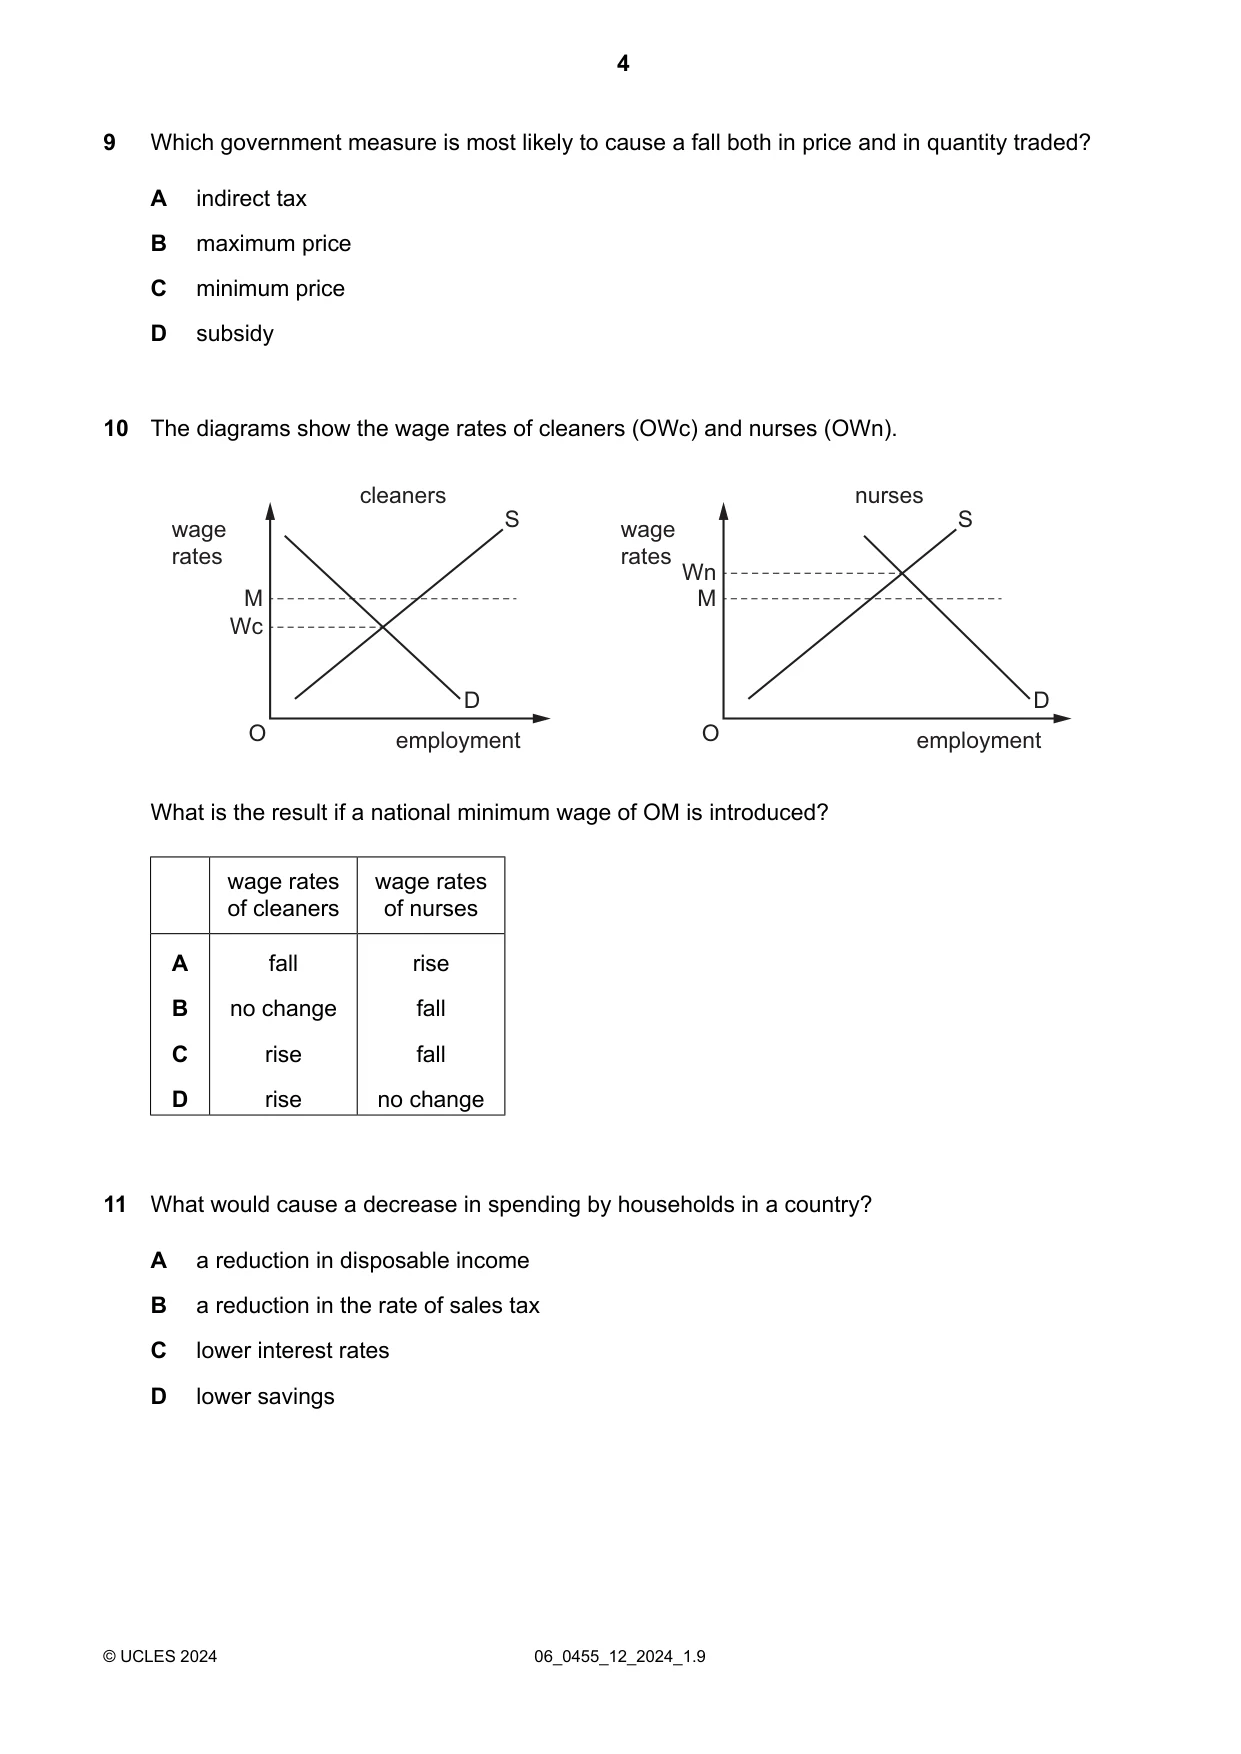
10 The diagrams show the wage rates of cleaners (OWc) and nurses (OWn). cleaners nurses wage S wage S rates rates Wn M M Wc D D O employment O employment What is the result if a national minimum wage of OM is introduced? wage rates wage rates of cleaners of nurses A fall rise B no change fall C rise fall D rise no change
Mark scheme: D
Q11 · What would cause a decrease in spending by households in a country?
11 What would cause a decrease in spending by households in a country? A a reduction in disposable income B a reduction in the rate of sales tax C lower interest rates D lower savings
Mark scheme: A
Q12 · Which combination shows the advantages of a small firm over a larger firm?
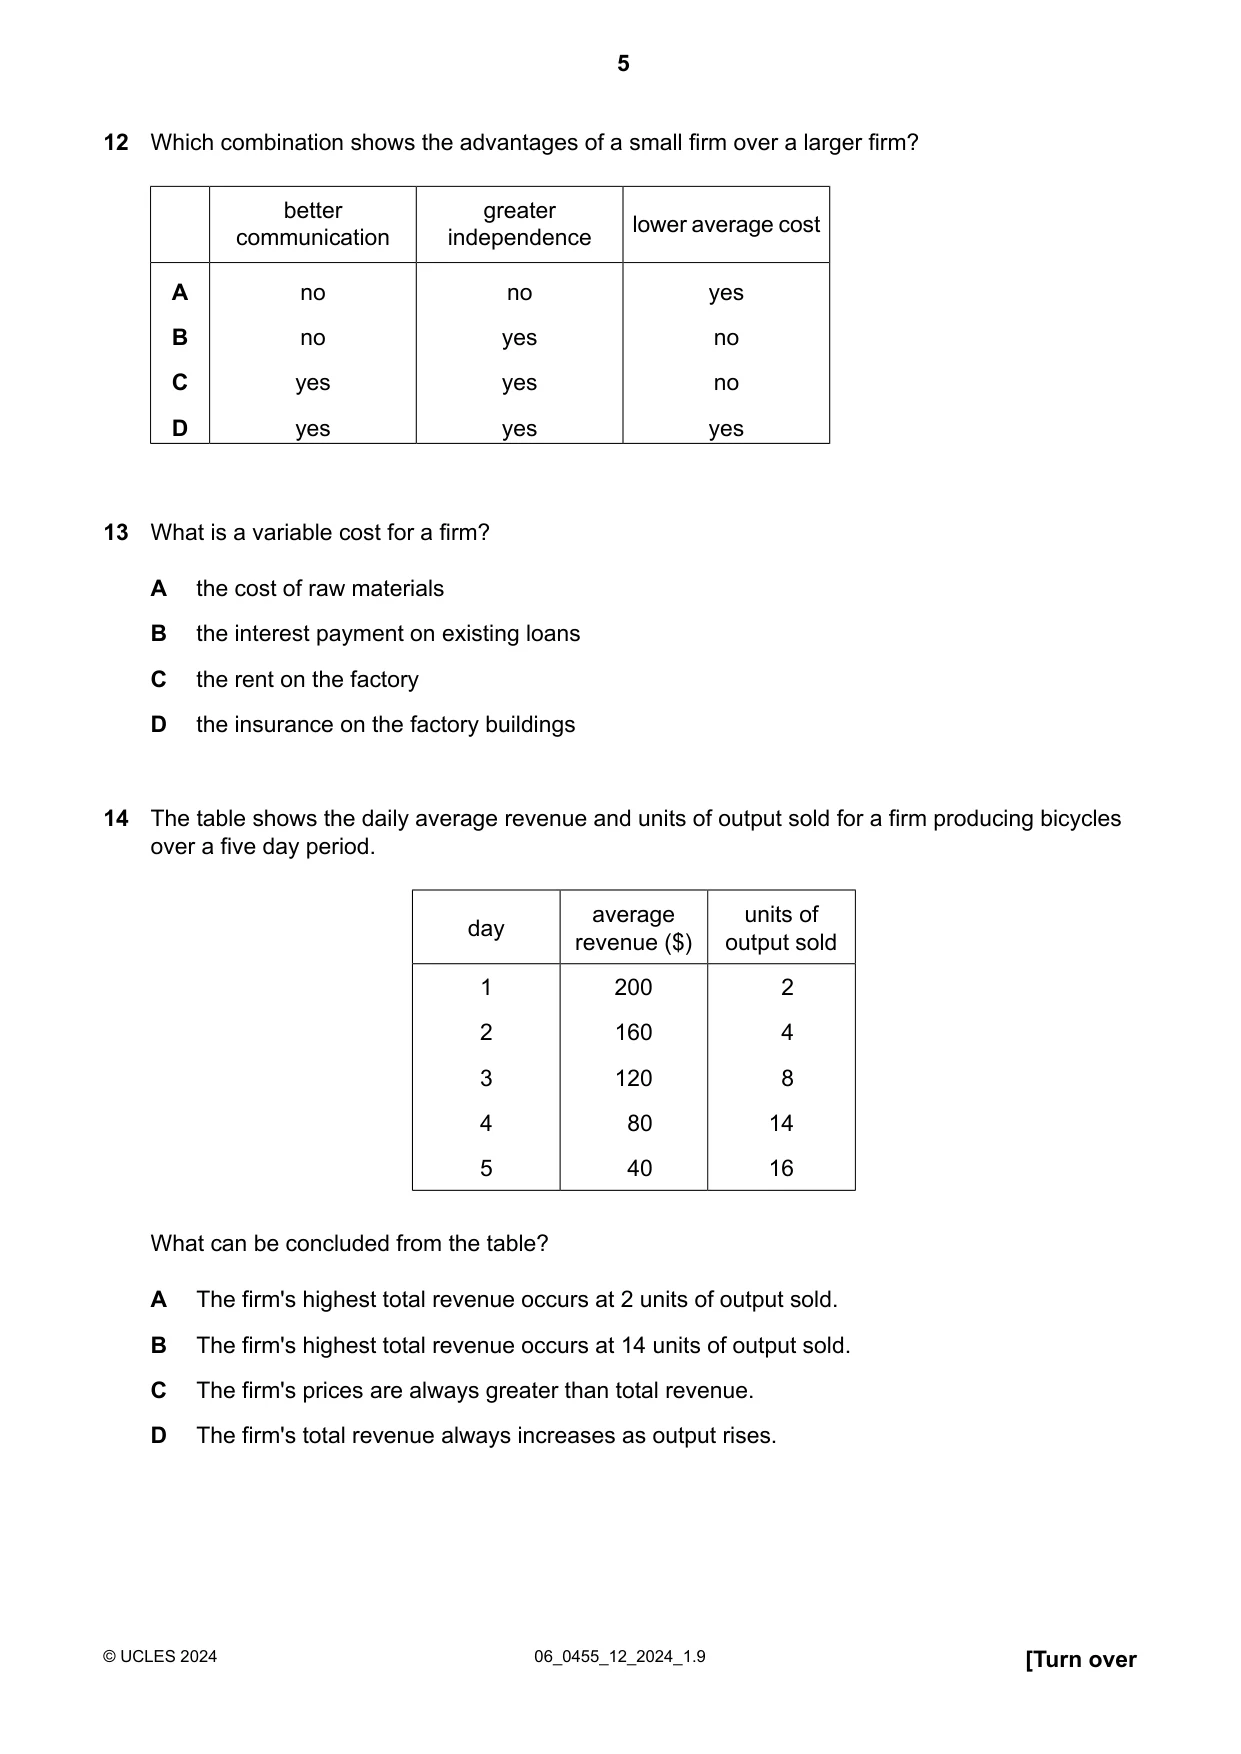
12 Which combination shows the advantages of a small firm over a larger firm? better greater lower average cost communication independence A no no yes B no yes no C yes yes no D yes yes yes
Mark scheme: C
Q13 · What is a variable cost for a firm?
13 What is a variable cost for a firm? A the cost of raw materials B the interest payment on existing loans C the rent on the factory D the insurance on the factory buildings
Mark scheme: A
Q14 · The table shows the daily average revenue and units of output sold for a firm producing…
14 The table shows the daily average revenue and units of output sold for a firm producing bicycles over a five day period. average units of day revenue ($) output sold 1 200 2 2 160 4 3 120 8 4 80 14 5 40 16 What can be concluded from the table? A The firm's highest total revenue occurs at 2 units of output sold. B The firm's highest total revenue occurs at 14 units of output sold. C The firm's prices are always greater than total revenue. D The firm's total revenue always increases as output rises.
Mark scheme: B
Q15 · Which function of money acts as a measure of value?
15 Which function of money acts as a measure of value? A a medium of exchange B a standard of deferred payment C a store of wealth D a unit of account
Mark scheme: D
Q16 · What are the features of a highly competitive market when compared with a monopoly market?
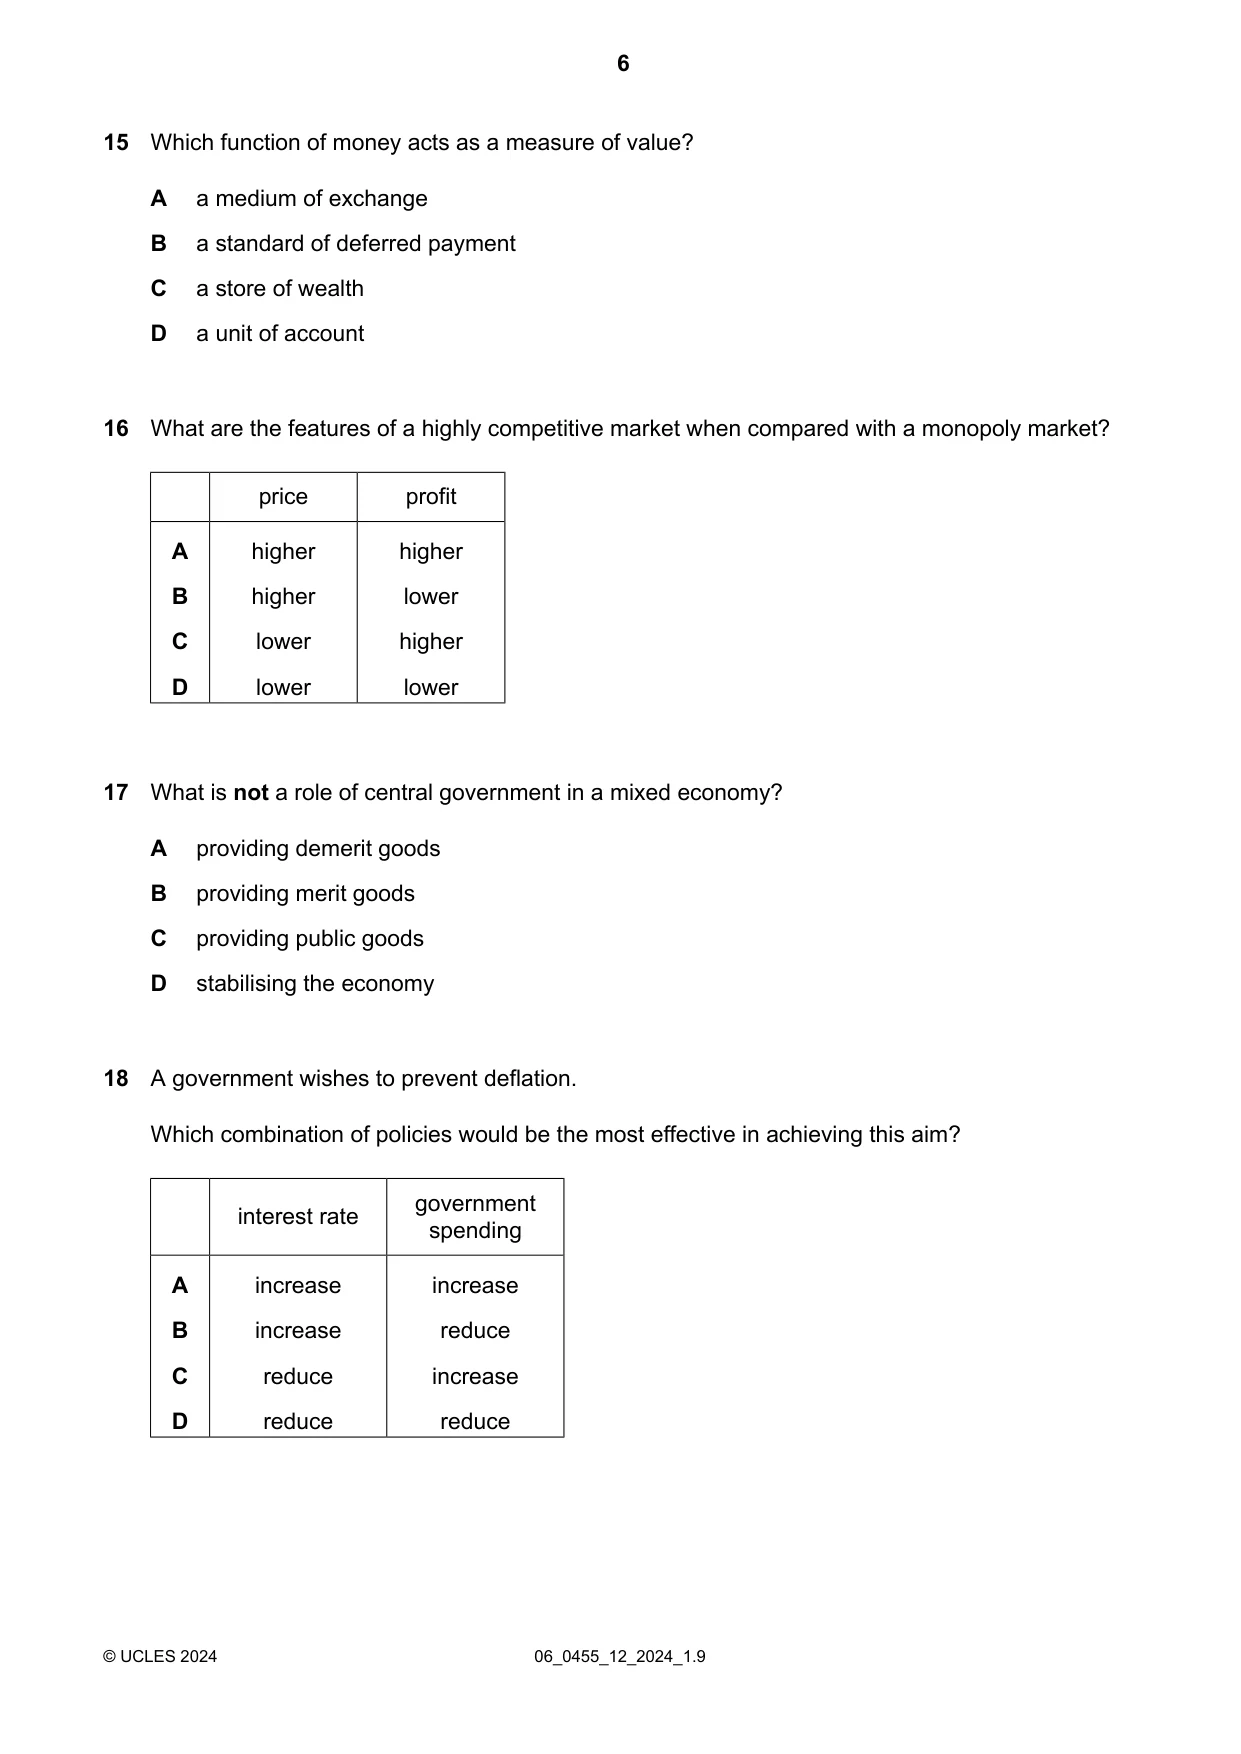
16 What are the features of a highly competitive market when compared with a monopoly market? price profit A higher higher B higher lower C lower higher D lower lower
Mark scheme: D
Q17 · What is not a role of central government in a mixed economy?
17 What is not a role of central government in a mixed economy? A providing demerit goods B providing merit goods C providing public goods D stabilising the economy
Mark scheme: A
Q18 · A government wishes to prevent deflation
18 A government wishes to prevent deflation. Which combination of policies would be the most effective in achieving this aim? government interest rate spending A increase increase B increase reduce C reduce increase D reduce reduce
Mark scheme: C
Q19 · The diagram shows the impact of a tax introduced on a product
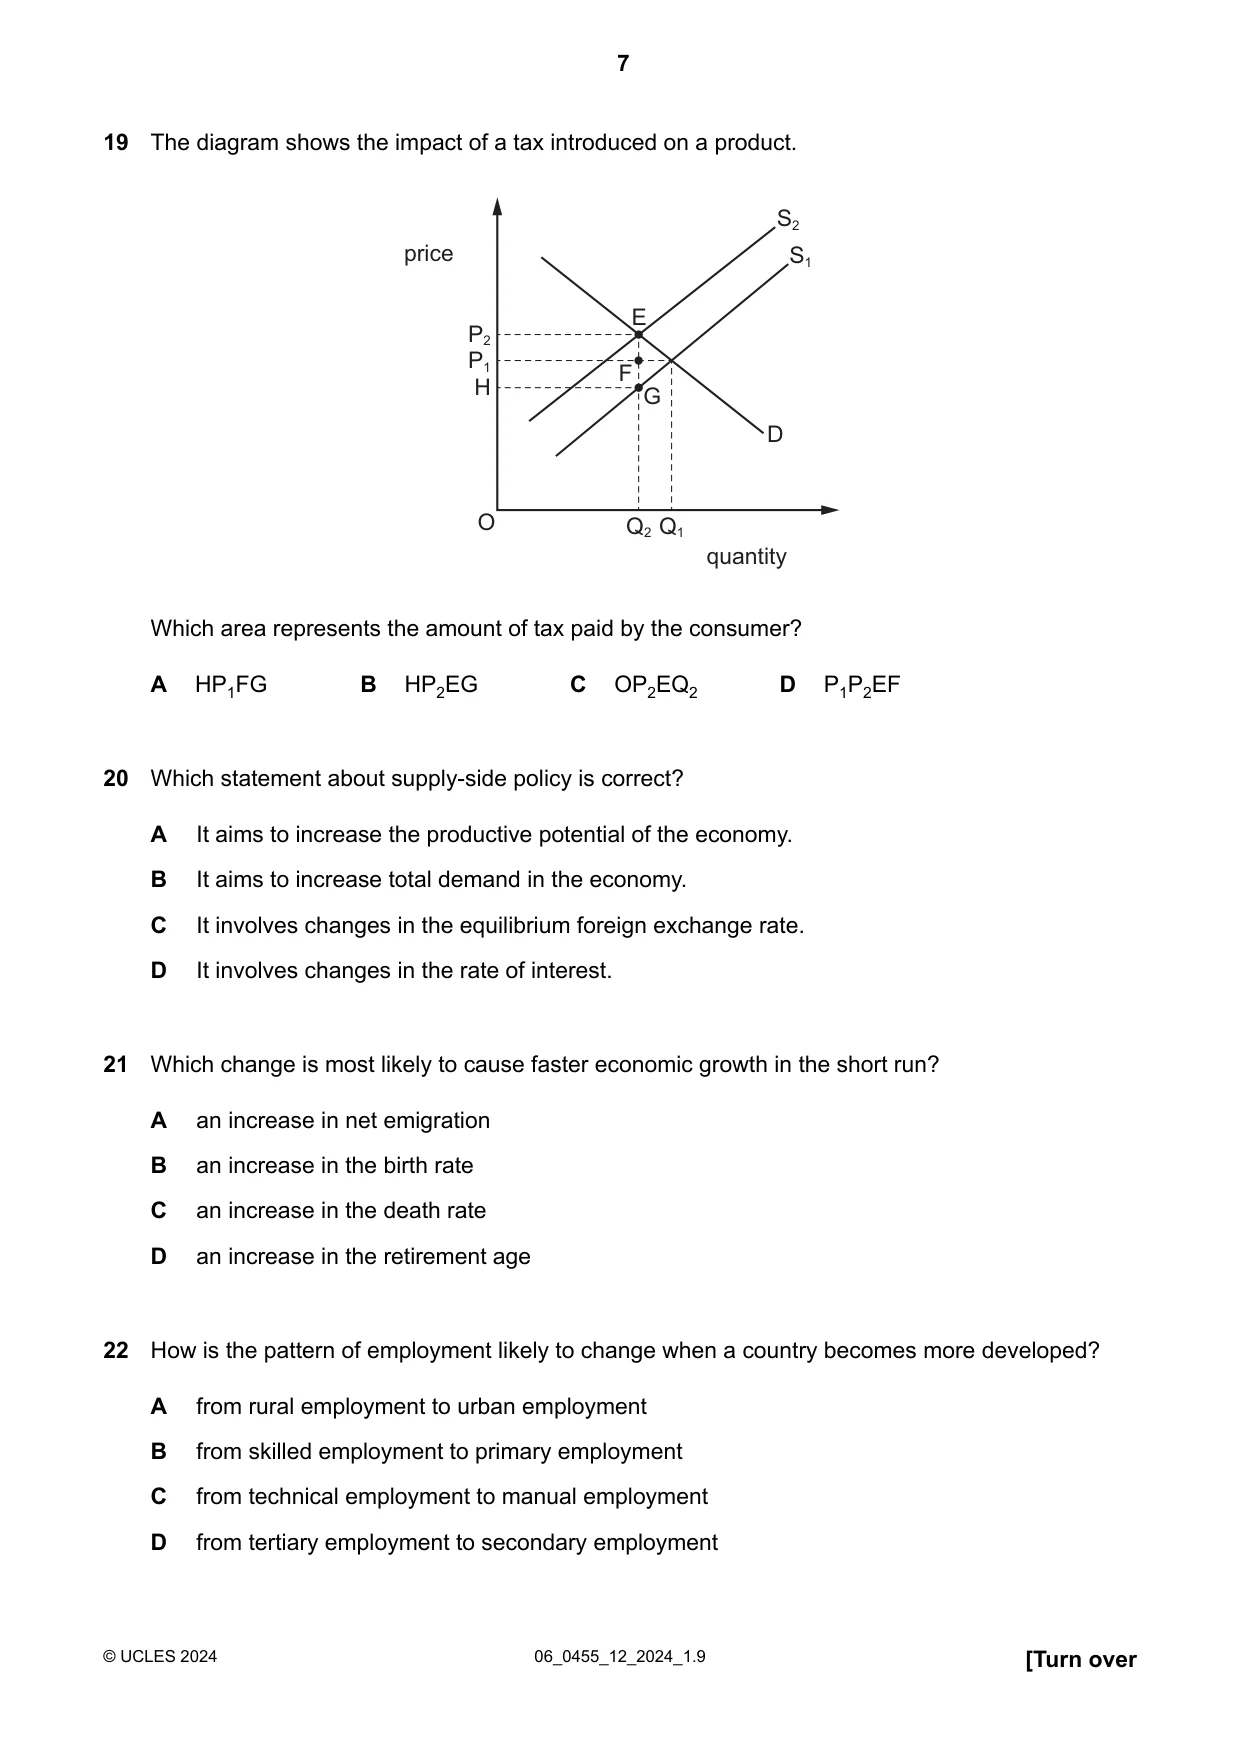
19 The diagram shows the impact of a tax introduced on a product. S2 price S1 E P2 P1 F H G D O Q2 Q1 quantity Which area represents the amount of tax paid by the consumer? A HP1FG B HP2EG C OP2EQ2 D P1P2EF
Mark scheme: D
Q20 · Which statement about supply-side policy is correct?
20 Which statement about supply-side policy is correct? A It aims to increase the productive potential of the economy. B It aims to increase total demand in the economy. C It involves changes in the equilibrium foreign exchange rate. D It involves changes in the rate of interest.
Mark scheme: A
Q21 · Which change is most likely to cause faster economic growth in the short run?
21 Which change is most likely to cause faster economic growth in the short run? A an increase in net emigration B an increase in the birth rate C an increase in the death rate D an increase in the retirement age
Mark scheme: D
Q22 · How is the pattern of employment likely to change when a country becomes more developed?
22 How is the pattern of employment likely to change when a country becomes more developed? A from rural employment to urban employment B from skilled employment to primary employment C from technical employment to manual employment D from tertiary employment to secondary employment
Mark scheme: A
More questions on Differences in economic development between countries
Q23 · Which item is least likely to be included in the Consumer Prices Index (CPI)?
23 Which item is least likely to be included in the Consumer Prices Index (CPI)? A domestic cooking oil B homemade clothes C milk D personal mobile phones
Mark scheme: B
Q24 · The table shows statistics for four countries A, B, C and D
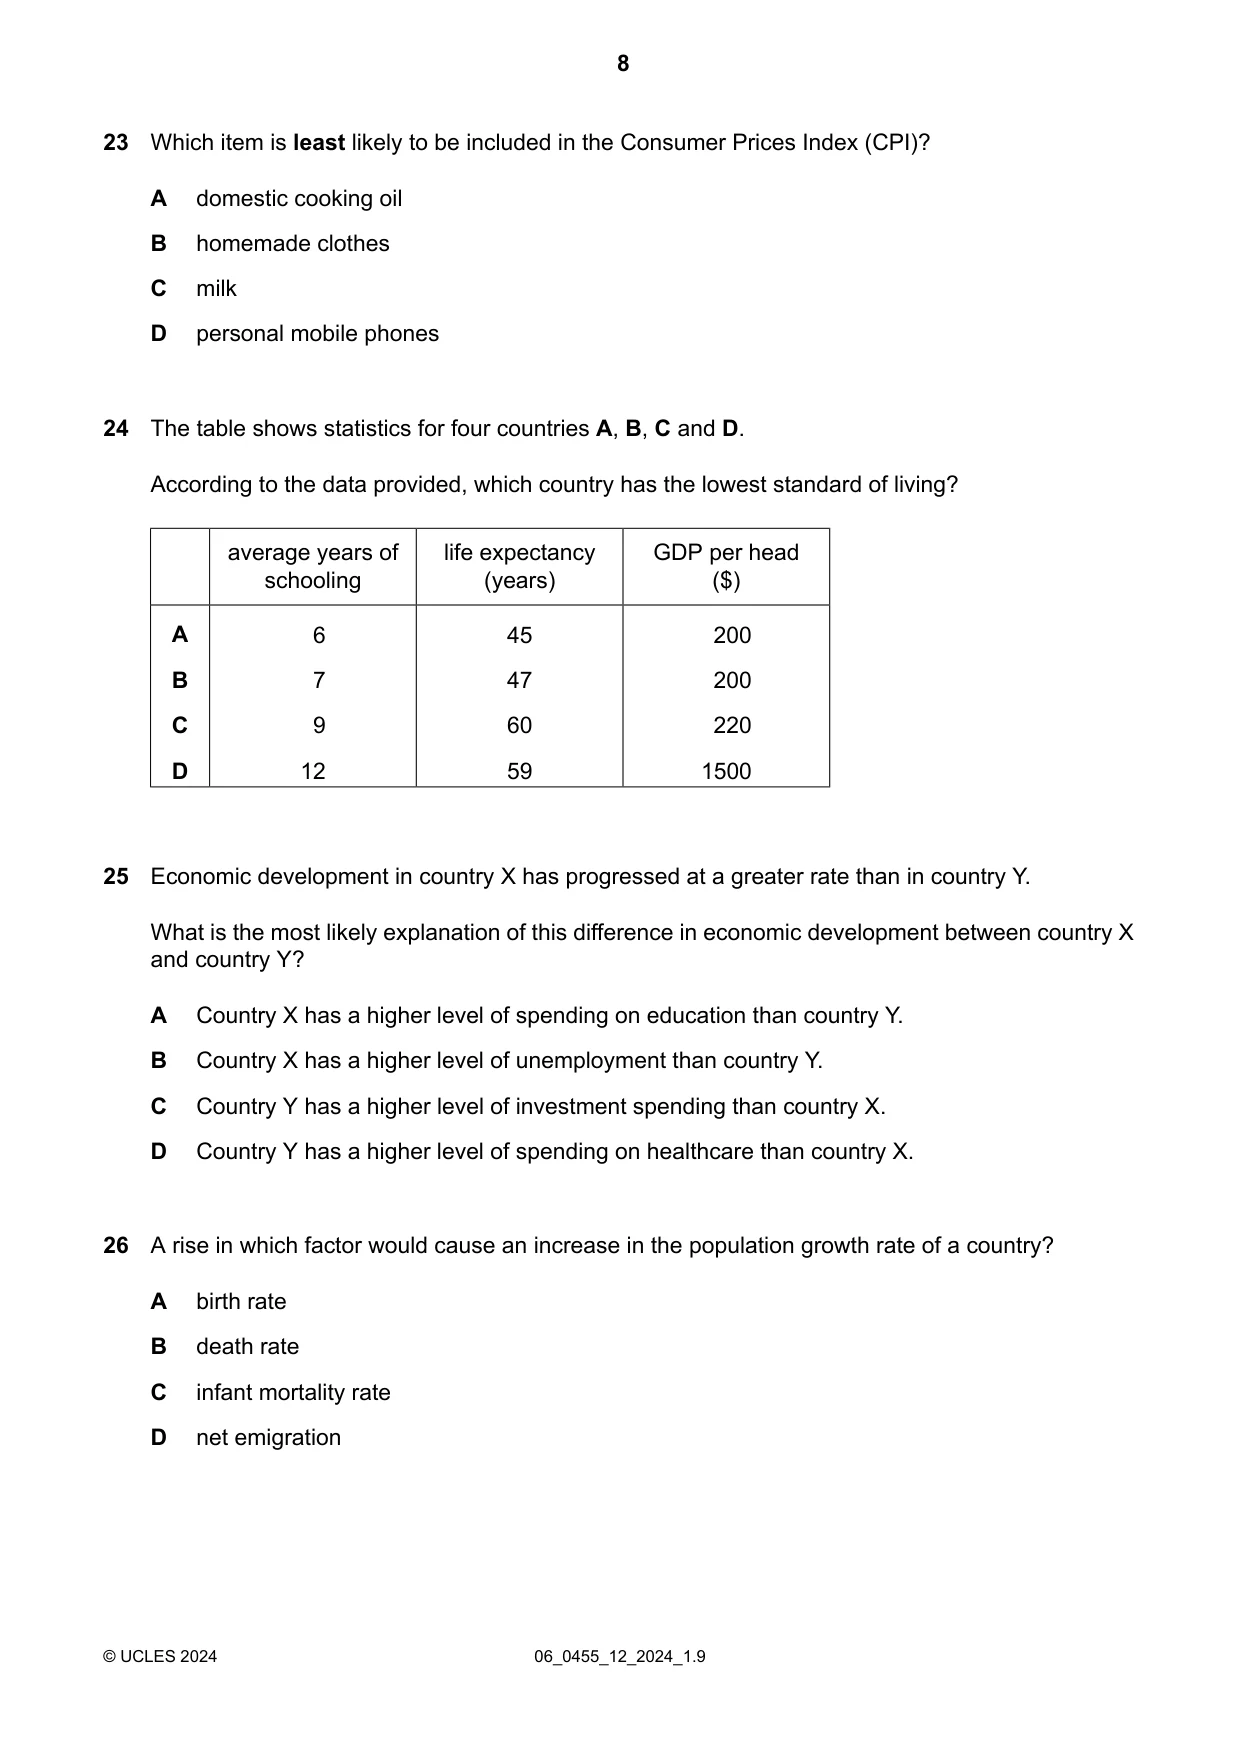
24 The table shows statistics for four countries A, B, C and D. According to the data provided, which country has the lowest standard of living? average years of life expectancy GDP per head schooling (years) ($) A 6 45 200 B 7 47 200 C 9 60 220 D 12 59 1500
Mark scheme: A
Q25 · Economic development in country X has progressed at a greater rate than in country Y
25 Economic development in country X has progressed at a greater rate than in country Y. What is the most likely explanation of this difference in economic development between country X and country Y? A Country X has a higher level of spending on education than country Y. B Country X has a higher level of unemployment than country Y. C Country Y has a higher level of investment spending than country X. D Country Y has a higher level of spending on healthcare than country X.
Mark scheme: A
More questions on Differences in economic development between countries
Q26 · A rise in which factor would cause an increase in the population growth rate of a country?
26 A rise in which factor would cause an increase in the population growth rate of a country? A birth rate B death rate C infant mortality rate D net emigration
Mark scheme: A
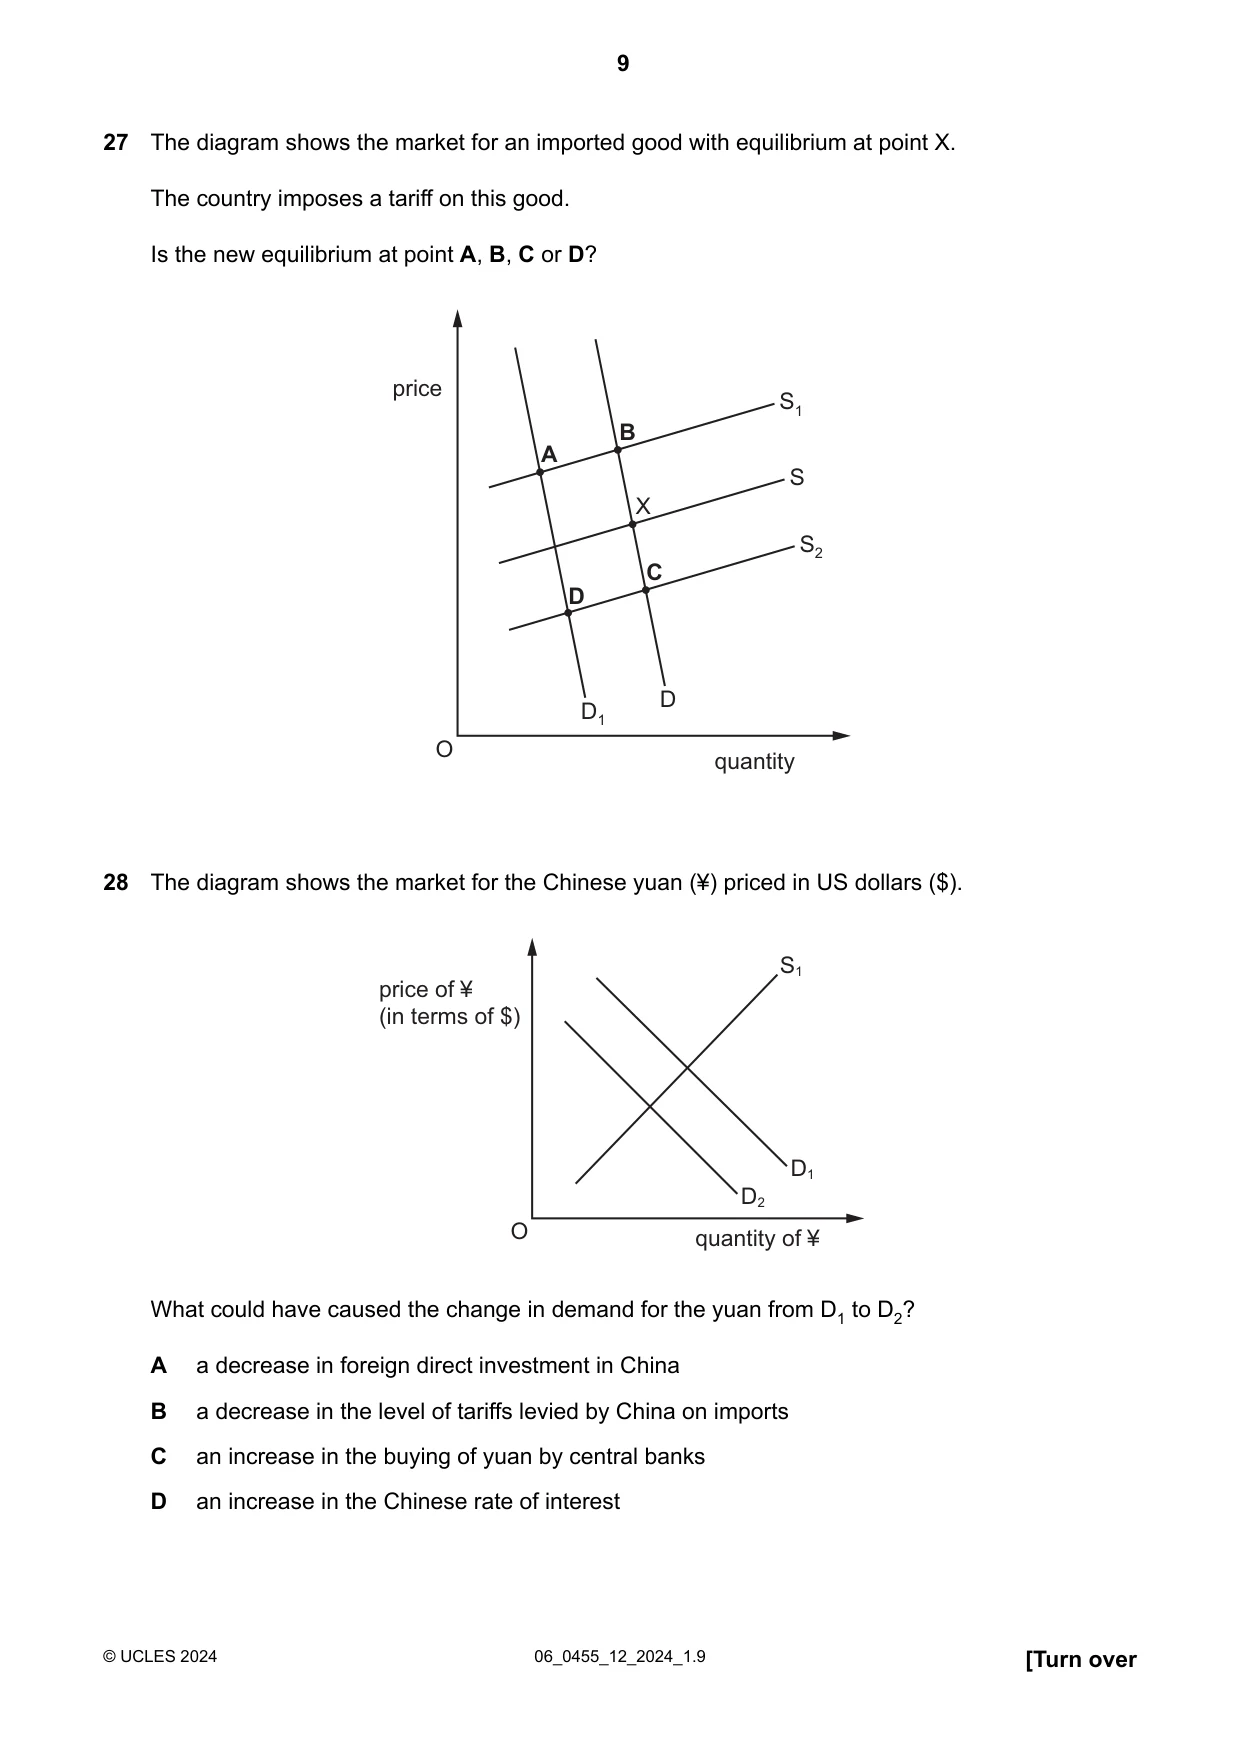
Q27 · The diagram shows the market for an imported good with equilibrium at point X
27 The diagram shows the market for an imported good with equilibrium at point X. The country imposes a tariff on this good. Is the new equilibrium at point A, B, C or D? price S1 B A S X S2 C D D D1 O quantity
Mark scheme: B
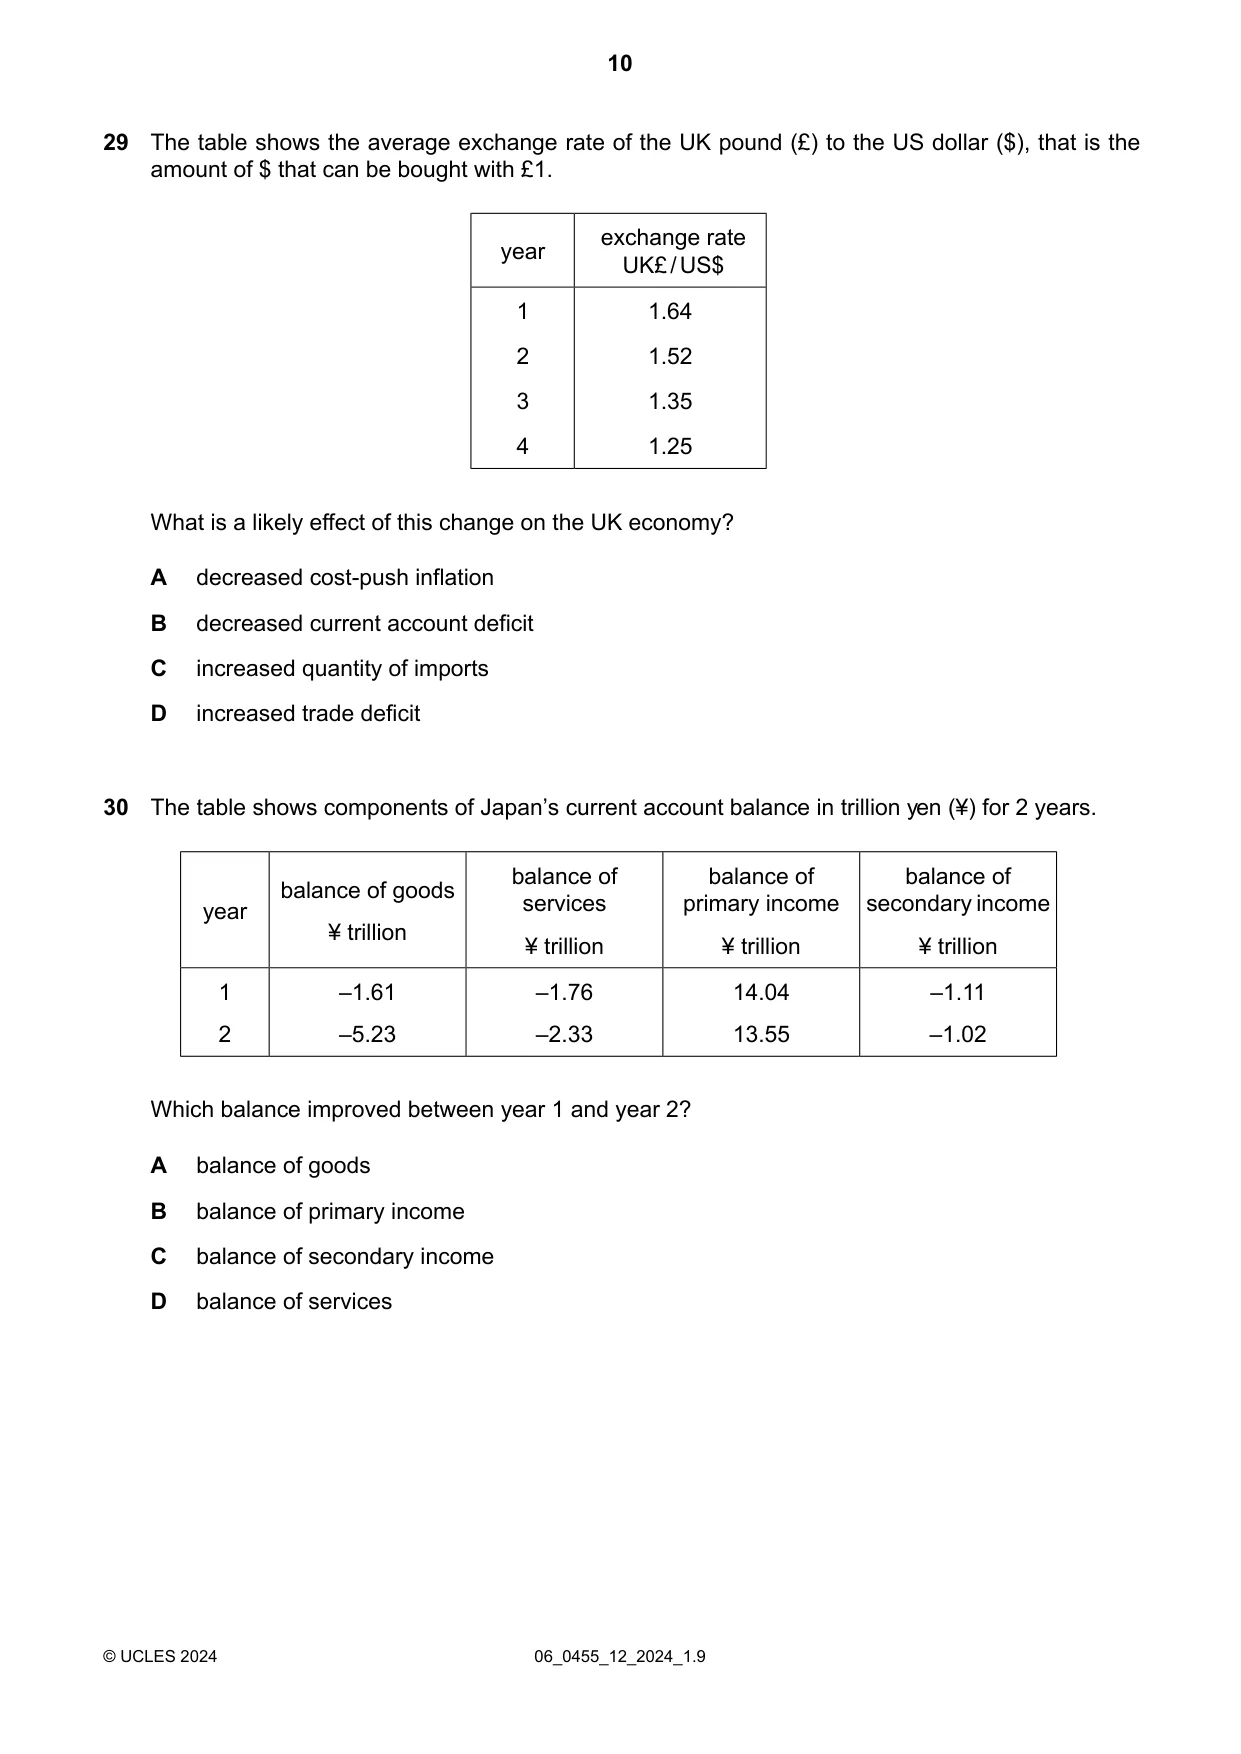
Q28 · The diagram shows the market for the Chinese yuan (¥) priced in US dollars ($)
28 The diagram shows the market for the Chinese yuan (¥) priced in US dollars ($). S1 price of ¥ (in terms of $) D1 D2 O quantity of ¥ What could have caused the change in demand for the yuan from D1 to D2? A a decrease in foreign direct investment in China B a decrease in the level of tariffs levied by China on imports C an increase in the buying of yuan by central banks D an increase in the Chinese rate of interest
Mark scheme: A
Q29 · The table shows the average exchange rate of the UK pound (£) to the US dollar ($), that…
29 The table shows the average exchange rate of the UK pound (£) to the US dollar ($), that is the amount of $ that can be bought with £1. exchange rate year UK£ / US$ 1 1.64 2 1.52 3 1.35 4 1.25 What is a likely effect of this change on the UK economy? A decreased cost-push inflation B decreased current account deficit C increased quantity of imports D increased trade deficit
Mark scheme: B
Q30 · The table shows components of Japan’s current account balance in trillion yen (¥) for 2…
30 The table shows components of Japan’s current account balance in trillion yen (¥) for 2 years. balance of balance of balance of balance of goods year services primary income secondary income ¥ trillion ¥ trillion ¥ trillion ¥ trillion 1 –1.61 –1.76 14.04 –1.11 2 –5.23 –2.33 13.55 –1.02 Which balance improved between year 1 and year 2? A balance of goods B balance of primary income C balance of secondary income D balance of services
Mark scheme: C
What was in this paper
The subtopics covered by these 30 questions, and how many questions each got. Open one in a new tab to see every Cambridge question on it.
2Differences in economic development between countries2Firms’ costs, revenue and objectives2Foreign exchange rates2Current account of balance of payments1Economic growth1Firms1Globalisation, free trade and protection1Households1Inflation and deflation1Living standards1Market failure1Market structure1Microeconomics and macroeconomics1Mixed economic system1Monetary policy1Money and banking1Opportunity cost1Population1Price determination1Price elasticity of supply (PES)1Production possibility curve (PPC) diagrams1Supply-side policy1The nature of the economic problem1The role of government1Workers1What you needed in this session
Cambridge’s own grade thresholds for 2024 May/June, Paper 1 · Variant 2. A higher threshold means an easier paper — the bar moves with how the cohort did.