Cambridge IGCSE Economics 0455 — 2021 May/June Paper 1 · Variant 3
0455/13/M/J/21 · 30 questions · 30 marks · ≈34 min
The question paper and its mark scheme, free to read here and free to download. This is Cambridge’s own paper, exactly as it was sat.
Question paper12 pages
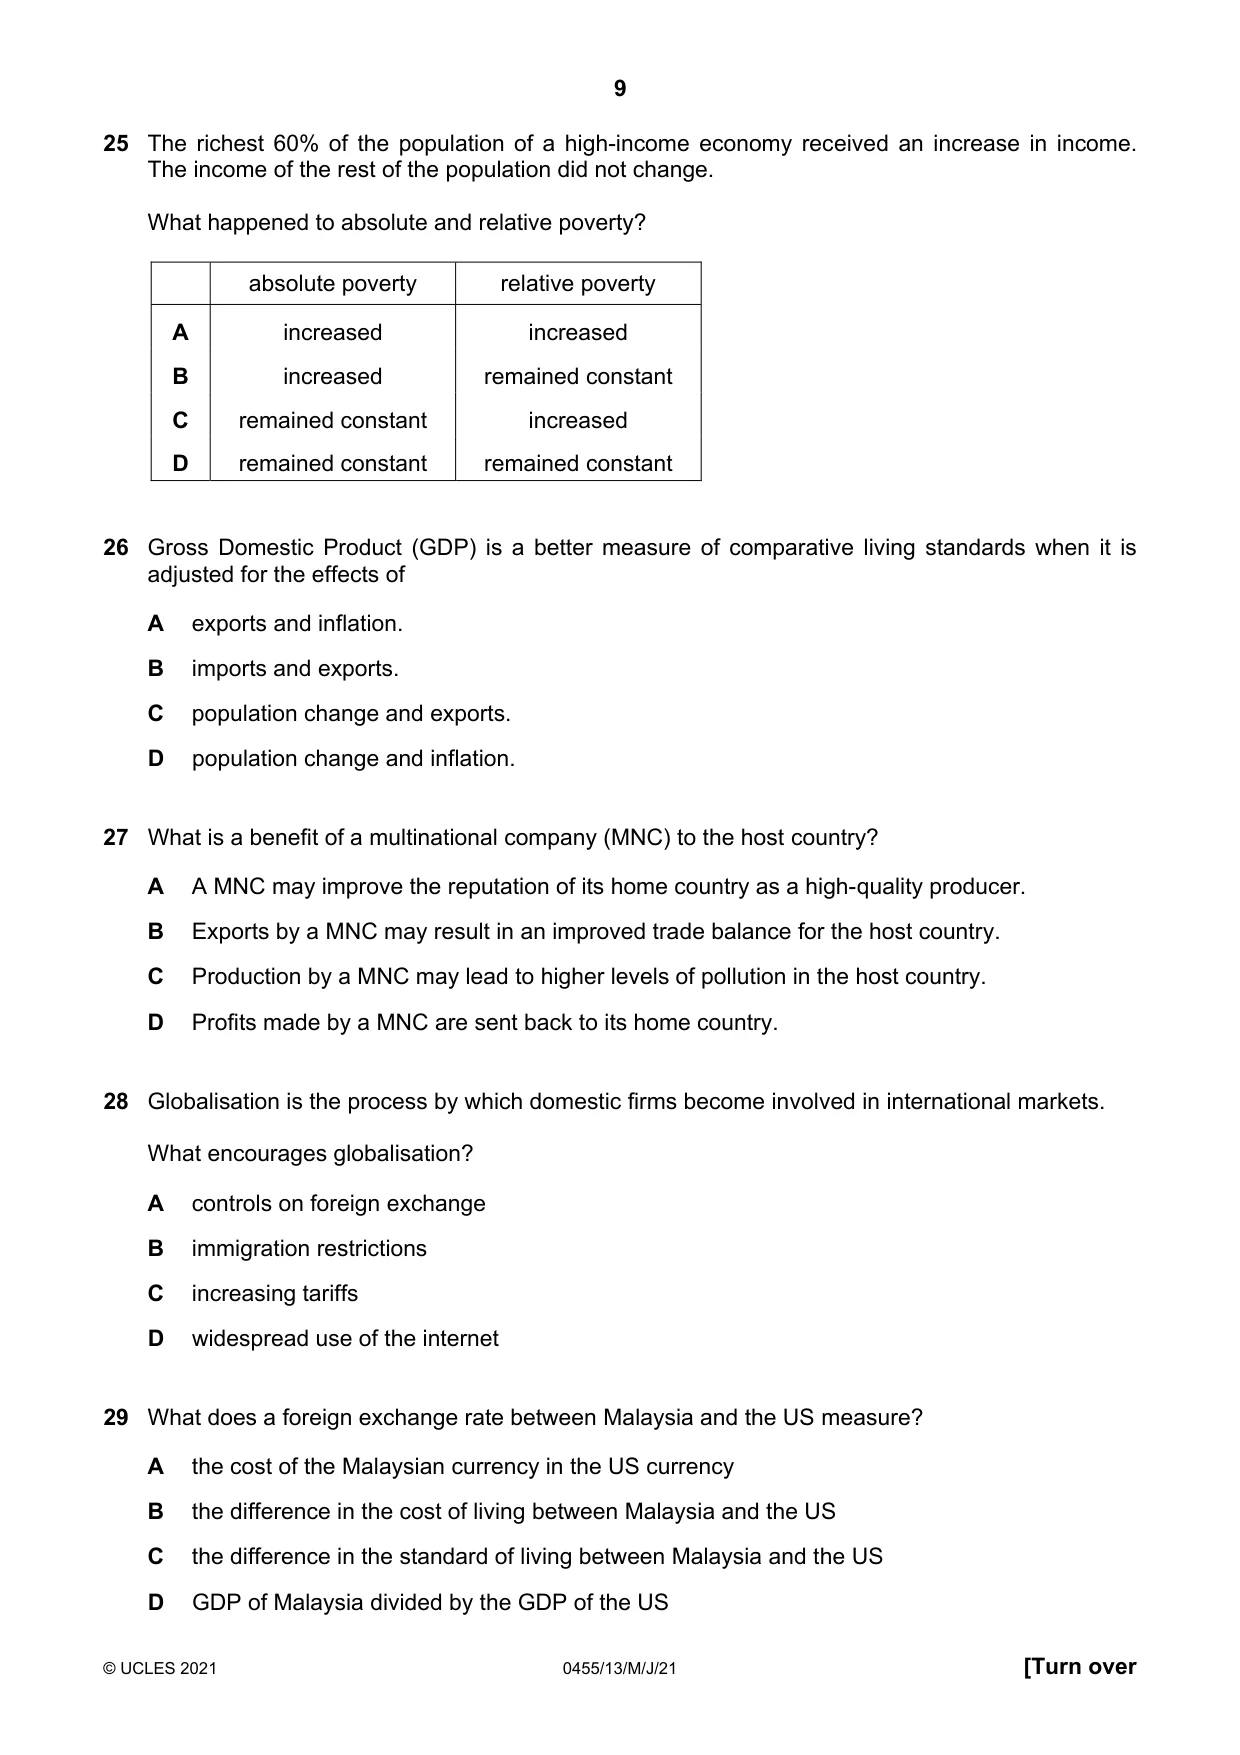
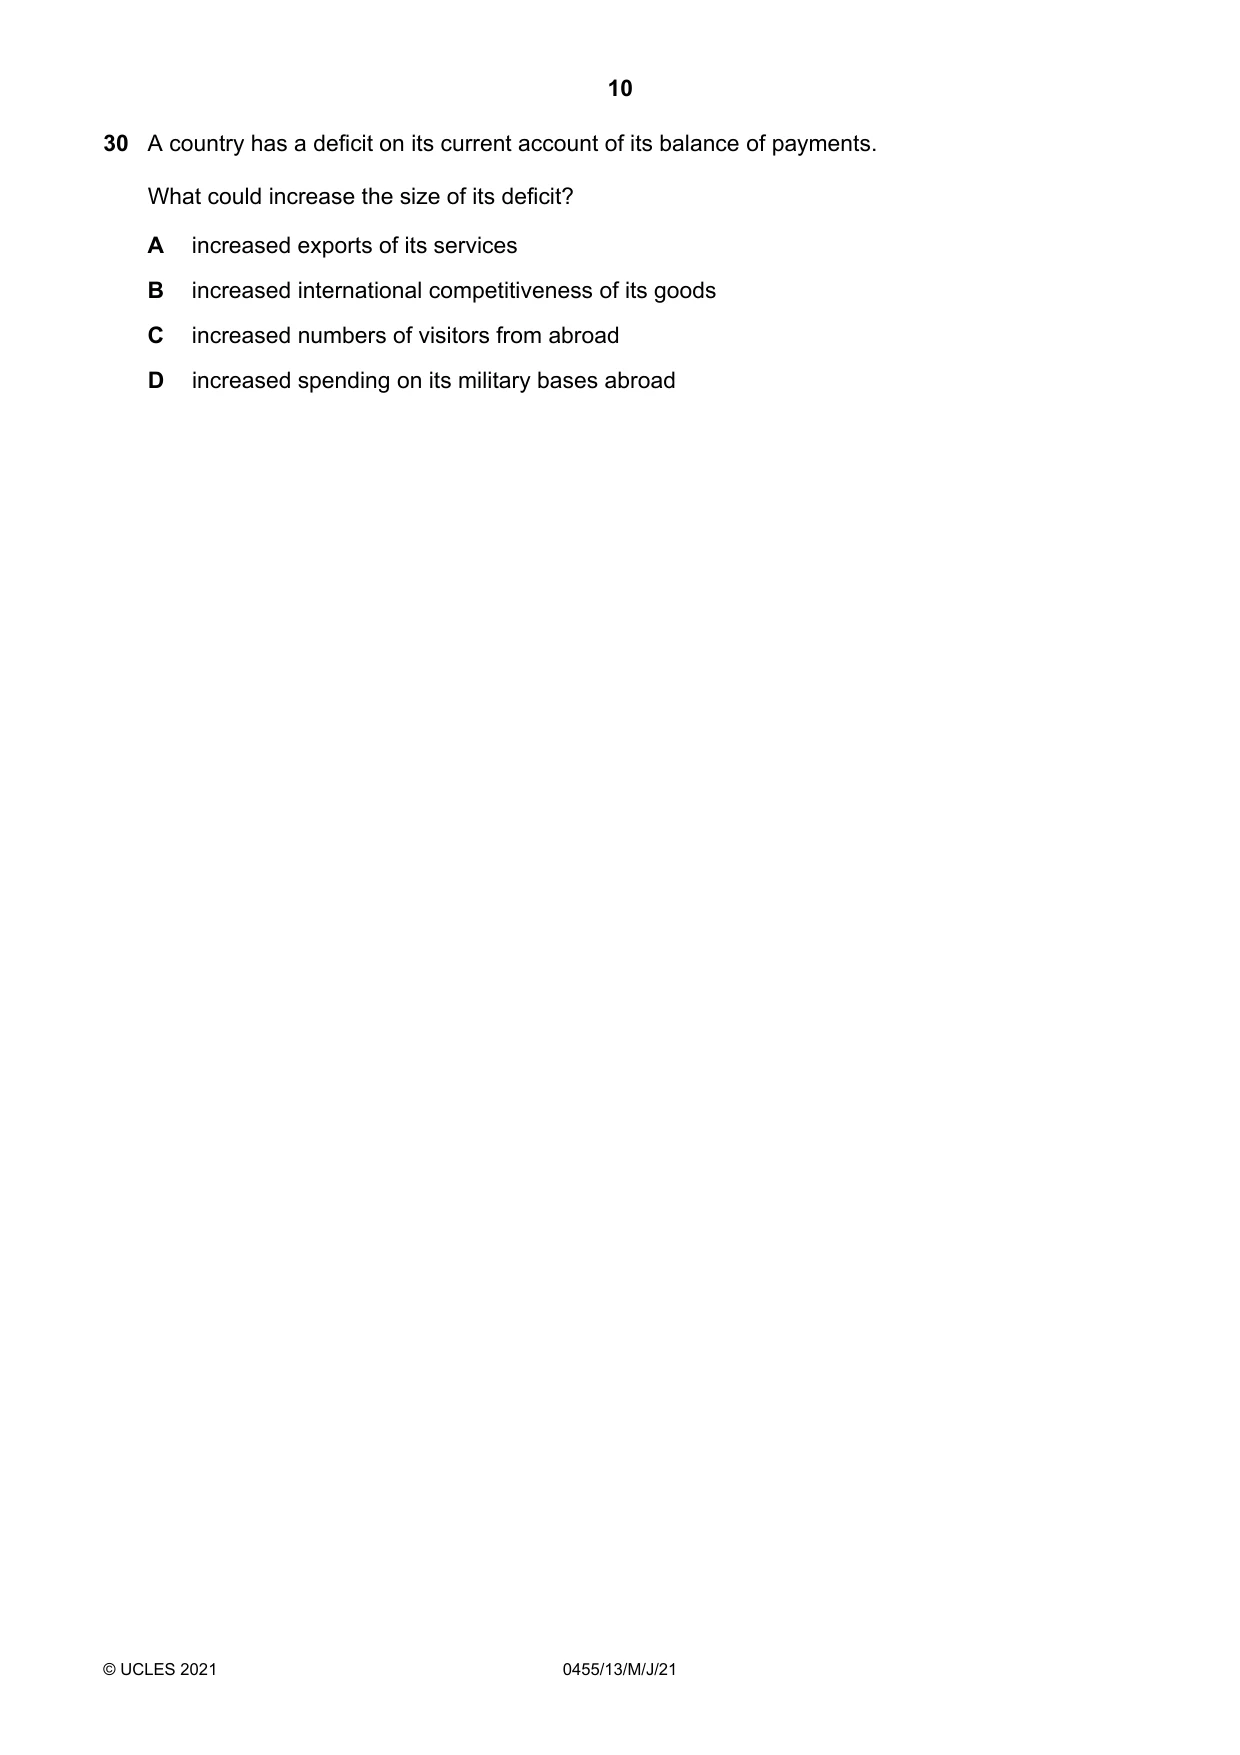

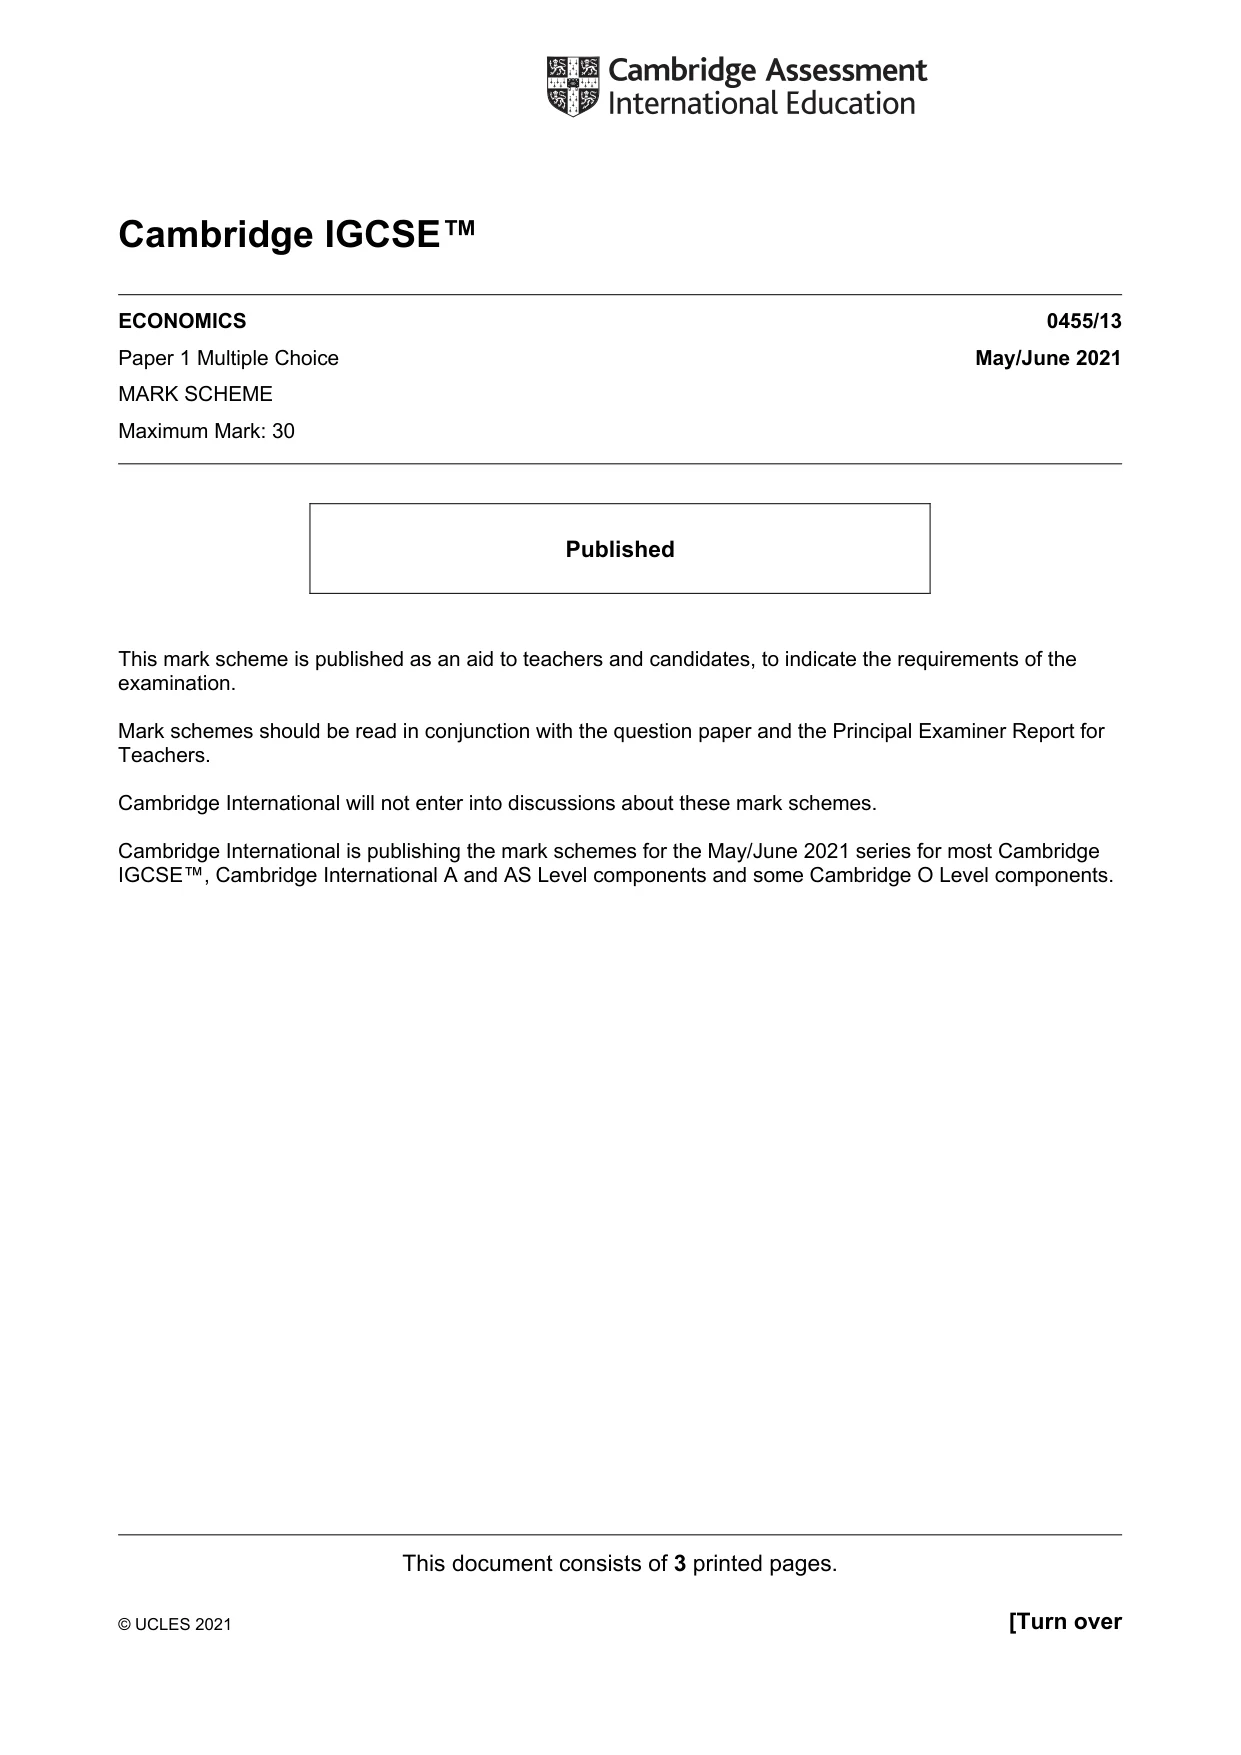
Mark scheme3 pages
Answers below. Sit the paper first if you are practising.
Questions as text
Q1 · Increasing output of one good reduces production of another good
1 Increasing output of one good reduces production of another good. Which economic concept does this change represent? A average cost B diseconomies of scale C economies of scale D opportunity cost
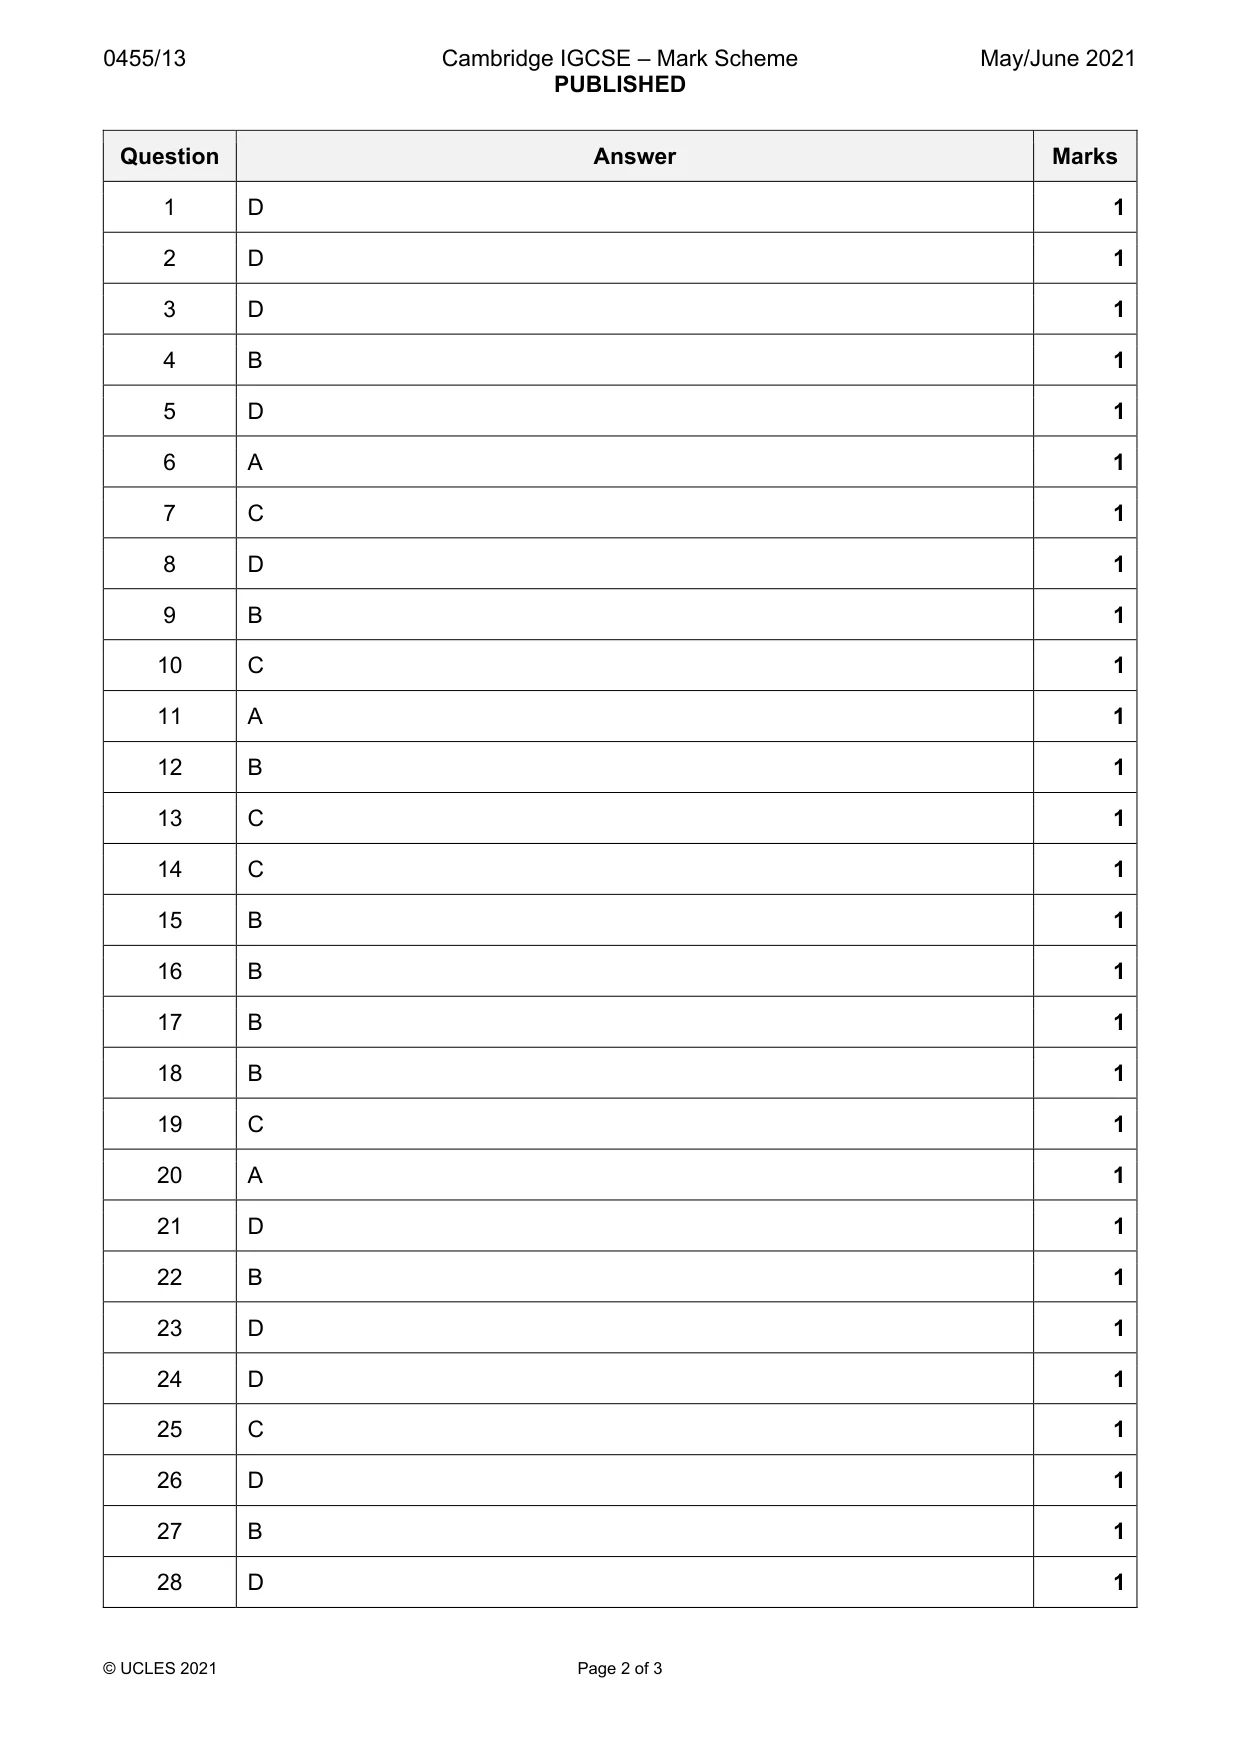
Mark scheme: D
Q2 · What condition in an economy would encourage immigration of labour?
2 What condition in an economy would encourage immigration of labour? A high cost of housing B preference for domestic over foreign qualifications C reduced quotas for foreign workers D shortage of skilled workers
Mark scheme: D
Q3 · The production possibility curve (PPC) shows the hours per day that a person has for…
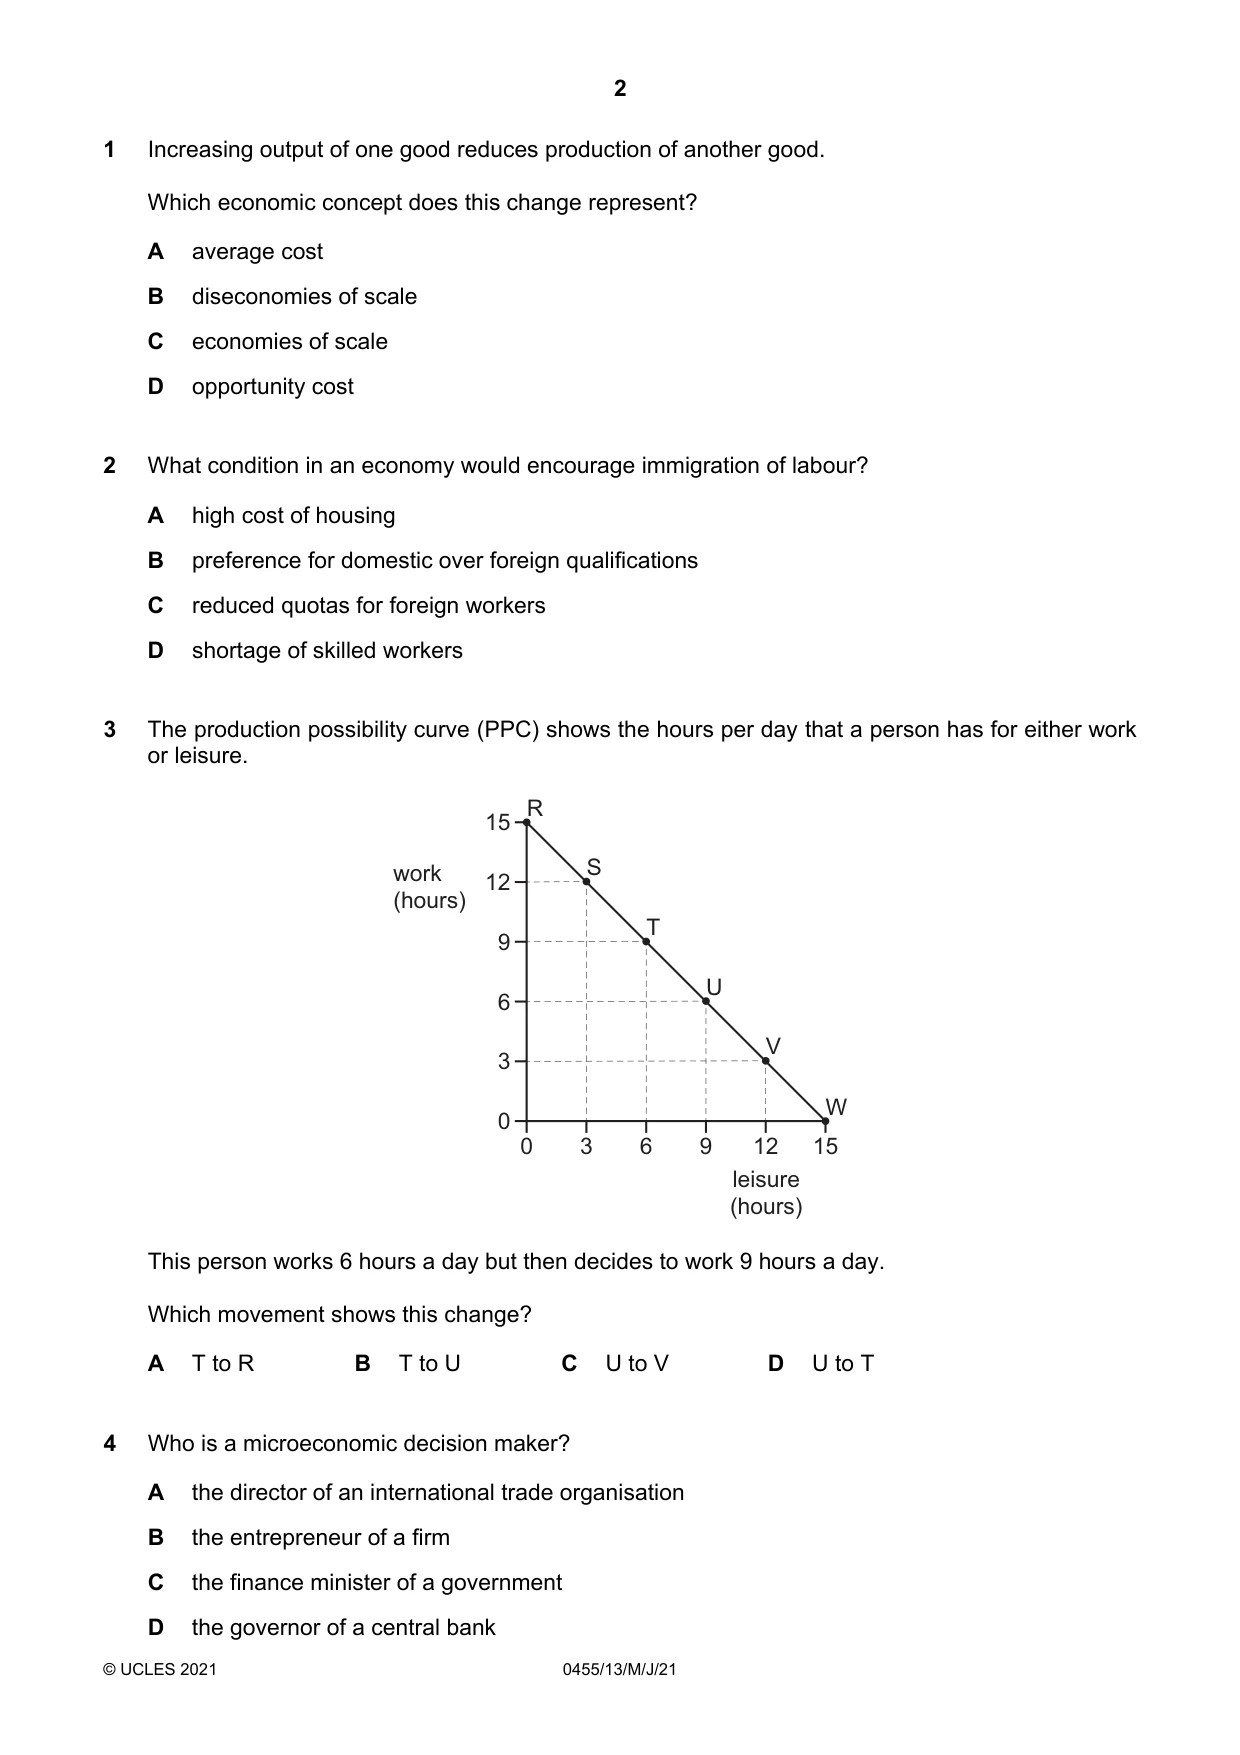
3 The production possibility curve (PPC) shows the hours per day that a person has for either work or leisure. R 15 work S 12 (hours) T 9 U 6 V 3 W 0 0 3 6 9 12 15 leisure (hours) This person works 6 hours a day but then decides to work 9 hours a day. Which movement shows this change? A T to R B T to U C U to V D U to T
Mark scheme: D
More questions on Production possibility curve (PPC) diagrams
Q4 · Who is a microeconomic decision maker?
4 Who is a microeconomic decision maker? A the director of an international trade organisation B the entrepreneur of a firm C the finance minister of a government
Mark scheme: B
Q5 · What is an essential feature of a market economy?
5 What is an essential feature of a market economy? A Central planners determine what, how and for whom to produce. B It aims for equality in the distribution of goods and services. C The market price reflects both the private and external costs of production. D The price mechanism sends signals to consumers and producers to allocate resources.
Mark scheme: D
Q6 · What is a definition of market failure?
6 What is a definition of market failure? A market forces of demand and supply do not allocate resources efficiently B not all consumers can afford to buy the goods they would like C private benefits of consumption are greater than external benefits D public goods are only provided by a government
Mark scheme: A
Q7 · The diagram shows the market for oil
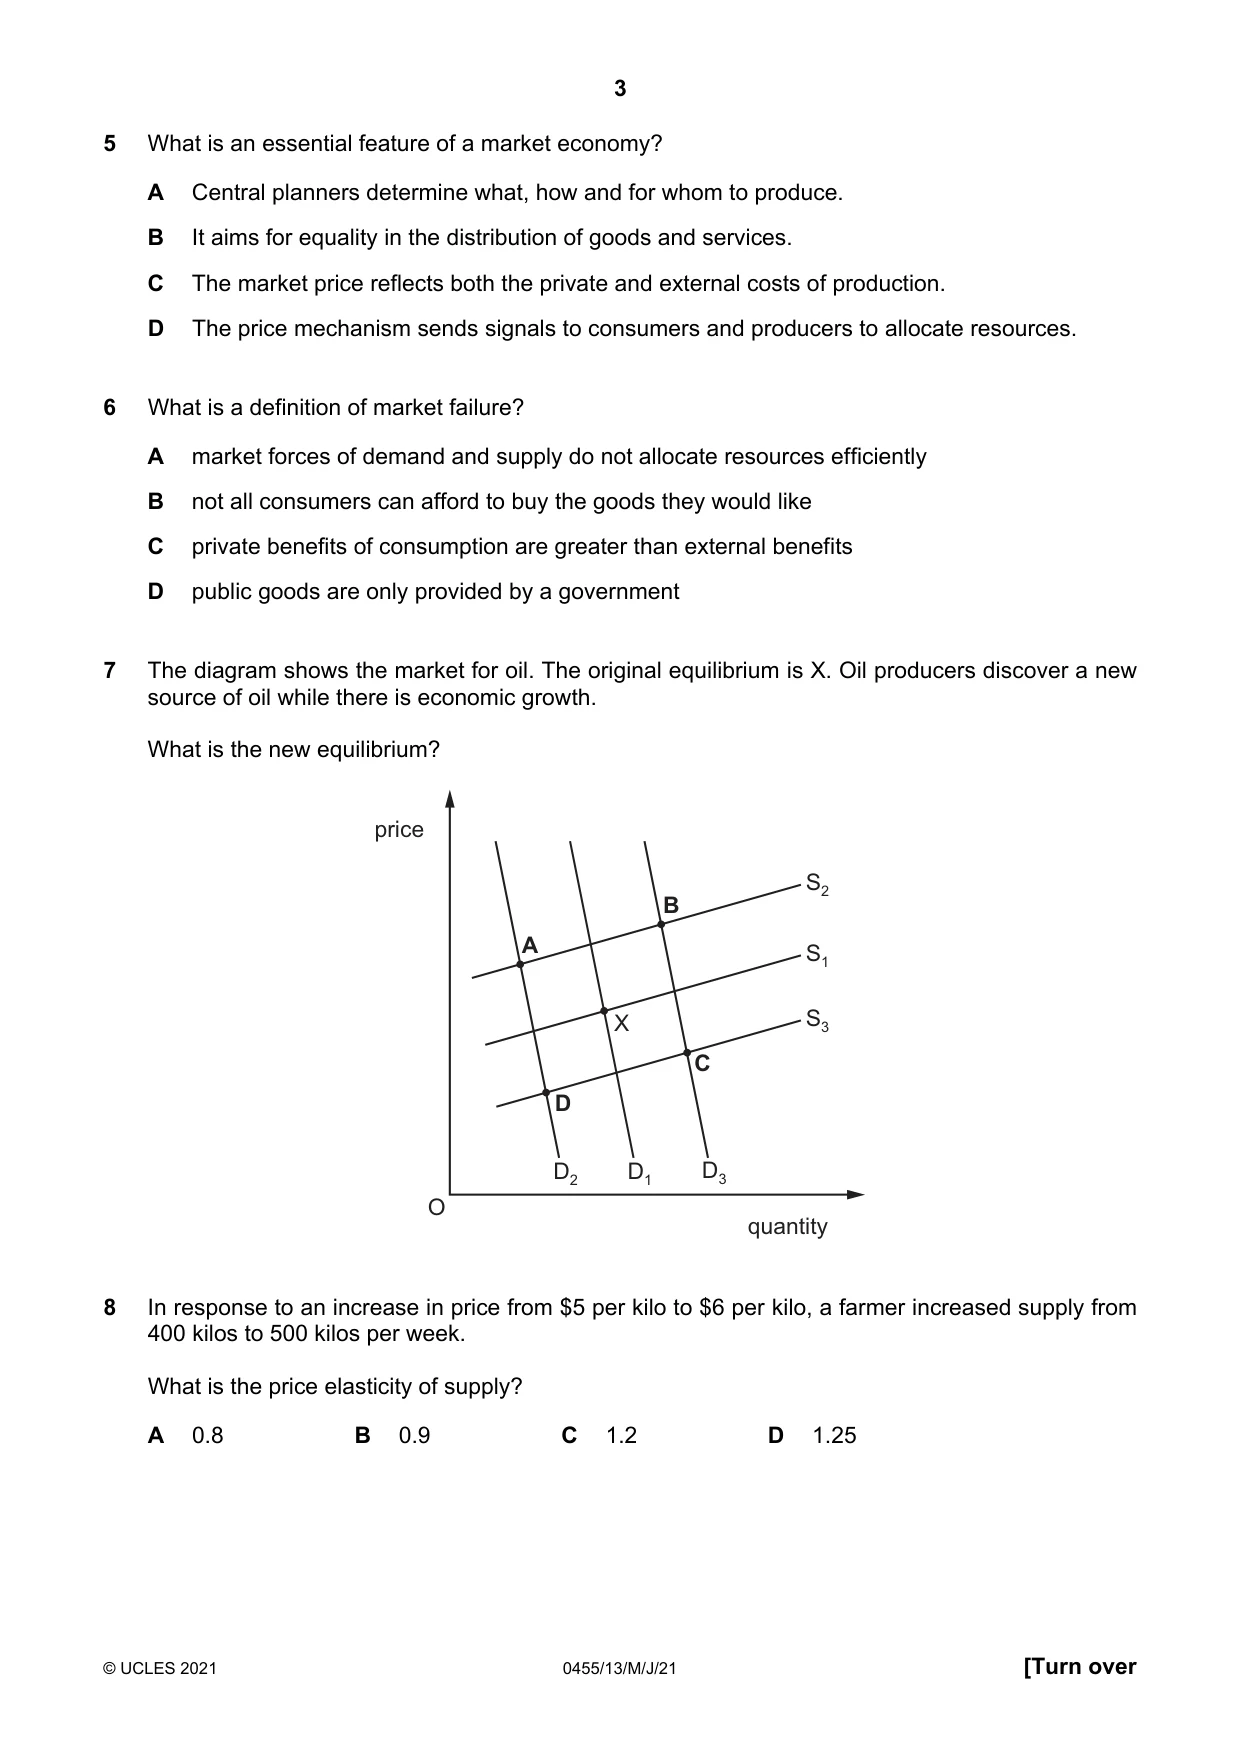
7 The diagram shows the market for oil. The original equilibrium is X. Oil producers discover a new source of oil while there is economic growth. What is the new equilibrium? price S2 B A S1 X S3 C D D2 D1 D3 O quantity
Mark scheme: C
Q8 · In response to an increase in price from $5 per kilo to $6 per kilo, a farmer increased…
8 In response to an increase in price from $5 per kilo to $6 per kilo, a farmer increased supply from 400 kilos to 500 kilos per week. What is the price elasticity of supply? A 0.8 B 0.9 C 1.2 D 1.25
Mark scheme: D
Q9 · Average incomes rose by 5% but savings did not rise
9 Average incomes rose by 5% but savings did not rise. What might explain this? A Consumer confidence in the economy fell. B Incomes rose more slowly than the rate of inflation. C Interest rates for savings rose. D The rate of income tax was reduced.
Mark scheme: B
Q10 · Which firm is in the tertiary sector?
10 Which firm is in the tertiary sector? A bread bakery B fruit grower C meal delivery D road builder
Mark scheme: C
Q11 · What is a benefit to a worker of being a member of a trade union?
11 What is a benefit to a worker of being a member of a trade union? A access to advice B guaranteed employment C opportunity to work extra hours D payment of subscriptions
Mark scheme: A
Q12 · A firm employs 10 workers
12 A firm employs 10 workers. Each worker is paid a weekly wage of $200 and produces 50 goods per week. What is the average cost of labour per good produced? A $0.4 B $4 C $20 D $200
Mark scheme: B
Q13 · How would advertising a good result in a retail firm increasing its market share?
13 How would advertising a good result in a retail firm increasing its market share? A It will improve the personal service in its shops. B It will increase the firm’s costs. C It will reduce demand for competitors’ products. D It will result in diversification in the firm.
Mark scheme: C
Q14 · What describes the total revenue of a firm?
14 What describes the total revenue of a firm? A fixed costs plus variable costs B income from sales minus total costs C quantity of goods sold multiplied by unit price D variable costs divided by output
Mark scheme: C
Q15 · The diagram shows the total revenue (TR) and total cost (TC) of a firm in a market
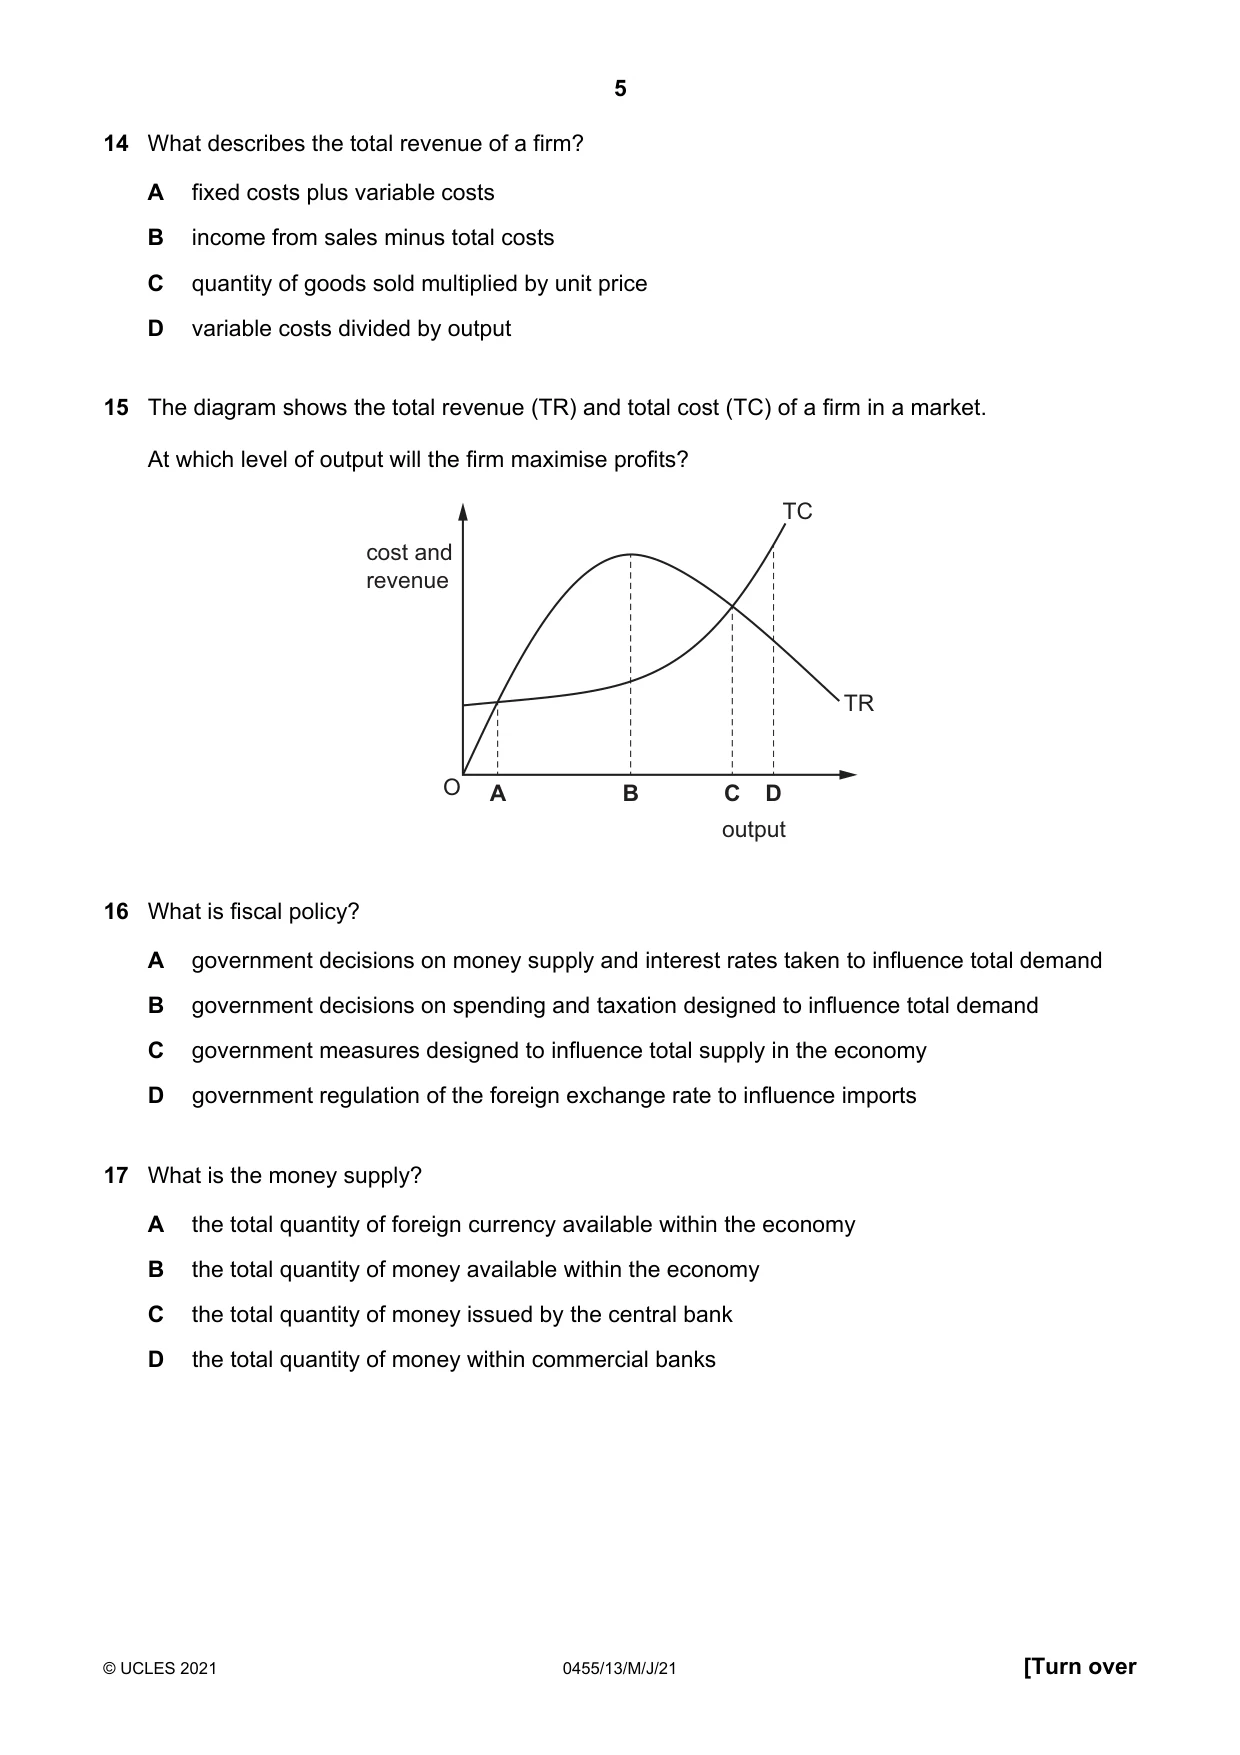
15 The diagram shows the total revenue (TR) and total cost (TC) of a firm in a market. At which level of output will the firm maximise profits? TC cost and revenue TR O A B C D output
Mark scheme: B
Q16 · What is fiscal policy?
16 What is fiscal policy? A government decisions on money supply and interest rates taken to influence total demand B government decisions on spending and taxation designed to influence total demand C government measures designed to influence total supply in the economy D government regulation of the foreign exchange rate to influence imports
Mark scheme: B
Q17 · What is the money supply?
17 What is the money supply? A the total quantity of foreign currency available within the economy B the total quantity of money available within the economy C the total quantity of money issued by the central bank D the total quantity of money within commercial banks
Mark scheme: B
Q18 · The table shows sources of government revenue for an economy
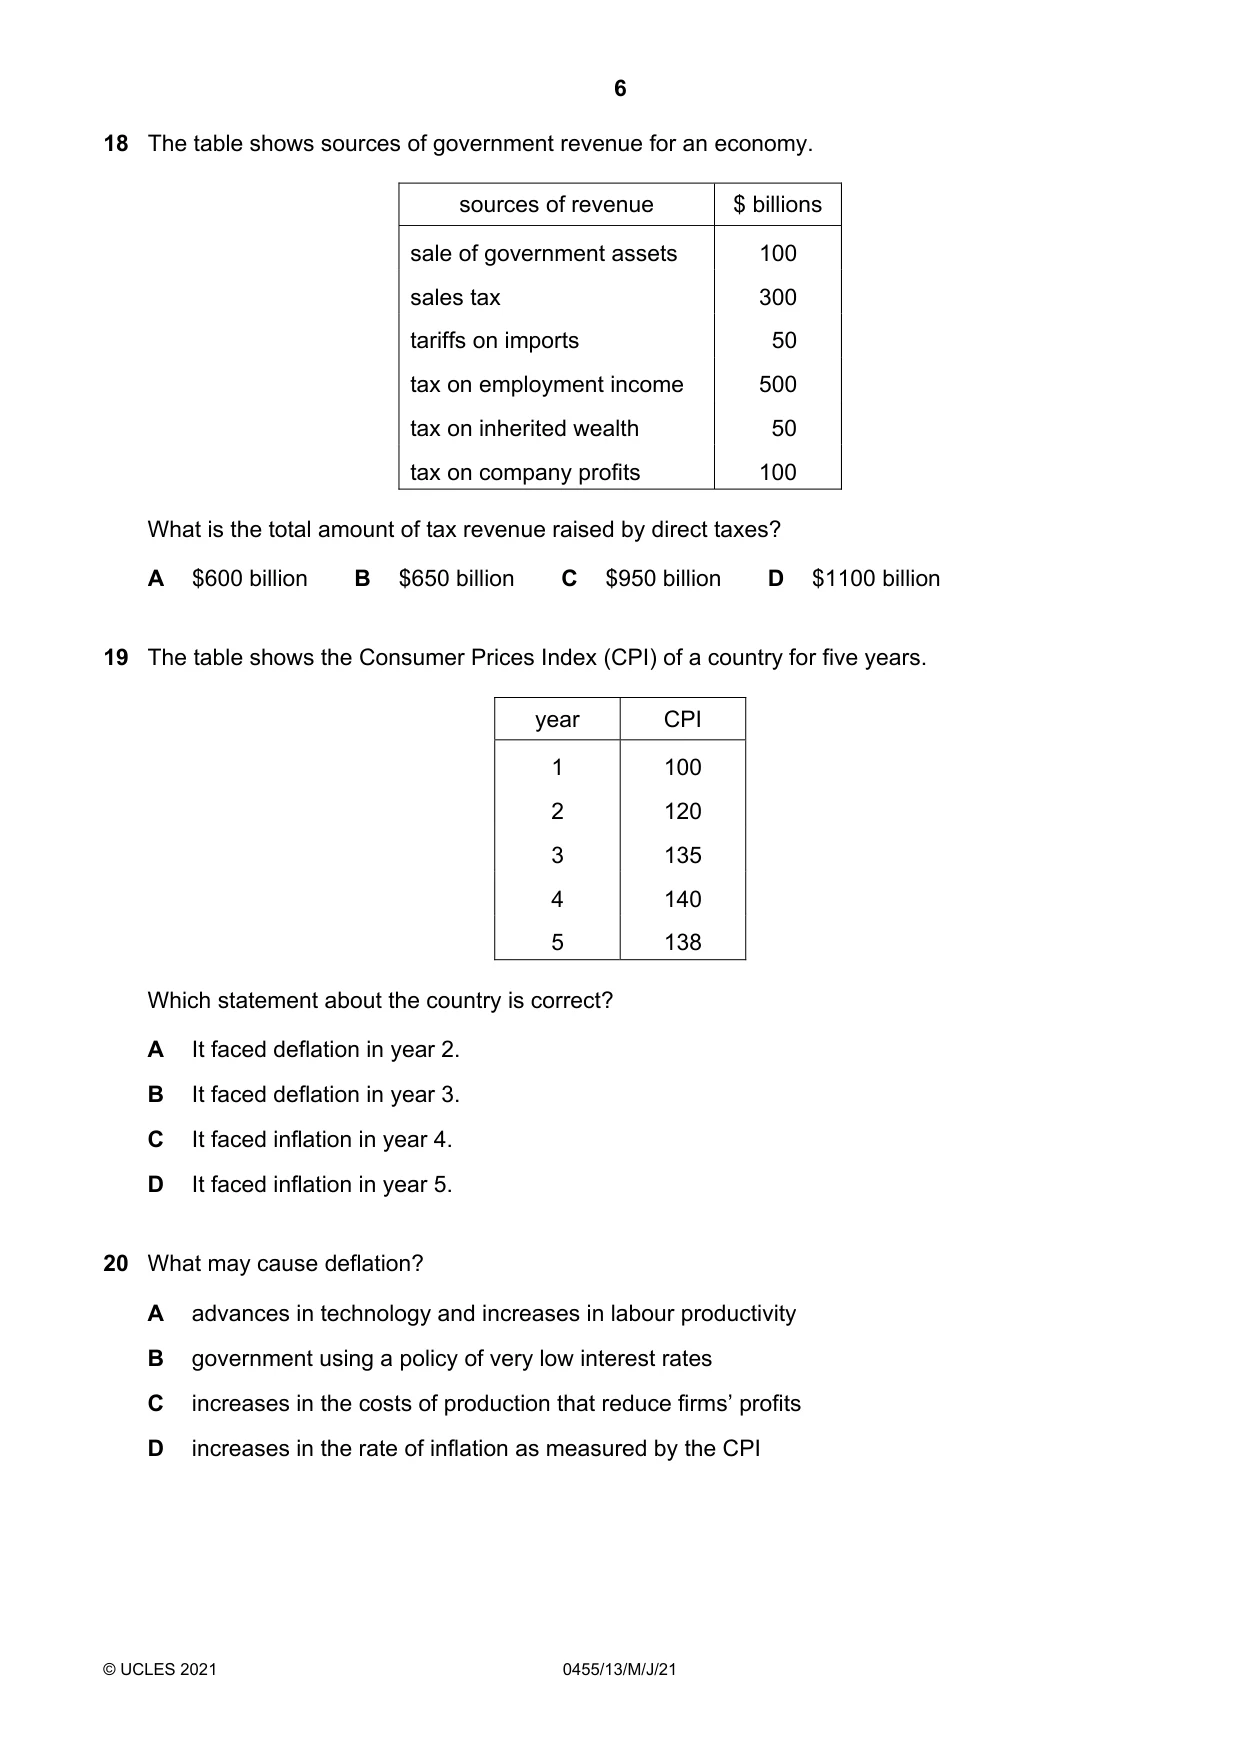
18 The table shows sources of government revenue for an economy. sources of revenue $ billions sale of government assets 100 sales tax 300 tariffs on imports 50 tax on employment income 500 tax on inherited wealth 50 tax on company profits 100 What is the total amount of tax revenue raised by direct taxes? A $600 billion B $650 billion C $950 billion D $1100 billion
Mark scheme: B
Q19 · The table shows the Consumer Prices Index (CPI) of a country for five years
19 The table shows the Consumer Prices Index (CPI) of a country for five years. year CPI 1 100 2 120 3 135 4 140 5 138 Which statement about the country is correct? A It faced deflation in year 2. B It faced deflation in year 3. C It faced inflation in year 4. D It faced inflation in year 5.
Mark scheme: C
Q20 · What may cause deflation?
20 What may cause deflation? A advances in technology and increases in labour productivity B government using a policy of very low interest rates C increases in the costs of production that reduce firms’ profits D increases in the rate of inflation as measured by the CPI
Mark scheme: A
Q21 · Economic growth can be defined as A a reduction in a country’s rate of inflation
21 Economic growth can be defined as A a reduction in a country’s rate of inflation. B an increase in a country’s exports. C an increase in a country’s population. D an increase in a country’s productive capacity.
Mark scheme: D
Q22 · The table compares the distribution of employment in selected industries in two years
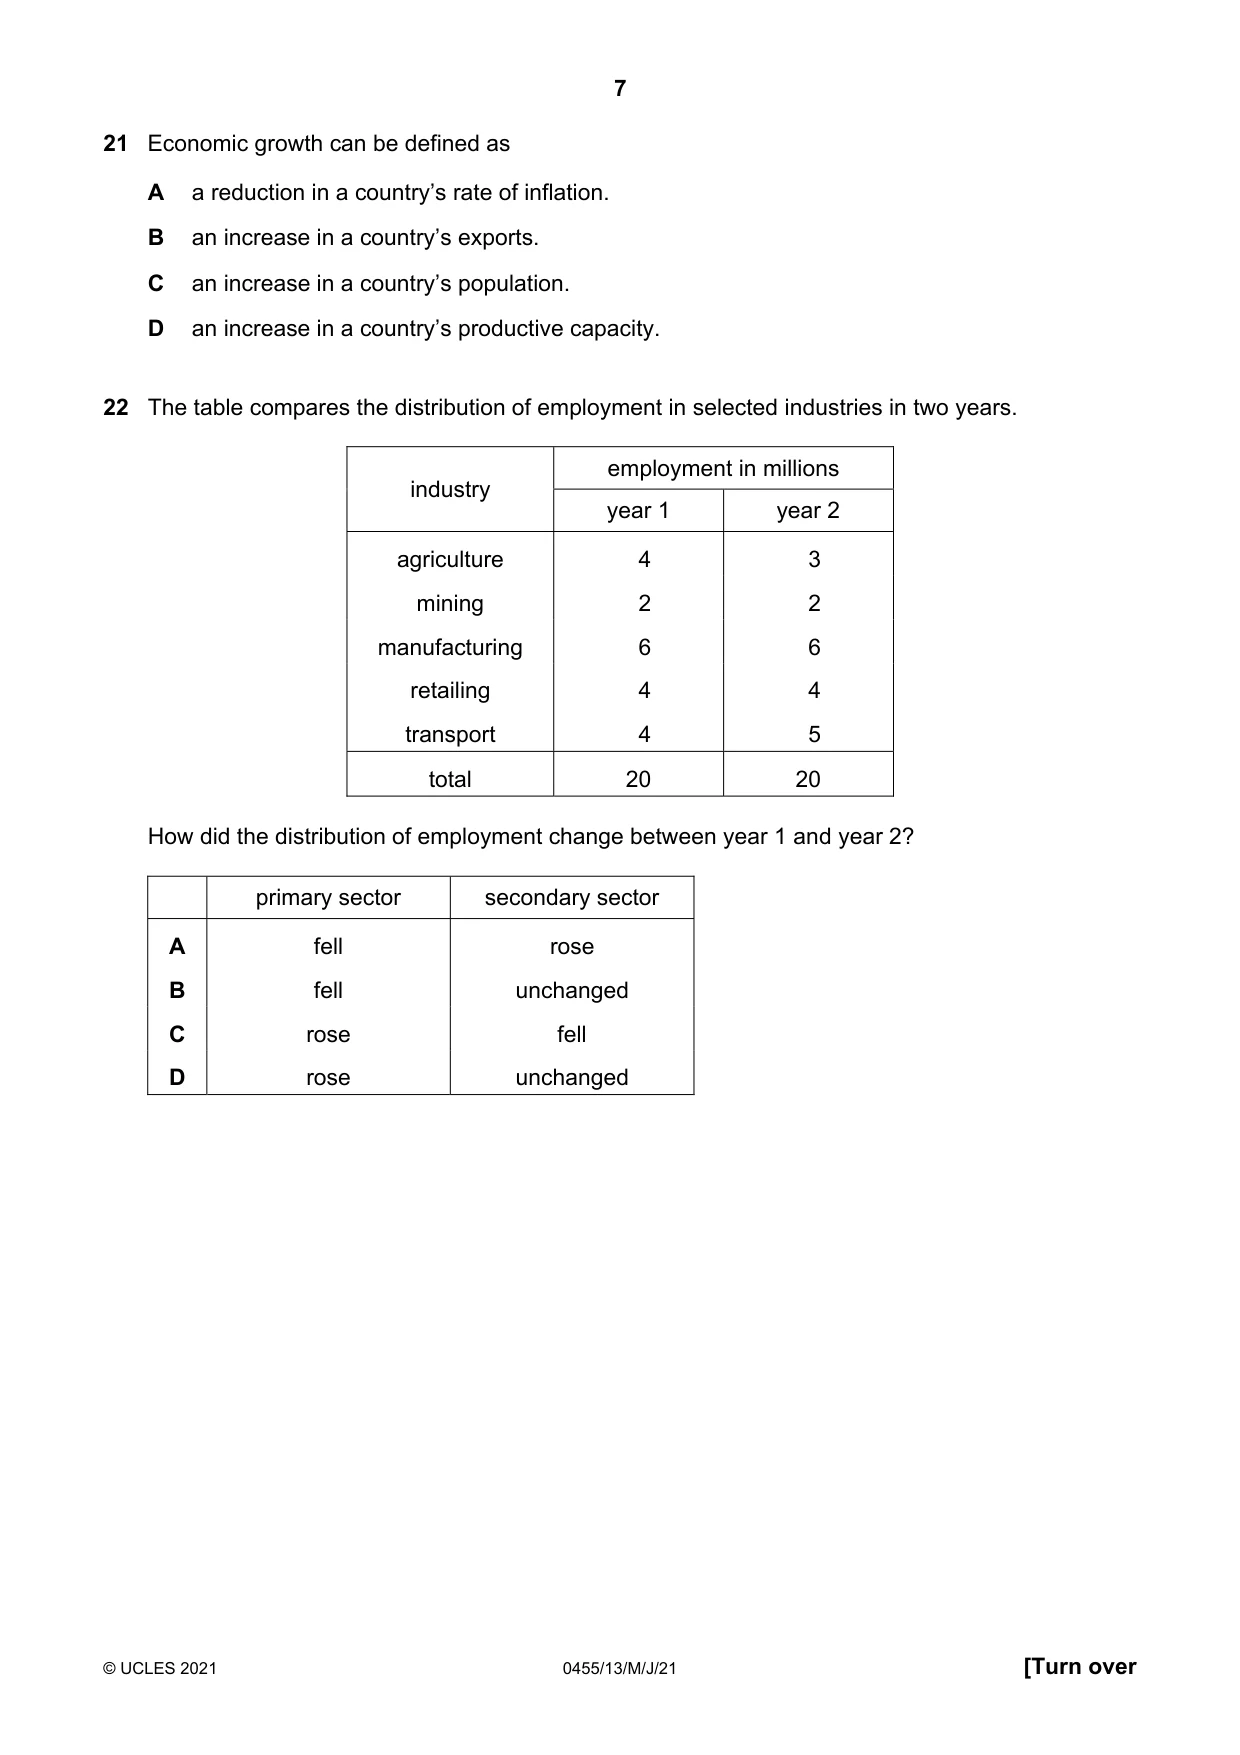
22 The table compares the distribution of employment in selected industries in two years. employment in millions industry year 1 year 2 agriculture 4 3 mining 2 2 manufacturing 6 6 retailing 4 4 transport 4 5 total 20 20 How did the distribution of employment change between year 1 and year 2? primary sector secondary sector A fell rose B fell unchanged C rose fell D rose unchanged
Mark scheme: B
Q23 · In a year, two changes occurred in a company
23 In a year, two changes occurred in a company. Company directors’ salaries increased by 15%. Office workers’ wages increased by 5%. The rate of inflation was 3.4%. What happened to real income? company directors’ office workers’ real income real income A fell fell B fell rose C rose fell D rose rose
Mark scheme: D
Q24 · The diagrams show birth rate (BR) and death rate (DR) in three countries, X, Y and Z, in…
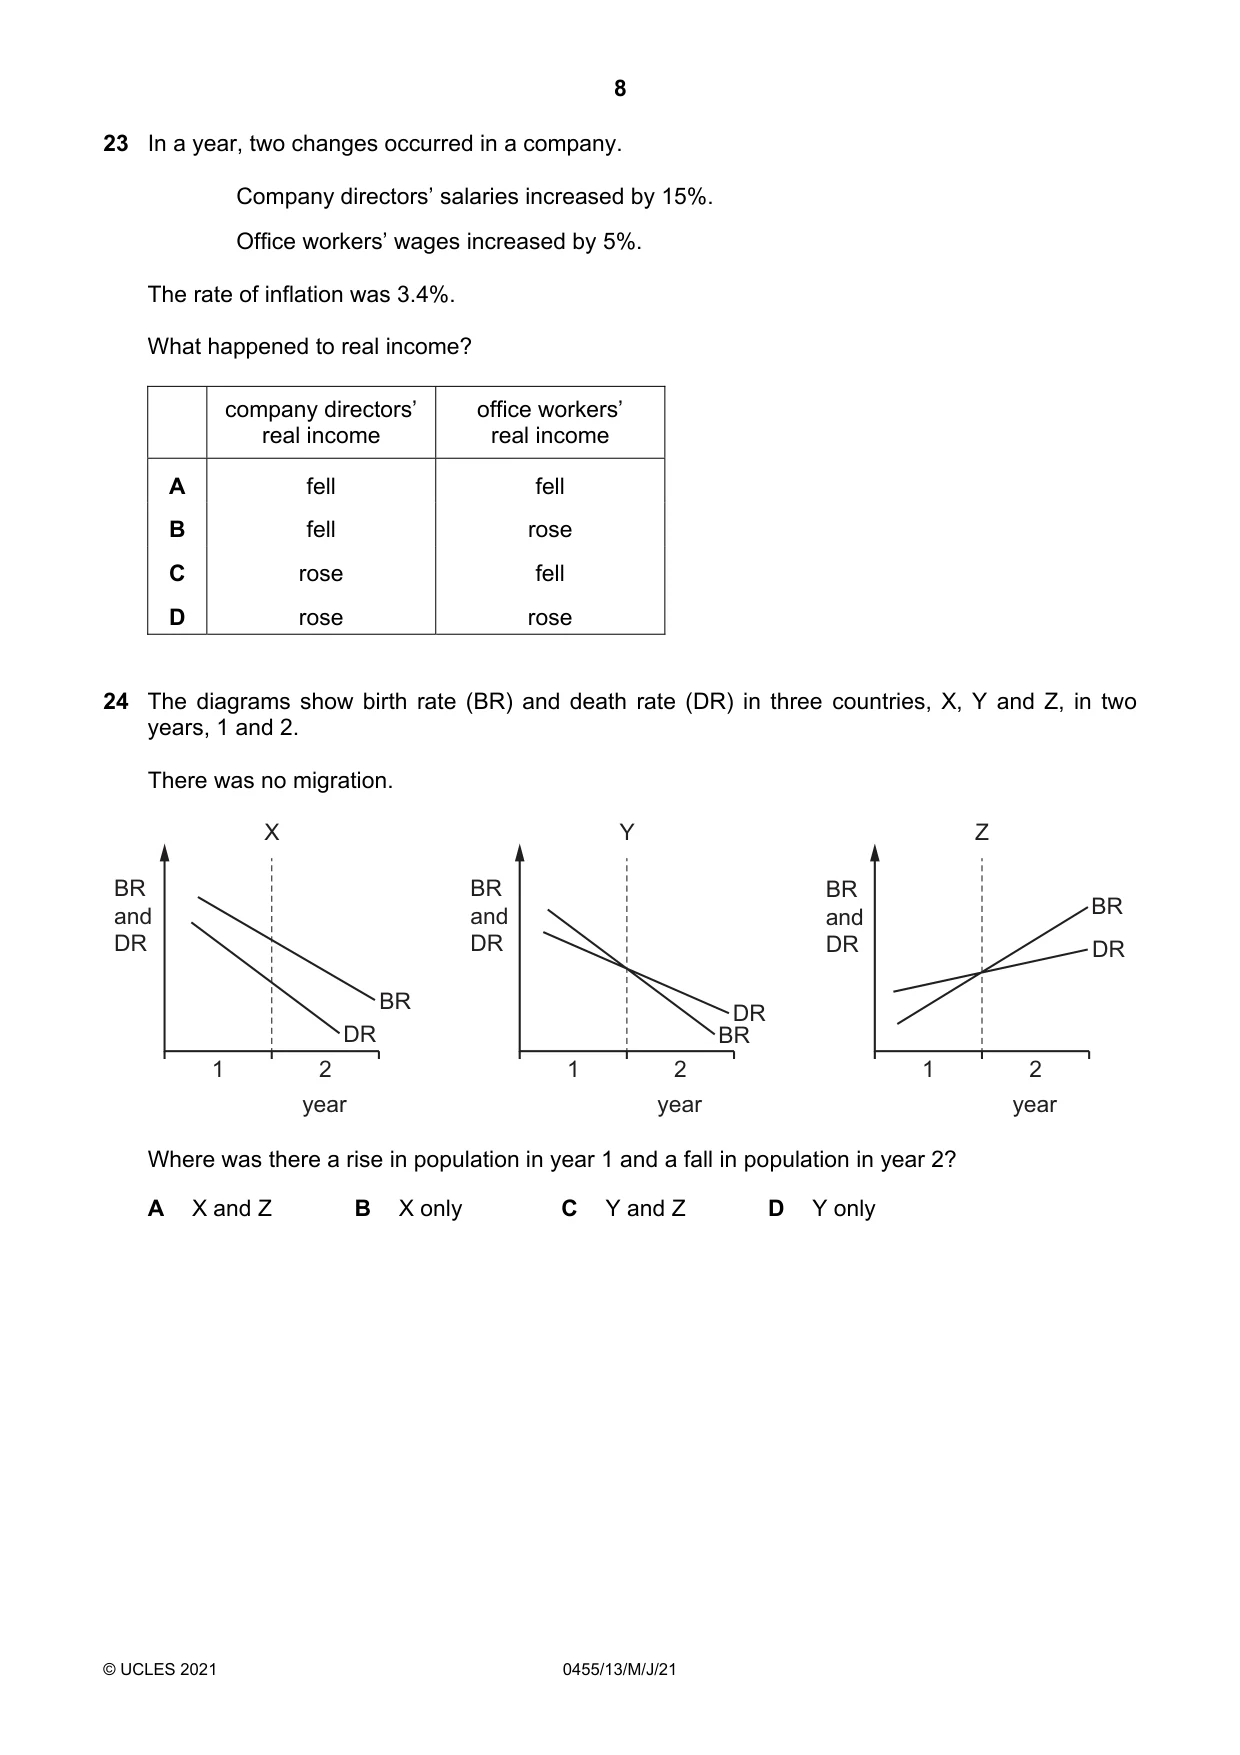
24 The diagrams show birth rate (BR) and death rate (DR) in three countries, X, Y and Z, in two years, 1 and 2. There was no migration. X Y Z BR BR BR and and BR and DR DR DR DR BR DR DR BR 1 2 1 2 1 2 year year year Where was there a rise in population in year 1 and a fall in population in year 2? A X and Z B X only C Y and Z D Y only
Mark scheme: D
Q25 · The richest 60% of the population of a high-income economy received an increase in income
25 The richest 60% of the population of a high-income economy received an increase in income. The income of the rest of the population did not change. What happened to absolute and relative poverty? absolute poverty relative poverty A increased increased B increased remained constant C remained constant increased D remained constant remained constant
Mark scheme: C
Q26 · Gross Domestic Product (GDP) is a better measure of comparative living standards when it…
26 Gross Domestic Product (GDP) is a better measure of comparative living standards when it is adjusted for the effects of A exports and inflation. B imports and exports. C population change and exports. D population change and inflation.
Mark scheme: D
Q27 · What is a benefit of a multinational company (MNC) to the host country?
27 What is a benefit of a multinational company (MNC) to the host country? A A MNC may improve the reputation of its home country as a high-quality producer. B Exports by a MNC may result in an improved trade balance for the host country. C Production by a MNC may lead to higher levels of pollution in the host country. D Profits made by a MNC are sent back to its home country.
Mark scheme: B
Q28 · Globalisation is the process by which domestic firms become involved in international…
28 Globalisation is the process by which domestic firms become involved in international markets. What encourages globalisation? A controls on foreign exchange B immigration restrictions C increasing tariffs D widespread use of the internet
Mark scheme: D
Q29 · What does a foreign exchange rate between Malaysia and the US measure?
29 What does a foreign exchange rate between Malaysia and the US measure? A the cost of the Malaysian currency in the US currency B the difference in the cost of living between Malaysia and the US C the difference in the standard of living between Malaysia and the US D GDP of Malaysia divided by the GDP of the US
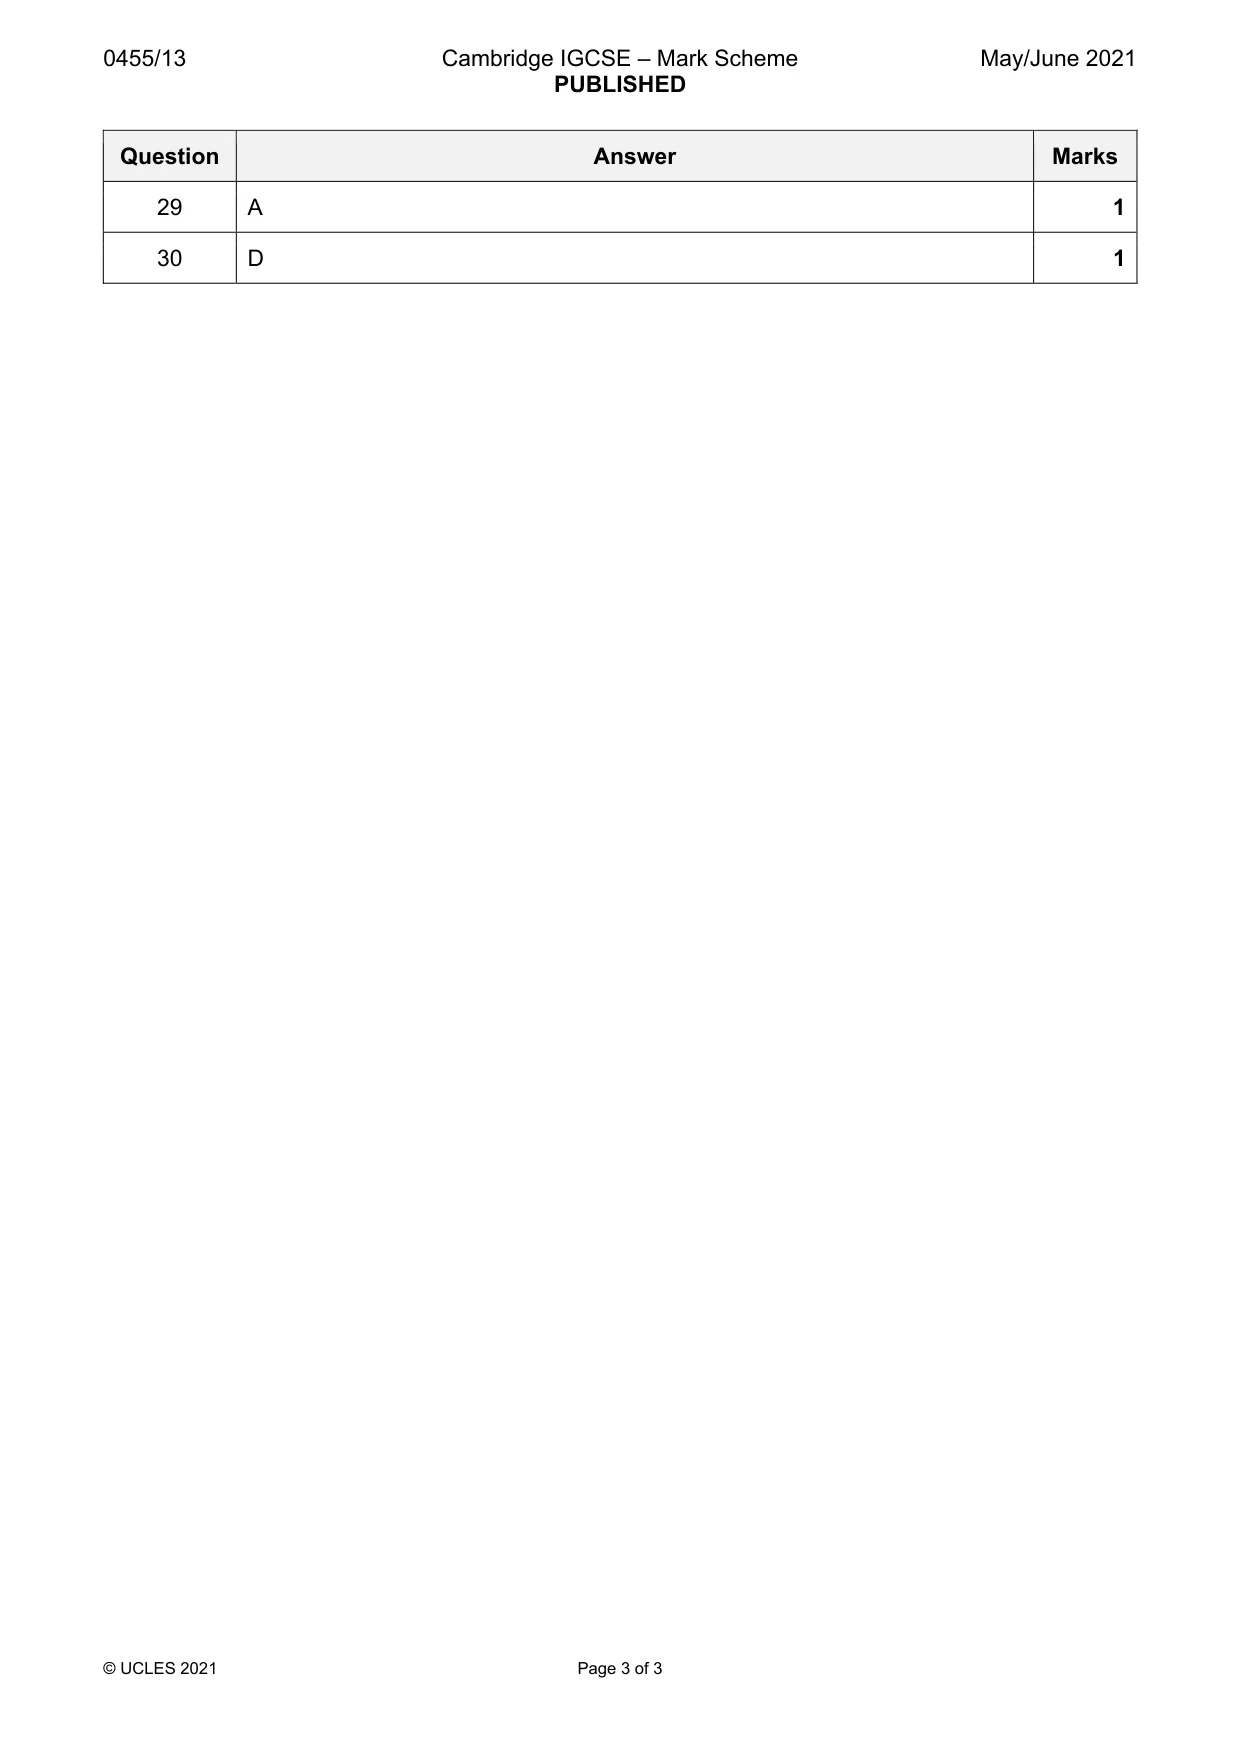
Mark scheme: A
Q30 · A country has a deficit on its current account of its balance of payments
30 A country has a deficit on its current account of its balance of payments. What could increase the size of its deficit? A increased exports of its services B increased international competitiveness of its goods C increased numbers of visitors from abroad D increased spending on its military bases abroad
Mark scheme: D
What was in this paper
The subtopics covered by these 30 questions, and how many questions each got. Open one in a new tab to see every Cambridge question on it.
3Inflation and deflation3Firms and production2Fiscal policy2Globalisation, free trade and protection2Current account of balance of payments1Economic growth1Firms1Foreign exchange rates1Households1Living standards1Market economic system1Market failure1Microeconomics and macroeconomics1Money and banking1Opportunity cost1Population1Poverty1Price changes1Price elasticity of supply (PES)1Production possibility curve (PPC) diagrams1Trade unions1Workers1What you needed in this session
Cambridge’s own grade thresholds for 2021 May/June, Paper 1 · Variant 3. A higher threshold means an easier paper — the bar moves with how the cohort did.