Cambridge IGCSE Economics 0455 — 2017 May/June Paper 1 · Variant 1
0455/11/M/J/17 · 30 questions · 30 marks · ≈34 min
The question paper and its mark scheme, free to read here and free to download. This is Cambridge’s own paper, exactly as it was sat.
Question paper12 pages

Mark scheme3 pages
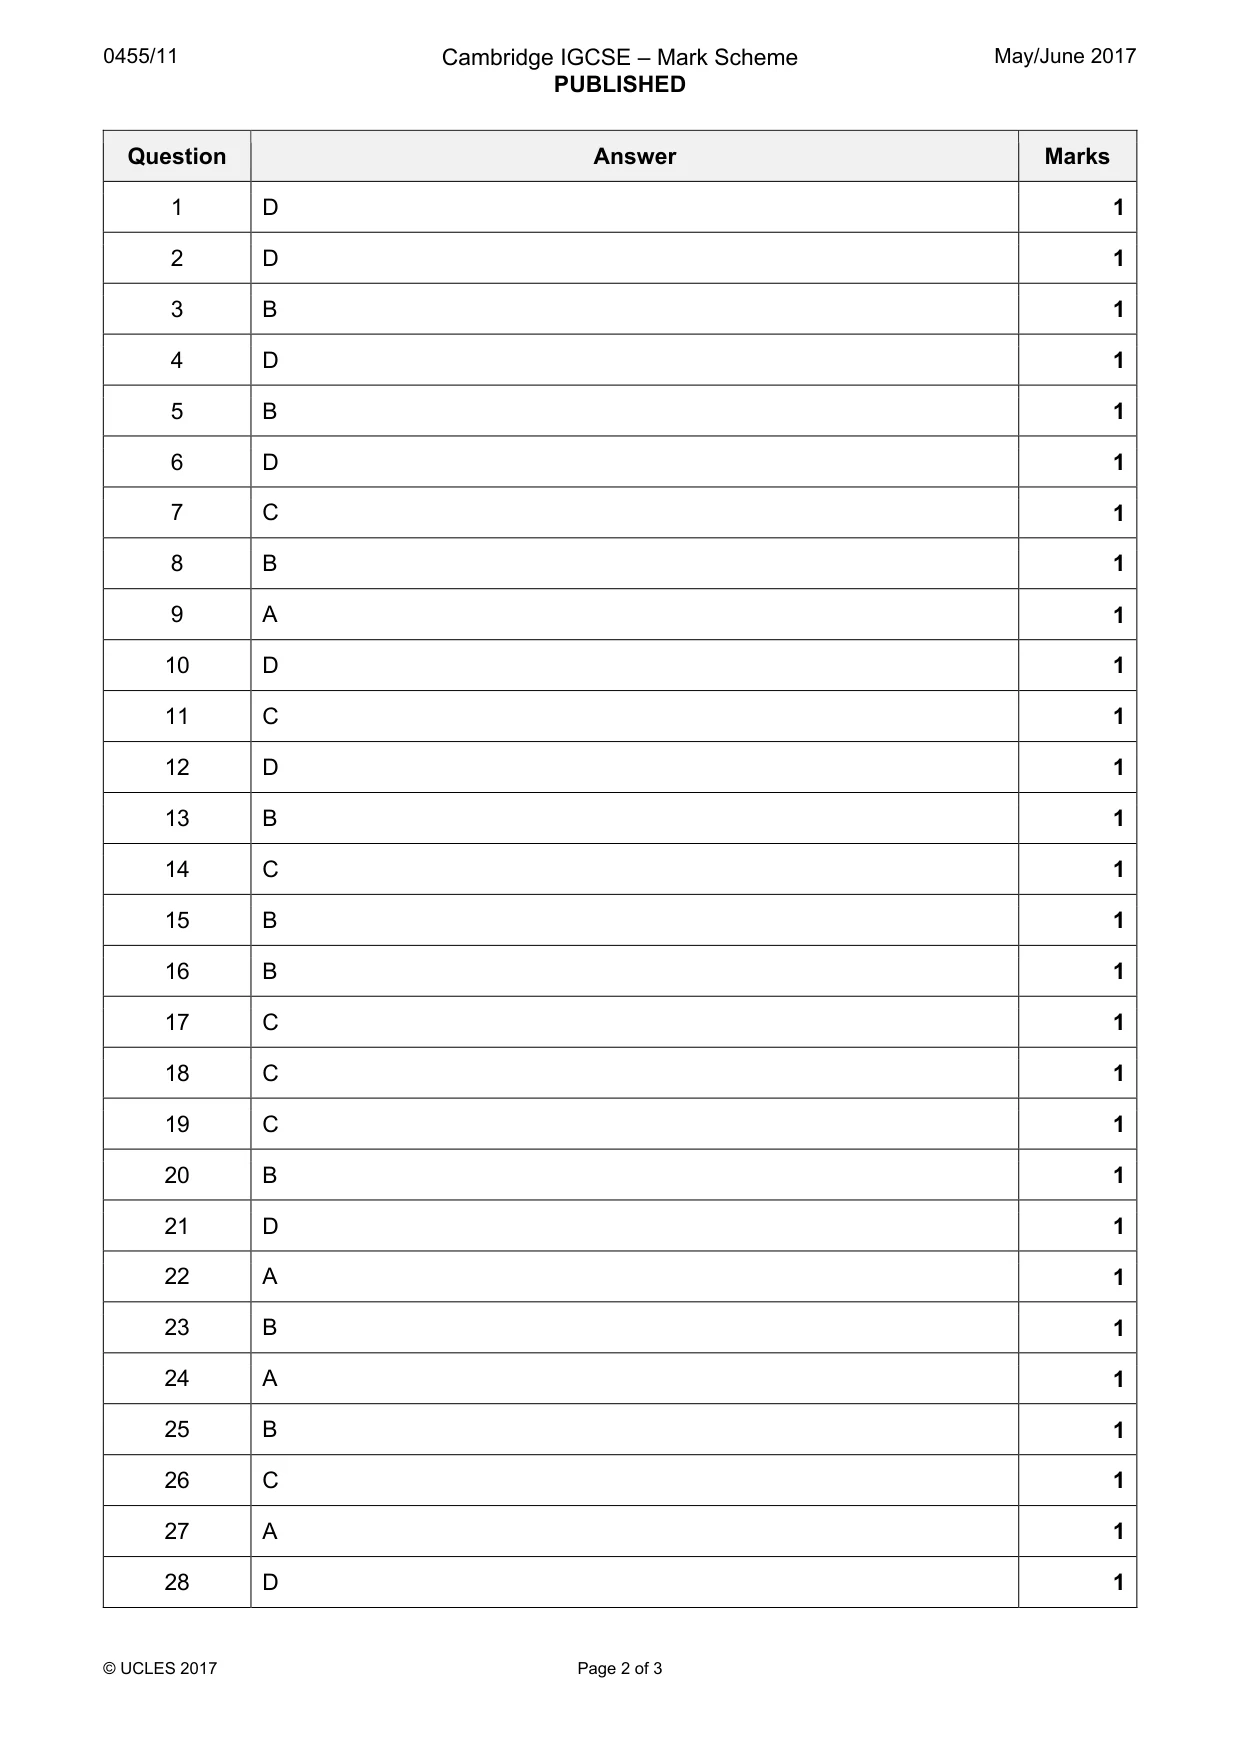
Answers below. Sit the paper first if you are practising.
Questions as text
Q1 · Which combination of terms gives the general definition of the economic problem?
1 Which combination of terms gives the general definition of the economic problem? A bigger families, less food, starvation B falling supply, rising demand, shortage C higher population, fewer jobs, unemployment D limited resources, unlimited wants, scarcity
Mark scheme: D
Q2 · Helium is a gas that is limited in supply
2 Helium is a gas that is limited in supply. It takes thousands of years to form from decaying radioactive rocks. The US government holds 35% of the world’s supply and has been selling its stocks. Helium is essential in medical scanners. It is also used for party balloons which some say is a wasteful alternative use of a valuable good. Which concepts can be applied to the above statement? A demand and supply, government subsidy B excess demand, resource allocation C factors of production, private monopoly D opportunity cost, public sector
Mark scheme: D
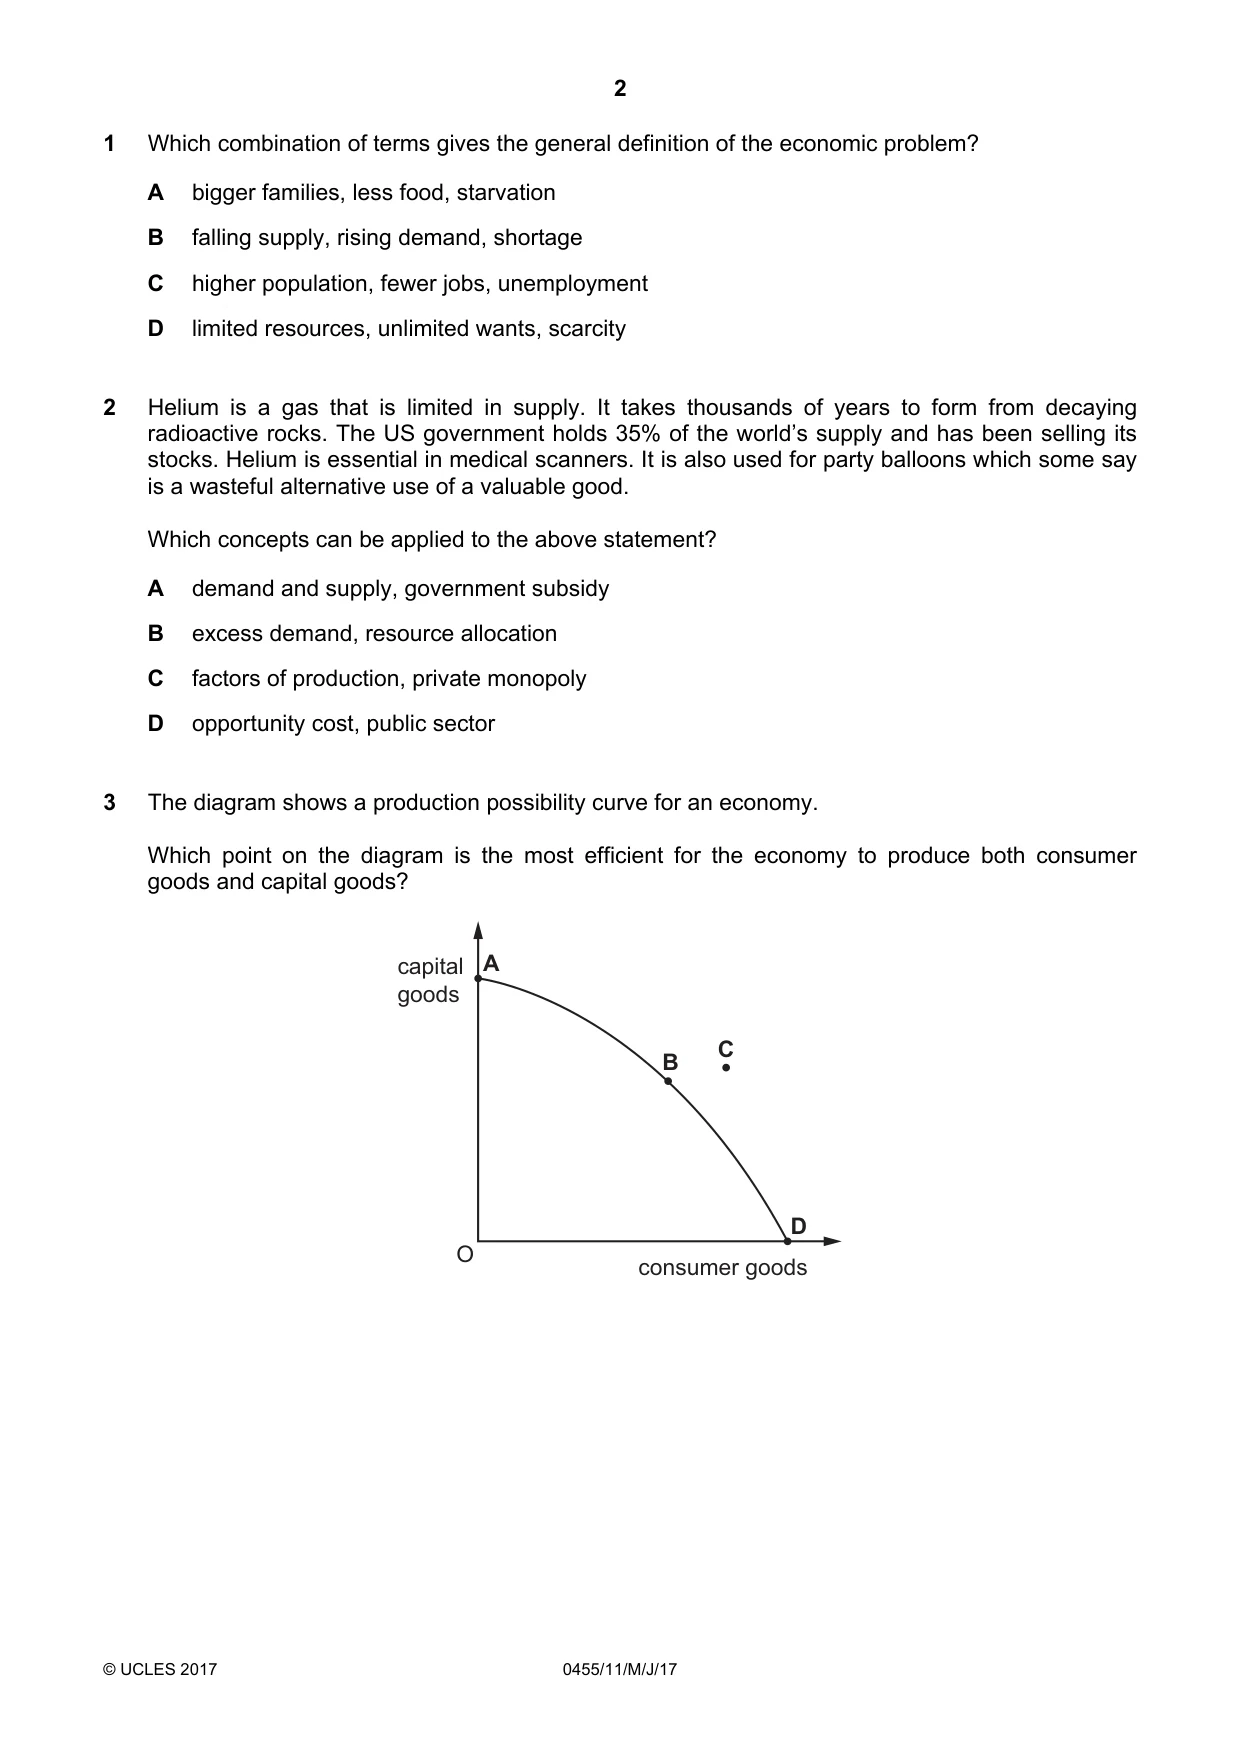
Q3 · The diagram shows a production possibility curve for an economy
3 The diagram shows a production possibility curve for an economy. Which point on the diagram is the most efficient for the economy to produce both consumer goods and capital goods? capital A goods C B D O consumer goods
Mark scheme: B
More questions on Production possibility curve (PPC) diagrams
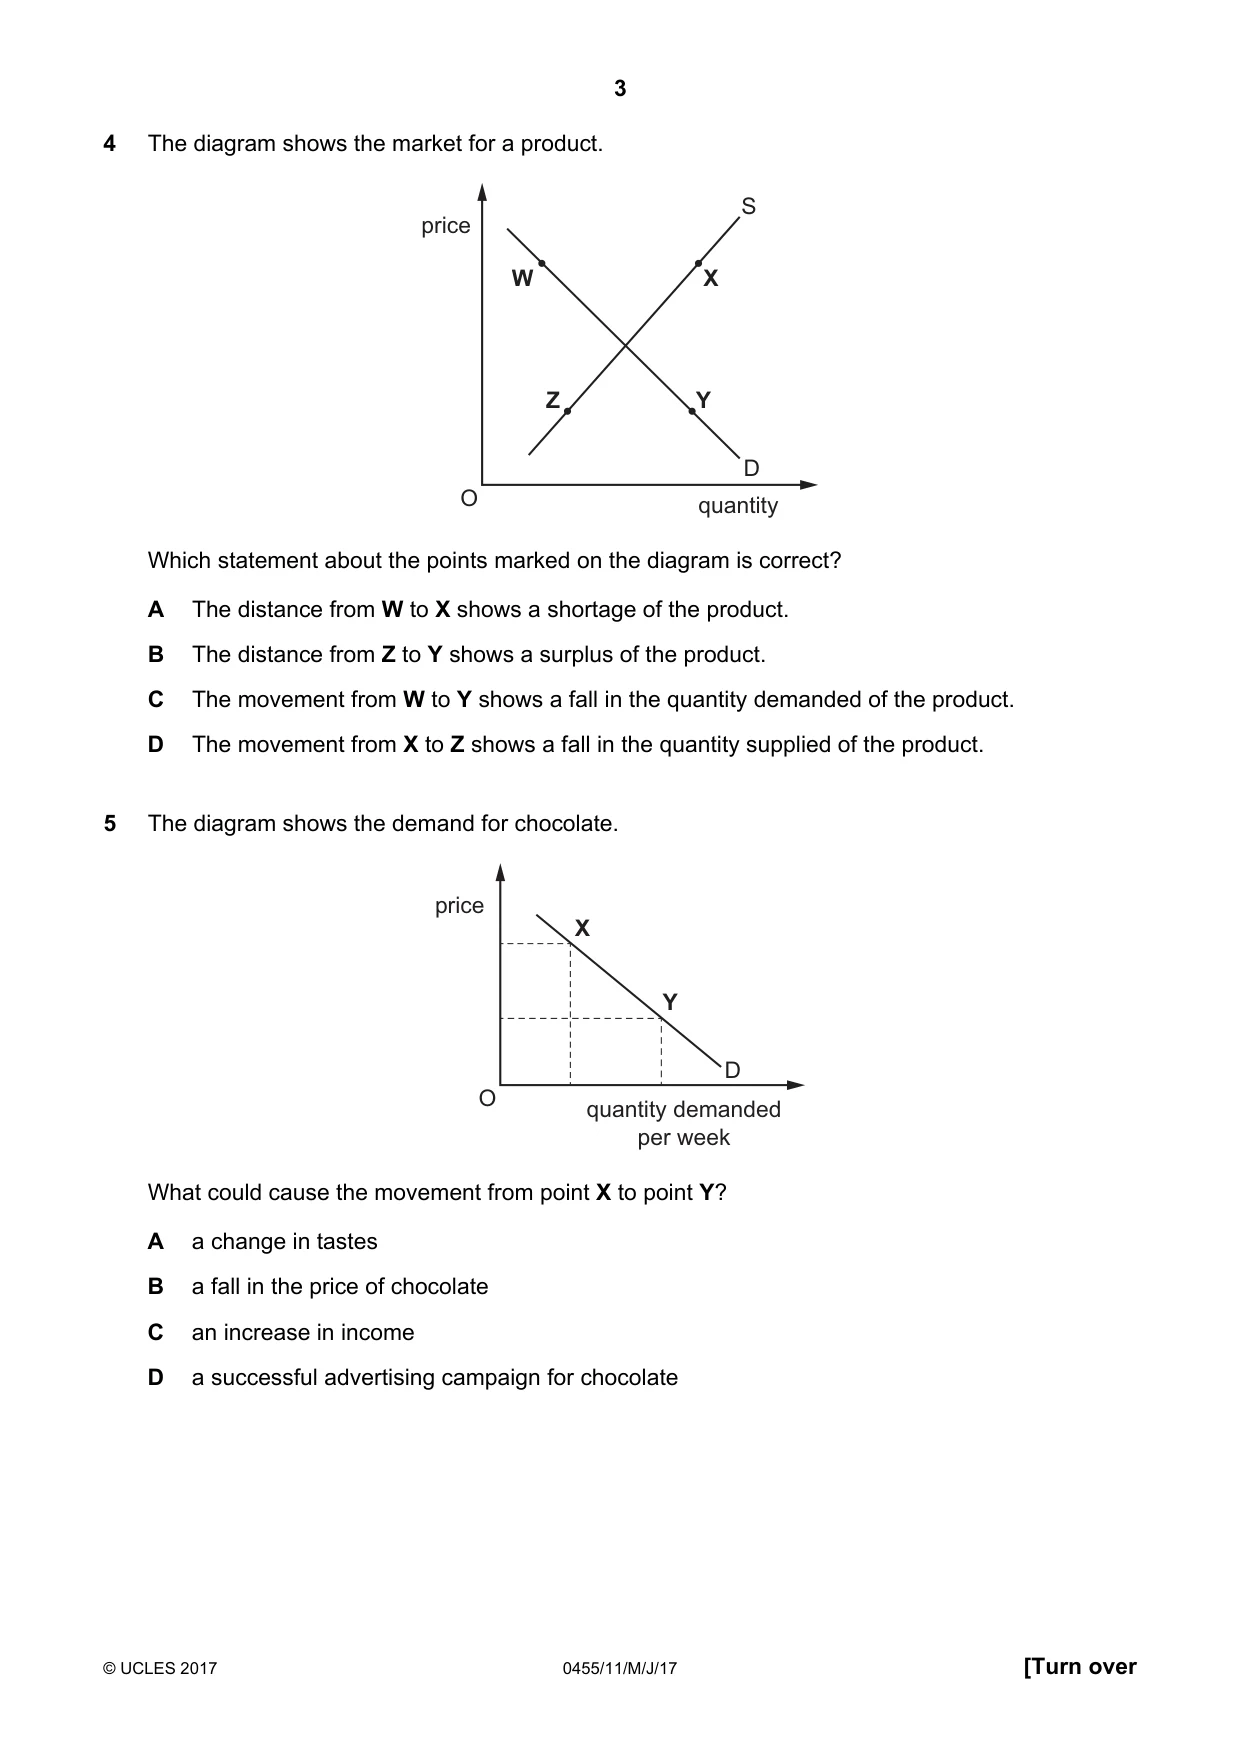
Q4 · The diagram shows the market for a product
4 The diagram shows the market for a product. S price W X Z Y D O quantity Which statement about the points marked on the diagram is correct? A The distance from W to X shows a shortage of the product. B The distance from Z to Y shows a surplus of the product. C The movement from W to Y shows a fall in the quantity demanded of the product. D The movement from X to Z shows a fall in the quantity supplied of the product.
Mark scheme: D
Q5 · The diagram shows the demand for chocolate
5 The diagram shows the demand for chocolate. price X Y D O quantity demanded per week What could cause the movement from point X to point Y? A a change in tastes B a fall in the price of chocolate C an increase in income D a successful advertising campaign for chocolate
Mark scheme: B
Q6 · A football club raises all stadium seat prices by 5%
6 A football club raises all stadium seat prices by 5%. The stadium is divided into four zones. The demand for seats falls by 1% in zone W, by 3% in zone X, by 5% in zone Y and by 6% in zone Z. In which zone is the responsiveness of demand for seats to the price change elastic? A zone W B zone X C zone Y D zone Z
Mark scheme: D
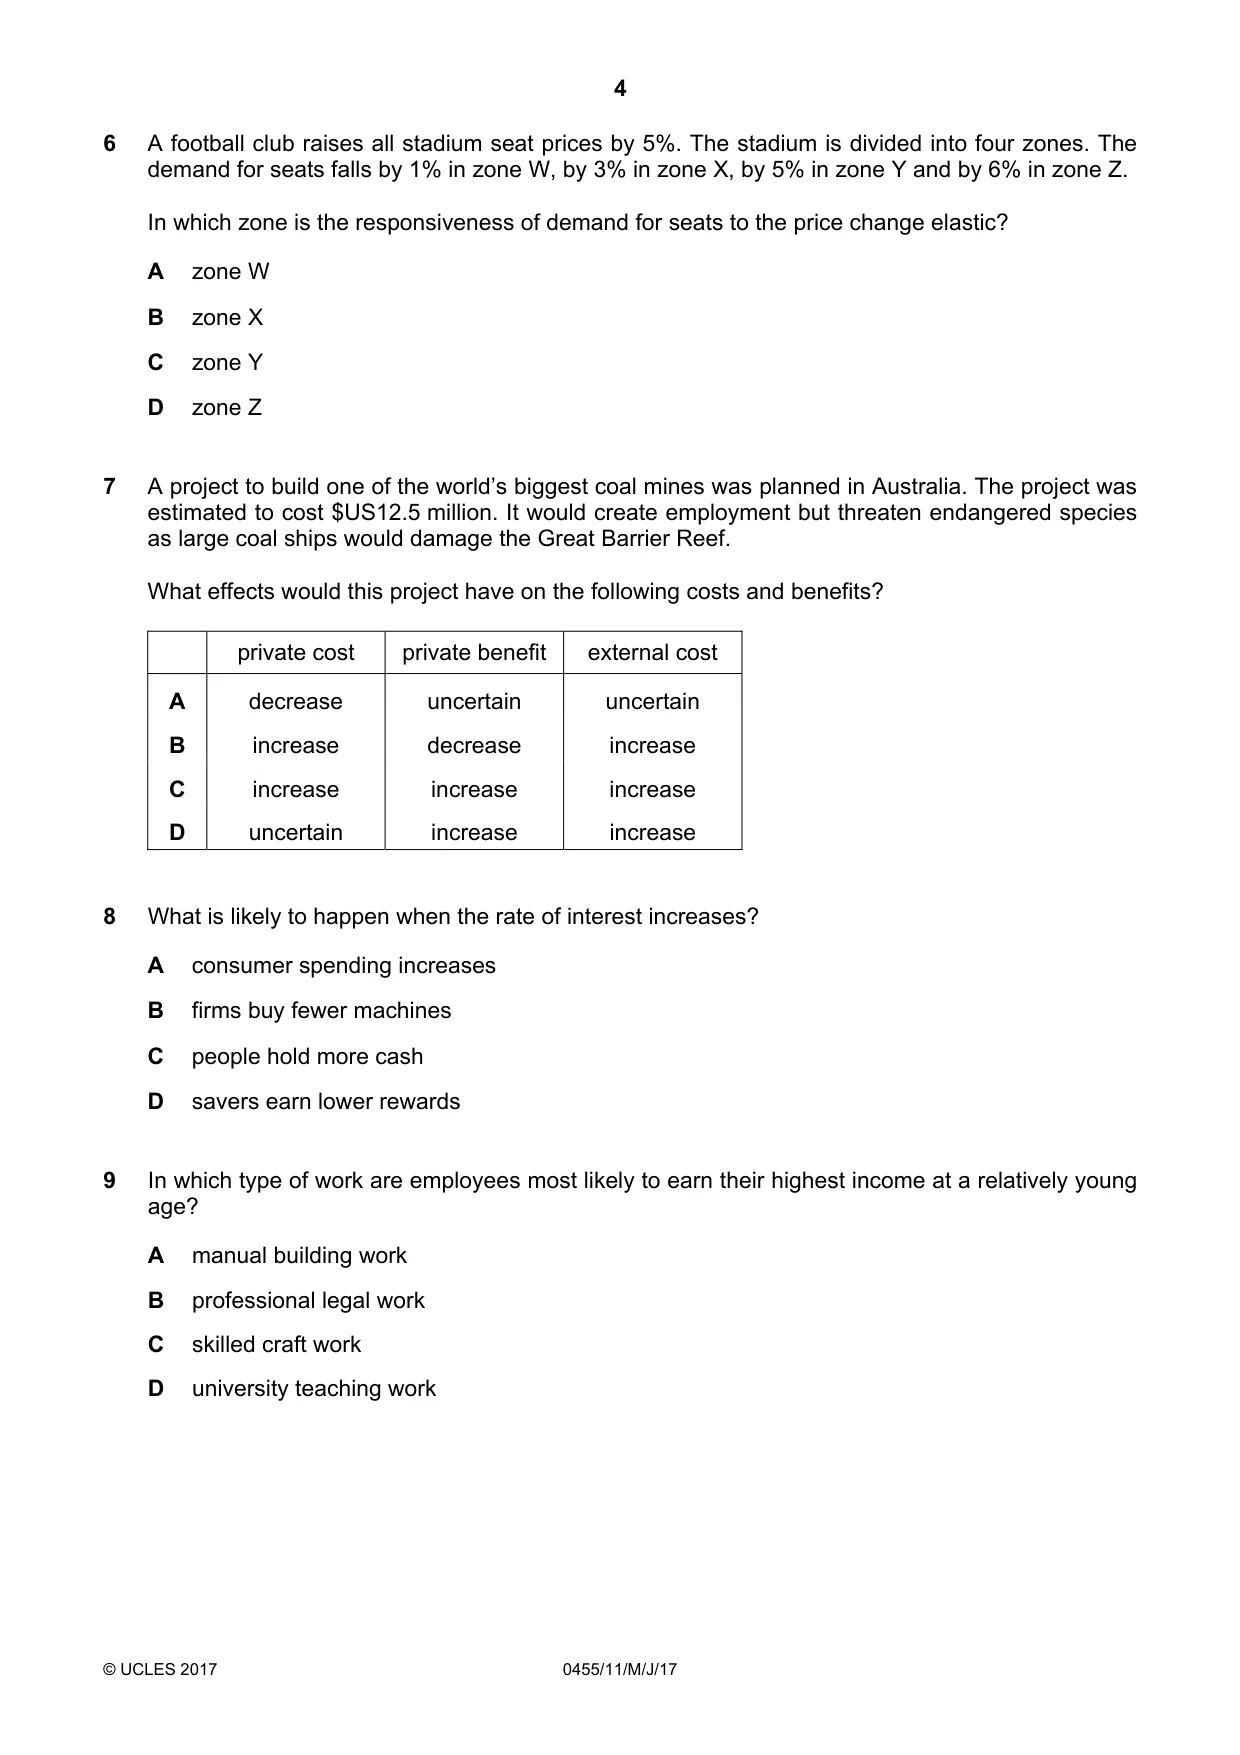
Q7 · A project to build one of the world’s biggest coal mines was planned in Australia
7 A project to build one of the world’s biggest coal mines was planned in Australia. The project was estimated to cost $US12.5 million. It would create employment but threaten endangered species as large coal ships would damage the Great Barrier Reef. What effects would this project have on the following costs and benefits? private cost private benefit external cost A decrease uncertain uncertain B increase decrease increase C increase increase increase D uncertain increase increase
Mark scheme: C
Q8 · What is likely to happen when the rate of interest increases?
8 What is likely to happen when the rate of interest increases? A consumer spending increases B firms buy fewer machines C people hold more cash D savers earn lower rewards
Mark scheme: B
Q9 · In which type of work are employees most likely to earn their highest income at a…
9 In which type of work are employees most likely to earn their highest income at a relatively young age? A manual building work B professional legal work C skilled craft work D university teaching work
Mark scheme: A
Q10 · Individuals produced their own goods
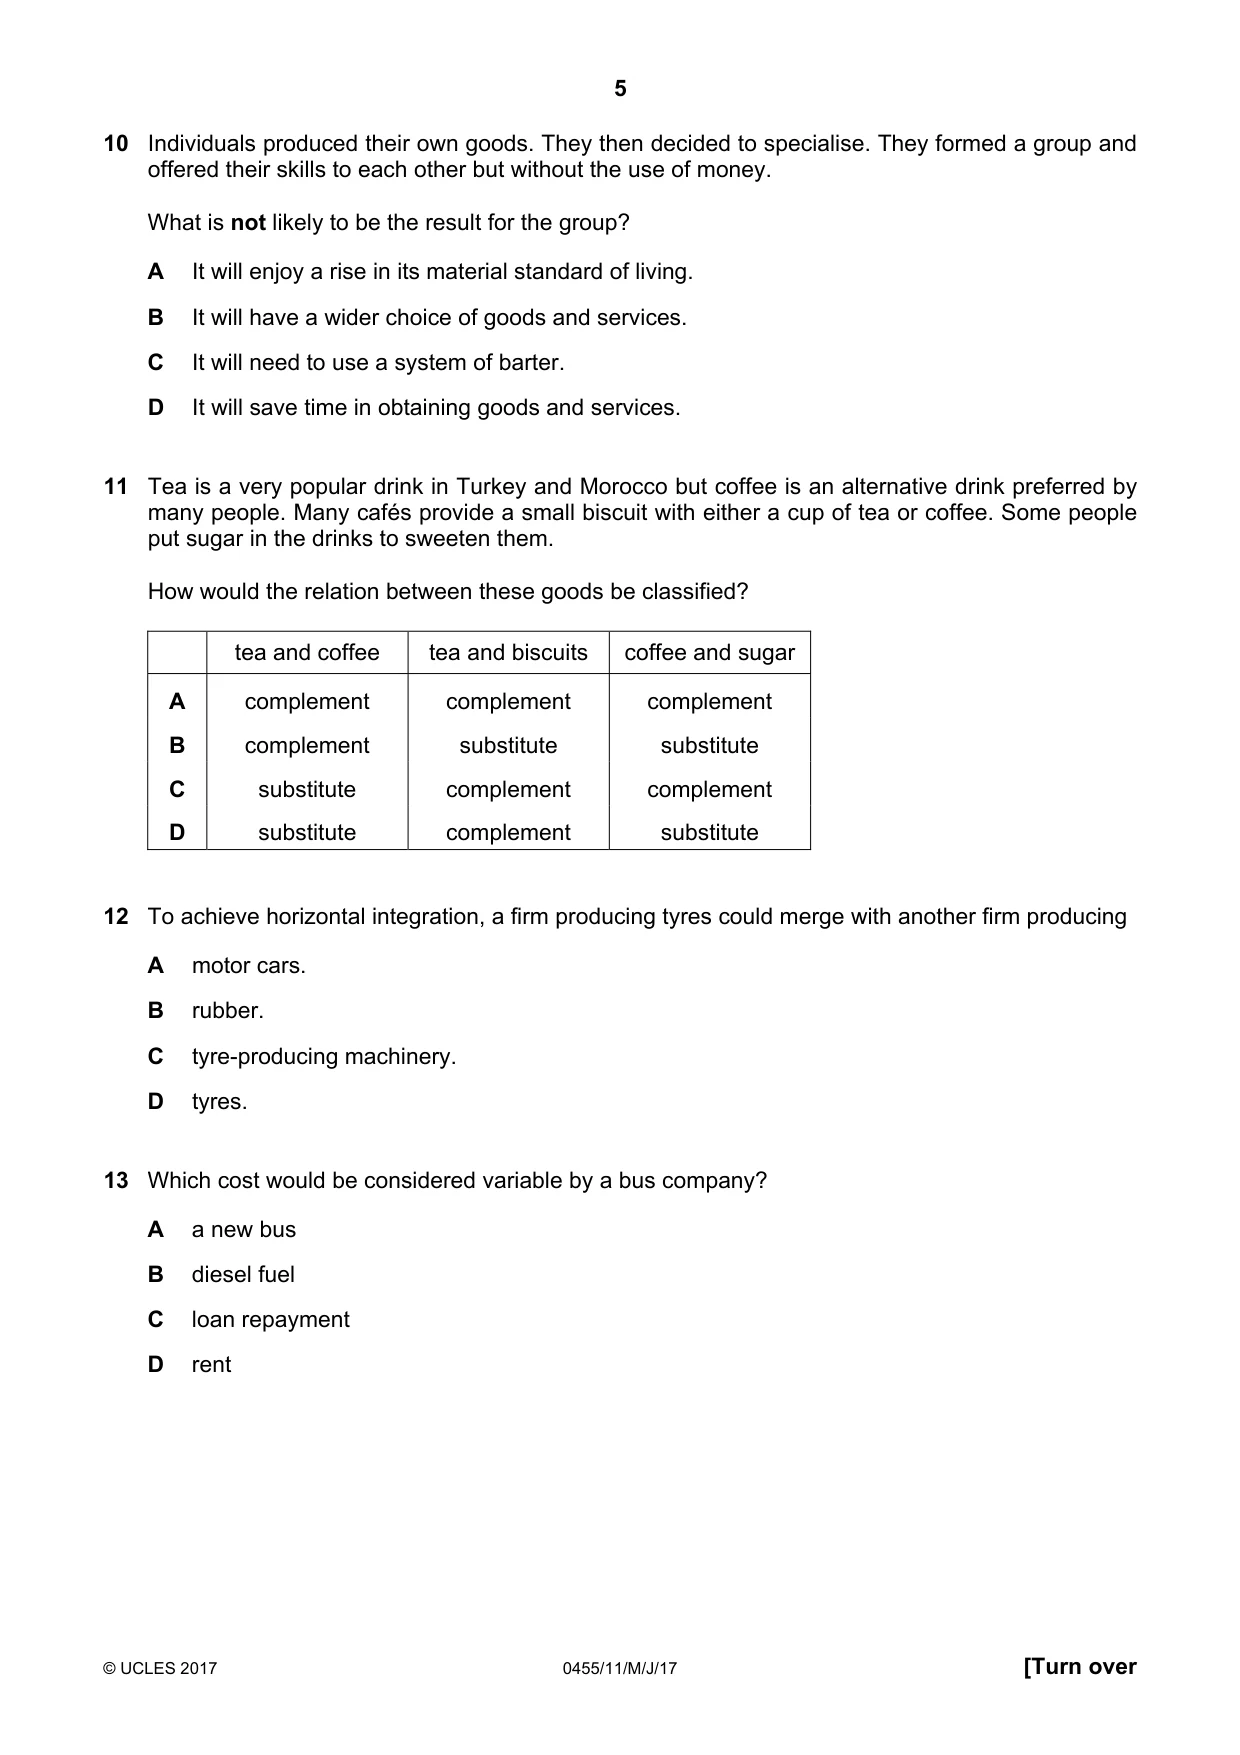
10 Individuals produced their own goods. They then decided to specialise. They formed a group and offered their skills to each other but without the use of money. What is not likely to be the result for the group? A It will enjoy a rise in its material standard of living. B It will have a wider choice of goods and services. C It will need to use a system of barter. D It will save time in obtaining goods and services.
Mark scheme: D
Q11 · Tea is a very popular drink in Turkey and Morocco but coffee is an alternative drink…
11 Tea is a very popular drink in Turkey and Morocco but coffee is an alternative drink preferred by many people. Many cafés provide a small biscuit with either a cup of tea or coffee. Some people put sugar in the drinks to sweeten them. How would the relation between these goods be classified? tea and coffee tea and biscuits coffee and sugar A complement complement complement B complement substitute substitute C substitute complement complement D substitute complement substitute
Mark scheme: C
Q12 · To achieve horizontal integration, a firm producing tyres could merge with another firm…
12 To achieve horizontal integration, a firm producing tyres could merge with another firm producing A motor cars. B rubber. C tyre-producing machinery. D tyres.
Mark scheme: D
Q13 · Which cost would be considered variable by a bus company?
13 Which cost would be considered variable by a bus company? A a new bus B diesel fuel C loan repayment D rent
Mark scheme: B
Q14 · A monopoly takes over an industry from competitive firms
14 A monopoly takes over an industry from competitive firms. What is not likely to be true about a monopoly compared with a competitive firm? A A monopoly will earn a higher rate of profit. B A monopoly will gain a greater share of the market. C A monopoly will offer a wider choice to the consumer. D A monopoly will operate on a larger scale of production.
Mark scheme: C
Q15 · The table shows how a firm’s production changes as it employs more workers
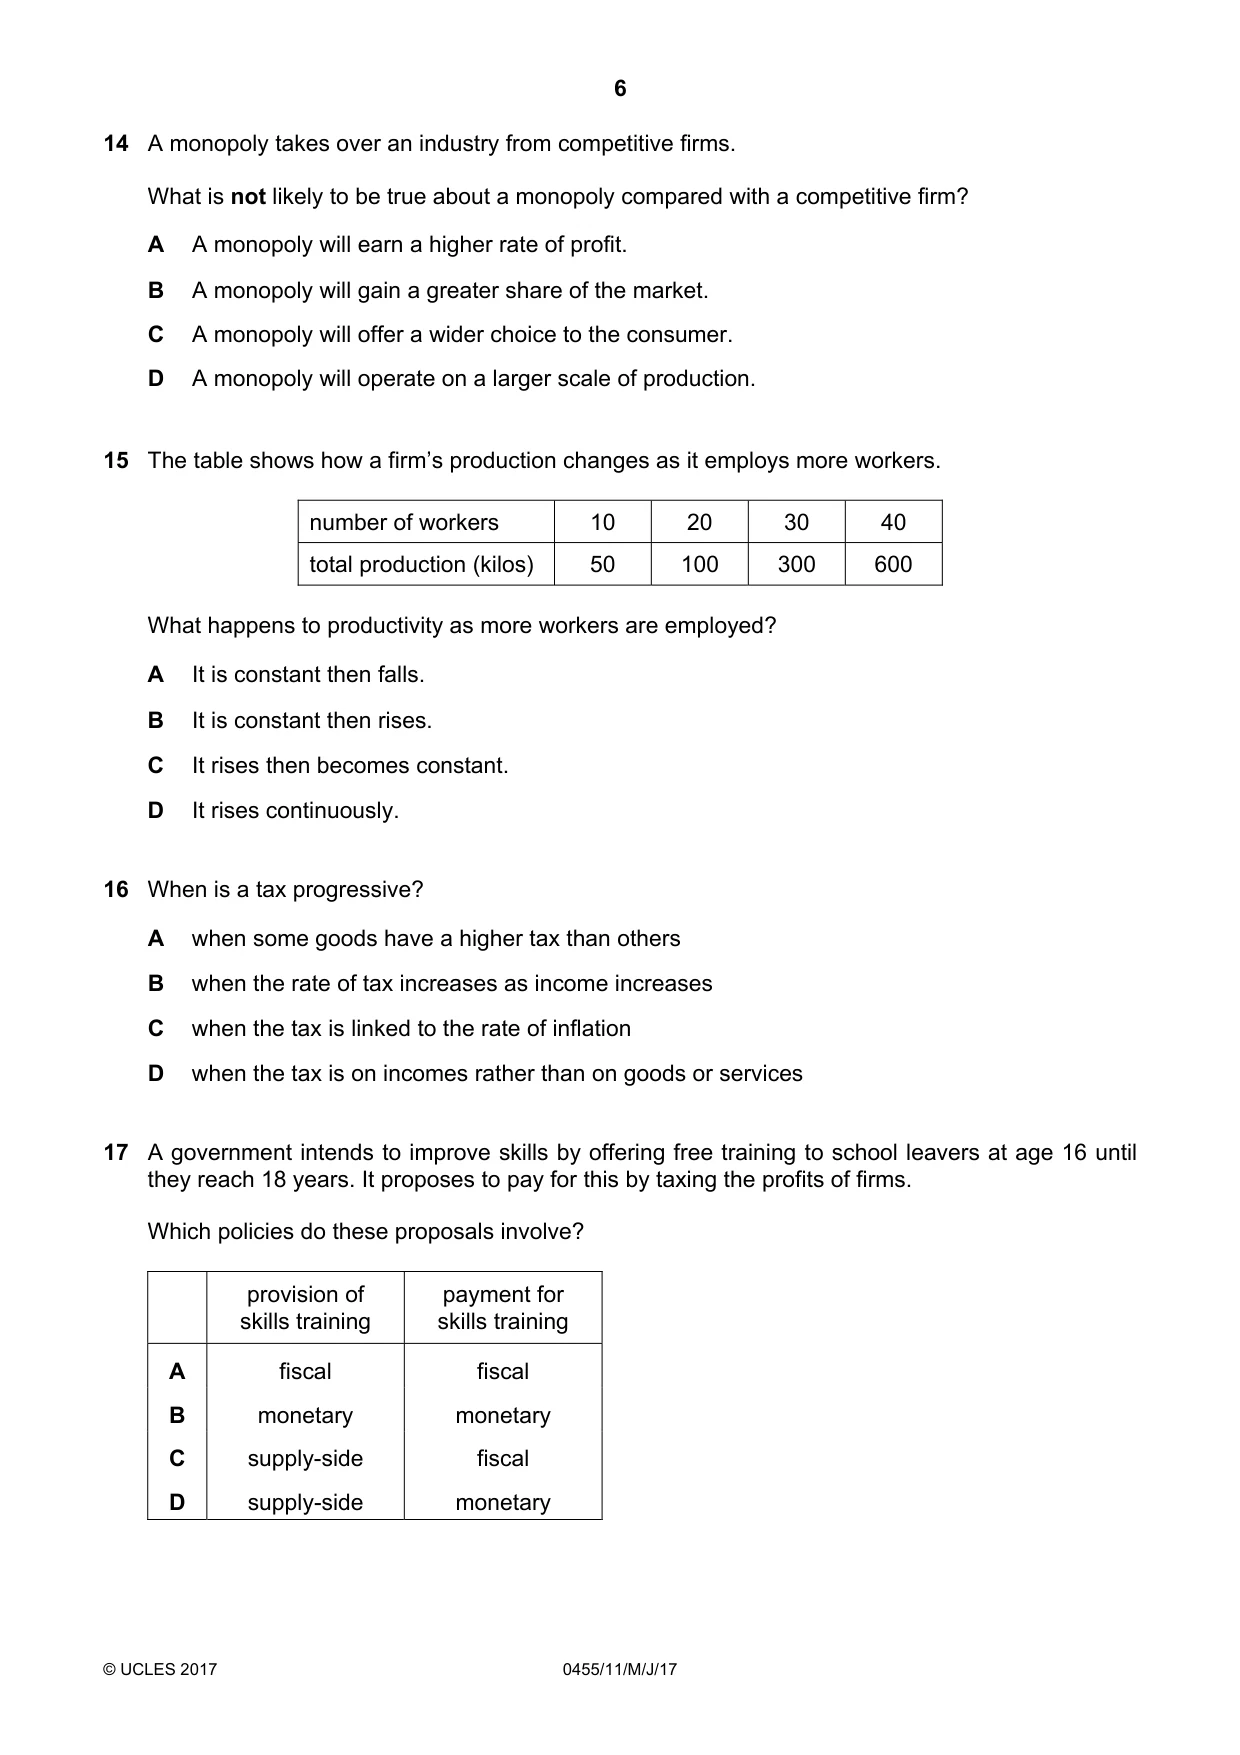
15 The table shows how a firm’s production changes as it employs more workers. number of workers 10 20 30 40 total production (kilos) 50 100 300 600 What happens to productivity as more workers are employed? A It is constant then falls. B It is constant then rises. C It rises then becomes constant. D It rises continuously.
Mark scheme: B
Q16 · When is a tax progressive?
16 When is a tax progressive? A when some goods have a higher tax than others B when the rate of tax increases as income increases C when the tax is linked to the rate of inflation D when the tax is on incomes rather than on goods or services
Mark scheme: B
Q17 · A government intends to improve skills by offering free training to school leavers at age…
17 A government intends to improve skills by offering free training to school leavers at age 16 until they reach 18 years. It proposes to pay for this by taxing the profits of firms. Which policies do these proposals involve? provision of payment for skills training skills training A fiscal fiscal B monetary monetary C supply-side fiscal D supply-side monetary
Mark scheme: C
Q18 · In trying to achieve one of its aims a government may make it difficult to achieve…
18 In trying to achieve one of its aims a government may make it difficult to achieve another aim. What is an example of this conflict? A Achieving a more even distribution of income may prevent a rise in the average standard of living. B Achieving an increase in economic growth may prevent full employment. C Achieving full employment may prevent stable prices. D Achieving stable prices may prevent a current account surplus on the balance of payments.
Mark scheme: C
Q19 · The charts relate to the Financial Statement of the government of New Zealand for 2014
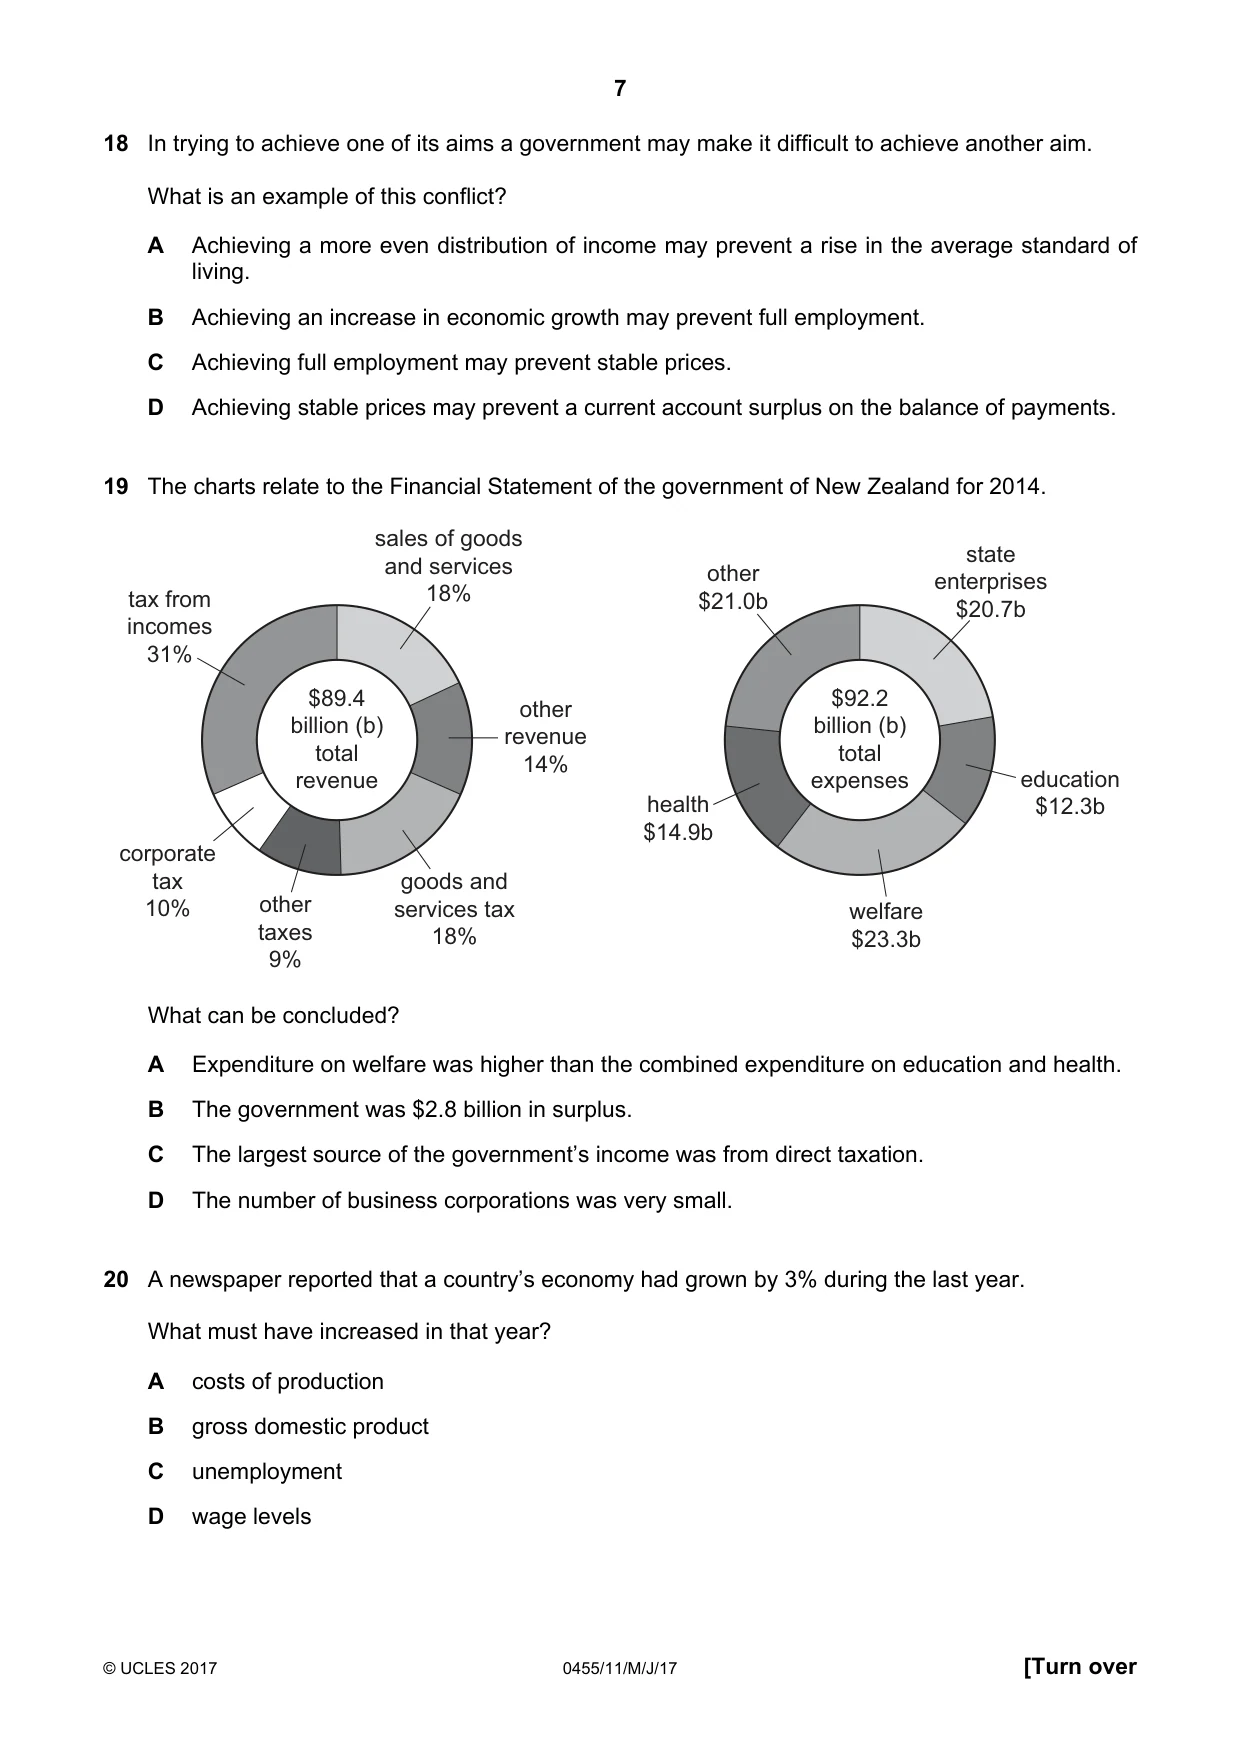
19 The charts relate to the Financial Statement of the government of New Zealand for 2014. sales of goods state and services other enterprises tax from 18% $21.0b $20.7b incomes 31% $89.4 $92.2 other billion (b) billion (b) revenue total total 14% revenue expenses education health $12.3b $14.9b corporate tax goods and 10% other services tax welfare taxes 18% $23.3b 9% What can be concluded? A Expenditure on welfare was higher than the combined expenditure on education and health. B The government was $2.8 billion in surplus. C The largest source of the government’s income was from direct taxation. D The number of business corporations was very small.
Mark scheme: C
Q20 · A newspaper reported that a country’s economy had grown by 3% during the last year
20 A newspaper reported that a country’s economy had grown by 3% during the last year. What must have increased in that year? A costs of production B gross domestic product C unemployment D wage levels
Mark scheme: B
Q21 · A country has a low GDP and a large population but ranks relatively highly on the HDI
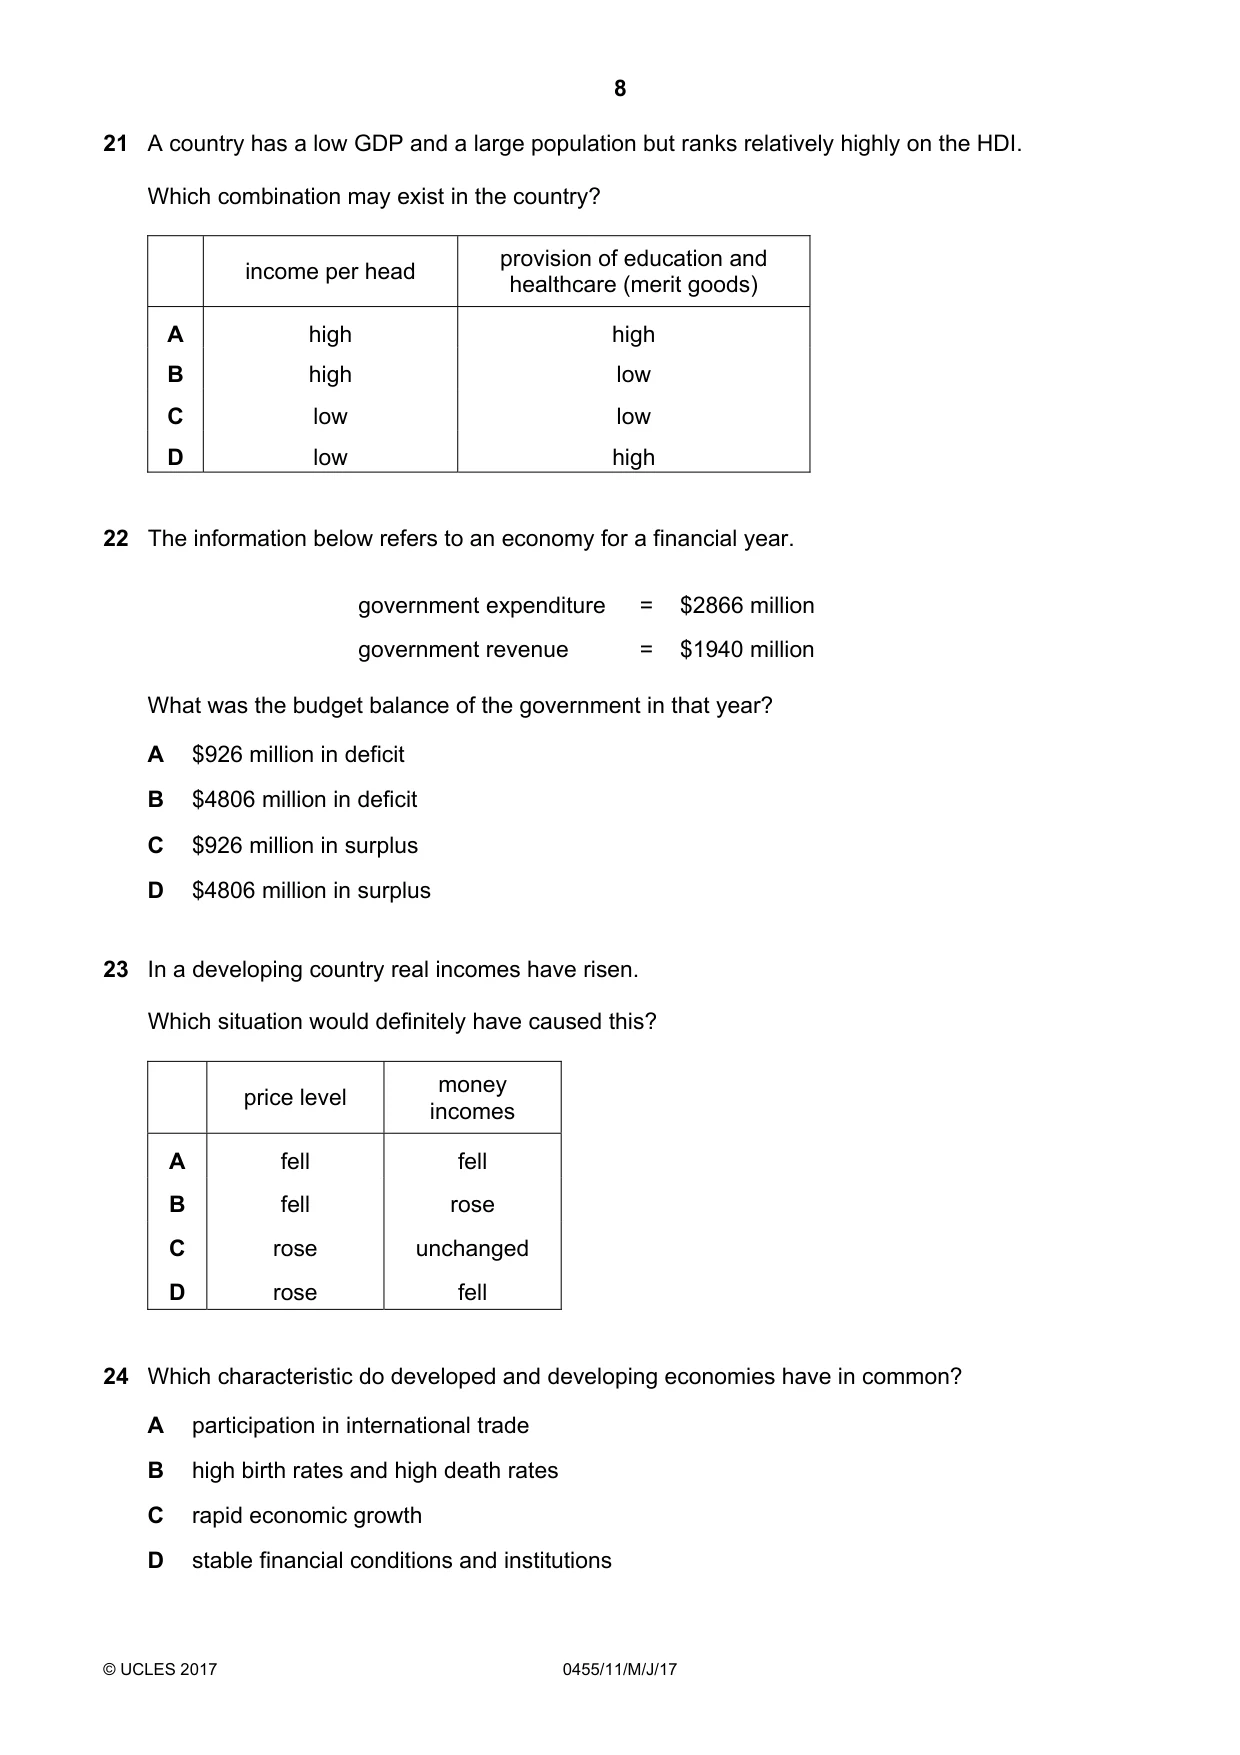
21 A country has a low GDP and a large population but ranks relatively highly on the HDI. Which combination may exist in the country? provision of education and income per head healthcare (merit goods) A high high B high low C low low D low high
Mark scheme: D
More questions on Differences in economic development between countries
Q22 · The information below refers to an economy for a financial year
22 The information below refers to an economy for a financial year. government expenditure = $2866 million government revenue = $1940 million What was the budget balance of the government in that year? A $926 million in deficit B $4806 million in deficit C $926 million in surplus D $4806 million in surplus
Mark scheme: A
Q23 · In a developing country real incomes have risen
23 In a developing country real incomes have risen. Which situation would definitely have caused this? money price level incomes A fell fell B fell rose C rose unchanged D rose fell
Mark scheme: B
Q24 · Which characteristic do developed and developing economies have in common?
24 Which characteristic do developed and developing economies have in common? A participation in international trade B high birth rates and high death rates C rapid economic growth D stable financial conditions and institutions
Mark scheme: A
Q25 · The diagram shows population projections until the year 2075 for selected areas
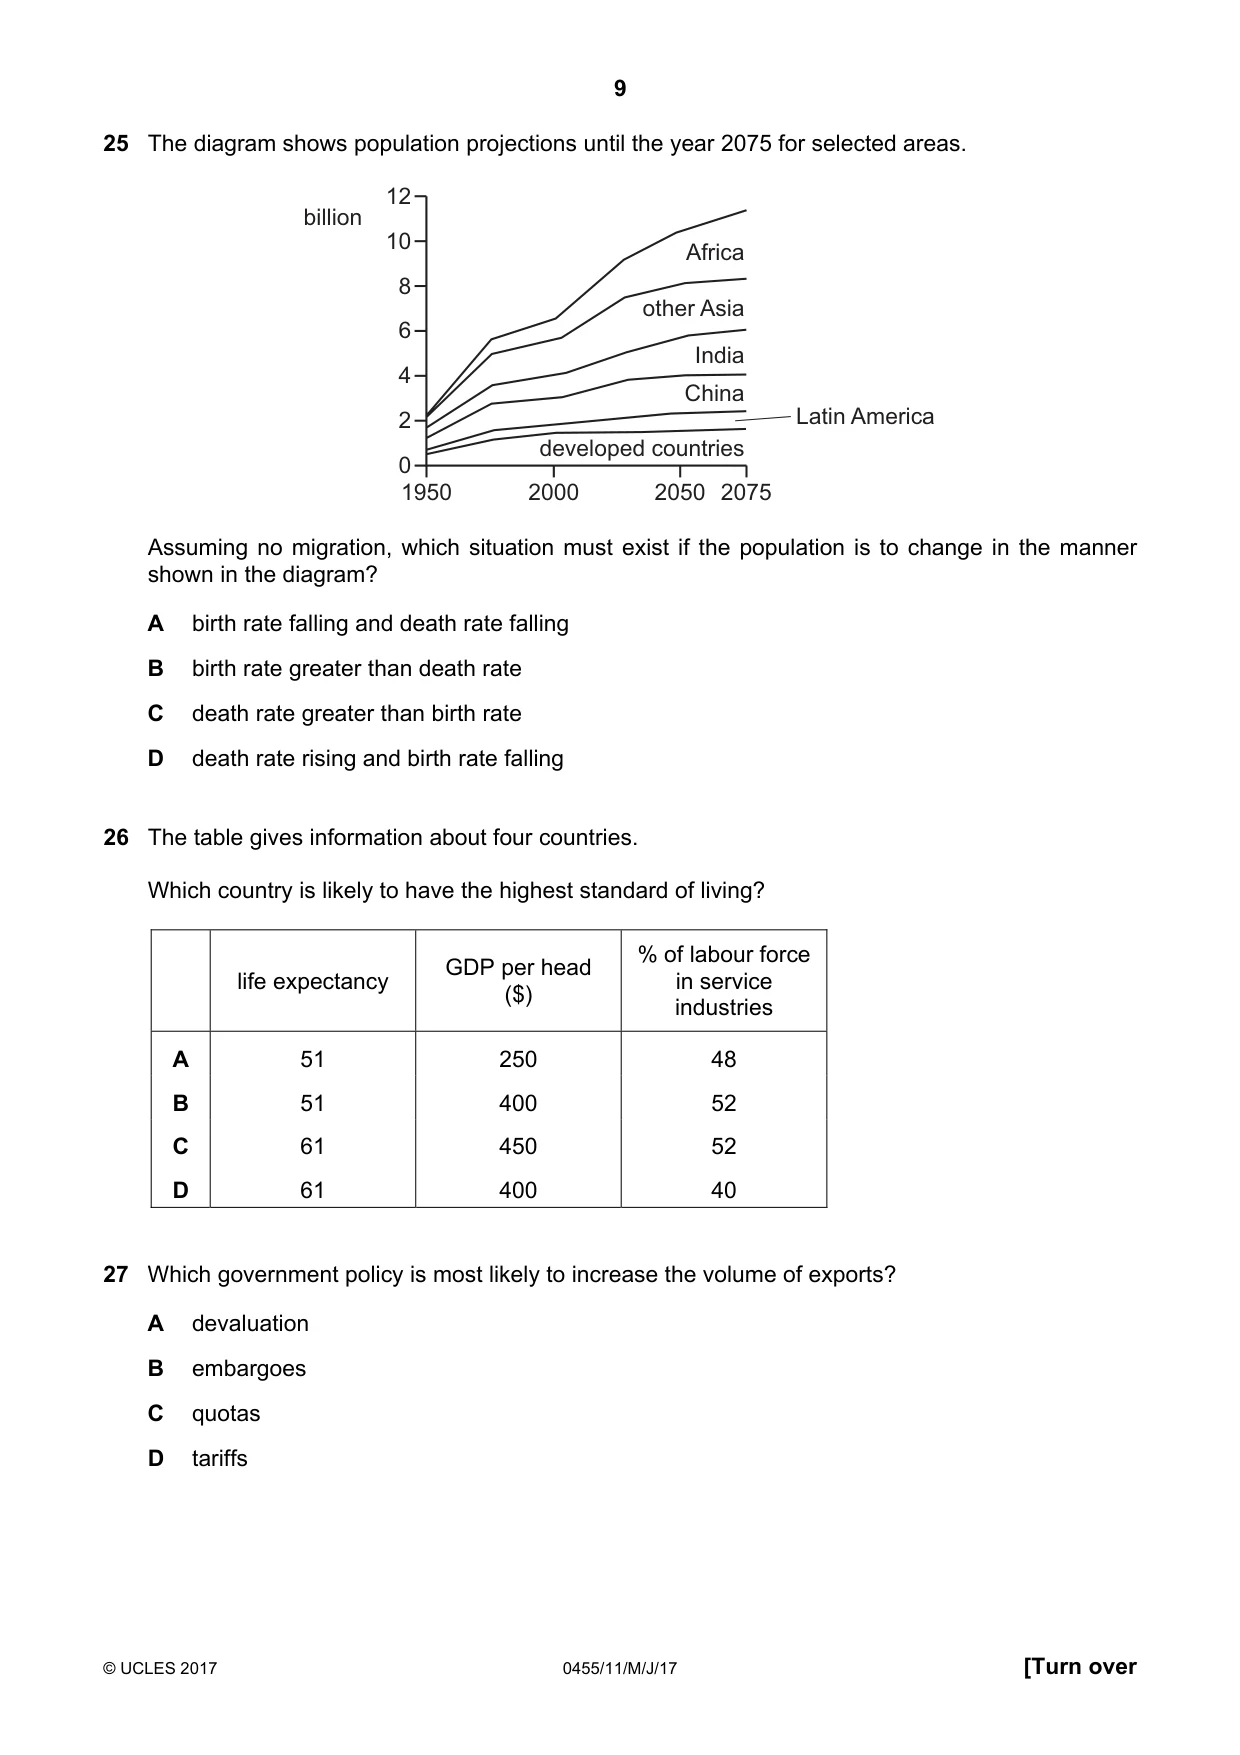
25 The diagram shows population projections until the year 2075 for selected areas. 12 billion 10 Africa 8 other Asia 6 India 4 China 2 Latin America developed countries 0 1950 2000 2050 2075 Assuming no migration, which situation must exist if the population is to change in the manner shown in the diagram? A birth rate falling and death rate falling B birth rate greater than death rate C death rate greater than birth rate D death rate rising and birth rate falling
Mark scheme: B
Q26 · The table gives information about four countries
26 The table gives information about four countries. Which country is likely to have the highest standard of living? % of labour force GDP per head life expectancy in service ($) industries A 51 250 48 B 51 400 52 C 61 450 52 D 61 400 40
Mark scheme: C
Q27 · Which government policy is most likely to increase the volume of exports?
27 Which government policy is most likely to increase the volume of exports? A devaluation B embargoes C quotas D tariffs
Mark scheme: A
Q28 · What is necessarily involved in international free trade?
28 What is necessarily involved in international free trade? A the absence of transport costs B the gift of foreign aid from charities C the supply of zero interest rate government loans D the unrestricted exchange of goods and services
Mark scheme: D
Q29 · In recent years, the US has experienced a deficit on its overall current account of the…
29 In recent years, the US has experienced a deficit on its overall current account of the balance of payments. What could have led to an increase in the size of the deficit? A increased competitiveness of goods made in the US B increased earnings by US investors in foreign companies C increased numbers of overseas visitors to the US D increased spending on US military bases abroad
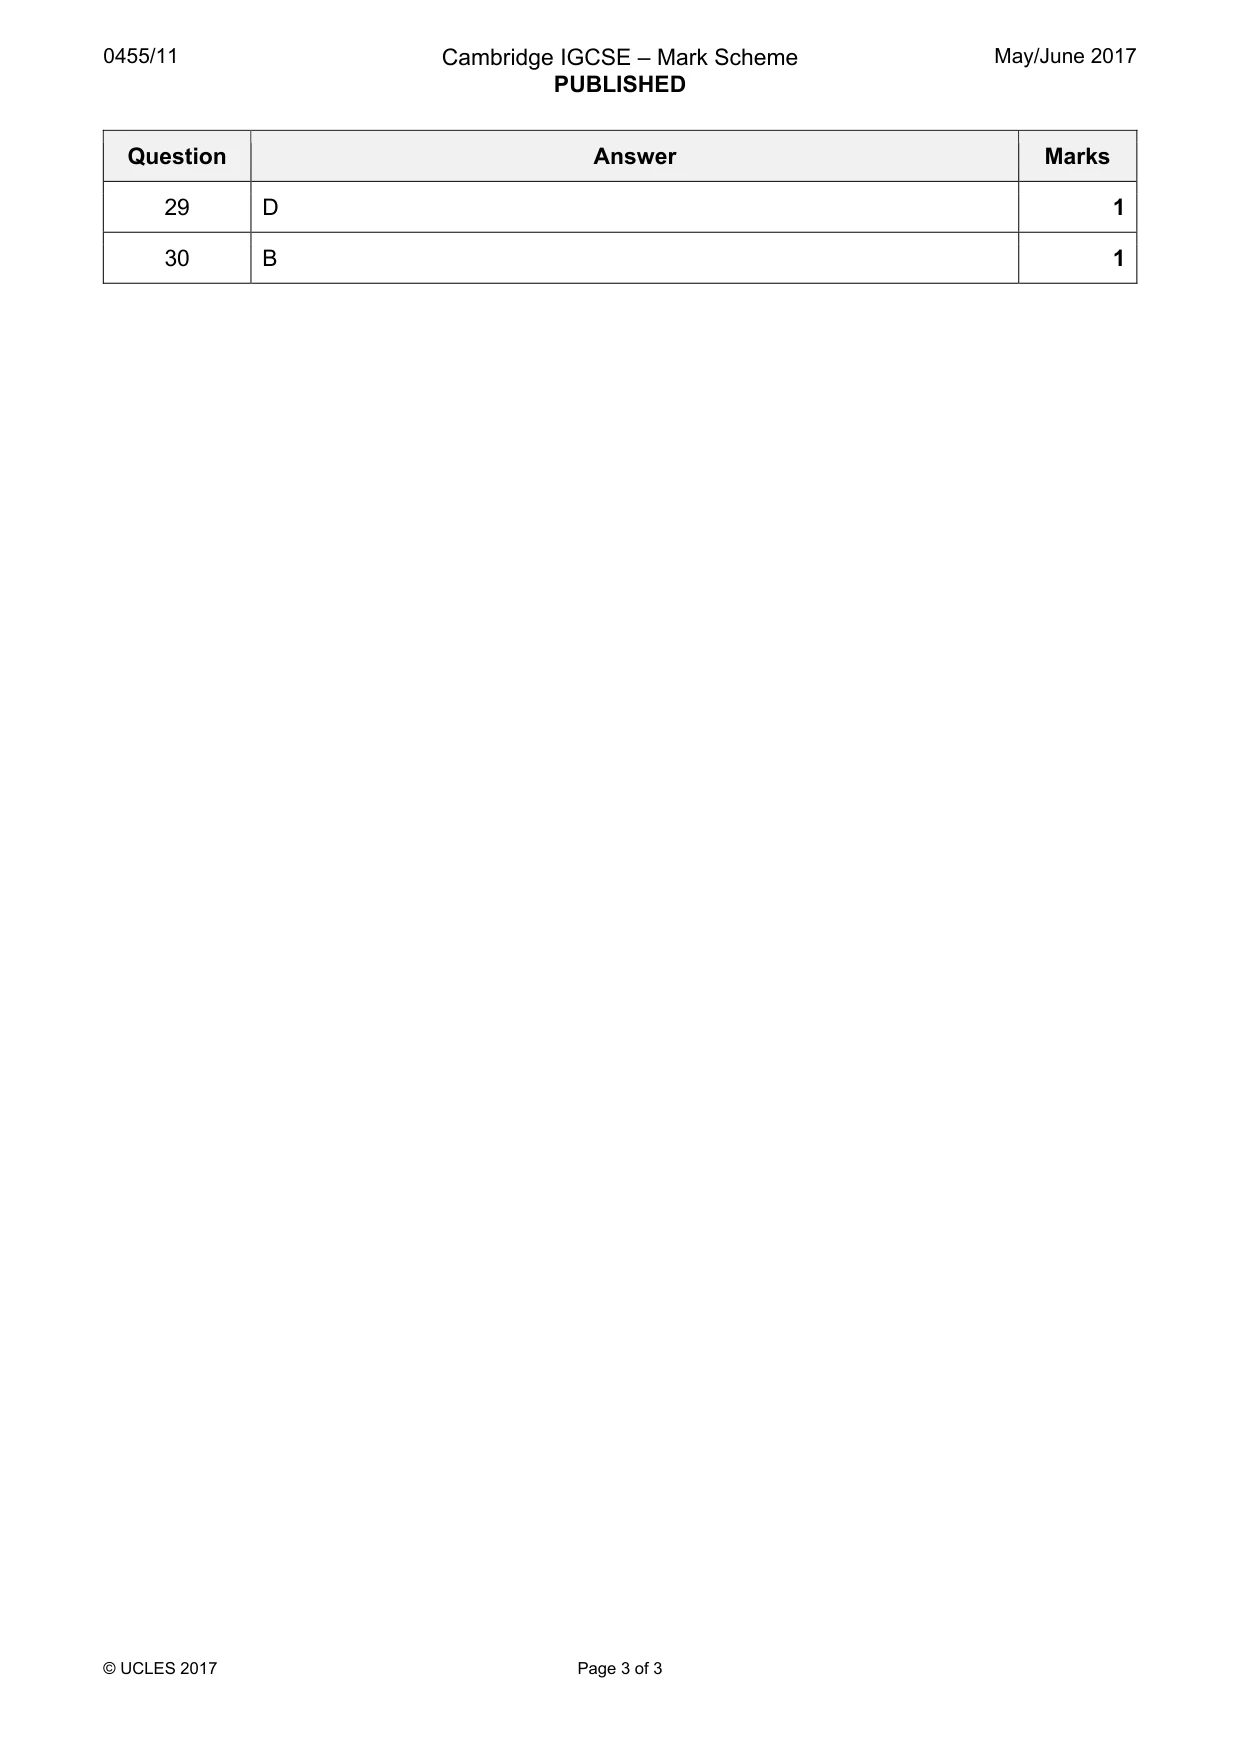
Mark scheme: D
Q30 · In 2015, China was the world’s largest exporter of manufactured goods and a major…
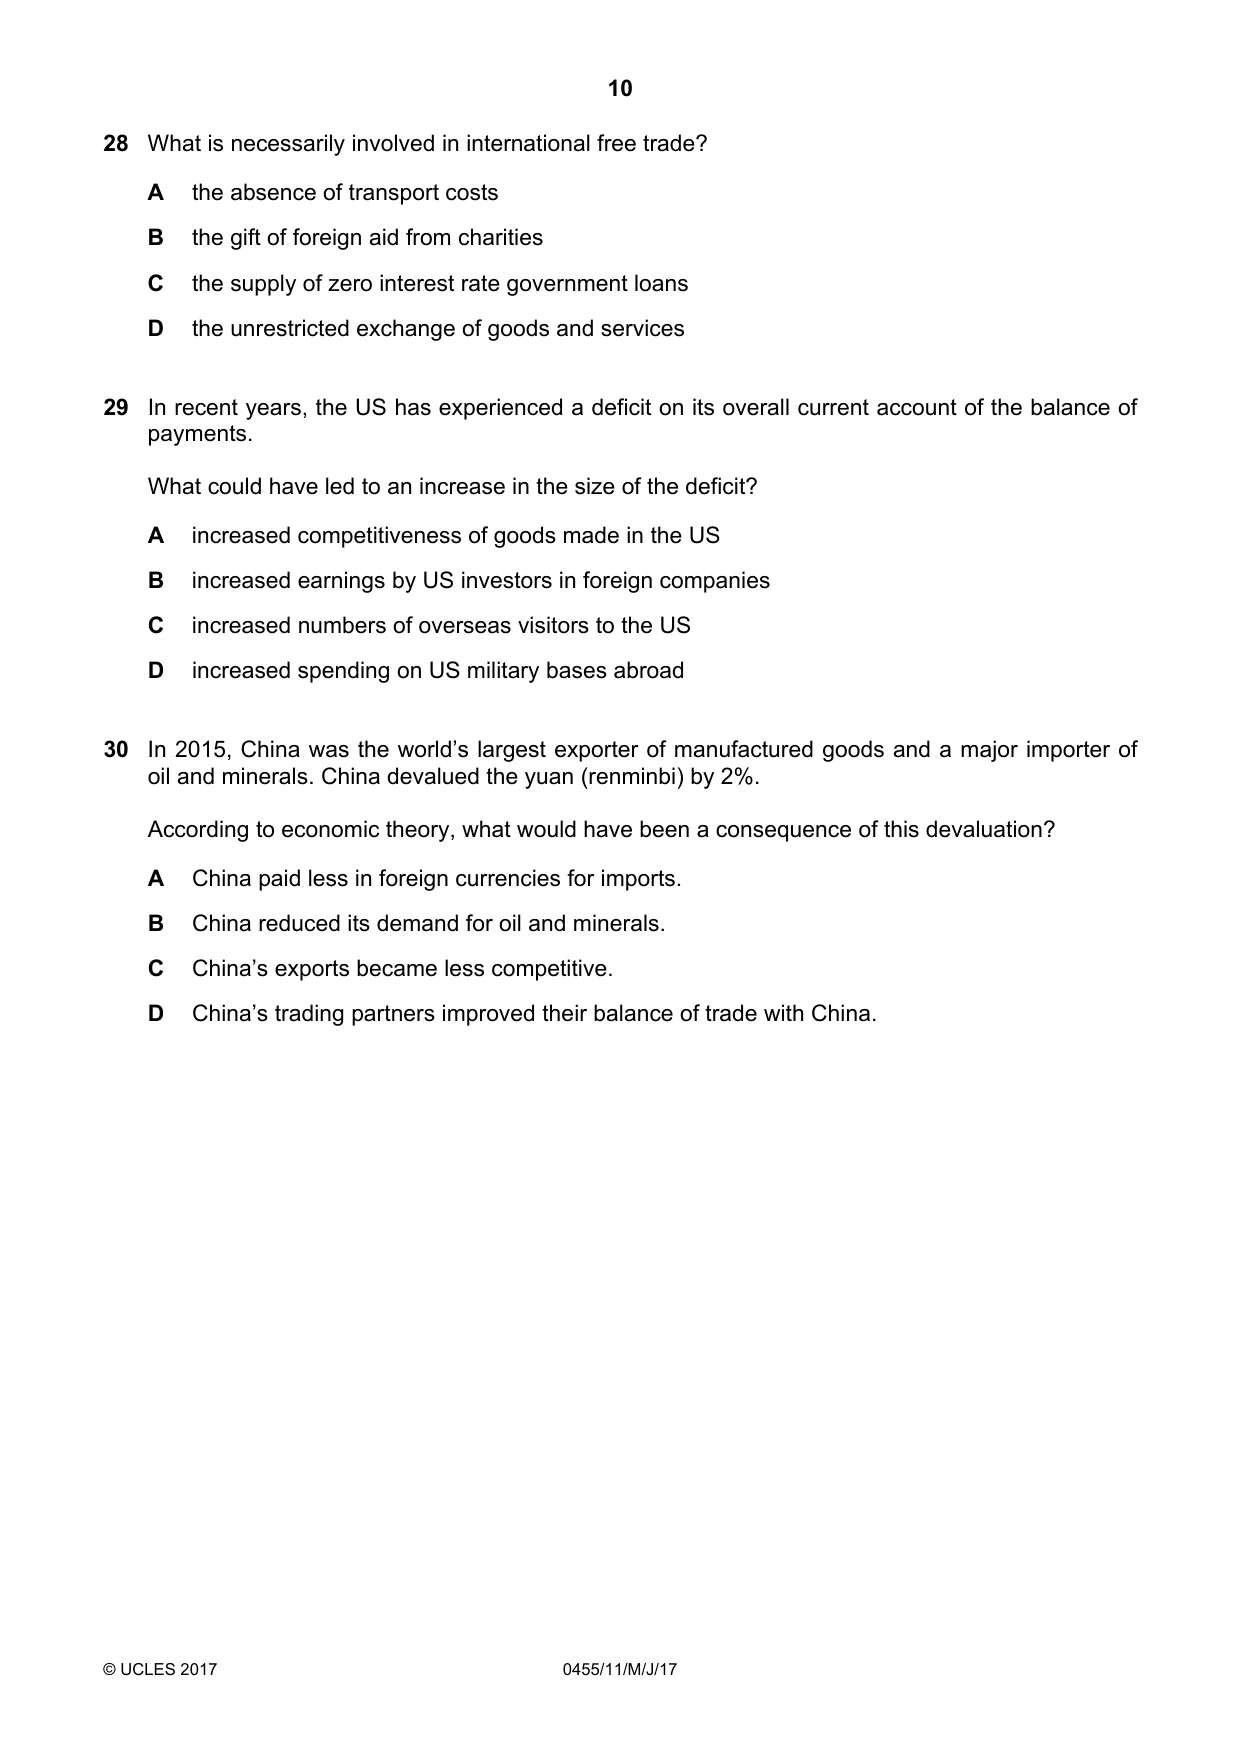
30 In 2015, China was the world’s largest exporter of manufactured goods and a major importer of oil and minerals. China devalued the yuan (renminbi) by 2%. According to economic theory, what would have been a consequence of this devaluation? A China paid less in foreign currencies for imports. B China reduced its demand for oil and minerals. C China’s exports became less competitive. D China’s trading partners improved their balance of trade with China.
Mark scheme: B
What was in this paper
The subtopics covered by these 30 questions, and how many questions each got. Open one in a new tab to see every Cambridge question on it.
3Demand2Foreign exchange rates2Globalisation, free trade and protection2Current account of balance of payments1Differences in economic development between countries1Economic growth1Firms1Firms and production1Firms’ costs, revenue and objectives1Inflation and deflation1Living standards1Market failure1Market structure1Monetary policy1Money and banking1Opportunity cost1Population1Price determination1Price elasticity of demand (PED)1Production possibility curve (PPC) diagrams1Supply-side policy1The macroeconomic aims of government1The nature of the economic problem1Workers1What you needed in this session
Cambridge’s own grade thresholds for 2017 May/June, Paper 1 · Variant 1. A higher threshold means an easier paper — the bar moves with how the cohort did.