Questions as text
Q1 · The diagram represents the production possibility curves of two economies X and Y 9708/11 Oct/Nov 2005
19 The diagram represents the production possibility curves of two economies X and Y. 2500 X 2000 X1 agricultural goods (units) 1000 Y 0 500 1000 manufactured goods (units) As a result of soil erosion in economy X, the production possibility curve shifts from X to X1. According to the law of comparative advantage, what should country Y do following this change? A cease to trade with country X B export agricultural goods to country X C export manufactured goods to country X D import both agricultural and manufactured goods from country X
1 marks
Answer: A
This question in 9708/11 Oct/Nov 2005
Q2 · When will there be a favourable movement in a country’s terms of trade? 9708/11 Oct/Nov 2005
21 When will there be a favourable movement in a country’s terms of trade? A when the prices of its exports fall by more than the prices of its imports B when the prices of its imports rise by less than the prices of its exports C when the volume of its exports increases by more than the volume of its imports D when the volume of its imports increases by more than the volume of its exports
1 marks
Answer: B
This question in 9708/11 Oct/Nov 2005
Q3 · What would encourage the growth of the international division of labour? 9708/11 May/June 2006
4 What would encourage the growth of the international division of labour? A an improvement in transport systems B instability in international exchange rates C restrictions on the movement of resources D the widespread introduction of tariffs
1 marks
Answer: A
This question in 9708/11 May/June 2006
Q4 · The graphs show the production possibilities for commodities X and Y in two countries M… 9708/11 May/June 2006
19 The graphs show the production possibilities for commodities X and Y in two countries M and N. country M country N Y Y 50 140 X X 0 100 0 560 What will be the effect of an agreement between M and N to exchange the commodities at a rate of 1Y for 3X? A Both countries will gain, because their consumption possibilities will increase. B Consumers in country M will lose, because a unit of Y will now cost 3X instead of 2X. C Only country N will gain, because N can produce more of both commodities than M. D Neither country will gain, because they both have a comparative advantage in the production of the same commodity, X.
1 marks
Answer: A
This question in 9708/11 May/June 2006
Q5 · The table shows the output per unit of input of two goods, X and Y, in two countries, 1… 9708/11 Oct/Nov 2006
19 The table shows the output per unit of input of two goods, X and Y, in two countries, 1 and 2. output of X output of Y per unit of input per unit of input Country 1 70 30 Country 2 50 25 Which statement about the data in the table is correct? A Country 1 has absolute advantage in the production of X and comparative advantage in the production of Y. B Country 1 has absolute advantage in the production of Y and comparative advantage in the production of X. C Country 2 has no absolute or comparative advantage. D Country 2 has comparative advantage in the production of X and no absolute advantage.
1 marks
Answer: B
This question in 9708/11 Oct/Nov 2006
Q6 · Turkey can produce a good but also imports some of the good from Egypt 9708/11 Oct/Nov 2006
28 Turkey can produce a good but also imports some of the good from Egypt. The Turkish currency depreciates against the Egyptian currency. How might this affect production of this good in Egypt and in Turkey? production in Egypt production in Turkey A decrease decrease B decrease increase C increase decrease D increase increase
1 marks
Answer: B
This question in 9708/11 Oct/Nov 2006
Q7 · The diagram shows the amounts of wheat and clothing that can be produced in countries X… 9708/11 May/June 2007
19 The diagram shows the amounts of wheat and clothing that can be produced in countries X and Y with a given quantity of resources. 100 country X units of wheat 50 country Y 0 200 1000 units of clothing What does the diagram indicate about the production of these two commodities? A Both countries have an absolute advantage in the production of clothing. B Both countries have a comparative advantage in the production of clothing. C Country X has a comparative advantage in wheat and an absolute advantage in clothing. D Country Y has both an absolute and a comparative advantage in clothing.
1 marks
Answer: D
This question in 9708/11 May/June 2007
Q8 · Brazil and Colombia attempt to control the supply of coffee in the world market to help… 9708/11 Oct/Nov 2007
18 Brazil and Colombia attempt to control the supply of coffee in the world market to help stabilise their incomes. What condition is essential for this to stabilise their incomes effectively? A There must be large firms in the industry. B It must be possible to store the coffee and release stocks when necessary. C Other countries must supply a significant percentage of the total market. D The demand for the product must be elastic.
1 marks
Answer: B
This question in 9708/11 Oct/Nov 2007
Q9 · Country X has a comparative advantage in producing wheat and country Y in producing cars 9708/11 Oct/Nov 2007
19 Country X has a comparative advantage in producing wheat and country Y in producing cars. However, the countries choose not to specialise and trade. What is a valid reason for this behaviour? A The exchange rate lies within the countries’ opportunity cost ratios. B There is immobility of factors of production between the countries. C Trade is based on absolute rather than comparative advantage. D Transport costs are high relative to the opportunity cost differences between the countries.
1 marks
Answer: D
This question in 9708/11 Oct/Nov 2007
Q10 · The table shows the ability of two countries, P and Q, to produce two goods, Y and Z 9708/11 May/June 2008
19 The table shows the ability of two countries, P and Q, to produce two goods, Y and Z. production of good Y production of good Z per person per person country P 1000 1600 country Q 1500 2000 Which statement is correct? A P has an absolute advantage in Z and Q has a comparative advantage in Y. B P has an absolute advantage in Z and Q has an absolute advantage in Y. C P has a comparative advantage in Z and Q has an absolute advantage in Y. D P has a comparative advantage in Y and Q has an absolute advantage in Z.
1 marks
Answer: C
This question in 9708/11 May/June 2008
Q11 · The diagram represents the production possibility curves of two economies X and Y 9708/11 Oct/Nov 2008
19 The diagram represents the production possibility curves of two economies X and Y. 2500 X 2000 X1 agricultural goods (units) 1000 Y 0 500 1000 manufactured goods (units) As a result of soil erosion in economy X, the production possibility curve shifts from X to X1. According to the law of comparative advantage, what should country Y do following this change? A cease to trade with country X B export agricultural goods to country X C export manufactured goods to country X D import both agricultural and manufactured goods from country X
1 marks
Answer: A
This question in 9708/11 Oct/Nov 2008
Q12 · The diagram shows Australia’s exports to and imports from four trade partners in $billion… 9708/11 Oct/Nov 2008
26 The diagram shows Australia’s exports to and imports from four trade partners in $billion in 1994 and 2004. Australia’s exports and imports, $bn, 1994 and 2004 30 imports 25 1994 20 2004 15 exports 10 1994 2004 5 0 Japan United States China New Zealand With which country did Australia have a trade deficit in 1994 and a trade surplus in 2004? A Japan B United States C China D New Zealand
1 marks
Answer: B
This question in 9708/11 Oct/Nov 2008
Q13 · The diagram shows a country’s domestic supply of, and demand for, a commodity that it… 9708/11 May/June 2009
11 The diagram shows a country’s domestic supply of, and demand for, a commodity that it both consumes and exports. S WP2 WP1 price D O W Y X Z quantity The world price changes from WP1 to WP2. What are the resulting changes in domestic consumption and exports? domestic consumption quantity of exports A OX to OZ OY to OX B OX to OZ OY to OZ C OY to OW YX to WZ D OY to OW YX to OZ
1 marks
Answer: C
This question in 9708/11 May/June 2009
Q14 · Between 2006 and 2007, the price of skimmed milk powder on the world market rose from… 9708/11 May/June 2009
12 Between 2006 and 2007, the price of skimmed milk powder on the world market rose from $1000 per tonne to $2400 per tonne. Assuming that the market is a free market, what will result from the price change? A Consumers will buy more complements to skimmed milk powder. B Farmers will increase the size of their dairy herds to supply more milk. C Firms processing milk into skimmed milk will switch to producing substitutes. D Governments will introduce a system of rationing.
1 marks
Answer: B
This question in 9708/11 May/June 2009
Q15 · In the diagram, MN is the production possibility curve of a country that has a… 9708/11 May/June 2009
19 In the diagram, MN is the production possibility curve of a country that has a comparative advantage in the production of good Y. M R quantity of good X O N quantity of good Y What might enable the country to consume the quantities of X and Y indicated by point R? A increased specialisation in the production of good X B international trade C a reduction in unemployment D increased specialisation in the production of good Y
1 marks
Answer: B
This question in 9708/11 May/June 2009
Q16 · A country has the correct climate for growing tea, which is produced very cheaply and… 9708/11 Oct/Nov 2009
19 A country has the correct climate for growing tea, which is produced very cheaply and exported. Fruit is also grown, but this costs more as the climate is not as suitable. Fruit can be sold at a higher price than tea so some of the land used for tea is switched to fruit. What will definitely happen as a result? A There will be an increase in specialisation by the country. B There will be an increase in the imports of tea. C There will be an opportunity cost of the loss of the tea production. D There will be production in line with absolute advantage.
1 marks
Answer: C
This question in 9708/11 Oct/Nov 2009
Q17 · What will cause an improvement in a country’s terms of trade? 9708/11 Oct/Nov 2009
21 What will cause an improvement in a country’s terms of trade? A a fall in incomes abroad B a fall in its exchange rate C a rise in its inflation rate D a rise in the price of its imports
1 marks
Answer: C
This question in 9708/11 Oct/Nov 2009
Q18 · A country has the correct climate for growing tea, which is produced very cheaply and… 9708/12 Oct/Nov 2009
18 A country has the correct climate for growing tea, which is produced very cheaply and exported. Fruit is also grown, but this costs more as the climate is not as suitable. Fruit can be sold at a higher price than tea so some of the land used for tea is switched to fruit. What will definitely happen as a result? A There will be an increase in specialisation by the country. B There will be an increase in the imports of tea. C There will be an opportunity cost of the loss of the tea production. D There will be production in line with absolute advantage.
1 marks
Answer: C
This question in 9708/12 Oct/Nov 2009
Q19 · A worker can make 10 hats or 5 pairs of shoes in a day 9708/11 May/June 2010
4 A worker can make 10 hats or 5 pairs of shoes in a day. In the market three hats can be sold at the same price as two pairs of shoes. The worker should make A 4 hats and 3 pairs of shoes daily. B 6 hats and 2 pairs of shoes daily. C hats only. D shoes only.
1 marks
Answer: C
This question in 9708/11 May/June 2010
Q20 · The diagram shows production possibility curves for two countries, X and Y 9708/11 May/June 2010
19 The diagram shows production possibility curves for two countries, X and Y. country Y good L country X O good M What can be deduced from the diagram? A Both countries can benefit from specialisation. B Country X has a higher opportunity cost than Y in producing good M. C Country Y has a comparative advantage in both goods. D Trade between X and Y will not take place.
1 marks
Answer: D
This question in 9708/11 May/June 2010
Q21 · The statements that follow relate to possible gains from an increase in free trade 9708/11 May/June 2010
20 The statements that follow relate to possible gains from an increase in free trade. Which gain is least certain to result? A Increased specialisation leads to improvements in productivity. B Trade extends the choice of goods available to consumers. C Trade leads to an increase in the number of jobs. D Trade leads to a reduction in costs of production.
1 marks
Answer: C
This question in 9708/11 May/June 2010
Q22 · A group of countries decides to change from being a customs union to being an economic… 9708/11 May/June 2010
21 A group of countries decides to change from being a customs union to being an economic union. What additional feature will this give the group? A a common external quota on imports from non-members B a common external tariff on imports from non-members C the removal of restrictions on the movement of capital and labour between members D the removal of tariffs and quotas on products exchanged between members
1 marks
Answer: C
This question in 9708/11 May/June 2010
Q23 · A worker can make 10 hats or 5 pairs of shoes in a day 9708/12 May/June 2010
3 A worker can make 10 hats or 5 pairs of shoes in a day. In the market three hats can be sold at the same price as two pairs of shoes. The worker should make A 4 hats and 3 pairs of shoes daily. B 6 hats and 2 pairs of shoes daily. C hats only. D shoes only.
1 marks
Answer: C
This question in 9708/12 May/June 2010
Q24 · The diagram shows production possibility curves for two countries, X and Y 9708/12 May/June 2010
18 The diagram shows production possibility curves for two countries, X and Y. country Y good L country X O good M What can be deduced from the diagram? A Both countries can benefit from specialisation. B Country X has a higher opportunity cost than Y in producing good M. C Country Y has a comparative advantage in both goods. D Trade between X and Y will not take place.
1 marks
Answer: D
This question in 9708/12 May/June 2010
Q25 · The statements that follow relate to possible gains from an increase in free trade 9708/12 May/June 2010
19 The statements that follow relate to possible gains from an increase in free trade. Which gain is least certain to result? A Increased specialisation leads to improvements in productivity. B Trade extends the choice of goods available to consumers. C Trade leads to an increase in the number of jobs. D Trade leads to a reduction in costs of production.
1 marks
Answer: C
This question in 9708/12 May/June 2010
Q26 · The diagram shows production possibility curves for two countries, X and Y 9708/13 May/June 2010
17 The diagram shows production possibility curves for two countries, X and Y. country Y good L country X O good M What can be deduced from the diagram? A Both countries can benefit from specialisation. B Country X has a higher opportunity cost than Y in producing good M. C Country Y has a comparative advantage in both goods. D Trade between X and Y will not take place.
1 marks
Answer: D
This question in 9708/13 May/June 2010
Q27 · The statements that follow relate to possible gains from an increase in free trade 9708/13 May/June 2010
18 The statements that follow relate to possible gains from an increase in free trade. Which gain is least certain to result? A Increased specialisation leads to improvements in productivity. B Trade extends the choice of goods available to consumers. C Trade leads to an increase in the number of jobs. D Trade leads to a reduction in costs of production.
1 marks
Answer: C
This question in 9708/13 May/June 2010
Q28 · Steel is produced in a number of countries, including China, Japan and the US 9708/11 Oct/Nov 2010
19 Steel is produced in a number of countries, including China, Japan and the US. It is used in the manufacture of cars. The US protects its domestic steel industry by imposing high tariffs on foreign steel imports. Which two groups would benefit from the removal of the US tariffs? A Chinese steel producers and Japanese car manufacturers B Japanese steel producers and US car manufacturers C US steel producers and Chinese steel workers D the US government and Japanese steel workers
1 marks
Answer: B
This question in 9708/11 Oct/Nov 2010
Q29 · The table shows how much rice and wheat two countries, X and Y, can grow when each… 9708/11 Oct/Nov 2010
22 The table shows how much rice and wheat two countries, X and Y, can grow when each country divides its resources equally between growing rice and wheat. country X country Y rice (units) 900 m 100 m wheat (units) 300 m 50 m Assume that each country now specialises according to comparative advantage and trades with the other country. Which terms of trade would benefit both countries? A 1 wheat = 5 rice B 1 wheat = 3 rice C 1 wheat = 2.5 rice D 1 wheat = 2 rice
1 marks
Answer: C
This question in 9708/11 Oct/Nov 2010
Q30 · The table shows how much rice and wheat two countries, X and Y, can grow when each… 9708/12 Oct/Nov 2010
22 The table shows how much rice and wheat two countries, X and Y, can grow when each country divides its resources equally between growing rice and wheat. country X country Y rice (units) 900 m 100 m wheat (units) 300 m 50 m Assume that each country now specialises according to comparative advantage and trades with the other country. Which terms of trade would benefit both countries? A 1 wheat = 5 rice B 1 wheat = 3 rice C 1 wheat = 2.5 rice D 1 wheat = 2 rice
1 marks
Answer: C
This question in 9708/12 Oct/Nov 2010
Q31 · The table shows how much rice and wheat two countries, X and Y, can grow when each… 9708/13 Oct/Nov 2010
21 The table shows how much rice and wheat two countries, X and Y, can grow when each country divides its resources equally between growing rice and wheat. country X country Y rice (units) 900 m 100 m wheat (units) 300 m 50 m Assume that each country now specialises according to comparative advantage and trades with the other country. Which terms of trade would benefit both countries? A 1 wheat = 5 rice B 1 wheat = 3 rice C 1 wheat = 2.5 rice D 1 wheat = 2 rice
1 marks
Answer: C
This question in 9708/13 Oct/Nov 2010
Q32 · Each diagram shows the production possibility curves of two economies, X and Y, which… 9708/11 May/June 2011
19 Each diagram shows the production possibility curves of two economies, X and Y, which produce food and clothes. In which diagram would both economies benefit by specialising in the good in which they have comparative advantage and trading at an exchange rate of 1 unit of clothes to 1.5 units of food? A B C D 5 5 4 4 4 4 3 Y Y food food food food Y Y 2 X X X X 0 0 0 0 0 1 2 0 4 5 0 2 5 0 4 clothes clothes clothes clothes
1 marks
Answer: C
This question in 9708/11 May/June 2011
Q33 · Each diagram shows the production possibility curves of two economies, X and Y, which… 9708/12 May/June 2011
18 Each diagram shows the production possibility curves of two economies, X and Y, which produce food and clothes. In which diagram would both economies benefit by specialising in the good in which they have comparative advantage and trading at an exchange rate of 1 unit of clothes to 1.5 units of food? A B C D 5 5 4 4 4 4 3 Y Y food food food food Y Y 2 X X X X 0 0 0 0 0 1 2 0 4 5 0 2 5 0 4 clothes clothes clothes clothes
1 marks
Answer: C
This question in 9708/12 May/June 2011
Q34 · Each diagram shows the production possibility curves of two economies, X and Y, which… 9708/13 May/June 2011
17 Each diagram shows the production possibility curves of two economies, X and Y, which produce food and clothes. In which diagram would both economies benefit by specialising in the good in which they have comparative advantage and trading at an exchange rate of 1 unit of clothes to 1.5 units of food? A B C D 5 5 4 4 4 4 3 Y Y food food food food Y Y 2 X X X X 0 0 0 0 0 1 2 0 4 5 0 2 5 0 4 clothes clothes clothes clothes
1 marks
Answer: C
This question in 9708/13 May/June 2011
Q35 · The world consists of Sealand and Fantasia 9708/11 Oct/Nov 2011
19 The world consists of Sealand and Fantasia. Each produces two goods, X and Y. Good X needs much land but little labour. Good Y needs much labour but little land. Sealand has plentiful land and labour. Fantasia has more labour than Sealand. What can be deduced from the above about Sealand? A It is unlikely to gain from trade with Fantasia. B It will have an absolute advantage in the production of both X and Y. C It will have a comparative advantage in the production of X. D It will have a comparative advantage in the production of Y.
1 marks
Answer: C
This question in 9708/11 Oct/Nov 2011
Q36 · The table shows four combinations of price changes which may affect a country’s terms of… 9708/12 Oct/Nov 2011
21 The table shows four combinations of price changes which may affect a country’s terms of trade. Which combination of price changes must cause an improvement in the country’s terms of trade? average price of exports average price of imports A falls falls B falls rises C rises falls D rises rises
1 marks
Answer: C
This question in 9708/12 Oct/Nov 2011
Q37 · The world consists of Sealand and Fantasia 9708/13 Oct/Nov 2011
17 The world consists of Sealand and Fantasia. Each produces two goods, X and Y. Good X needs much land but little labour. Good Y needs much labour but little land. Sealand has plentiful land and labour. Fantasia has more labour than Sealand. What can be deduced from the above about Sealand? A It is unlikely to gain from trade with Fantasia. B It will have an absolute advantage in the production of both X and Y. C It will have a comparative advantage in the production of X. D It will have a comparative advantage in the production of Y.
1 marks
Answer: C
This question in 9708/13 Oct/Nov 2011
Q38 · Thailand produces rubber at a lower opportunity cost than China 9708/11 May/June 2012
19 Thailand produces rubber at a lower opportunity cost than China. It does, however, import some rubber from China. What could explain Thailand importing rubber from China? A China imposes lower tariffs on rubber imports than Thailand. B China is consuming increasing quantities of rubber in industry. C Thailand has the absolute but not the comparative advantage in rubber production. D Thailand wants to avoid the risks involved in overspecialising in rubber production.
1 marks
Answer: D
This question in 9708/11 May/June 2012
Q39 · The diagram shows the production possibility curves for two countries, X and Y 9708/11 May/June 2012
20 The diagram shows the production possibility curves for two countries, X and Y. A decrease in productivity moves country X’s production possibility curve from X1 to X2. 40 30 raw materials X2 Y X1 0 50 90 120 manufactured goods Which statement is correct? A After the change X would export raw materials and import manufactured goods. B After the change there is no economic basis for trade. C Before the change Y had an absolute advantage in the production of raw materials. D Before the change X had a comparative advantage in both products.
1 marks
Answer: A
This question in 9708/11 May/June 2012
Q40 · The price of a good traded internationally increases 9708/11 May/June 2012
29 The price of a good traded internationally increases. Who would be disadvantaged the most? A high income countries that pursue a policy of self sufficiency B high income countries with a balance of payments surplus that export the good C low income countries dependent on importing the good D low income countries with alternative suppliers of the good
1 marks
Answer: C
This question in 9708/11 May/June 2012
Q41 · A country has a comparative advantage in producing spices 9708/12 May/June 2012
19 A country has a comparative advantage in producing spices. Why may it choose not to specialise in spices? A The country experiences a lower opportunity cost in producing spices than other countries. B There are high tariffs imposed by other countries on the import of spices. C There is a low cost of transporting spices to other countries. D There is high world income elasticity of demand for spices.
1 marks
Answer: B
This question in 9708/12 May/June 2012
Q42 · The diagram shows the production possibility curves for two countries, X and Y 9708/12 May/June 2012
20 The diagram shows the production possibility curves for two countries, X and Y. A decrease in productivity moves country X’s production possibility curve from X1 to X2. 40 30 raw materials X2 Y X1 0 50 90 120 manufactured goods Which statement is correct? A After the change X would export raw materials and import manufactured goods. B After the change there is no economic basis for trade. C Before the change Y had an absolute advantage in the production of raw materials. D Before the change X had a comparative advantage in both products.
1 marks
Answer: A
This question in 9708/12 May/June 2012
Q43 · Thailand produces rubber at a lower opportunity cost than China 9708/13 May/June 2012
19 Thailand produces rubber at a lower opportunity cost than China. It does, however, import some rubber from China. What could explain Thailand importing rubber from China? A China imposes lower tariffs on rubber imports than Thailand. B China is consuming increasing quantities of rubber in industry. C Thailand has the absolute but not the comparative advantage in rubber production. D Thailand wants to avoid the risks involved in overspecialising in rubber production.
1 marks
Answer: D
This question in 9708/13 May/June 2012
Q44 · The price of a good traded internationally increases 9708/13 May/June 2012
29 The price of a good traded internationally increases. Who would be disadvantaged the most? A high income countries that pursue a policy of self sufficiency B high income countries with a balance of payments surplus that export the good C low income countries dependent on importing the good D low income countries with alternative suppliers of the good
1 marks
Answer: C
This question in 9708/13 May/June 2012
Q45 · The table shows the levels of output which three countries can produce 9708/11 Oct/Nov 2012
19 The table shows the levels of output which three countries can produce. country X 25 tonnes of maize or 5 tractors country Y 75 tonnes of maize or 15 tractors country Z 225 tonnes of maize or 45 tractors What would be the most likely outcome? A Country X will specialise in maize and country Y in tractors. B Country Y will specialise in maize and country Z in tractors. C Country Z will specialise in both maize and tractors. D There will be no gains from trade between the countries.
1 marks
Answer: D
This question in 9708/11 Oct/Nov 2012
Q46 · An economy with a long history of extensive barriers to trade decides to switch to… 9708/11 Oct/Nov 2012
20 An economy with a long history of extensive barriers to trade decides to switch to totally free trade. What is most likely to increase in the short term? A consumer surplus B government revenue C inflationary pressure D profits of all domestic companies
1 marks
Answer: A
This question in 9708/11 Oct/Nov 2012
Q47 · The diagram shows a market for a good which is supplied partly from domestic production… 9708/12 Oct/Nov 2012
11 The diagram shows a market for a good which is supplied partly from domestic production and partly from imports. Sh represents domestic supply and Sm represents imports. Sh price Sm D O R T V quantity What will be the level of consumption and the associated quantity of imports? consumption quantity of imports A OT RT B OT OT C OV RT D OV RV
1 marks
Answer: D
This question in 9708/12 Oct/Nov 2012
Q48 · A country’s terms of trade increased from a base year value of 100 to 120 in the… 9708/12 Oct/Nov 2012
21 A country’s terms of trade increased from a base year value of 100 to 120 in the following year. If export prices had increased by 50 %, what was the change in the price of the country’s imports? A –30 % B –25 % C +25 % D +30 %
1 marks
Answer: C
This question in 9708/12 Oct/Nov 2012
Q49 · The diagram represents the production possibility curves of two economies X and Y 9708/13 Oct/Nov 2012
19 The diagram represents the production possibility curves of two economies X and Y. 2500 X 2000 X1 agricultural goods (units) 1000 Y 0 500 1000 manufactured goods (units) As a result of soil erosion in economy X, the production possibility curve shifts from X to X1. According to the law of comparative advantage, what should country Y do following this change? A cease to trade with country X B export agricultural goods to country X C export manufactured goods to country X D import both agricultural and manufactured goods from country X
1 marks
Answer: A
This question in 9708/13 Oct/Nov 2012
Q50 · What is an assumption behind the basic theory of comparative advantage? 9708/13 Oct/Nov 2012
20 What is an assumption behind the basic theory of comparative advantage? A Each country sets its own tariff barriers. B Factors of production are mobile between countries. C Producers benefit from economies of scale. D There are no significant transport costs.
1 marks
Answer: D
This question in 9708/13 Oct/Nov 2012
Q51 · The table gives information about the trade between Singapore and New Zealand during… 9708/13 Oct/Nov 2012
28 The table gives information about the trade between Singapore and New Zealand during 2001, the first year after they signed a free trade agreement. The values are given both in Singapore dollars (S$) and New Zealand dollars (NZ$). percentage change S$ m NZ$ m from 2000 Singapore exports to New Zealand 508 618 +20 % Singapore imports from New Zealand 331 403 –17 % What can be concluded from the table? A New Zealand gained more than Singapore from the trade agreement. B New Zealand’s trade position with Singapore improved in 2001. C Singapore had a trade surplus with New Zealand in 2001. D The exchange rate in 2001 was approximately NZ$ 1 = S$ 1.2.
1 marks
Answer: C
This question in 9708/13 Oct/Nov 2012
Q52 · What would cause a country to lose its comparative advantage in producing rice? 9708/11 May/June 2013
19 What would cause a country to lose its comparative advantage in producing rice? A Another country becomes able to produce rice at a lower opportunity cost. B There is a global fall in demand for rice. C There is a fall in tariffs imposed by rice importers. D Transport costs to and from another country producing rice decrease.
1 marks
Answer: A
This question in 9708/11 May/June 2013
Q53 · The table shows the costs of producing a unit of food and a unit of clothing in countries… 9708/12 May/June 2013
19 The table shows the costs of producing a unit of food and a unit of clothing in countries X and Y, expressed in the currency of each country. country food clothing X $2 $4 Y £1 £1 The exchange rate is fixed at £1 = $3. What level of transport cost per unit of each commodity would exactly eliminate the benefits of trade? A £0.33 B £0.50 C £1.00 D £1.50
1 marks
Answer: A
This question in 9708/12 May/June 2013
Q54 · In the diagram, JK is a country’s production possibility curve 9708/13 May/June 2013
19 In the diagram, JK is a country’s production possibility curve. LK is its trading possibility curve which shows possible combinations of good X and good Y after specialising in the product in which it has comparative advantage, and then trading it. L J good X R S O T K good Y The country consumes OR of good X and OT of good Y. Which quantities of goods X and Y does it produce? good X good Y A JS OT B OS OT C RS TK D zero OK
1 marks
Answer: D
This question in 9708/13 May/June 2013
Q55 · In the diagram, MN is the production possibility curve of a country that has a… 9708/11 Oct/Nov 2013
19 In the diagram, MN is the production possibility curve of a country that has a comparative advantage in the production of good Y. M R quantity of good X O N quantity of good Y What might enable the country to consume the quantities of X and Y indicated by point R? A increased specialisation in the production of good X B international trade C a reduction in unemployment D increased specialisation in the production of good Y
1 marks
Answer: B
This question in 9708/11 Oct/Nov 2013
Q56 · Which combination of price changes must cause an improvement in the country’s terms of… 9708/11 Oct/Nov 2013
21 Which combination of price changes must cause an improvement in the country’s terms of trade? average price average price of exports of imports A falls falls B falls rises C rises falls D rises rises
1 marks
Answer: C
This question in 9708/11 Oct/Nov 2013
Q57 · The table shows the ability of two countries, P and Q, to produce two goods, Y and Z 9708/12 Oct/Nov 2013
19 The table shows the ability of two countries, P and Q, to produce two goods, Y and Z. production of good Y production of good Z per person per person country P 1000 1600 country Q 1500 2000 Which statement is correct? A P has an absolute advantage in Z and Q has a comparative advantage in Y. B P has an absolute advantage in Z and Q has an absolute advantage in Y. C P has a comparative advantage in Z and Q has an absolute advantage in Y. D P has a comparative advantage in Y and Q has an absolute advantage in Z.
1 marks
Answer: C
This question in 9708/12 Oct/Nov 2013
Q58 · What is the least likely outcome for participating countries of a move towards freer… 9708/12 Oct/Nov 2013
20 What is the least likely outcome for participating countries of a move towards freer trade? A greater international specialisation B greater product choice C higher standards of living D more equal distribution of income
1 marks
Answer: D
This question in 9708/12 Oct/Nov 2013
Q59 · A country joins a trade organisation, where the only requirements are that members must… 9708/12 Oct/Nov 2013
21 A country joins a trade organisation, where the only requirements are that members must have identical tariff rates towards non-members and no trade barriers to fellow members. With which possible change in status for the country is this condition consistent? A from independent trade to membership of a free trade area B from membership of a customs union to membership of an economic union C from membership of a free trade area to membership of a customs union D from membership of a free trade area to membership of an economic union
1 marks
Answer: C
This question in 9708/12 Oct/Nov 2013
Q60 · Two workers, George and Zaheer, can produce the following amounts in one working day if… 9708/13 Oct/Nov 2013
2 Two workers, George and Zaheer, can produce the following amounts in one working day if they concentrate on producing only one of the products. units of food units of clothing pairs of shoes George 9 or 18 or 36 Zaheer 15 or 45 or 30 First they decide to produce for themselves the 6 units of food they need to survive. Then they specialise in the product at which they are relatively efficient. What will be the total output of clothing and shoes, in addition to the 12 units of food, that is produced in one working day? units of clothing pairs of shoes A 6 18 B 21 22 C 27 12 D 36 12
1 marks
Answer: C
This question in 9708/13 Oct/Nov 2013
Q61 · What will cause a deterioration in a country’s terms of trade? 9708/13 Oct/Nov 2013
20 What will cause a deterioration in a country’s terms of trade? A a fall in its inflation rate B a fall in the price of its imports C a rise in incomes abroad D a rise in its exchange rate
1 marks
Answer: A
This question in 9708/13 Oct/Nov 2013
Q62 · The graphs show the production possibilities for commodities X and Y in two countries M… 9708/13 Oct/Nov 2013
21 The graphs show the production possibilities for commodities X and Y in two countries M and N. country M country N Y Y 50 140 X X 0 100 0 560 What will be the effect of an agreement between M and N to exchange the commodities at a rate of 1Y for 3X? A Both countries will gain, because their consumption possibilities will increase. B Consumers in country M will lose, because a unit of Y will now cost 3X instead of 2X. C Only country N will gain, because N can produce more of both commodities than M. D Neither country will gain, because they both have a comparative advantage in the production of the same commodity, X.
1 marks
Answer: A
This question in 9708/13 Oct/Nov 2013
Q63 · The diagram shows that a country can make a product at less than the world price 9708/11 May/June 2014
19 The diagram shows that a country can make a product at less than the world price. domestic supply D R T P1 world price U V P price W S domestic demand O X Y Z quantity What will happen if it engages in international trade? A Domestic consumers will experience a fall in consumer surplus of RVT. B Domestic output of OY will be exported. C Domestic producers will gain an increase in revenue of PP1TV. D Revenue from exports will be XRTZ from the product.
1 marks
Answer: D
This question in 9708/11 May/June 2014
Q64 · Which argument is an importer most likely to use to gain the support of consumers for… 9708/11 May/June 2014
20 Which argument is an importer most likely to use to gain the support of consumers for free trade? A More imports allow the government to raise revenue from tariffs. B More imports improve the country’s terms of trade. C More imports increase competition in the domestic economy. D More imports raise total employment in the domestic economy.
1 marks
Answer: C
This question in 9708/11 May/June 2014
Q65 · The table shows the output of cars and televisions per worker per week before trade and… 9708/12 May/June 2014
19 The table shows the output of cars and televisions per worker per week before trade and specialisation. country X country Y cars 2 8 televisions 6 48 Each country specialises in the product where it has a comparative advantage and trades on the basis of an exchange rate which lies between their opportunity cost ratios. Which change would stop the countries specialising and trading? A The exchange rate moves to one car for five televisions. B The exchange rate moves to one car for eight televisions. C The productivity of workers in country X rises to three cars per week. D The productivity of workers in country Y rises to fifty six televisions per week.
1 marks
Answer: B
This question in 9708/12 May/June 2014
Q66 · What would encourage the growth of the international division of labour? 9708/13 May/June 2014
4 What would encourage the growth of the international division of labour? A an improvement in transport systems B instability in international exchange rates C restrictions on the movement of resources D the widespread introduction of tariffs
1 marks
Answer: A
This question in 9708/13 May/June 2014
Q67 · The production possibility curve shows island J’s ability to produce fish and fruit 9708/13 May/June 2014
19 The production possibility curve shows island J’s ability to produce fish and fruit. It specialises entirely in fish in which it has a comparative advantage and trades fish for fruit from island K. As a result, island J increases its consumption from 80 tonnes of fish and 60 tonnes of fruit, point X, to 100 tonnes of fish and 100 tonnes of fruit, point Y. 200 fish (tonnes) 100 Y 80 X O 60 100 fruit (tonnes) What was island J’s exchange rate of fish for fruit? A 1 tonne of fish for 2 1 tonne of fruit B 1 tonne of fish for 4 3 tonne of fruit C 1 tonne of fish for 1 tonne of fruit D 1 tonne of fish for 2 tonnes of fruit
1 marks
Answer: C
This question in 9708/13 May/June 2014
Q68 · The diagrams show the production possibility curves of two countries, X and Y, both of… 9708/11 Oct/Nov 2014
19 The diagrams show the production possibility curves of two countries, X and Y, both of which can produce food and clothes. country X country Y 1000 food food 500 (units) (units) O 600 O 500 clothes (units) clothes (units) Which statement about production in the two countries is correct? A X has absolute advantage in clothes and Y has absolute advantage in food. B X has absolute advantage in clothes and Y has comparative advantage in food. C X has absolute advantage in food and Y has absolute advantage in clothes. D X has absolute advantage in food and Y has comparative advantage in clothes.
1 marks
This question in 9708/11 Oct/Nov 2014
Q69 · What is an effect on a country of free trade? 9708/12 Oct/Nov 2014
19 What is an effect on a country of free trade? A greater diversification of locally produced goods B greater efficiency in the resource use C greater independence in production D greater security for local industries
1 marks
Answer: B
This question in 9708/12 Oct/Nov 2014
Q70 · As a result of a trade agreement, toys produced in Africa can be supplied to European… 9708/12 Oct/Nov 2014
21 As a result of a trade agreement, toys produced in Africa can be supplied to European markets. These toys are much cheaper than similar toys produced in Europe but are not of such good quality. What will happen in Europe to expenditure on toys, employment in European toy companies and imports from Africa? expenditure employment imports A decrease decrease decrease B increase decrease uncertain C increase uncertain increase D uncertain uncertain increase
1 marks
Answer: D
This question in 9708/12 Oct/Nov 2014
Q71 · Country X exports agricultural commodities to country Y and country Y exports industrial… 9708/13 Oct/Nov 2014
19 Country X exports agricultural commodities to country Y and country Y exports industrial goods to country X. Given that the pattern of trade between X and Y can be explained by the theory of comparative advantage, what can be concluded from this? A Both countries derive an equal benefit from engaging in trade. B Country X has more fertile agricultural land than country Y. C Neither country has an absolute advantage in the production of both sets of goods. D The opportunity cost of producing agricultural commodities is greater in Y than in X.
1 marks
Answer: D
This question in 9708/13 Oct/Nov 2014
Q72 · A worker can make 10 hats or 5 pairs of shoes in a day 9708/11 May/June 2015
4 A worker can make 10 hats or 5 pairs of shoes in a day. In the market, three hats can be sold at the same price as two pairs of shoes. The worker should make A hats only. B shoes only. C 4 hats and 3 pairs of shoes daily. D 6 hats and 2 pairs of shoes daily.
1 marks
Answer: A
This question in 9708/11 May/June 2015
Q73 · Country M specialises in the production of cars while country N specialises in the… 9708/11 May/June 2015
19 Country M specialises in the production of cars while country N specialises in the production of televisions. They then trade with each other. What is most likely to reduce the level of specialisation and trade? A There is rising productivity in the production of cars in M and televisions in N. B There is a change from fixed to floating exchange rates between M and N. C There is a decrease in the costs of transporting cars and televisions between M and N. D There is an increase in the mobility of factors of production within M and within N.
1 marks
Answer: B
This question in 9708/11 May/June 2015
Q74 · Below are production possibilities for two countries showing their daily production of… 9708/12 May/June 2015
19 Below are production possibilities for two countries showing their daily production of food and drink, each using the same quantity of resources. food drink (units) (units) country X 50 100 country Y 40 60 What can be concluded from the figures? A Country X has absolute advantage in food and comparative advantage in drink. B Country X has comparative advantage in both goods. C Country Y has absolute advantage in drink and comparative advantage in food. D Country Y has neither absolute nor comparative advantage.
1 marks
Answer: A
This question in 9708/12 May/June 2015
Q75 · A trading country can produce two goods, X and Y 9708/13 May/June 2015
19 A trading country can produce two goods, X and Y. It specialises completely in the production of good Y. What will be the opportunity cost to the country of consuming additional imports of good X? A the additional imports of good X B the increase in the resources required to produce good X C the reduction in the domestic consumption of good Y D the reduction in the resources available to produce good Y
1 marks
Answer: C
This question in 9708/13 May/June 2015
Q76 · The table shows how much rice and wheat two countries, X and Y, can grow when each… 9708/13 May/June 2015
21 The table shows how much rice and wheat two countries, X and Y, can grow when each country divides its resources equally between growing rice and wheat. country X country Y rice (units) 900 million 100 million wheat (units) 300 million 50 million Assume that each country now specialises according to comparative advantage and trades with the other country. Which terms of trade would benefit both countries? A 1 wheat = 5 rice B 1 wheat = 3 rice C 1 wheat = 2.5 rice D 1 wheat = 2 rice
1 marks
Answer: C
This question in 9708/13 May/June 2015
Q77 · An economy produces two goods, X and Y 9708/11 Oct/Nov 2015
19 An economy produces two goods, X and Y. In the diagram, the line ML is the economy’s production possibility curve and the line MN its trading possibility curve. M good Y O L N good X What does the diagram show? A The economy’s consumers prefer good X to good Y. B The economy’s consumers prefer good Y to good X. C The economy has a comparative advantage in the production of good X. D The economy has a comparative advantage in the production of good Y.
1 marks
Answer: D
This question in 9708/11 Oct/Nov 2015
Q78 · A group of people in a country start a campaign for free trade because they believe that… 9708/11 Oct/Nov 2015
20 A group of people in a country start a campaign for free trade because they believe that it will benefit the economy. Which argument in favour of free trade is not likely to appear in their campaign? A It encourages competition between producers in different countries. B It encourages global specialisation and better product quality. C It gives consumers a greater choice of products from other countries. D It lets countries dump cheap surplus products in other countries.
1 marks
Answer: D
This question in 9708/11 Oct/Nov 2015
Q79 · The diagram illustrates the production possibility curves for countries S and T producing… 9708/12 Oct/Nov 2015
19 The diagram illustrates the production possibility curves for countries S and T producing goods X and Y. country S country T 400 400 300 300 good X 200 good X 200 100 100 0 0 0 50 100 150 200 0 50 100 150 200 good Y good Y Countries S and T specialise in the product for which they have the lower opportunity cost. They trade with each other at the rate of two good X for one good Y. What is a possible combination of goods for country S to consume after specialisation and trade have taken place? good X good Y A 100 50 B 150 75 C 200 100 D 300 150
1 marks
Answer: A
This question in 9708/12 Oct/Nov 2015
Q80 · What is the most likely reason why Pakistan might reduce its trade barriers on imports? 9708/12 Oct/Nov 2015
20 What is the most likely reason why Pakistan might reduce its trade barriers on imports? A to help Pakistan increase its gain from comparative advantage B to help Pakistan invest more abroad C to raise its foreign exchange rate D to reduce government borrowing and international debt
1 marks
Answer: A
This question in 9708/12 Oct/Nov 2015
Q81 · The table shows the annual production per worker per year in three countries 9708/13 Oct/Nov 2015
19 The table shows the annual production per worker per year in three countries. There are no trade barriers, no transport costs and the countries specialise on the basis of opportunity cost. product (tonnes) Southland Westland Eastland yams 100 80 12 wheat 80 70 16 rice 60 60 8 Which country will export which product? Southland Westland Eastland A rice yams wheat B wheat rice yams C yams rice wheat D yams wheat rice
1 marks
Answer: C
This question in 9708/13 Oct/Nov 2015
Q82 · What may limit the benefits a country derives from engaging in international trade? 9708/13 Oct/Nov 2015
20 What may limit the benefits a country derives from engaging in international trade? A The country is specialised in agricultural production. B The country’s labour force is highly immobile. C There are no product areas where the country enjoys an absolute advantage. D Wage rates are lower in the country’s principal competitors.
1 marks
Answer: B
This question in 9708/13 Oct/Nov 2015
Q83 · For many years, Japan had a current account surplus which then became a current account… 9708/13 Oct/Nov 2015
27 For many years, Japan had a current account surplus which then became a current account deficit. What might explain this change? A Japan has faced deflation. B Japan has introduced protectionist policies. C Japan’s currency has depreciated. D Japanese manufacturing has lost its comparative advantage.
1 marks
Answer: D
This question in 9708/13 Oct/Nov 2015
Q84 · A country’s terms of trade increased from a base year value of 100 to 120 in the… 9708/12 Feb/March 2016
25 A country’s terms of trade increased from a base year value of 100 to 120 in the following year. If export prices had increased by 50%, what was the change in the price of the country’s imports? A –30% B –25% C +25% D +30%
1 marks
Answer: C
This question in 9708/12 Feb/March 2016
Q85 · In each country, P and Q, one person can either produce the quantity of X or the quantity… 9708/12 Feb/March 2016
26 In each country, P and Q, one person can either produce the quantity of X or the quantity of Y shown. In which case does country P have absolute advantage in the production of Y and country Q have comparative advantage in the production of X? country product X product Y A P 6 7 Q 6 9 B P 10 8 Q 7 9 C P 12 6 Q 8 4 D P 16 15 Q 14 8
1 marks
Answer: D
This question in 9708/12 Feb/March 2016
Q86 · There are two main types of coffee grown, arabica and robusta 9708/11 May/June 2016
6 There are two main types of coffee grown, arabica and robusta. The table gives details of the four largest coffee producers for 2013-2014. Production is measured in thousand 60 kilogram bags. coffee producer arabica coffee robusta coffee total output Brazil 39 400 14 400 53 800 Vietnam 1 175 27 800 28 975 Indonesia 1 650 7 850 9 500 Colombia 11 000 0 11 000 What can be concluded from the table about production in the four countries? A Brazil has the highest level of specialisation. B Brazil produces more coffee than the other three named producers together. C Robusta coffee production is greater than arabica coffee production. D Vietnam has a comparative advantage in robusta and Colombia in arabica.
1 marks
Answer: B
This question in 9708/11 May/June 2016
Q87 · Which combination of changes in import prices and export prices would result in a fall in… 9708/11 May/June 2016
25 Which combination of changes in import prices and export prices would result in a fall in the value of a country’s terms of trade? average import prices average export prices A decrease by 5% decrease by 10% B decrease by 10% decrease by 5% C decrease by 10% increase by 5% D increase by 5% increase by 10%
1 marks
Answer: A
This question in 9708/11 May/June 2016
Q88 · The diagram shows the production possibility curves for two countries, X and Y 9708/11 May/June 2016
26 The diagram shows the production possibility curves for two countries, X and Y. A decrease in productivity moves country X’s production possibility curve from X1 to X2. 40 30 raw materials X2 Y X1 0 50 90 120 manufactured goods Which statement is correct? A After the change X would export raw materials and import manufactured goods. B After the change there is no economic basis for trade. C Before the change Y had an absolute advantage in the production of raw materials. D Before the change X had a comparative advantage in both products.
1 marks
Answer: A
This question in 9708/11 May/June 2016
Q89 · The diagram shows production possibility curves for two countries, X and Y 9708/12 May/June 2016
25 The diagram shows production possibility curves for two countries, X and Y. country Y good L country X O good M What can be deduced from the diagram? A Both countries can benefit from specialisation. B Country X has a higher opportunity cost than Y in producing good M. C Country Y has a comparative advantage in both goods. D Trade between X and Y will not take place.
1 marks
Answer: D
This question in 9708/12 May/June 2016
Q90 · Countries X and Y produce the world supply of computers and wheat 9708/13 May/June 2016
26 Countries X and Y produce the world supply of computers and wheat. Each country divides its resources equally between the two products and produces the following. computers wheat units units X 2000 1400 Y 1000 200 How would total output be altered if each country specialised completely in the product in which it has a comparative advantage? computers wheat units units A –1000 +1200 B –1000 +1600 C +1000 +400 D +1000 +1600
1 marks
Answer: A
This question in 9708/13 May/June 2016
Q91 · The table gives the terms of trade index for Brunei Darussalam for the period 2009 to 2012 9708/11 Oct/Nov 2016
26 The table gives the terms of trade index for Brunei Darussalam for the period 2009 to 2012. 2009 2010 2011 2012 terms of trade index 100.0 107.2 124.9 134.5 What can be concluded from the table? A Export prices were 34.5% higher in 2012 than in 2009. B Import prices were 34.5% lower in 2012 than in 2009. C The ratio of export to import prices was 34.5% higher in 2012 than in 2009. D The terms of trade increased by 34.5% during 2012.
1 marks
Answer: C
This question in 9708/11 Oct/Nov 2016
Q92 · The diagram shows an economy’s production possibility curve, PPC, and trading possibility… 9708/11 Oct/Nov 2016
27 The diagram shows an economy’s production possibility curve, PPC, and trading possibility curve, TPC. food TPC PPC O clothing Why is the diagram not able to demonstrate the benefits of international trade? A It assumes there are no transport costs and no barriers to trade. B It deals with only two products. C The curves are drawn as straight lines. D The position of the curves does not support the existence of benefits.
1 marks
Answer: D
This question in 9708/11 Oct/Nov 2016
Q93 · The table shows the indices of import prices and export prices of four countries between… 9708/12 Oct/Nov 2016
25 The table shows the indices of import prices and export prices of four countries between July 2013 and July 2014. index of import prices index of export prices July 2013 July 2014 July 2013 July 2014 Brazil 137 139 164 162 China 98 101 99 99 Italy 113 111 113 114 Spain 110 106 111 109 In which countries did the terms of trade improve between July 2013 and July 2014? A Brazil and China B China only C Italy and Spain D Italy only
1 marks
Answer: C
This question in 9708/12 Oct/Nov 2016
Q94 · Country X can produce apples and plums at lower cost than country Y 9708/12 Oct/Nov 2016
26 Country X can produce apples and plums at lower cost than country Y. Country X can also produce strawberries but it costs more to do so than in country Y. In fact, country X produces only apples and trades them for plums and strawberries from country Y. What economic analysis could explain this pattern of trade? plums strawberries A absolute advantage country X absolute advantage country X B absolute advantage country Y comparative advantage country Y C comparative advantage country Y absolute advantage country Y D comparative advantage country Y comparative advantage country X
1 marks
Answer: C
This question in 9708/12 Oct/Nov 2016
Q95 · The diagram shows a country’s domestic supply of, and demand for, a commodity that it… 9708/13 Oct/Nov 2016
11 The diagram shows a country’s domestic supply of, and demand for, a commodity that it both consumes and exports. S WP2 WP1 price D O W Y X Z quantity The world price changes from WP1 to WP2. What are the resulting changes in domestic consumption and quantity of exports? domestic consumption quantity of exports A OX to OZ OY to OX B OX to OZ OY to OZ C OY to OW YX to OZ D OY to OW YX to WZ
1 marks
Answer: D
This question in 9708/13 Oct/Nov 2016
Q96 · The table shows different possible outputs of apples and bananas for Country X and… 9708/13 Oct/Nov 2016
26 The table shows different possible outputs of apples and bananas for Country X and Country Y assuming only two goods are produced and all resources are used to their maximum. apples bananas Country X 100 or 80 Country Y 50 or 25 Country Y decides to specialise in the production of the good in which it has a comparative advantage. Country X decides to use 75% of its resources to produce the good in which it has a comparative advantage and 25% of its resources to produce the other good. What will be the total output? apples bananas A 50 80 B 75 45 C 75 60 D 150 120
1 marks
Answer: C
This question in 9708/13 Oct/Nov 2016
Q97 · The US President signed a trade agreement which allowed more duty-free access to the US… 9708/12 Feb/March 2017
26 The US President signed a trade agreement which allowed more duty-free access to the US market for Latin American and Caribbean countries. Who might benefit in the short run from this agreement? A Caribbean countries, because they may export to Latin America. B Latin American businesses, because they may be able to sell more in the US. C Latin American governments, because they will not have to pay so much duty. D The US, because it may export more to Latin America.
1 marks
Answer: B
This question in 9708/12 Feb/March 2017
Q98 · Since 2000 a country’s export prices have increased on average by 50% and its import… 9708/11 May/June 2017
24 Since 2000 a country’s export prices have increased on average by 50% and its import prices by 25%. What is the current figure for the country’s terms of trade (2000 = 100)? A 75 B 83 C 120 D 125
1 marks
Answer: C
This question in 9708/11 May/June 2017
Q99 · Each diagram shows the production possibility curves of two economies, X and Y, which… 9708/11 May/June 2017
25 Each diagram shows the production possibility curves of two economies, X and Y, which produce food and clothes. In which diagram would both economies benefit by specialising in the good in which they have comparative advantage and trading at an exchange rate of 1 unit of clothes to 1.5 units of food? A B C D 5 5 food food food food 4 4 4 4 3 Y Y Y Y 2 X X X X 0 0 0 0 0 1 2 0 4 5 0 2 5 0 4 clothes clothes clothes clothes
1 marks
Answer: C
This question in 9708/11 May/June 2017
Q100 · A country’s terms of trade currently stands at 150 (base year 2000 = 100) 9708/12 May/June 2017
25 A country’s terms of trade currently stands at 150 (base year 2000 = 100). Since 2000 the average price the country has received for its exports has increased by 20%. What has been the change in the average price it has paid for its imports? A –25% B –20% C +20% D +25%
1 marks
Answer: B
This question in 9708/12 May/June 2017
Q101 · The table shows the ability of two countries, P and Q, to produce two goods, Y and Z 9708/12 May/June 2017
26 The table shows the ability of two countries, P and Q, to produce two goods, Y and Z. production of good Y production of good Z per person per person country P 1800 2800 country Q 1500 2000 Which statement is correct? A P has an absolute advantage in Y and Q has an absolute advantage in Z. B P has an absolute advantage in Z and Q has a comparative advantage in Y. C P has a comparative advantage in Y and Q has a comparative advantage in Z. D P has a comparative advantage in Z and Q has an absolute advantage in Y.
1 marks
Answer: B
This question in 9708/12 May/June 2017
Q102 · An economy’s terms of trade fell from the base year of 100 to 90 9708/13 May/June 2017
24 An economy’s terms of trade fell from the base year of 100 to 90. Which changes in the export price index and the import price index would have caused this? export price import price index change index change A 0 –10 B 0 +10 C –10 0 D –10 +10
1 marks
Answer: C
This question in 9708/13 May/June 2017
Q103 · Kenya produces some of the finest teas much of which it exports 9708/13 May/June 2017
25 Kenya produces some of the finest teas much of which it exports. Its climate is not so suited to producing olives but the olives can be sold for a higher price per sack. What would definitely happen if a Kenyan company used some of the land where tea is grown to plant olive trees? A The company would have a comparative advantage in trade. B The company’s revenue would increase. C There would be a decrease in the credit side of the trade in goods and services. D There would be an opportunity cost from lost tea production.
1 marks
Answer: D
This question in 9708/13 May/June 2017
Q104 · The diagram shows a market for a good which is supplied partly from domestic production… 9708/11 Oct/Nov 2017
12 The diagram shows a market for a good which is supplied partly from domestic production and partly from imports. Sh represents domestic supply and Sm represents imports. Sh price Sm D O R T V quantity What will be the level of consumption and the associated quantity of imports? consumption quantity of imports A OT RT B OT OT C OV RT D OV RV
1 marks
Answer: D
This question in 9708/11 Oct/Nov 2017
Q105 · The introduction of the euro as the common currency of much of Western Europe created a… 9708/11 Oct/Nov 2017
25 The introduction of the euro as the common currency of much of Western Europe created a powerful economic group. What is least likely to have been the intention? A faster economic growth in the region B greater labour mobility and employment in the region C more international trade within the region D more international trade with non-members
1 marks
Answer: D
This question in 9708/11 Oct/Nov 2017
Q106 · Country X has a comparative advantage in producing wheat and country Y in producing cars 9708/11 Oct/Nov 2017
26 Country X has a comparative advantage in producing wheat and country Y in producing cars. However, the countries choose not to specialise and trade. What is a valid reason for this behaviour? A The cost of transport is high relative to the opportunity cost differences between the countries. B The exchange rate lies within the countries’ opportunity cost ratios. C There is immobility of factors of production between the countries. D Trade is based on absolute rather than comparative advantage.
1 marks
Answer: A
This question in 9708/11 Oct/Nov 2017
Q107 · Which formula is used to calculate a country’s terms of trade? 9708/12 Oct/Nov 2017
24 Which formula is used to calculate a country’s terms of trade? A index of export prices − index of import prices B index of import prices – index of export prices index of export prices C × 100 index of import prices index of import prices D × 100 index of export prices
1 marks
Answer: C
This question in 9708/12 Oct/Nov 2017
Q108 · The table shows the ability of two countries to produce two commodities when they use all… 9708/12 Oct/Nov 2017
26 The table shows the ability of two countries to produce two commodities when they use all of their resources for that product. maximum output maximum output country of rice of wheat X 2000 2000 Y 4000 2000 Which statement is correct? A Country X has an absolute advantage in wheat. B Country Y has an absolute advantage in wheat. C Country X has a comparative advantage in wheat. D Country Y has a comparative advantage in wheat.
1 marks
Answer: C
This question in 9708/12 Oct/Nov 2017
Q109 · In 2014, Poland was the world’s largest exporter of apples 9708/12 Oct/Nov 2017
27 In 2014, Poland was the world’s largest exporter of apples. 55% of the crop went to Russia. Then Russia banned the imports. What would not have prevented the revenue of the Polish apple farmers falling dramatically? A The apple farmers found new markets in other countries. B The apple farmers were able to store the harvest for sale later. C The Polish Government placed a ban on imports of food from Russia. D The Polish Government established a scheme to buy apples and supply them to charities.
1 marks
Answer: C
This question in 9708/12 Oct/Nov 2017
Q110 · What is the least likely outcome for participating countries of a move towards freer… 9708/13 Oct/Nov 2017
25 What is the least likely outcome for participating countries of a move towards freer trade? A a greater product choice B a more equal distribution of income C greater international specialisation D higher standards of living
1 marks
Answer: B
This question in 9708/13 Oct/Nov 2017
Q111 · Turkey can produce a good but also imports some of the good from Egypt 9708/12 Feb/March 2018
24 Turkey can produce a good but also imports some of the good from Egypt. The Turkish currency depreciates against the Egyptian currency. How is this most likely to affect production of this good in Egypt and in Turkey? production in Egypt production in Turkey A decrease decrease B decrease increase C increase decrease D increase increase
1 marks
Answer: B
This question in 9708/12 Feb/March 2018
Q112 · What is present in a customs union but not in a free trade area? 9708/12 Feb/March 2018
26 What is present in a customs union but not in a free trade area? A a common external tariff with the rest of the world B a common monetary system C a common system of taxation D the free movement of all goods, services and factors of production
1 marks
Answer: A
This question in 9708/12 Feb/March 2018
Q113 · A newspaper headline stated that the Australian car industry has been affected by the… 9708/11 May/June 2018
23 A newspaper headline stated that the Australian car industry has been affected by the strength of the Australian dollar. What would not be an effect caused by a strong rising Australian dollar? A Reduced foreign demand for Australian cars caused increased unemployment. B The price of exports of Australian cars became more expensive. C The price of foreign competitive cars became less expensive. D The price of imports of car parts became more expensive.
1 marks
Answer: D
This question in 9708/11 May/June 2018
Q114 · The graphs show the production possibilities for commodities X and Y in two countries M… 9708/11 May/June 2018
25 The graphs show the production possibilities for commodities X and Y in two countries M and N. country M country N Y Y 50 140 X X 0 100 0 560 What will be the effect of an agreement between M and N to exchange the commodities at a rate of 1Y for 3X? A Both countries will gain, because their consumption possibilities will increase. B Consumers in country M will lose, because a unit of Y will now cost 3X instead of 2X. C Neither country will gain, because they both have a comparative advantage in the production of the same commodity, X. D Only country N will gain, because N can produce more of both commodities than M.
1 marks
Answer: A
This question in 9708/11 May/June 2018
Q115 · Country P exports goods and imports goods 9708/12 May/June 2018
24 Country P exports goods and imports goods. Export prices and import prices are set to an index of 100 in year 1. The table shows corresponding prices indices for years 2 and 3. year 2 year 3 export price index 120 132 import price index 110 121 Which statement is correct? A It is not possible to say how the terms of trade changed without further information. B The terms of trade improved between years 1 and 2, and improved again between years 2 and 3. C The terms of trade improved between years 1 and 2, and then remained unchanged between years 2 and 3. D The terms of trade worsened throughout the whole period.
1 marks
Answer: C
This question in 9708/12 May/June 2018
Q116 · In the diagram, MN is the production possibility curve of a country that has a… 9708/12 May/June 2018
25 In the diagram, MN is the production possibility curve of a country that has a comparative advantage in the production of good Y. M quantity of good X R O N quantity of good Y What might enable the country to consume the quantities of X and Y indicated by point R? A a reduction in unemployment B increased specialisation in the production of good X C increased specialisation in the production of good Y D more participation in international trade
1 marks
Answer: D
This question in 9708/12 May/June 2018
Q117 · What is the difference between a customs union and a free trade area? 9708/12 May/June 2018
26 What is the difference between a customs union and a free trade area? A Only the customs union has a common external tariff with the rest of the world. B Only the customs union requires fixed exchange rates between member countries. C Only the free trade area needs to eliminate tariffs between member countries. D Only the free trade area requires freedom of movement for labour and capital between member countries.
1 marks
Answer: A
This question in 9708/12 May/June 2018
Q118 · The terms of trade for the major oil exporting country of Saudi Arabia fell from 223 in… 9708/13 May/June 2018
24 The terms of trade for the major oil exporting country of Saudi Arabia fell from 223 in 2013 to 205 in 2014. What could be a likely cause of this fall? A a fall in the amount of oil exported by Saudi Arabia B a fall in the amount of oil produced by Saudi Arabia C a fall in the price of Saudi Arabian oil exports D an appreciation of the Saudi Arabian currency
1 marks
Answer: C
This question in 9708/13 May/June 2018
Q119 · A country takes no part in international trade and its domestic market price is Pd 9708/13 May/June 2018
27 A country takes no part in international trade and its domestic market price is Pd. The country decides to engage in free trade and the market price rises to the world price (Pw). Sd price Pw Pw X Z Y Pd Dd O quantity What happens to consumer surplus and producer surplus when the economy engages in free trade? A Domestic consumers gain Z only. B Domestic consumers lose X + Y. C Domestic producers gain Z only. D Domestic producers lose X + Y + Z.
1 marks
Answer: B
This question in 9708/13 May/June 2018
Q120 · The table shows the ability of two countries, P and Q, to produce two goods, Y and Z 9708/11 Oct/Nov 2018
25 The table shows the ability of two countries, P and Q, to produce two goods, Y and Z. production of good Y production of good Z per person per person country P 1000 1600 country Q 1500 2000 Which statement is correct? A P has an absolute advantage in Z and Q has a comparative advantage in Y. B P has an absolute advantage in Z and Q has an absolute advantage in Y. C P has a comparative advantage in Y and Q has an absolute advantage in Z. D P has a comparative advantage in Z and Q has an absolute advantage in Y.
1 marks
Answer: D
This question in 9708/11 Oct/Nov 2018
Q121 · The table shows the production possibilities of cloth and food in four countries using… 9708/12 Oct/Nov 2018
26 The table shows the production possibilities of cloth and food in four countries using all of their resources. cloth food country (million units) (million units) V 40 or 8 X 28 or 4 Y 8 or 2 Z 5 or 5 If the world exchange rate is 1 unit of food for 6 units of cloth, with whom is V likely to trade? A X and Y B X only C Y and Z D Z only
1 marks
Answer: B
This question in 9708/12 Oct/Nov 2018
Q122 · The table refers to a particular country 9708/13 Oct/Nov 2018
24 The table refers to a particular country. index of import index of export year prices prices (2010 = 100) (2010 = 100) 2005 48.1 57.0 2015 122.4 120.8 Which statement about the period 2005 to 2015 is correct? A The balance of payments worsened. B The current account balance improved. C The exchange rate appreciated. D The terms of trade fell.
1 marks
Answer: D
This question in 9708/13 Oct/Nov 2018
Q123 · Two countries, Northland and Southland, produce two goods, food and drink 9708/13 Oct/Nov 2018
25 Two countries, Northland and Southland, produce two goods, food and drink. The table shows how many hours each has to use to produce one unit of each product. After specialising according to comparative advantage, they decide to trade. food drink Northland 10 hours 4 hours Southland 20 hours 12 hours Which exchange rate will allow both countries to benefit from trade? A 1 unit of food to 2 1 unit of drink B 1 unit of food to 1 unit of drink C 1 unit of food to 2 units of drink D 1 unit of food to 3 units of drink
1 marks
Answer: C
This question in 9708/13 Oct/Nov 2018
Q124 · Countries M and N produce the world supply of machines and textiles 9708/12 Feb/March 2019
22 Countries M and N produce the world supply of machines and textiles. The table shows what each country produces when it divides its resources equally between the two products. machines textiles country M 1000 500 country N 900 300 total 1900 800 What should happen according to the principle of comparative advantage? A Country M should produce both machines and textiles. B Country M should specialise in the production of machines, country N should specialise in production of textiles. C Country M should specialise in the production of textiles, country N should specialise in production of machines. D Country N should produce both machines and textiles.
1 marks
Answer: C
This question in 9708/12 Feb/March 2019
Q125 · In which situation will a country’s terms of trade worsen? 9708/11 May/June 2019
22 In which situation will a country’s terms of trade worsen? A The prices of its imports rise by more than the prices of its exports. B The total value of external payments rises by more than the total value of external receipts. C The value of its imports rises by more than the value of its exports. D The volume of its imports rises by more than the volume of its exports.
1 marks
Answer: A
This question in 9708/11 May/June 2019
Q126 · A country decides to remove all its tariffs and engage in free international trade 9708/12 May/June 2019
22 A country decides to remove all its tariffs and engage in free international trade. What will be the final decision the country has to make before free trade takes place? A deciding which resources to allocate to the production of goods and services for international trade B deciding which goods and services should be provided for international trade C identifying the opportunity costs of production of goods and services which might be used for international trade D setting an appropriate exchange rate for the international trade of goods and services
1 marks
Answer: D
This question in 9708/12 May/June 2019
Q127 · The table shows the amount of good X or the amount of good Y that can be produced by… 9708/11 Oct/Nov 2019
21 The table shows the amount of good X or the amount of good Y that can be produced by country R and country T if each uses all of their resources. output of output of good X good Y country R 80 100 country T 20 80 What can be concluded from the table? A Country R has an absolute advantage in producing good Y and a comparative advantage in producing good X. B Country R has an absolute advantage in producing good X and a comparative advantage in producing good Y. C Country T has an absolute advantage in producing good X and a comparative advantage in producing good Y. D Country T has an absolute advantage in producing good Y and a comparative advantage in producing good X.
1 marks
Answer: A
This question in 9708/11 Oct/Nov 2019
Q128 · The diagram shows Australia’s terms of trade per quarter from Q2, 2014 to Q1, 2017 9708/11 Oct/Nov 2019
23 The diagram shows Australia’s terms of trade per quarter from Q2, 2014 to Q1, 2017. 109.7 107.4 terms of trade 103.5 102.9 102 99.3 95 93.9 92.6 89.2 89.9 87.9 Q2 Q3 Q4 Q1 Q2 Q3 Q4 Q1 Q2 Q3 Q4 Q1 2014 2014 2014 2015 2015 2015 2015 2016 2016 2016 2016 2017 In which period did Australia’s terms of trade decline and then improve? A Q2, 2014 to Q4, 2014 B Q1, 2015 to Q3, 2015 C Q4, 2015 to Q2, 2016 D Q3, 2016 to Q1, 2017
1 marks
Answer: C
This question in 9708/11 Oct/Nov 2019
Q129 · The table indicates the factor inputs required to produce wheat and cars in countries X… 9708/12 Oct/Nov 2019
23 The table indicates the factor inputs required to produce wheat and cars in countries X and Y. units of factor units of factor inputs to produce inputs to produce one tonne of wheat one car country X 4 2 country Y 8 6 What makes it possible for both countries to benefit from trade? A Country X has an absolute advantage in wheat and car production. B Country Y has an absolute advantage in wheat and car production. C Country Y has a comparative advantage in wheat production. D Opportunity cost of wheat and car production is the same between countries.
1 marks
Answer: C
This question in 9708/12 Oct/Nov 2019
Q130 · The European Union consists of a group of countries with free trade between its members… 9708/13 Oct/Nov 2019
23 The European Union consists of a group of countries with free trade between its members and a common external tariff on trade with non-members. What would weaken the operation of this customs union? A devaluation of any member’s currency B differences in wage costs between members C entry tests for seasonal migrant workers D one member country agreeing a trade deal with a non-member country
1 marks
Answer: D
This question in 9708/13 Oct/Nov 2019
Q131 · Four countries, A, B, C and D, trade internationally 9708/12 Feb/March 2020
21 Four countries, A, B, C and D, trade internationally. Each circle in the diagram represents a free trade area between the countries within the circle. A country can belong to more than one free trade area. Countries outside of a circle face trade barriers. Which country has the greatest opportunity to benefit from free international trade? A C B D
1 marks
Answer: B
This question in 9708/12 Feb/March 2020
Q132 · What is least likely to change an advanced industrialised economy’s terms of trade? 9708/11 May/June 2020
19 What is least likely to change an advanced industrialised economy’s terms of trade? A its level of labour productivity B its rate of inflation C the maintenance of a stable foreign exchange rate D the occurrence of random supply shocks
1 marks
Answer: C
This question in 9708/11 May/June 2020
Q133 · Which argument is an importer most likely to use to gain the support of consumers for… 9708/12 May/June 2020
22 Which argument is an importer most likely to use to gain the support of consumers for free trade? A More imports allow the government to raise revenue from tariffs. B More imports improve the country’s terms of trade. C More imports increase competition in the domestic economy. D More imports raise total employment in the domestic economy.
1 marks
Answer: C
This question in 9708/12 May/June 2020
Q134 · Why does the value of a country’s terms of trade have no monetary units? 9708/12 May/June 2020
25 Why does the value of a country’s terms of trade have no monetary units? A It cannot be calculated accurately enough. B It includes more than one currency. C It is a ratio of two index numbers. D It measures change over time.
1 marks
Answer: C
This question in 9708/12 May/June 2020
Q135 · The statements that follow relate to possible gains from an increase in free trade 9708/12 May/June 2020
26 The statements that follow relate to possible gains from an increase in free trade. Which gain is least certain to result in the short run? A a reduction in costs of production B a rise in the number of jobs C a wider choice of goods available to consumers D an increase in the level of competition
1 marks
Answer: B
This question in 9708/12 May/June 2020
Q136 · The table shows the relative price of exports compared with imports expressed as an index… 9708/13 May/June 2020
23 The table shows the relative price of exports compared with imports expressed as an index number for an economy (2013 = 100). date index 2013 100 2014 97 2015 95 Which statement about the period 2013–2015 is correct? A Export prices have increased each year. B The general level of prices has fallen. C The terms of trade have deteriorated. D The volume of imports increasingly exceeds the volume of exports.
1 marks
Answer: C
This question in 9708/13 May/June 2020
Q137 · An economy with a long history of extensive barriers to trade decides to switch to… 9708/13 May/June 2020
26 An economy with a long history of extensive barriers to trade decides to switch to totally free trade. What is most likely to increase in the short term? A consumer surplus B government revenue C inflationary pressure D profits of all domestic companies
1 marks
Answer: A
This question in 9708/13 May/June 2020
Q138 · Agricultural economies have faced a deterioration in their terms of trade 9708/11 Oct/Nov 2020
19 Agricultural economies have faced a deterioration in their terms of trade. What might have contributed to this? A falling exchange rates of agricultural economies B falling productivity in agricultural production C increasing productivity in manufacturing economies D the high income elasticity of demand for foodstuffs
1 marks
Answer: A
This question in 9708/11 Oct/Nov 2020
Q139 · The table shows the output of rice and cotton for countries X and Y 9708/11 Oct/Nov 2020
20 The table shows the output of rice and cotton for countries X and Y. units of output of units of output of rice per year cotton per year country X 5000 5000 country Y 4000 2000 Each country divides its resources equally between the production of rice and cotton. Based upon the law of comparative advantage, which statement is correct? A Country X has the higher opportunity cost in producing cotton. B Country Y has the lower opportunity cost in producing rice. C Country X should produce both goods as the opportunity cost is the same. D Country Y should produce both goods as it has an absolute advantage in both.
1 marks
Answer: B
This question in 9708/11 Oct/Nov 2020
Q140 · The diagram shows the production possibility curves for two economies using all resources 9708/12 Oct/Nov 2020
23 The diagram shows the production possibility curves for two economies using all resources. Country X can produce 10 million cars or 20 million bicycles and country Y can produce 20 million cars or 40 million bicycles. cars 20 (millions) 10 X Y 0 20 40 bicycles (millions) Which statement is correct about country X and country Y according to the theory of comparative advantage? A Country X and country Y would not gain from free trade. B Country X has a lower opportunity cost ratio in producing cars and bicycles than country Y. C Country X has an absolute advantage over country Y in the production of both goods. D Country Y will have a faster rate of economic growth than country X.
1 marks
Answer: A
This question in 9708/12 Oct/Nov 2020
Q141 · In which circumstances will country X have a comparative advantage in the production of… 9708/13 Oct/Nov 2020
20 In which circumstances will country X have a comparative advantage in the production of rice over country Y? A when X has lower opportunity costs in producing rice than Y B when X is in a customs union and Y is outside that union C when X uses dollars for trading and Y uses a different currency D when X uses more units of labour than Y to produce rice
1 marks
Answer: A
This question in 9708/13 Oct/Nov 2020
Q142 · What is indicated by an economy’s terms of trade? 9708/13 Oct/Nov 2020
23 What is indicated by an economy’s terms of trade? A the degree of its dependence on imports B the international competitiveness of its exports C the purchasing power of its exports relative to its imports D the relative strength of its currency in the foreign exchange market
1 marks
Answer: C
This question in 9708/13 Oct/Nov 2020
Q143 · The diagram shows the effect of removing a tariff on imports of good X into country Y 9708/12 Feb/March 2021
24 The diagram shows the effect of removing a tariff on imports of good X into country Y. SX domestic price of X (US$) 20 SX world + tariff 10 SX world DX domestic 0 8 10 17 20 quantity of X (millions) What is the volume, in million units, of the extra international trade created by removing the tariff? A 3 B 5 C 10 D 12
1 marks
Answer: B
This question in 9708/12 Feb/March 2021
Q144 · Two statements are shown 9708/12 May/June 2021
24 Two statements are shown. 1 A country can produce a good at a lower opportunity cost than another country. 2 A country can produce a greater quantity of a good for the same quantity of inputs than another country. What do these two statements describe? 1 2 A absolute advantage comparative advantage B absolute advantage the terms of trade C comparative advantage absolute advantage D the terms of trade comparative advantage
1 marks
Answer: C
This question in 9708/12 May/June 2021
Q145 · What may increase the benefits a country gains from international trade? 9708/13 May/June 2021
23 What may increase the benefits a country gains from international trade? A a reduction in transportation costs because of a fall in world oil prices B domestic wage rates increase at a faster rate than output per worker C the domestic labour force becomes more occupationally immobile D trading partners increase tariffs on imported goods
1 marks
Answer: A
This question in 9708/13 May/June 2021
Q146 · The diagram shows the production possibility curves of two economies, Northland (Y1–X1)… 9708/11 Oct/Nov 2021
4 The diagram shows the production possibility curves of two economies, Northland (Y1–X1) and Southland (Y2–X2). Y1 R food Y2 P O X1 X2 drink Both economies specialise based on the theory of comparative advantage and trade with one another. What can be concluded from the diagram? A Both economies face increasing opportunity costs. B Point P represents the final equilibrium outcome. C Point R shows the total possible combined production of food and drink. D All points on Y1–X2 are only attainable through trade.
1 marks
Answer: C
This question in 9708/11 Oct/Nov 2021
Q147 · What best describes a country’s terms of trade? 9708/11 Oct/Nov 2021
21 What best describes a country’s terms of trade? A the difference between the volume of its exports and its imports B the average price of its exports divided by the average price of its imports C the total value of its exports divided by the total value of its imports D the volume of its exports divided by the volume of its imports
1 marks
Answer: B
This question in 9708/11 Oct/Nov 2021
Q148 · Country X and country Y both produce rice and tables 9708/11 Oct/Nov 2021
23 Country X and country Y both produce rice and tables. Half of their resources are used to produce rice and the other half to produce tables. The resulting output of each product is given in the table shown. country rice tables X 150 100 Y 100 50 What can be concluded from the table? A Country X has a comparative advantage in the production of both goods. B Country X has a comparative advantage in the production of rice. C Country Y has a comparative advantage in the production of both goods. D Country Y has a comparative advantage in the production of rice.
1 marks
Answer: D
This question in 9708/11 Oct/Nov 2021
Q149 · Compared with Pakistan, Germany has a higher output of pharmaceuticals per unit of… 9708/12 Oct/Nov 2021
19 Compared with Pakistan, Germany has a higher output of pharmaceuticals per unit of resources used. What could explain this? A the existence of floating exchange rates B the law of absolute advantage C the Marshall–Lerner condition D the terms of trade
1 marks
Answer: B
This question in 9708/12 Oct/Nov 2021
Q150 · The average price of a country’s exports increased by 5% and the average price of its… 9708/12 Oct/Nov 2021
23 The average price of a country’s exports increased by 5% and the average price of its imports increased by 10%. What can definitely be concluded from this information? A Its balance of trade will improve. B Its balance of trade will worsen. C Its terms of trade have improved. D Its terms of trade have worsened.
1 marks
Answer: D
This question in 9708/12 Oct/Nov 2021
Q151 · The table shows the number of biscuits and cakes that can be produced by four workers in… 9708/12 Oct/Nov 2021
25 The table shows the number of biscuits and cakes that can be produced by four workers in an hour. Laura Mo Nathan Omar biscuits 6 10 13 8 cakes 3 10 12 16 Who has the greatest comparative advantage in producing biscuits? A Laura B Mo C Nathan D Omar
1 marks
Answer: A
This question in 9708/12 Oct/Nov 2021
Q152 · According to the theory of comparative advantage, what makes trade beneficial between two… 9708/13 Oct/Nov 2021
19 According to the theory of comparative advantage, what makes trade beneficial between two countries? A Each country has different goods to sell and different tastes. B Each country has different opportunity costs of production. C One country has the absolute advantage in producing both goods. D The prices of goods are different between each country.
1 marks
Answer: B
This question in 9708/13 Oct/Nov 2021
Q153 · The demand for a country’s exports is price-elastic 9708/13 Oct/Nov 2021
20 The demand for a country’s exports is price-elastic. Its government introduces export subsidies. What will be the effect on its balance of trade and on its terms of trade? balance of trade terms of trade A increase increase B increase decrease C decrease increase D decrease decrease
1 marks
Answer: B
This question in 9708/13 Oct/Nov 2021
Q154 · Country X places a tariff of 20% on steel products imported from country Y 9708/13 Oct/Nov 2021
24 Country X places a tariff of 20% on steel products imported from country Y. Country Y retaliates with a 20% tariff on computers imported from country X. What is a certain economic consequence of these actions? A The balance of payments of country X and country Y will remain unchanged. B The exchange rate value on which trade between the two countries is based will be maintained. C The profits and employment of domestic firms in both countries will be preserved. D The volume of bilateral trade between country X and country Y will be reduced.
1 marks
Answer: D
This question in 9708/13 Oct/Nov 2021
Q155 · Two countries, X and Y, produce food and drink 9708/12 Feb/March 2022
27 Two countries, X and Y, produce food and drink. The table shows how many hours it takes them to produce one unit of each. food drink X 10 2 Y 20 12 What will be the result if country Y doubles its productivity in the output of drink and both countries produce only one good according to comparative advantage? A X will continue to produce drink. B Y will produce drink instead of food. C World drink production will rise. D World food production will fall.
1 marks
Answer: A
This question in 9708/12 Feb/March 2022
Q156 · Turkey can produce a good but also imports some of the good from Egypt 9708/11 May/June 2022
19 Turkey can produce a good but also imports some of the good from Egypt. The Turkish currency depreciates against the Egyptian currency. How is this most likely to affect production of this good in Egypt and in Turkey? production in Egypt production in Turkey A decrease decrease B decrease increase C increase decrease D increase increase
1 marks
Answer: B
This question in 9708/11 May/June 2022
Q157 · What will lead to an improvement in the terms of trade? 9708/12 May/June 2022
21 What will lead to an improvement in the terms of trade? A Export prices fall by 10% and import prices fall by 5%. B Export prices fall by 10% and import prices rise by 5%. C Export prices rise by 5% and import prices rise by 10%. D Export prices rise by 10% and import prices rise by 5%.
1 marks
Answer: D
This question in 9708/12 May/June 2022
Q158 · What could explain an improvement in the terms of trade for a country? 9708/13 May/June 2022
20 What could explain an improvement in the terms of trade for a country? A an increase in tariffs on imports B a decrease in the volume of imports sold C an increase in the prices of exports D a decrease in the volume of exports sold
1 marks
Answer: C
This question in 9708/13 May/June 2022
Q159 · In 2000, Japan was Asia’s largest exporter of electrical components, but by 2018 it was… 9708/13 May/June 2022
27 In 2000, Japan was Asia’s largest exporter of electrical components, but by 2018 it was ranked 8th. What might explain this change? A Japan has a lower opportunity cost in electrical component production than its Asian competitors. B Japan has experienced greater deflation than its Asian competitors. C Japan has imposed tariffs on the import of electrical components from its Asian competitors. D The Japanese Yen has appreciated against the currencies of its Asian competitors.
1 marks
Answer: D
This question in 9708/13 May/June 2022
Q160 · What is an accurate statement about possible causes and/or consequences of a worsening in… 9708/14 May/June 2022
27 What is an accurate statement about possible causes and/or consequences of a worsening in a country’s terms of trade? A It will result from a fall in the demand for its exports. B It will result from an increase in consumers’ incomes in its major trading partners. C It will result in a decrease in interest rates by its major trading partners. D It will result in an improvement in its balance of trade.
1 marks
Answer: A
This question in 9708/14 May/June 2022
Q161 · What is a measure of a country’s terms of trade index? 9708/11 Oct/Nov 2022
24 What is a measure of a country’s terms of trade index? price index of exports A × 100 price index of imports price index of imports B × 100 price index of exports total value of exports C × 100 total value of imports D total value of exports – total value of imports
1 marks
Answer: A
This question in 9708/11 Oct/Nov 2022
Q162 · From the same quantity of factors of production, country X and country Y each produce the… 9708/12 Oct/Nov 2022
25 From the same quantity of factors of production, country X and country Y each produce the following units of output. country sugar textiles X 30 20 Y 40 10 Which statement is correct? A Country X has absolute advantage in the production of both goods. B Country X has comparative advantage in the production of sugar. C Country Y has absolute advantage in the production of textiles. D Country Y has comparative advantage in the production of sugar.
1 marks
Answer: D
This question in 9708/12 Oct/Nov 2022
Q163 · What can be best understood from a knowledge of a country’s terms of trade? 9708/12 Feb/March 2023
24 What can be best understood from a knowledge of a country’s terms of trade? A its balance of payments performance B the purchasing power of its exports C the standard of living within the country D the value of its real exchange rate
1 marks
Answer: B
This question in 9708/12 Feb/March 2023
Q164 · A company produces goods for export only 9708/12 Feb/March 2023
25 A company produces goods for export only. Which change could cause a rise in the price of its goods while the quantity sold is unchanged? domestic foreign workers’ consumers’ wages wages A unchanged fall B fall unchanged C fall fall D rise rise
1 marks
Answer: D
This question in 9708/12 Feb/March 2023
Q165 · Which statement correctly describes absolute advantage? 9708/11 May/June 2023
15 Which statement correctly describes absolute advantage? A It is when a country has a higher opportunity cost in producing a good than another country. B It is when a country has a lower wage cost in producing a good than another country. C It is when the relative prices of exports of a country are greater than the relative prices of its imports. D It is when a country’s output of a good is greater per unit of resource than another country.
1 marks
Answer: D
This question in 9708/11 May/June 2023
Q166 · The diagram shows production possibility curves for two countries, India and Japan 9708/11 May/June 2023
23 The diagram shows production possibility curves for two countries, India and Japan. 600 rice 500 India Japan 0 0 200 tea Which combination of outputs would be achieved if each country specialised in the product in which it has a comparative advantage? rice tea A 600 200 B 600 500 C 1200 200 D 1200 1000
1 marks
Answer: A
This question in 9708/11 May/June 2023
Q167 · Which measure is aimed directly at promoting international trade? 9708/11 May/June 2023
26 Which measure is aimed directly at promoting international trade? A decreasing existing quotas B increasing interest rates C subsidies paid to export industries D wage subsidy schemes during recessions
1 marks
Answer: C
This question in 9708/11 May/June 2023
Q168 · The world consists of two countries, M and N 9708/12 May/June 2023
26 The world consists of two countries, M and N. The graphs show their production possibilities for wheat and rice. country M country N 100 rice rice 75 0 0 0 100 0 50 wheat wheat Countries M and N operate on their production possibility curves and, before specialisation, country M produces 60 units of wheat and country N produces 30 units of wheat. What will be the change in the world output of rice if both countries decide to specialise according to comparative advantage? A It will fall by 5 units. B It will fall by 30 units. C It will rise by 5 units. D It will rise by 30 units.
1 marks
Answer: C
This question in 9708/12 May/June 2023
Q169 · Country X and country Y each allocate half of their resources towards the manufacturing… 9708/13 May/June 2023
23 Country X and country Y each allocate half of their resources towards the manufacturing of shoes, and the other half towards the manufacturing of t-shirts. Resources can be used equally effectively in the production of both products in both countries. The table shows the output of shoes and t-shirts produced by both countries using half their resources in each case, before specialisation. country shoes t-shirts X 4 000 12 000 Y 2 000 8 000 total 6 000 20 000 What can be concluded from the data? A The opportunity cost of country Y producing two shoes is four t-shirts. B The opportunity cost of country X producing one t-shirt is four shoes. C The total output of shoes and t-shirts after specialisation would be 24 000. D The total output of shoes and t-shirts after specialisation would be 28 000.
1 marks
Answer: C
This question in 9708/13 May/June 2023
Q170 · The diagram shows the production possibility curves (PPCs) for country X and country Y… 9708/11 Oct/Nov 2023
20 The diagram shows the production possibility curves (PPCs) for country X and country Y, the only two countries in the world. Both countries produce just two goods, M and N. 200 output of good M PPCY 100 PPCX 0 0 100 150 output of good N Under which terms of trade will both country X and country Y benefit from trading with each other? A 1M for 0.75N B 1M for 0.8N C 1M for 1N D 1M for 2N
1 marks
Answer: B
This question in 9708/11 Oct/Nov 2023
Q171 · What must be the result for a country of a rise in its export prices relative to its… 9708/12 Oct/Nov 2023
18 What must be the result for a country of a rise in its export prices relative to its import prices? A a deficit in its trade in goods B an improvement in its terms of trade C an increase in its inflation rate D a rise in its exchange rate
1 marks
Answer: B
This question in 9708/12 Oct/Nov 2023
Q172 · Country X can produce a product at a lower opportunity cost than country Y 9708/12 Oct/Nov 2023
19 Country X can produce a product at a lower opportunity cost than country Y. Which term best describes this statement? A absolute advantage B comparative advantage C specialisation D terms of trade
1 marks
Answer: B
This question in 9708/12 Oct/Nov 2023
Q173 · The table shows different combinations of rings and bracelets that can be produced by… 9708/13 Oct/Nov 2023
3 The table shows different combinations of rings and bracelets that can be produced by Luke and Zoe in the same time period. Luke Zoe rings bracelets rings bracelets 18 0 20 0 12 6 16 8 6 12 12 16 0 18 8 24 Which statement is not correct? A Luke has a larger opportunity cost than Zoe for making bracelets. B The opportunity cost of producing rings is constant for both Luke and Zoe. C Zoe should specialise in making rings. D Zoe’s opportunity cost for each bracelet is 2 rings.
1 marks
Answer: D
This question in 9708/13 Oct/Nov 2023
Q174 · Country R and country S are going to trade 1 unit of product X for 2 1 unit of product Y 9708/13 Oct/Nov 2023
24 Country R and country S are going to trade 1 unit of product X for 2 1 unit of product Y. With a given amount of resources: country R can produce either 30 units of product X or 50 units of product Y country S can produce either 20 units of product X or 25 units of product Y. Which statement is correct, according to the theory of comparative advantage? A Free trade will benefit both R and S. B Free trade will benefit neither R nor S. C Free trade will benefit R but not S. D Free trade will benefit S but not R.
1 marks
Answer: A
This question in 9708/13 Oct/Nov 2023
Q175 · The table indicates the factor inputs required to produce wheat and cars in countries X… 9708/12 Feb/March 2024
24 The table indicates the factor inputs required to produce wheat and cars in countries X and Y. units of factor units of factor inputs to produce inputs to produce one tonne of wheat one car country X 4 2 country Y 8 6 What makes it possible for both countries to benefit from trade? A Country X has an absolute advantage in wheat and car production. B Country Y has an absolute advantage in wheat and car production. C Country Y has a comparative advantage in wheat production. D Opportunity cost of wheat and car production is the same between countries.
1 marks
Answer: C
This question in 9708/12 Feb/March 2024
Q176 · When must the terms of trade of a country change? 9708/12 Feb/March 2024
26 When must the terms of trade of a country change? A when the volume of exports falls and the volume of imports rises B when the total value of exports falls and the total value of imports rises C when the balance of trade in goods moves from deficit to surplus D when the average price of exports rises and the average price of imports falls
1 marks
Answer: D
This question in 9708/12 Feb/March 2024
Q177 · Countries X and Y both produce goods M and N 9708/11 May/June 2024
26 Countries X and Y both produce goods M and N. They decide to specialise and trade freely in the goods. Under which conditions are the gains from specialisation and free trade likely to be smallest? mobility of factors of mobility of factors of production between production between goods M and N countries X and Y A high high B high low C low high D low low
1 marks
Answer: C
This question in 9708/11 May/June 2024
Q178 · The diagram shows the amounts of cotton and butter that can be produced in countries X… 9708/12 May/June 2024
27 The diagram shows the amounts of cotton and butter that can be produced in countries X and Y with a given quantity of resources. 500 units of cotton 300 Y X 0 0 190 200 units of butter What can be concluded from the diagram? A Country X has an absolute advantage in the production of cotton. B Country X has a comparative advantage in the production of butter. C Country Y has a comparative advantage in the production of both goods. D There are no gains from trade between these two countries.
1 marks
Answer: B
This question in 9708/12 May/June 2024
Q179 · What is indicated by an economy’s terms of trade? 9708/12 May/June 2024
28 What is indicated by an economy’s terms of trade? A the degree of its dependence on imports B the international competitiveness of its exports C the purchasing power of its exports relative to its imports D the relative strength of its currency in the foreign exchange market
1 marks
Answer: C
This question in 9708/12 May/June 2024
Q180 · The table shows the output of goods X and Y in China and the United States (US) before… 9708/13 May/June 2024
28 The table shows the output of goods X and Y in China and the United States (US) before specialisation. good X good Y China 20 000 70 000 US 20 000 50 000 total 40 000 120 000 Assuming both China and the US use 50% of their resources to produce each product, what will the combined total output be after specialisation has occurred? A 120 000 B 140 000 C 160 000 D 180 000
1 marks
Answer: D
This question in 9708/13 May/June 2024
Q181 · Economists suggest that multilateral trade between many countries is preferable to… 9708/13 May/June 2024
29 Economists suggest that multilateral trade between many countries is preferable to bilateral trade between two countries. Why is this? A Bilateral trade means that trade diversion is always greater than trade creation. B Bilateral trade misses the benefit of trade with third countries. C Gains from bilateral trade are less than the harm done to third countries. D Gains from comparative advantage cannot apply in the case of bilateral trade.
1 marks
Answer: B
This question in 9708/13 May/June 2024
Q182 · Using all their resources efficiently, country X can produce 6 million tonnes of wheat or… 9708/11 Oct/Nov 2024
26 Using all their resources efficiently, country X can produce 6 million tonnes of wheat or 2 million tonnes of steel whilst country Y can produce 4 million tonnes of wheat or 1 million tonnes of steel. Based on this information, what does the theory of comparative advantage suggest? A Country X should produce only steel. B Country X will not gain from international trade. C Country Y has no comparative advantage. D Country Y will not gain from international trade.
1 marks
Answer: A
This question in 9708/11 Oct/Nov 2024
Q183 · Which circumstances would most help a firm to gain from a depreciation of the exchange… 9708/12 Oct/Nov 2024
24 Which circumstances would most help a firm to gain from a depreciation of the exchange rate? A It sells mainly abroad and relies on domestic suppliers for inputs. B It sells mainly abroad and relies on foreign suppliers for inputs. C It sells mainly in its home market and relies on domestic suppliers for inputs. D It sells mainly in its home market and relies on foreign suppliers for inputs.
1 marks
Answer: A
This question in 9708/12 Oct/Nov 2024
Q184 · A country currently producing at point X on its production possibility curve decides to… 9708/13 Oct/Nov 2024
26 A country currently producing at point X on its production possibility curve decides to specialise in the manufacture of cars and import trucks. It finds it can import one truck in exchange for four cars. 2000 trucks X 1000 0 0 5000 10 000 cars What is the result in the domestic market if it exports all the extra cars? A 250 extra trucks B 1000 extra trucks C 1250 extra trucks D 2000 extra trucks
1 marks
Answer: A
This question in 9708/13 Oct/Nov 2024
Q185 · Country X trades with country Y 9708/12 Feb/March 2025
26 Country X trades with country Y. What are the terms of trade for country X? A average price of country X’s exports divided by the average price of country Y’s exports B the ratio of an index of country X’s export prices to an index of its import prices C value of country X’s exports divided by the value of country Y’s exports D value of country X’s imports divided by the value of country Y’s imports
1 marks
Answer: B
This question in 9708/12 Feb/March 2025
Q186 · The diagram shows the production possibilities for barley and wheat in countries Q and R 9708/12 Feb/March 2025
29 The diagram shows the production possibilities for barley and wheat in countries Q and R. 80 barley 60 country Q country R 0 0 20 80 wheat What can be concluded? A Country Q has a comparative advantage in the production of barley. B Country Q has an absolute advantage in producing both goods. C Country R has an absolute advantage in the production of barley. D There is no comparative advantage.
1 marks
Answer: B
This question in 9708/12 Feb/March 2025
Q187 · A government increases the import quota of cars 9708/13 May/June 2025
28 A government increases the import quota of cars. What is the likely effect of this? A jobs will be created in the domestic car industry B prices of cars will fall for domestic consumers C specialisation is reduced D trading partners will retaliate
1 marks
Answer: B
This question in 9708/13 May/June 2025
Q188 · Country X and country Y use the same amount of resources to produce mobile phones and… 9708/13 May/June 2025
30 Country X and country Y use the same amount of resources to produce mobile phones and televisions. The table shows how much of each product can be produced if all resources are used to produce that product. mobile phones televisions country X 500 400 country Y 100 200 What can be deduced about absolute advantage and comparative advantage? Country X has an absolute advantage in producing mobile phones and a comparative advantage A in producing televisions. Country X has an absolute advantage in producing televisions and a comparative advantage in B producing mobile phones. Country Y has an absolute advantage in producing mobile phones and a comparative advantage C in producing televisions. Country Y has an absolute advantage in producing televisions and a comparative advantage in D producing mobile phones.
1 marks
Answer: B
This question in 9708/13 May/June 2025
Q189 · The terms of trade of a developing country fell from 90 in 2010 to 80 in 2015 9708/11 Oct/Nov 2025
27 The terms of trade of a developing country fell from 90 in 2010 to 80 in 2015. Assuming the index of its import prices remained constant at 110 between these two years, what happened to its index of export prices? A fell by 10 B fell by 11 C increased by 10 D increased by 30
1 marks
Answer: B
This question in 9708/11 Oct/Nov 2025
Q190 · What is not a limitation of the theory of comparative advantage? 9708/11 Oct/Nov 2025
28 What is not a limitation of the theory of comparative advantage? A the movement of factors of production between countries B governments’ imposition of trade restrictions C one country being more efficient in the production of all goods D transport costs outweighing any comparative advantage
1 marks
Answer: C
This question in 9708/11 Oct/Nov 2025
Q191 · What will definitely lead to an improvement in the terms of trade? 9708/12 Oct/Nov 2025
27 What will definitely lead to an improvement in the terms of trade? A Export prices fall whilst import prices rise. B Export prices rise by the same amount as import prices. C Export prices rise slower than import prices. D Export prices rise whilst import prices stay the same.
1 marks
Answer: D
This question in 9708/12 Oct/Nov 2025
Q192 · What is meant by comparative advantage? 9708/13 Oct/Nov 2025
28 What is meant by comparative advantage? A One country can produce a product at a lower opportunity cost than another country. B One country can produce more of a product than another country, using a given level of resources. C One country has lower barriers to trade than another country. D One country is making more efficient use of factors of production than another country.
1 marks
Answer: A
This question in 9708/13 Oct/Nov 2025
Q193 · An economy specialises in the production of one product 9708/13 Oct/Nov 2025
29 An economy specialises in the production of one product. It exports this product to obtain another product. Which type of diagram can show the combinations of these products? A the production possibility curve B the aggregate demand curve C the principle of absolute advantage D the trading possibility curve
1 marks
Answer: D
This question in 9708/13 Oct/Nov 2025
Q194 · The main export of country X is oil 9708/13 Oct/Nov 2025
30 The main export of country X is oil. The world demand for oil is price inelastic. The world supply of oil is reduced by the major oil producing countries, including country X. Imports into country X are unchanged. What are the effects of this action by the major oil producing countries on the terms of trade and the current account of the balance of payments in country X? terms of trade current account A increases increases B increases decreases C decreases increases D decreases decreases
1 marks
Answer: A
This question in 9708/13 Oct/Nov 2025
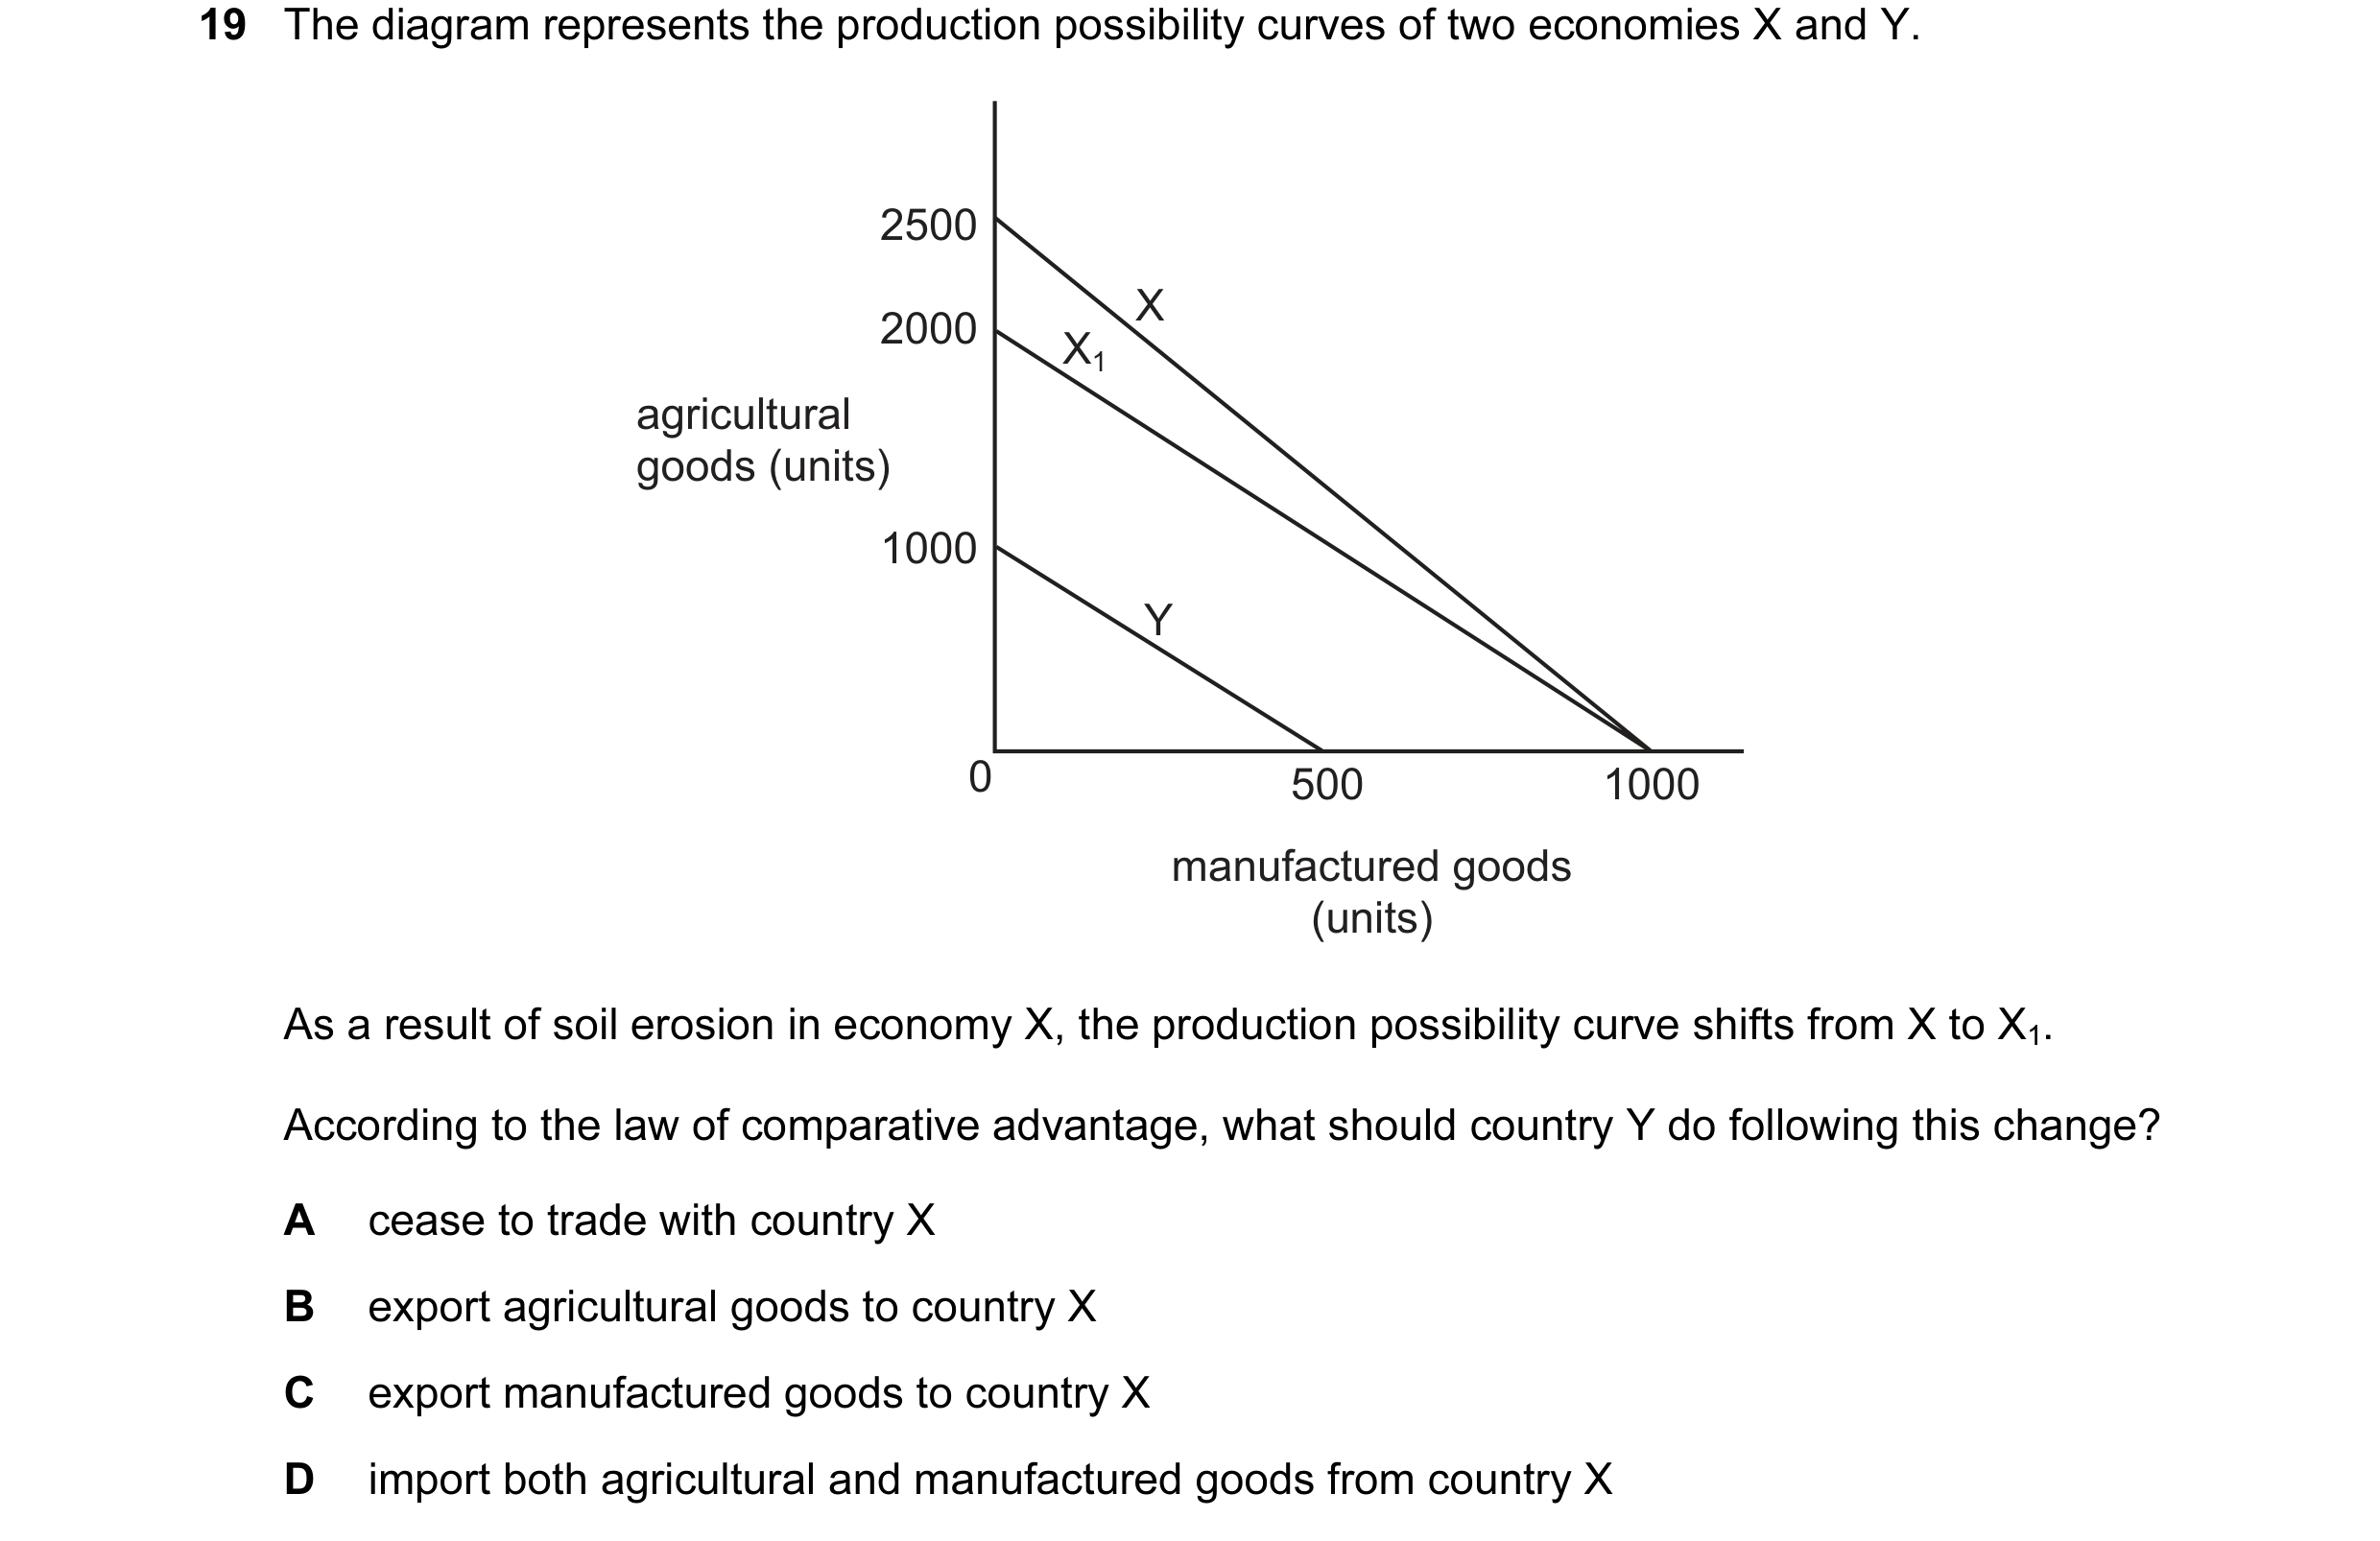

 1 / 59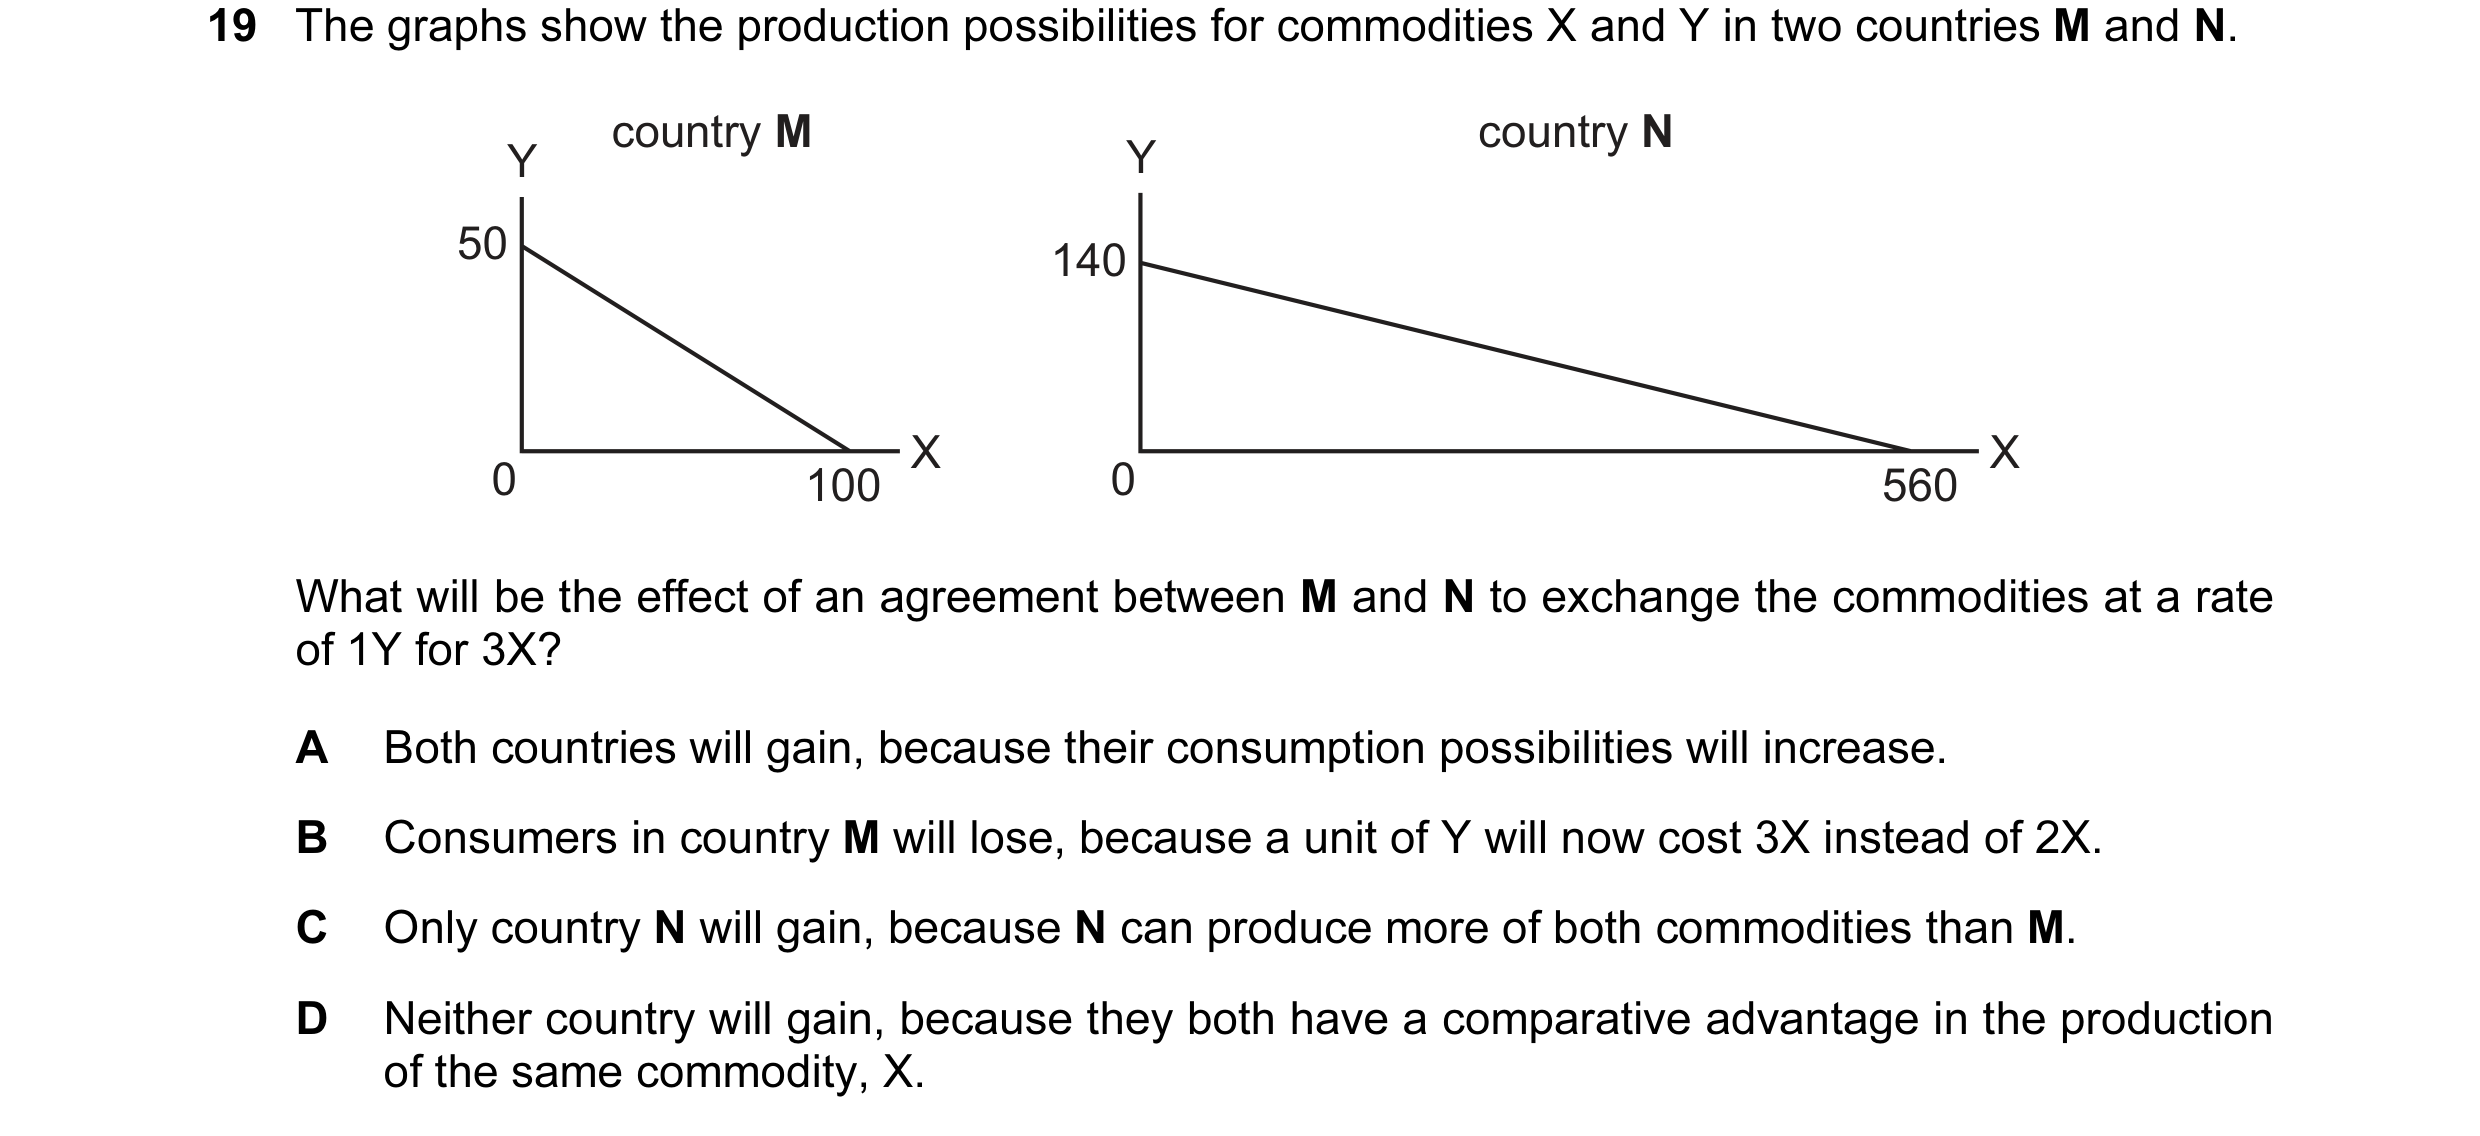
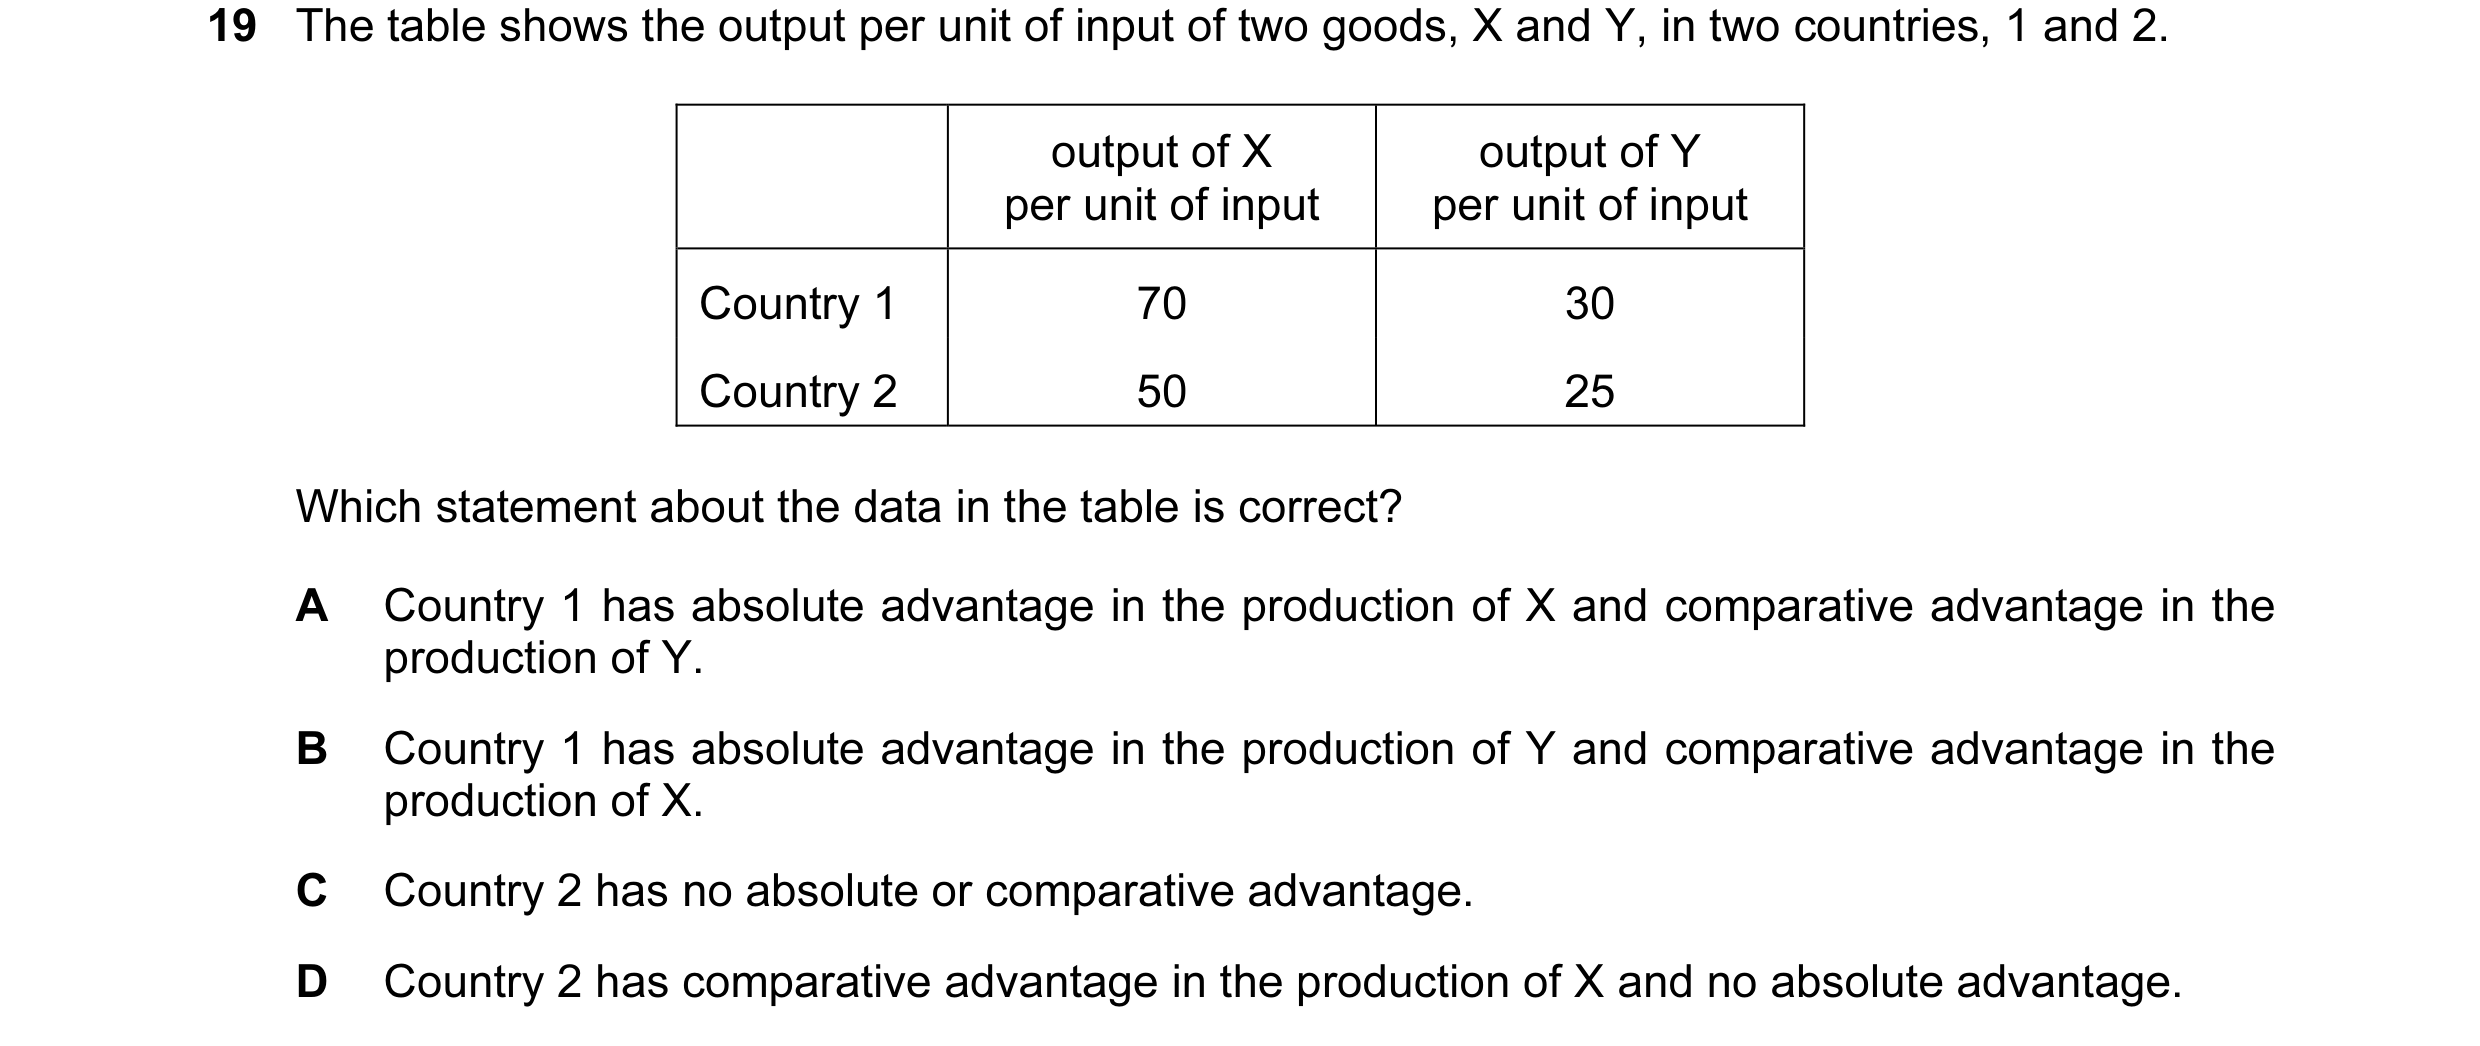
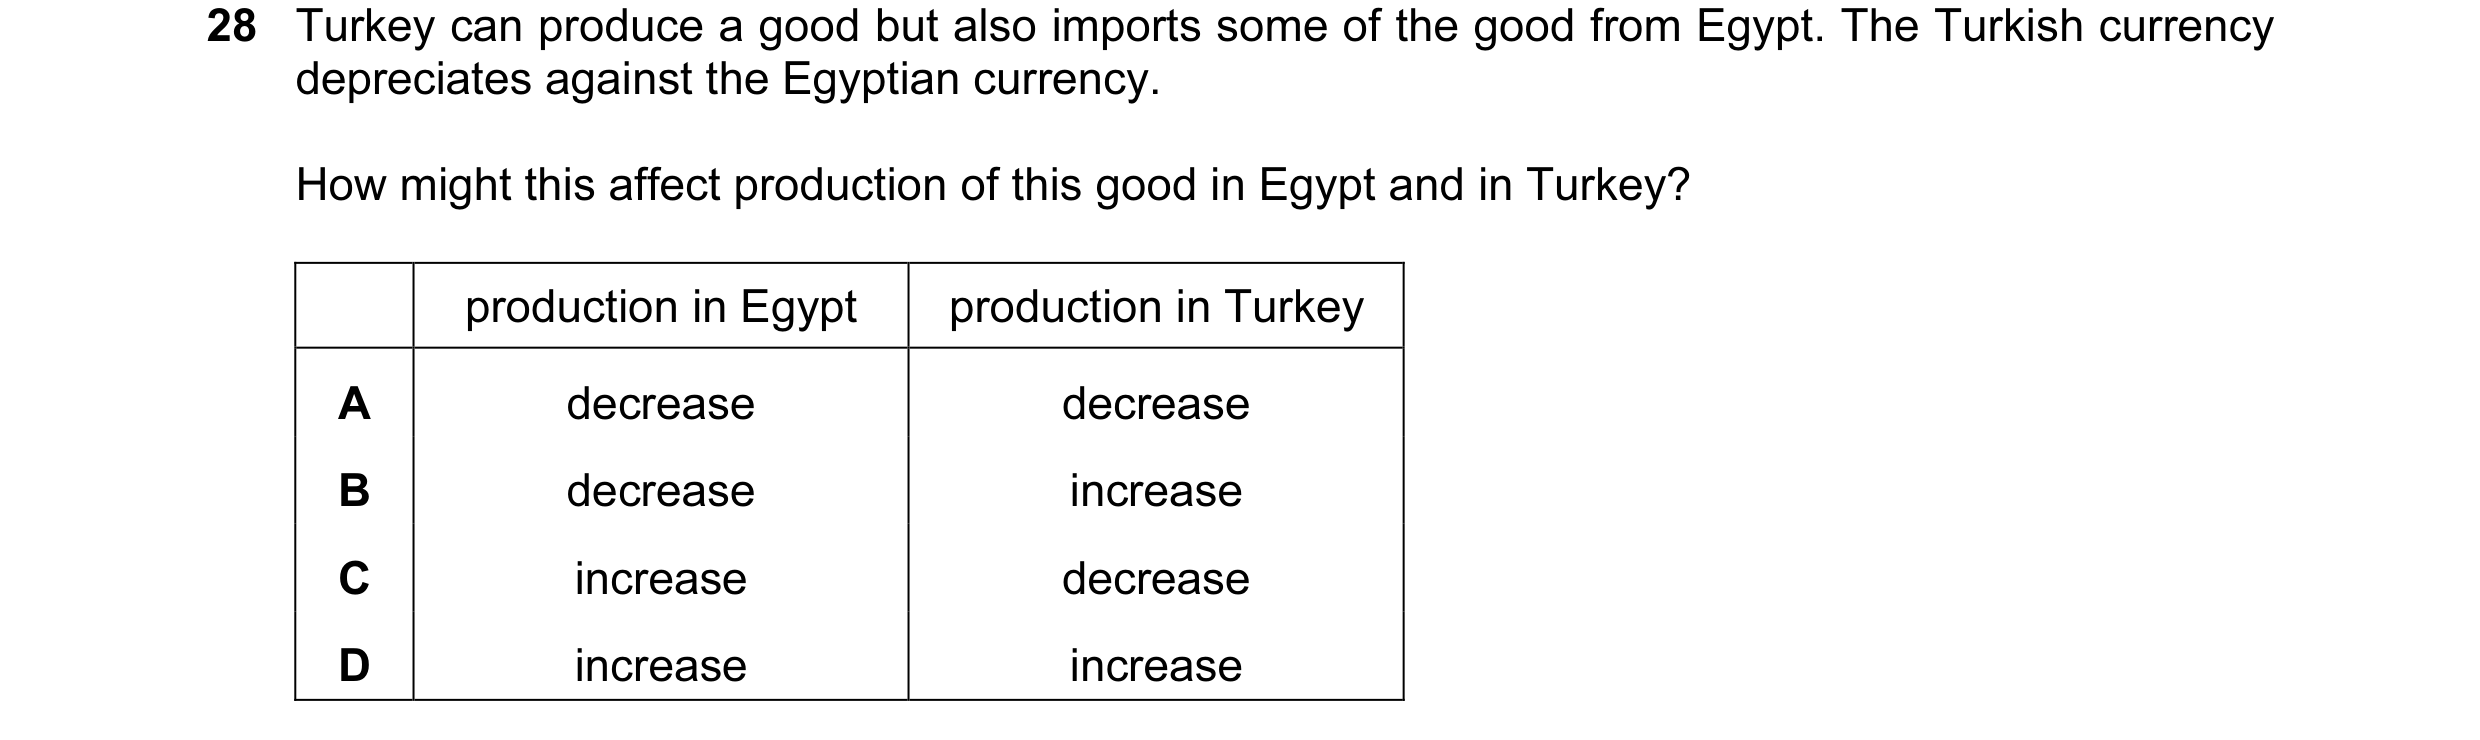 2 / 59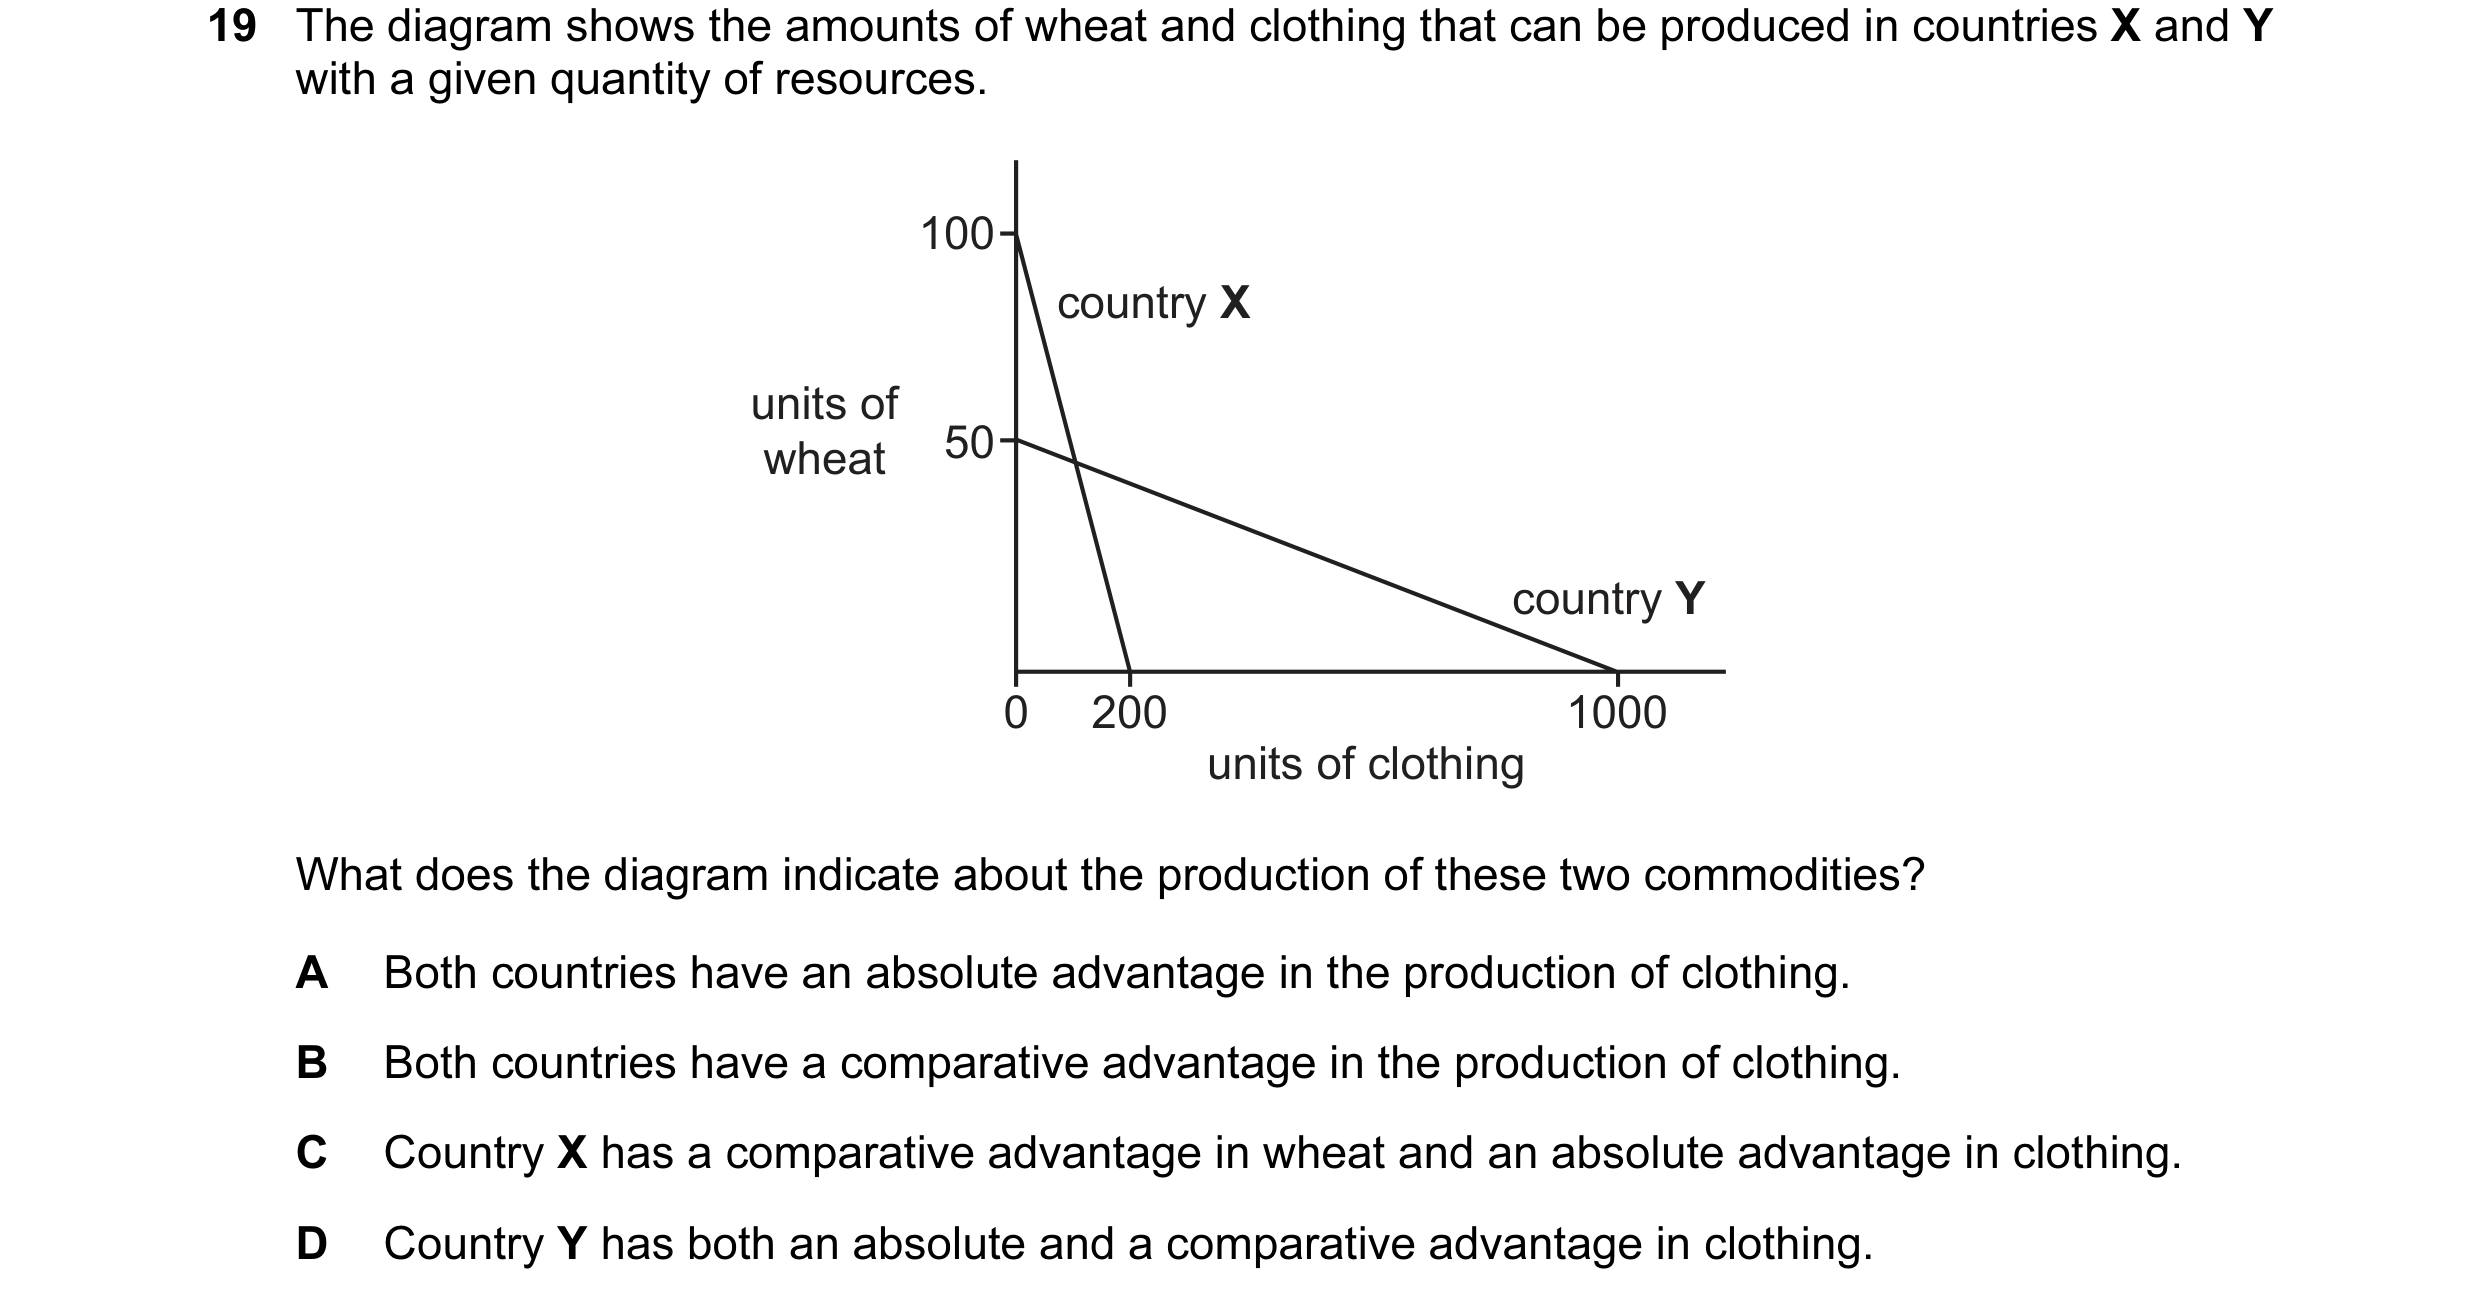
 3 / 59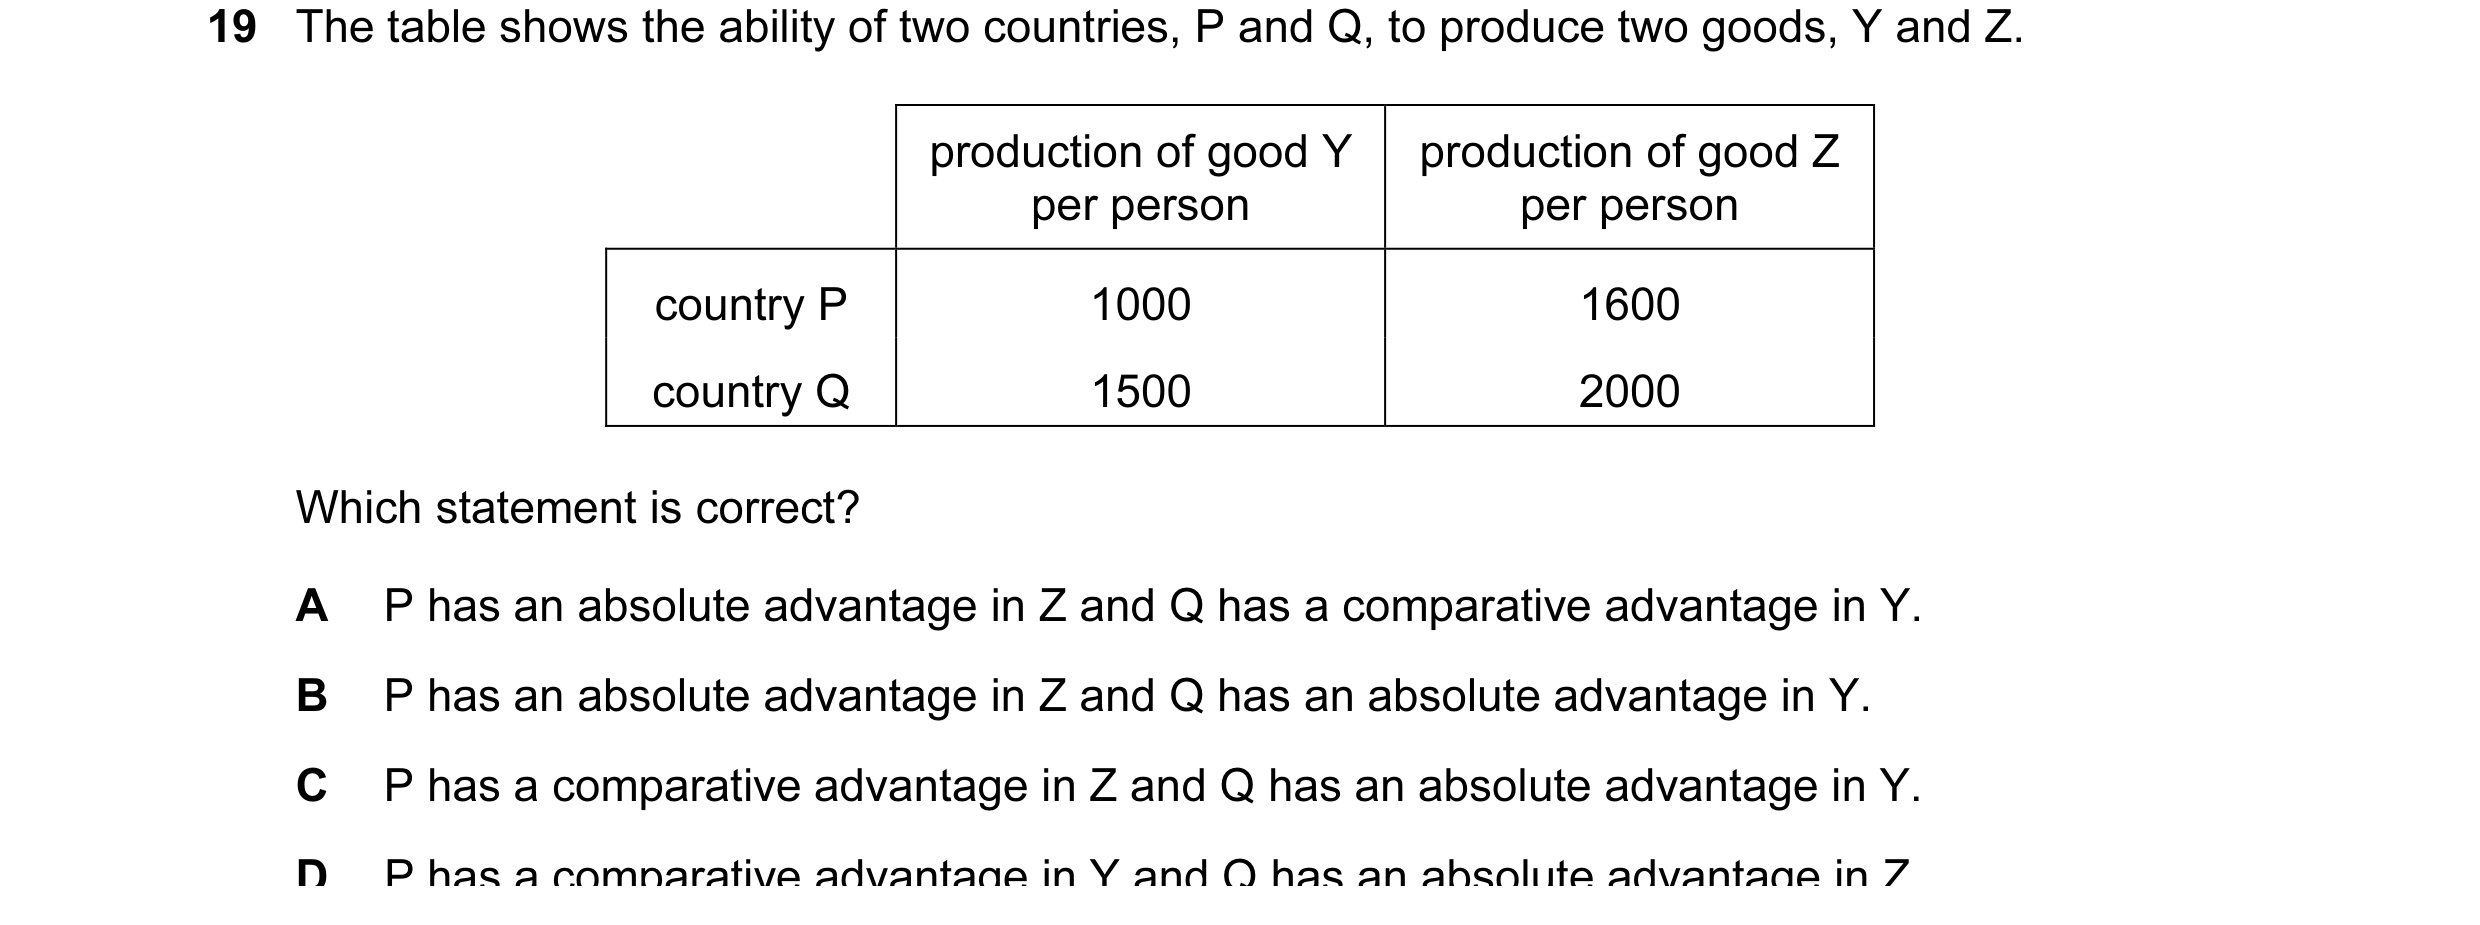
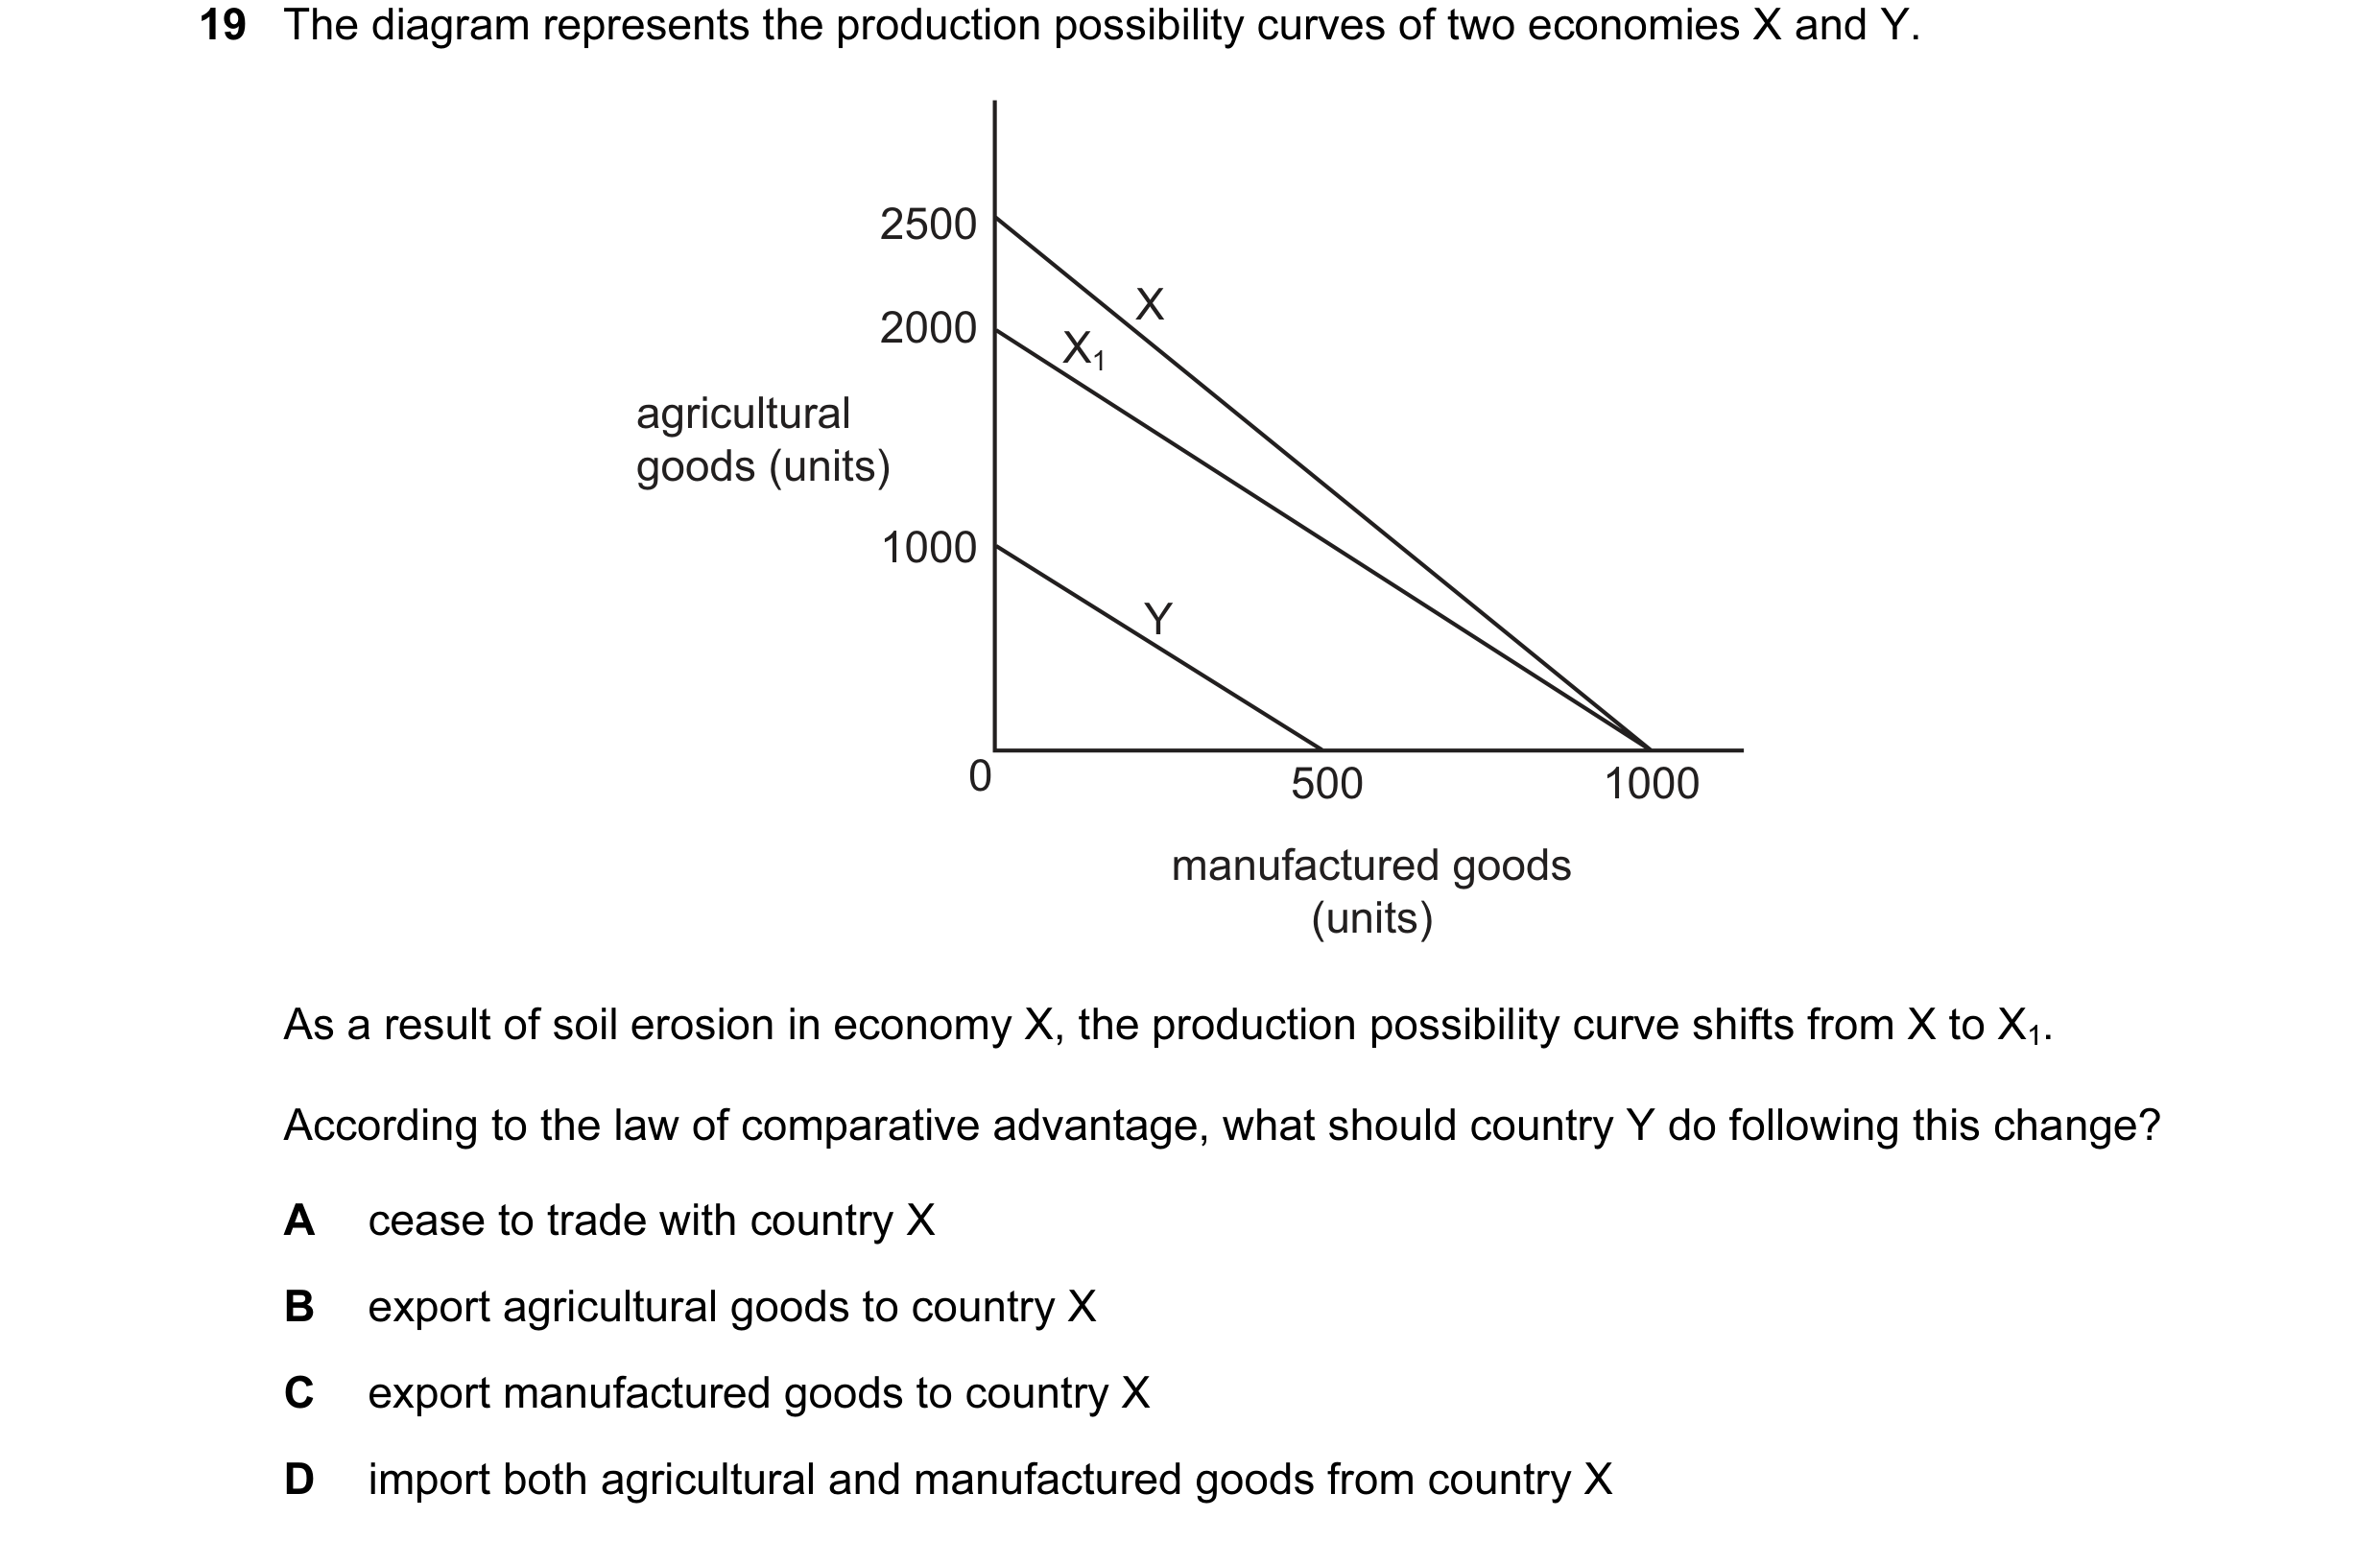 4 / 59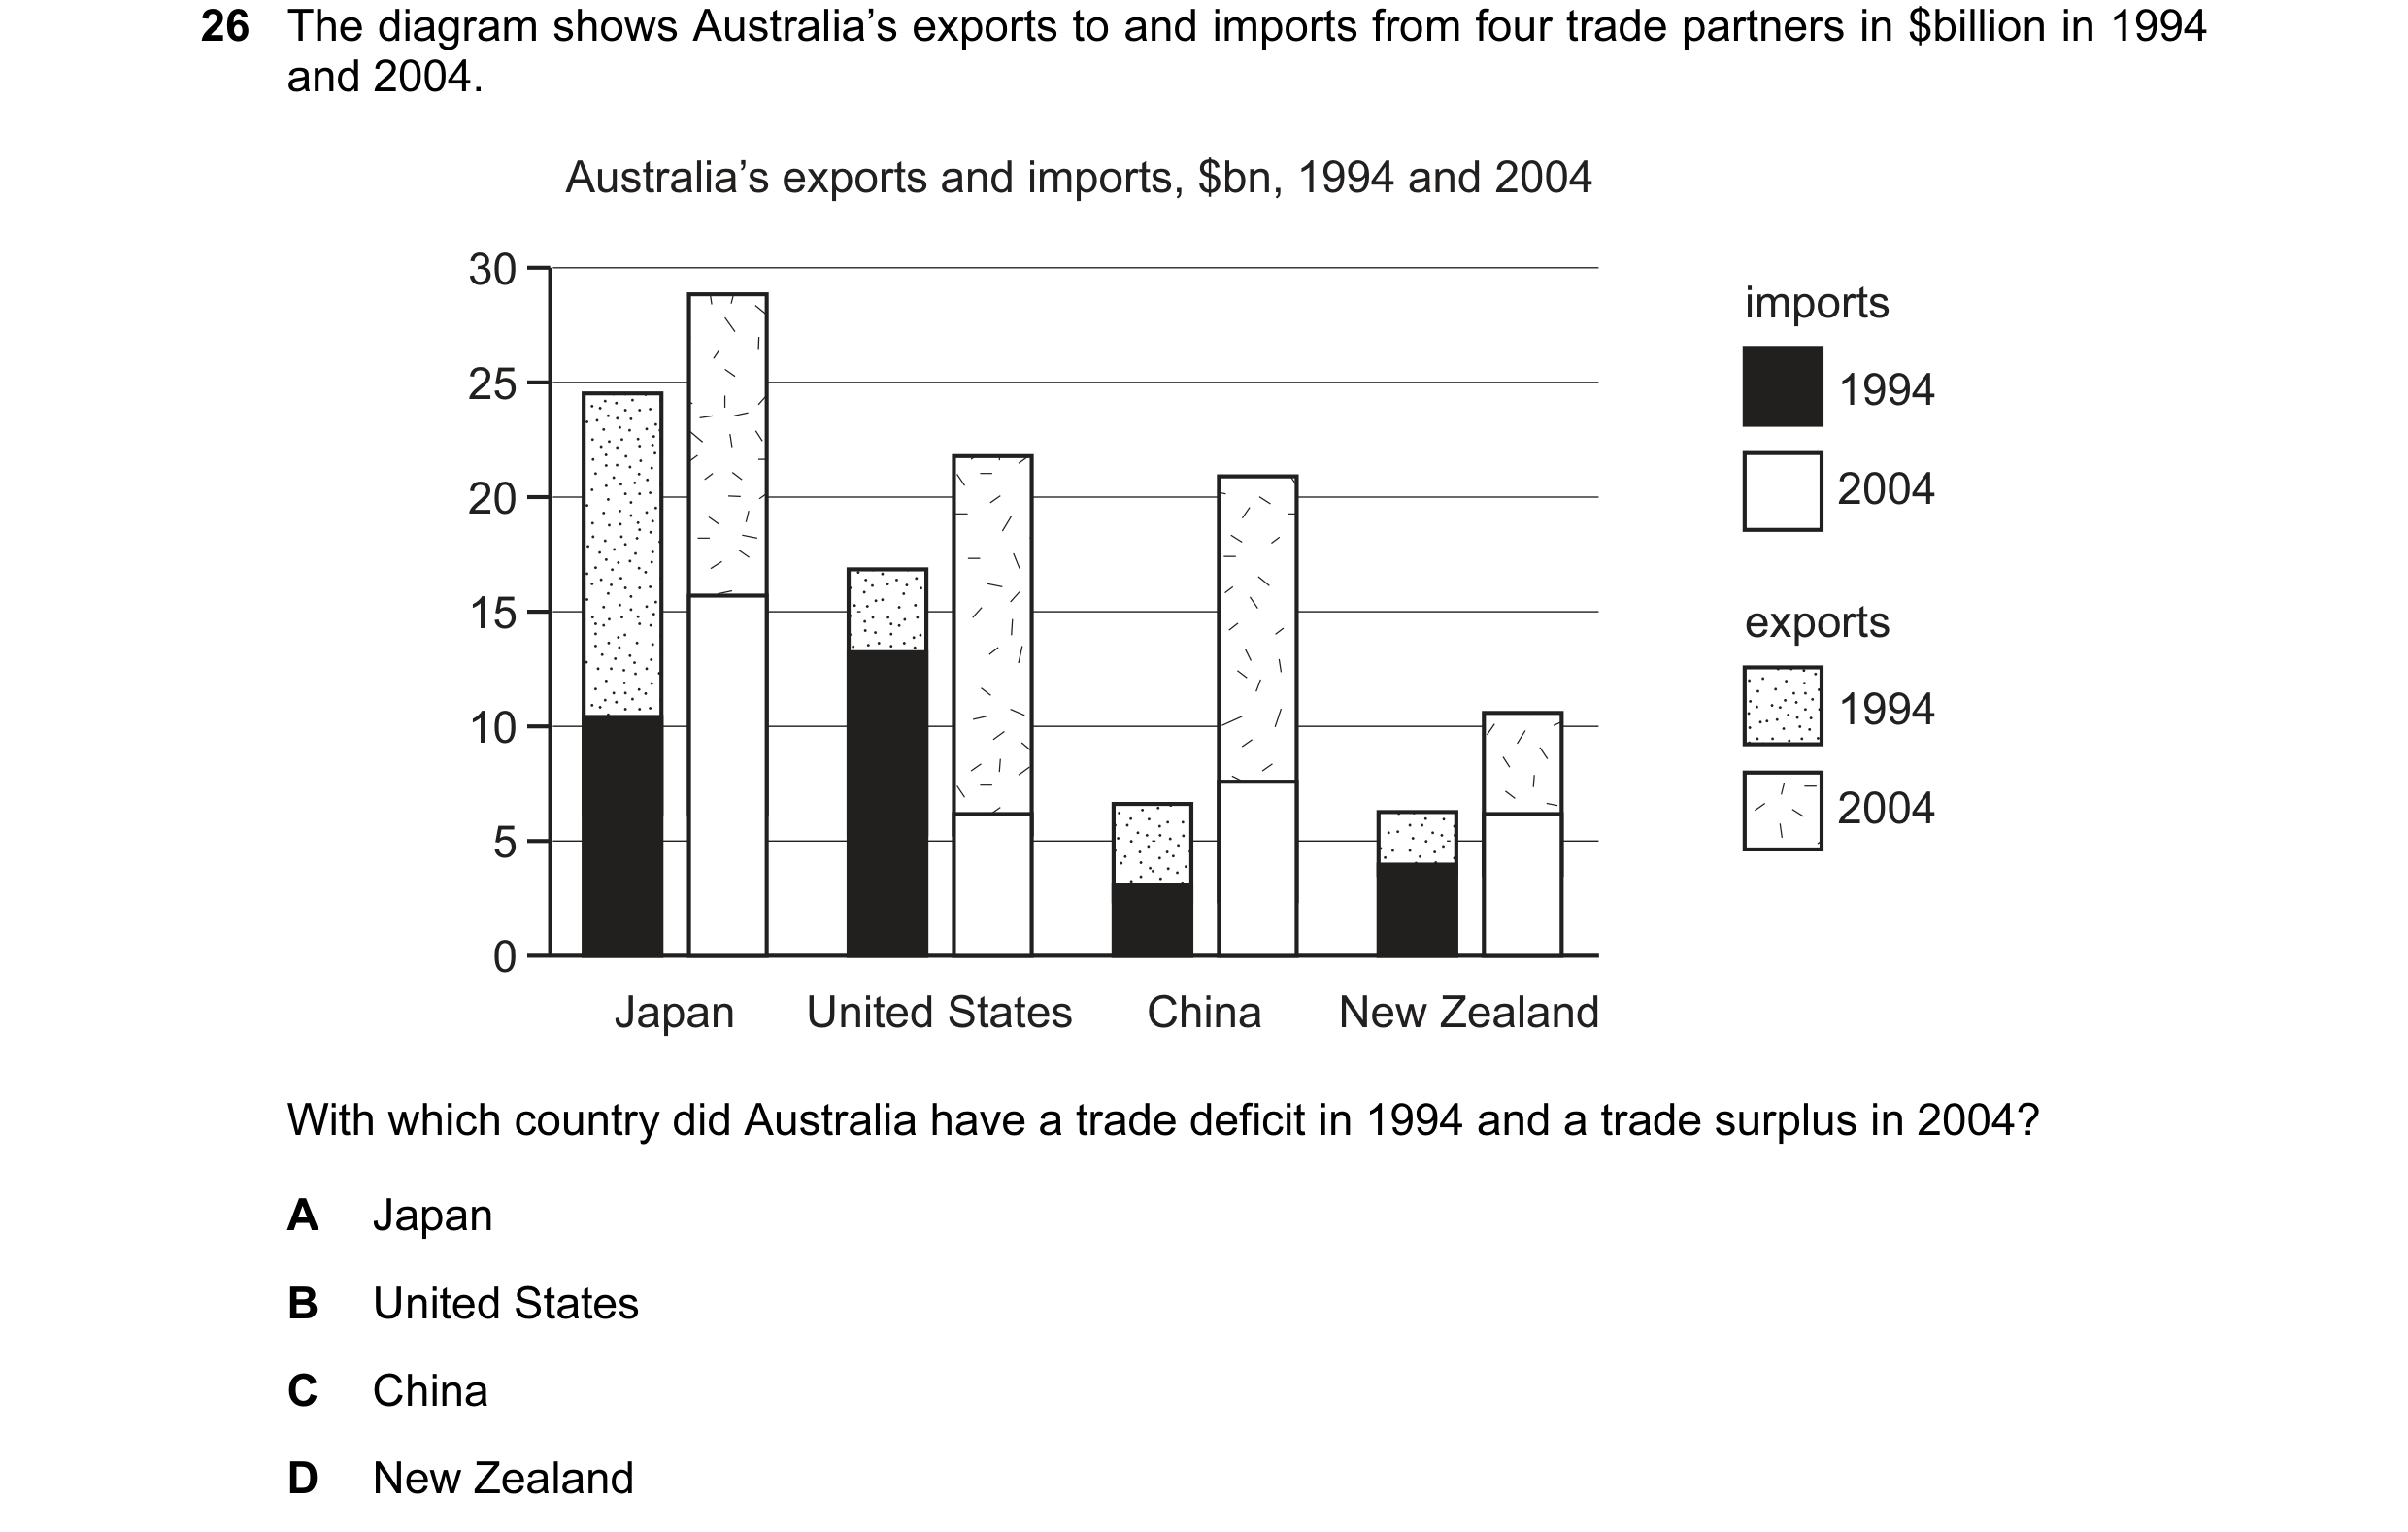
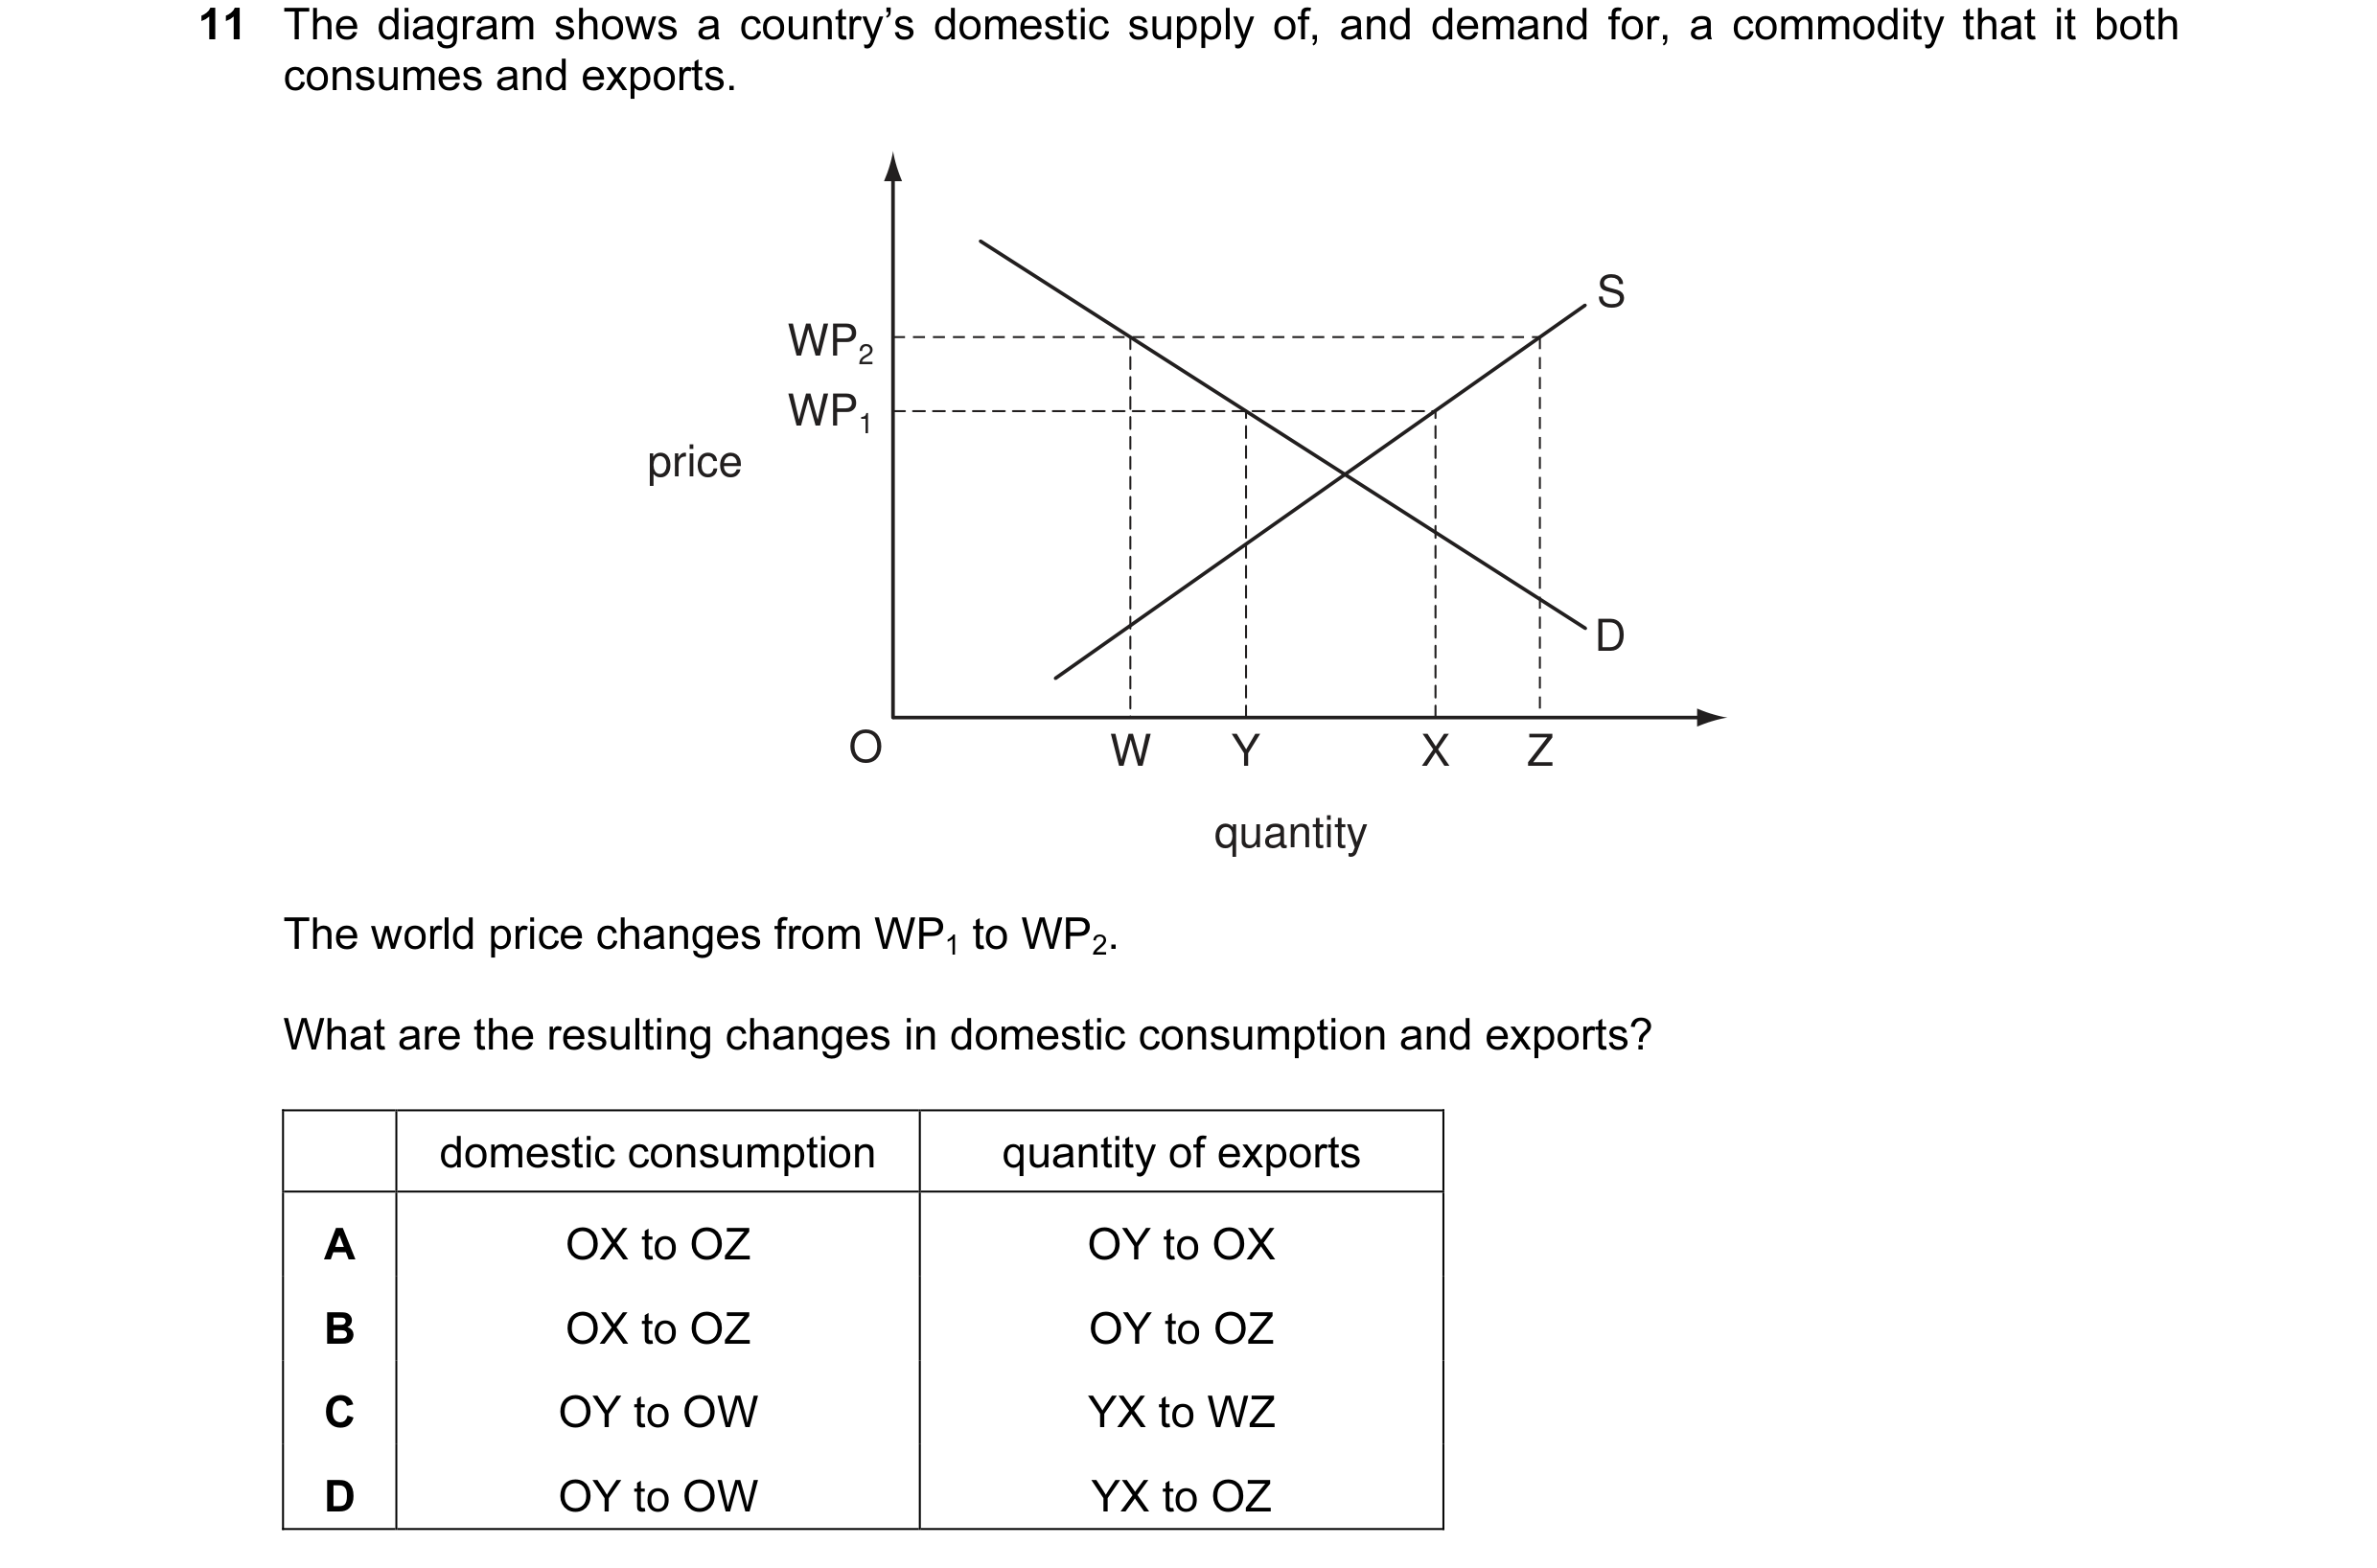 5 / 59
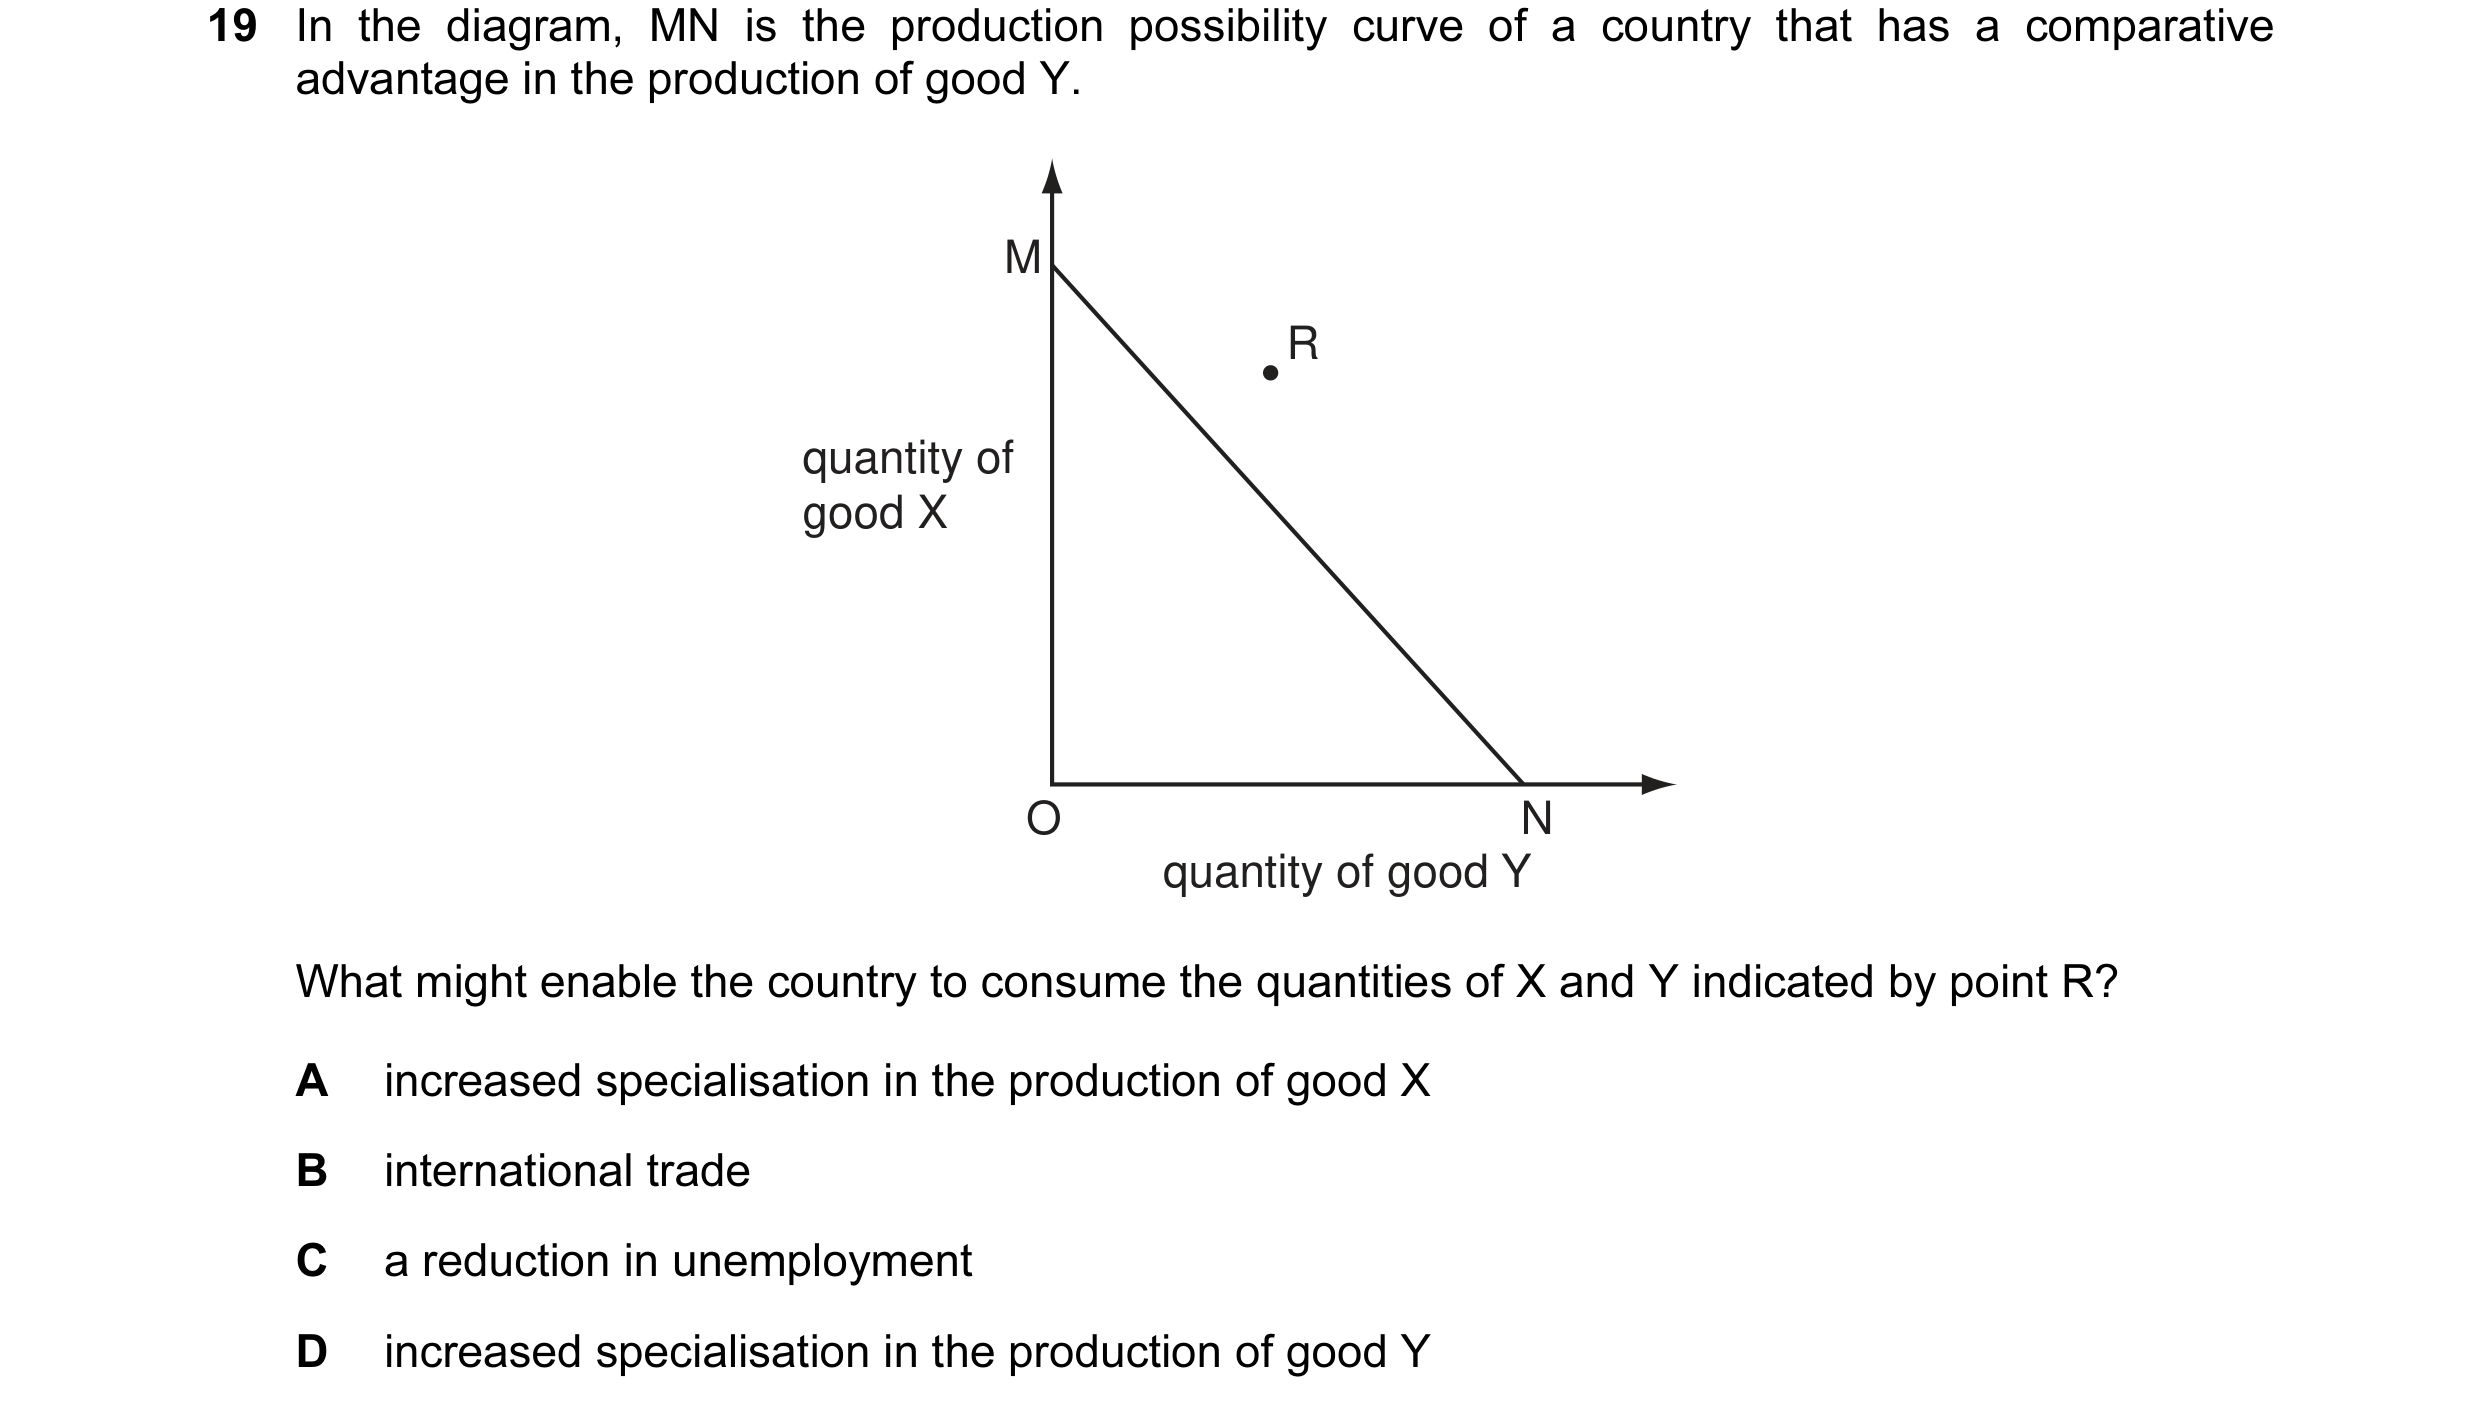
 6 / 59
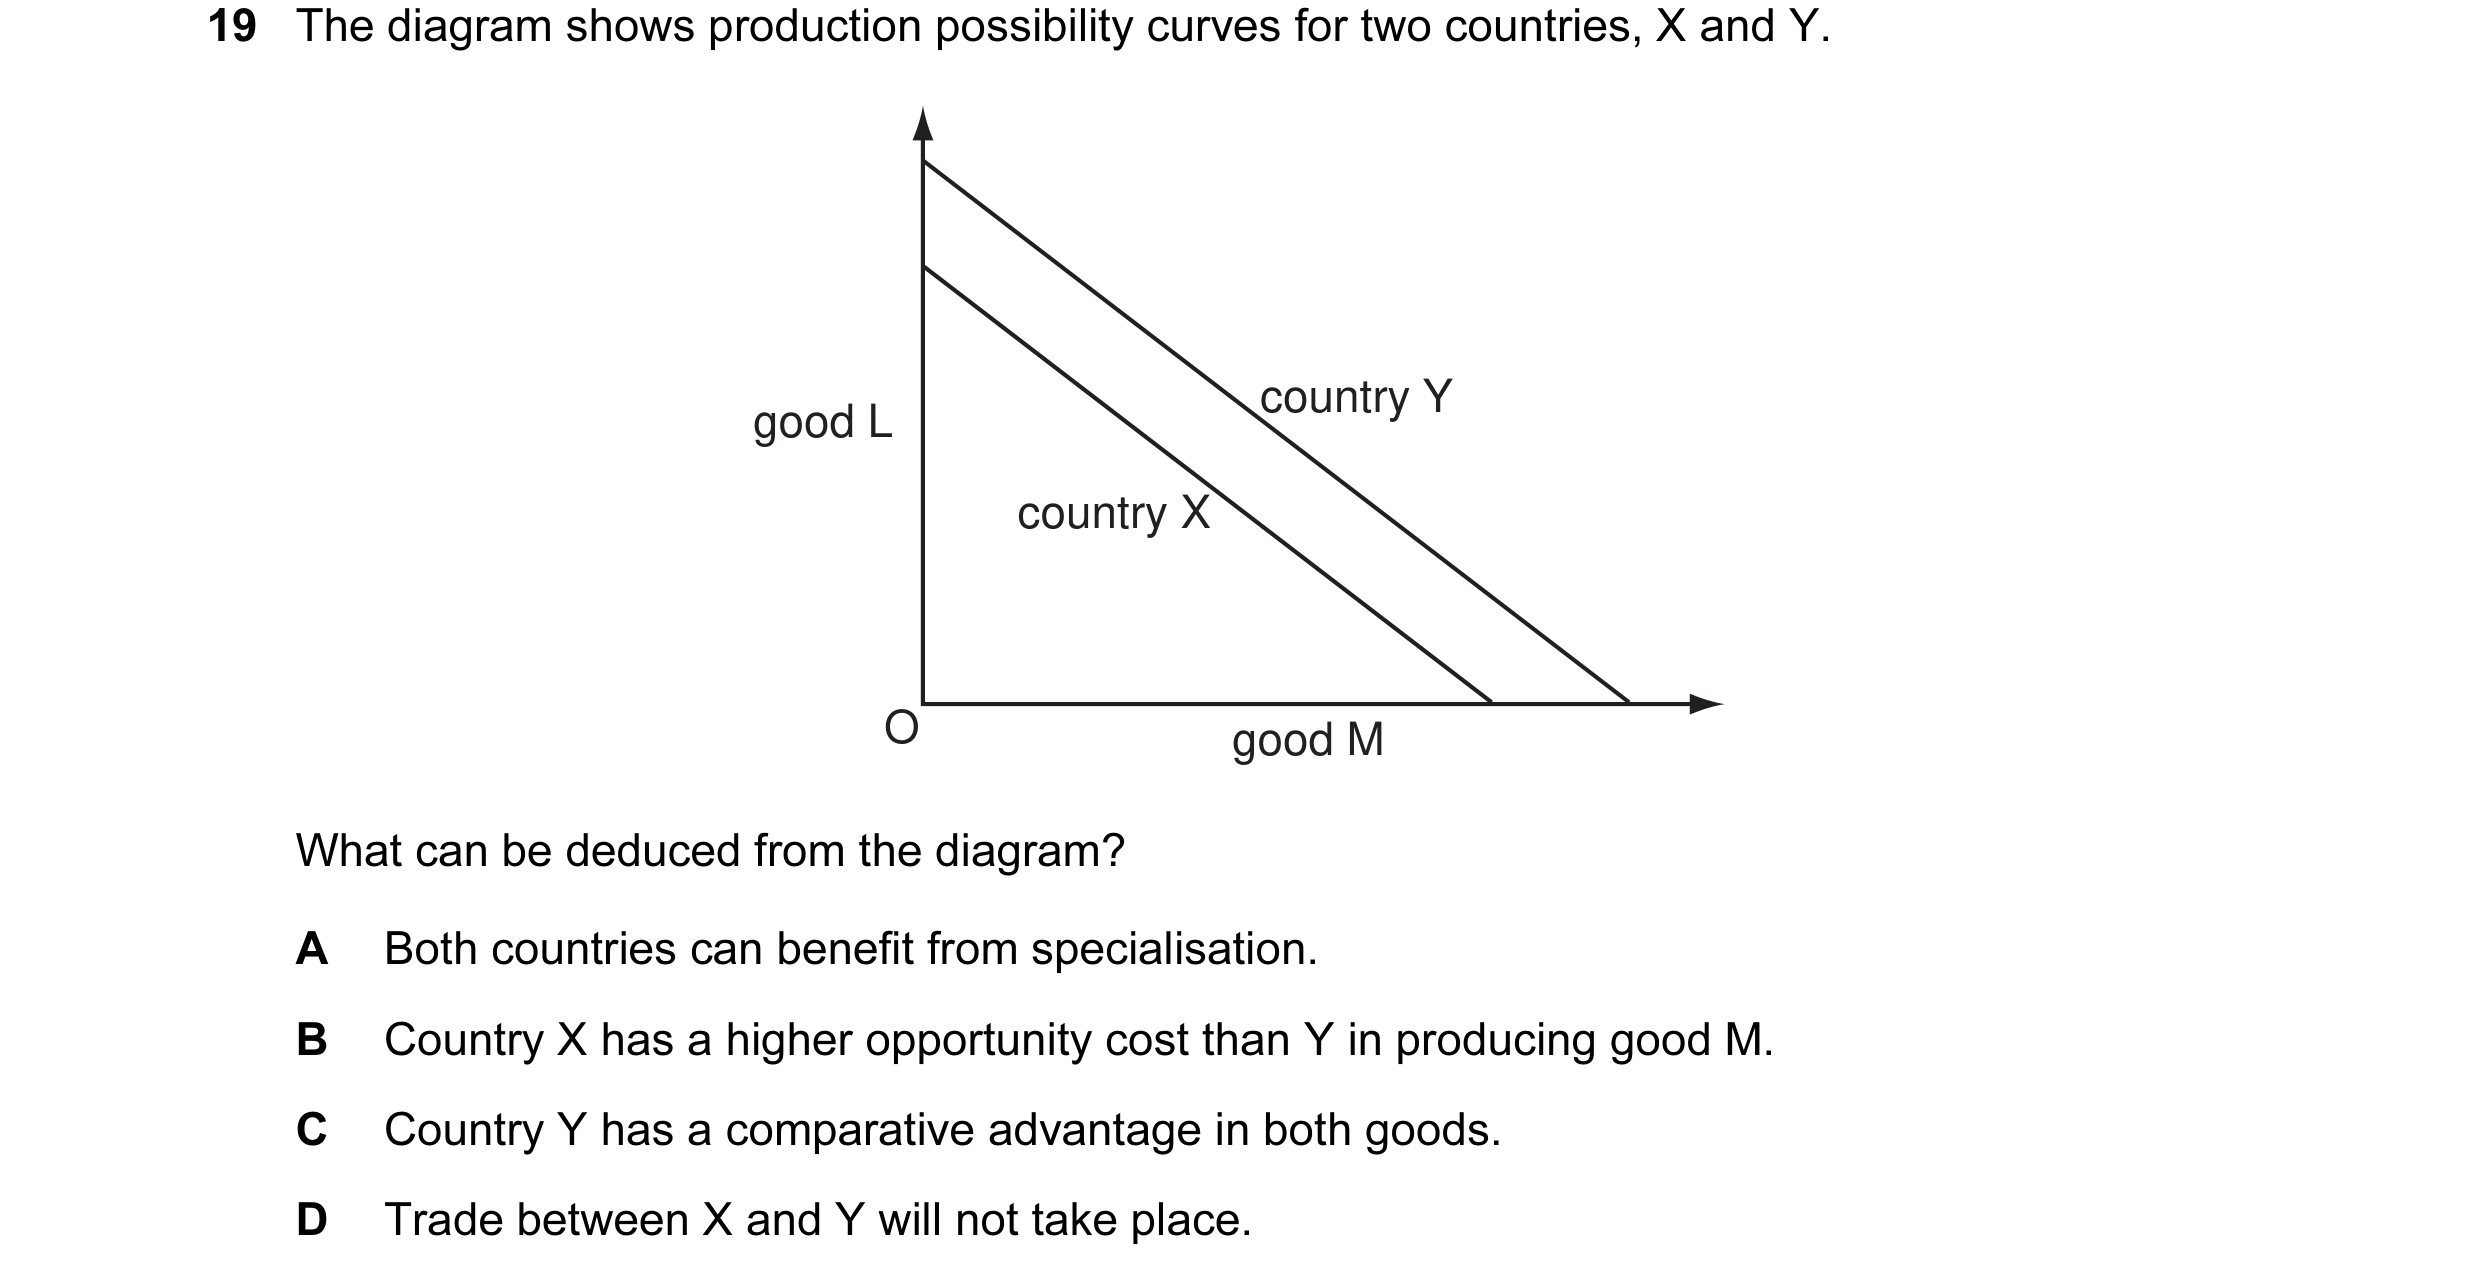
 7 / 59
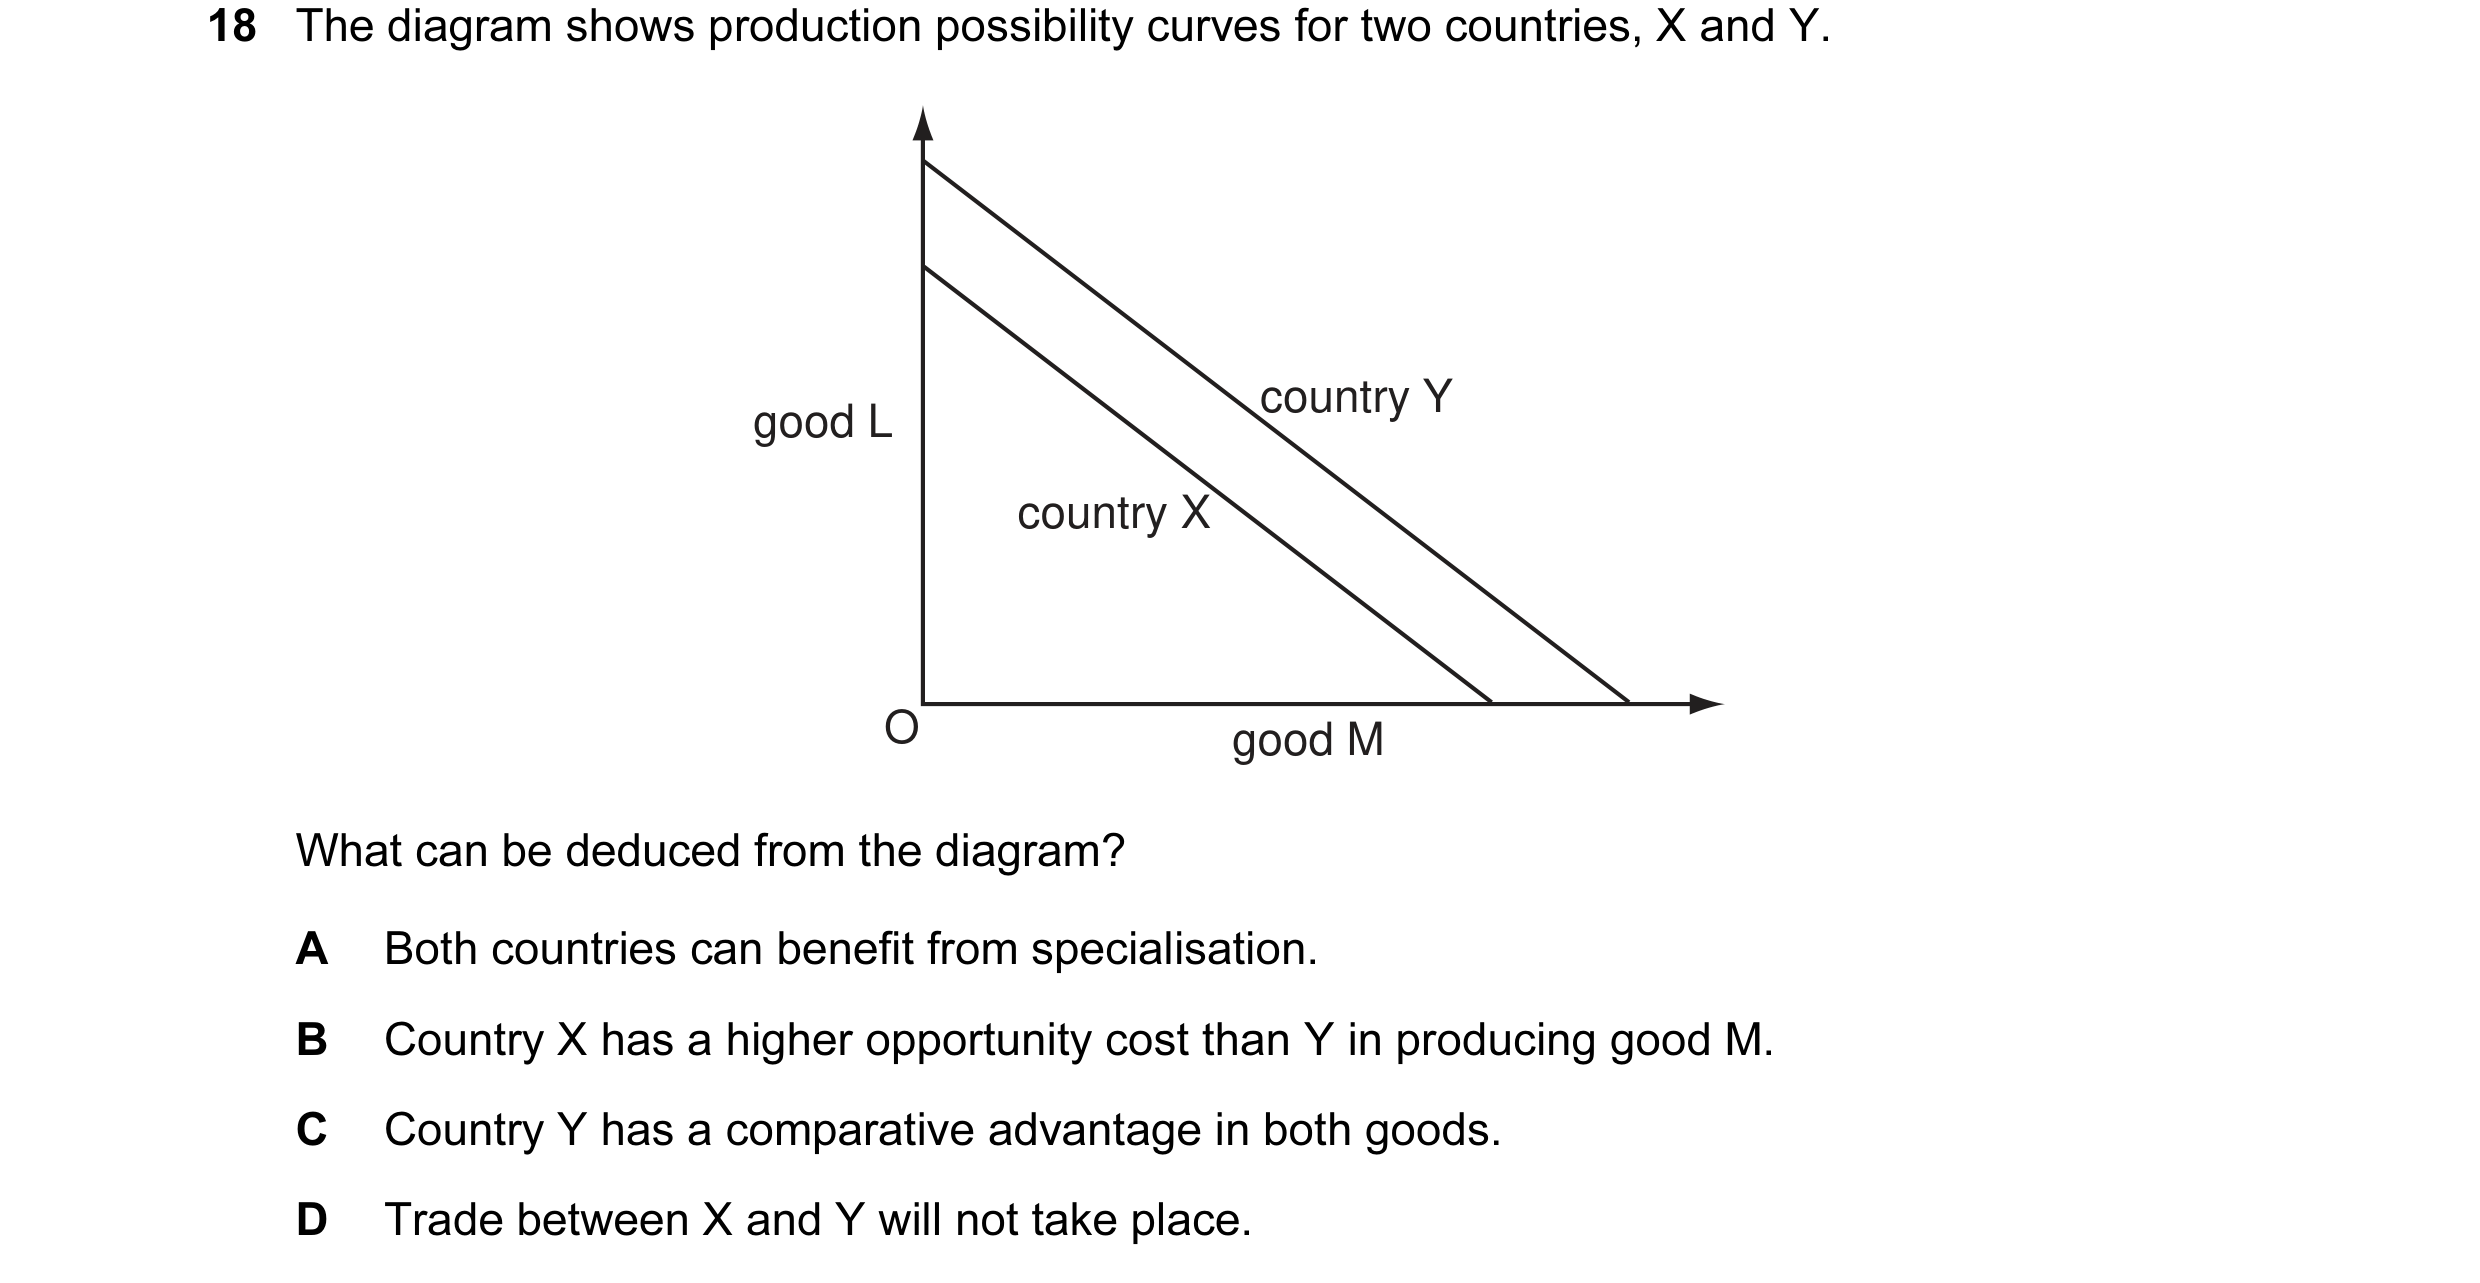
 8 / 59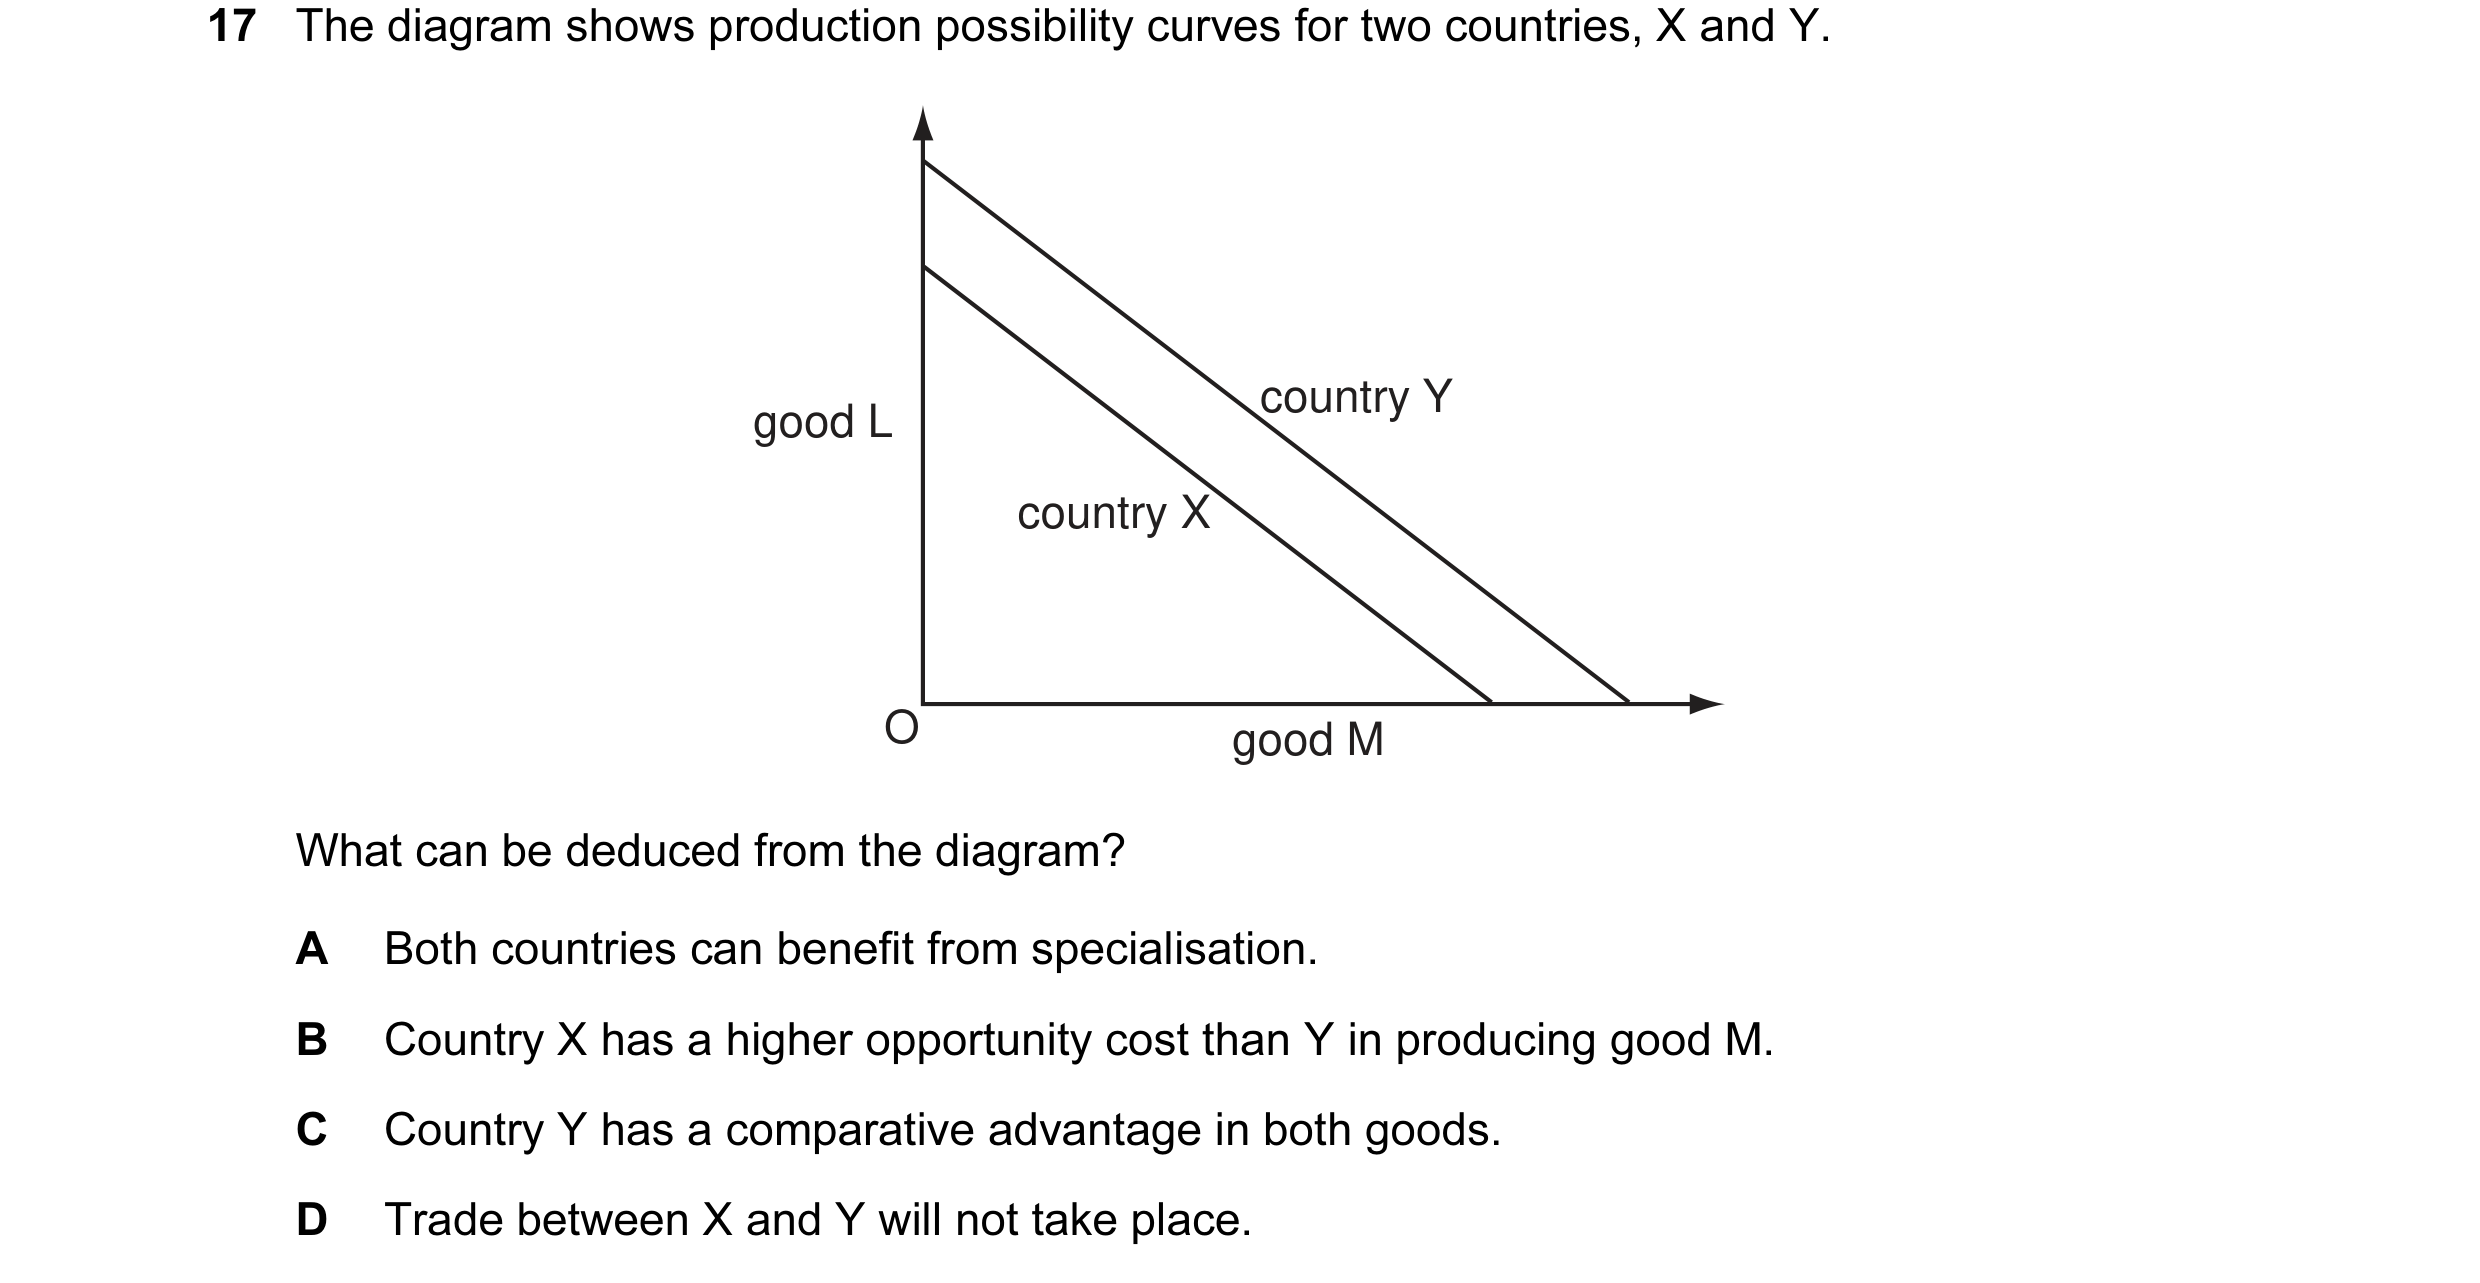
 9 / 59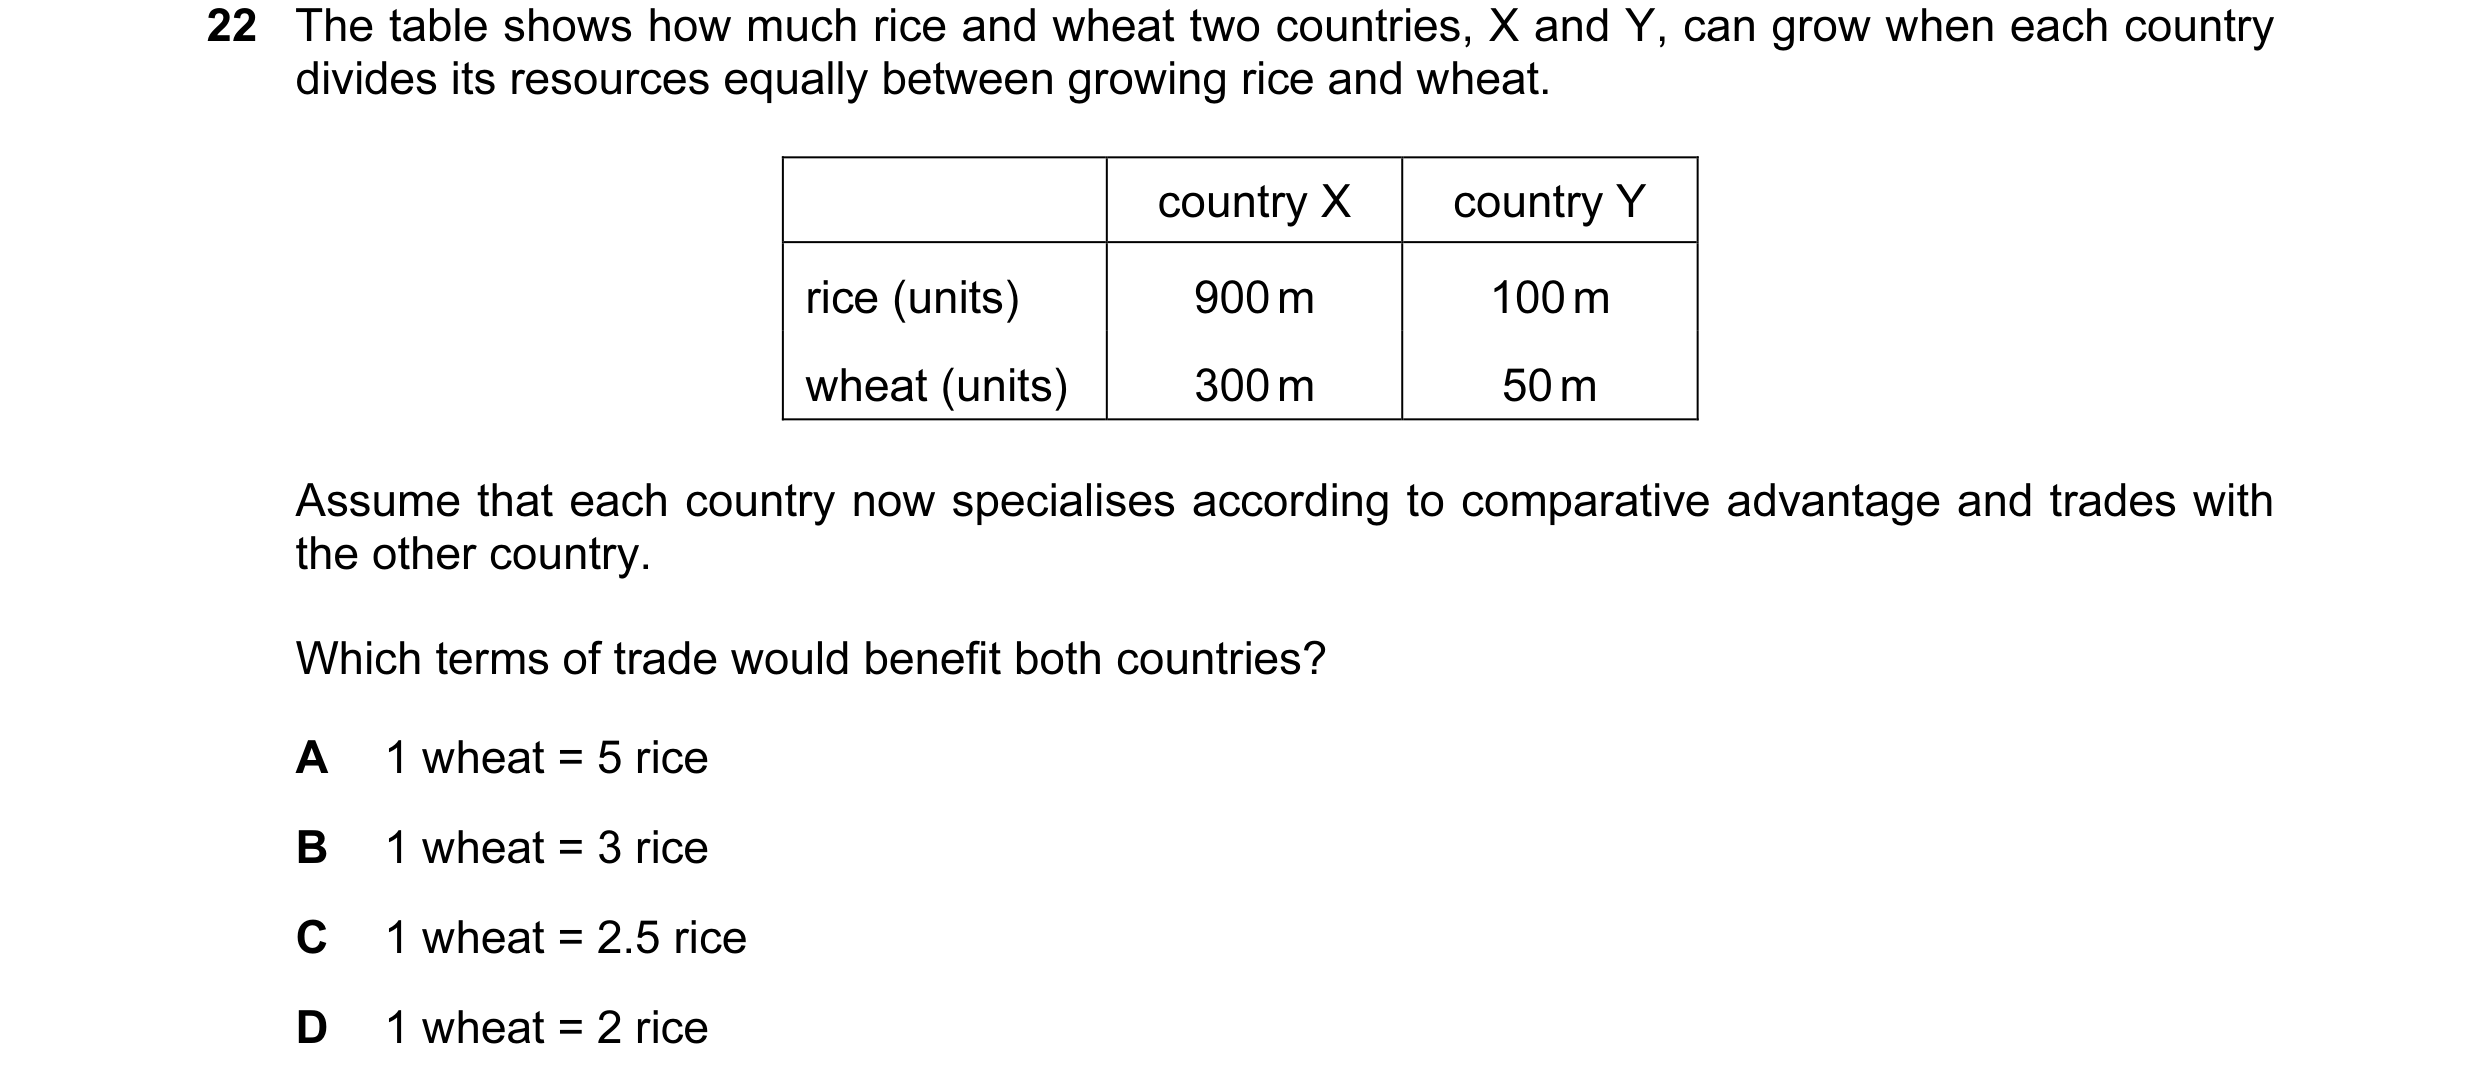
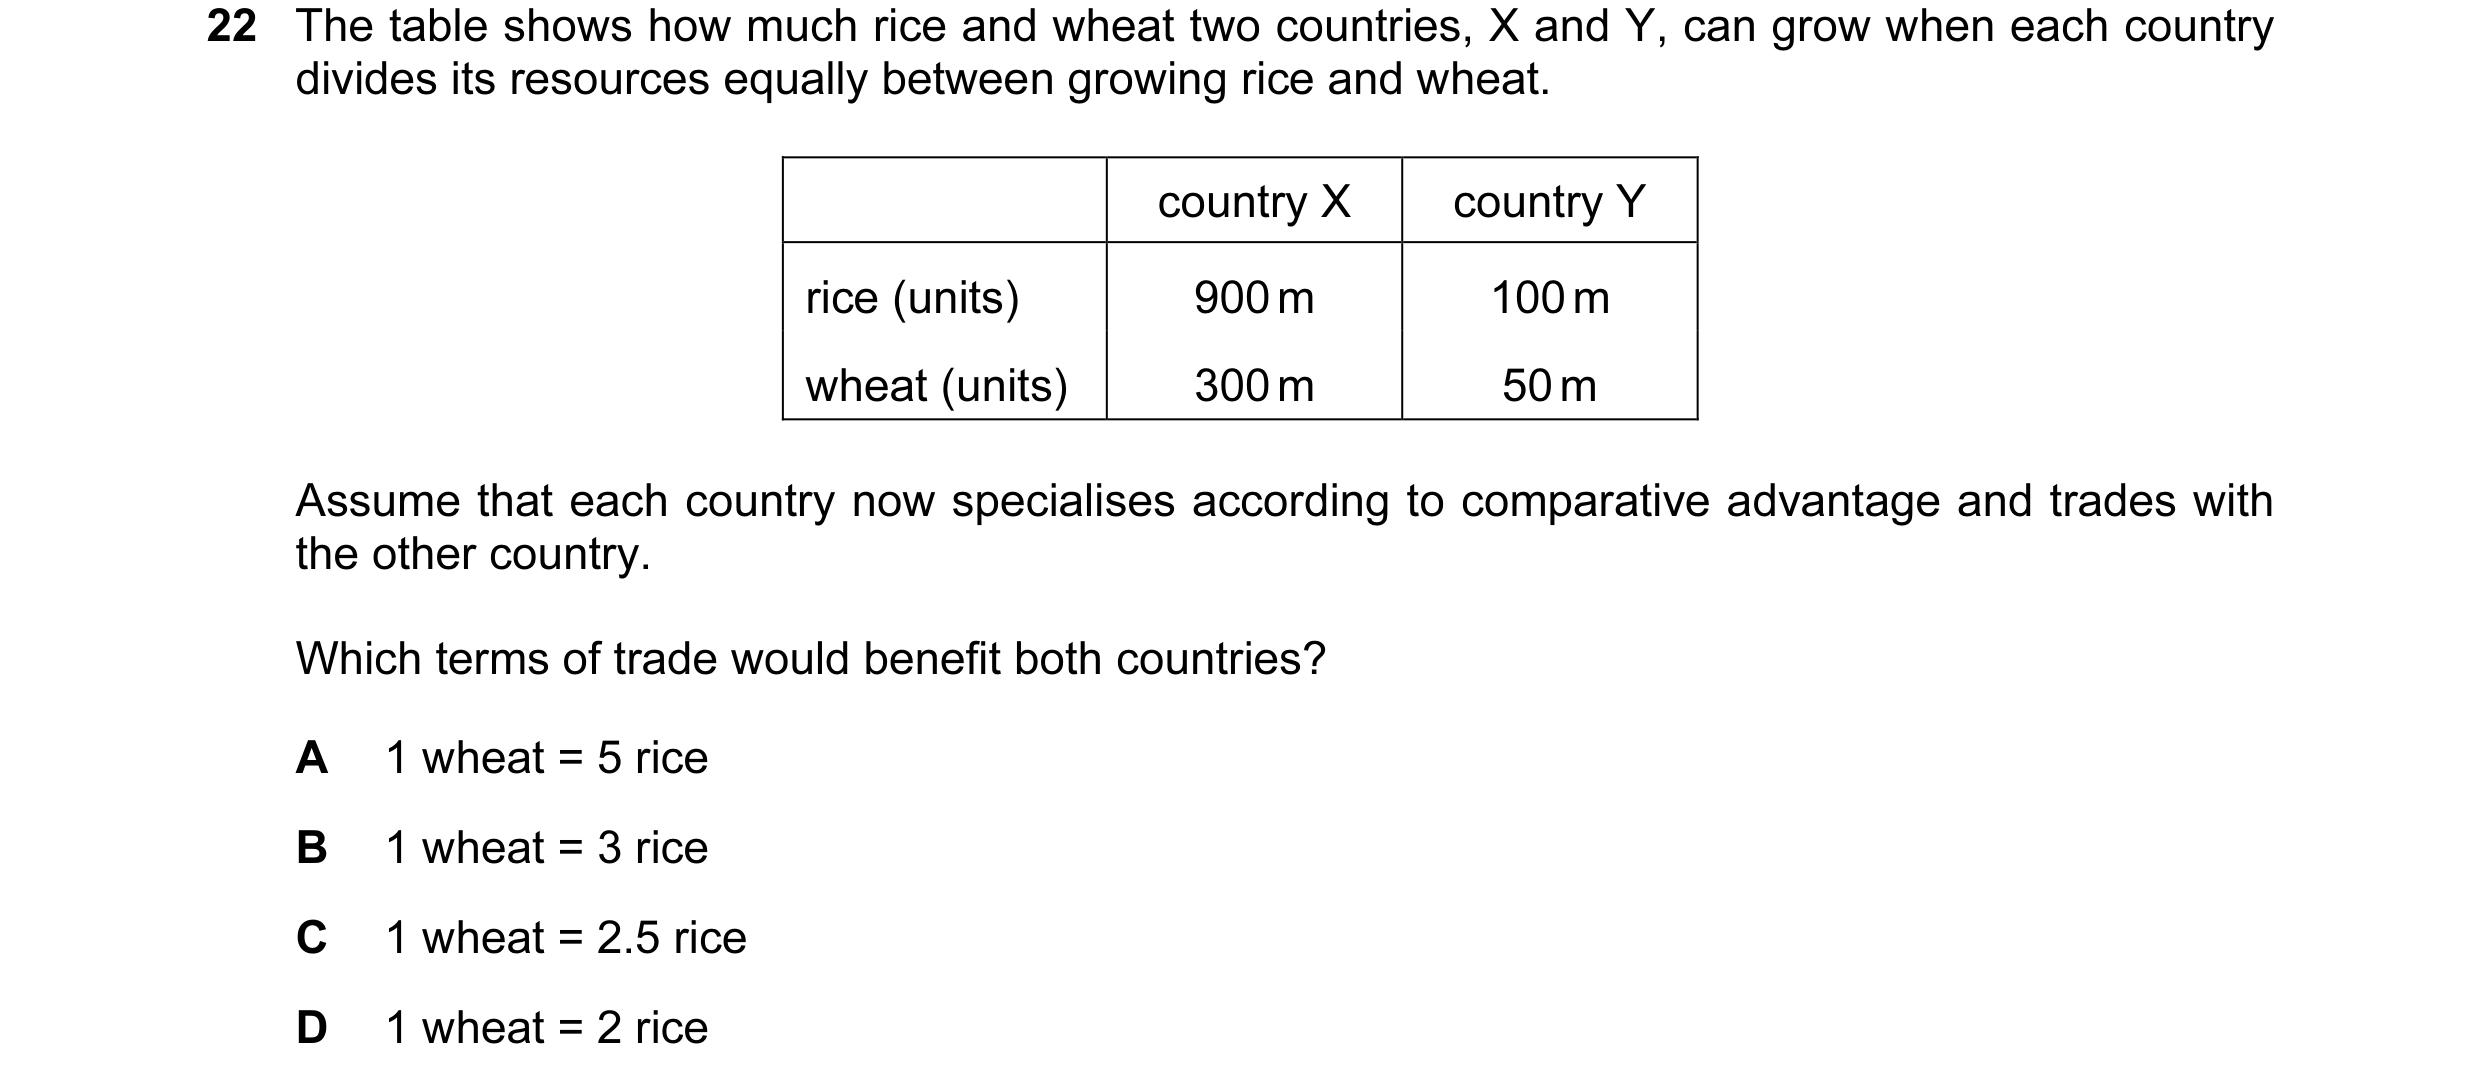
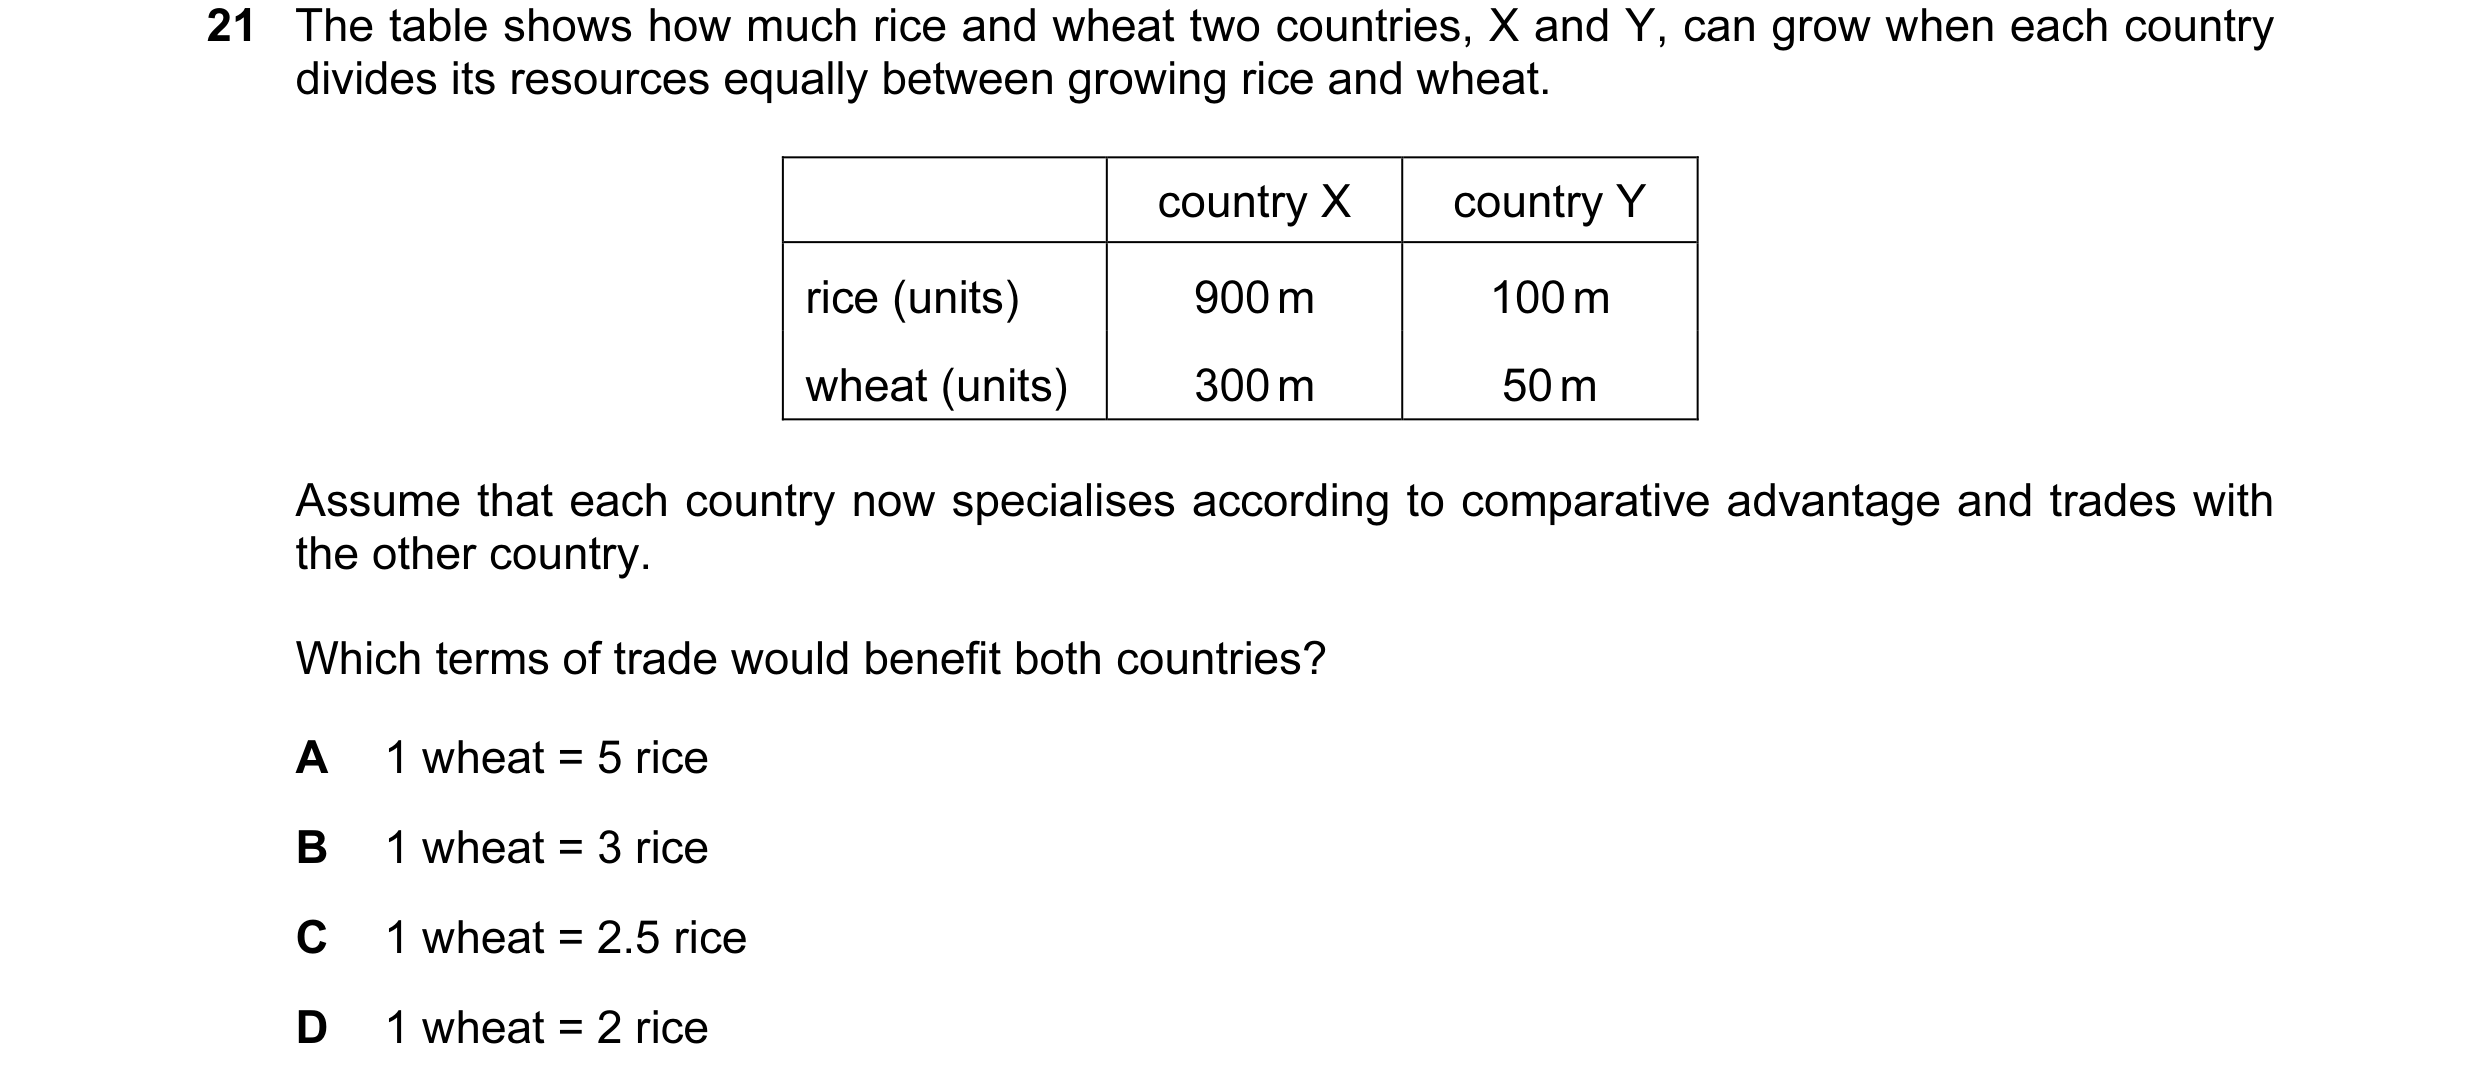 10 / 59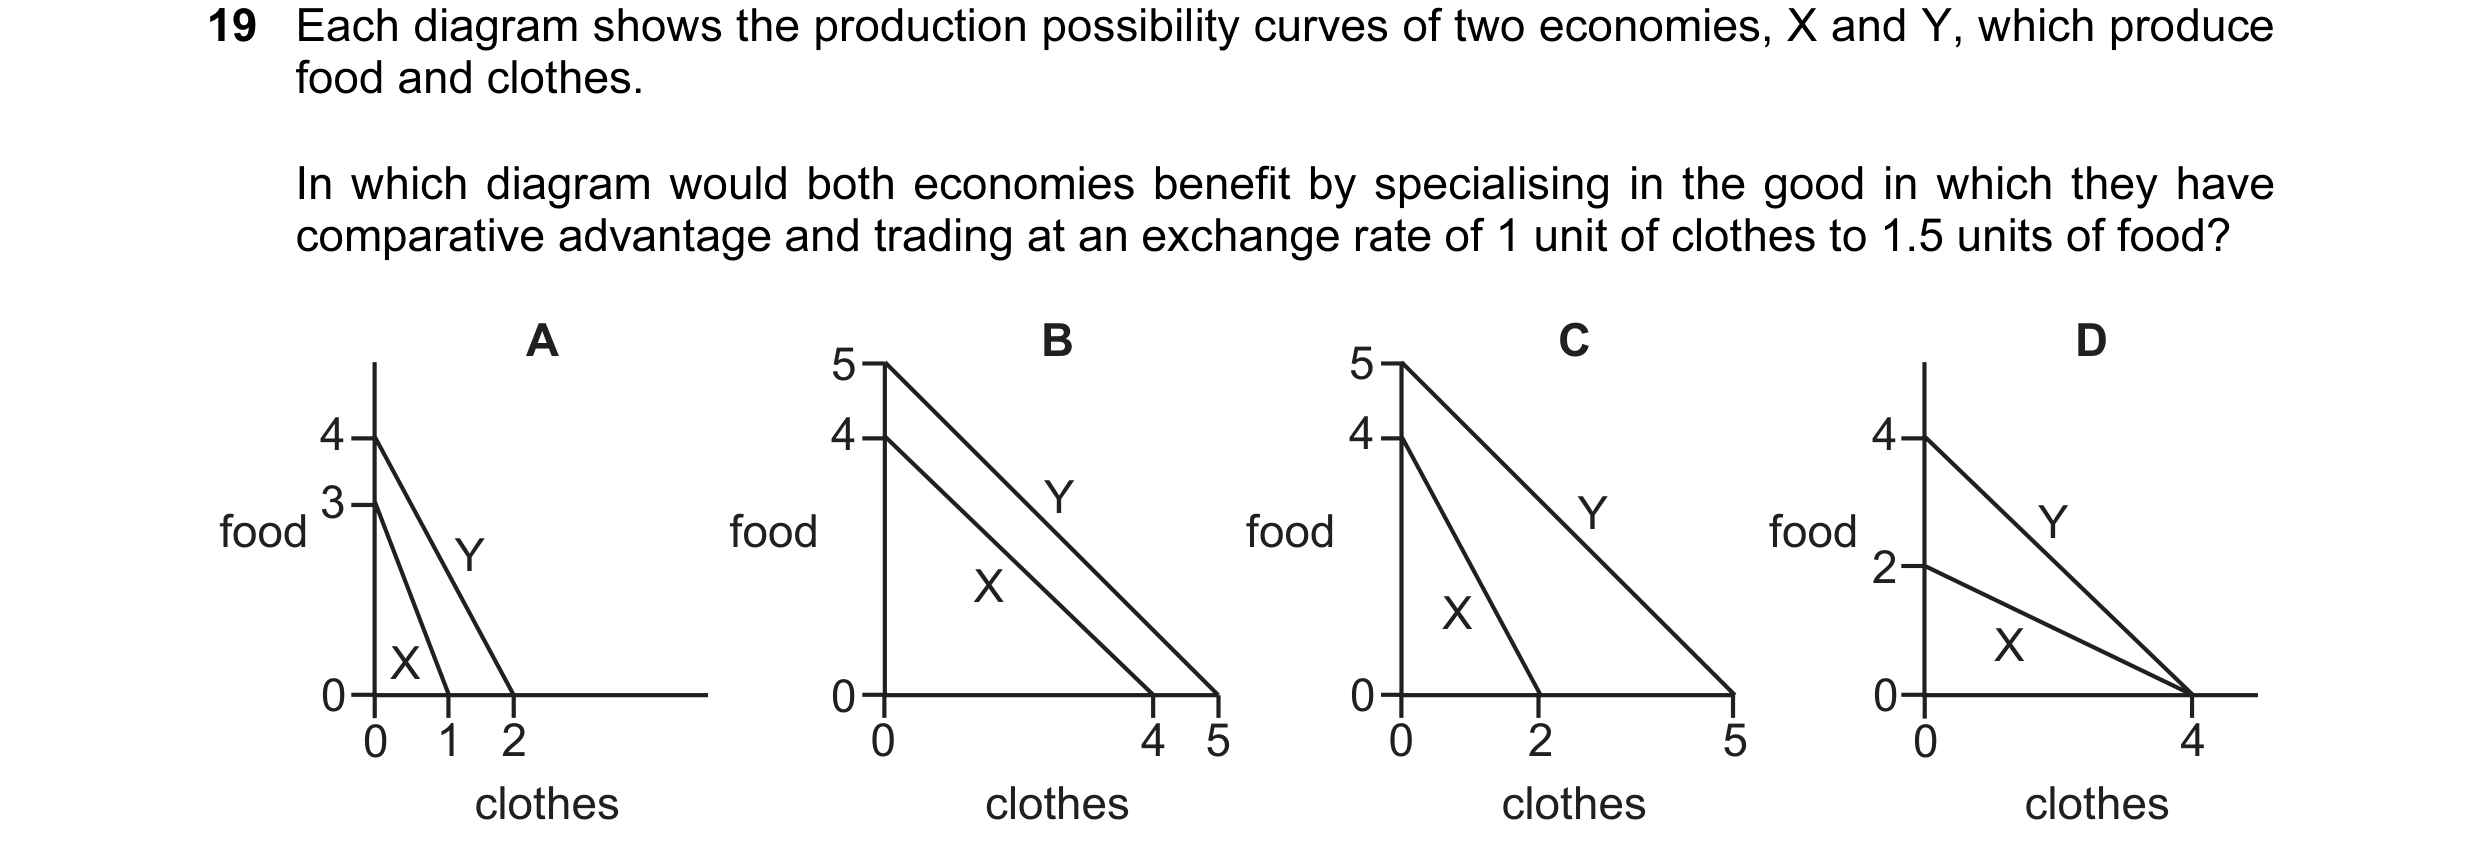
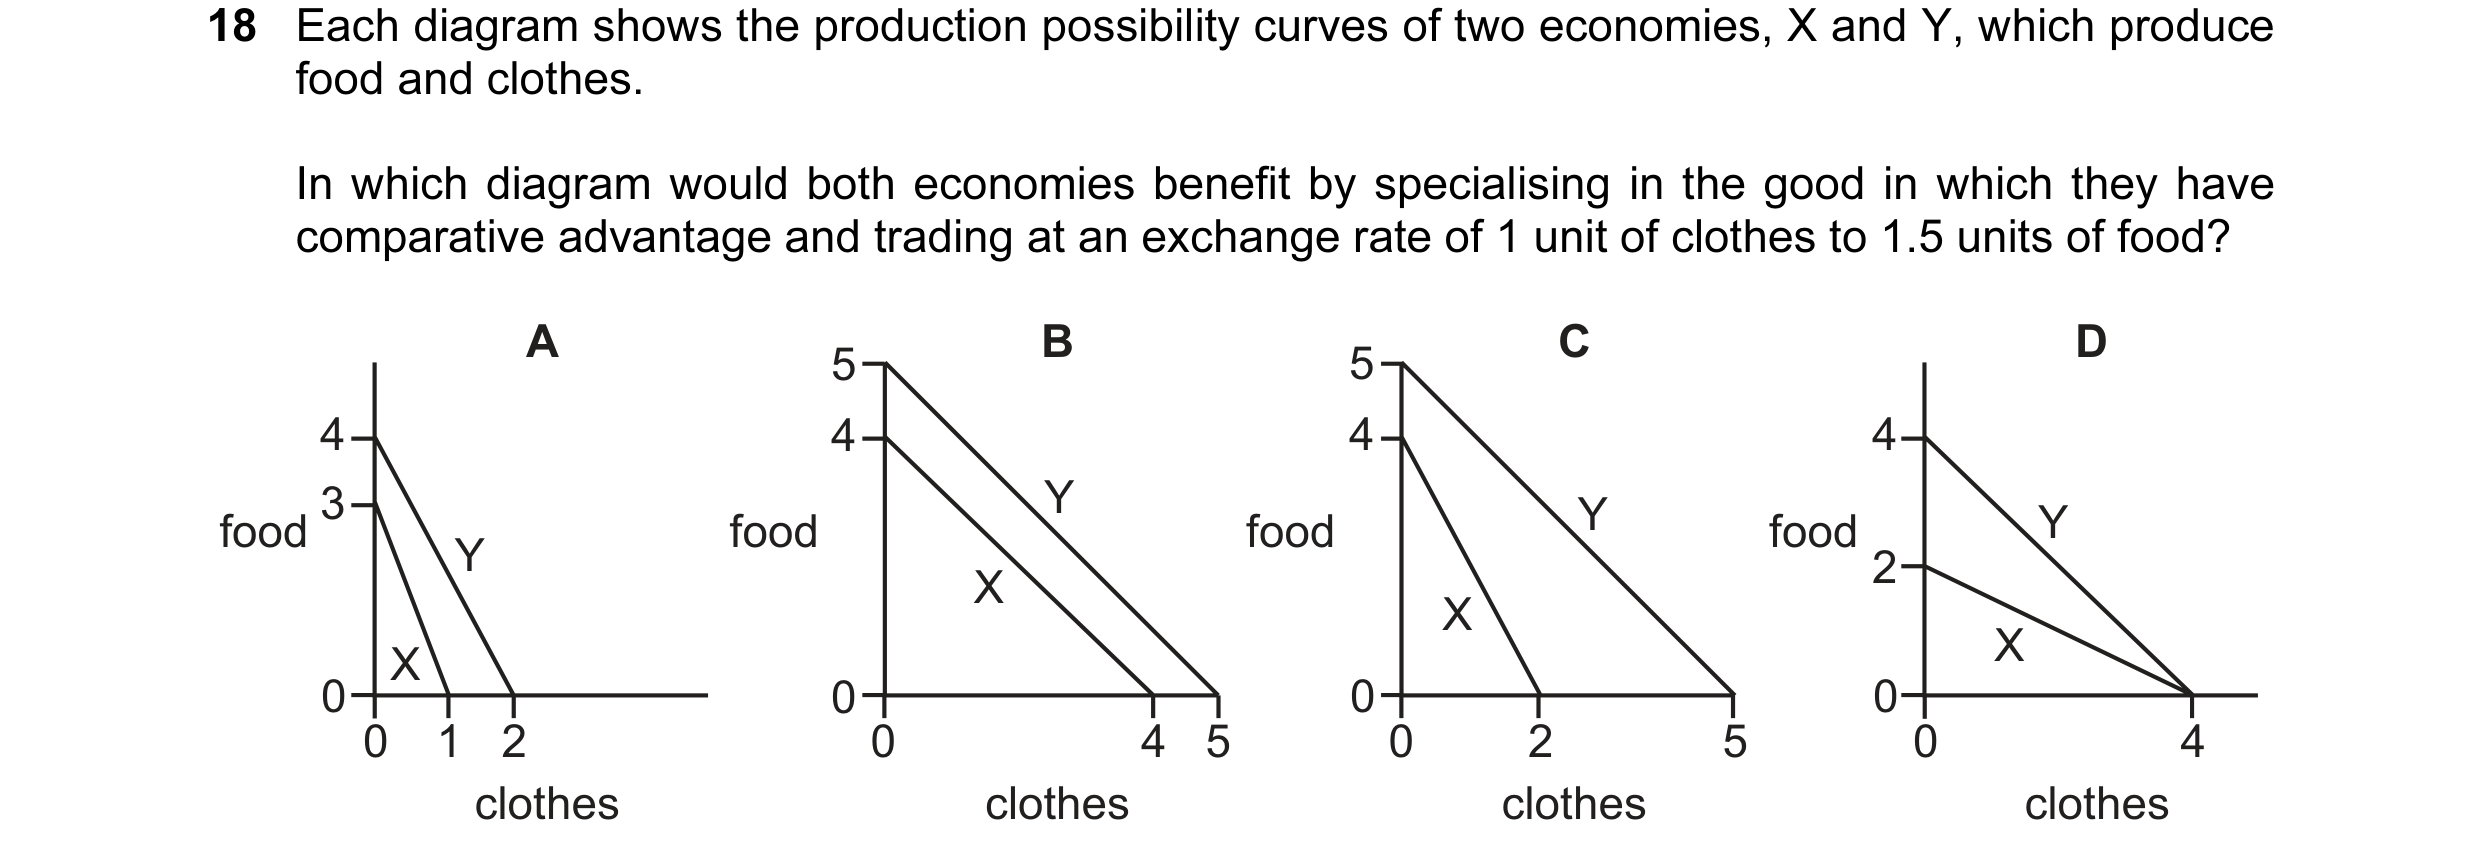
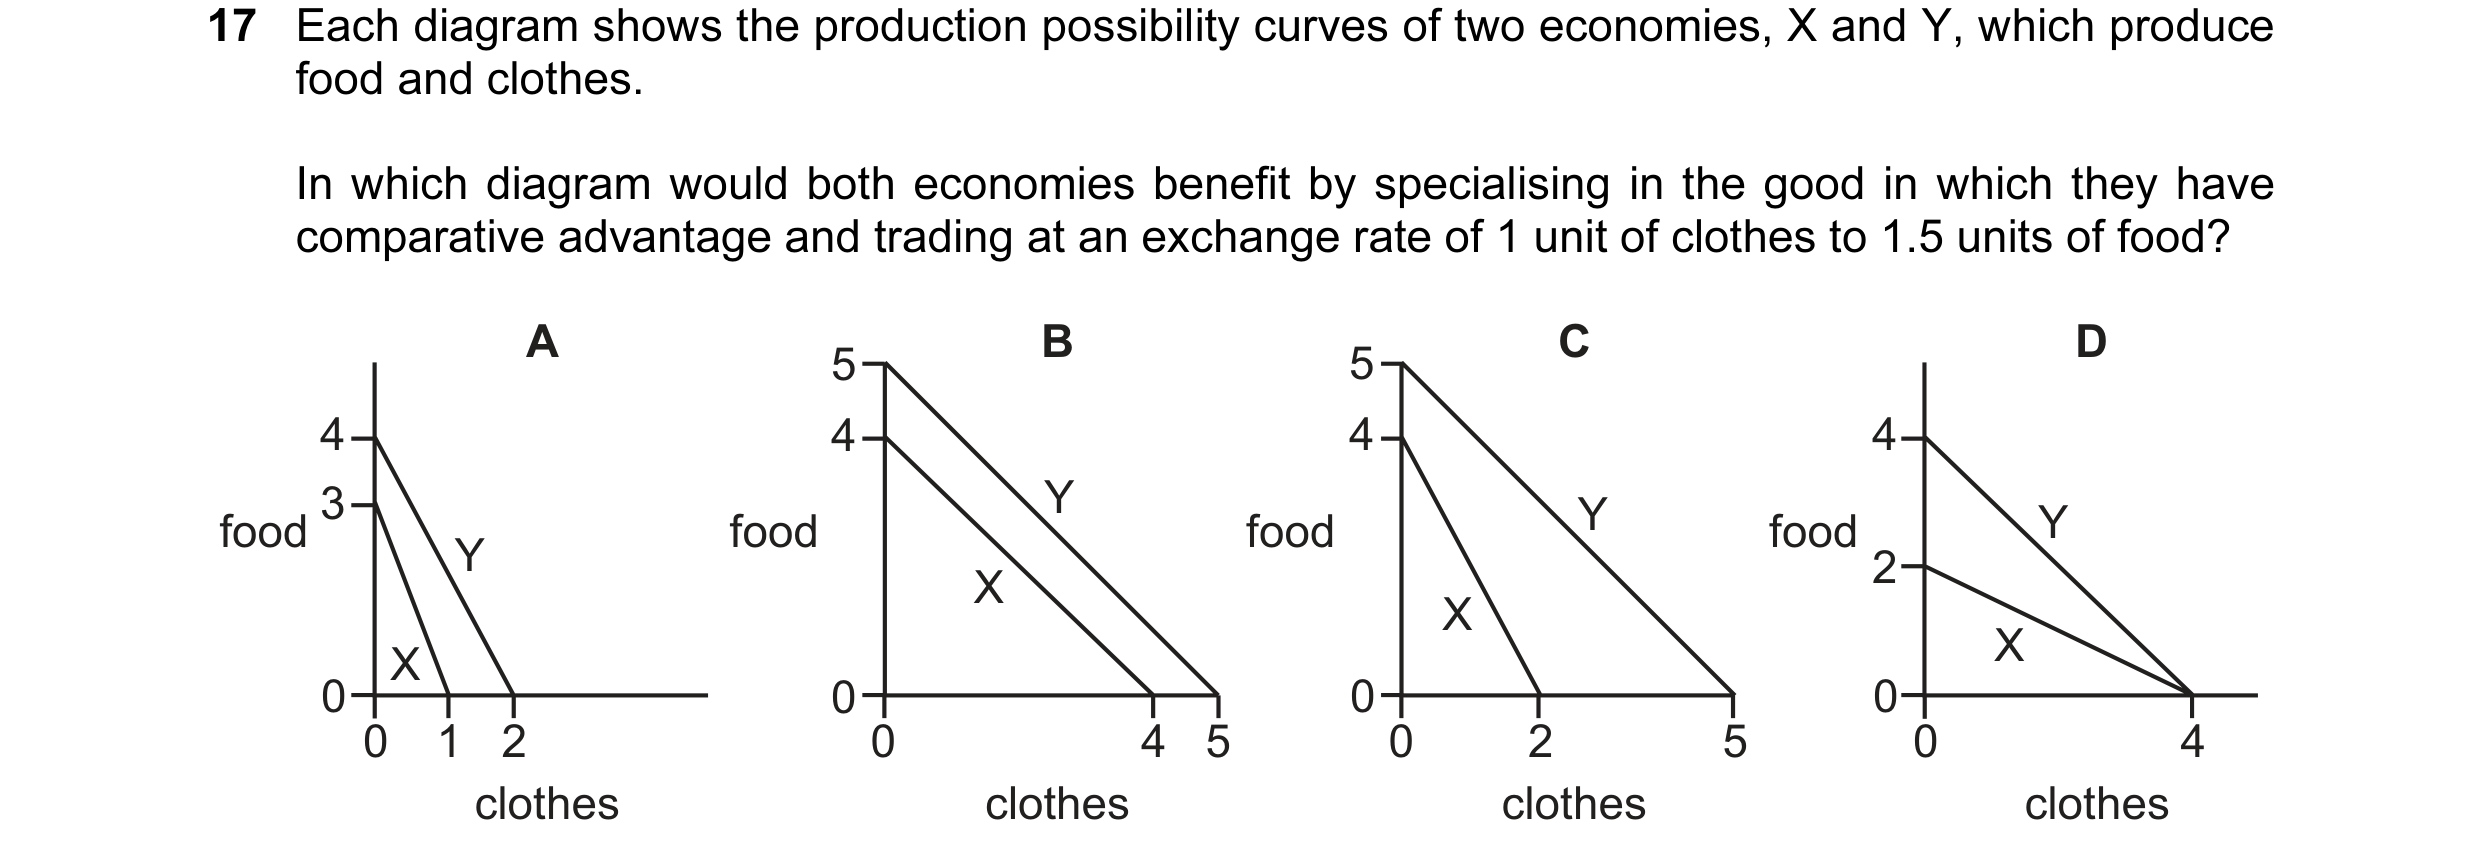
 11 / 59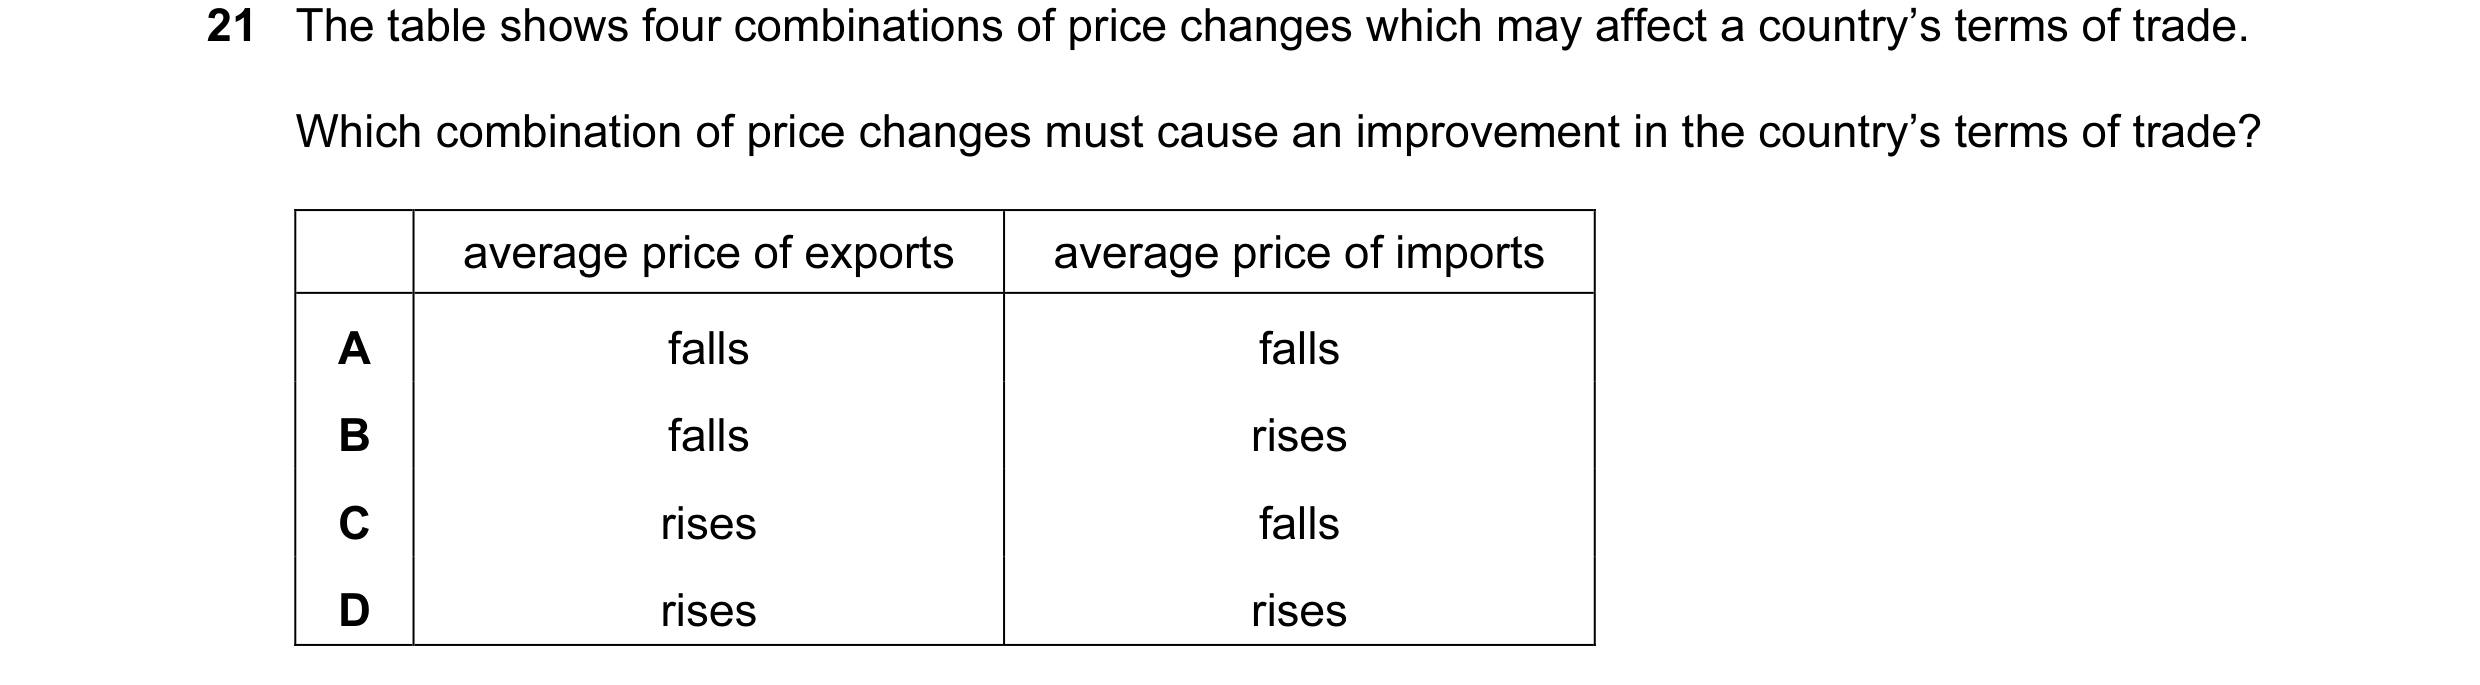
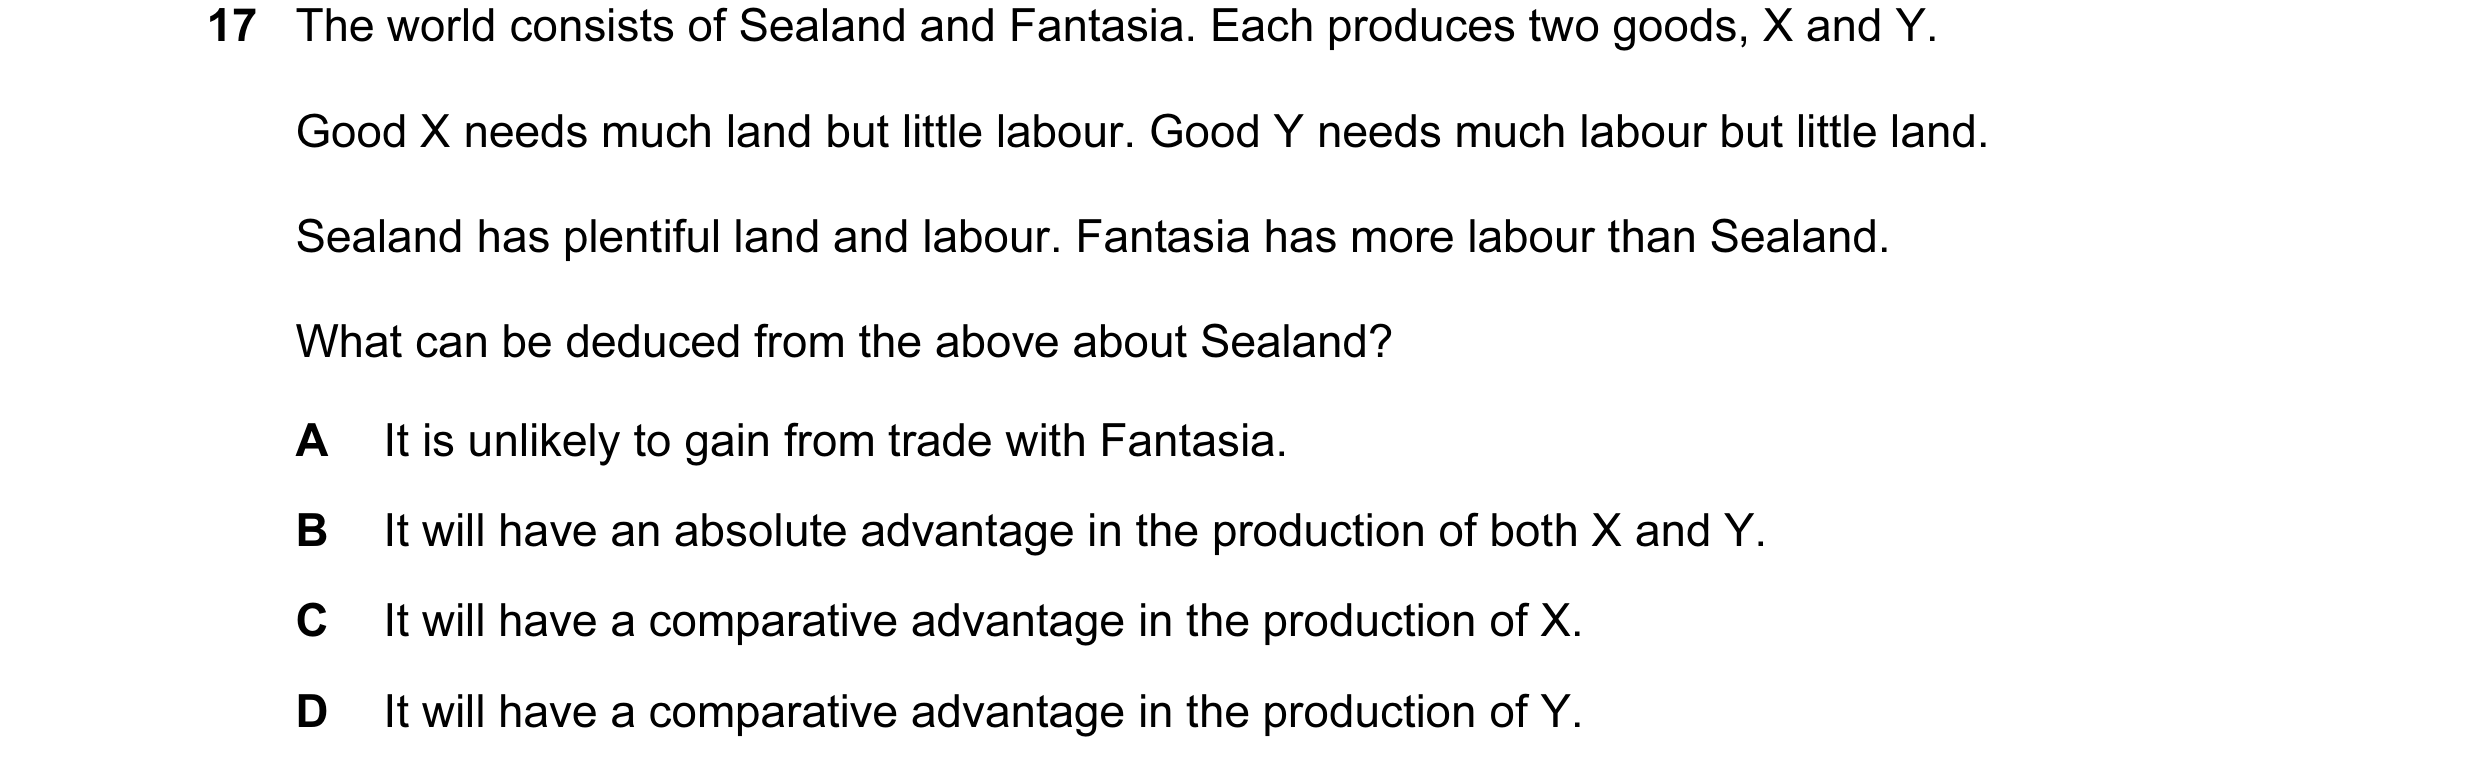
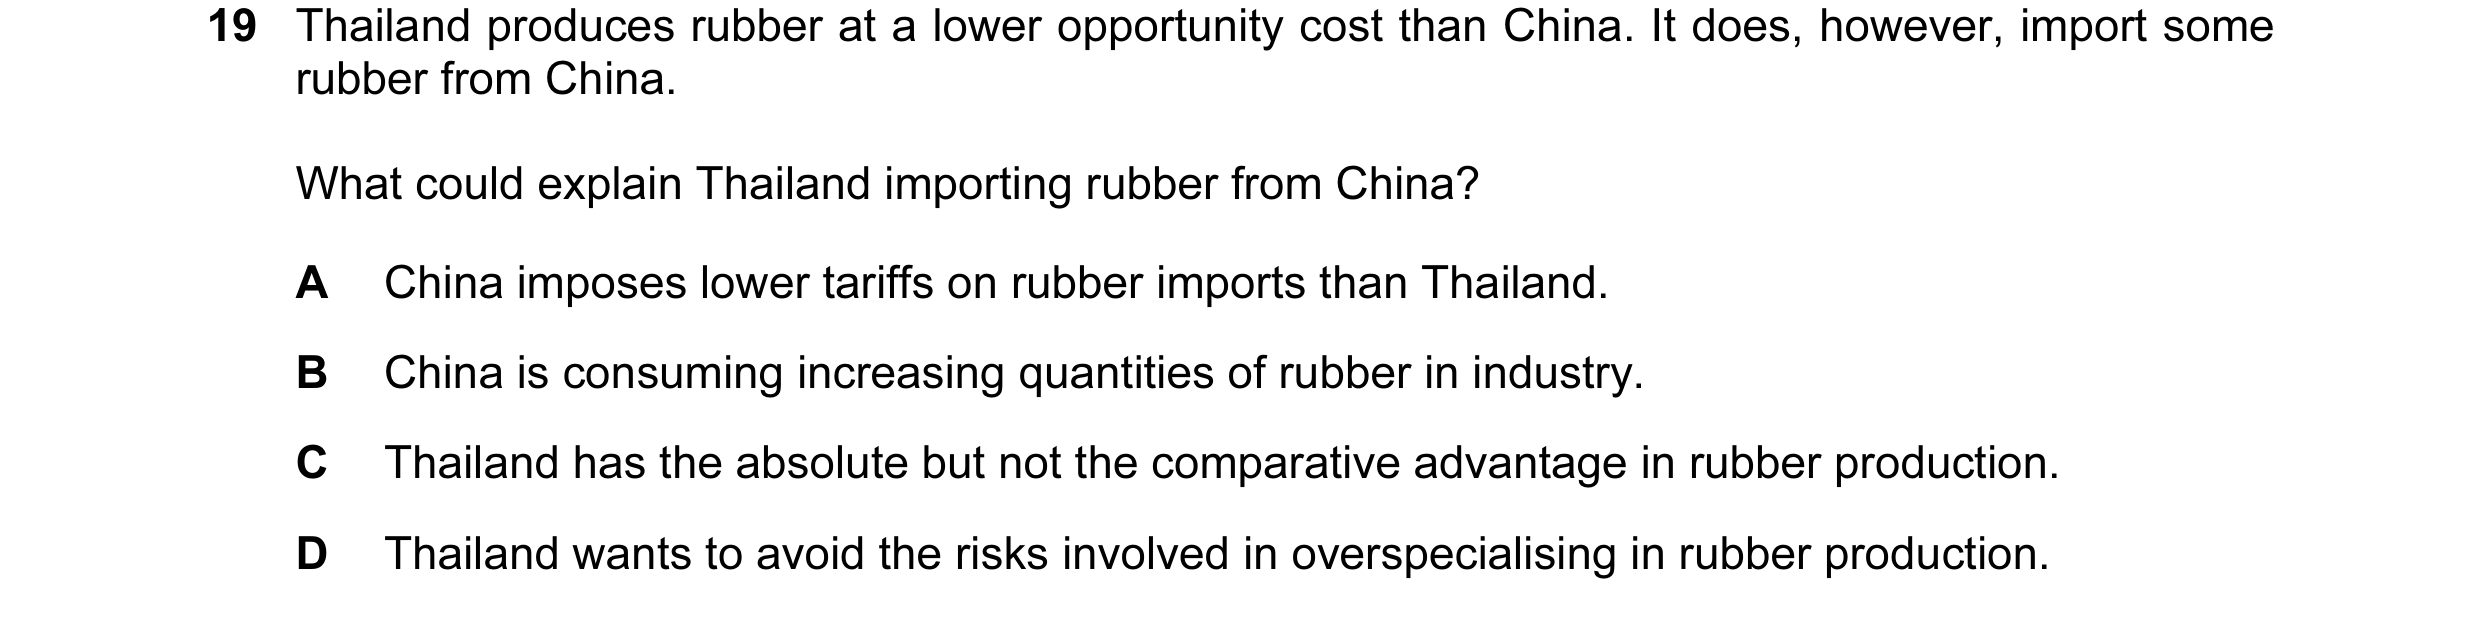 12 / 59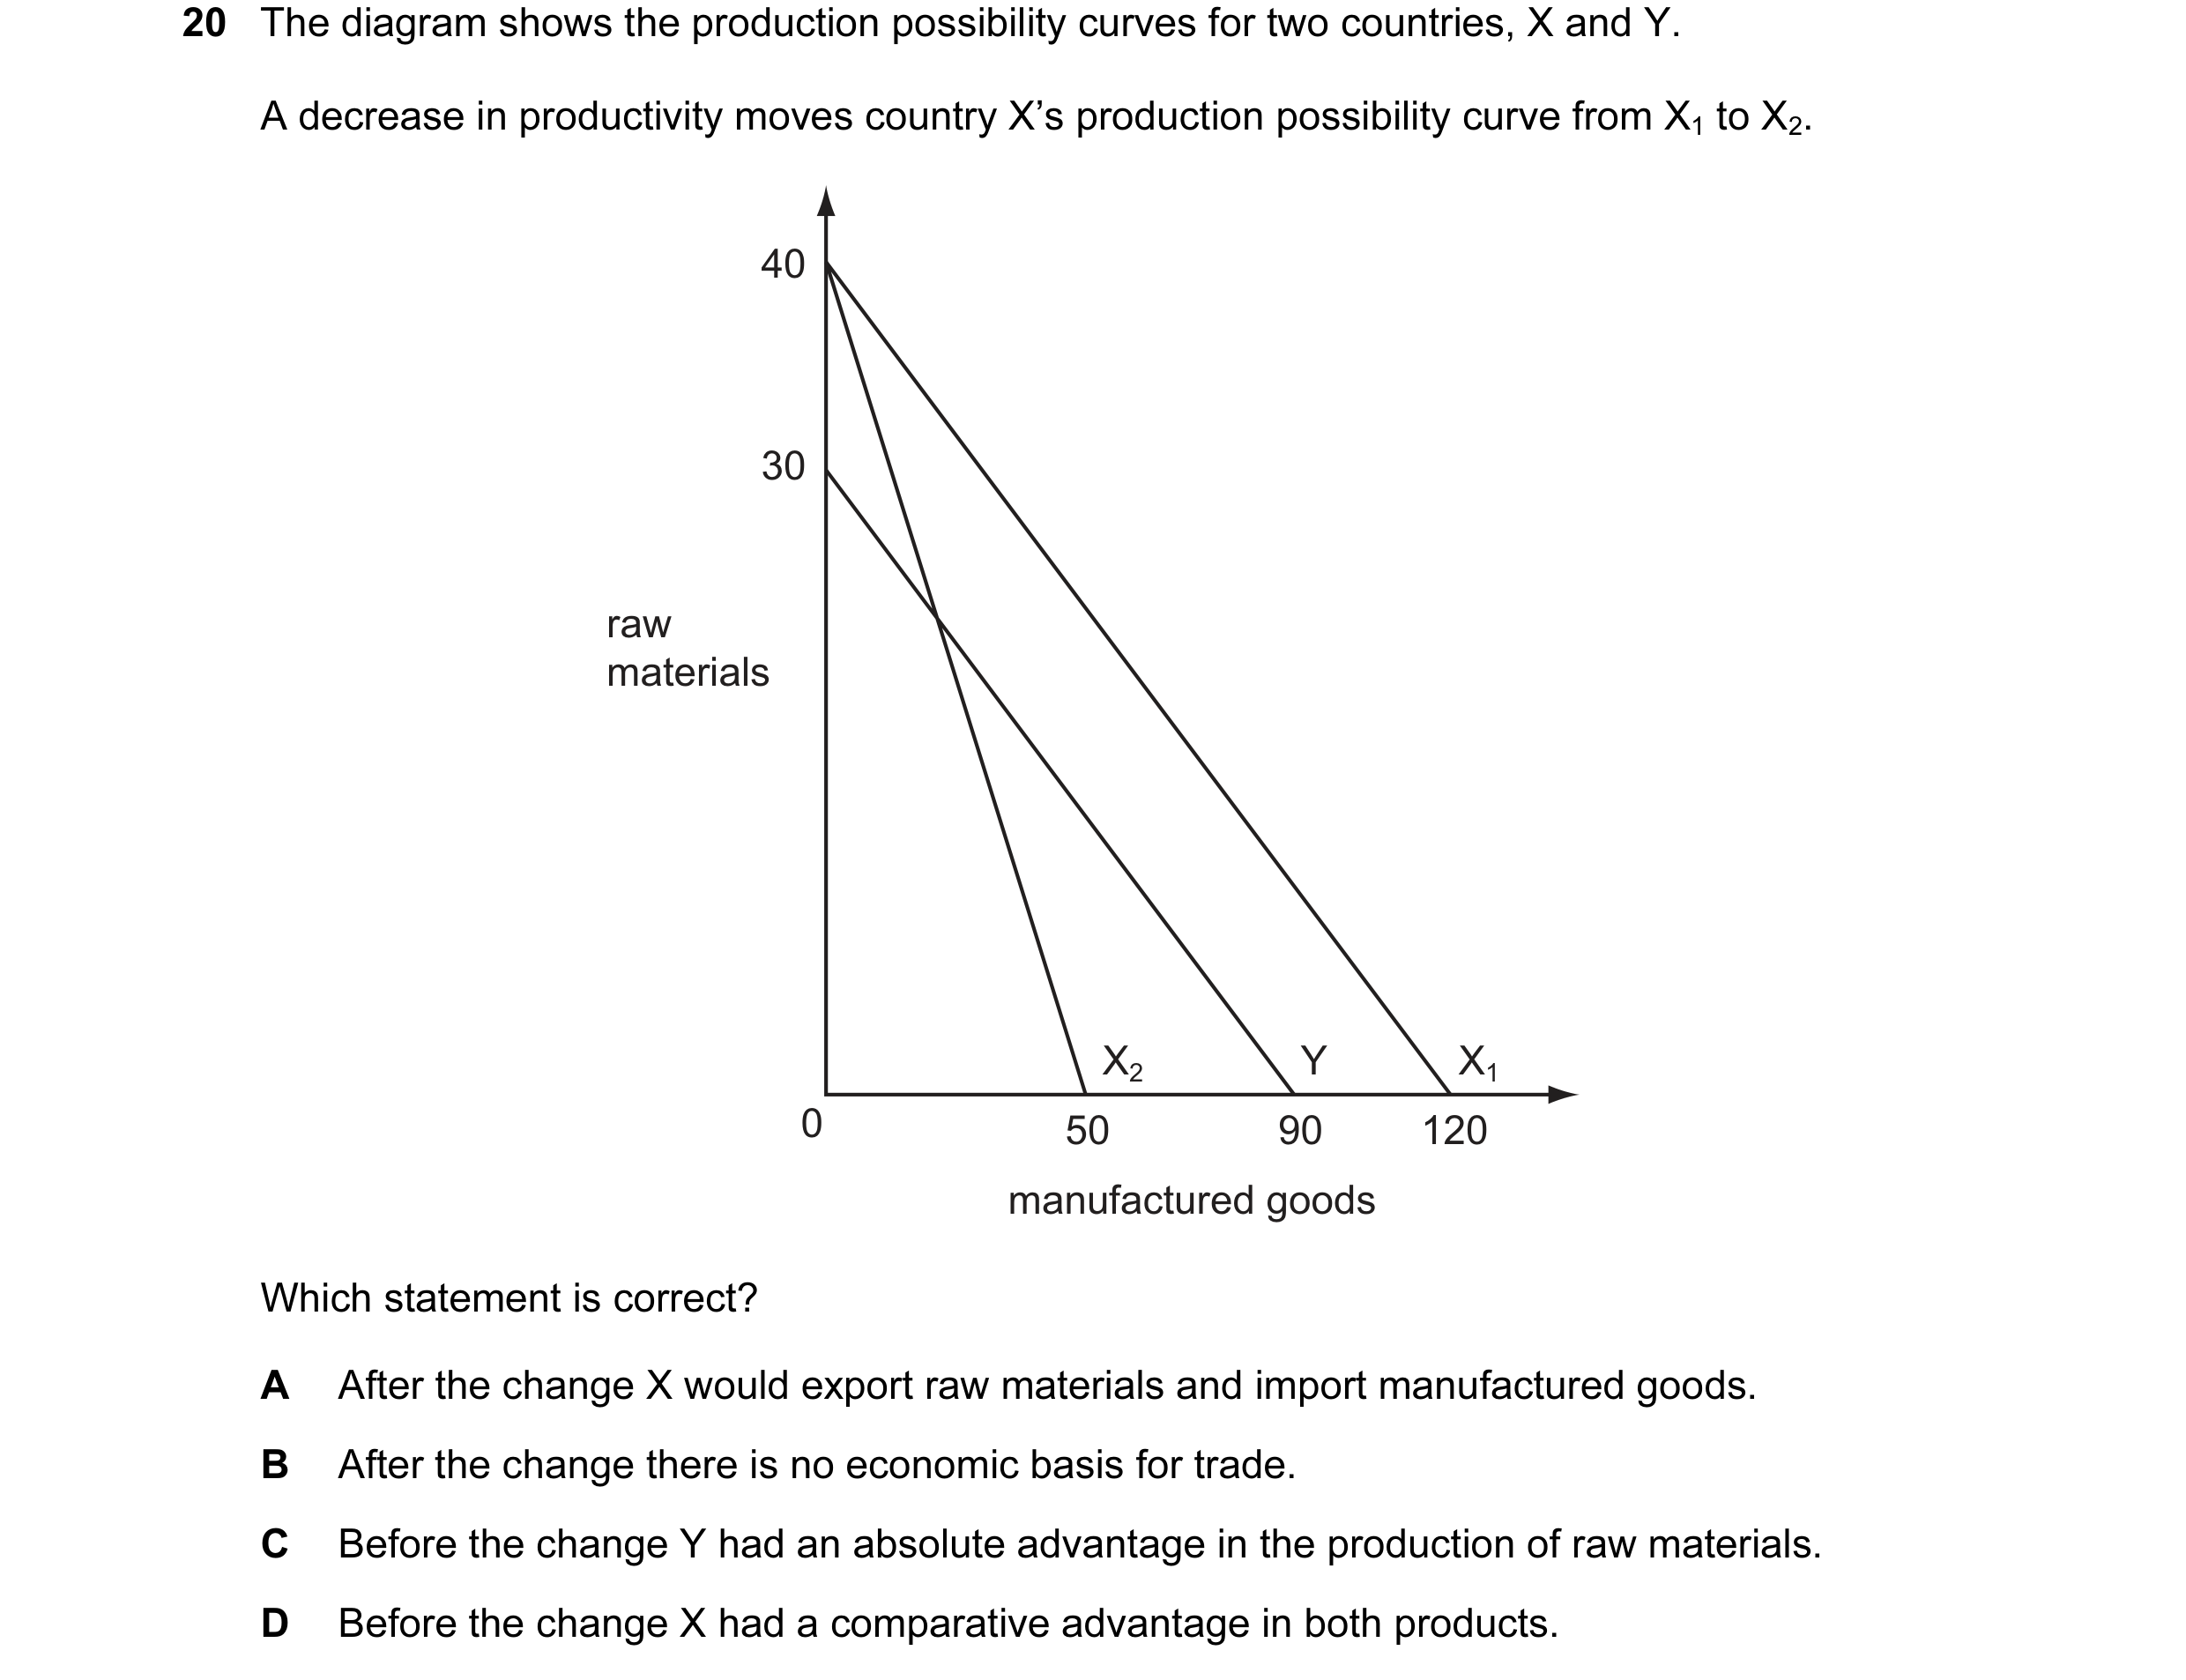
 13 / 59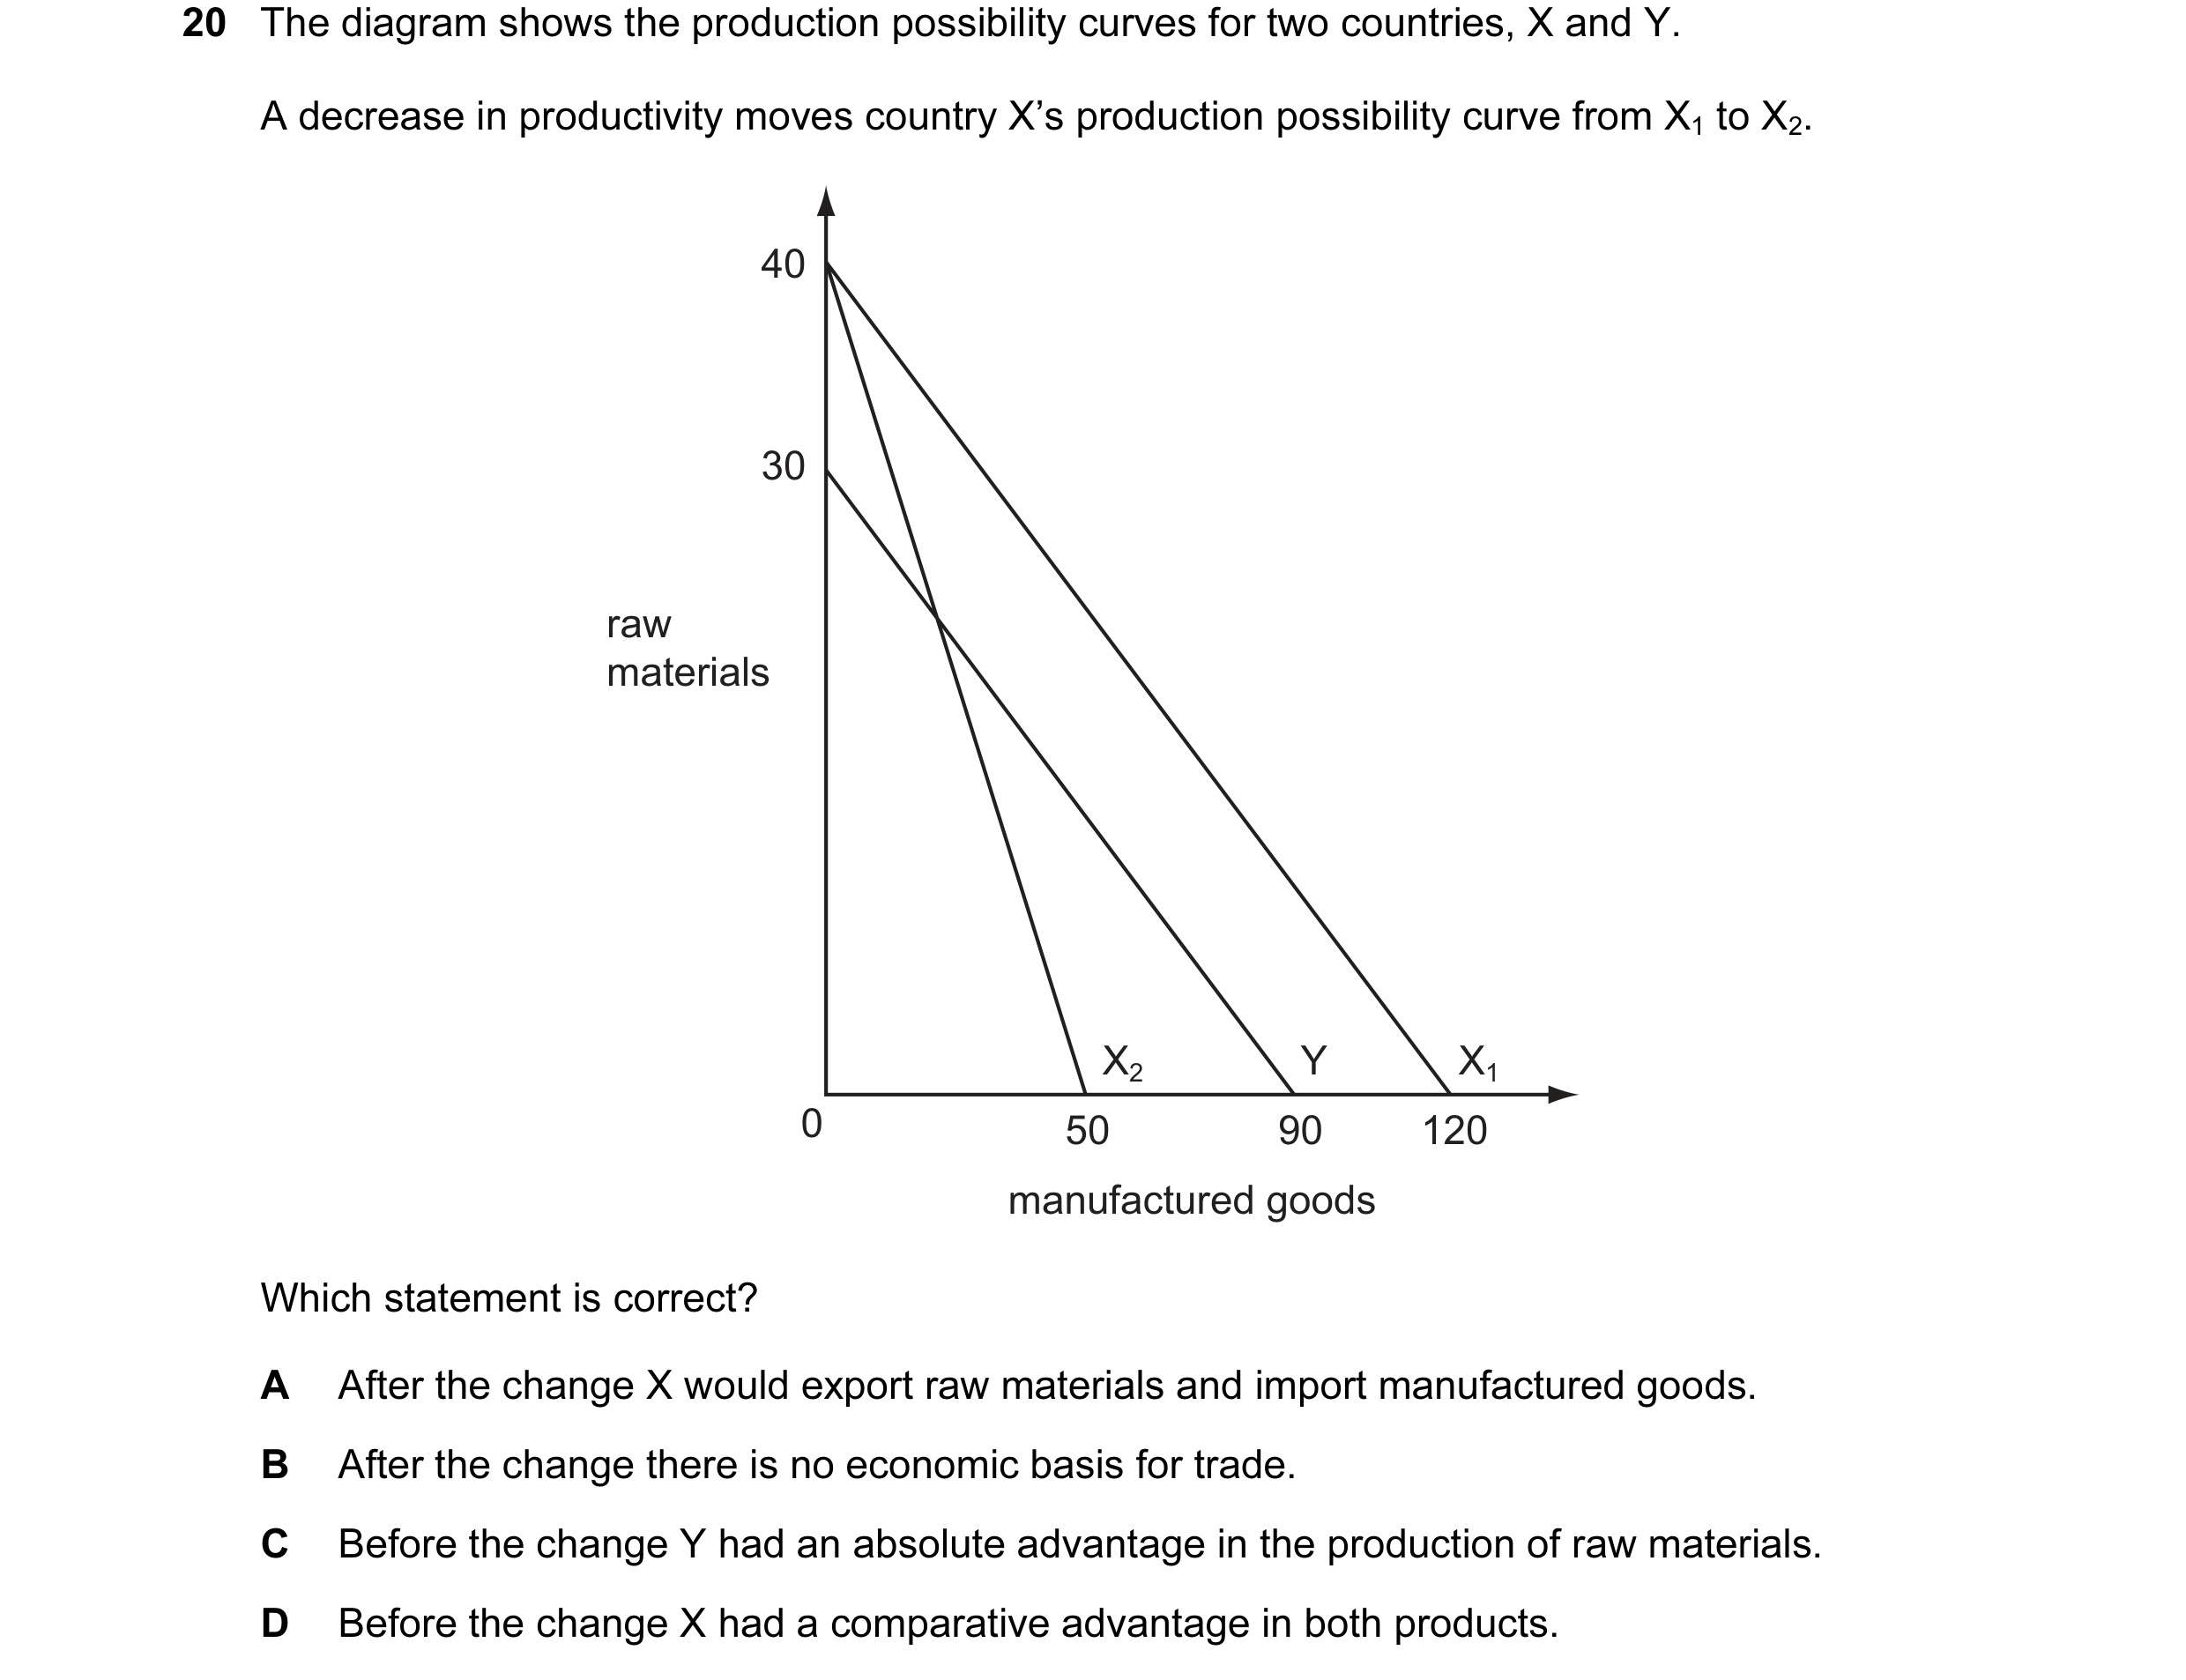
 14 / 59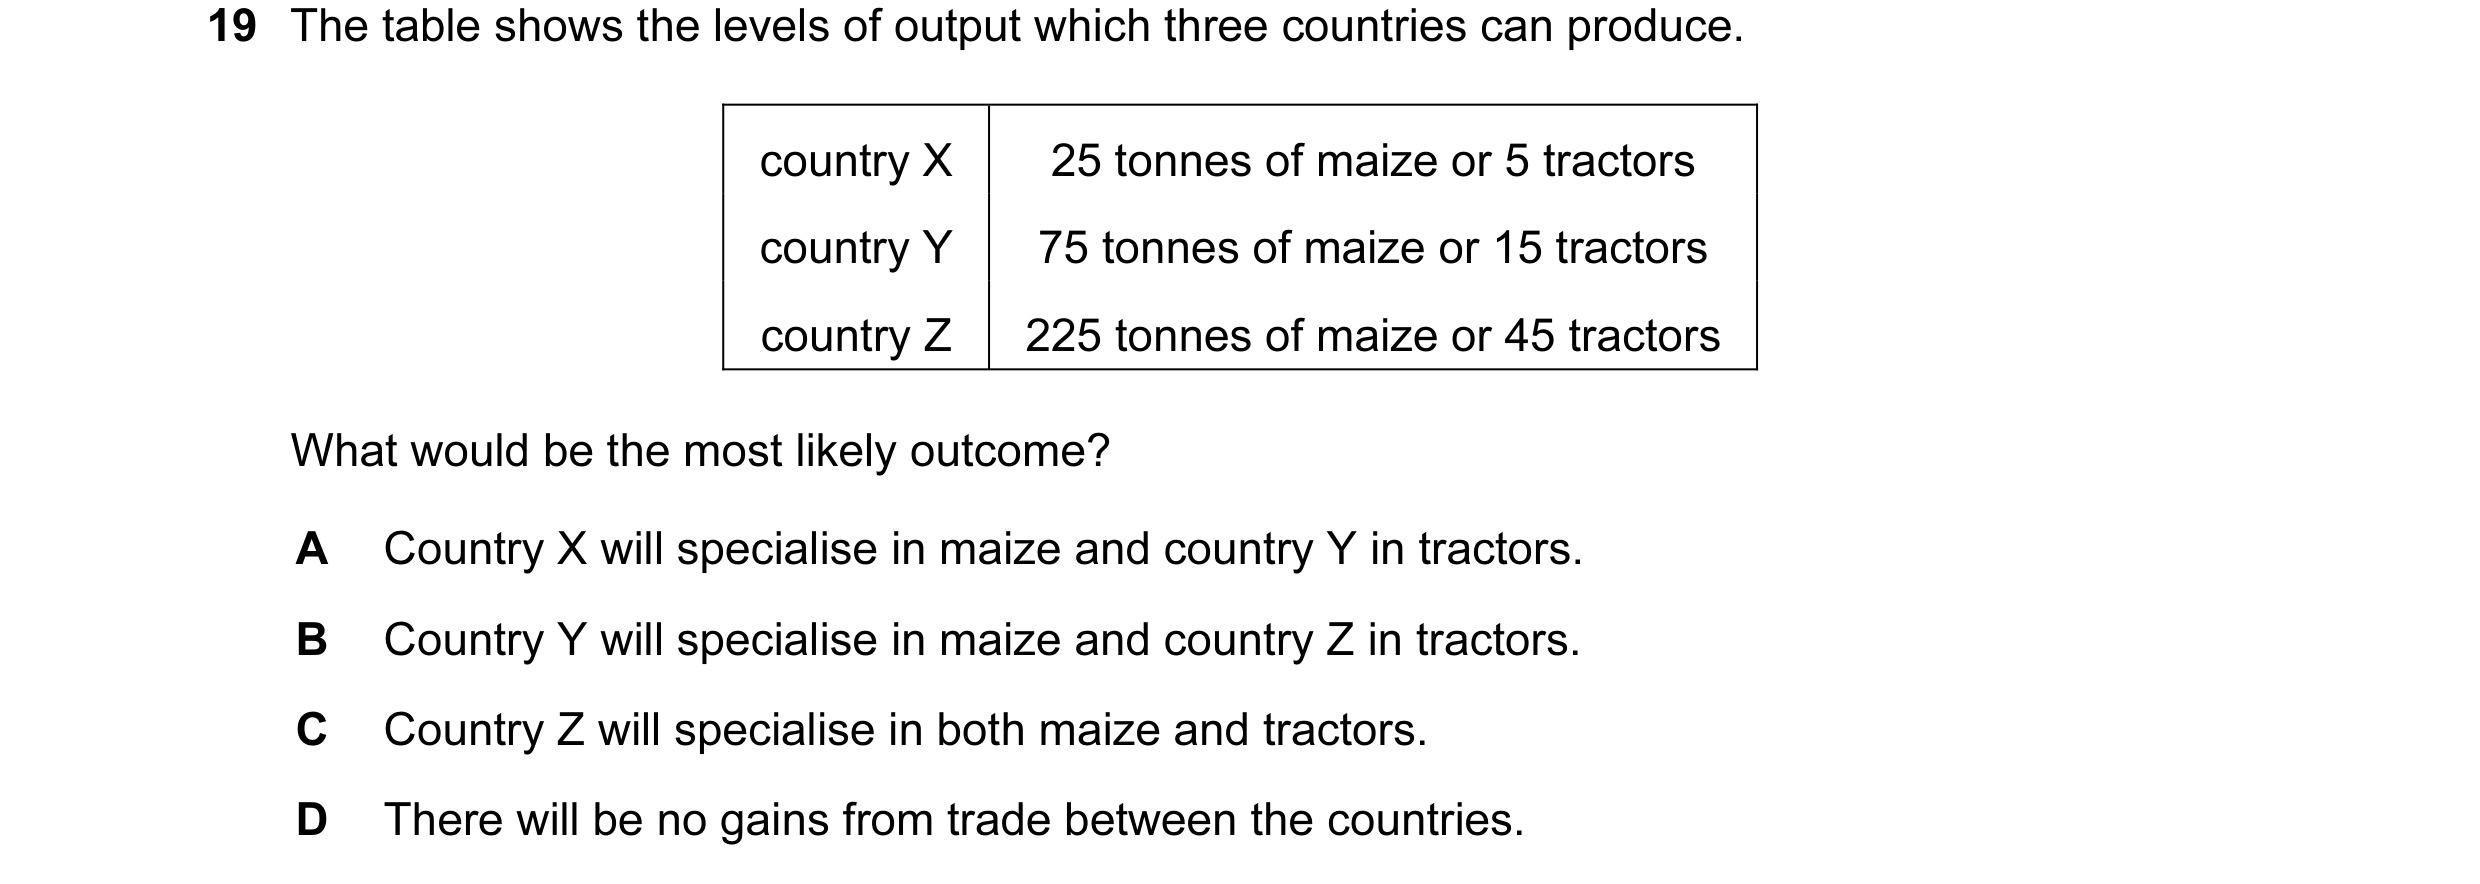
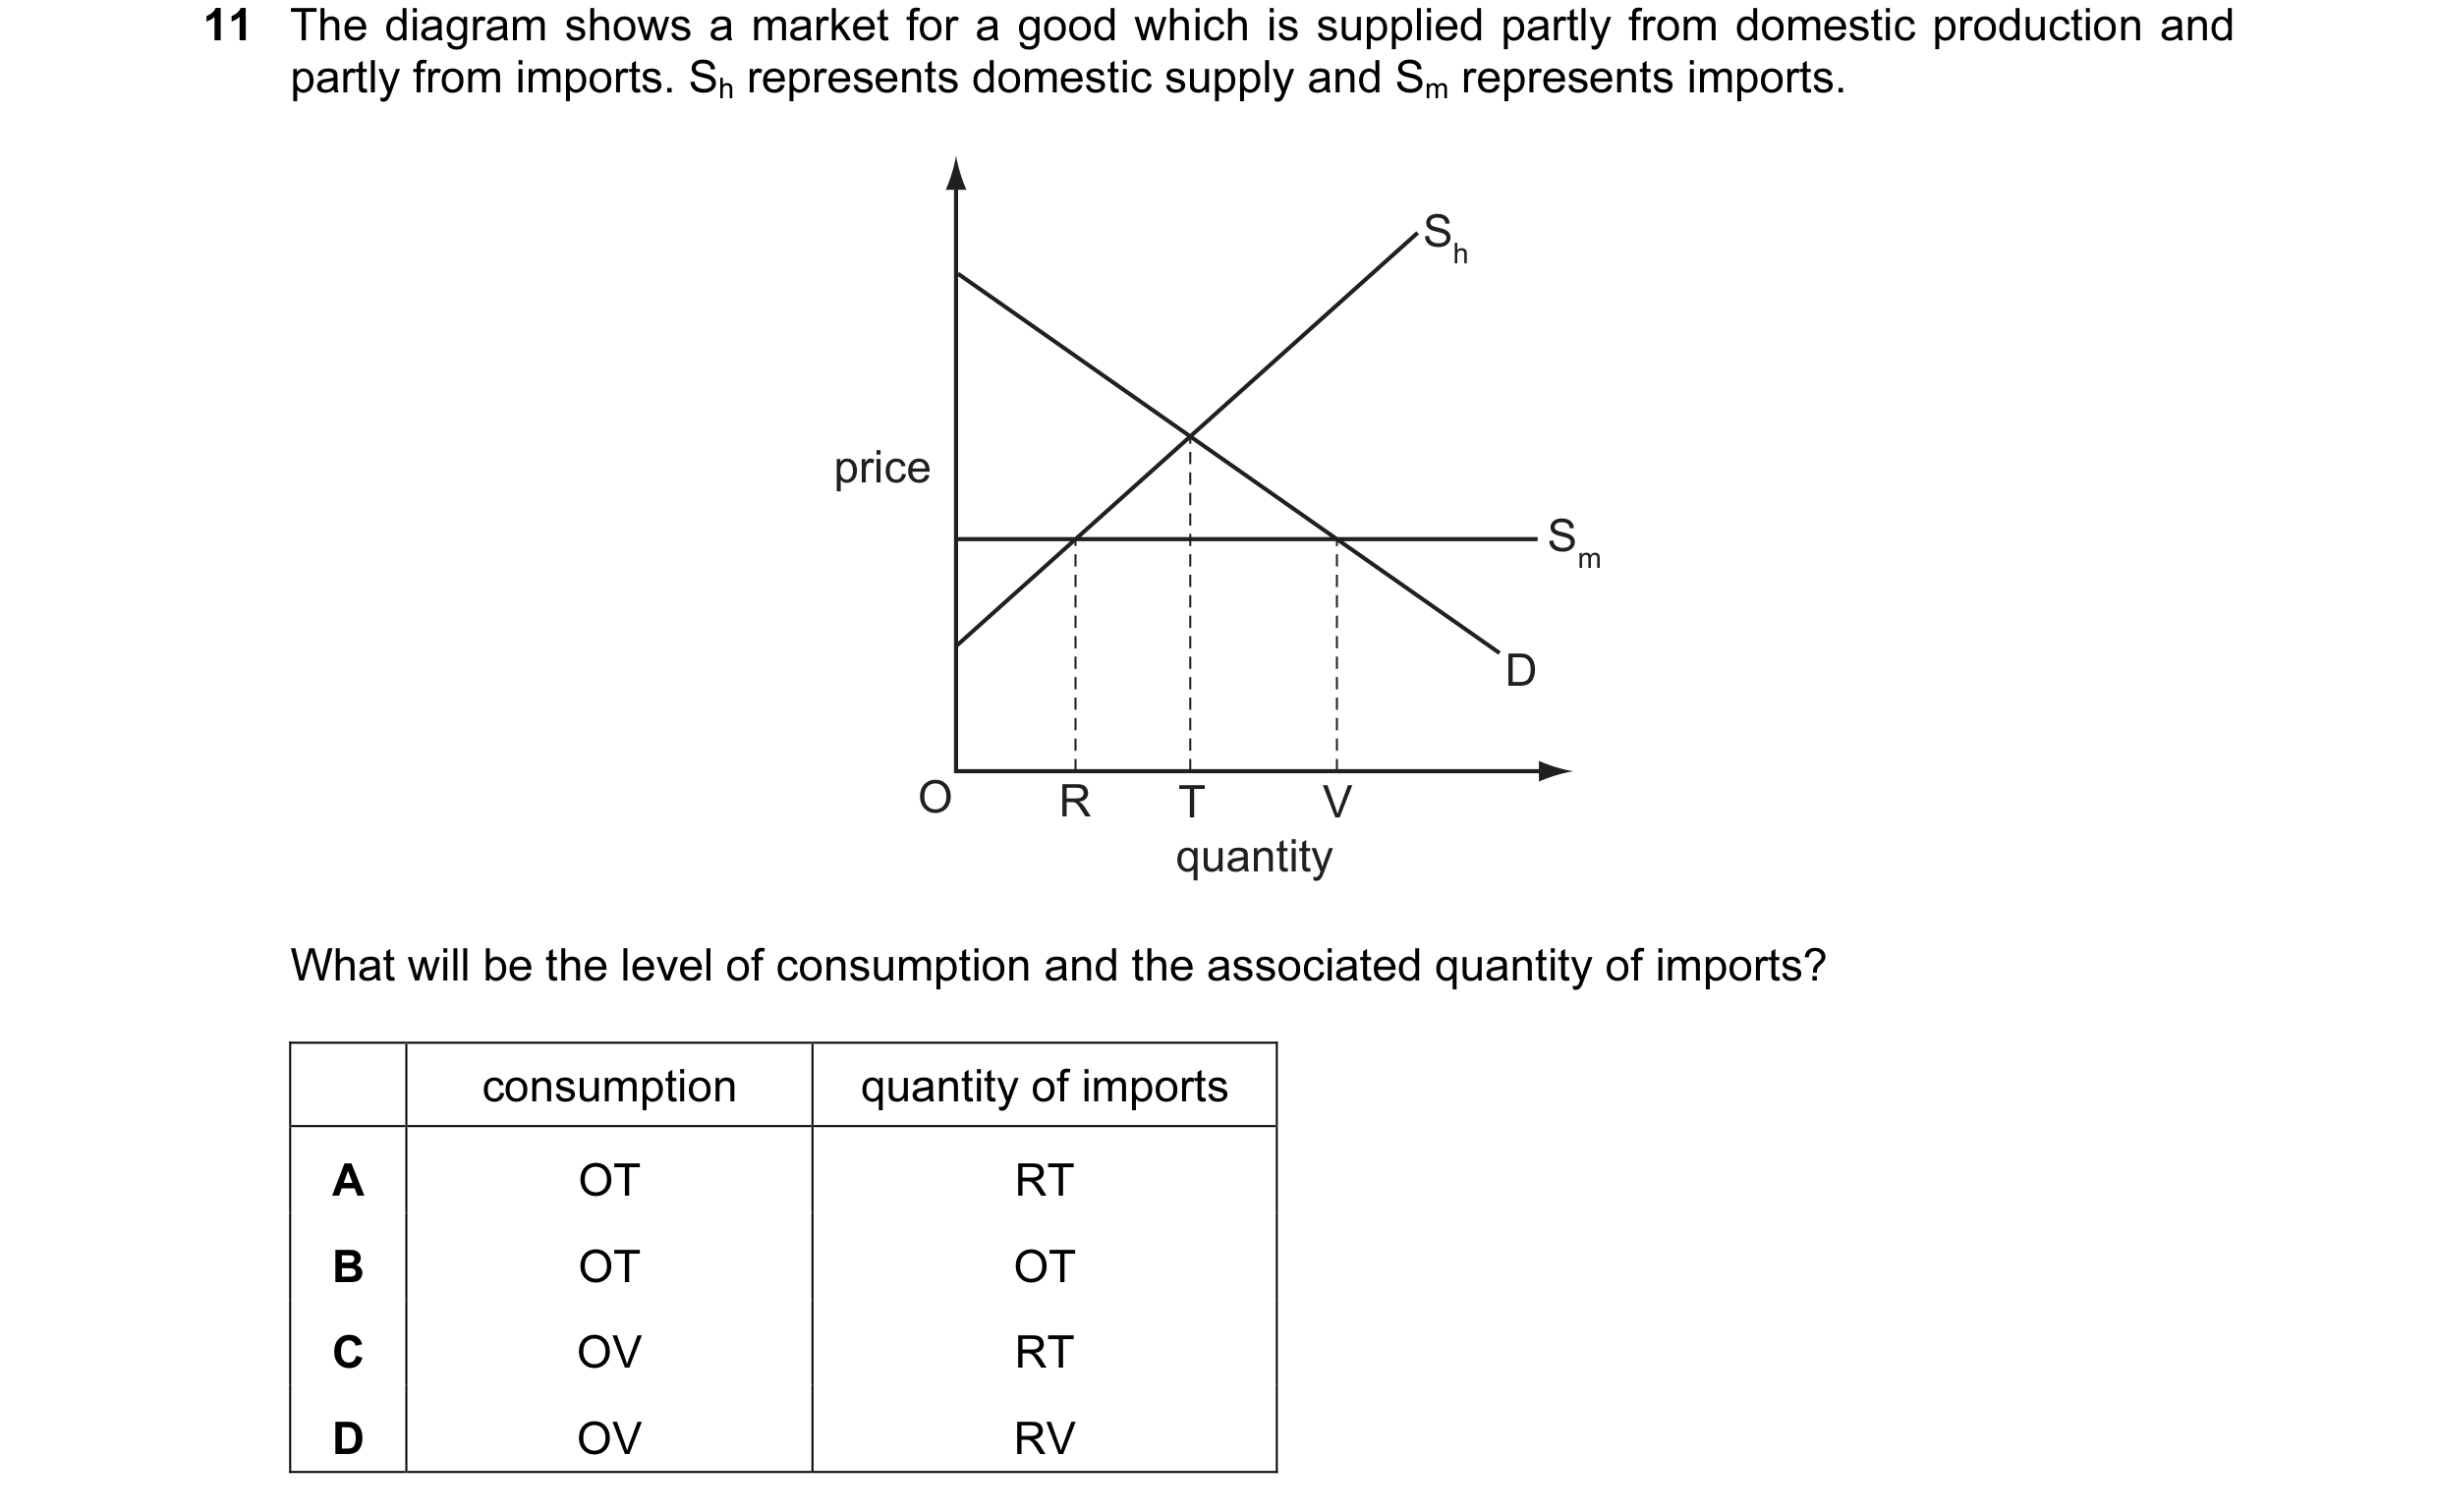
 15 / 59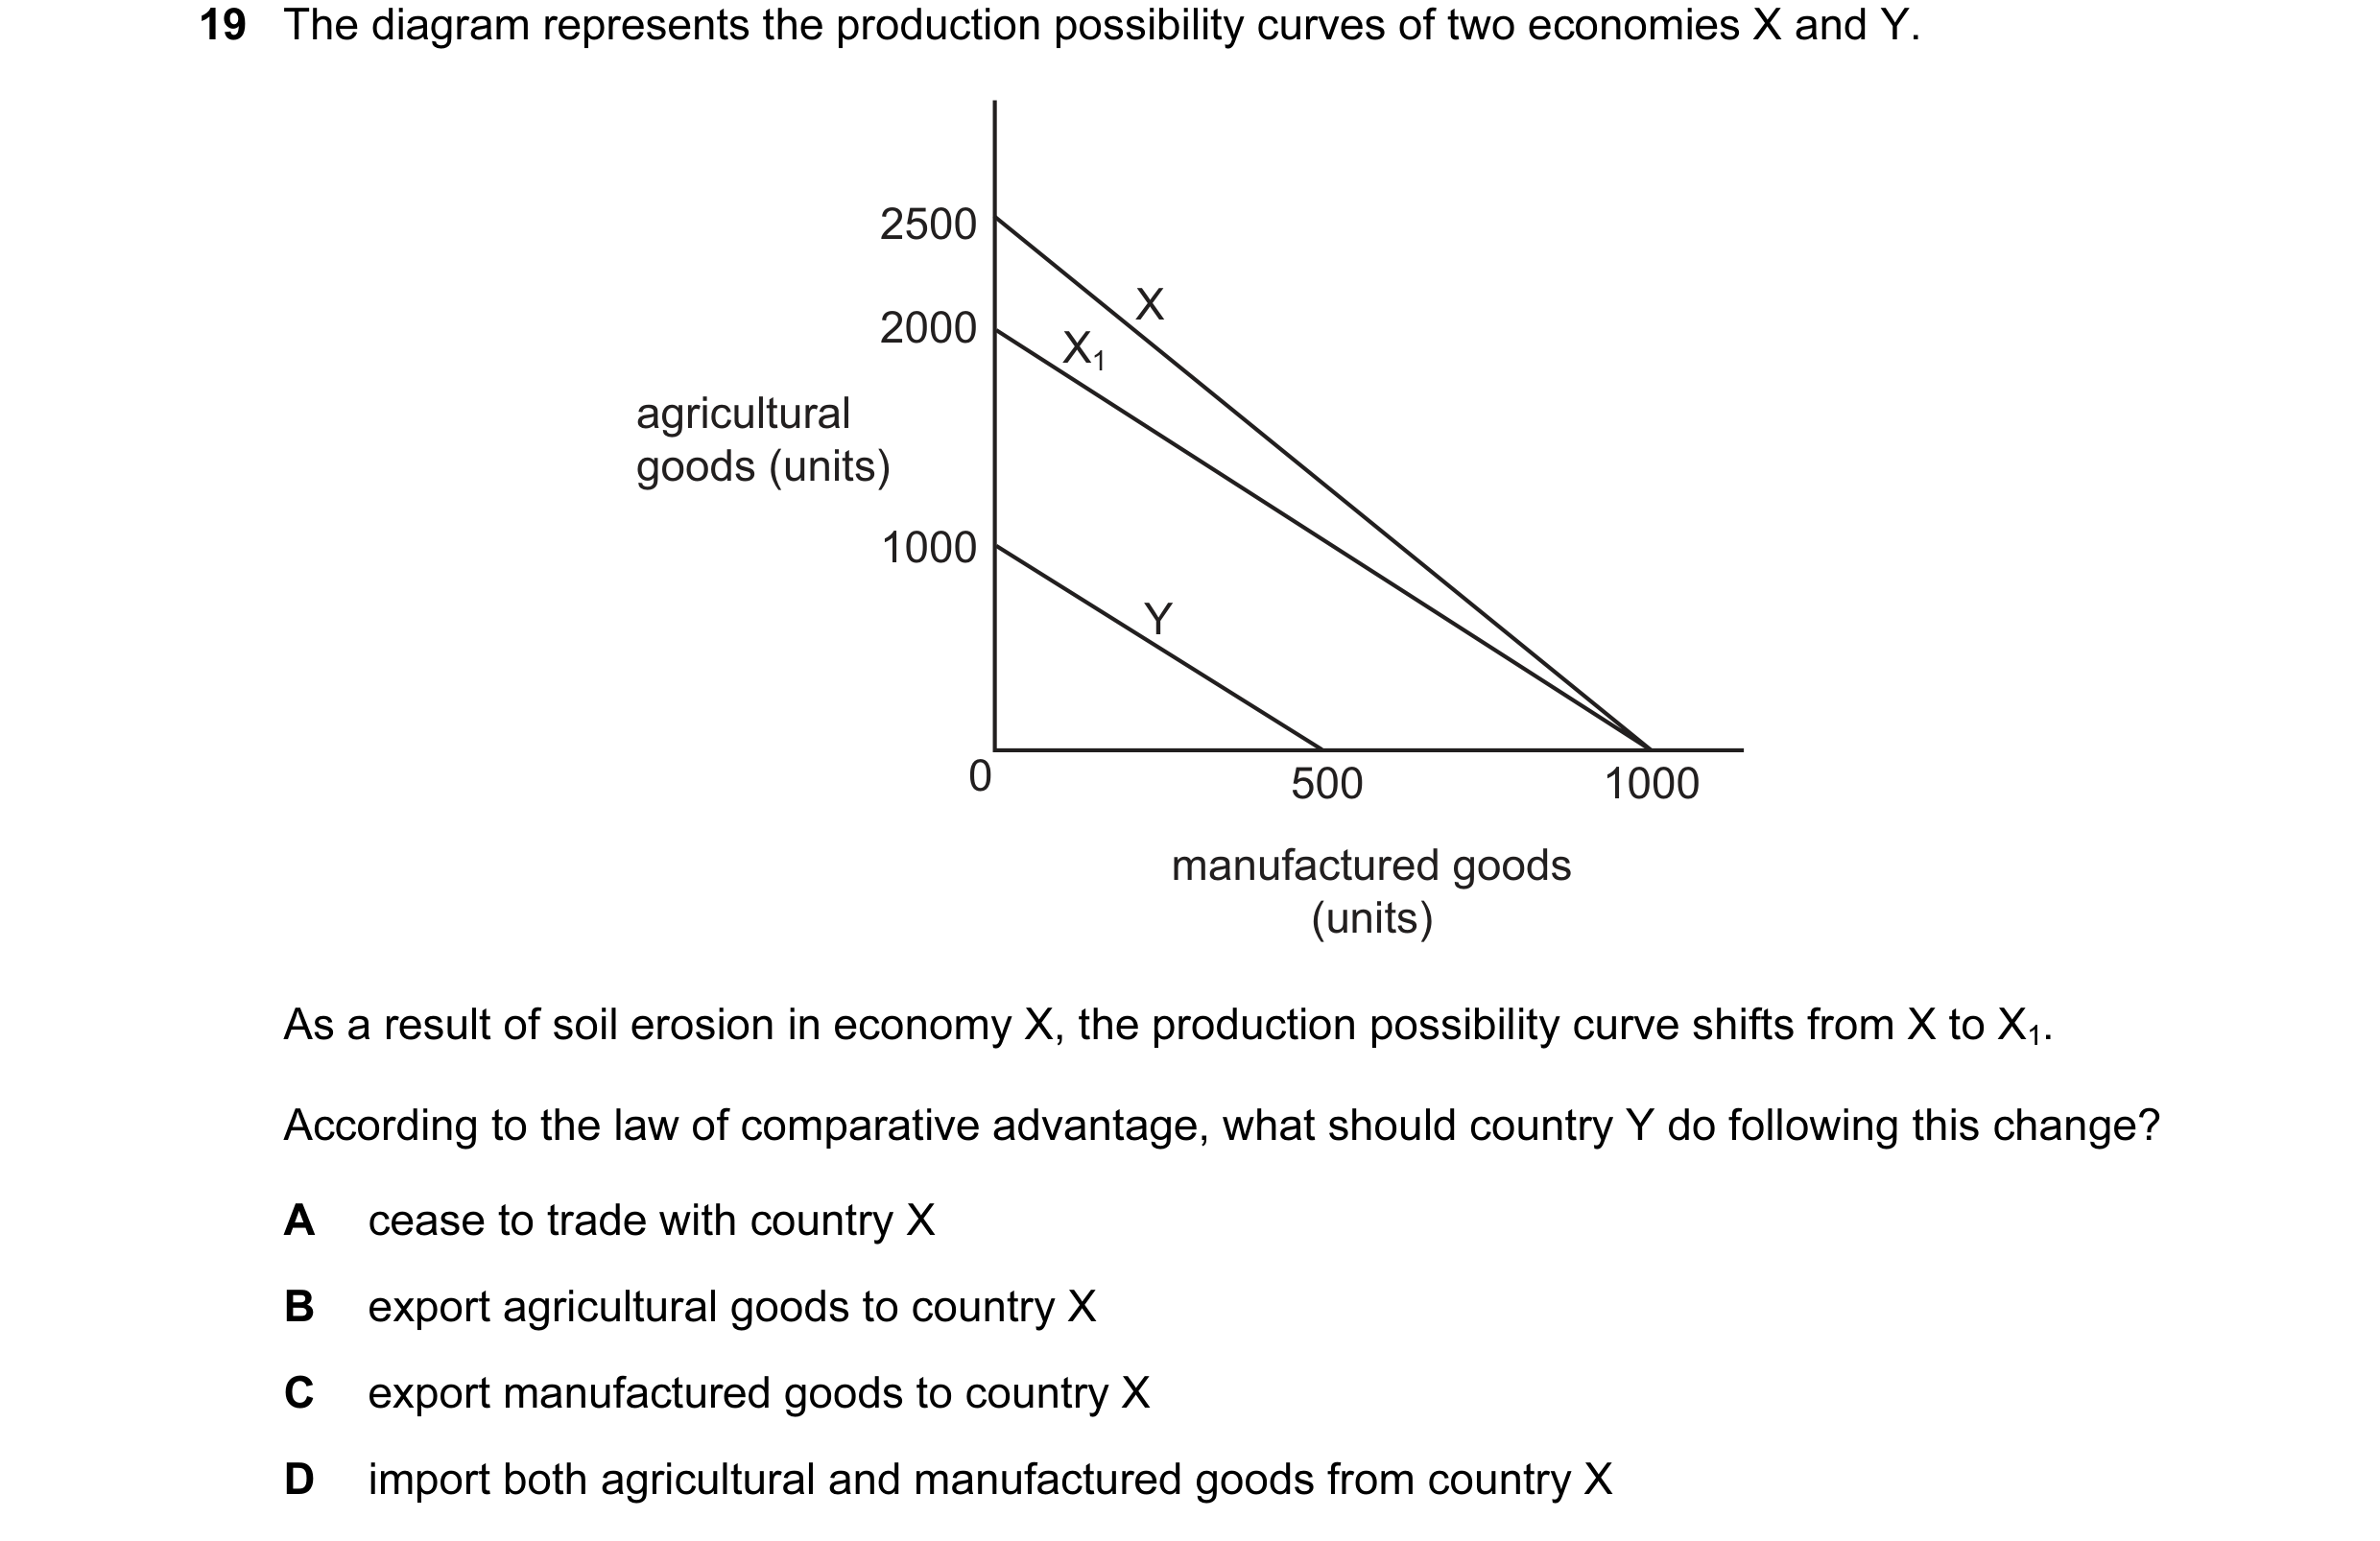

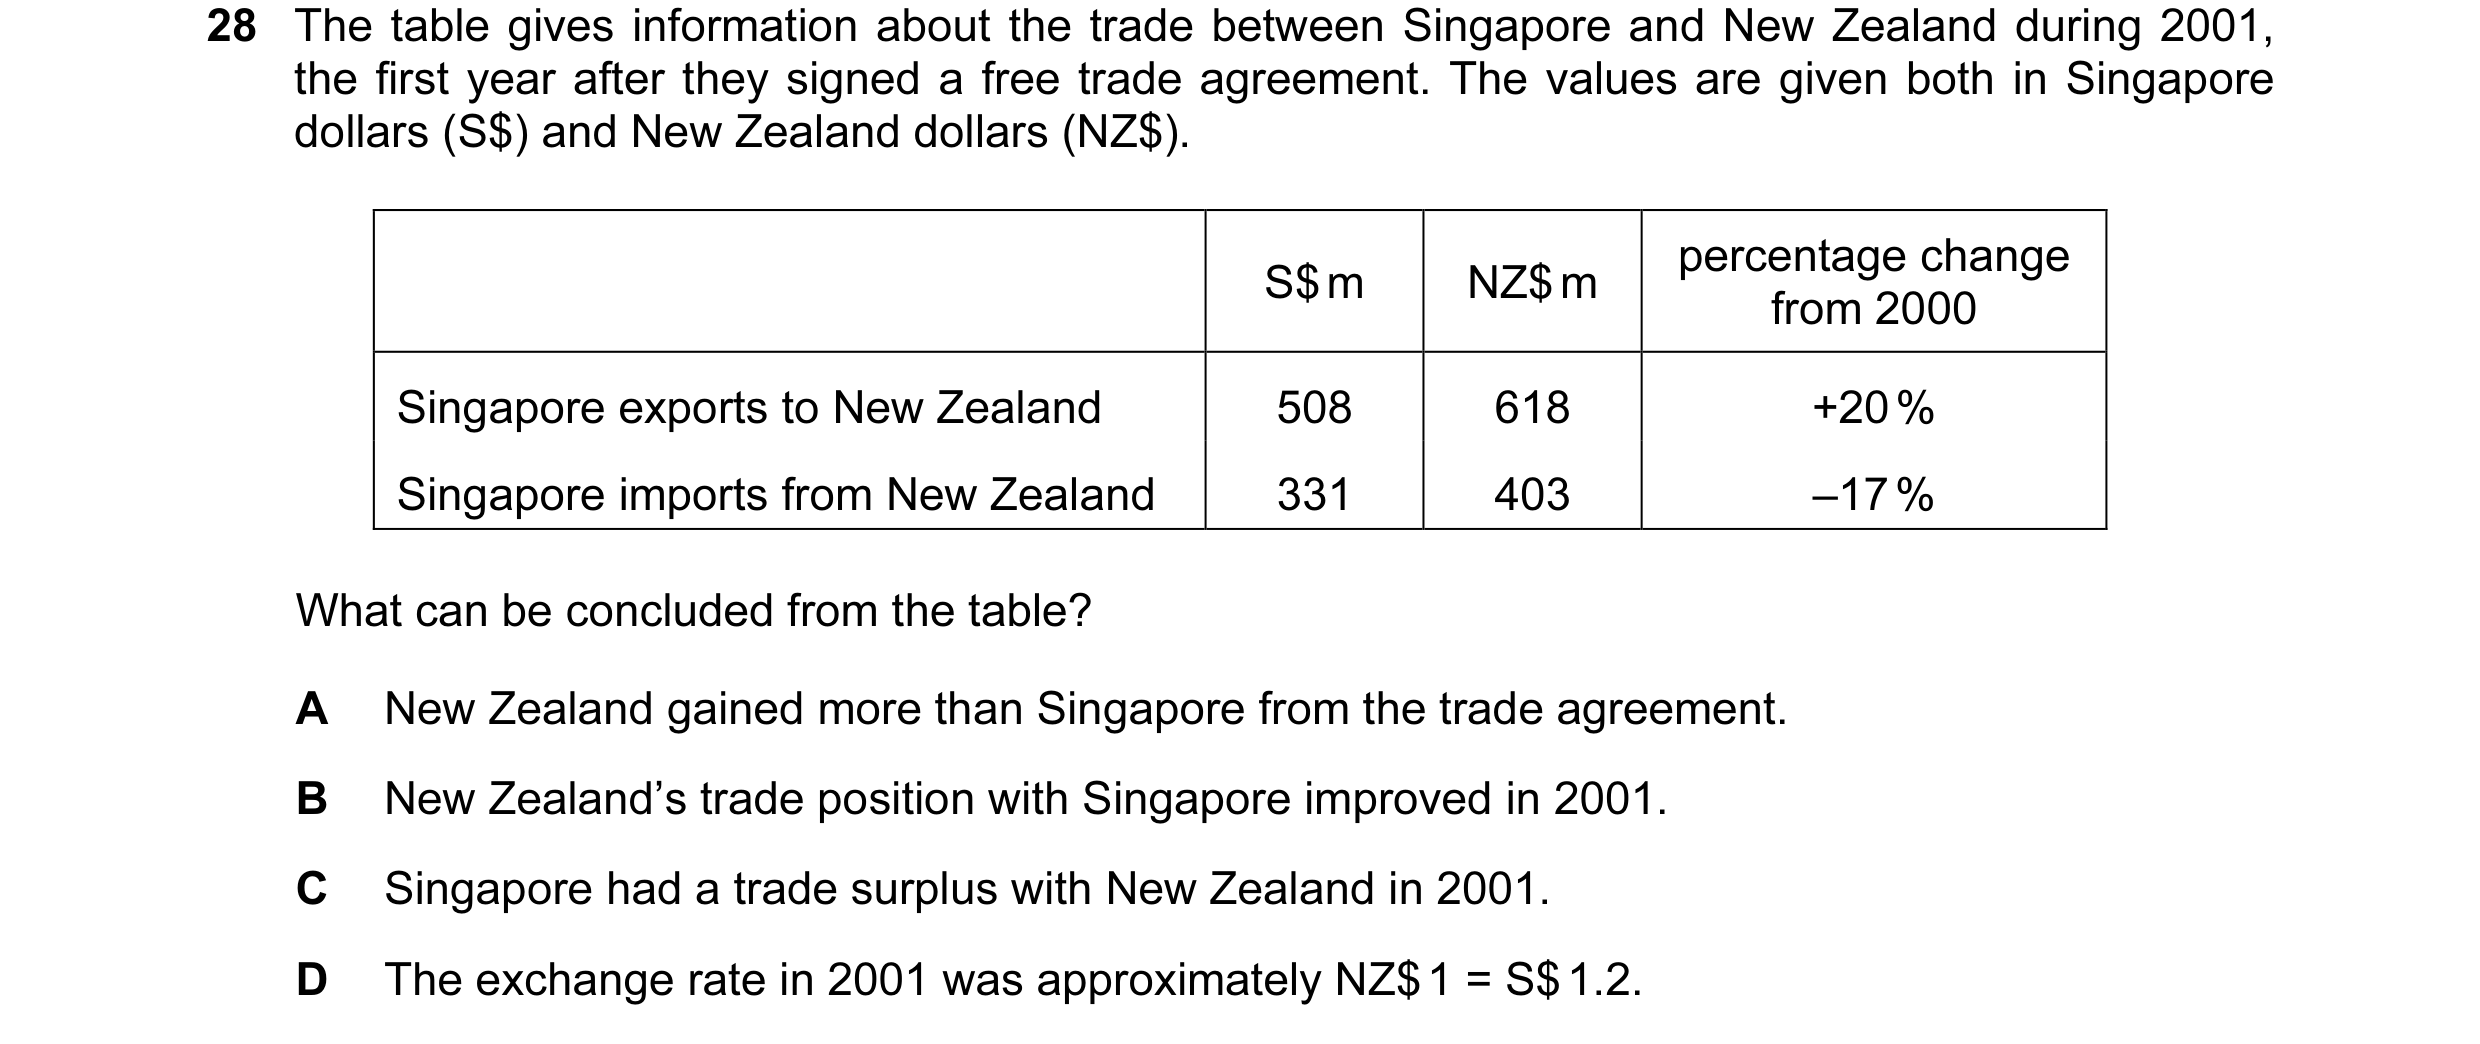 16 / 59
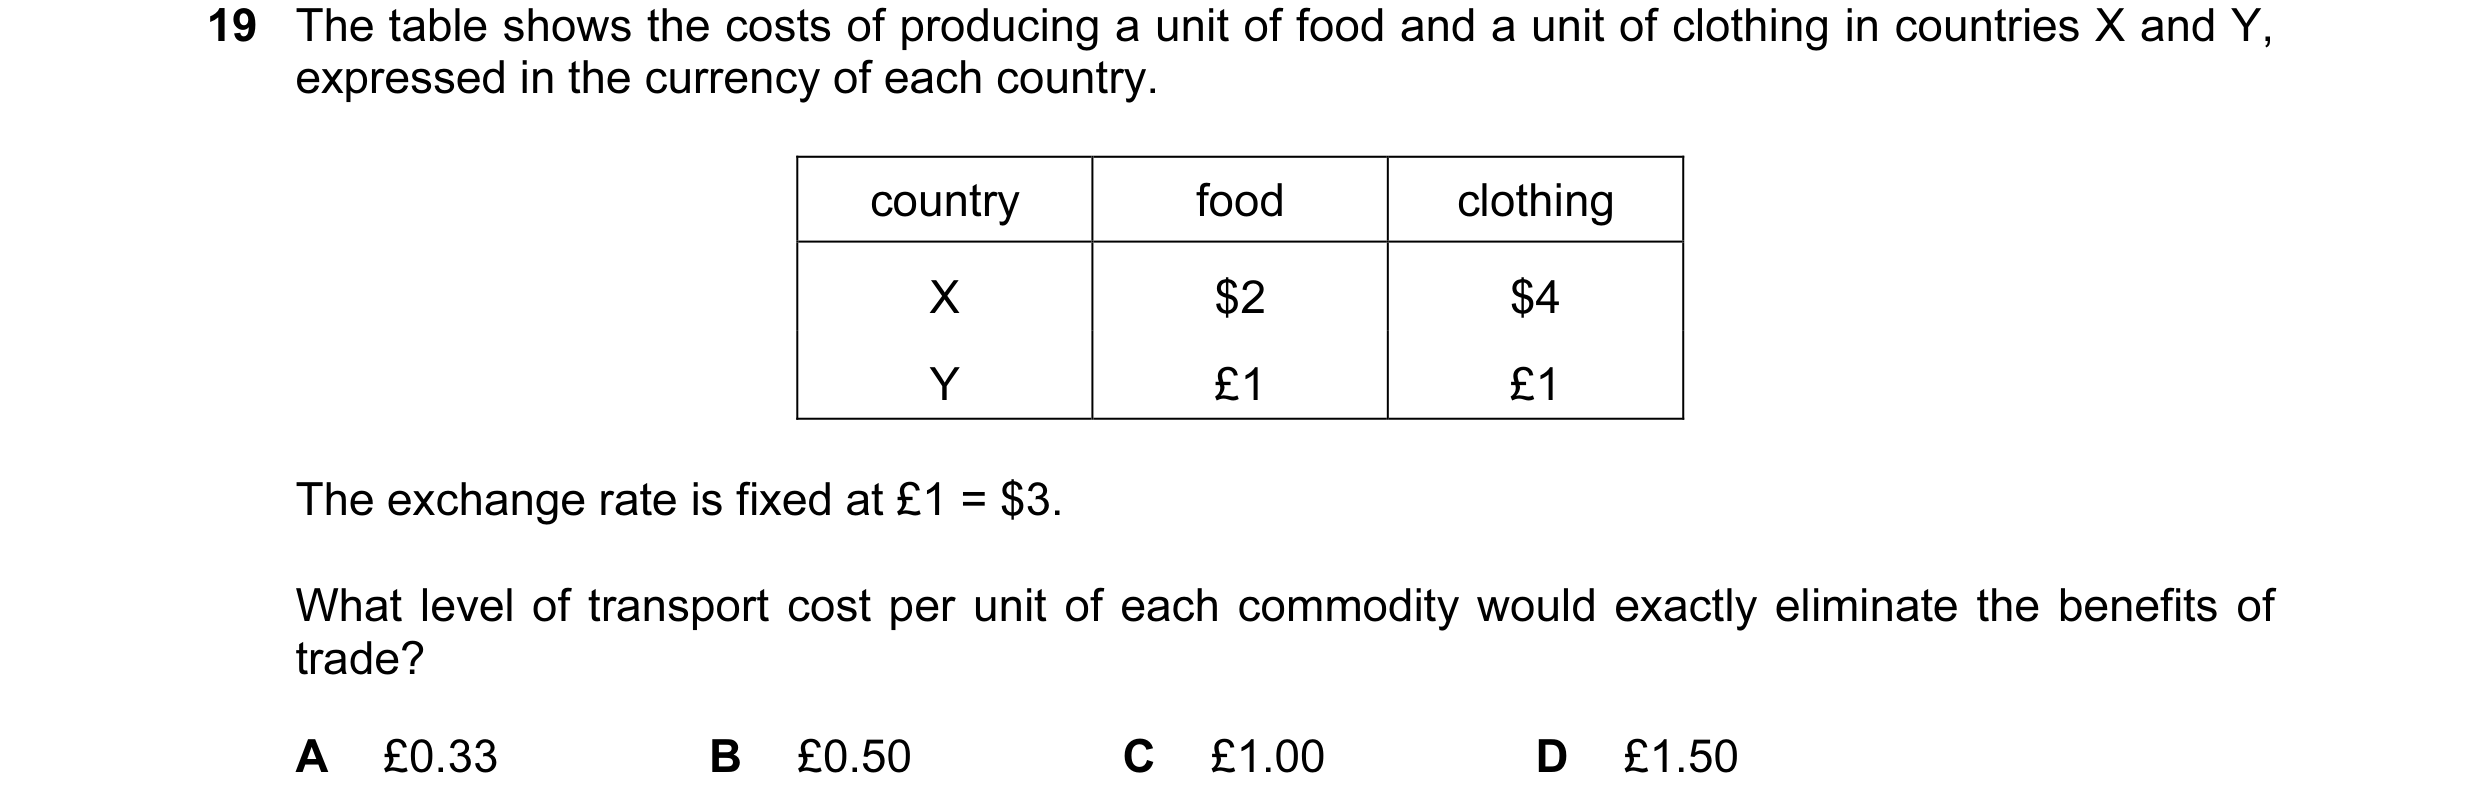
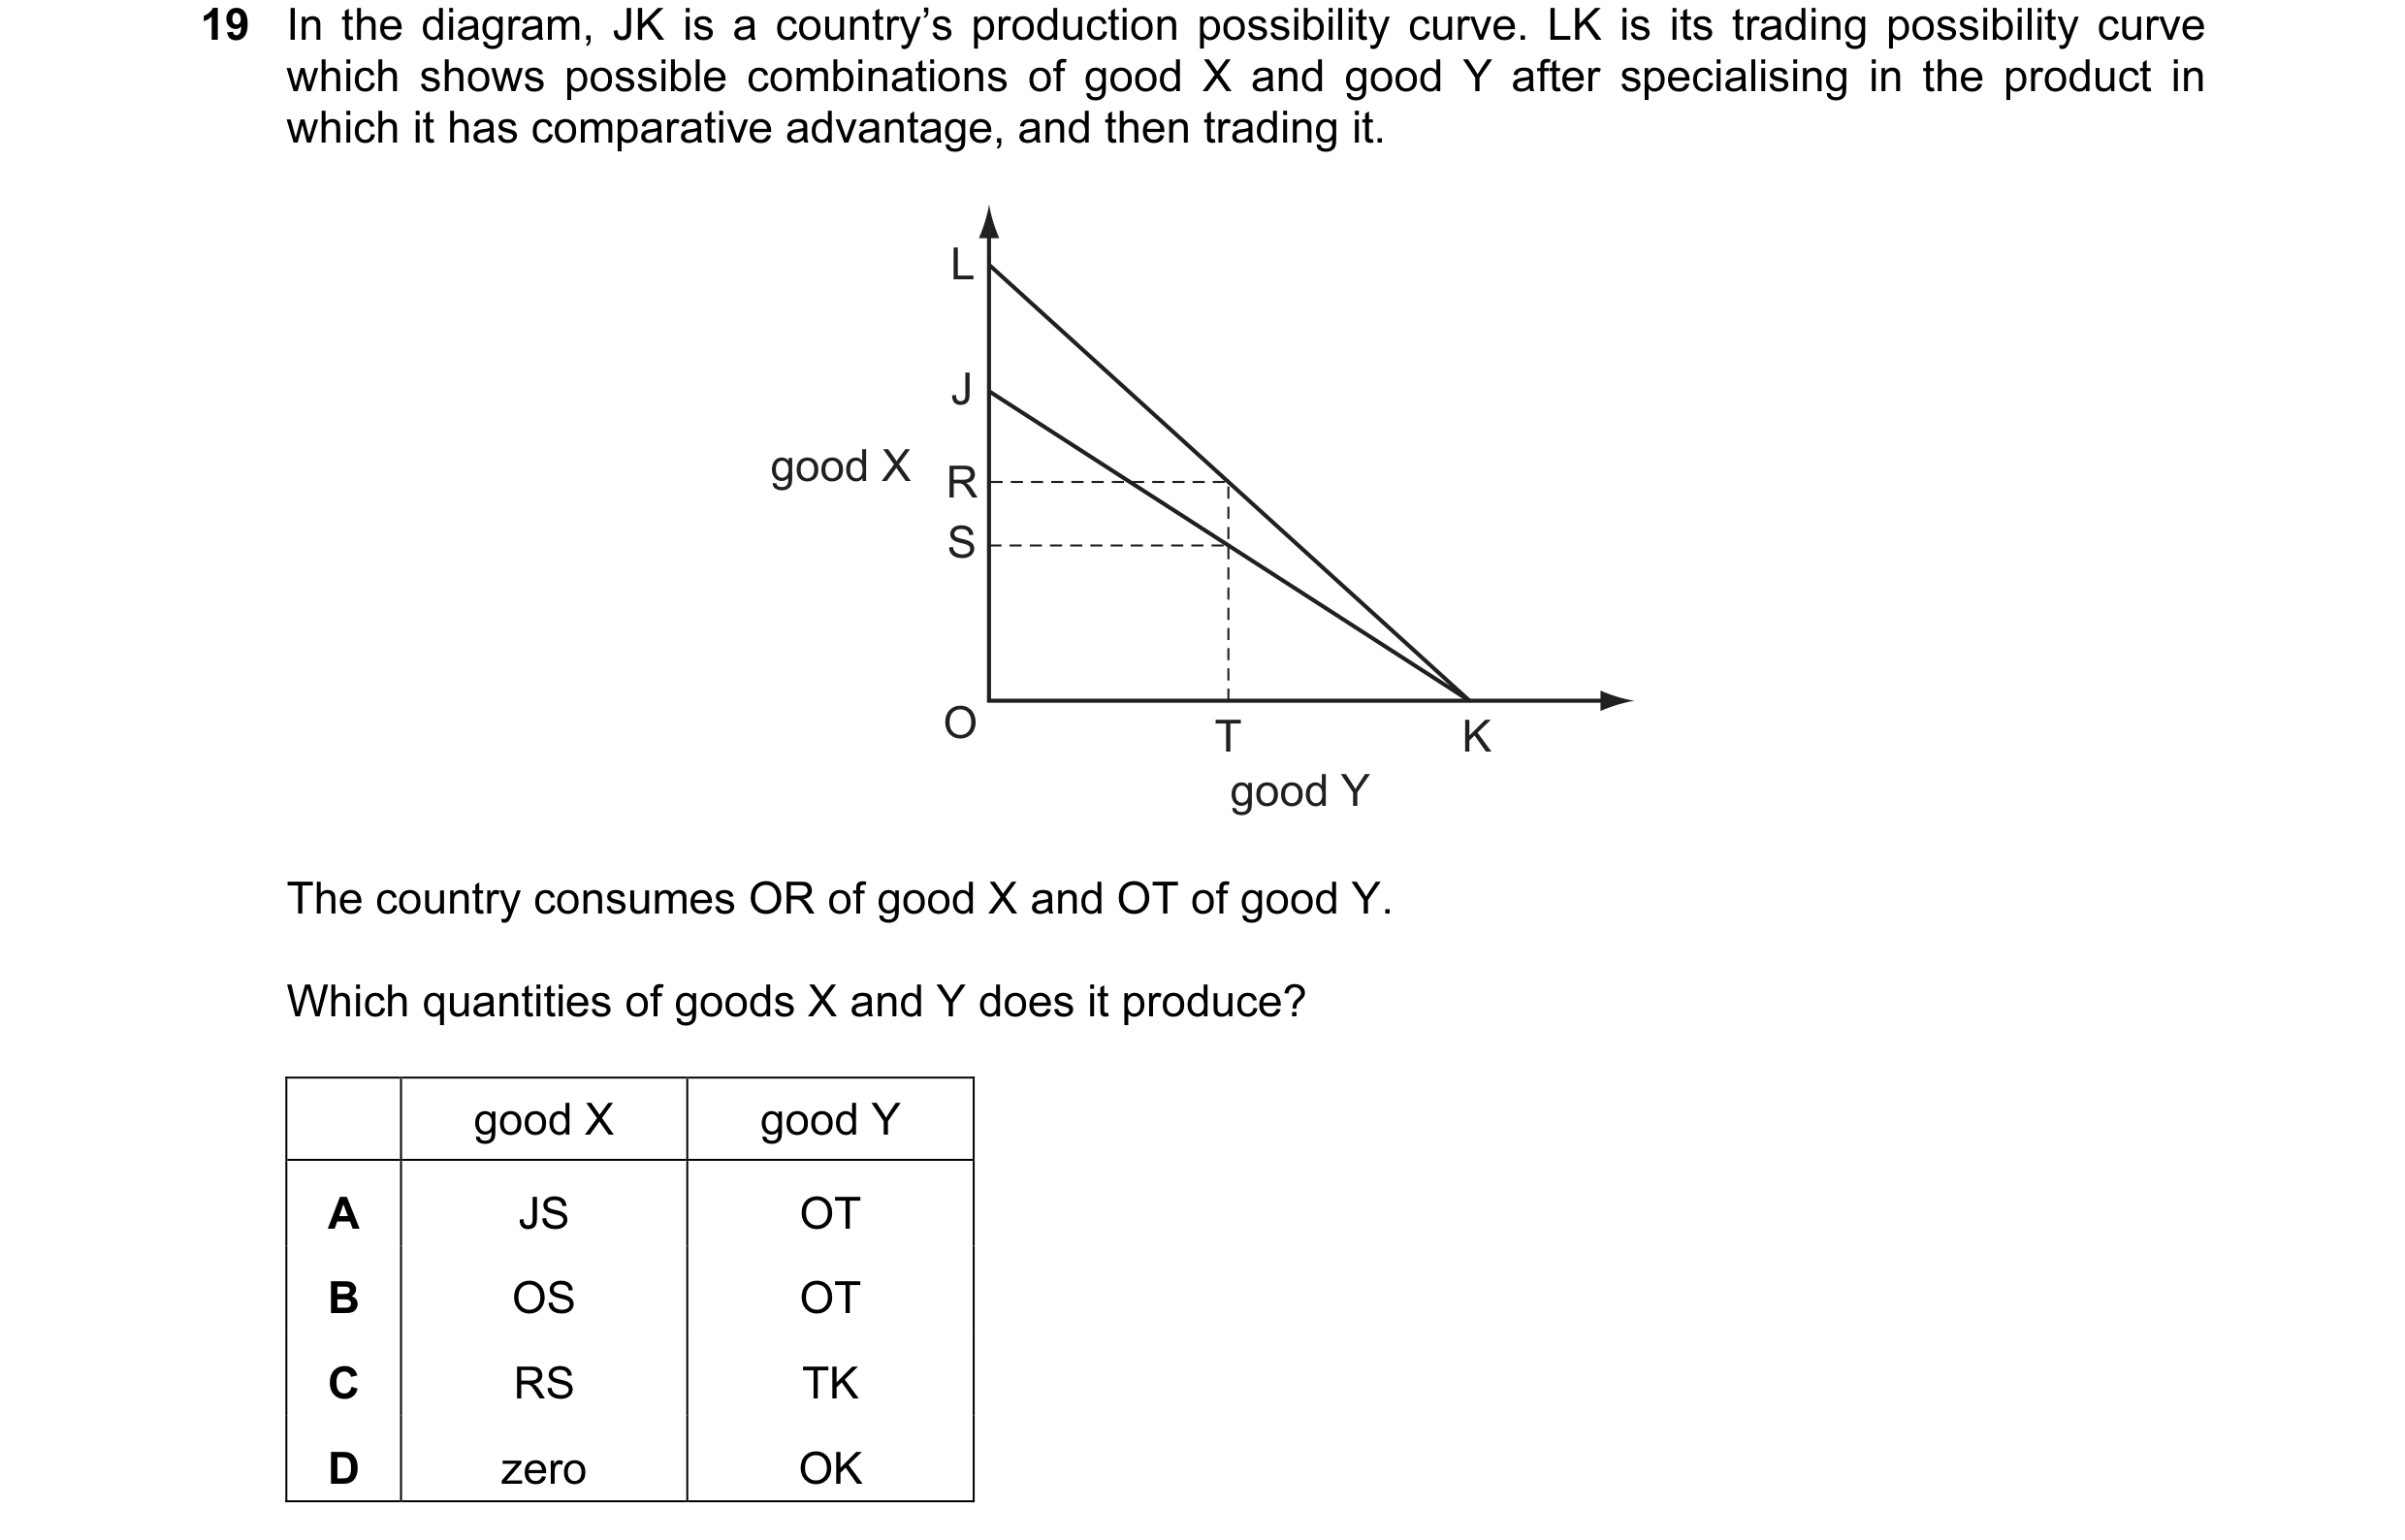 17 / 59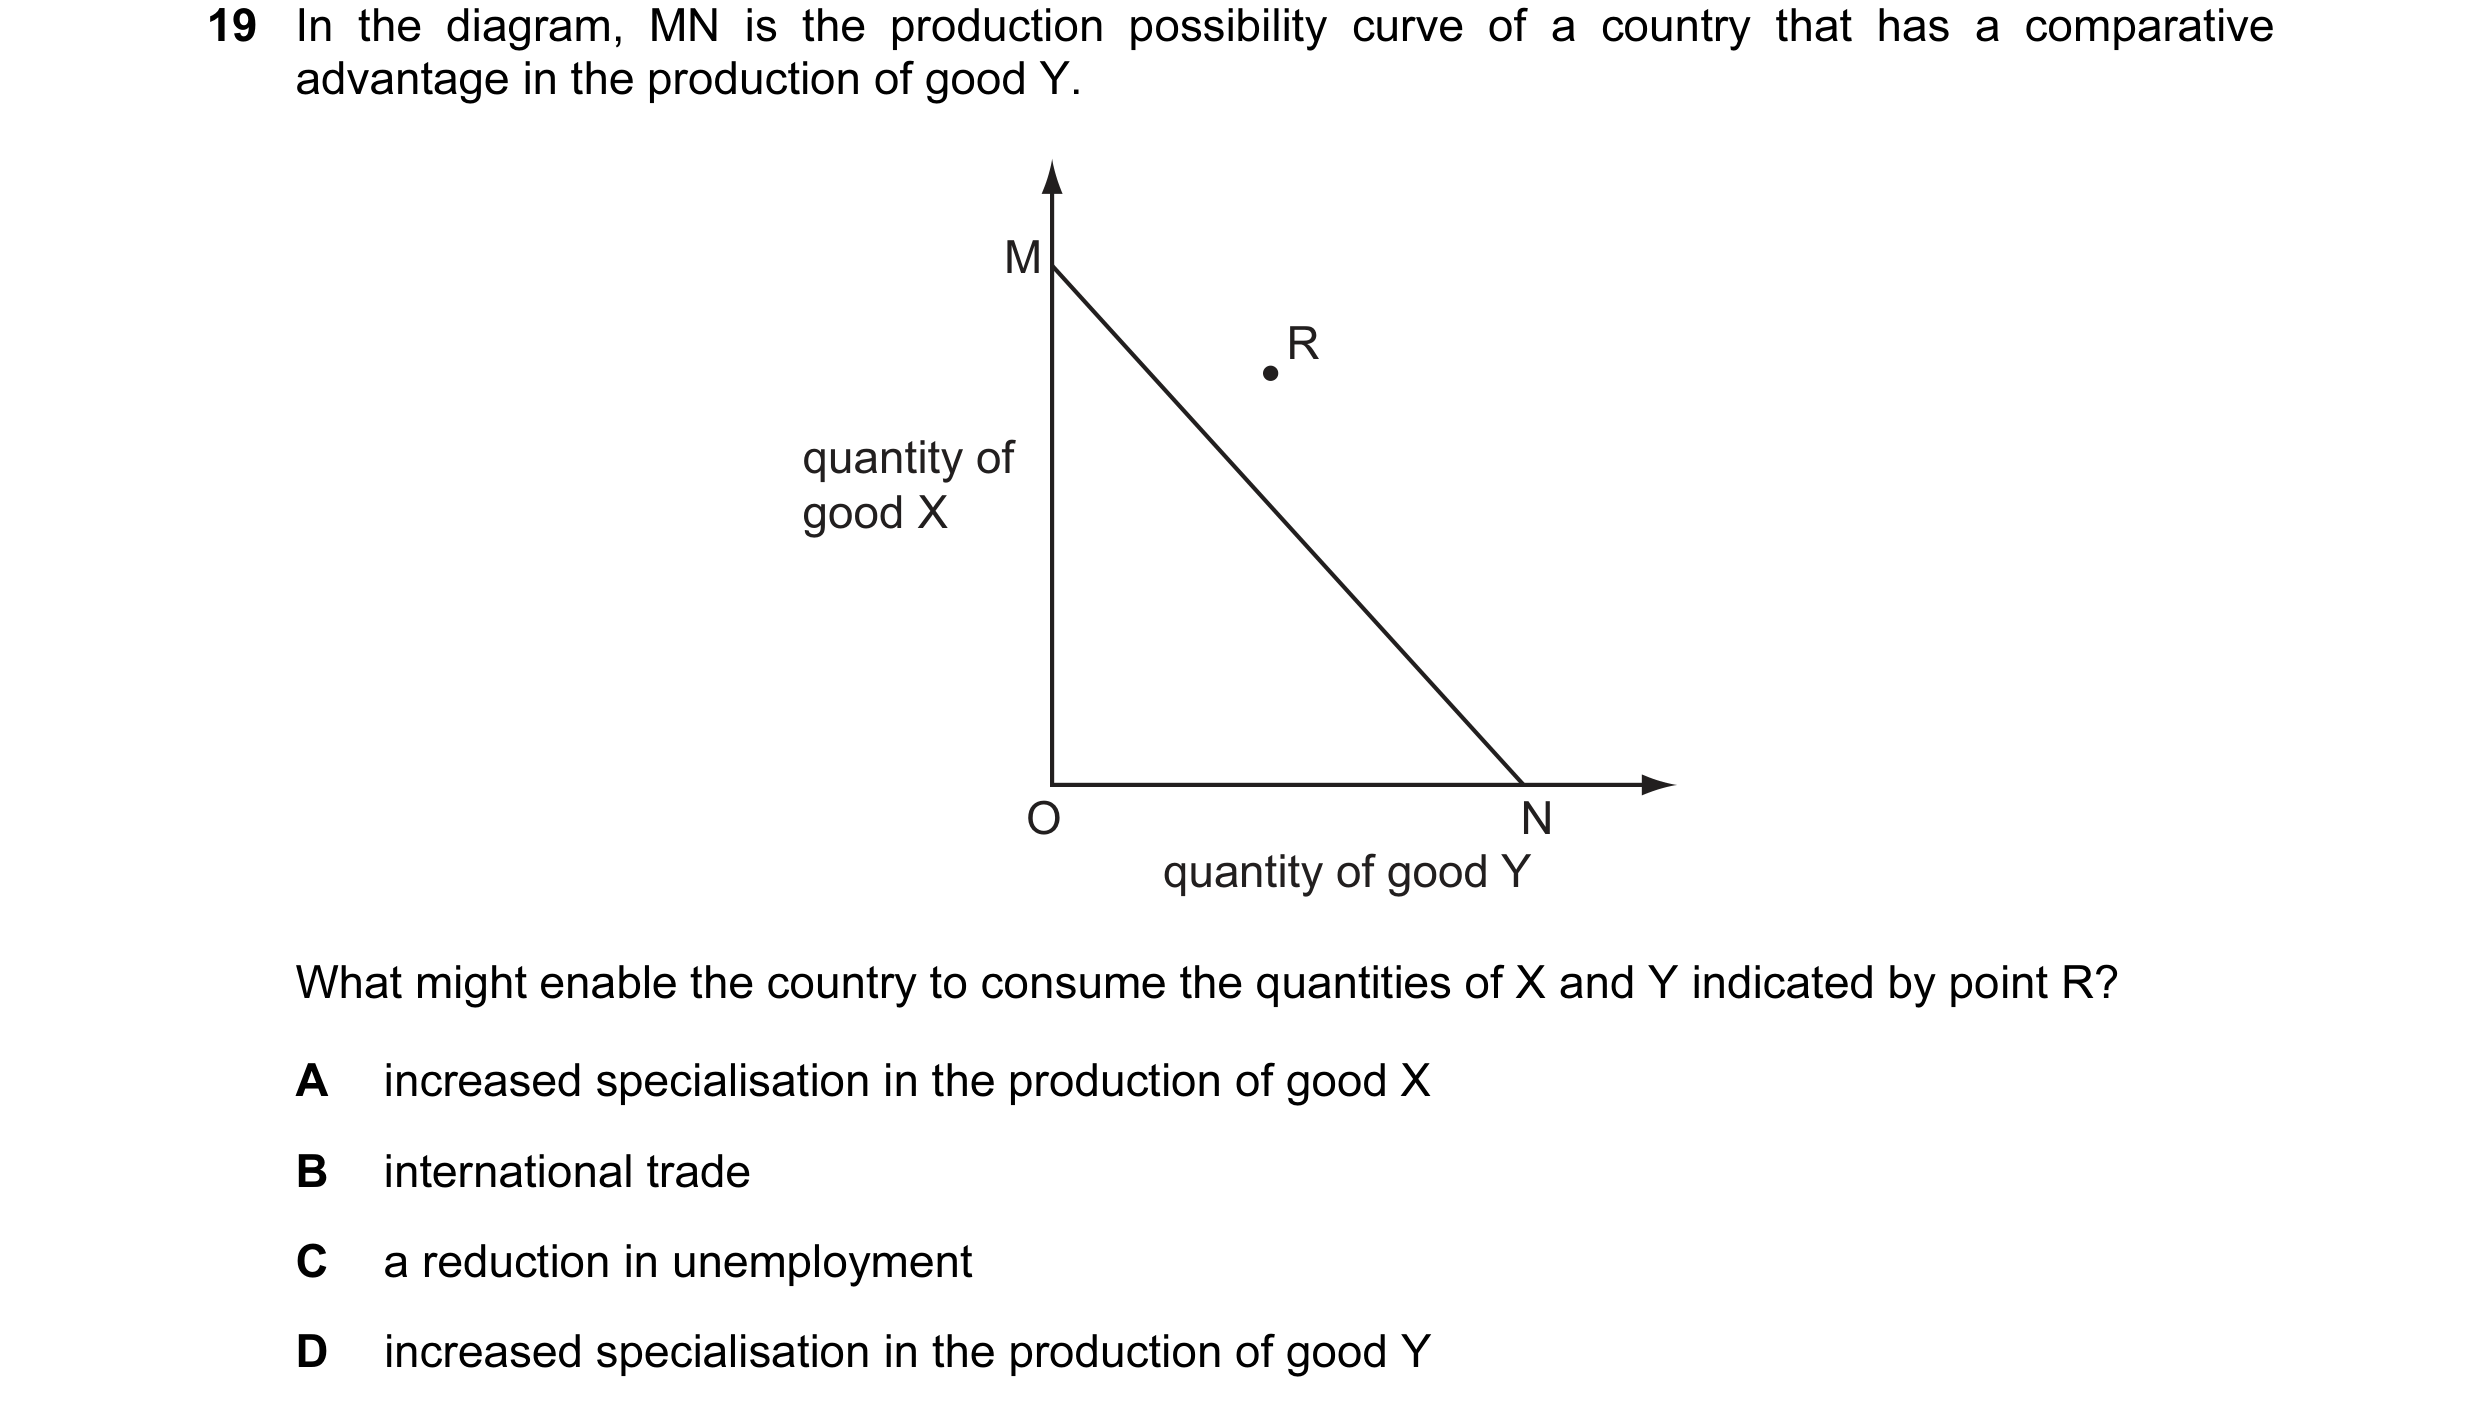
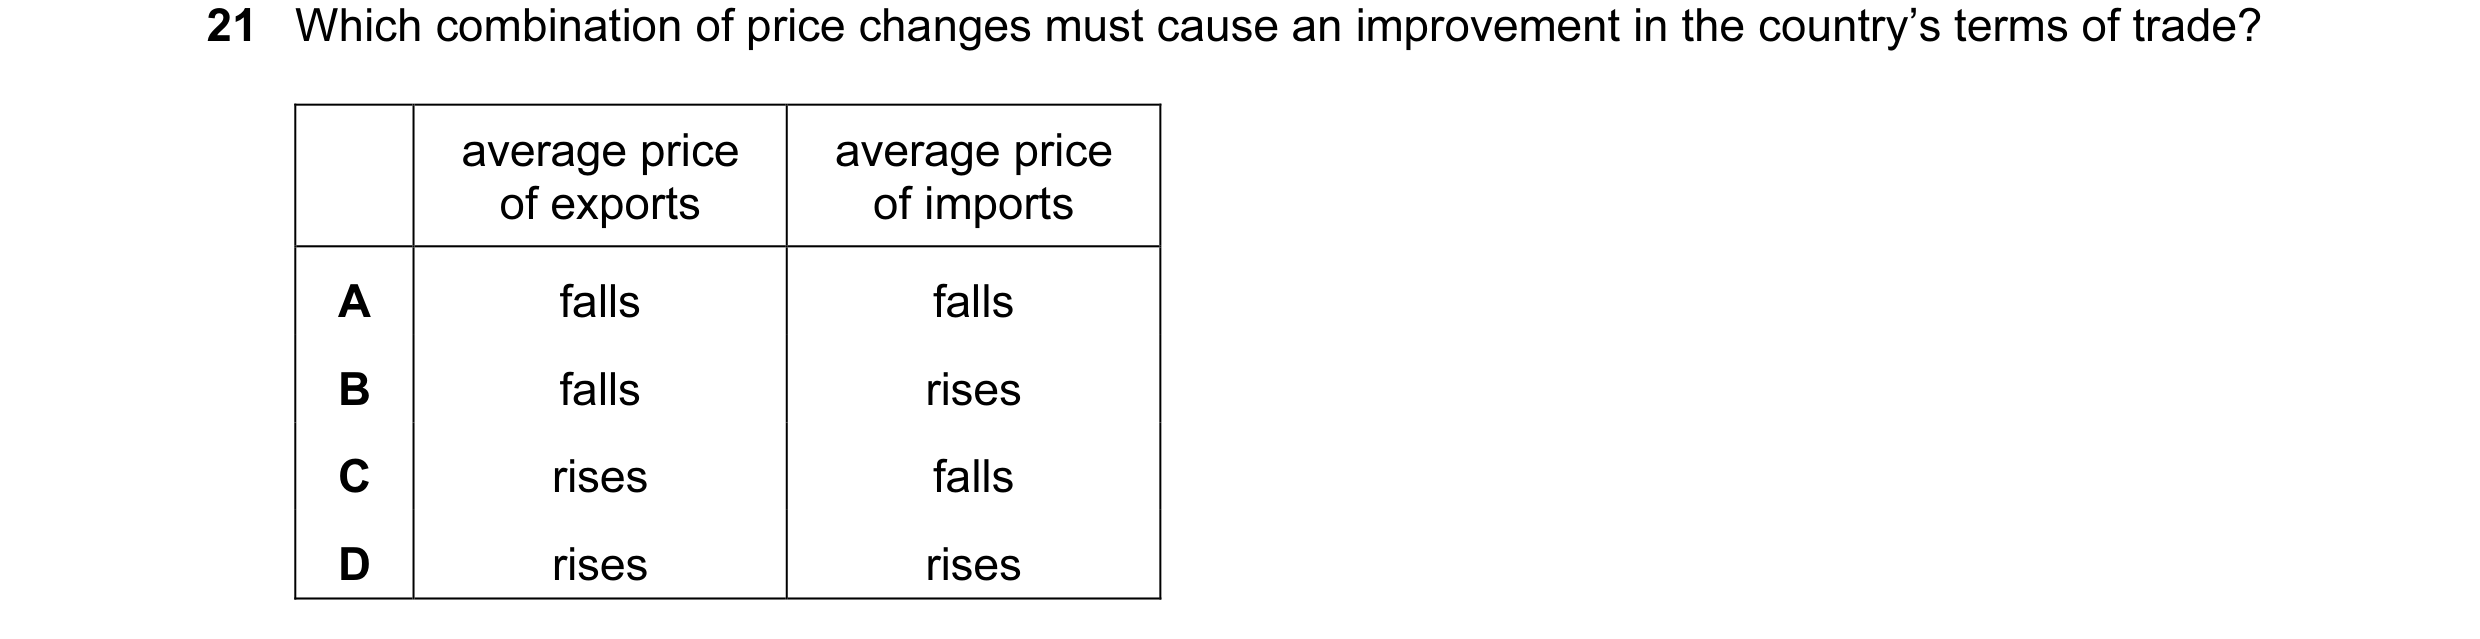
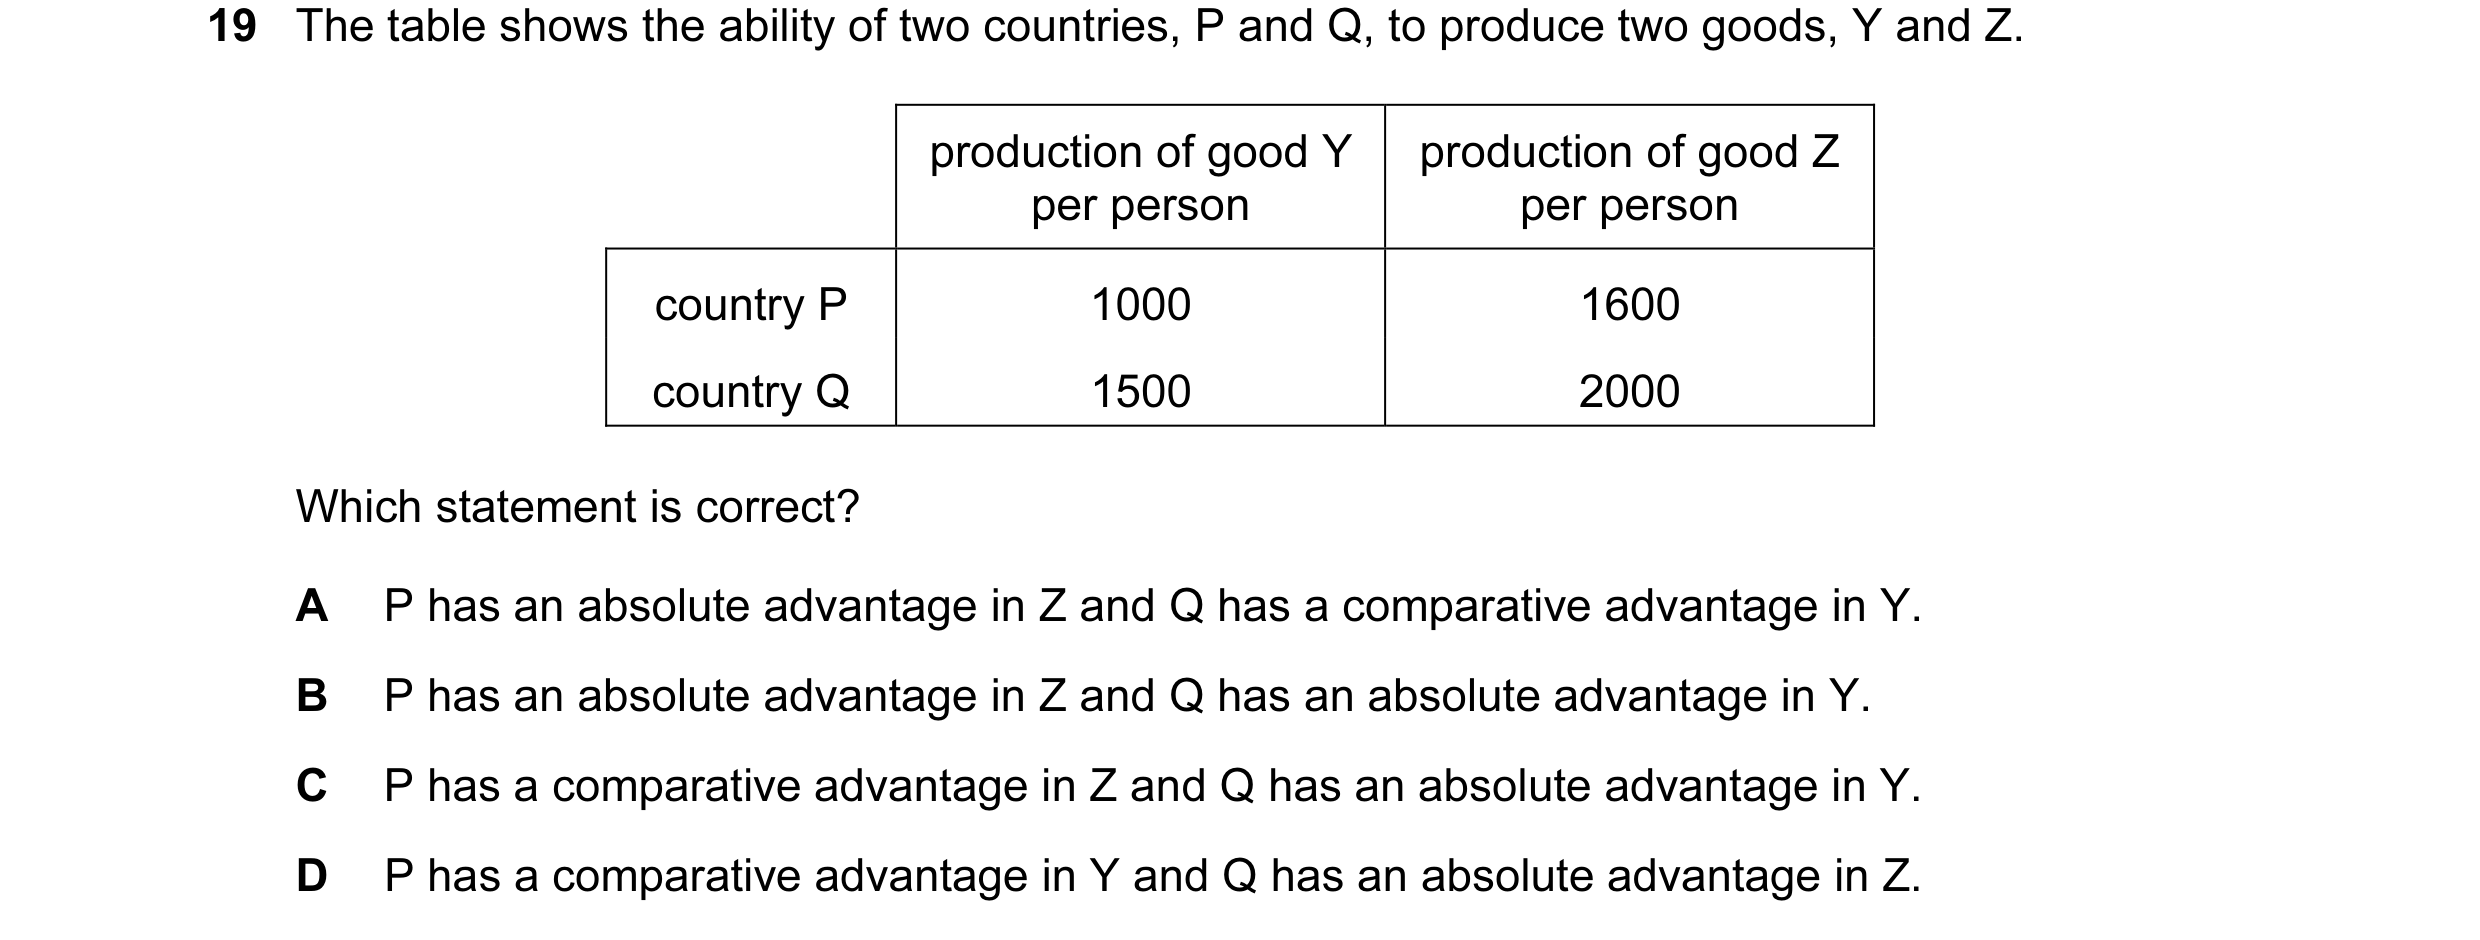 18 / 59
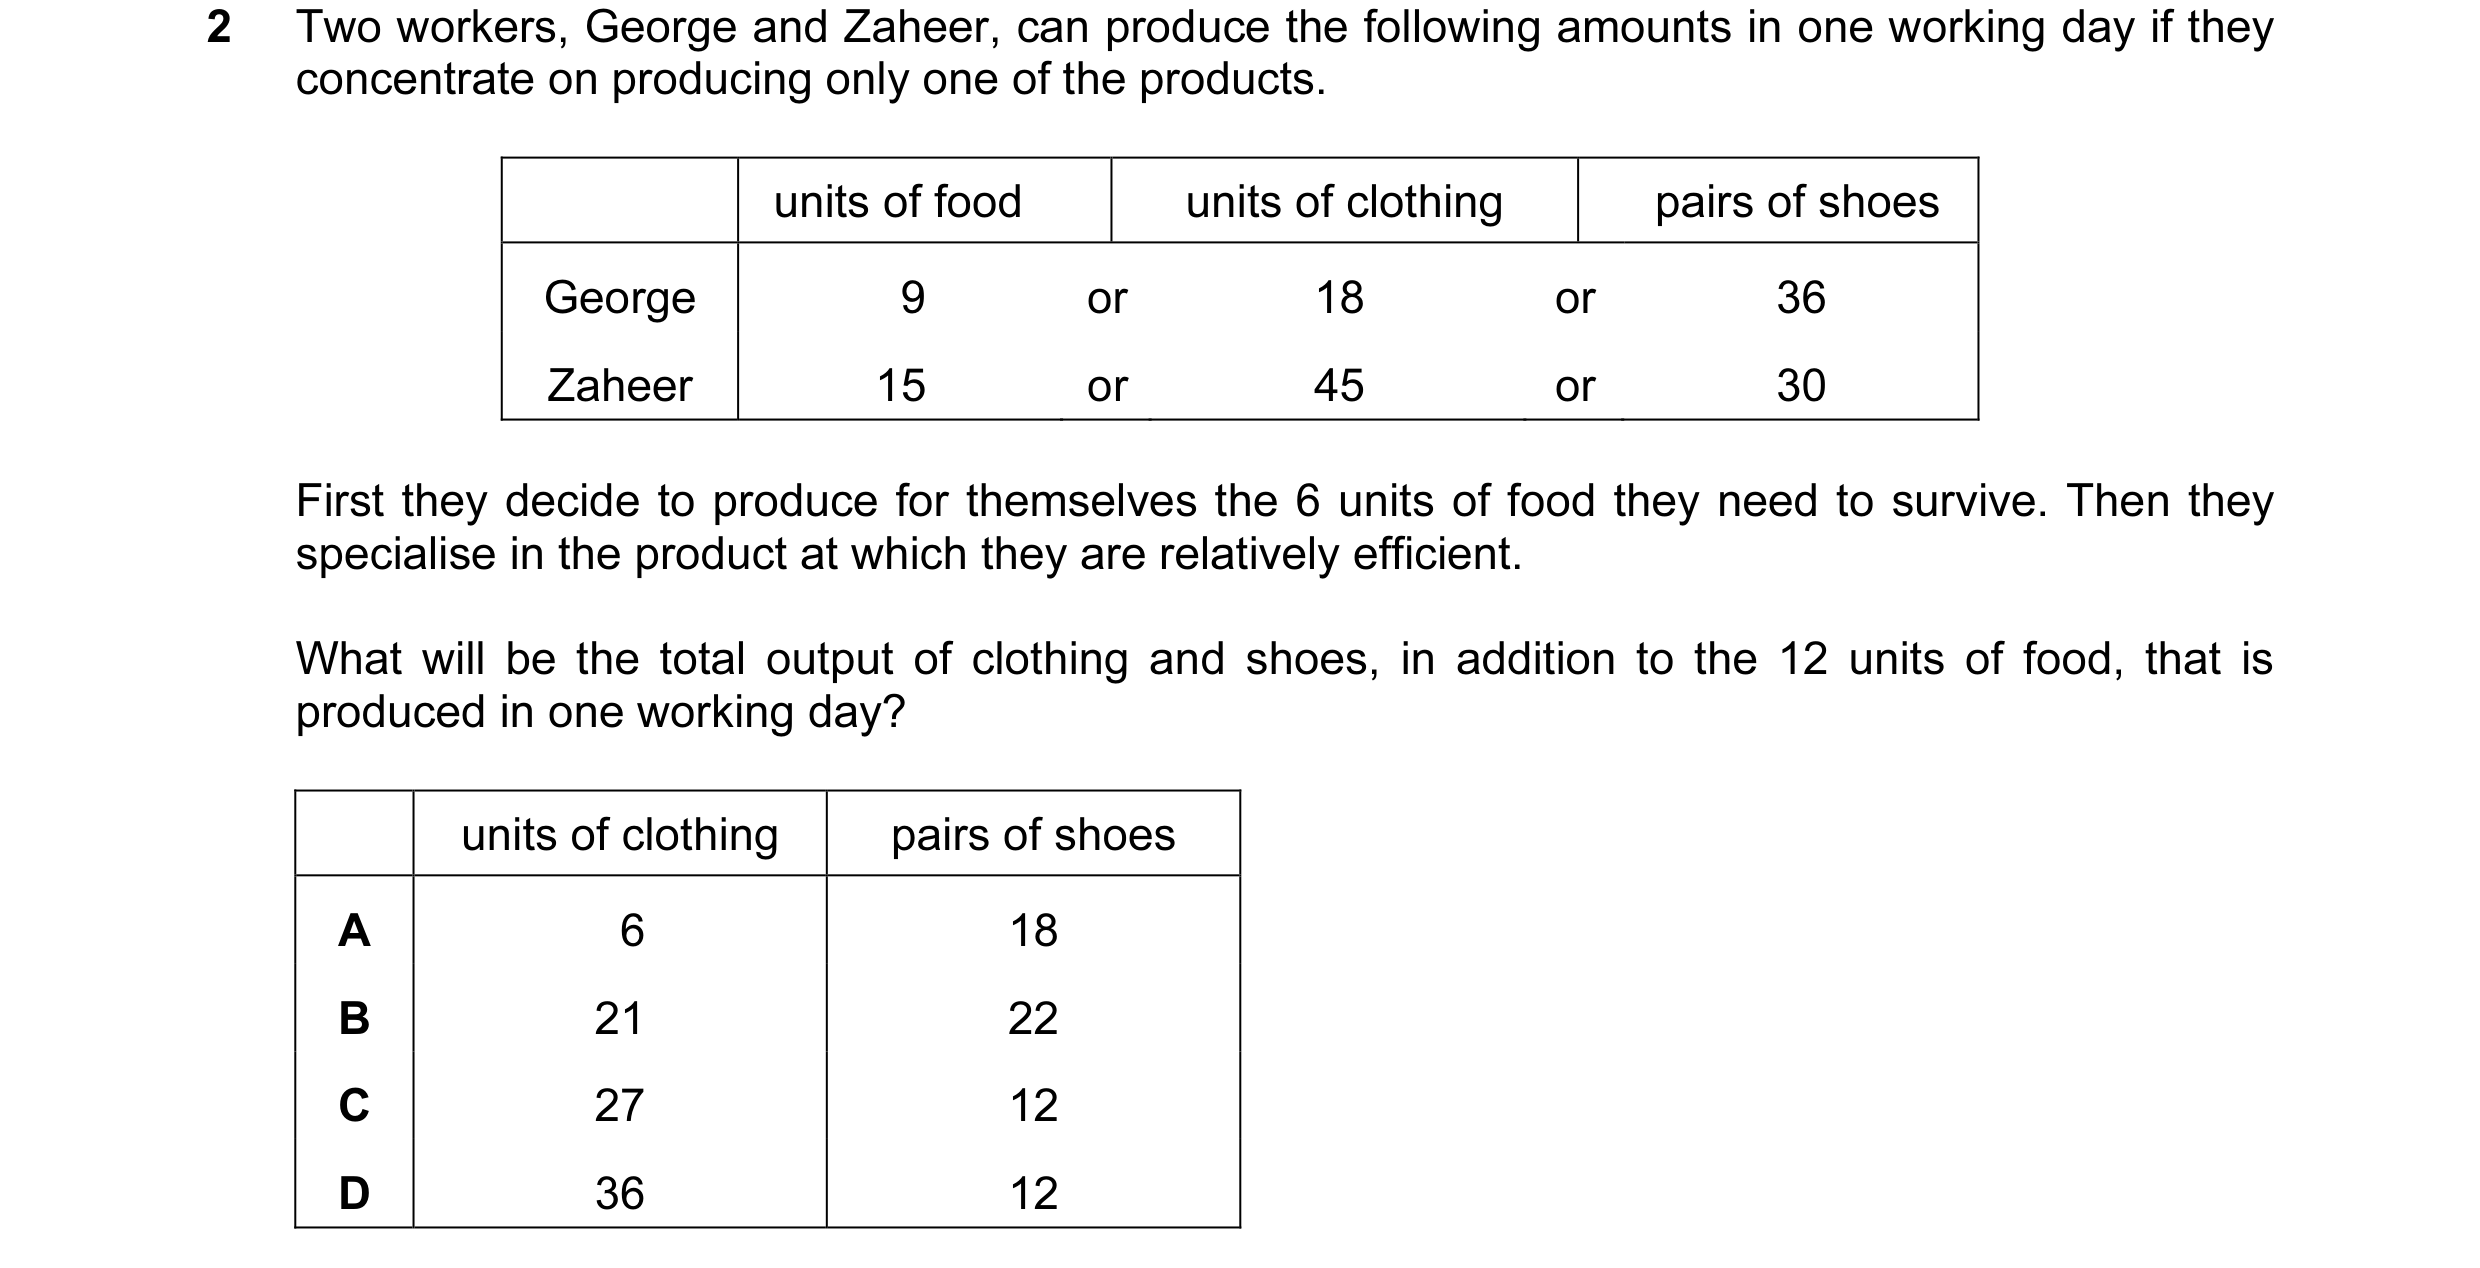
 19 / 59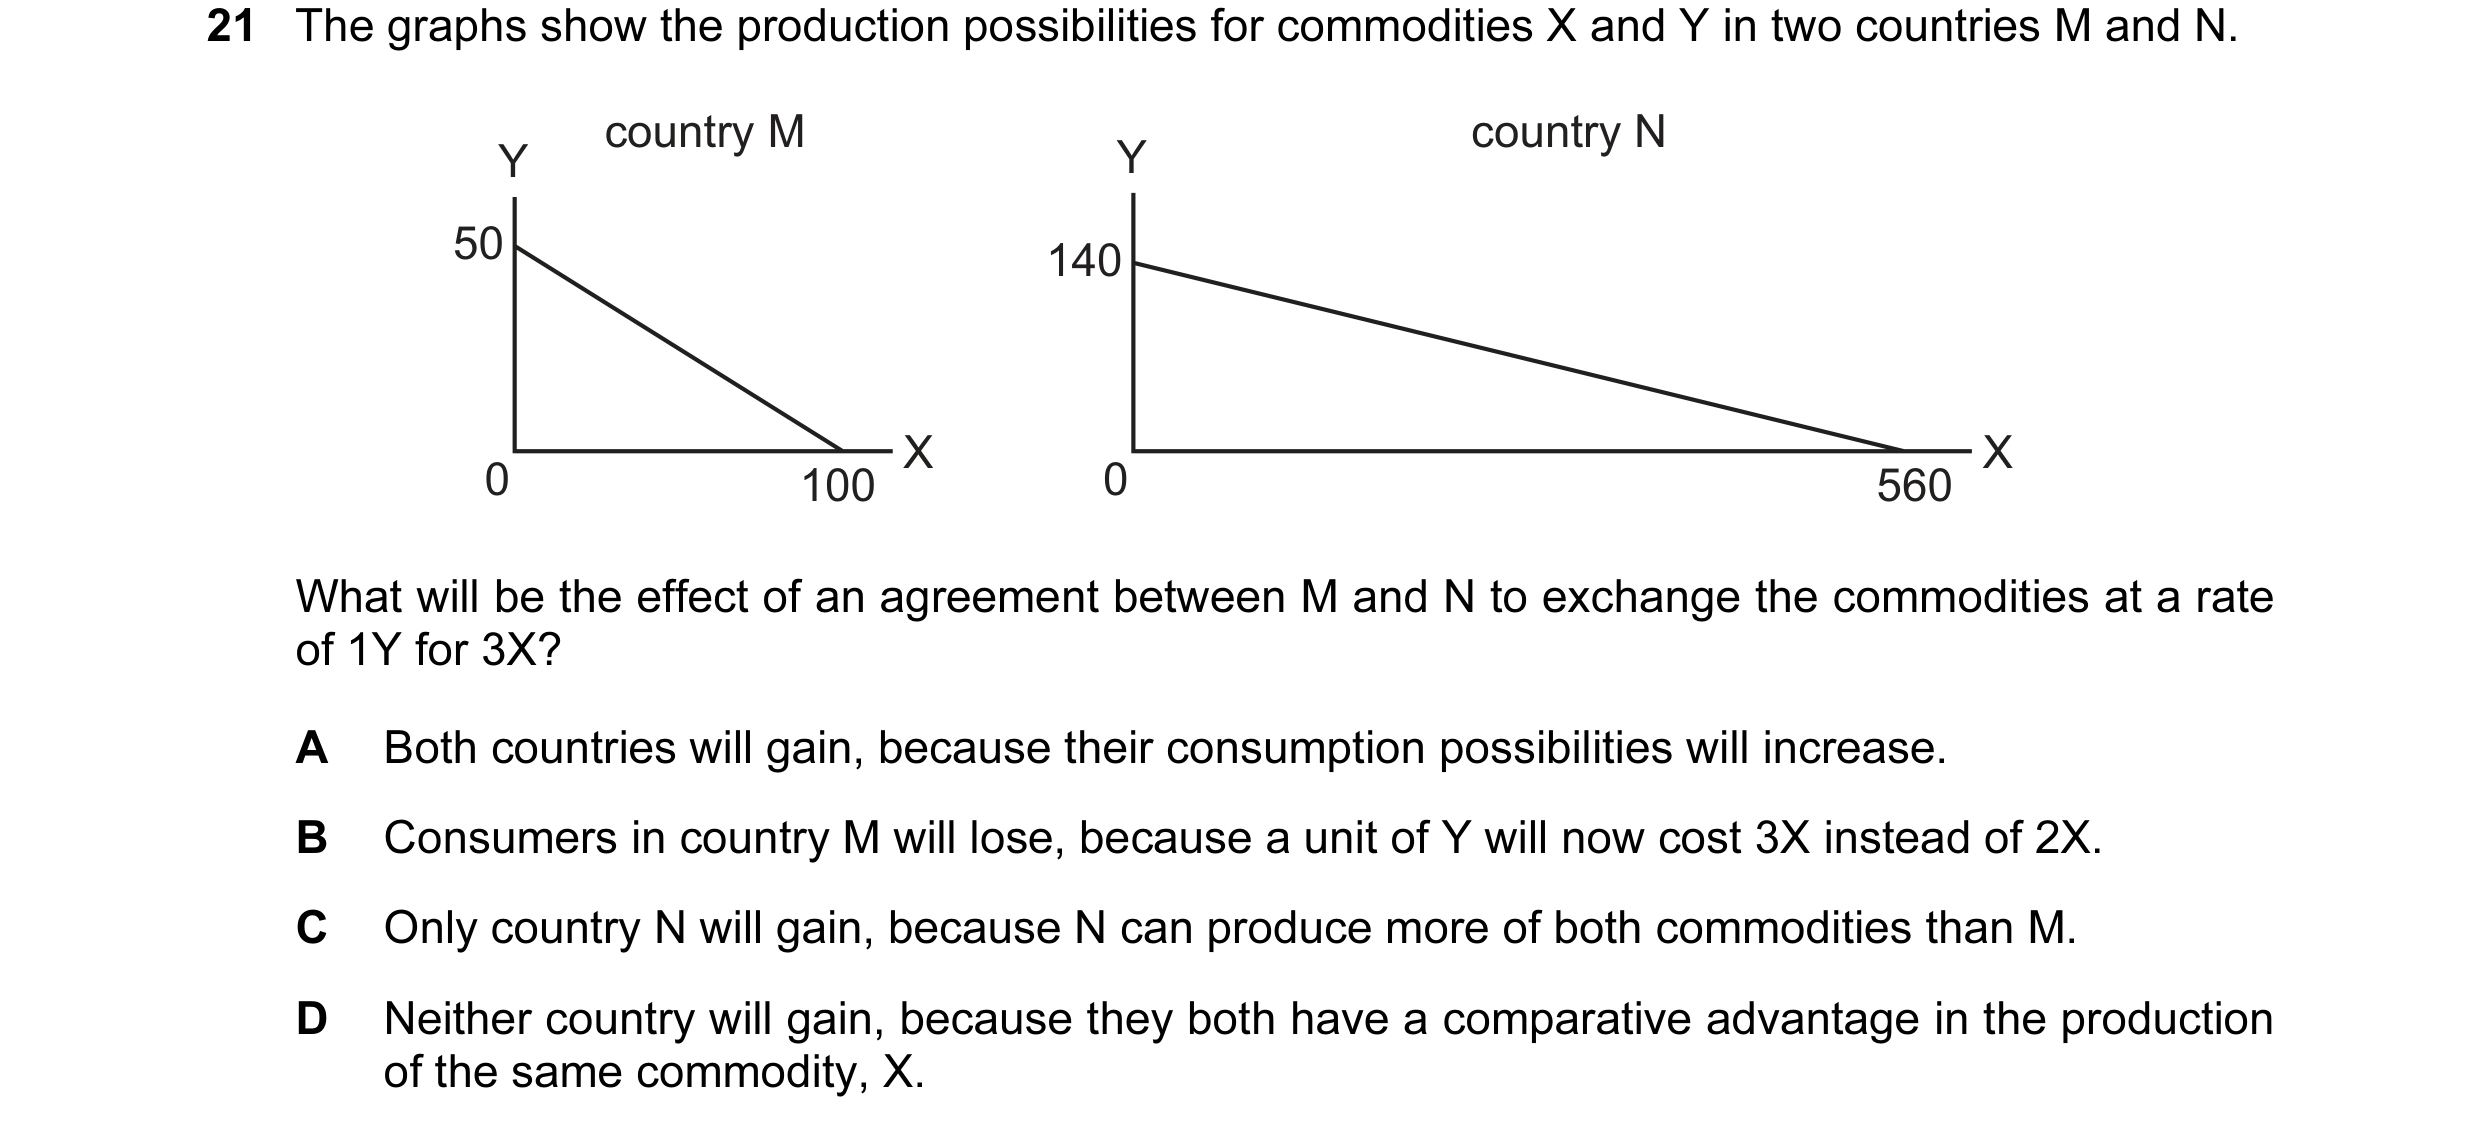
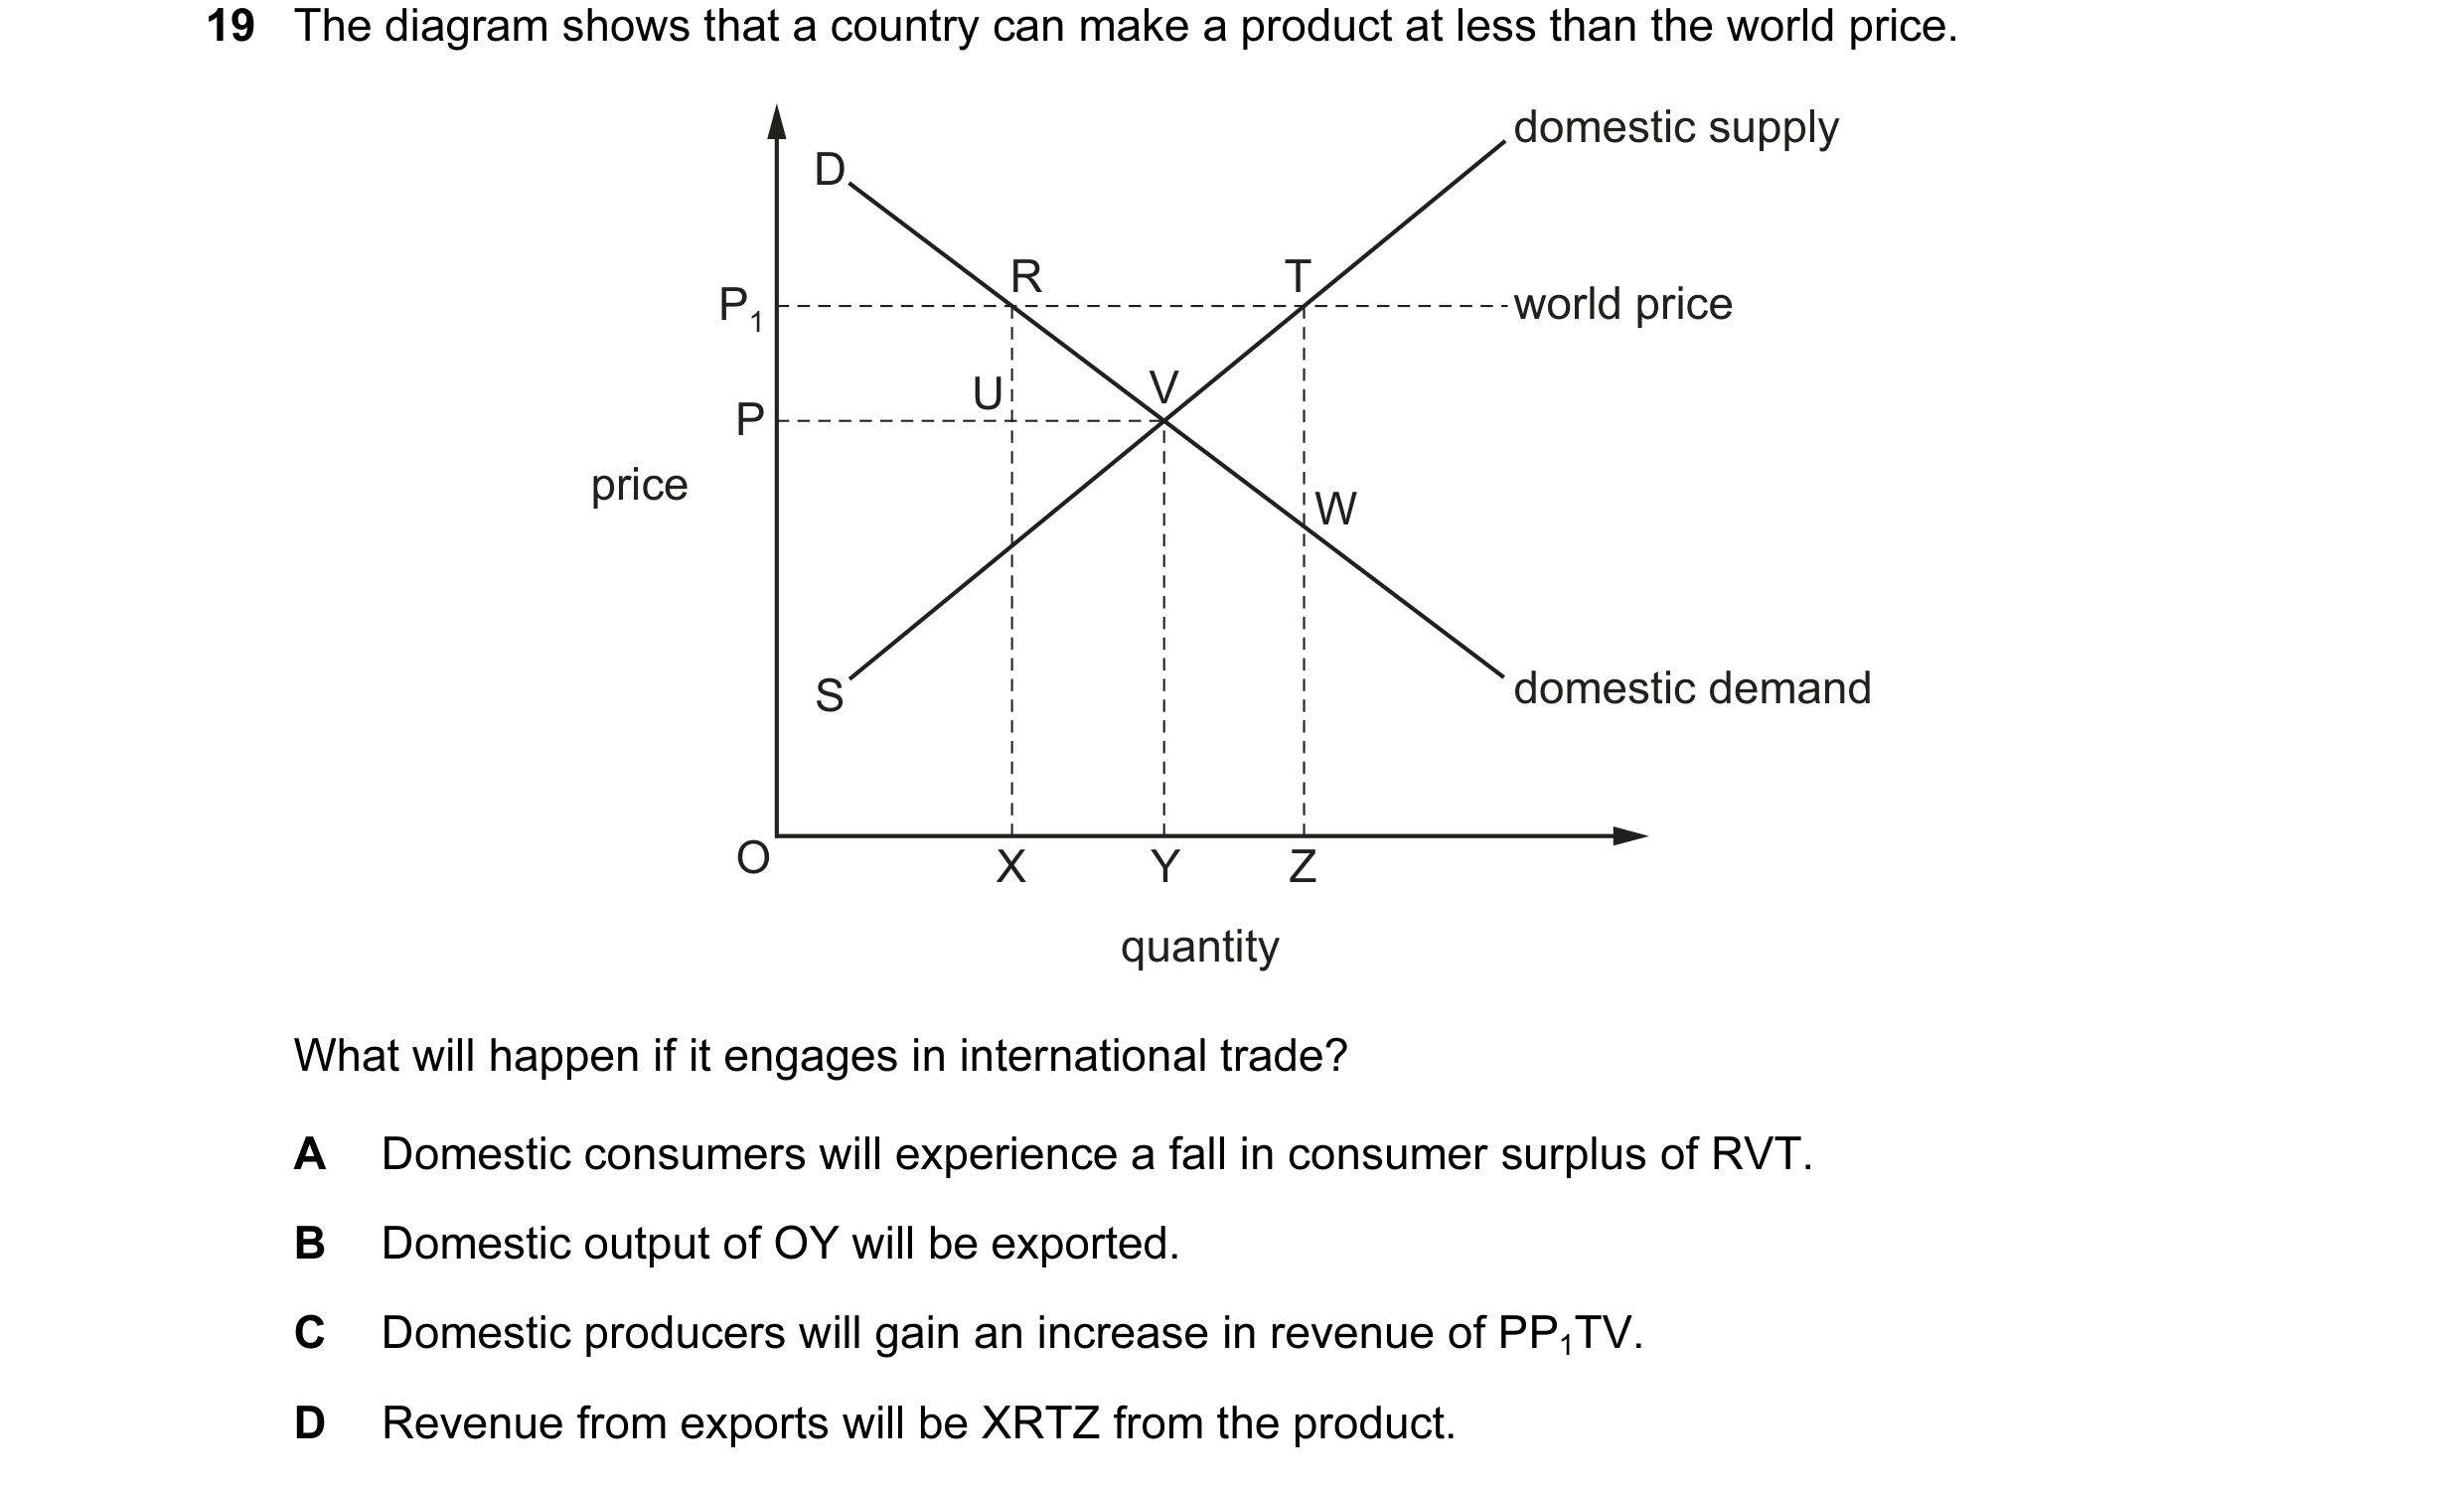
 20 / 59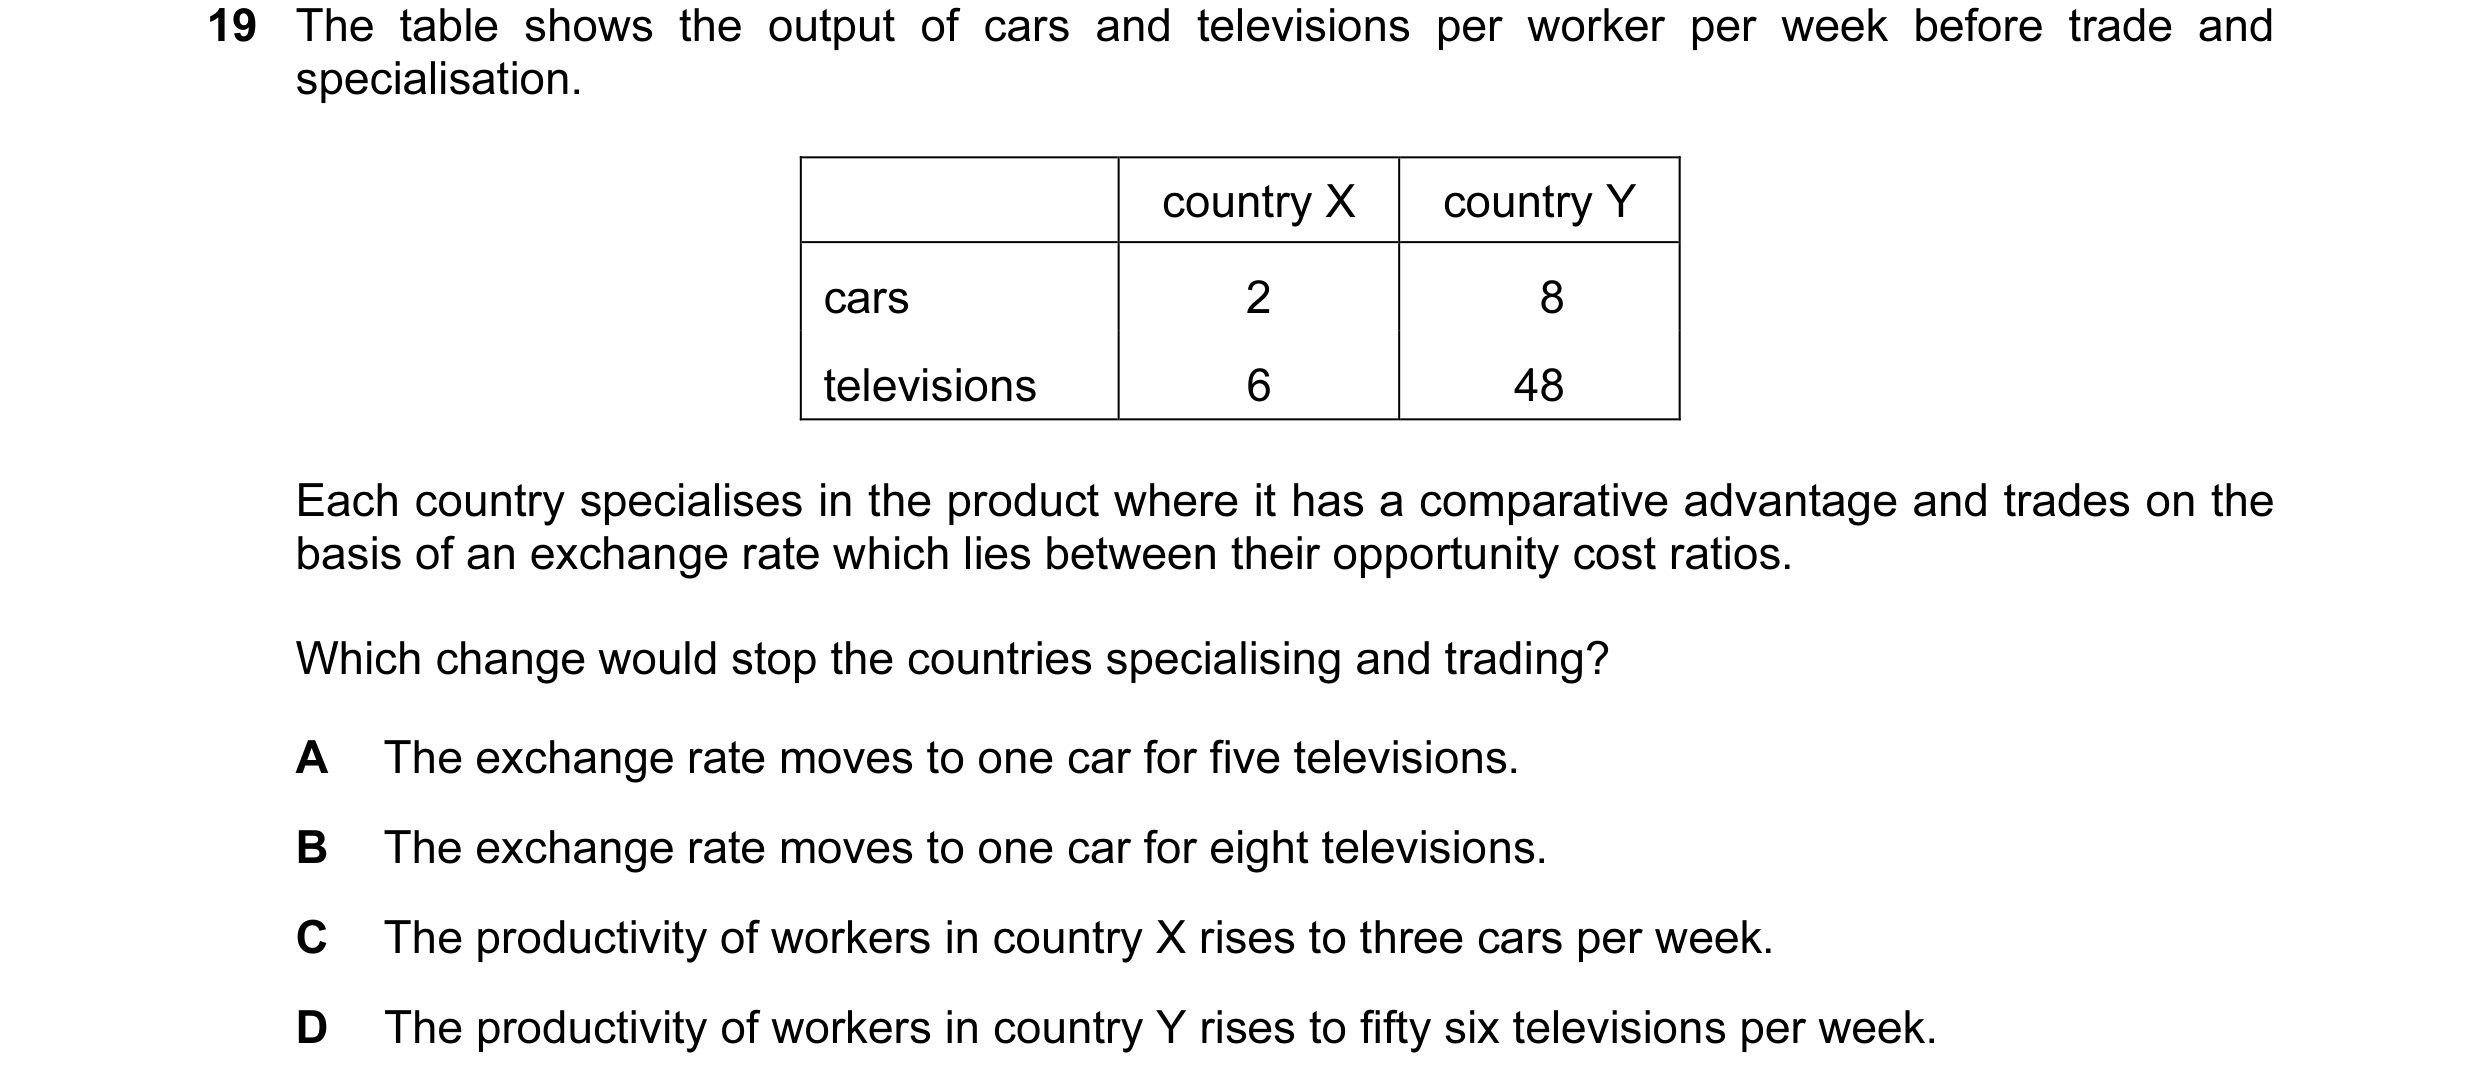

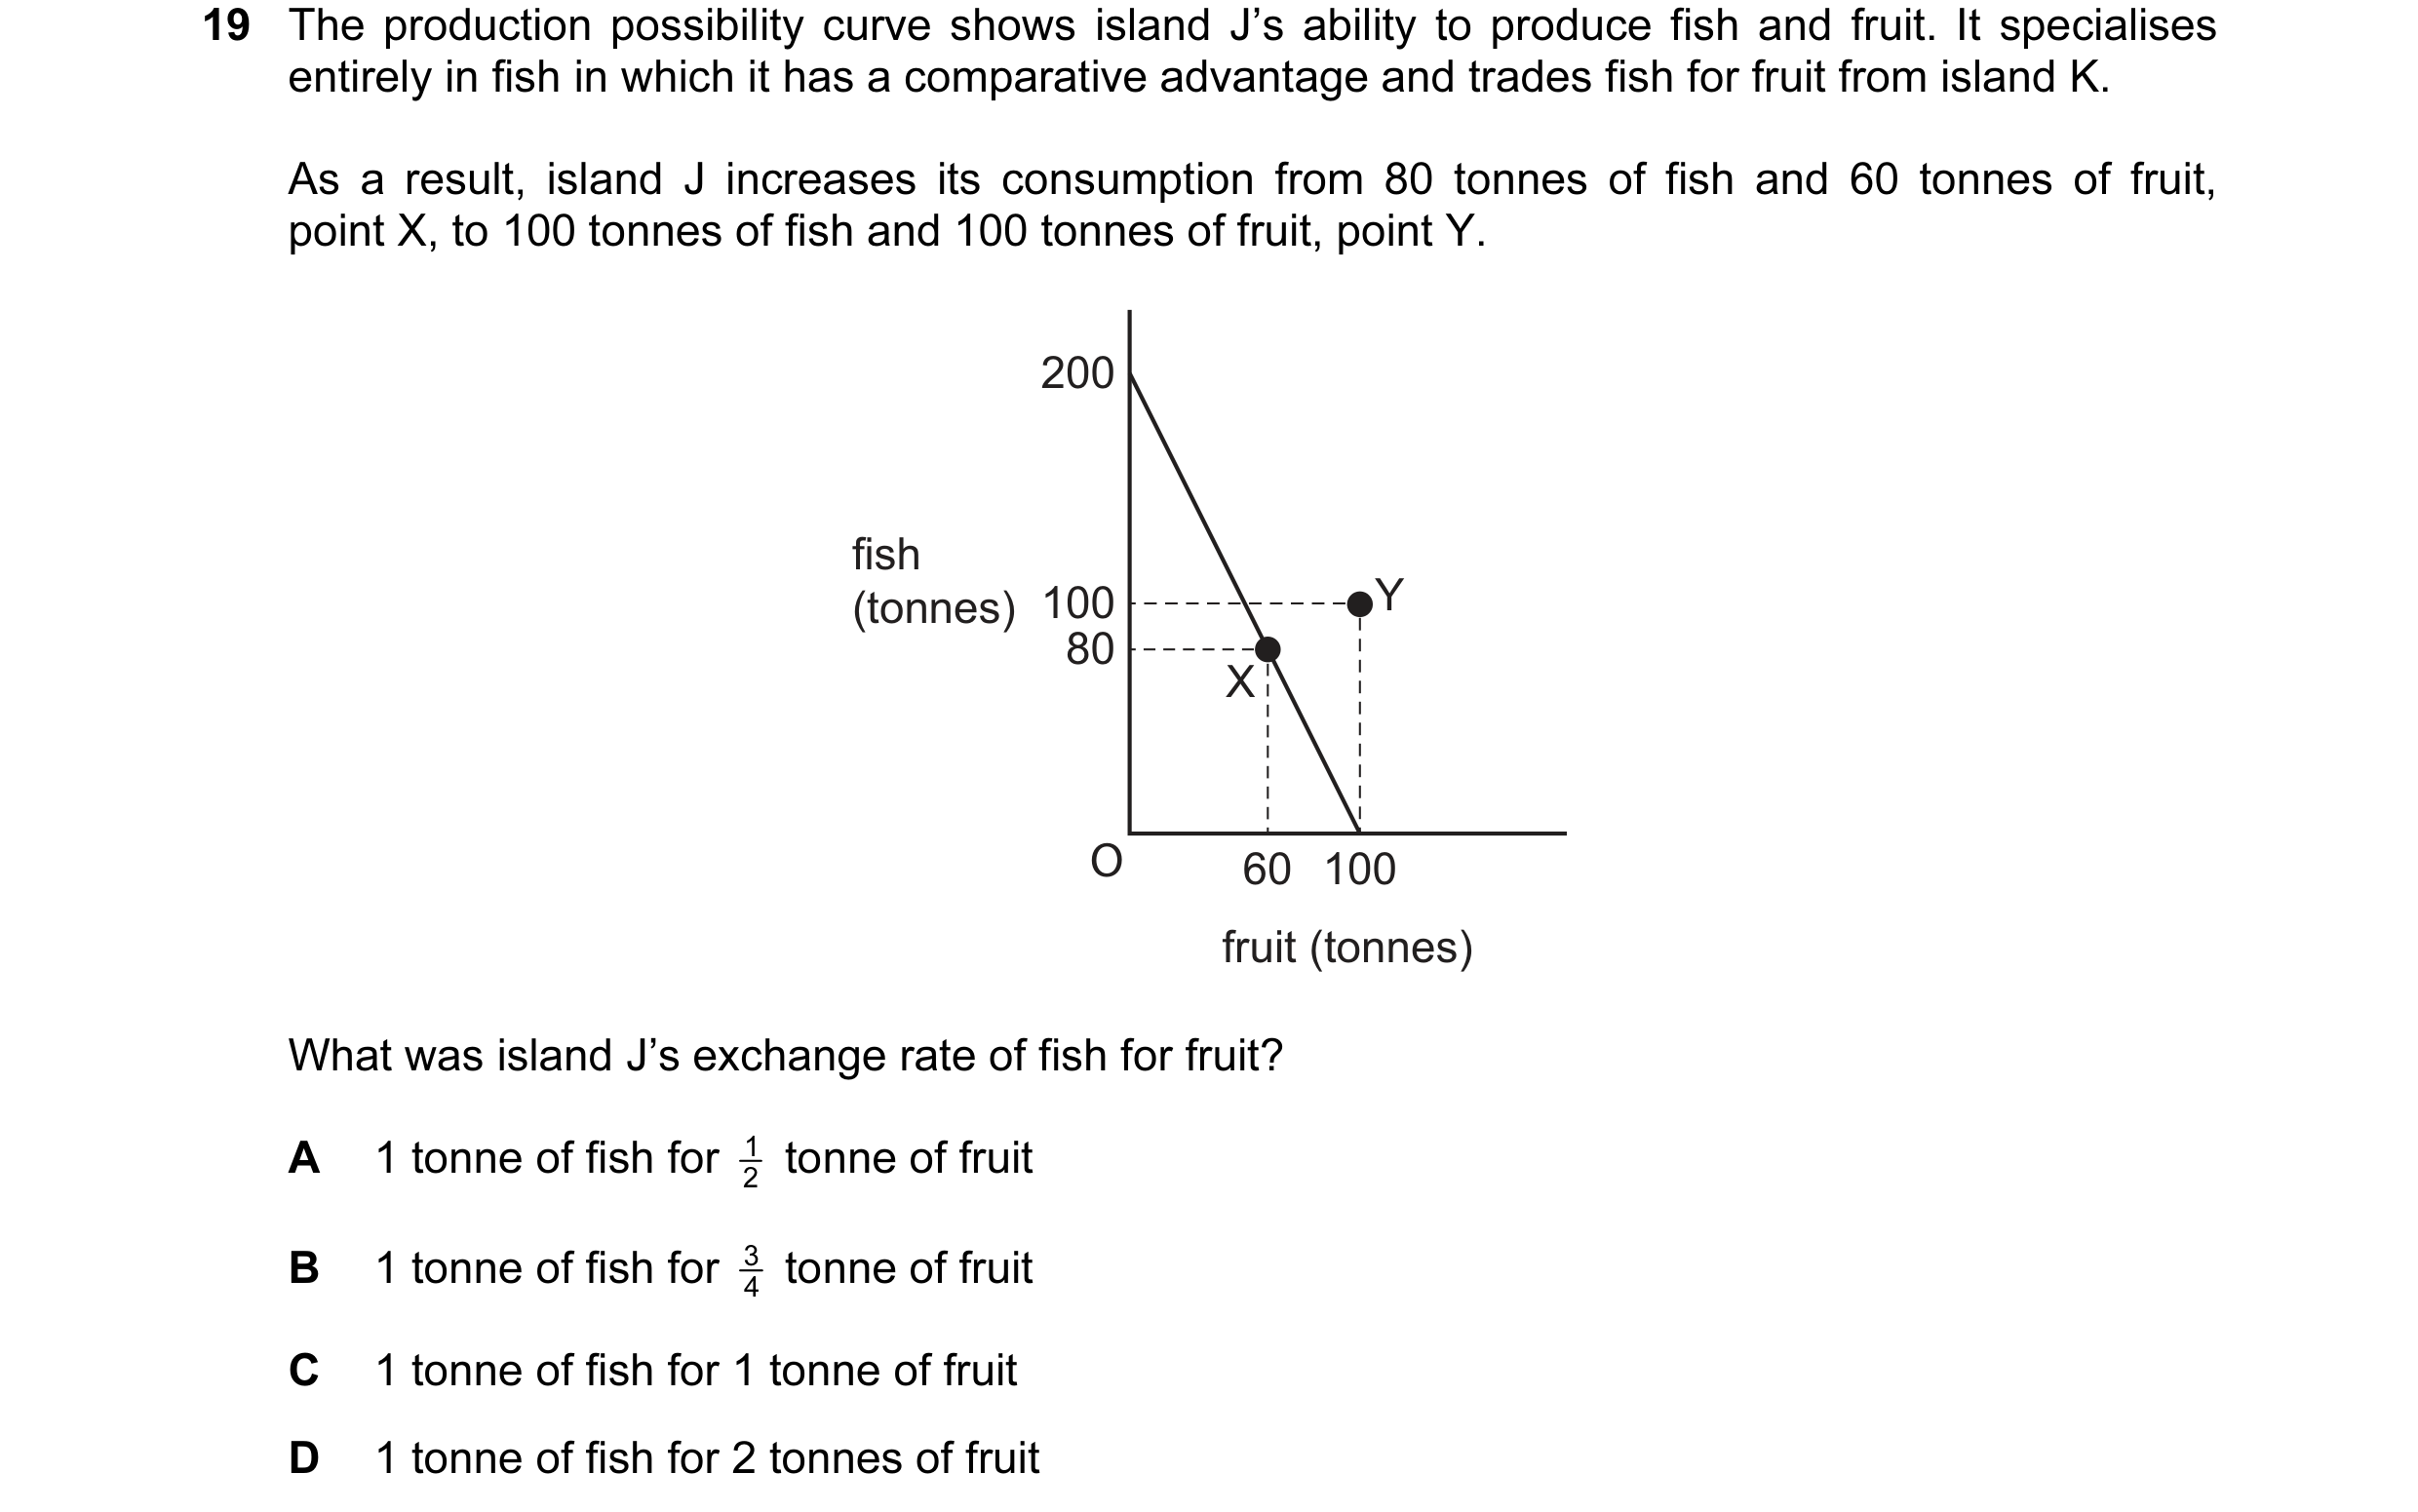 21 / 59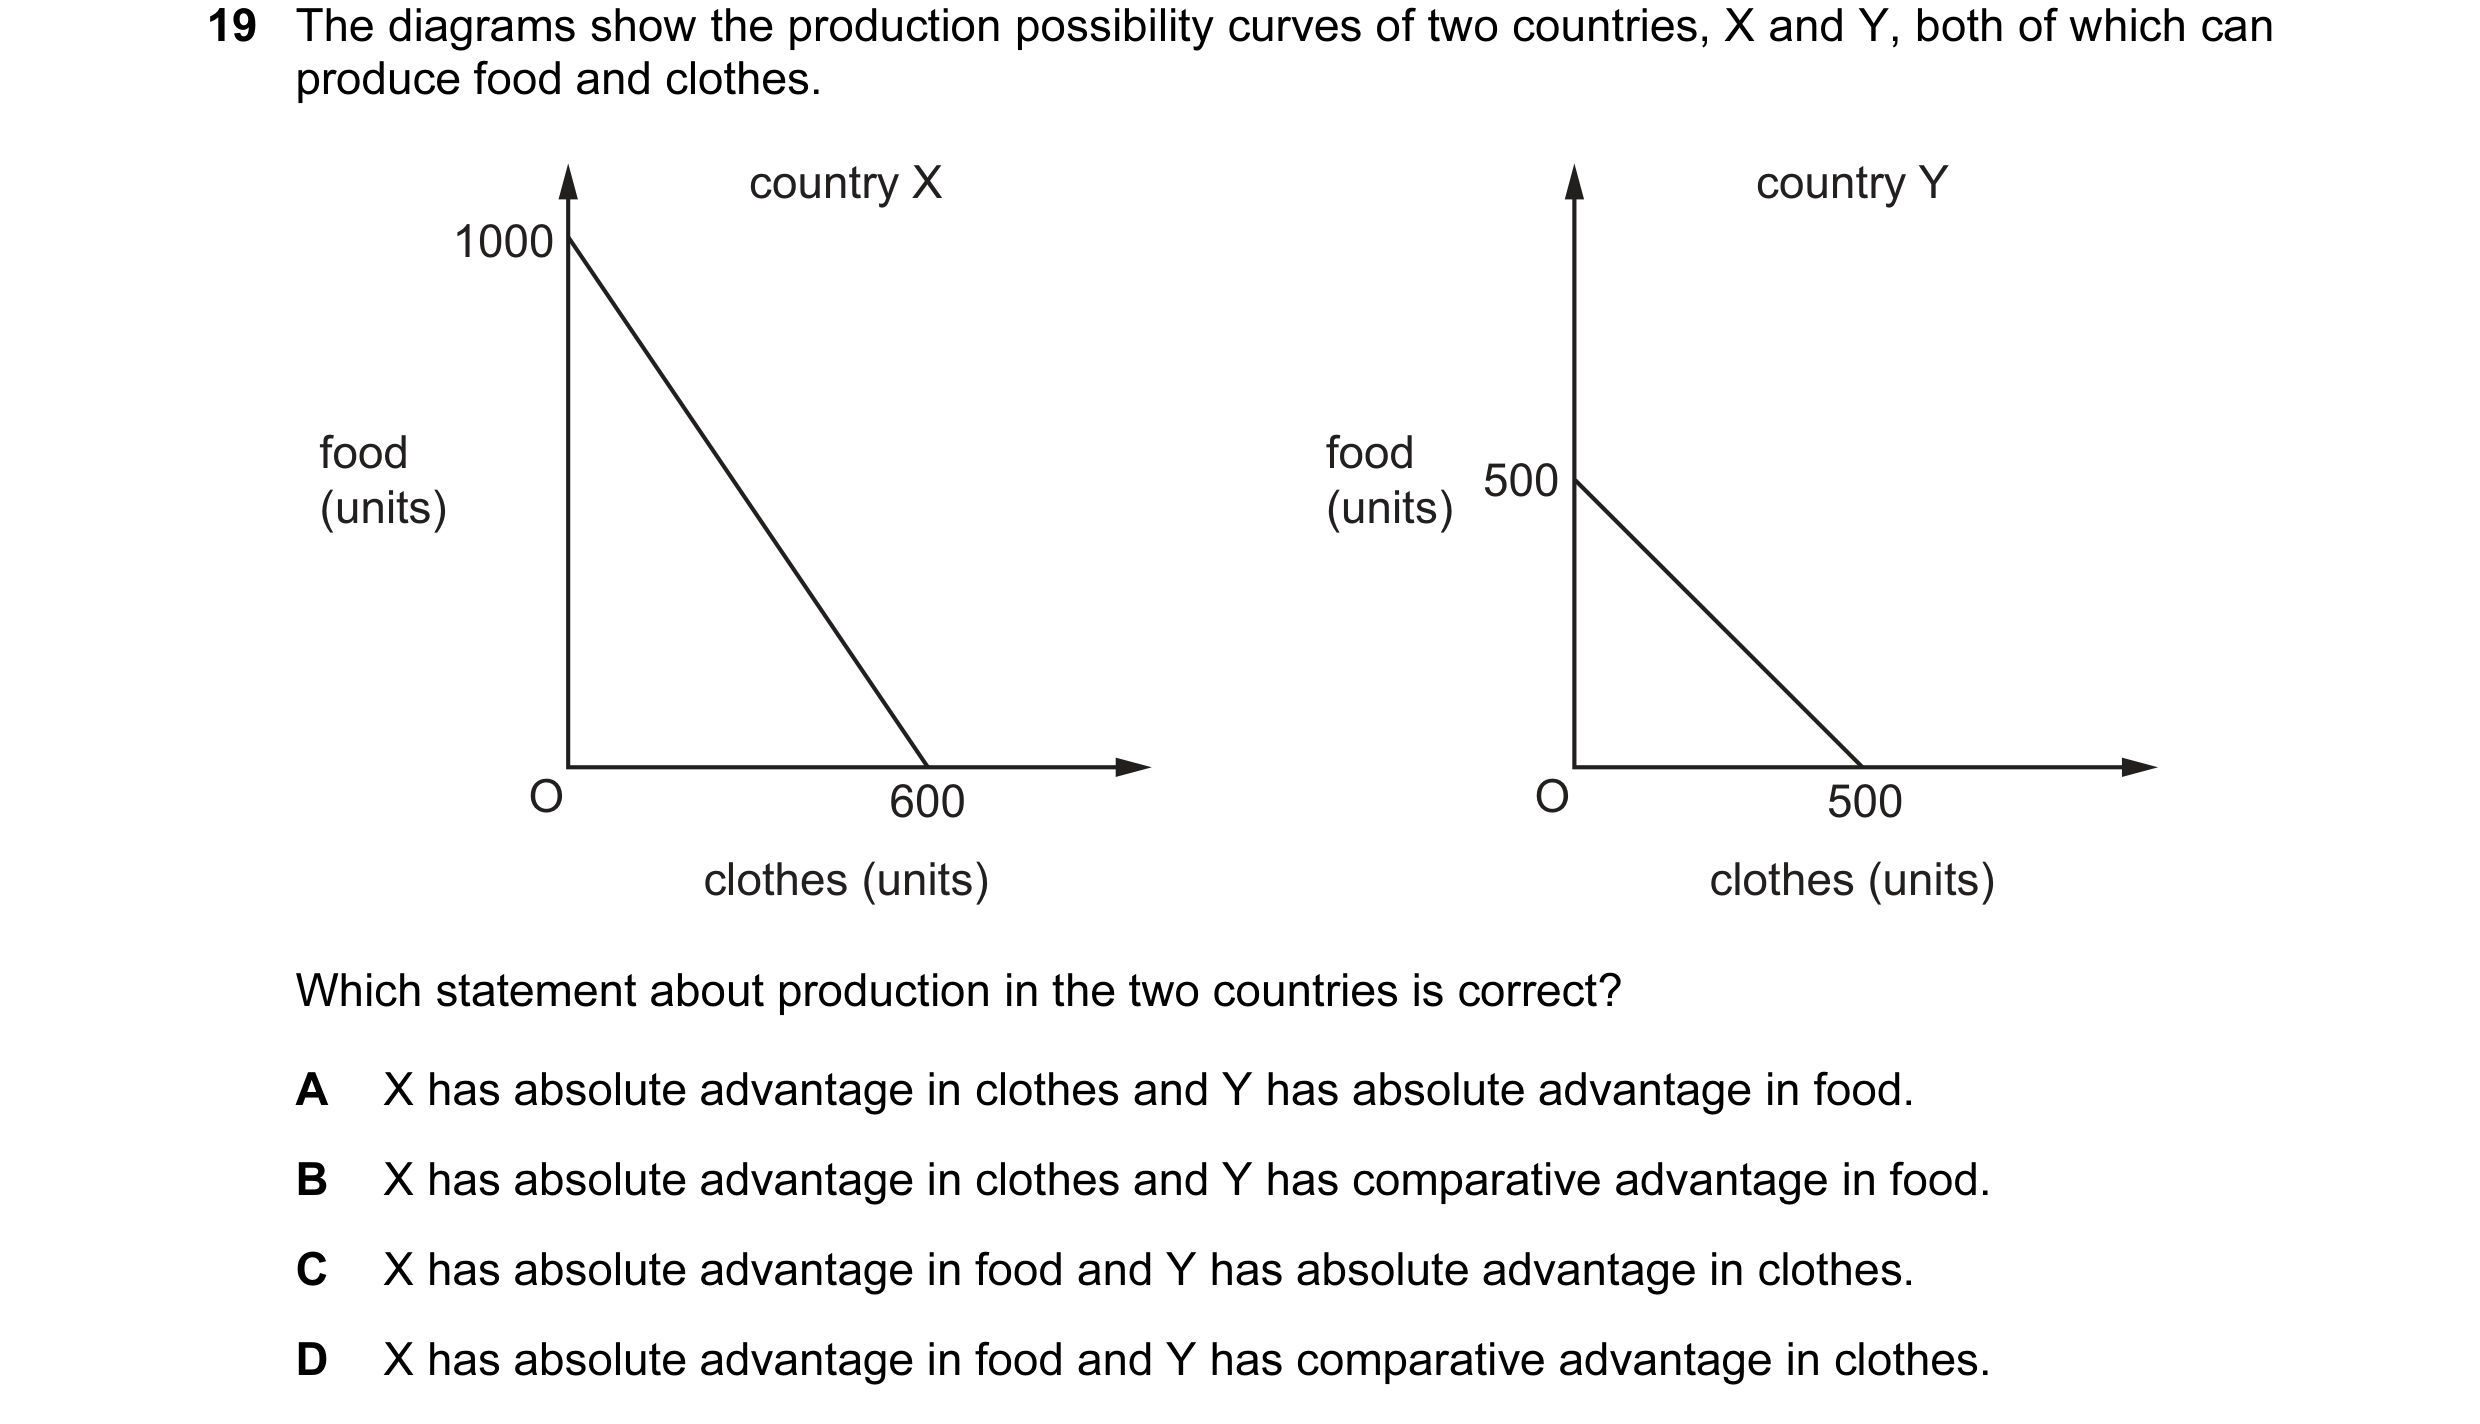

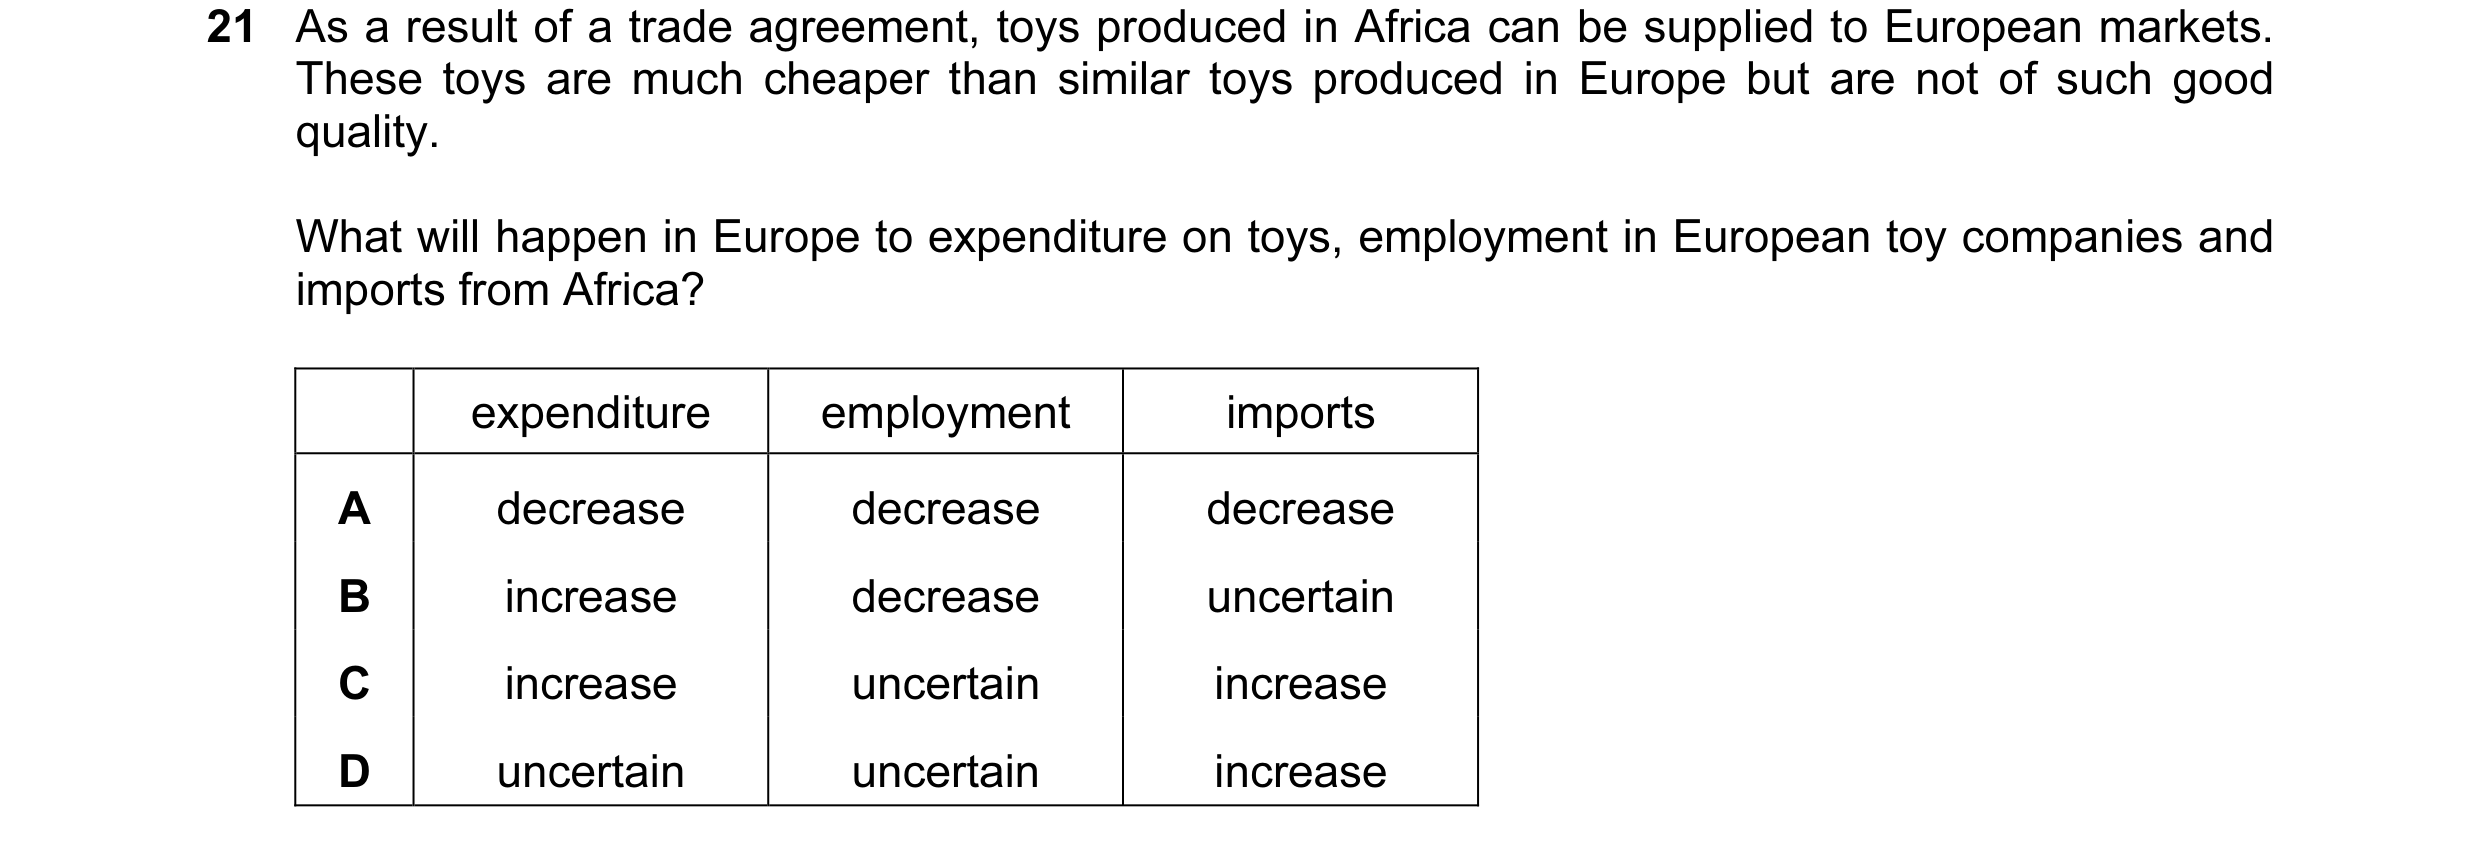 22 / 59
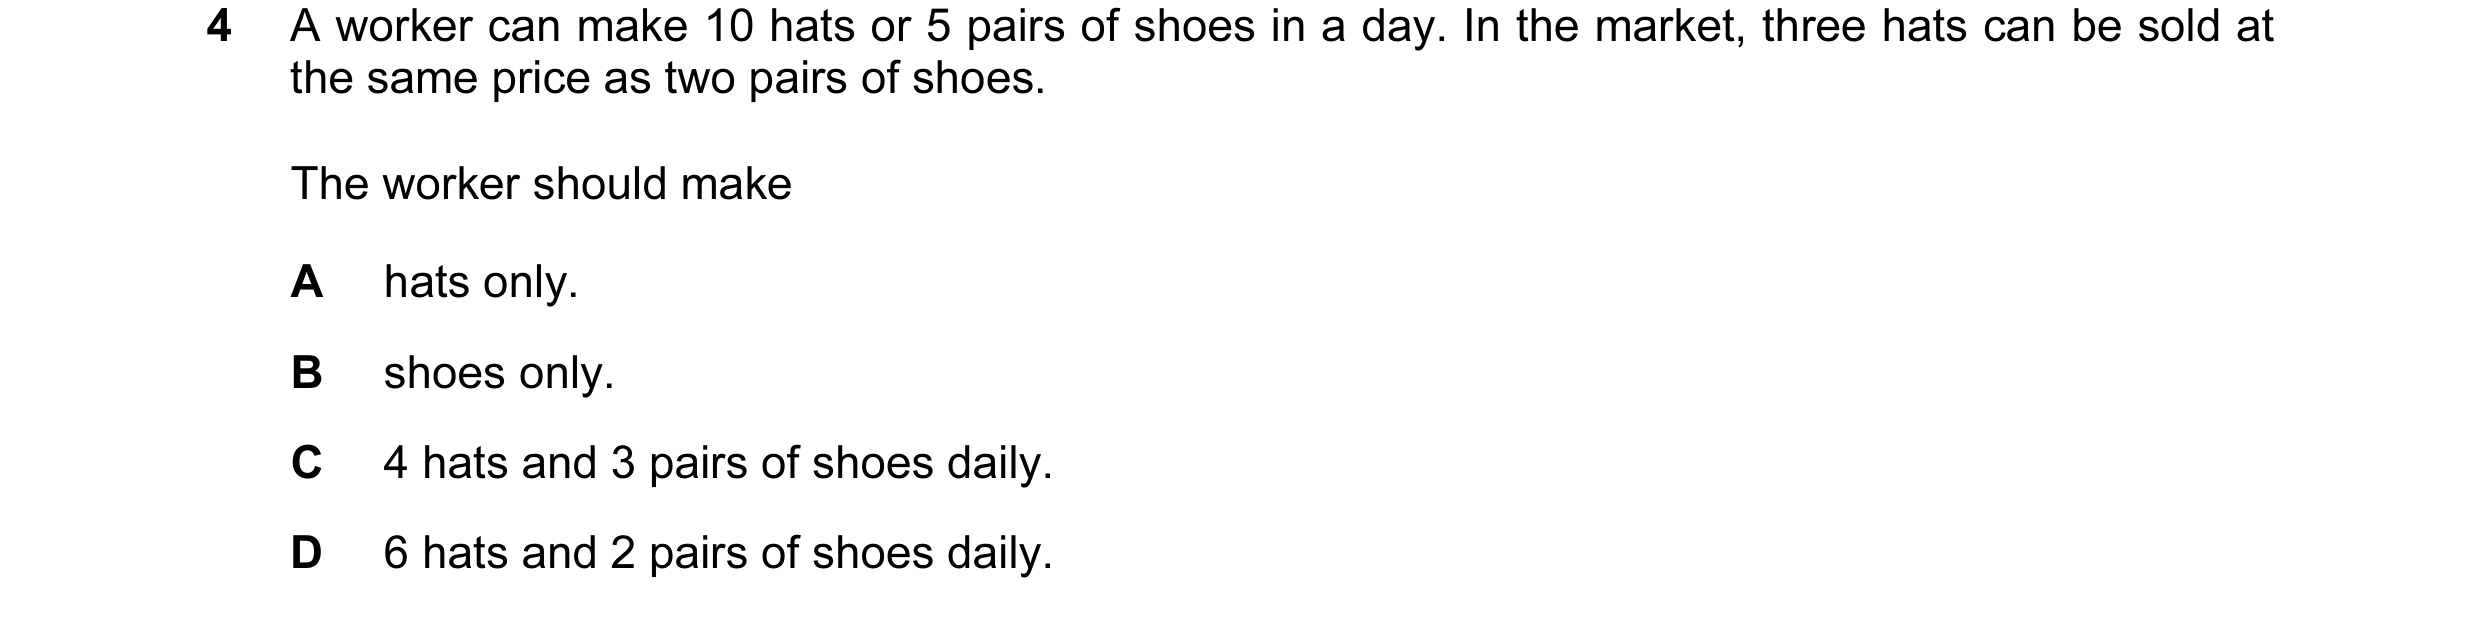
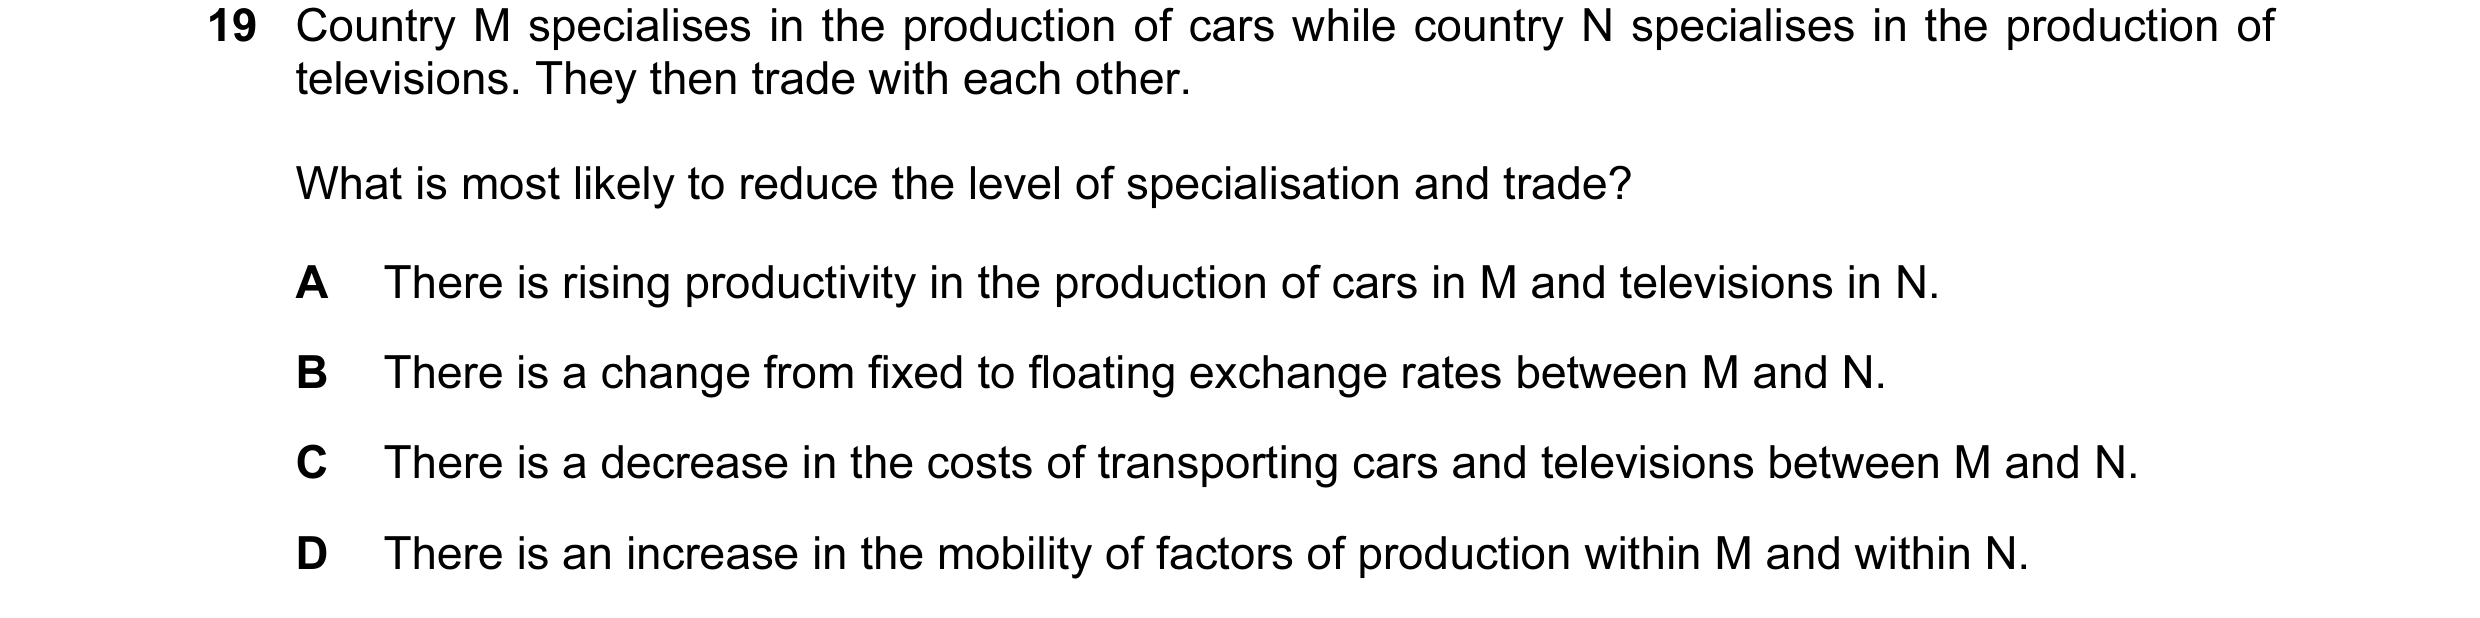
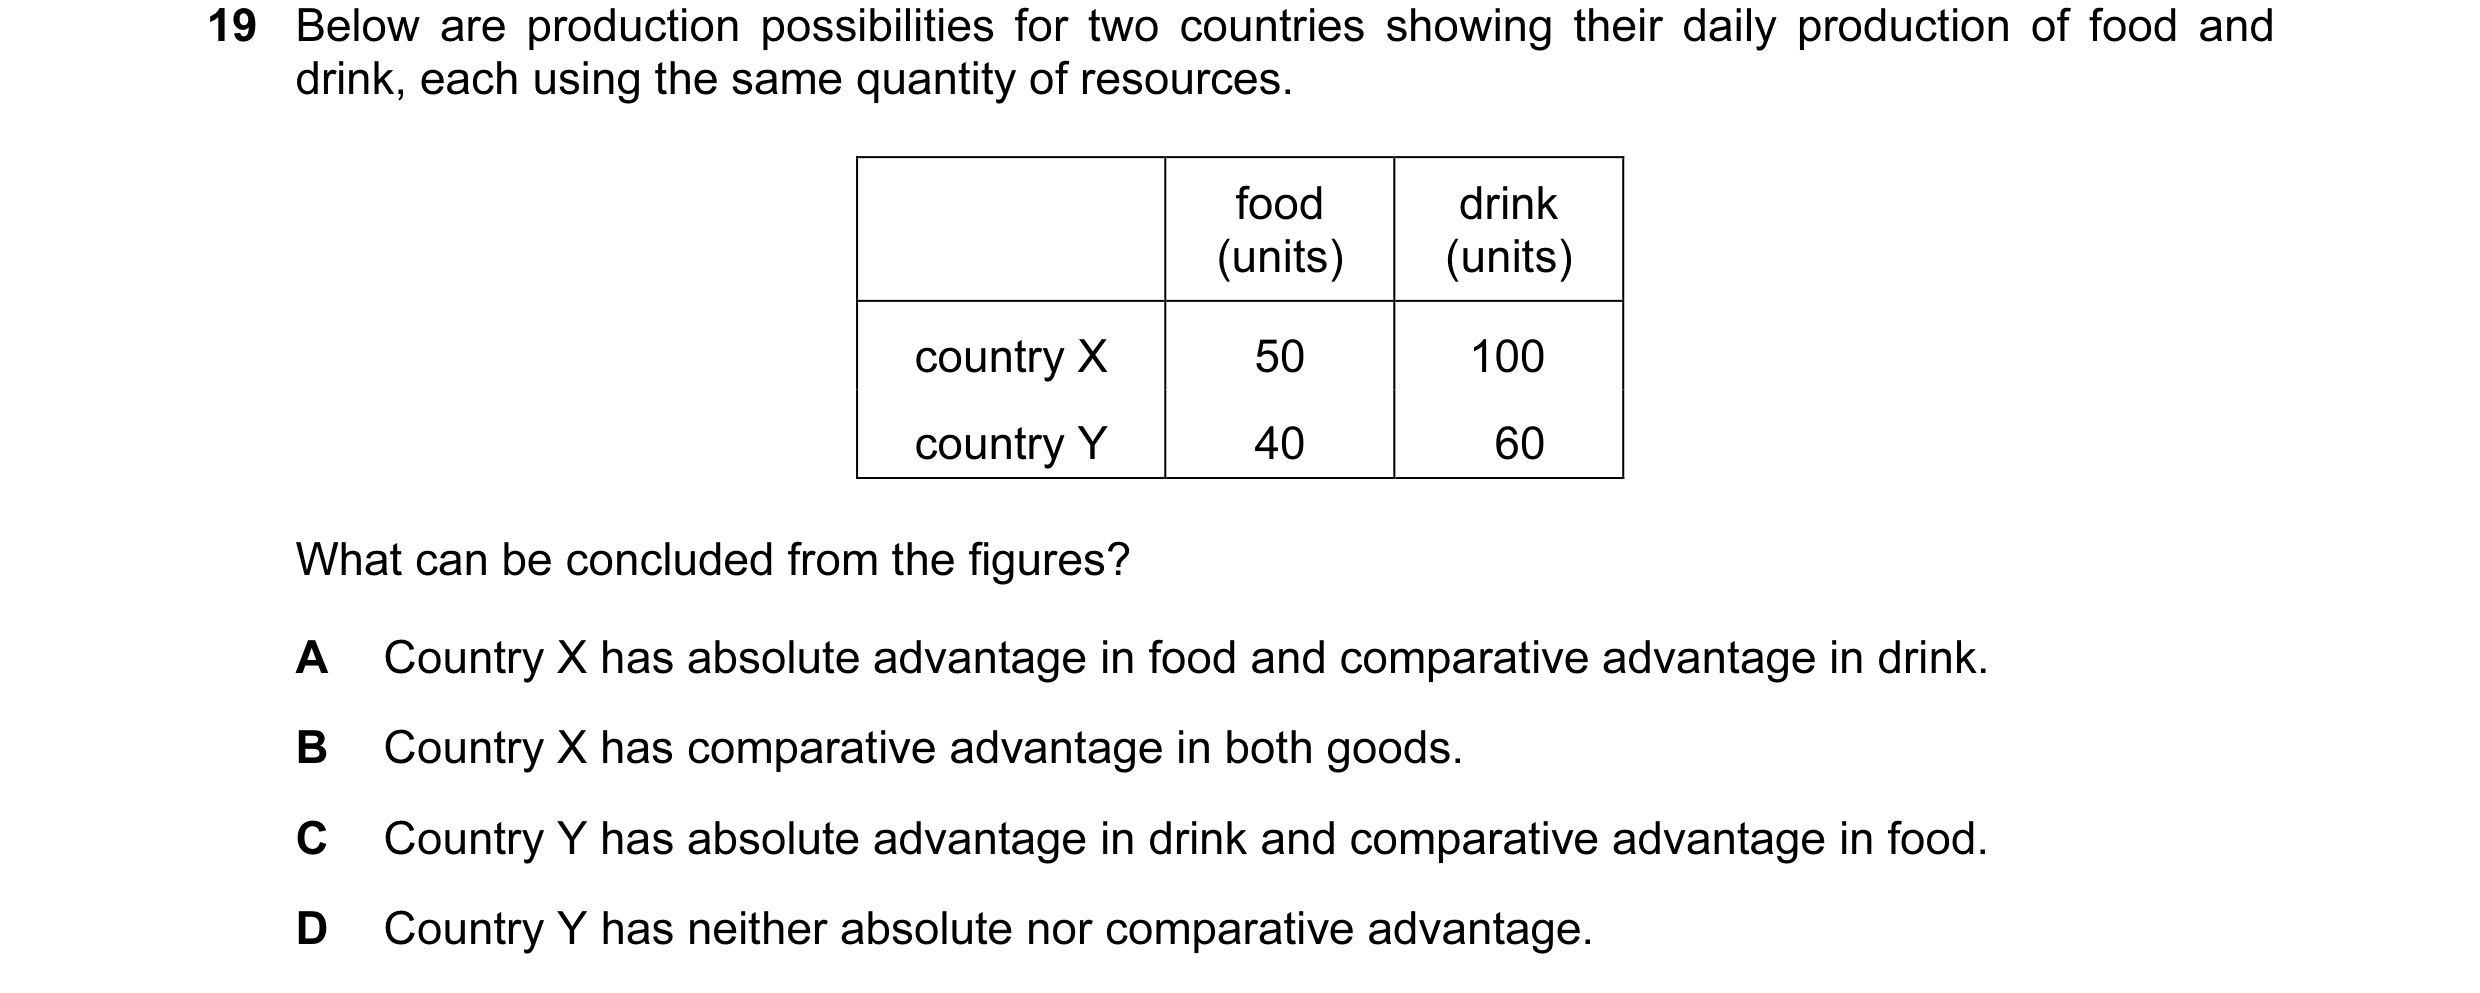 23 / 59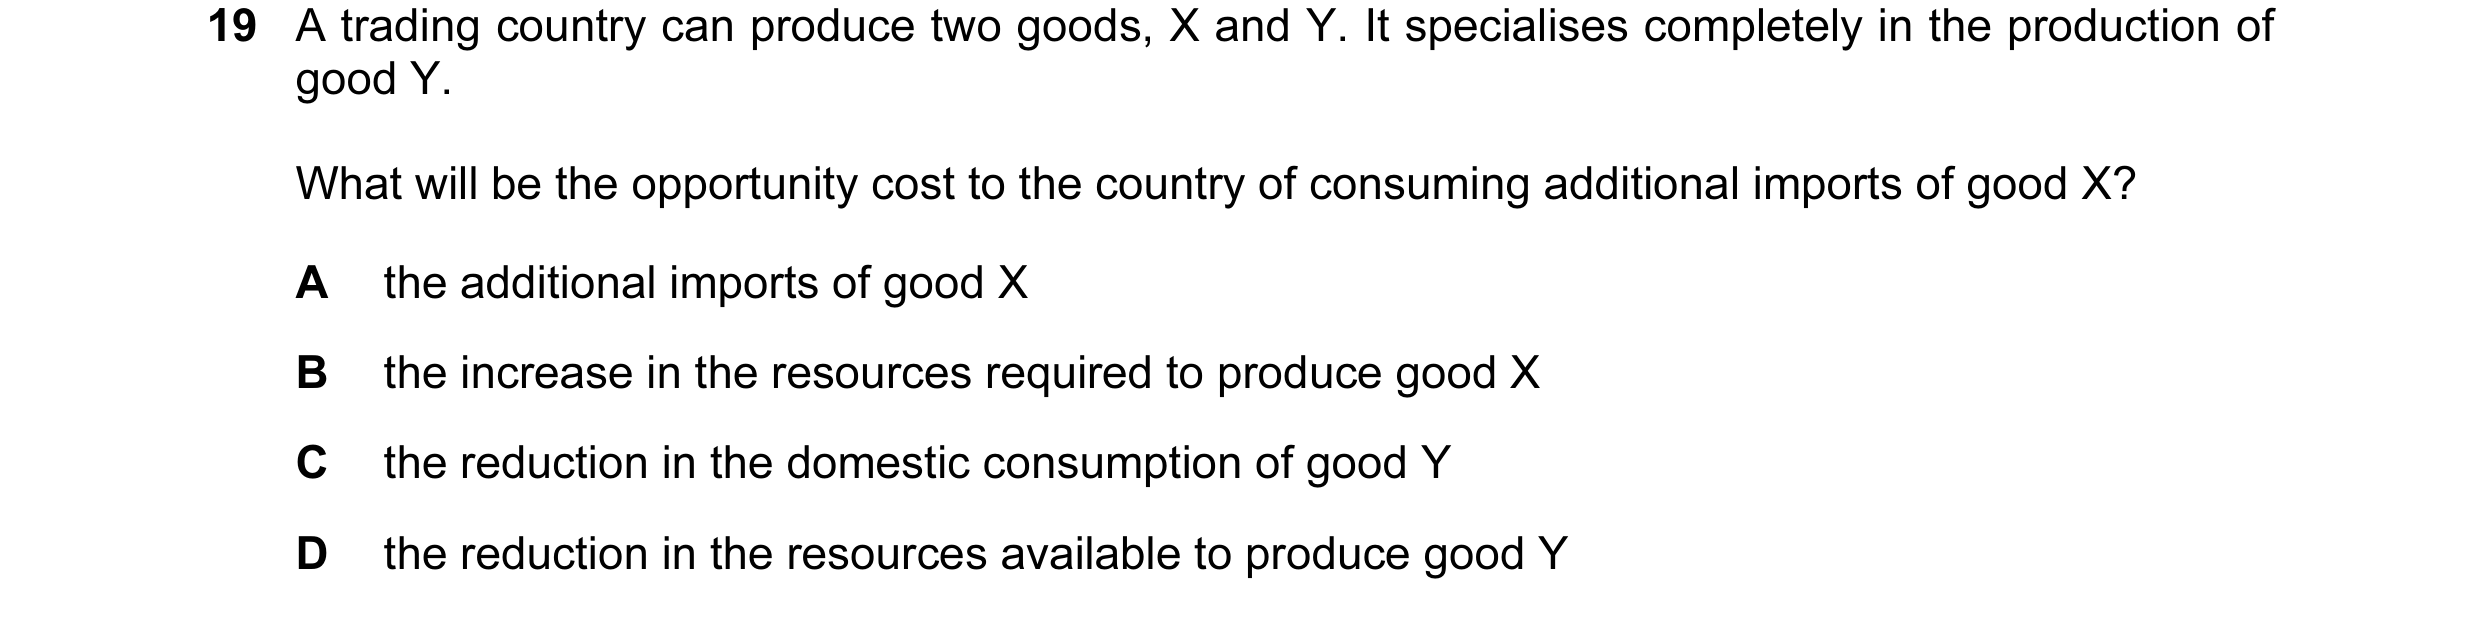
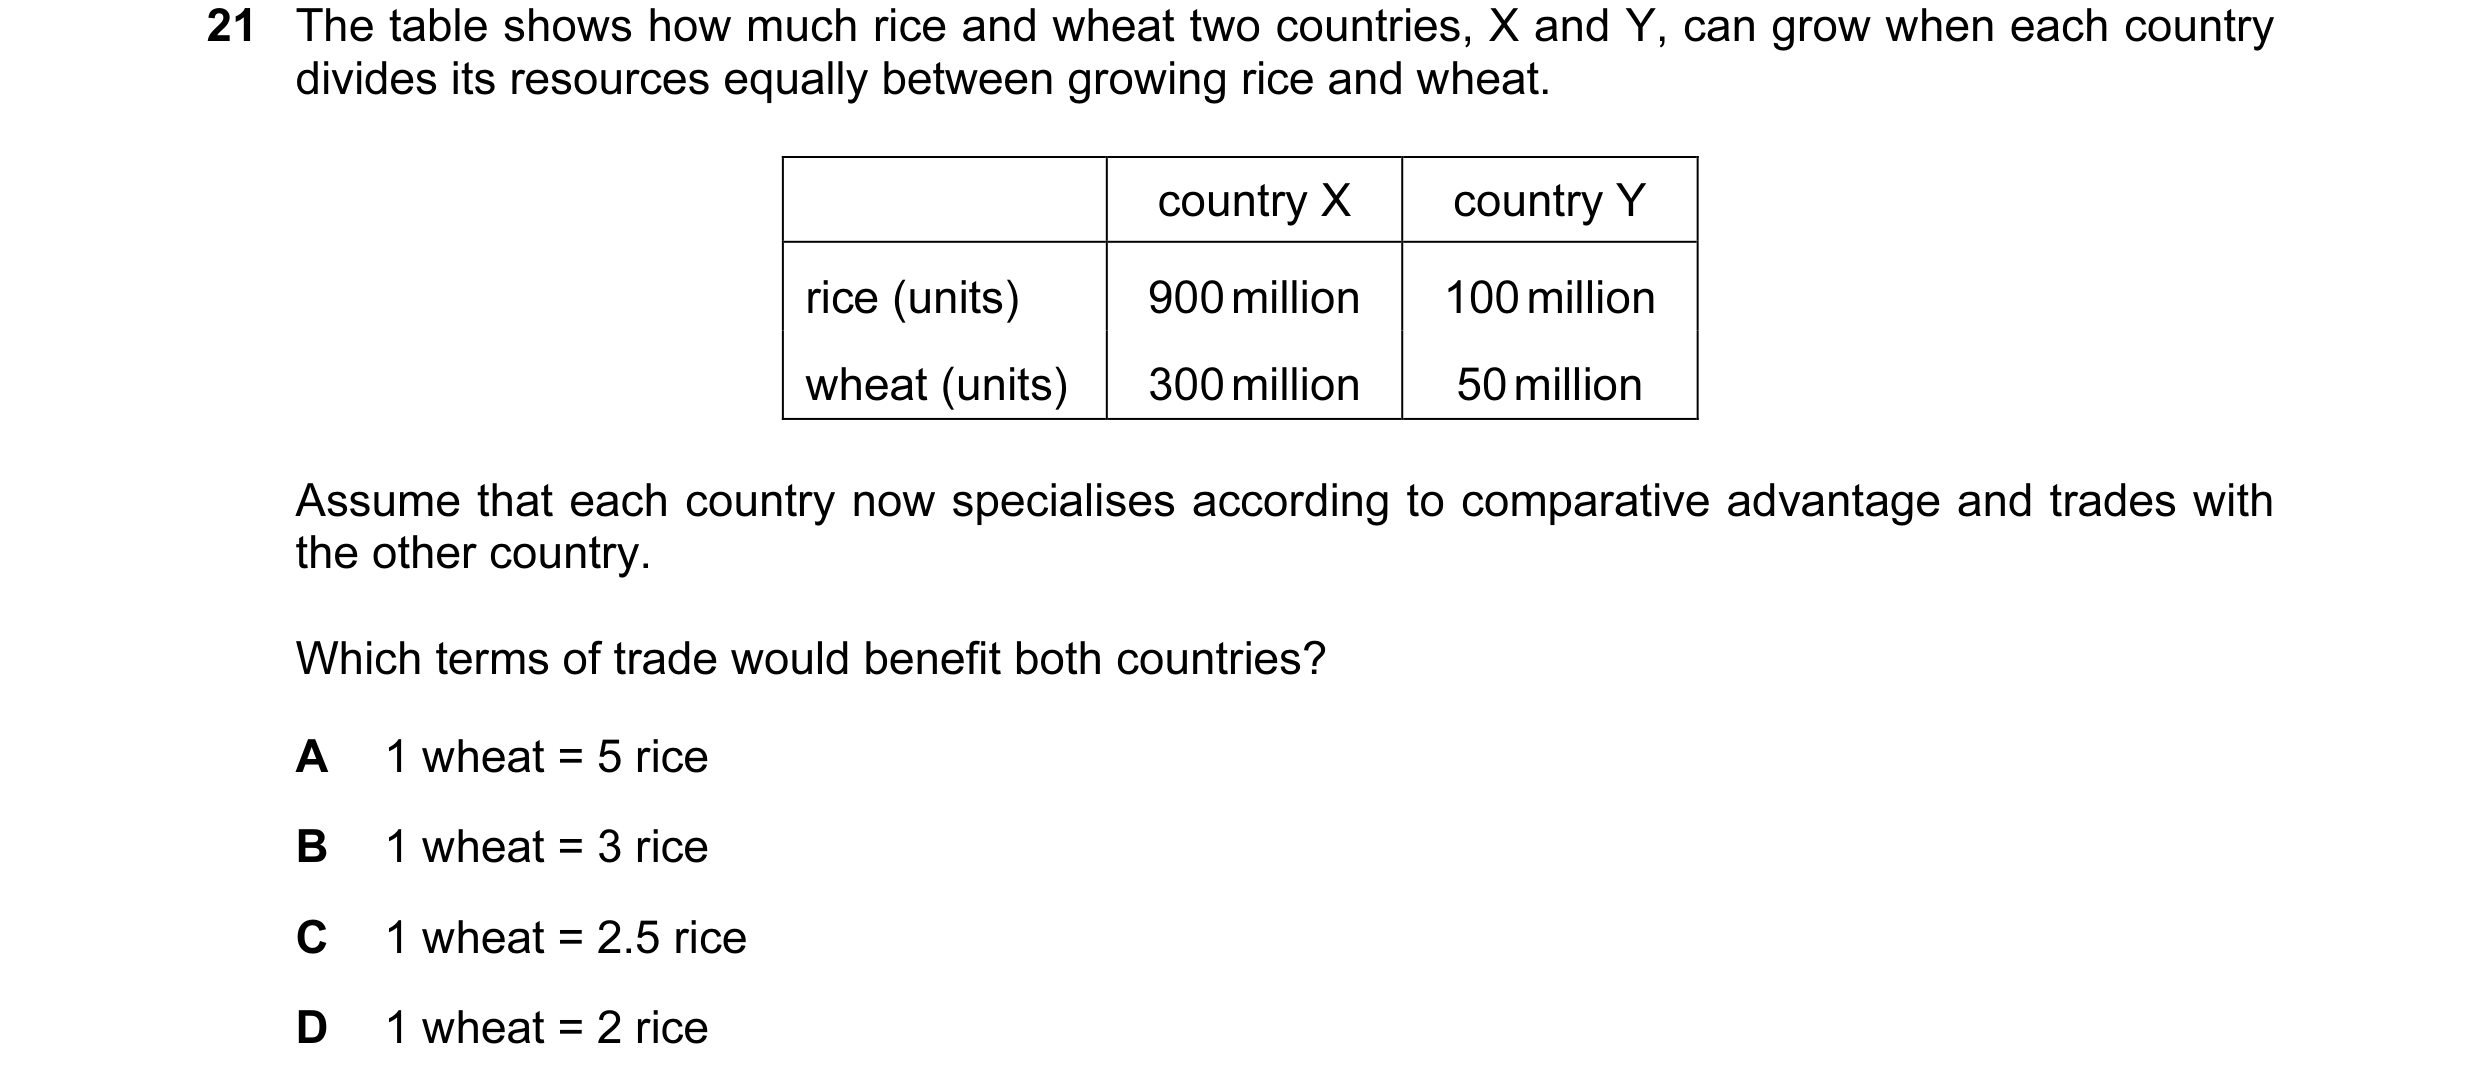
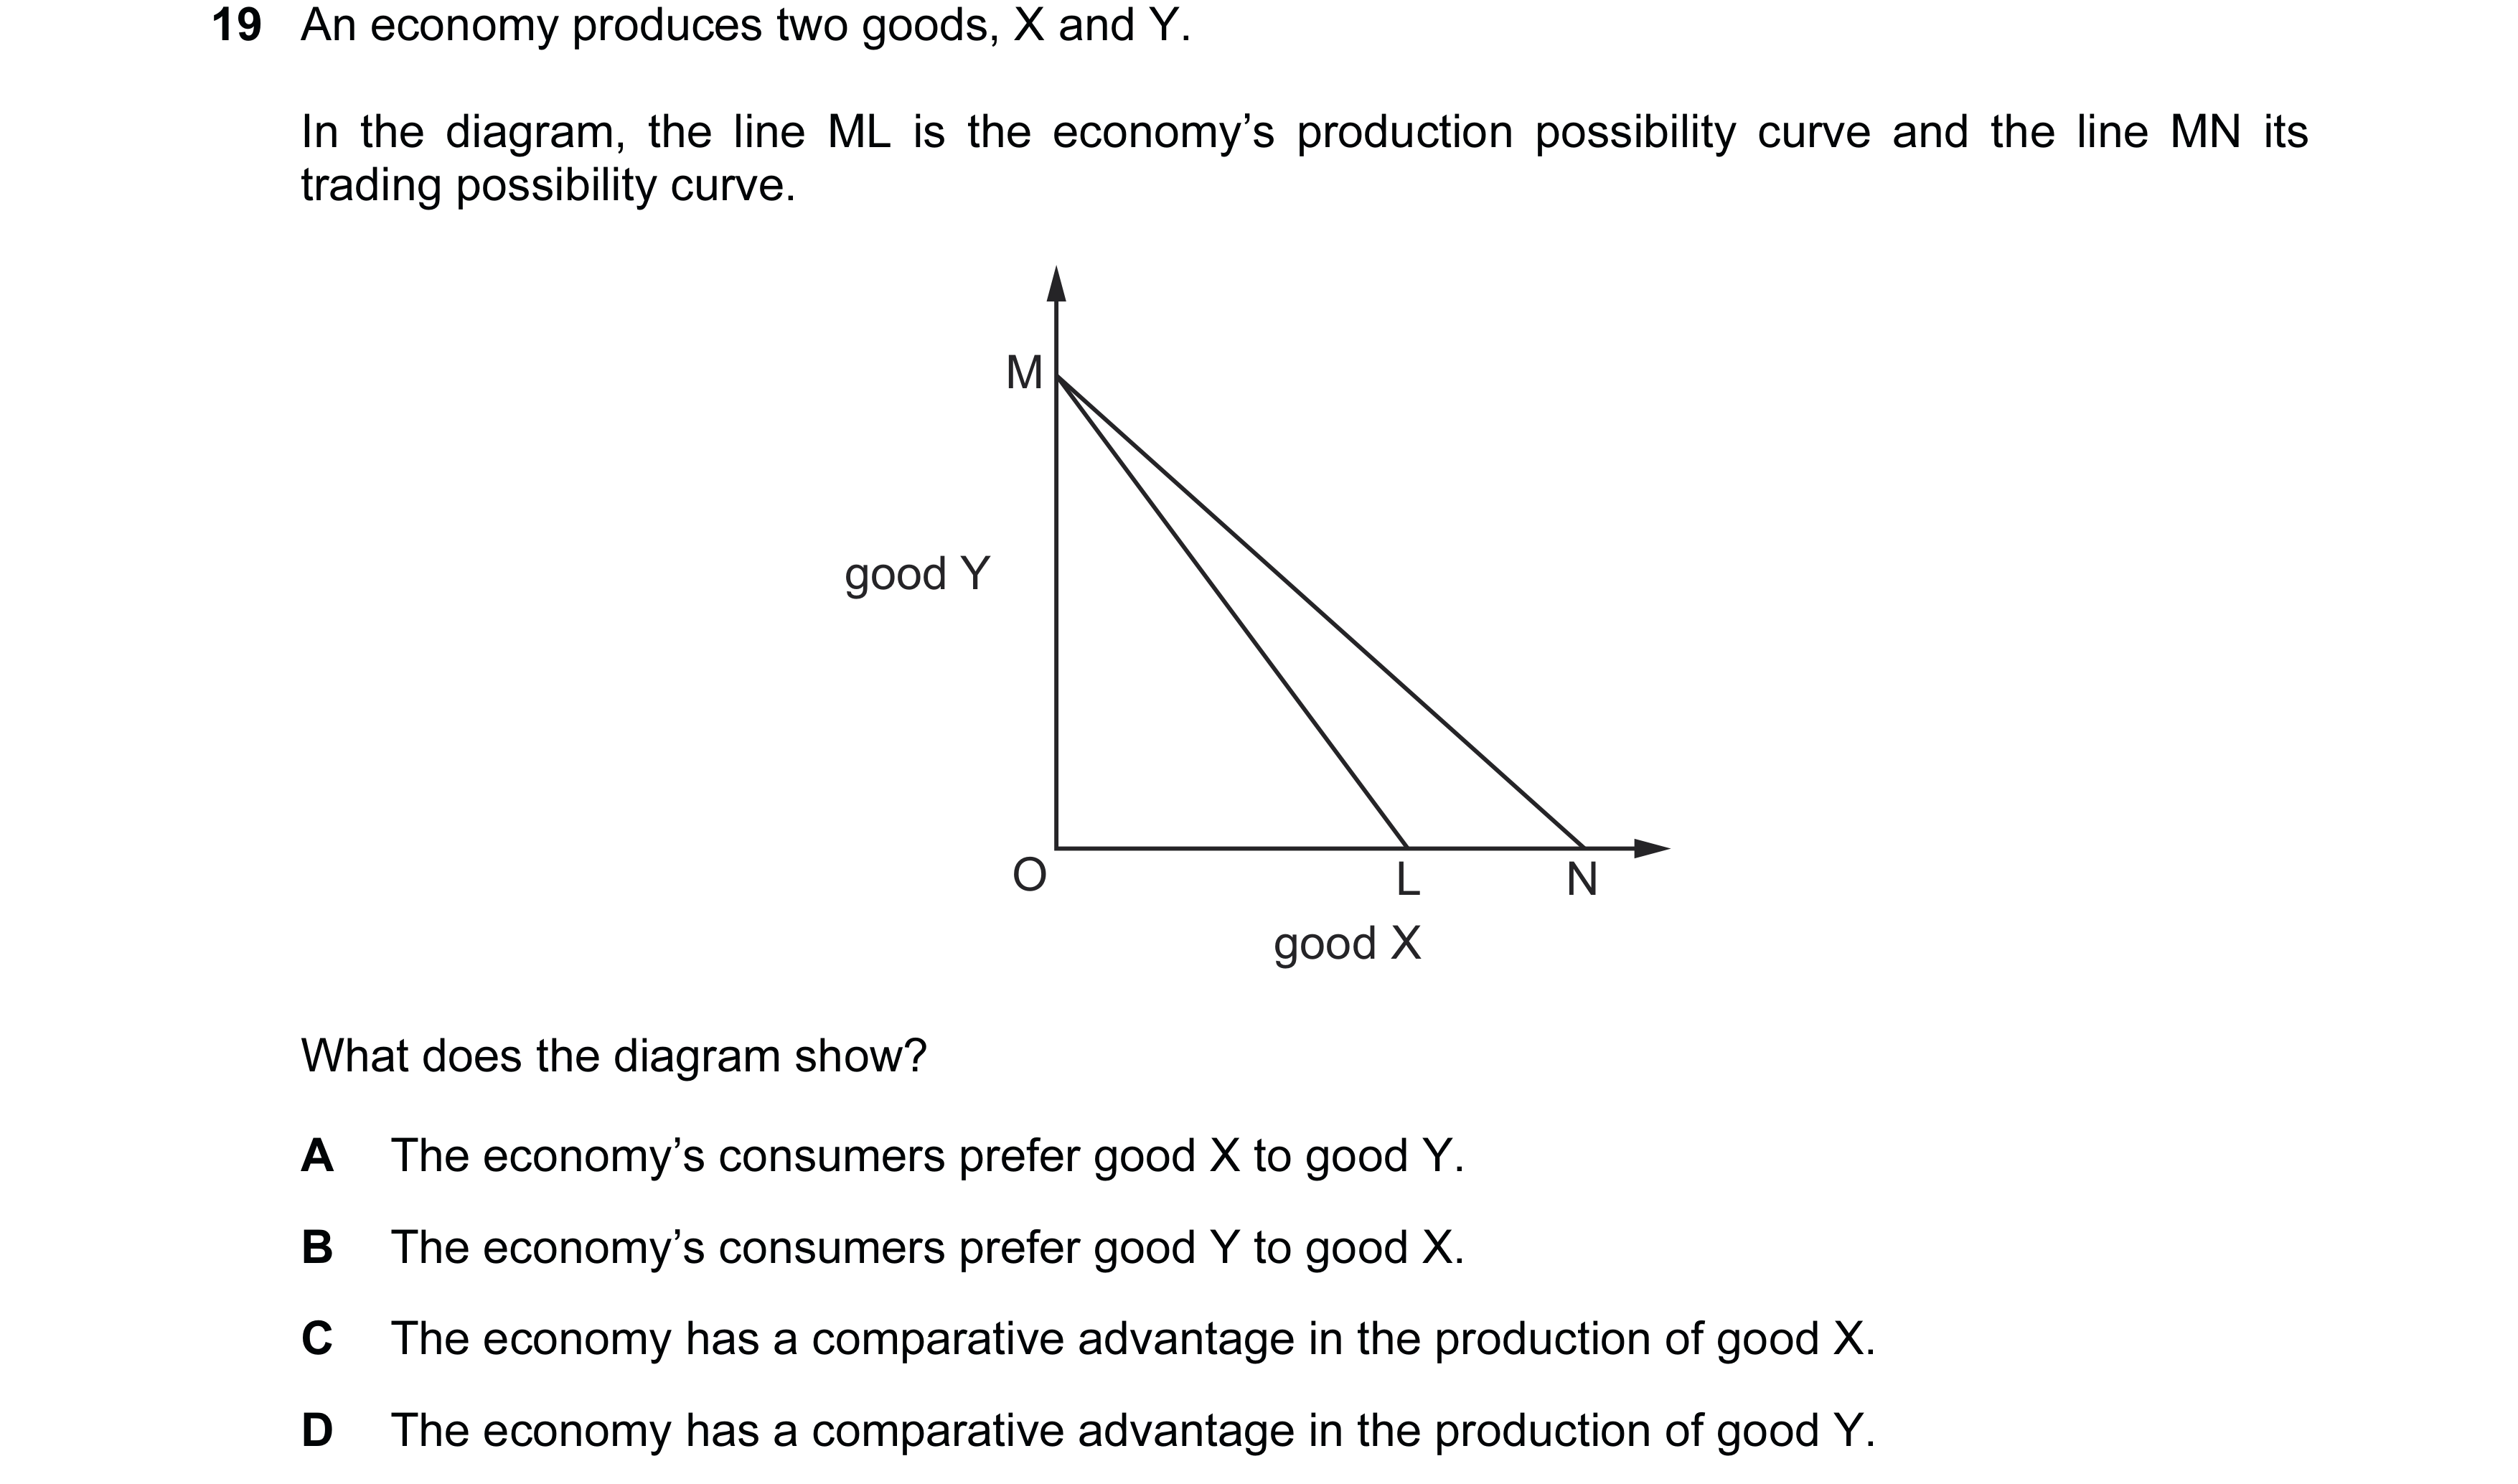 24 / 59
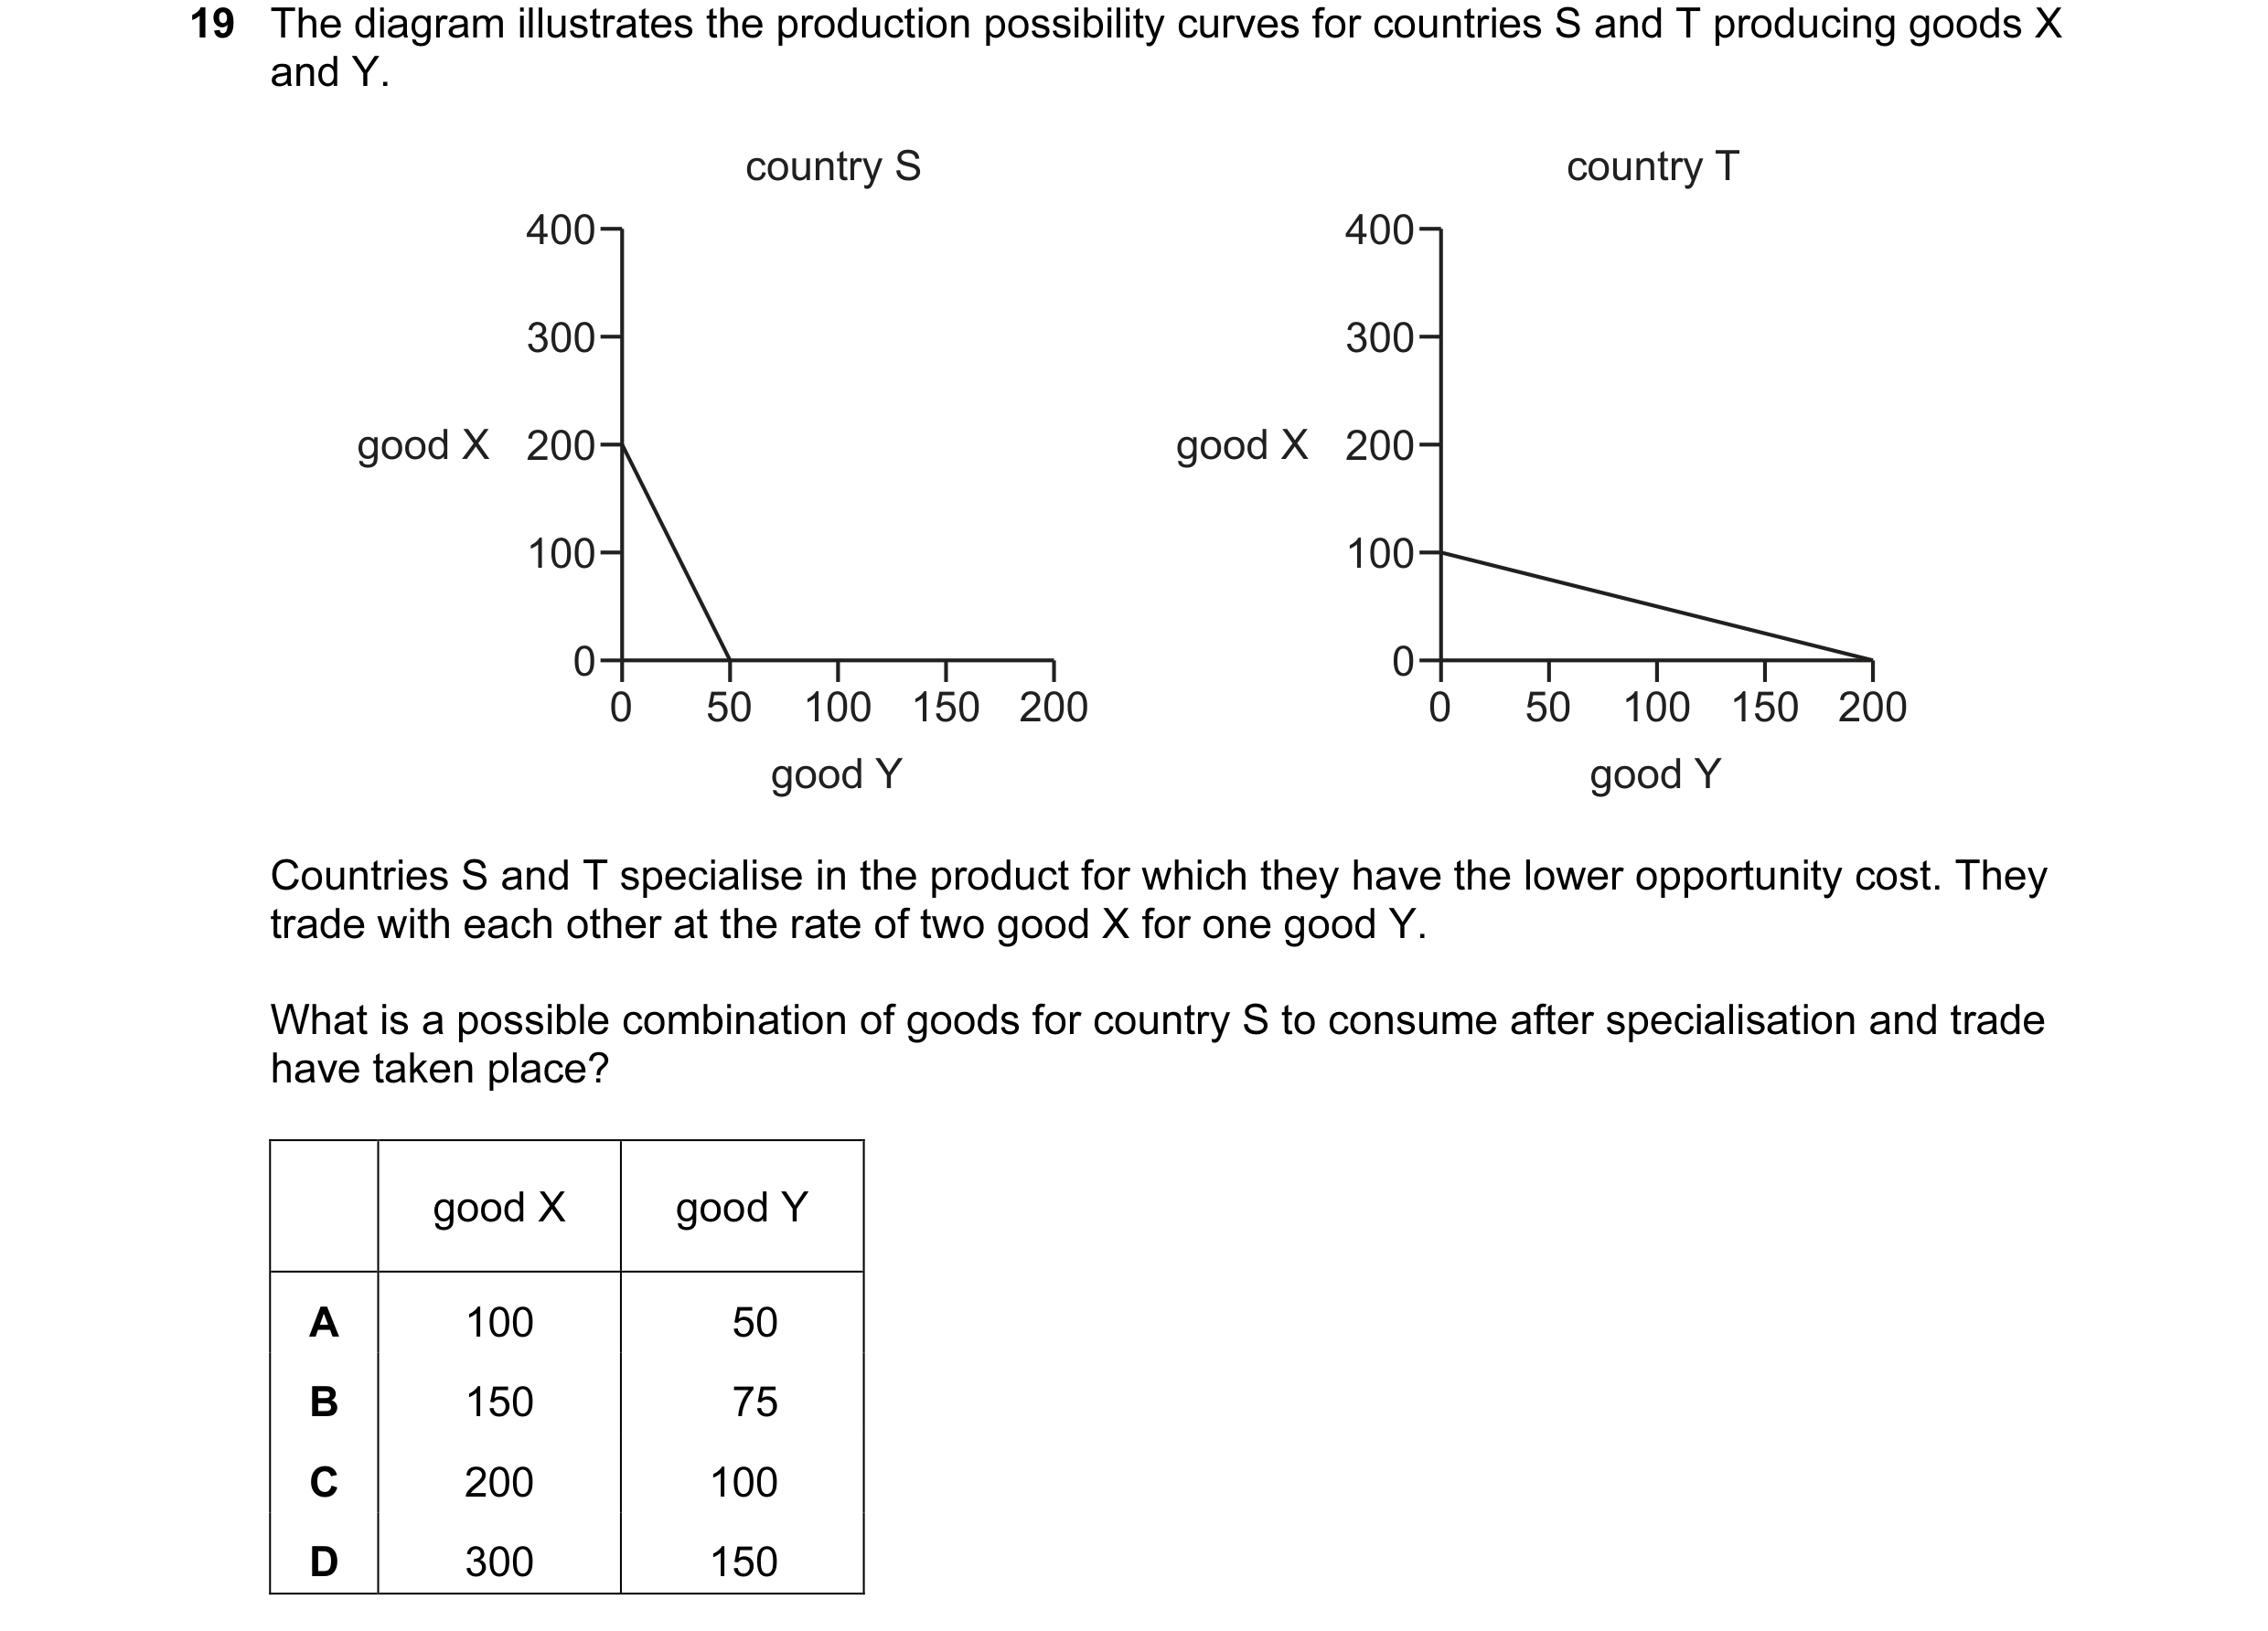
 25 / 59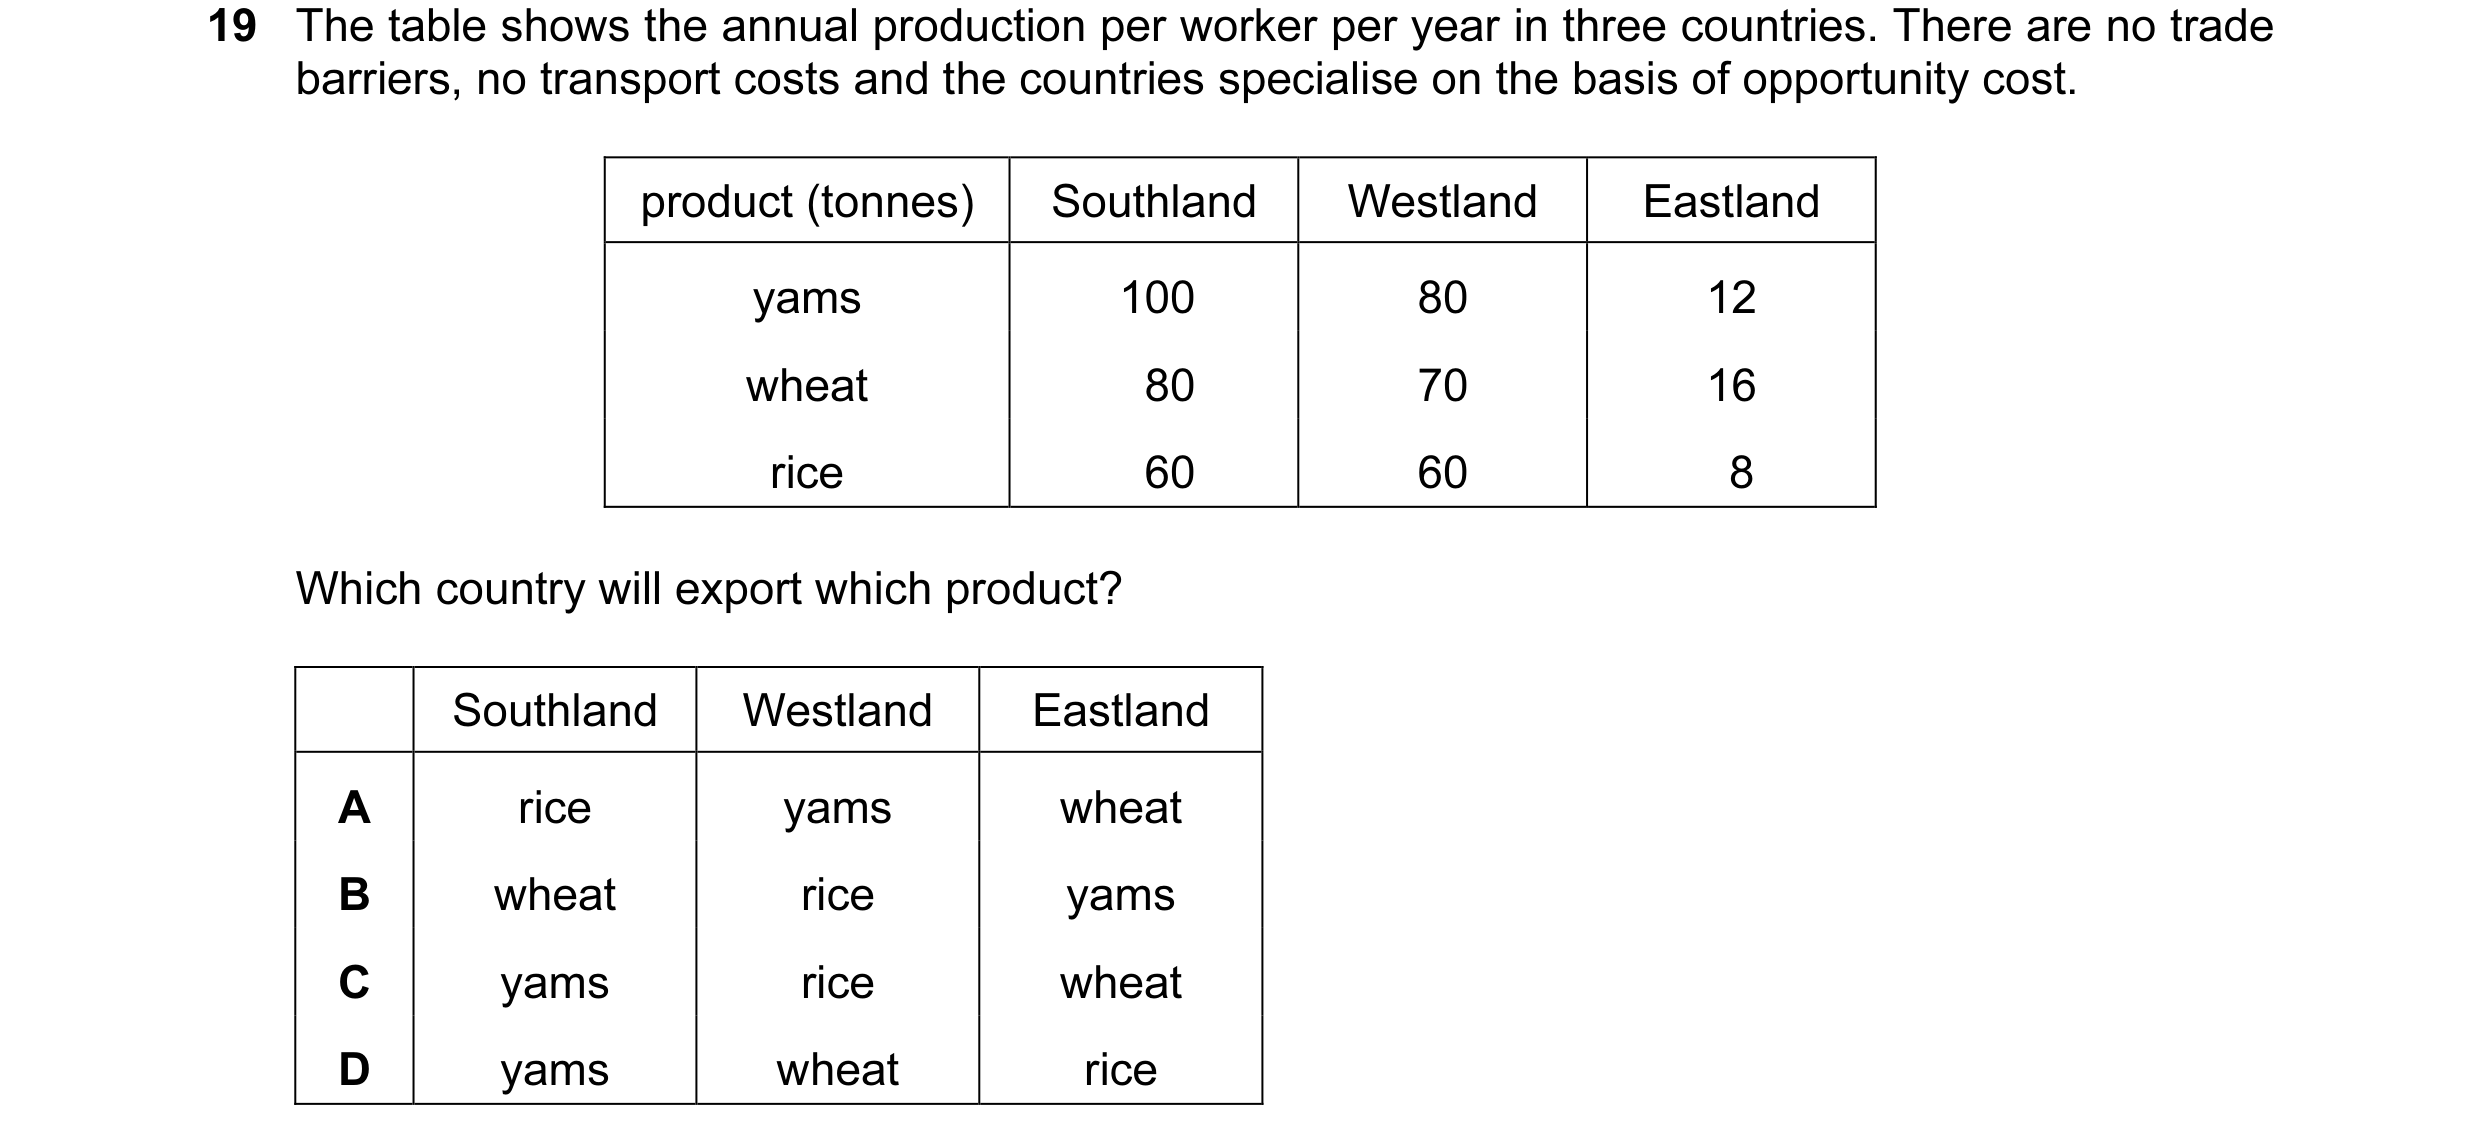

 26 / 59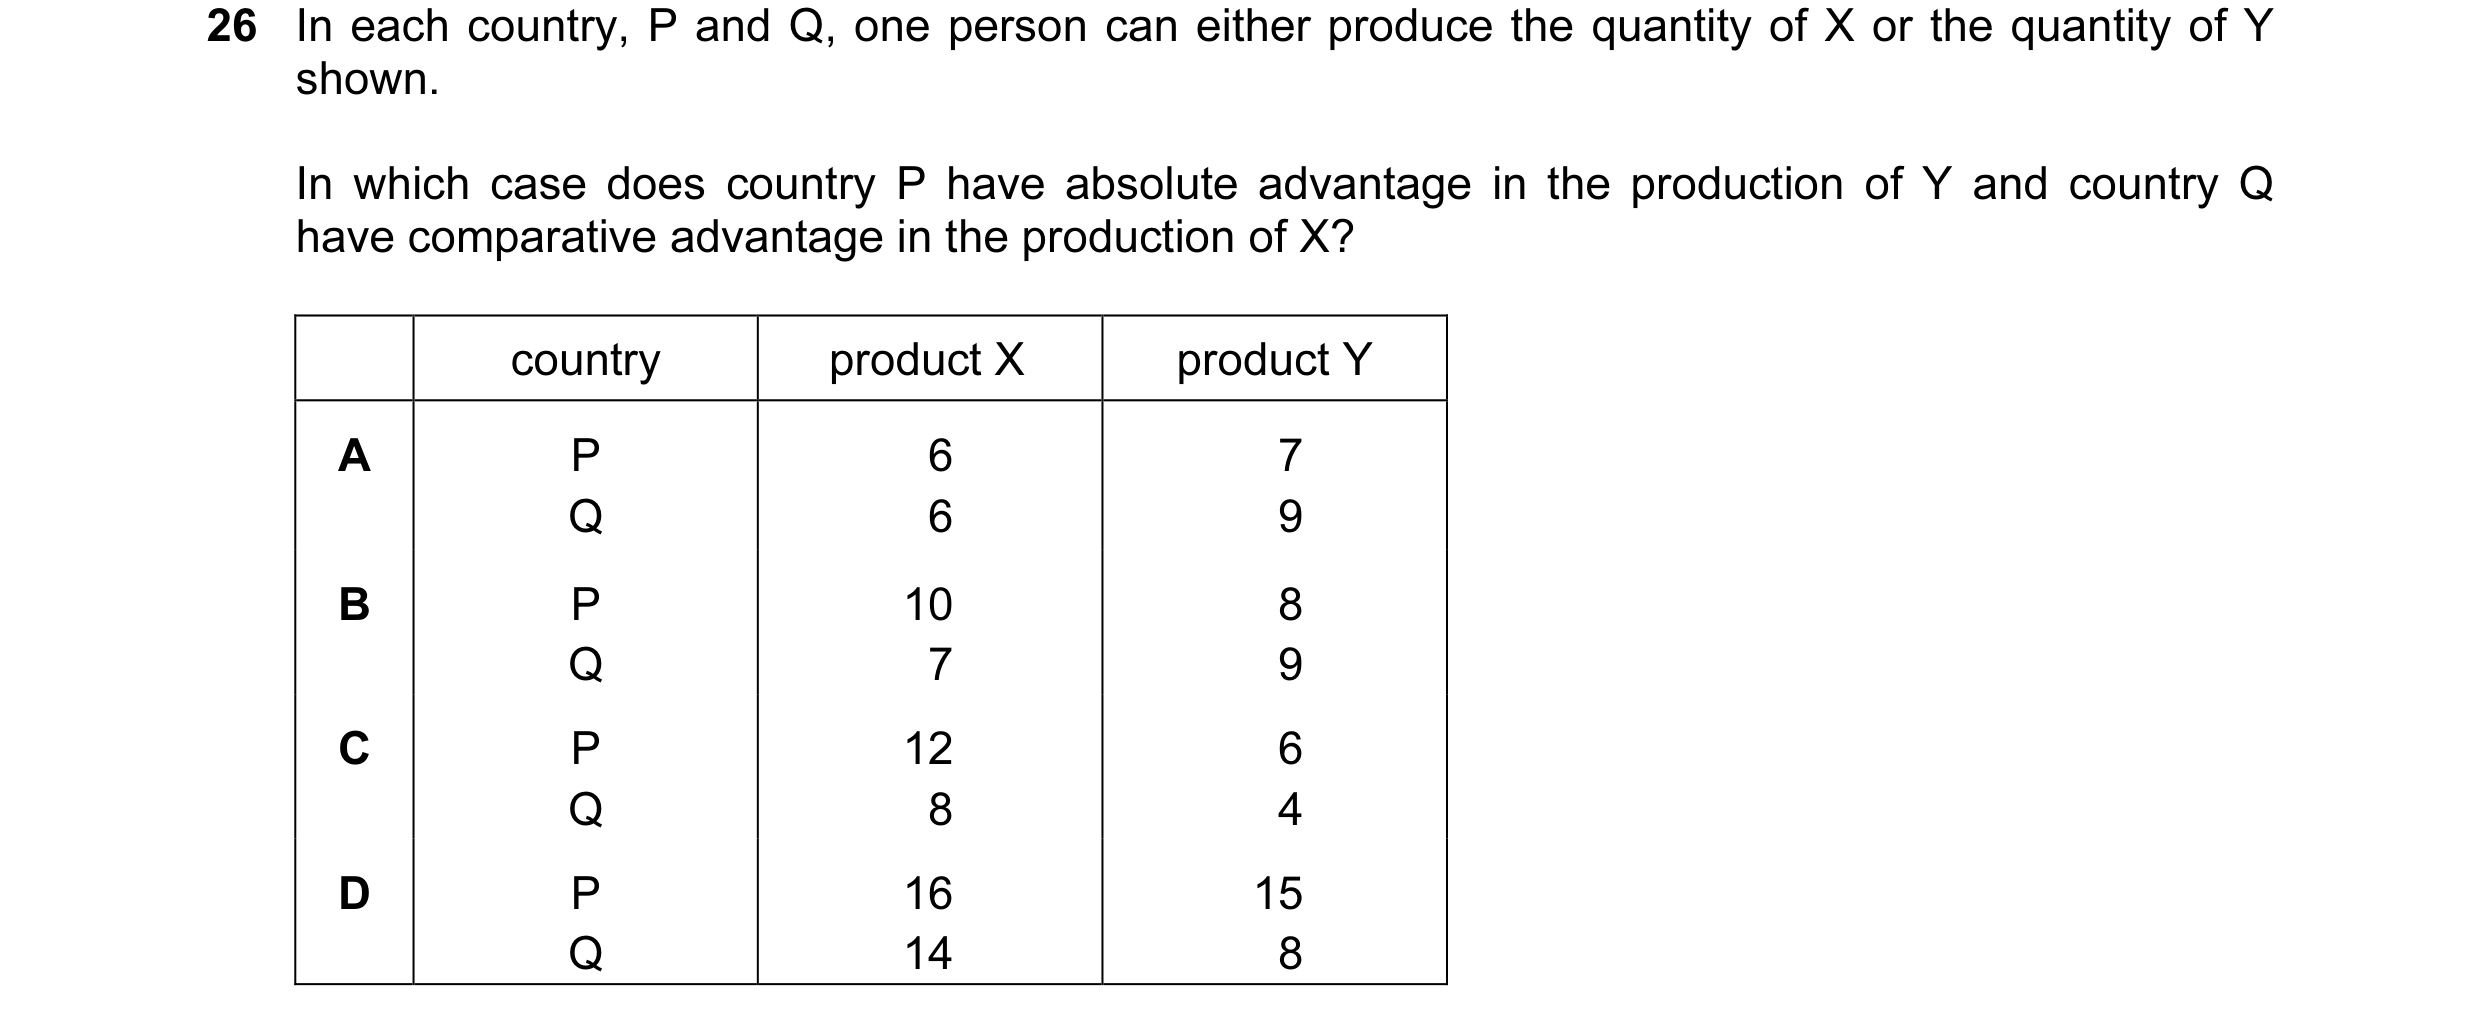
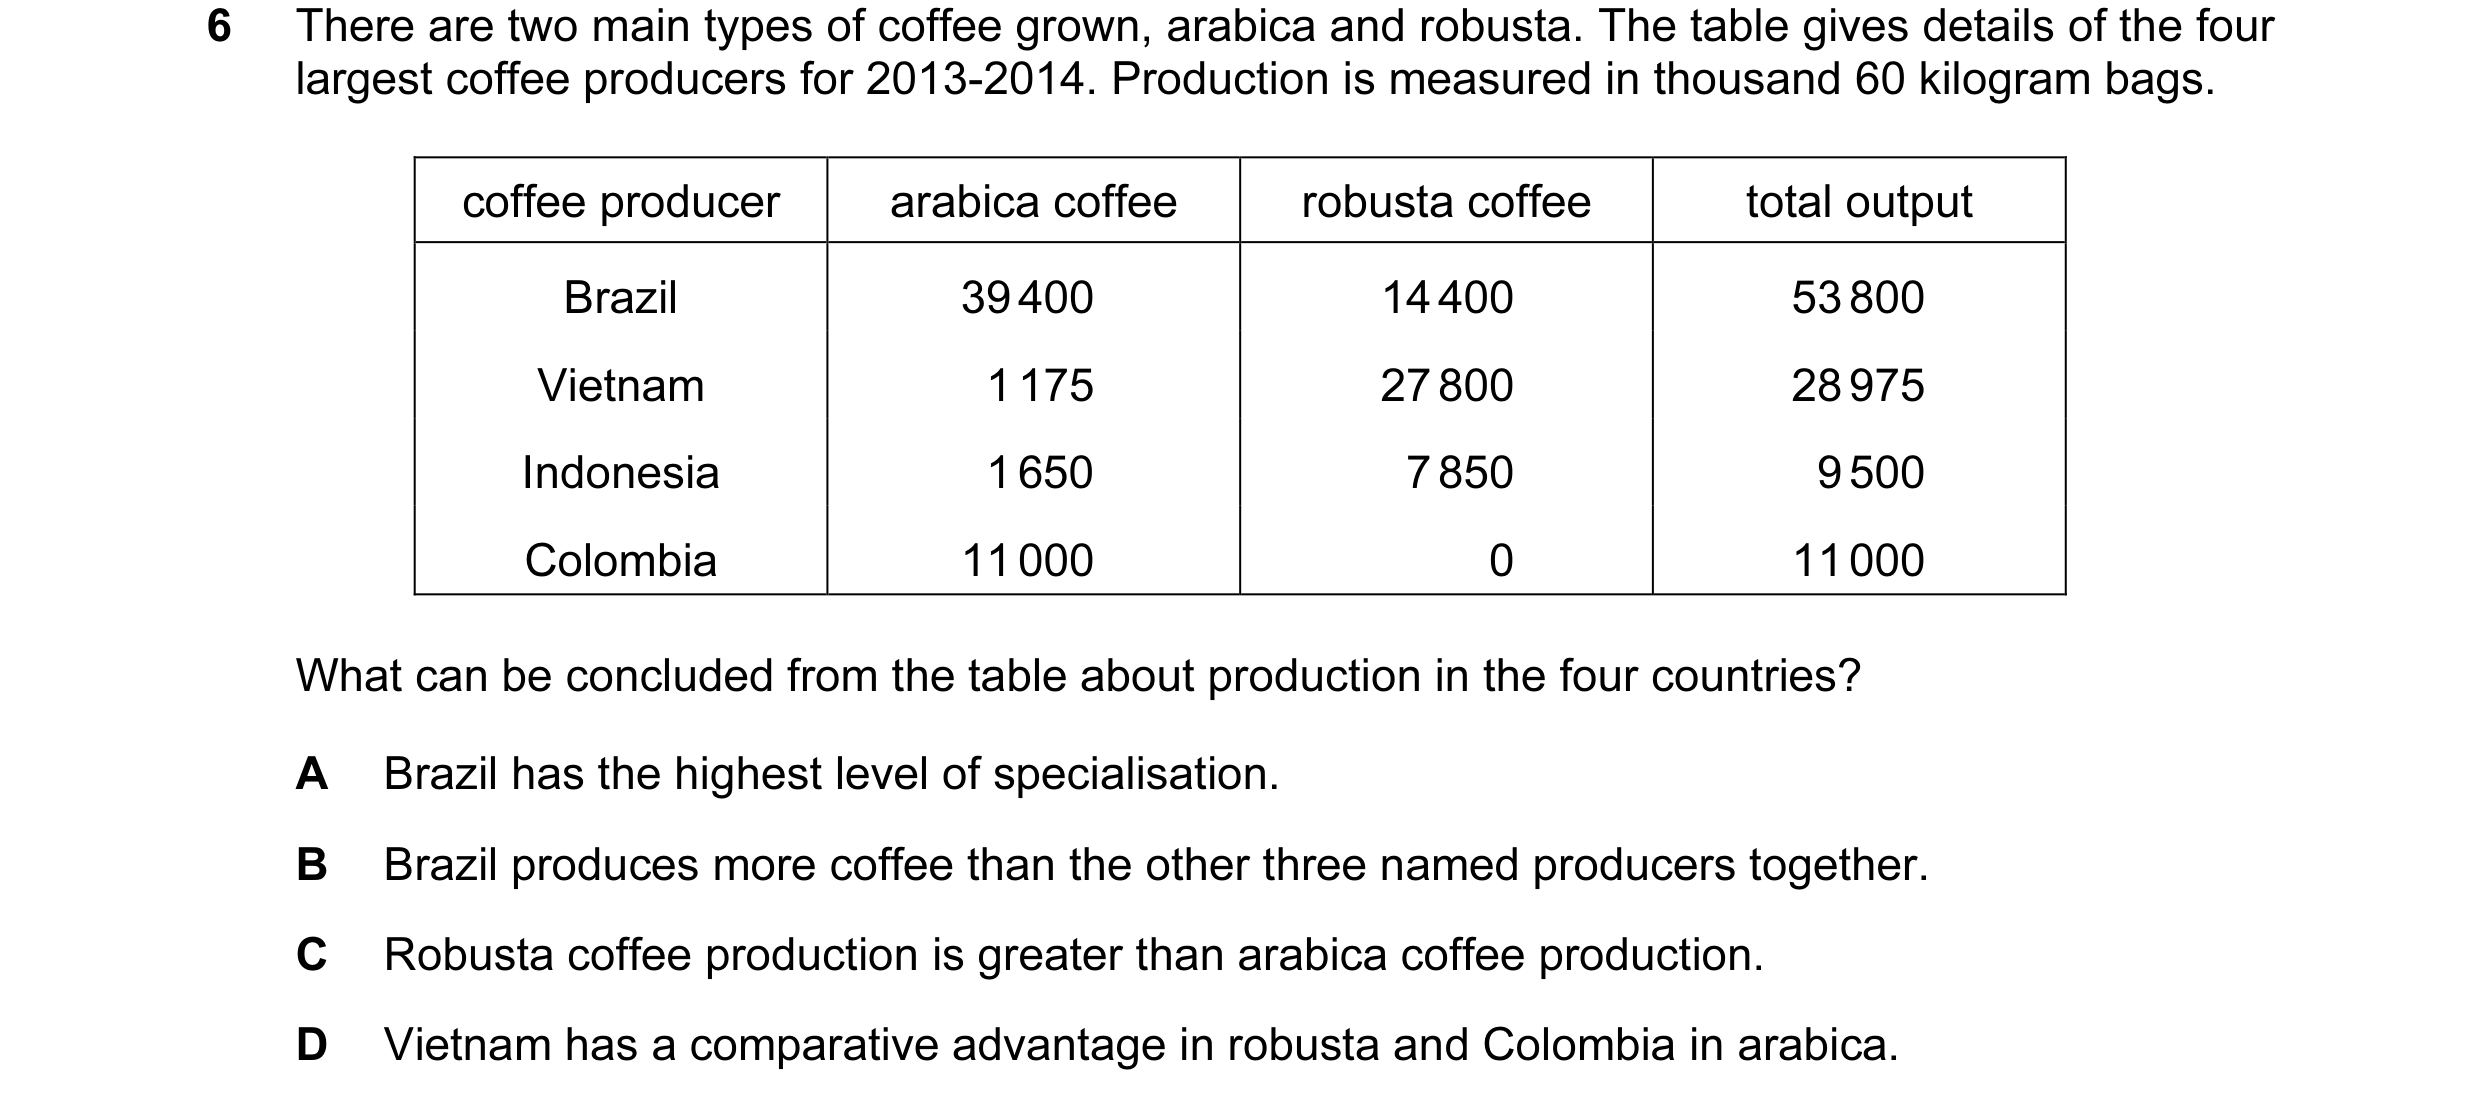
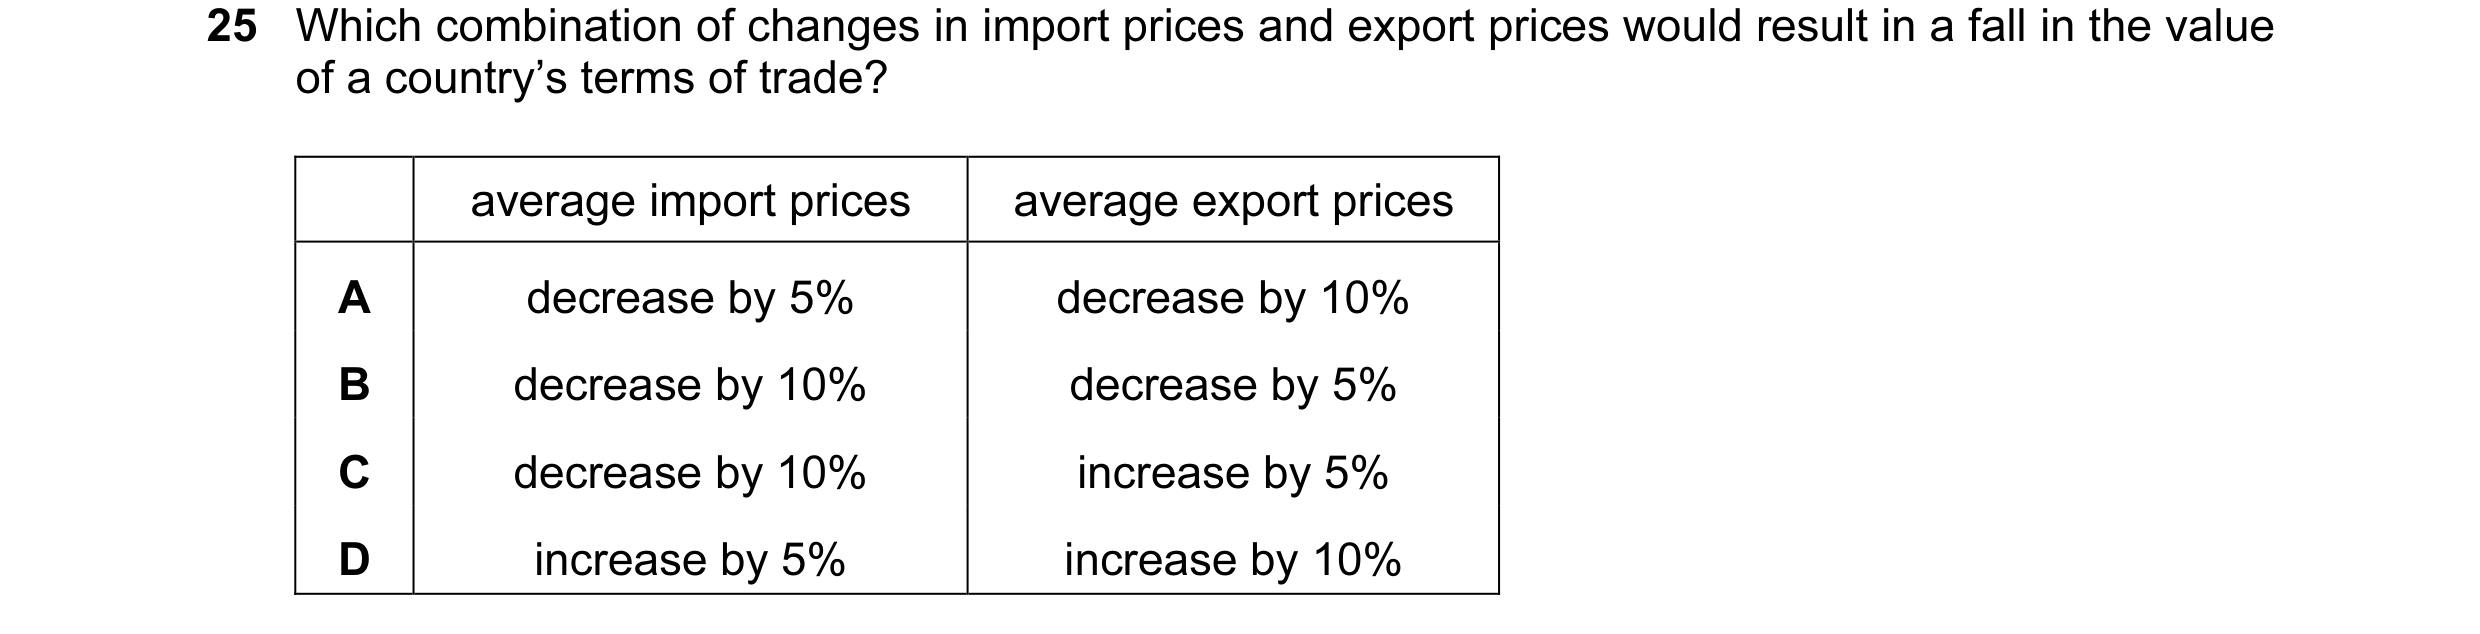 27 / 59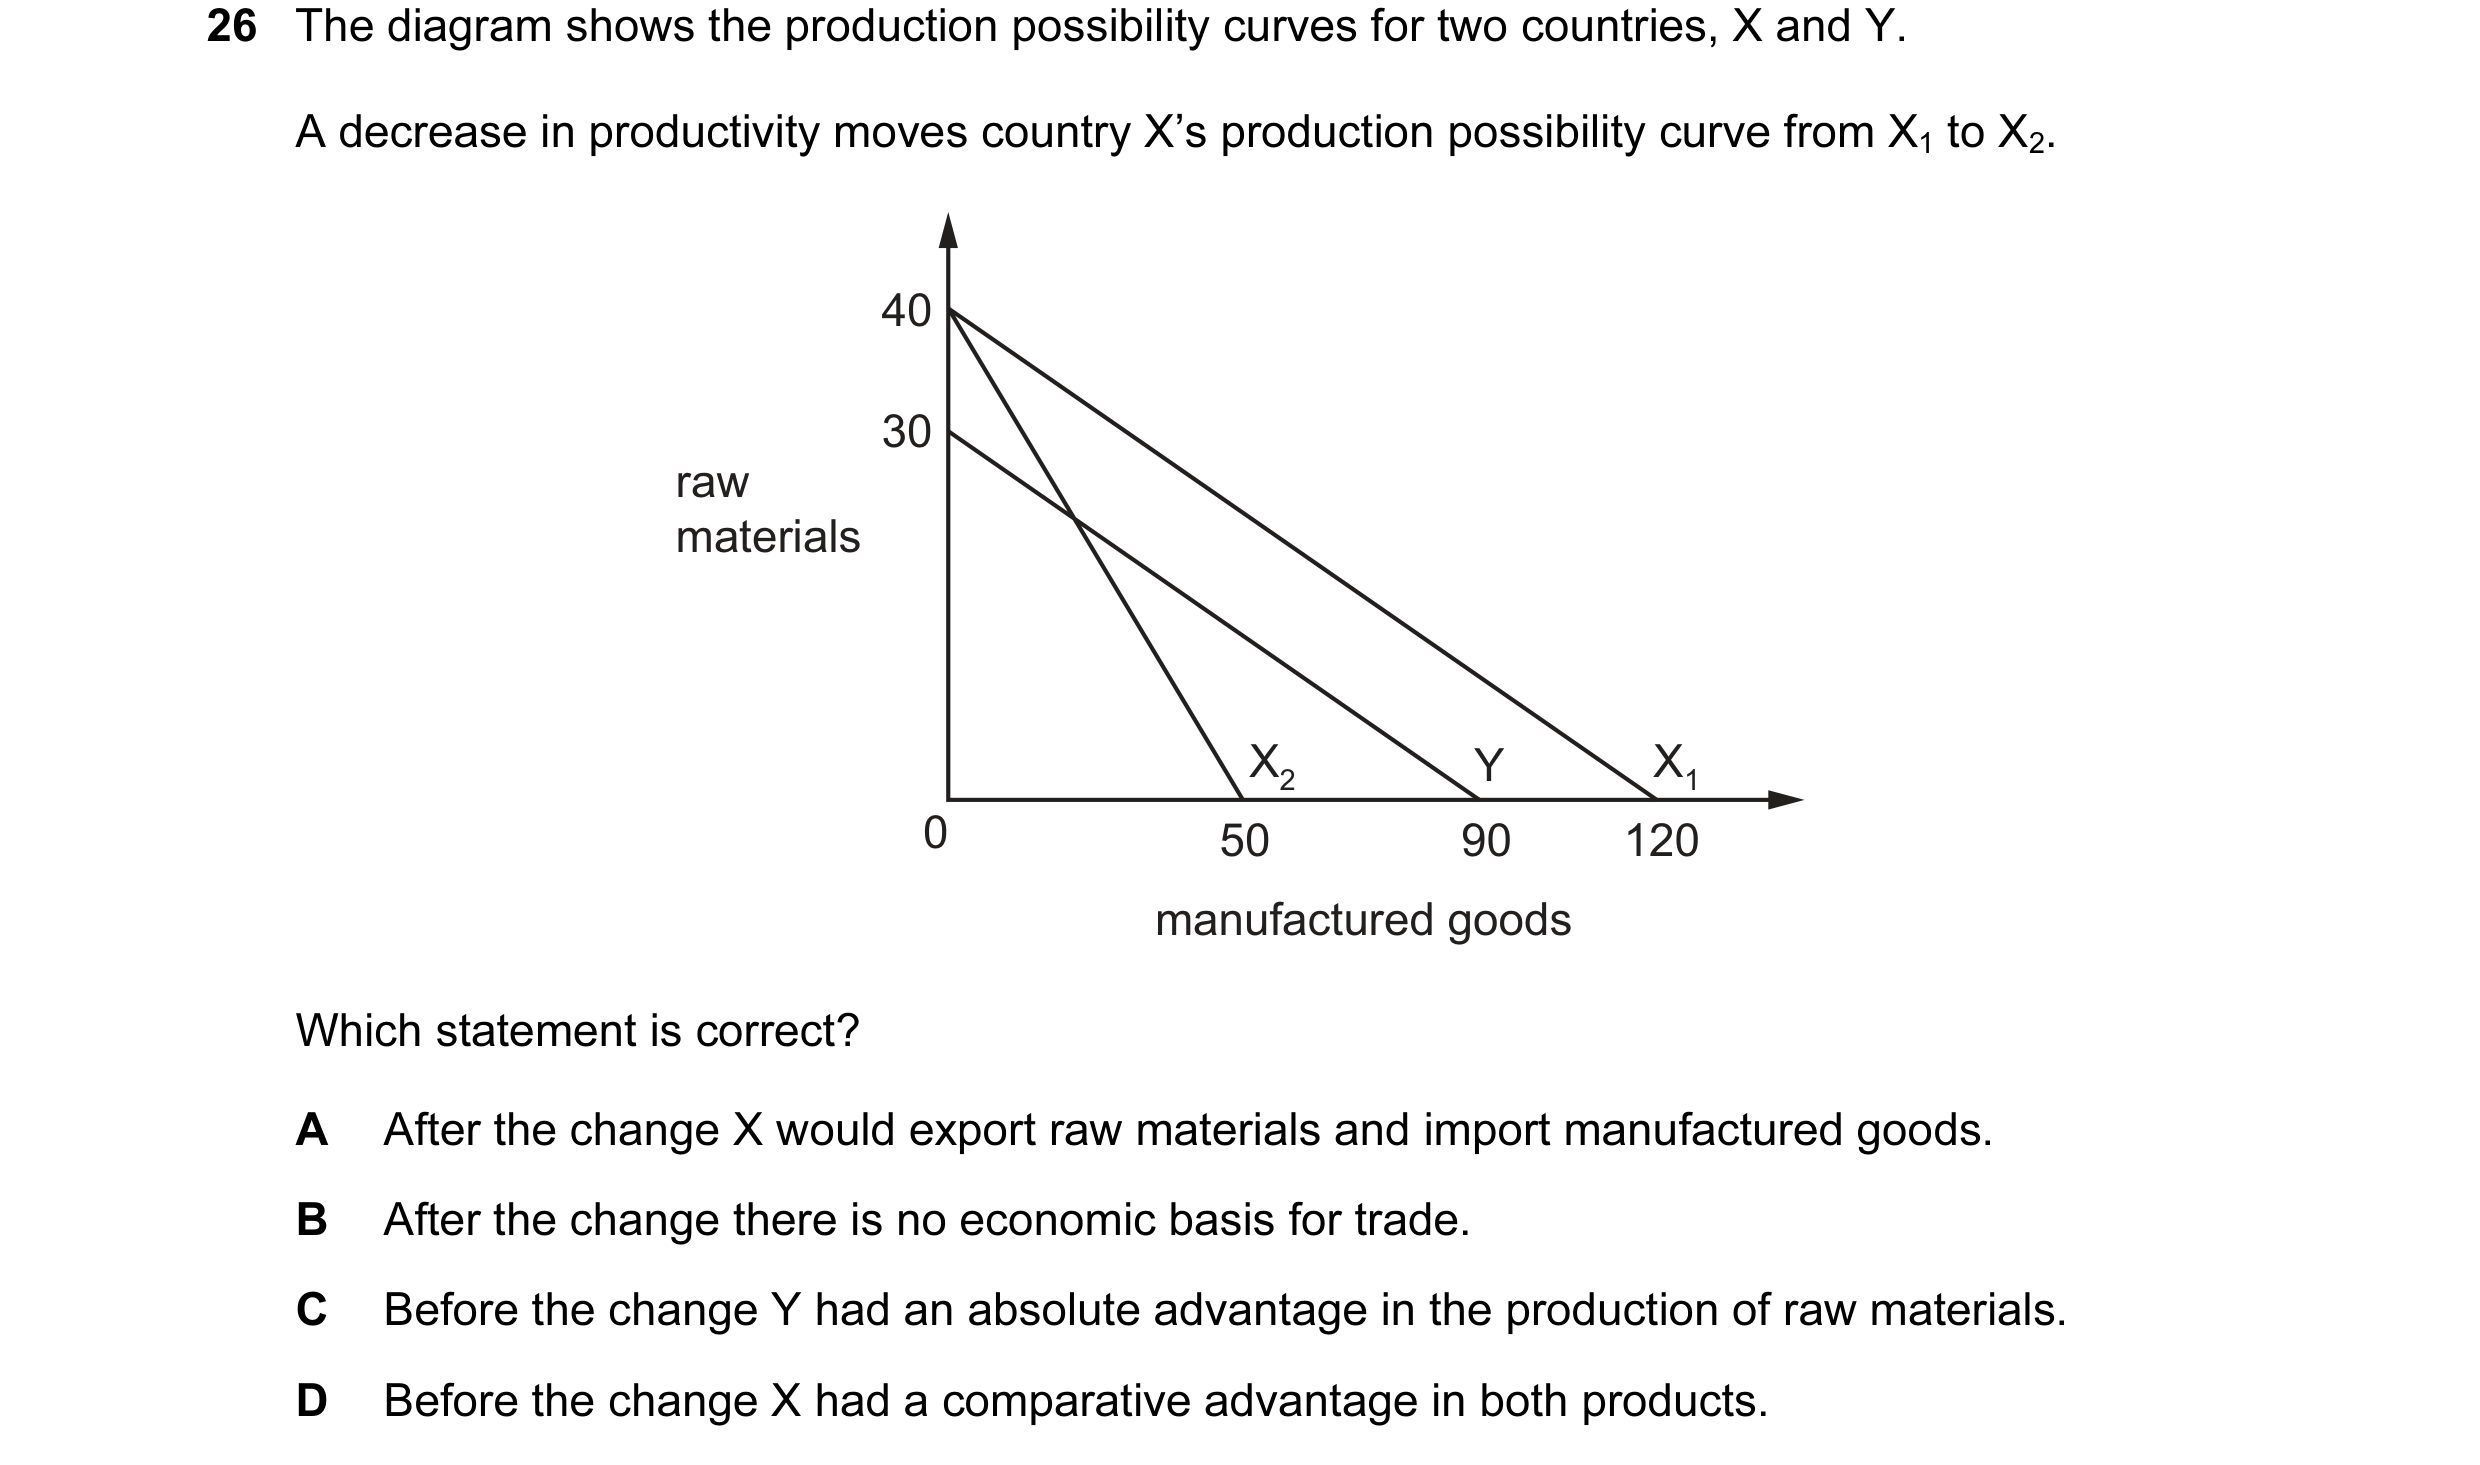
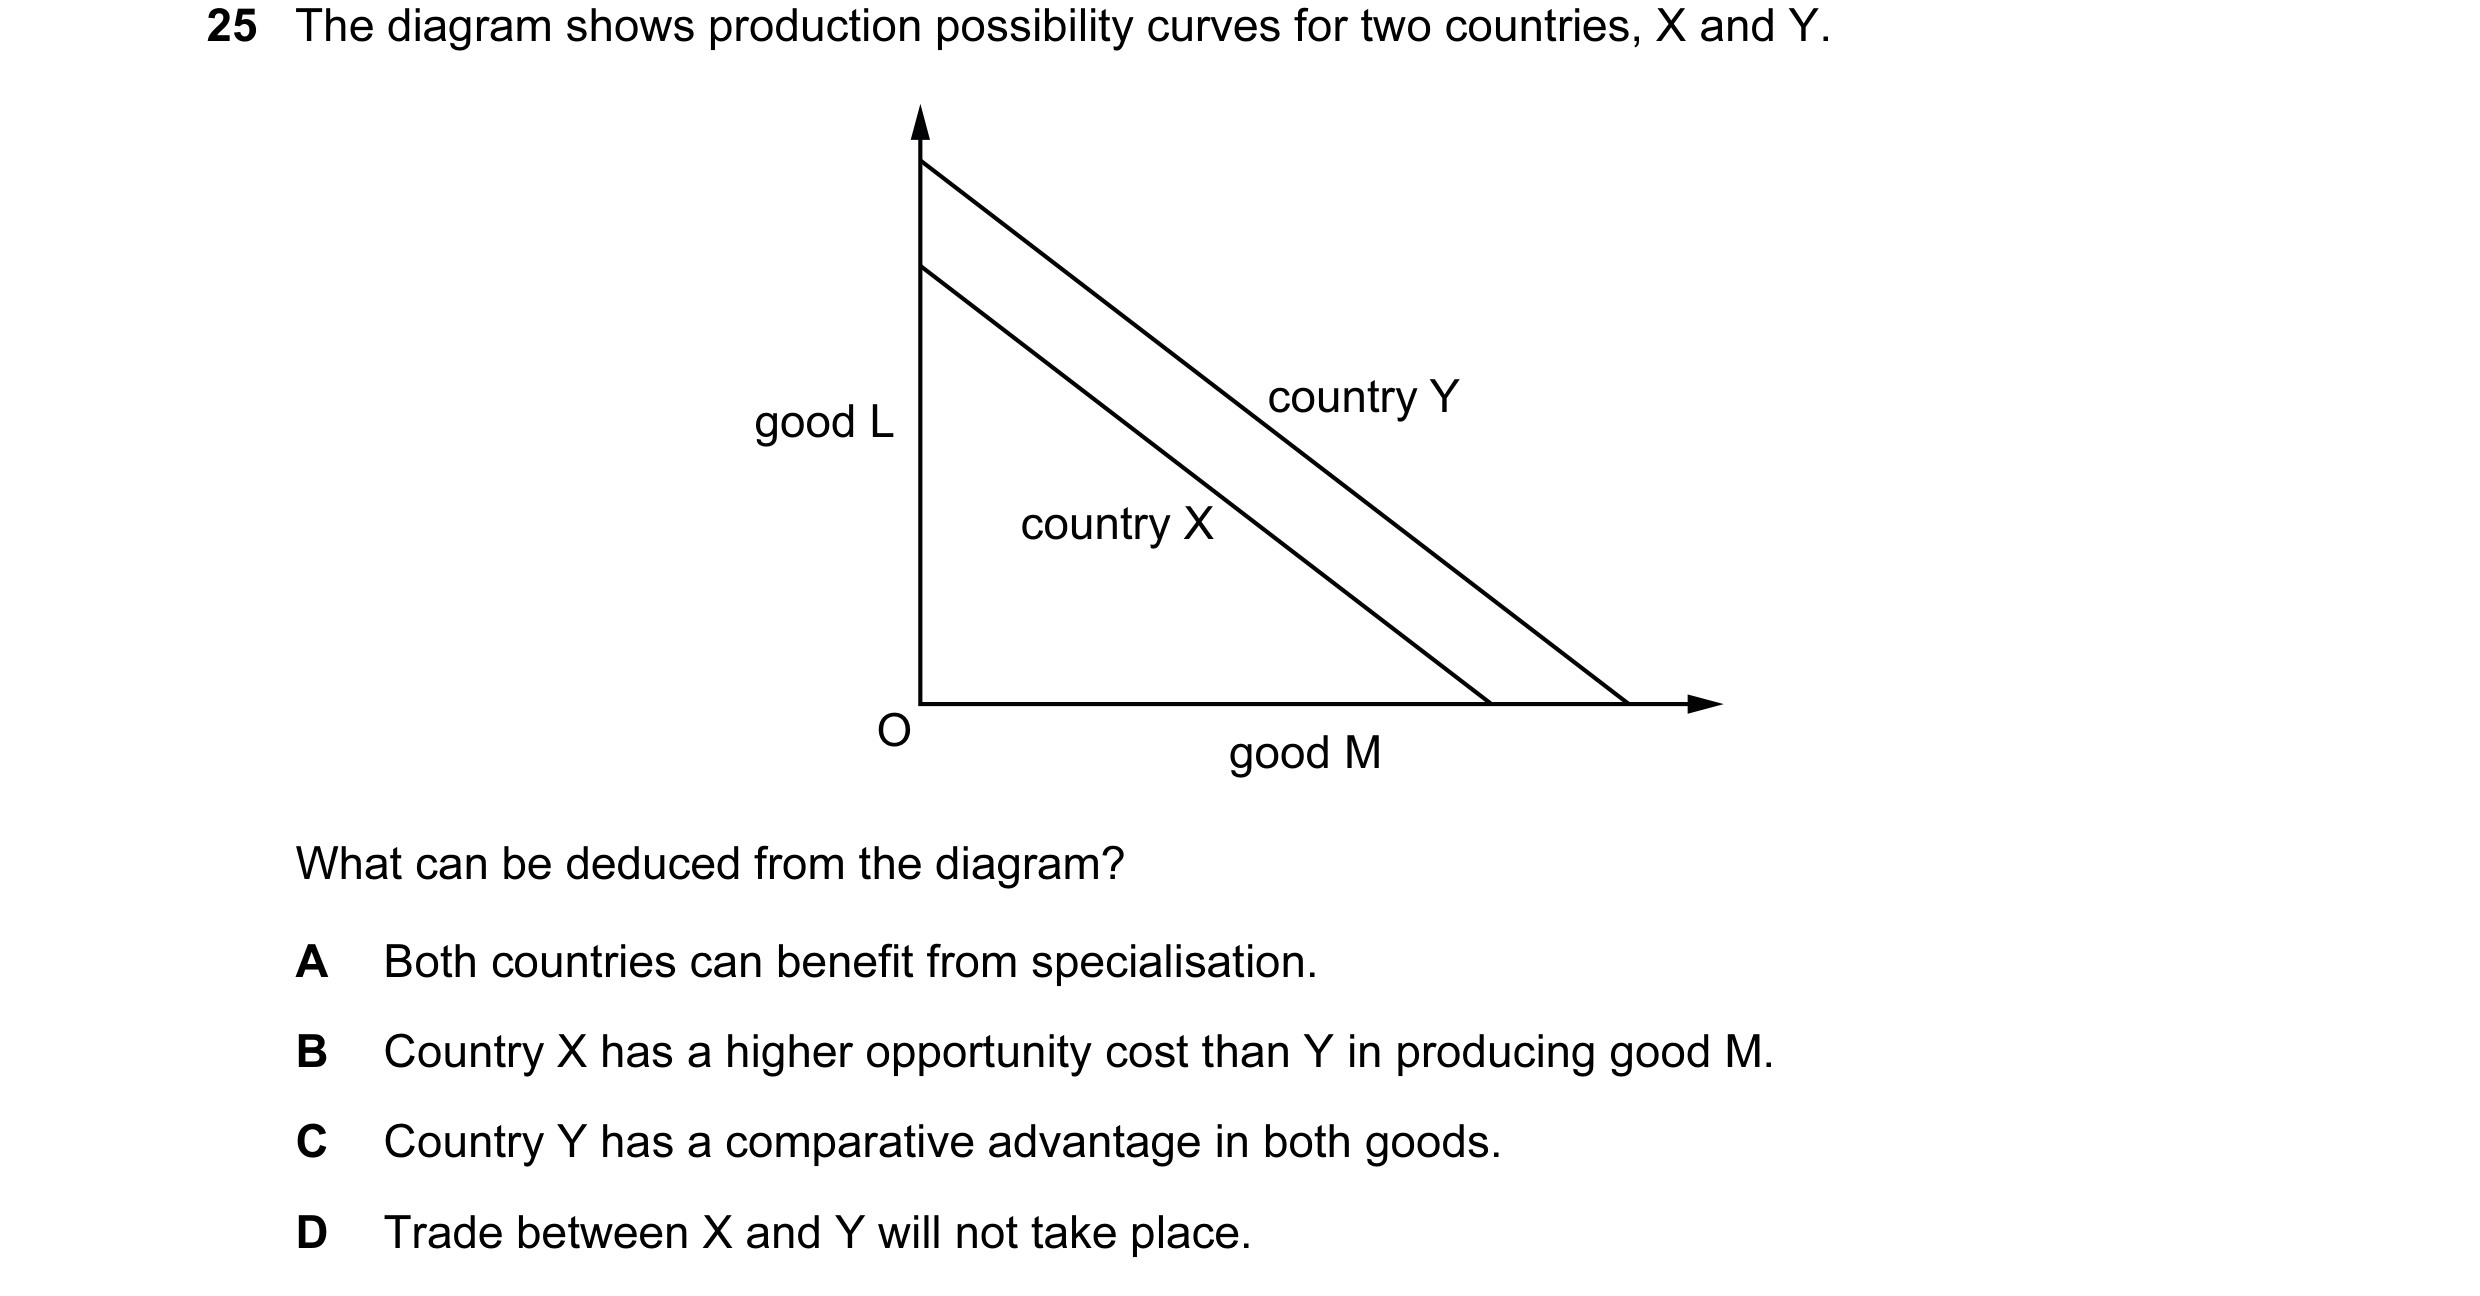 28 / 59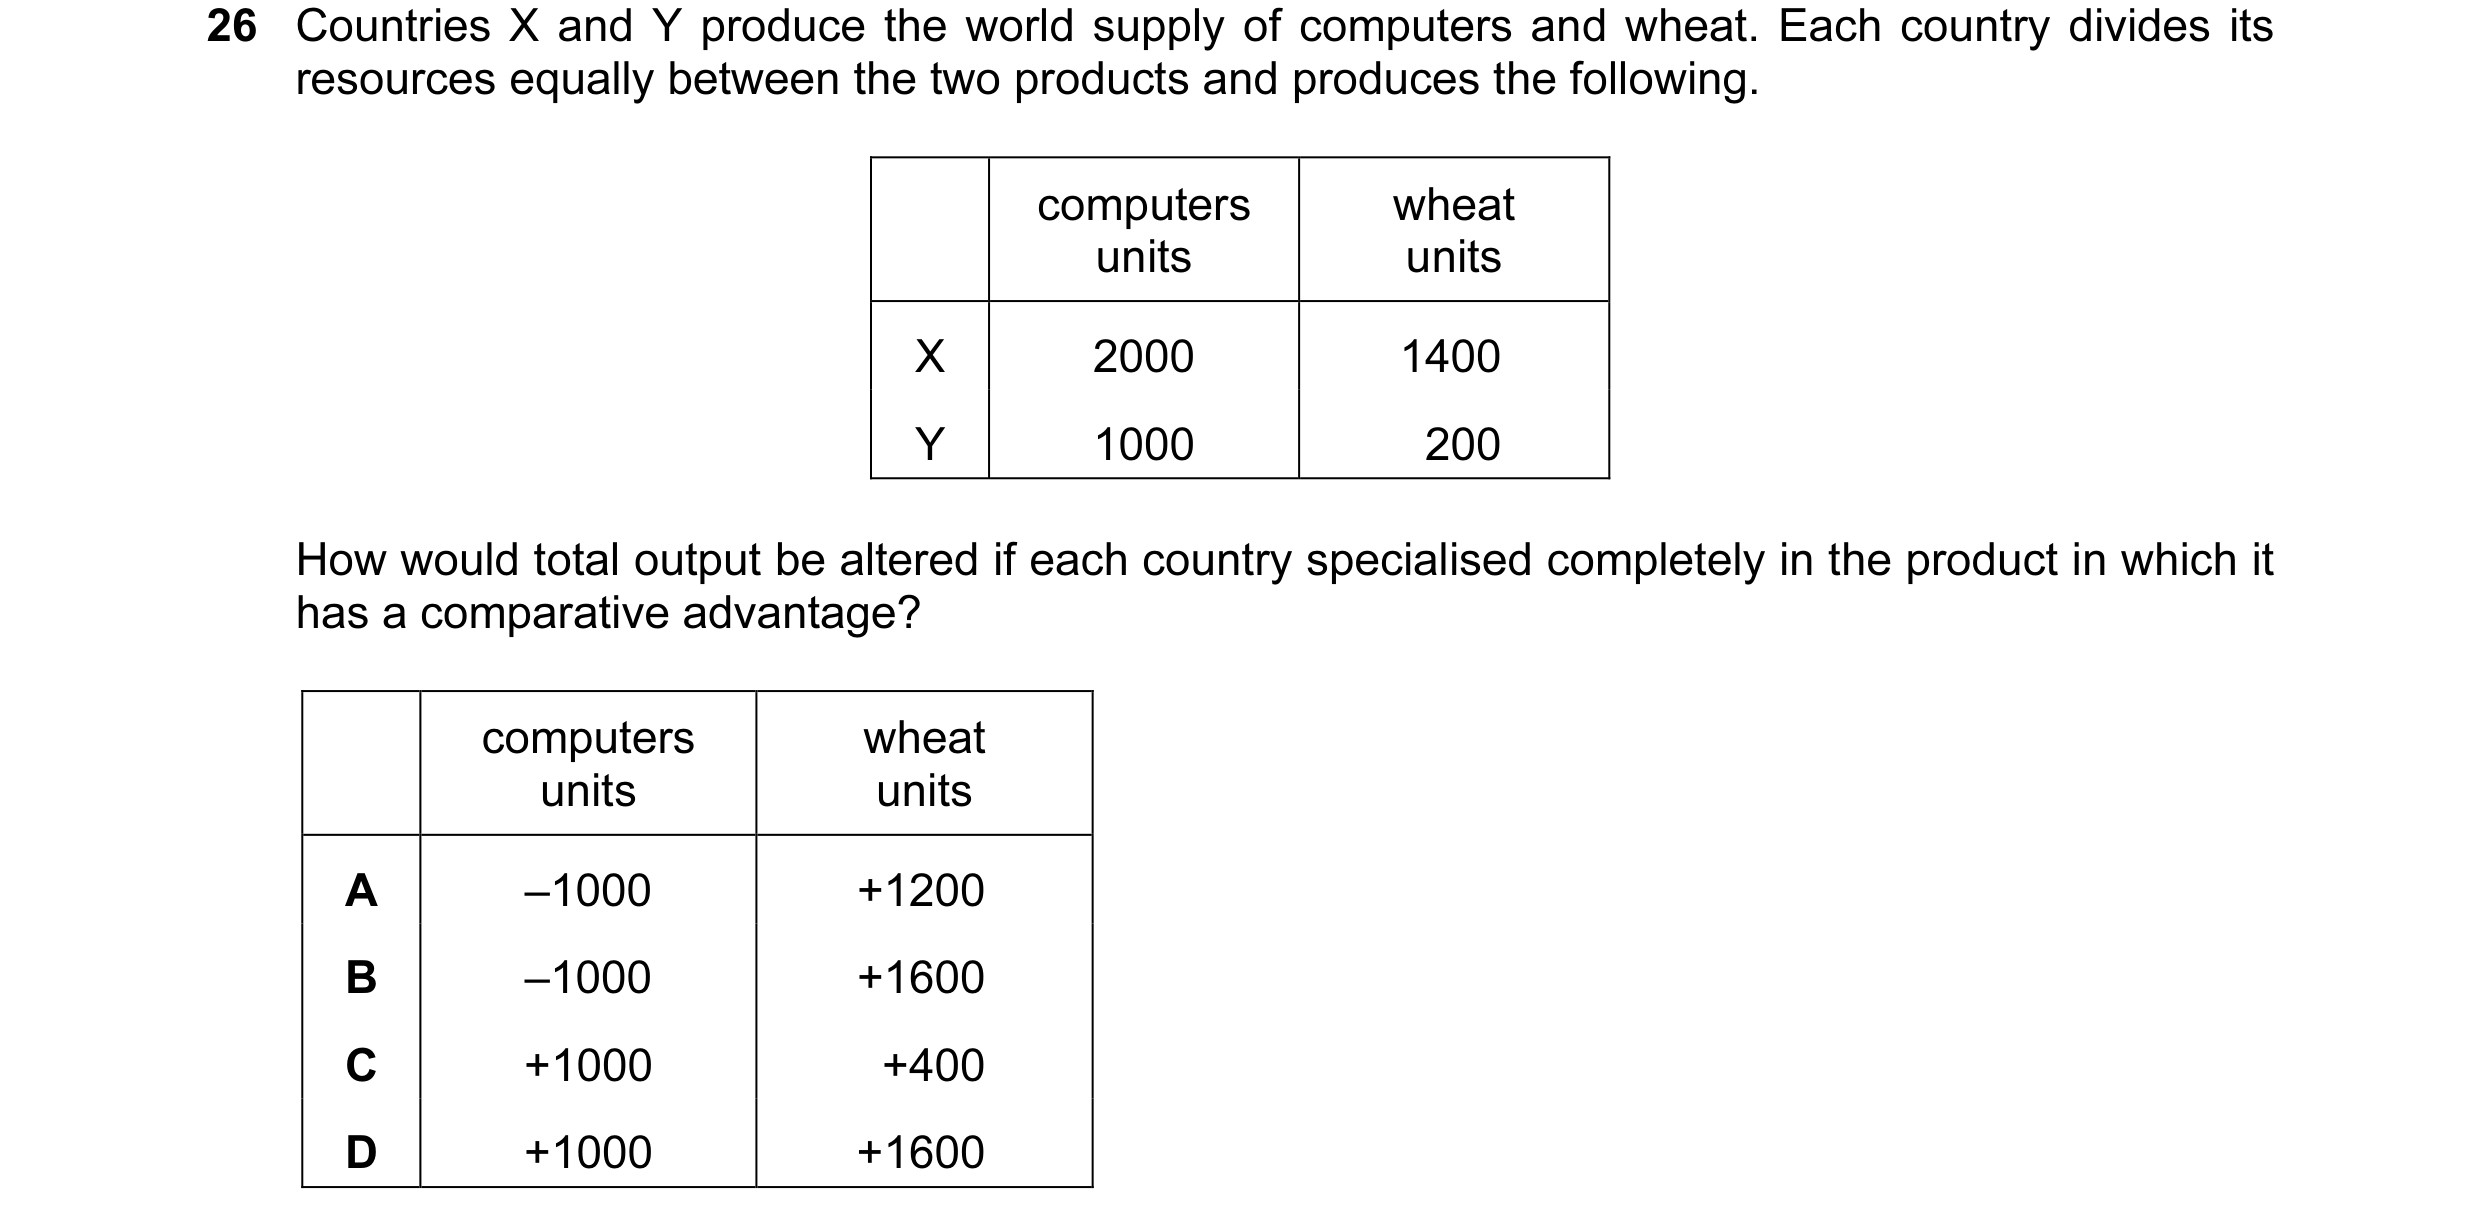
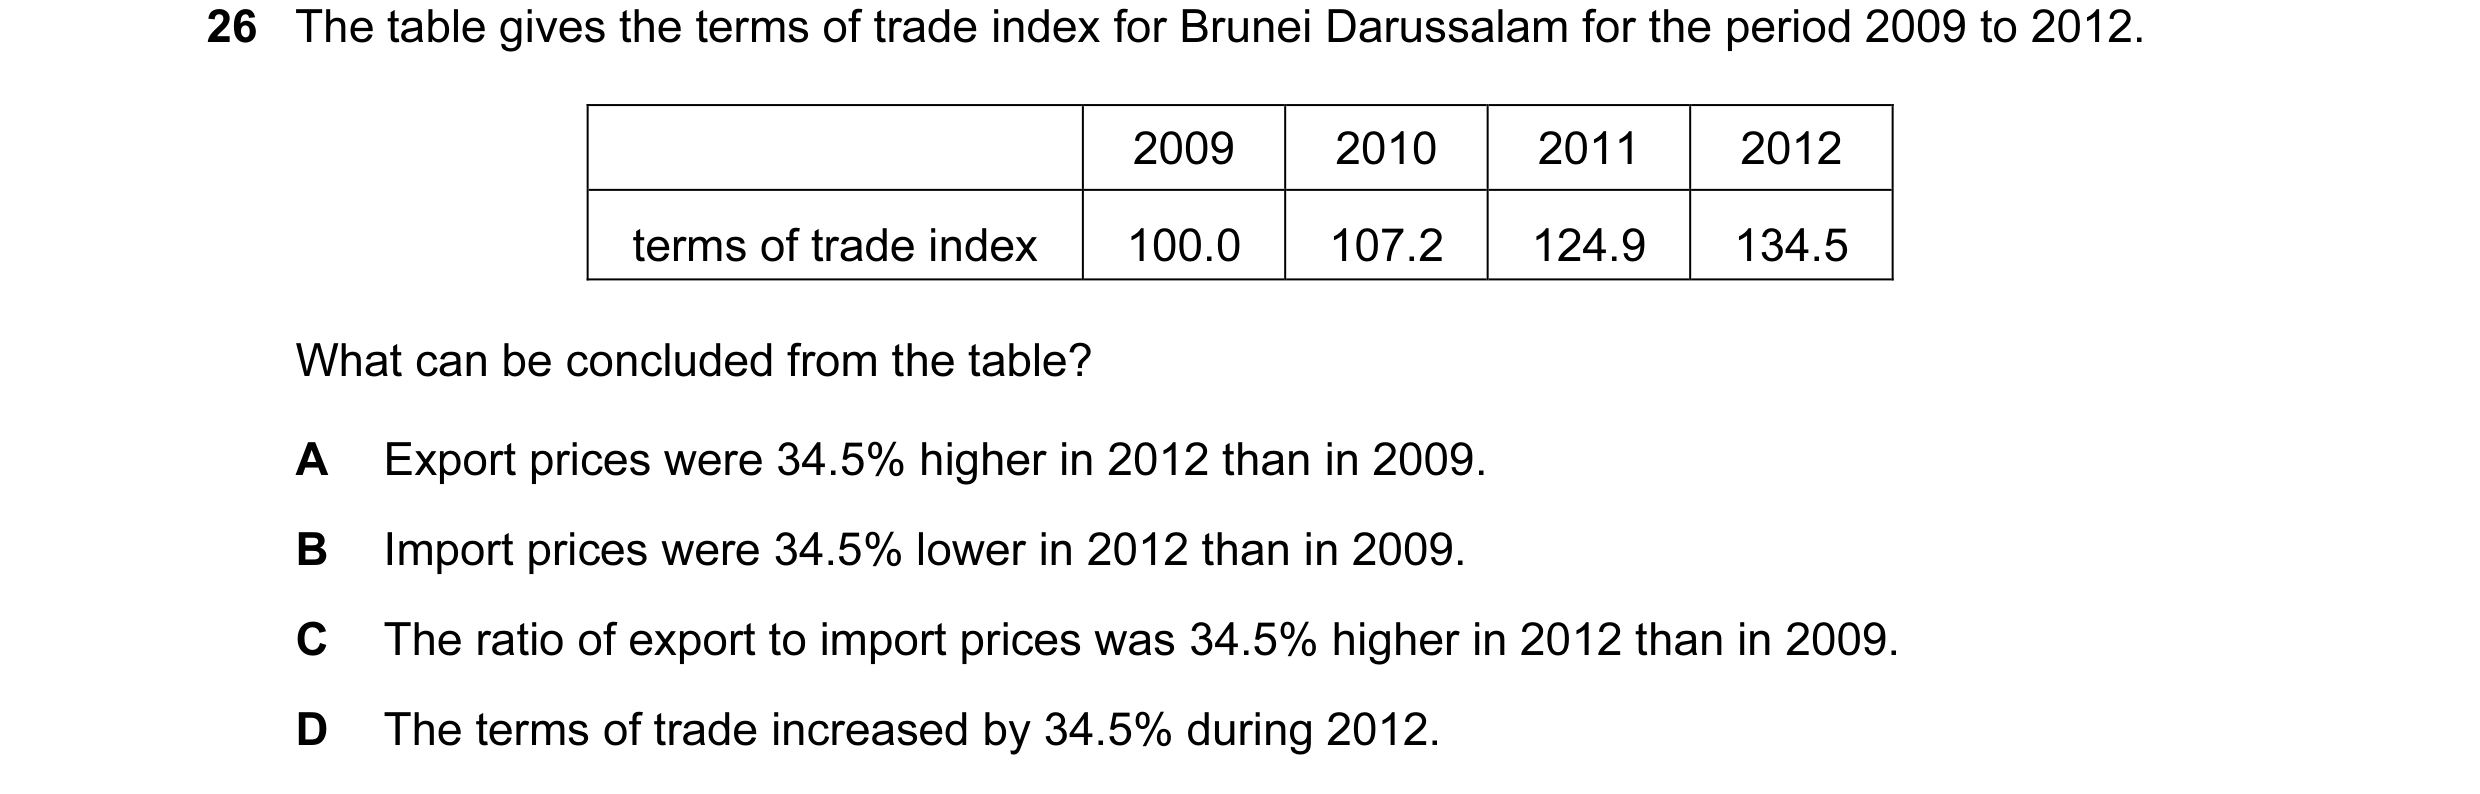
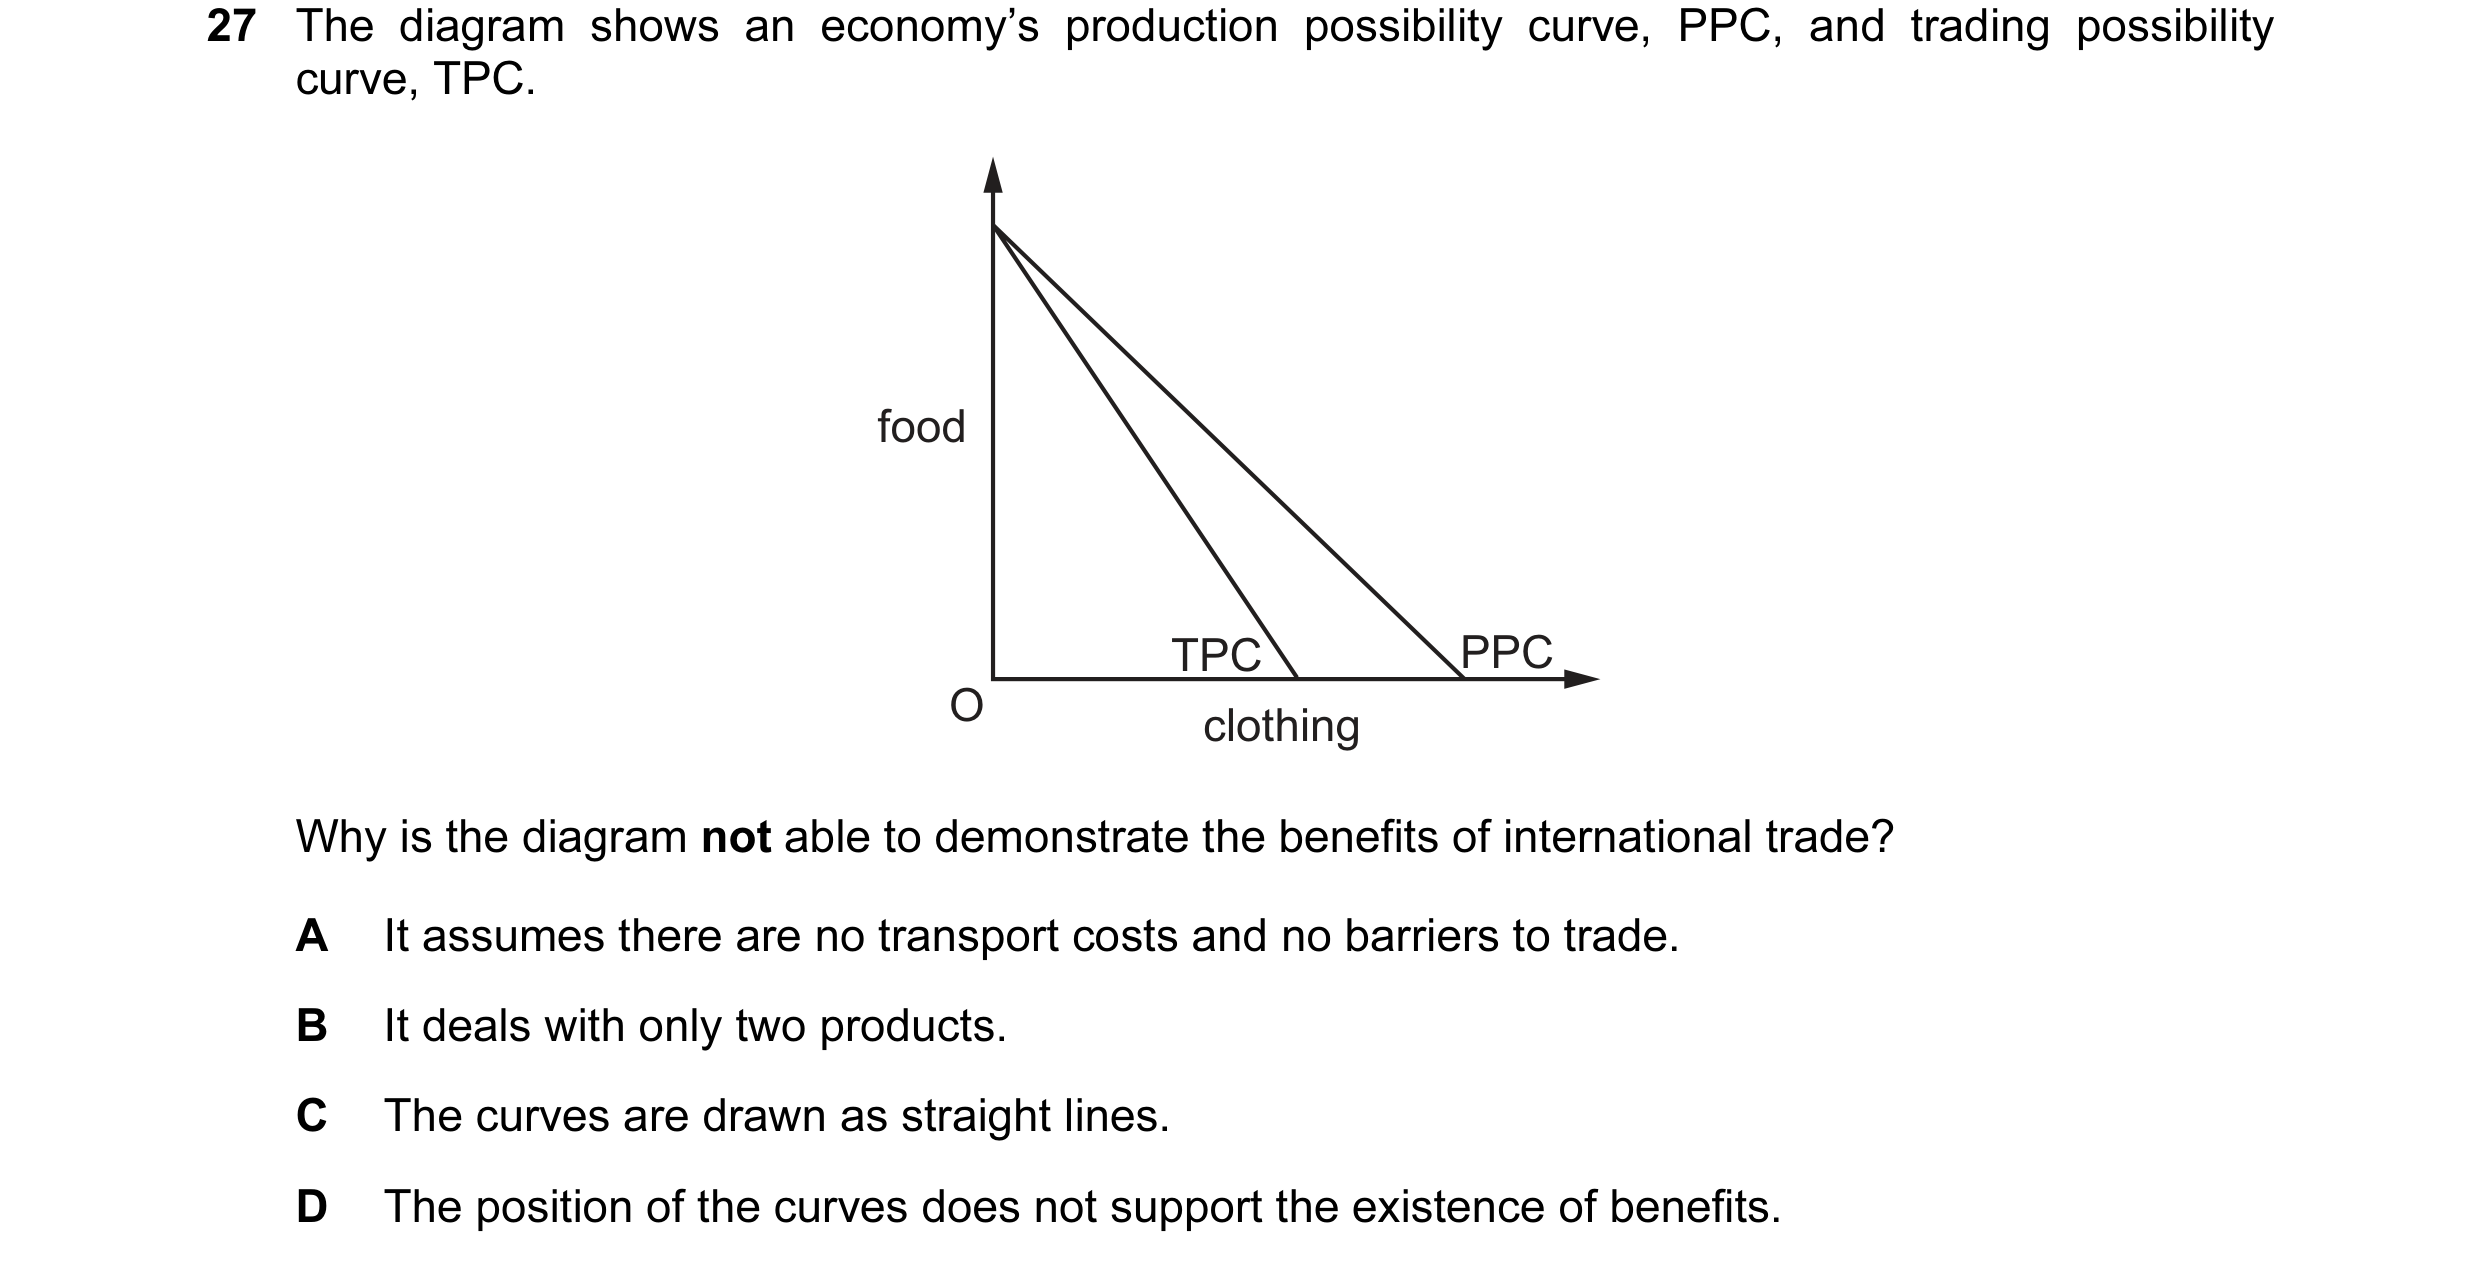 29 / 59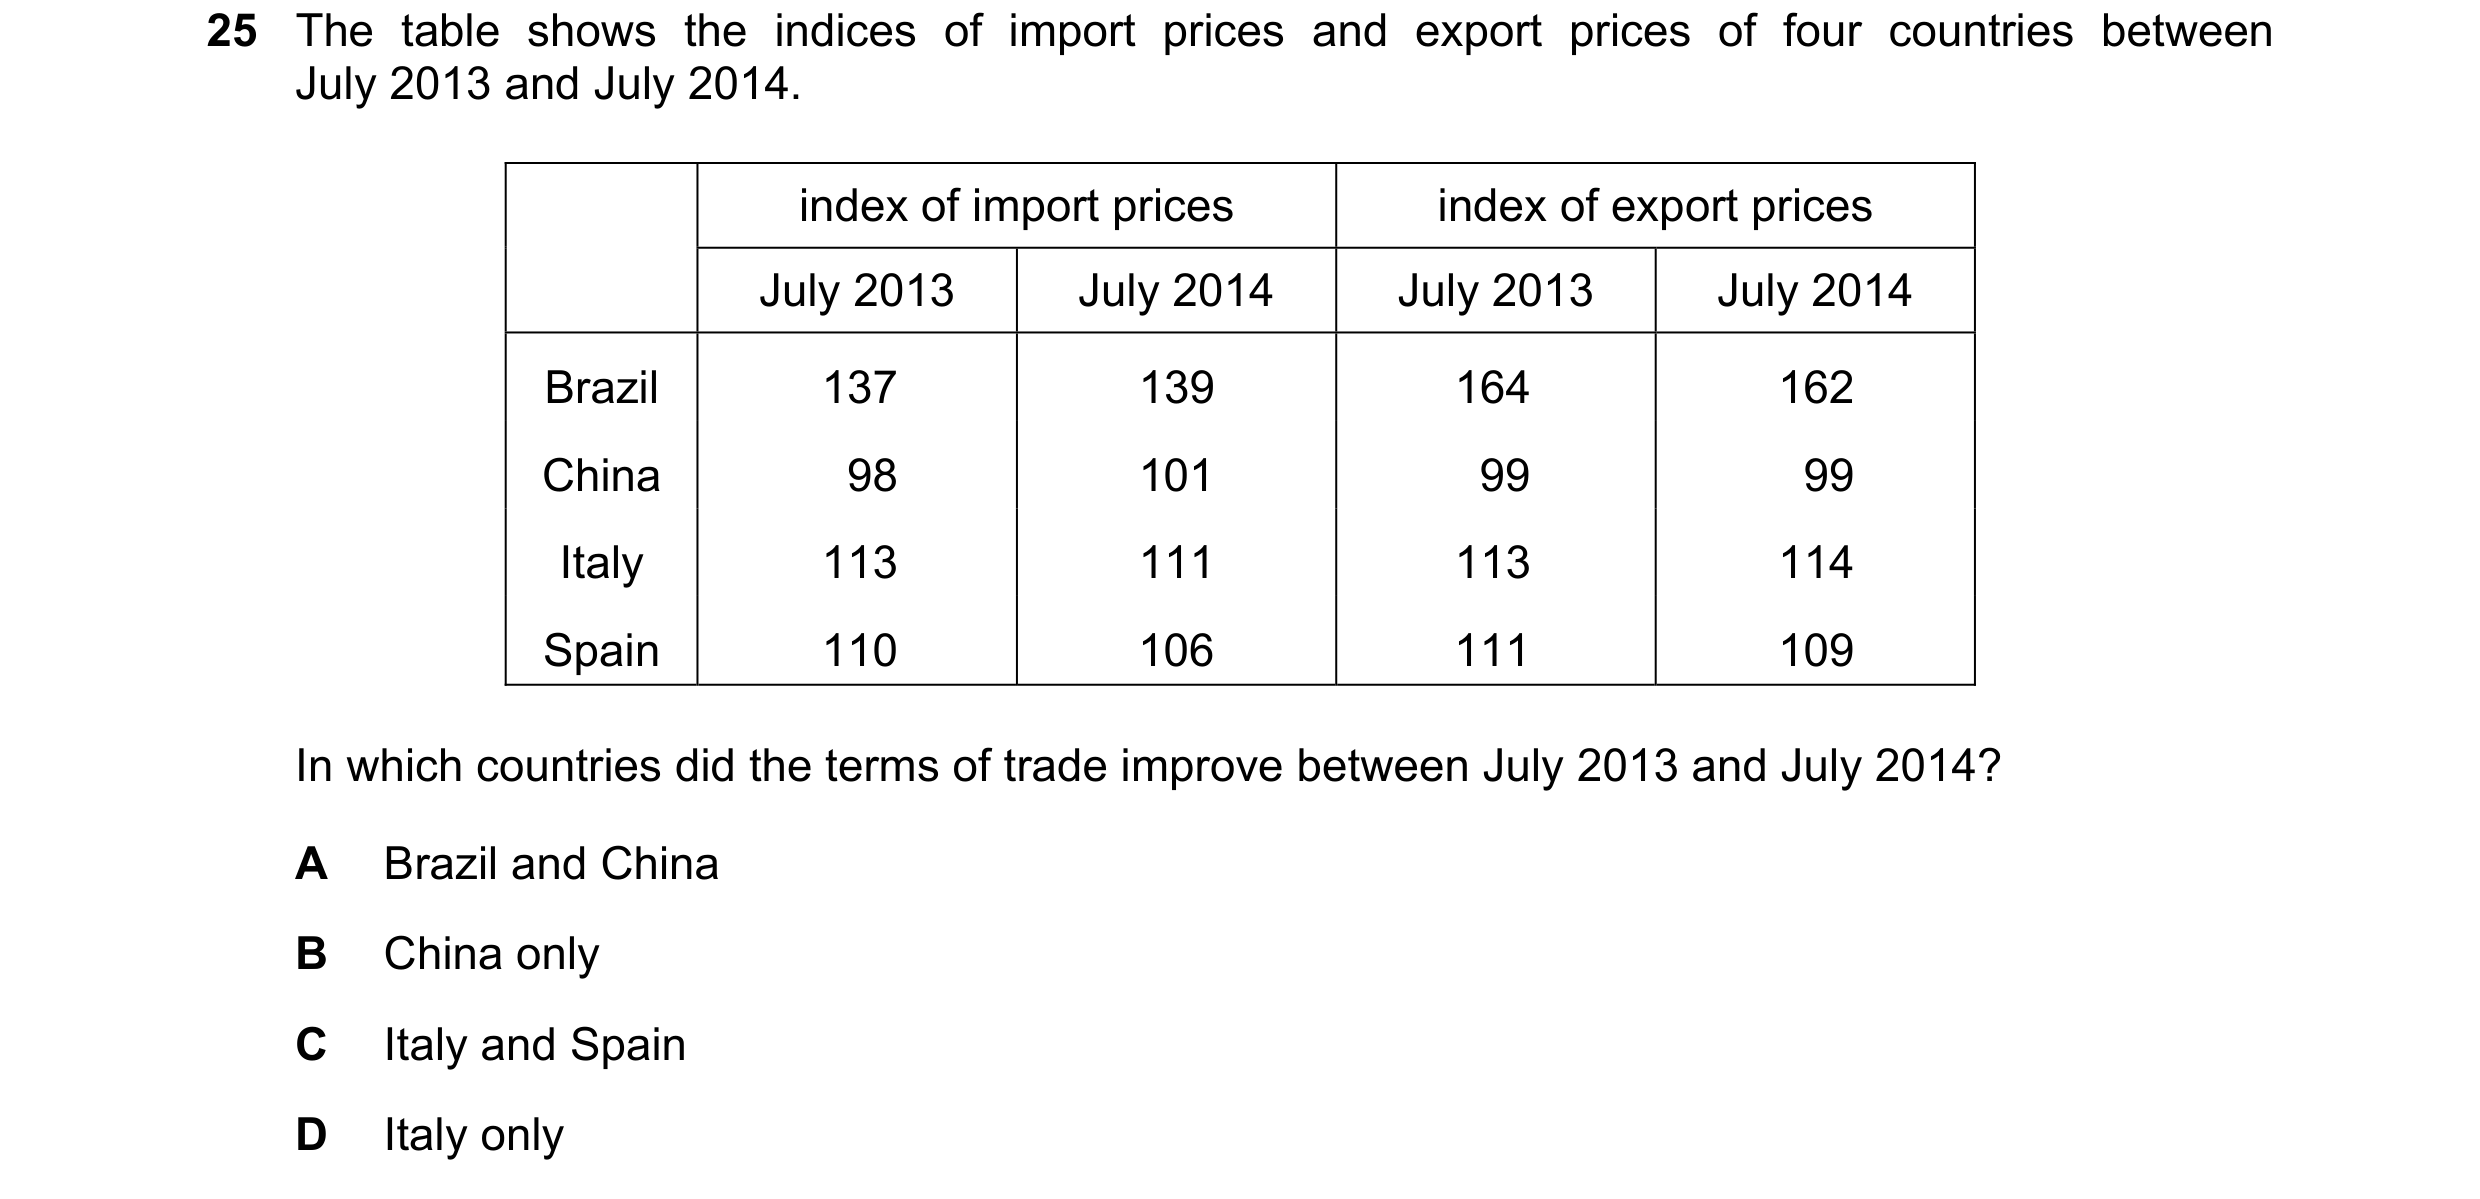
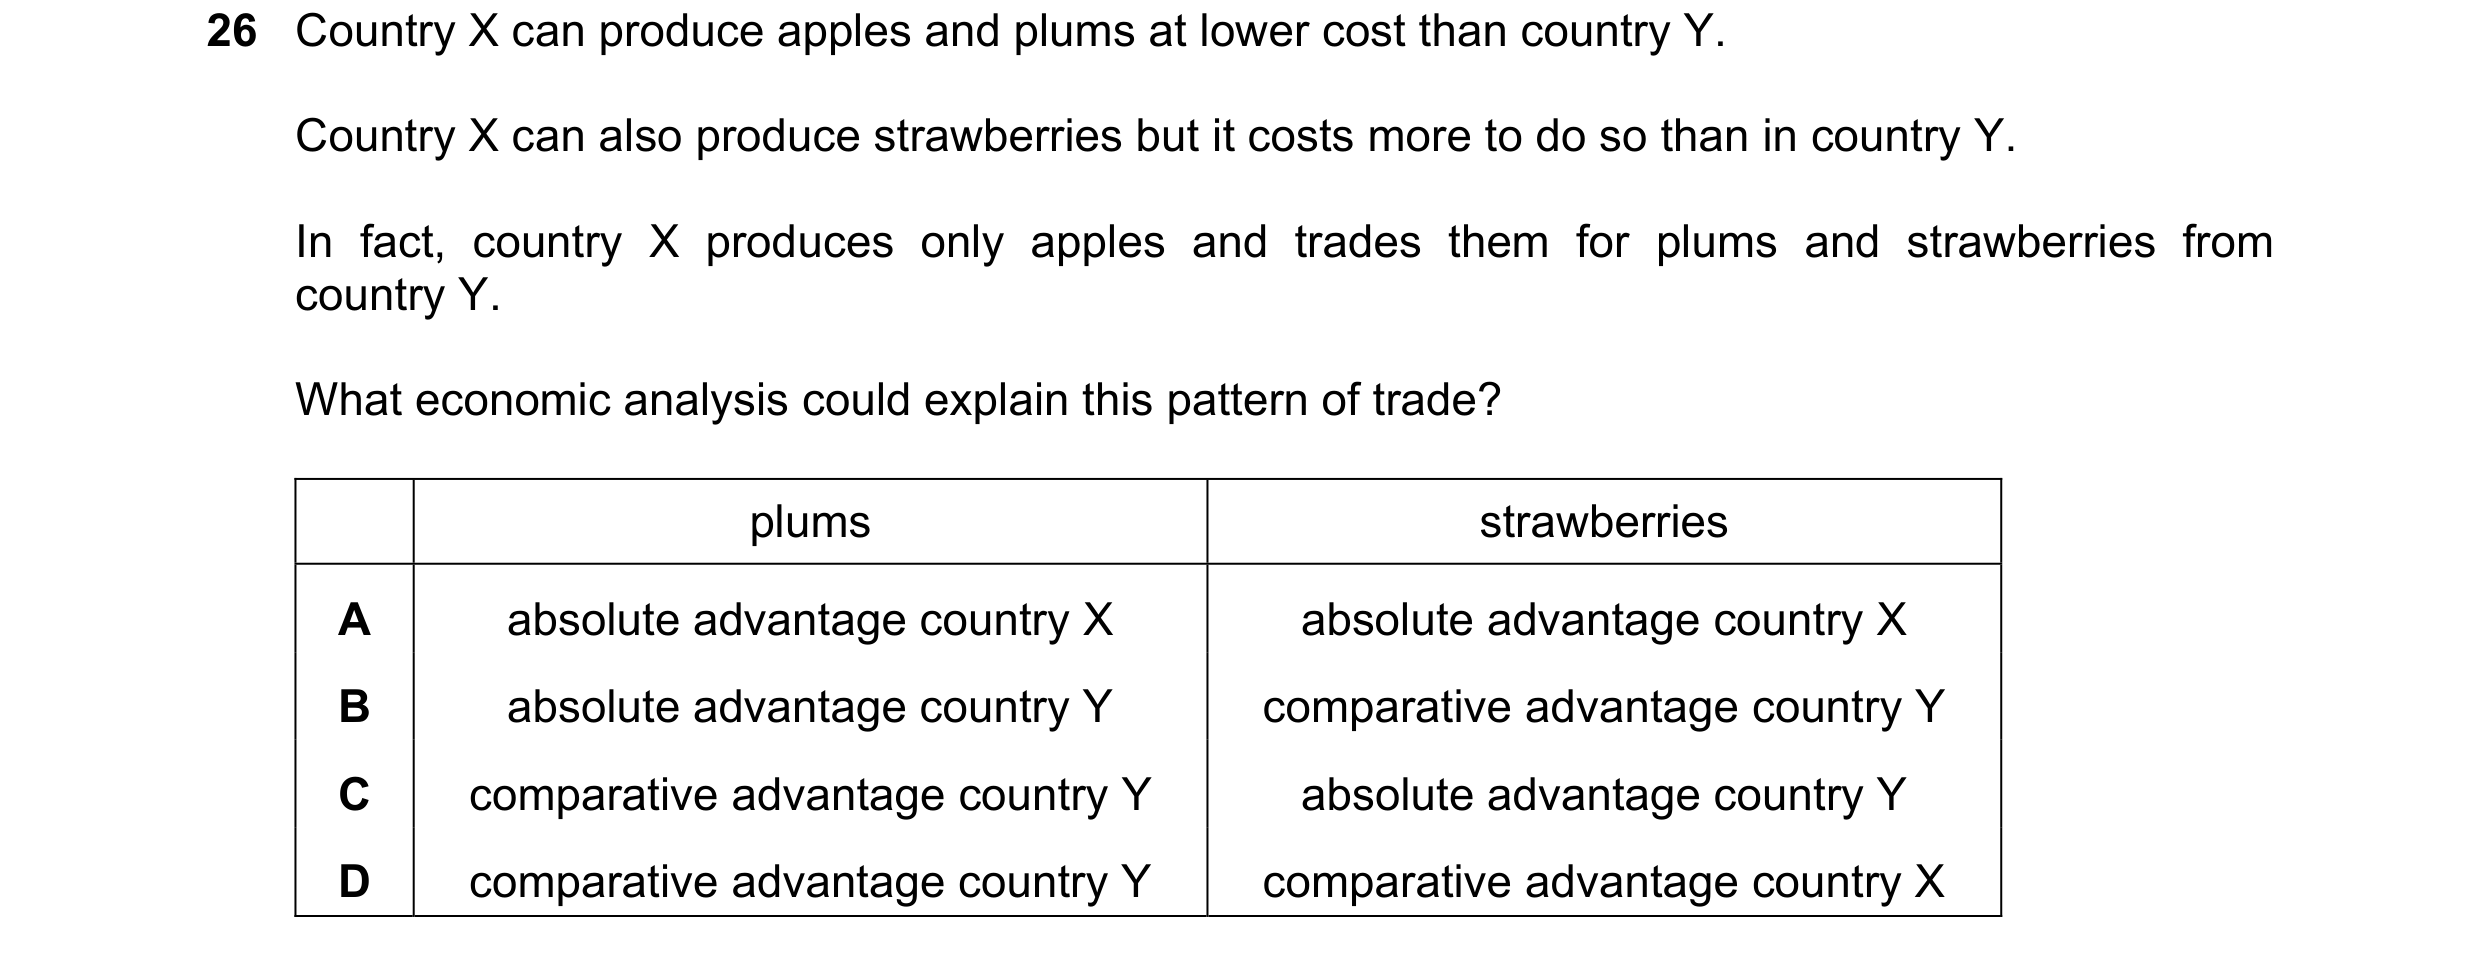 30 / 59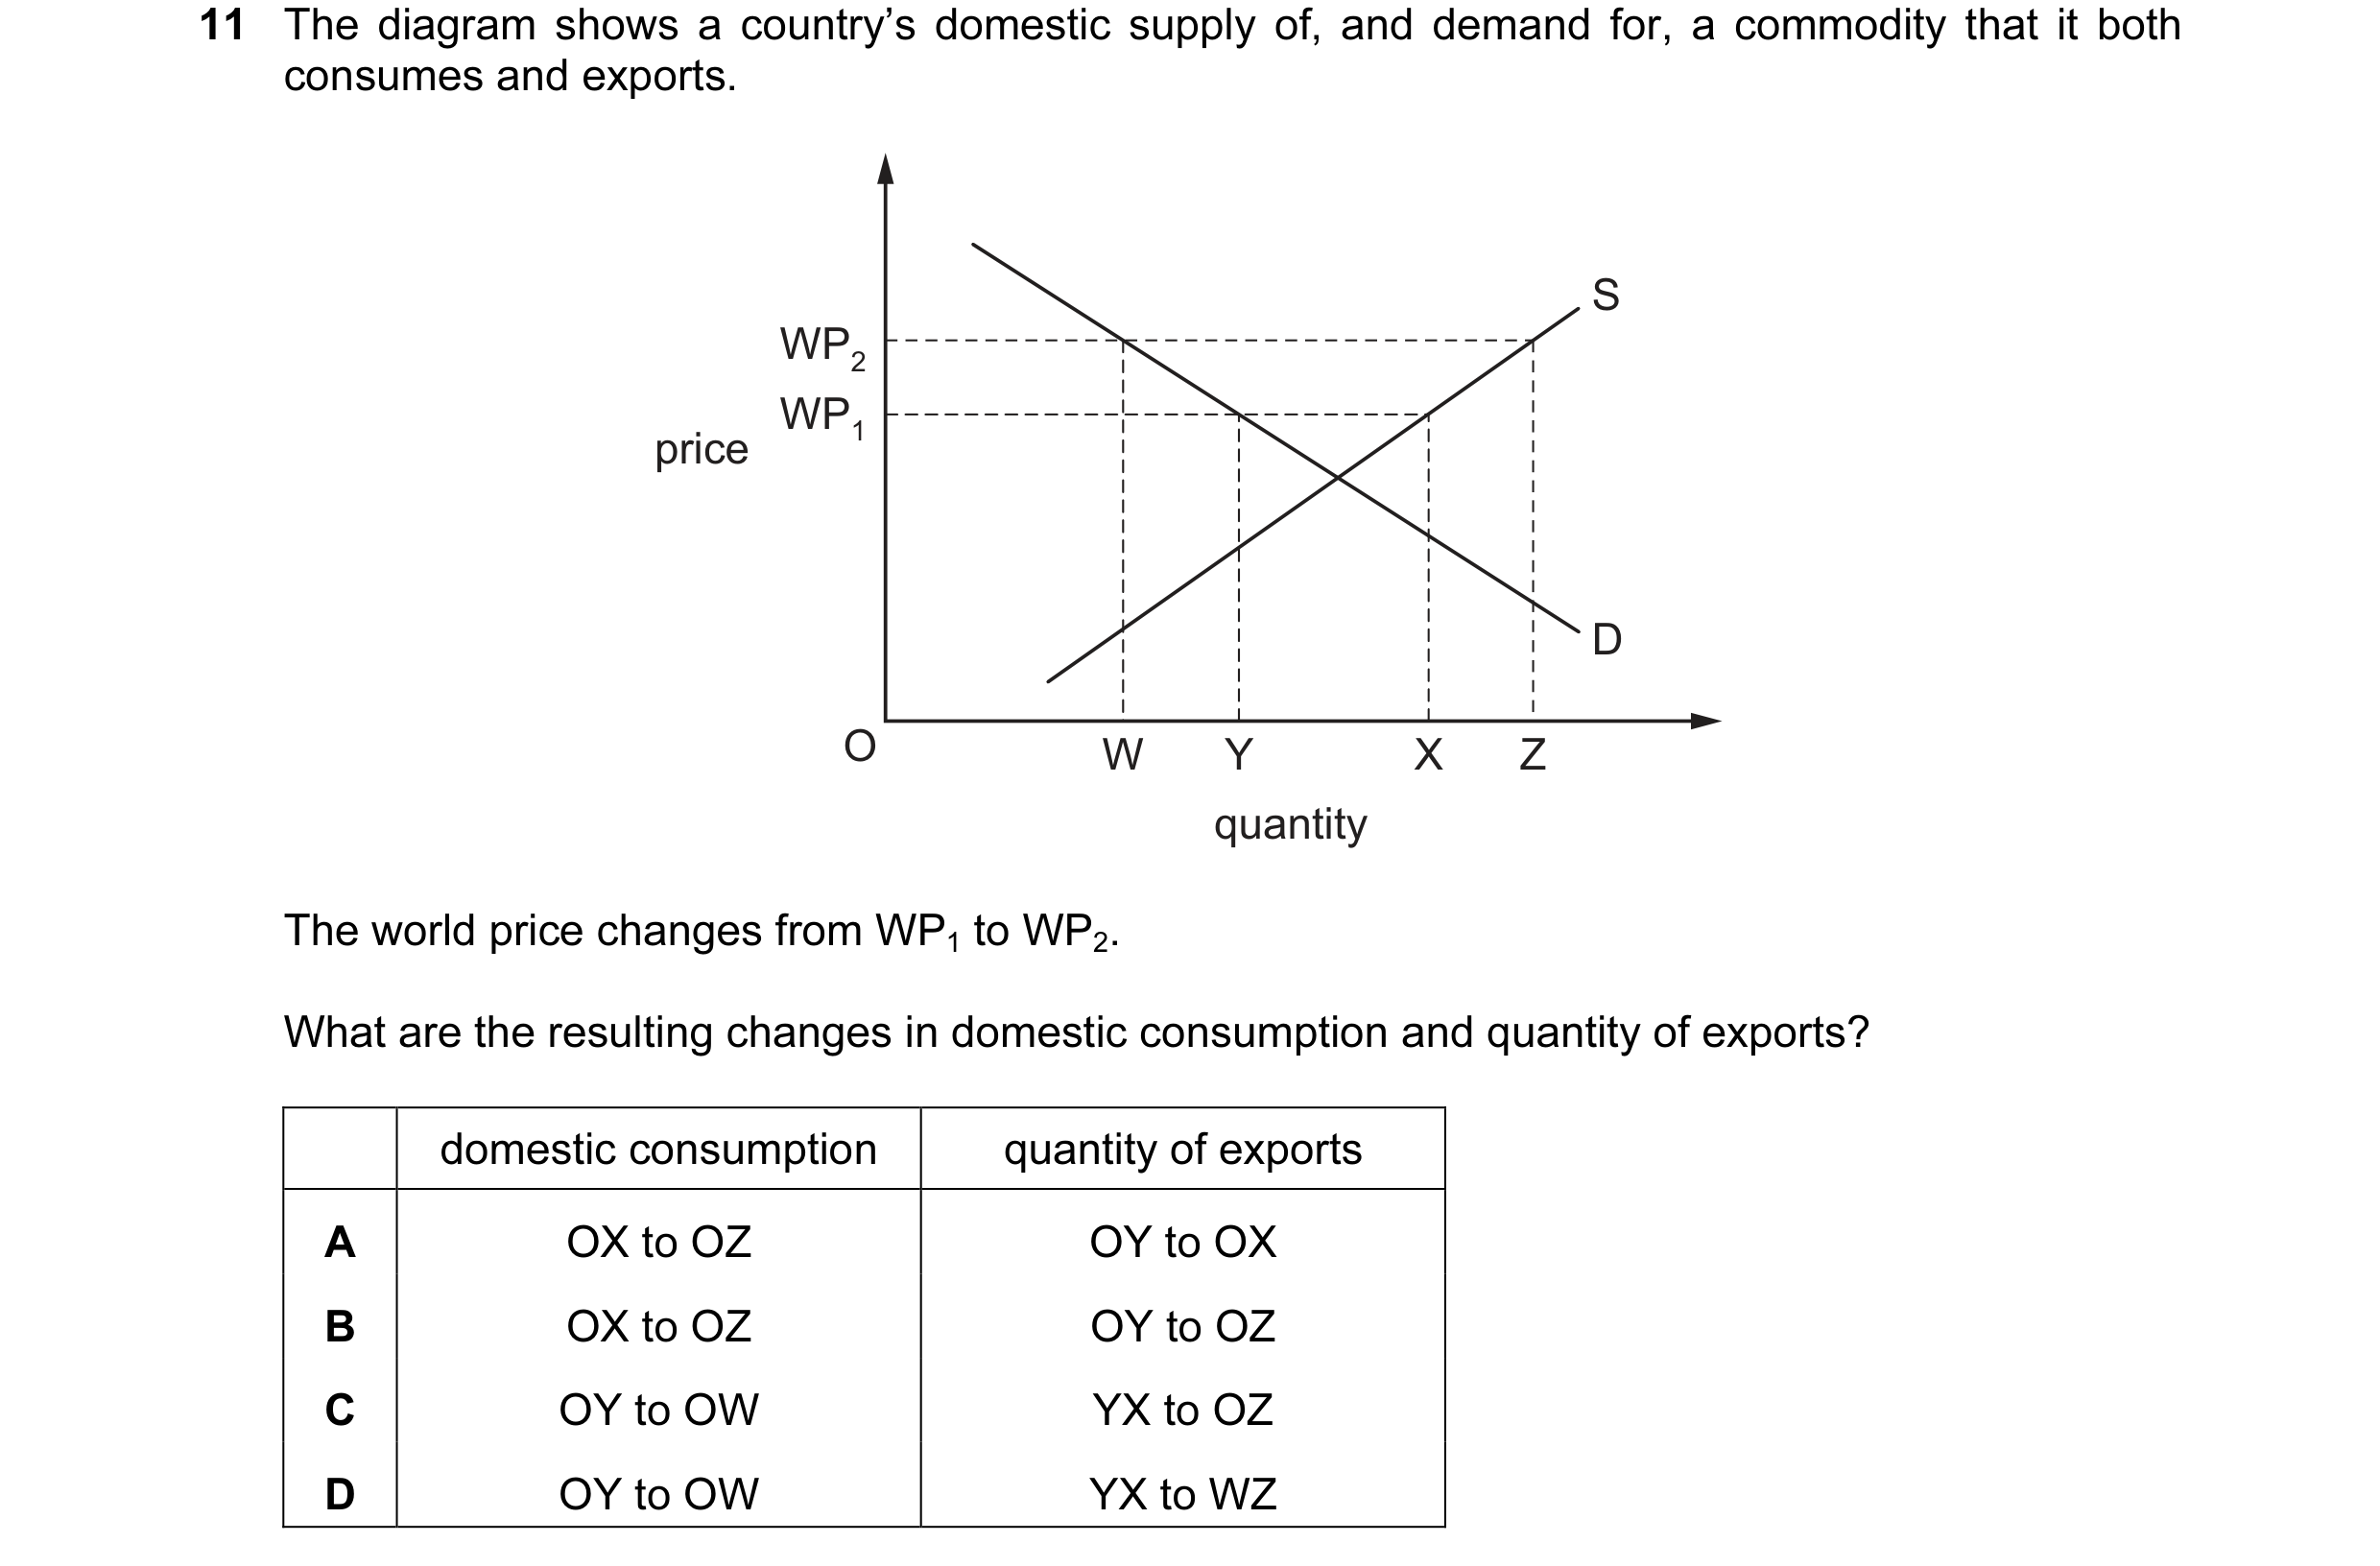
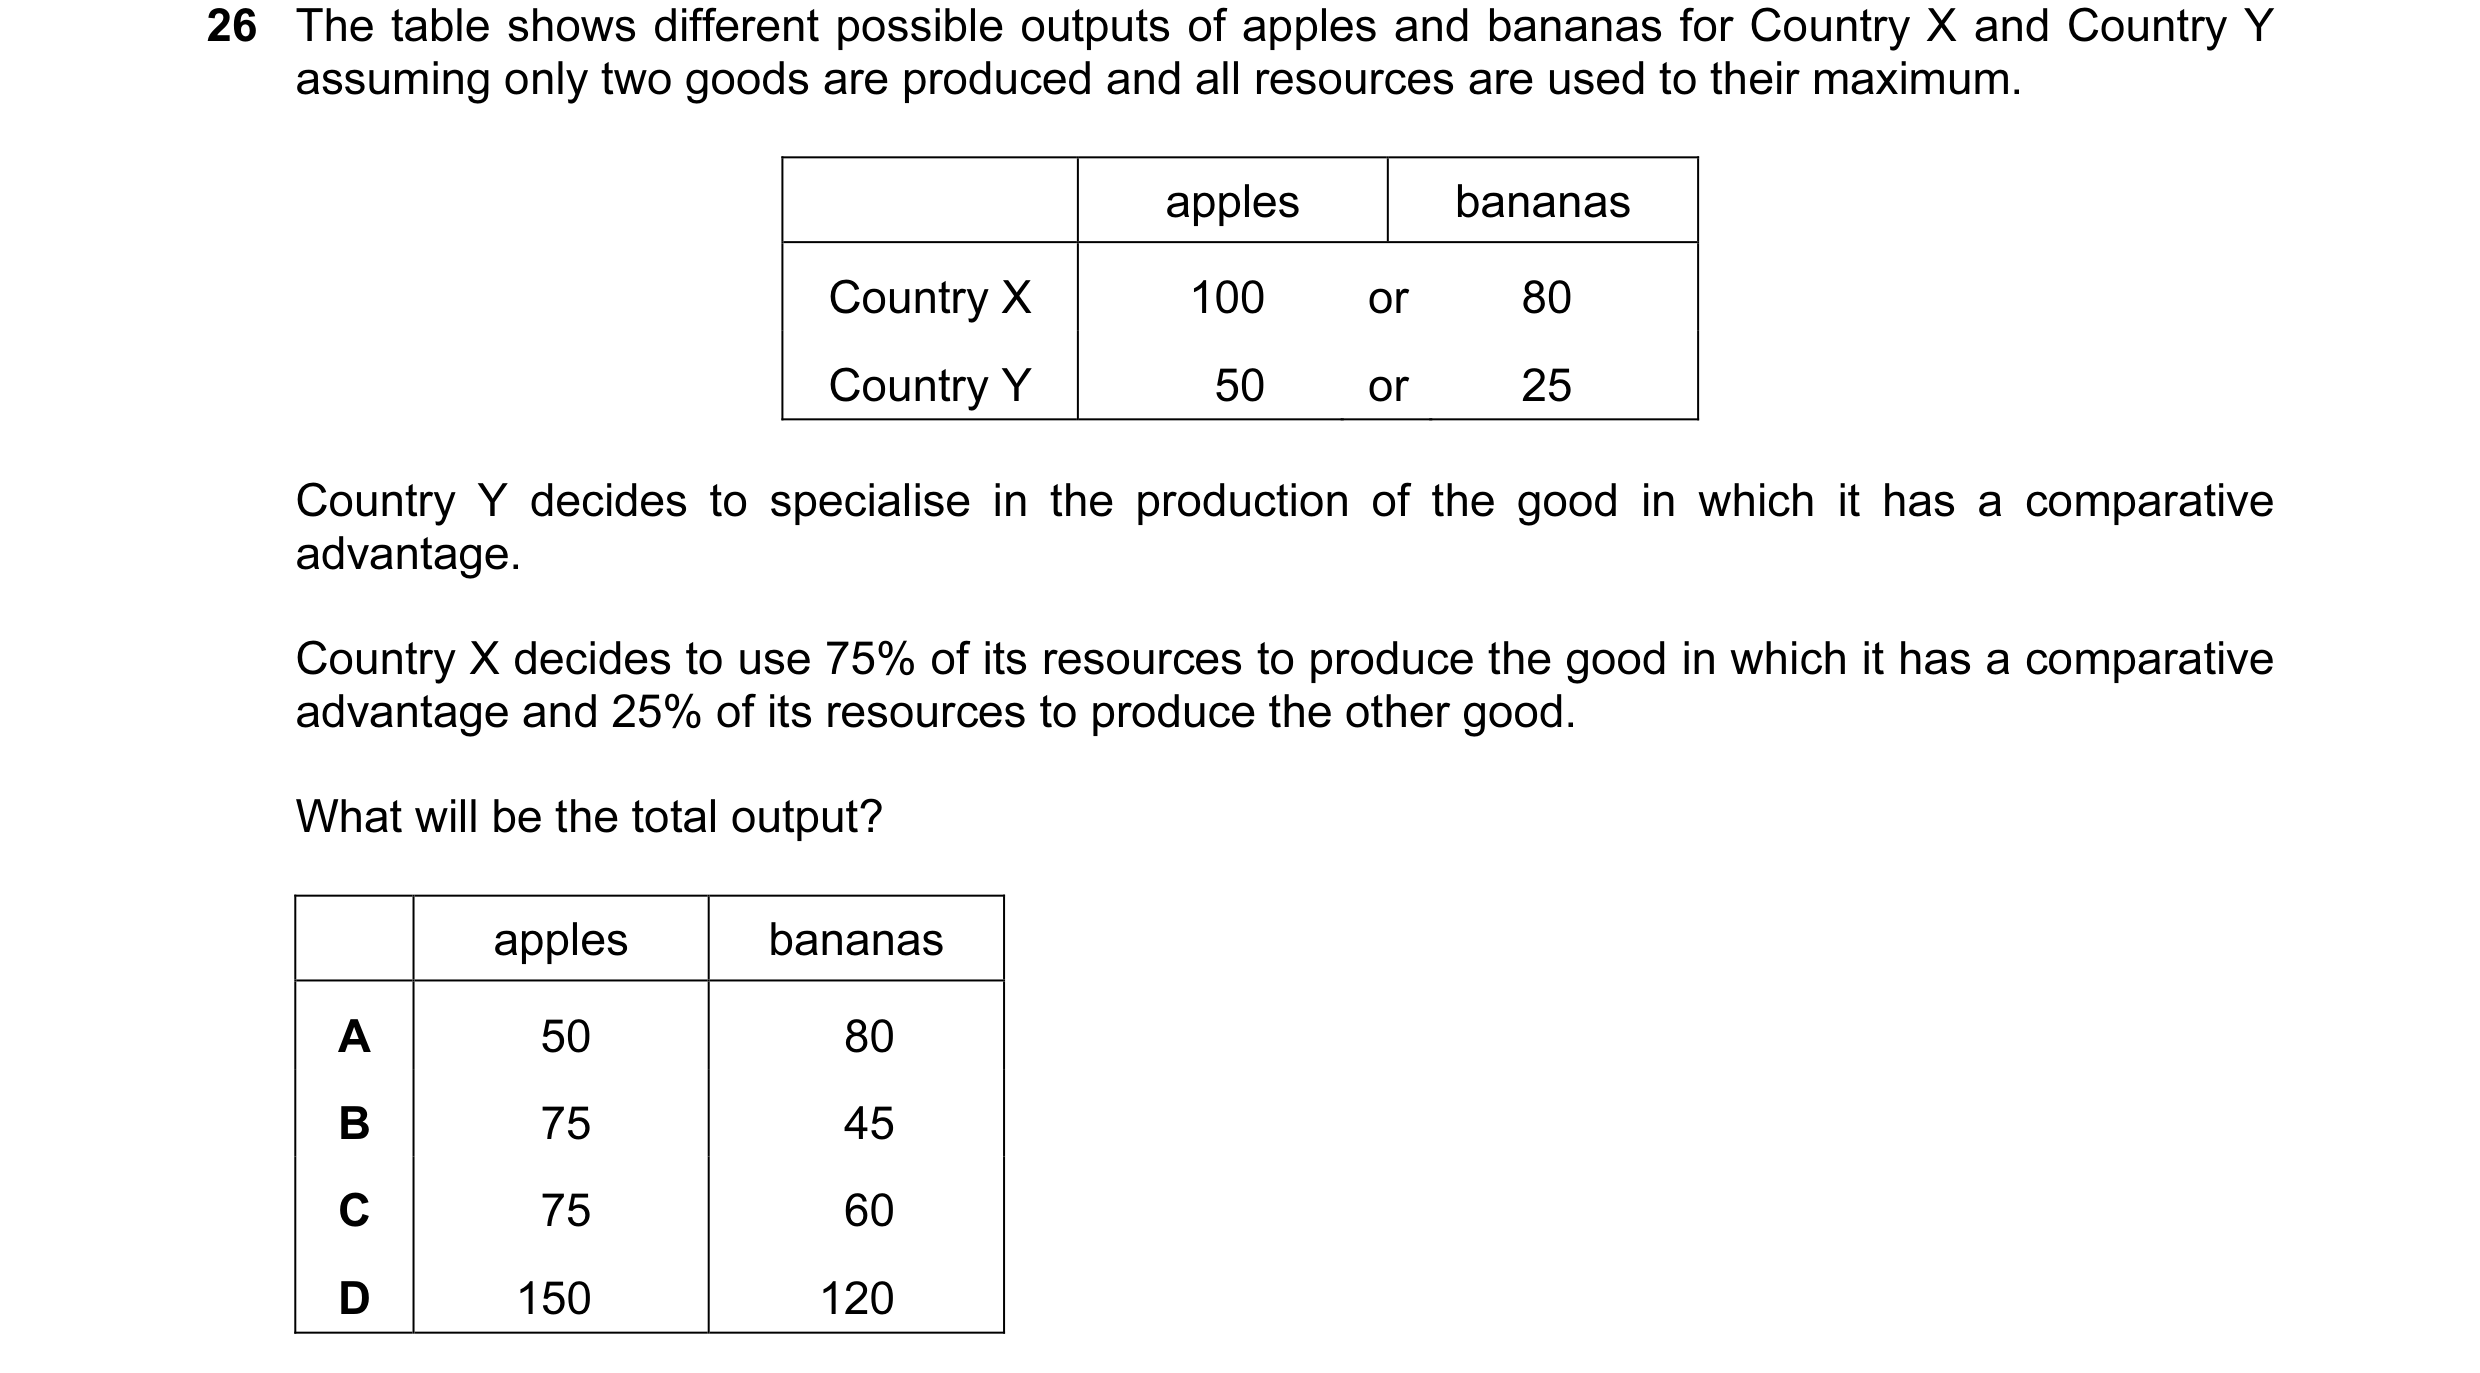 31 / 59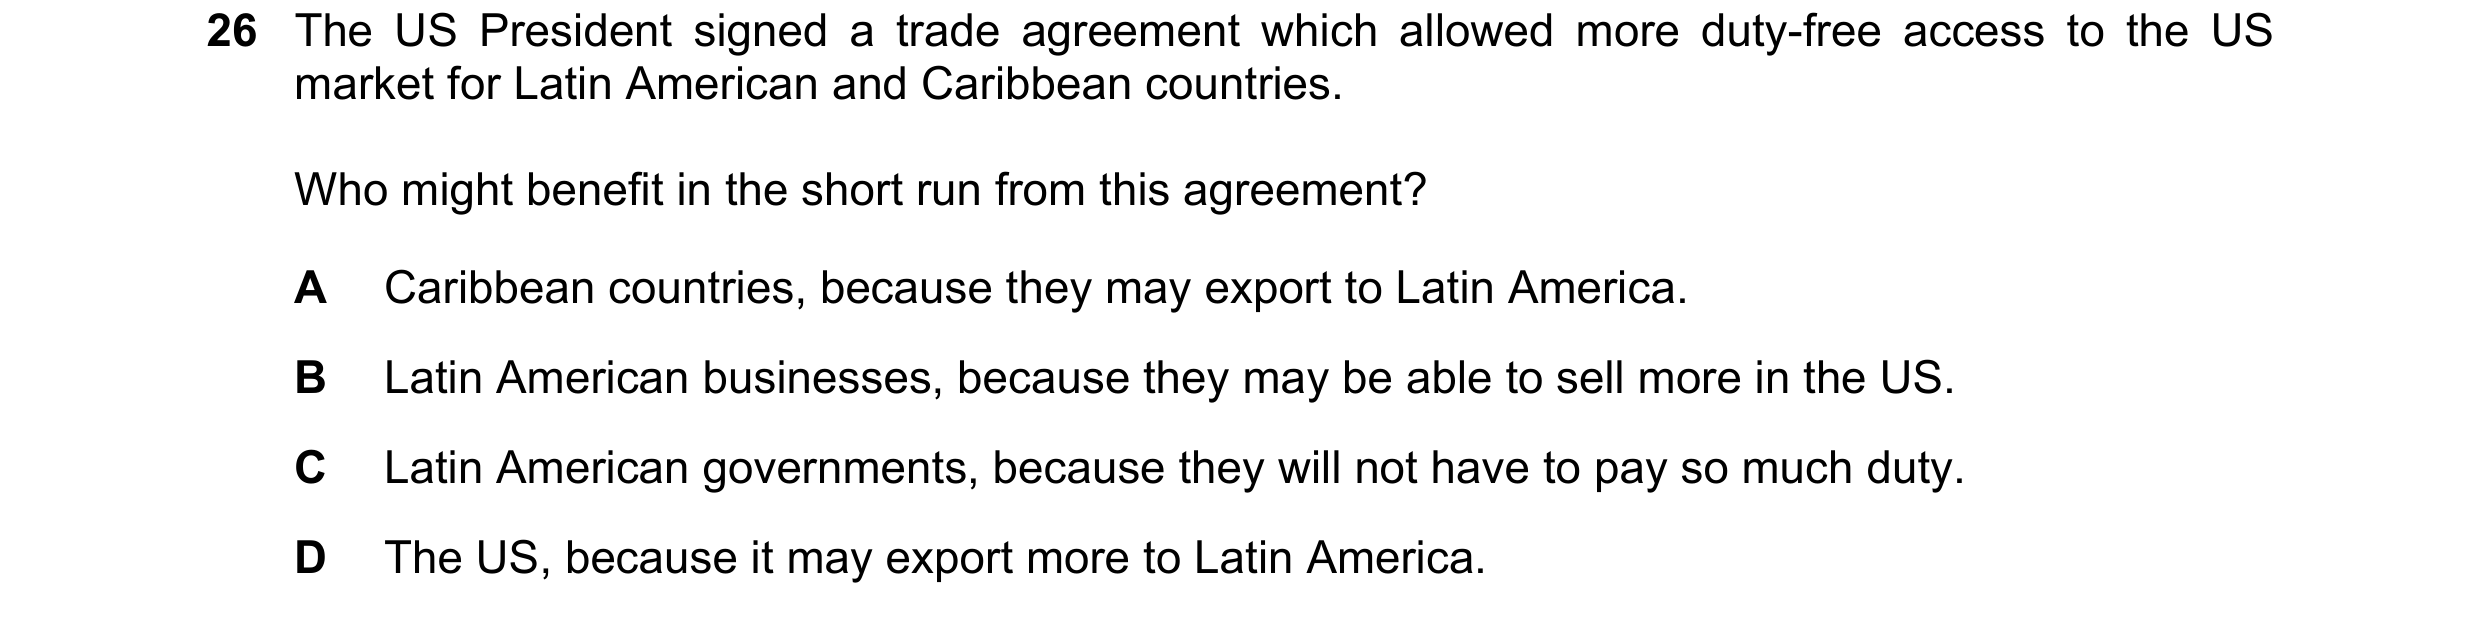

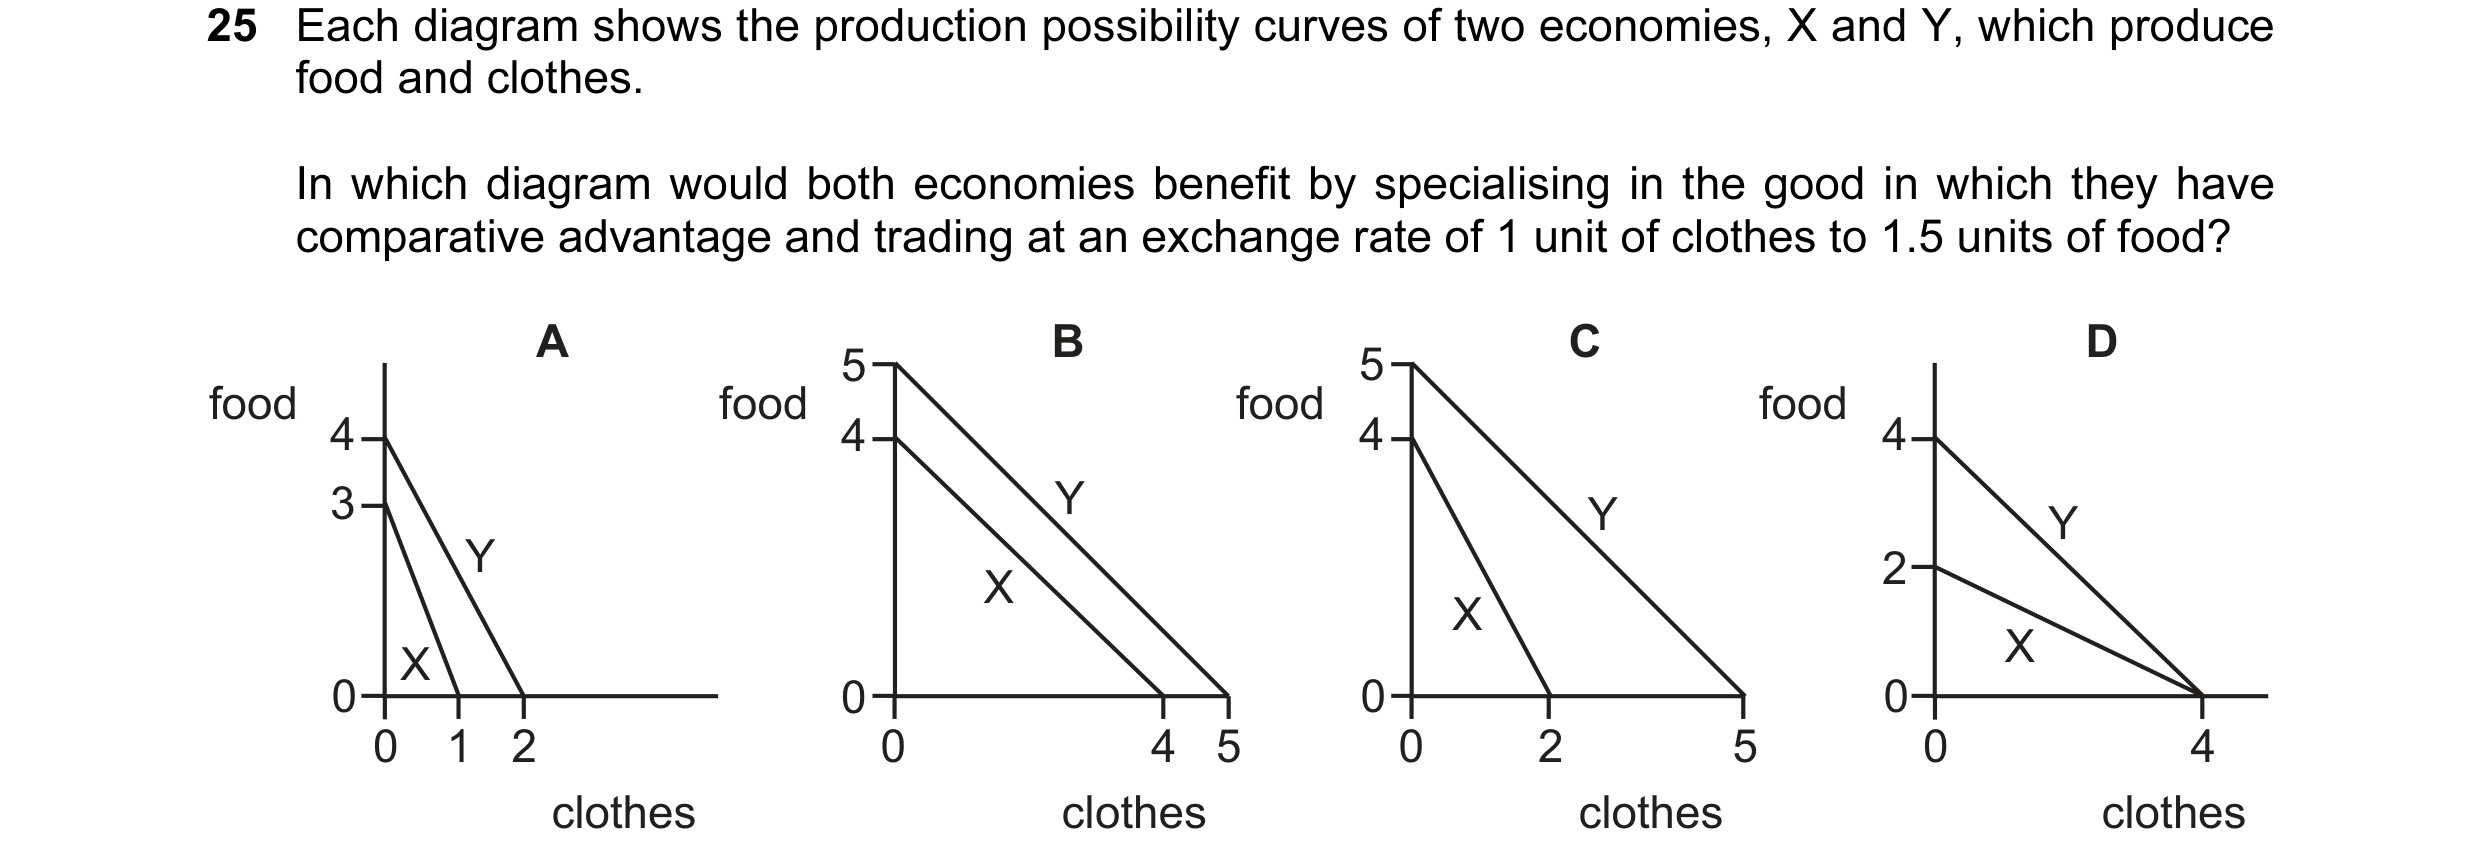

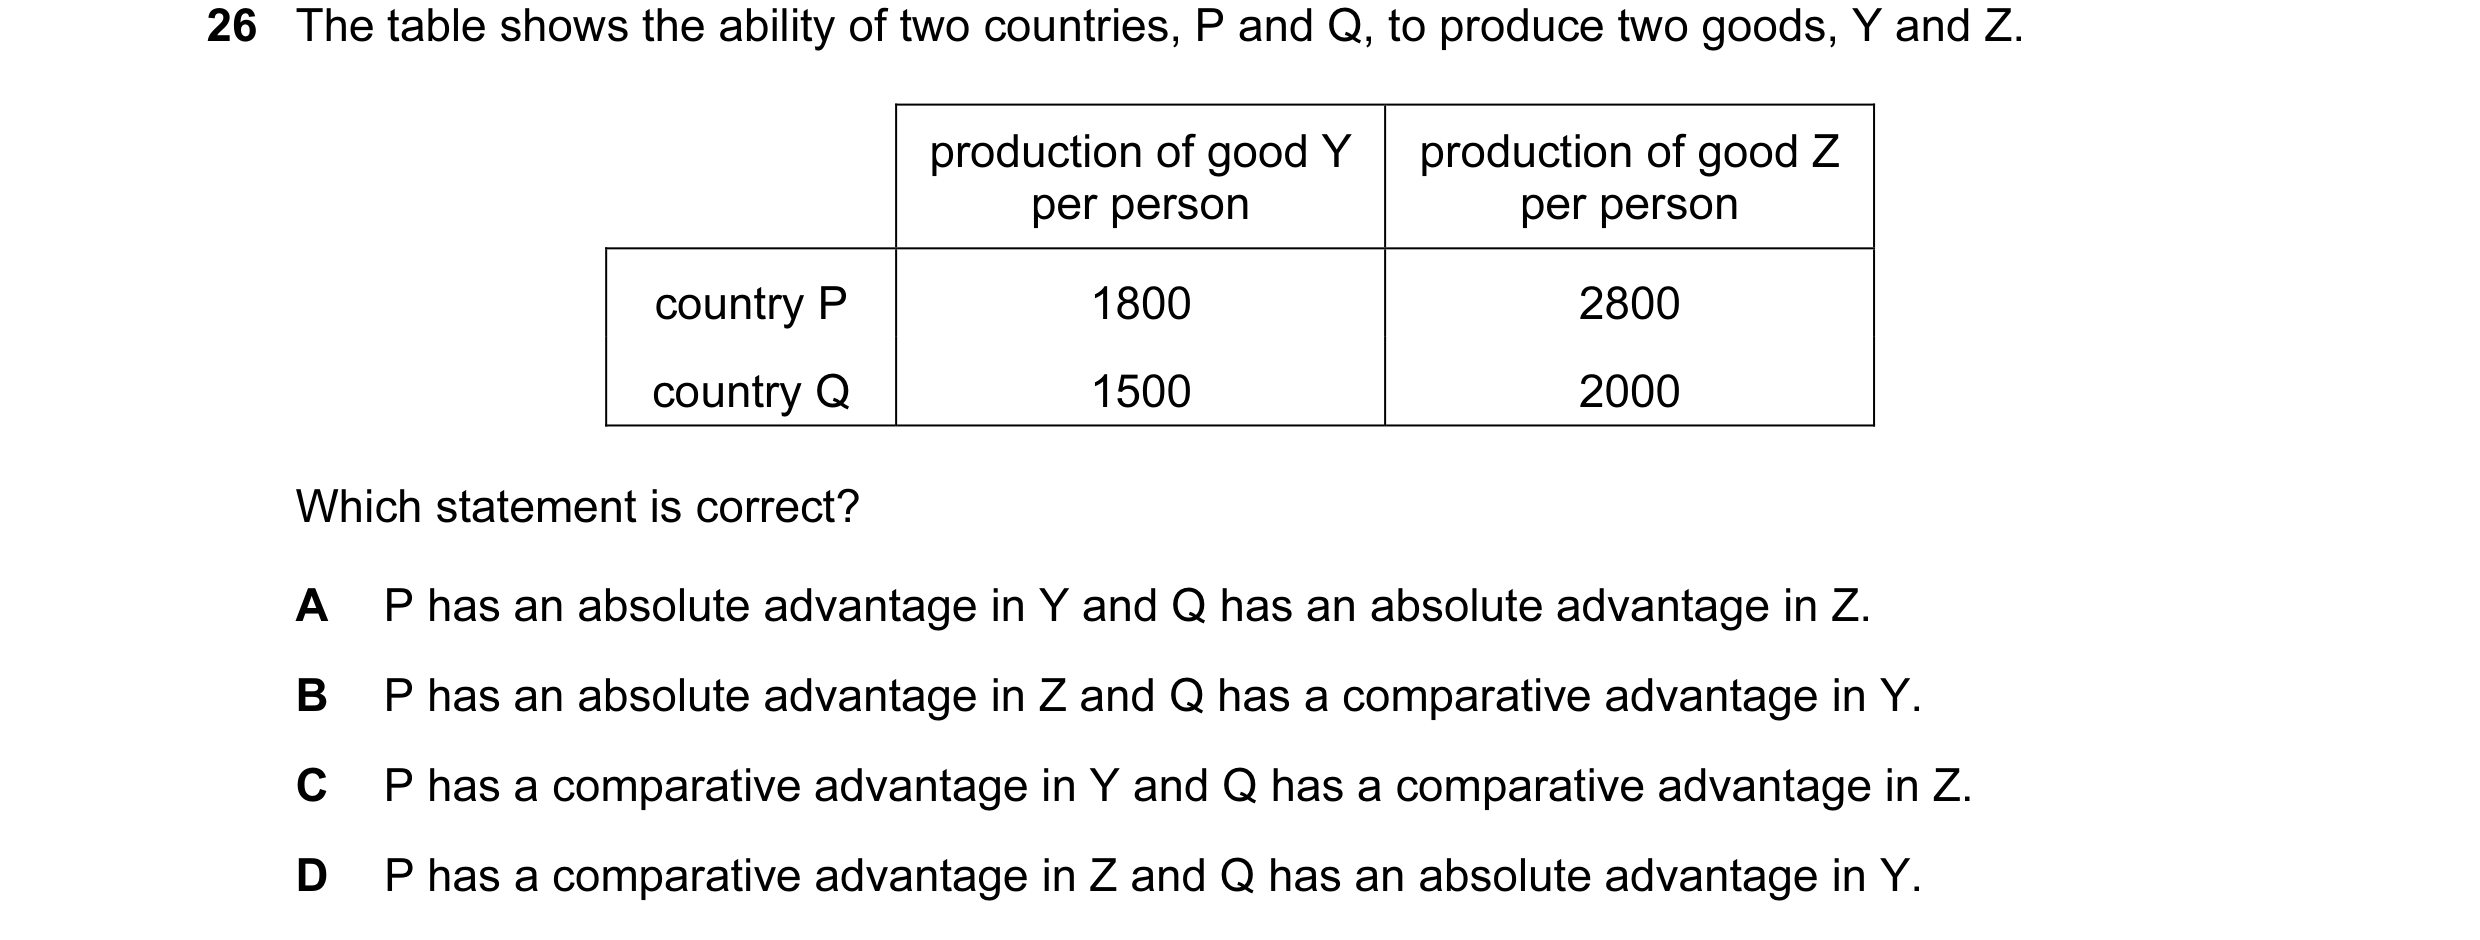 32 / 59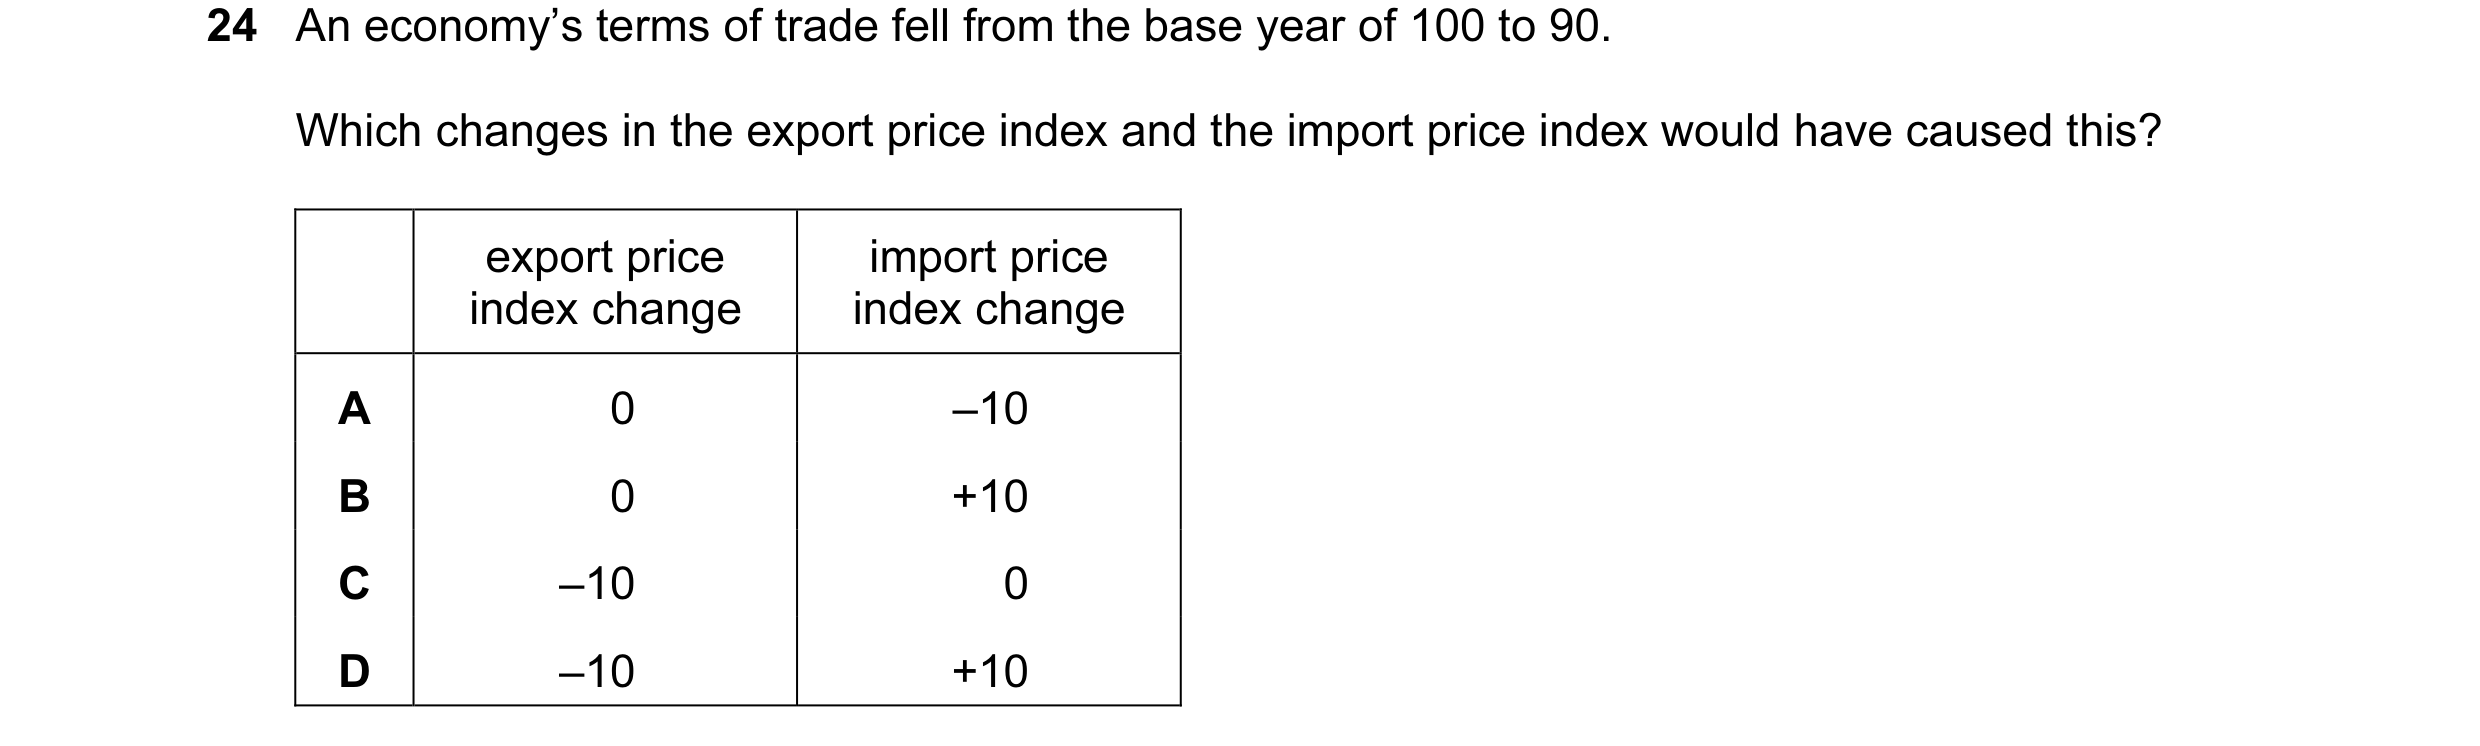
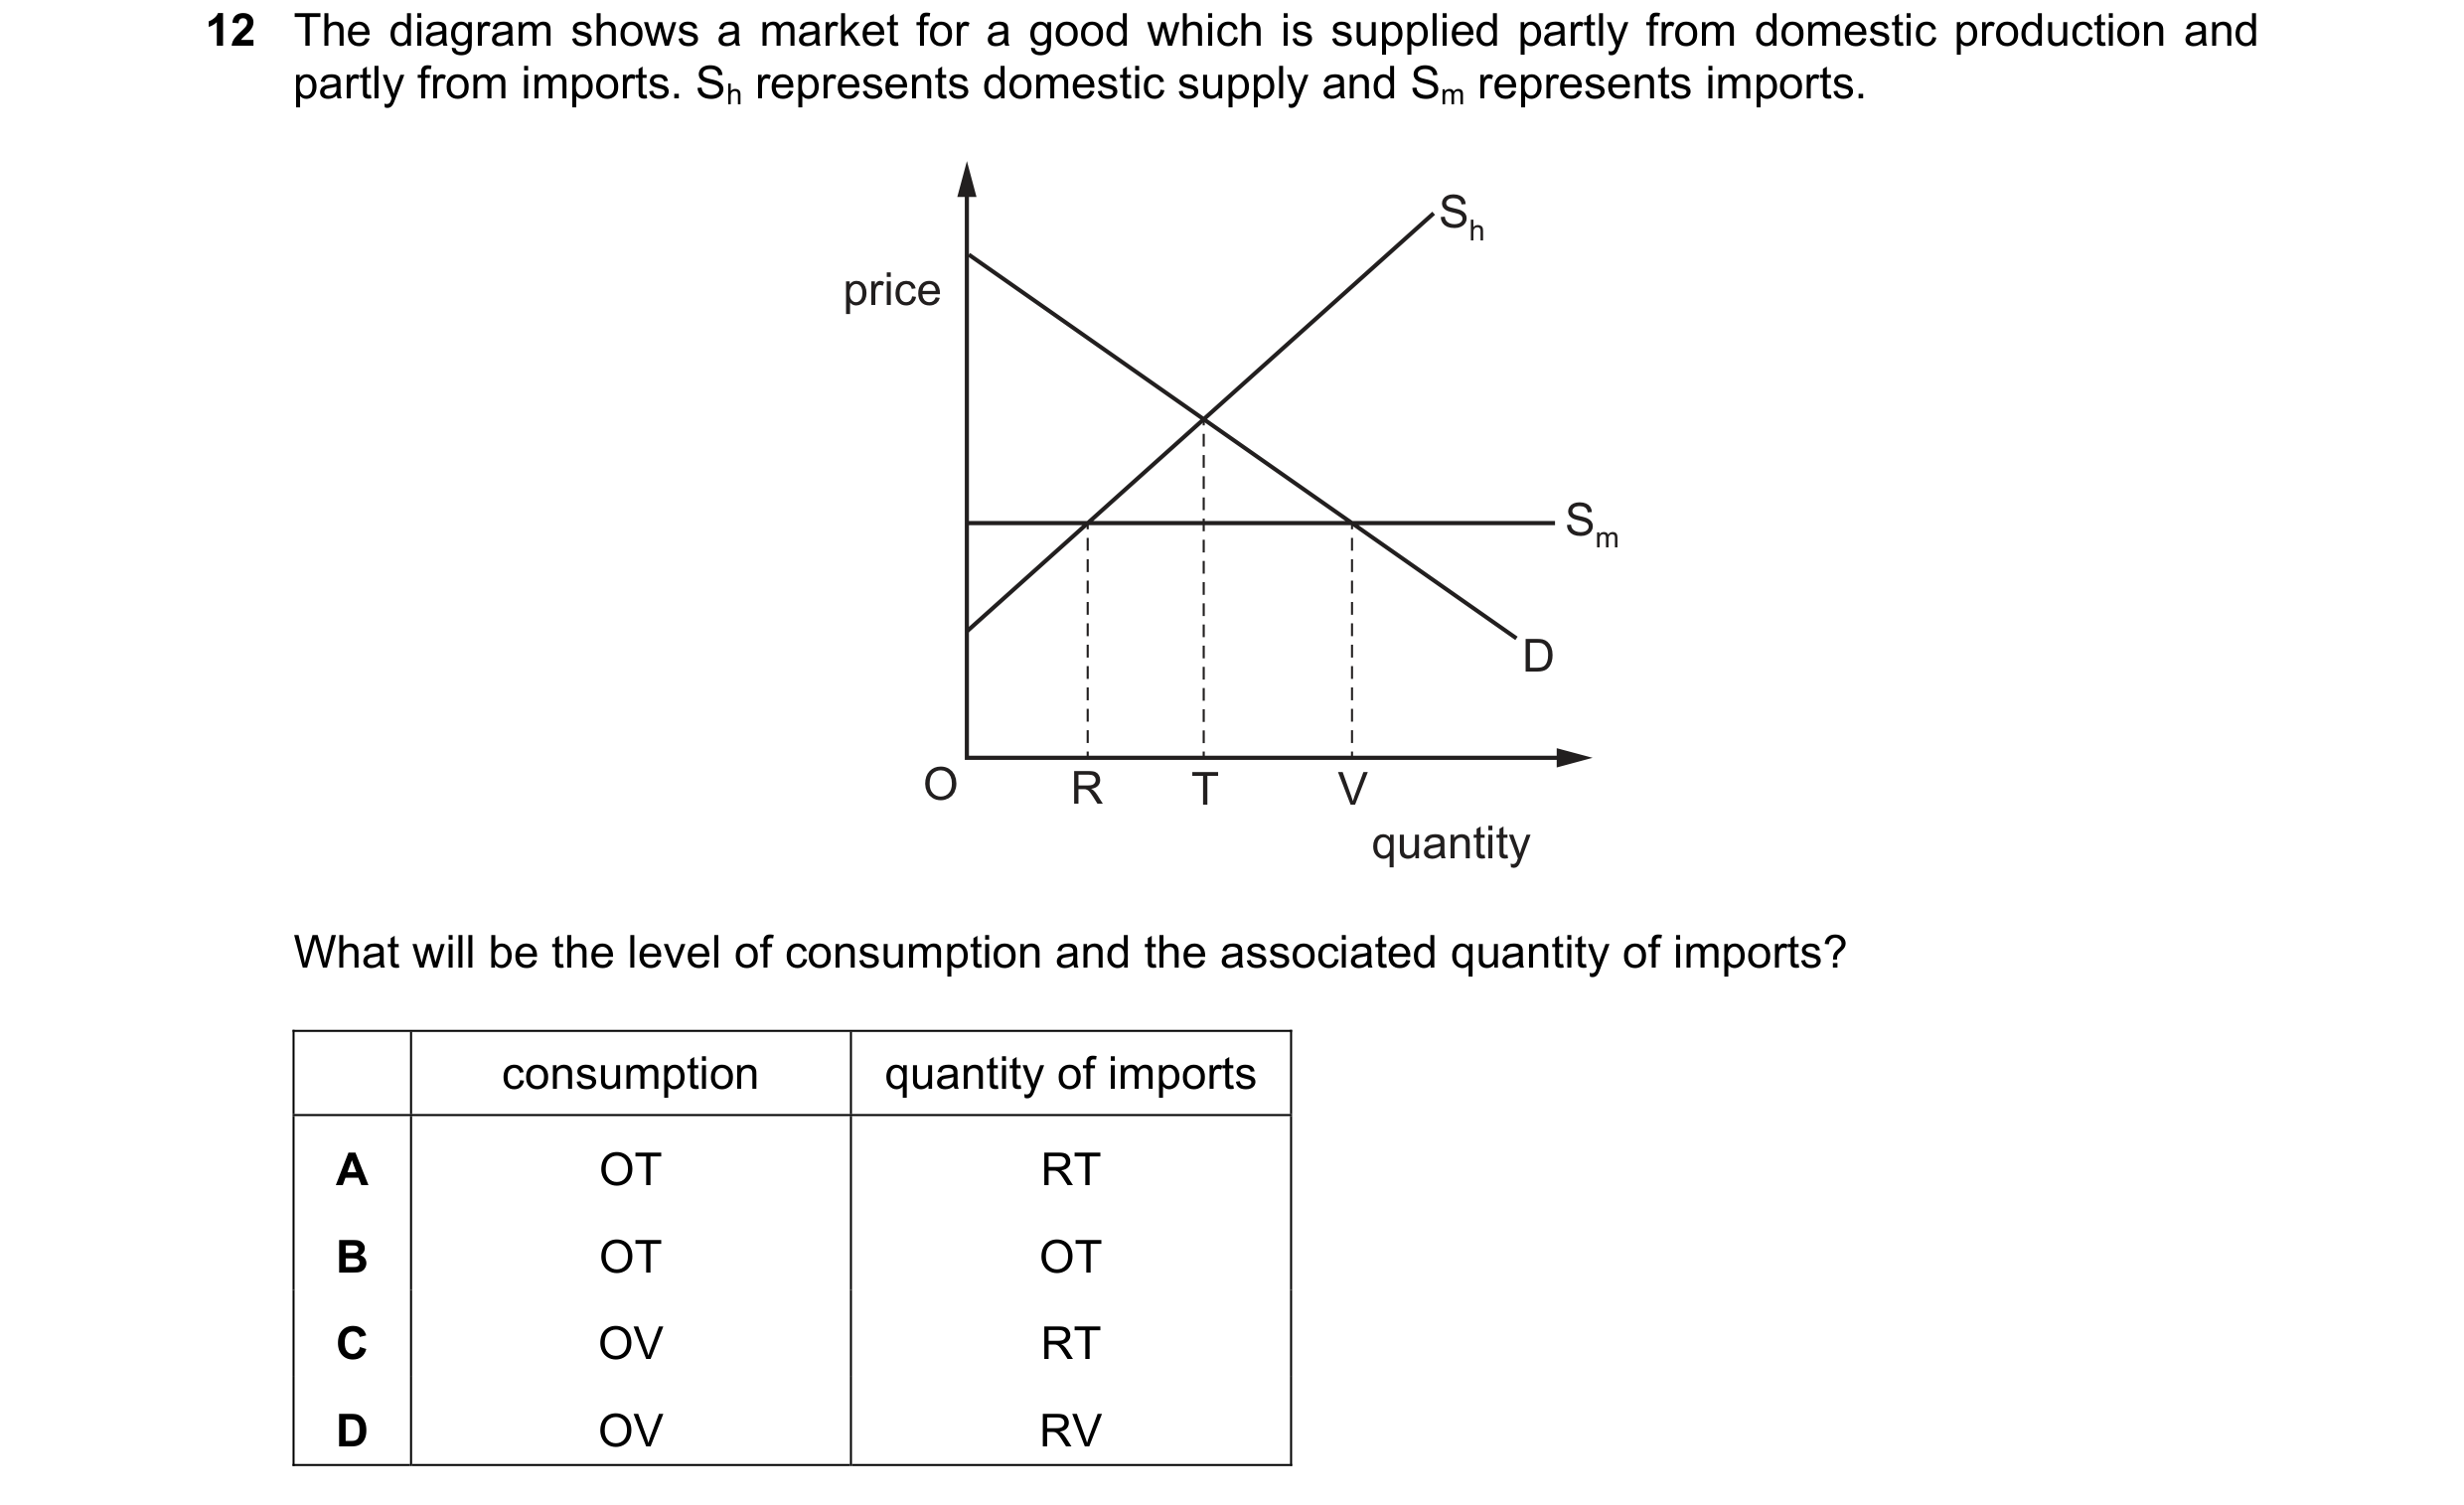 33 / 59
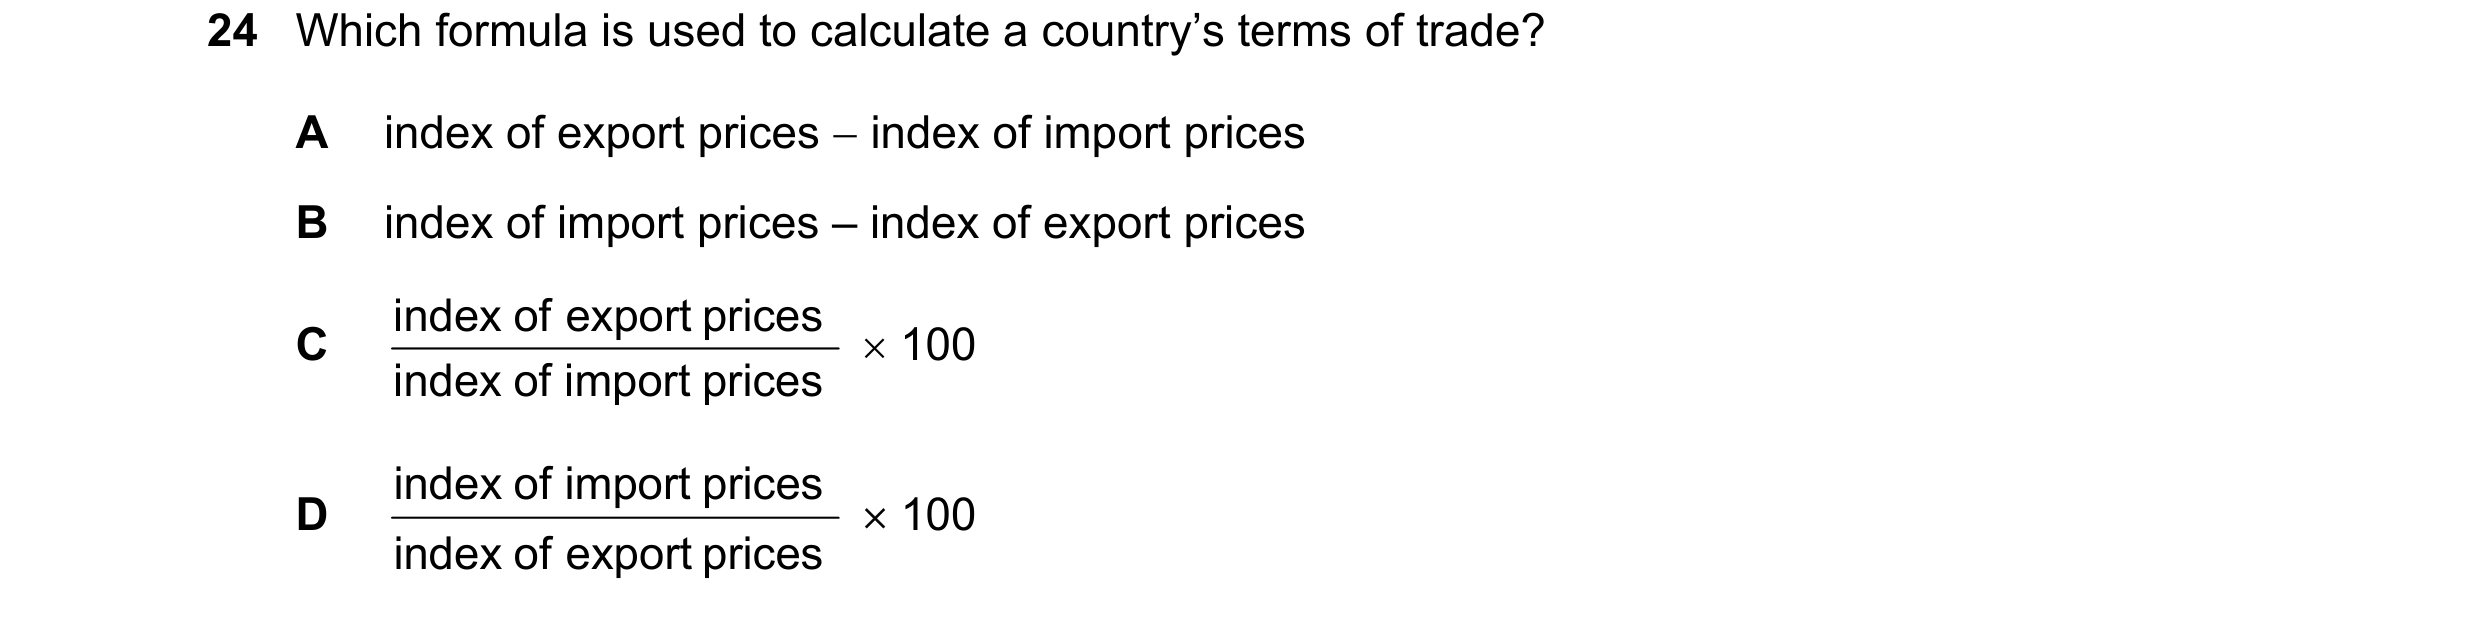
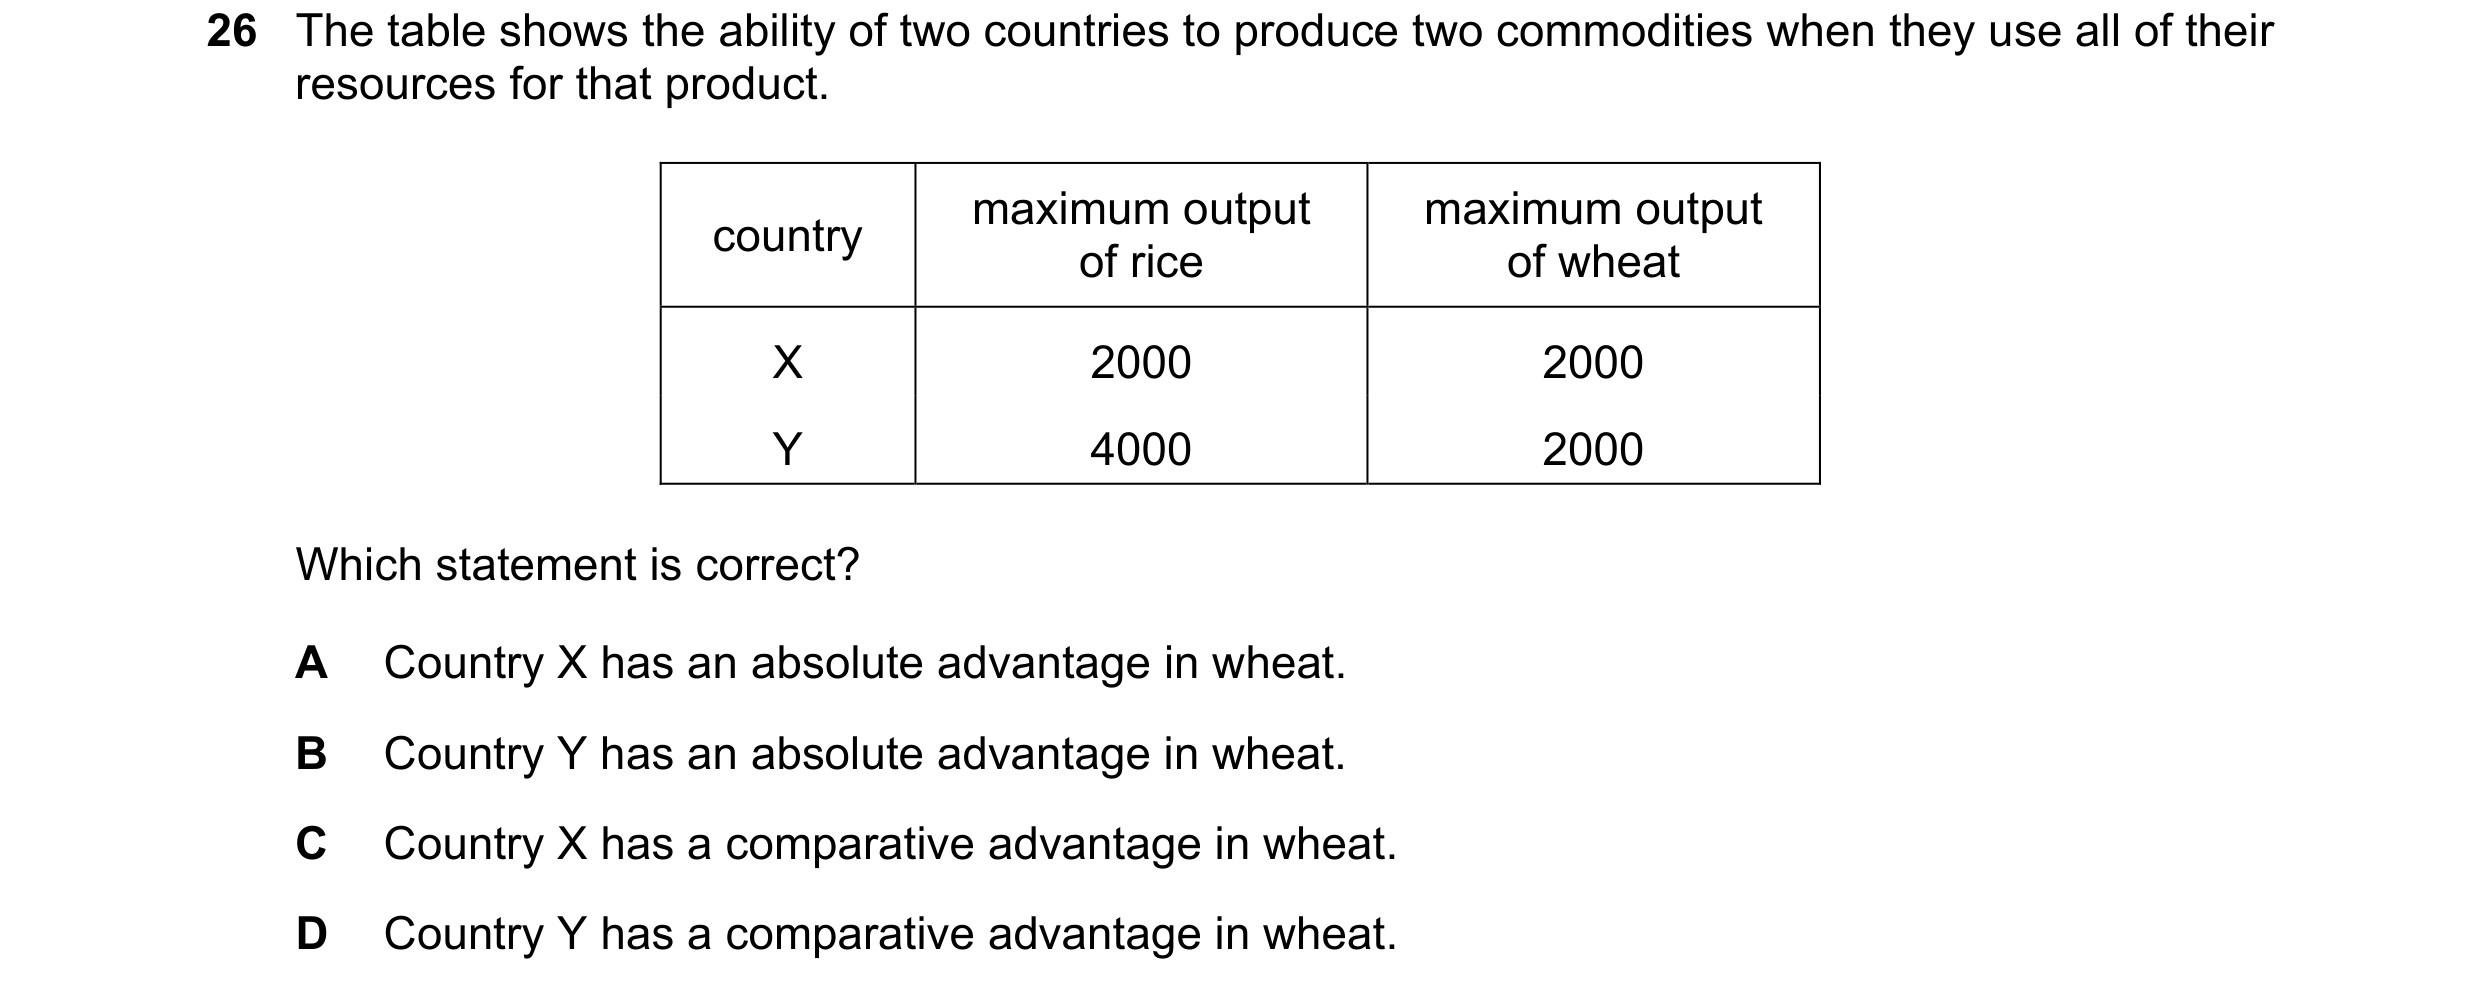 34 / 59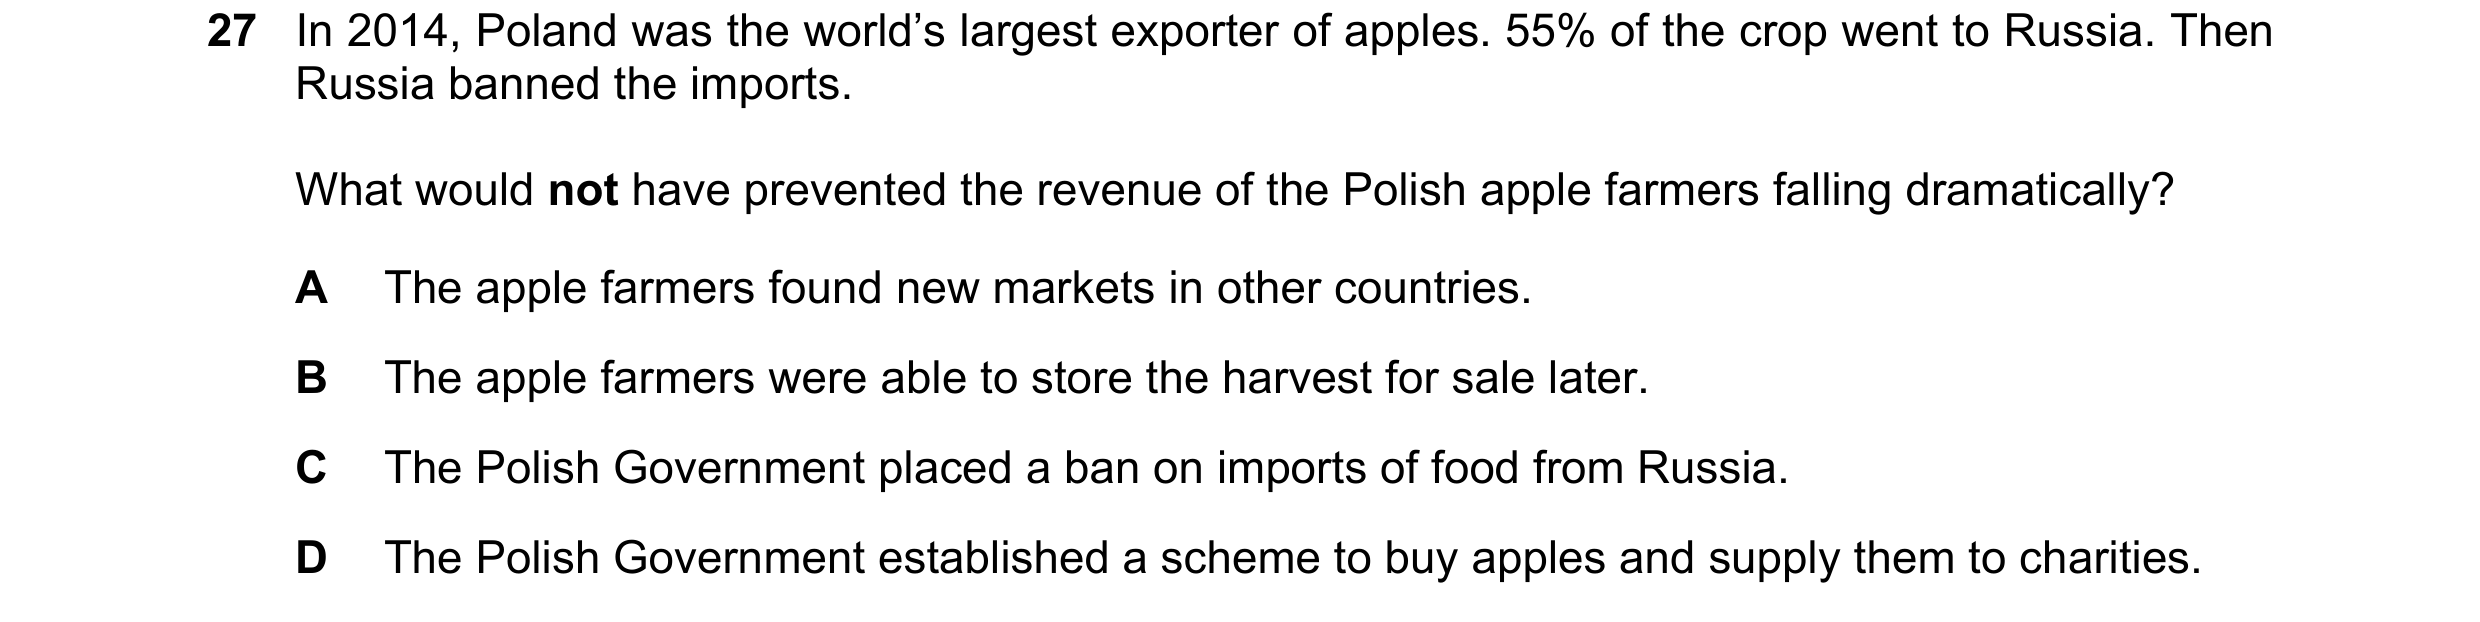

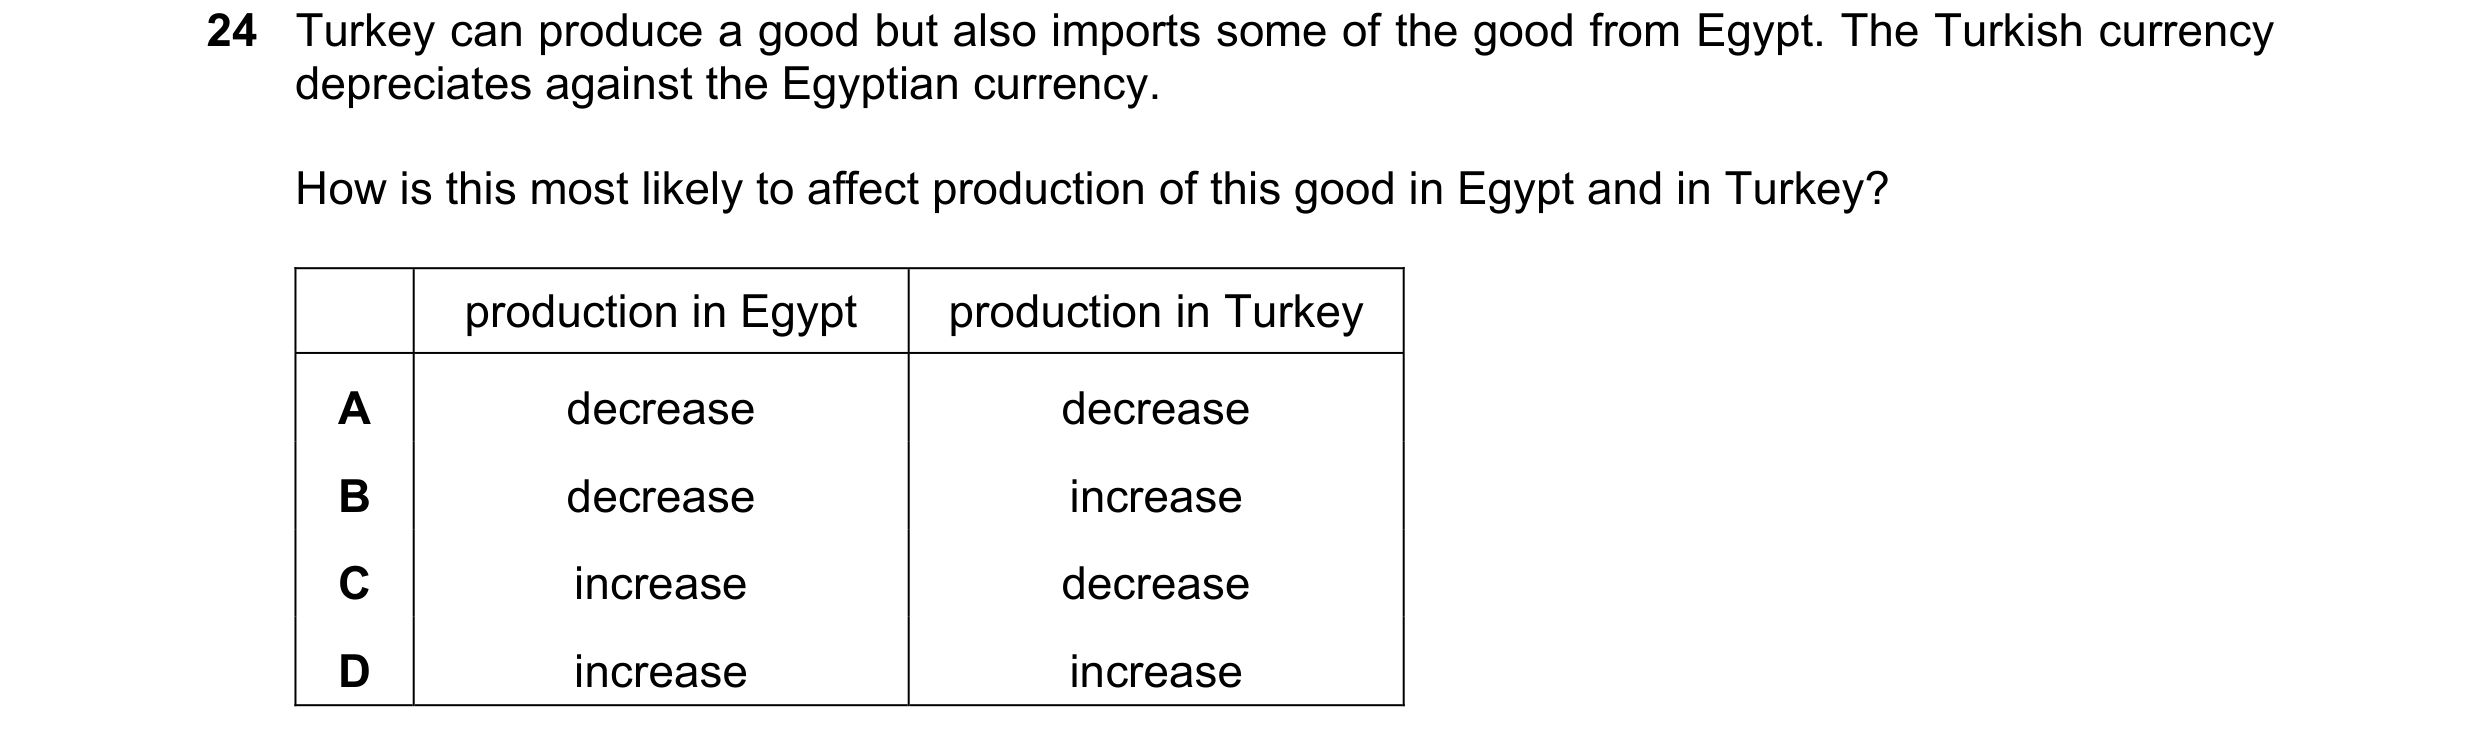

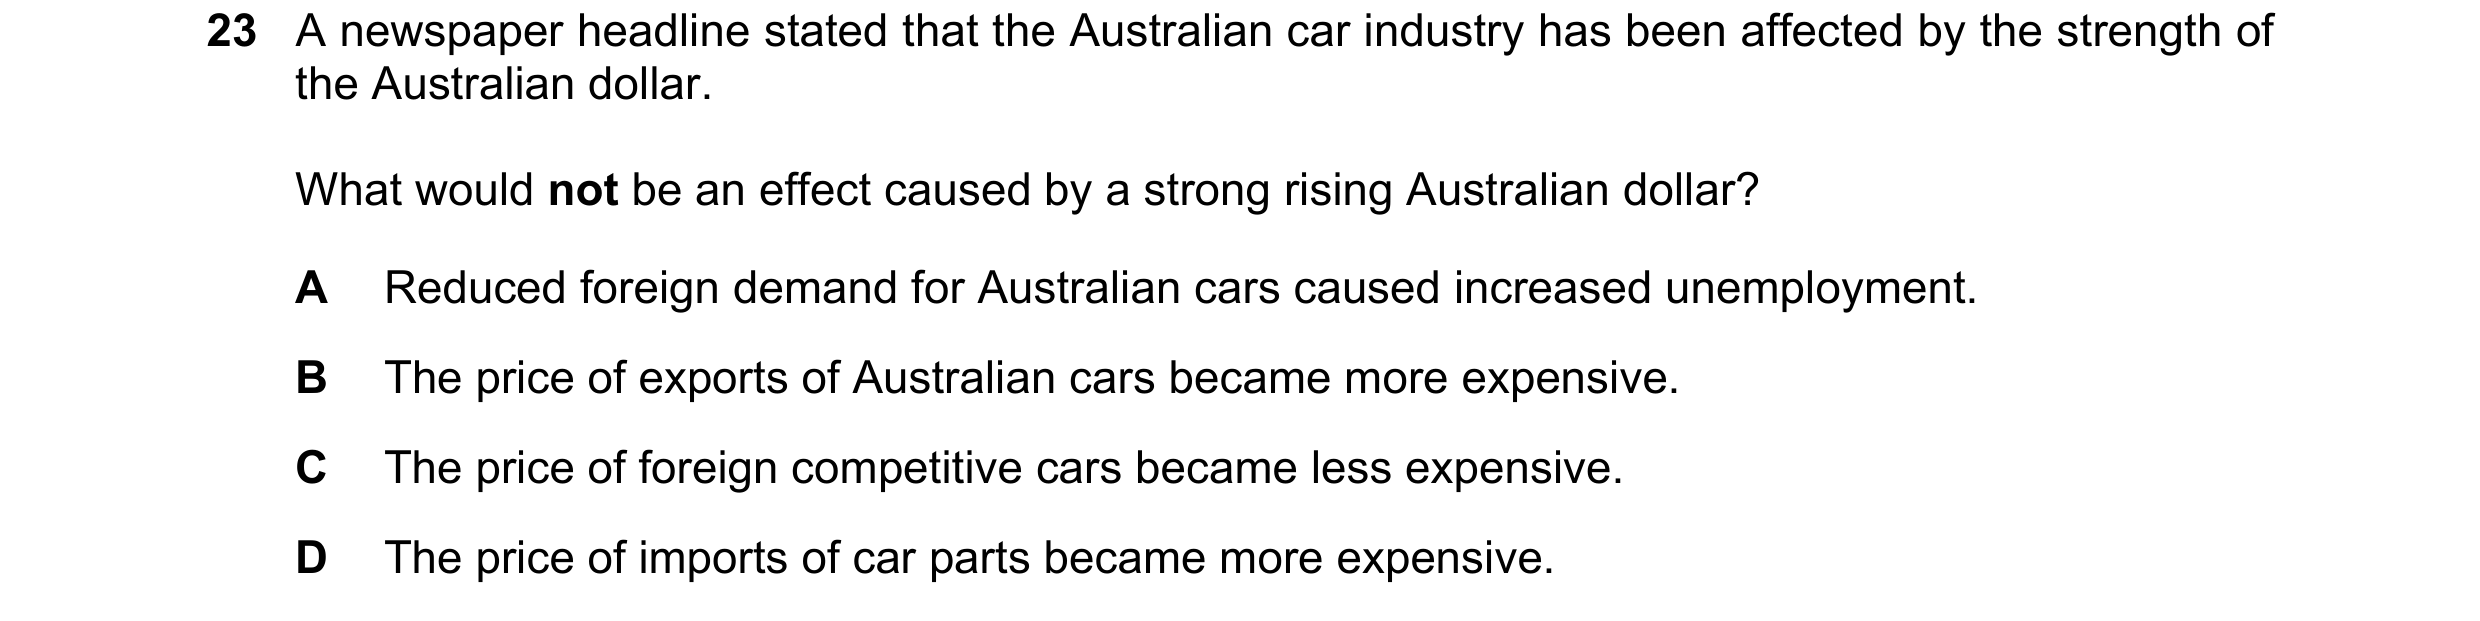 35 / 59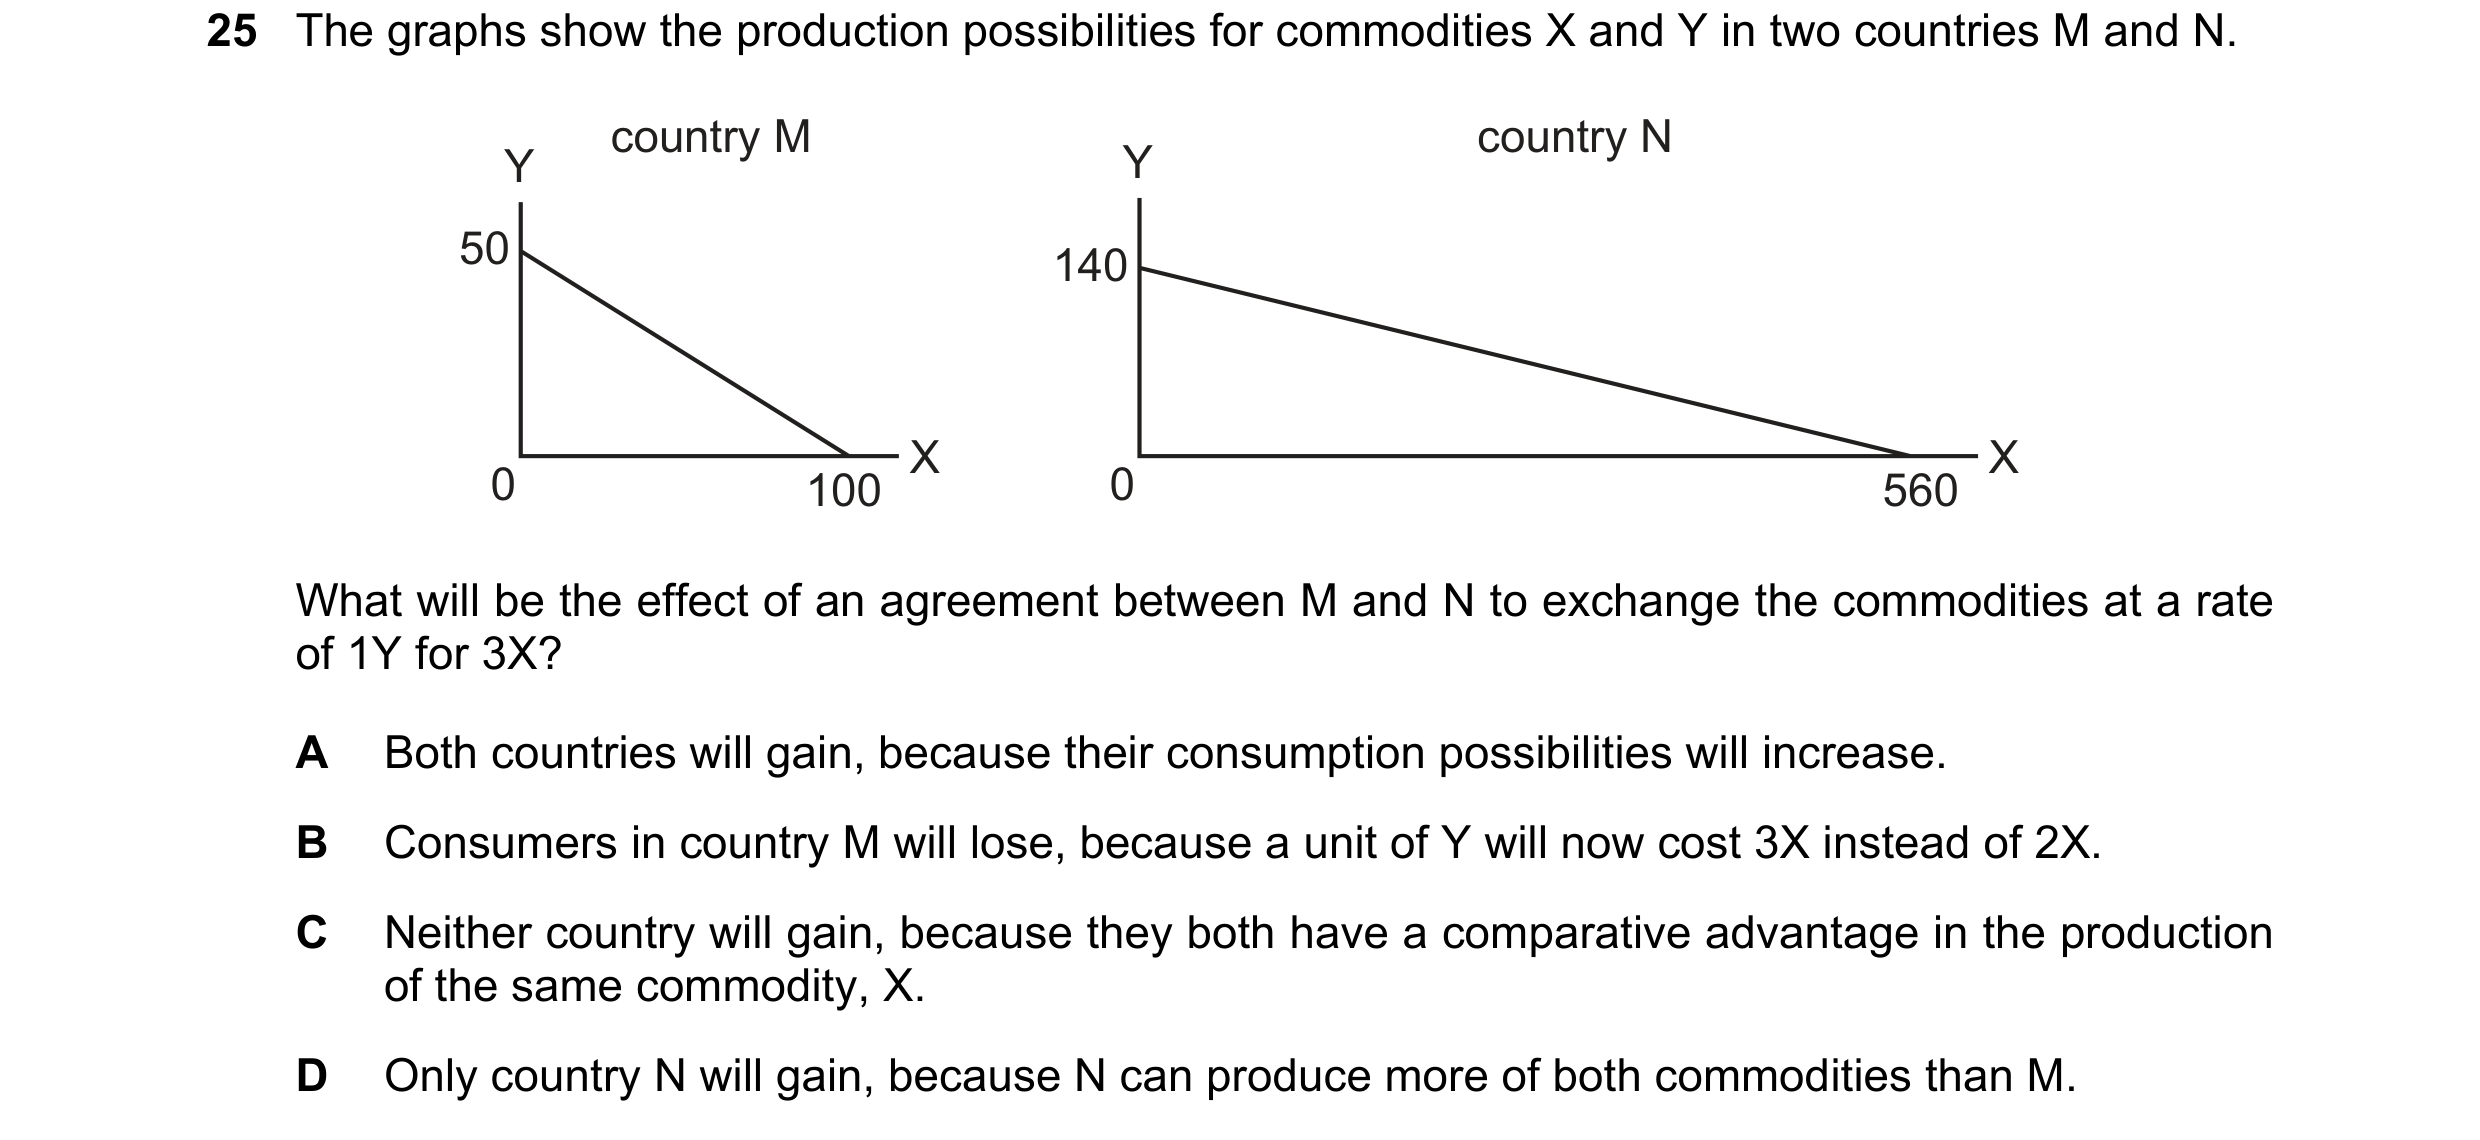
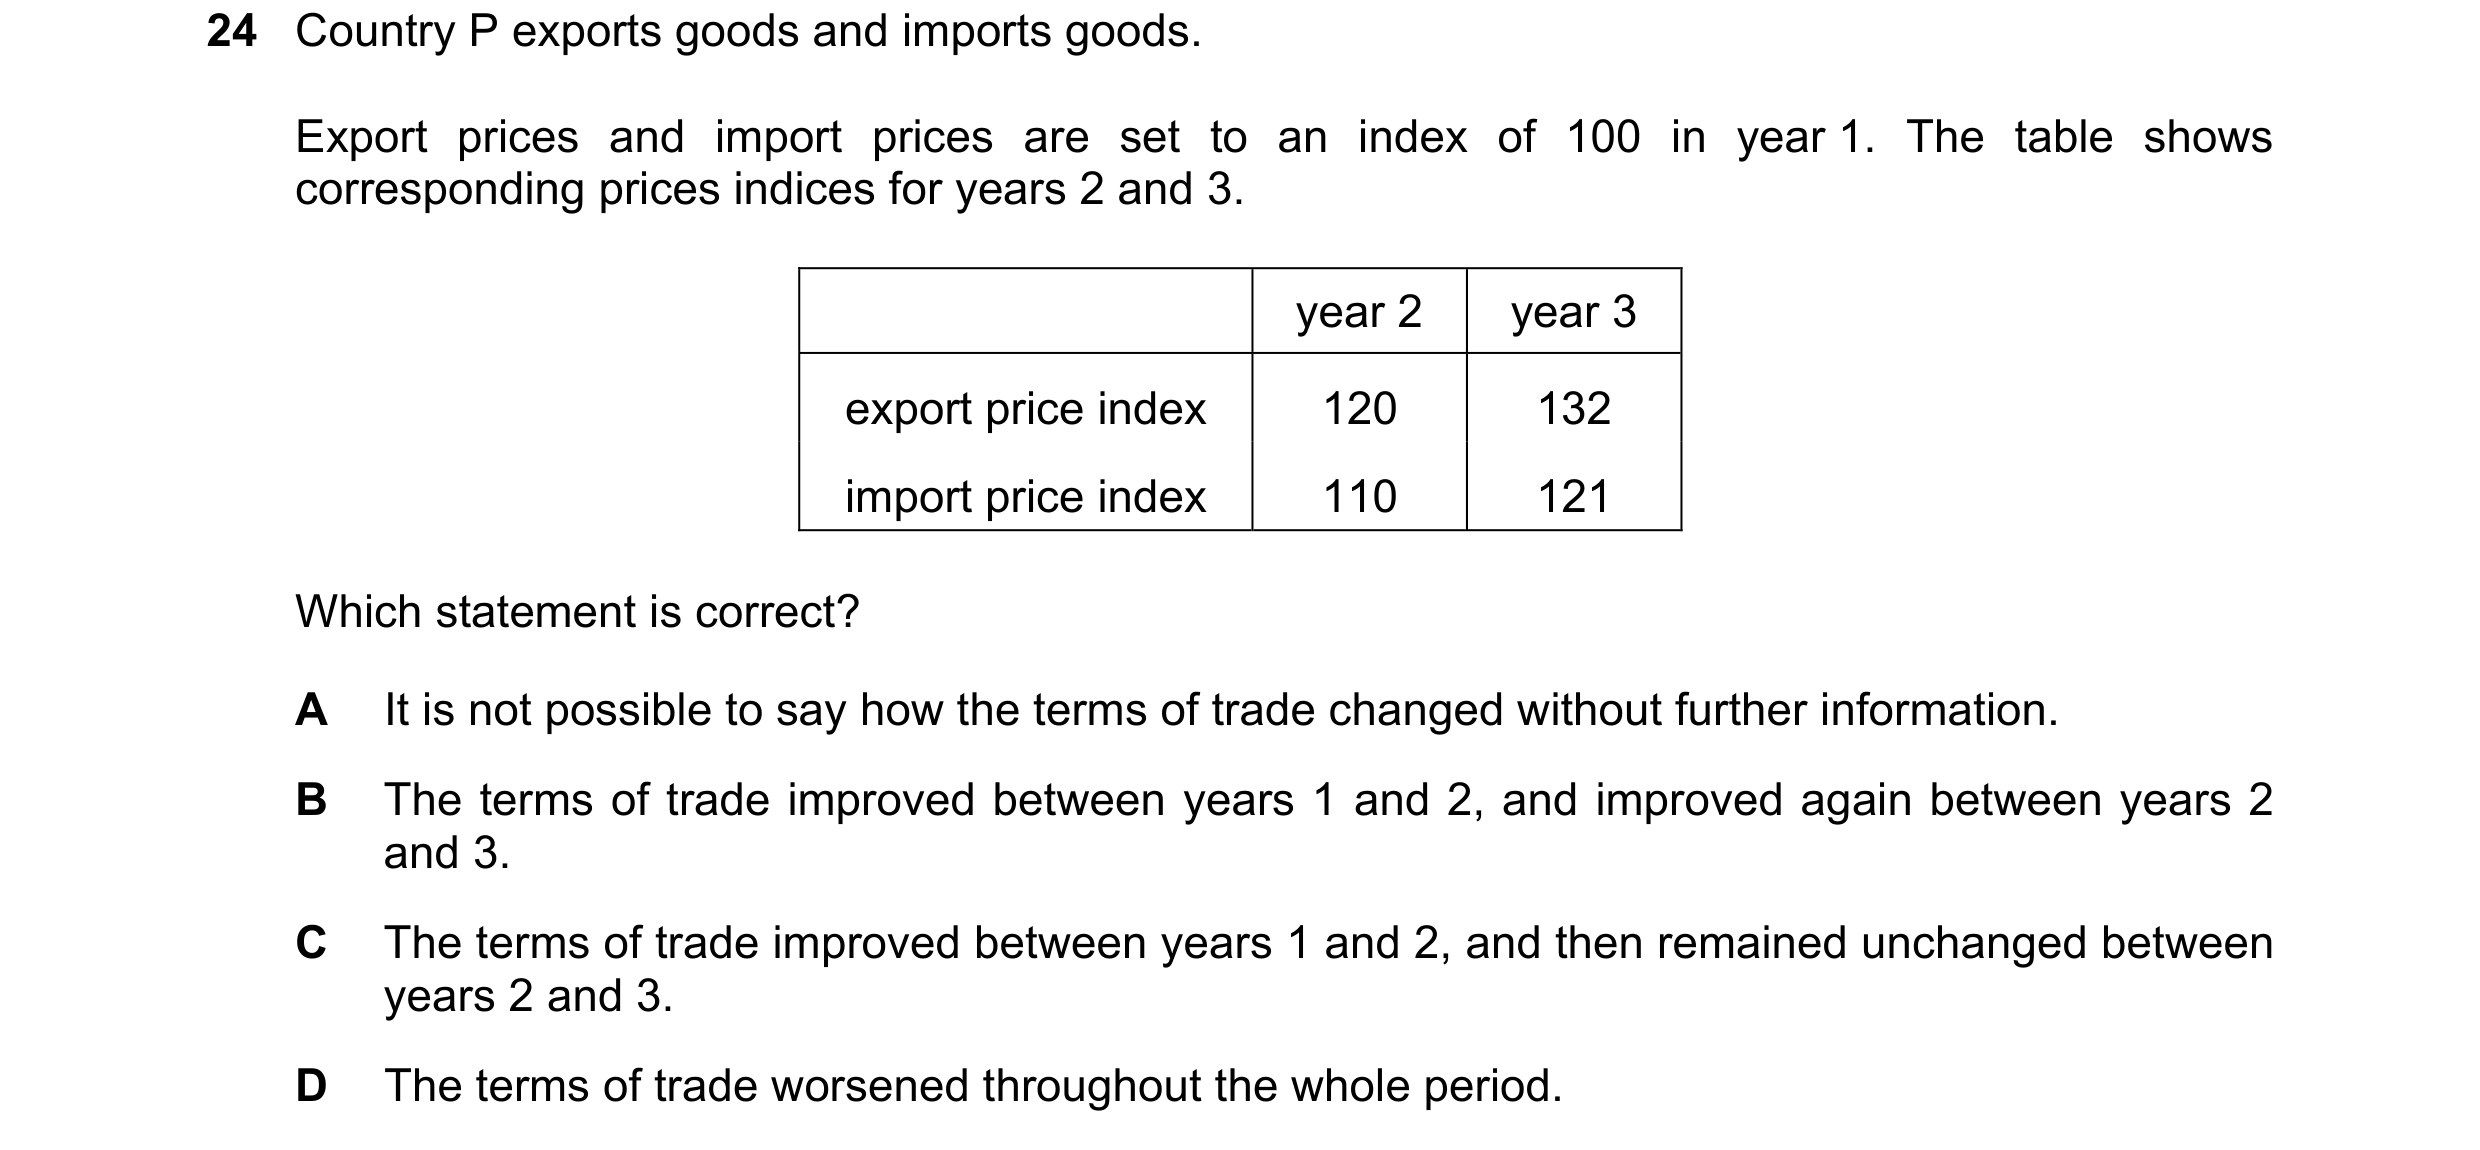 36 / 59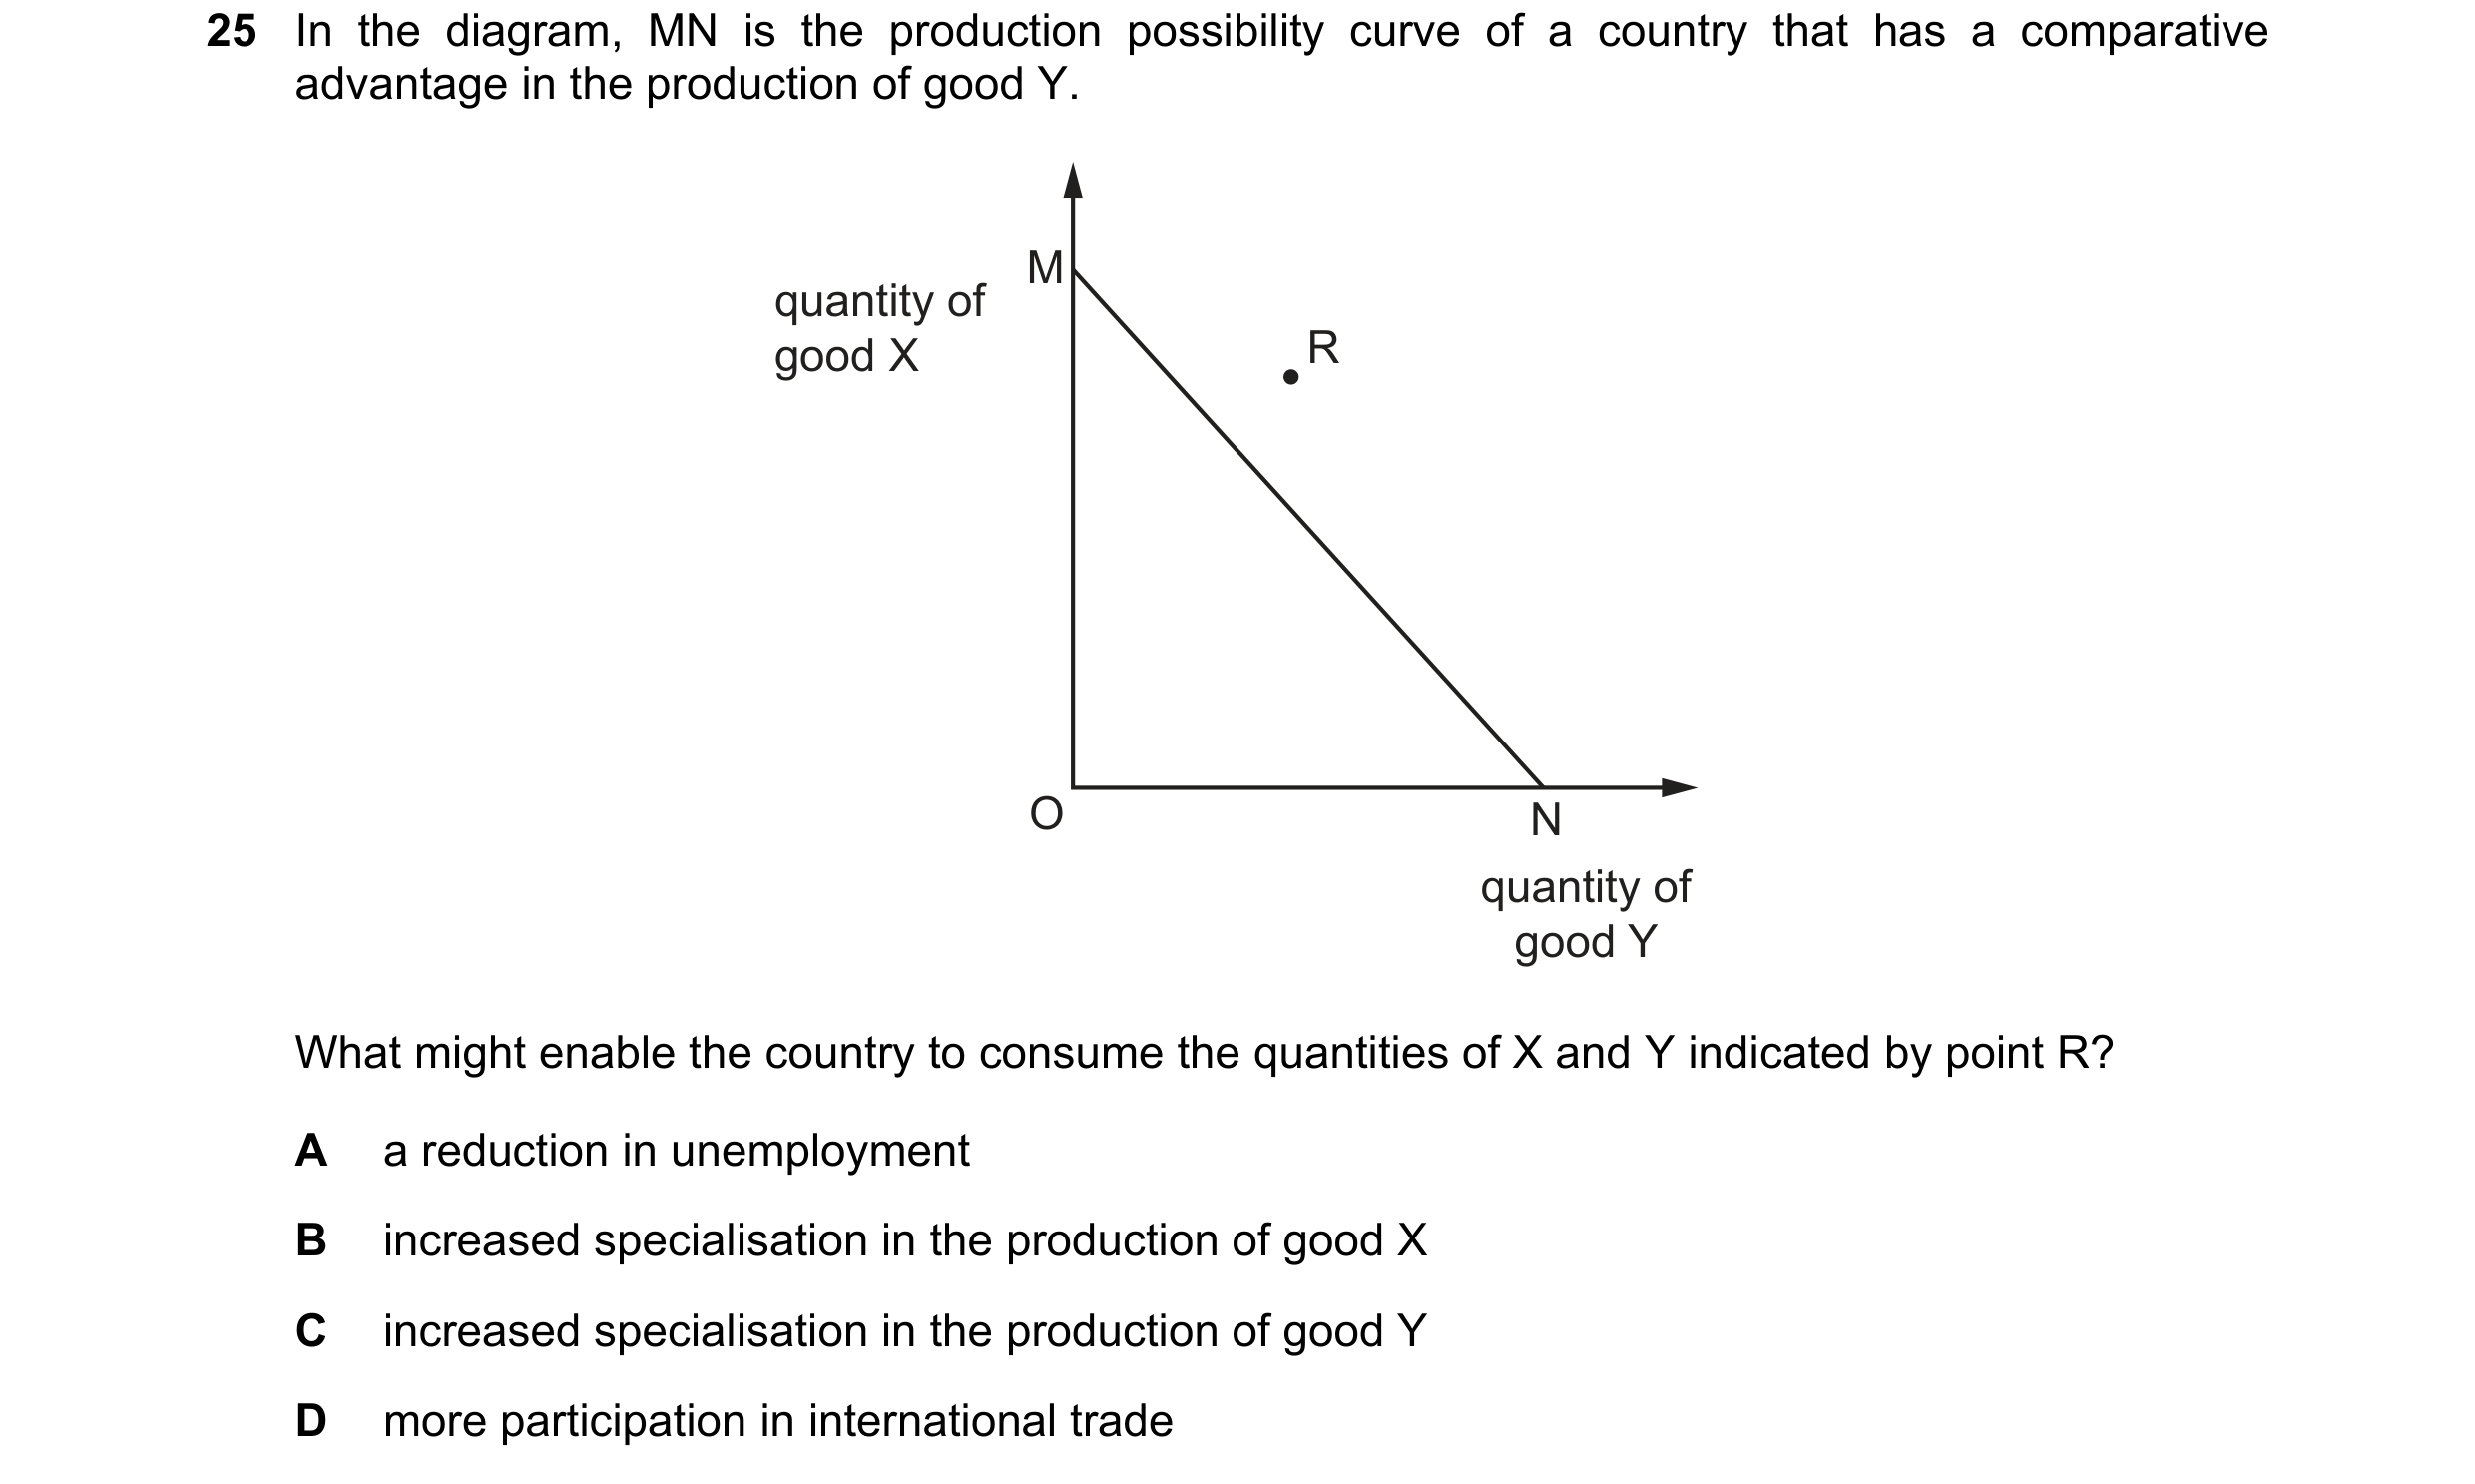
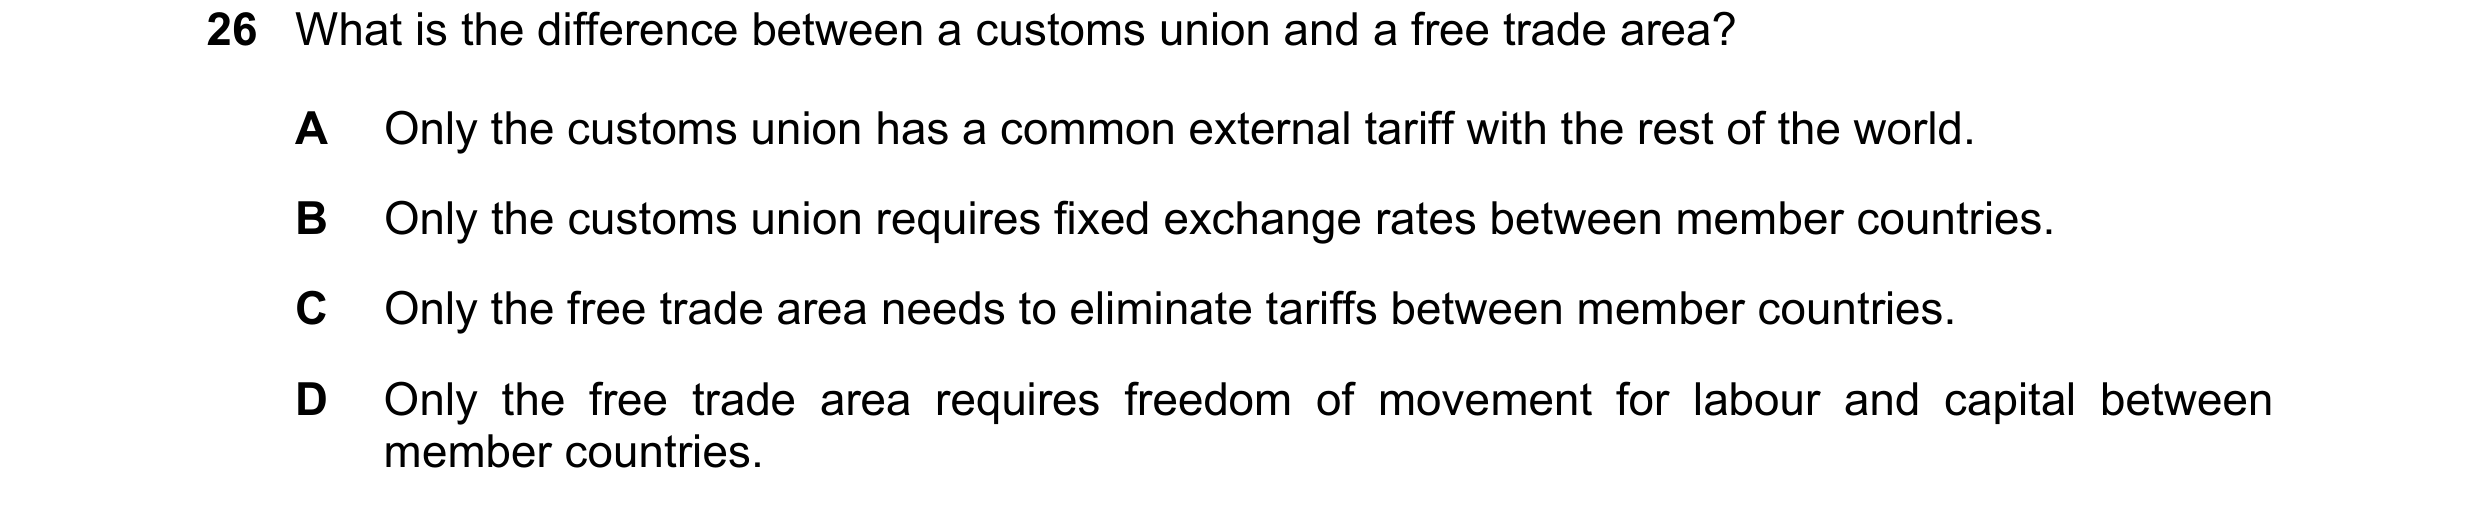
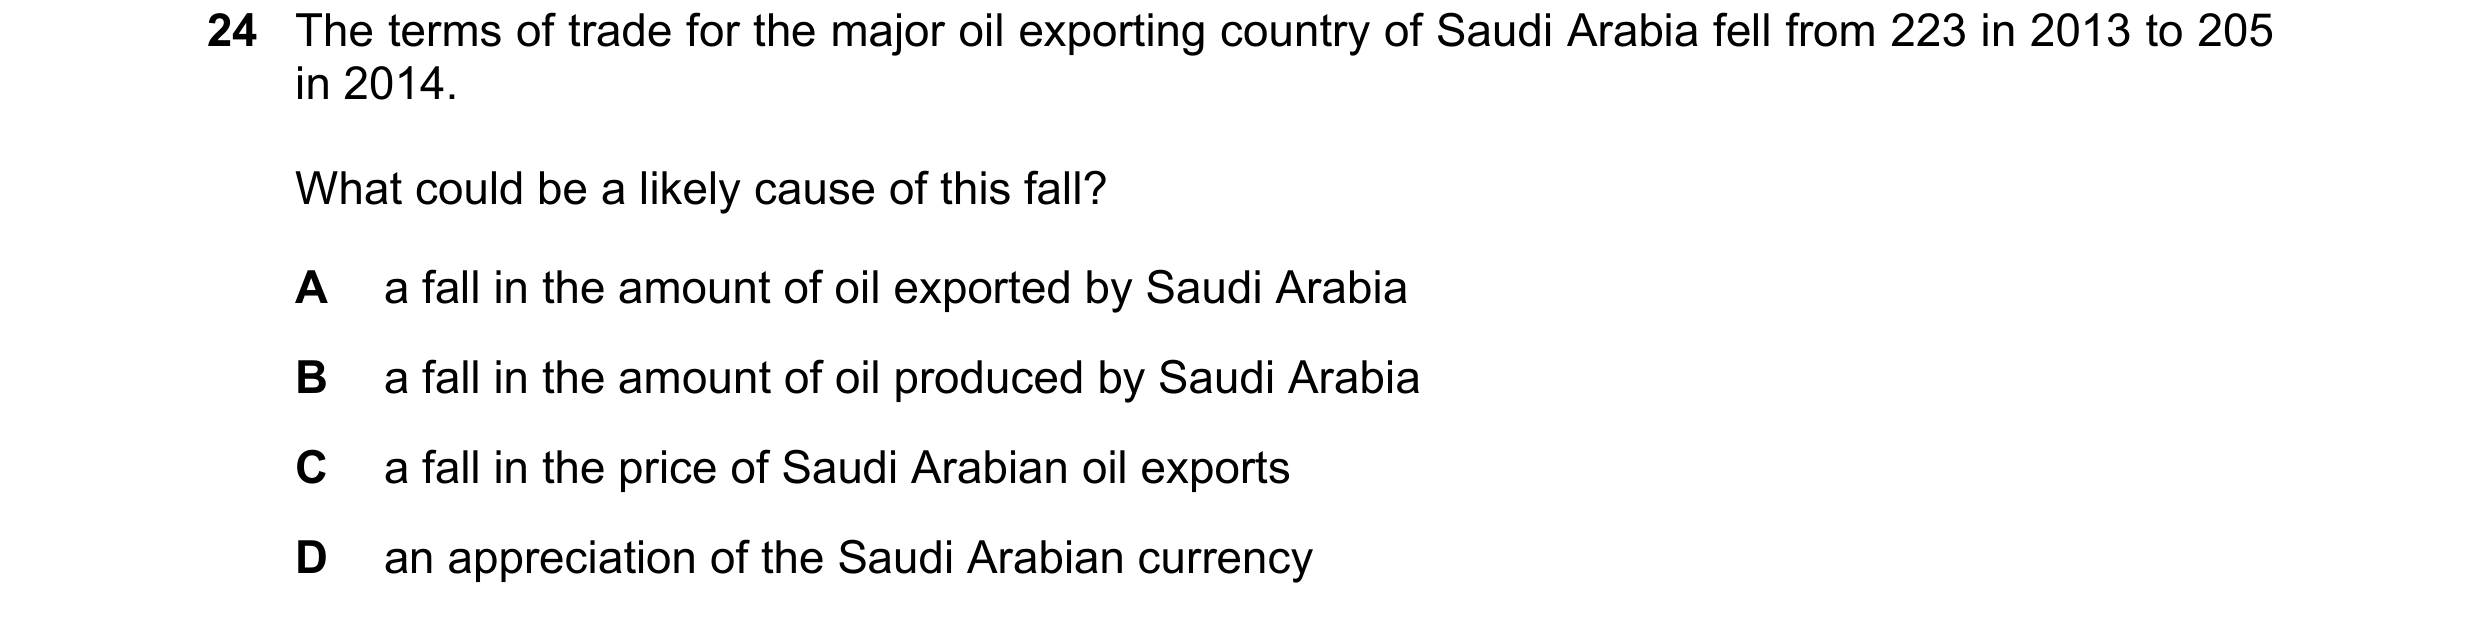 37 / 59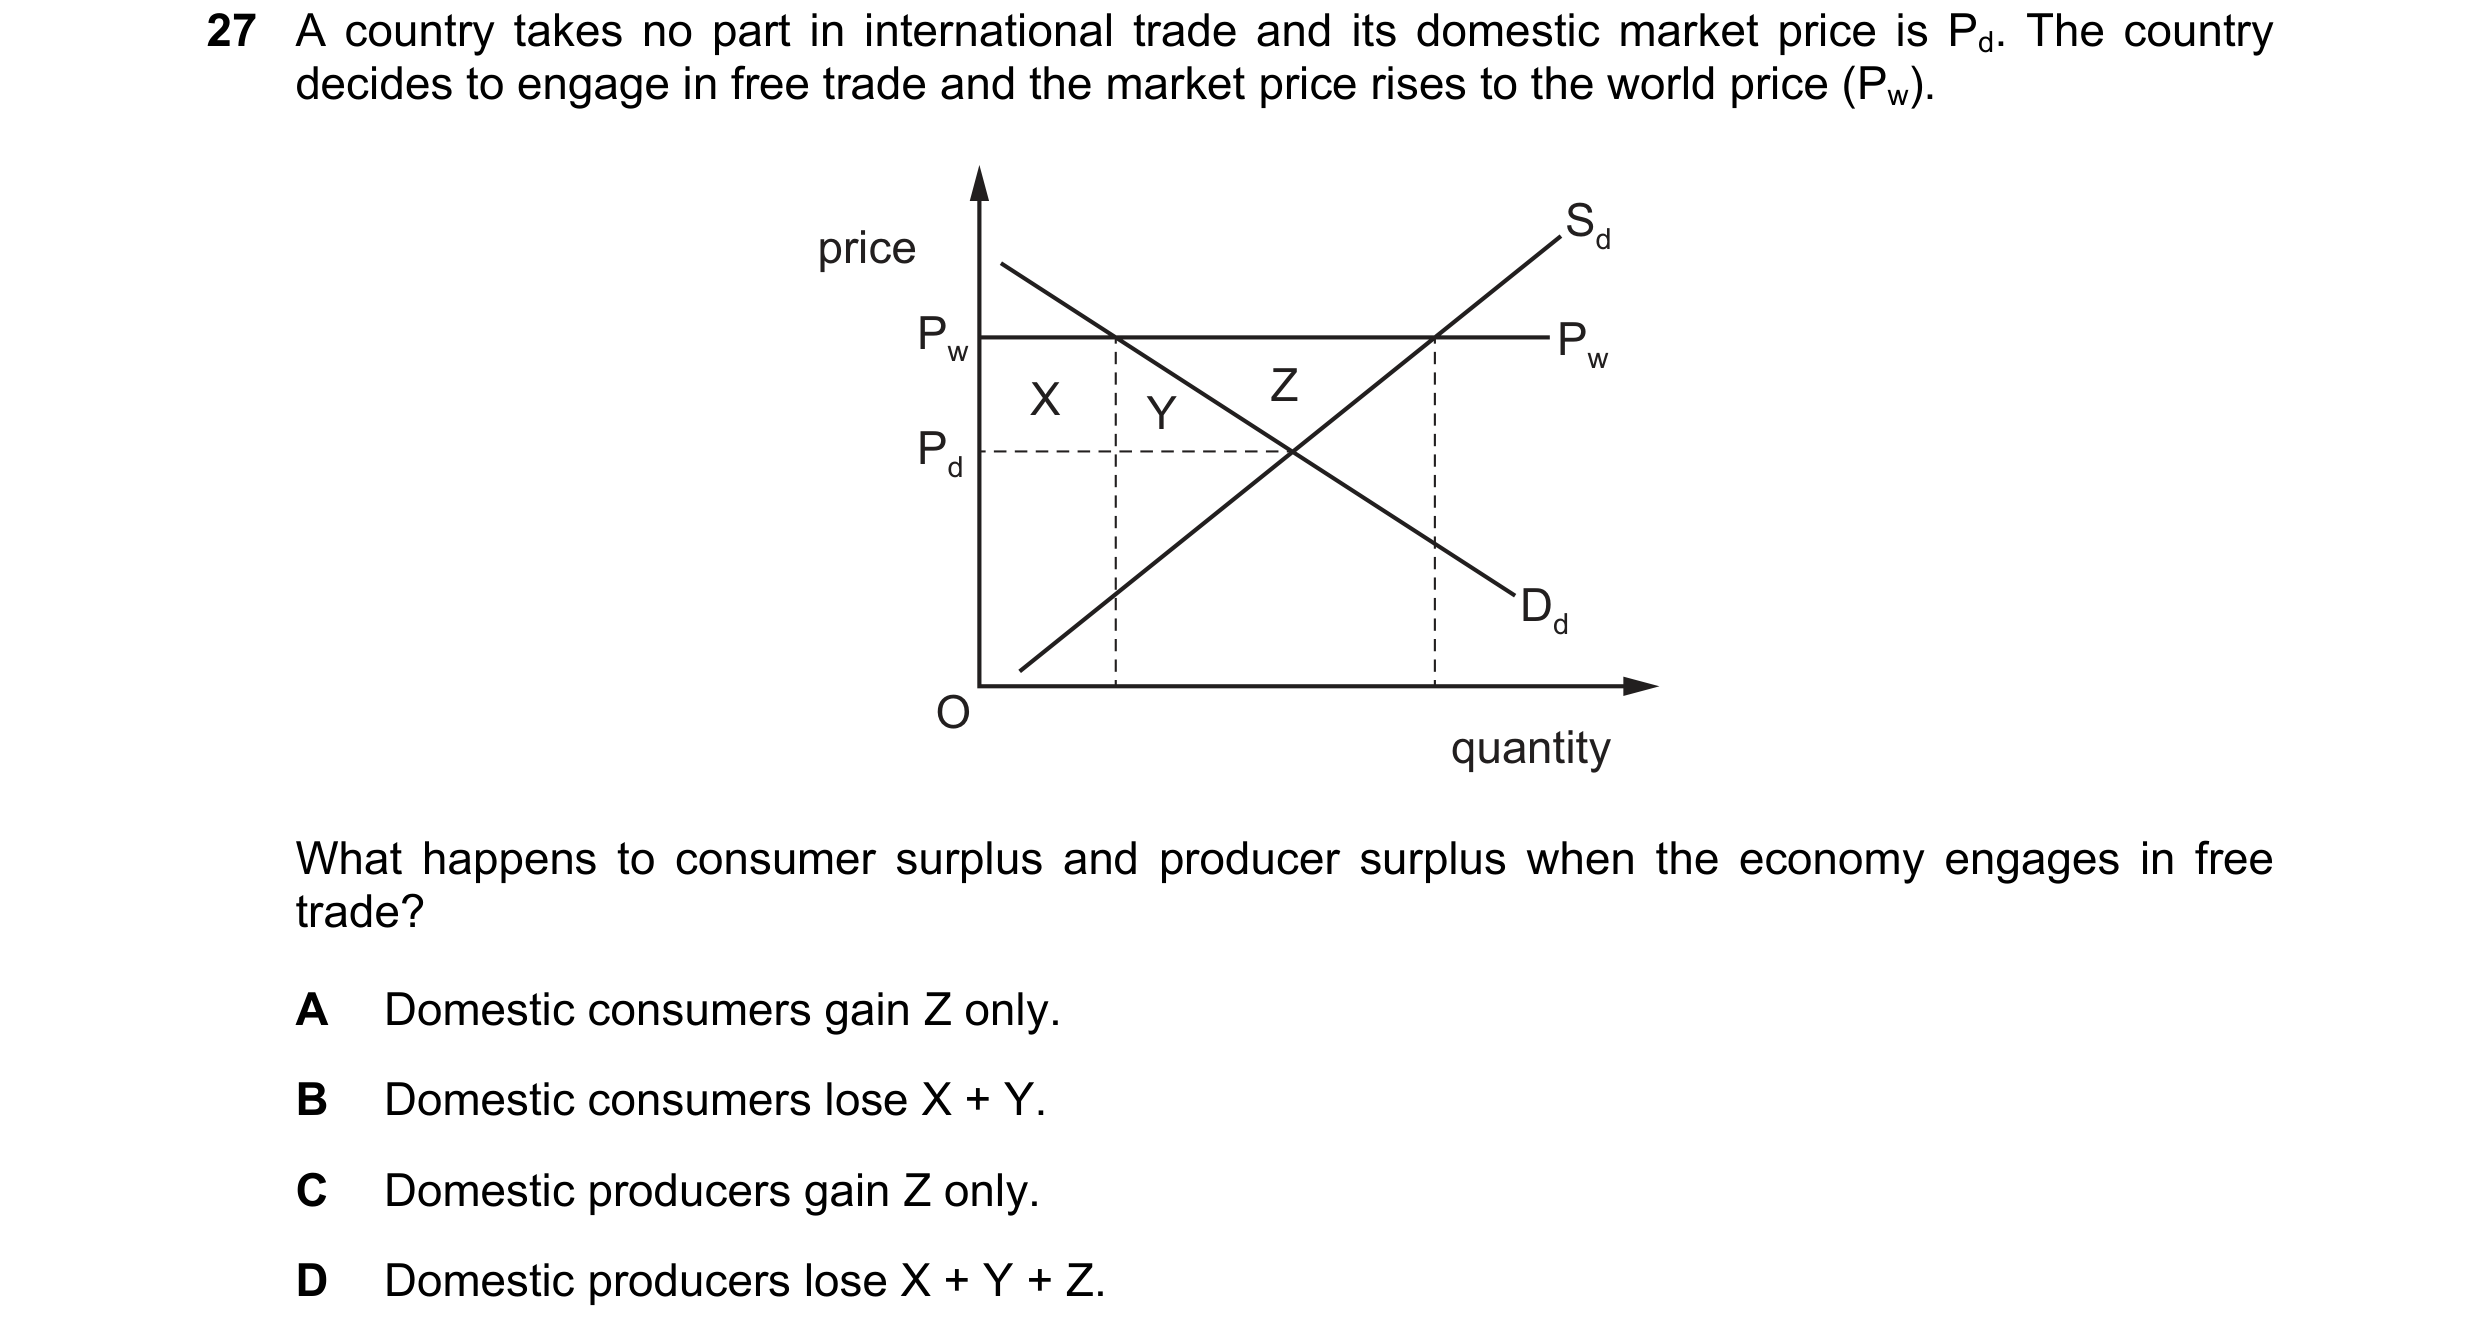
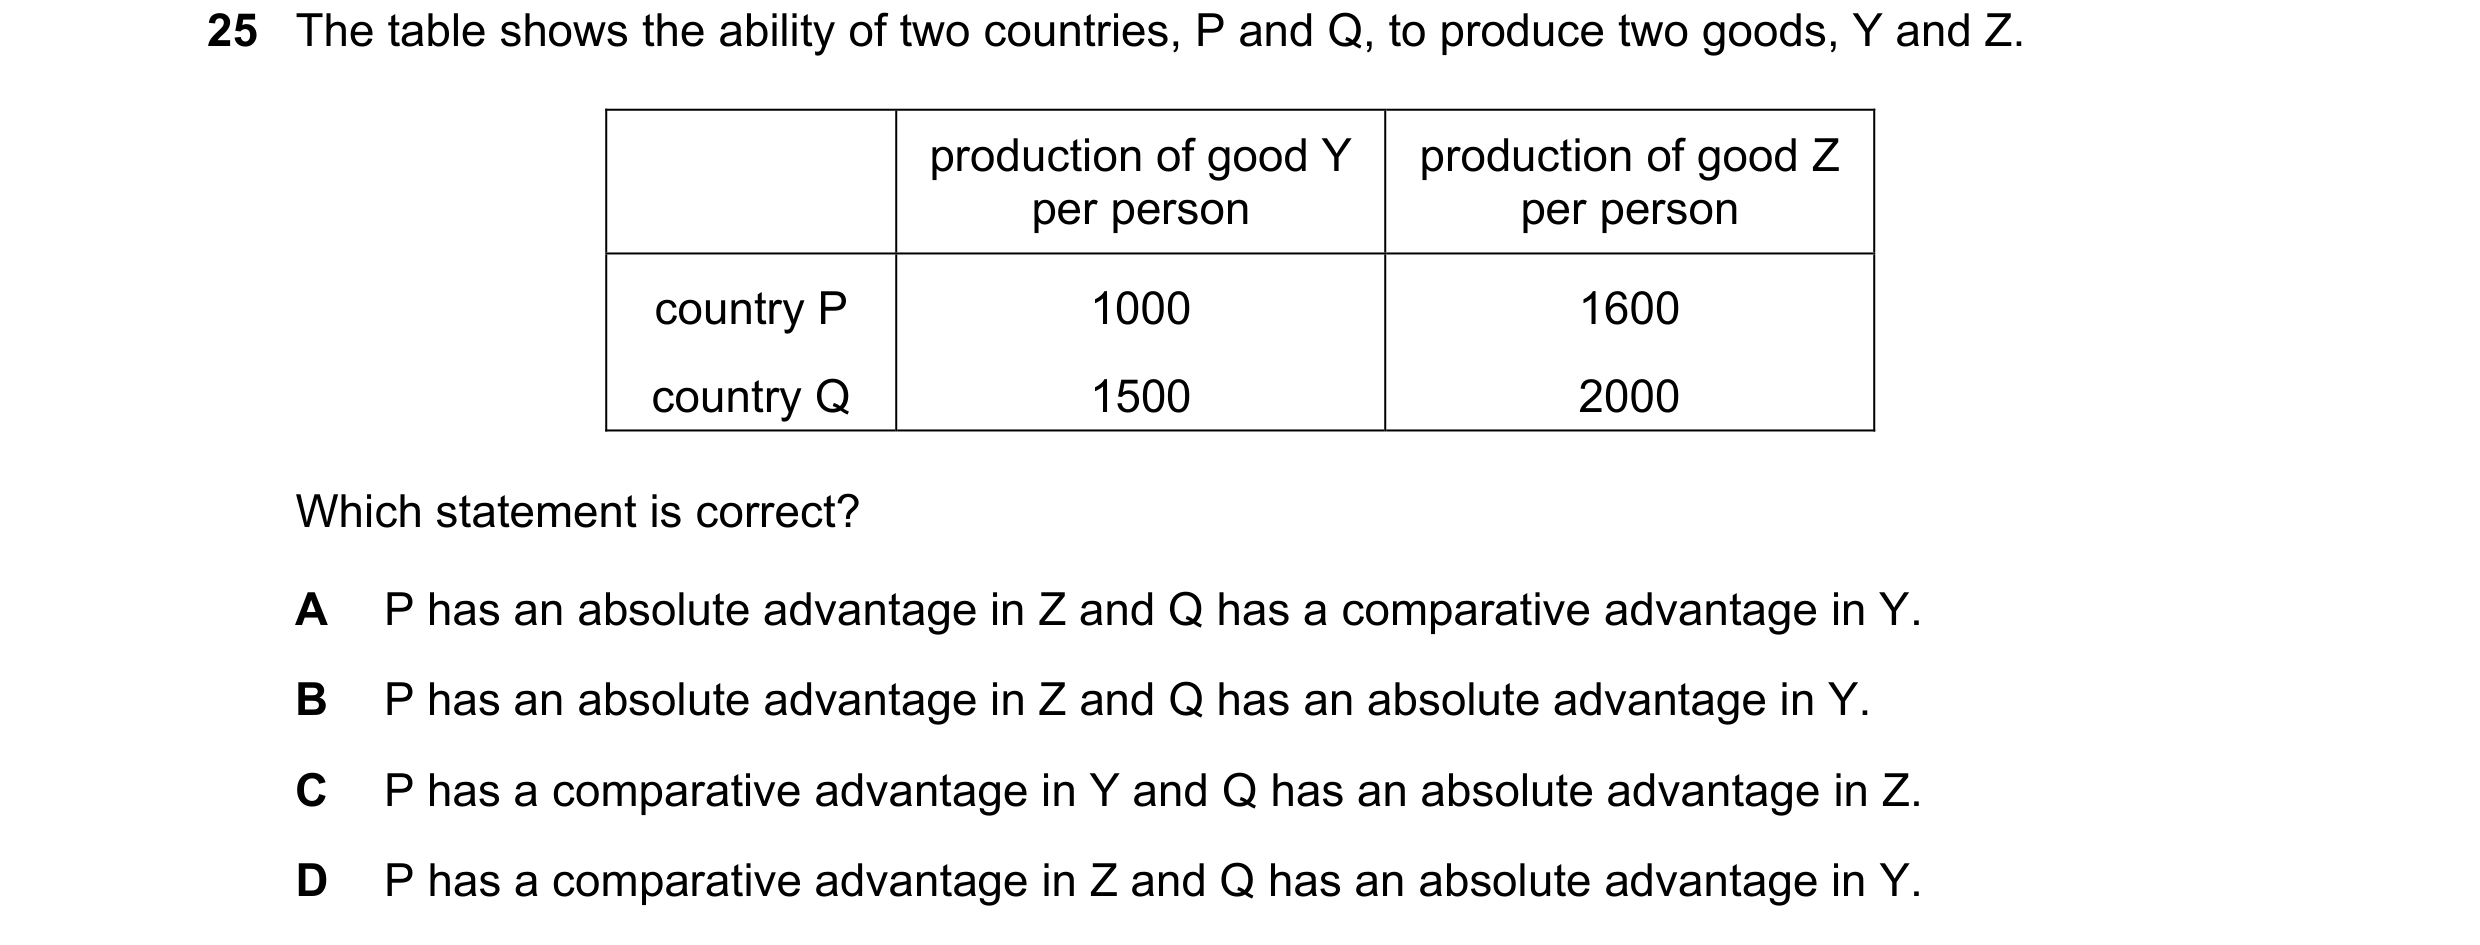
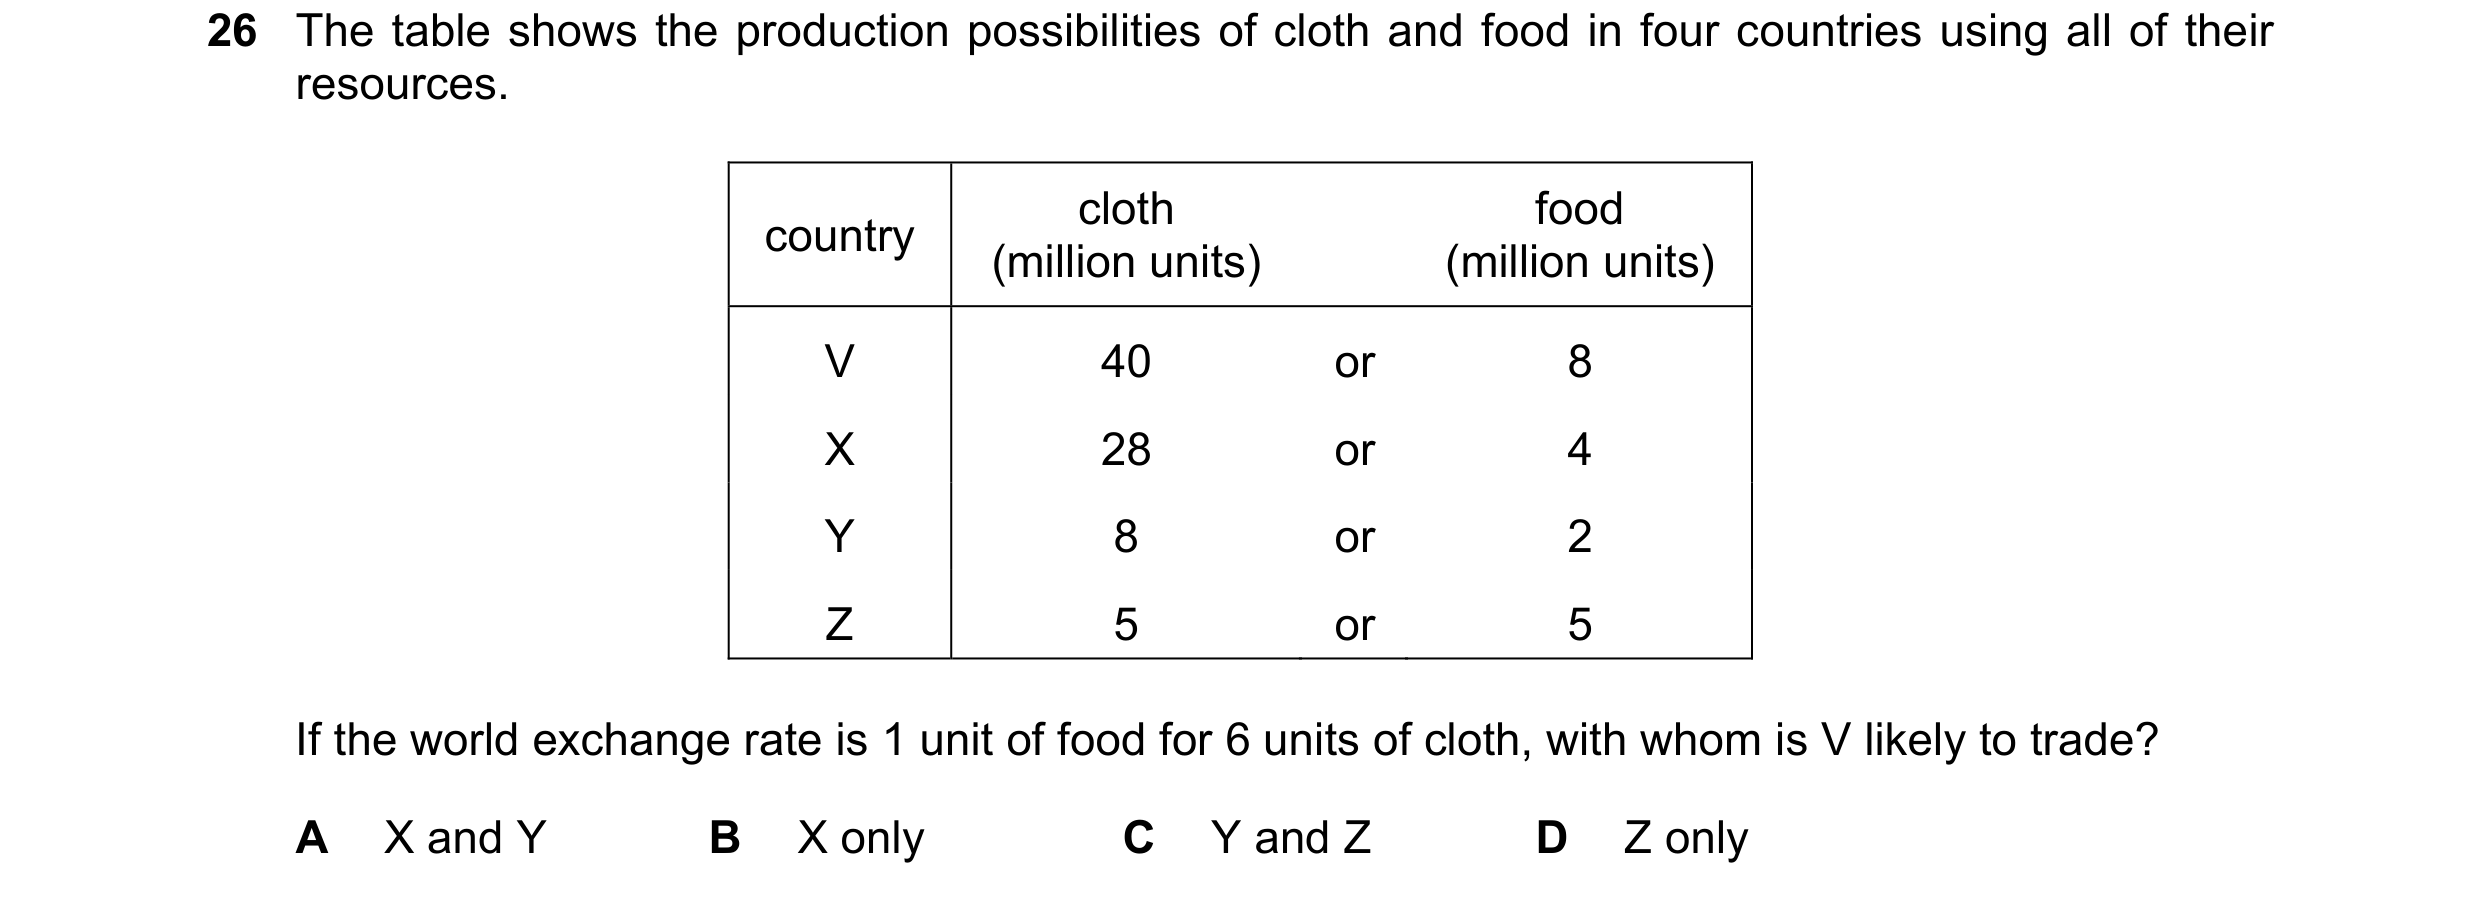 38 / 59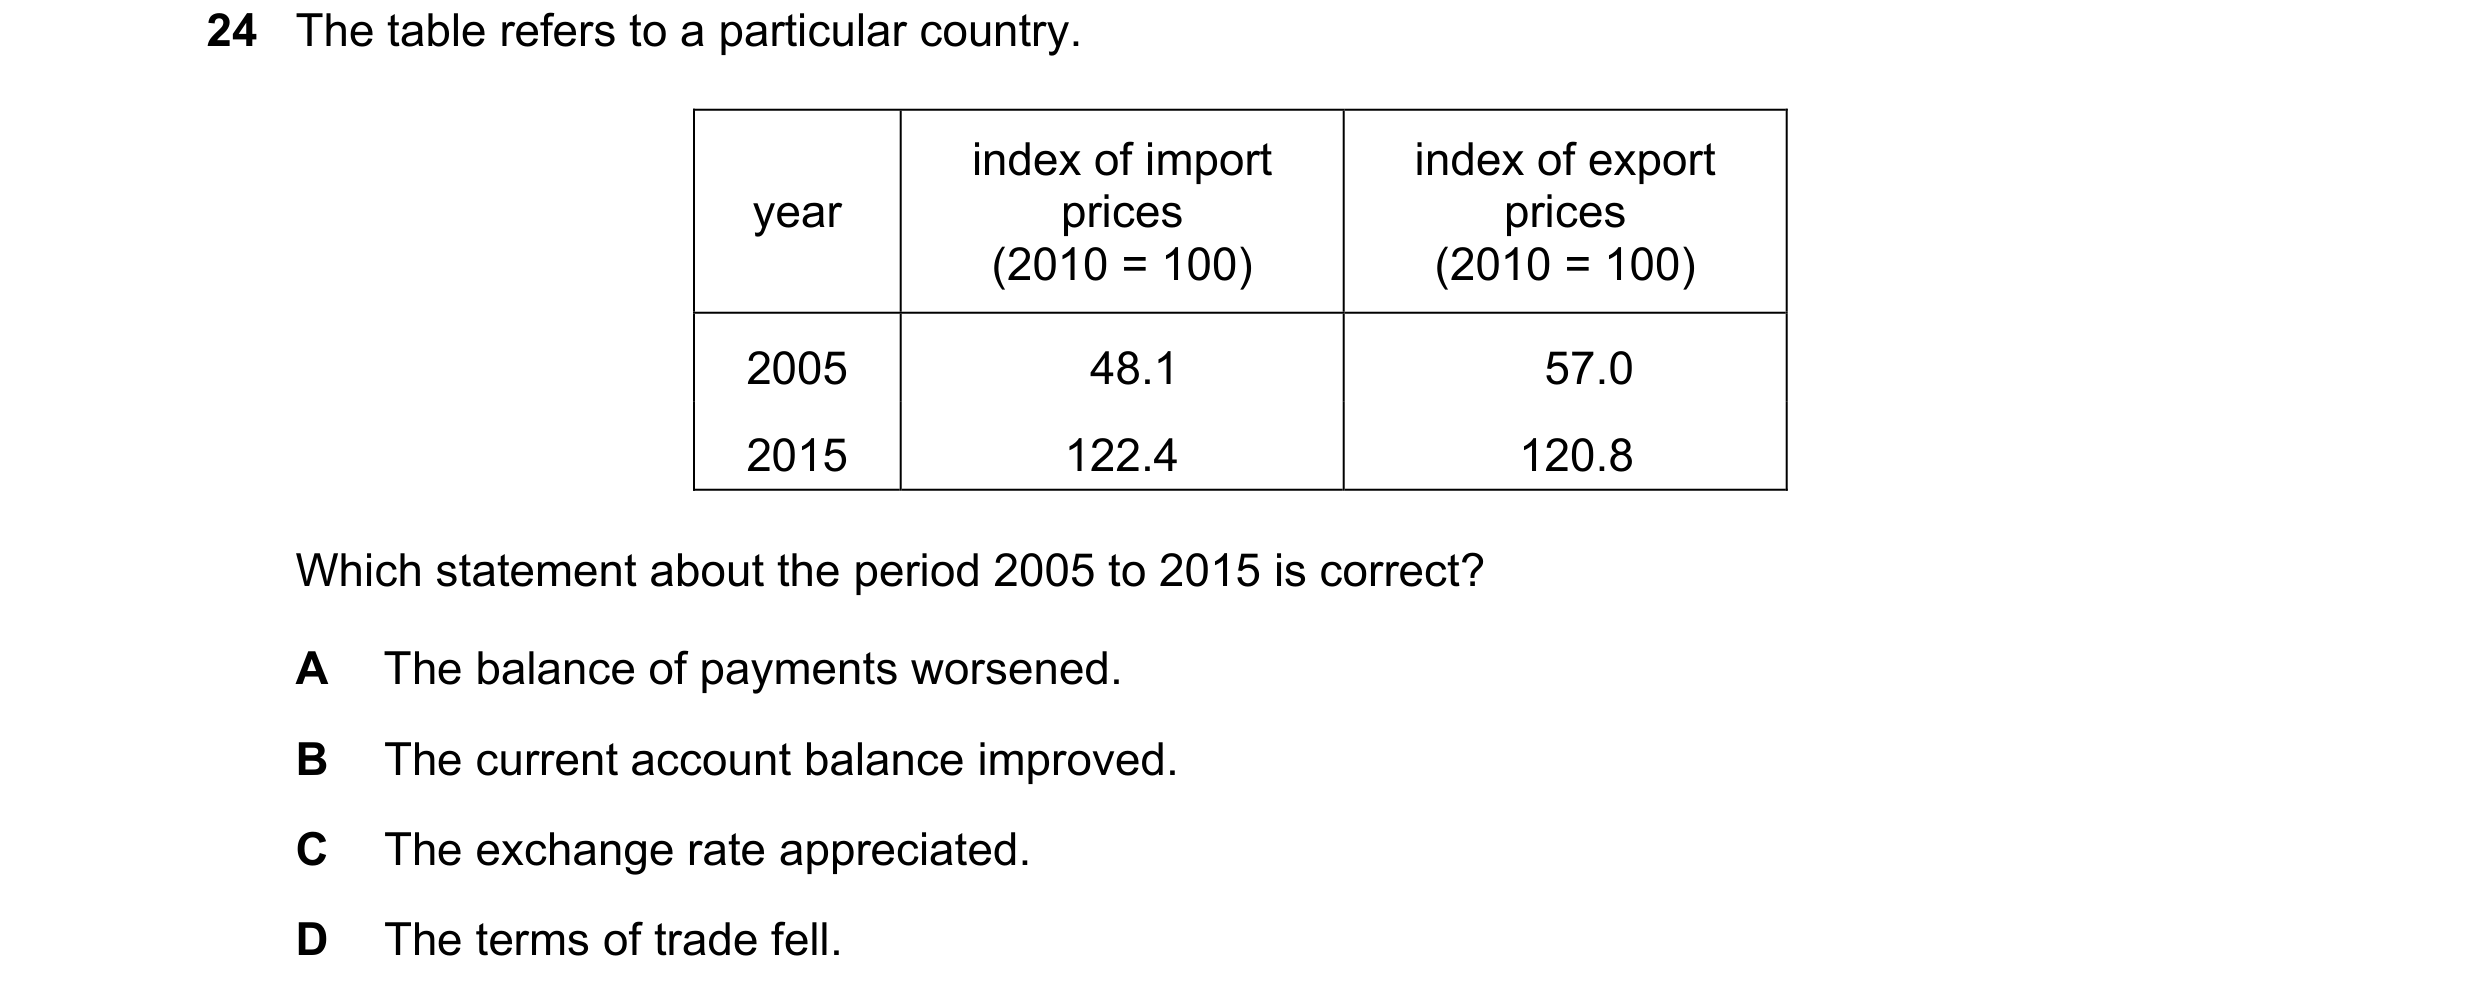
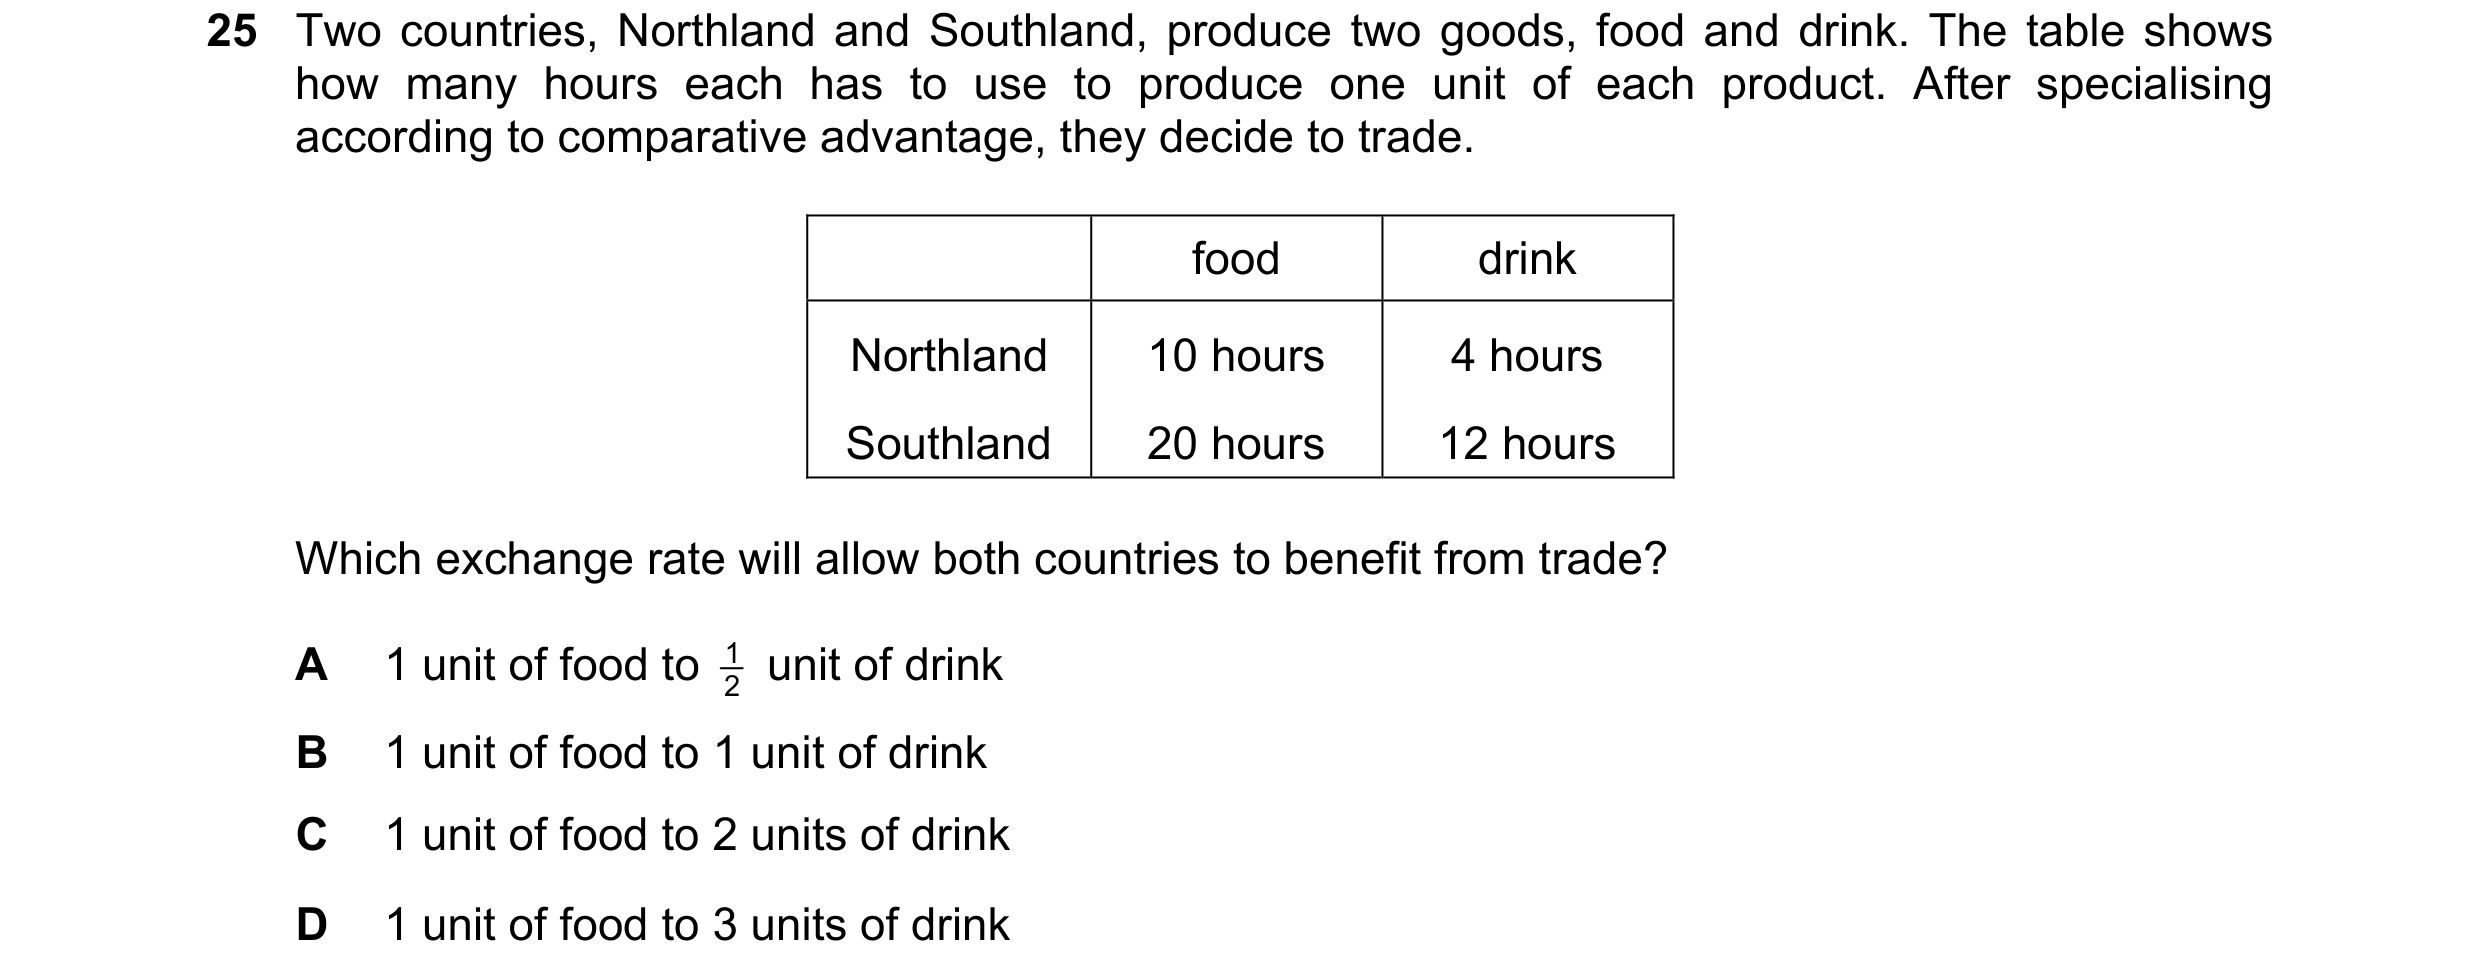
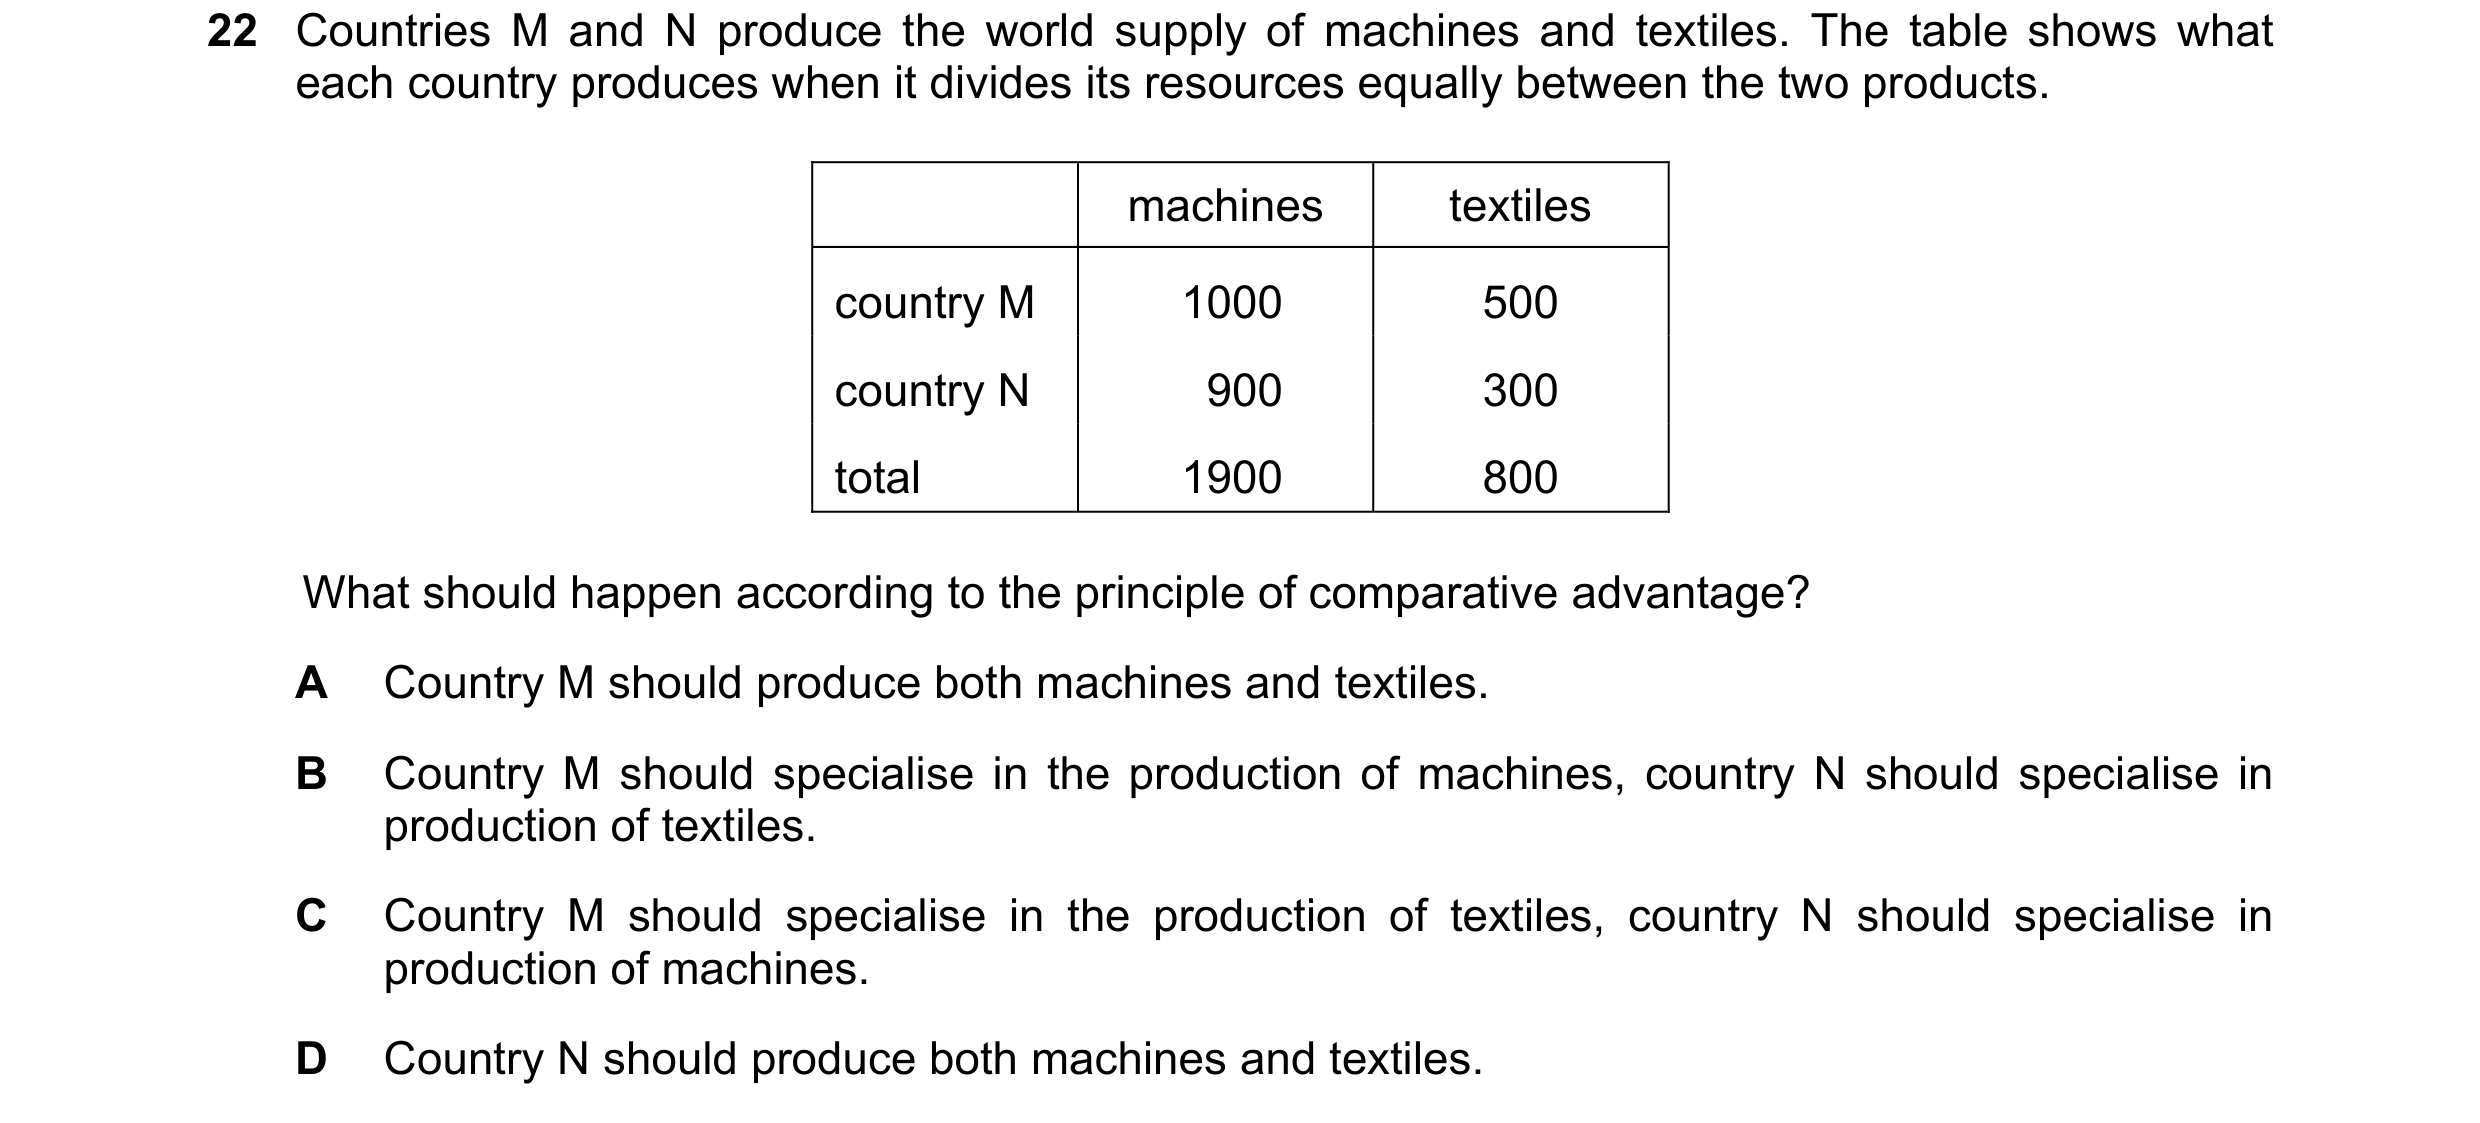 39 / 59
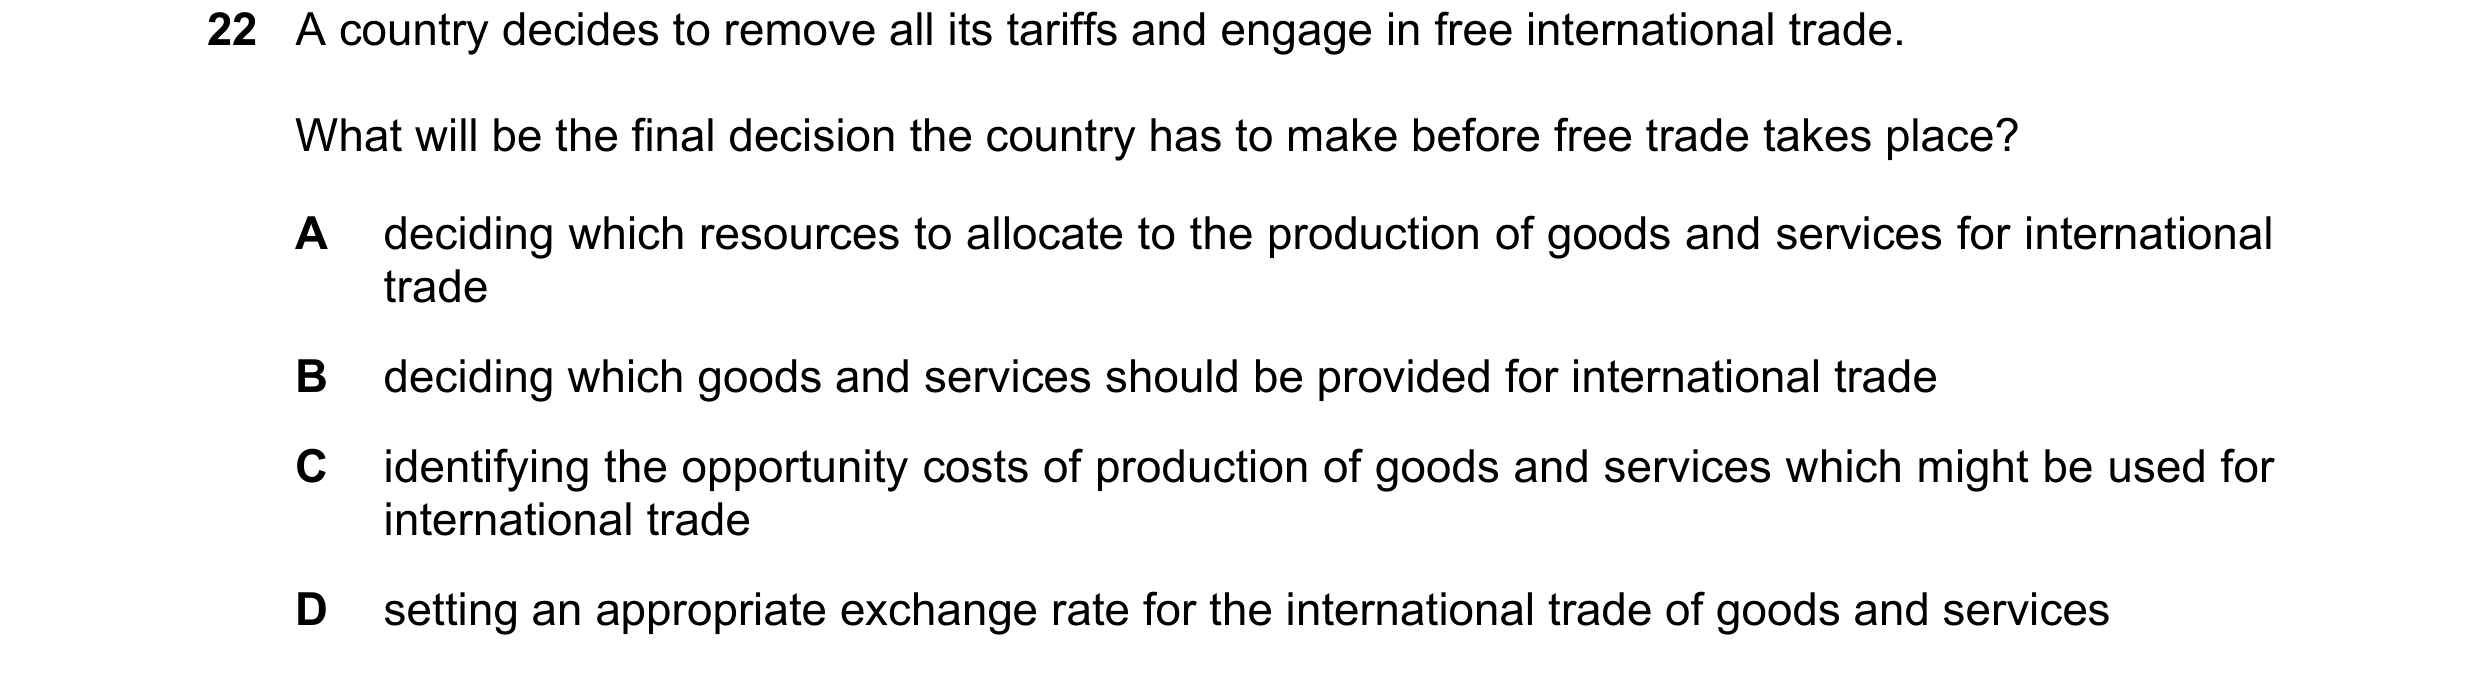
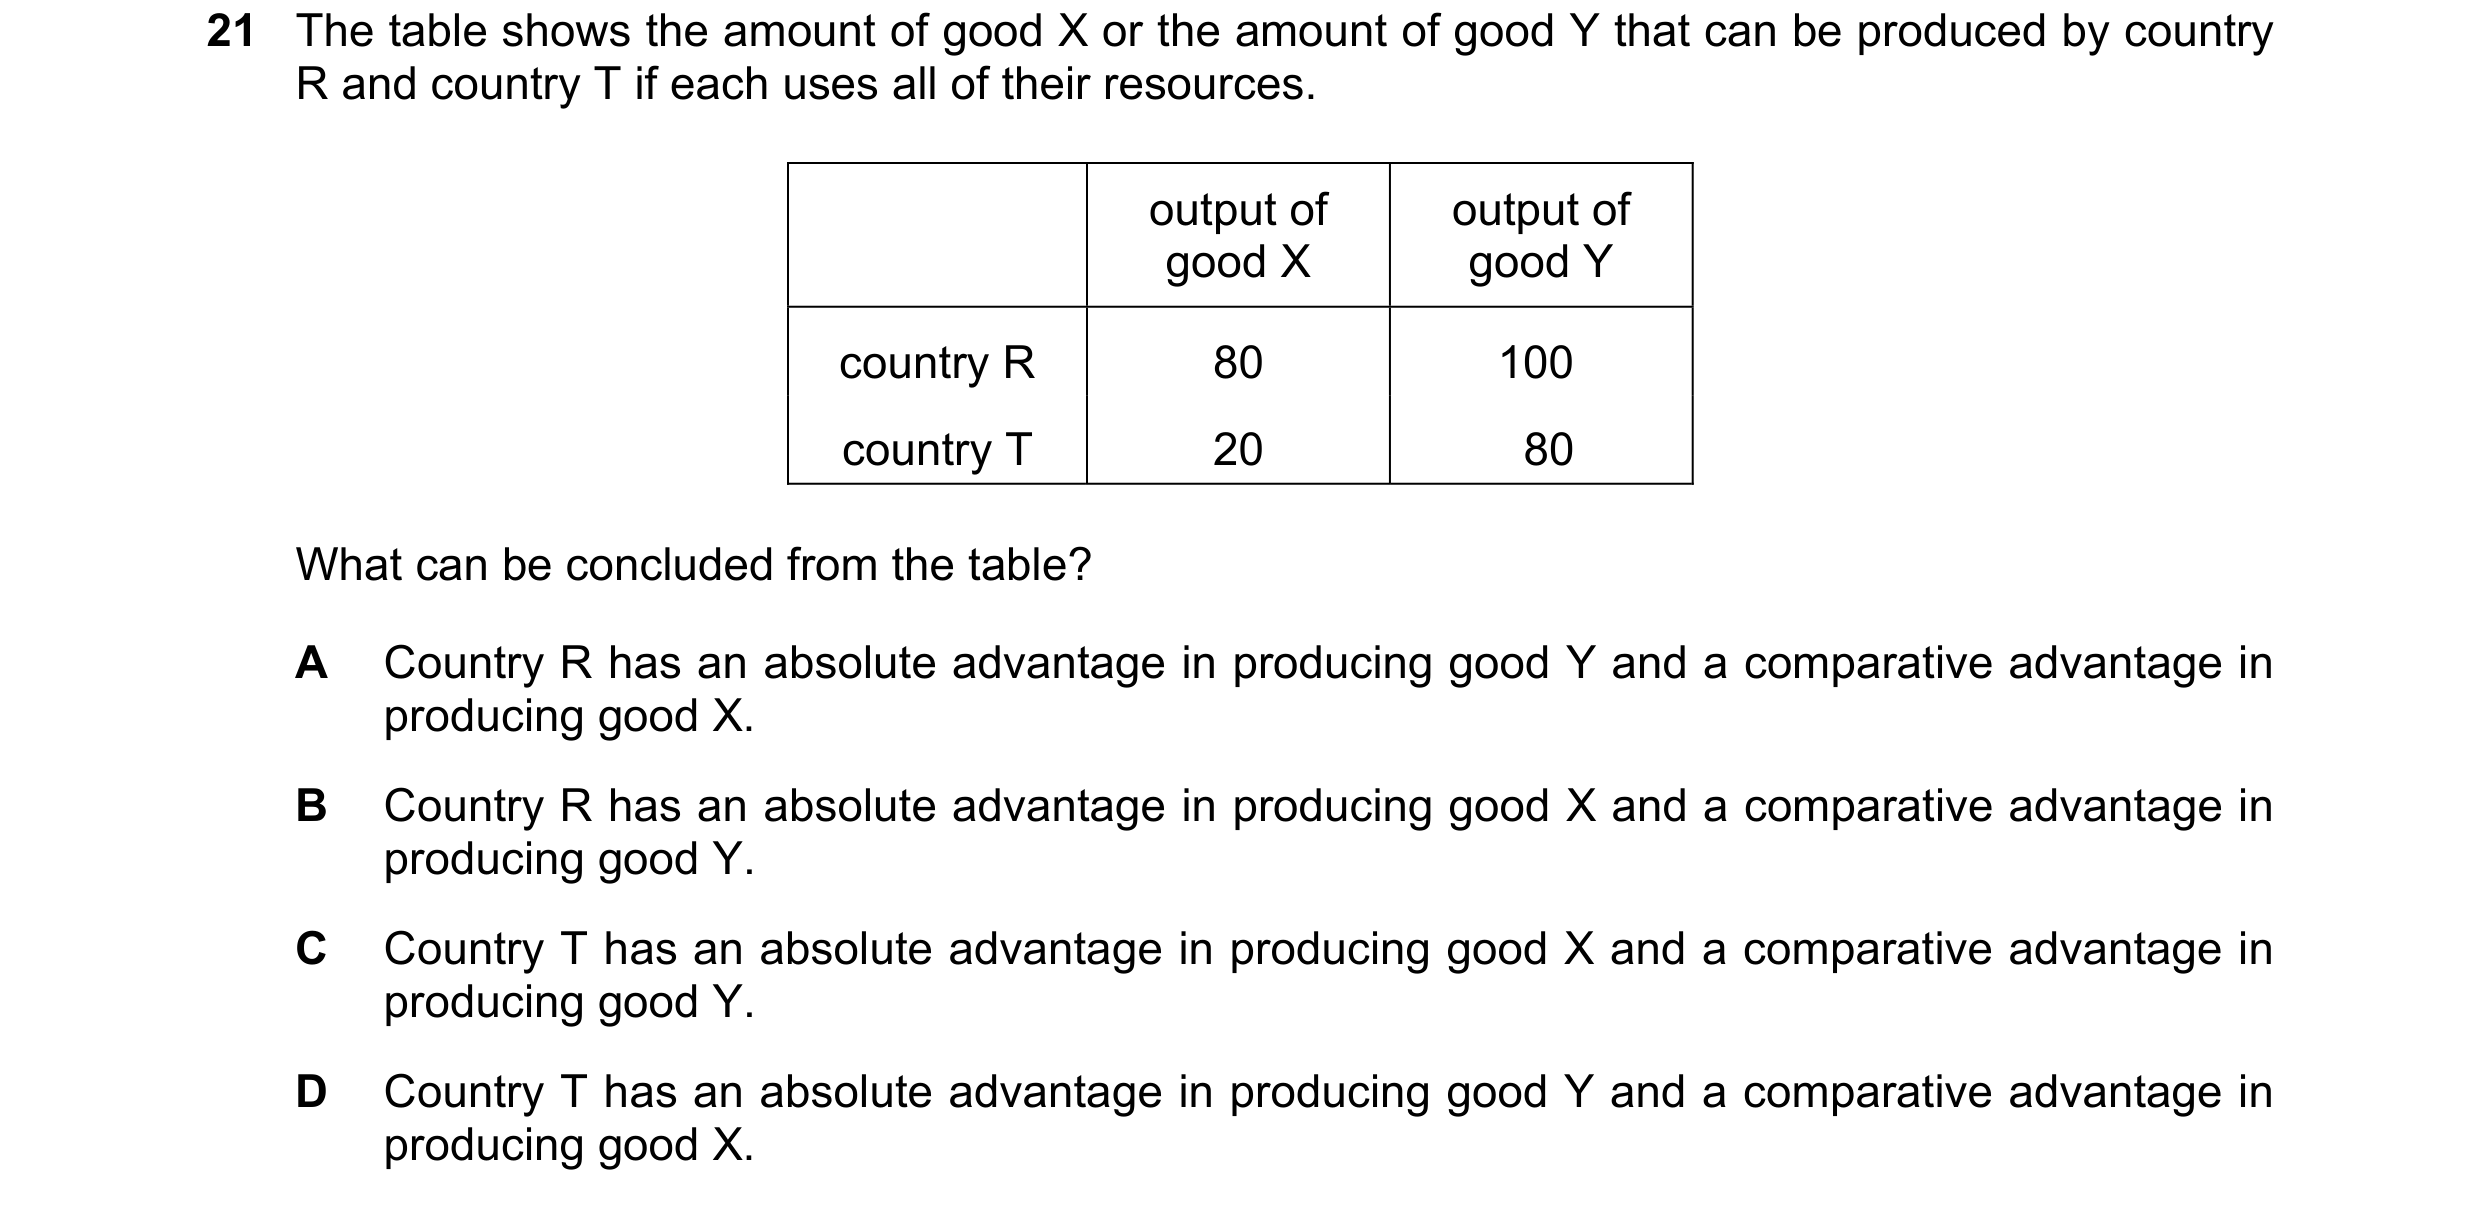 40 / 59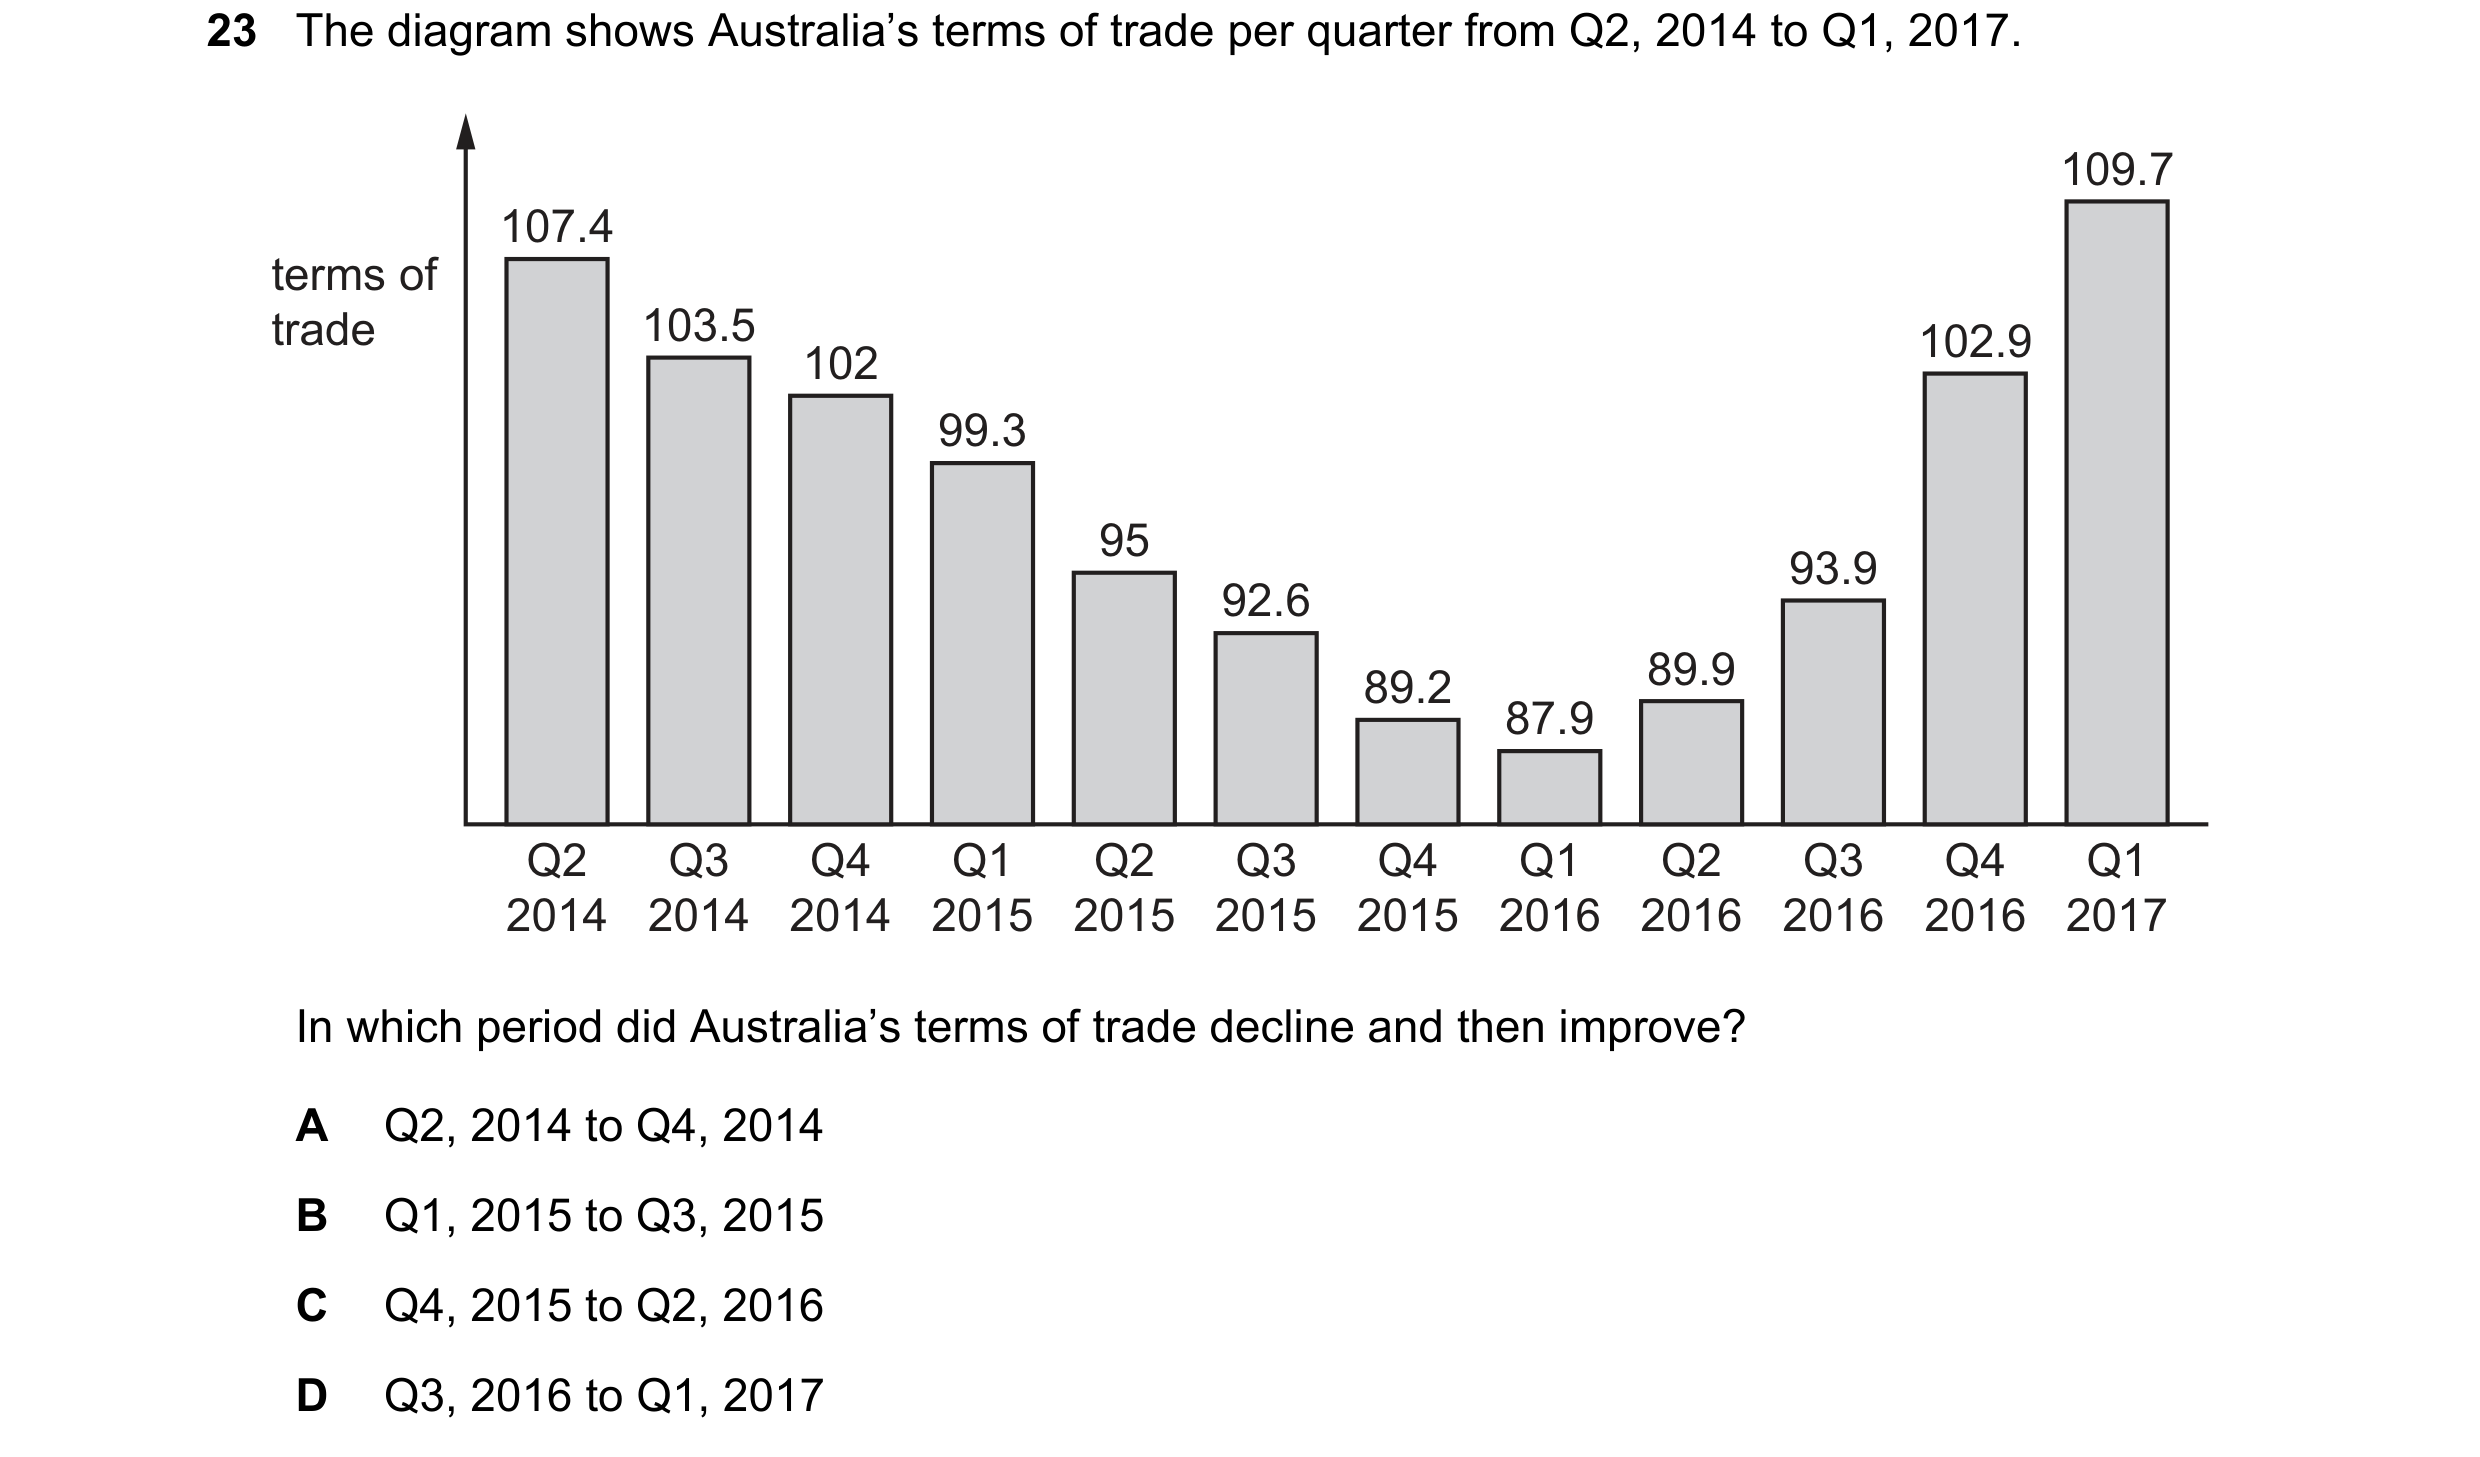
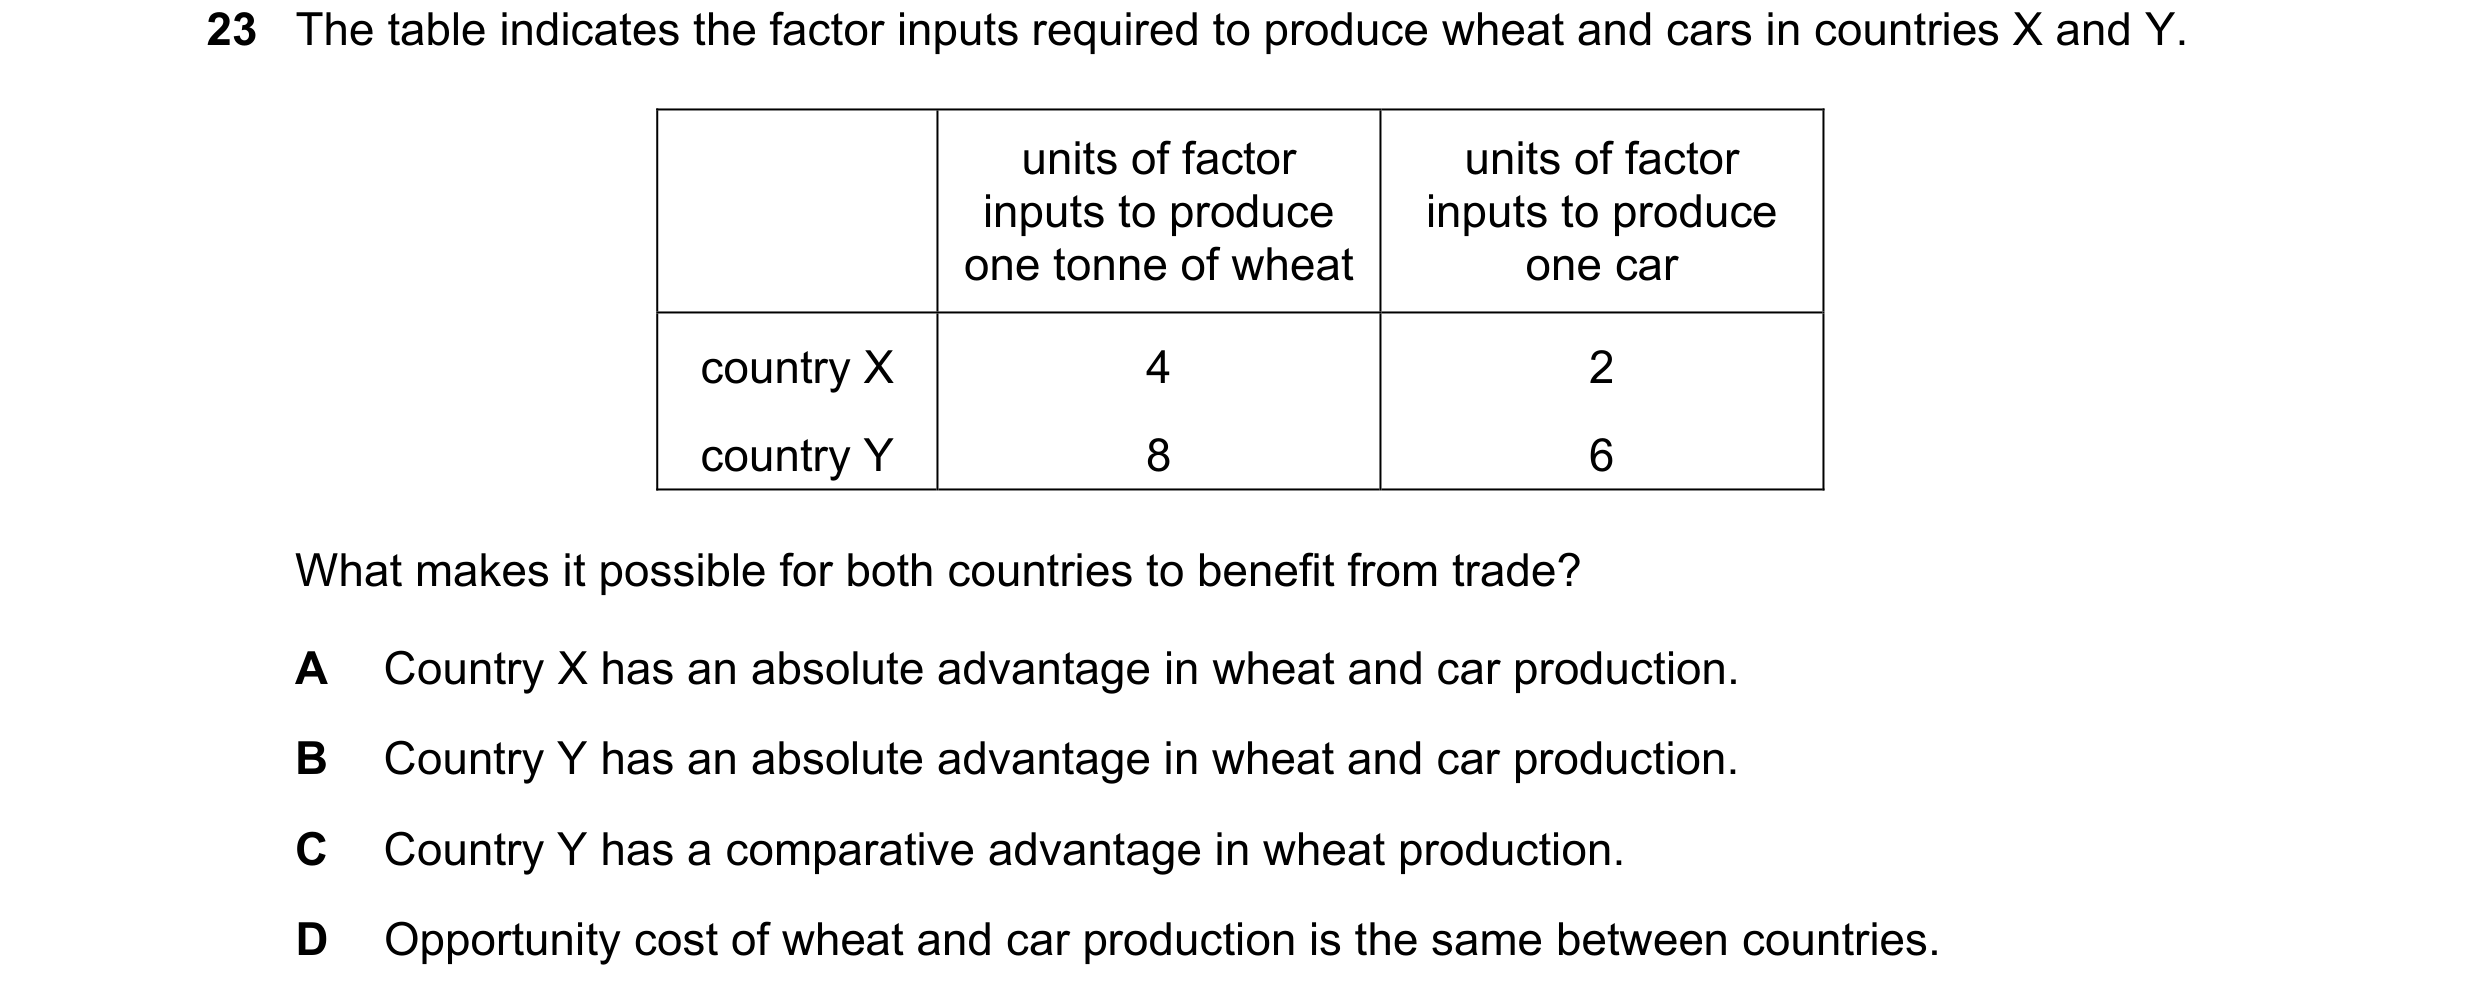
 41 / 59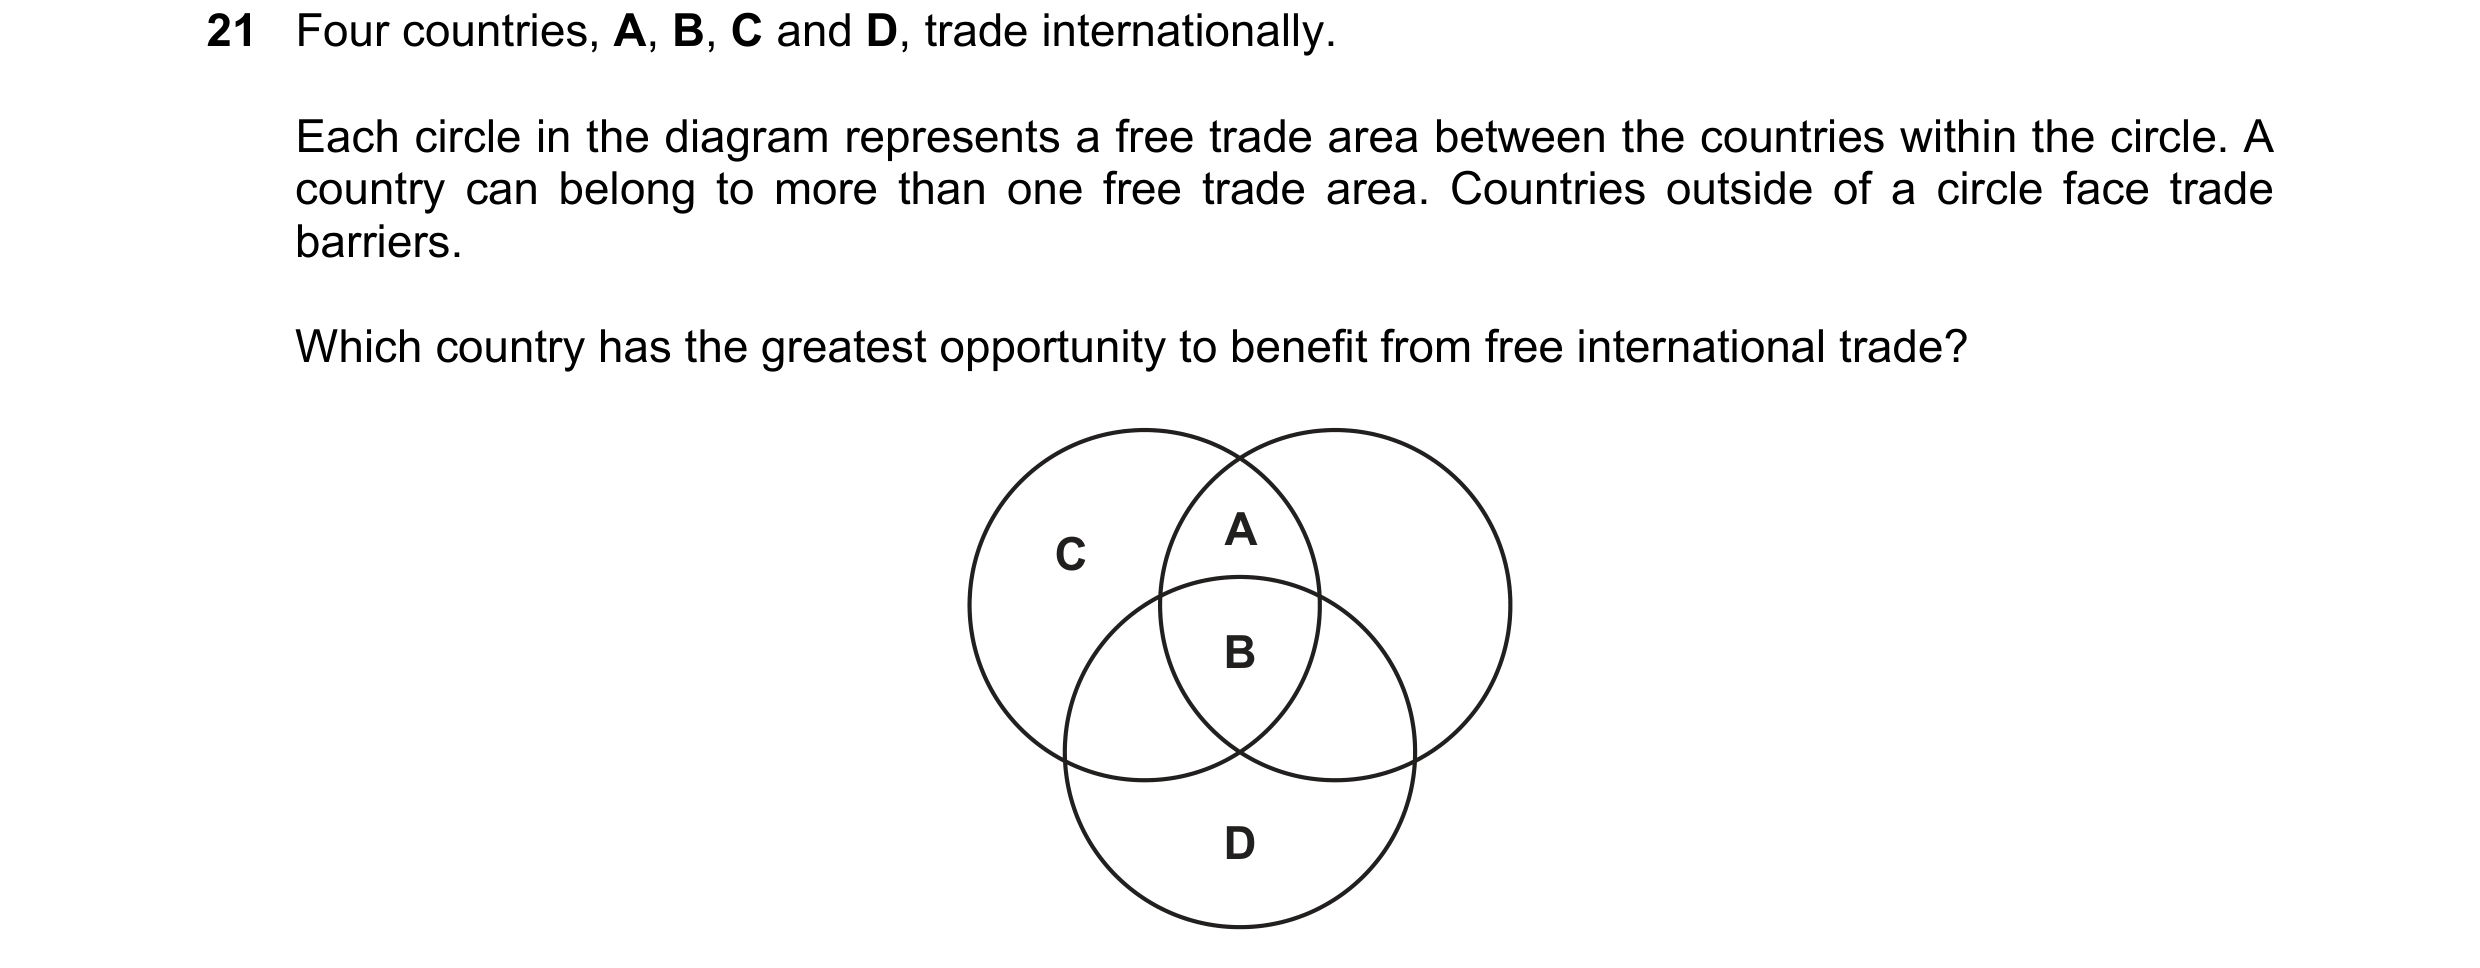


 42 / 59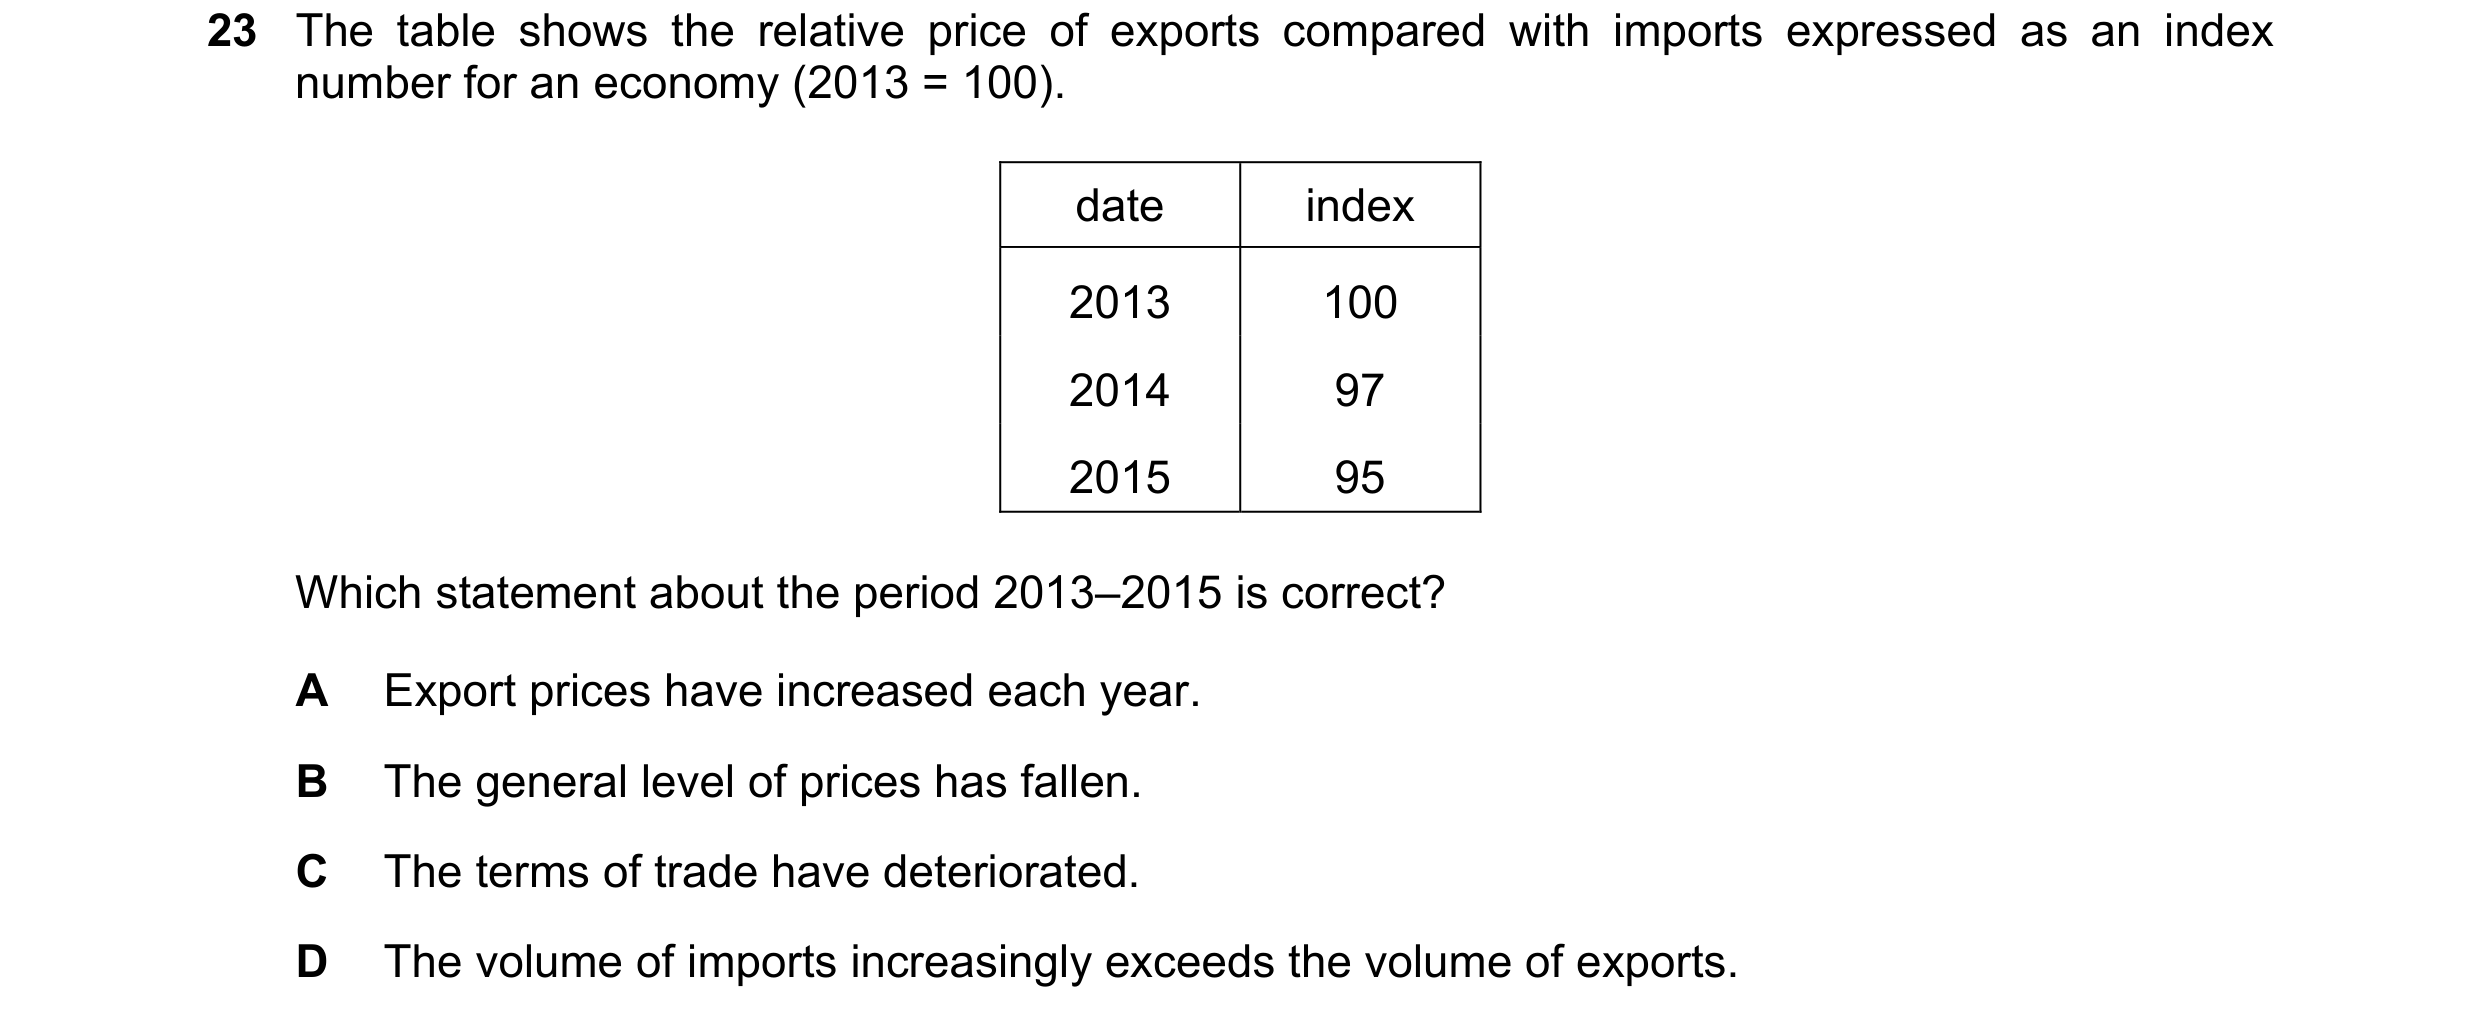
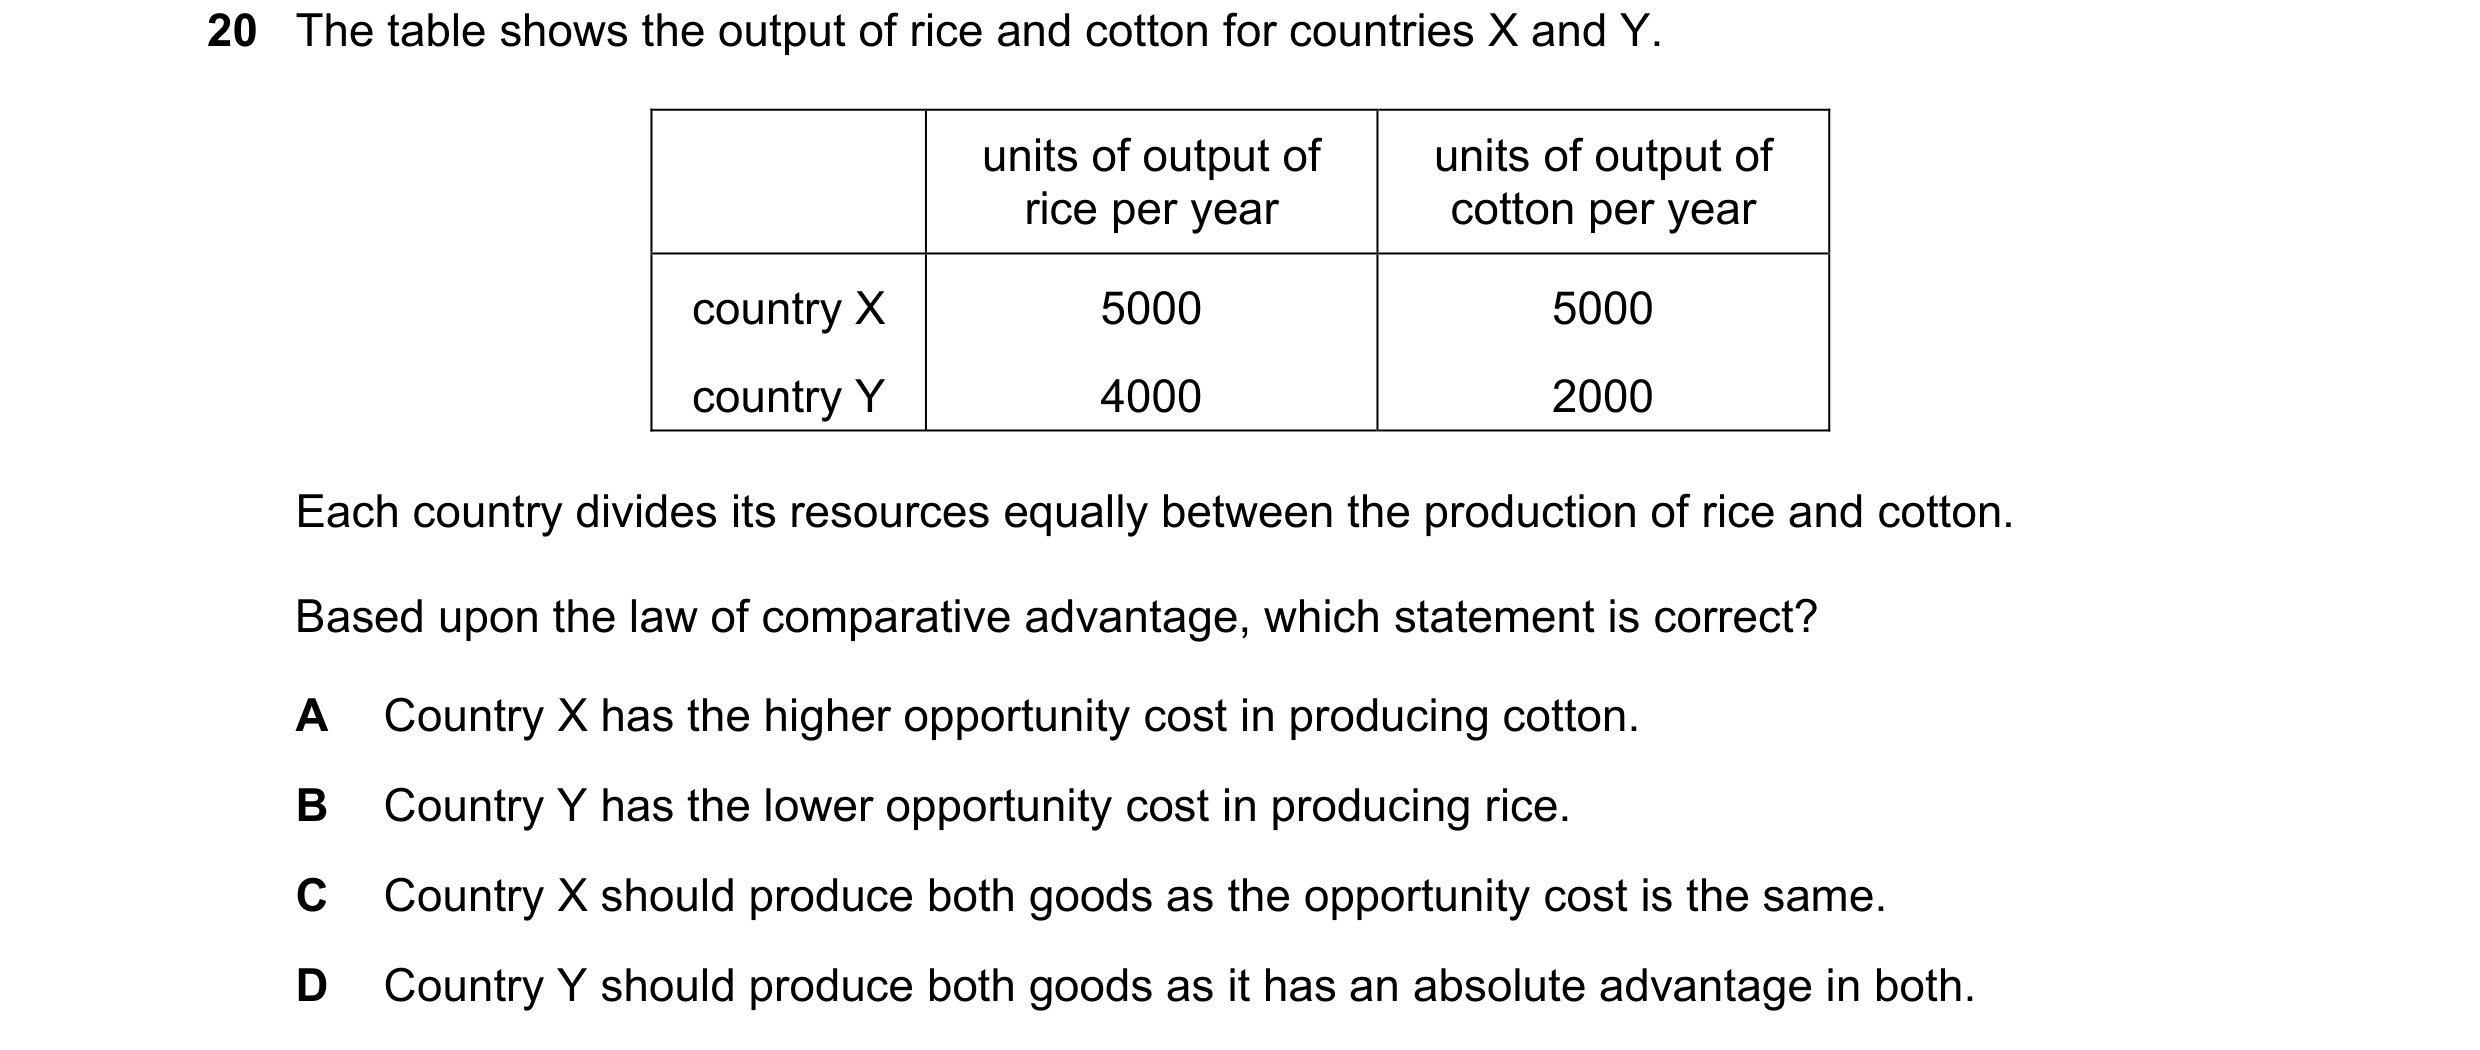 43 / 59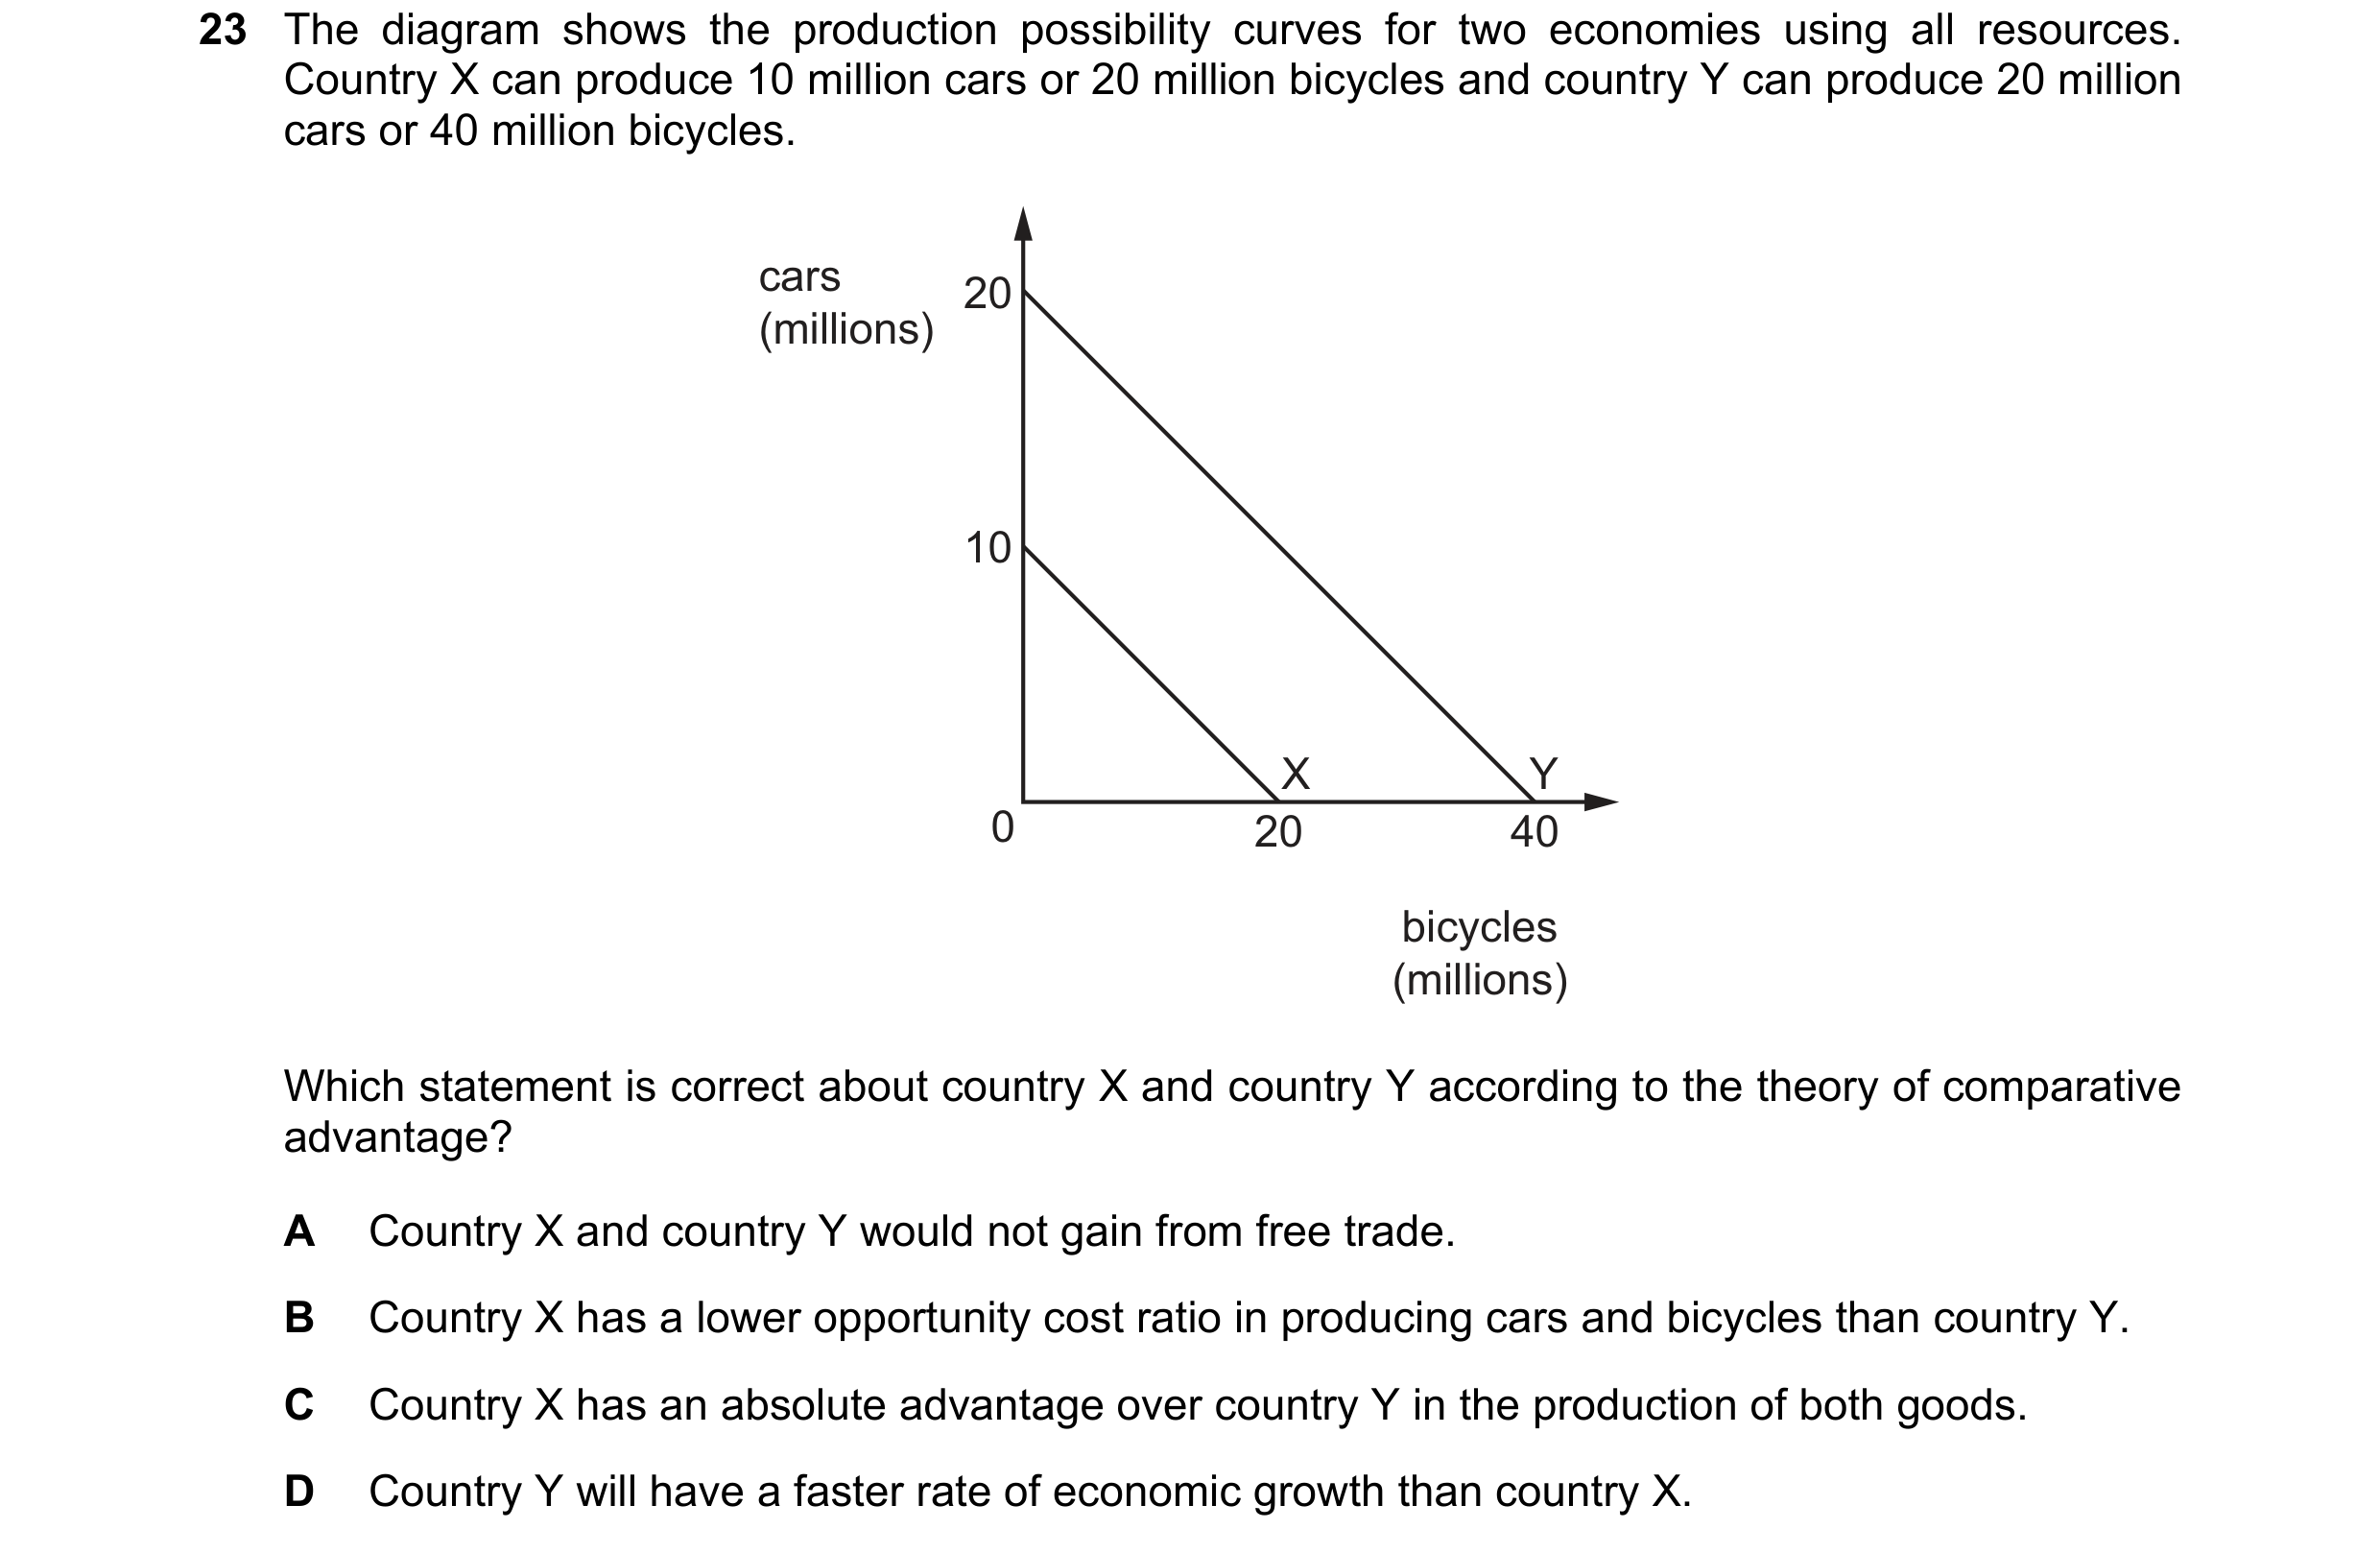
 44 / 59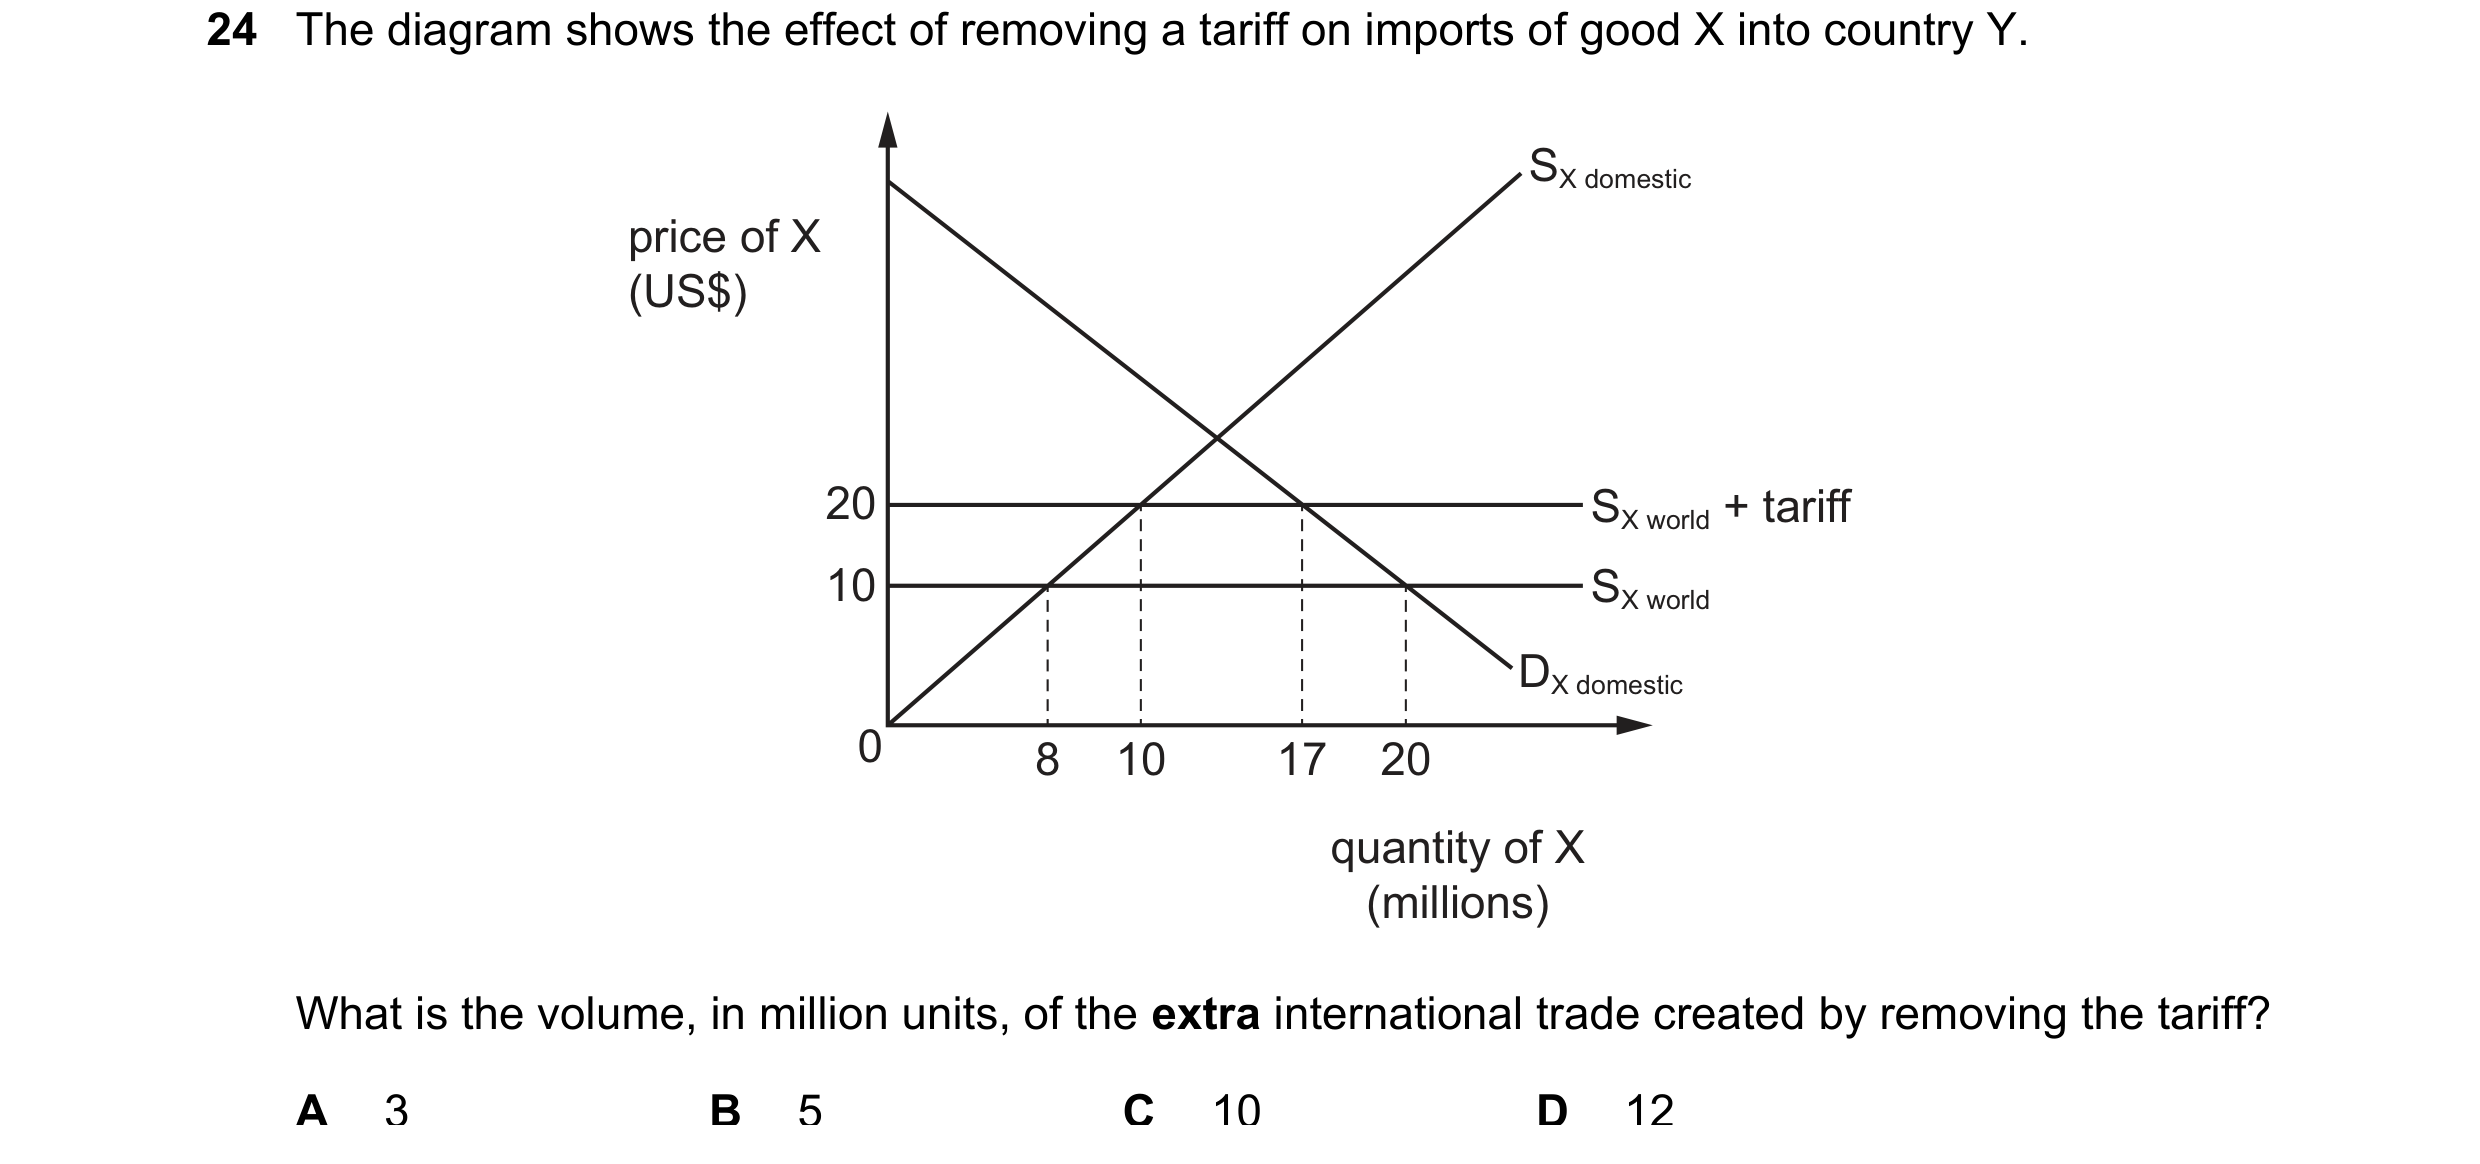
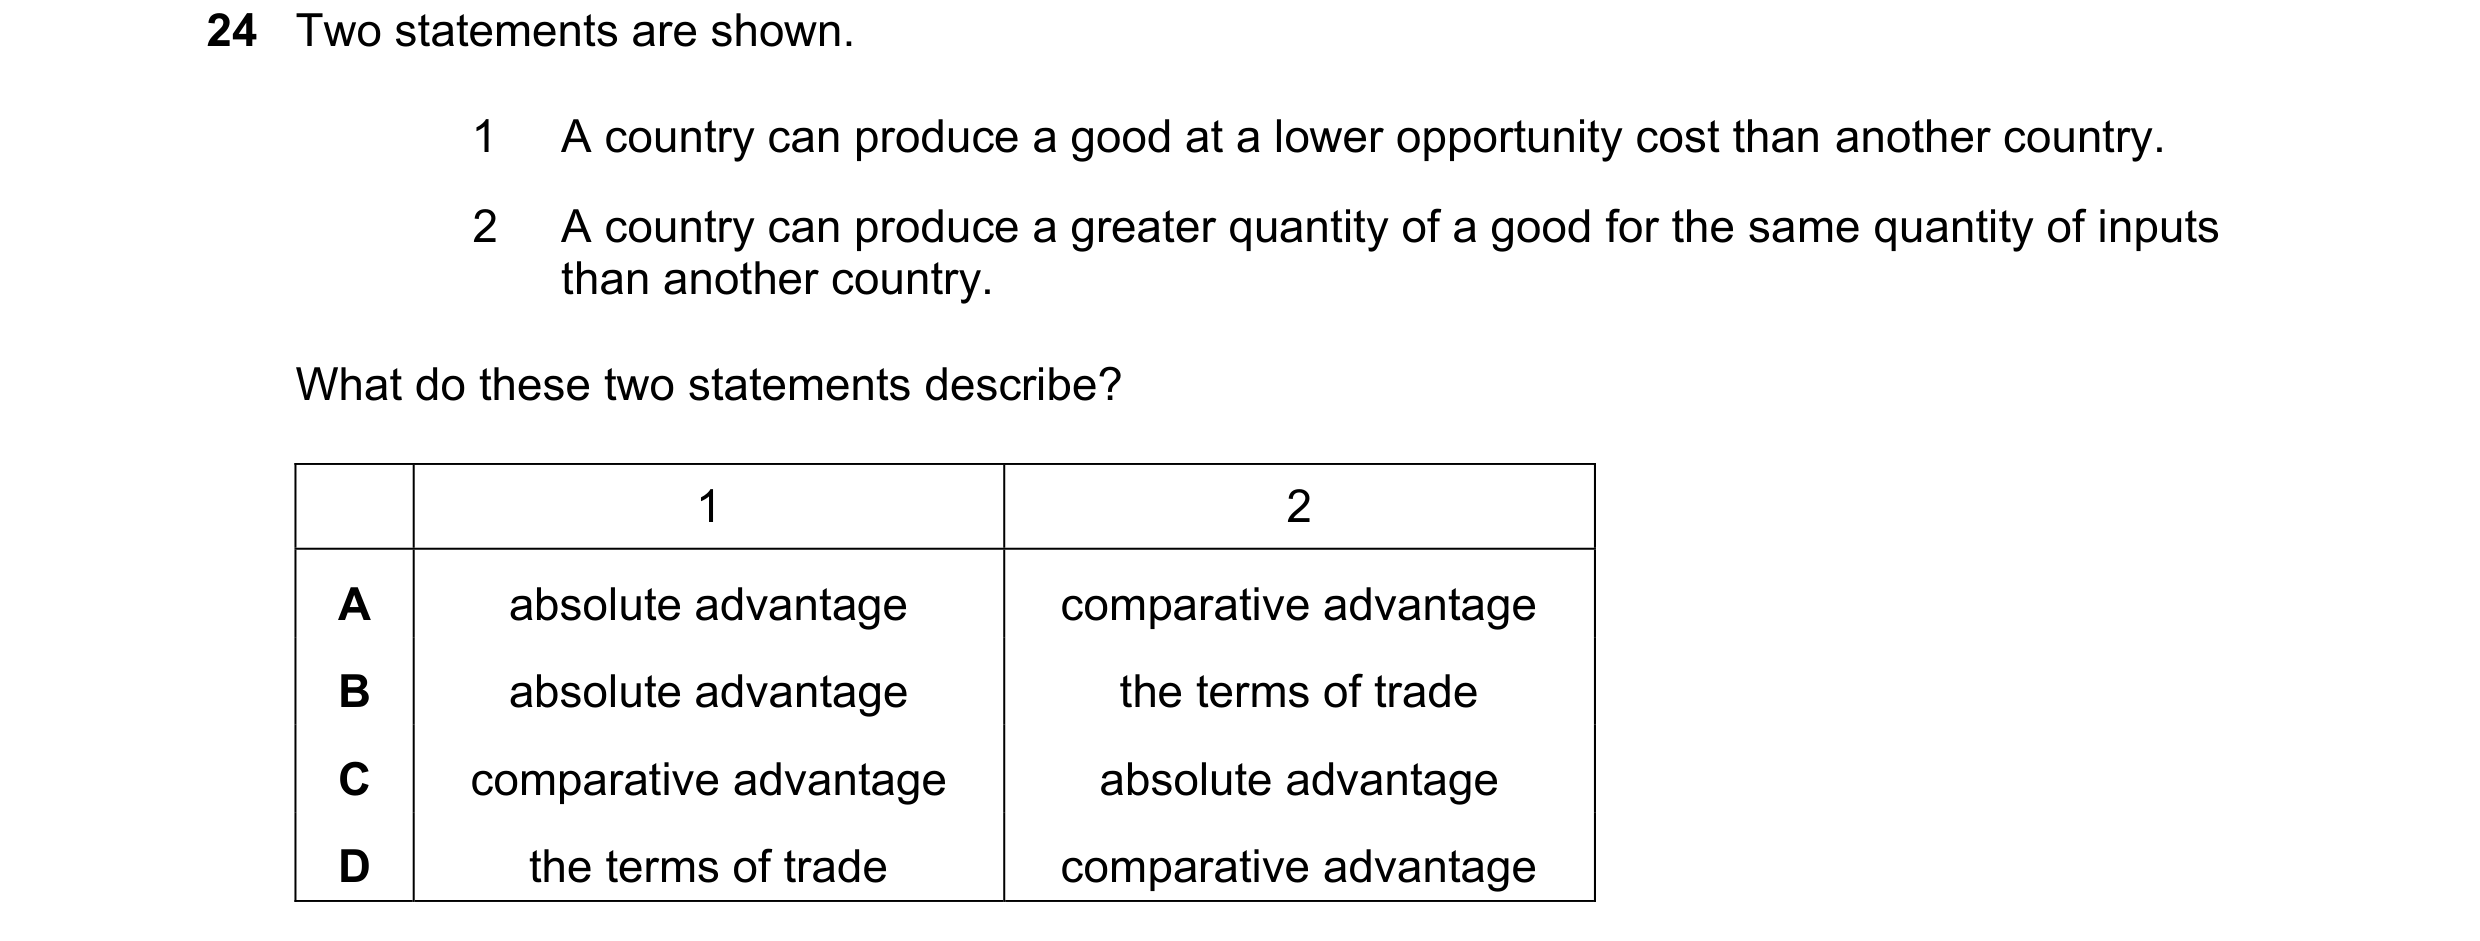
 45 / 59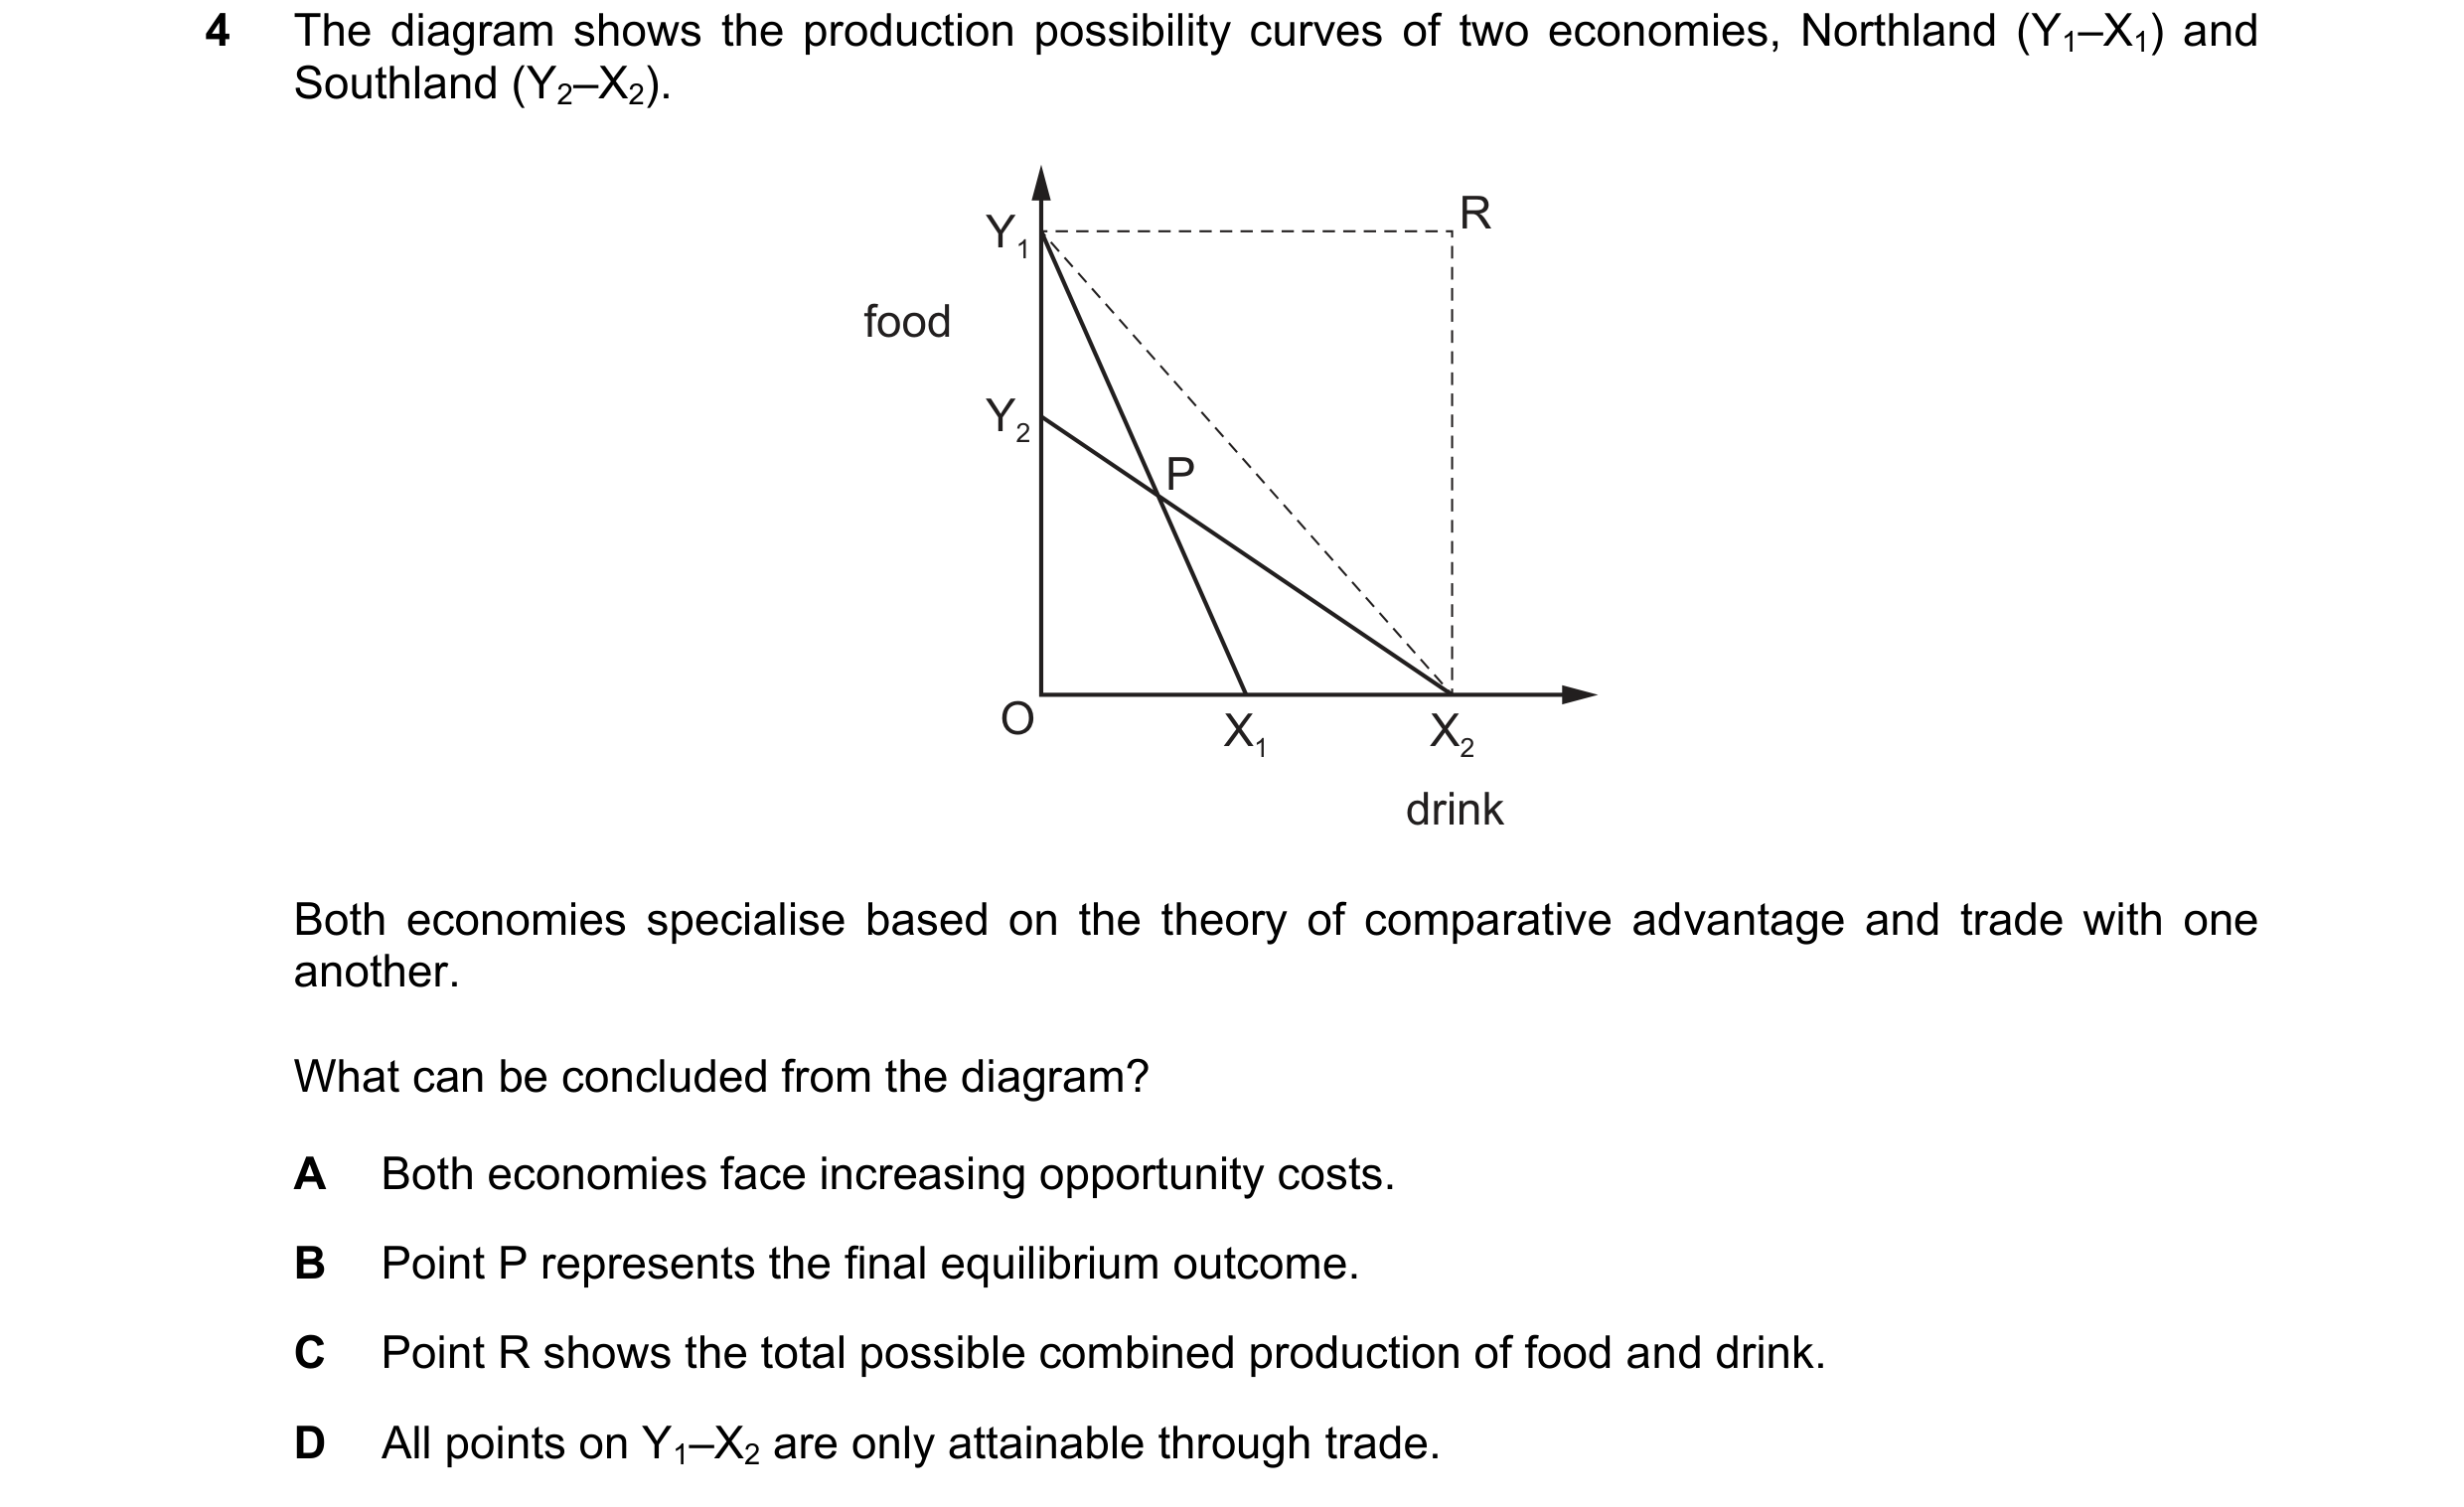

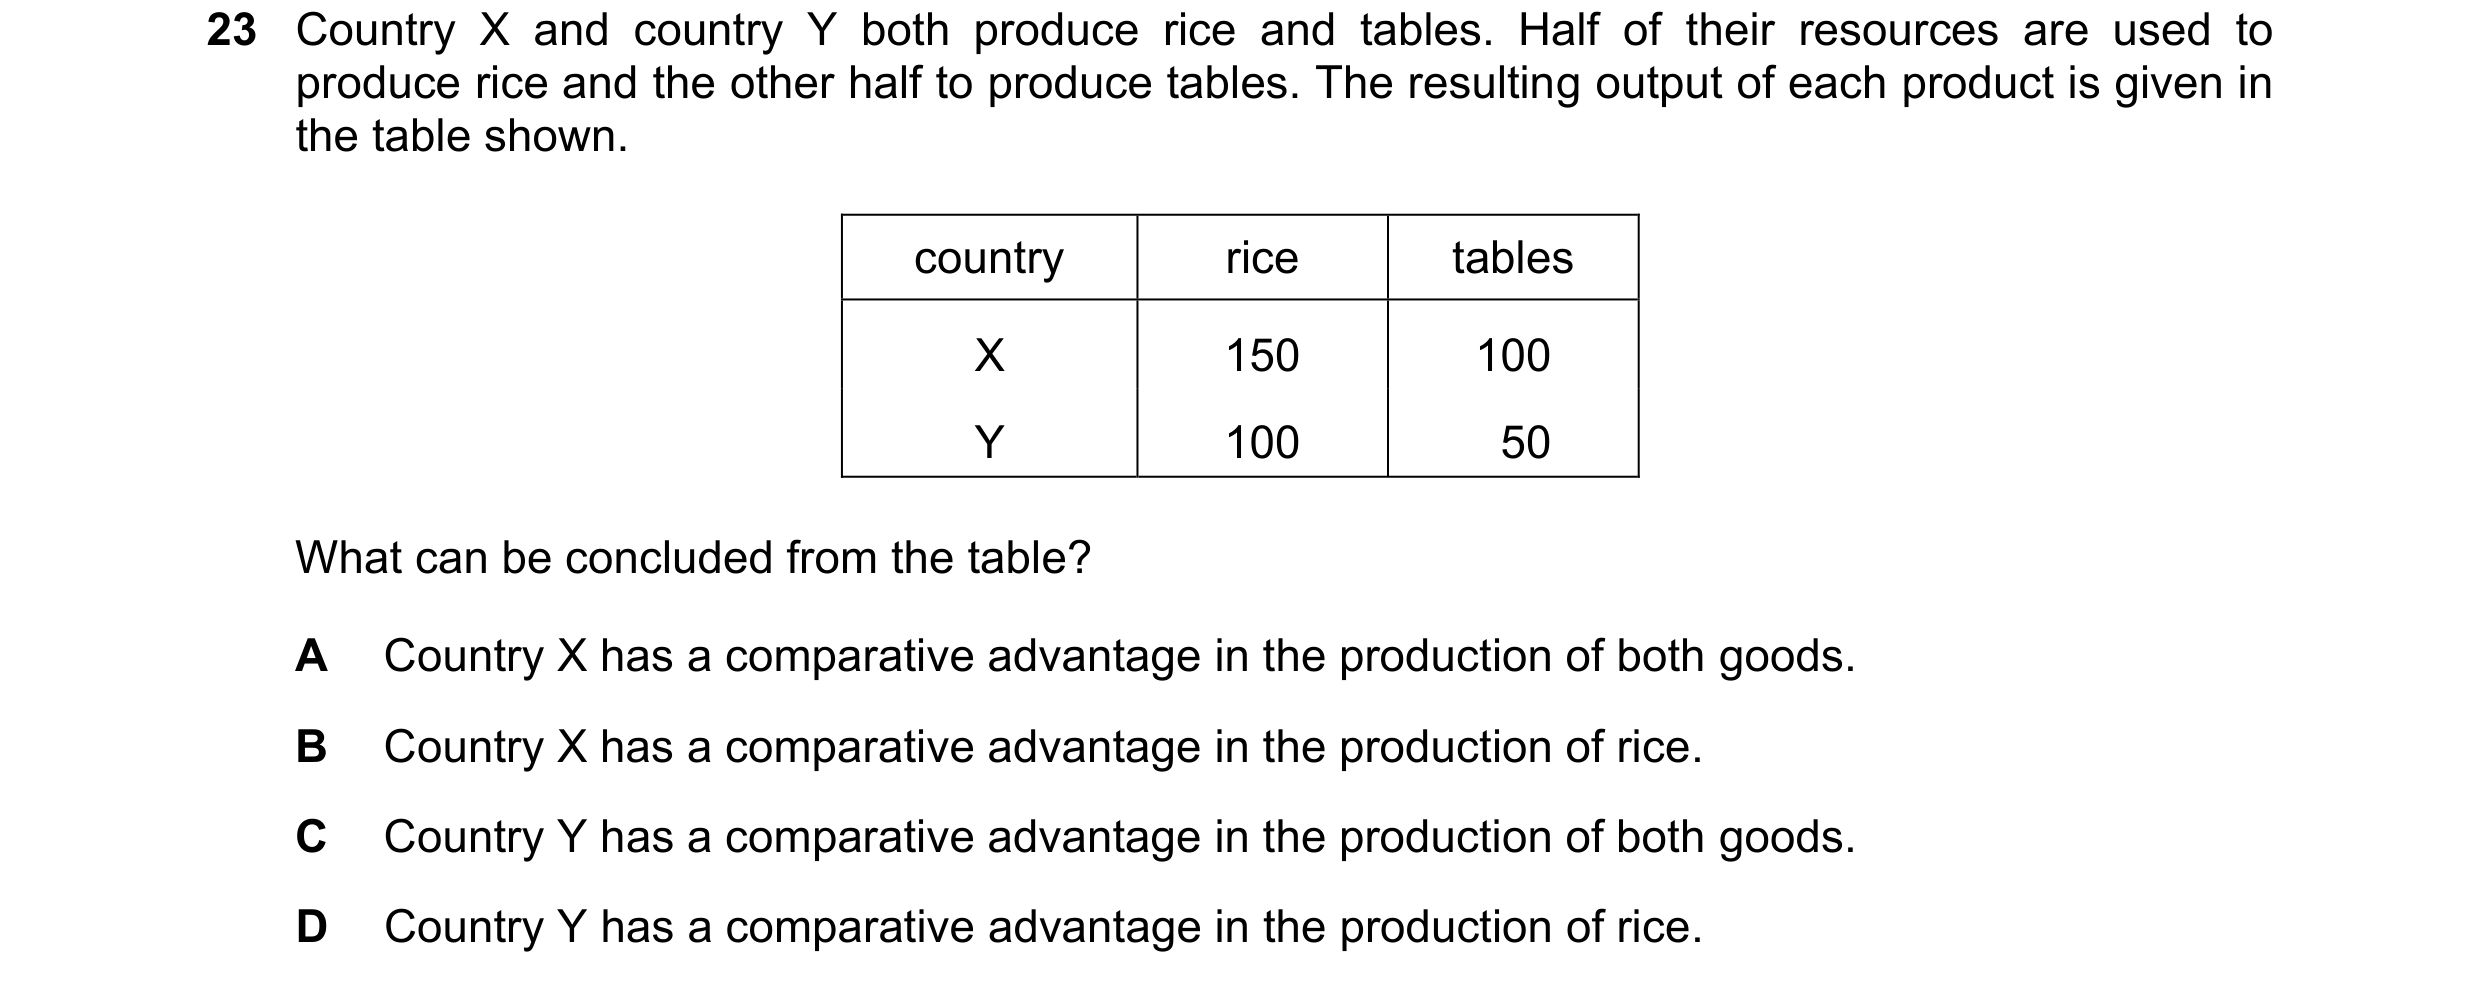 46 / 59
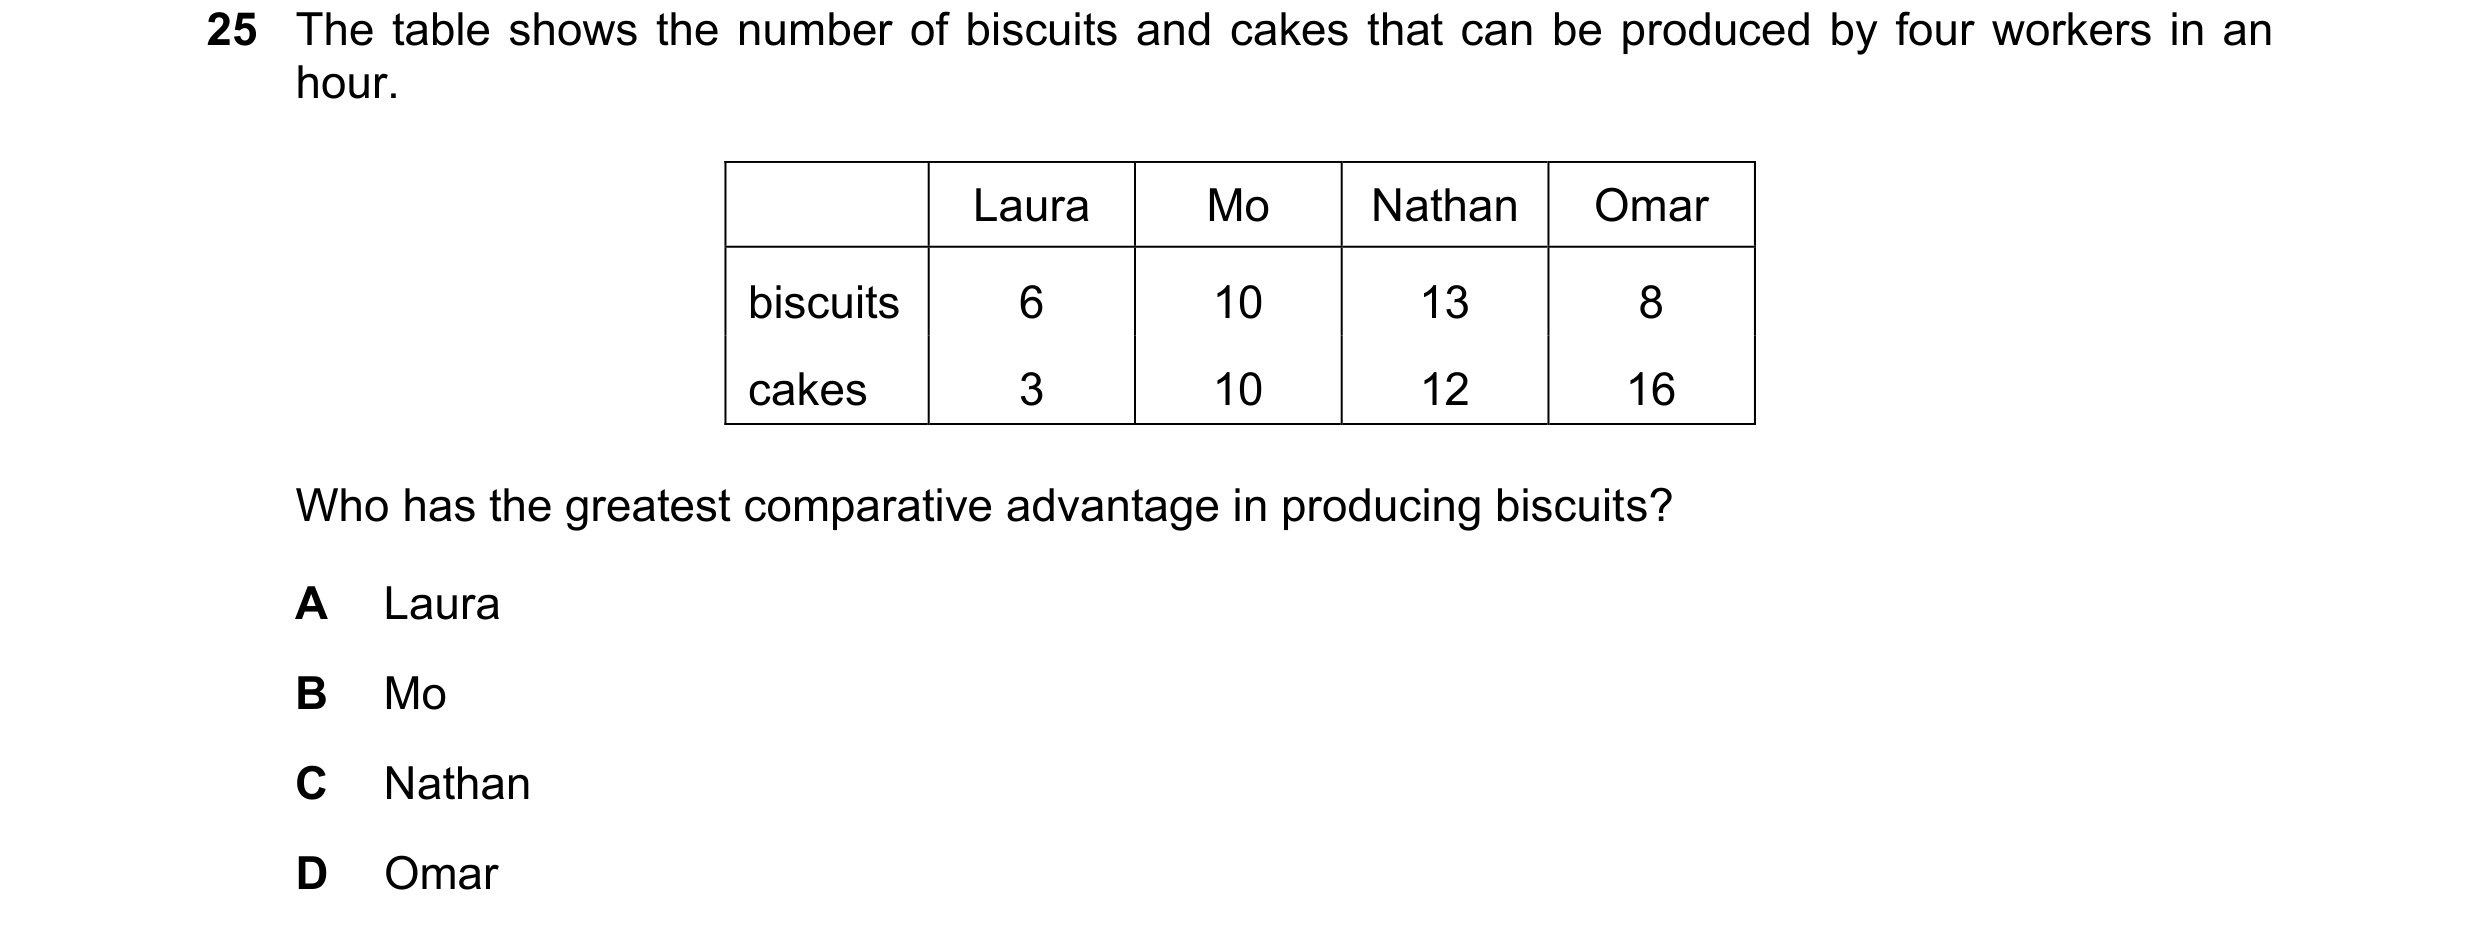
 47 / 59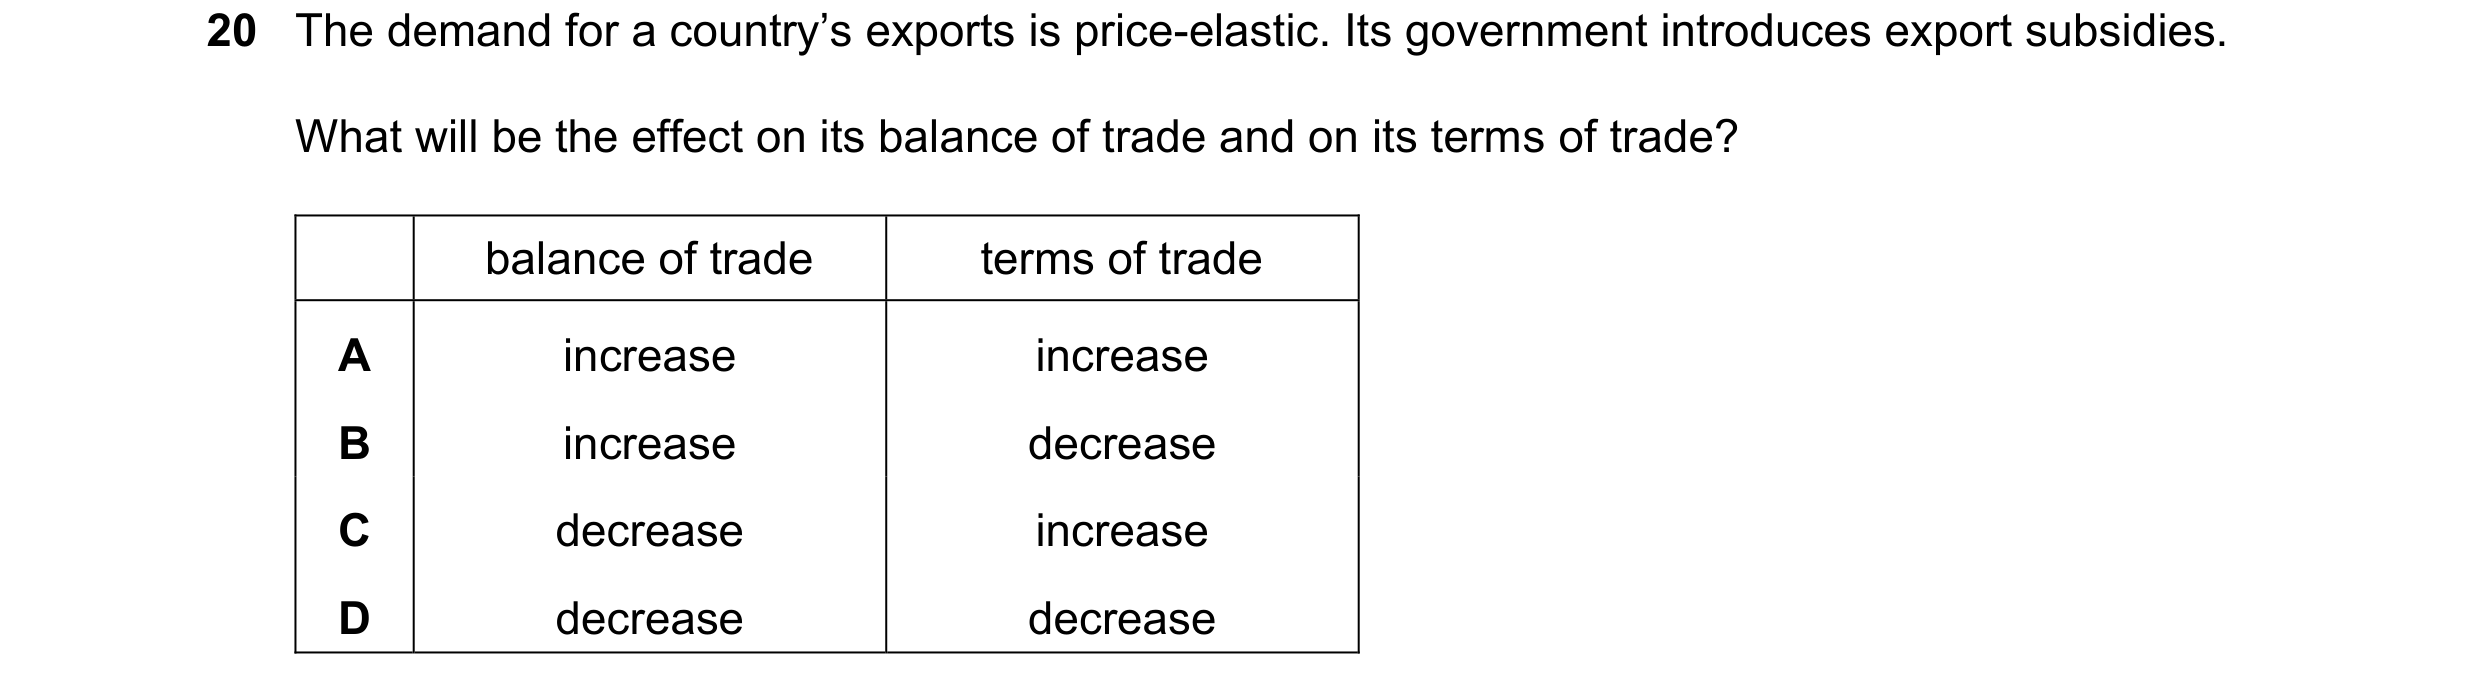
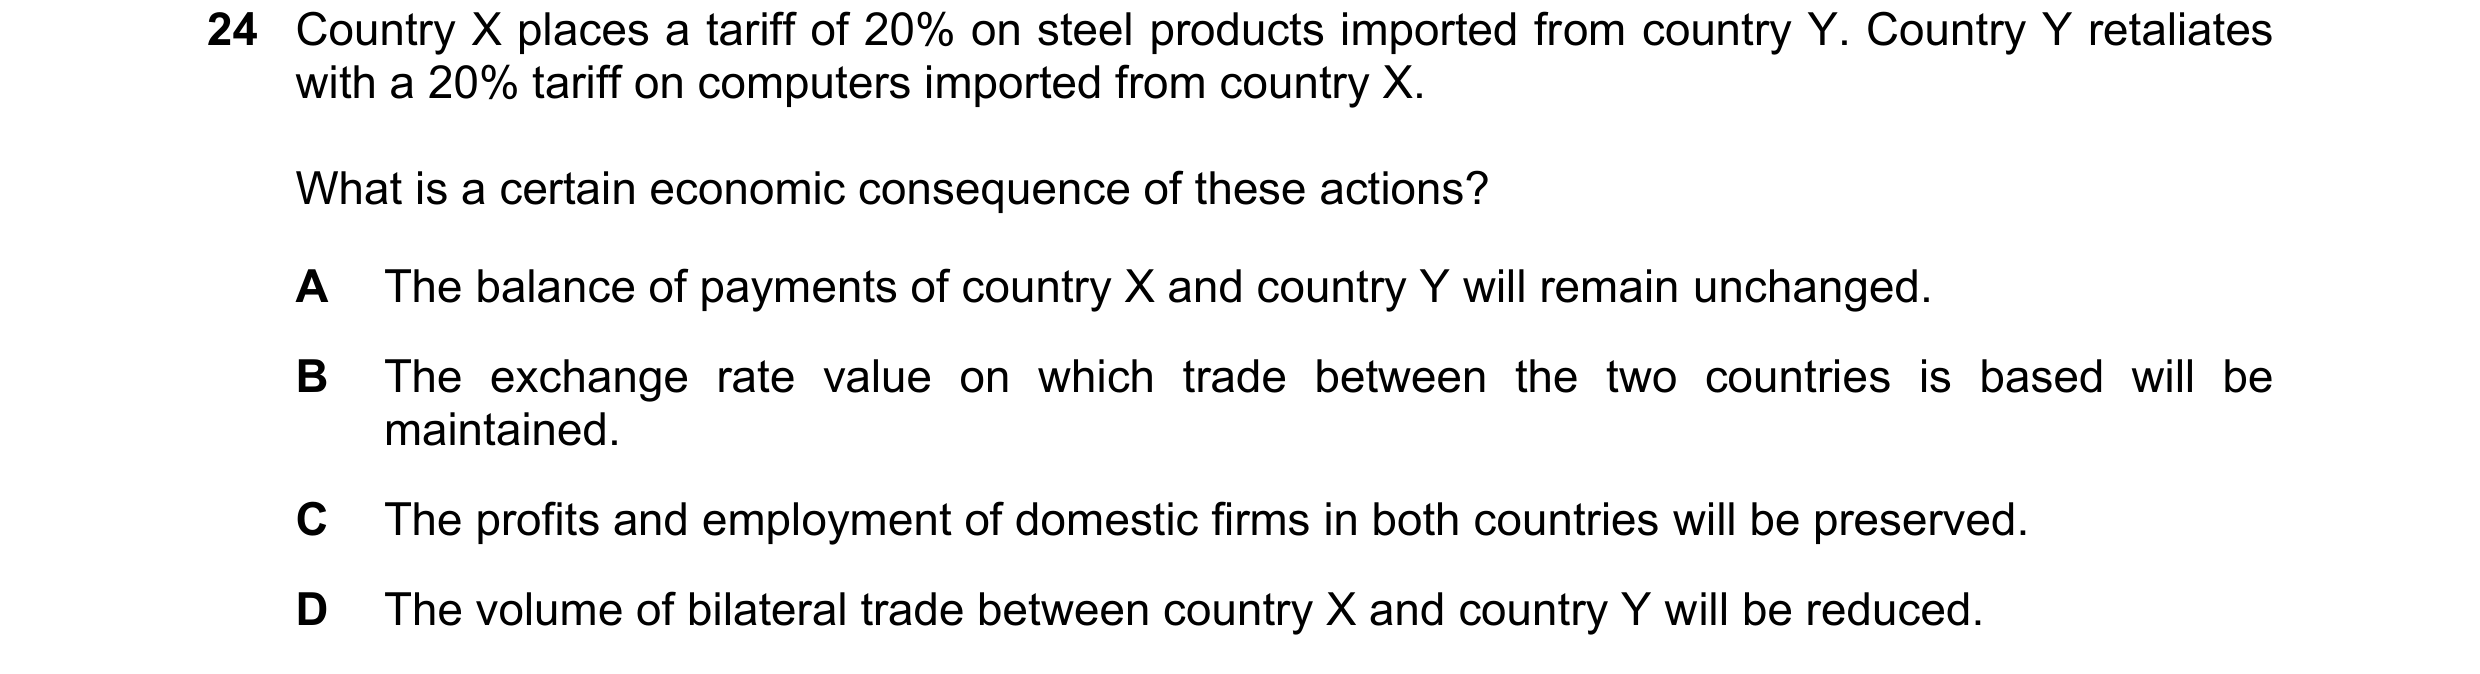
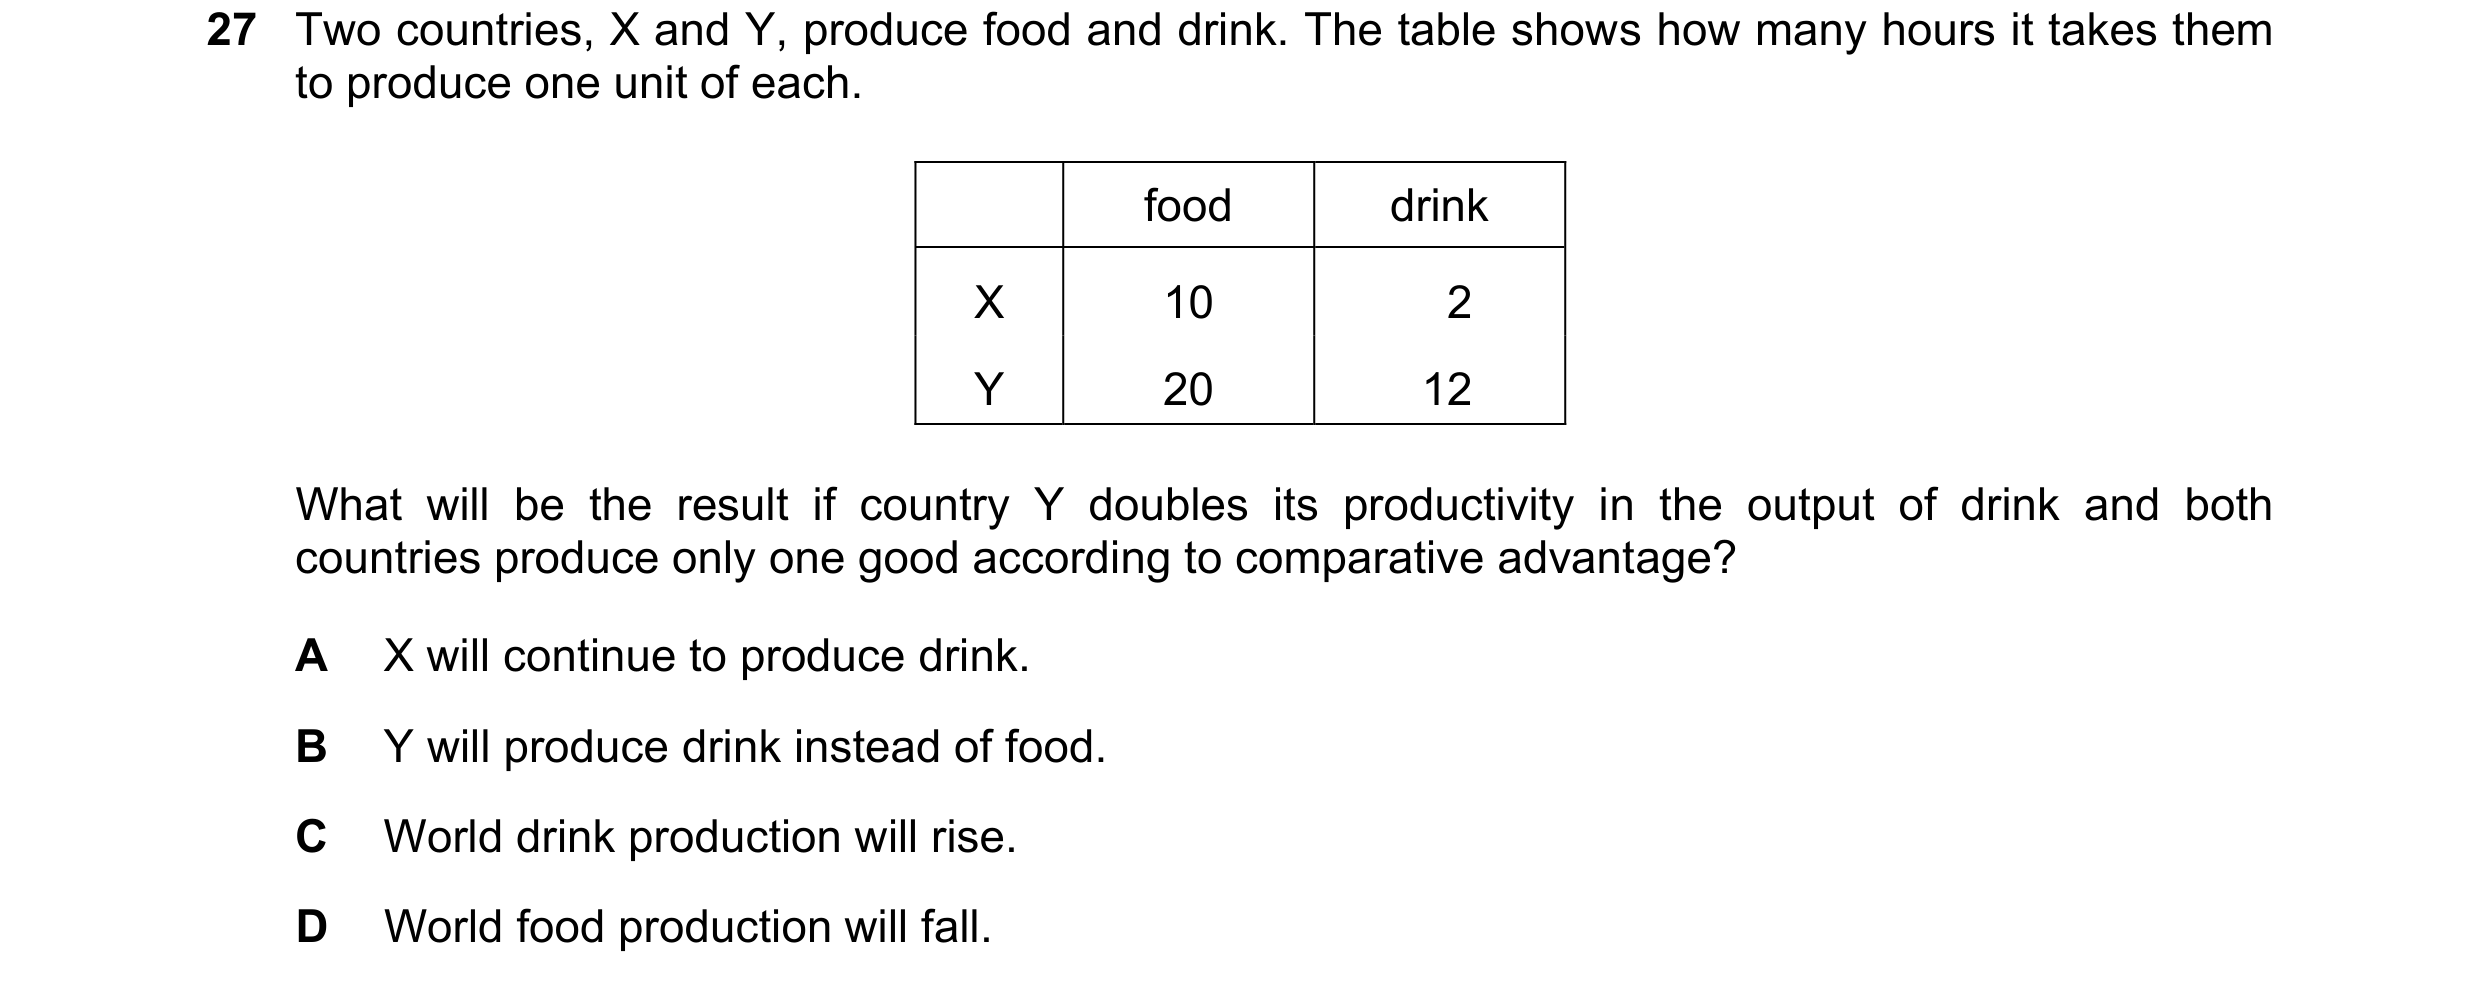
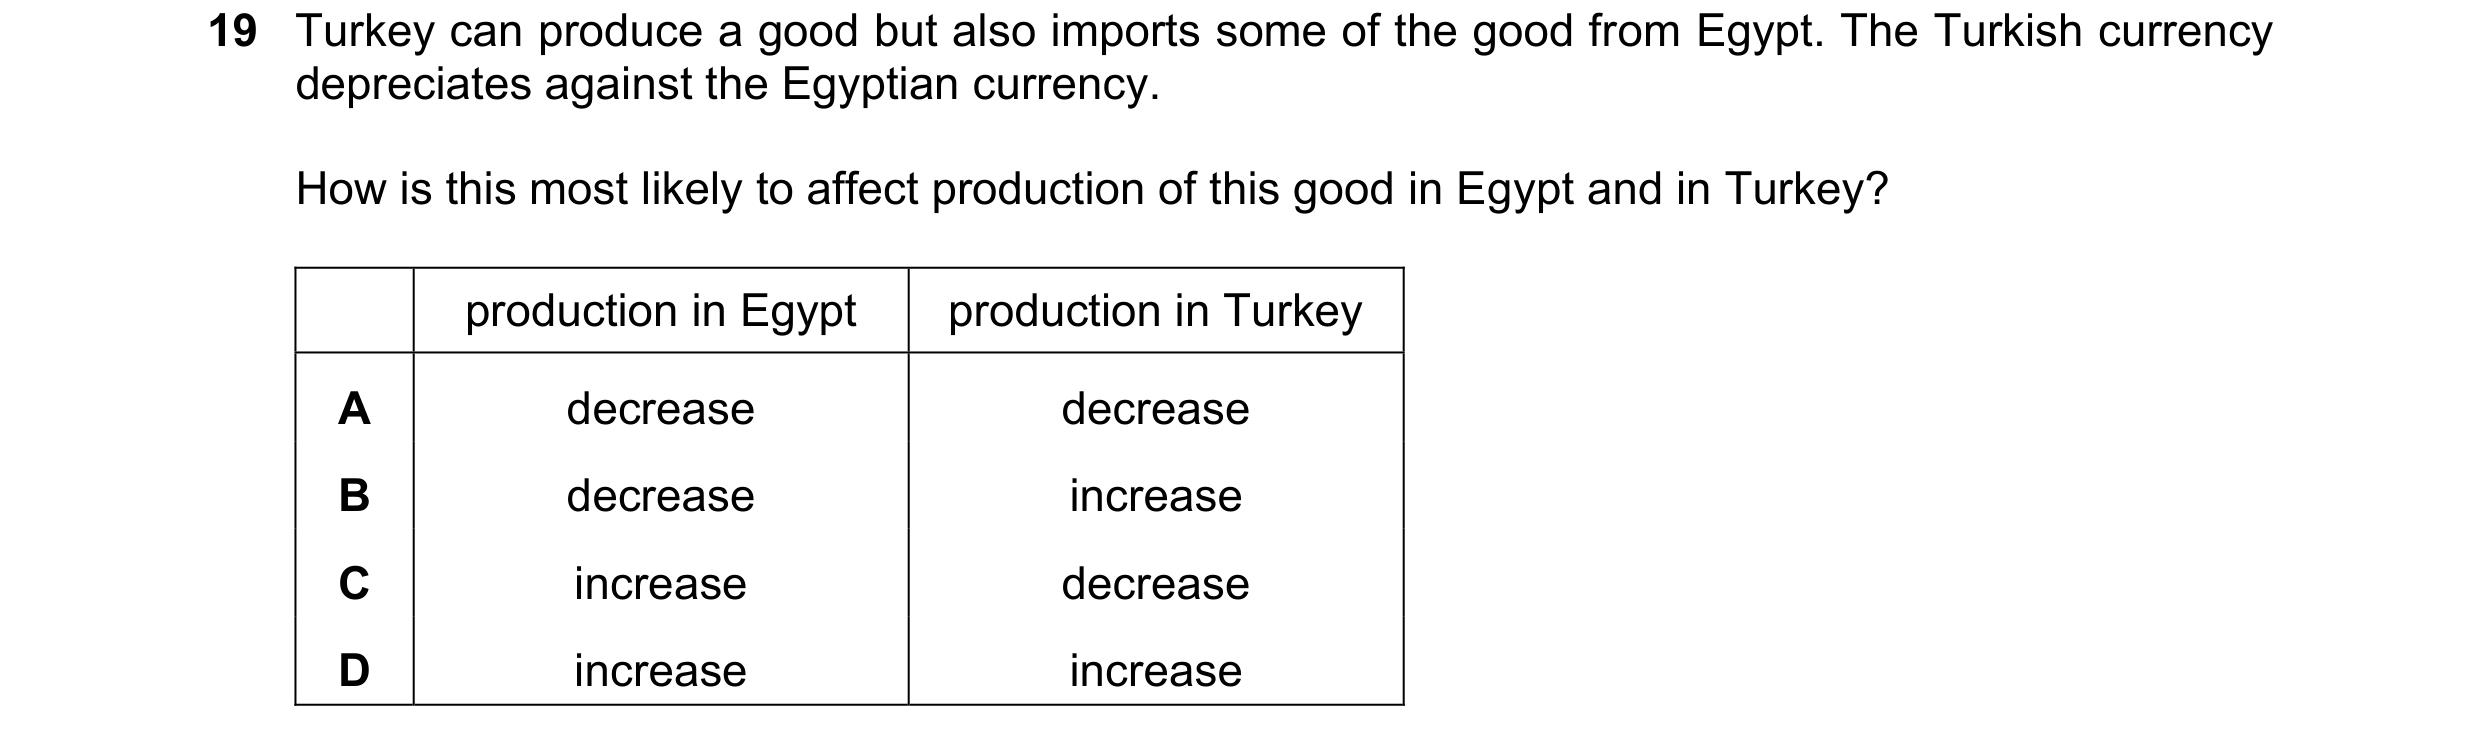 48 / 59

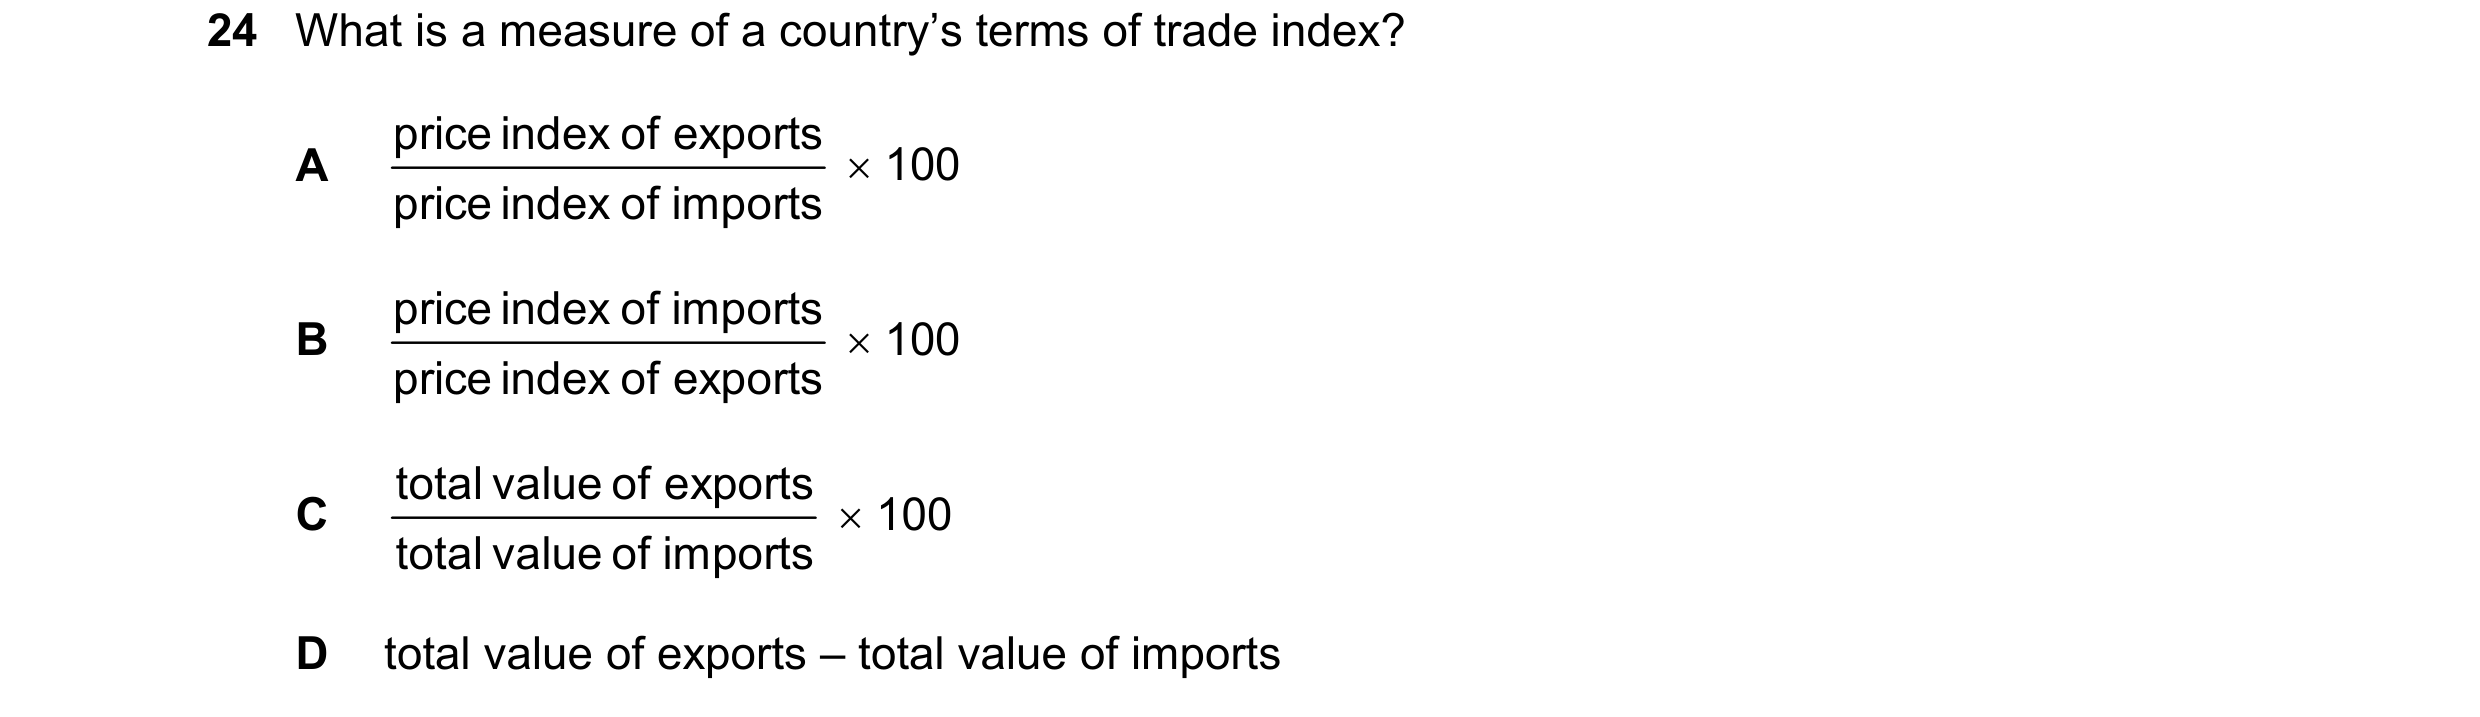 49 / 59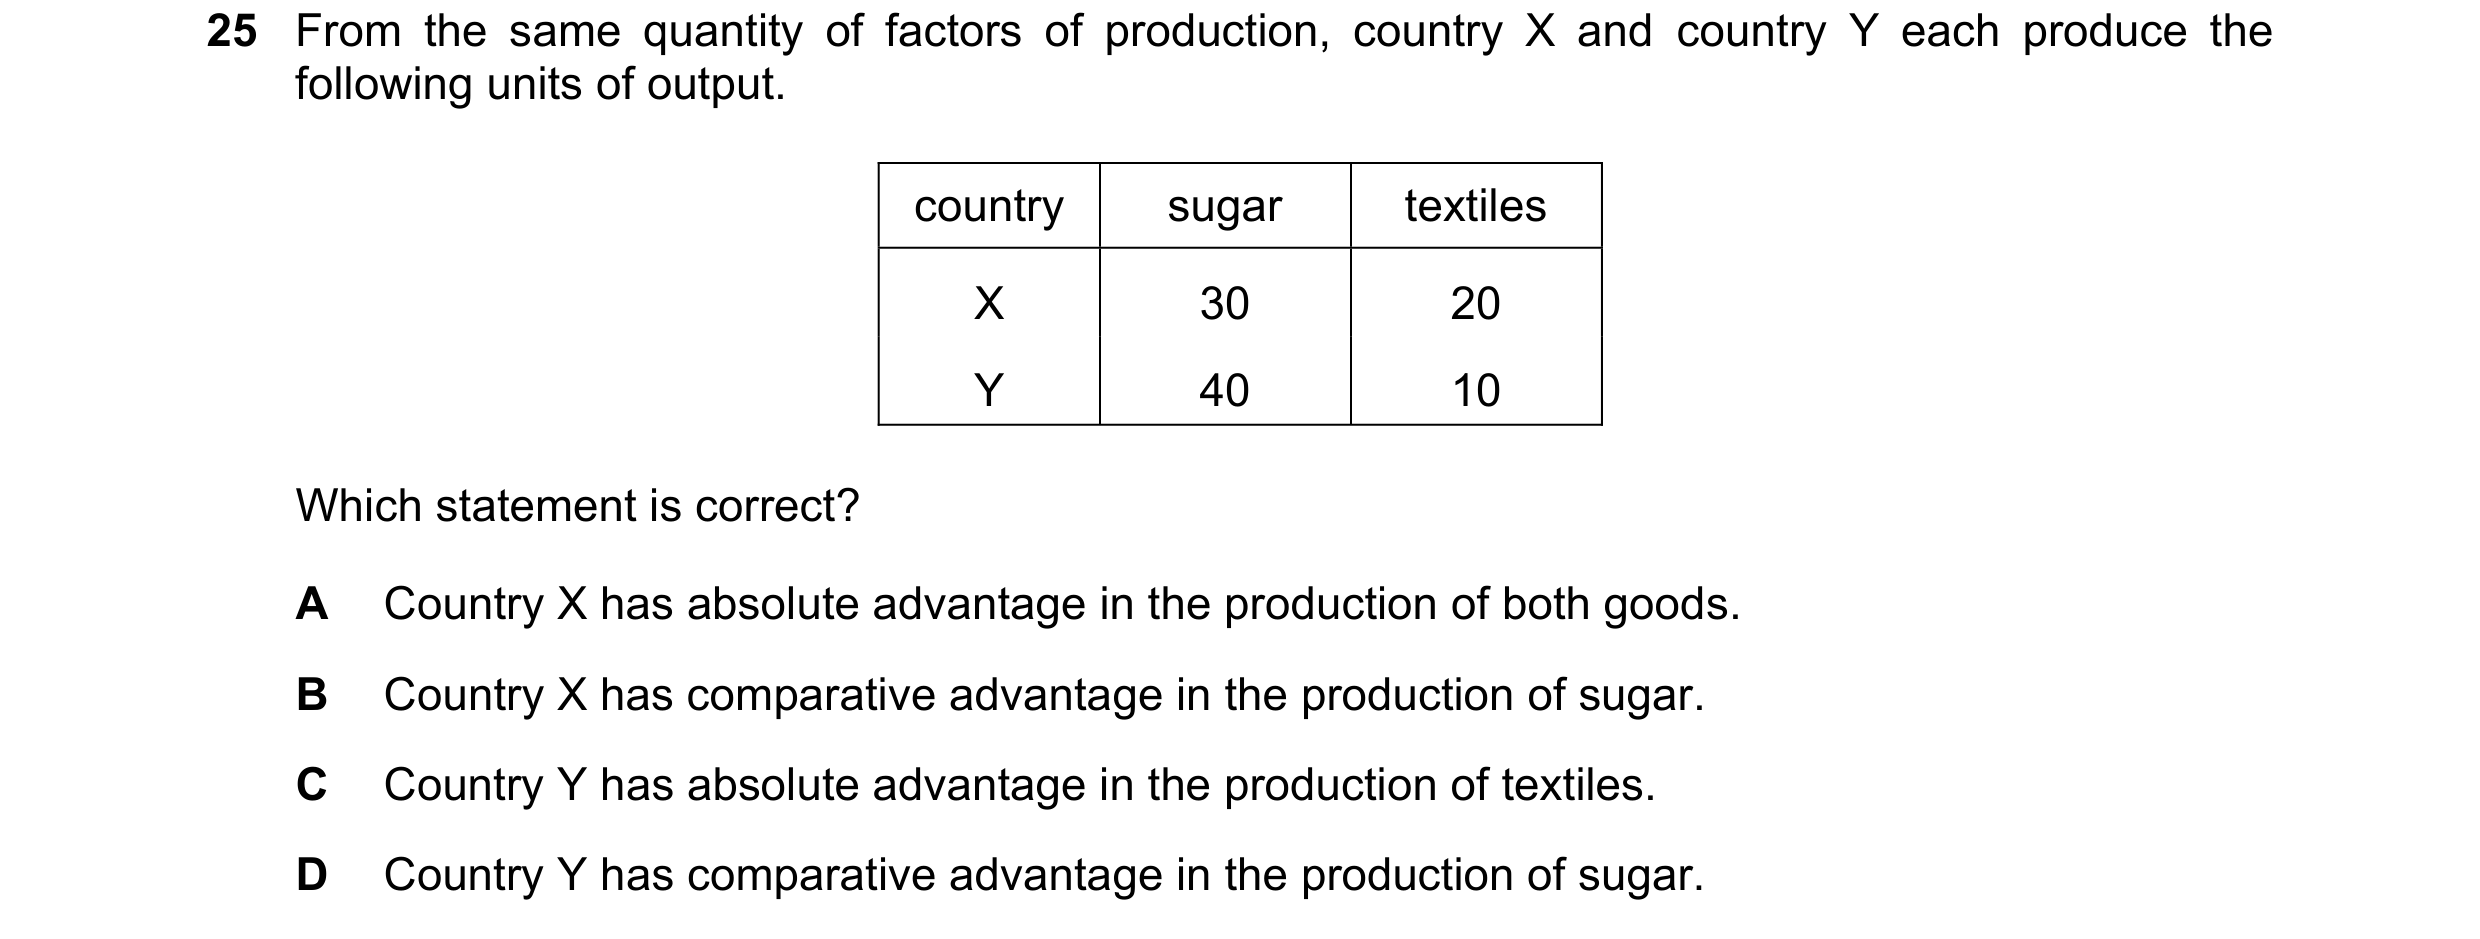

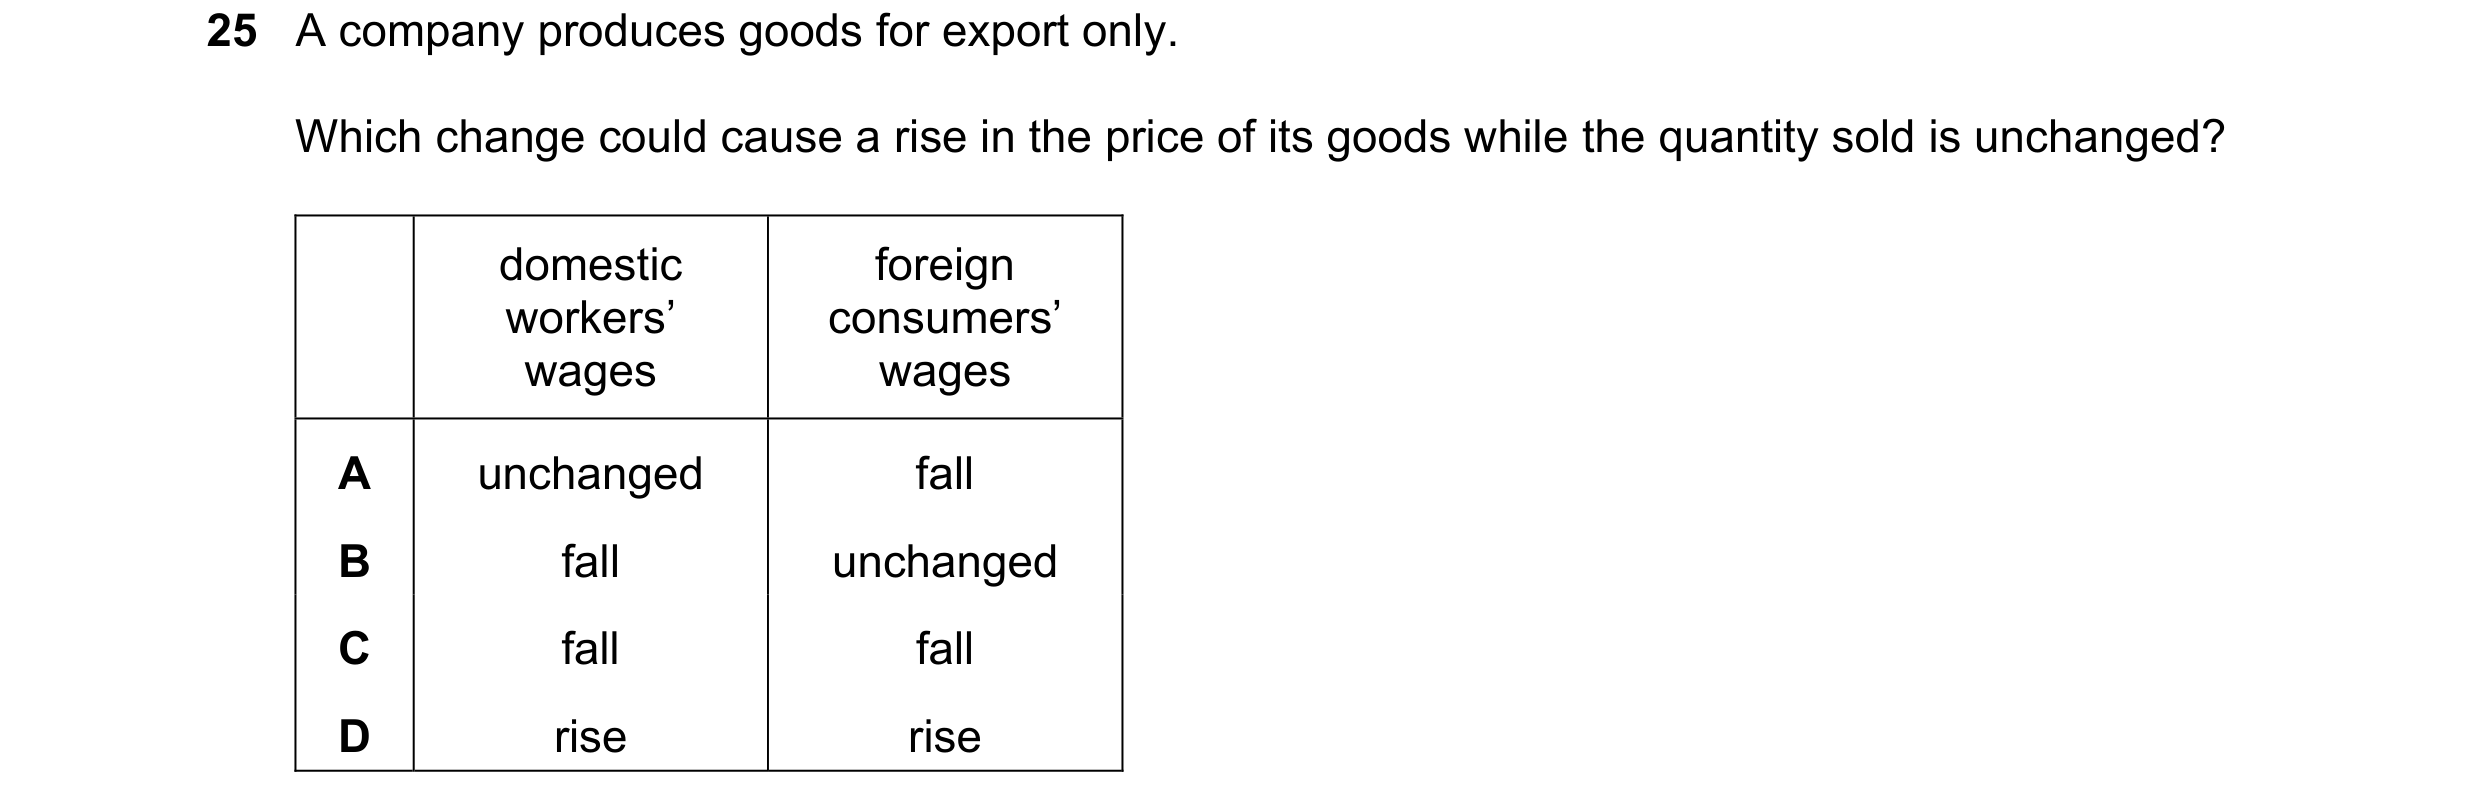
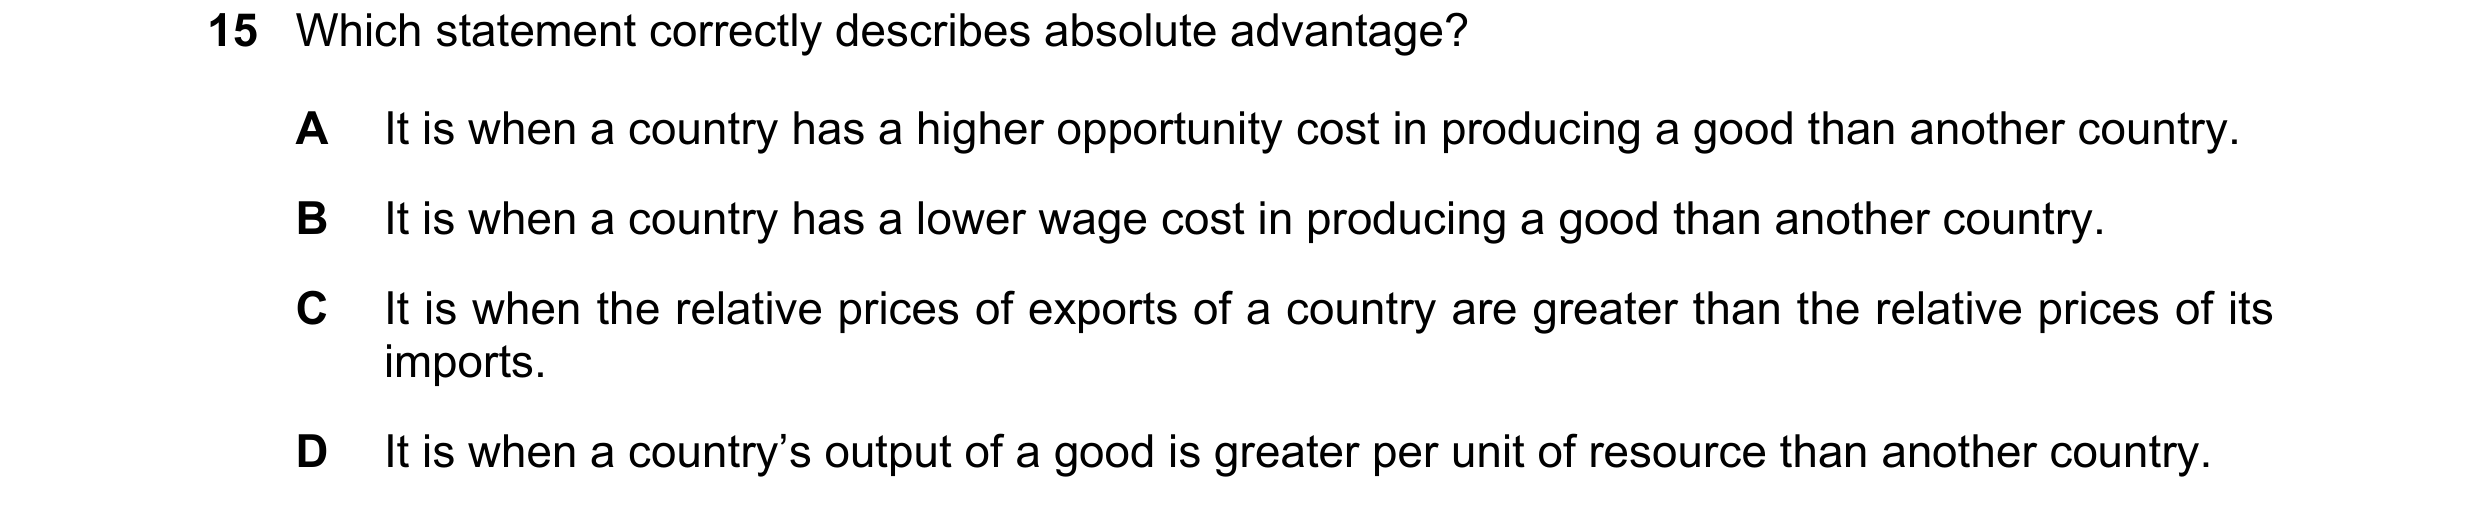 50 / 59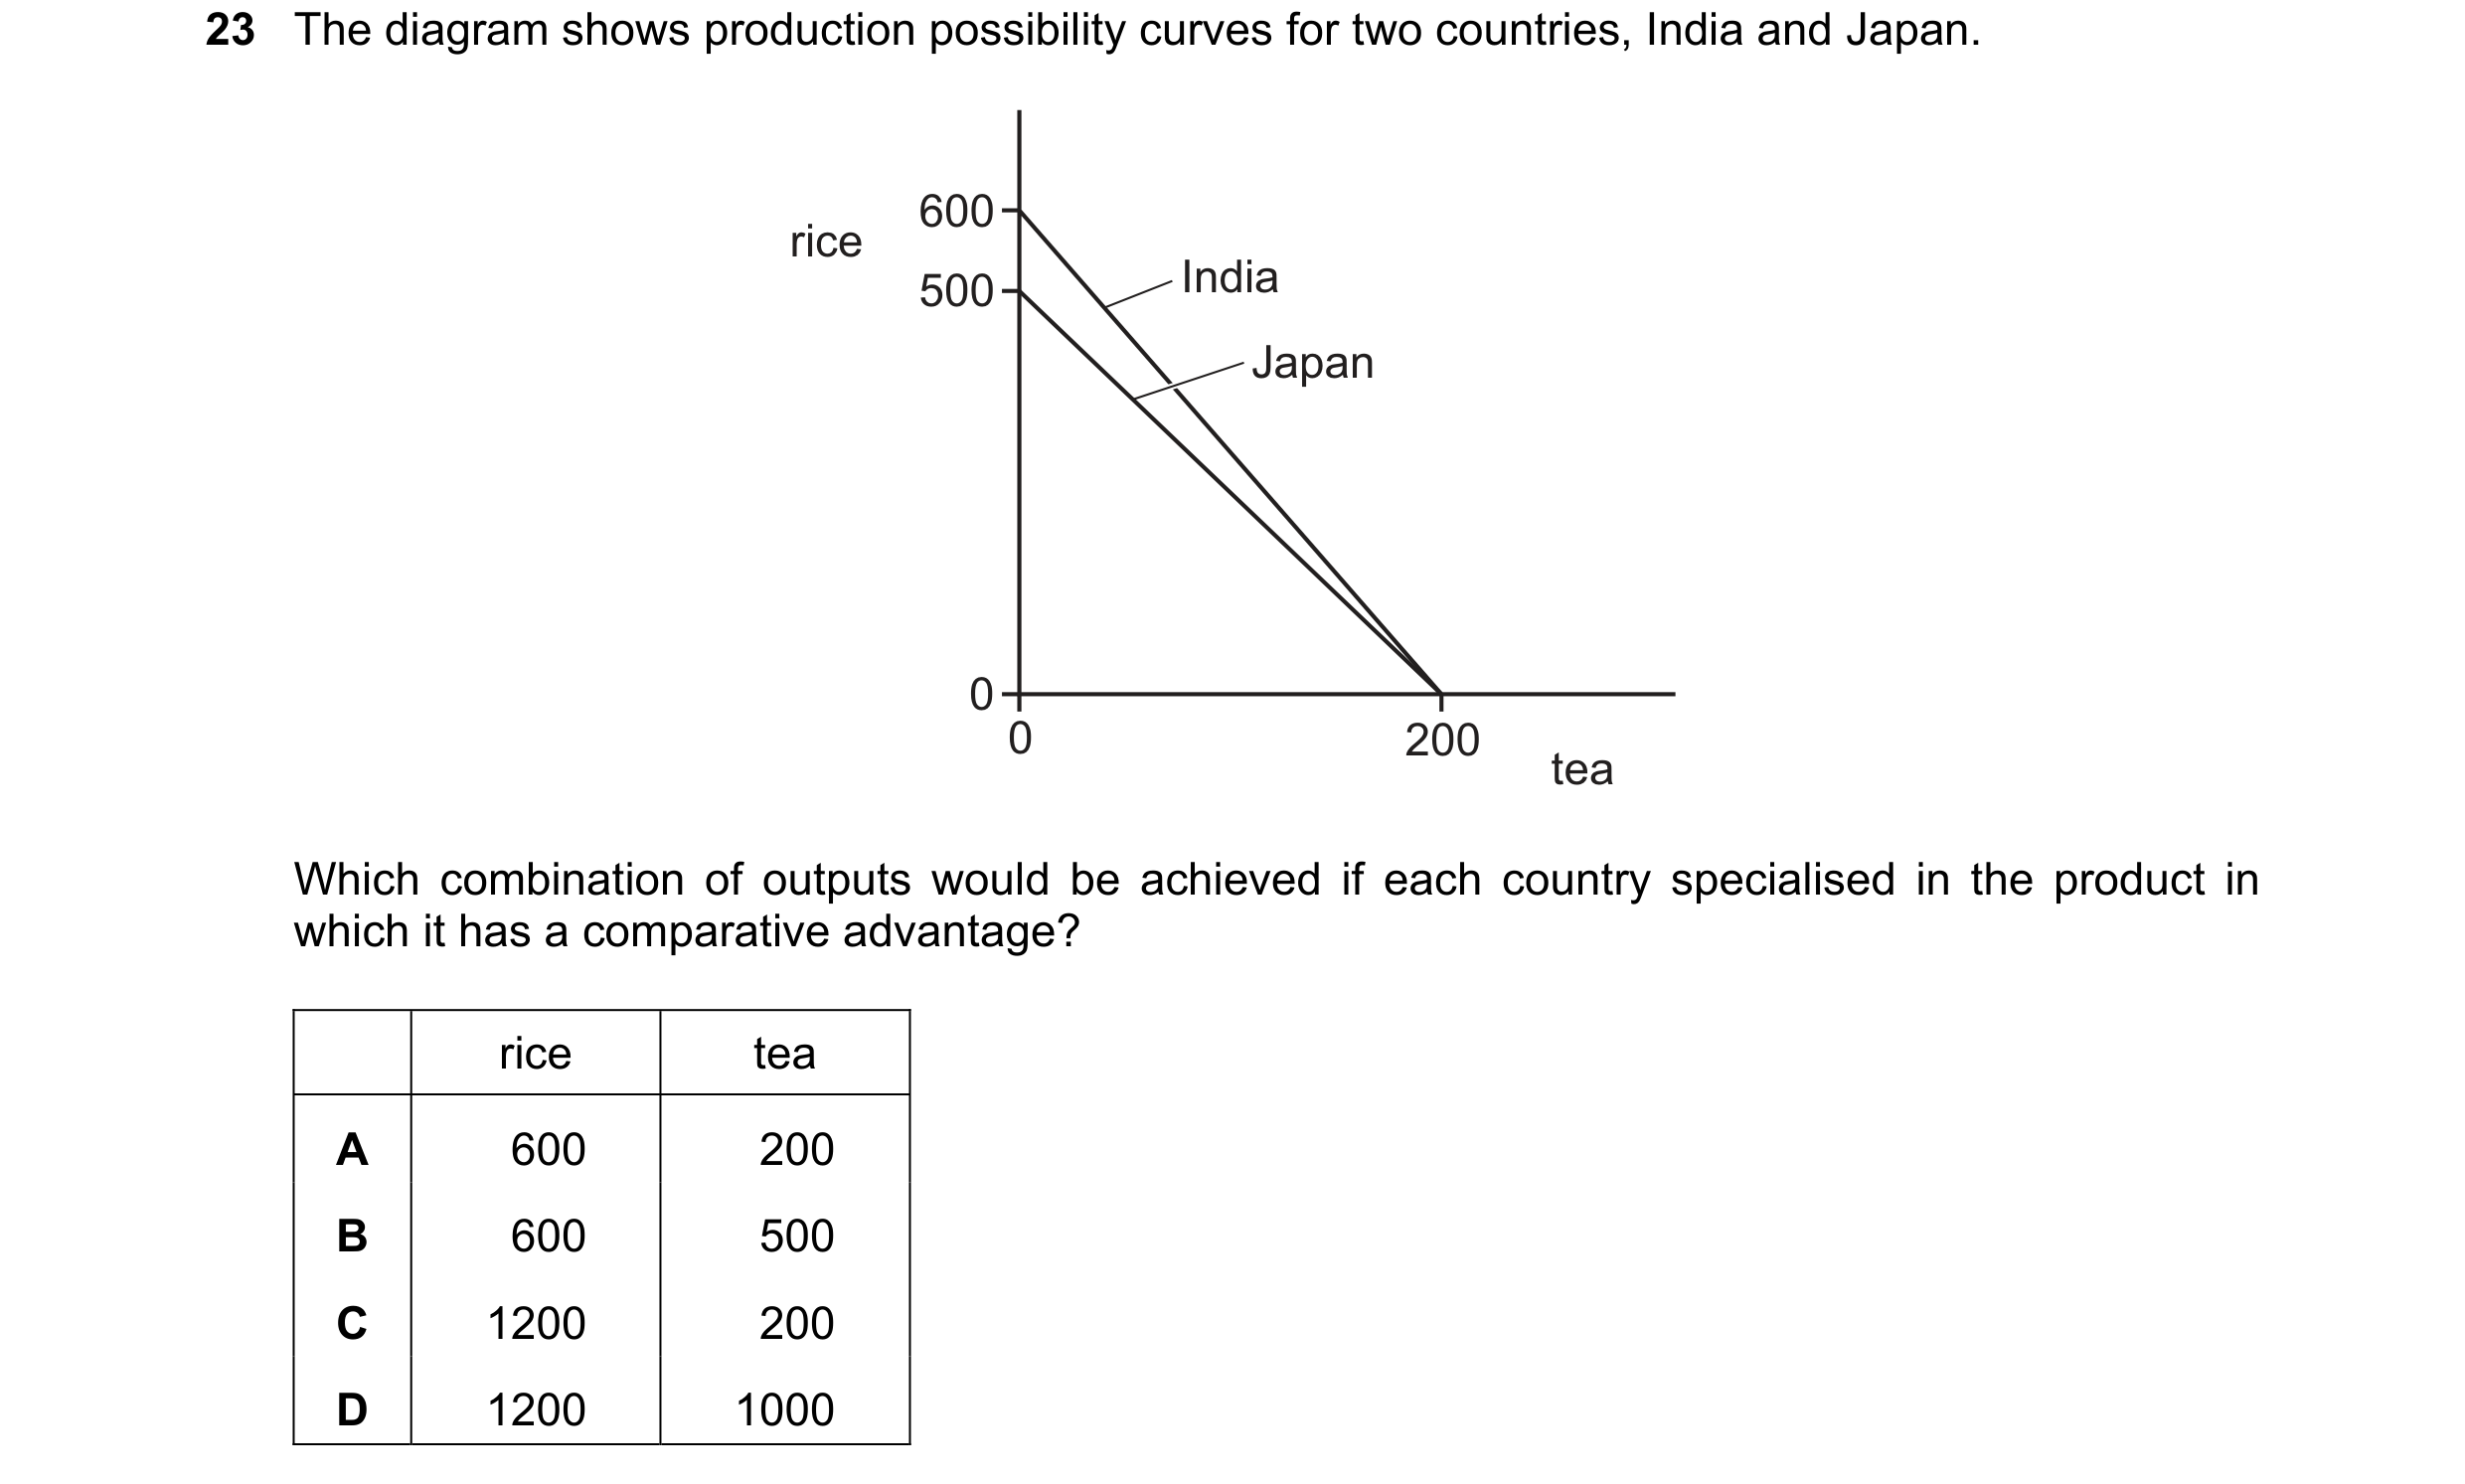
 51 / 59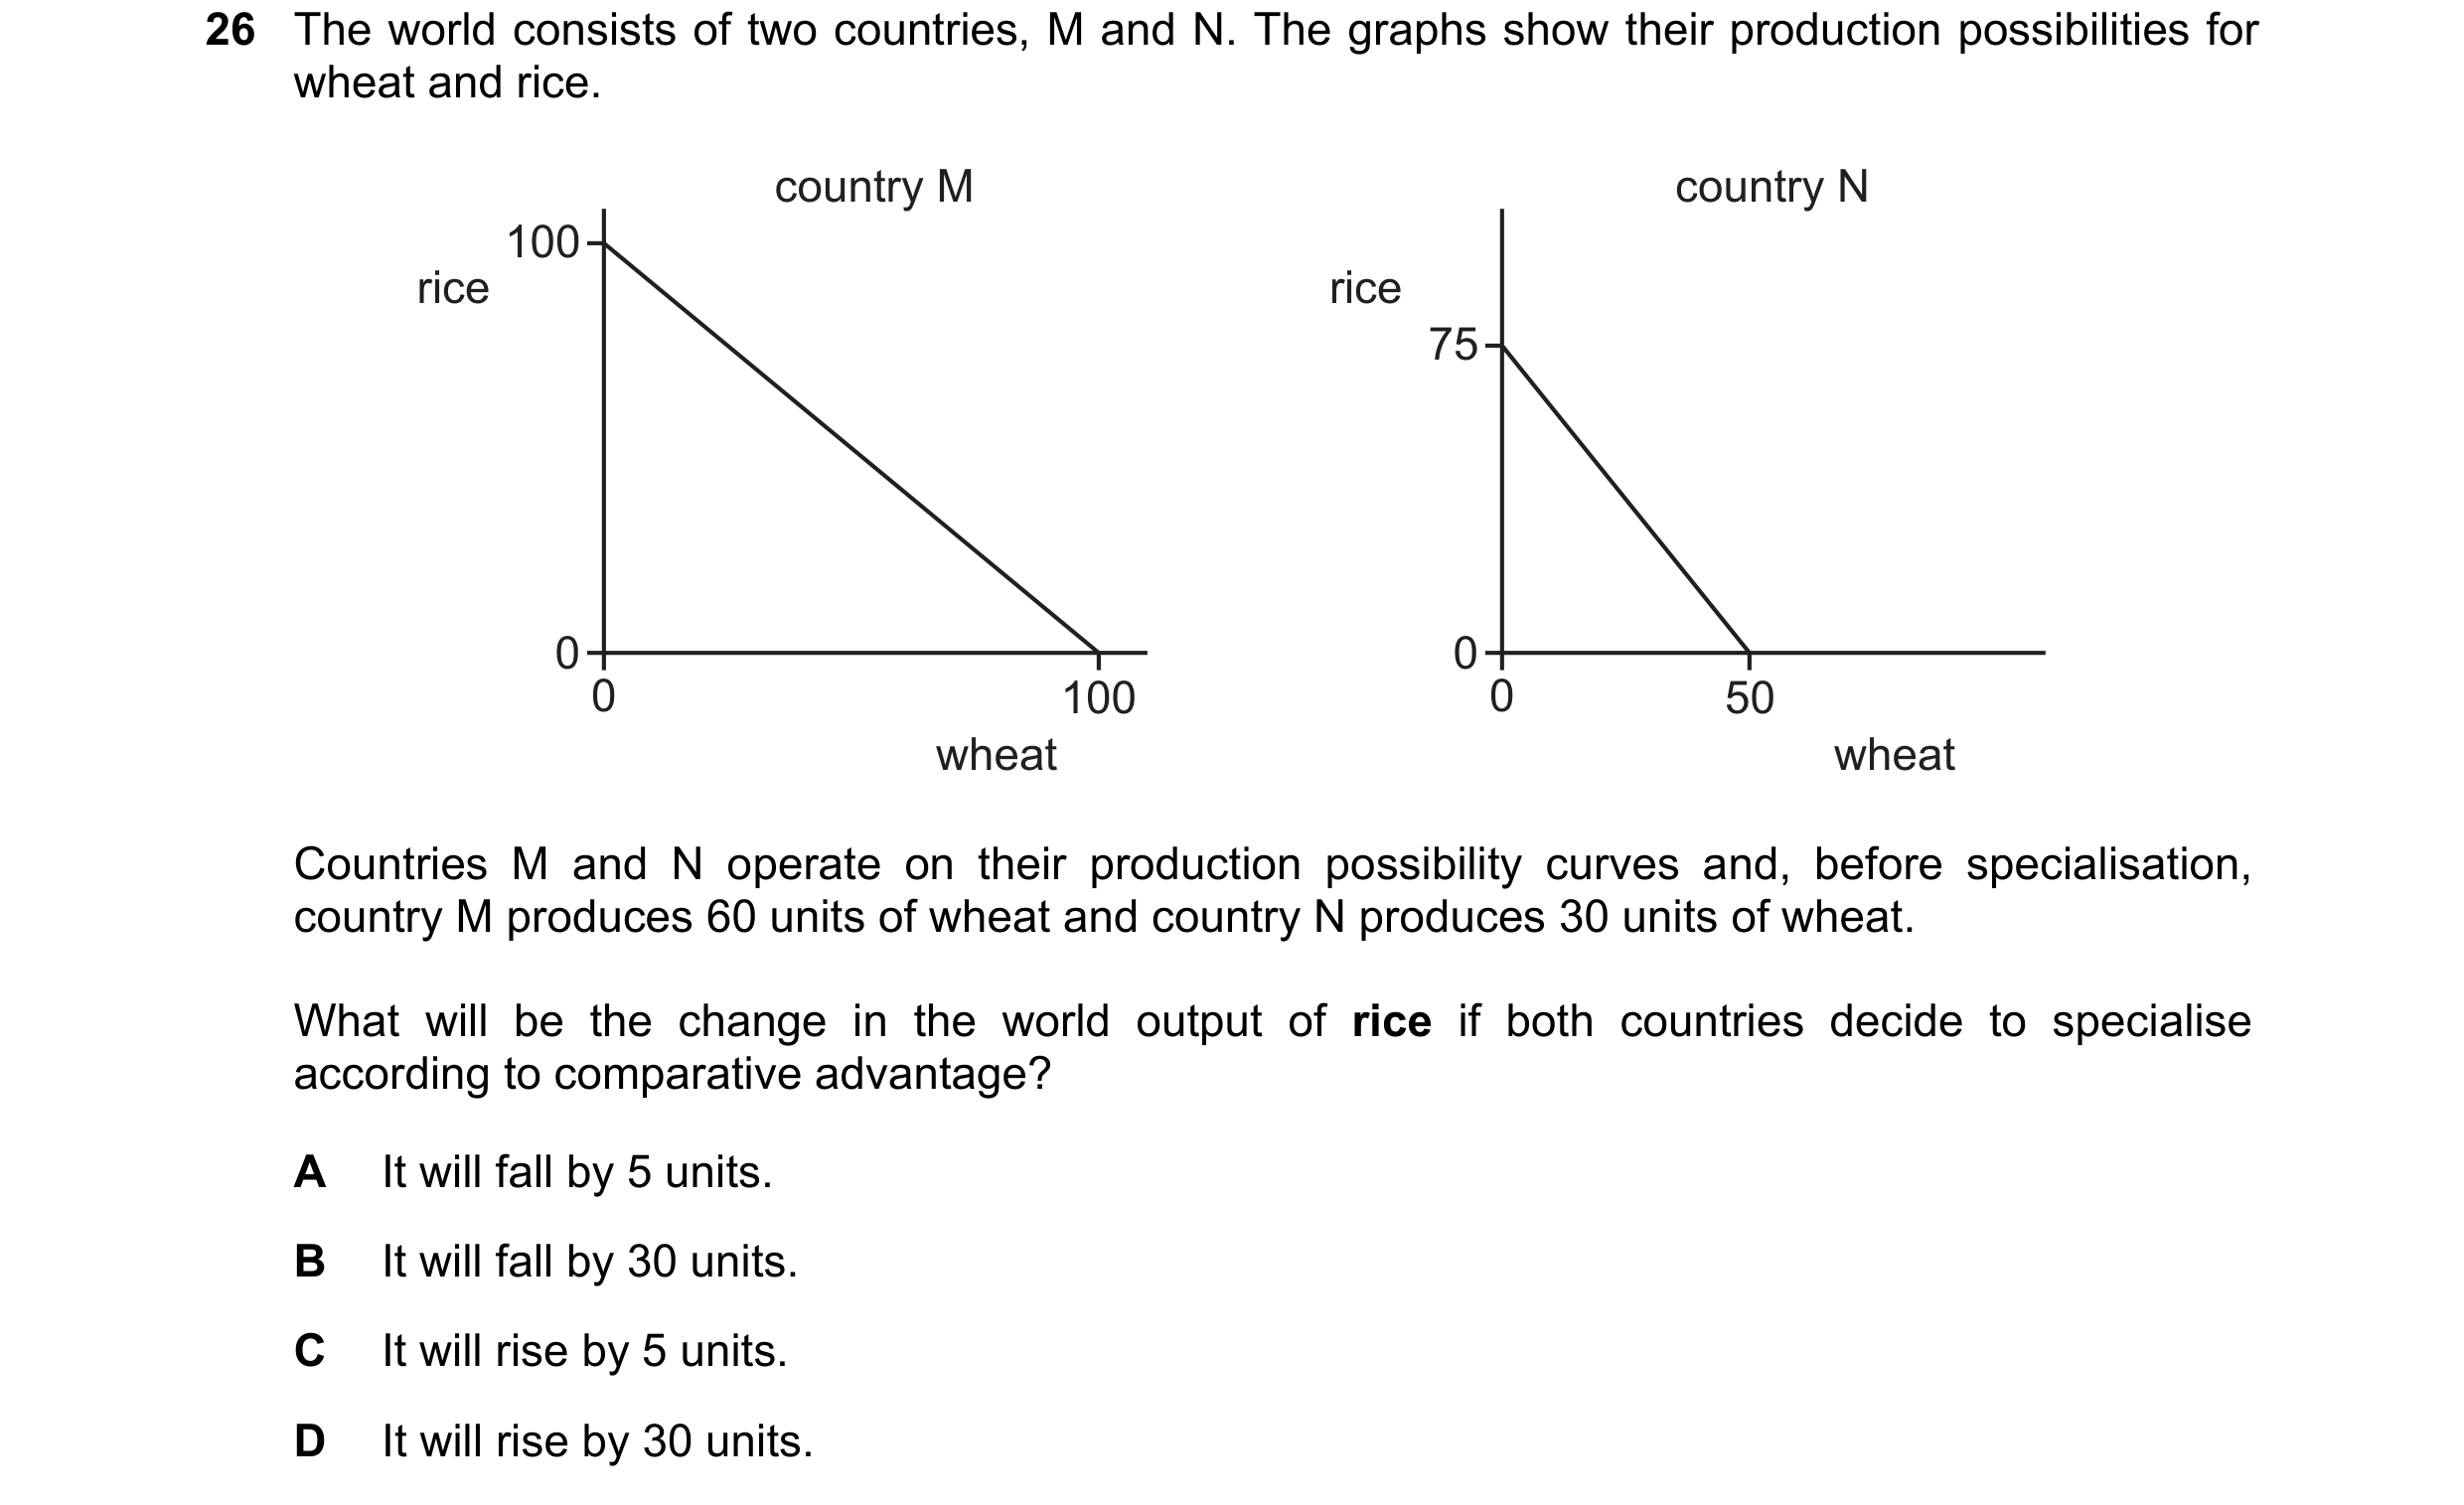
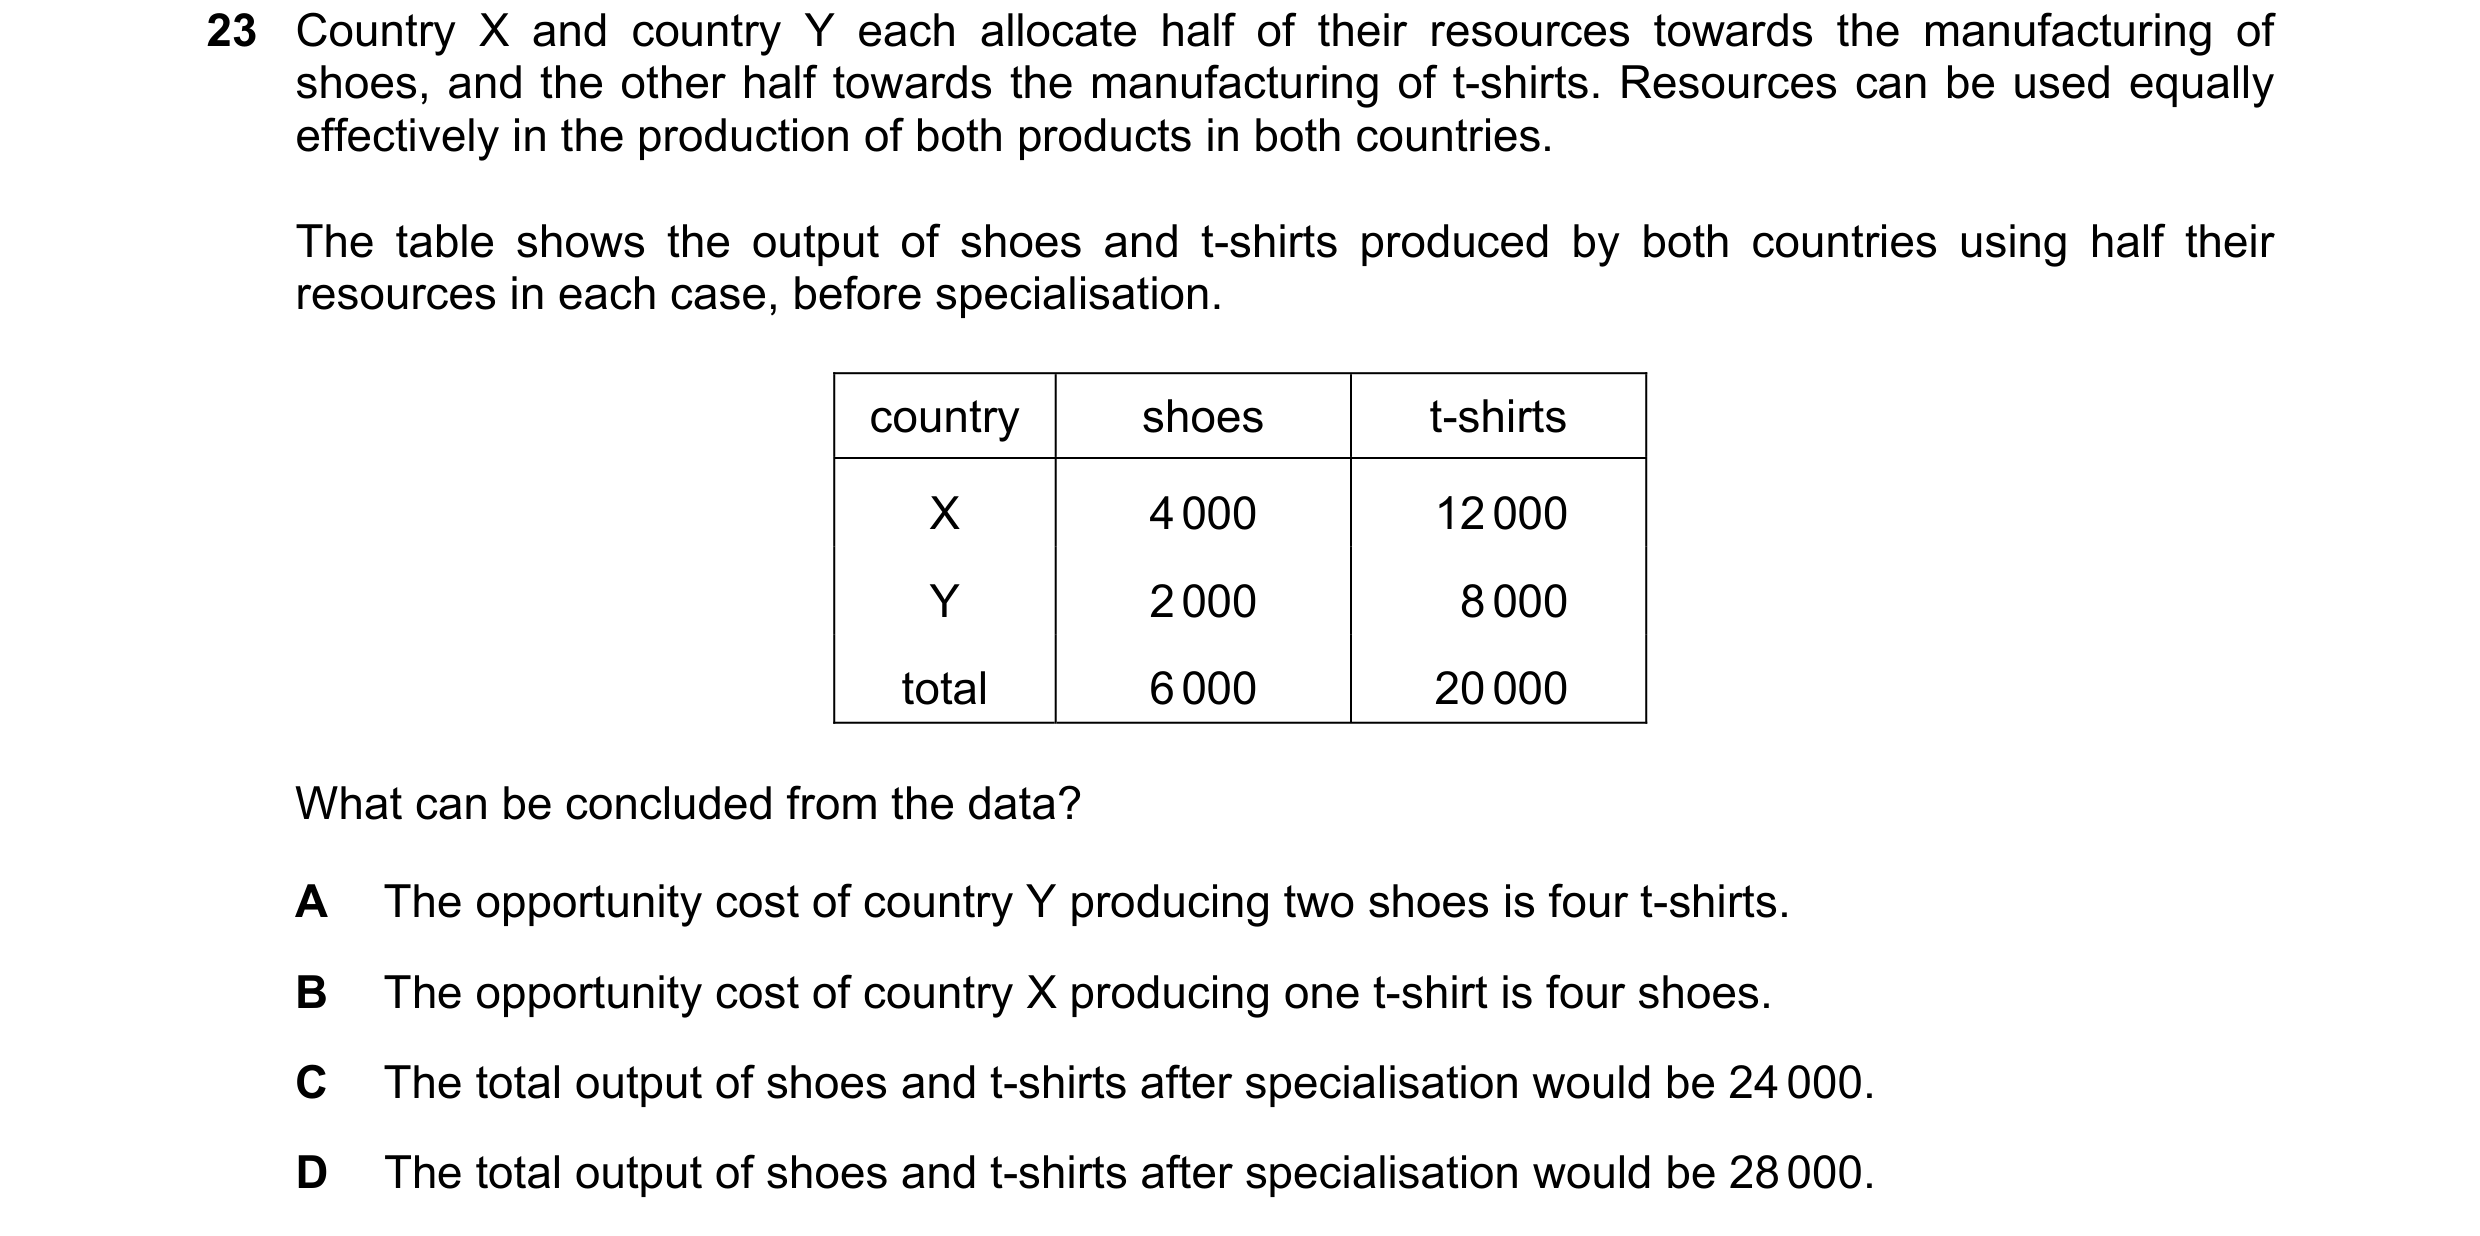 52 / 59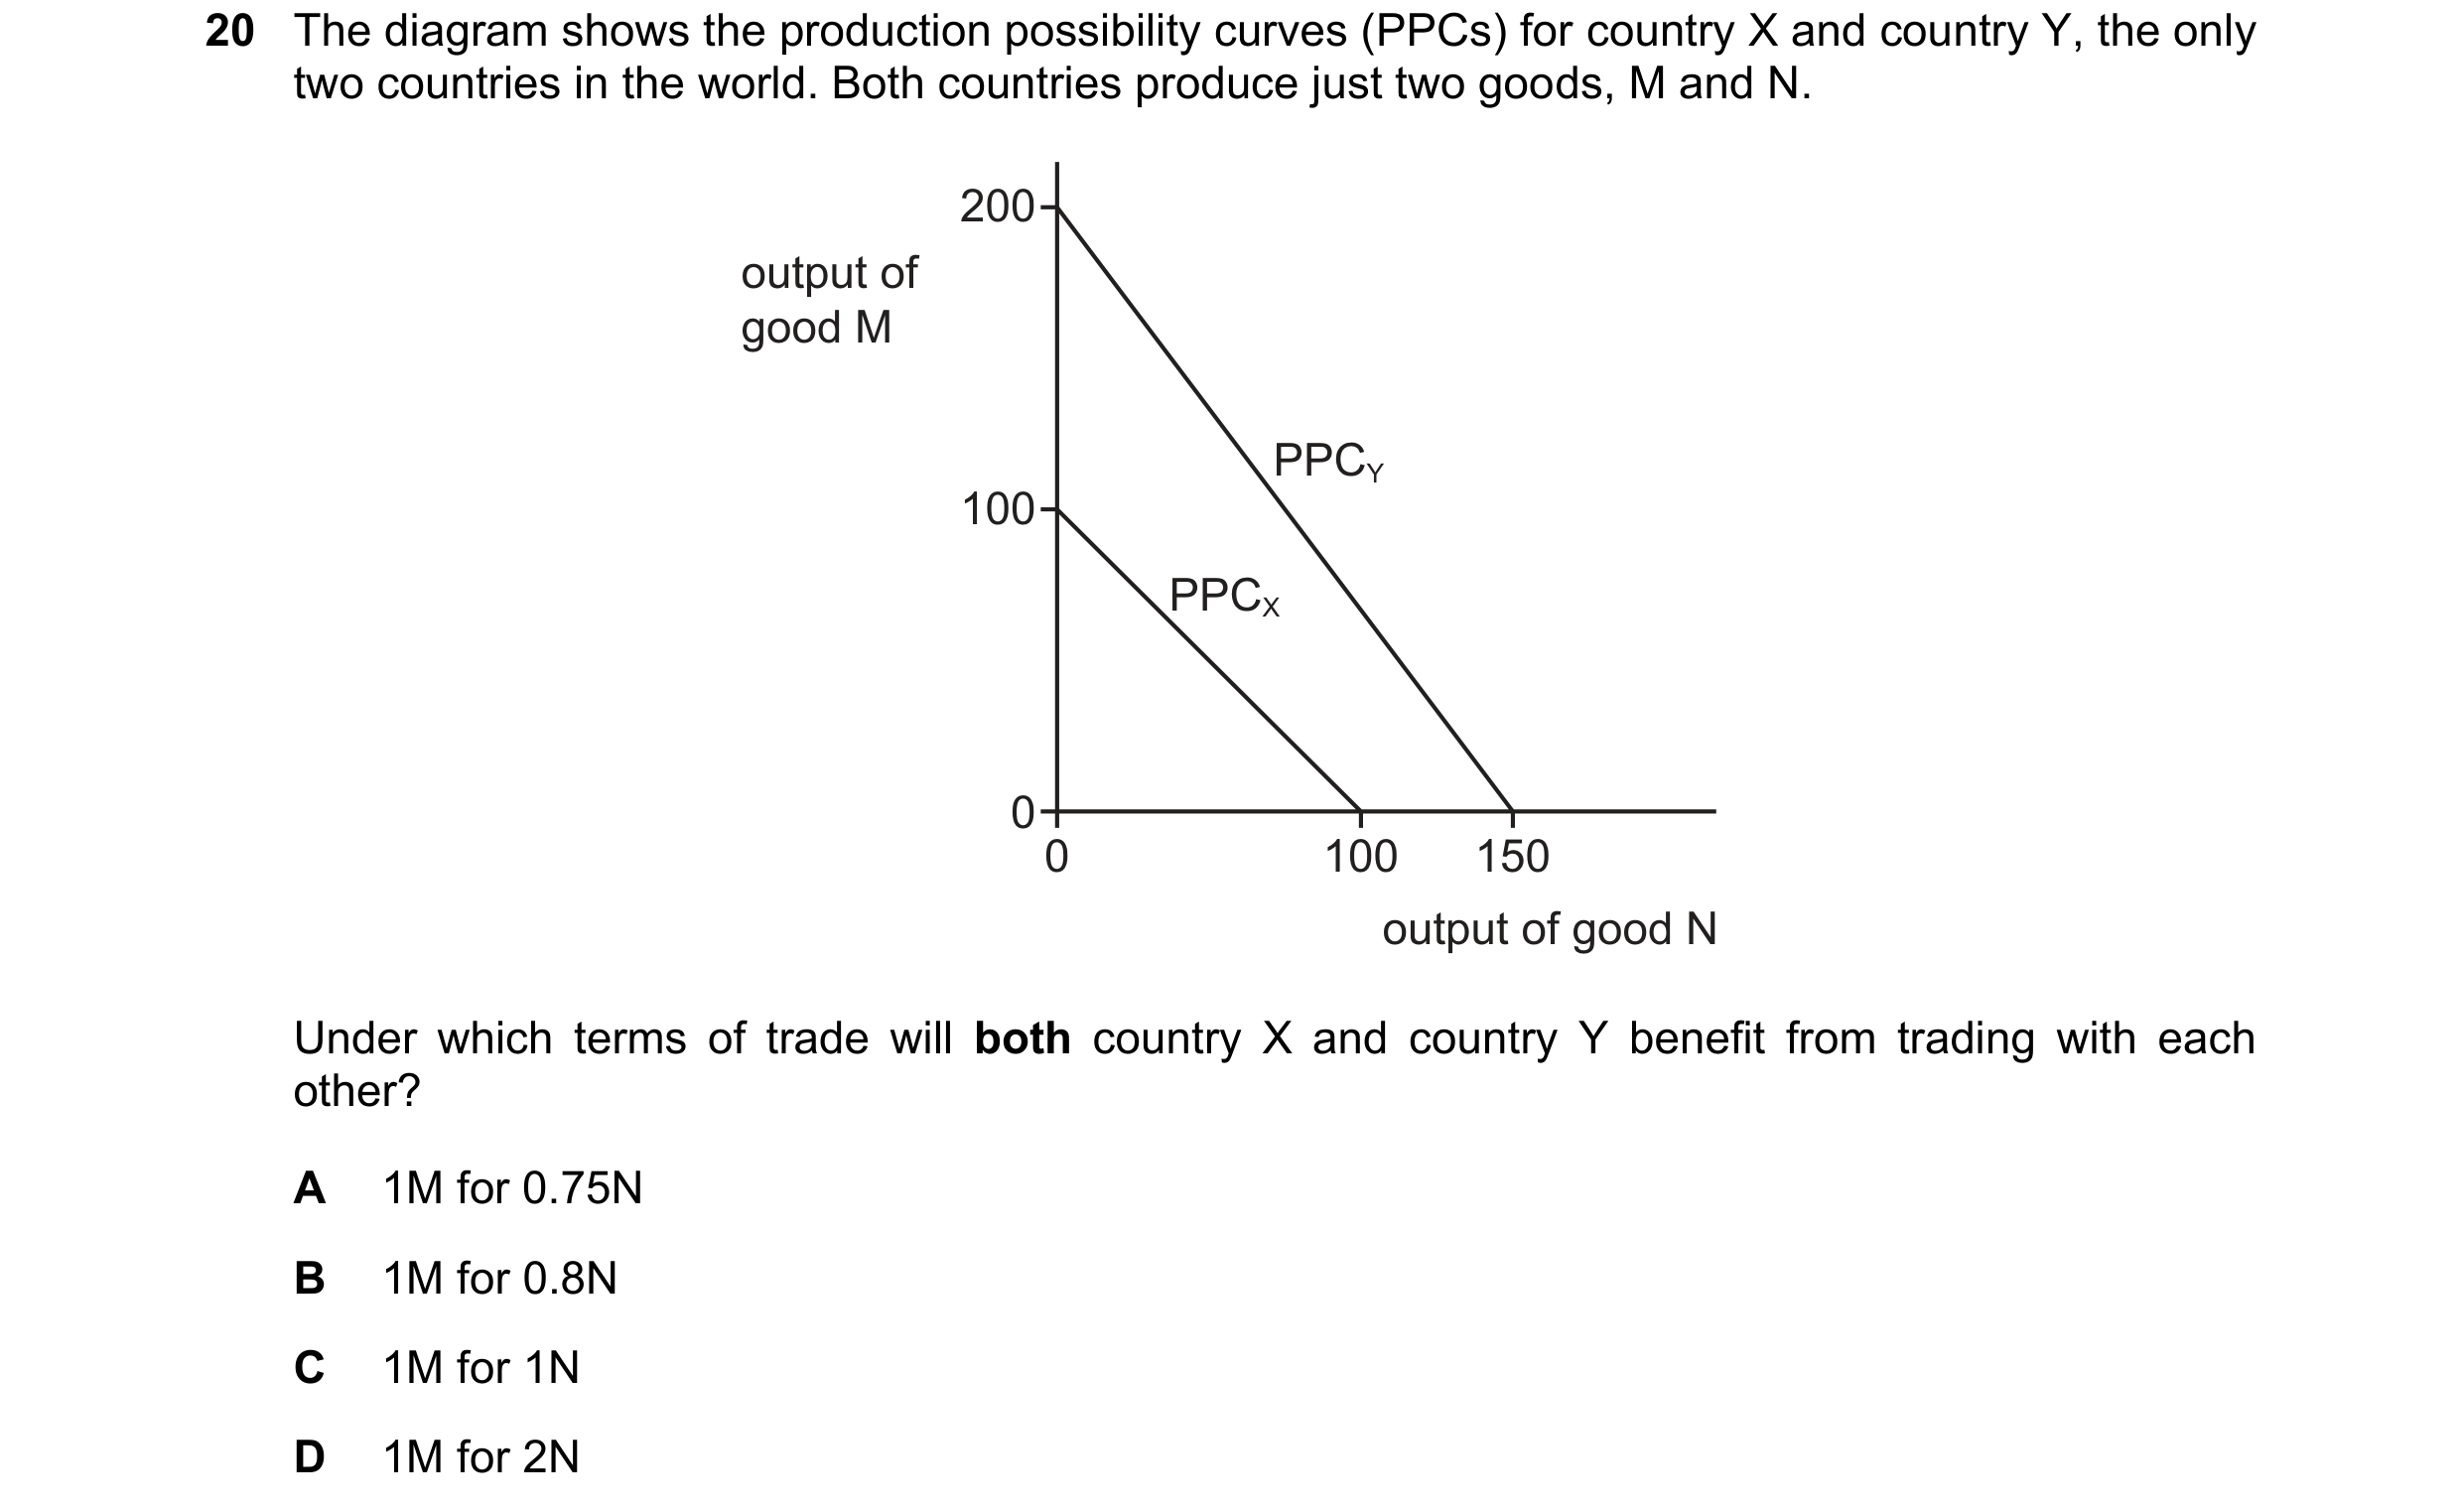

 53 / 59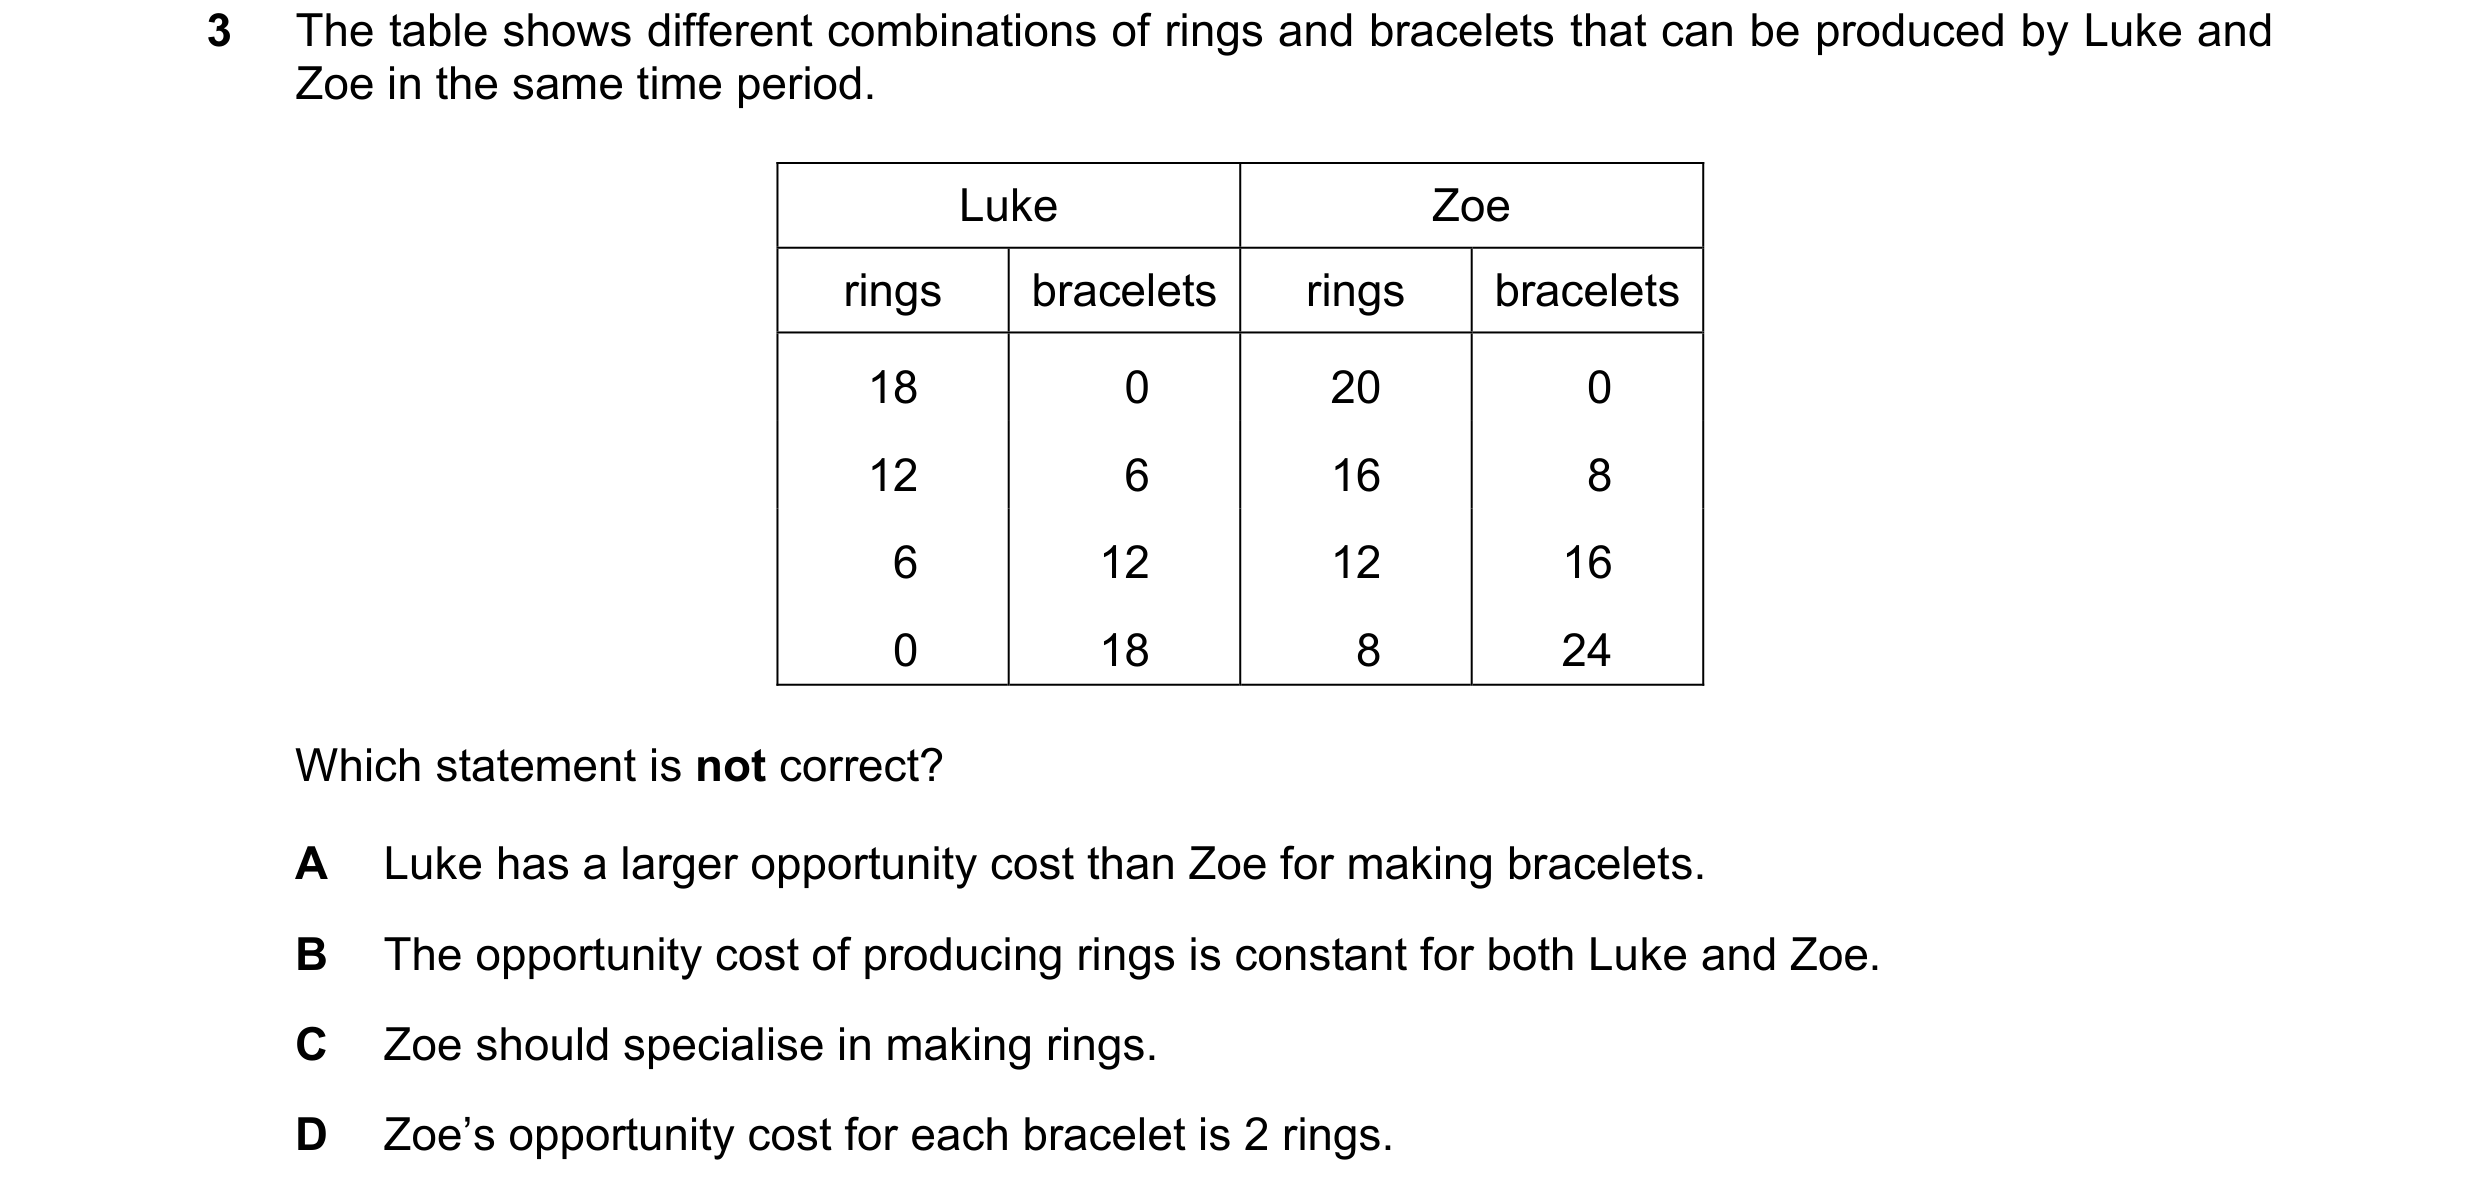
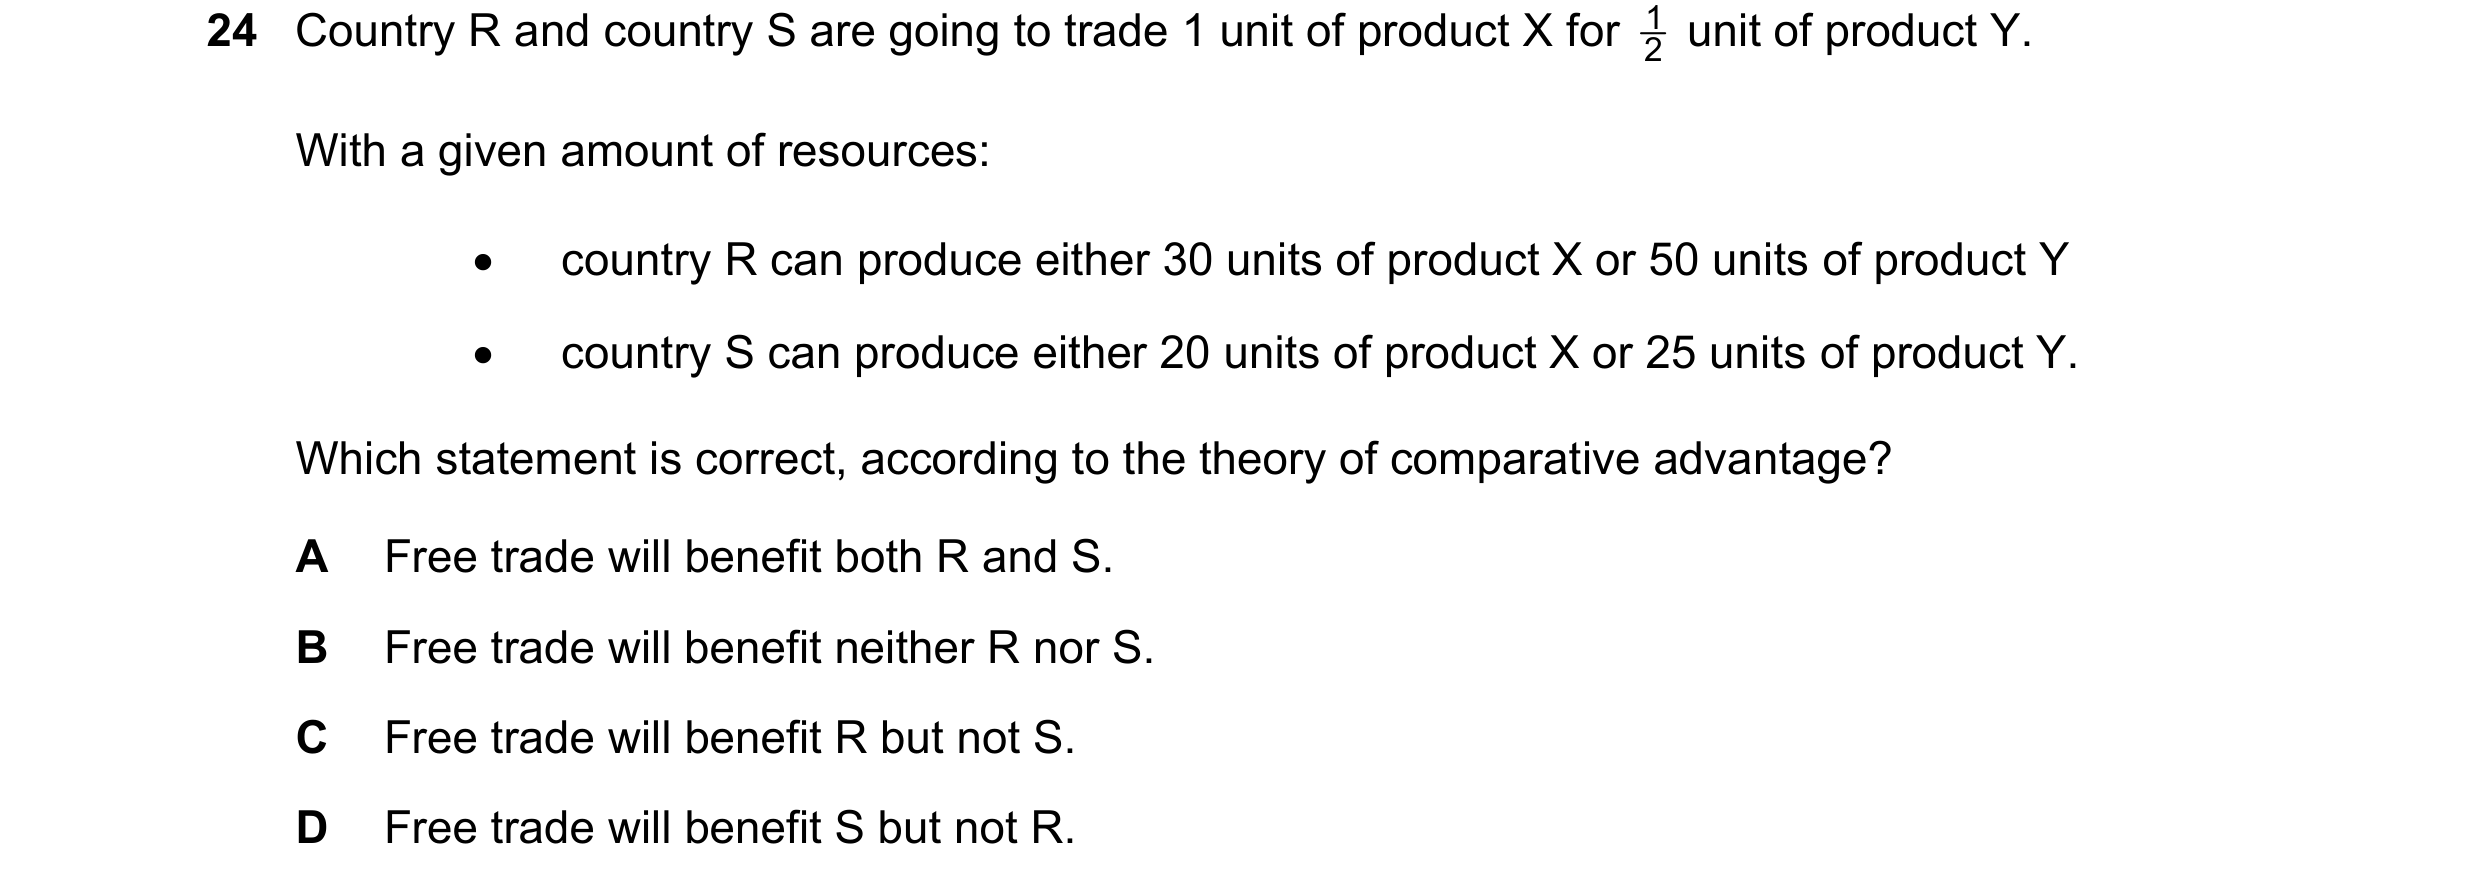
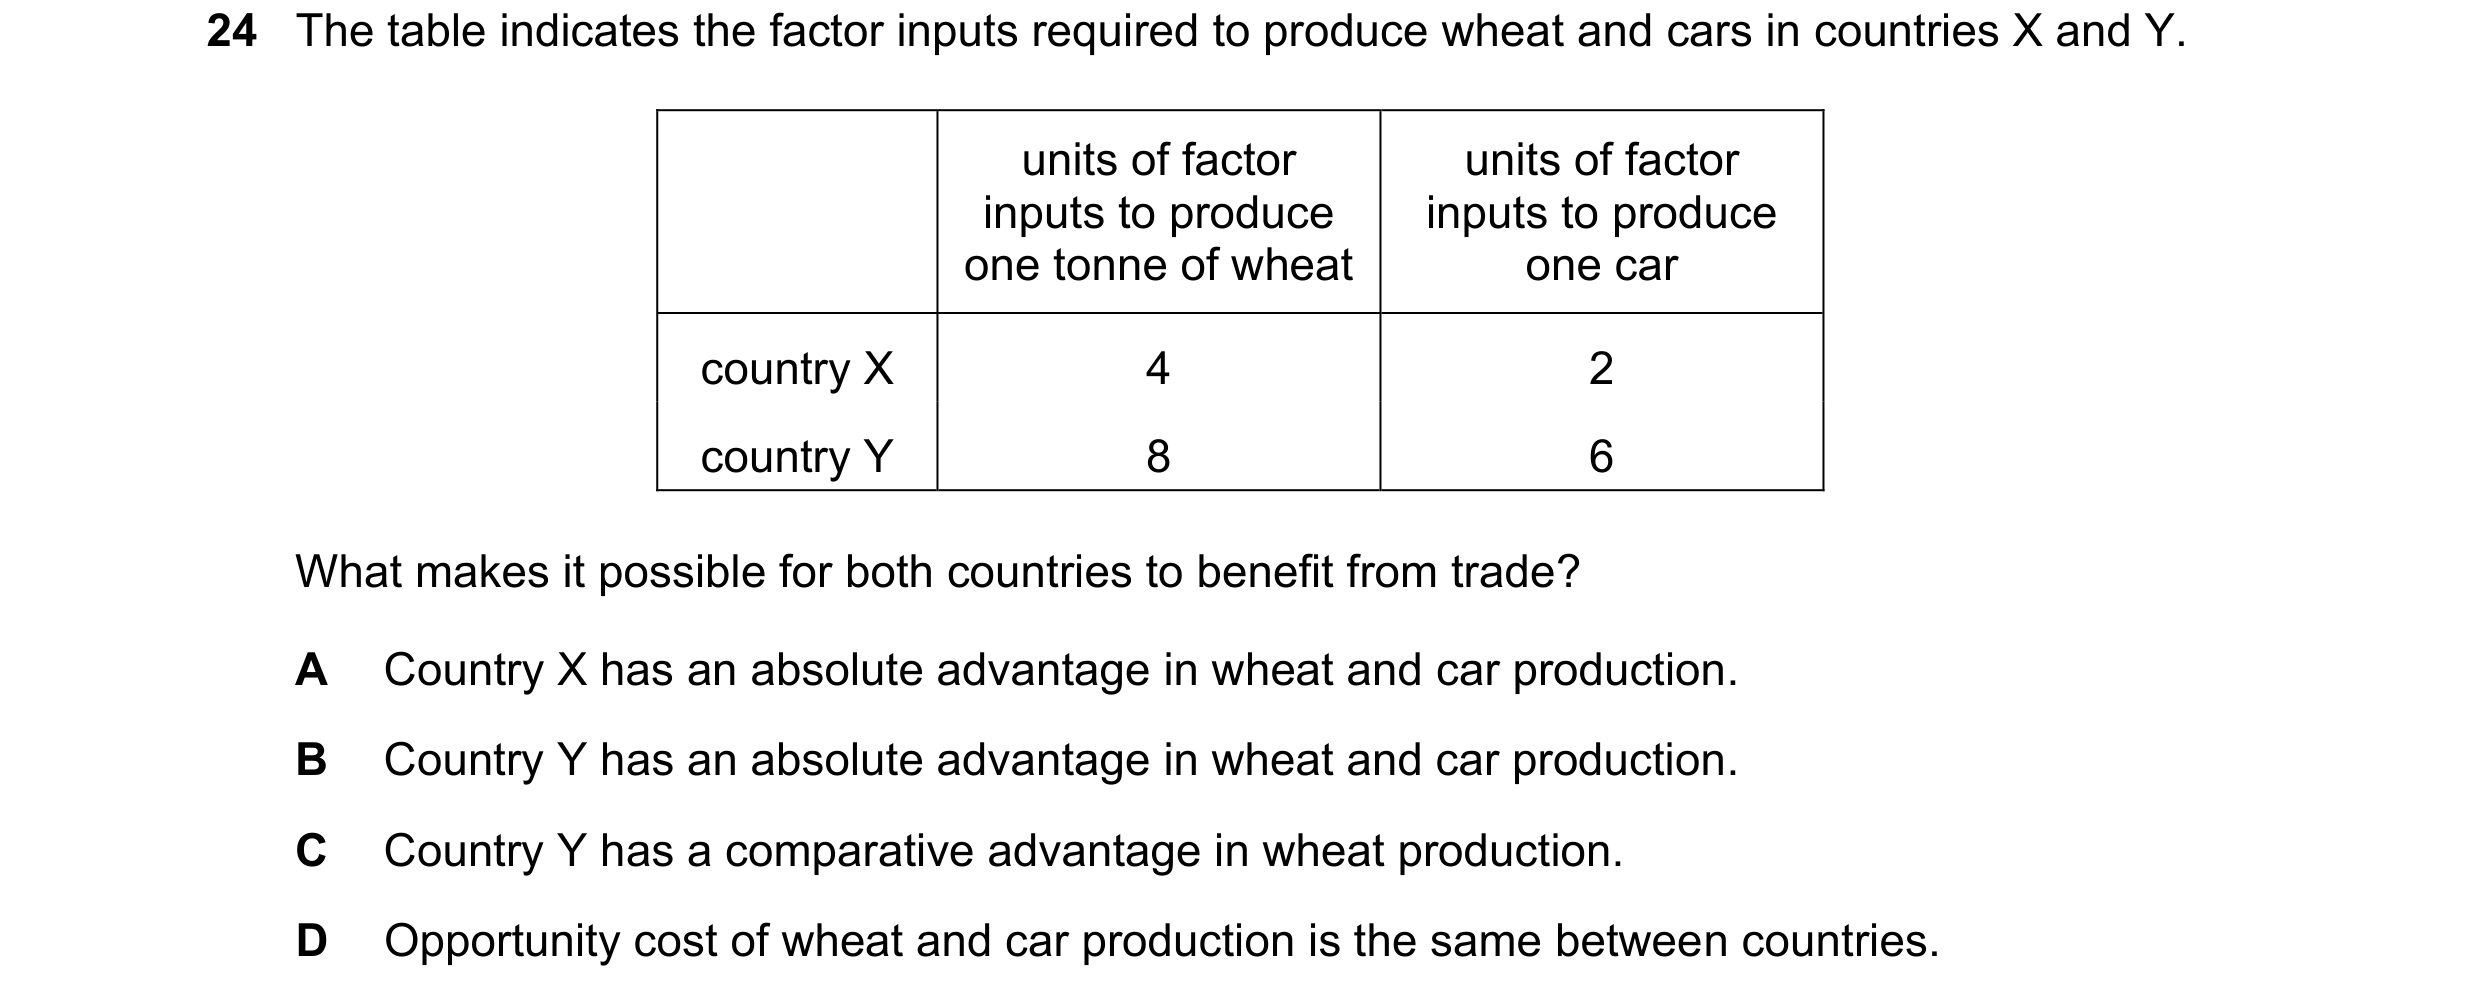 54 / 59
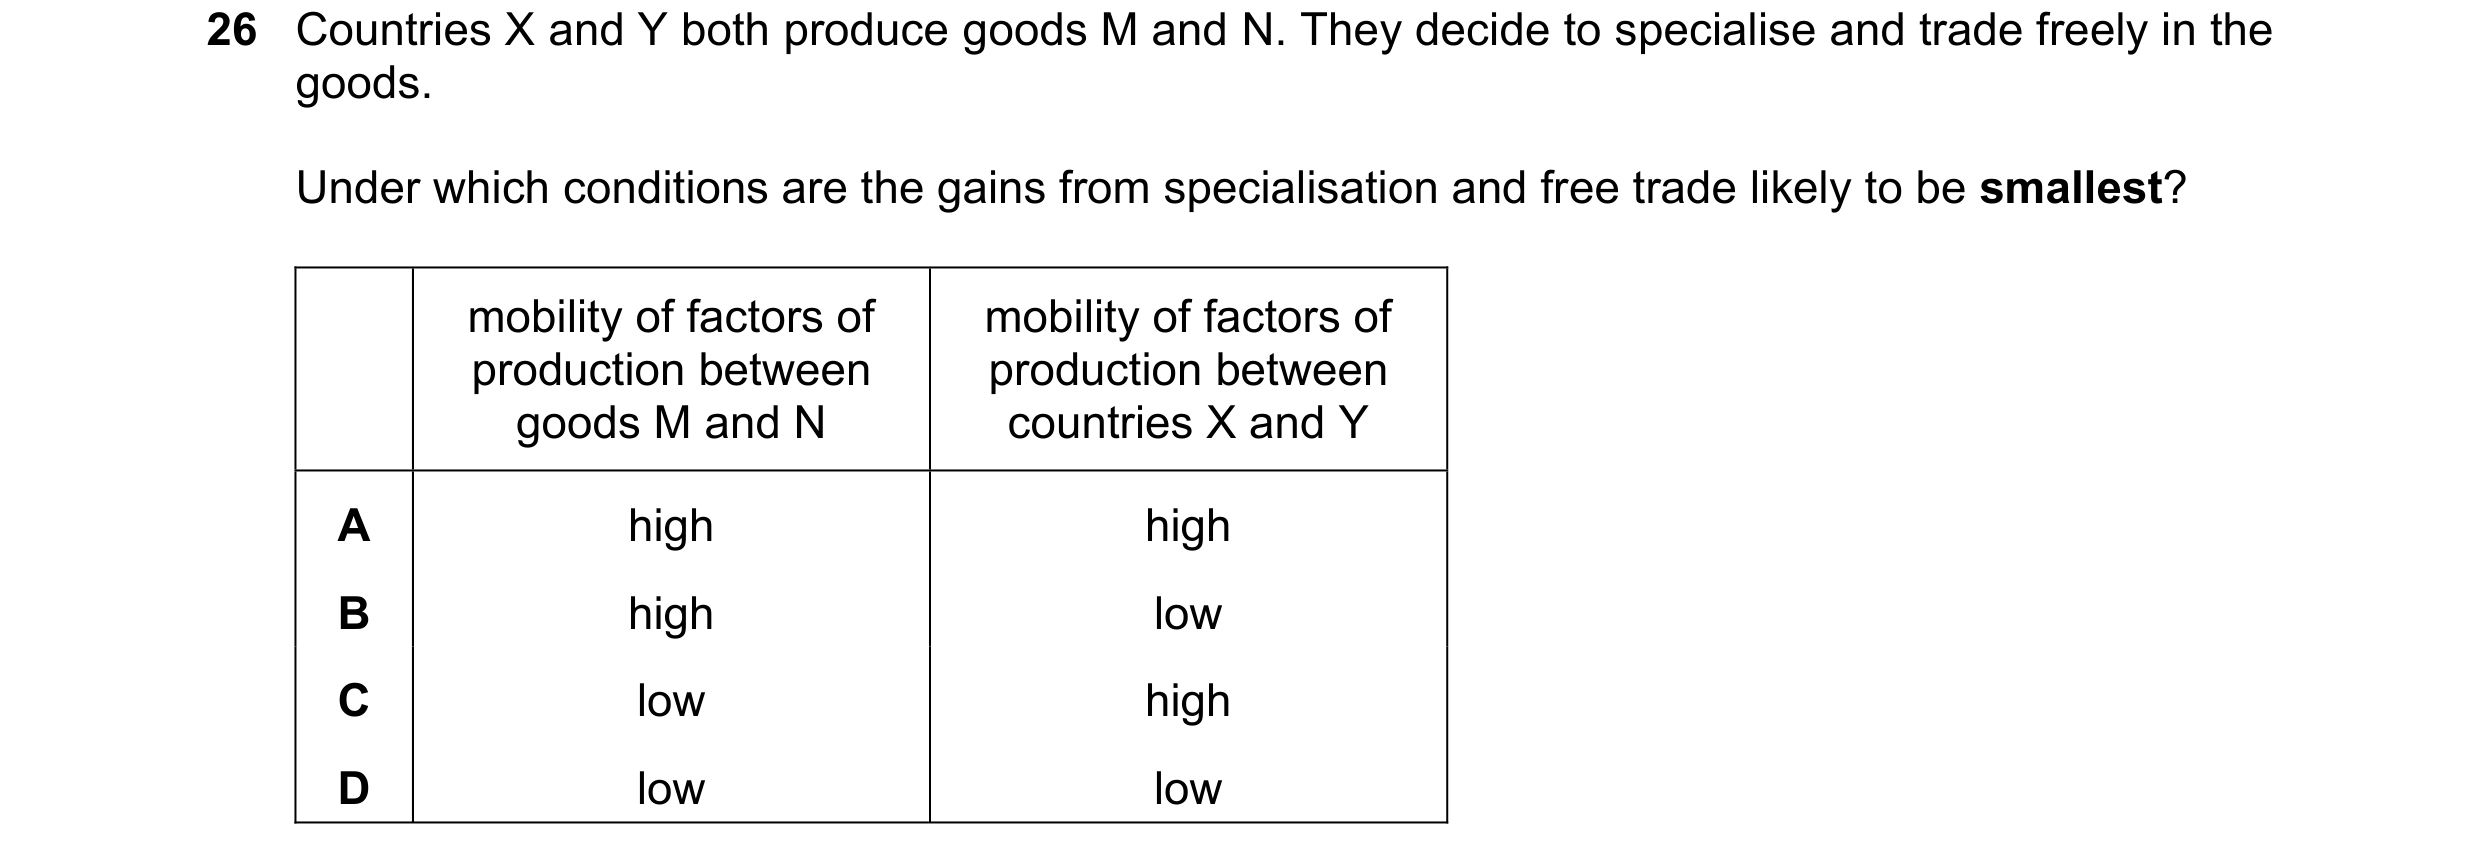
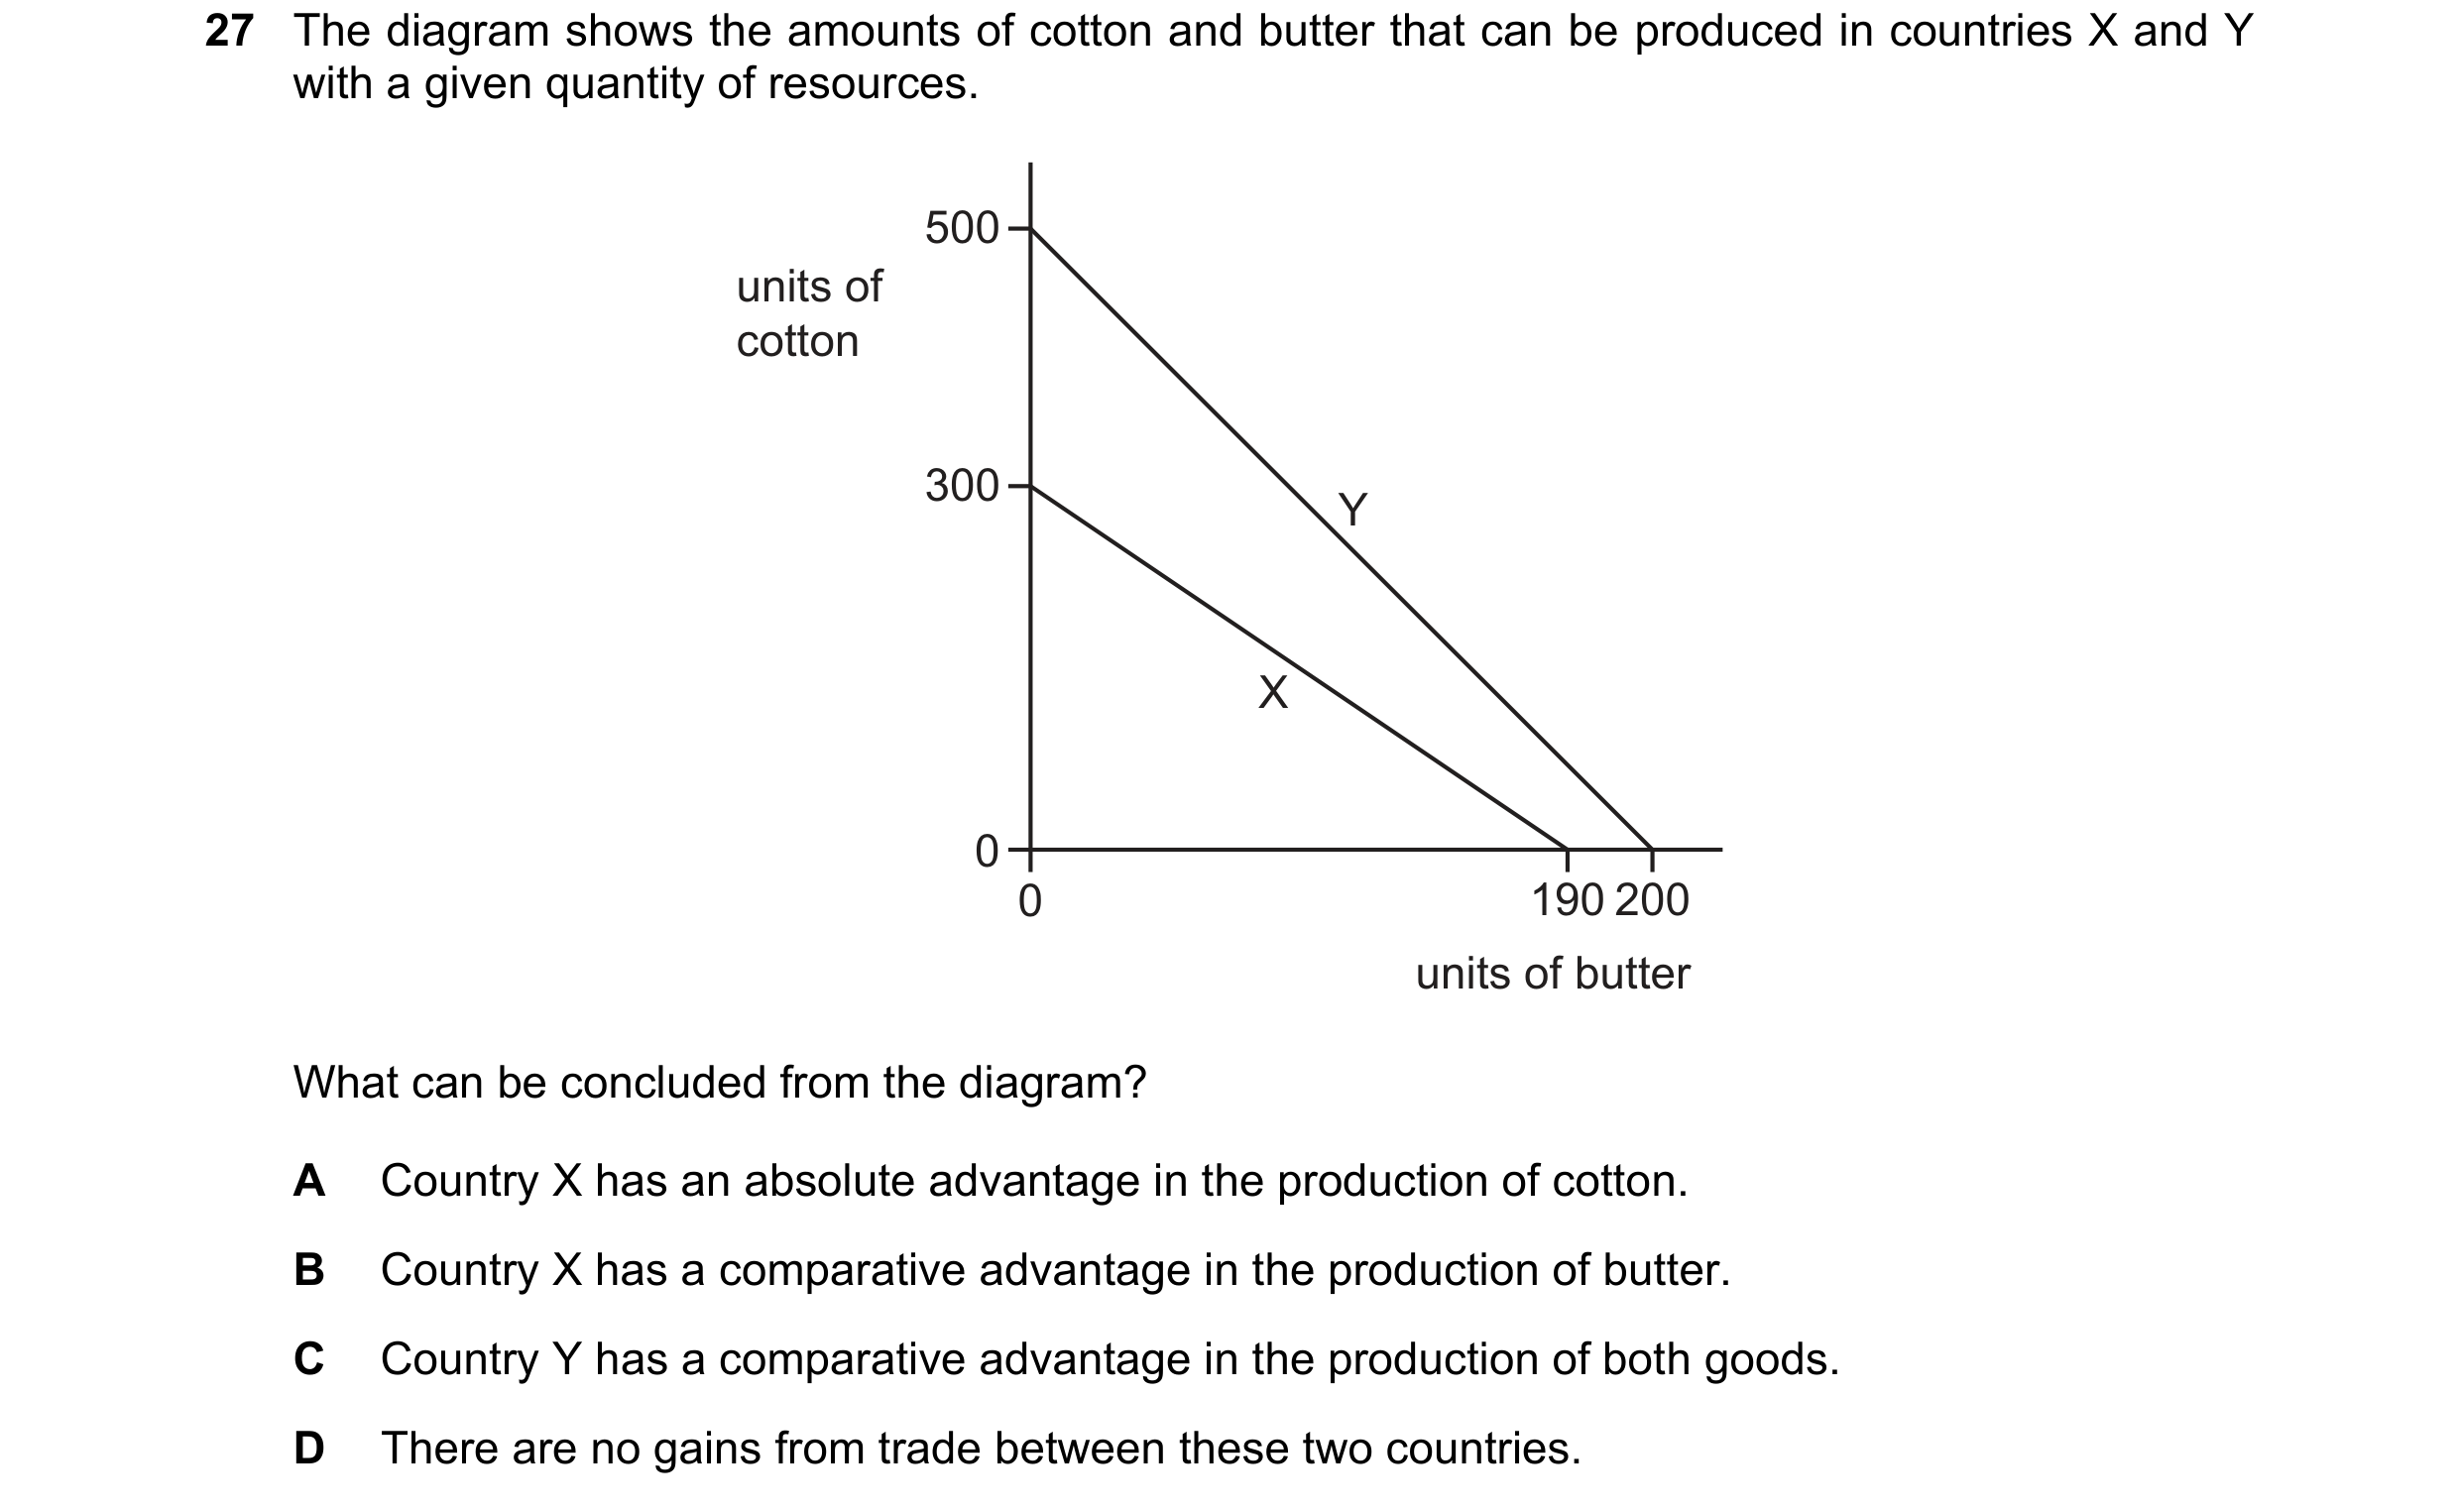
 55 / 59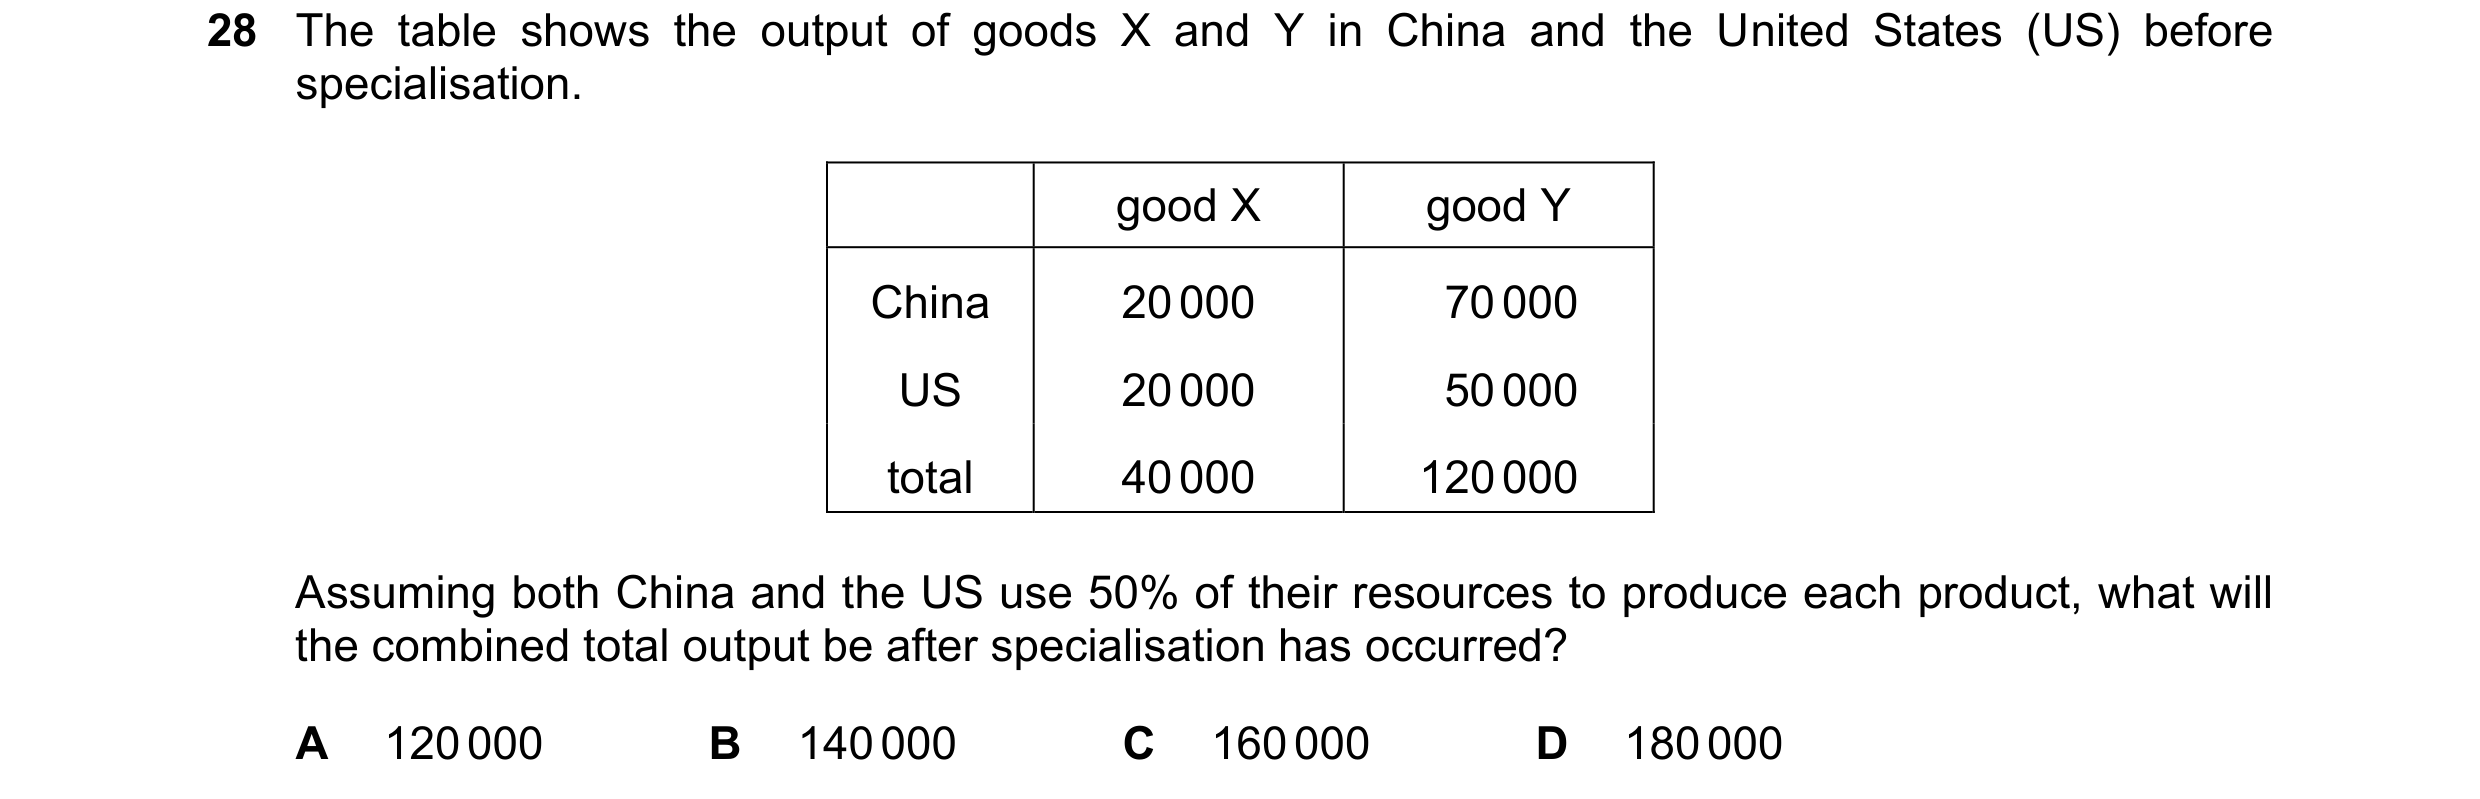
 56 / 59
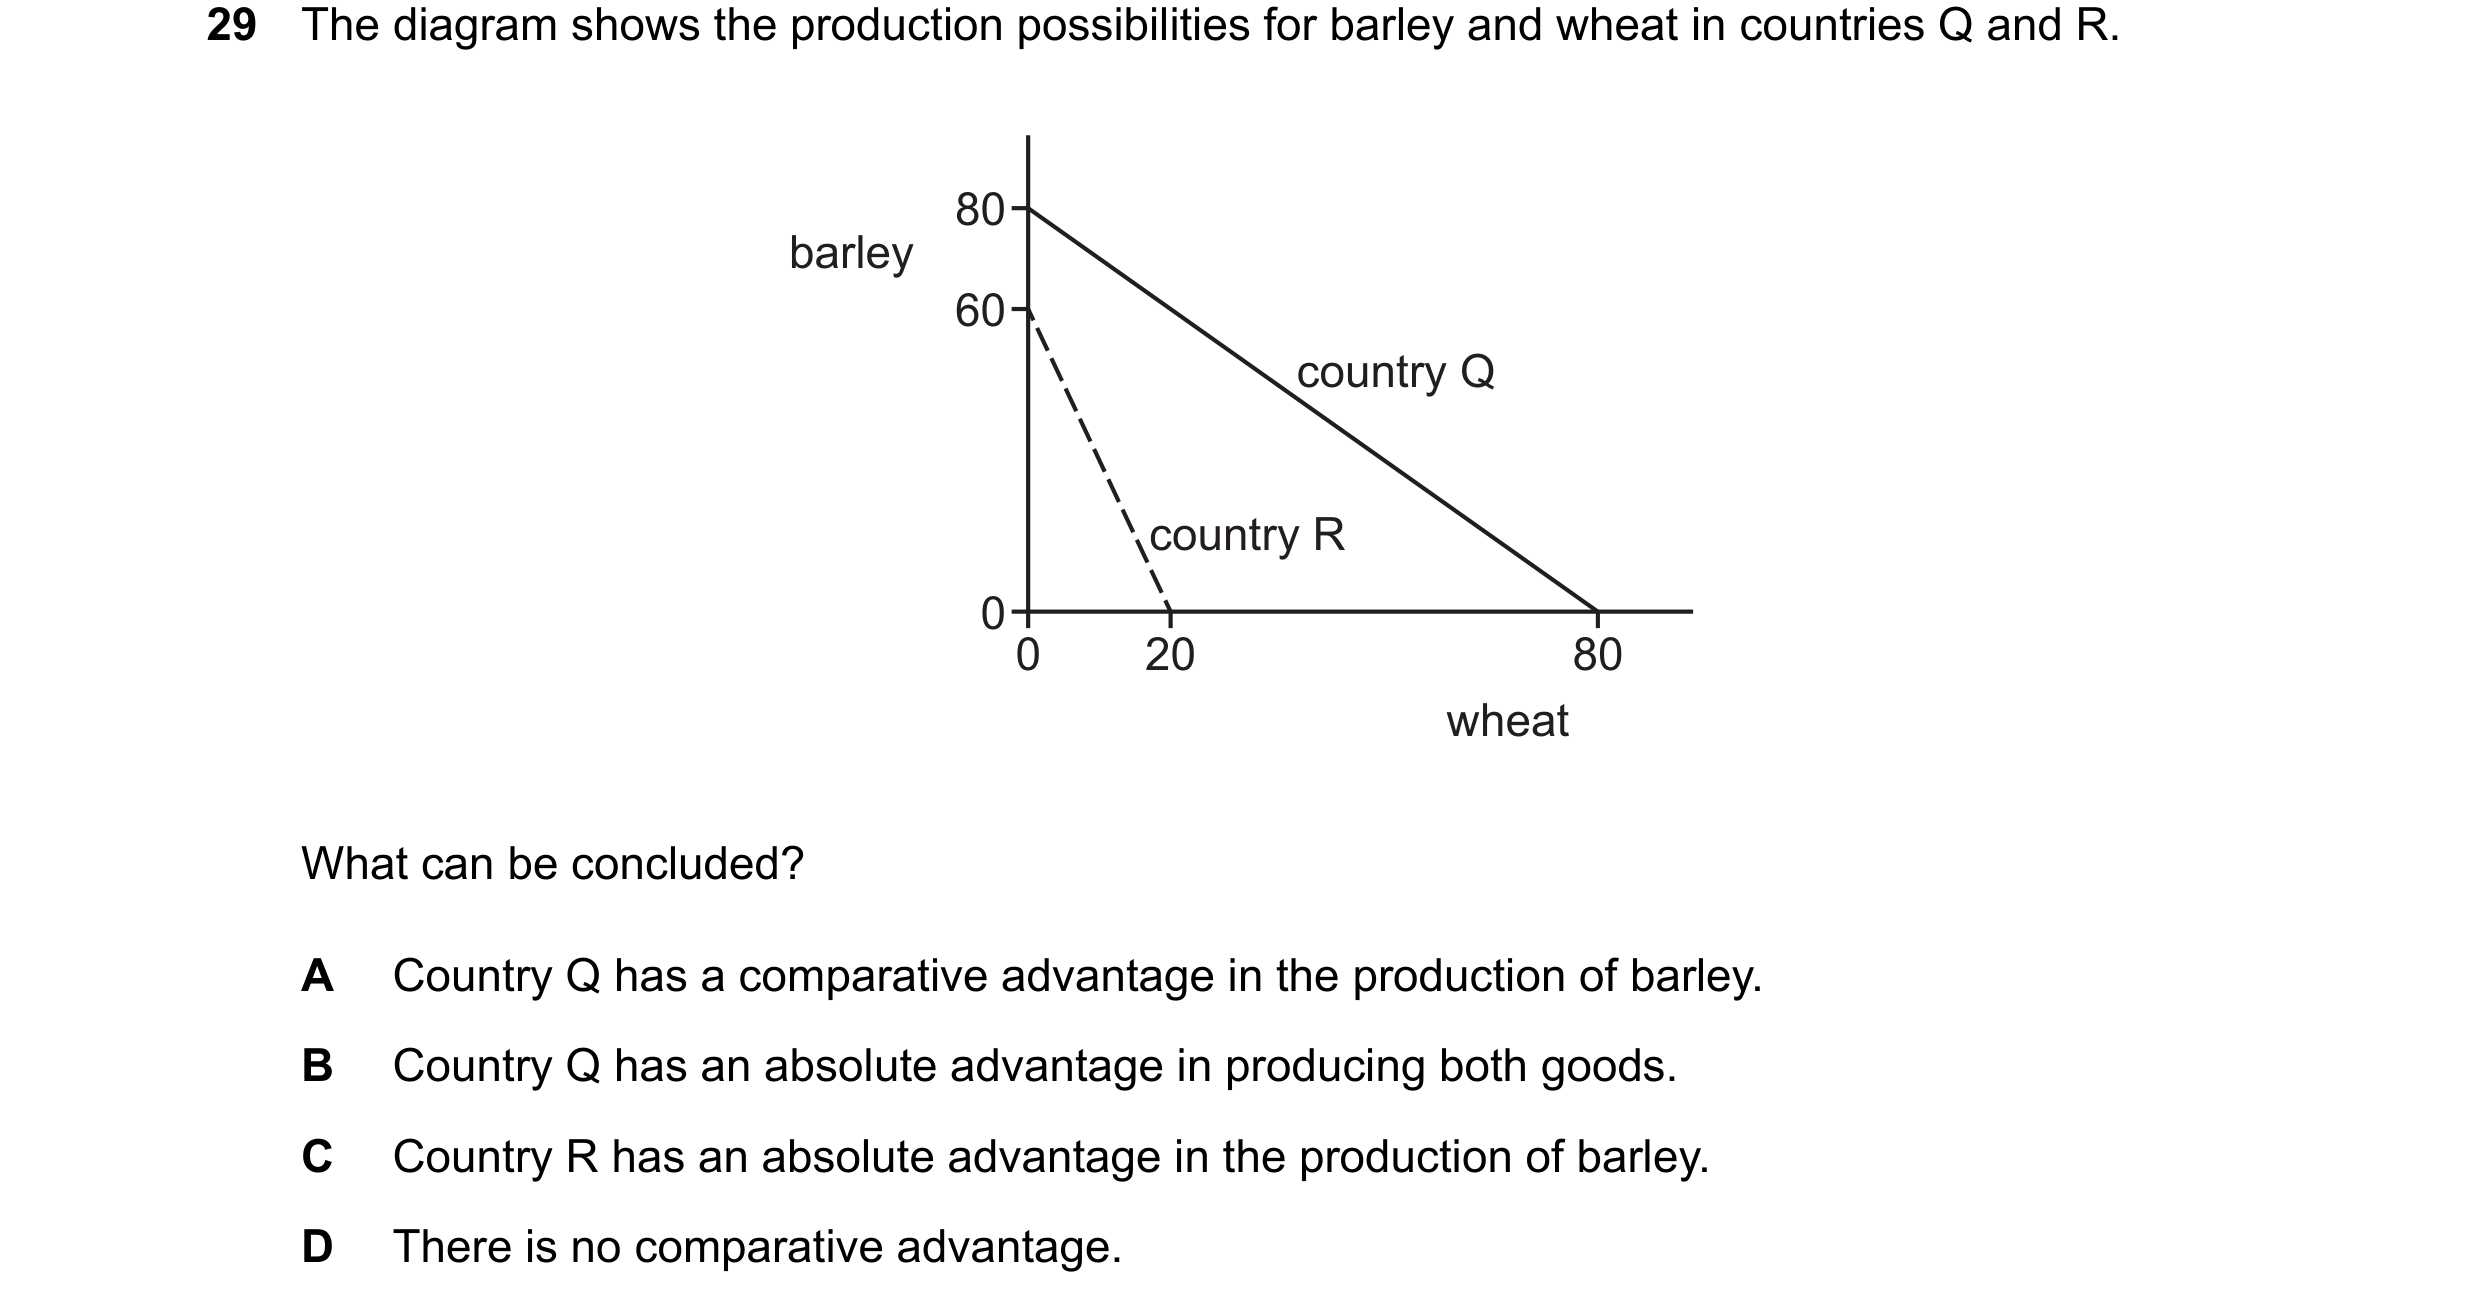 57 / 59
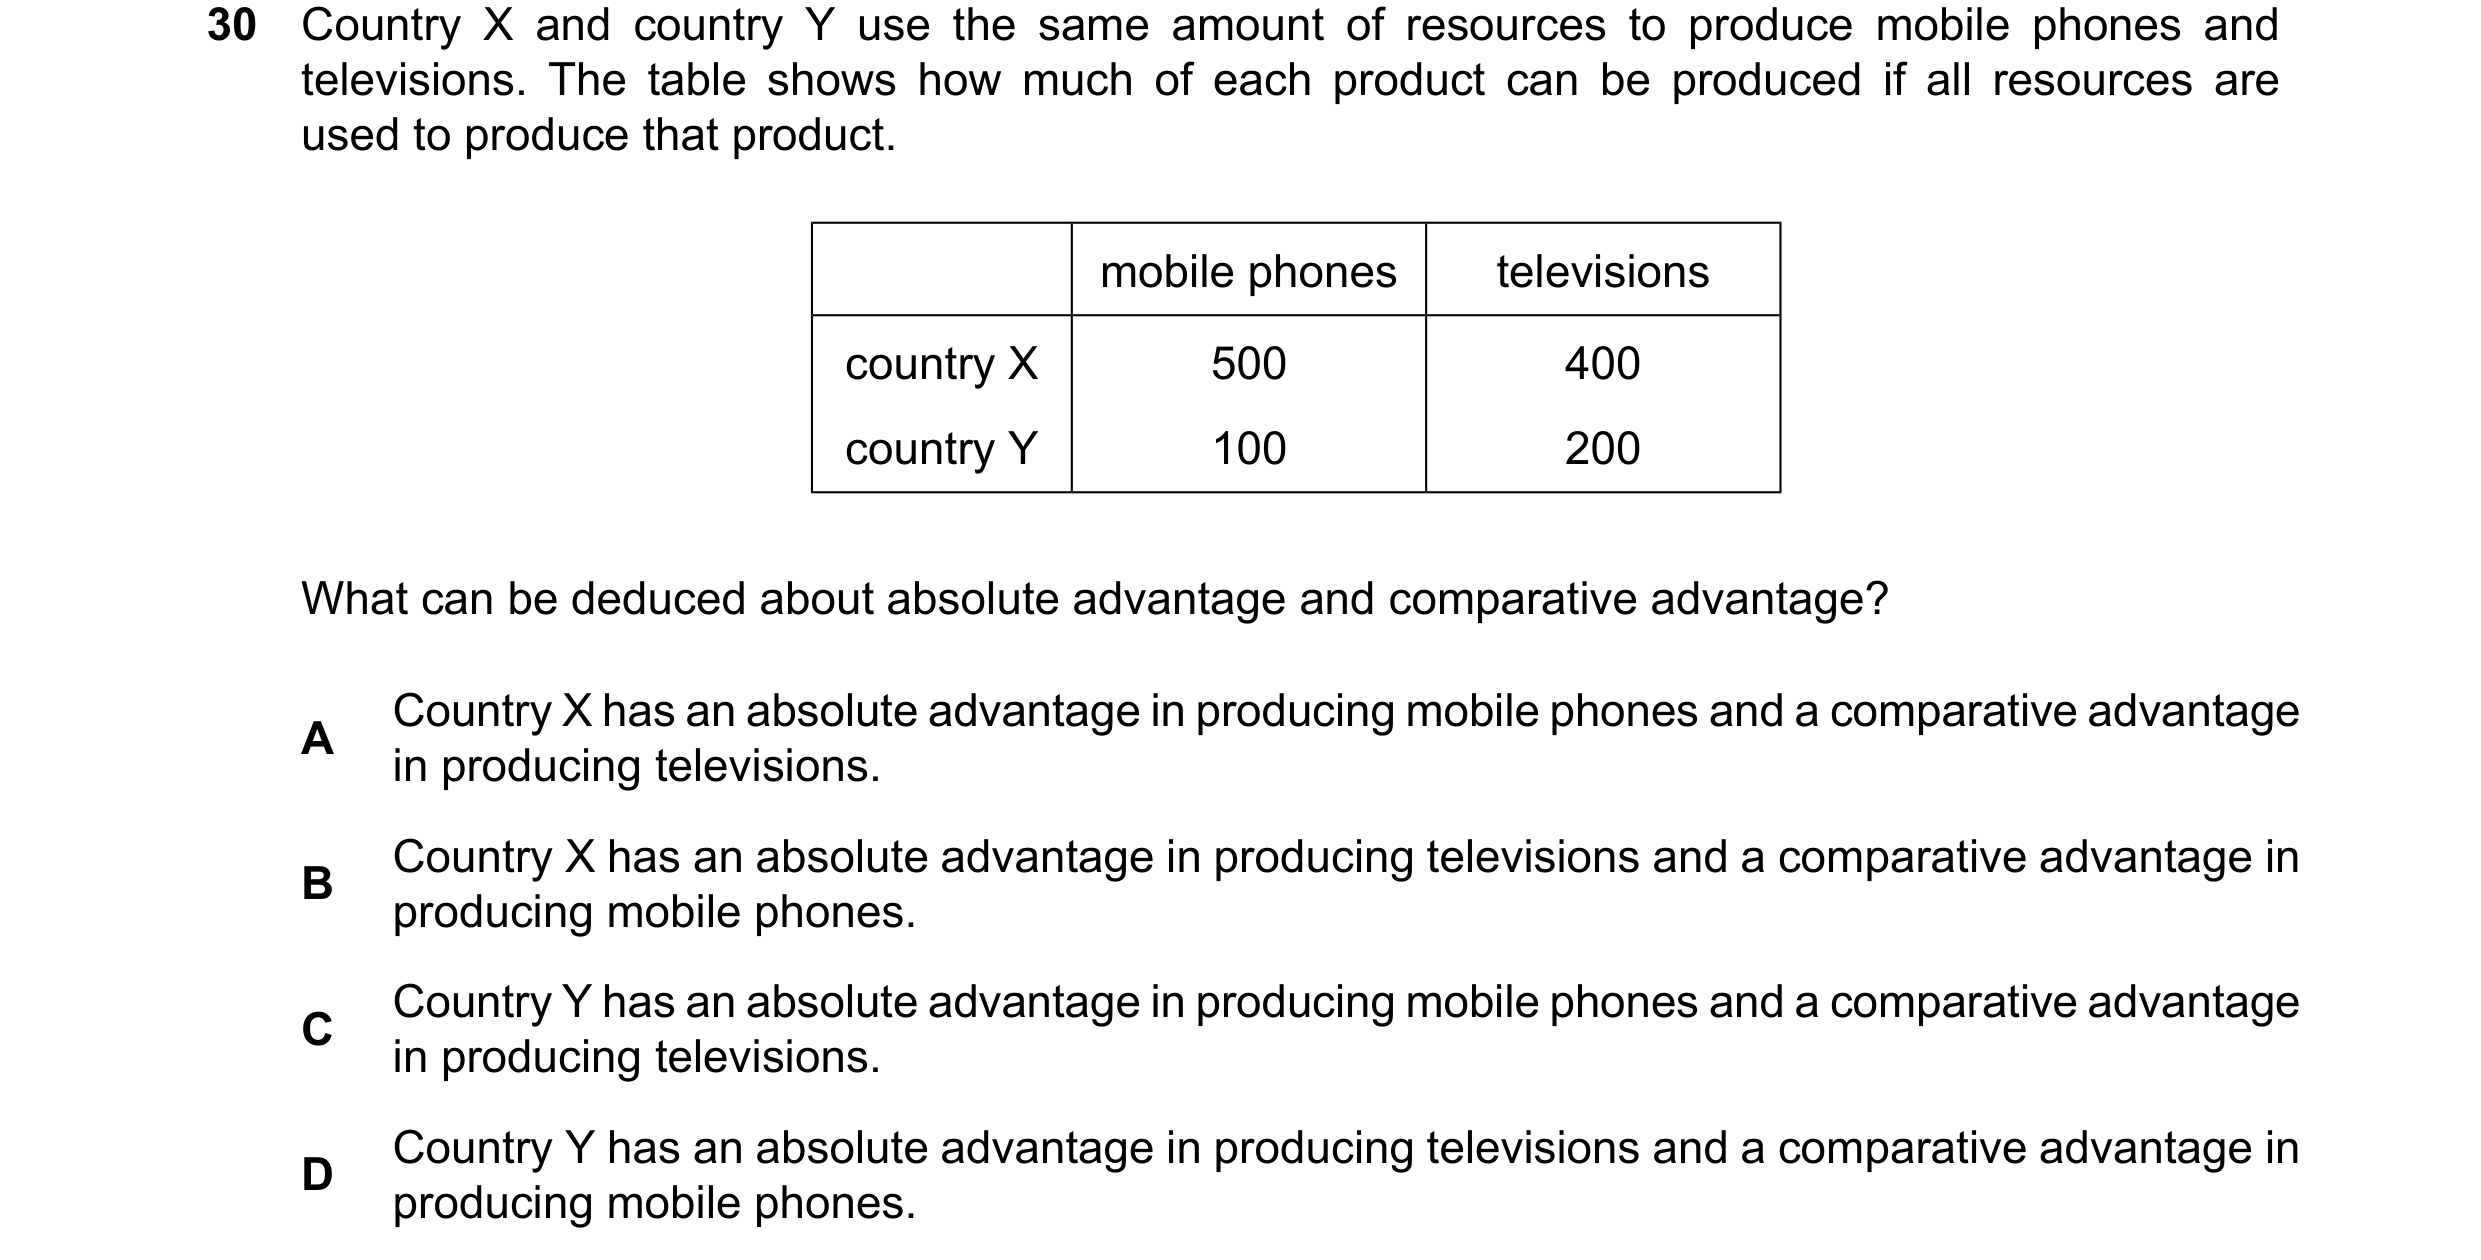
 58 / 59

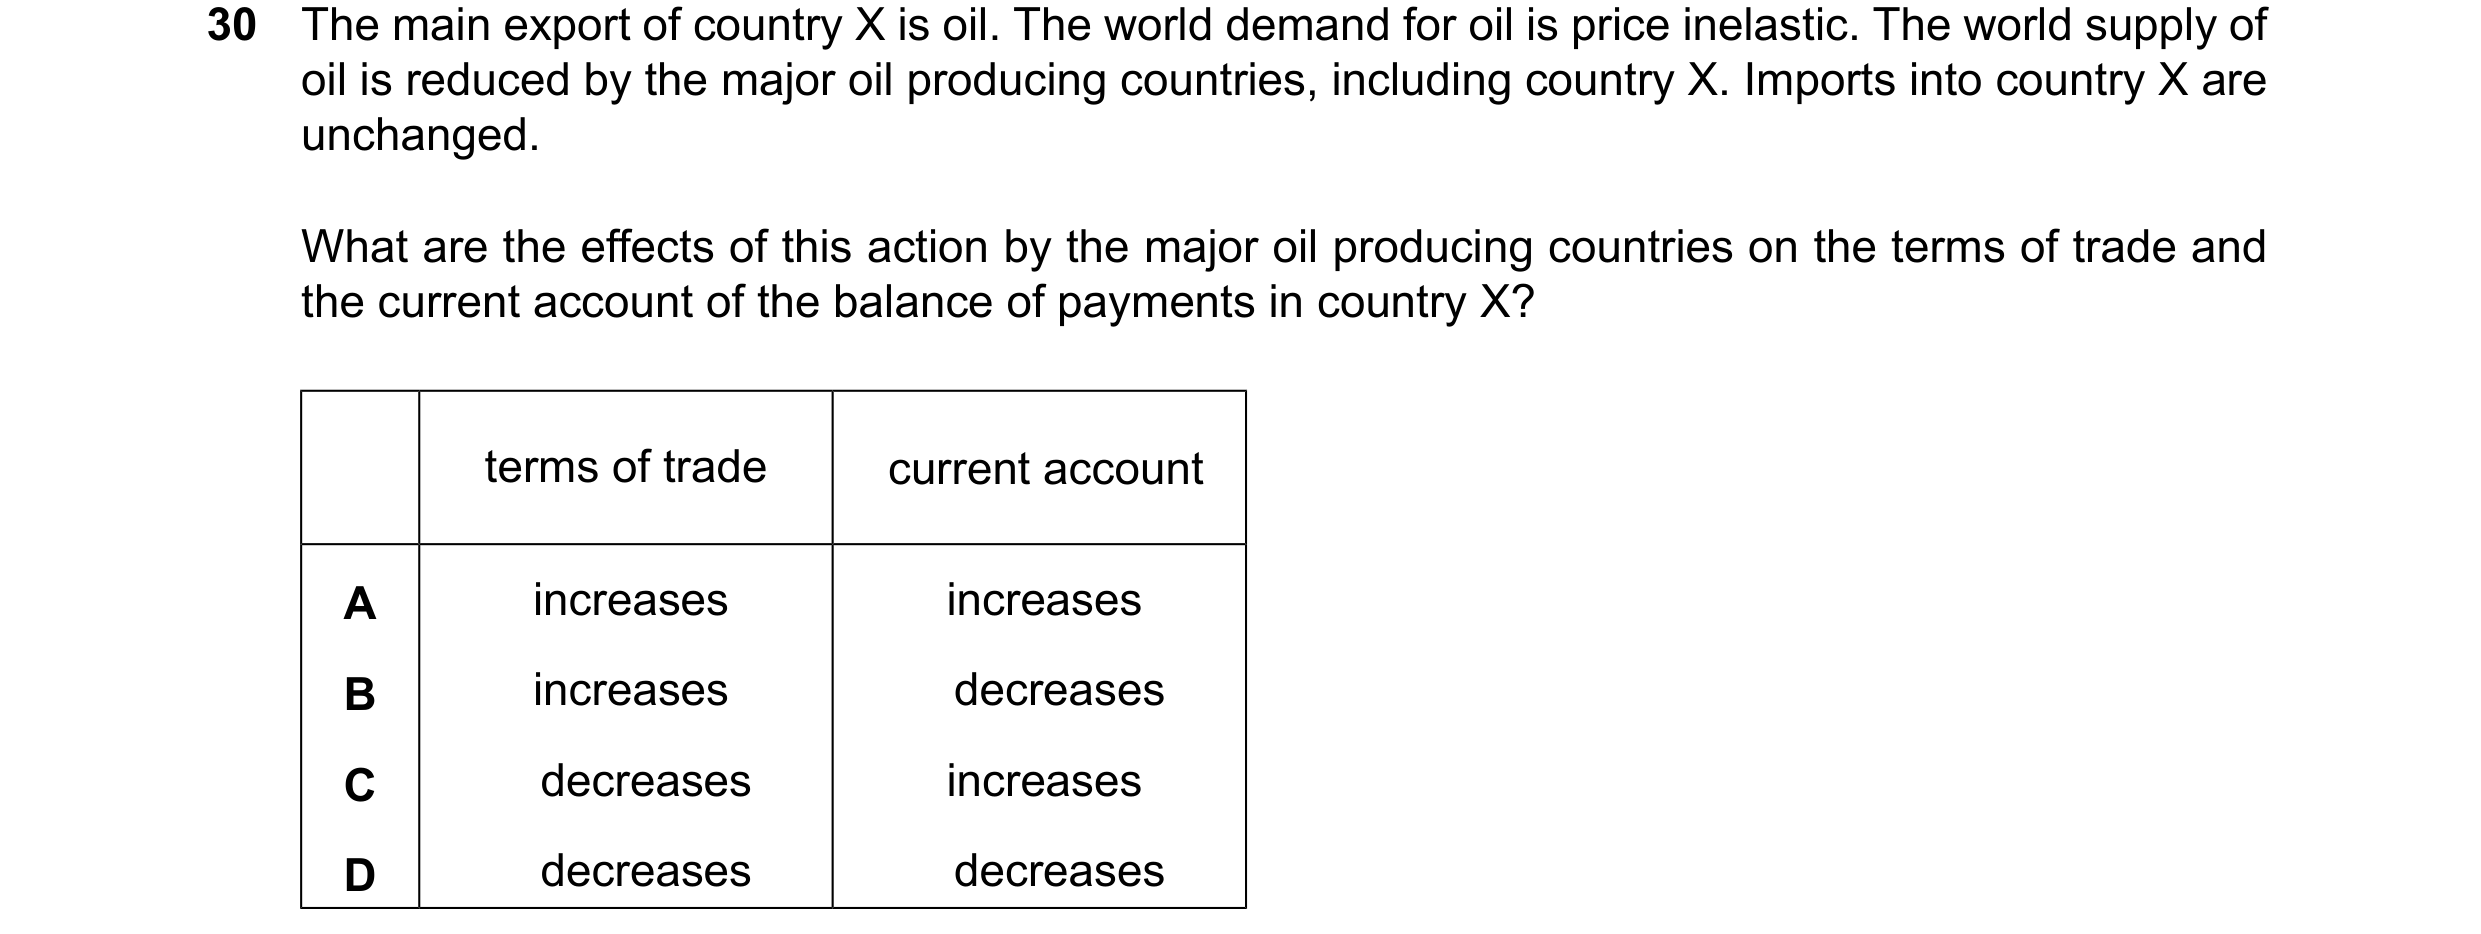 59 / 59