Cambridge A Level Economics 9708 — 2018 Feb/March Paper 1 · Variant 2
9708/12/F/M/18 · 30 questions · 30 marks · ≈34 min
The question paper and its mark scheme, free to read here and free to download. This is Cambridge’s own paper, exactly as it was sat.
Question paper12 pages
Mark scheme3 pages
Answers below. Sit the paper first if you are practising.
Questions as text
Q1 · Which statement about economics is not correct?
1 Which statement about economics is not correct? A Economic actions can produce unexpected side effects. B Economic thinking is usually based on logical reasoning at the margin. C The use of scarce resources to produce a good always has a cost. D The value of a good or service involves a purely objective judgement.
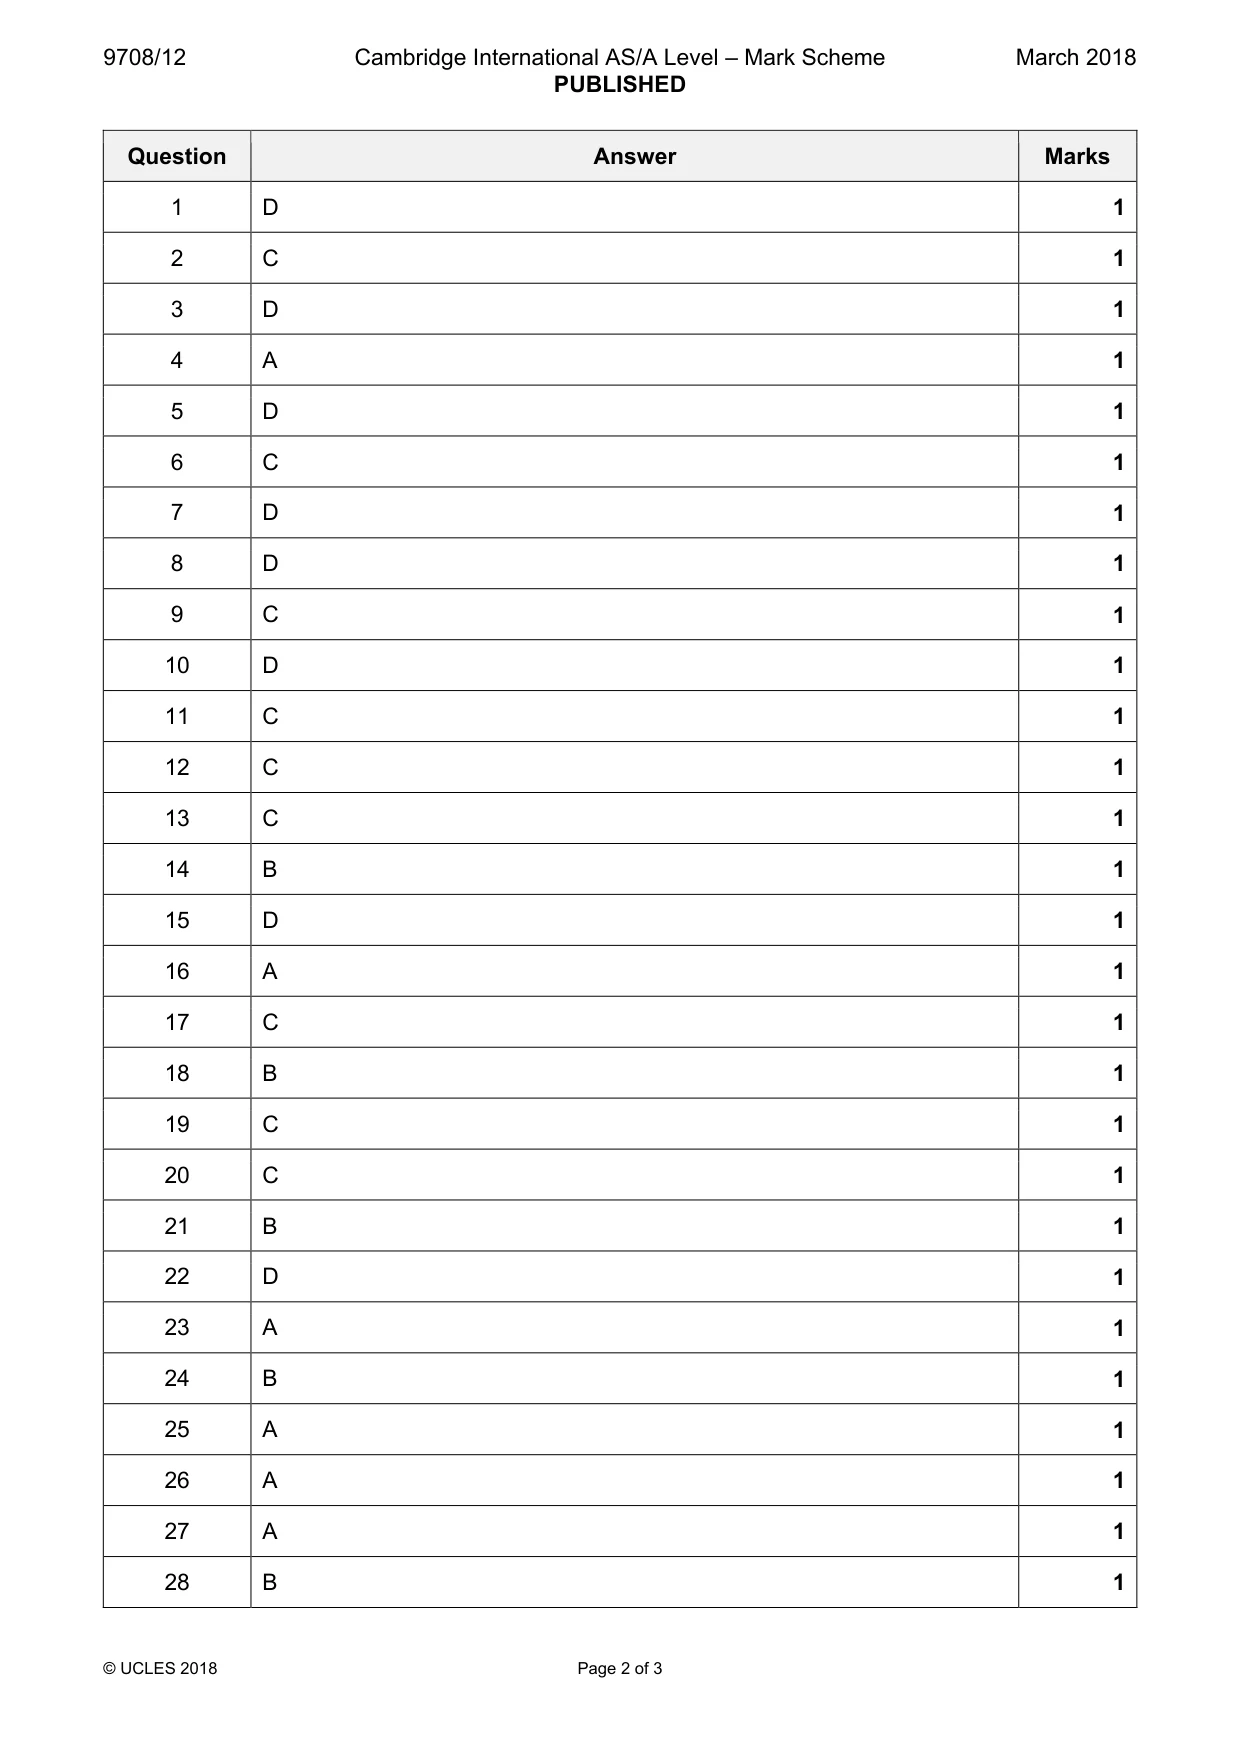
Mark scheme: D
Q2 · A farmer is able to grow three crops, X, Y and Z, on his land
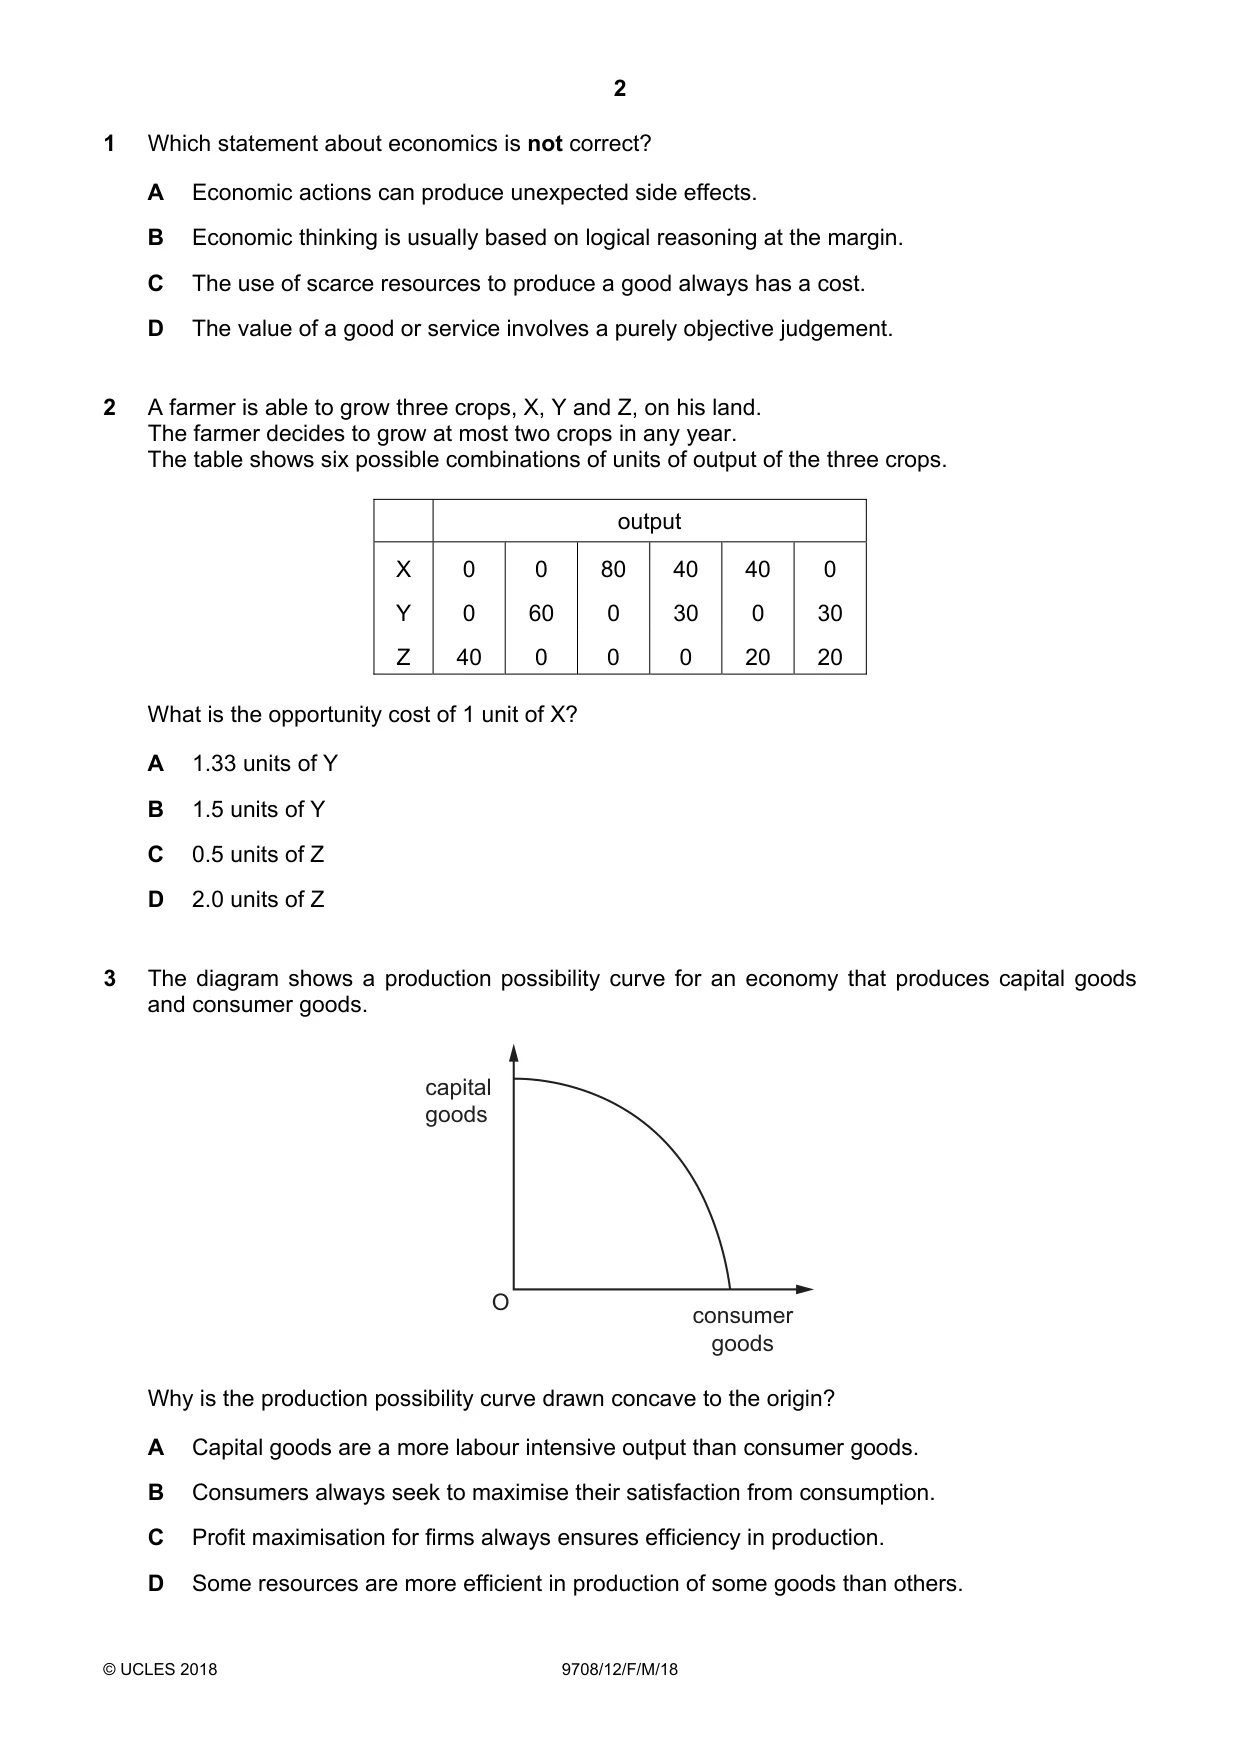
2 A farmer is able to grow three crops, X, Y and Z, on his land. The farmer decides to grow at most two crops in any year. The table shows six possible combinations of units of output of the three crops. output X 0 0 80 40 40 0 Y 0 60 0 30 0 30 Z 40 0 0 0 20 20 What is the opportunity cost of 1 unit of X? A 1.33 units of Y B 1.5 units of Y C 0.5 units of Z D 2.0 units of Z
Mark scheme: C
Q3 · The diagram shows a production possibility curve for an economy that produces capital…
3 The diagram shows a production possibility curve for an economy that produces capital goods and consumer goods. capital goods O consumer goods Why is the production possibility curve drawn concave to the origin? A Capital goods are a more labour intensive output than consumer goods. B Consumers always seek to maximise their satisfaction from consumption. C Profit maximisation for firms always ensures efficiency in production. D Some resources are more efficient in production of some goods than others.
Mark scheme: D
Q4 · The Bureau of Alcohol, Tobacco, Firearms and Explosives is a branch of the United States…
4 The Bureau of Alcohol, Tobacco, Firearms and Explosives is a branch of the United States Government which regulates markets. What does its name imply is most likely to be its main responsibility? A to prevent harm from demerit goods B to provide subsidies for essential goods C to raise revenue from goods in elastic demand D to safeguard employment in manufacturing industry
Mark scheme: A
Q5 · What is treated as a variable in constructing a market demand curve?
5 What is treated as a variable in constructing a market demand curve? A consumers’ tastes B the distribution of income C the price of related goods D the price of the good
Mark scheme: D
Q6 · The diagram shows how the quantity demanded of four goods changes as income changes
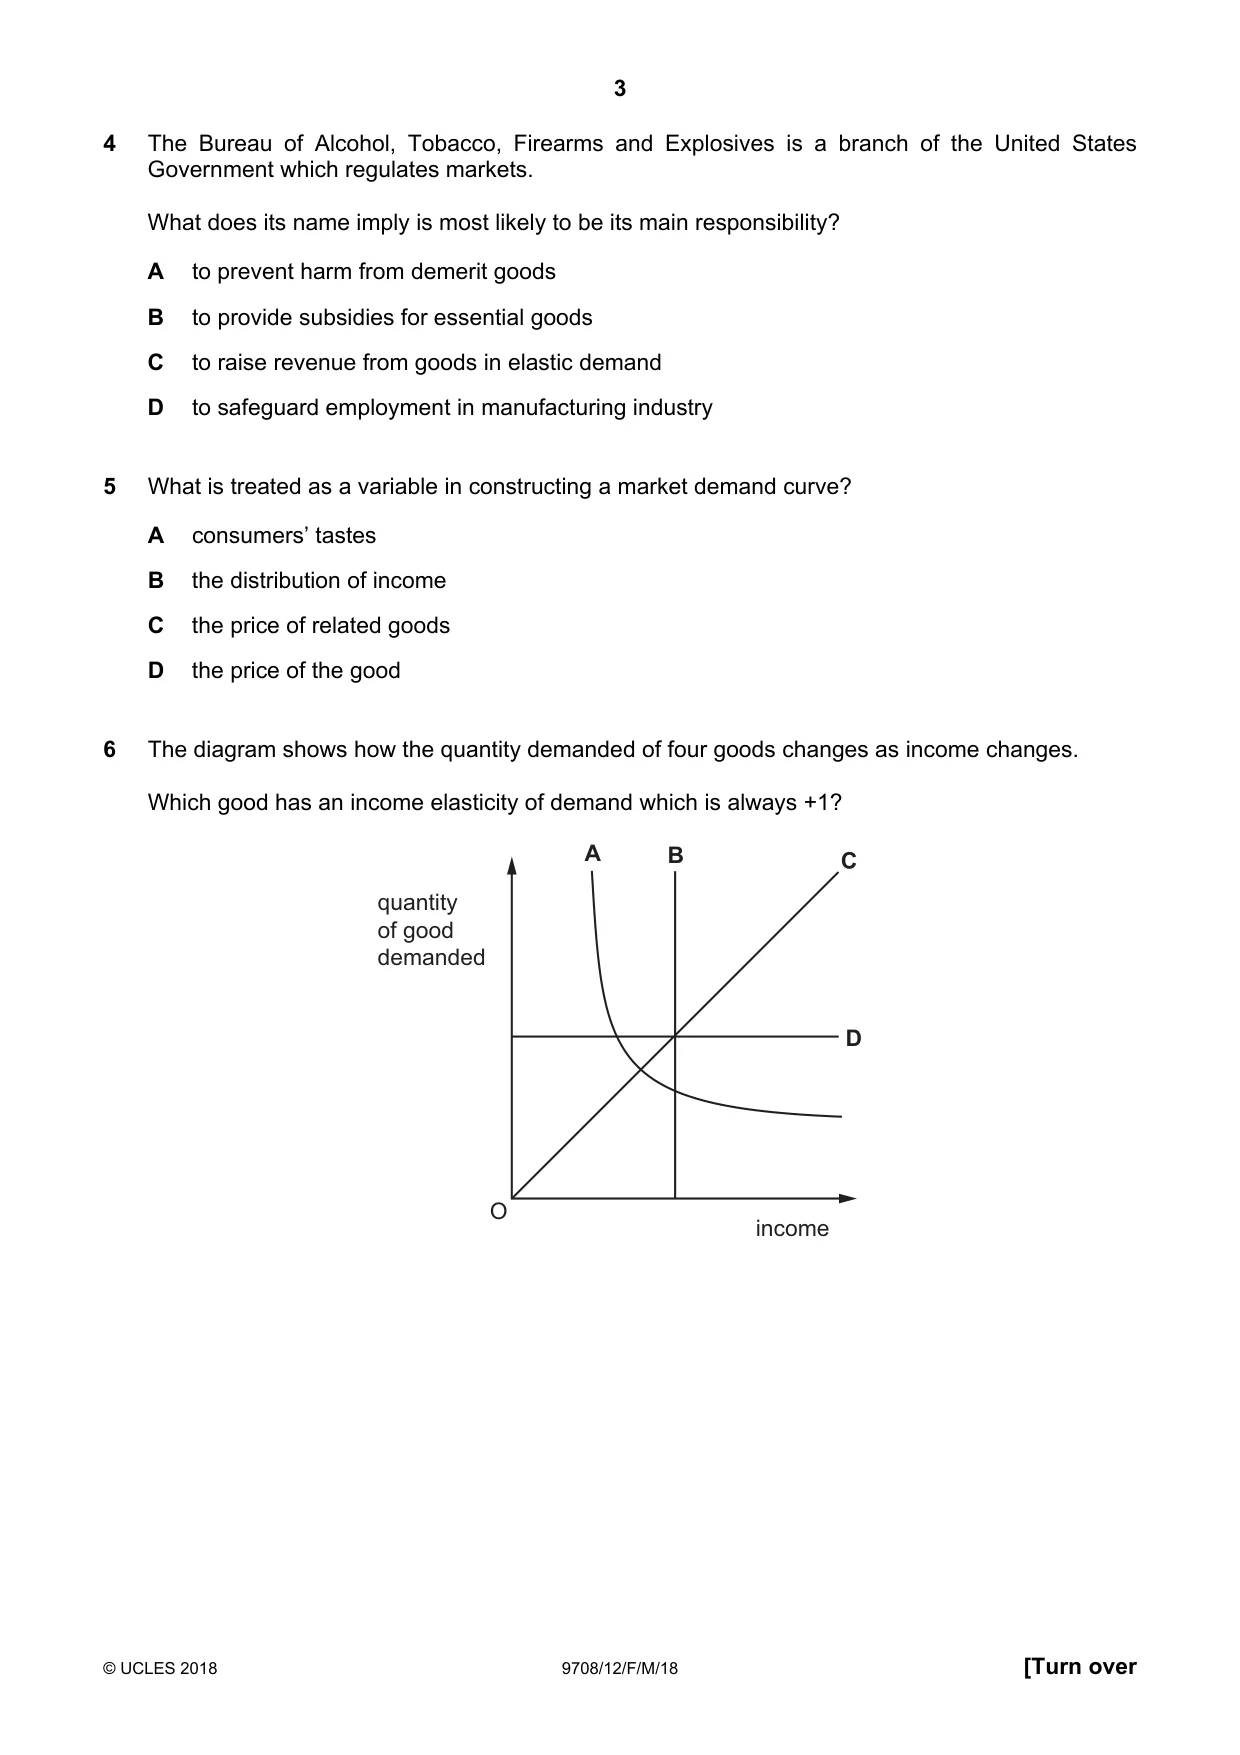
6 The diagram shows how the quantity demanded of four goods changes as income changes. Which good has an income elasticity of demand which is always +1? A B C quantity of good demanded D O income
Mark scheme: C
More questions on Price elasticity, income elasticity and cross elasticity of demand
Q7 · The table shows three different prices and quantities supplied per week of two products…
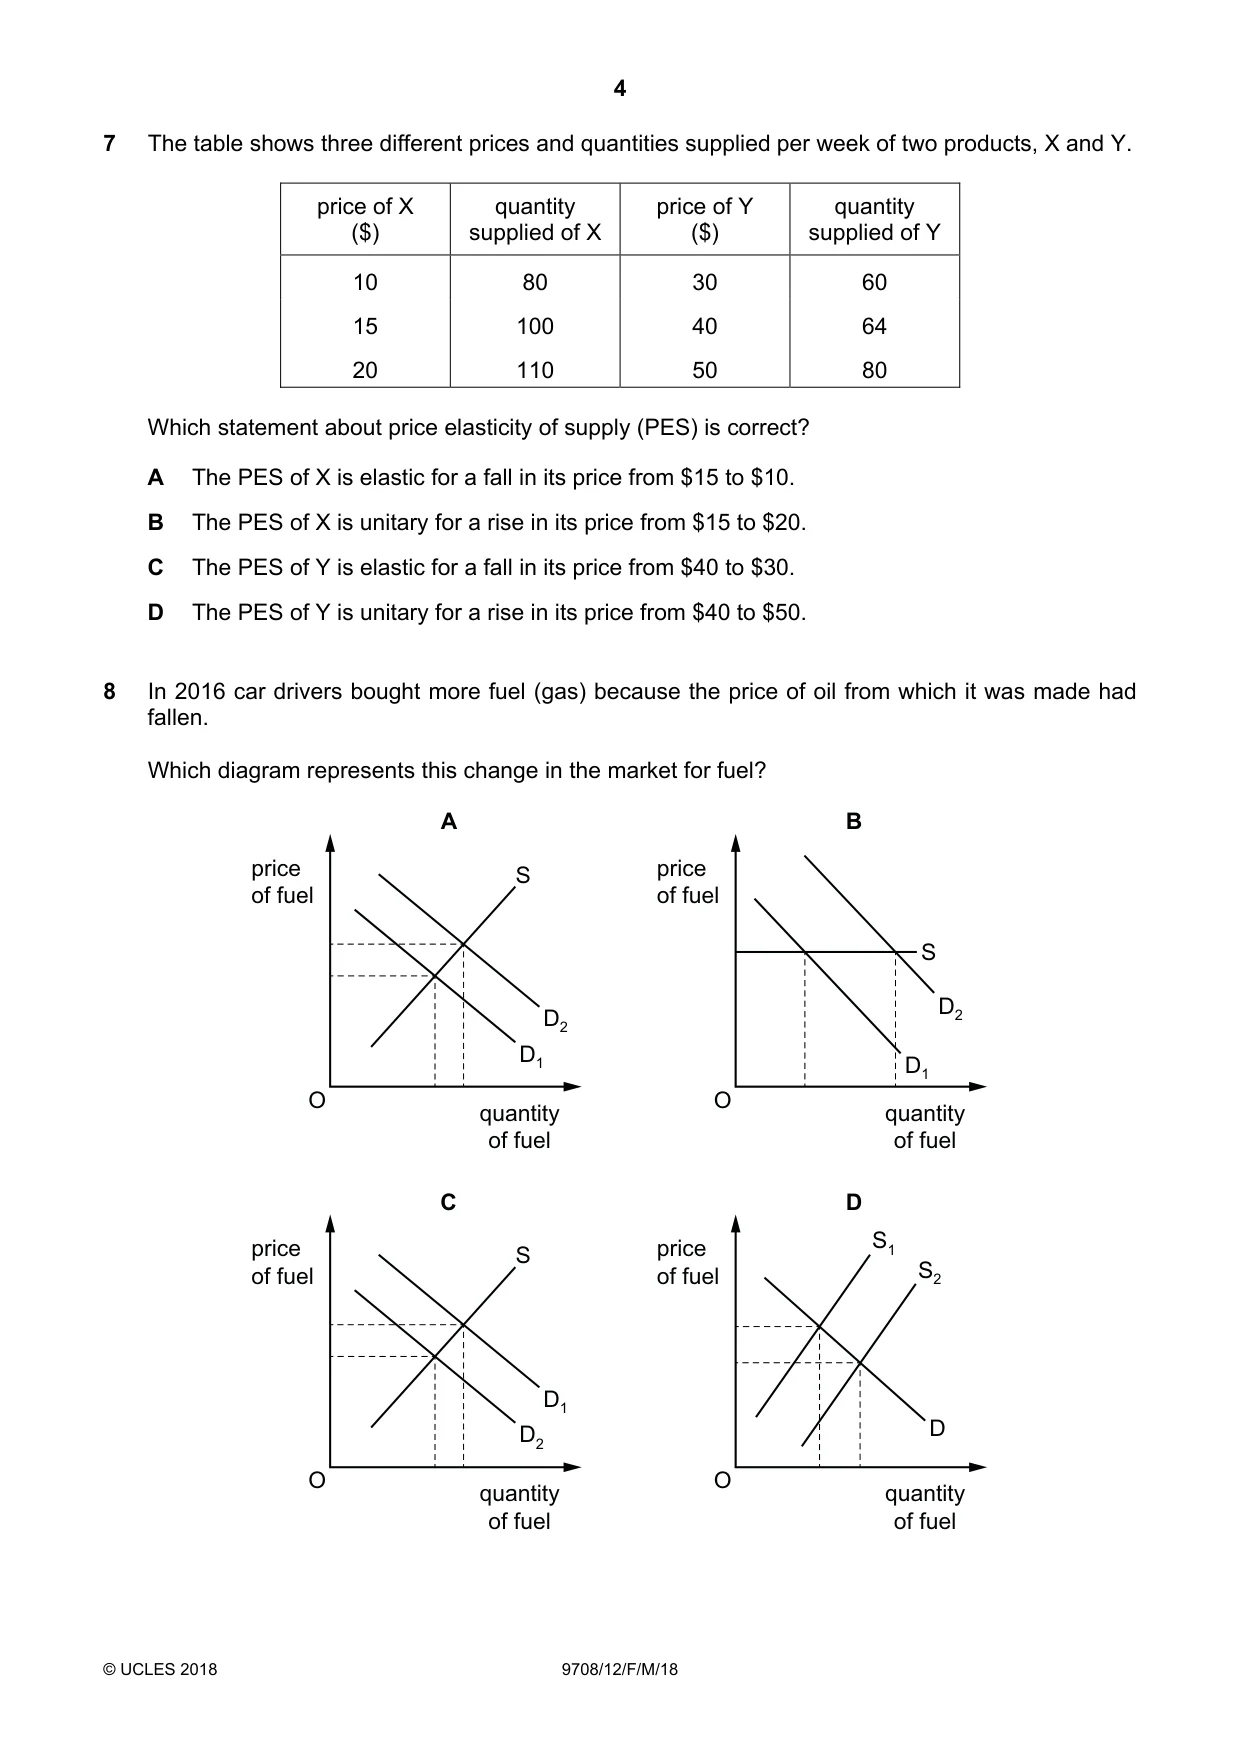
7 The table shows three different prices and quantities supplied per week of two products, X and Y. price of X quantity price of Y quantity ($) supplied of X ($) supplied of Y 10 80 30 60 15 100 40 64 20 110 50 80 Which statement about price elasticity of supply (PES) is correct? A The PES of X is elastic for a fall in its price from $15 to $10. B The PES of X is unitary for a rise in its price from $15 to $20. C The PES of Y is elastic for a fall in its price from $40 to $30. D The PES of Y is unitary for a rise in its price from $40 to $50.
Mark scheme: D
Q8 · In 2016 car drivers bought more fuel (gas) because the price of oil from which it was…
8 In 2016 car drivers bought more fuel (gas) because the price of oil from which it was made had fallen. Which diagram represents this change in the market for fuel? A B price S price of fuel of fuel S D2 D2 D1 D1 O O quantity quantity of fuel of fuel C D price price S1 S of fuel of fuel S2 D1 D2 D O O quantity quantity of fuel of fuel
Mark scheme: D
Q9 · The market demand for a product is made up of the demand from three firms, X, Y and Z
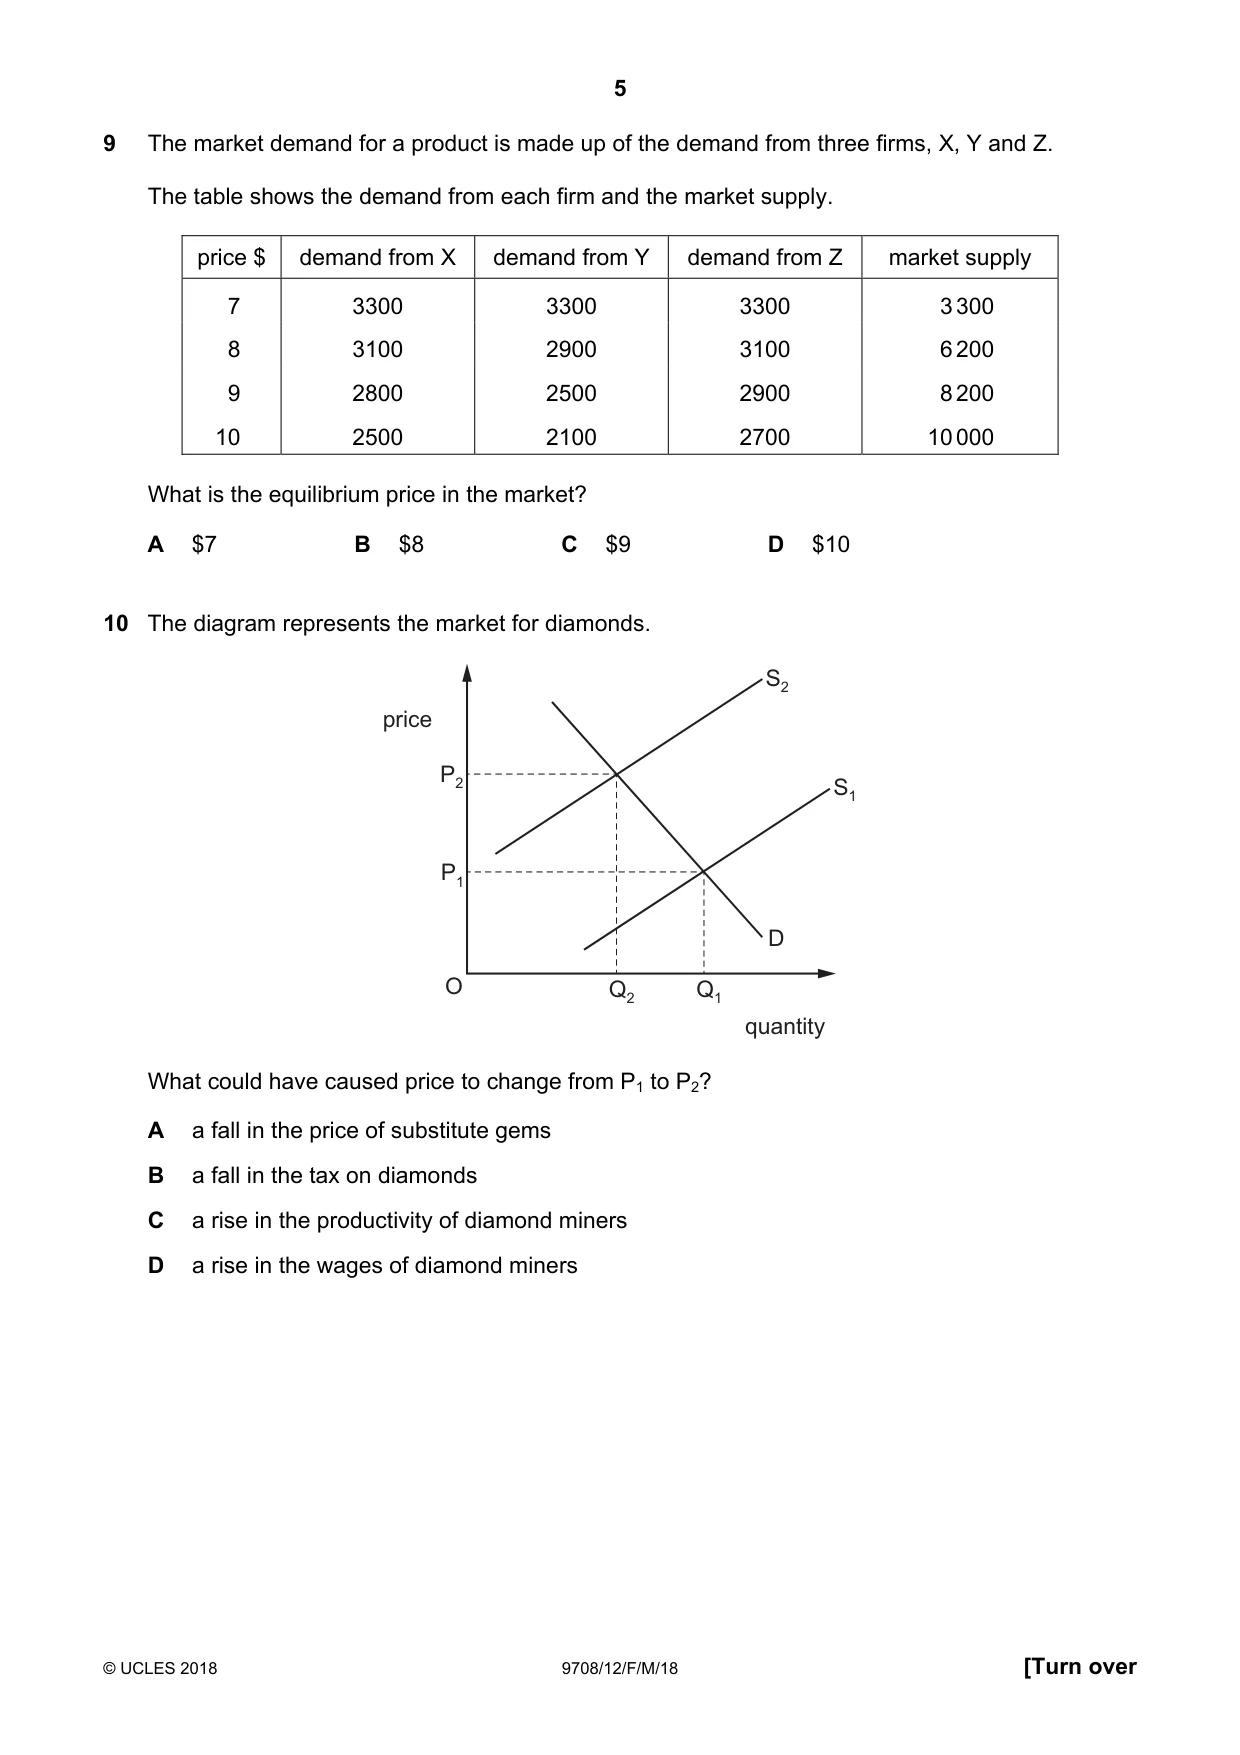
9 The market demand for a product is made up of the demand from three firms, X, Y and Z. The table shows the demand from each firm and the market supply. price $ demand from X demand from Y demand from Z market supply 7 3300 3300 3300 3 300 8 3100 2900 3100 6 200 9 2800 2500 2900 8 200 10 2500 2100 2700 10 000 What is the equilibrium price in the market? A $7 B $8 C $9 D $10
Mark scheme: C
Q10 · The diagram represents the market for diamonds
10 The diagram represents the market for diamonds. S2 price P2 S1 P1 D O Q2 Q1 quantity What could have caused price to change from P1 to P2? A a fall in the price of substitute gems B a fall in the tax on diamonds C a rise in the productivity of diamond miners D a rise in the wages of diamond miners
Mark scheme: D
Q11 · Good X has a substitute, good Y, and a complement, good Z
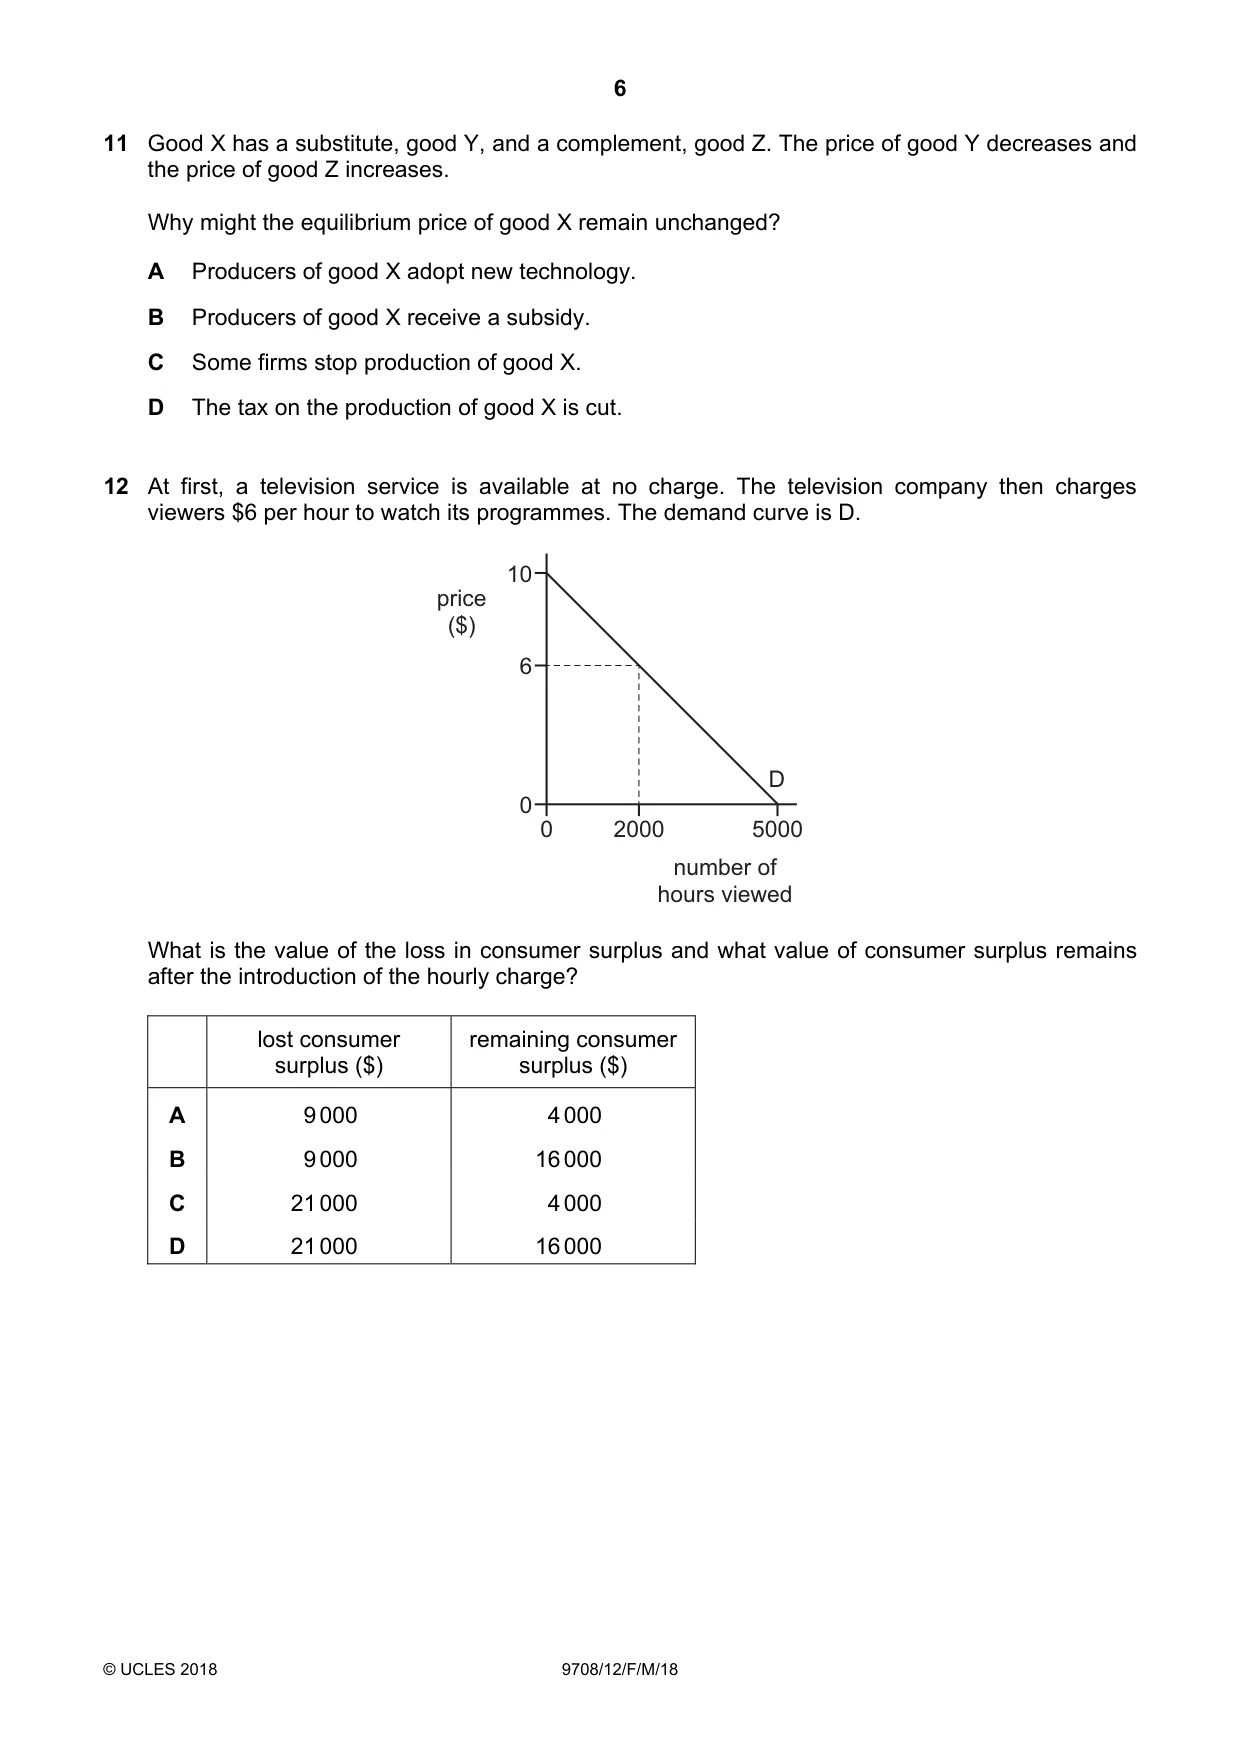
11 Good X has a substitute, good Y, and a complement, good Z. The price of good Y decreases and the price of good Z increases. Why might the equilibrium price of good X remain unchanged? A Producers of good X adopt new technology. B Producers of good X receive a subsidy. C Some firms stop production of good X. D The tax on the production of good X is cut.
Mark scheme: C
Q12 · At first, a television service is available at no charge
12 At first, a television service is available at no charge. The television company then charges viewers $6 per hour to watch its programmes. The demand curve is D. 10 price ($) 6 D 0 0 2000 5000 number of hours viewed What is the value of the loss in consumer surplus and what value of consumer surplus remains after the introduction of the hourly charge? lost consumer remaining consumer surplus ($) surplus ($) A 9 000 4 000 B 9 000 16 000 C 21 000 4 000 D 21 000 16 000
Mark scheme: C
Q13 · The diagram shows the European airline market
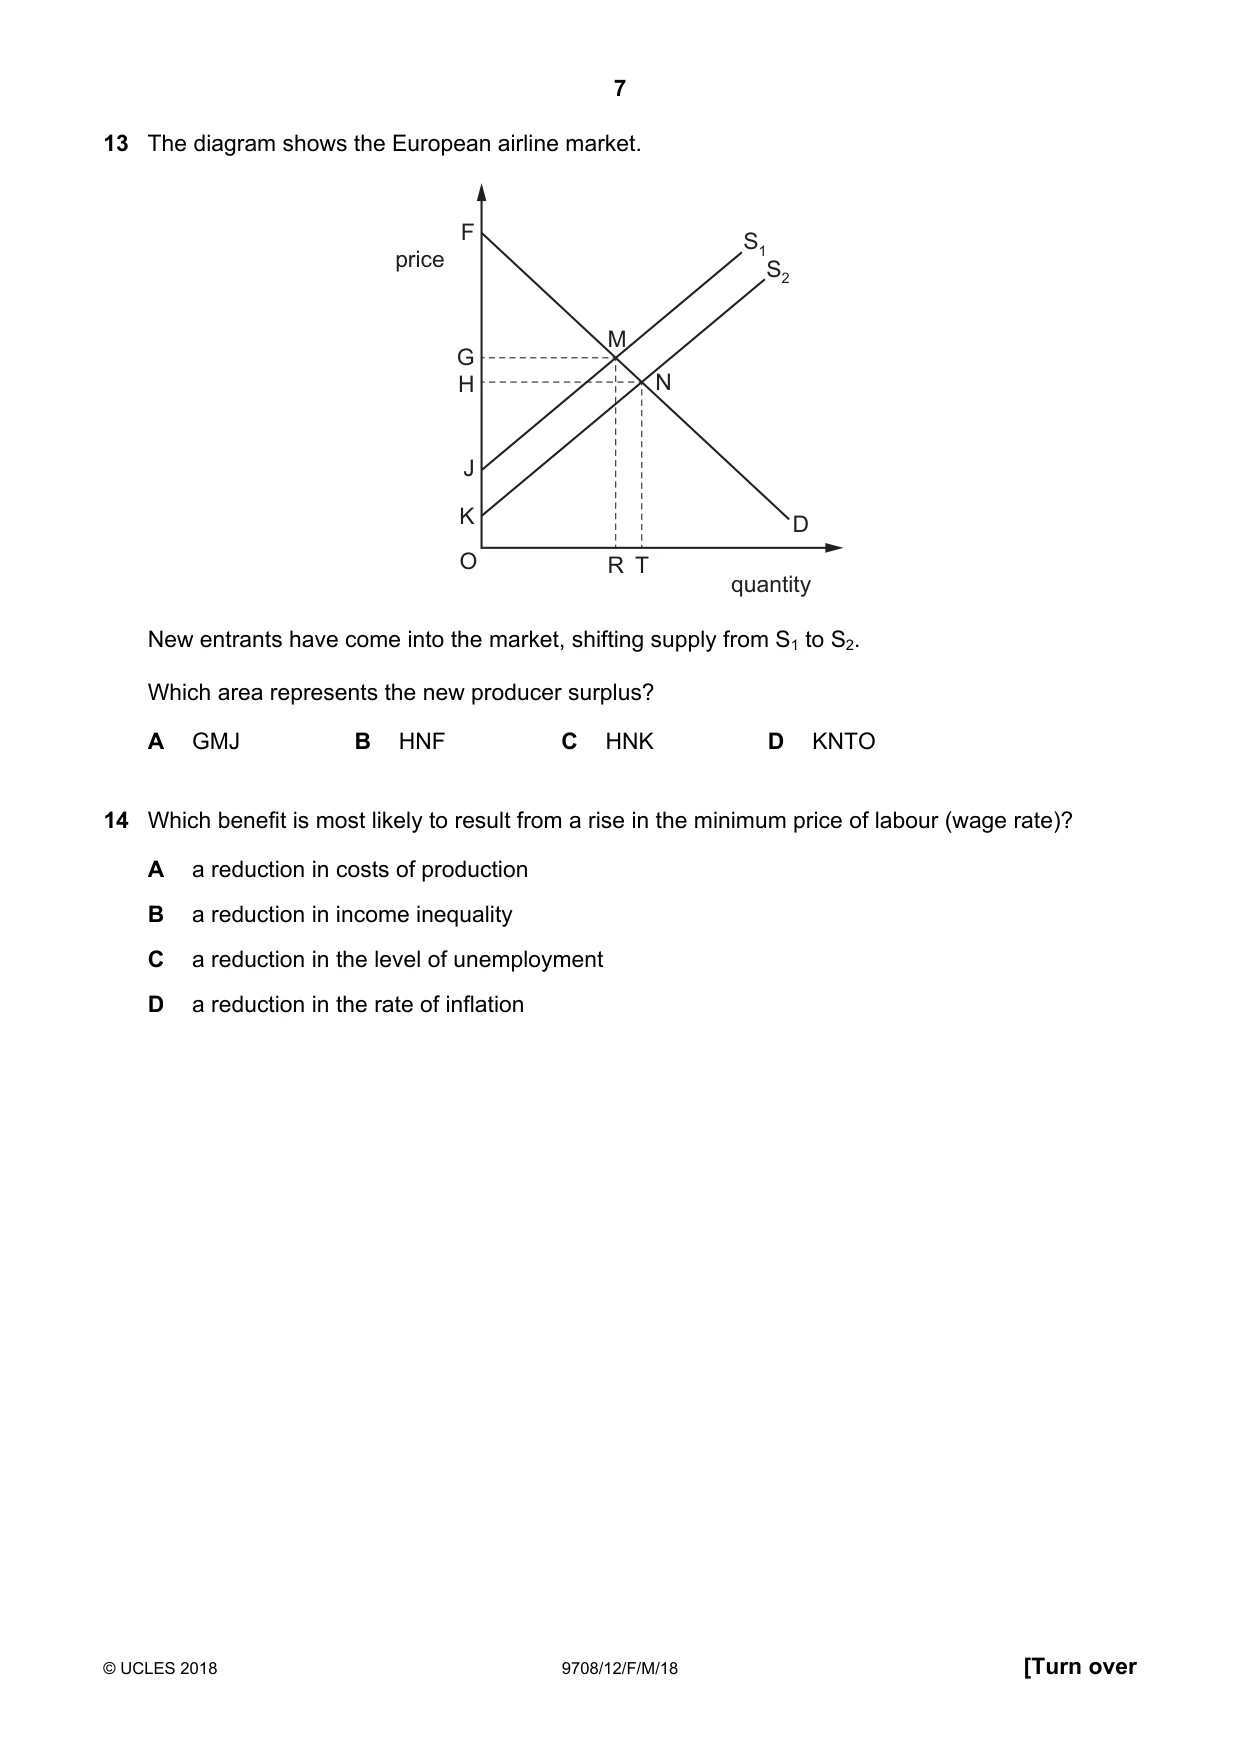
13 The diagram shows the European airline market. F S1 price S2 M G H N J K D O R T quantity New entrants have come into the market, shifting supply from S1 to S2. Which area represents the new producer surplus? A GMJ B HNF C HNK D KNTO
Mark scheme: C
Q14 · Which benefit is most likely to result from a rise in the minimum price of labour (wage…
14 Which benefit is most likely to result from a rise in the minimum price of labour (wage rate)? A a reduction in costs of production B a reduction in income inequality C a reduction in the level of unemployment D a reduction in the rate of inflation
Mark scheme: B
Q15 · The diagram shows the equilibrium price and quantity of good X
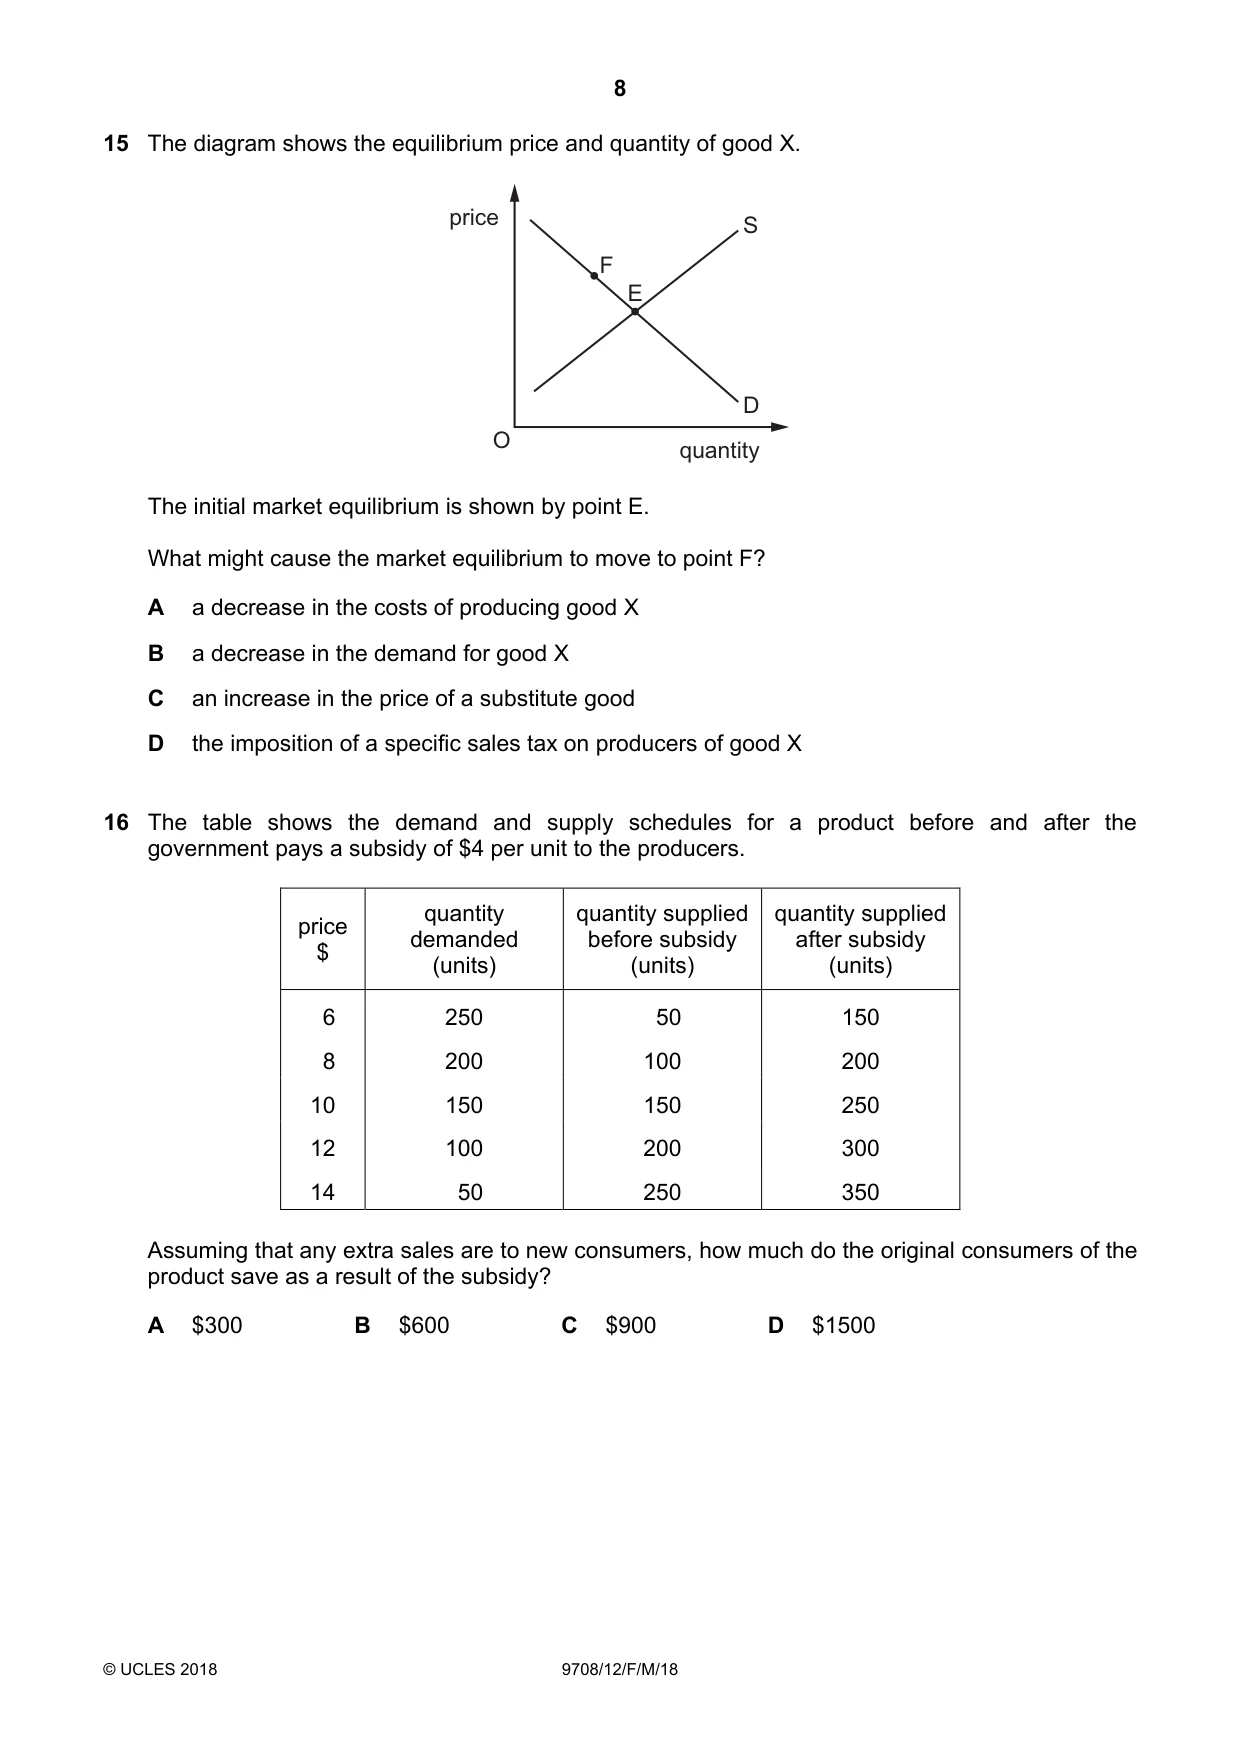
15 The diagram shows the equilibrium price and quantity of good X. price S F E D O quantity The initial market equilibrium is shown by point E. What might cause the market equilibrium to move to point F? A a decrease in the costs of producing good X B a decrease in the demand for good X C an increase in the price of a substitute good D the imposition of a specific sales tax on producers of good X
Mark scheme: D
More questions on Methods and effects of government intervention in markets
Q16 · The table shows the demand and supply schedules for a product before and after the…
16 The table shows the demand and supply schedules for a product before and after the government pays a subsidy of $4 per unit to the producers. quantity quantity supplied quantity supplied price demanded before subsidy after subsidy $ (units) (units) (units) 6 250 50 150 8 200 100 200 10 150 150 250 12 100 200 300 14 50 250 350 Assuming that any extra sales are to new consumers, how much do the original consumers of the product save as a result of the subsidy? A $300 B $600 C $900 D $1500
Mark scheme: A
More questions on Methods and effects of government intervention in markets
Q17 · Which statement about transfer payments is correct?
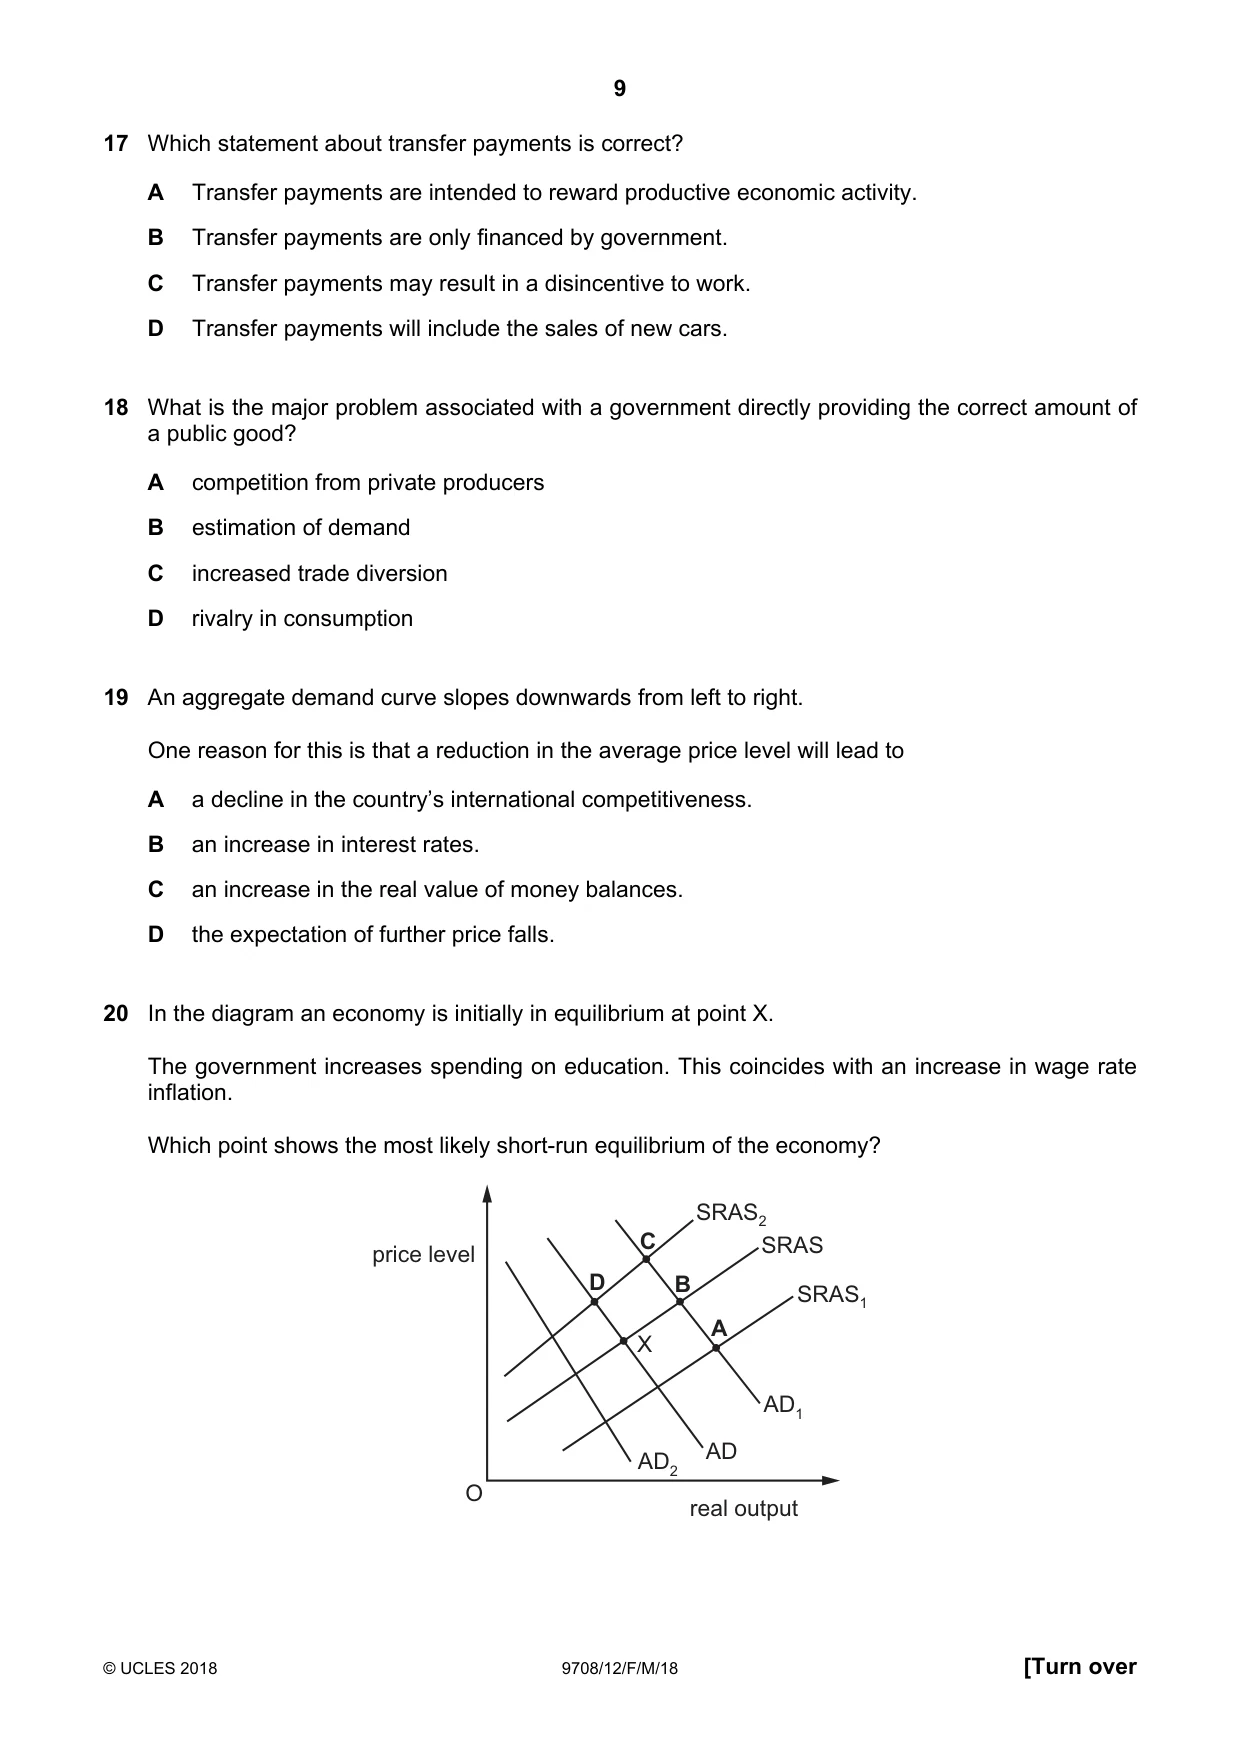
17 Which statement about transfer payments is correct? A Transfer payments are intended to reward productive economic activity. B Transfer payments are only financed by government. C Transfer payments may result in a disincentive to work. D Transfer payments will include the sales of new cars.
Mark scheme: C
Q18 · What is the major problem associated with a government directly providing the correct…
18 What is the major problem associated with a government directly providing the correct amount of a public good? A competition from private producers B estimation of demand C increased trade diversion D rivalry in consumption
Mark scheme: B
Q19 · An aggregate demand curve slopes downwards from left to right
19 An aggregate demand curve slopes downwards from left to right. One reason for this is that a reduction in the average price level will lead to A a decline in the country’s international competitiveness. B an increase in interest rates. C an increase in the real value of money balances. D the expectation of further price falls.
Mark scheme: C
More questions on Aggregate Demand and Aggregate Supply analysis
Q20 · In the diagram an economy is initially in equilibrium at point X
20 In the diagram an economy is initially in equilibrium at point X. The government increases spending on education. This coincides with an increase in wage rate inflation. Which point shows the most likely short-run equilibrium of the economy? SRAS2 C SRAS price level D B SRAS1 A X AD1 AD AD2 O real output
Mark scheme: C
More questions on Aggregate Demand and Aggregate Supply analysis
Q21 · During one year the national output of a country valued in terms of money prices…
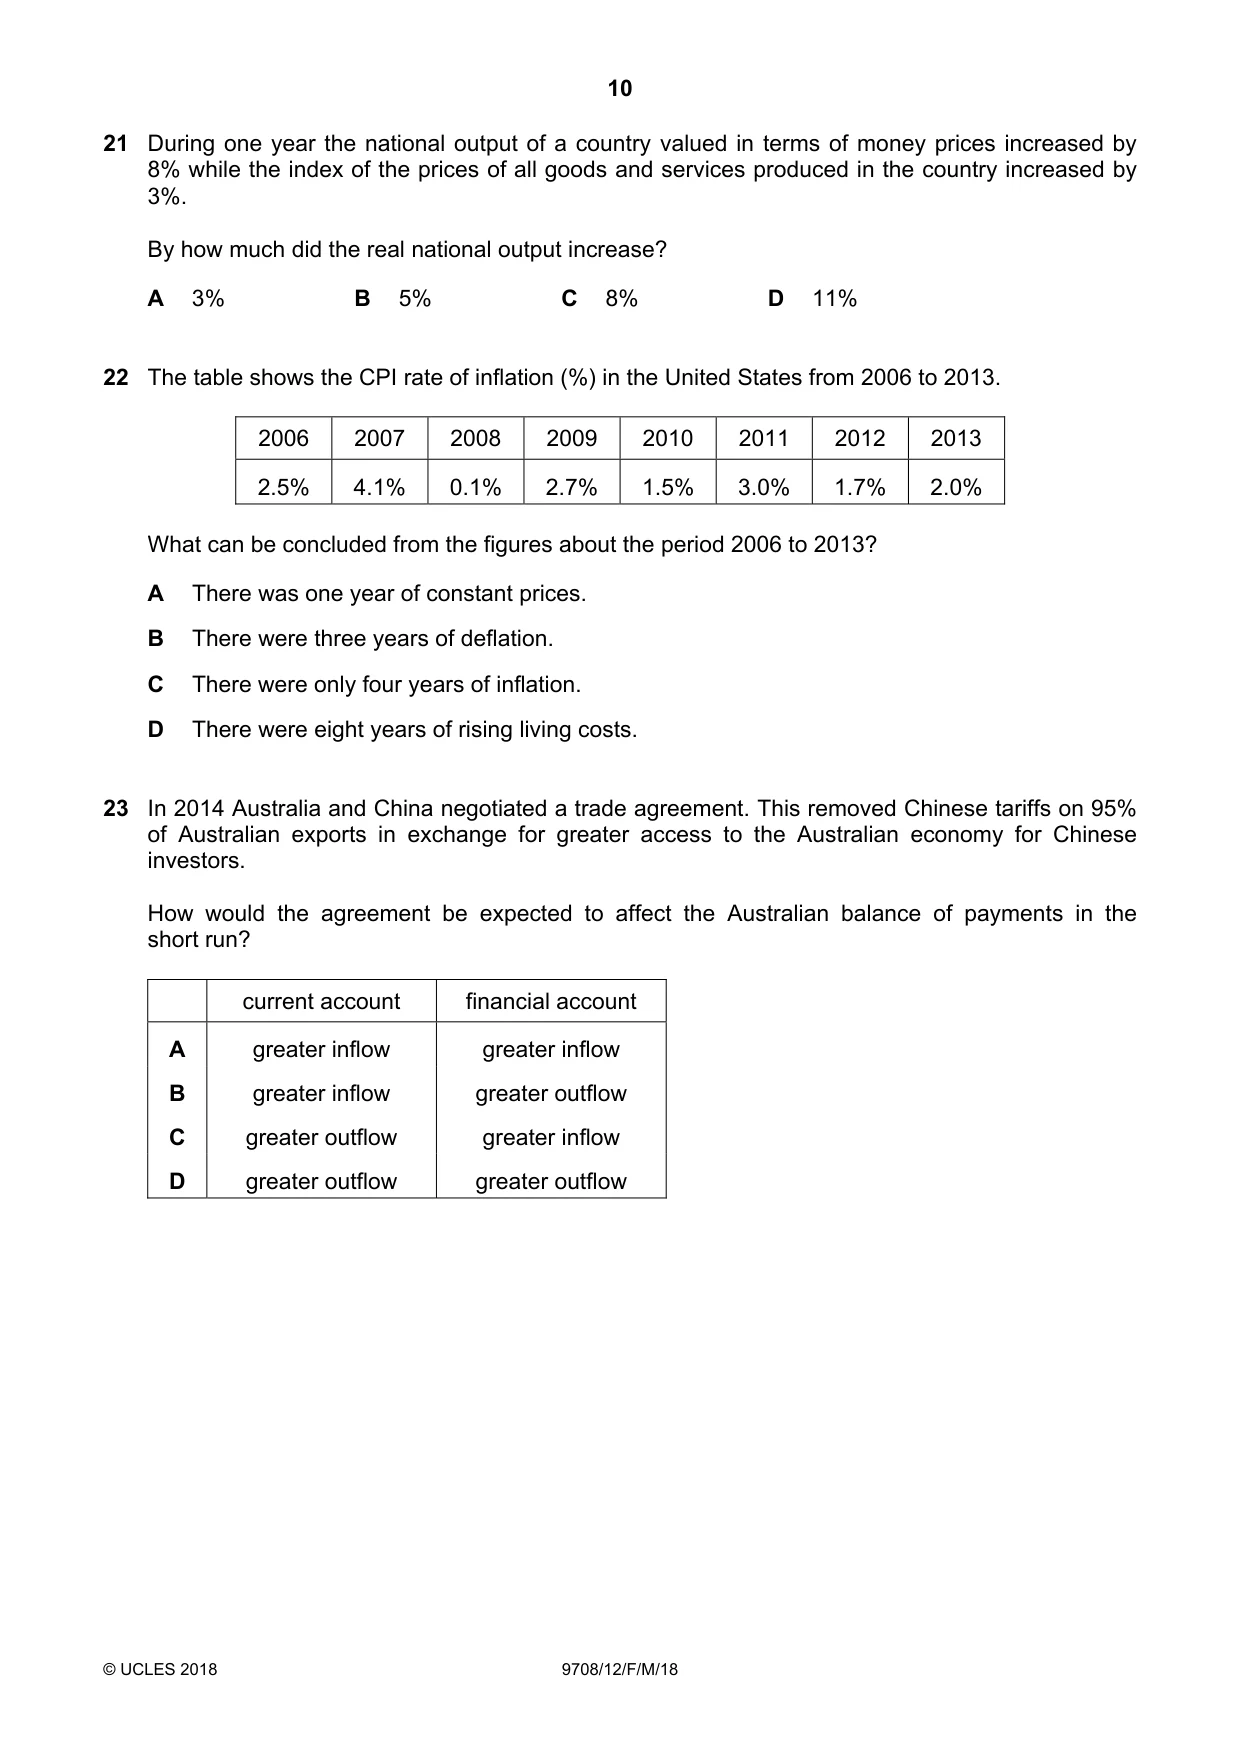
21 During one year the national output of a country valued in terms of money prices increased by 8% while the index of the prices of all goods and services produced in the country increased by 3%. By how much did the real national output increase? A 3% B 5% C 8% D 11%
Mark scheme: B
Q22 · The table shows the CPI rate of inflation (%) in the United States from 2006 to 2013
22 The table shows the CPI rate of inflation (%) in the United States from 2006 to 2013. 2006 2007 2008 2009 2010 2011 2012 2013 2.5% 4.1% 0.1% 2.7% 1.5% 3.0% 1.7% 2.0% What can be concluded from the figures about the period 2006 to 2013? A There was one year of constant prices. B There were three years of deflation. C There were only four years of inflation. D There were eight years of rising living costs.
Mark scheme: D
Q23 · In 2014 Australia and China negotiated a trade agreement
23 In 2014 Australia and China negotiated a trade agreement. This removed Chinese tariffs on 95% of Australian exports in exchange for greater access to the Australian economy for Chinese investors. How would the agreement be expected to affect the Australian balance of payments in the short run? current account financial account A greater inflow greater inflow B greater inflow greater outflow C greater outflow greater inflow D greater outflow greater outflow
Mark scheme: A
More questions on Current account of the balance of payments
Q24 · Turkey can produce a good but also imports some of the good from Egypt
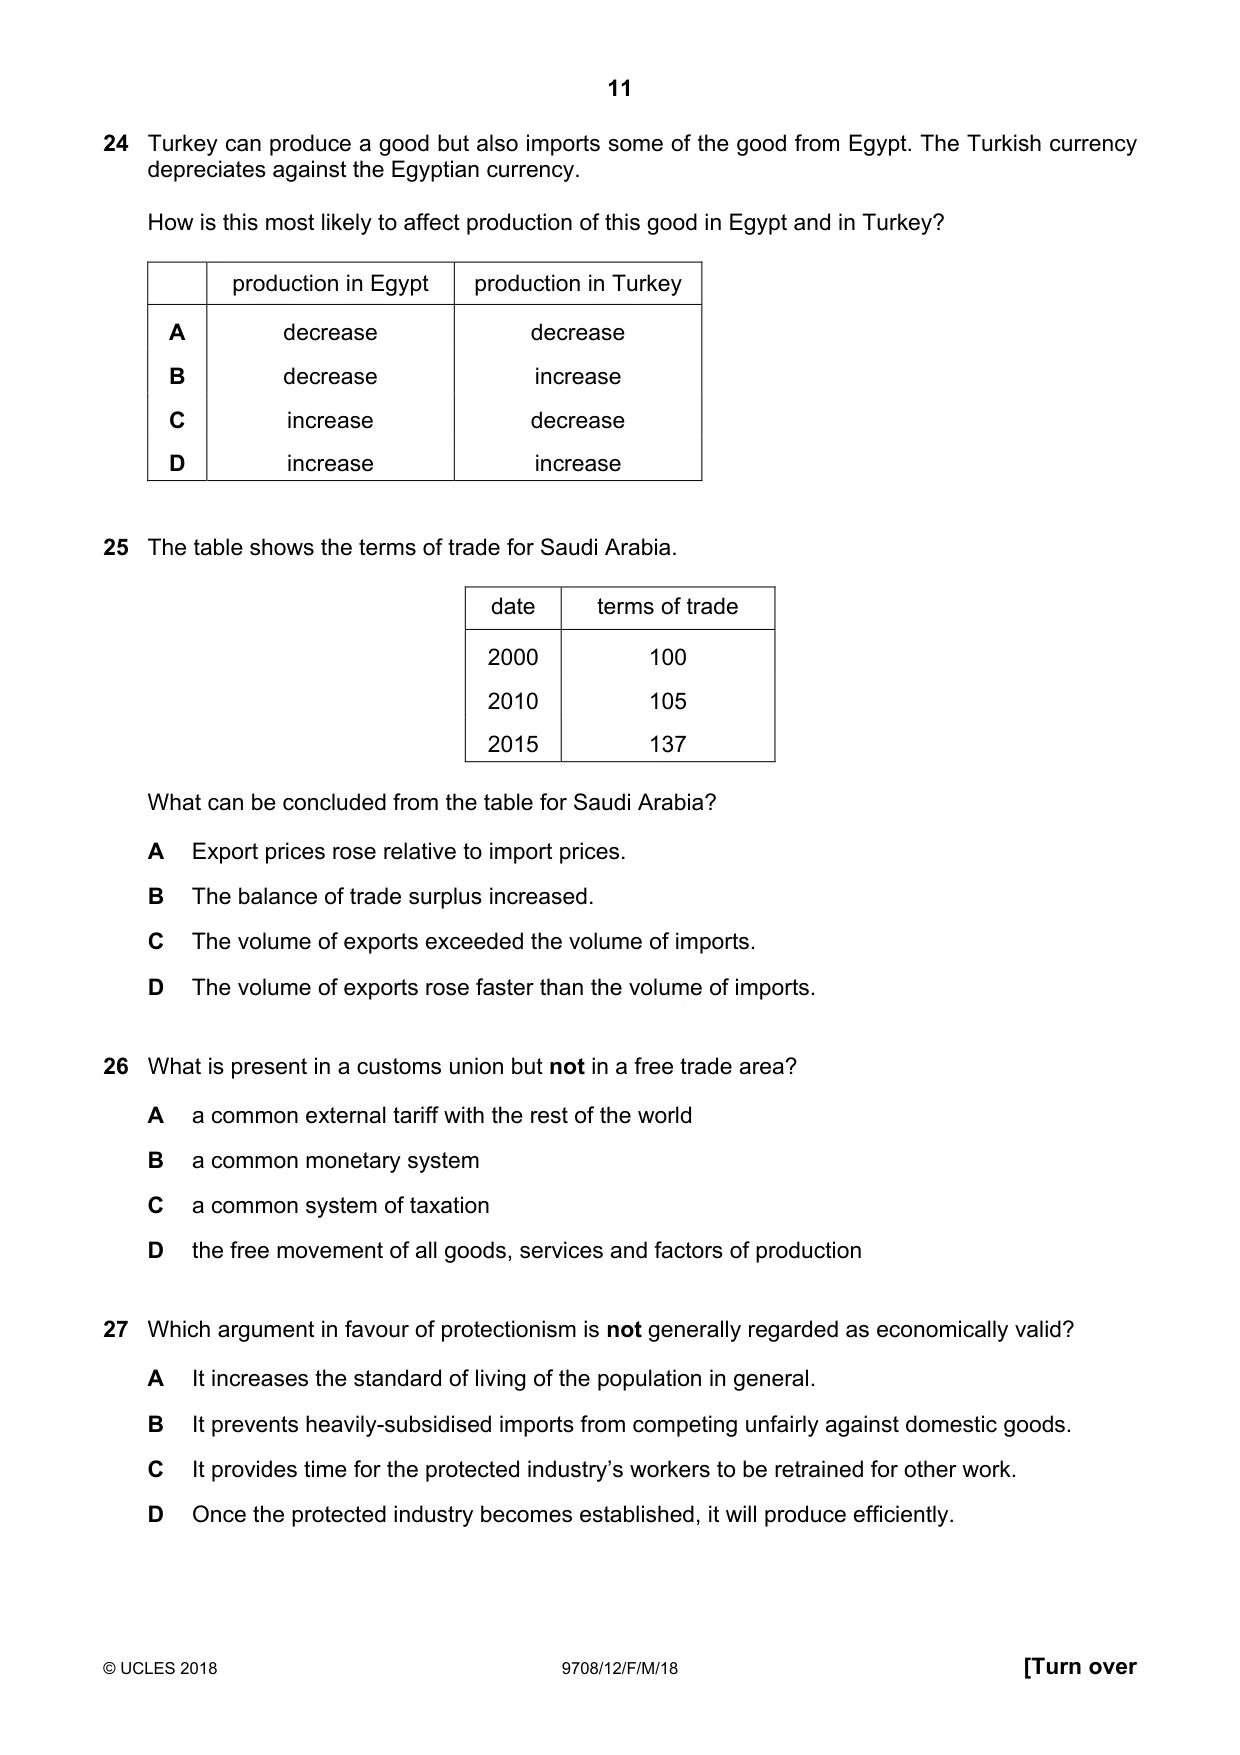
24 Turkey can produce a good but also imports some of the good from Egypt. The Turkish currency depreciates against the Egyptian currency. How is this most likely to affect production of this good in Egypt and in Turkey? production in Egypt production in Turkey A decrease decrease B decrease increase C increase decrease D increase increase
Mark scheme: B
Q25 · The table shows the terms of trade for Saudi Arabia
25 The table shows the terms of trade for Saudi Arabia. date terms of trade 2000 100 2010 105 2015 137 What can be concluded from the table for Saudi Arabia? A Export prices rose relative to import prices. B The balance of trade surplus increased. C The volume of exports exceeded the volume of imports. D The volume of exports rose faster than the volume of imports.
Mark scheme: A
More questions on Current account of the balance of payments
Q26 · What is present in a customs union but not in a free trade area?
26 What is present in a customs union but not in a free trade area? A a common external tariff with the rest of the world B a common monetary system C a common system of taxation D the free movement of all goods, services and factors of production
Mark scheme: A
Q27 · Which argument in favour of protectionism is not generally regarded as economically valid?
27 Which argument in favour of protectionism is not generally regarded as economically valid? A It increases the standard of living of the population in general. B It prevents heavily-subsidised imports from competing unfairly against domestic goods. C It provides time for the protected industry’s workers to be retrained for other work. D Once the protected industry becomes established, it will produce efficiently.
Mark scheme: A
Q28 · Which action is classified as a fiscal policy measure?
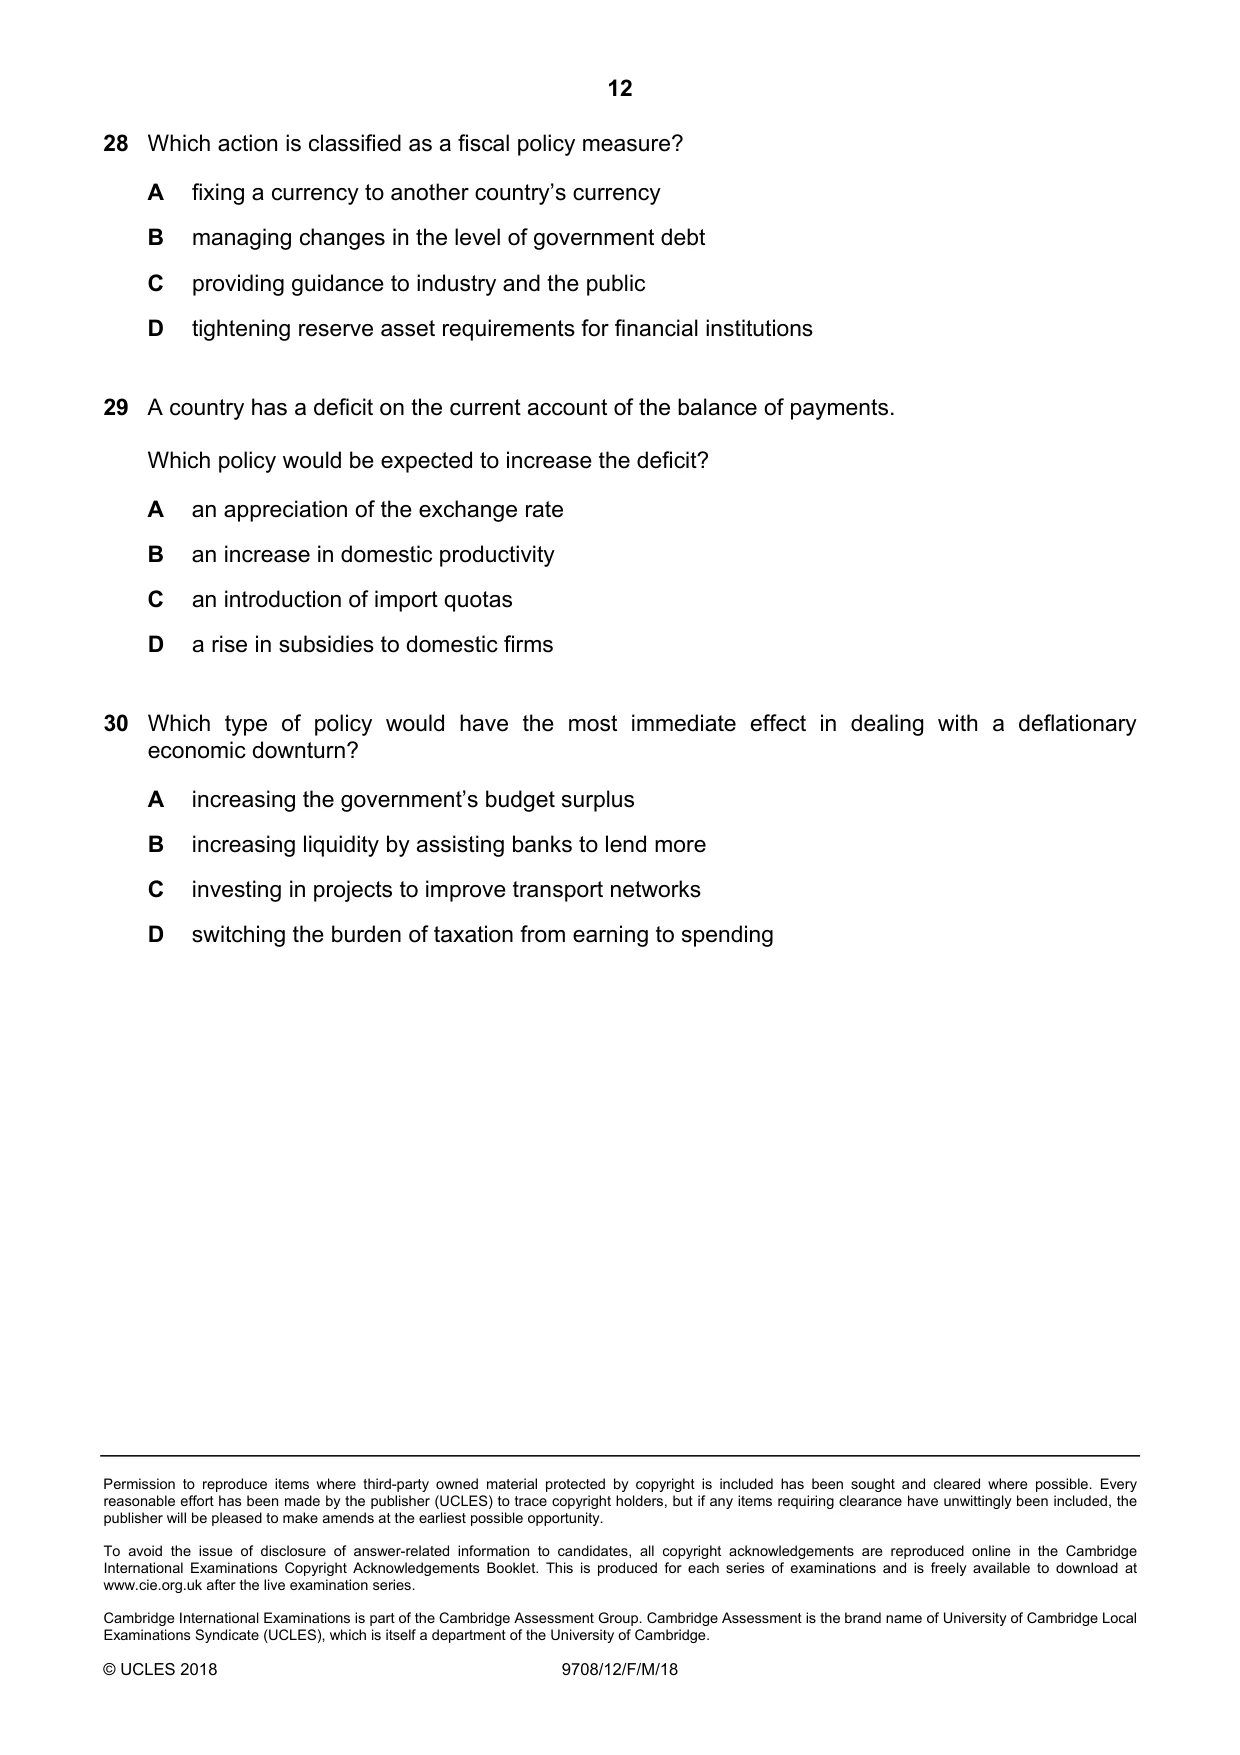
28 Which action is classified as a fiscal policy measure? A fixing a currency to another country’s currency B managing changes in the level of government debt C providing guidance to industry and the public D tightening reserve asset requirements for financial institutions
Mark scheme: B
Q29 · A country has a deficit on the current account of the balance of payments
29 A country has a deficit on the current account of the balance of payments. Which policy would be expected to increase the deficit? A an appreciation of the exchange rate B an increase in domestic productivity C an introduction of import quotas D a rise in subsidies to domestic firms
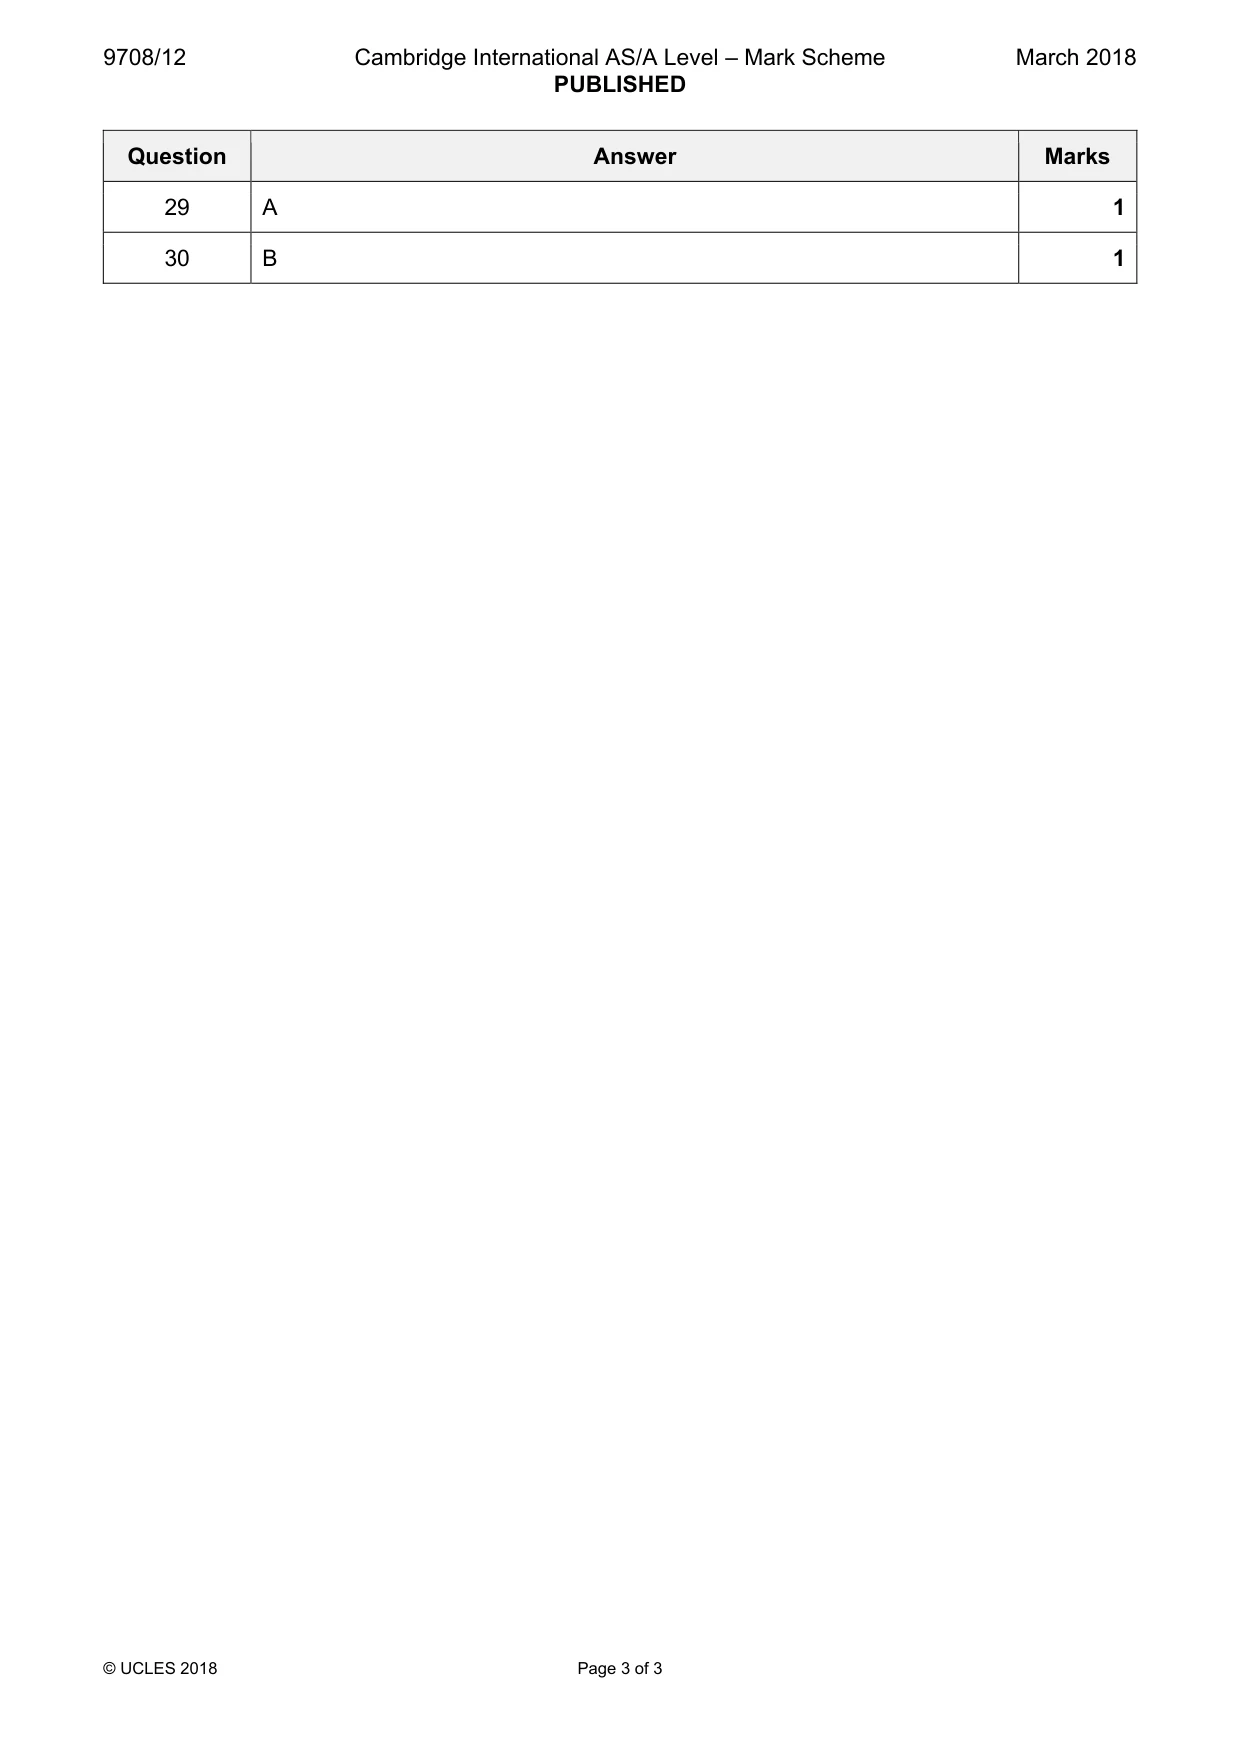
Mark scheme: A
More questions on Policies to correct imbalances in the current account of the balance of payments
Q30 · Which type of policy would have the most immediate effect in dealing with a deflationary…
30 Which type of policy would have the most immediate effect in dealing with a deflationary economic downturn? A increasing the government’s budget surplus B increasing liquidity by assisting banks to lend more C investing in projects to improve transport networks D switching the burden of taxation from earning to spending
Mark scheme: B
What was in this paper
The subtopics covered by these 30 questions, and how many questions each got. Open one in a new tab to see every Cambridge question on it.
4Addressing income and wealth inequality2Aggregate Demand and Aggregate Supply analysis2Classification of goods and services2Consumer and producer surplus2Current account of the balance of payments2Methods and effects of government intervention in markets2Demand and supply curves1Economic methodology1Exchange rates1Fiscal policy1Monetary policy1National income statistics1Policies to correct imbalances in the current account of the balance of payments1Price elasticity of supply1Price elasticity, income elasticity and cross elasticity of demand1Price stability1Production possibility curves1Protectionism1Scarcity, choice and opportunity cost1The reasons for international trade1What you needed in this session
Cambridge’s own grade thresholds for 2018 Feb/March, Paper 1 · Variant 2. A higher threshold means an easier paper — the bar moves with how the cohort did.