Cambridge A Level Economics 9708 — 2023 May/June Paper 1 · Variant 3
9708/13/M/J/23 · 30 questions · 30 marks · ≈34 min
The question paper and its mark scheme, free to read here and free to download. This is Cambridge’s own paper, exactly as it was sat.
Question paper12 pages
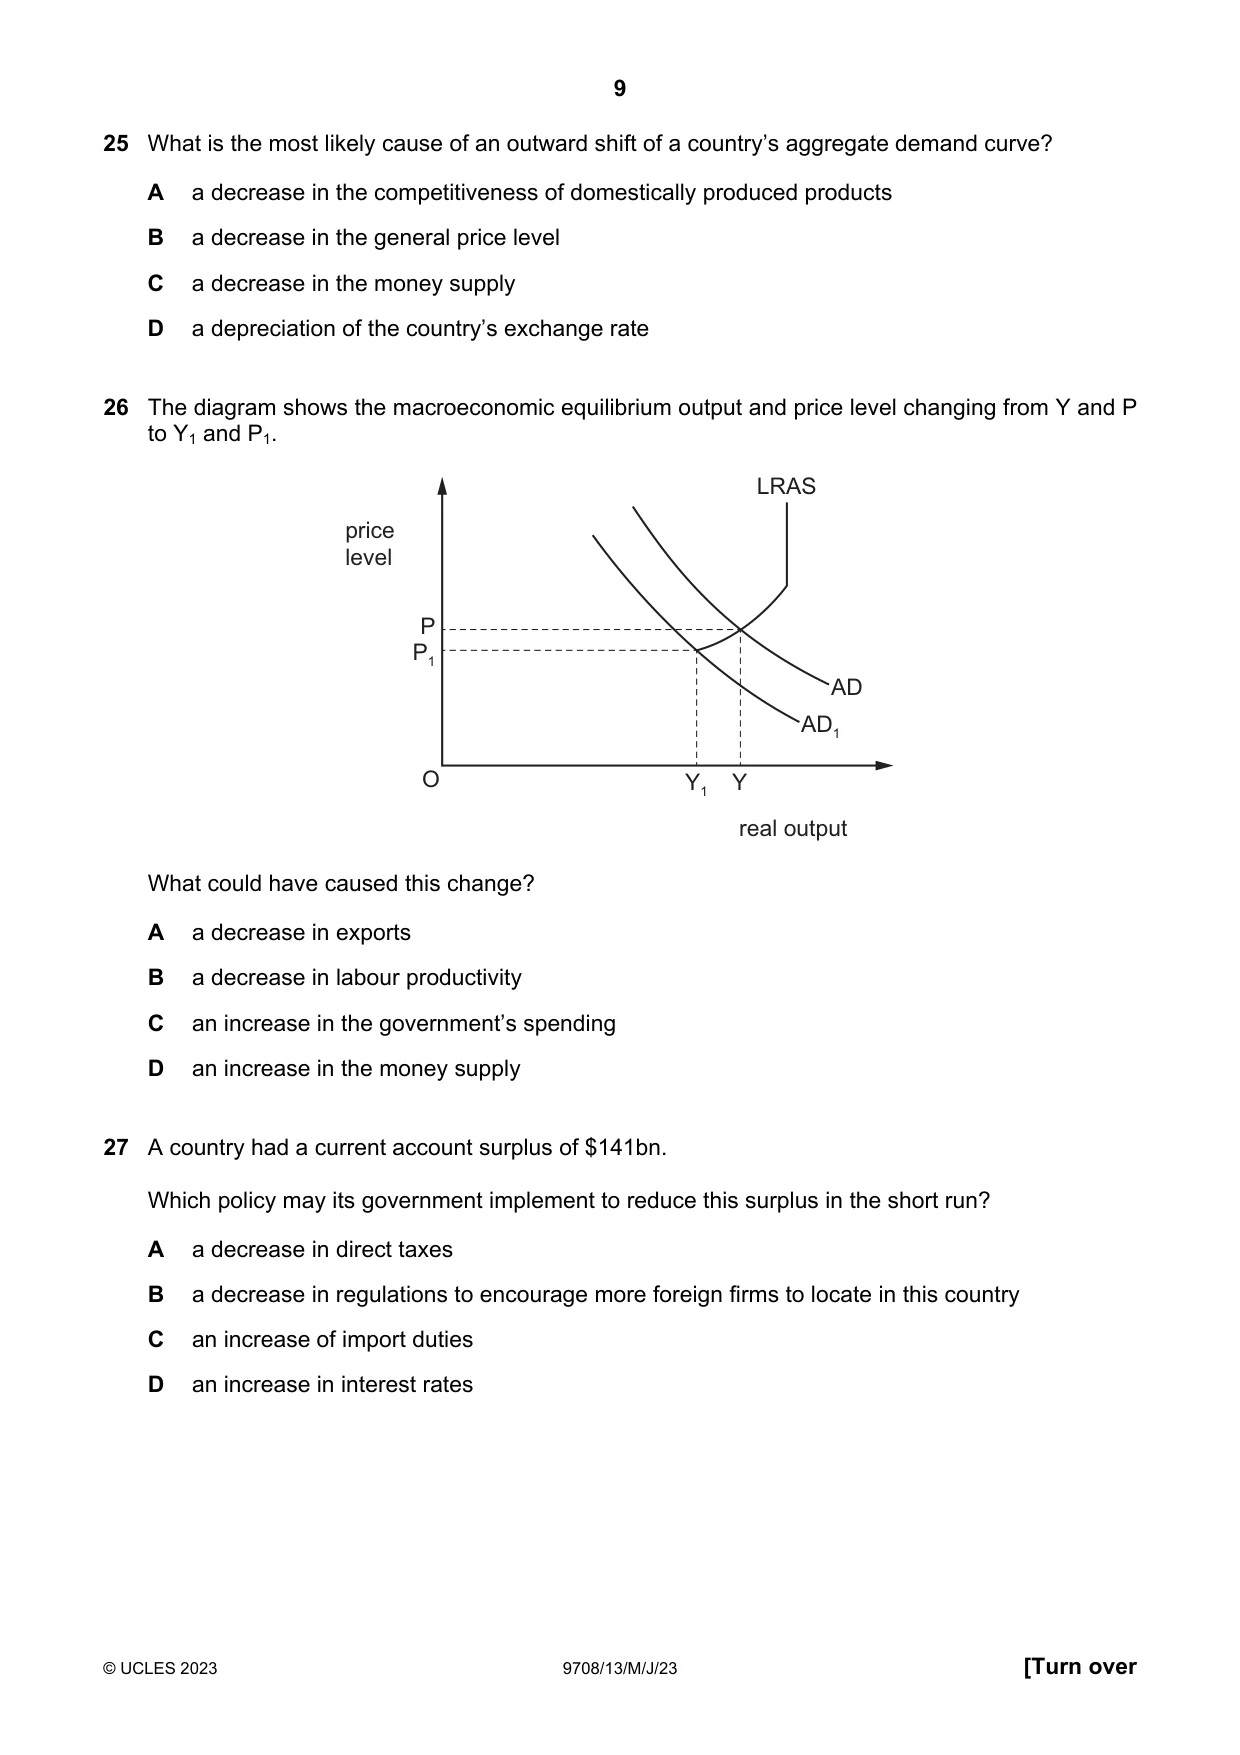
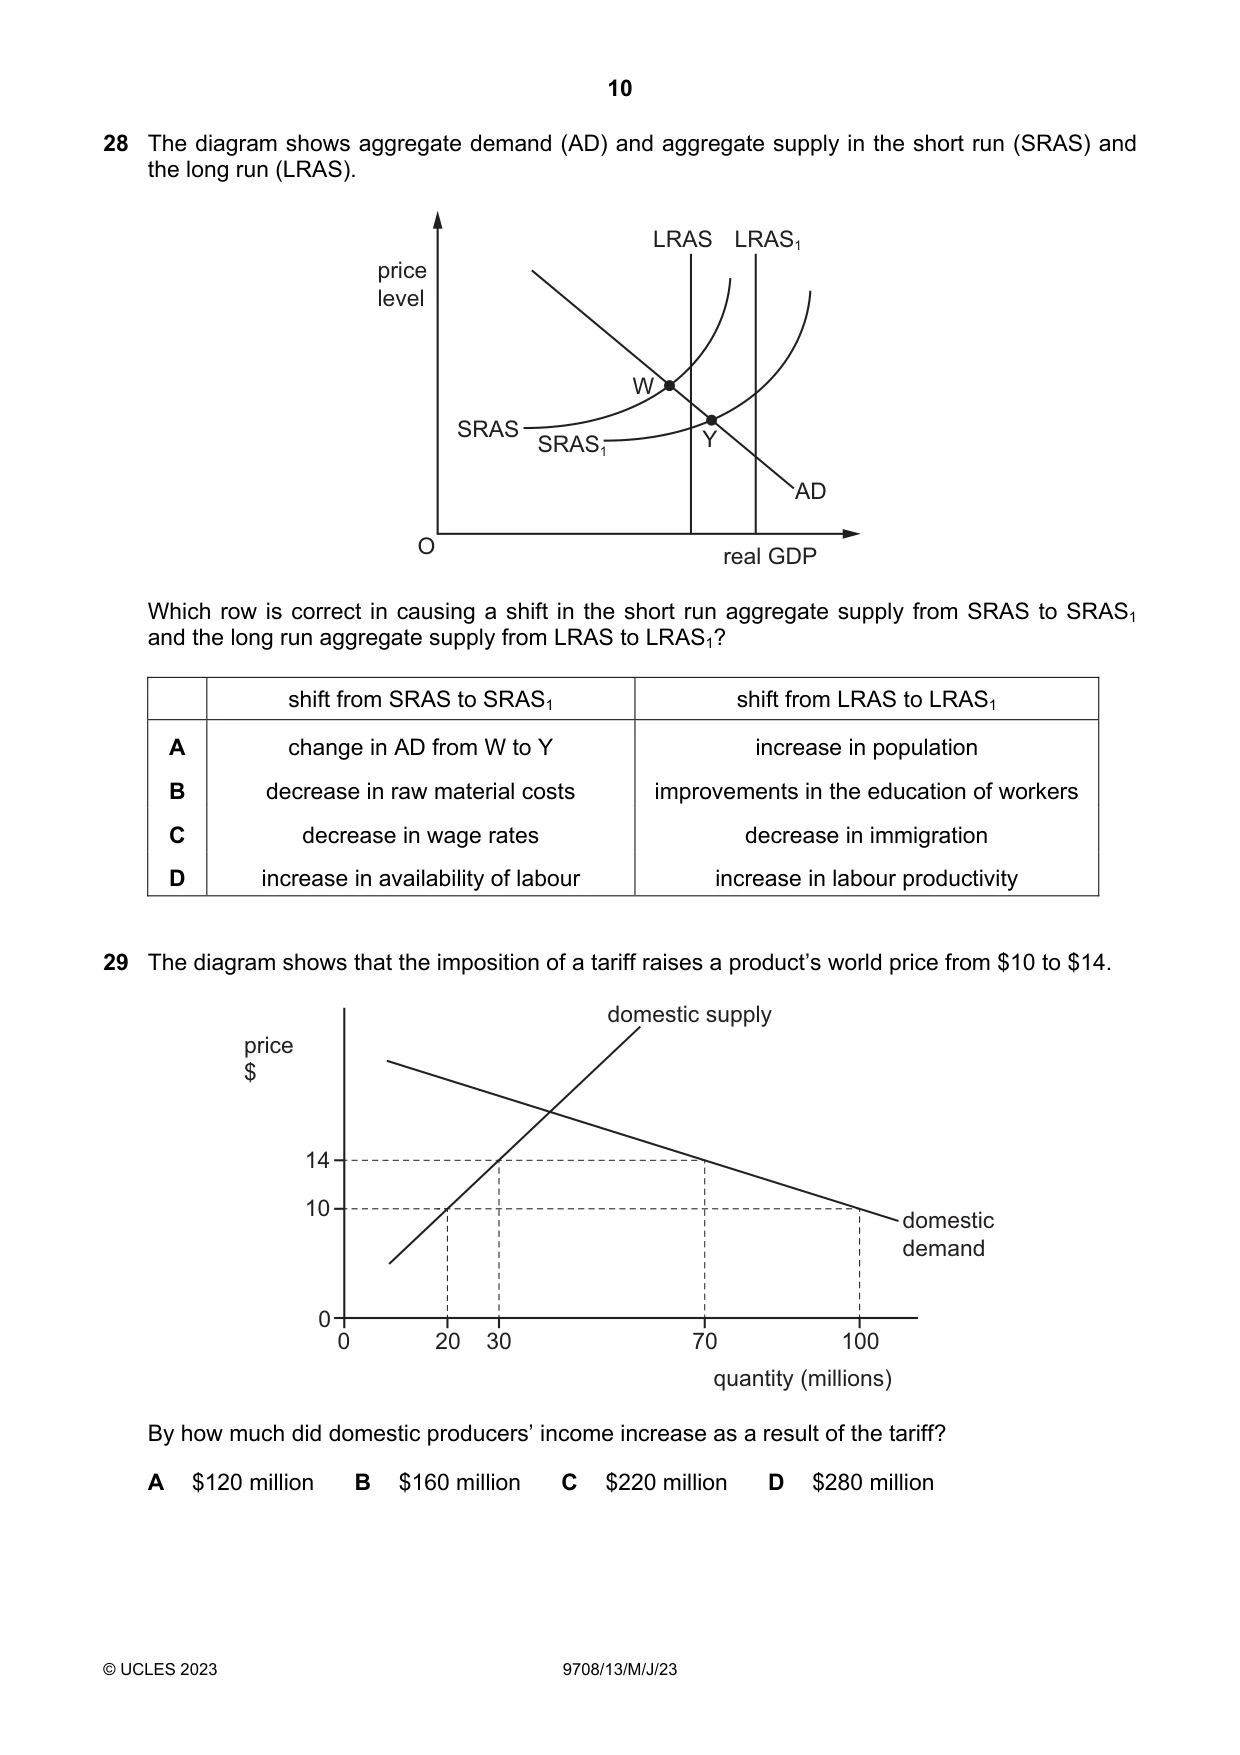
Mark scheme3 pages
Answers below. Sit the paper first if you are practising.
Questions as text
Q1 · People plant flowers in a local park
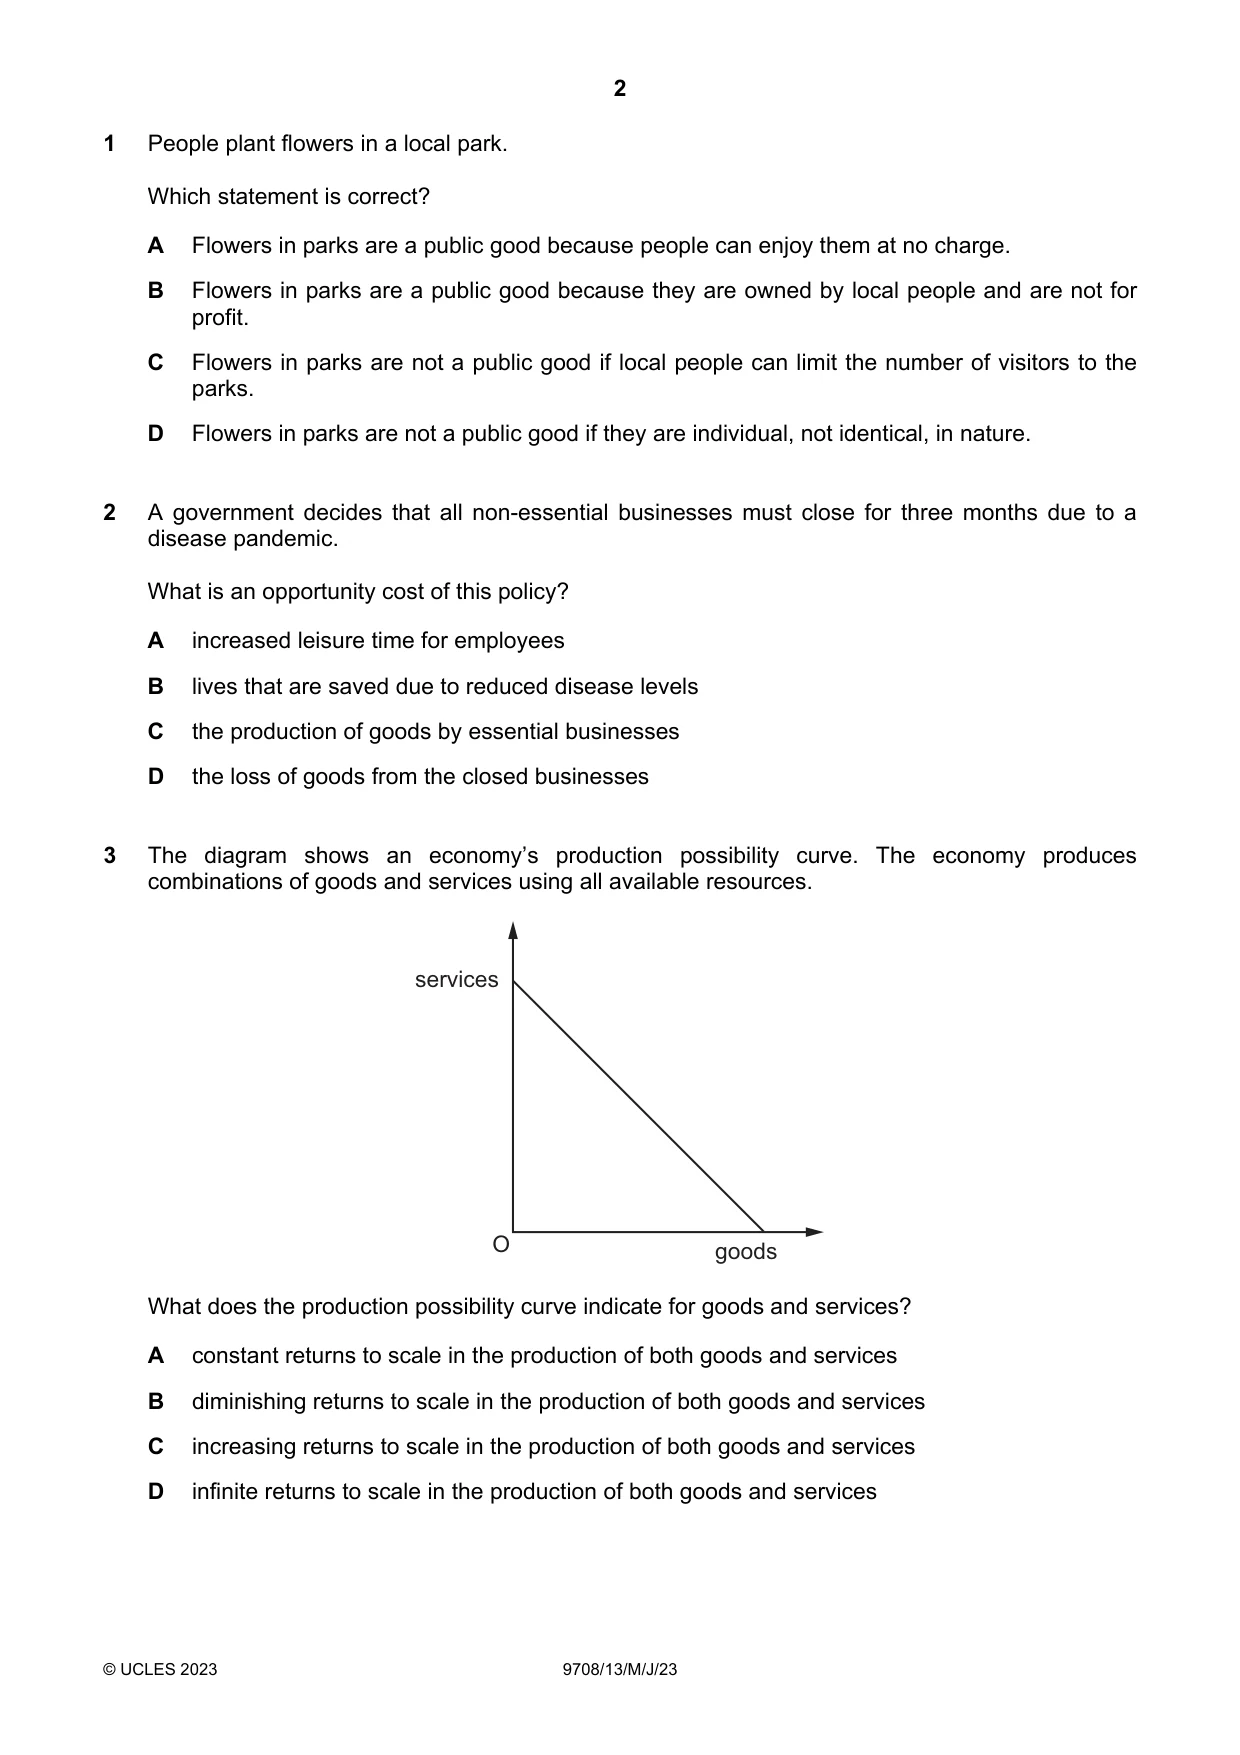
1 People plant flowers in a local park. Which statement is correct? A Flowers in parks are a public good because people can enjoy them at no charge. B Flowers in parks are a public good because they are owned by local people and are not for profit. C Flowers in parks are not a public good if local people can limit the number of visitors to the parks. D Flowers in parks are not a public good if they are individual, not identical, in nature.
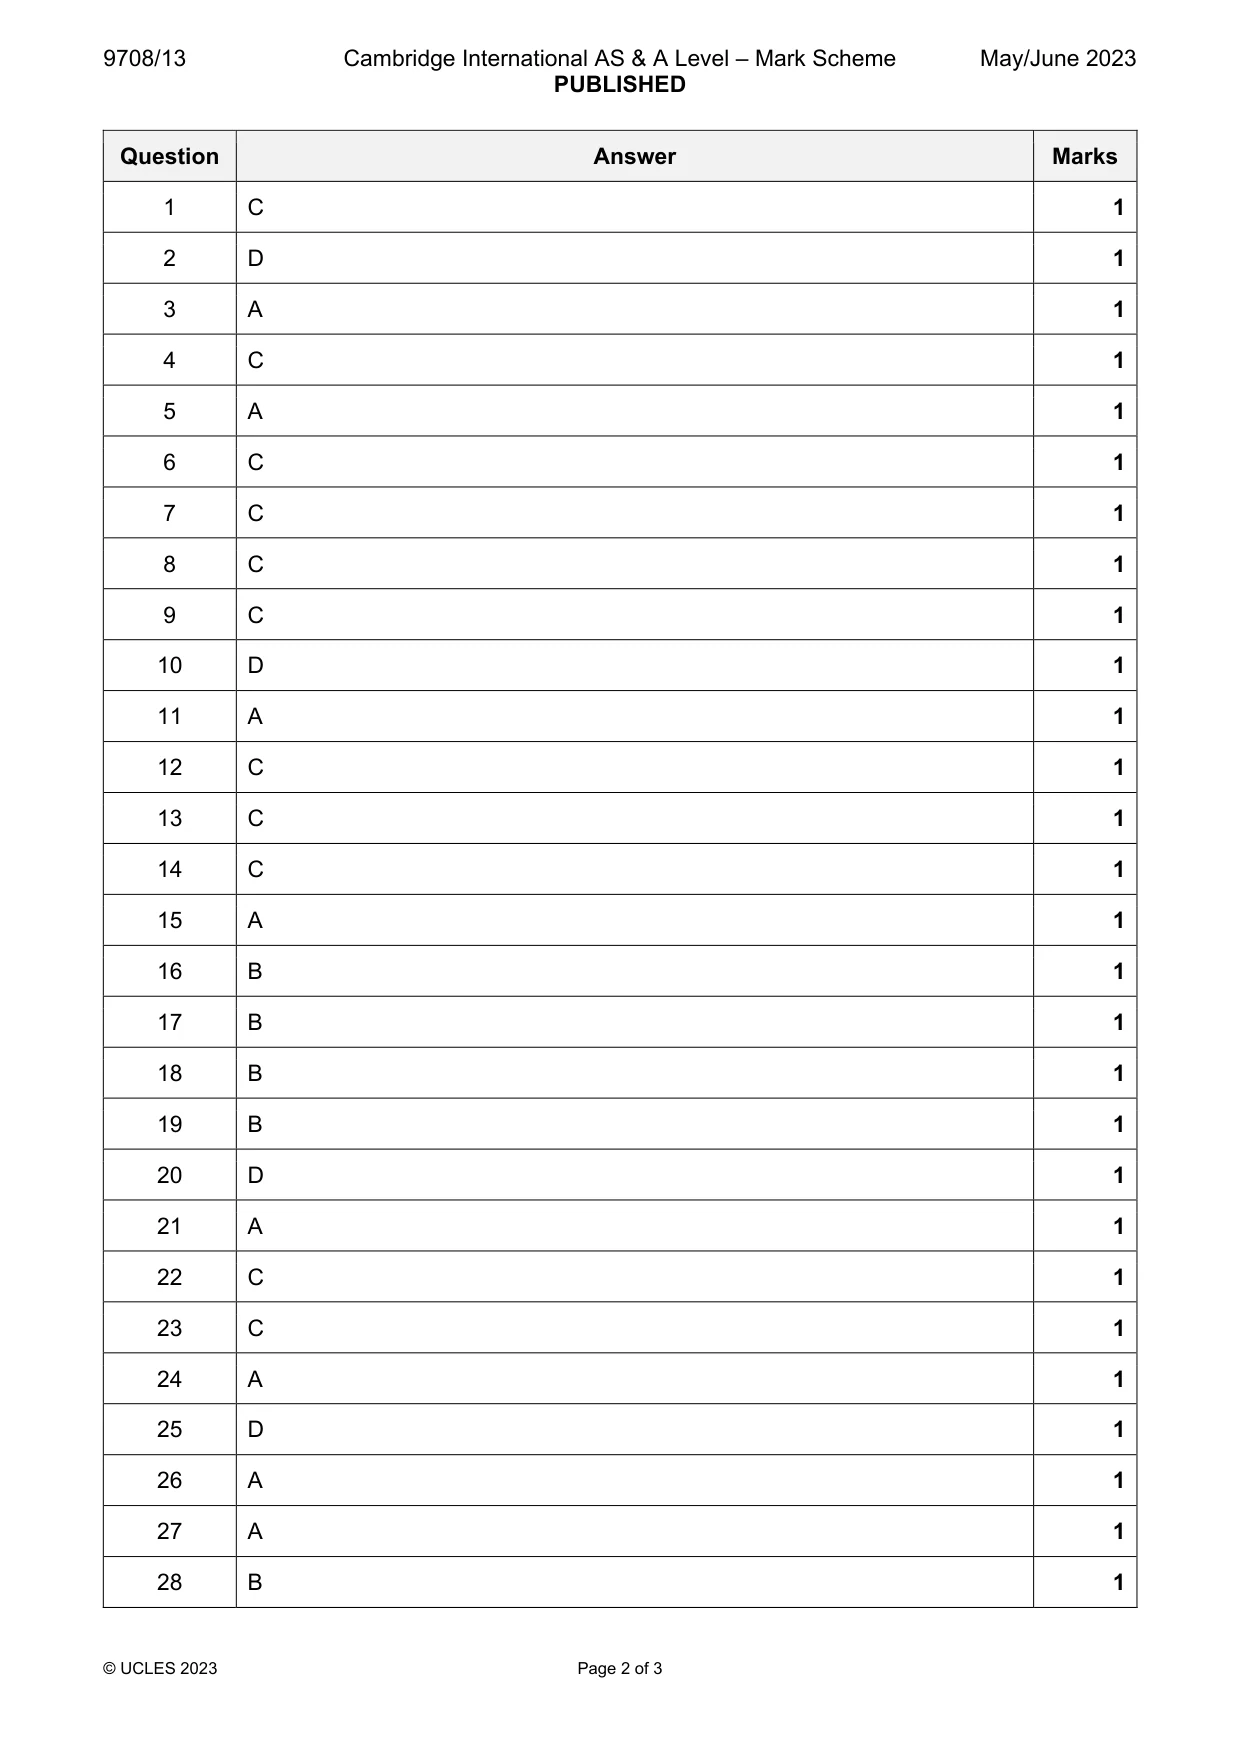
Mark scheme: C
Q2 · A government decides that all non-essential businesses must close for three months due to…
2 A government decides that all non-essential businesses must close for three months due to a disease pandemic. What is an opportunity cost of this policy? A increased leisure time for employees B lives that are saved due to reduced disease levels C the production of goods by essential businesses D the loss of goods from the closed businesses
Mark scheme: D
Q3 · The diagram shows an economy’s production possibility curve
3 The diagram shows an economy’s production possibility curve. The economy produces combinations of goods and services using all available resources. services O goods What does the production possibility curve indicate for goods and services? A constant returns to scale in the production of both goods and services B diminishing returns to scale in the production of both goods and services C increasing returns to scale in the production of both goods and services D infinite returns to scale in the production of both goods and services
Mark scheme: A
Q4 · Which economic conditions are likely to encourage an increase in enterprise?
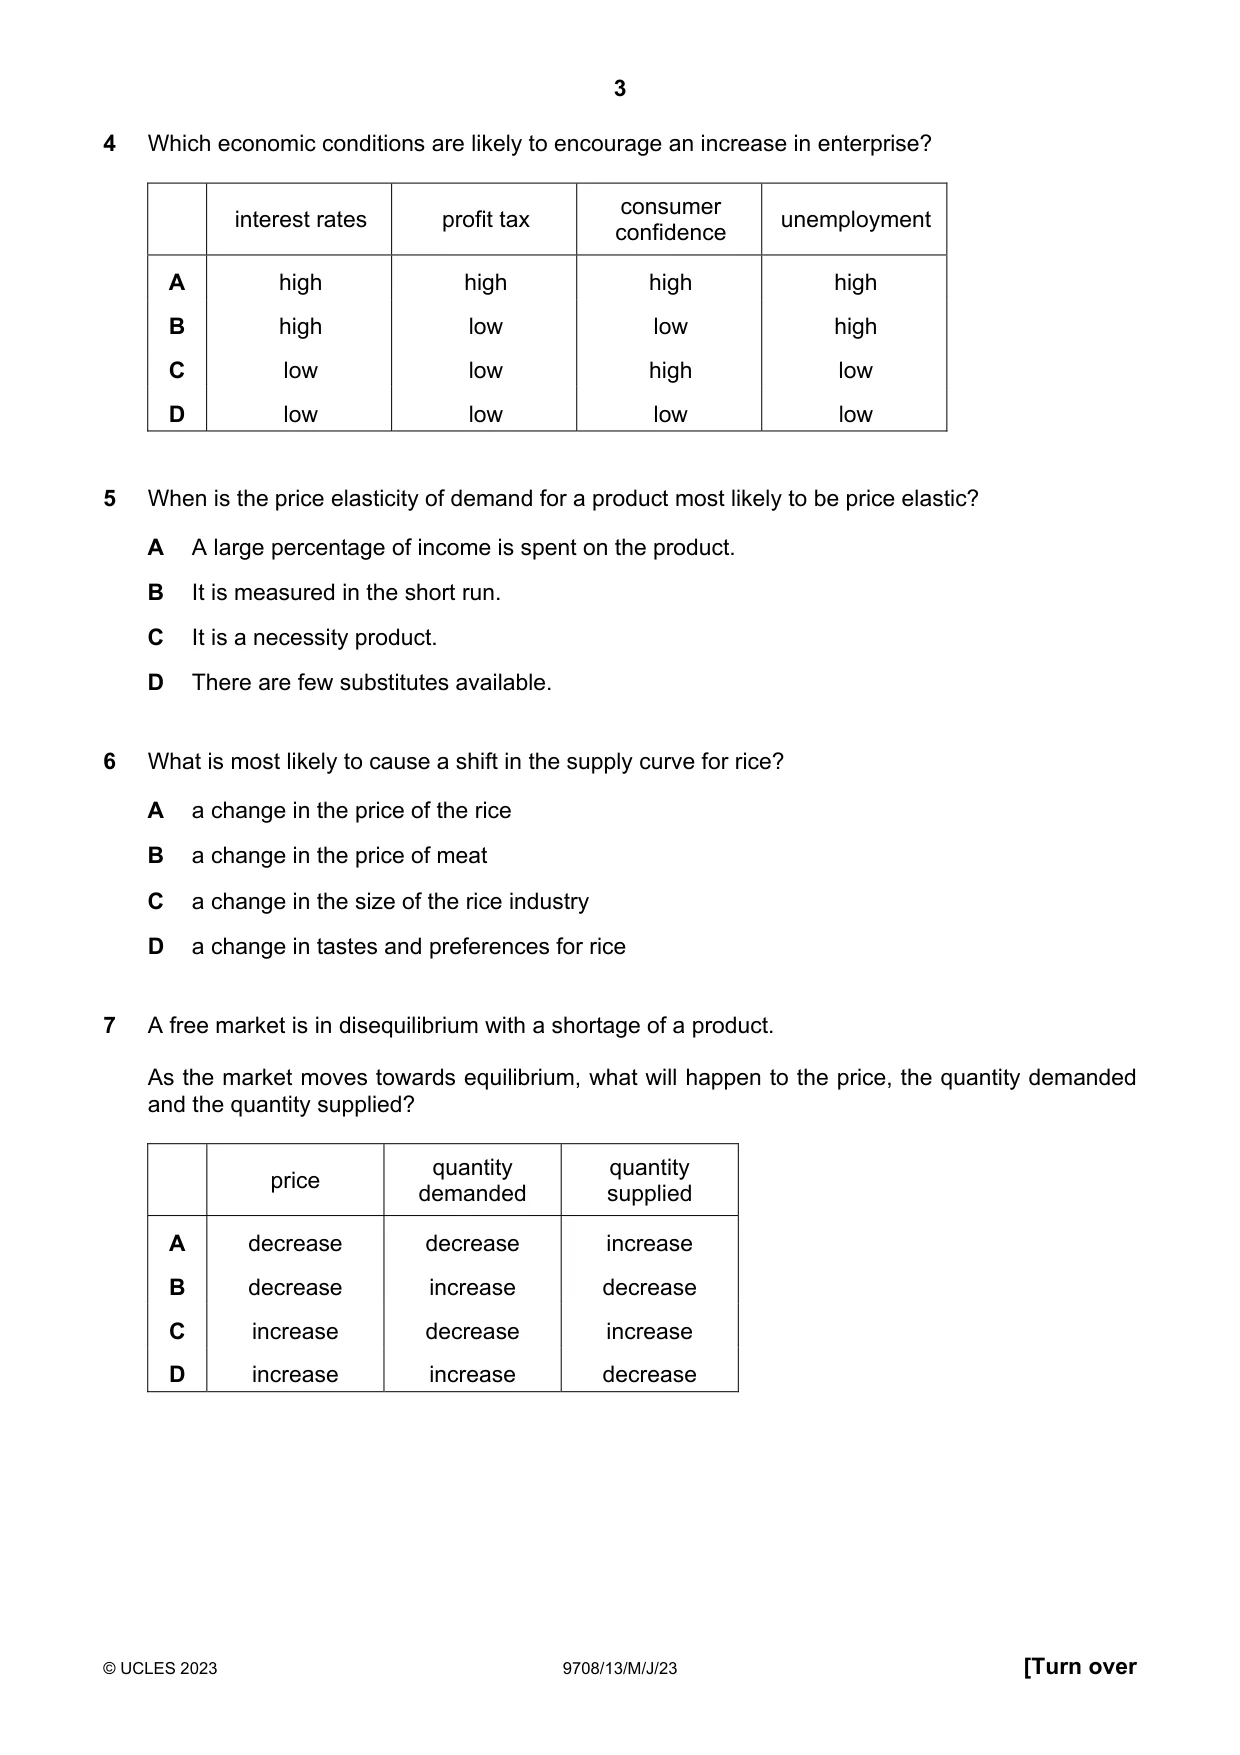
4 Which economic conditions are likely to encourage an increase in enterprise? consumer interest rates profit tax unemployment confidence A high high high high B high low low high C low low high low D low low low low
Mark scheme: C
Q5 · When is the price elasticity of demand for a product most likely to be price elastic?
5 When is the price elasticity of demand for a product most likely to be price elastic? A A large percentage of income is spent on the product. B It is measured in the short run. C It is a necessity product. D There are few substitutes available.
Mark scheme: A
More questions on Price elasticity, income elasticity and cross elasticity of demand
Q6 · What is most likely to cause a shift in the supply curve for rice?
6 What is most likely to cause a shift in the supply curve for rice? A a change in the price of the rice B a change in the price of meat C a change in the size of the rice industry D a change in tastes and preferences for rice
Mark scheme: C
Q7 · A free market is in disequilibrium with a shortage of a product
7 A free market is in disequilibrium with a shortage of a product. As the market moves towards equilibrium, what will happen to the price, the quantity demanded and the quantity supplied? quantity quantity price demanded supplied A decrease decrease increase B decrease increase decrease C increase decrease increase D increase increase decrease
Mark scheme: C
Q8 · What would not cause a shift in the demand curve for a good?
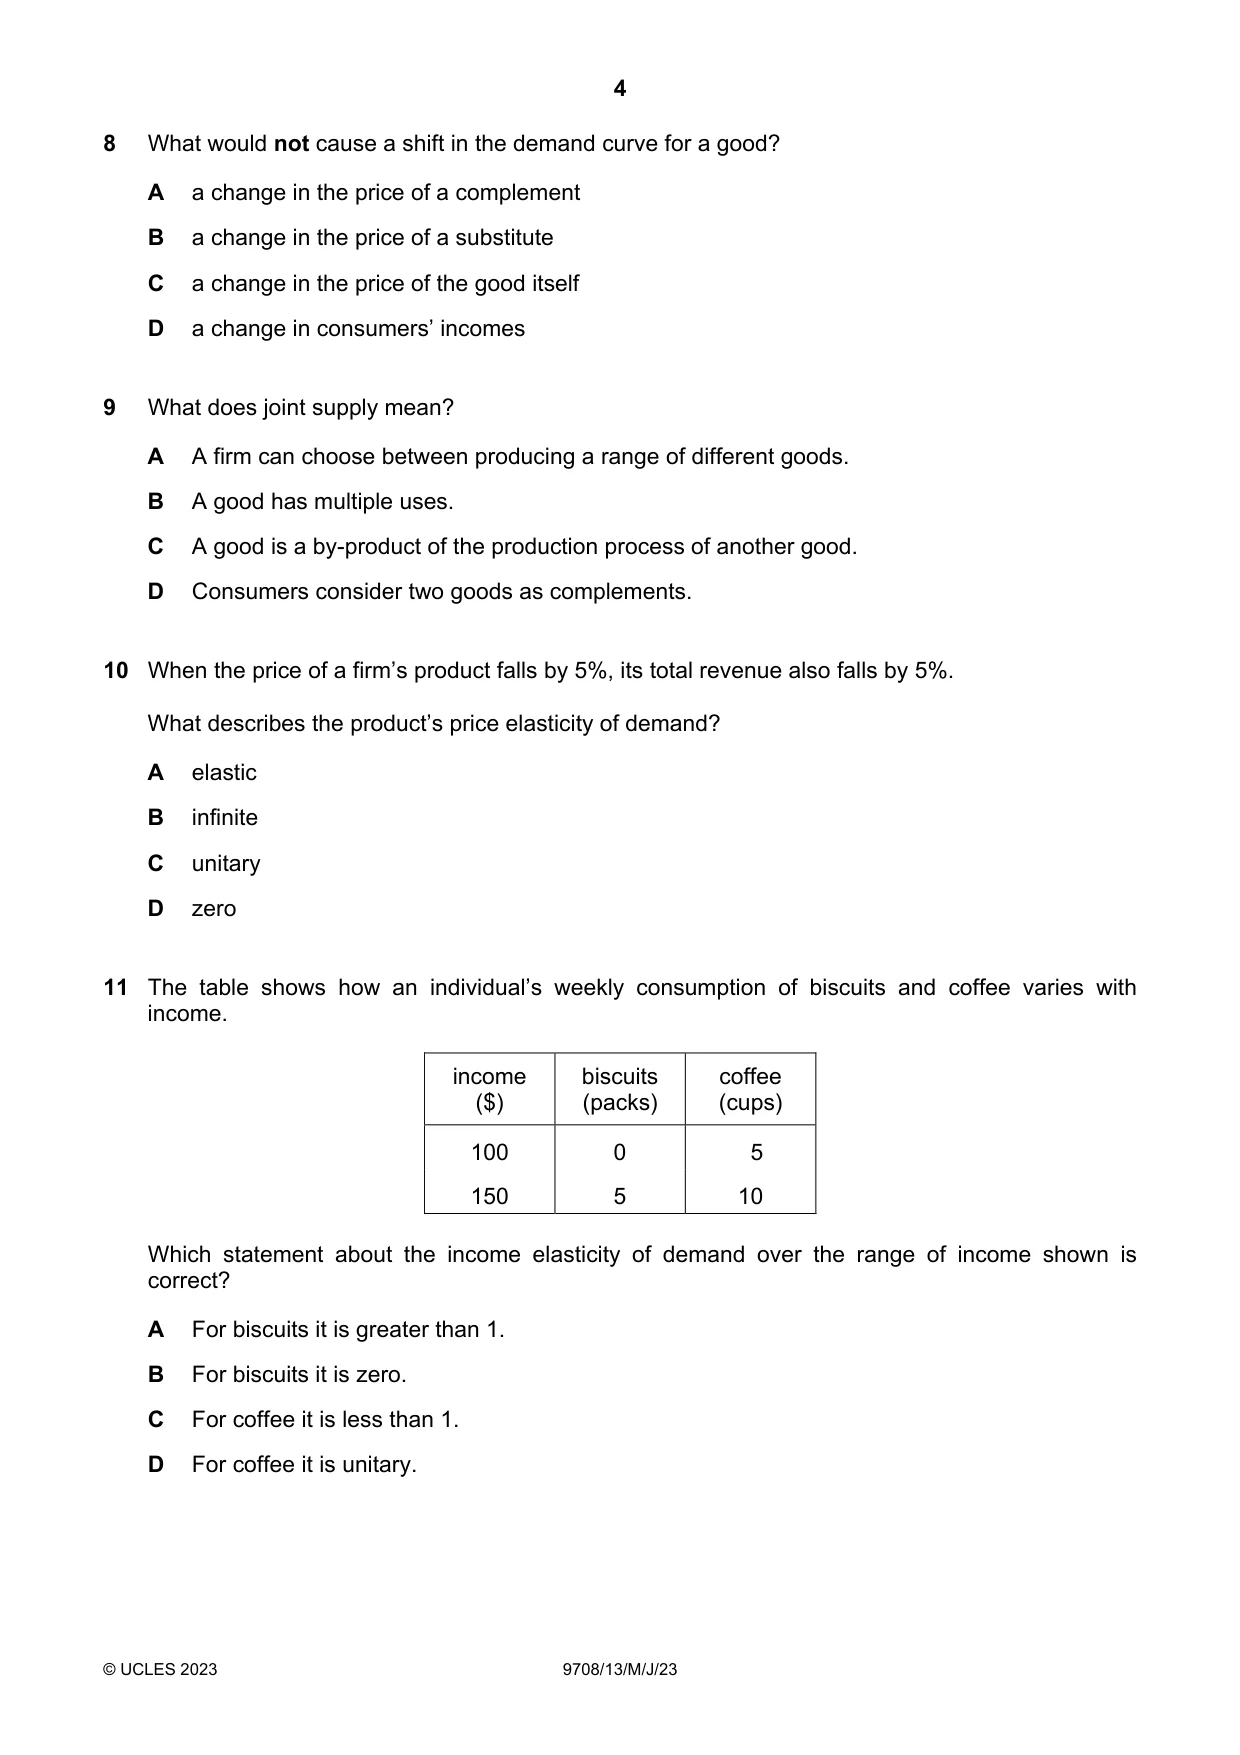
8 What would not cause a shift in the demand curve for a good? A a change in the price of a complement B a change in the price of a substitute C a change in the price of the good itself D a change in consumers’ incomes
Mark scheme: C
Q9 · What does joint supply mean?
9 What does joint supply mean? A A firm can choose between producing a range of different goods. B A good has multiple uses. C A good is a by-product of the production process of another good. D Consumers consider two goods as complements.
Mark scheme: C
Q10 · When the price of a firm’s product falls by 5%, its total revenue also falls by 5%
10 When the price of a firm’s product falls by 5%, its total revenue also falls by 5%. What describes the product’s price elasticity of demand? A elastic B infinite C unitary D zero
Mark scheme: D
More questions on Price elasticity, income elasticity and cross elasticity of demand
Q11 · The table shows how an individual’s weekly consumption of biscuits and coffee varies with…
11 The table shows how an individual’s weekly consumption of biscuits and coffee varies with income. income biscuits coffee ($) (packs) (cups) 100 0 5 150 5 10 Which statement about the income elasticity of demand over the range of income shown is correct? A For biscuits it is greater than 1. B For biscuits it is zero. C For coffee it is less than 1. D For coffee it is unitary.
Mark scheme: A
More questions on Price elasticity, income elasticity and cross elasticity of demand
Q12 · The diagram shows four supply curves
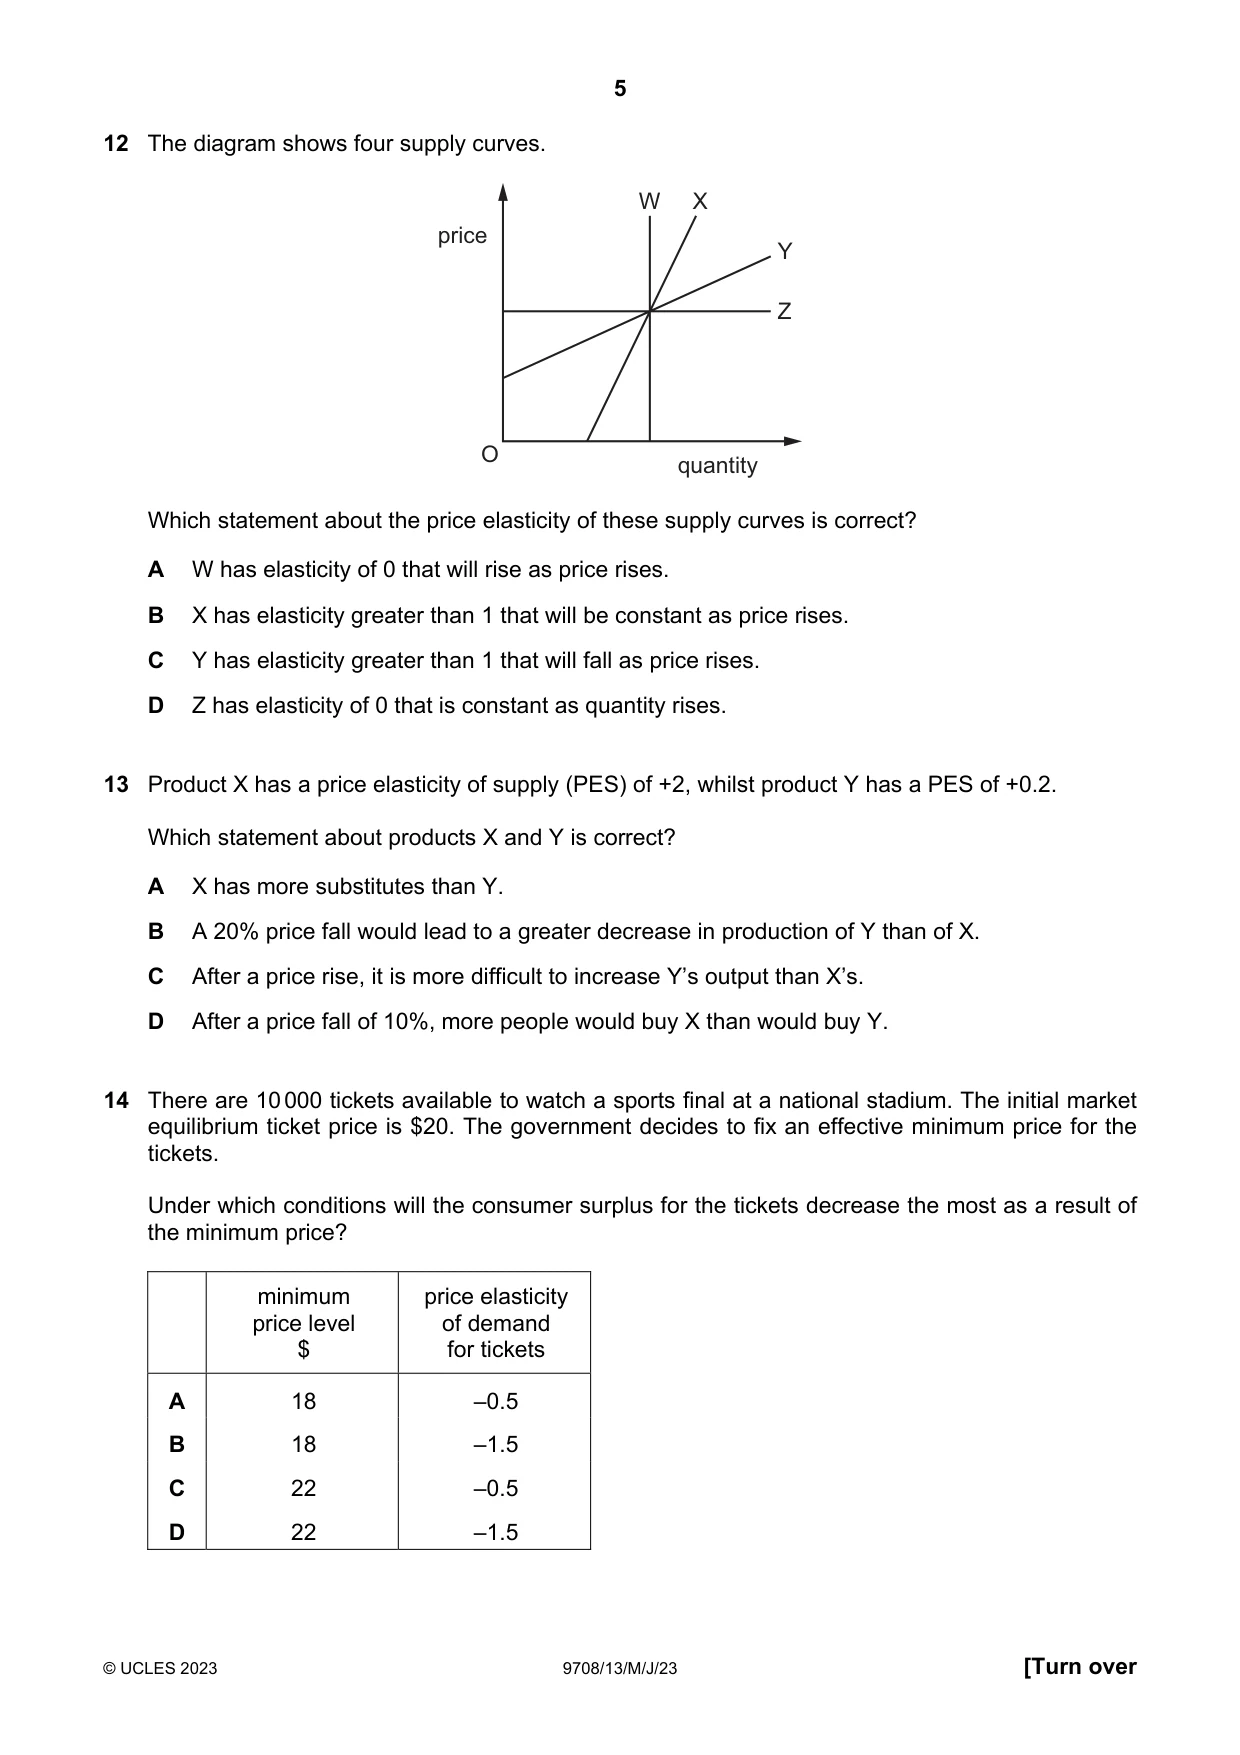
12 The diagram shows four supply curves. W X price Y Z O quantity Which statement about the price elasticity of these supply curves is correct? A W has elasticity of 0 that will rise as price rises. B X has elasticity greater than 1 that will be constant as price rises. C Y has elasticity greater than 1 that will fall as price rises. D Z has elasticity of 0 that is constant as quantity rises.
Mark scheme: C
Q13 · Product X has a price elasticity of supply (PES) of +2, whilst product Y has a PES of +0.2
13 Product X has a price elasticity of supply (PES) of +2, whilst product Y has a PES of +0.2. Which statement about products X and Y is correct? A X has more substitutes than Y. B A 20% price fall would lead to a greater decrease in production of Y than of X. C After a price rise, it is more difficult to increase Y’s output than X’s. D After a price fall of 10%, more people would buy X than would buy Y.
Mark scheme: C
Q14 · There are 10 000 tickets available to watch a sports final at a national stadium
14 There are 10 000 tickets available to watch a sports final at a national stadium. The initial market equilibrium ticket price is $20. The government decides to fix an effective minimum price for the tickets. Under which conditions will the consumer surplus for the tickets decrease the most as a result of the minimum price? minimum price elasticity price level of demand $ for tickets A 18 –0.5 B 18 –1.5 C 22 –0.5 D 22 –1.5
Mark scheme: C
Q15 · The diagram shows the impact of a government imposing a unit tax on a demerit good
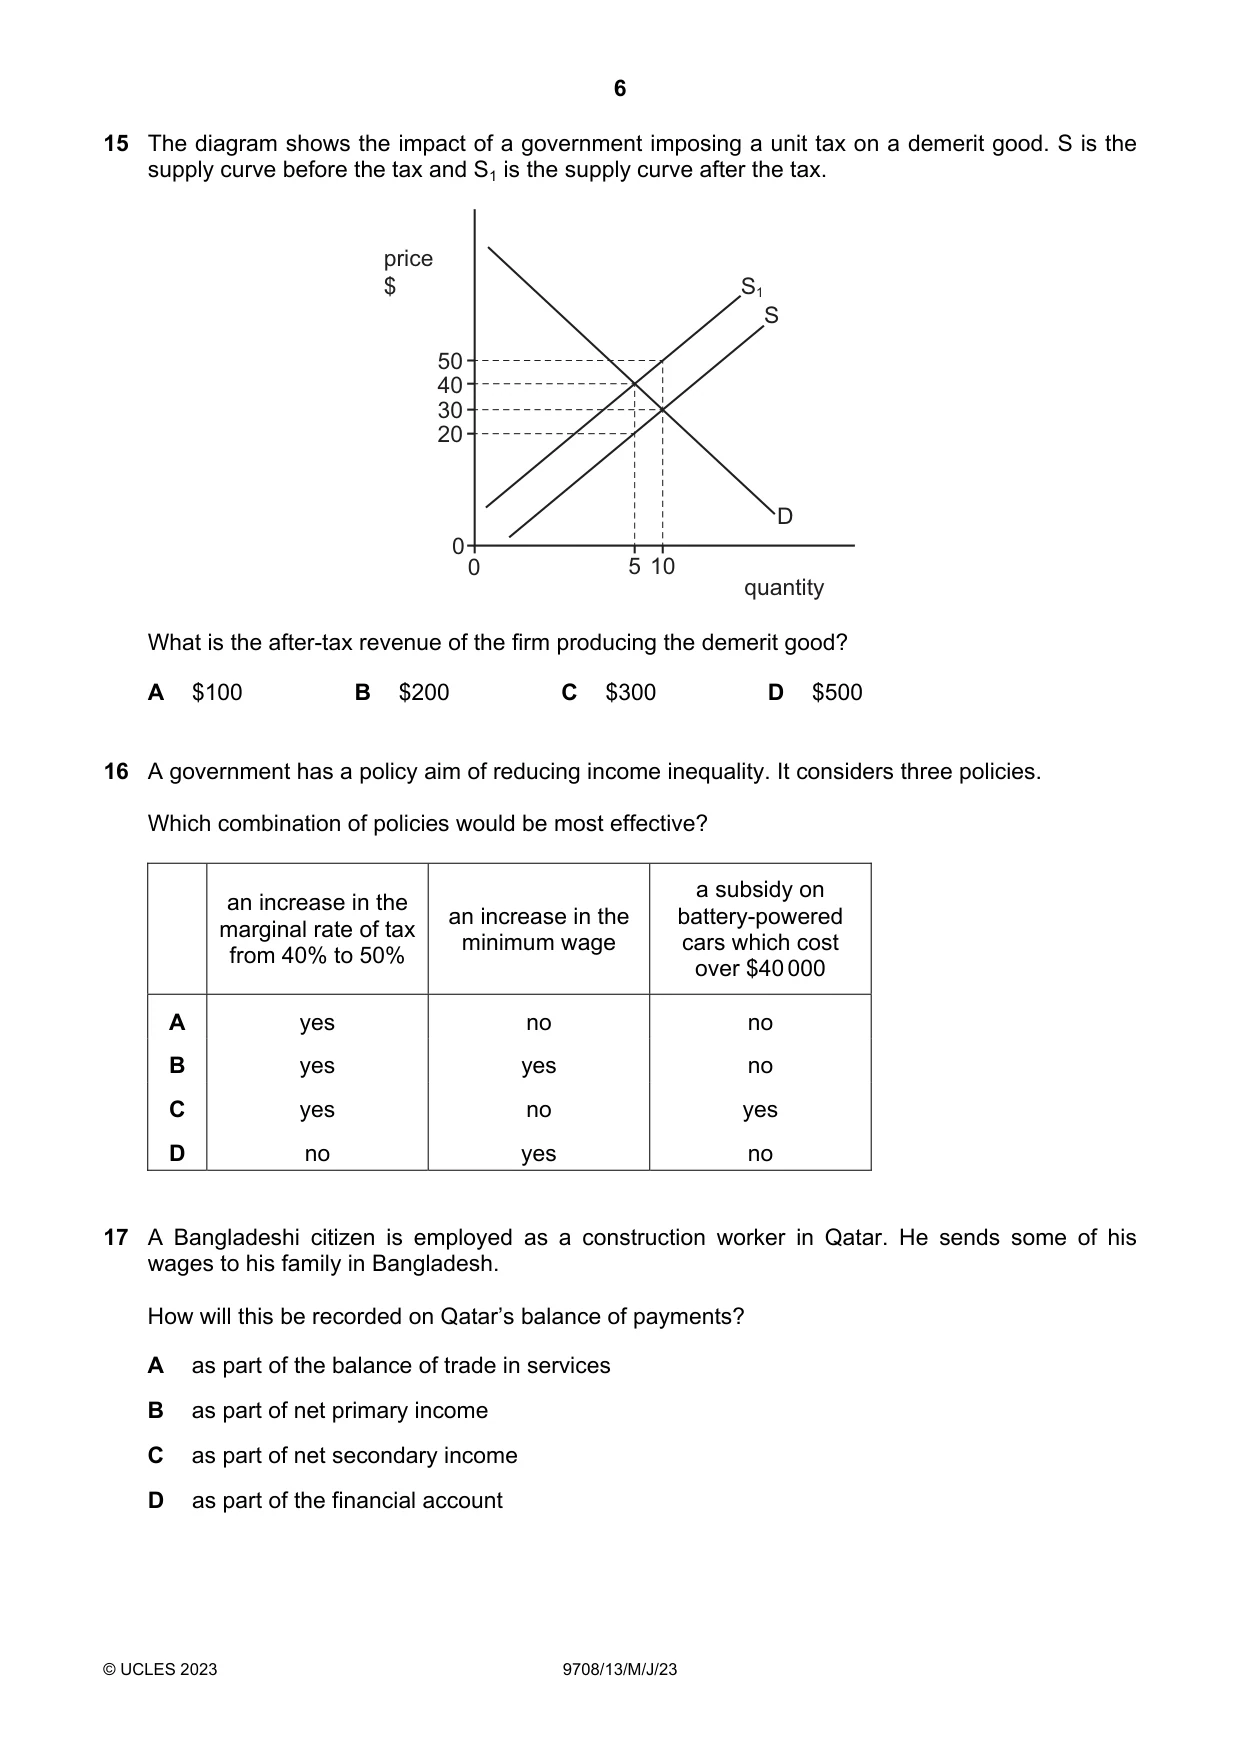
15 The diagram shows the impact of a government imposing a unit tax on a demerit good. S is the supply curve before the tax and S1 is the supply curve after the tax. price $ S1 S 50 40 30 20 D 0 0 5 10 quantity What is the after-tax revenue of the firm producing the demerit good? A $100 B $200 C $300 D $500
Mark scheme: A
More questions on Methods and effects of government intervention in markets
Q16 · A government has a policy aim of reducing income inequality
16 A government has a policy aim of reducing income inequality. It considers three policies. Which combination of policies would be most effective? a subsidy on an increase in the an increase in the battery-powered marginal rate of tax minimum wage cars which cost from 40% to 50% over $40 000 A yes no no B yes yes no C yes no yes D no yes no
Mark scheme: B
Q17 · A Bangladeshi citizen is employed as a construction worker in Qatar
17 A Bangladeshi citizen is employed as a construction worker in Qatar. He sends some of his wages to his family in Bangladesh. How will this be recorded on Qatar’s balance of payments? A as part of the balance of trade in services B as part of net primary income C as part of net secondary income D as part of the financial account
Mark scheme: B
More questions on Current account of the balance of payments
Q18 · The table gives data for an economy
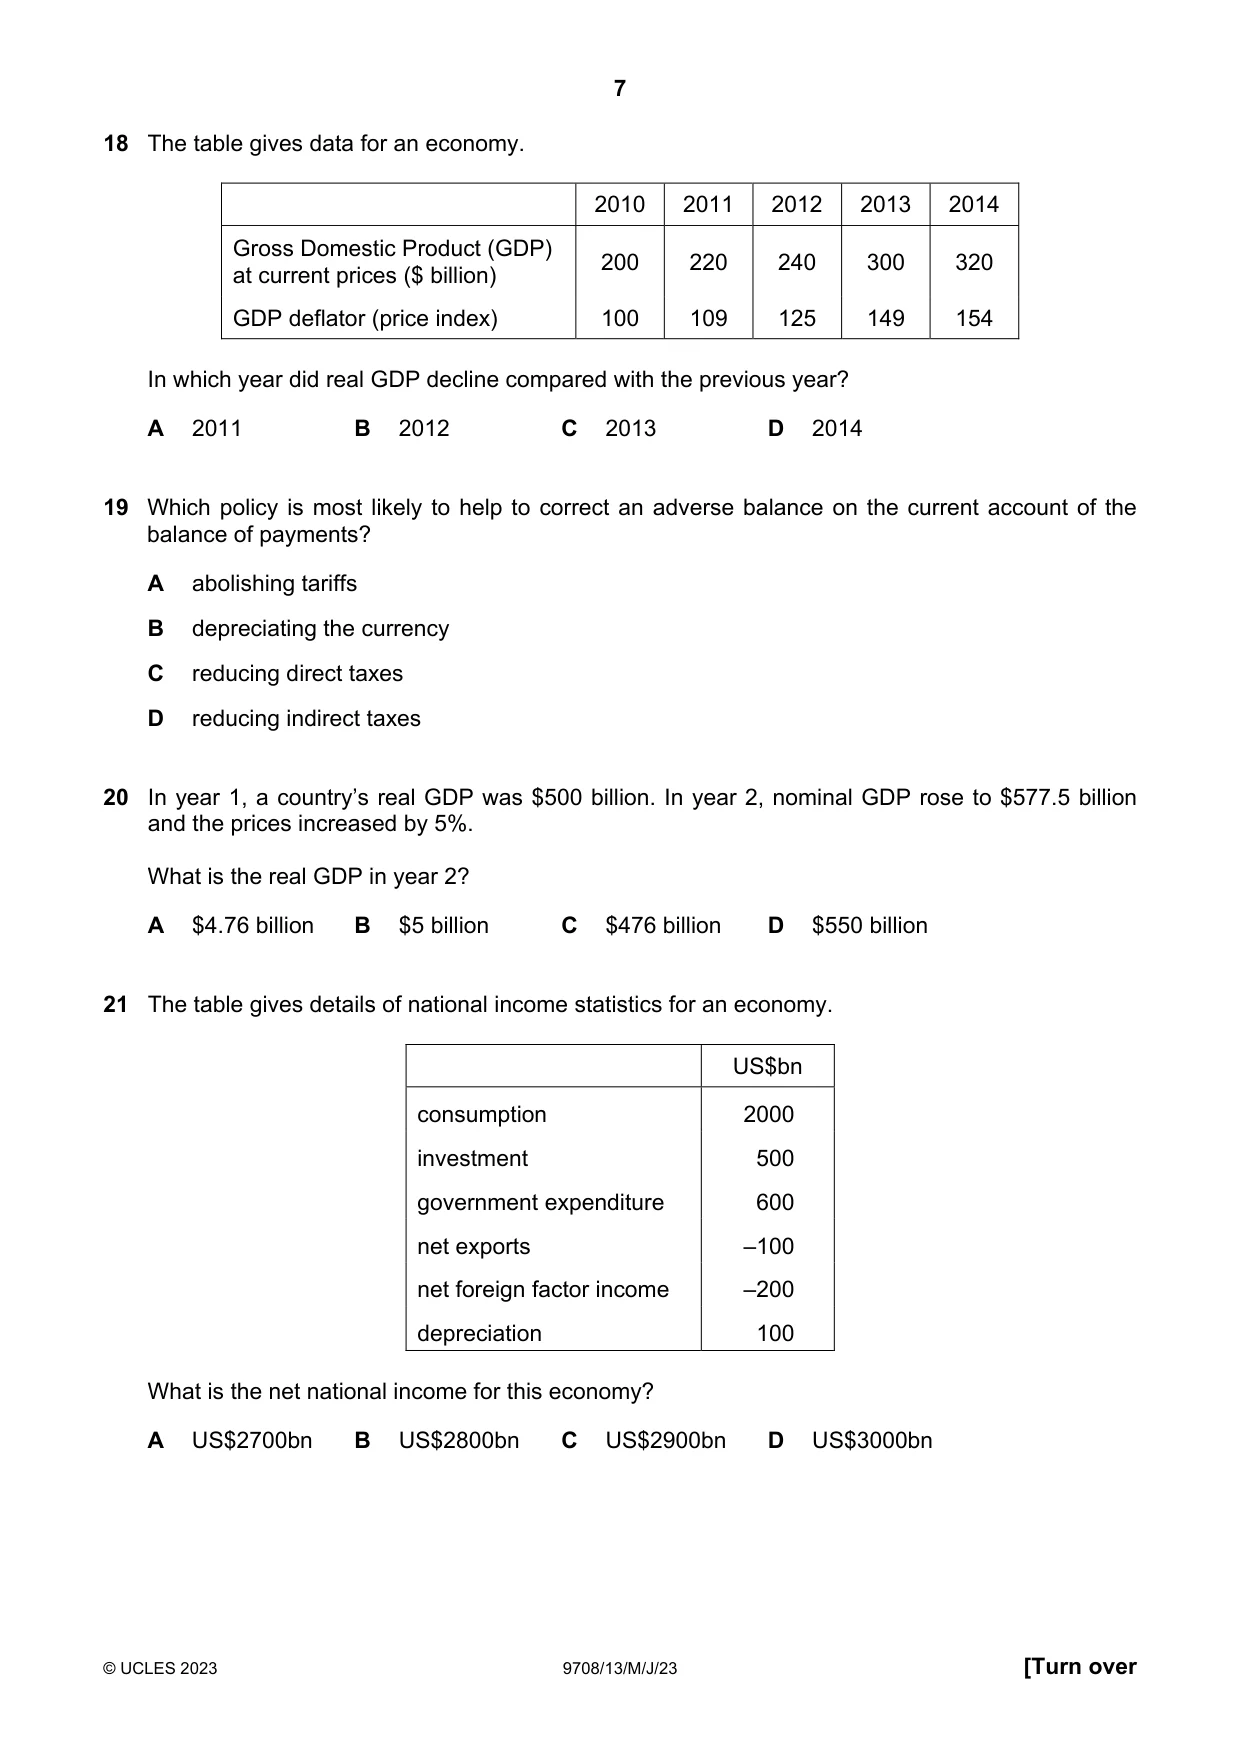
18 The table gives data for an economy. 2010 2011 2012 2013 2014 Gross Domestic Product (GDP) 200 220 240 300 320 at current prices ($ billion) GDP deflator (price index) 100 109 125 149 154 In which year did real GDP decline compared with the previous year? A 2011 B 2012 C 2013 D 2014
Mark scheme: B
Q19 · Which policy is most likely to help to correct an adverse balance on the current account…
19 Which policy is most likely to help to correct an adverse balance on the current account of the balance of payments? A abolishing tariffs B depreciating the currency C reducing direct taxes D reducing indirect taxes
Mark scheme: B
More questions on Policies to correct imbalances in the current account of the balance of payments
Q20 · In year 1, a country’s real GDP was $500 billion
20 In year 1, a country’s real GDP was $500 billion. In year 2, nominal GDP rose to $577.5 billion and the prices increased by 5%. What is the real GDP in year 2? A $4.76 billion B $5 billion C $476 billion D $550 billion
Mark scheme: D
Q21 · The table gives details of national income statistics for an economy
21 The table gives details of national income statistics for an economy. US$bn consumption 2000 investment 500 government expenditure 600 net exports –100 net foreign factor income –200 depreciation 100 What is the net national income for this economy? A US$2700bn B US$2800bn C US$2900bn D US$3000bn
Mark scheme: A
Q22 · The table shows the relative price of exports compared with imports expressed as an index…
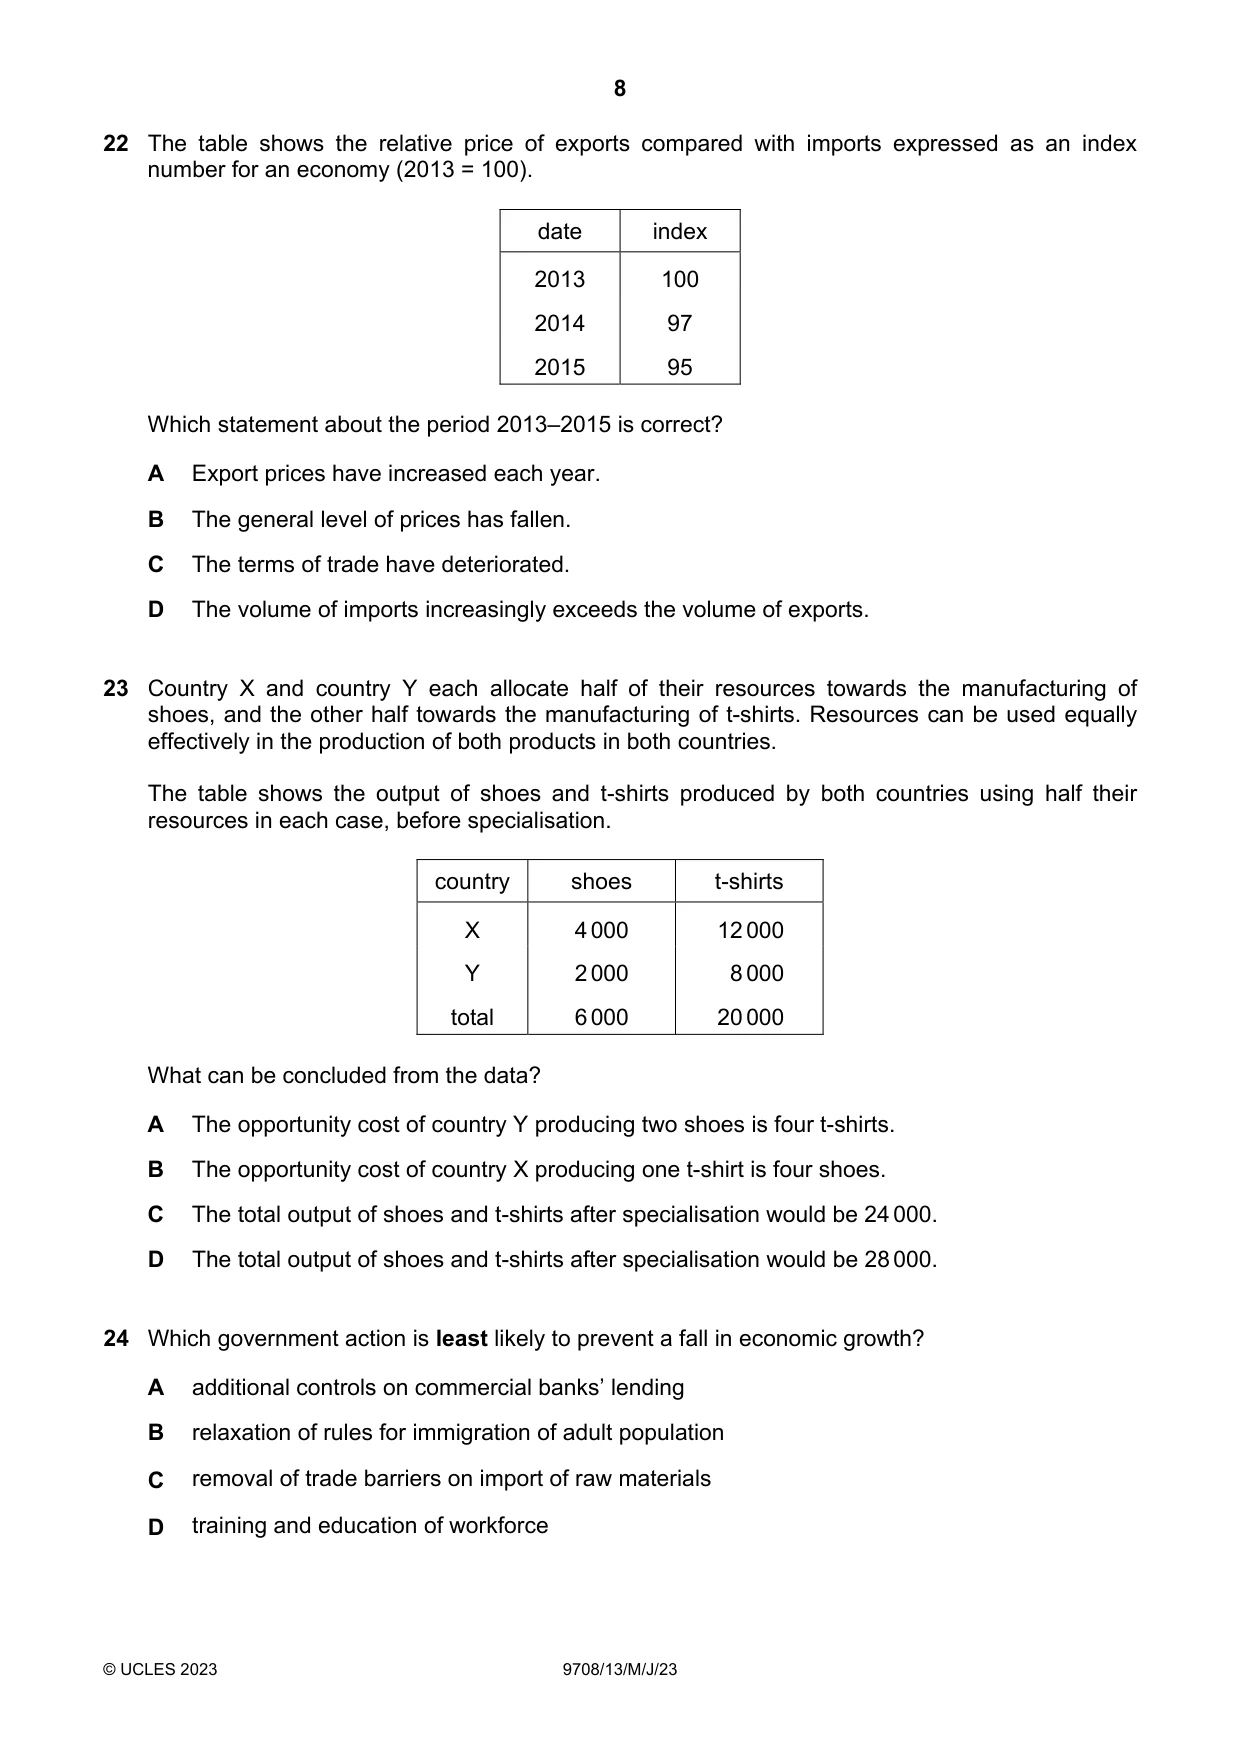
22 The table shows the relative price of exports compared with imports expressed as an index number for an economy (2013 = 100). date index 2013 100 2014 97 2015 95 Which statement about the period 2013–2015 is correct? A Export prices have increased each year. B The general level of prices has fallen. C The terms of trade have deteriorated. D The volume of imports increasingly exceeds the volume of exports.
Mark scheme: C
Q23 · Country X and country Y each allocate half of their resources towards the manufacturing…
23 Country X and country Y each allocate half of their resources towards the manufacturing of shoes, and the other half towards the manufacturing of t-shirts. Resources can be used equally effectively in the production of both products in both countries. The table shows the output of shoes and t-shirts produced by both countries using half their resources in each case, before specialisation. country shoes t-shirts X 4 000 12 000 Y 2 000 8 000 total 6 000 20 000 What can be concluded from the data? A The opportunity cost of country Y producing two shoes is four t-shirts. B The opportunity cost of country X producing one t-shirt is four shoes. C The total output of shoes and t-shirts after specialisation would be 24 000. D The total output of shoes and t-shirts after specialisation would be 28 000.
Mark scheme: C
Q24 · Which government action is least likely to prevent a fall in economic growth?
24 Which government action is least likely to prevent a fall in economic growth? A additional controls on commercial banks’ lending B relaxation of rules for immigration of adult population C removal of trade barriers on import of raw materials D training and education of workforce
Mark scheme: A
Q25 · What is the most likely cause of an outward shift of a country’s aggregate demand curve?
25 What is the most likely cause of an outward shift of a country’s aggregate demand curve? A a decrease in the competitiveness of domestically produced products B a decrease in the general price level C a decrease in the money supply D a depreciation of the country’s exchange rate
Mark scheme: D
More questions on Aggregate Demand and Aggregate Supply analysis
Q26 · The diagram shows the macroeconomic equilibrium output and price level changing from Y…
26 The diagram shows the macroeconomic equilibrium output and price level changing from Y and P to Y1 and P1. LRAS price level P P1 AD AD1 O Y1 Y real output What could have caused this change? A a decrease in exports B a decrease in labour productivity C an increase in the government’s spending D an increase in the money supply
Mark scheme: A
More questions on Aggregate Demand and Aggregate Supply analysis
Q27 · A country had a current account surplus of $141bn
27 A country had a current account surplus of $141bn. Which policy may its government implement to reduce this surplus in the short run? A a decrease in direct taxes B a decrease in regulations to encourage more foreign firms to locate in this country C an increase of import duties D an increase in interest rates
Mark scheme: A
More questions on Policies to correct imbalances in the current account of the balance of payments
Q28 · The diagram shows aggregate demand (AD) and aggregate supply in the short run (SRAS) and…
28 The diagram shows aggregate demand (AD) and aggregate supply in the short run (SRAS) and the long run (LRAS). LRAS LRAS1 price level W SRAS SRAS1 Y AD O real GDP Which row is correct in causing a shift in the short run aggregate supply from SRAS to SRAS1 and the long run aggregate supply from LRAS to LRAS1? shift from SRAS to SRAS1 shift from LRAS to LRAS1 A change in AD from W to Y increase in population B decrease in raw material costs improvements in the education of workers C decrease in wage rates decrease in immigration D increase in availability of labour increase in labour productivity
Mark scheme: B
More questions on Aggregate Demand and Aggregate Supply analysis
Q29 · The diagram shows that the imposition of a tariff raises a product’s world price from $10…
29 The diagram shows that the imposition of a tariff raises a product’s world price from $10 to $14. domestic supply price $ 14 10 domestic demand 0 0 20 30 70 100 quantity (millions) By how much did domestic producers’ income increase as a result of the tariff? A $120 million B $160 million C $220 million D $280 million
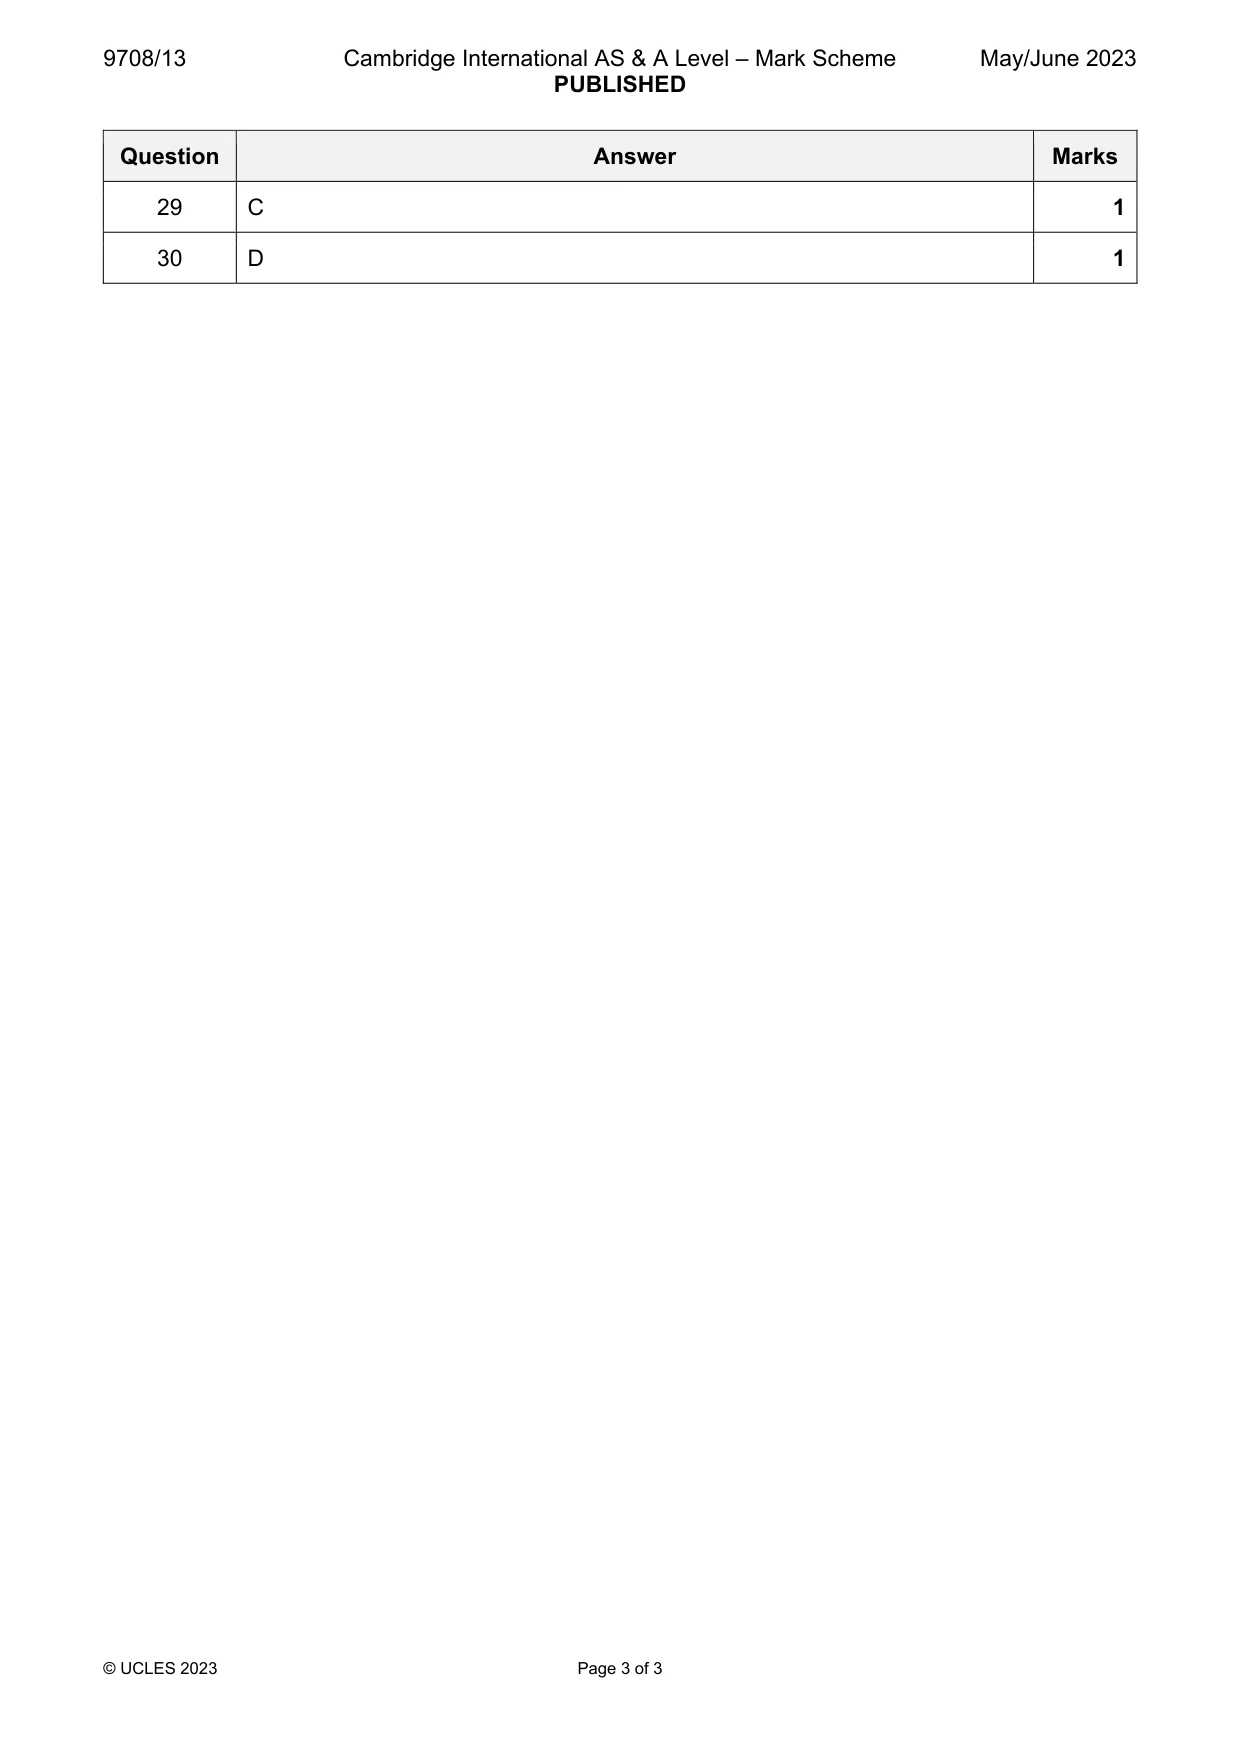
Mark scheme: C
Q30 · Which approach would a government be most likely to use to eliminate deflation?
30 Which approach would a government be most likely to use to eliminate deflation? A an increase in direct taxes B an increase in interest rates C a reduction in indirect taxes D a reduction in its budget surplus
Mark scheme: D
What was in this paper
The subtopics covered by these 30 questions, and how many questions each got. Open one in a new tab to see every Cambridge question on it.
3Demand and supply curves3National income statistics3Price elasticity, income elasticity and cross elasticity of demand3Policies to correct imbalances in the current account of the balance of payments2Price elasticity of supply2Addressing income and wealth inequality1Classification of goods and services1Consumer and producer surplus1Current account of the balance of payments1Exchange rates1Factors of production1Fiscal policy1Methods and effects of government intervention in markets1Production possibility curves1Protectionism1Scarcity, choice and opportunity cost1Supply-side policy1The interaction of demand and supply1The reasons for international trade1What you needed in this session
Cambridge’s own grade thresholds for 2023 May/June, Paper 1 · Variant 3. A higher threshold means an easier paper — the bar moves with how the cohort did.