Cambridge A Level Economics 9708 — 2016 Oct/Nov Paper 1 · Variant 1
9708/11/O/N/16 · 30 questions · 30 marks · ≈34 min
The question paper and its mark scheme, free to read here and free to download. This is Cambridge’s own paper, exactly as it was sat.
Question paper12 pages
Mark scheme2 pages
Answers below. Sit the paper first if you are practising.
Questions as text
Q1 · To increase production a firm in industry X needs to install capital equipment, while a…
1 To increase production a firm in industry X needs to install capital equipment, while a firm in industry Y needs to research and introduce a new technology. What time periods are illustrated by these cases? industry X industry Y A short run long run B long run long run C long run very long run D very long run very long run
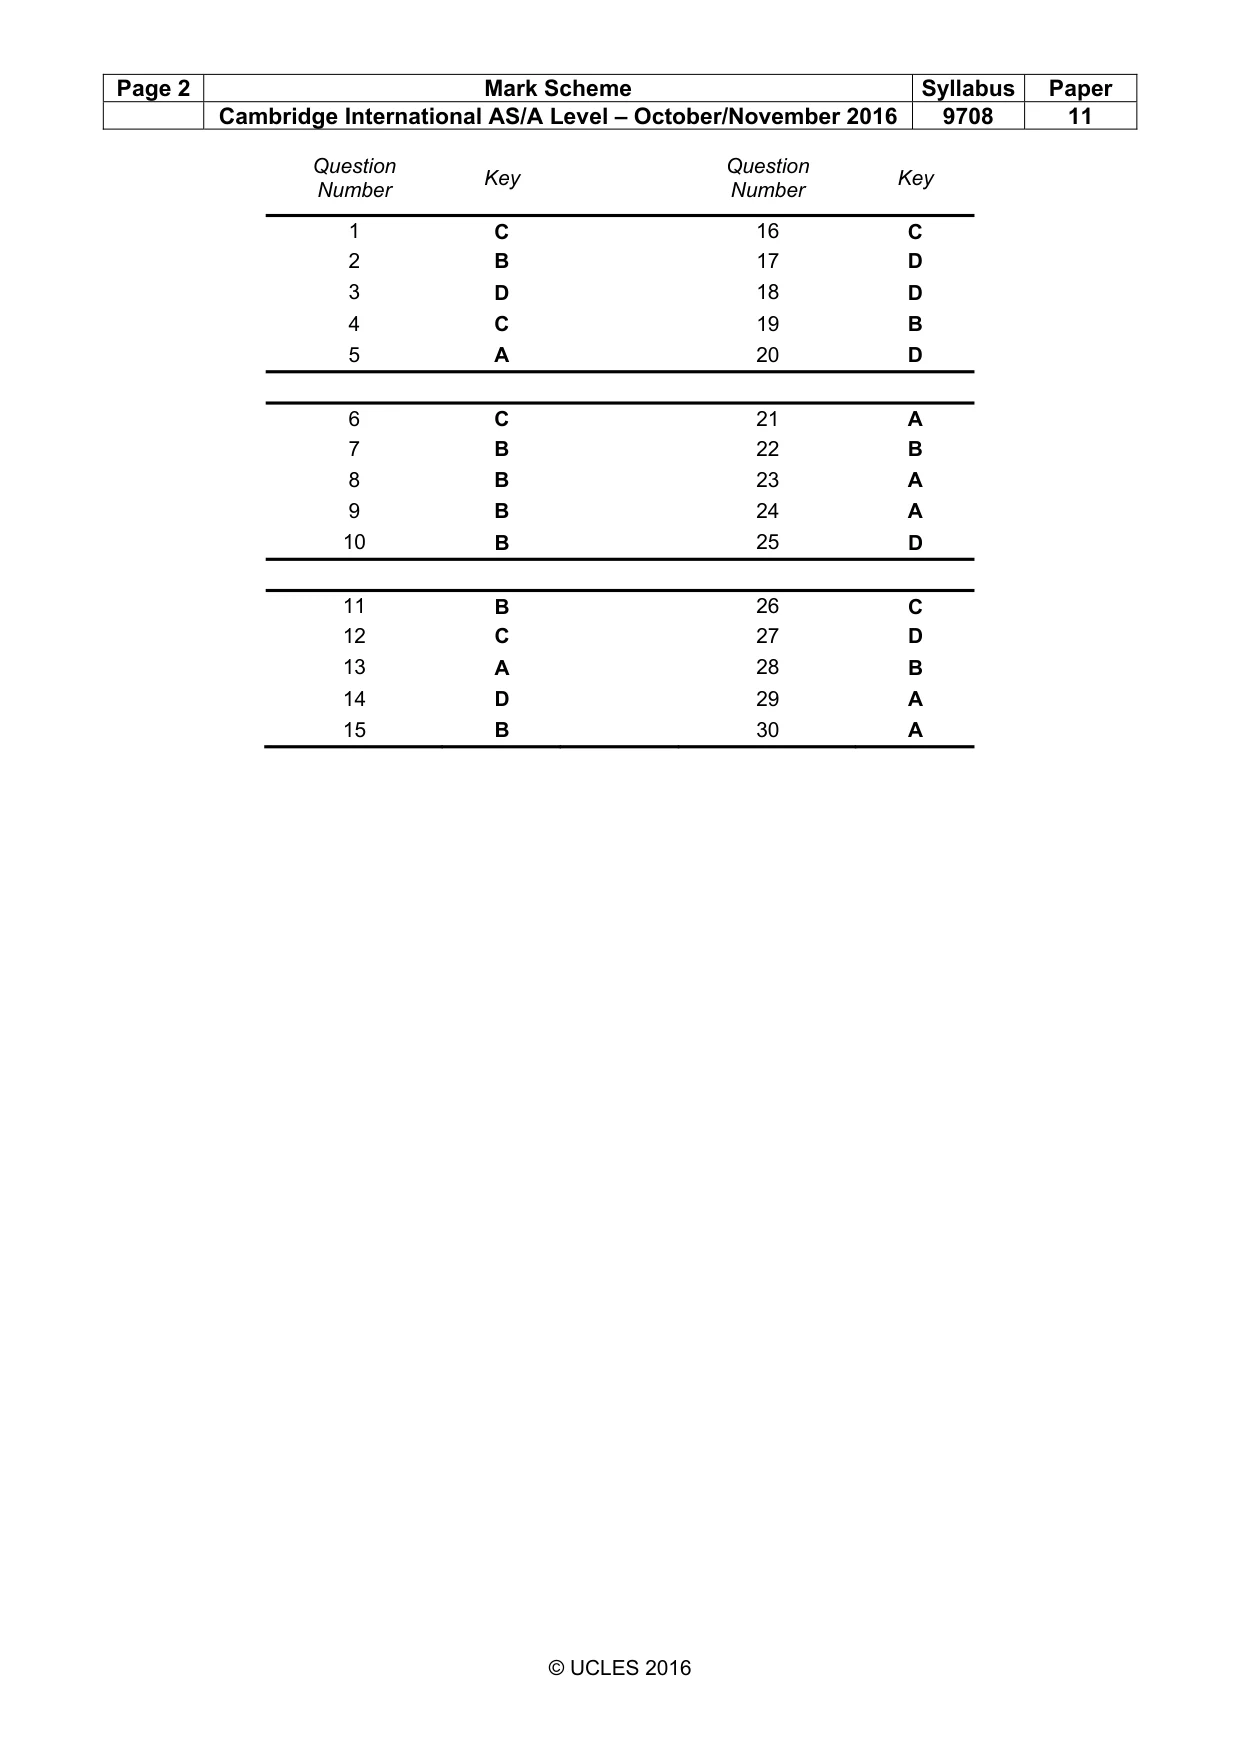
Mark scheme: C
More questions on Types of cost, revenue and profit, short-run and long-run production
Q2 · The production possibility curve for an economy producing capital goods and consumer…
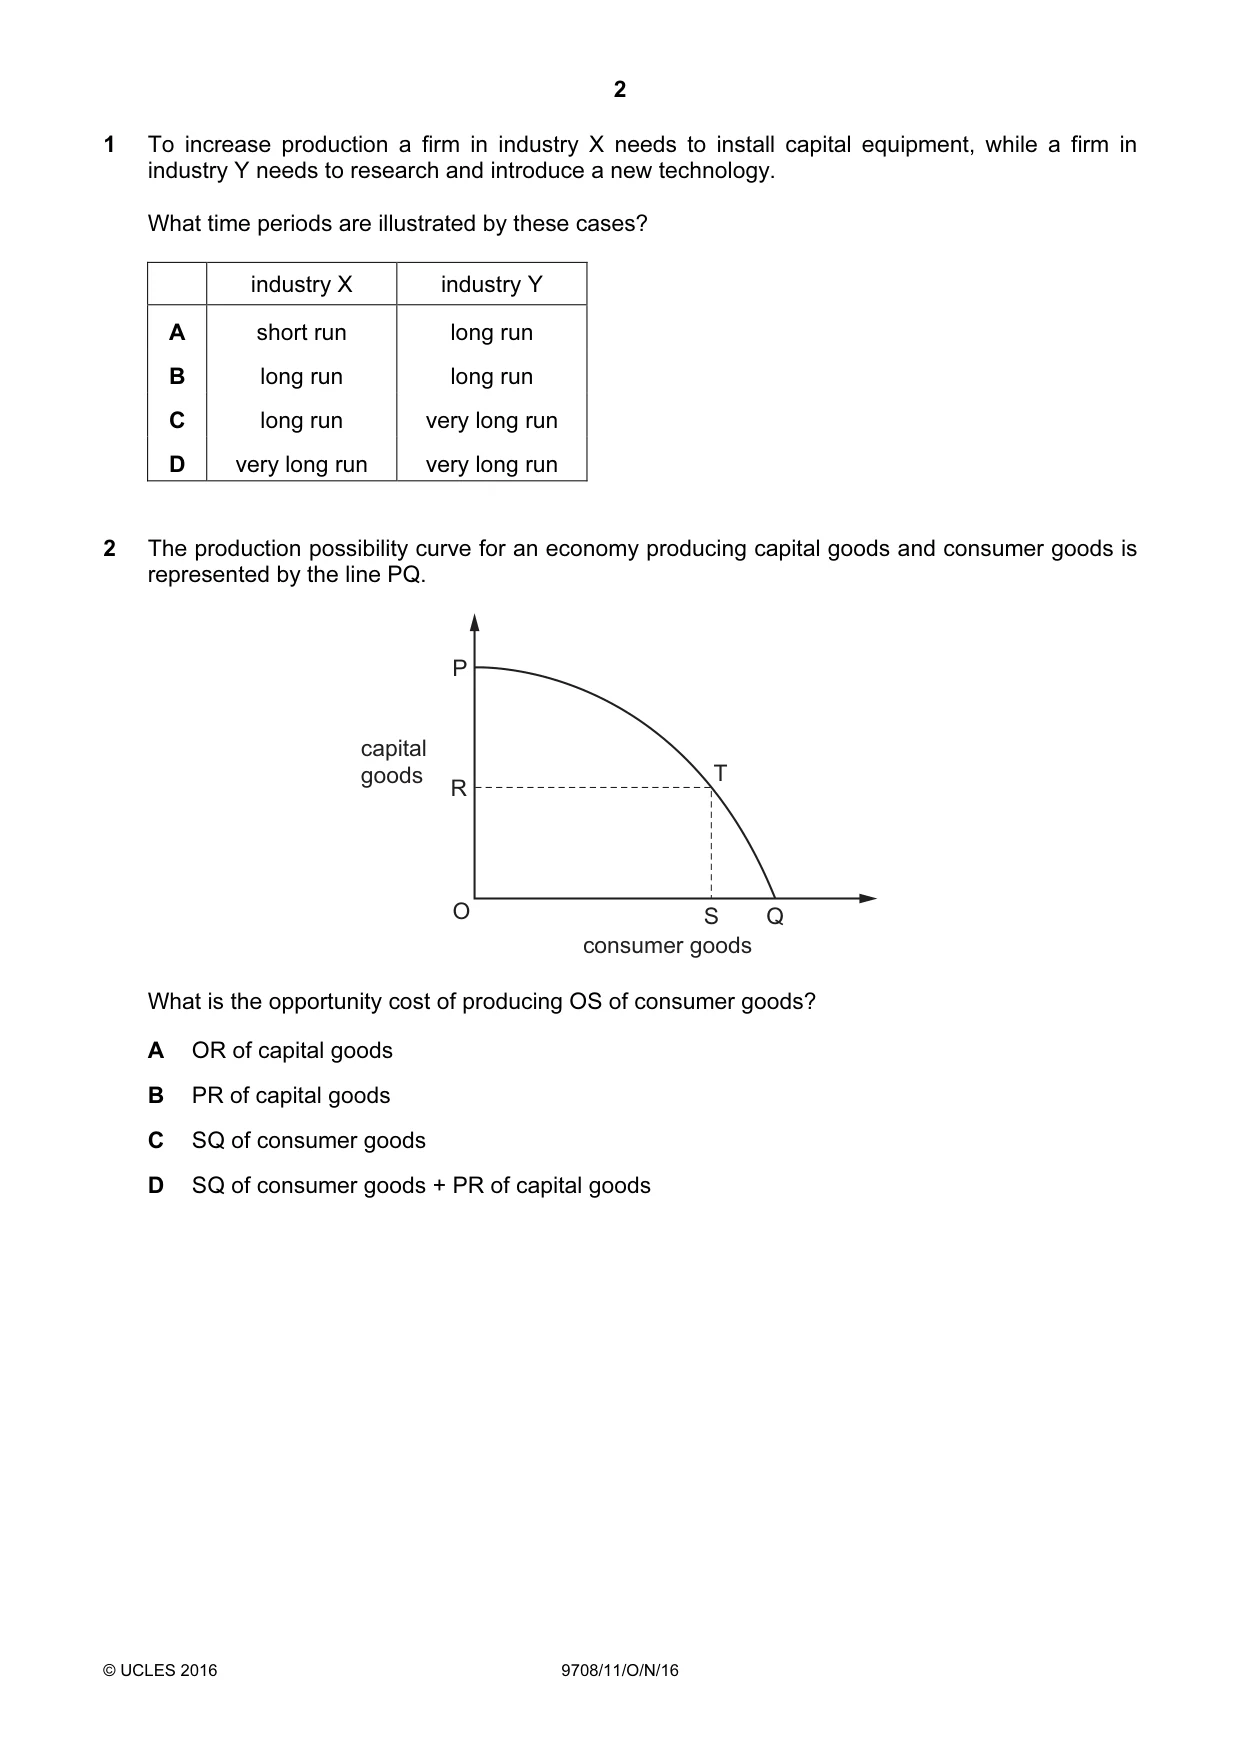
2 The production possibility curve for an economy producing capital goods and consumer goods is represented by the line PQ. P capital goods T R O S Q consumer goods What is the opportunity cost of producing OS of consumer goods? A OR of capital goods B PR of capital goods C SQ of consumer goods D SQ of consumer goods + PR of capital goods
Mark scheme: B
Q3 · In the diagram XY is an economy’s production possibility curve
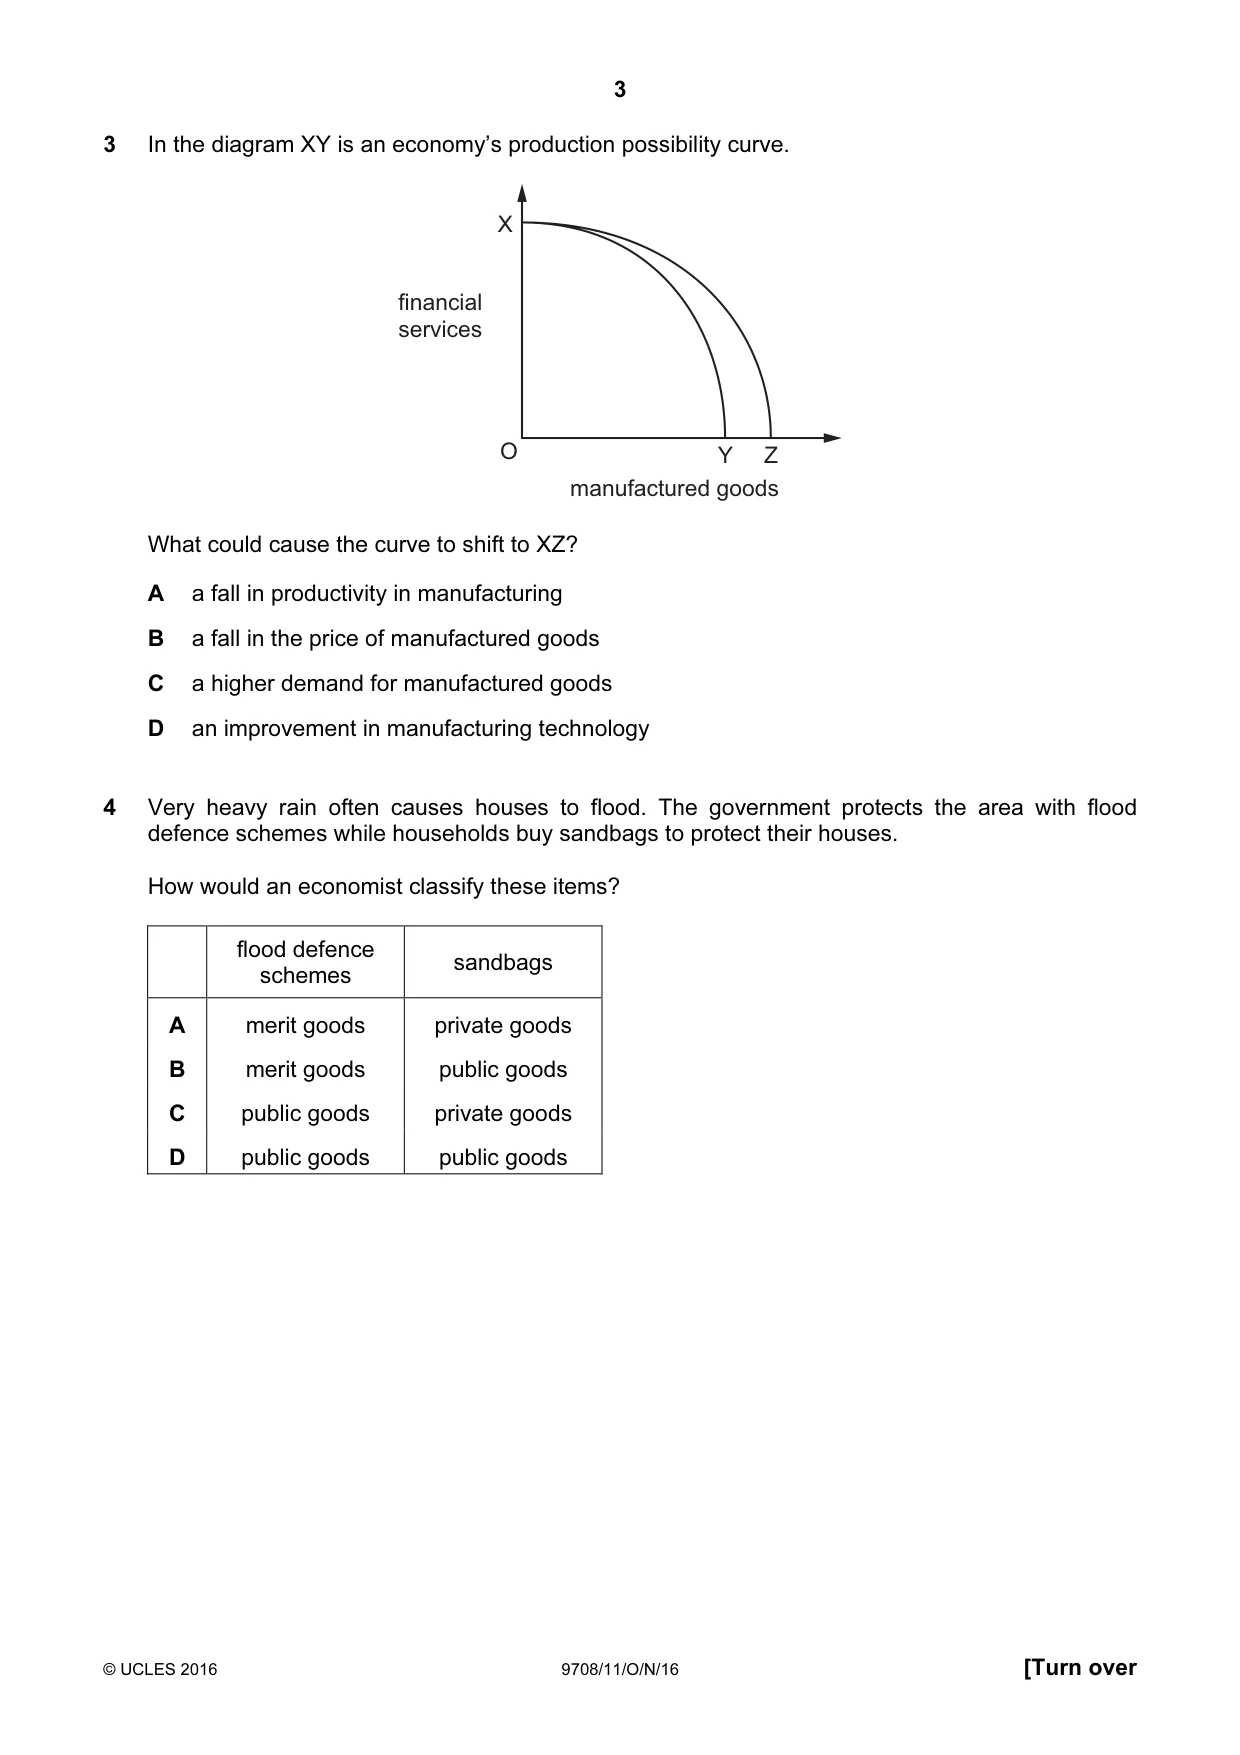
3 In the diagram XY is an economy’s production possibility curve. X financial services O Y Z manufactured goods What could cause the curve to shift to XZ? A a fall in productivity in manufacturing B a fall in the price of manufactured goods C a higher demand for manufactured goods D an improvement in manufacturing technology
Mark scheme: D
Q4 · Very heavy rain often causes houses to flood
4 Very heavy rain often causes houses to flood. The government protects the area with flood defence schemes while households buy sandbags to protect their houses. How would an economist classify these items? flood defence sandbags schemes A merit goods private goods B merit goods public goods C public goods private goods D public goods public goods
Mark scheme: C
Q5 · The diagram shows the demand for air travel in Asia
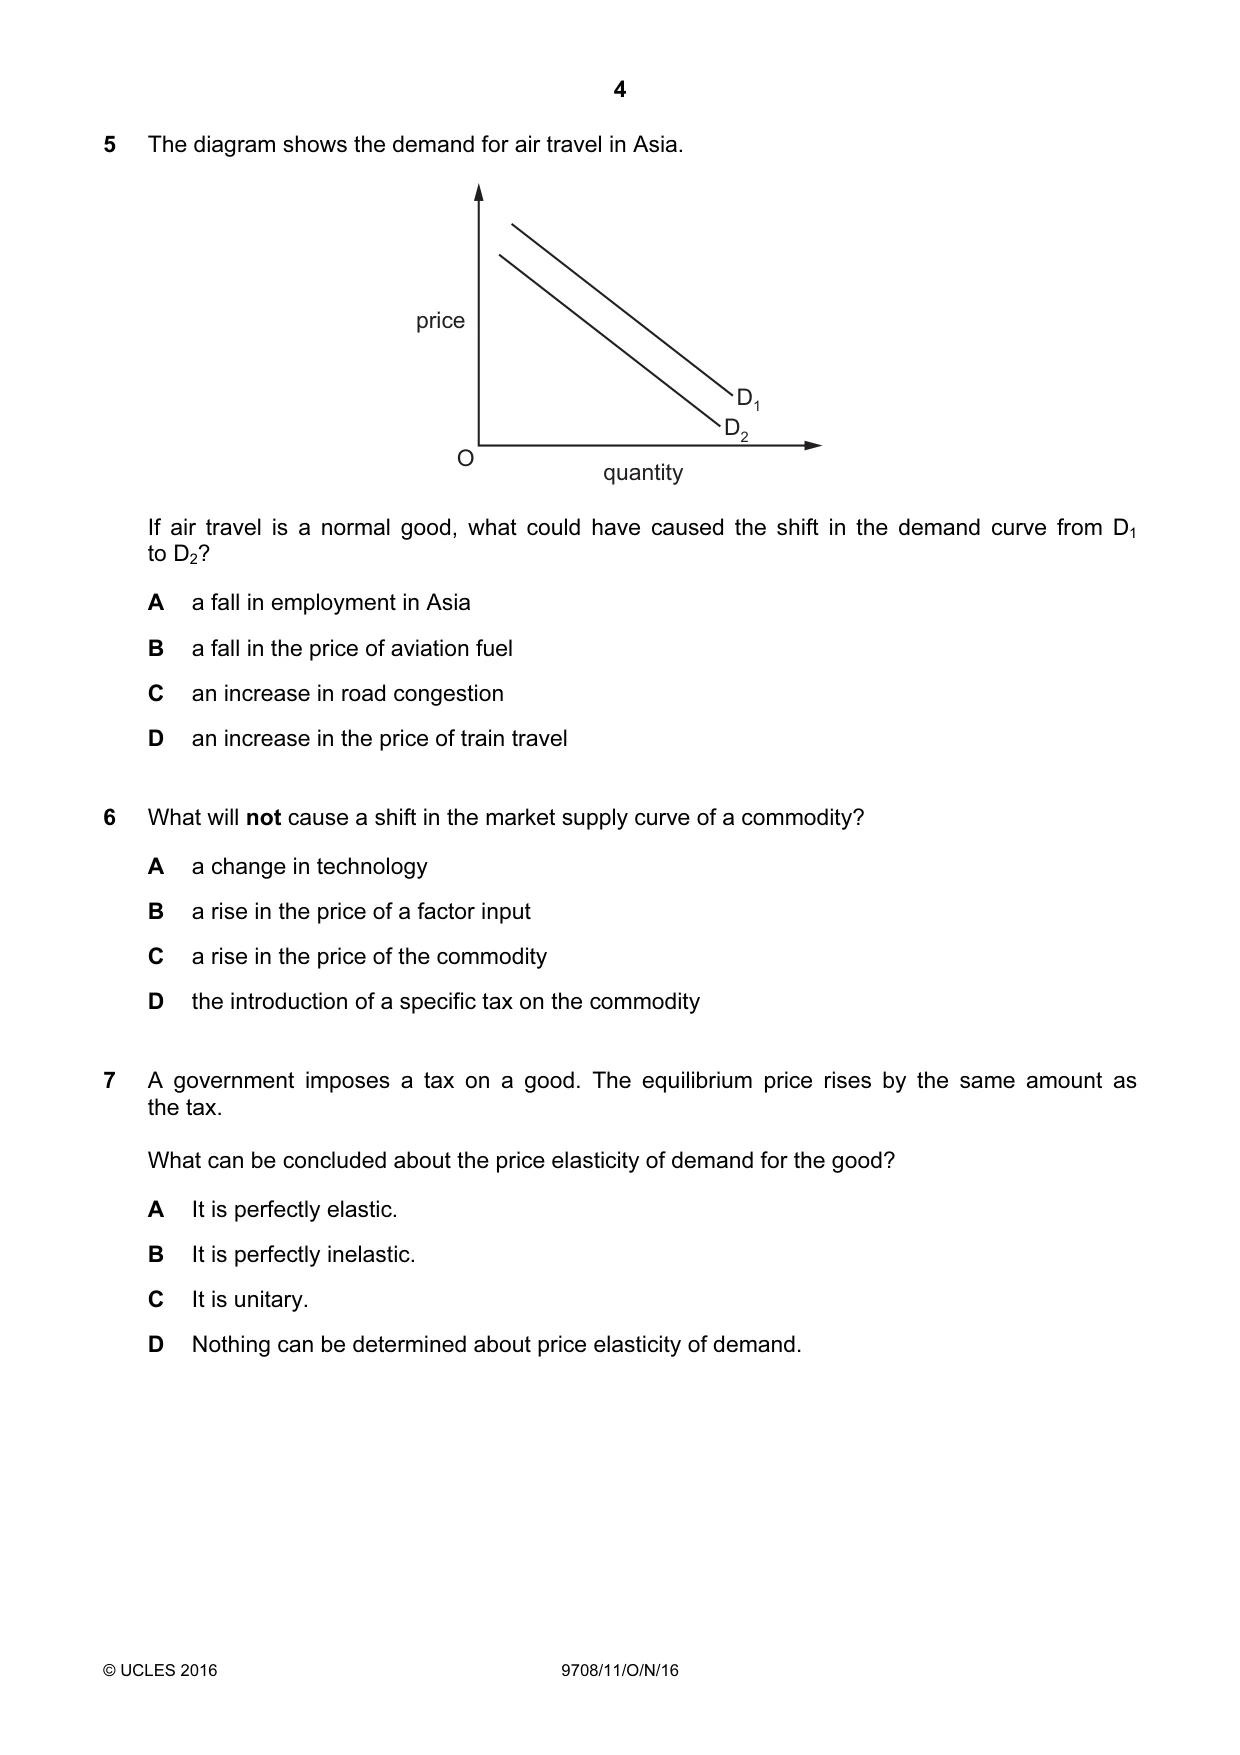
5 The diagram shows the demand for air travel in Asia. price D1 D2 O quantity If air travel is a normal good, what could have caused the shift in the demand curve from D1 to D2? A a fall in employment in Asia B a fall in the price of aviation fuel C an increase in road congestion D an increase in the price of train travel
Mark scheme: A
Q6 · What will not cause a shift in the market supply curve of a commodity?
6 What will not cause a shift in the market supply curve of a commodity? A a change in technology B a rise in the price of a factor input C a rise in the price of the commodity D the introduction of a specific tax on the commodity
Mark scheme: C
Q7 · A government imposes a tax on a good
7 A government imposes a tax on a good. The equilibrium price rises by the same amount as the tax. What can be concluded about the price elasticity of demand for the good? A It is perfectly elastic. B It is perfectly inelastic. C It is unitary. D Nothing can be determined about price elasticity of demand.
Mark scheme: B
More questions on Price elasticity, income elasticity and cross elasticity of demand
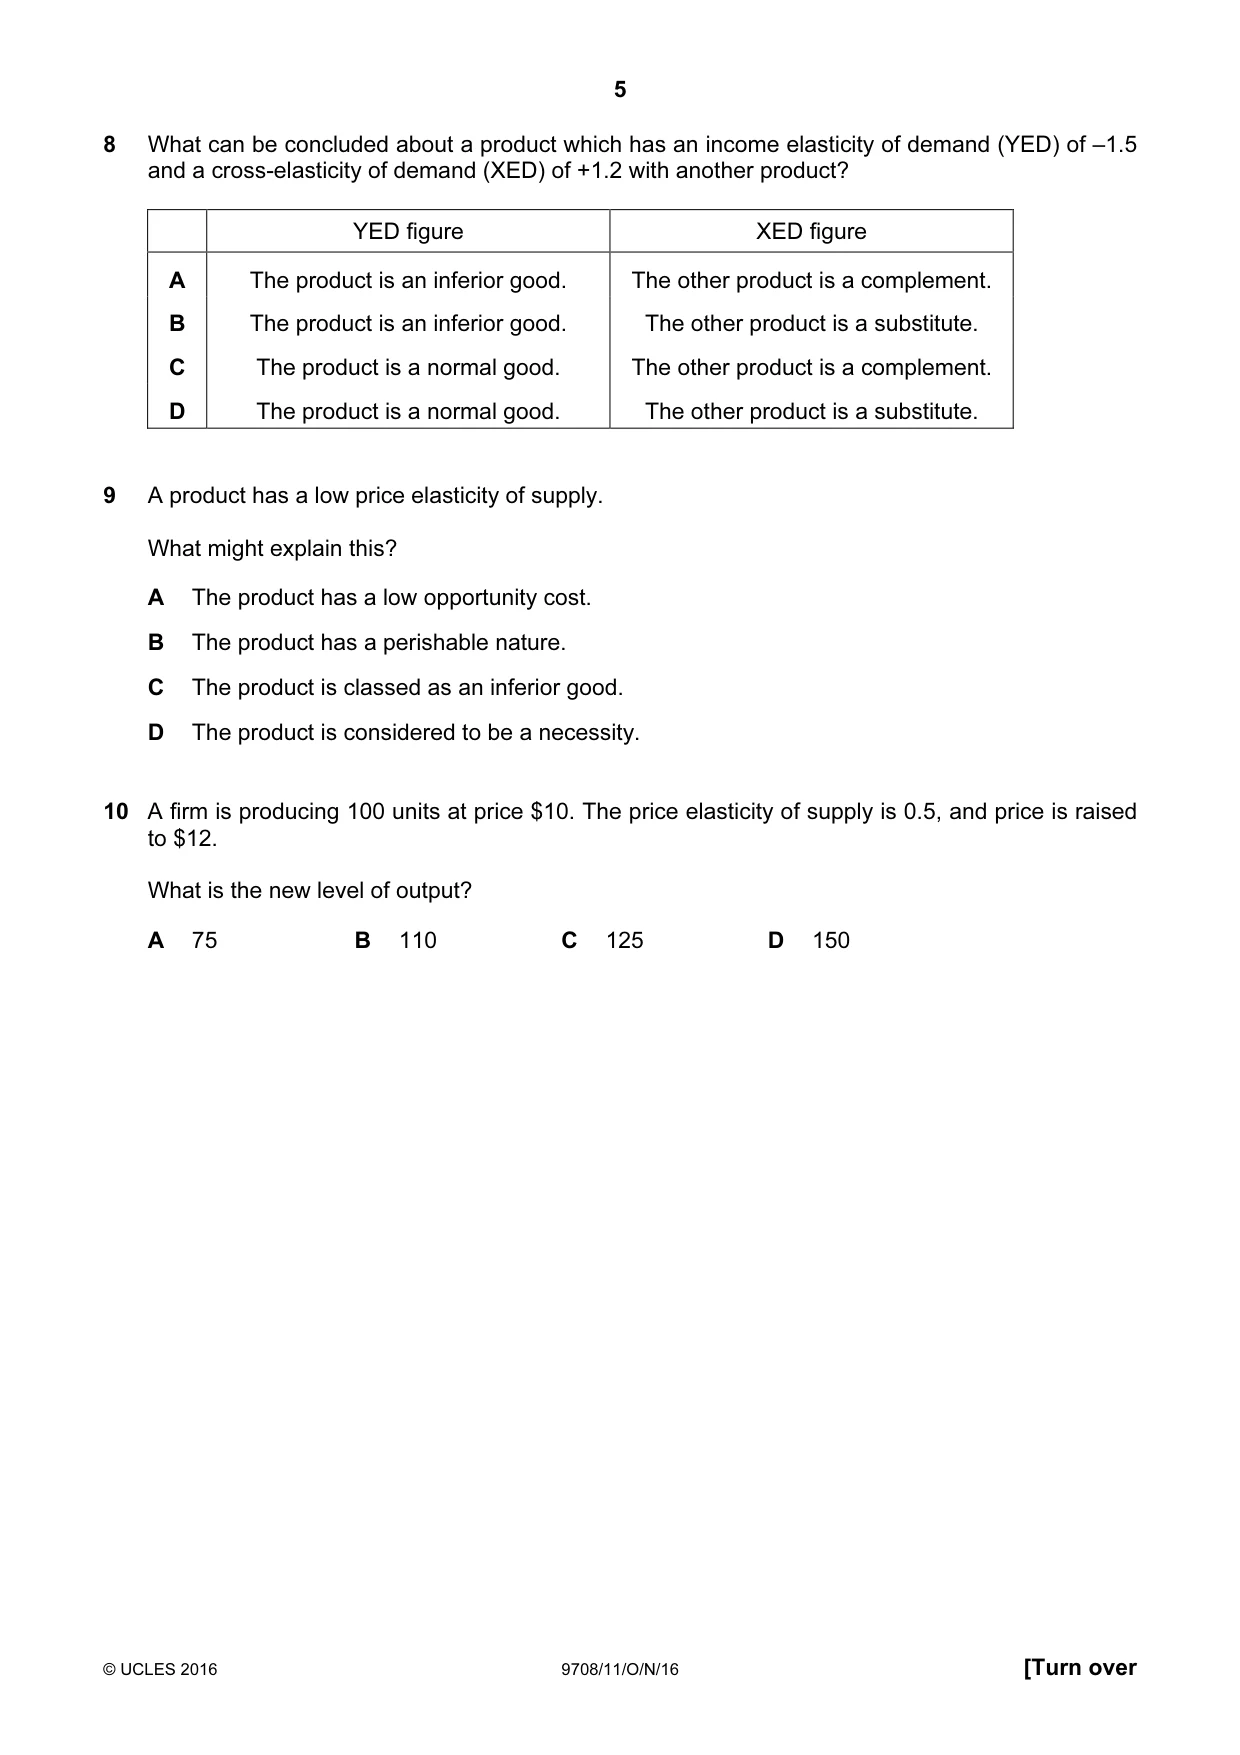
Q8 · What can be concluded about a product which has an income elasticity of demand (YED) of…
8 What can be concluded about a product which has an income elasticity of demand (YED) of –1.5 and a cross-elasticity of demand (XED) of +1.2 with another product? YED figure XED figure A The product is an inferior good. The other product is a complement. B The product is an inferior good. The other product is a substitute. C The product is a normal good. The other product is a complement. D The product is a normal good. The other product is a substitute.
Mark scheme: B
More questions on Price elasticity, income elasticity and cross elasticity of demand
Q9 · A product has a low price elasticity of supply
9 A product has a low price elasticity of supply. What might explain this? A The product has a low opportunity cost. B The product has a perishable nature. C The product is classed as an inferior good. D The product is considered to be a necessity.
Mark scheme: B
Q10 · A firm is producing 100 units at price $10
10 A firm is producing 100 units at price $10. The price elasticity of supply is 0.5, and price is raised to $12. What is the new level of output? A 75 B 110 C 125 D 150
Mark scheme: B
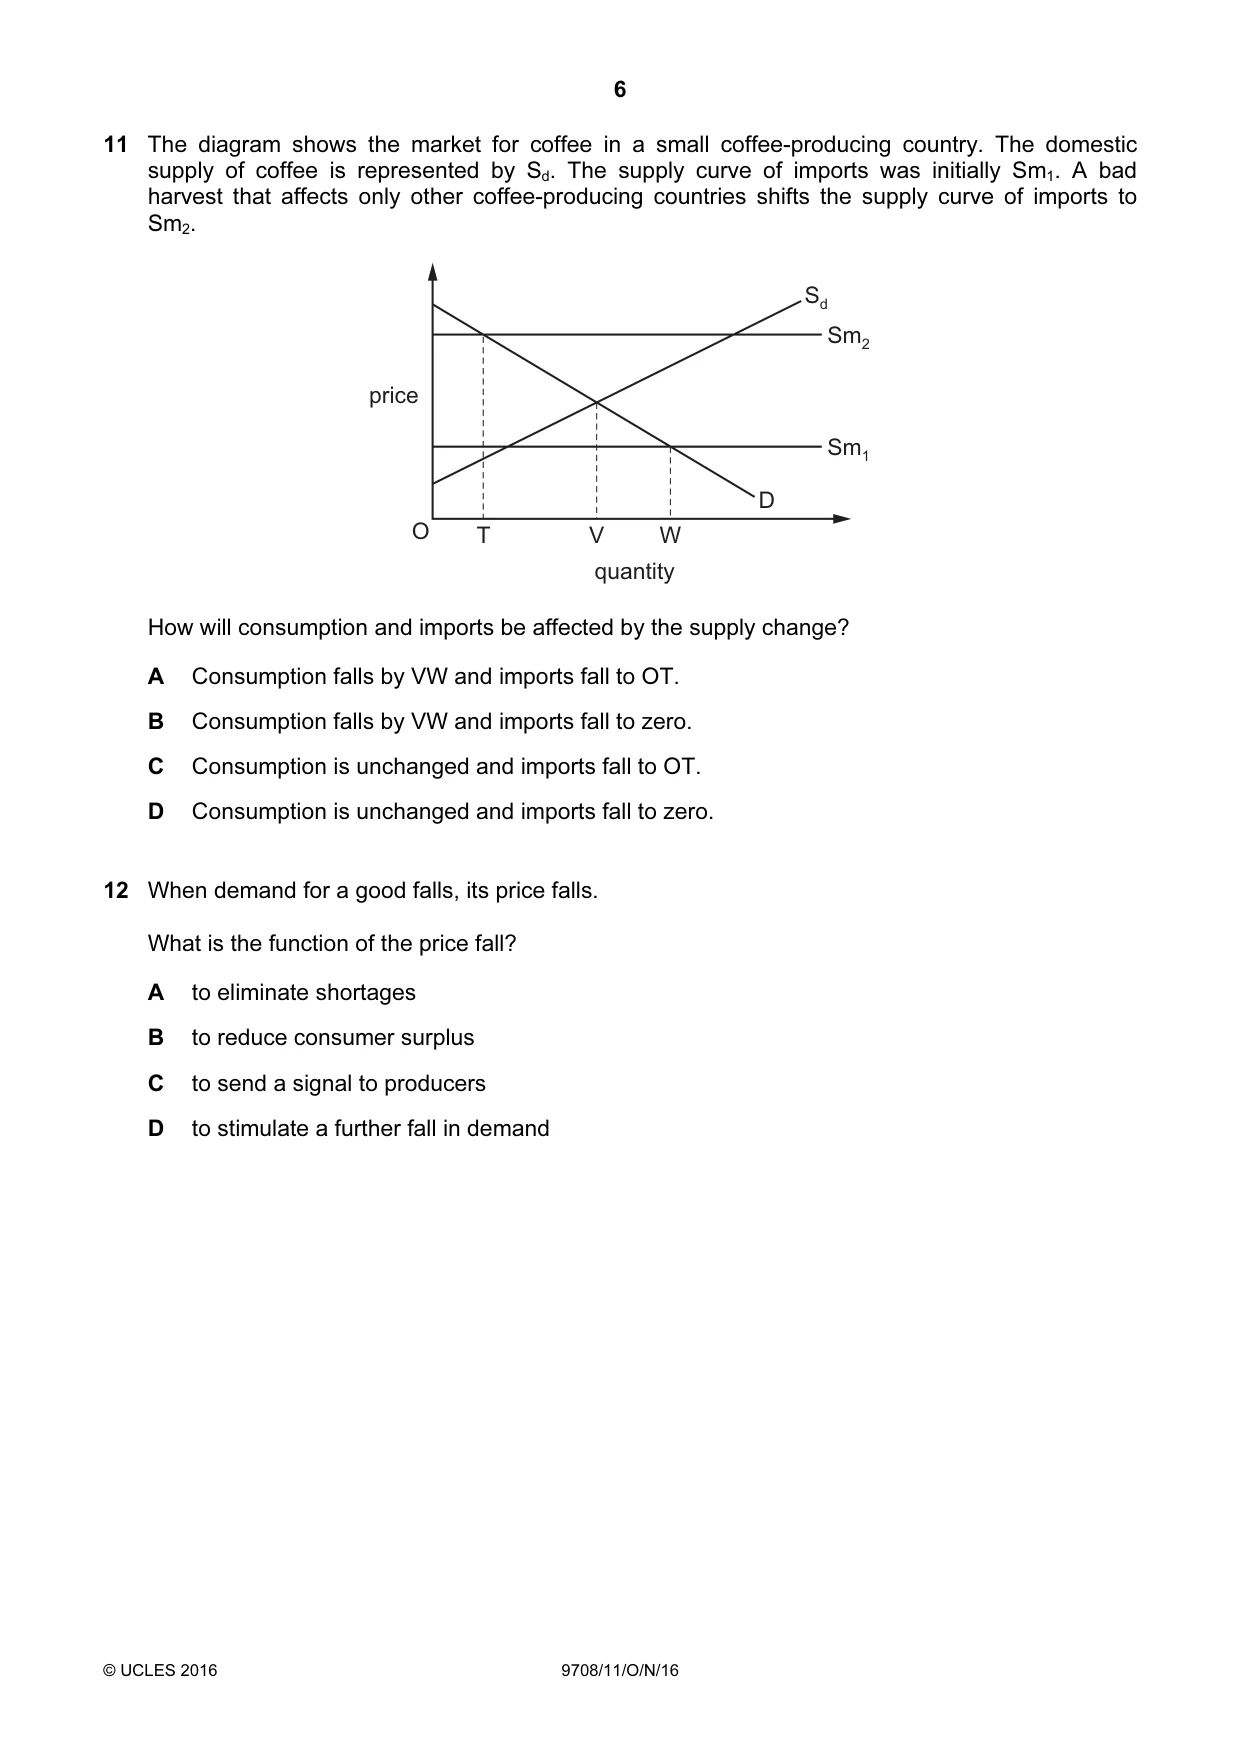
Q11 · The diagram shows the market for coffee in a small coffee-producing country
11 The diagram shows the market for coffee in a small coffee-producing country. The domestic supply of coffee is represented by Sd. The supply curve of imports was initially Sm1. A bad harvest that affects only other coffee-producing countries shifts the supply curve of imports to Sm2. Sd Sm2 price Sm1 D O T V W quantity How will consumption and imports be affected by the supply change? A Consumption falls by VW and imports fall to OT. B Consumption falls by VW and imports fall to zero. C Consumption is unchanged and imports fall to OT. D Consumption is unchanged and imports fall to zero.
Mark scheme: B
Q12 · When demand for a good falls, its price falls
12 When demand for a good falls, its price falls. What is the function of the price fall? A to eliminate shortages B to reduce consumer surplus C to send a signal to producers D to stimulate a further fall in demand
Mark scheme: C
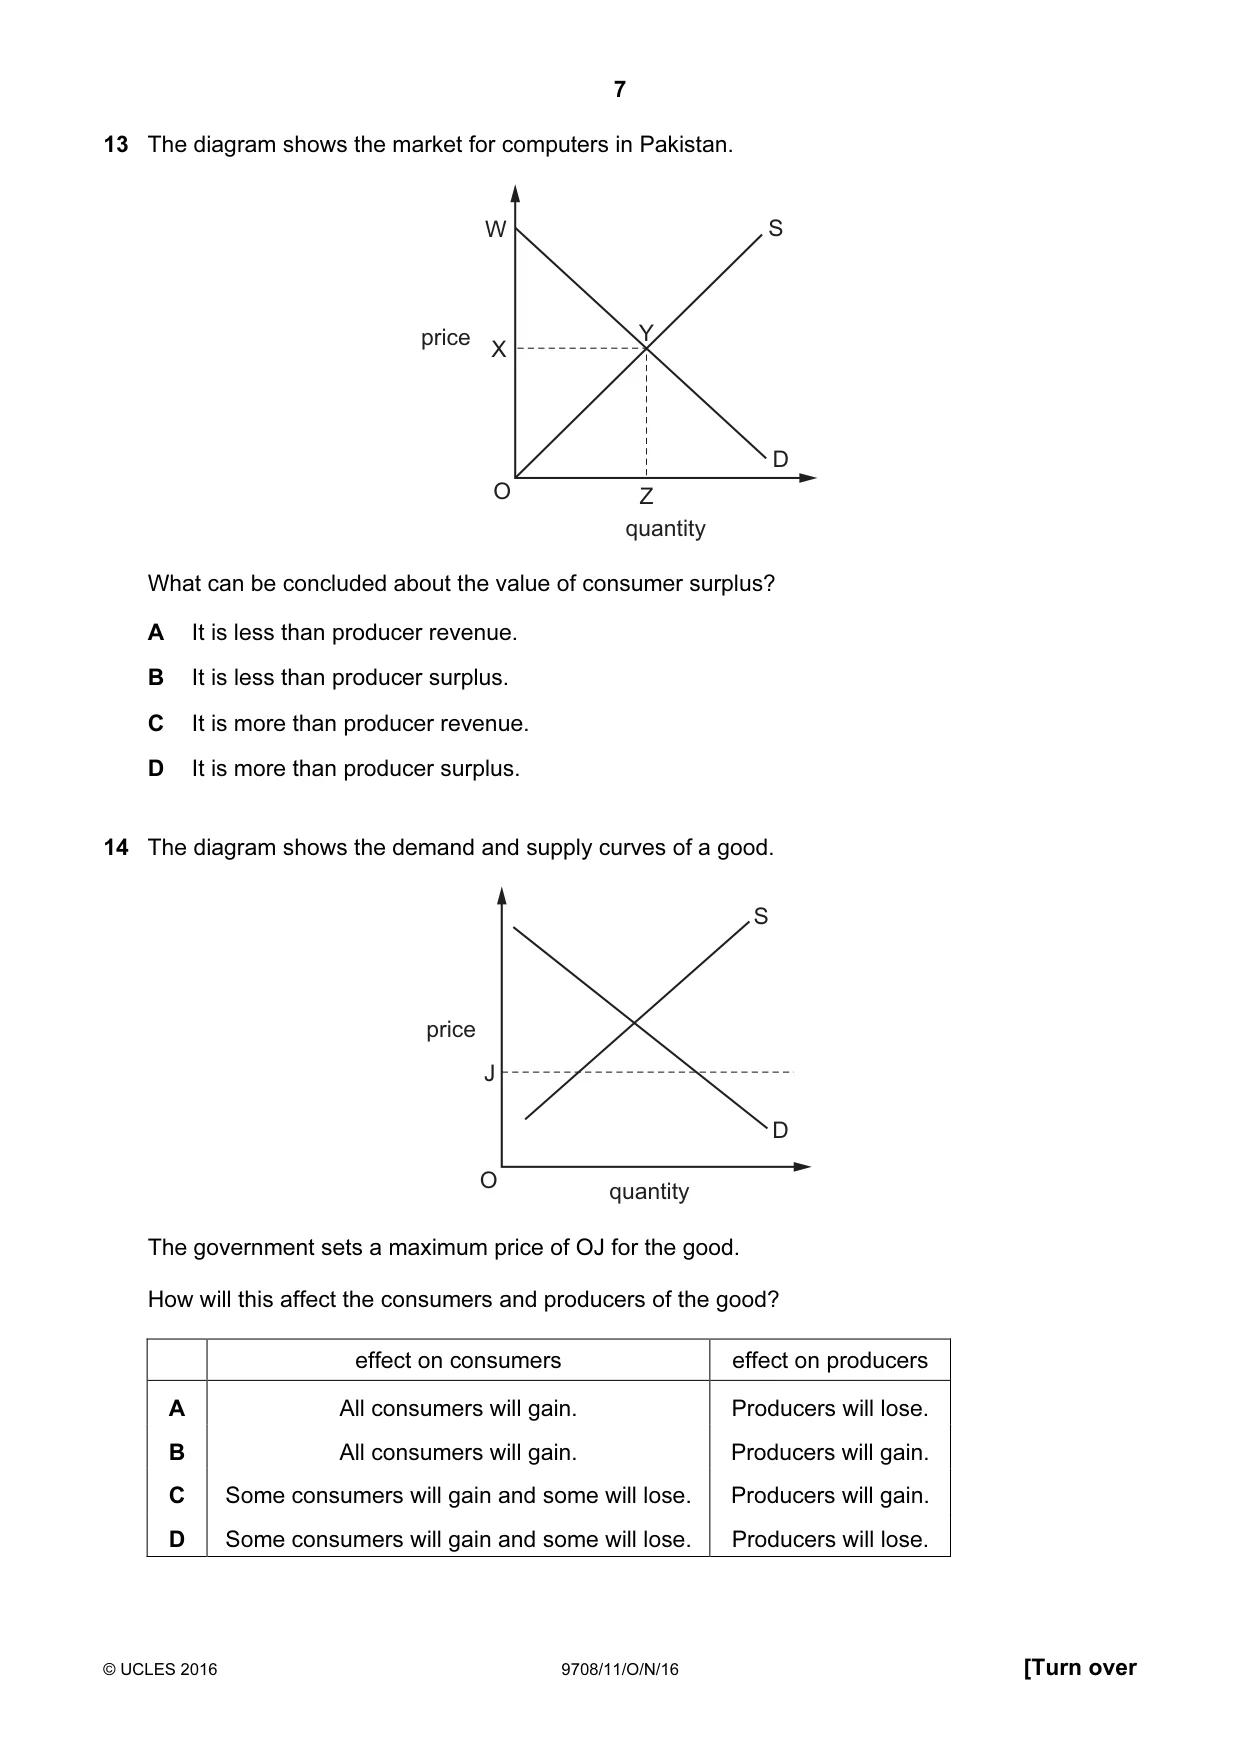
Q13 · The diagram shows the market for computers in Pakistan
13 The diagram shows the market for computers in Pakistan. W S price Y X D O Z quantity What can be concluded about the value of consumer surplus? A It is less than producer revenue. B It is less than producer surplus. C It is more than producer revenue. D It is more than producer surplus.
Mark scheme: A
Q14 · The diagram shows the demand and supply curves of a good
14 The diagram shows the demand and supply curves of a good. S price J D O quantity The government sets a maximum price of OJ for the good. How will this affect the consumers and producers of the good? effect on consumers effect on producers A All consumers will gain. Producers will lose. B All consumers will gain. Producers will gain. C Some consumers will gain and some will lose. Producers will gain. D Some consumers will gain and some will lose. Producers will lose.
Mark scheme: D
More questions on Methods and effects of government intervention in markets
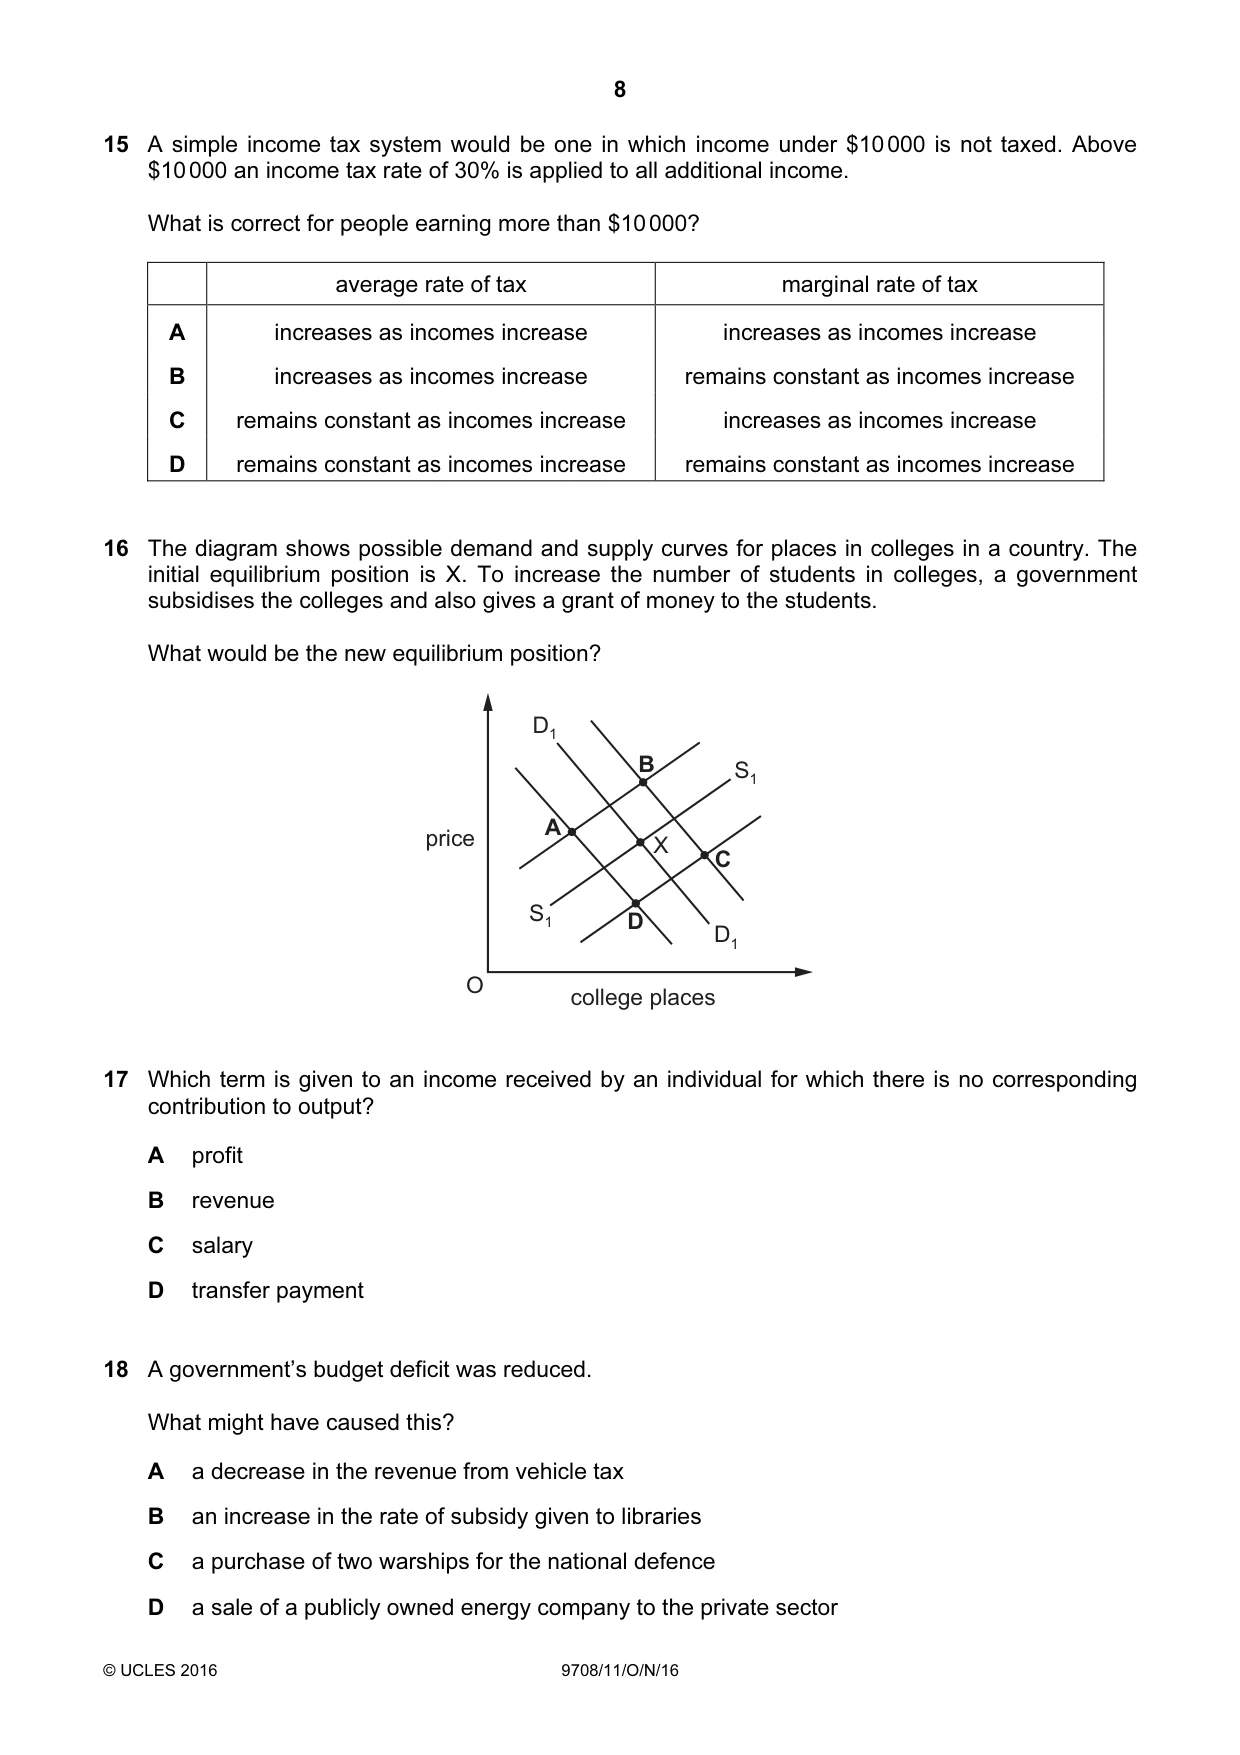
Q15 · A simple income tax system would be one in which income under $10 000 is not taxed
15 A simple income tax system would be one in which income under $10 000 is not taxed. Above $10 000 an income tax rate of 30% is applied to all additional income. What is correct for people earning more than $10 000? average rate of tax marginal rate of tax A increases as incomes increase increases as incomes increase B increases as incomes increase remains constant as incomes increase C remains constant as incomes increase increases as incomes increase D remains constant as incomes increase remains constant as incomes increase
Mark scheme: B
Q16 · The diagram shows possible demand and supply curves for places in colleges in a country
16 The diagram shows possible demand and supply curves for places in colleges in a country. The initial equilibrium position is X. To increase the number of students in colleges, a government subsidises the colleges and also gives a grant of money to the students. What would be the new equilibrium position? D1 B S1 A price X C S1 D D1 O college places
Mark scheme: C
More questions on Methods and effects of government intervention in markets
Q17 · Which term is given to an income received by an individual for which there is no…
17 Which term is given to an income received by an individual for which there is no corresponding contribution to output? A profit B revenue C salary D transfer payment
Mark scheme: D
More questions on Equity and redistribution of income and wealth
Q18 · A government’s budget deficit was reduced
18 A government’s budget deficit was reduced. What might have caused this? A a decrease in the revenue from vehicle tax B an increase in the rate of subsidy given to libraries C a purchase of two warships for the national defence D a sale of a publicly owned energy company to the private sector
Mark scheme: D
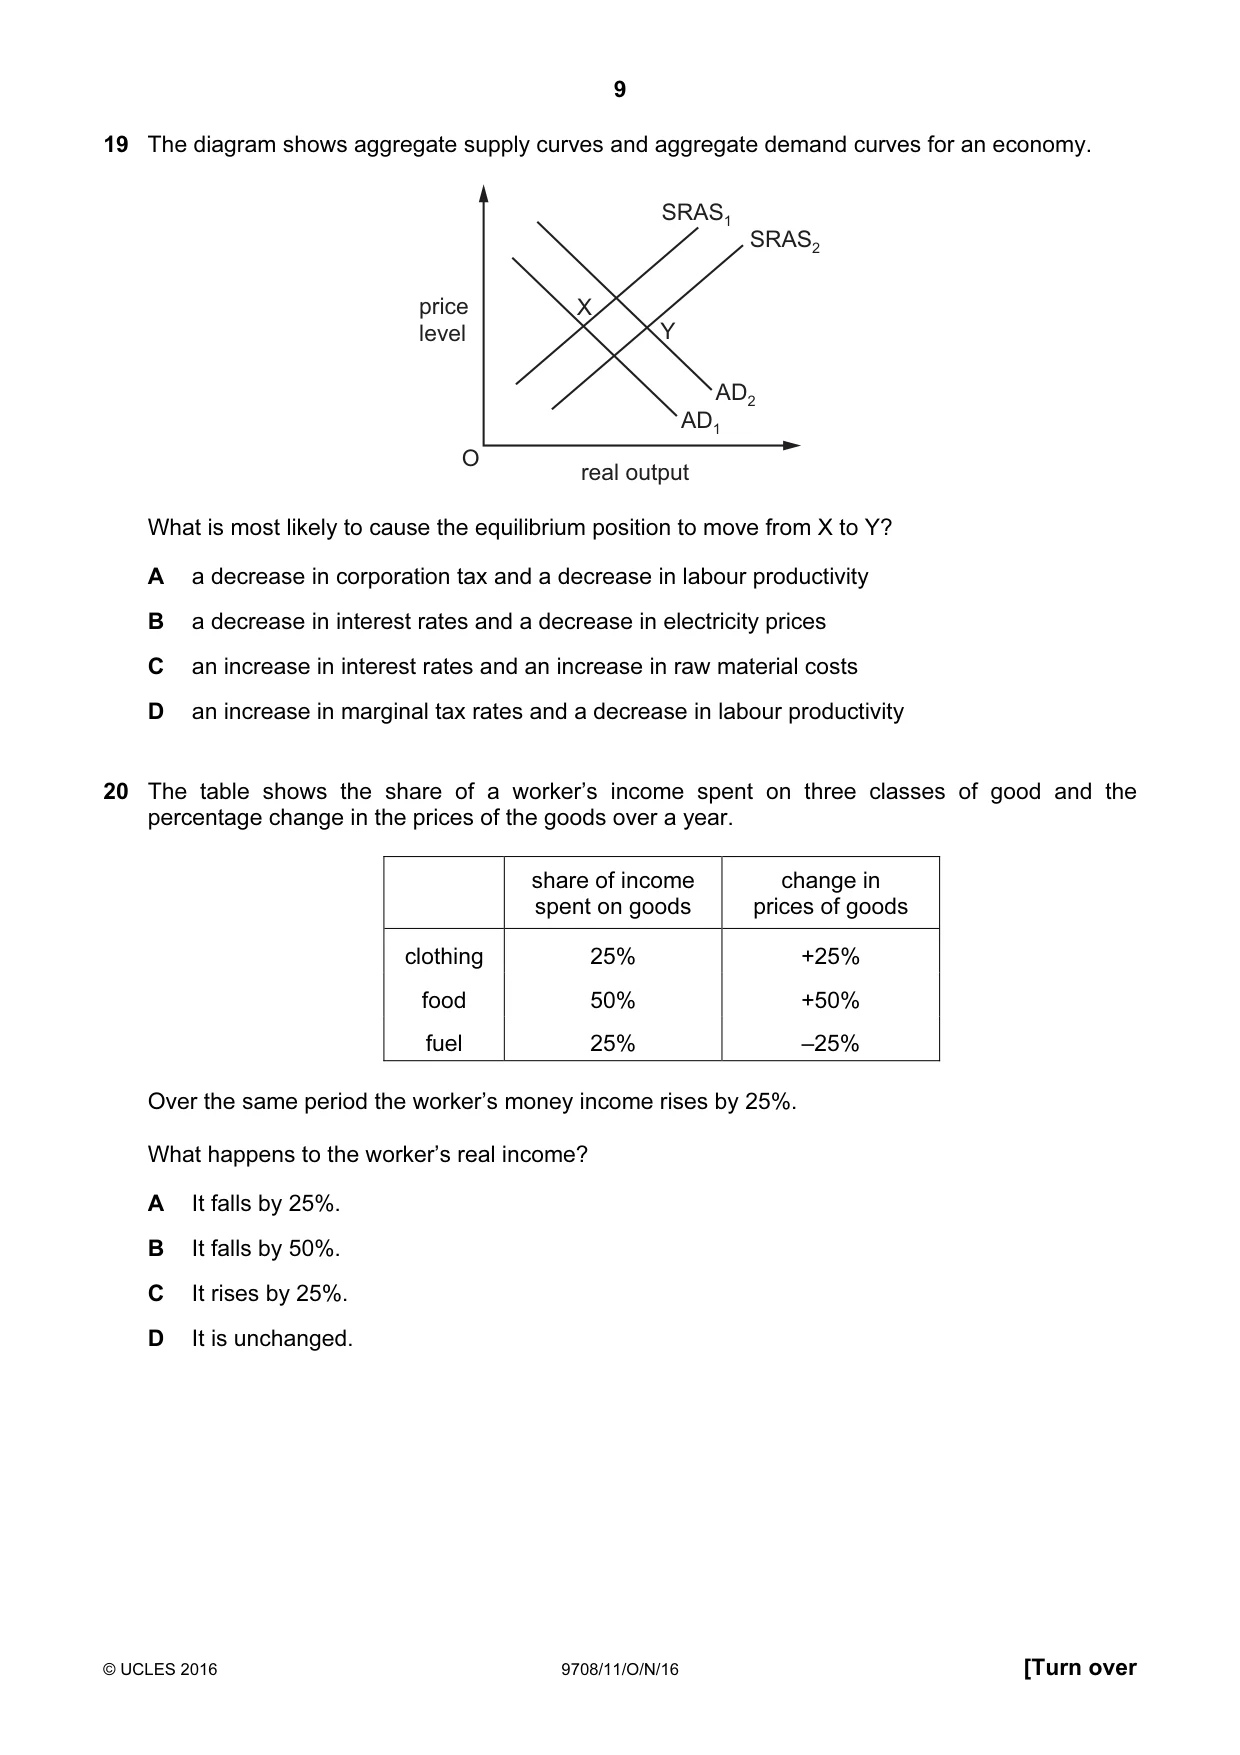
Q19 · The diagram shows aggregate supply curves and aggregate demand curves for an economy
19 The diagram shows aggregate supply curves and aggregate demand curves for an economy. SRAS1 SRAS2 price X level Y AD2 AD1 O real output What is most likely to cause the equilibrium position to move from X to Y? A a decrease in corporation tax and a decrease in labour productivity B a decrease in interest rates and a decrease in electricity prices C an increase in interest rates and an increase in raw material costs D an increase in marginal tax rates and a decrease in labour productivity
Mark scheme: B
More questions on Aggregate Demand and Aggregate Supply analysis
Q20 · The table shows the share of a worker’s income spent on three classes of good and the…
20 The table shows the share of a worker’s income spent on three classes of good and the percentage change in the prices of the goods over a year. share of income change in spent on goods prices of goods clothing 25% +25% food 50% +50% fuel 25% –25% Over the same period the worker’s money income rises by 25%. What happens to the worker’s real income? A It falls by 25%. B It falls by 50%. C It rises by 25%. D It is unchanged.
Mark scheme: D
Q21 · Over a period of a year, the annual rate of inflation becomes negative
21 Over a period of a year, the annual rate of inflation becomes negative. Which statement must be correct? A The cost of living has fallen. B The purchasing power of money has fallen. C The standard of living has increased. D There has been an increase in the Consumer Price Index.
Mark scheme: A
Q22 · What would cause an immediate increase in the deficit in a country’s balance of payments…
22 What would cause an immediate increase in the deficit in a country’s balance of payments on the current account? A a rise in government expenditure on education B a rise in the cost of imported raw materials used in domestic production C a rise in the foreign ownership of domestic companies D a rise in the total wages earned by nationals working abroad
Mark scheme: B
More questions on Current account of the balance of payments
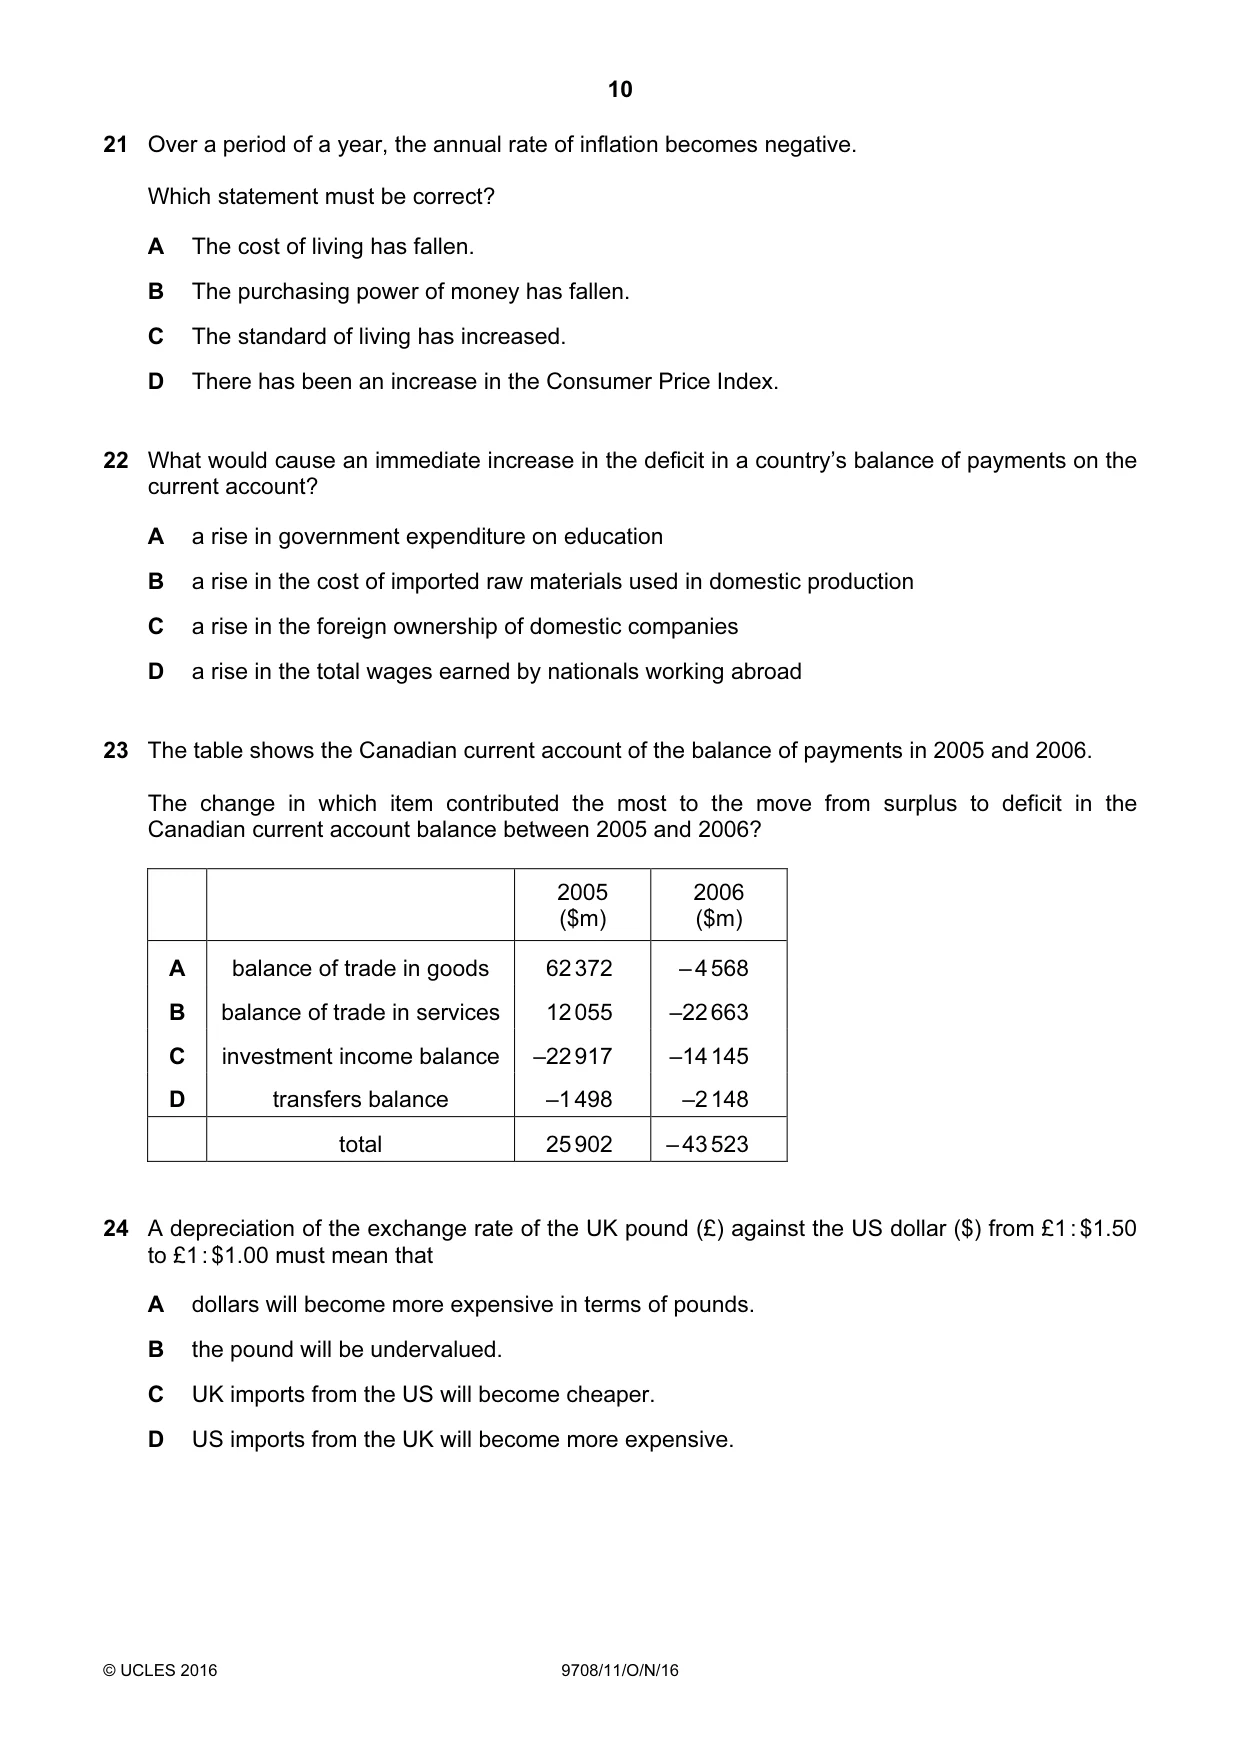
Q23 · The table shows the Canadian current account of the balance of payments in 2005 and 2006
23 The table shows the Canadian current account of the balance of payments in 2005 and 2006. The change in which item contributed the most to the move from surplus to deficit in the Canadian current account balance between 2005 and 2006? 2005 2006 ($m) ($m) A balance of trade in goods 62 372 – 4 568 B balance of trade in services 12 055 –22 663 C investment income balance –22 917 –14 145 D transfers balance –1 498 –2 148 total 25 902 – 43 523
Mark scheme: A
More questions on Current account of the balance of payments
Q24 · A depreciation of the exchange rate of the UK pound (£) against the US dollar ($) from £1…
24 A depreciation of the exchange rate of the UK pound (£) against the US dollar ($) from £1 : $1.50 to £1 : $1.00 must mean that A dollars will become more expensive in terms of pounds. B the pound will be undervalued. C UK imports from the US will become cheaper. D US imports from the UK will become more expensive.
Mark scheme: A
Q25 · A country has no controls on transactions in foreign exchange and allows its exchange…
25 A country has no controls on transactions in foreign exchange and allows its exchange rate to float freely. What will always be zero? A net inward investment B the country’s foreign exchange reserves C the current account balance of payments position D the overall balance of payments position
Mark scheme: D
Q26 · The table gives the terms of trade index for Brunei Darussalam for the period 2009 to 2012
26 The table gives the terms of trade index for Brunei Darussalam for the period 2009 to 2012. 2009 2010 2011 2012 terms of trade index 100.0 107.2 124.9 134.5 What can be concluded from the table? A Export prices were 34.5% higher in 2012 than in 2009. B Import prices were 34.5% lower in 2012 than in 2009. C The ratio of export to import prices was 34.5% higher in 2012 than in 2009. D The terms of trade increased by 34.5% during 2012.
Mark scheme: C
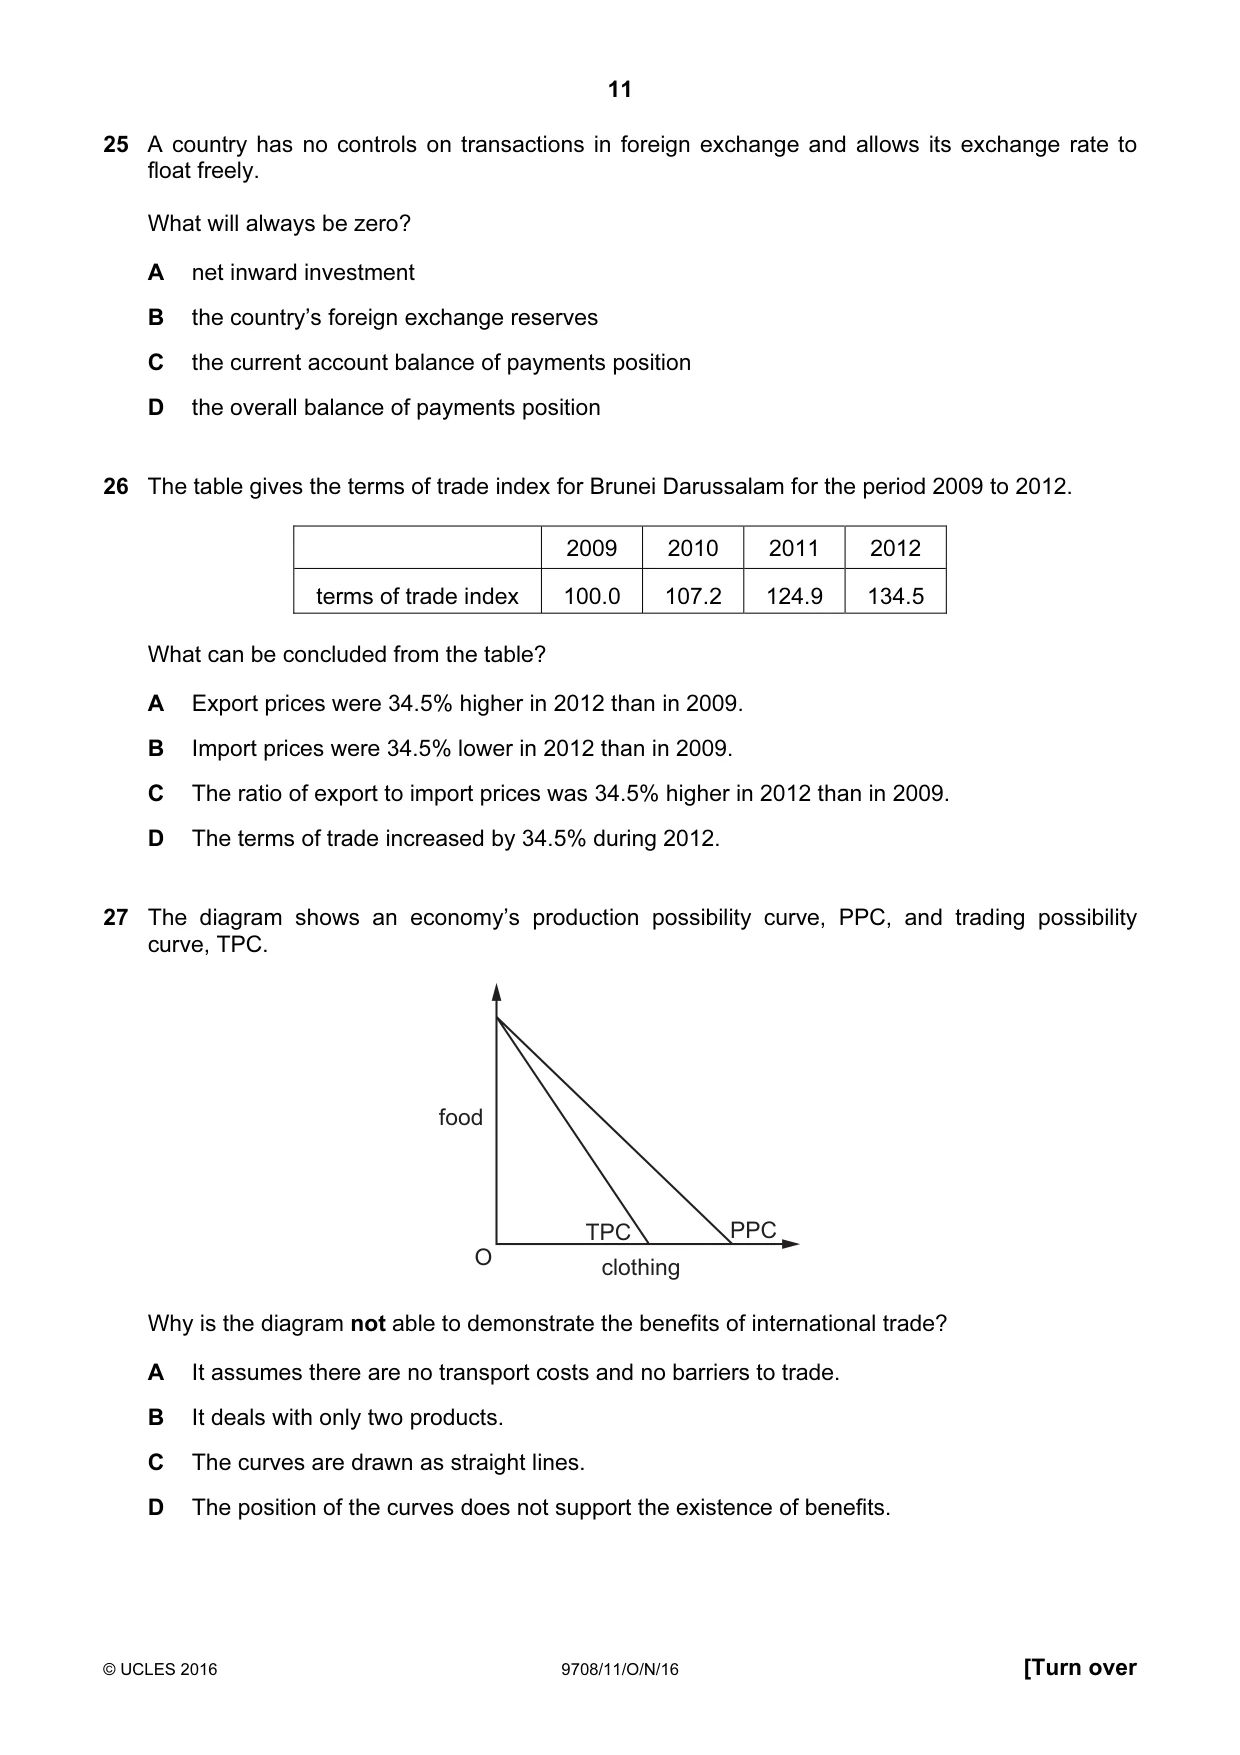
Q27 · The diagram shows an economy’s production possibility curve, PPC, and trading possibility…
27 The diagram shows an economy’s production possibility curve, PPC, and trading possibility curve, TPC. food TPC PPC O clothing Why is the diagram not able to demonstrate the benefits of international trade? A It assumes there are no transport costs and no barriers to trade. B It deals with only two products. C The curves are drawn as straight lines. D The position of the curves does not support the existence of benefits.
Mark scheme: D
Q28 · Which government policy will increase aggregate demand?
28 Which government policy will increase aggregate demand? A raising indirect taxation B reducing the budget surplus C removing domestic subsidies D removing import quotas
Mark scheme: B
Q29 · What would be the best policy for a country to reduce a balance of payments deficit?
29 What would be the best policy for a country to reduce a balance of payments deficit? A an increase in interest rates B an increase in the exchange rate C a reduction in direct taxes D a reduction in subsidies to domestic industry
Mark scheme: A
More questions on Policies to correct imbalances in the current account of the balance of payments
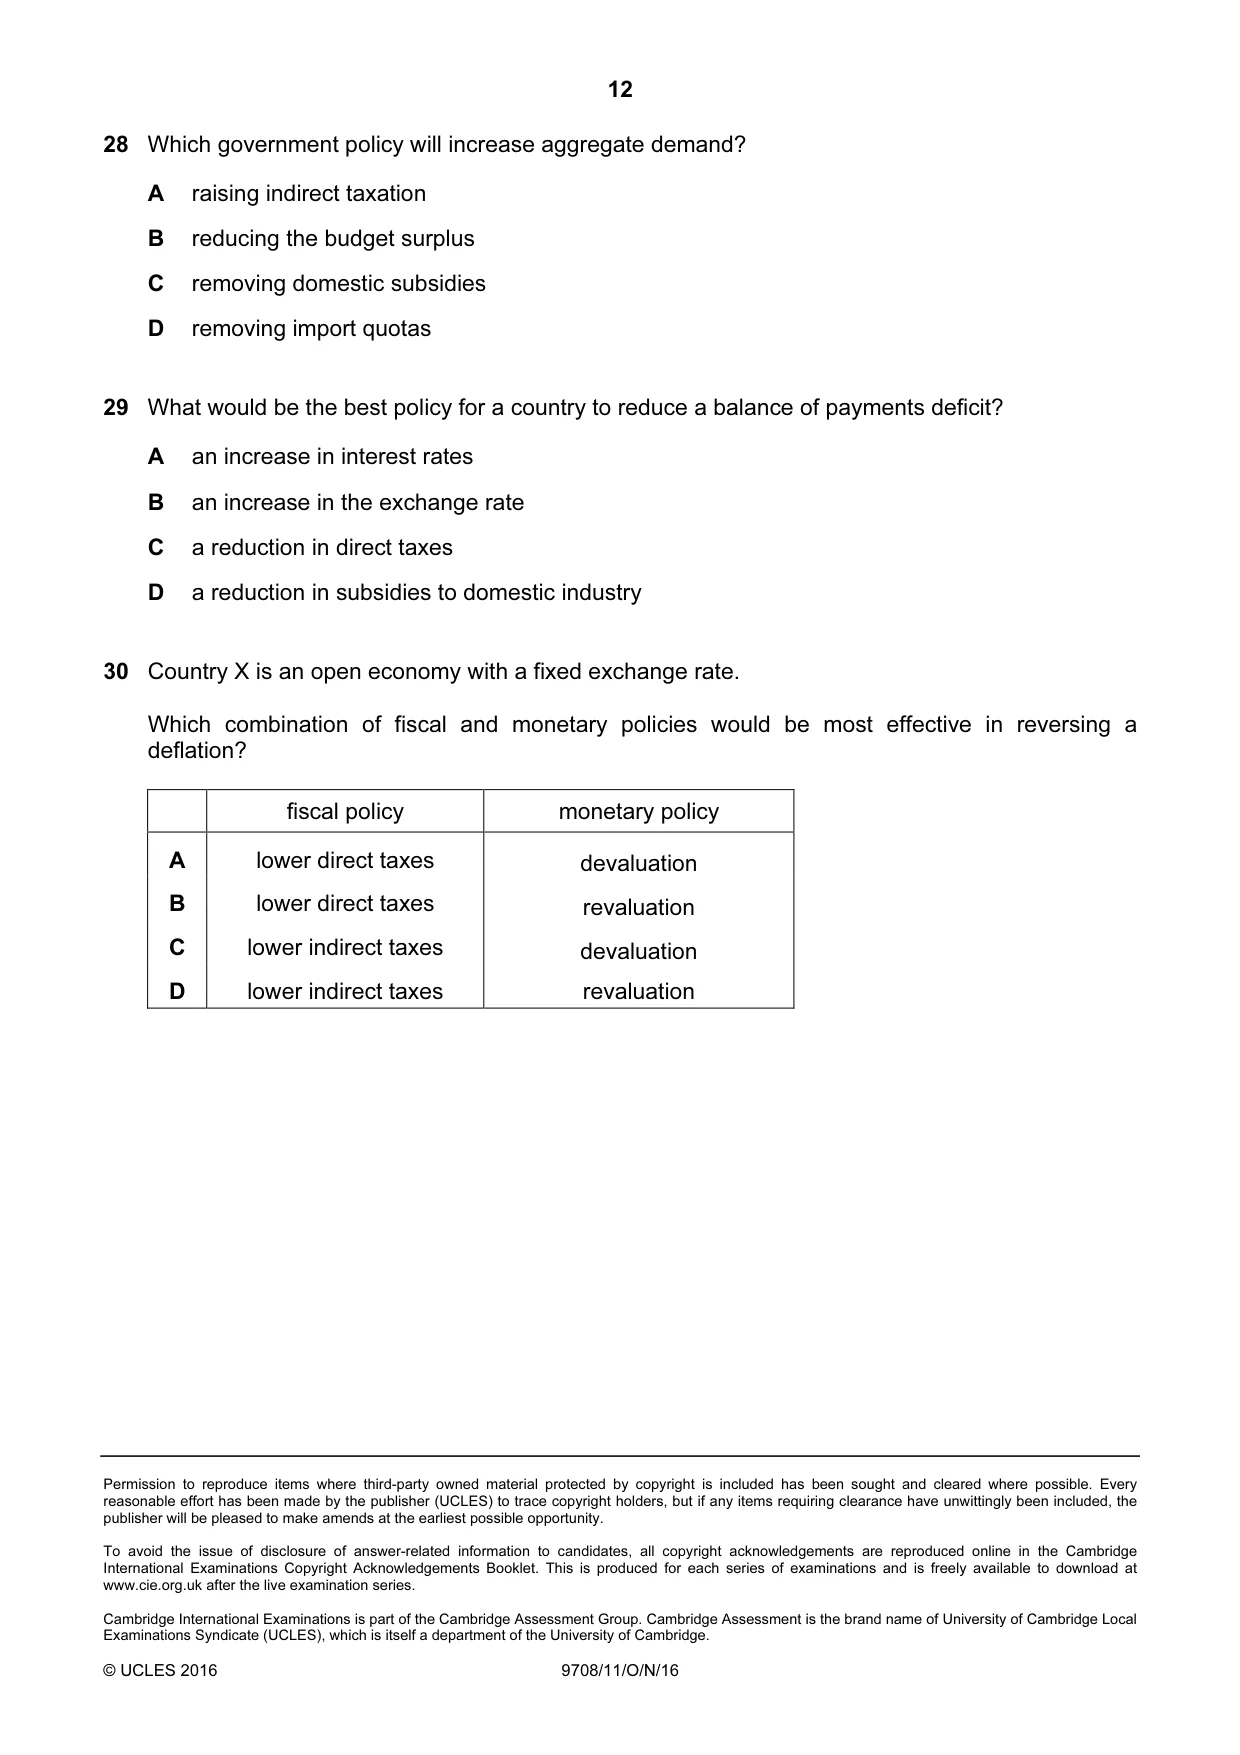
Q30 · Country X is an open economy with a fixed exchange rate
30 Country X is an open economy with a fixed exchange rate. Which combination of fiscal and monetary policies would be most effective in reversing a deflation? fiscal policy monetary policy A lower direct taxes devaluation B lower direct taxes revaluation C lower indirect taxes devaluation D lower indirect taxes revaluation
Mark scheme: A
What was in this paper
The subtopics covered by these 30 questions, and how many questions each got. Open one in a new tab to see every Cambridge question on it.
3Current account of the balance of payments2Demand and supply curves2Exchange rates2Methods and effects of government intervention in markets2Price elasticity of supply2Price elasticity, income elasticity and cross elasticity of demand2Price stability2Production possibility curves2The interaction of demand and supply2The reasons for international trade2Addressing income and wealth inequality1Aggregate Demand and Aggregate Supply analysis1Classification of goods and services1Consumer and producer surplus1Equity and redistribution of income and wealth1Policies to correct imbalances in the current account of the balance of payments1Types of cost, revenue and profit, short-run and long-run production1What you needed in this session
Cambridge’s own grade thresholds for 2016 Oct/Nov, Paper 1 · Variant 1. A higher threshold means an easier paper — the bar moves with how the cohort did.