Cambridge A Level Economics 9708 — 2018 Oct/Nov Paper 1 · Variant 1
9708/11/O/N/18 · 30 questions · 30 marks · ≈34 min
The question paper and its mark scheme, free to read here and free to download. This is Cambridge’s own paper, exactly as it was sat.
Question paper16 pages

Mark scheme3 pages
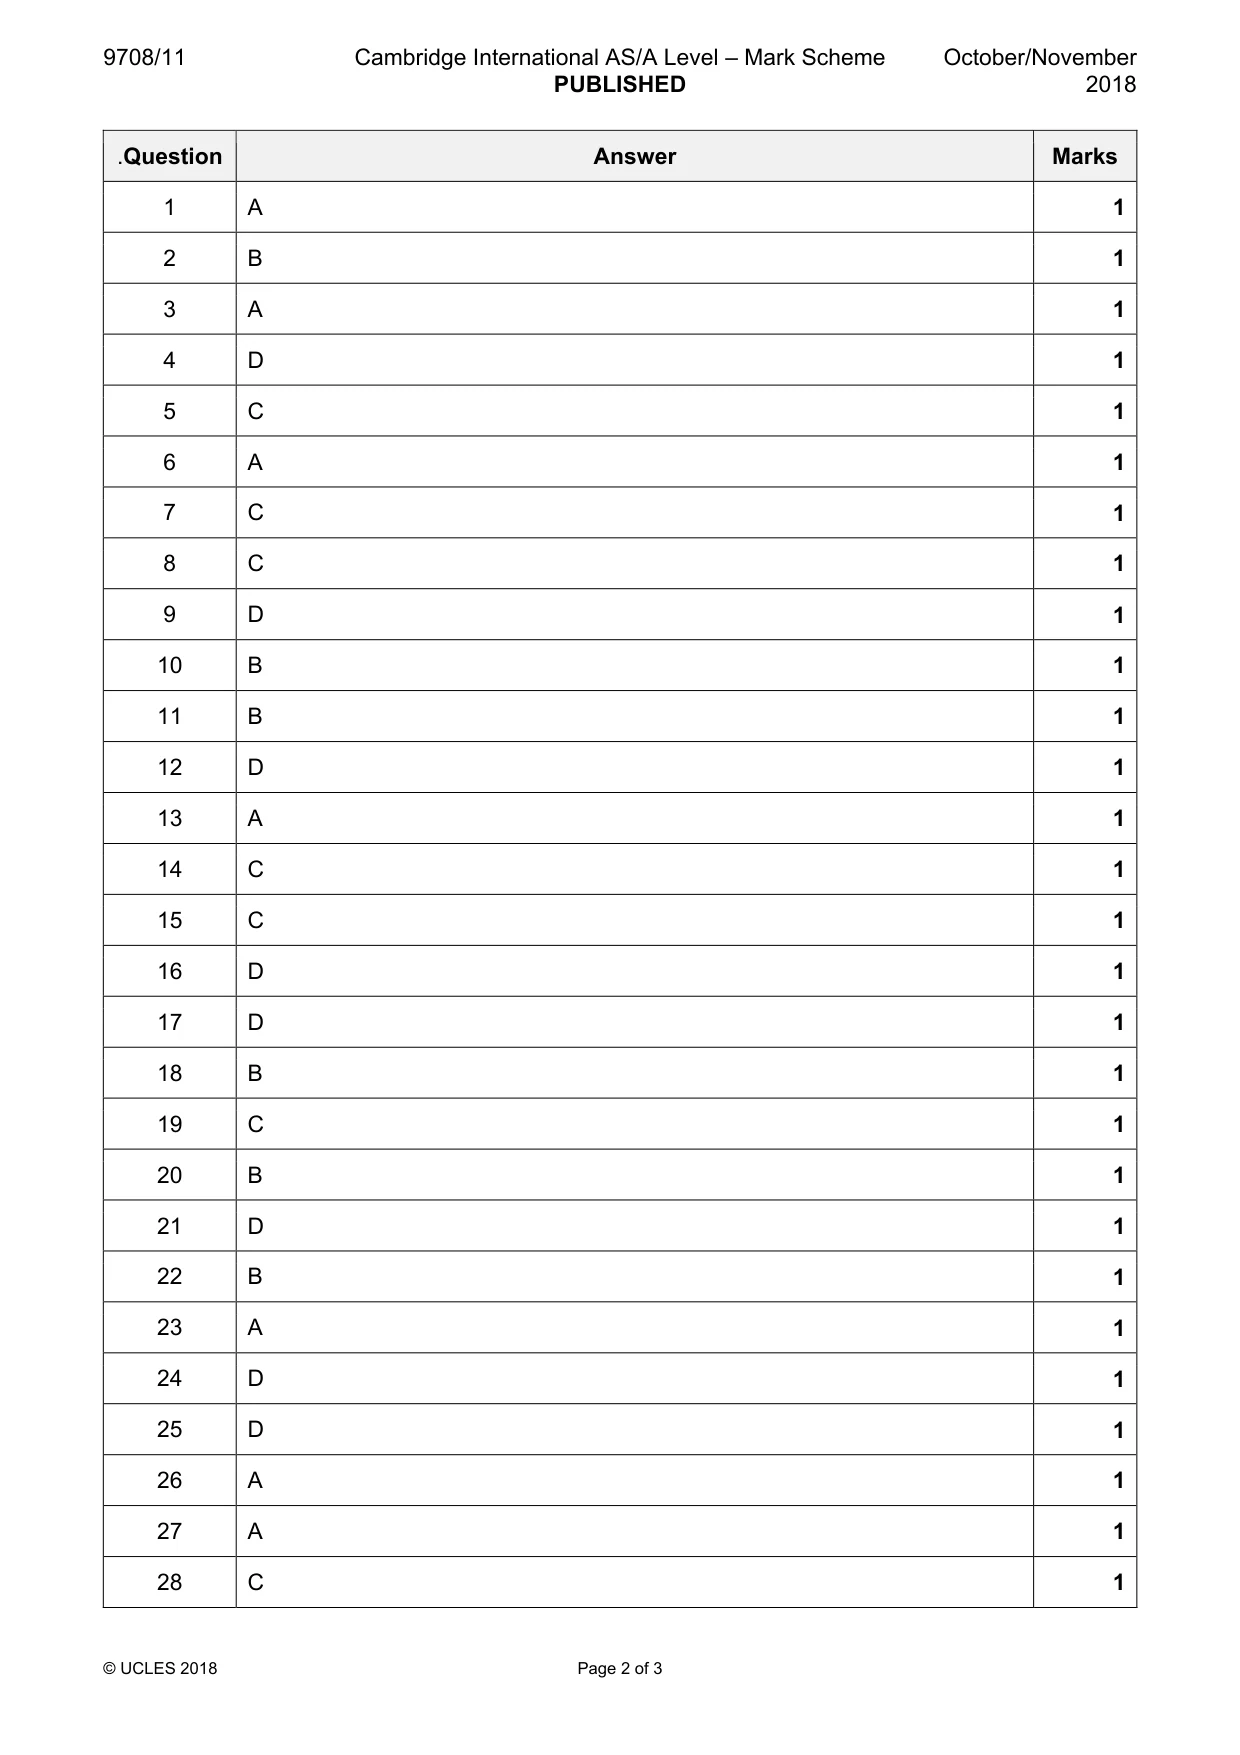
Answers below. Sit the paper first if you are practising.
Questions as text
Q1 · The demand for a product is inversely related to its price, ceteris paribus
1 The demand for a product is inversely related to its price, ceteris paribus. What does ceteris paribus mean in this context? A Factors affecting demand other than price are held constant. B Factors affecting price other than demand are held constant. C Price changes result from changes in demand. D Price falls result in increased quantity demanded.
Mark scheme: A
Q2 · What is not an example of the role of the factor enterprise in a modern economy?
2 What is not an example of the role of the factor enterprise in a modern economy? A deciding on new export markets for the company’s goods and services B making payments to suppliers for raw materials and capital goods C reducing costs through the introduction of a new shift system for employees D transforming the production process with the introduction of robots
Mark scheme: B
Q3 · The production possibility curves show the abilities of four economies to produce trucks…
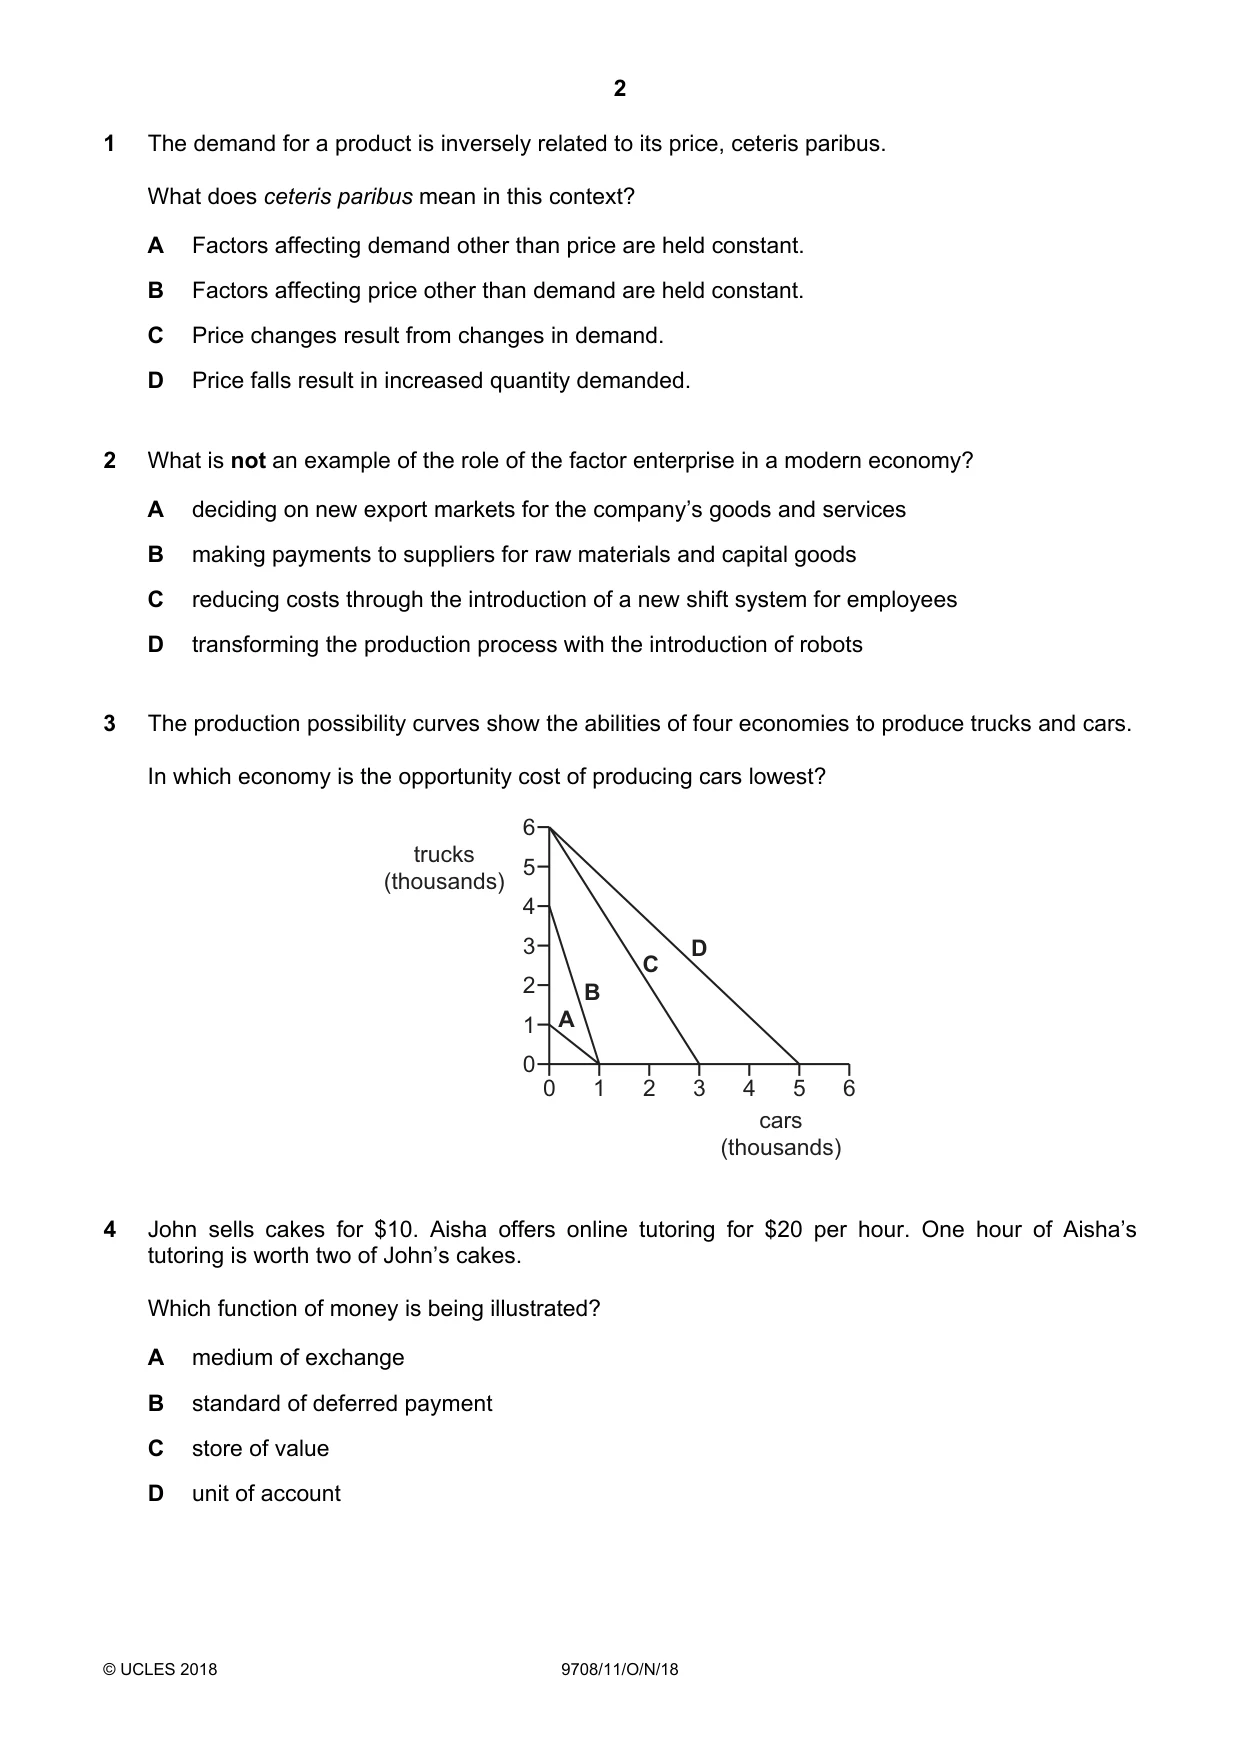
3 The production possibility curves show the abilities of four economies to produce trucks and cars. In which economy is the opportunity cost of producing cars lowest? 6 trucks 5 (thousands) 4 3 D C 2 B 1 A 0 0 1 2 3 4 5 6 cars (thousands)
Mark scheme: A
Q4 · John sells cakes for $10
4 John sells cakes for $10. Aisha offers online tutoring for $20 per hour. One hour of Aisha’s tutoring is worth two of John’s cakes. Which function of money is being illustrated? A medium of exchange B standard of deferred payment C store of value D unit of account
Mark scheme: D
Q5 · In the diagram, D1 is the initial demand curve for student places at universities
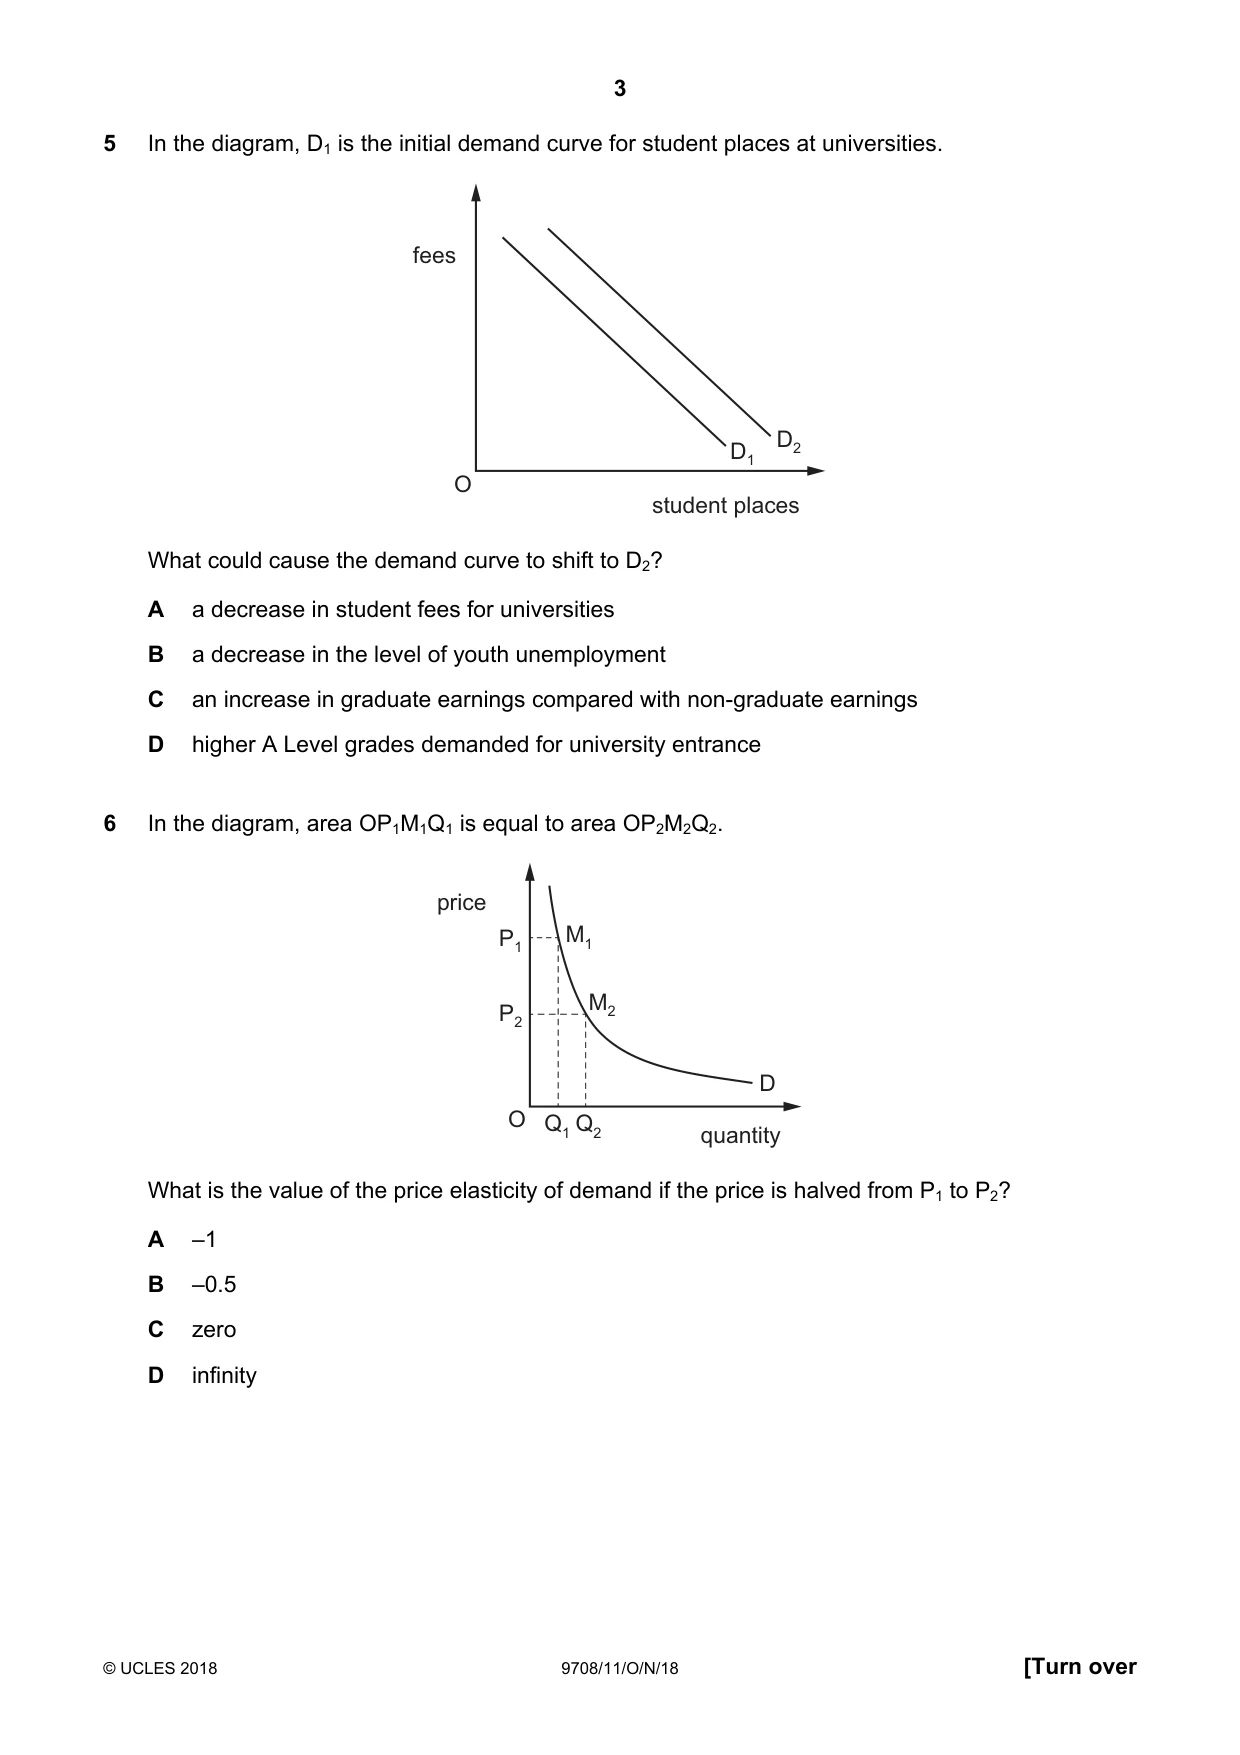
5 In the diagram, D1 is the initial demand curve for student places at universities. fees D2 D1 O student places What could cause the demand curve to shift to D2? A a decrease in student fees for universities B a decrease in the level of youth unemployment C an increase in graduate earnings compared with non-graduate earnings D higher A Level grades demanded for university entrance
Mark scheme: C
Q6 · In the diagram, area OP1M1Q1 is equal to area OP2M2Q2
6 In the diagram, area OP1M1Q1 is equal to area OP2M2Q2. price P1 M1 M2 P2 D O Q1 Q2 quantity What is the value of the price elasticity of demand if the price is halved from P1 to P2? A –1 B –0.5 C zero D infinity
Mark scheme: A
More questions on Price elasticity, income elasticity and cross elasticity of demand
Q7 · Which elasticity values indicate that cars are normal goods and that petrol is a…
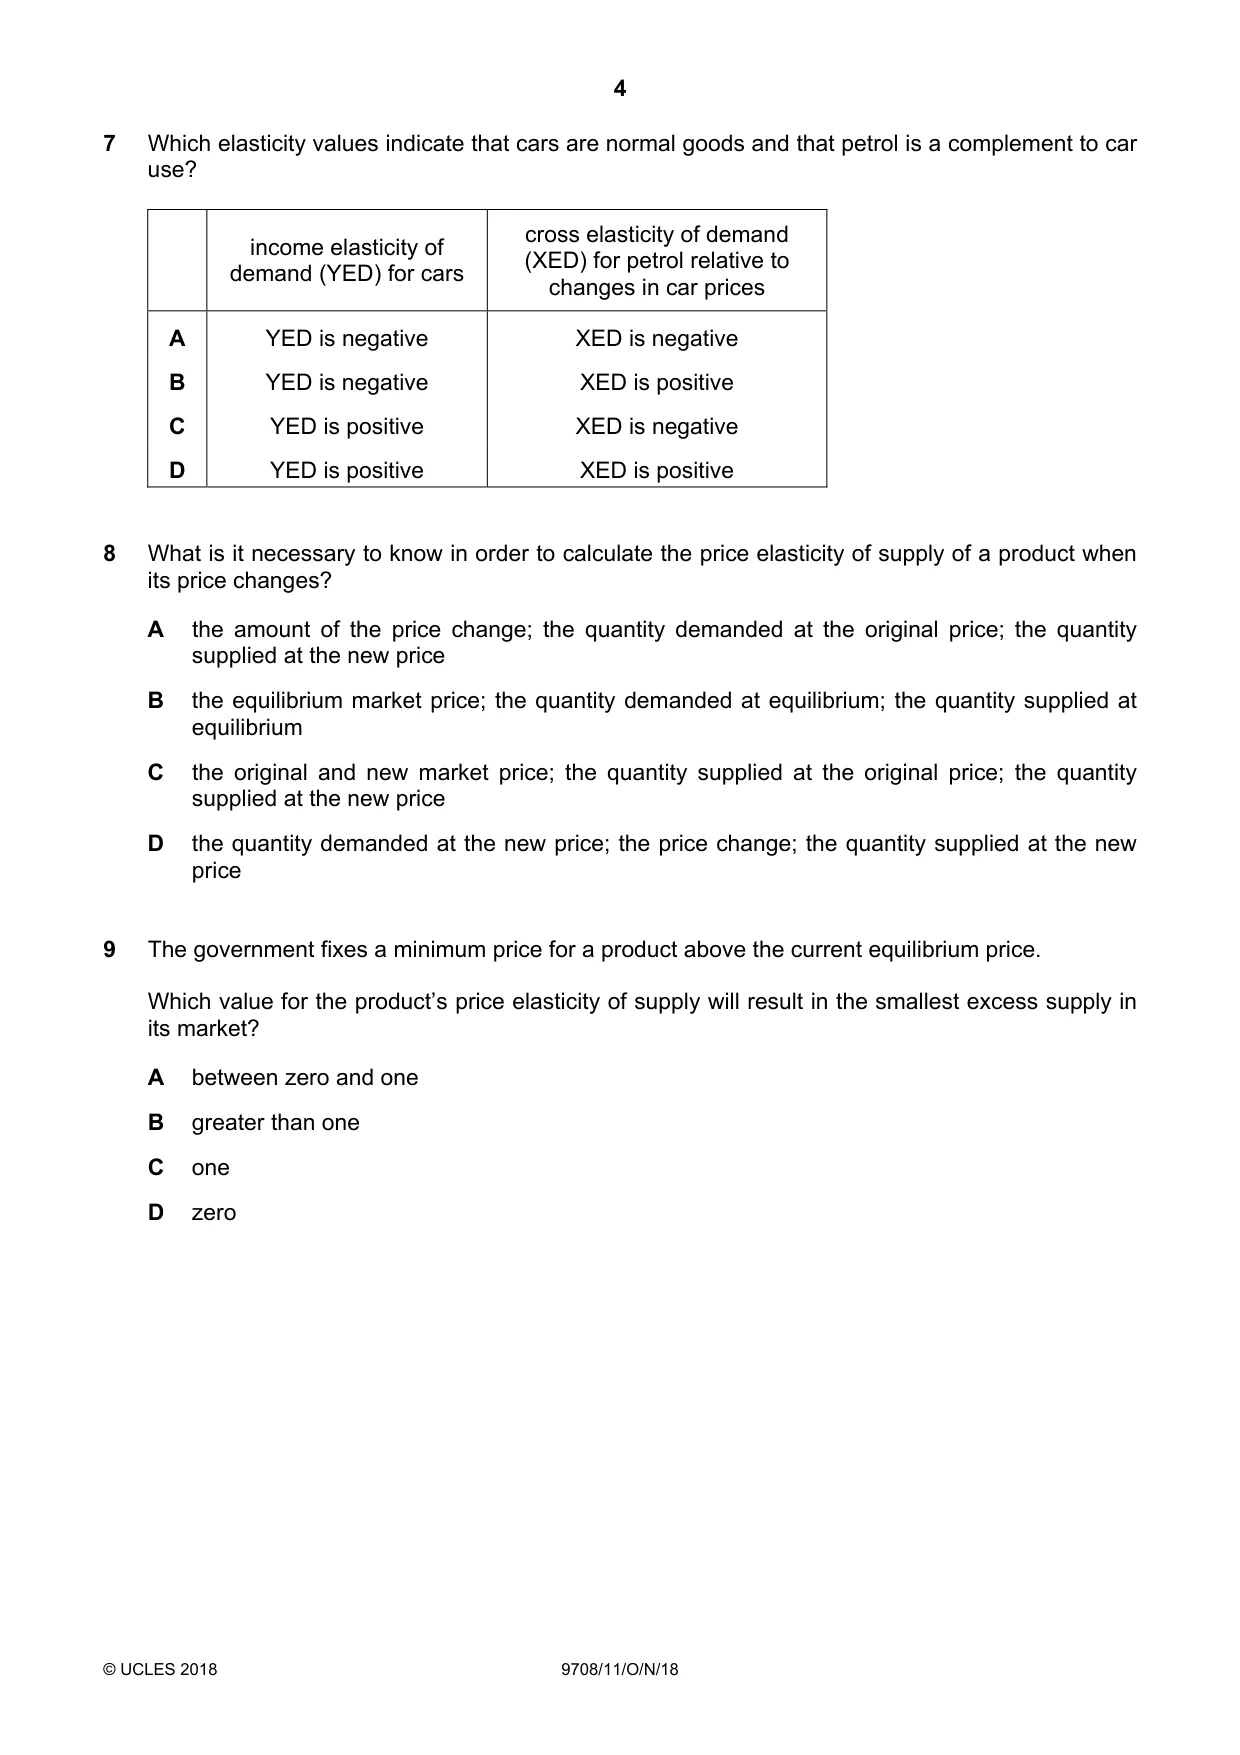
7 Which elasticity values indicate that cars are normal goods and that petrol is a complement to car use? cross elasticity of demand income elasticity of (XED) for petrol relative to demand (YED) for cars changes in car prices A YED is negative XED is negative B YED is negative XED is positive C YED is positive XED is negative D YED is positive XED is positive
Mark scheme: C
More questions on Price elasticity, income elasticity and cross elasticity of demand
Q8 · What is it necessary to know in order to calculate the price elasticity of supply of a…
8 What is it necessary to know in order to calculate the price elasticity of supply of a product when its price changes? A the amount of the price change; the quantity demanded at the original price; the quantity supplied at the new price B the equilibrium market price; the quantity demanded at equilibrium; the quantity supplied at equilibrium C the original and new market price; the quantity supplied at the original price; the quantity supplied at the new price D the quantity demanded at the new price; the price change; the quantity supplied at the new price
Mark scheme: C
Q9 · The government fixes a minimum price for a product above the current equilibrium price
9 The government fixes a minimum price for a product above the current equilibrium price. Which value for the product’s price elasticity of supply will result in the smallest excess supply in its market? A between zero and one B greater than one C one D zero
Mark scheme: D
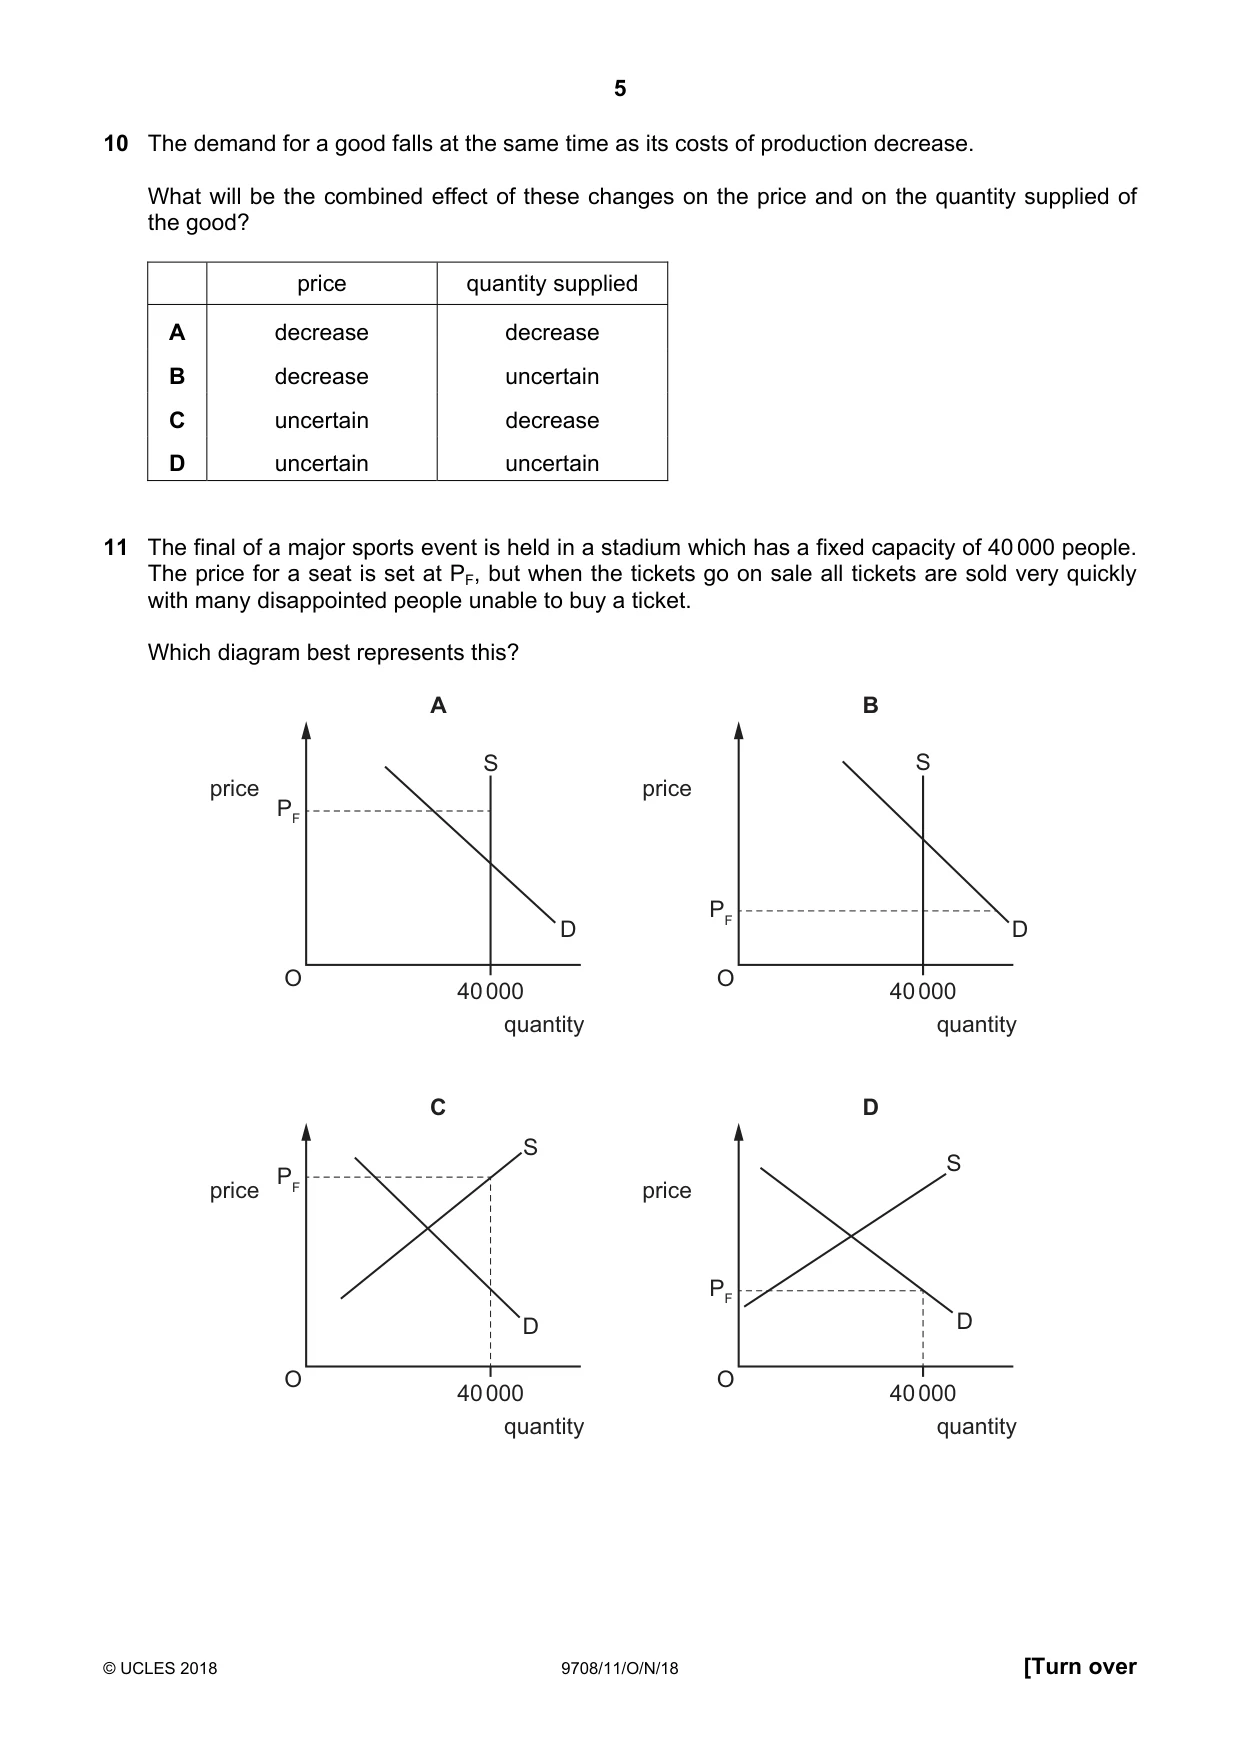
Q10 · The demand for a good falls at the same time as its costs of production decrease
10 The demand for a good falls at the same time as its costs of production decrease. What will be the combined effect of these changes on the price and on the quantity supplied of the good? price quantity supplied A decrease decrease B decrease uncertain C uncertain decrease D uncertain uncertain
Mark scheme: B
Q11 · The final of a major sports event is held in a stadium which has a fixed capacity of 40…
11 The final of a major sports event is held in a stadium which has a fixed capacity of 40 000 people. The price for a seat is set at PF, but when the tickets go on sale all tickets are sold very quickly with many disappointed people unable to buy a ticket. Which diagram best represents this? A B S S price price PF PF D D O O 40 000 40 000 quantity quantity C D S S price PF price PF D D O O 40 000 40 000 quantity quantity
Mark scheme: B
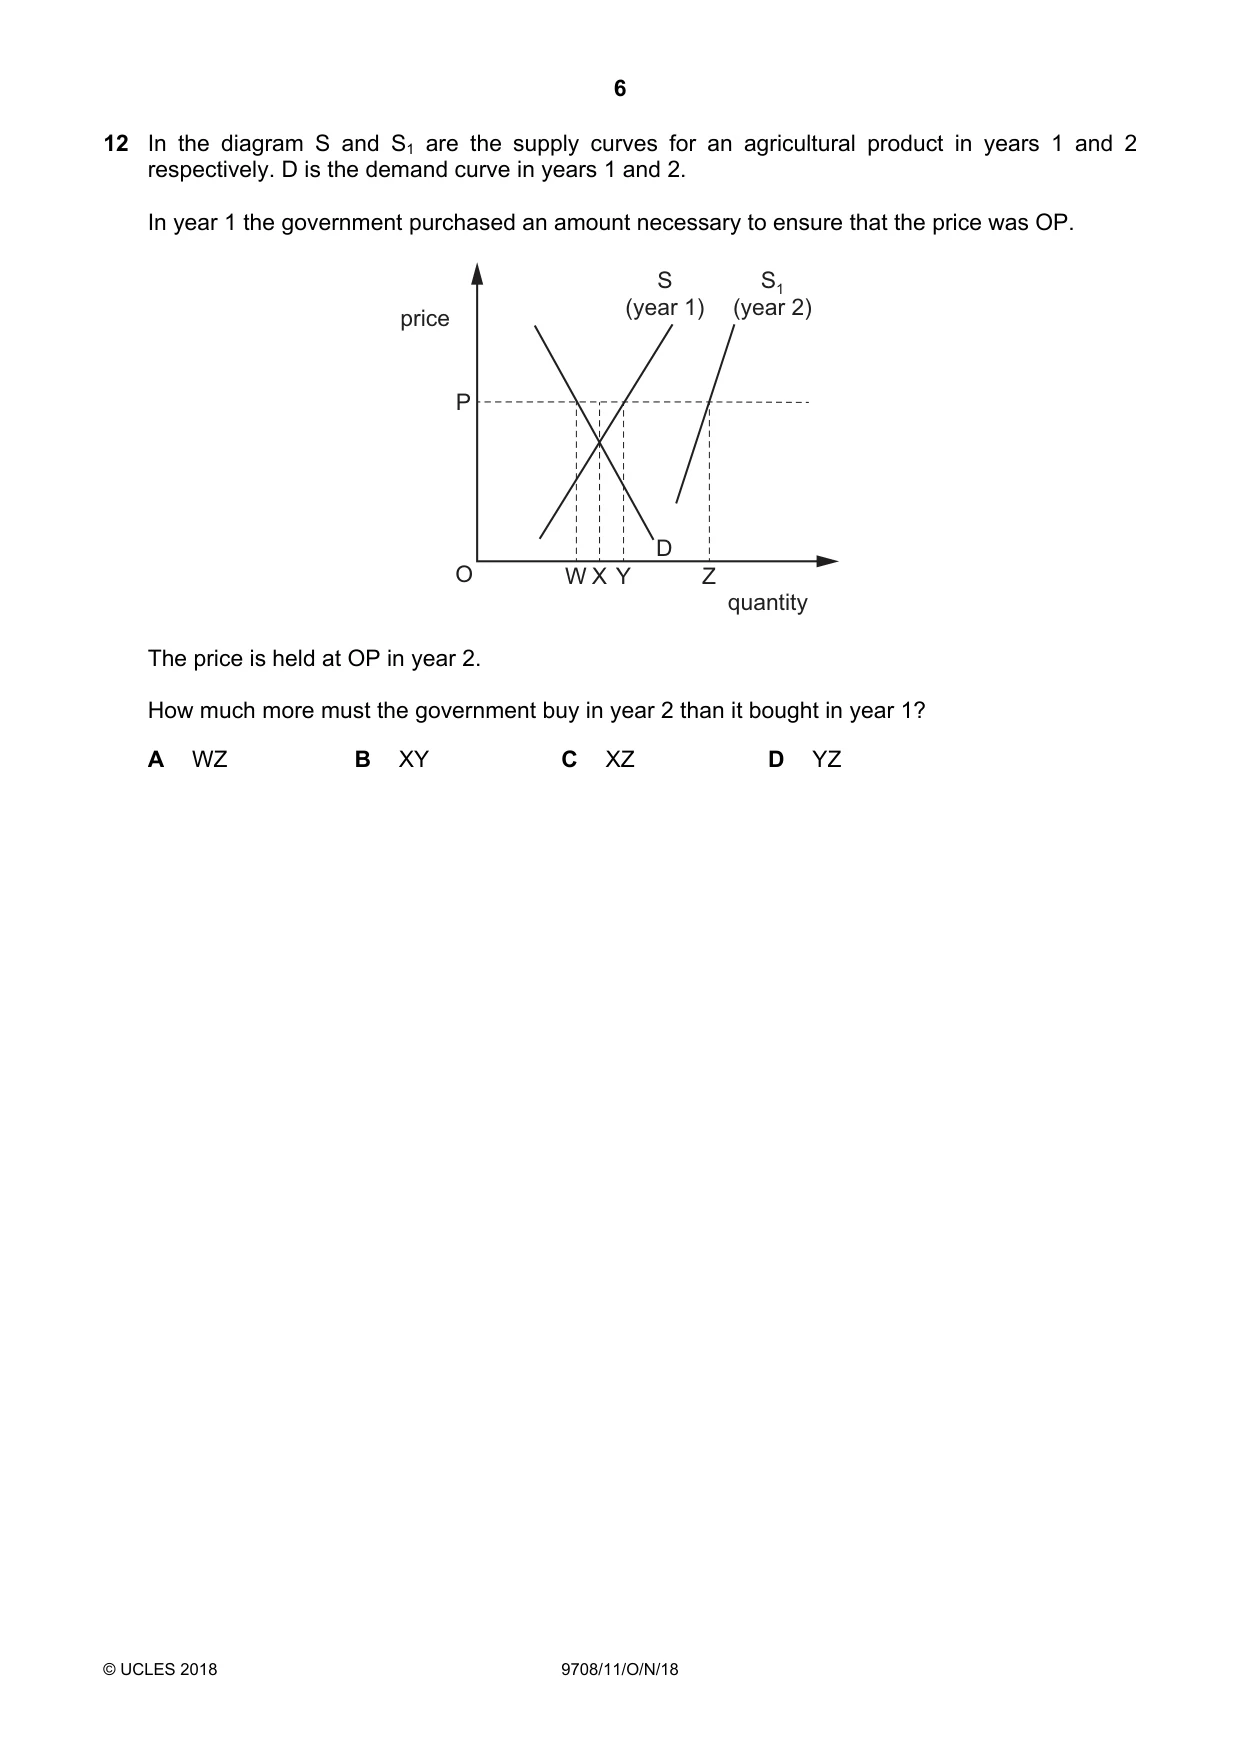
Q12 · In the diagram S and S1 are the supply curves for an agricultural product in years 1 and…
12 In the diagram S and S1 are the supply curves for an agricultural product in years 1 and 2 respectively. D is the demand curve in years 1 and 2. In year 1 the government purchased an amount necessary to ensure that the price was OP. S S1 price (year 1) (year 2) P D O W X Y Z quantity The price is held at OP in year 2. How much more must the government buy in year 2 than it bought in year 1? A WZ B XY C XZ D YZ
Mark scheme: D
More questions on Methods and effects of government intervention in markets
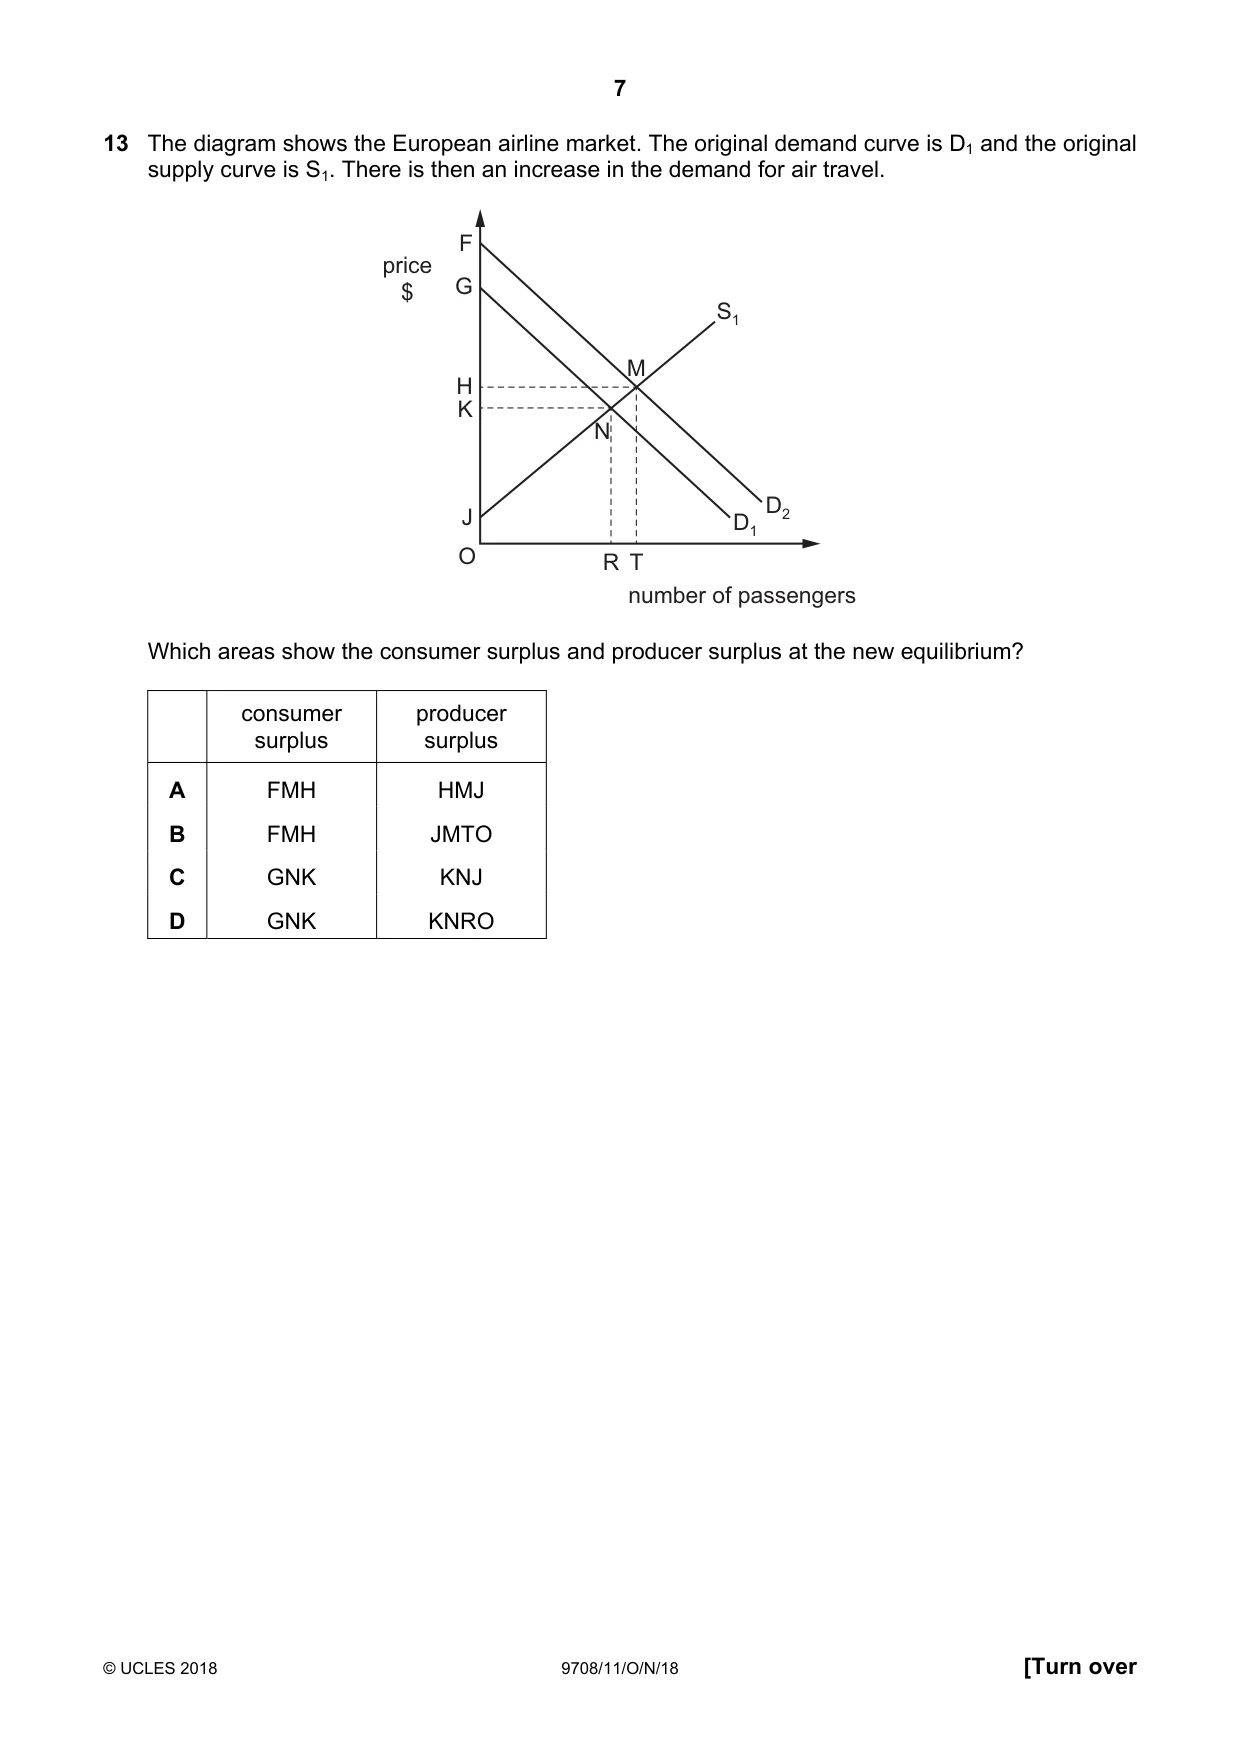
Q13 · The diagram shows the European airline market
13 The diagram shows the European airline market. The original demand curve is D1 and the original supply curve is S1. There is then an increase in the demand for air travel. F price $ G S1 M H K N D2 J D1 O R T number of passengers Which areas show the consumer surplus and producer surplus at the new equilibrium? consumer producer surplus surplus A FMH HMJ B FMH JMTO C GNK KNJ D GNK KNRO
Mark scheme: A
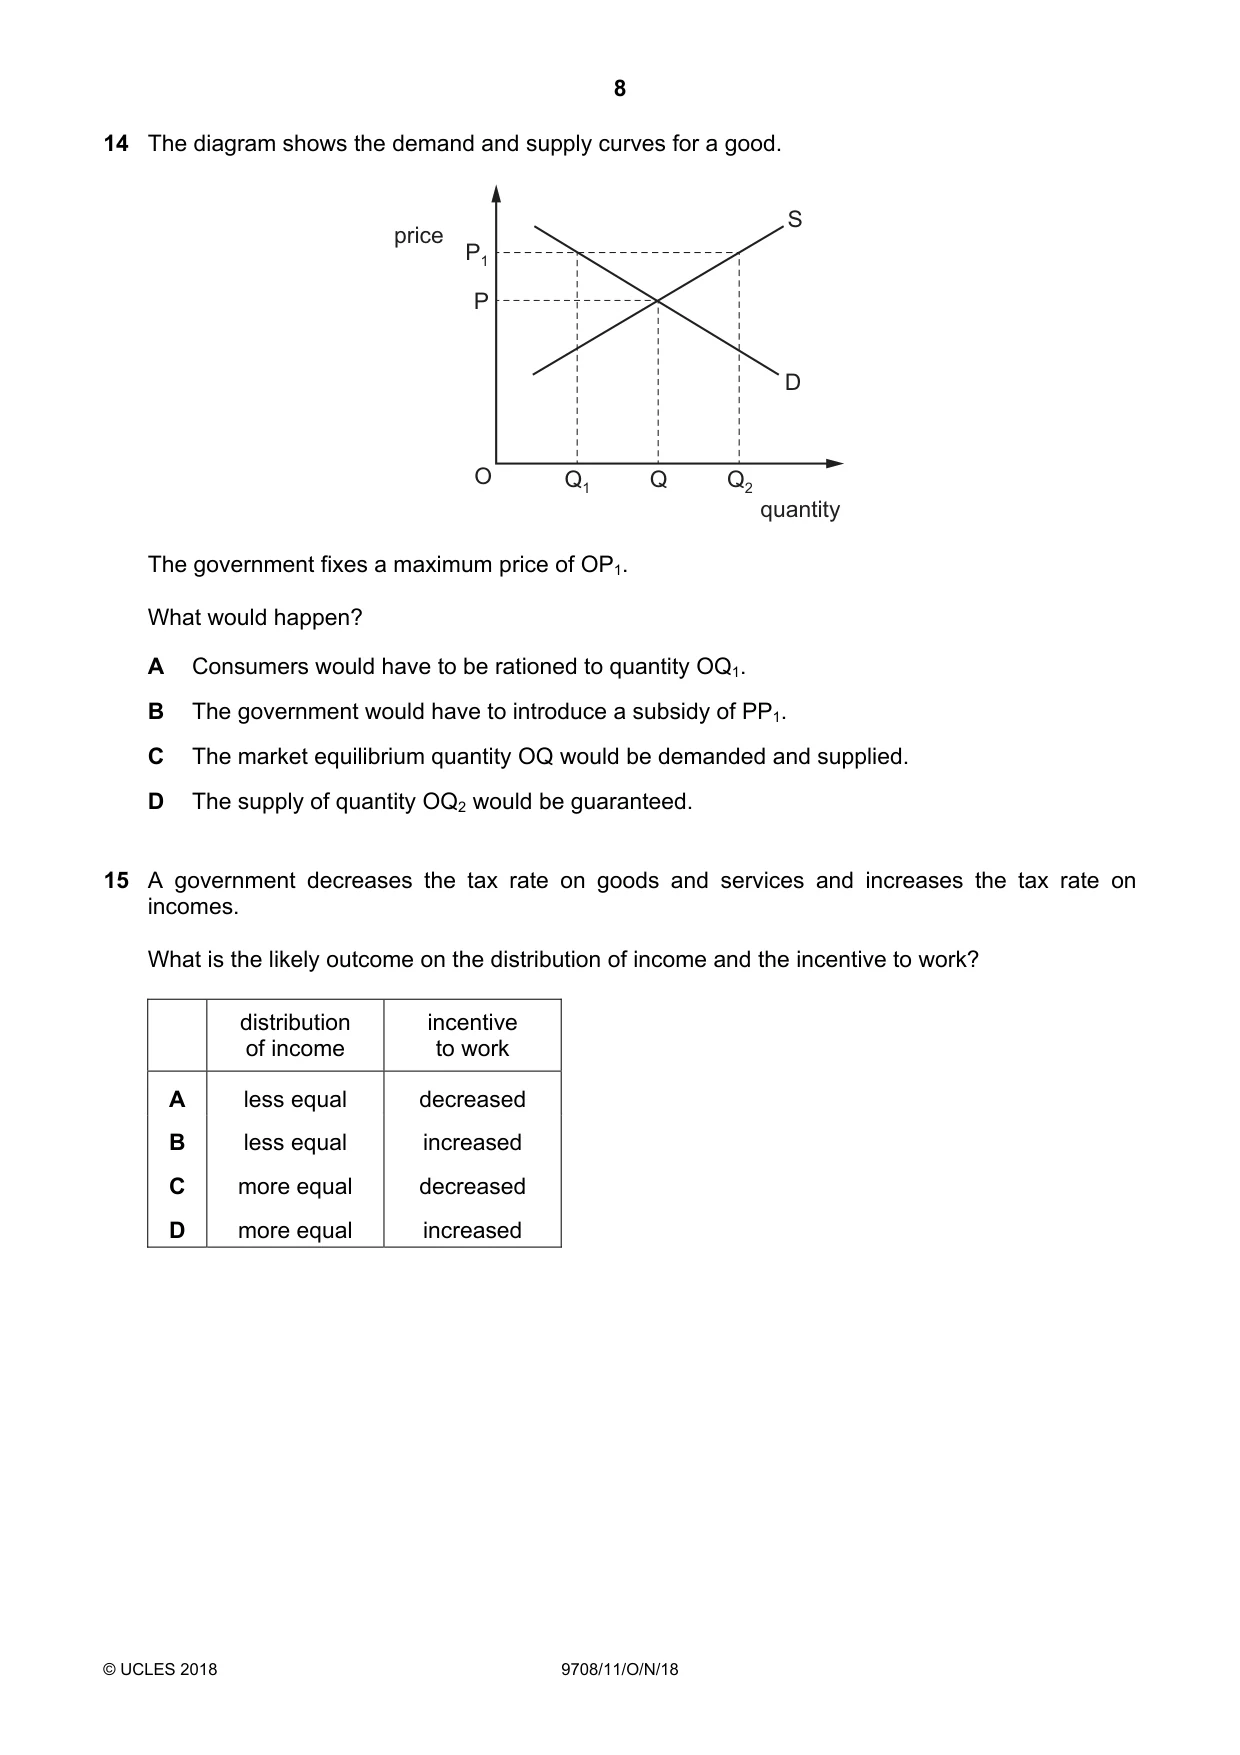
Q14 · The diagram shows the demand and supply curves for a good
14 The diagram shows the demand and supply curves for a good. S price P1 P D O Q1 Q Q2 quantity The government fixes a maximum price of OP1. What would happen? A Consumers would have to be rationed to quantity OQ1. B The government would have to introduce a subsidy of PP1. C The market equilibrium quantity OQ would be demanded and supplied. D The supply of quantity OQ2 would be guaranteed.
Mark scheme: C
More questions on Methods and effects of government intervention in markets
Q15 · A government decreases the tax rate on goods and services and increases the tax rate on…
15 A government decreases the tax rate on goods and services and increases the tax rate on incomes. What is the likely outcome on the distribution of income and the incentive to work? distribution incentive of income to work A less equal decreased B less equal increased C more equal decreased D more equal increased
Mark scheme: C
Q16 · The diagram shows the equilibrium price, P1, and quantity bought and sold, Q1, in a…
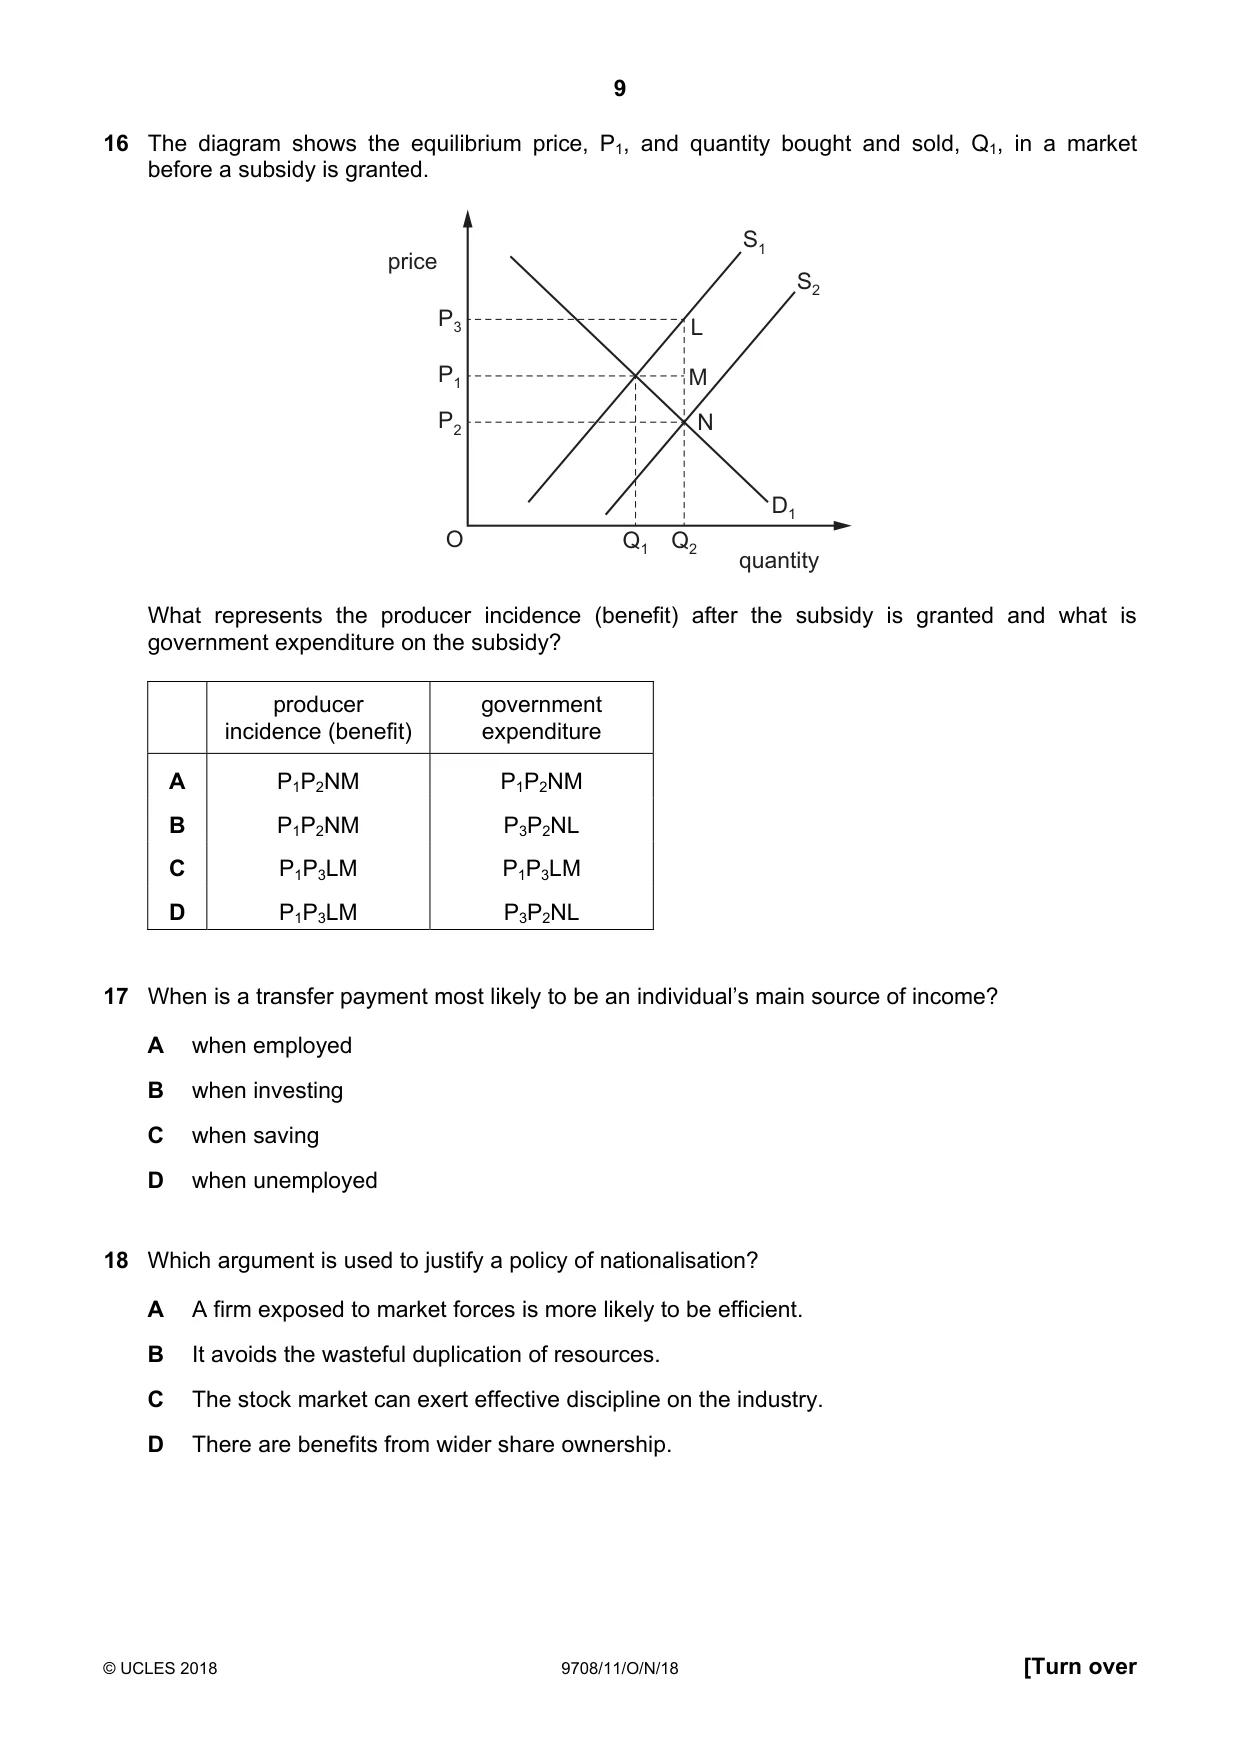
16 The diagram shows the equilibrium price, P1, and quantity bought and sold, Q1, in a market before a subsidy is granted. S1 price S2 P3 L P1 M P2 N D1 O Q1 Q2 quantity What represents the producer incidence (benefit) after the subsidy is granted and what is government expenditure on the subsidy? producer government incidence (benefit) expenditure A P1P2NM P1P2NM B P1P2NM P3P2NL C P1P3LM P1P3LM D P1P3LM P3P2NL
Mark scheme: D
More questions on Methods and effects of government intervention in markets
Q17 · When is a transfer payment most likely to be an individual’s main source of income?
17 When is a transfer payment most likely to be an individual’s main source of income? A when employed B when investing C when saving D when unemployed
Mark scheme: D
Q18 · Which argument is used to justify a policy of nationalisation?
18 Which argument is used to justify a policy of nationalisation? A A firm exposed to market forces is more likely to be efficient. B It avoids the wasteful duplication of resources. C The stock market can exert effective discipline on the industry. D There are benefits from wider share ownership.
Mark scheme: B
More questions on Resource allocation in different economic systems
Q19 · The table illustrates macroeconomic data for an economy
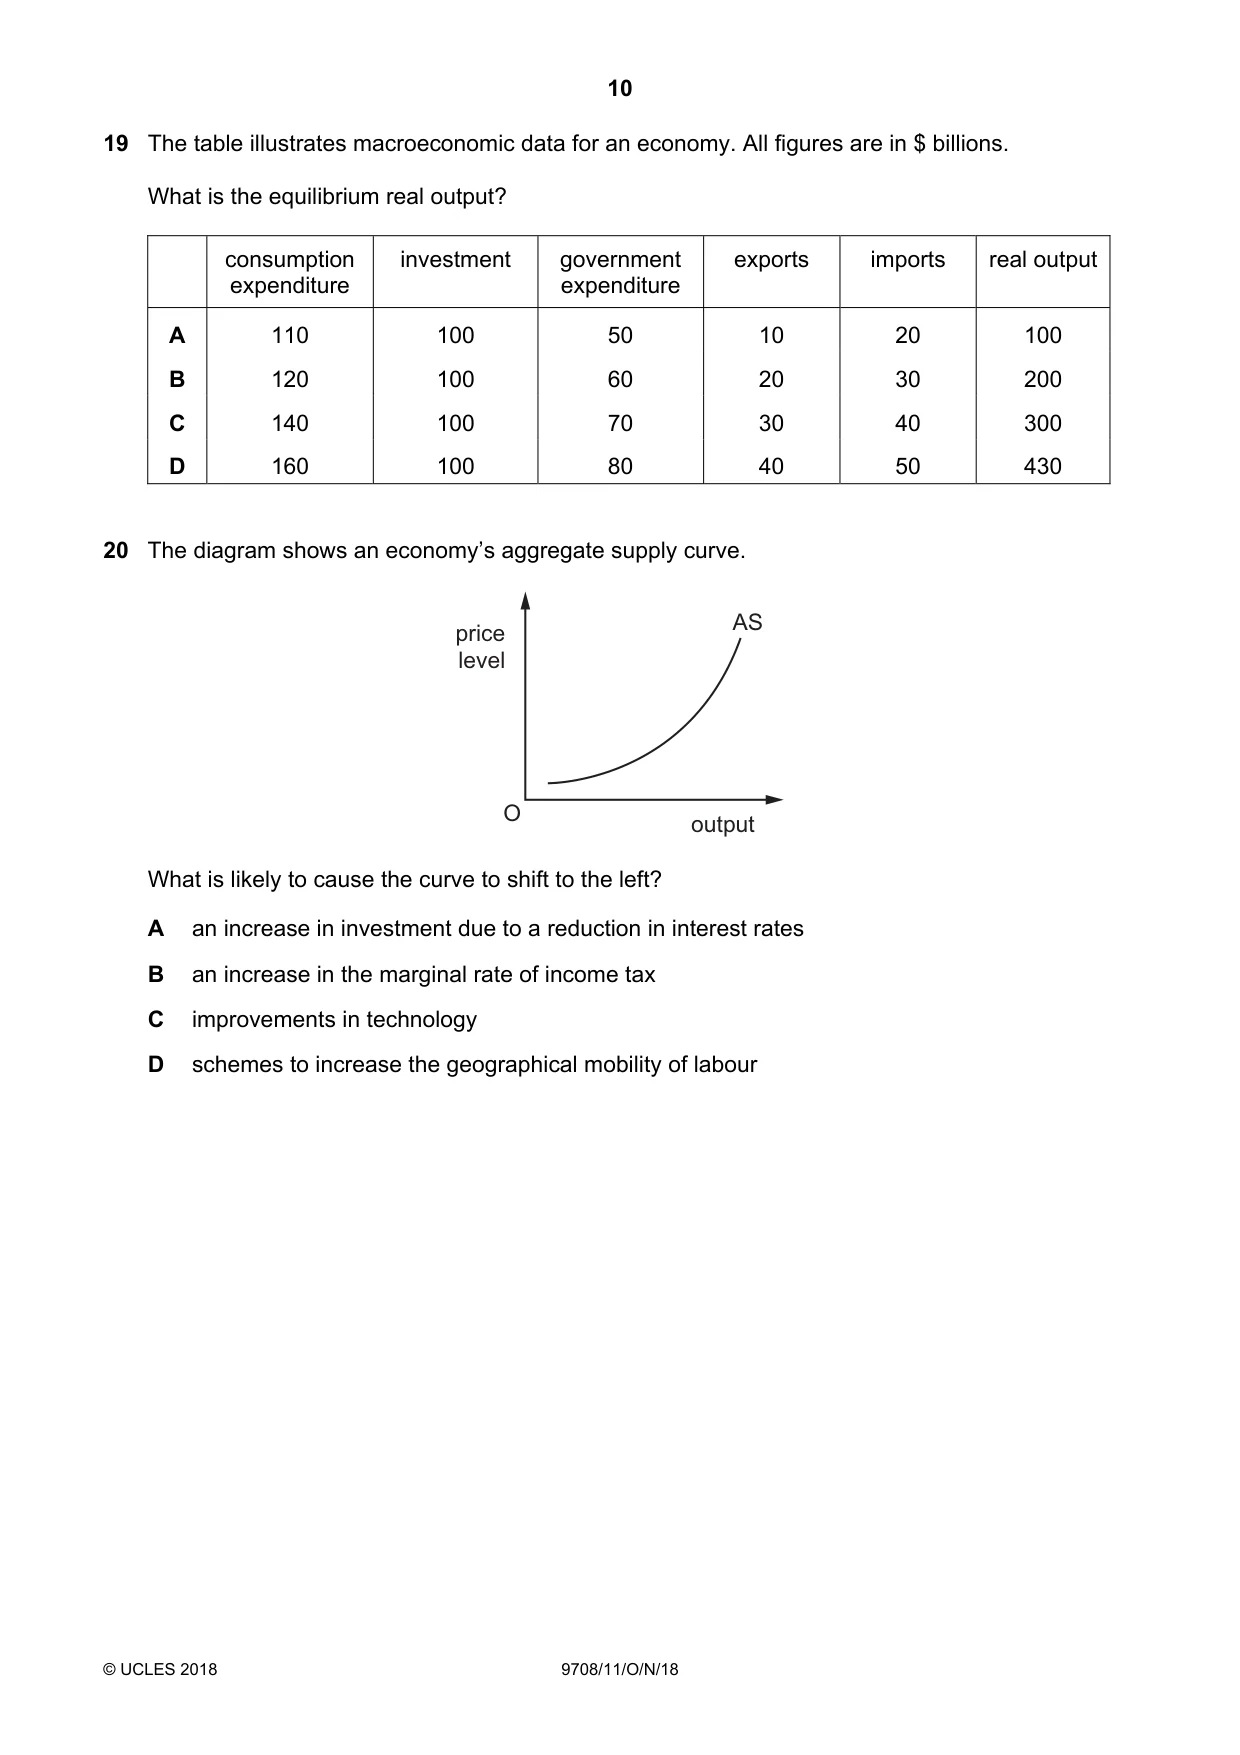
19 The table illustrates macroeconomic data for an economy. All figures are in $ billions. What is the equilibrium real output? consumption investment government exports imports real output expenditure expenditure A 110 100 50 10 20 100 B 120 100 60 20 30 200 C 140 100 70 30 40 300 D 160 100 80 40 50 430
Mark scheme: C
More questions on Introduction to the circular flow of income
Q20 · The diagram shows an economy’s aggregate supply curve
20 The diagram shows an economy’s aggregate supply curve. price AS level O output What is likely to cause the curve to shift to the left? A an increase in investment due to a reduction in interest rates B an increase in the marginal rate of income tax C improvements in technology D schemes to increase the geographical mobility of labour
Mark scheme: B
More questions on Aggregate Demand and Aggregate Supply analysis
Q21 · The diagram shows the change in an economy’s rate of inflation over 4 years
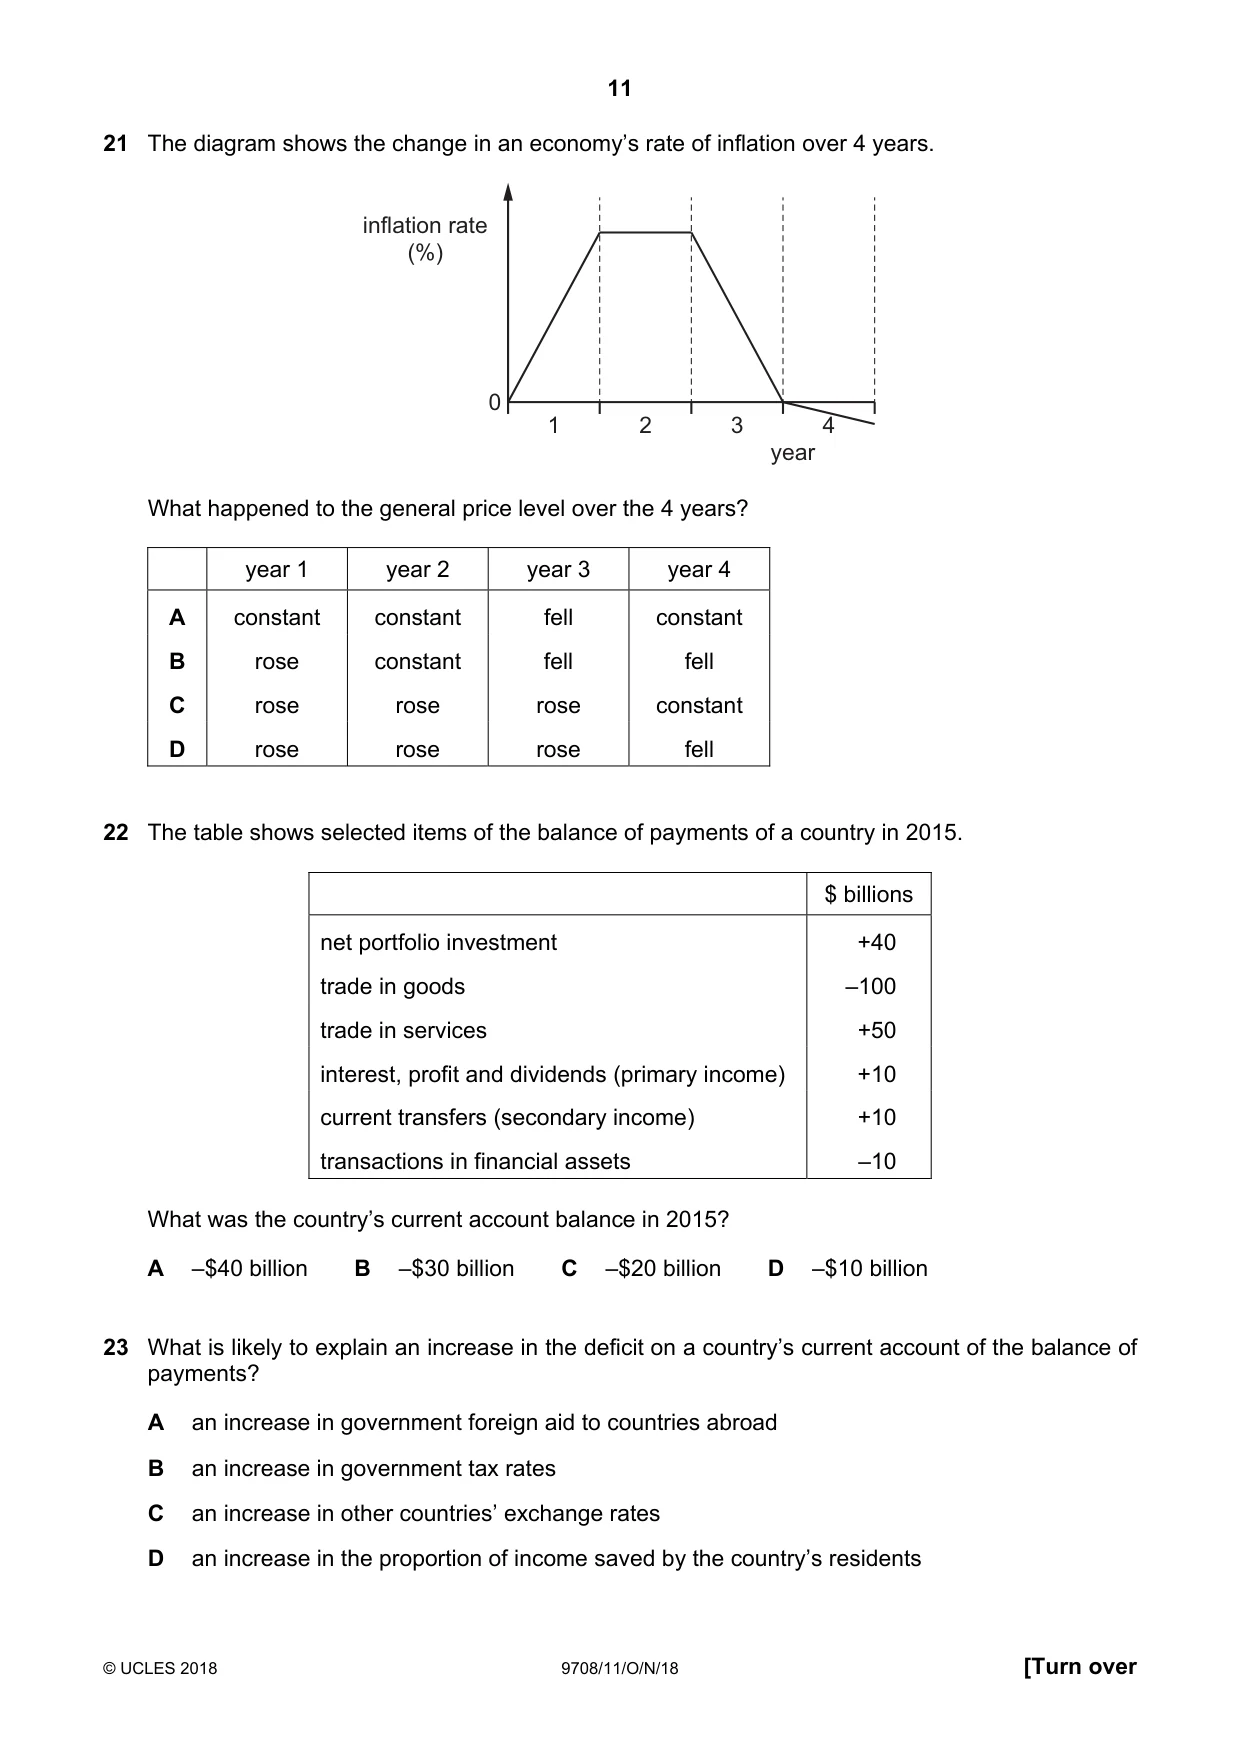
21 The diagram shows the change in an economy’s rate of inflation over 4 years. inflation rate (%) 0 1 2 3 4 year What happened to the general price level over the 4 years? year 1 year 2 year 3 year 4 A constant constant fell constant B rose constant fell fell C rose rose rose constant D rose rose rose fell
Mark scheme: D
Q22 · The table shows selected items of the balance of payments of a country in 2015
22 The table shows selected items of the balance of payments of a country in 2015. $ billions net portfolio investment +40 trade in goods –100 trade in services +50 interest, profit and dividends (primary income) +10 current transfers (secondary income) +10 transactions in financial assets –10 What was the country’s current account balance in 2015? A –$40 billion B –$30 billion C –$20 billion D –$10 billion
Mark scheme: B
More questions on Current account of the balance of payments
Q23 · What is likely to explain an increase in the deficit on a country’s current account of…
23 What is likely to explain an increase in the deficit on a country’s current account of the balance of payments? A an increase in government foreign aid to countries abroad B an increase in government tax rates C an increase in other countries’ exchange rates D an increase in the proportion of income saved by the country’s residents
Mark scheme: A
More questions on Current account of the balance of payments
Q24 · The diagram shows the determination of the floating exchange rate between the US$ and the…
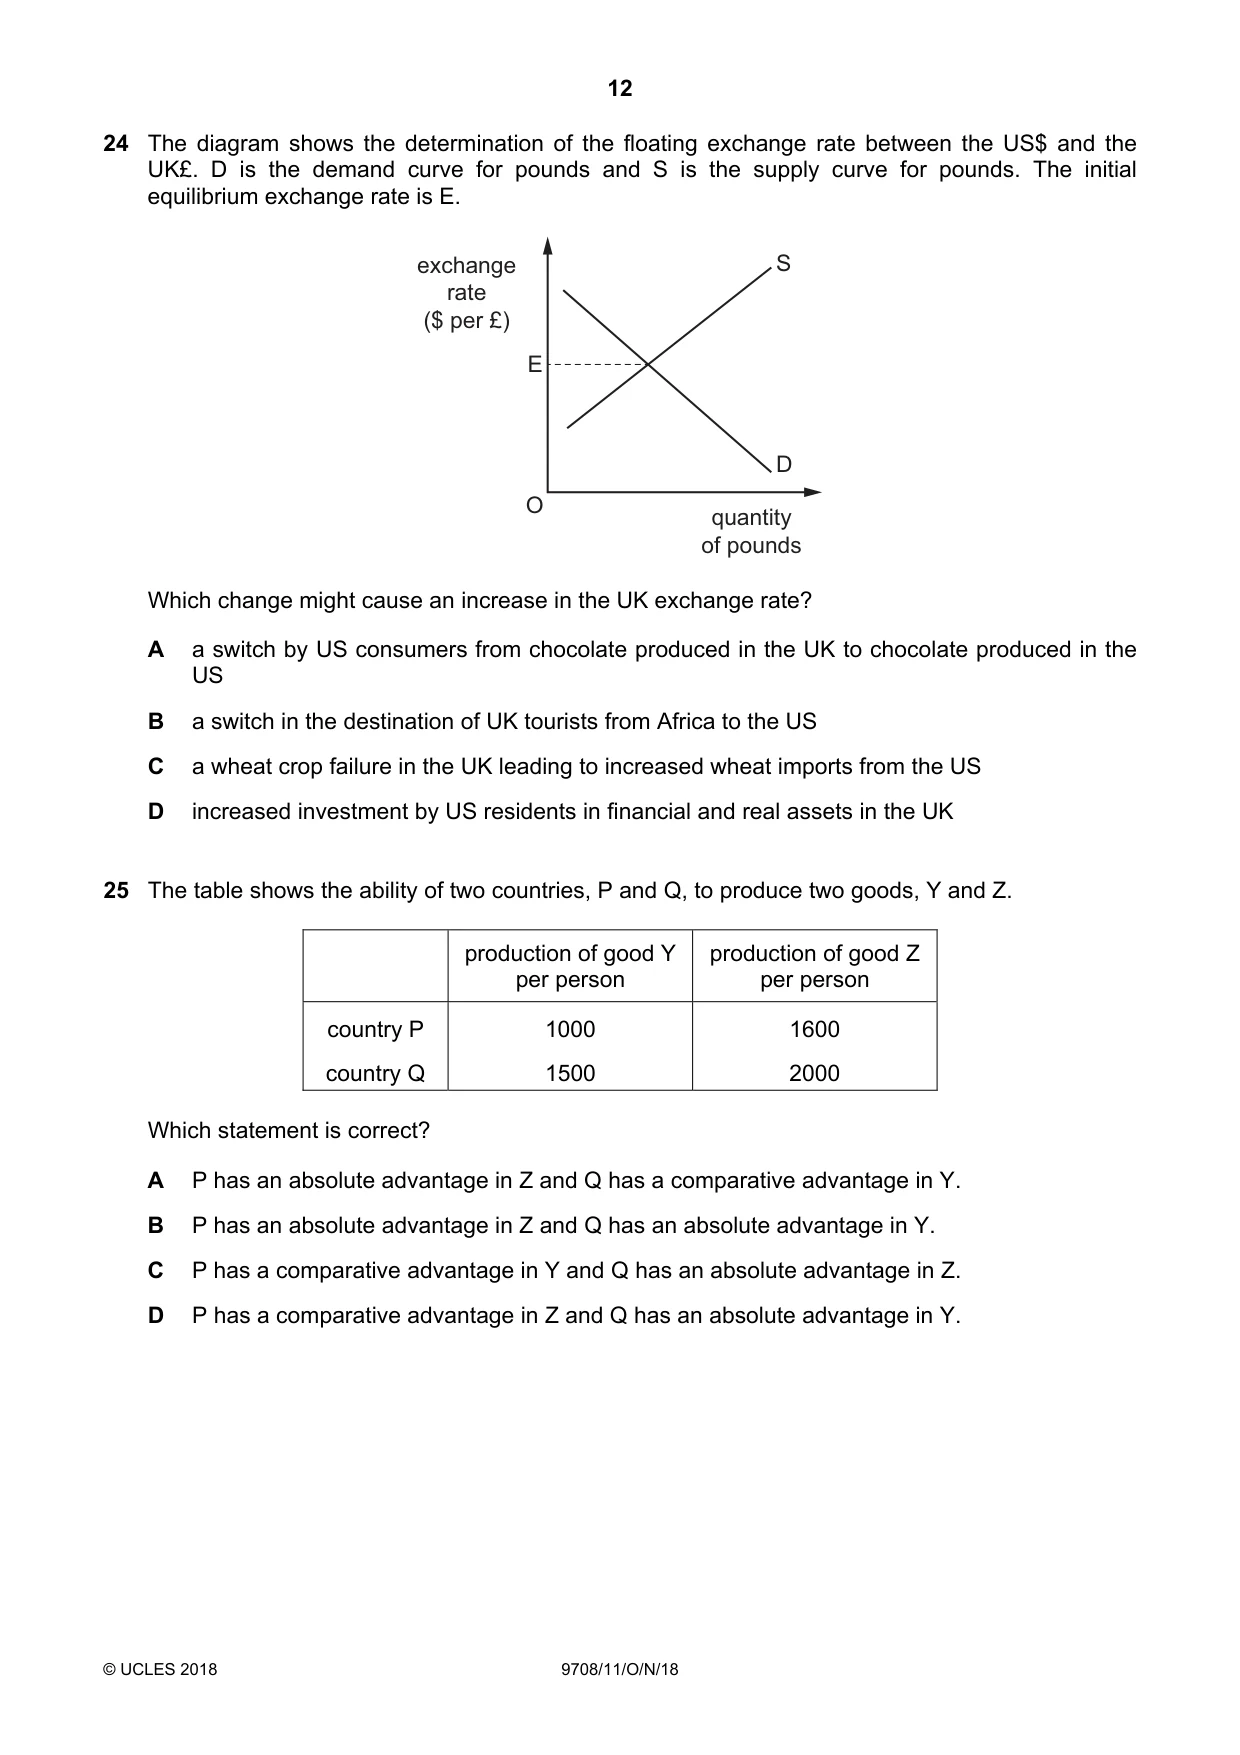
24 The diagram shows the determination of the floating exchange rate between the US$ and the UK£. D is the demand curve for pounds and S is the supply curve for pounds. The initial equilibrium exchange rate is E. exchange S rate ($ per £) E D O quantity of pounds Which change might cause an increase in the UK exchange rate? A a switch by US consumers from chocolate produced in the UK to chocolate produced in the US B a switch in the destination of UK tourists from Africa to the US C a wheat crop failure in the UK leading to increased wheat imports from the US D increased investment by US residents in financial and real assets in the UK
Mark scheme: D
Q25 · The table shows the ability of two countries, P and Q, to produce two goods, Y and Z
25 The table shows the ability of two countries, P and Q, to produce two goods, Y and Z. production of good Y production of good Z per person per person country P 1000 1600 country Q 1500 2000 Which statement is correct? A P has an absolute advantage in Z and Q has a comparative advantage in Y. B P has an absolute advantage in Z and Q has an absolute advantage in Y. C P has a comparative advantage in Y and Q has an absolute advantage in Z. D P has a comparative advantage in Z and Q has an absolute advantage in Y.
Mark scheme: D
Q26 · Which action increases and which action decreases the level of protectionism?
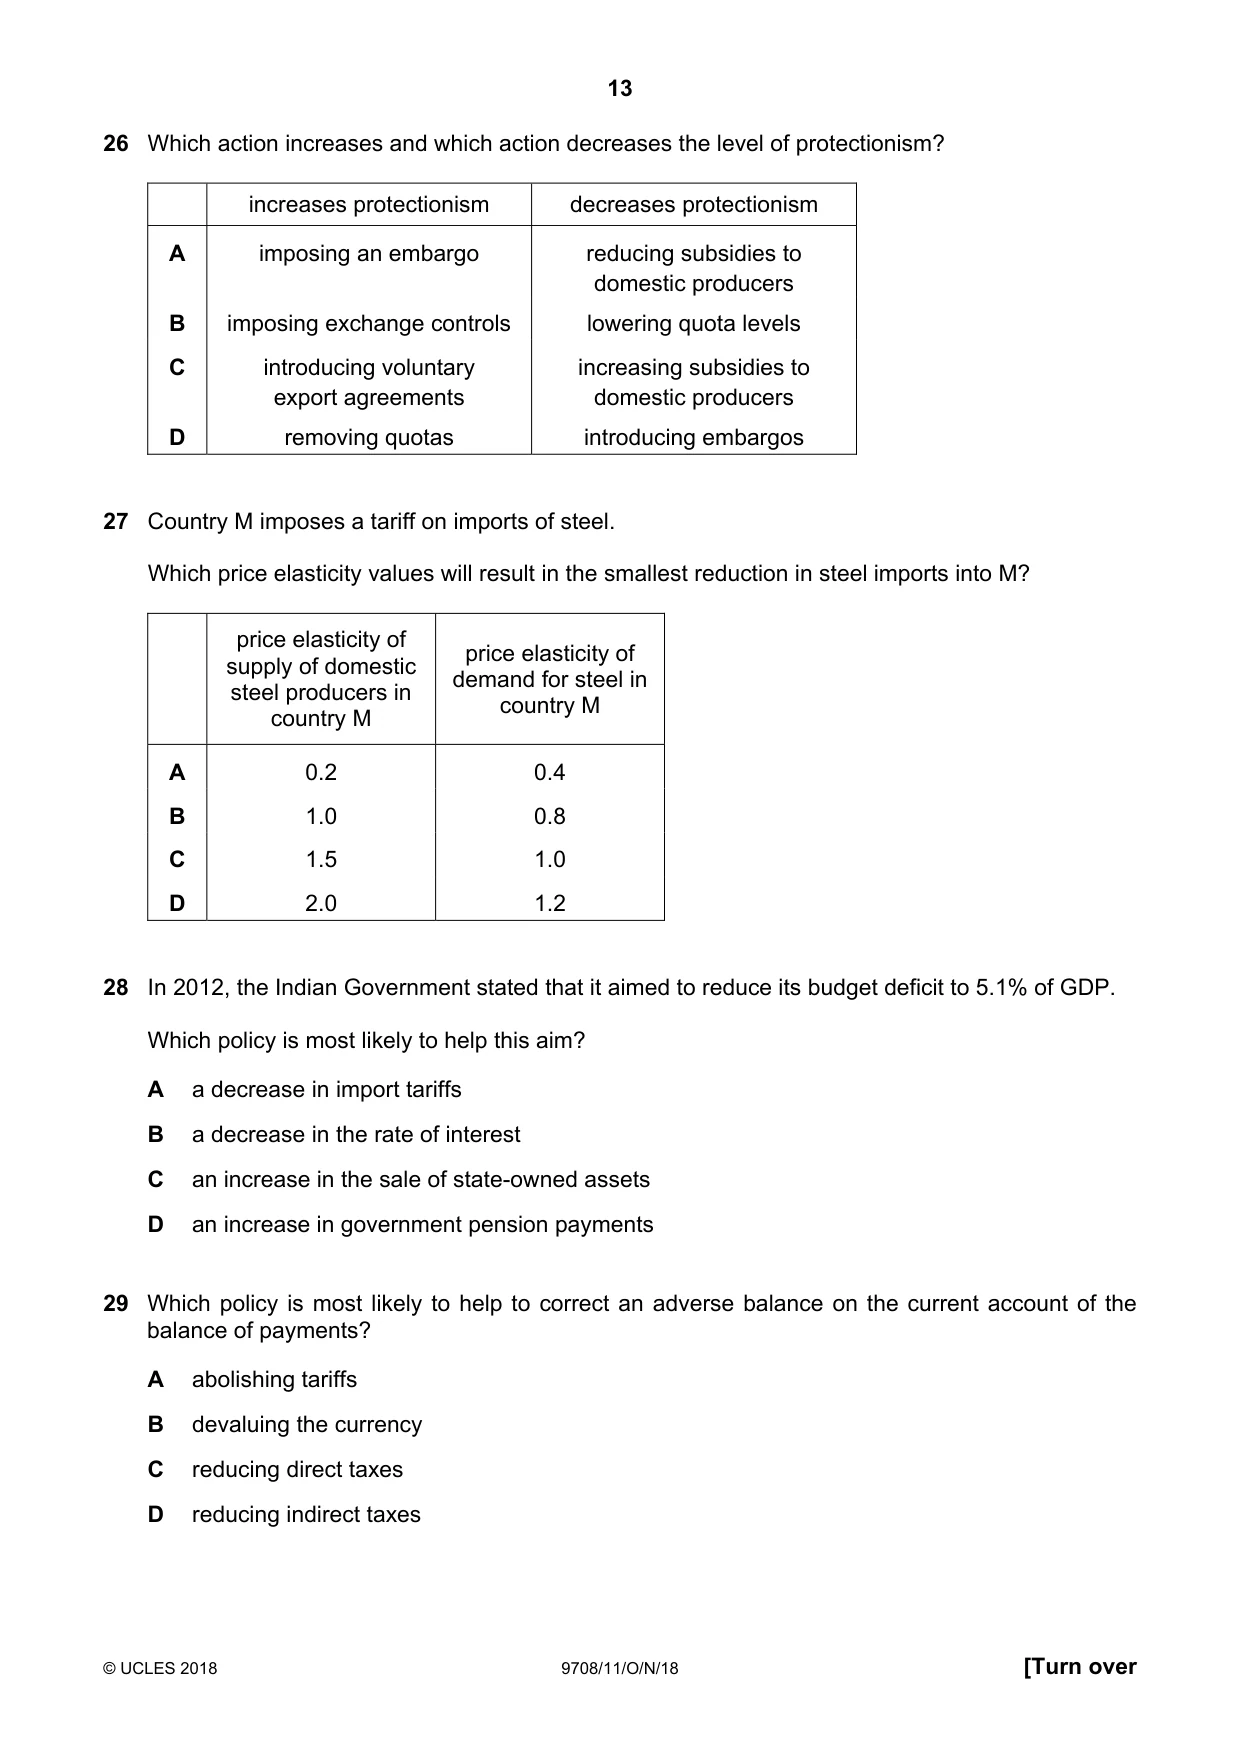
26 Which action increases and which action decreases the level of protectionism? increases protectionism decreases protectionism A imposing an embargo reducing subsidies to domestic producers B imposing exchange controls lowering quota levels C introducing voluntary increasing subsidies to export agreements domestic producers D removing quotas introducing embargos
Mark scheme: A
Q27 · Country M imposes a tariff on imports of steel
27 Country M imposes a tariff on imports of steel. Which price elasticity values will result in the smallest reduction in steel imports into M? price elasticity of price elasticity of supply of domestic demand for steel in steel producers in country M country M A 0.2 0.4 B 1.0 0.8 C 1.5 1.0 D 2.0 1.2
Mark scheme: A
Q28 · In 2012, the Indian Government stated that it aimed to reduce its budget deficit to 5.1%…
28 In 2012, the Indian Government stated that it aimed to reduce its budget deficit to 5.1% of GDP. Which policy is most likely to help this aim? A a decrease in import tariffs B a decrease in the rate of interest C an increase in the sale of state-owned assets D an increase in government pension payments
Mark scheme: C
Q29 · Which policy is most likely to help to correct an adverse balance on the current account…
29 Which policy is most likely to help to correct an adverse balance on the current account of the balance of payments? A abolishing tariffs B devaluing the currency C reducing direct taxes D reducing indirect taxes
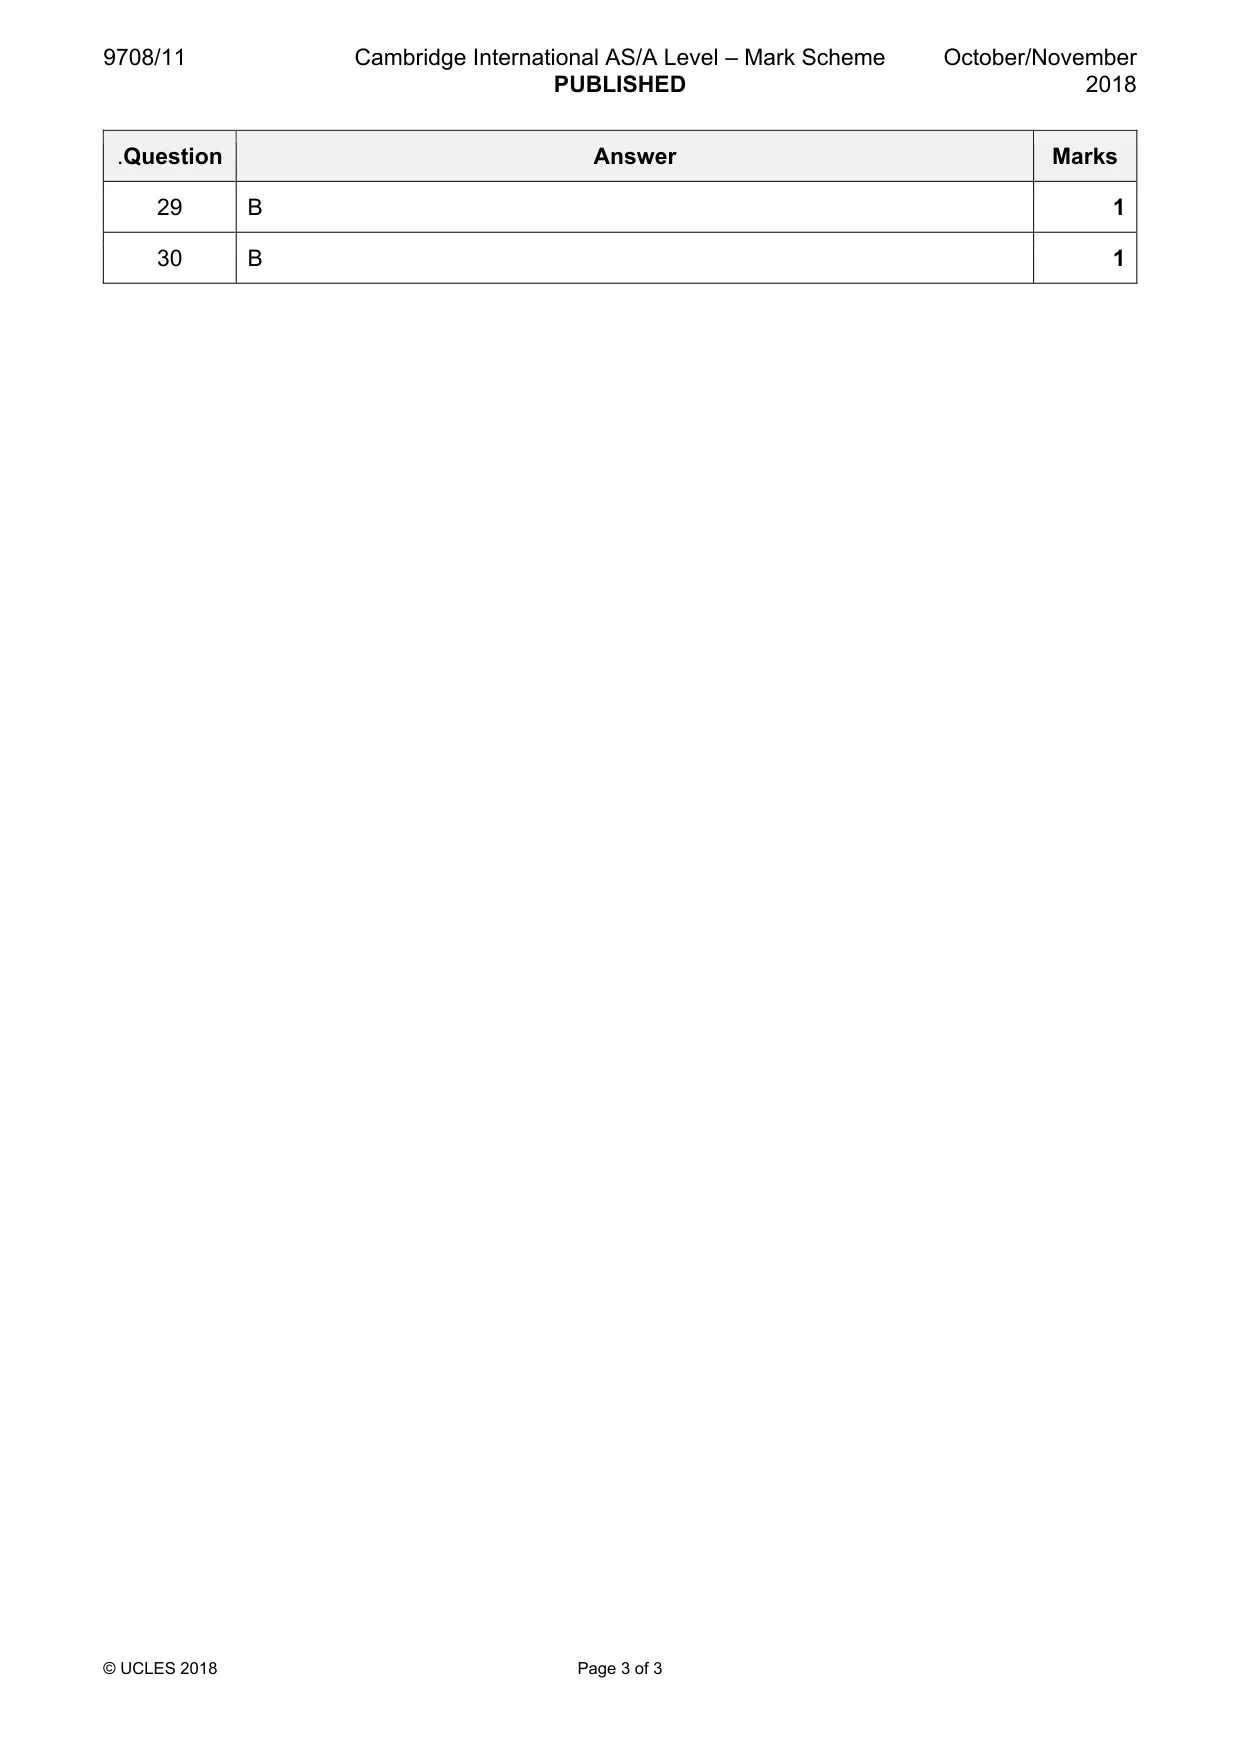
Mark scheme: B
More questions on Policies to correct imbalances in the current account of the balance of payments
Q30 · A government reduced the tax on company profits from 28% to 20%
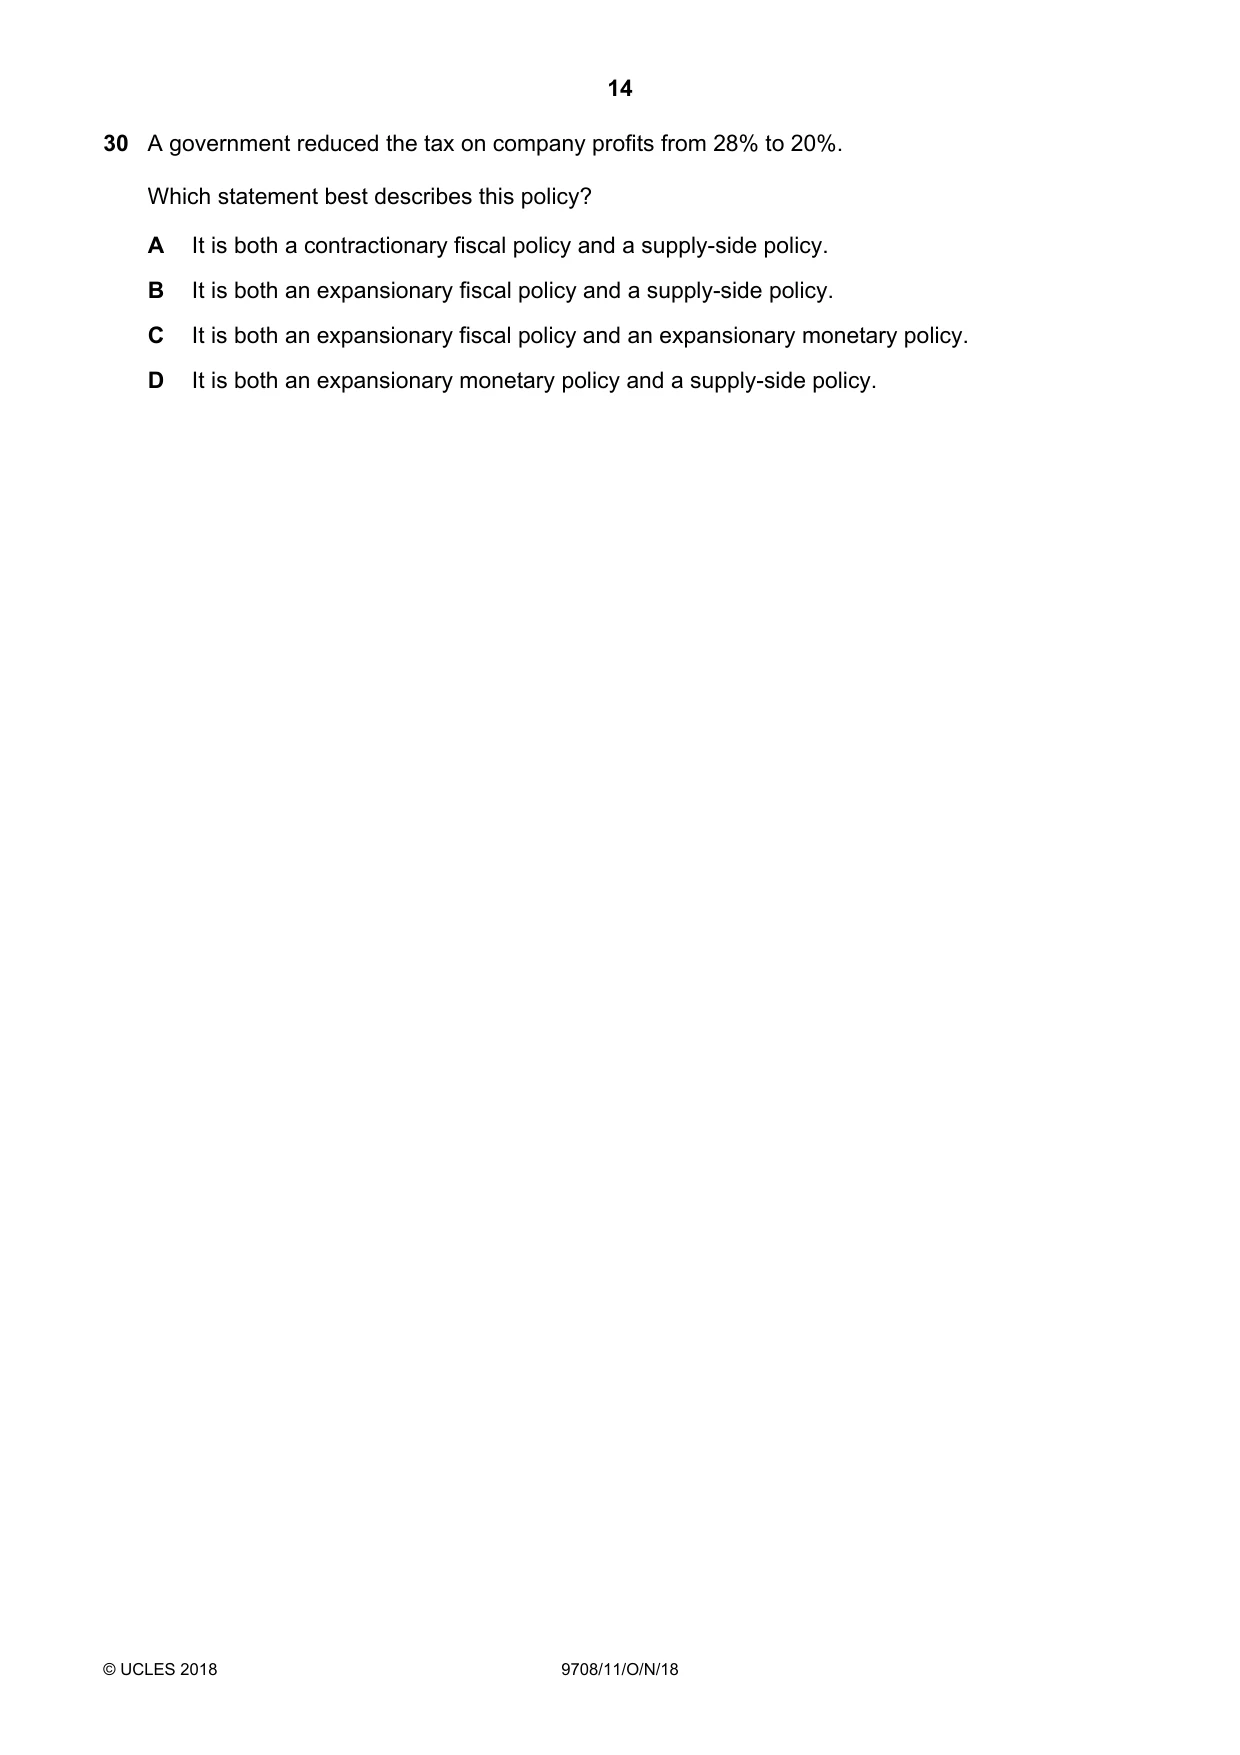
30 A government reduced the tax on company profits from 28% to 20%. Which statement best describes this policy? A It is both a contractionary fiscal policy and a supply-side policy. B It is both an expansionary fiscal policy and a supply-side policy. C It is both an expansionary fiscal policy and an expansionary monetary policy. D It is both an expansionary monetary policy and a supply-side policy.
Mark scheme: B
What was in this paper
The subtopics covered by these 30 questions, and how many questions each got. Open one in a new tab to see every Cambridge question on it.
3Current account of the balance of payments2Fiscal policy2Price elasticity of supply2Price elasticity, income elasticity and cross elasticity of demand2Protectionism2The interaction of demand and supply2Addressing income and wealth inequality1Aggregate Demand and Aggregate Supply analysis1Consumer and producer surplus1Demand and supply curves1Economic methodology1Exchange rates1Factors of production1Introduction to the circular flow of income1Money and banking1National income statistics1Policies to correct imbalances in the current account of the balance of payments1Price stability1Production possibility curves1Resource allocation in different economic systems1The reasons for international trade1What you needed in this session
Cambridge’s own grade thresholds for 2018 Oct/Nov, Paper 1 · Variant 1. A higher threshold means an easier paper — the bar moves with how the cohort did.