Cambridge A Level Economics 9708 — 2019 Oct/Nov Paper 1 · Variant 2
9708/12/O/N/19 · 30 questions · 30 marks · ≈34 min
The question paper and its mark scheme, free to read here and free to download. This is Cambridge’s own paper, exactly as it was sat.
Question paper12 pages
Mark scheme3 pages
Answers below. Sit the paper first if you are practising.
Questions as text
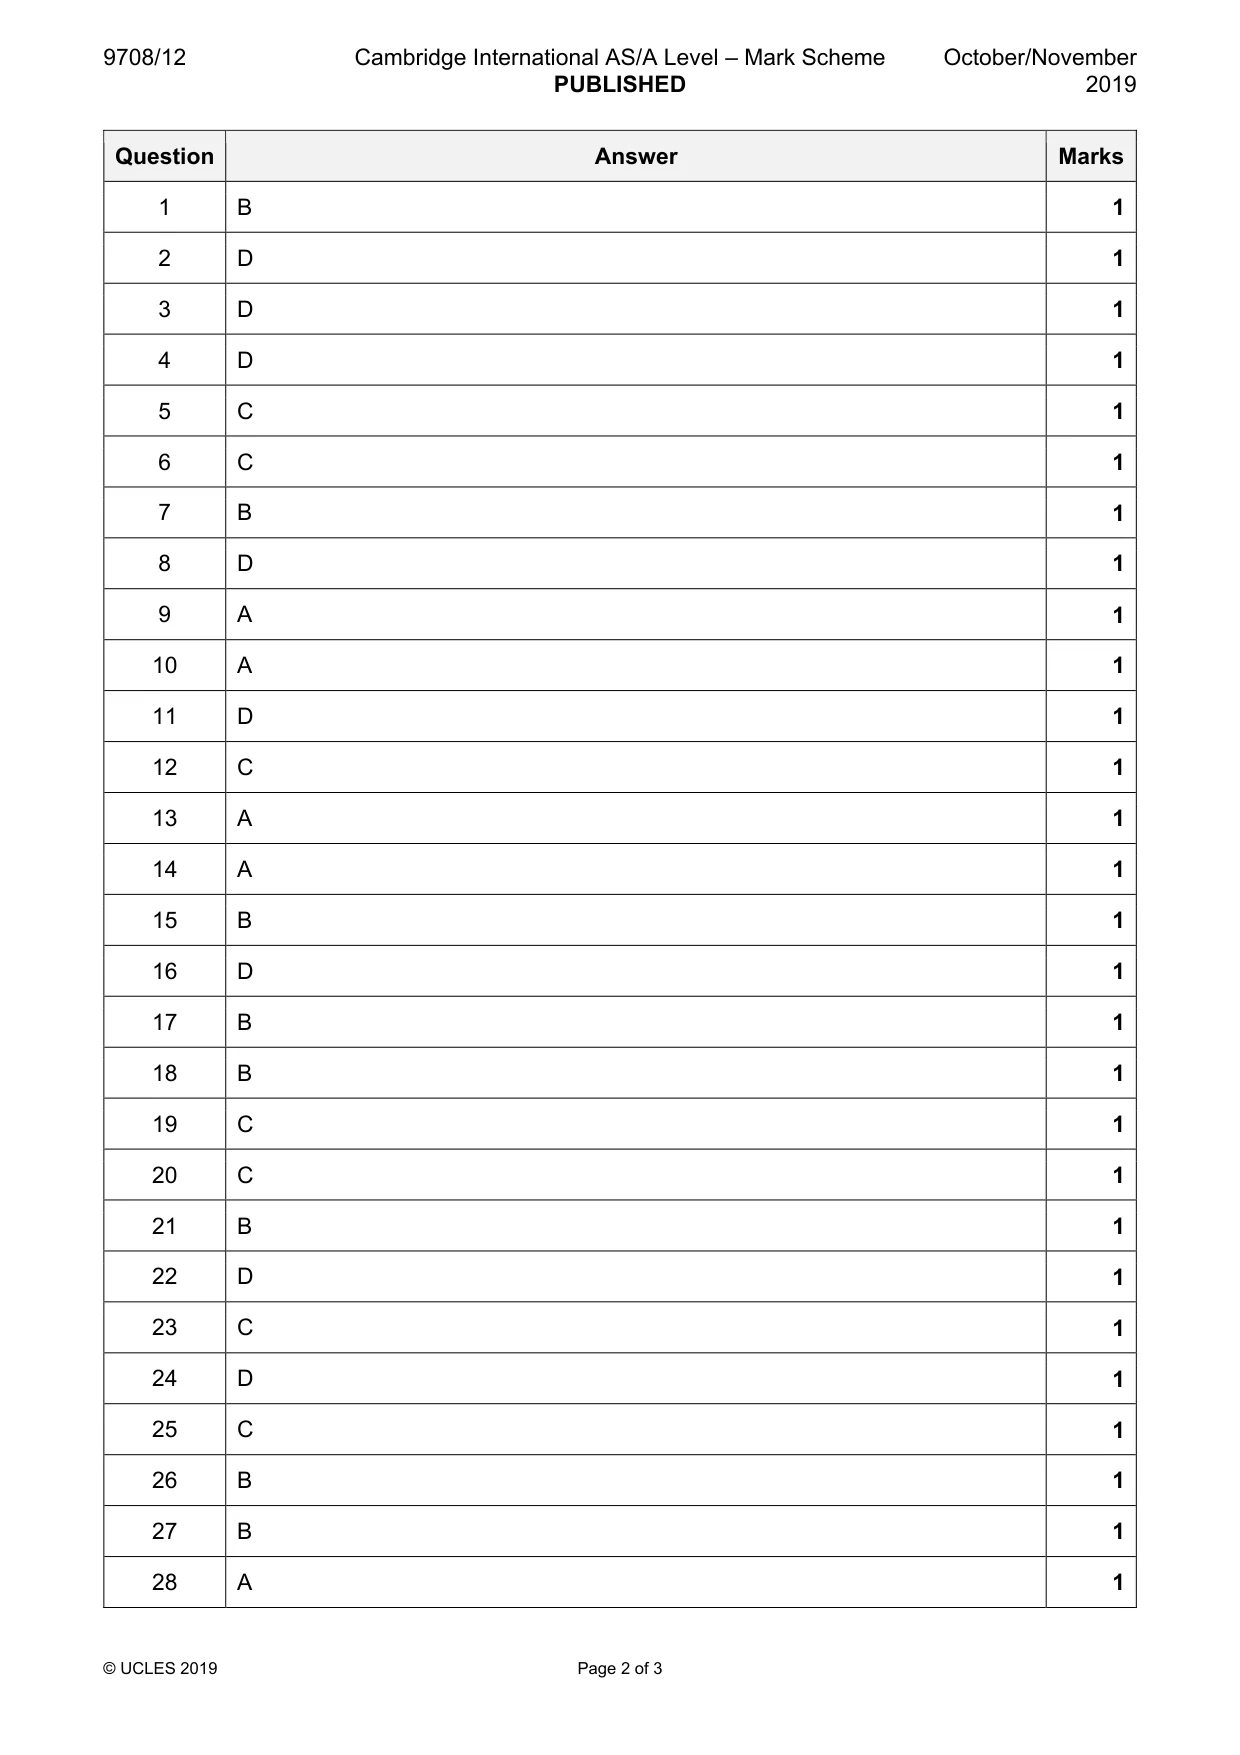
Q1 · What is correct about scarcity?
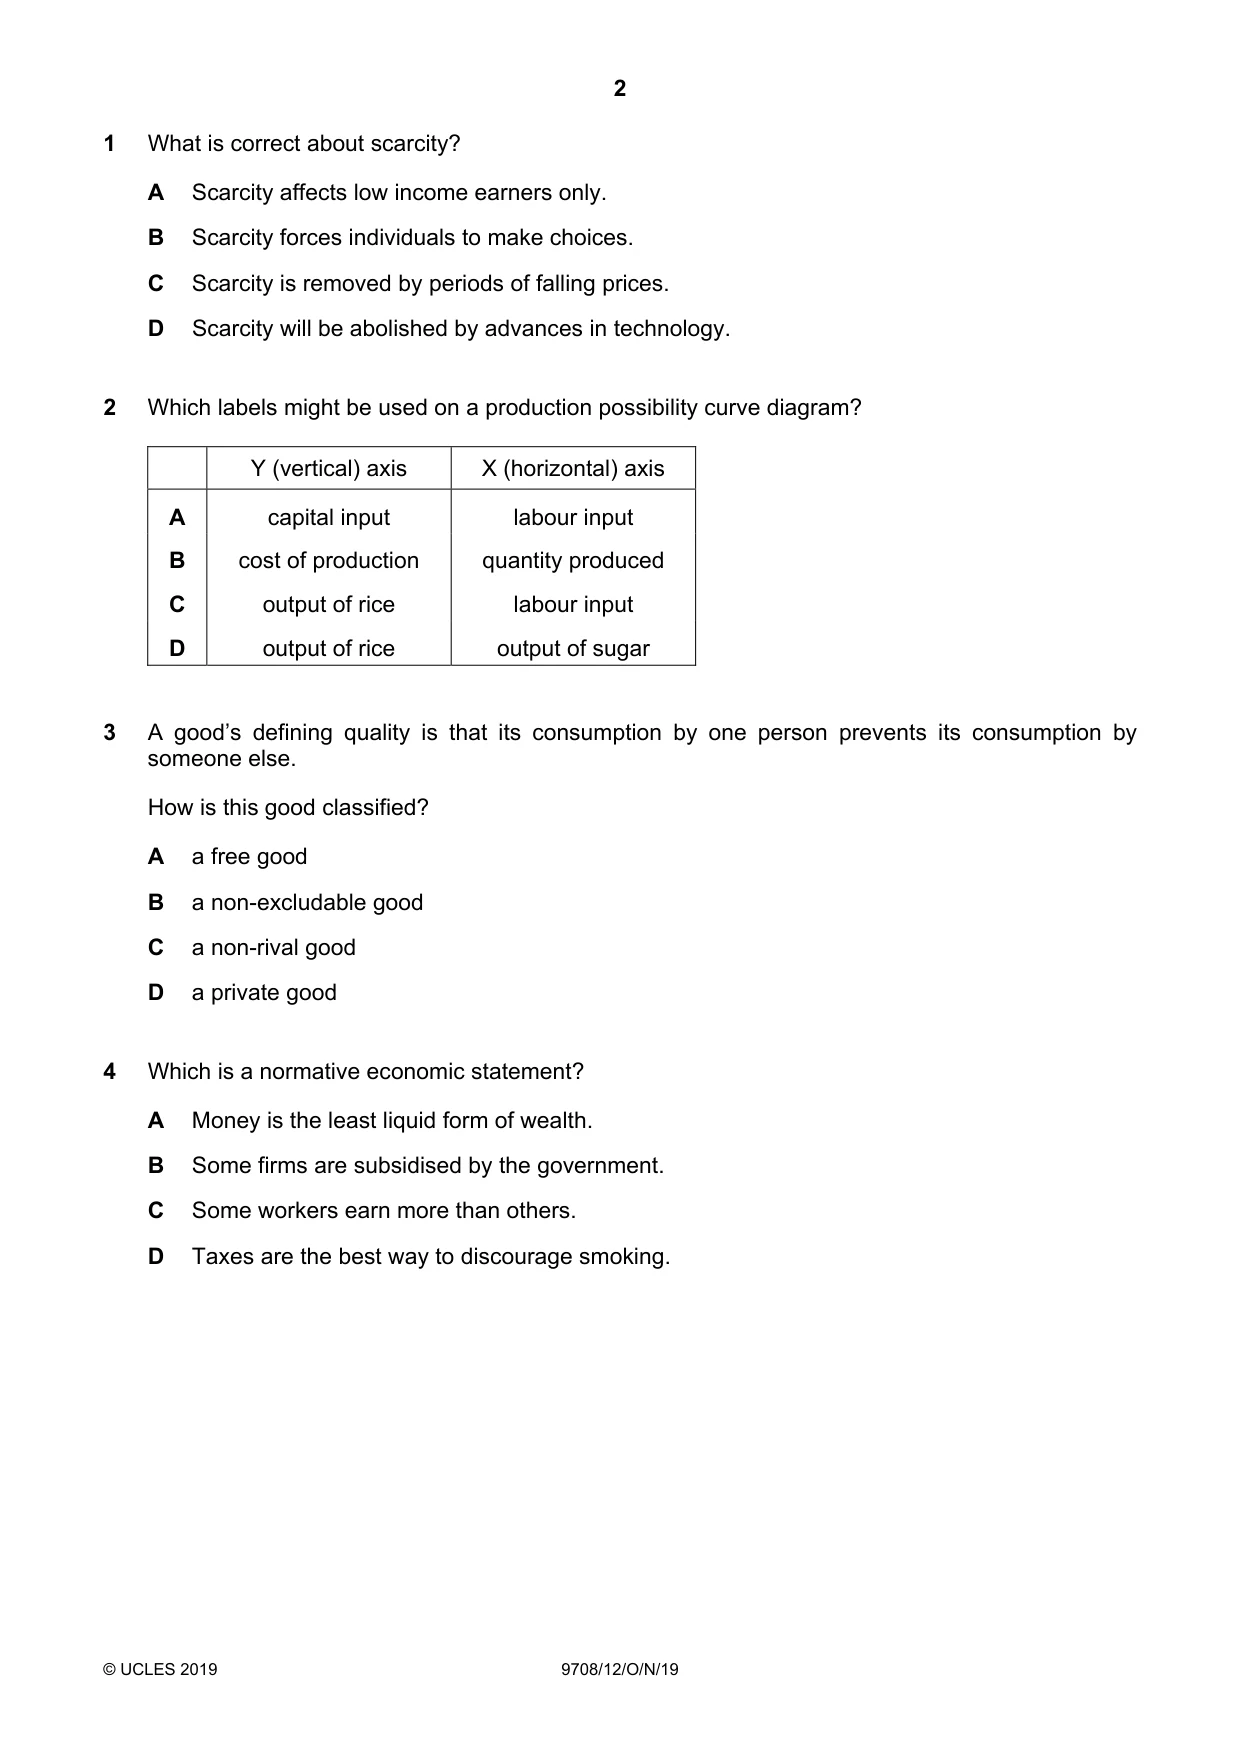
1 What is correct about scarcity? A Scarcity affects low income earners only. B Scarcity forces individuals to make choices. C Scarcity is removed by periods of falling prices. D Scarcity will be abolished by advances in technology.
Mark scheme: B
Q2 · Which labels might be used on a production possibility curve diagram?
2 Which labels might be used on a production possibility curve diagram? Y (vertical) axis X (horizontal) axis A capital input labour input B cost of production quantity produced C output of rice labour input D output of rice output of sugar
Mark scheme: D
Q3 · A good’s defining quality is that its consumption by one person prevents its consumption…
3 A good’s defining quality is that its consumption by one person prevents its consumption by someone else. How is this good classified? A a free good B a non-excludable good C a non-rival good D a private good
Mark scheme: D
Q4 · Which is a normative economic statement?
4 Which is a normative economic statement? A Money is the least liquid form of wealth. B Some firms are subsidised by the government. C Some workers earn more than others. D Taxes are the best way to discourage smoking.
Mark scheme: D
Q5 · The price of a ticket for an international athletics tournament was $50
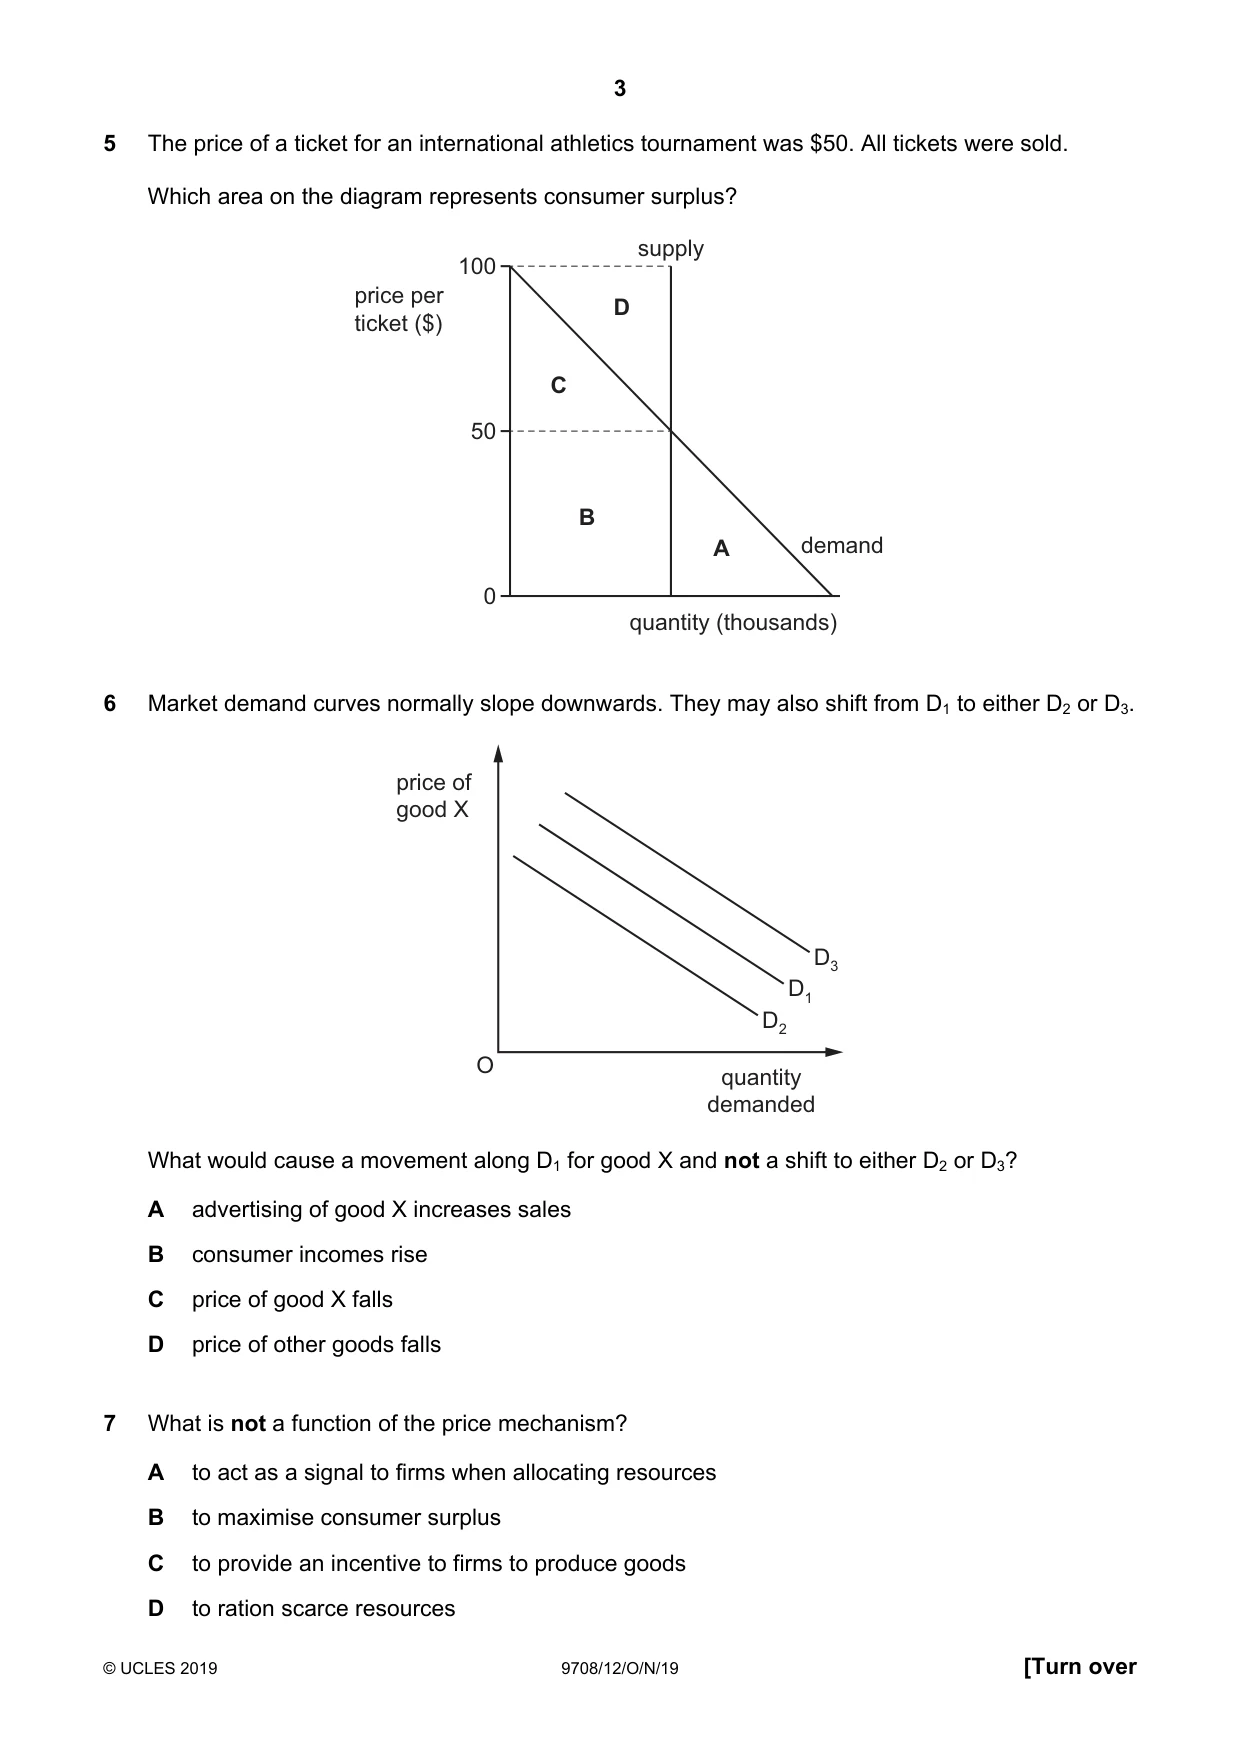
5 The price of a ticket for an international athletics tournament was $50. All tickets were sold. Which area on the diagram represents consumer surplus? supply 100 price per ZD ticket ($) C 50 B A demand 0 quantity (thousands)
Mark scheme: C
Q6 · Market demand curves normally slope downwards
6 Market demand curves normally slope downwards. They may also shift from D1 to either D2 or D3. price of good X D3 D1 D2 O quantity demanded What would cause a movement along D1 for good X and not a shift to either D2 or D3? A advertising of good X increases sales B consumer incomes rise C price of good X falls D price of other goods falls
Mark scheme: C
Q7 · What is not a function of the price mechanism?
7 What is not a function of the price mechanism? A to act as a signal to firms when allocating resources B to maximise consumer surplus C to provide an incentive to firms to produce goods D to ration scarce resources
Mark scheme: B
More questions on Resource allocation in different economic systems
Q8 · A government introduces a maximum price above the market price
8 A government introduces a maximum price above the market price. What will be the effect on consumer and producer surplus? consumer surplus producer surplus A fall rise B rise fall C rise unchanged D unchanged unchanged
Mark scheme: D
More questions on Methods and effects of government intervention in markets
Q9 · The diagram shows the market for air travel in Asia
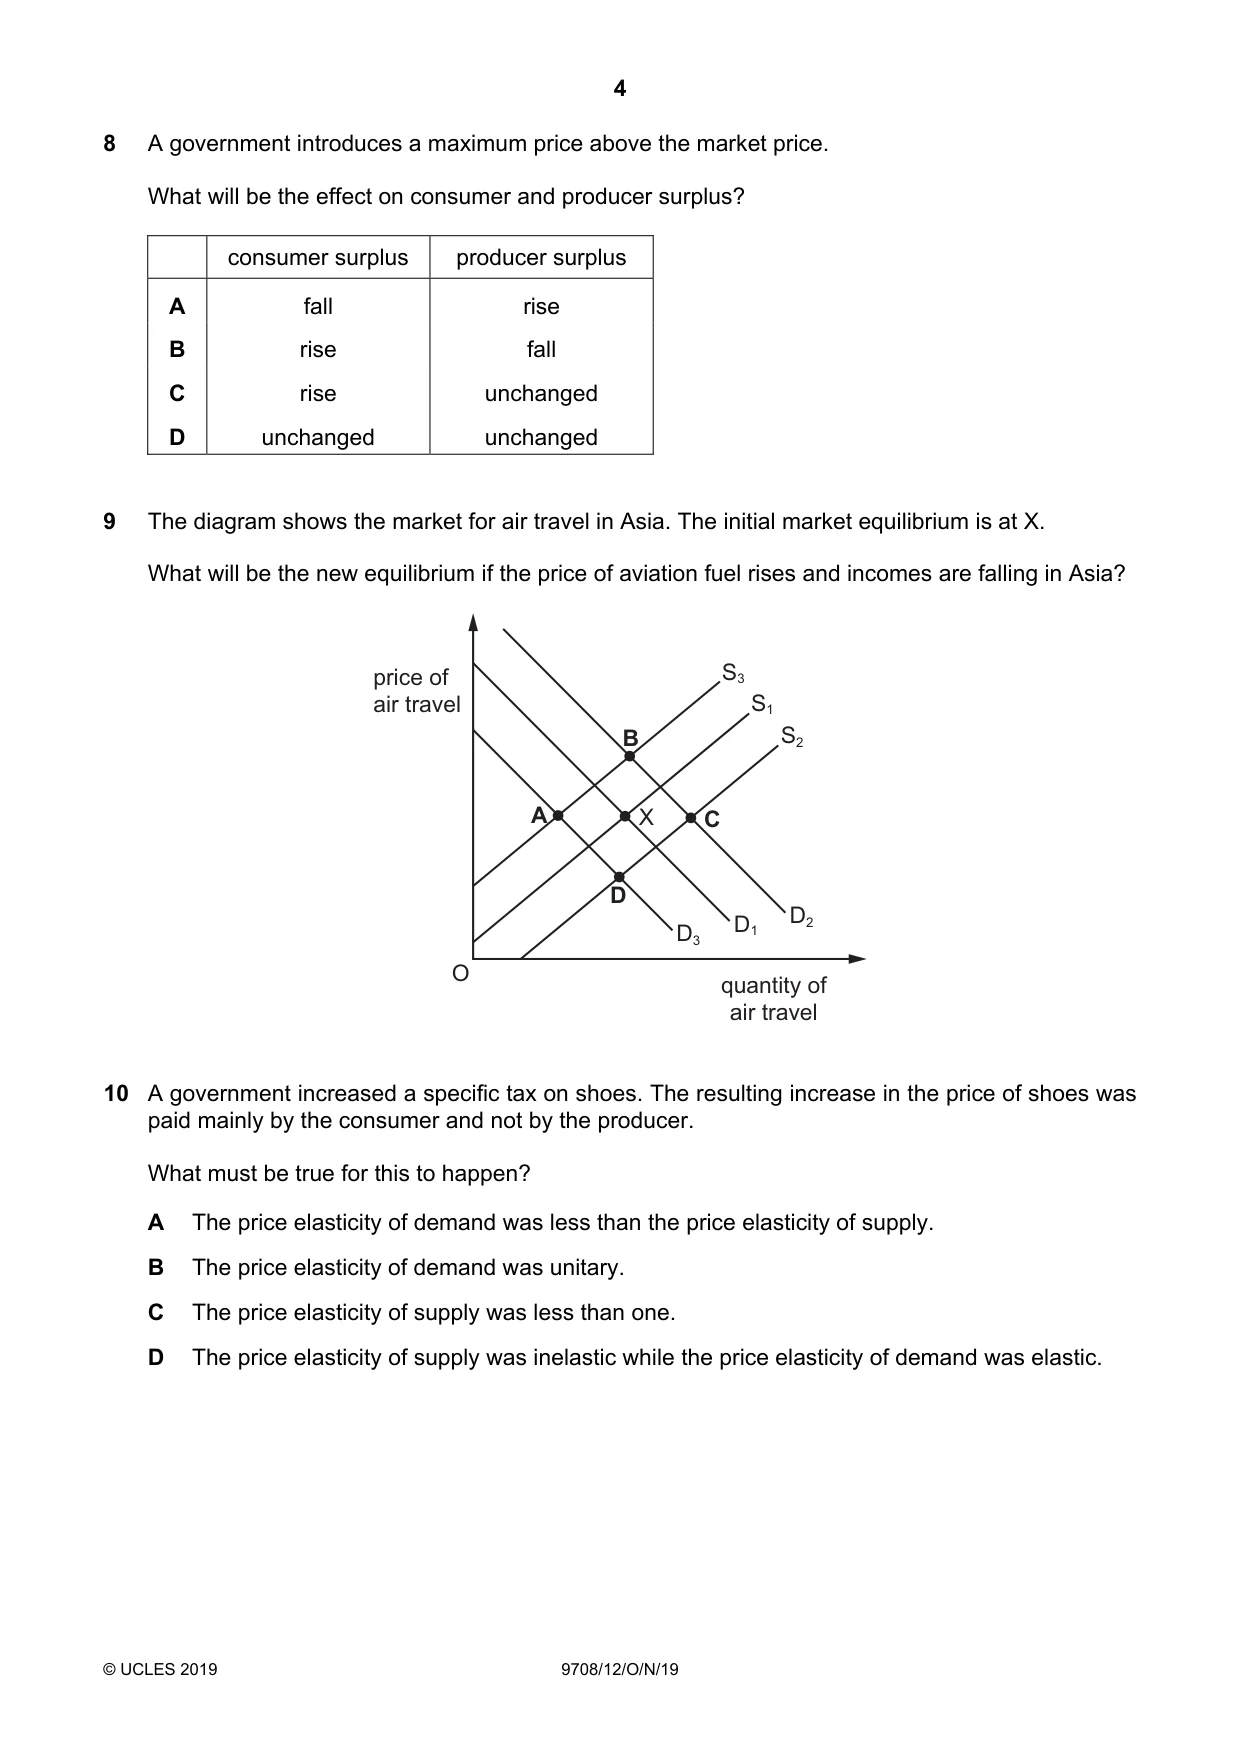
9 The diagram shows the market for air travel in Asia. The initial market equilibrium is at X. What will be the new equilibrium if the price of aviation fuel rises and incomes are falling in Asia? price of S3 air travel S1 B S2 A X C D D1 D2 D3 O quantity of air travel
Mark scheme: A
Q10 · A government increased a specific tax on shoes
10 A government increased a specific tax on shoes. The resulting increase in the price of shoes was paid mainly by the consumer and not by the producer. What must be true for this to happen? A The price elasticity of demand was less than the price elasticity of supply. B The price elasticity of demand was unitary. C The price elasticity of supply was less than one. D The price elasticity of supply was inelastic while the price elasticity of demand was elastic.
Mark scheme: A
More questions on Price elasticity, income elasticity and cross elasticity of demand
Q11 · The diagram shows supply and demand for a good
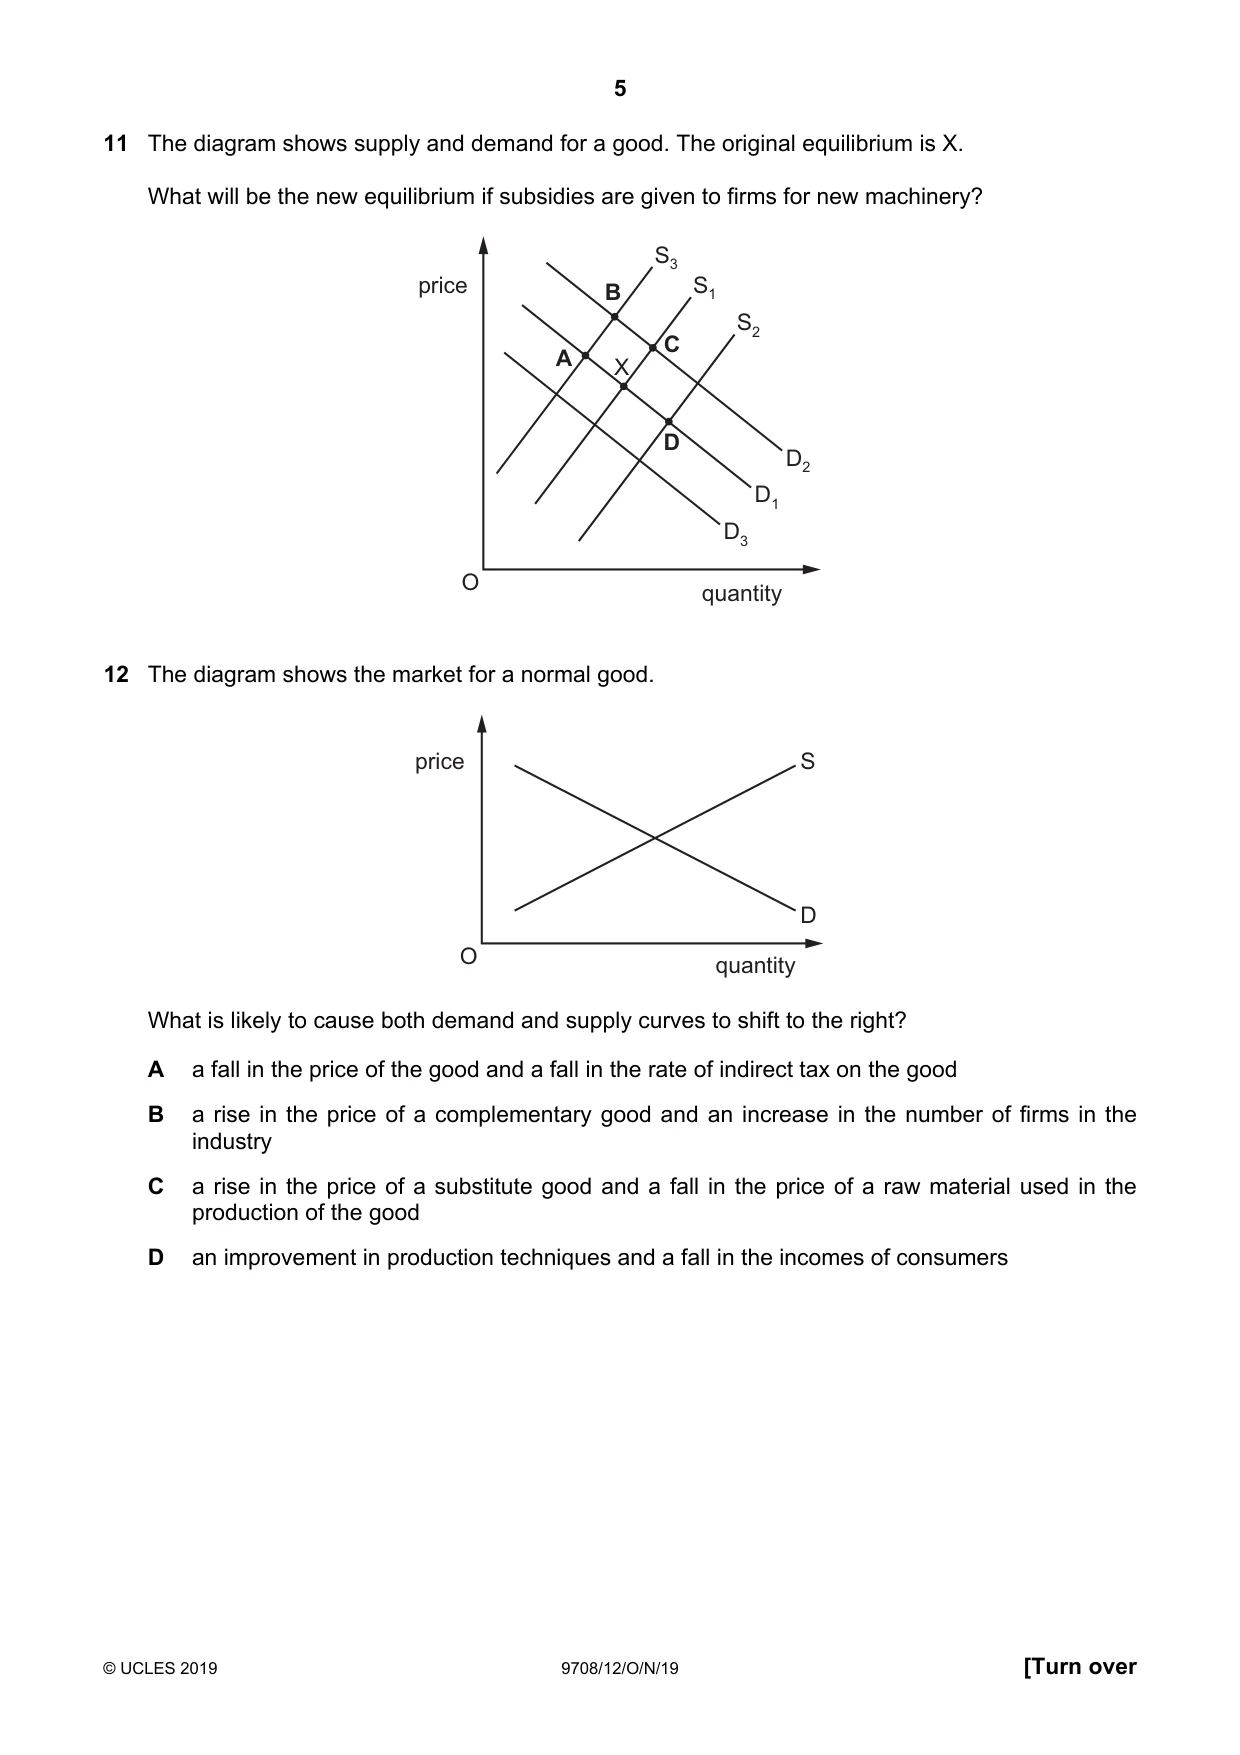
11 The diagram shows supply and demand for a good. The original equilibrium is X. What will be the new equilibrium if subsidies are given to firms for new machinery? S3 price B S1 S2 C A X D D2 D1 D3 O quantity
Mark scheme: D
Q12 · The diagram shows the market for a normal good
12 The diagram shows the market for a normal good. price S D O quantity What is likely to cause both demand and supply curves to shift to the right? A a fall in the price of the good and a fall in the rate of indirect tax on the good B a rise in the price of a complementary good and an increase in the number of firms in the industry C a rise in the price of a substitute good and a fall in the price of a raw material used in the production of the good D an improvement in production techniques and a fall in the incomes of consumers
Mark scheme: C
Q13 · The diagrams relate to the markets for four different products
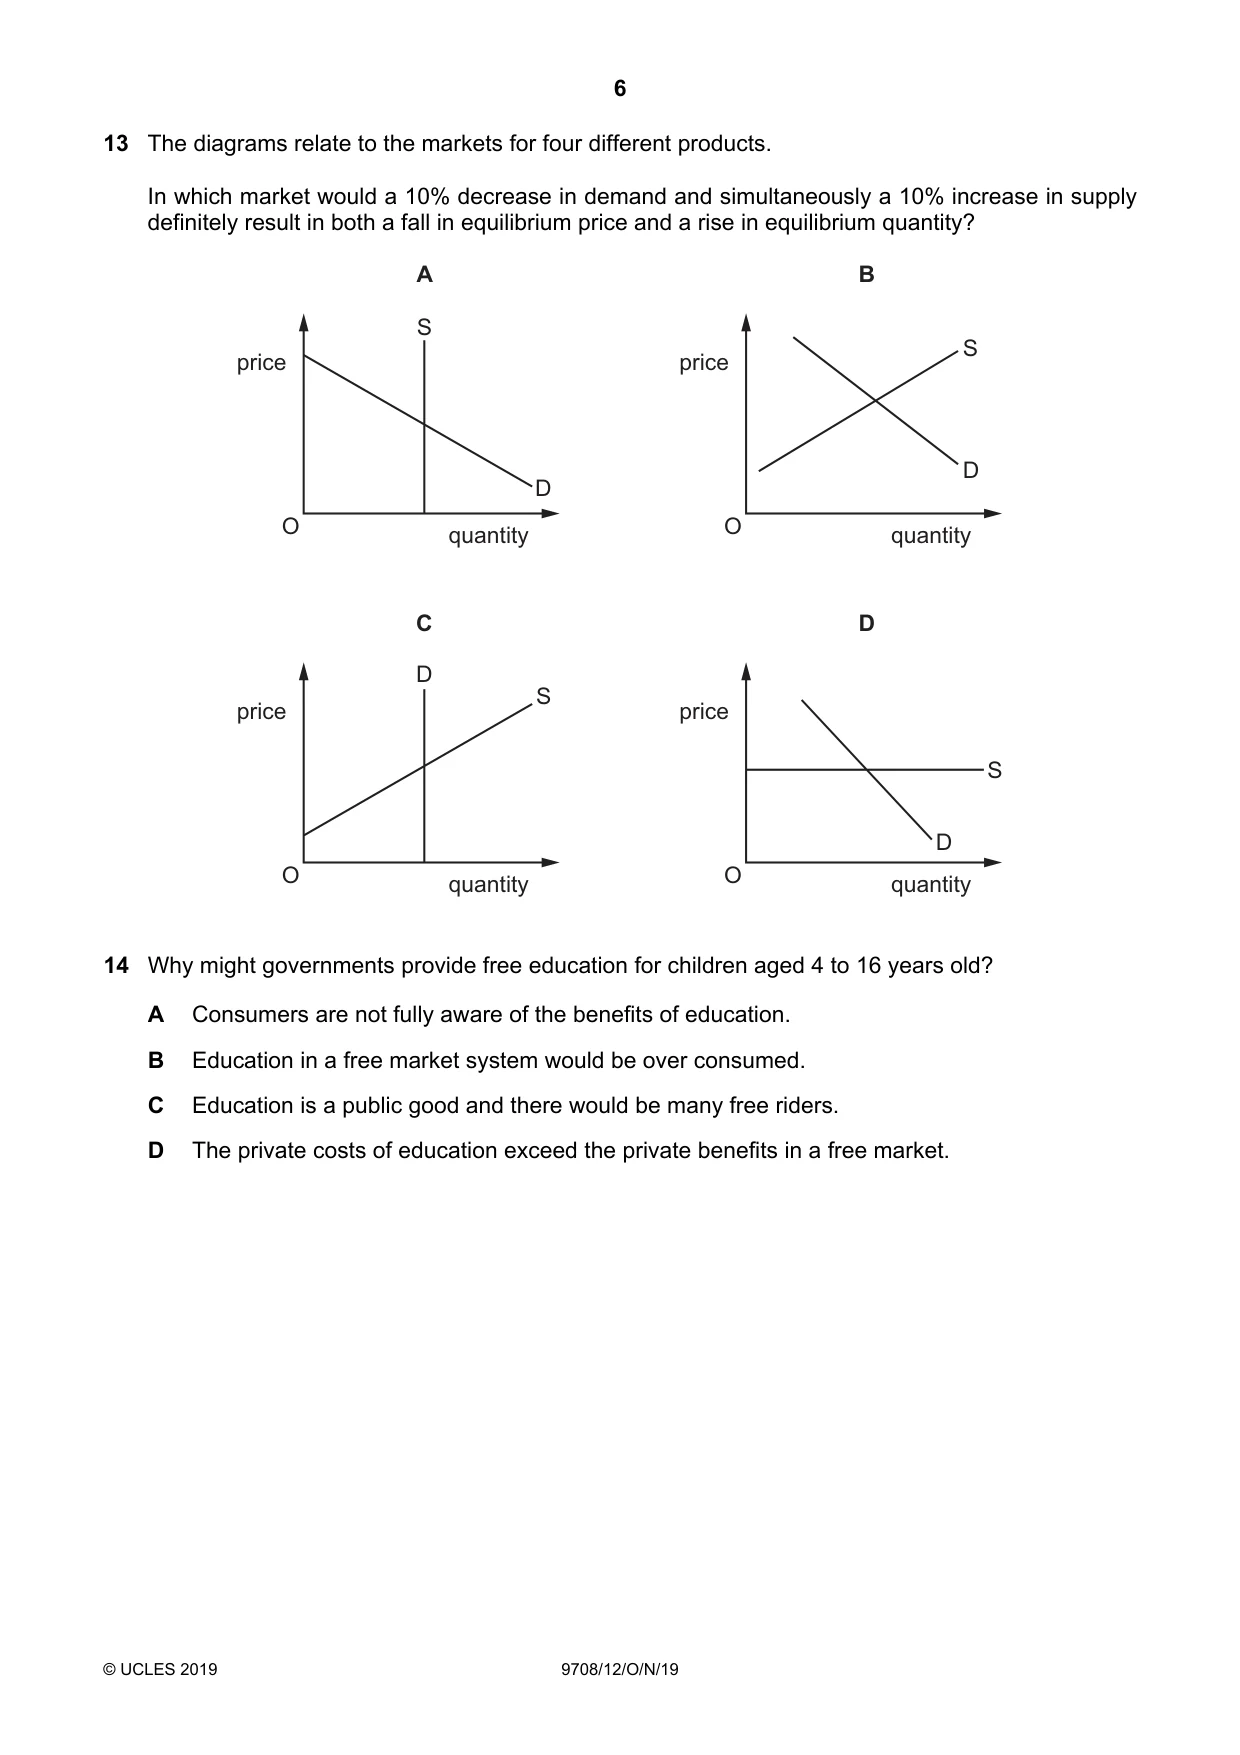
13 The diagrams relate to the markets for four different products. In which market would a 10% decrease in demand and simultaneously a 10% increase in supply definitely result in both a fall in equilibrium price and a rise in equilibrium quantity? A B S S price price D D O quantity O quantity C D D S price price S D O quantity O quantity
Mark scheme: A
Q14 · Why might governments provide free education for children aged 4 to 16 years old?
14 Why might governments provide free education for children aged 4 to 16 years old? A Consumers are not fully aware of the benefits of education. B Education in a free market system would be over consumed. C Education is a public good and there would be many free riders. D The private costs of education exceed the private benefits in a free market.
Mark scheme: A
More questions on Reasons for government intervention in markets
Q15 · The diagram shows three possible tax schemes
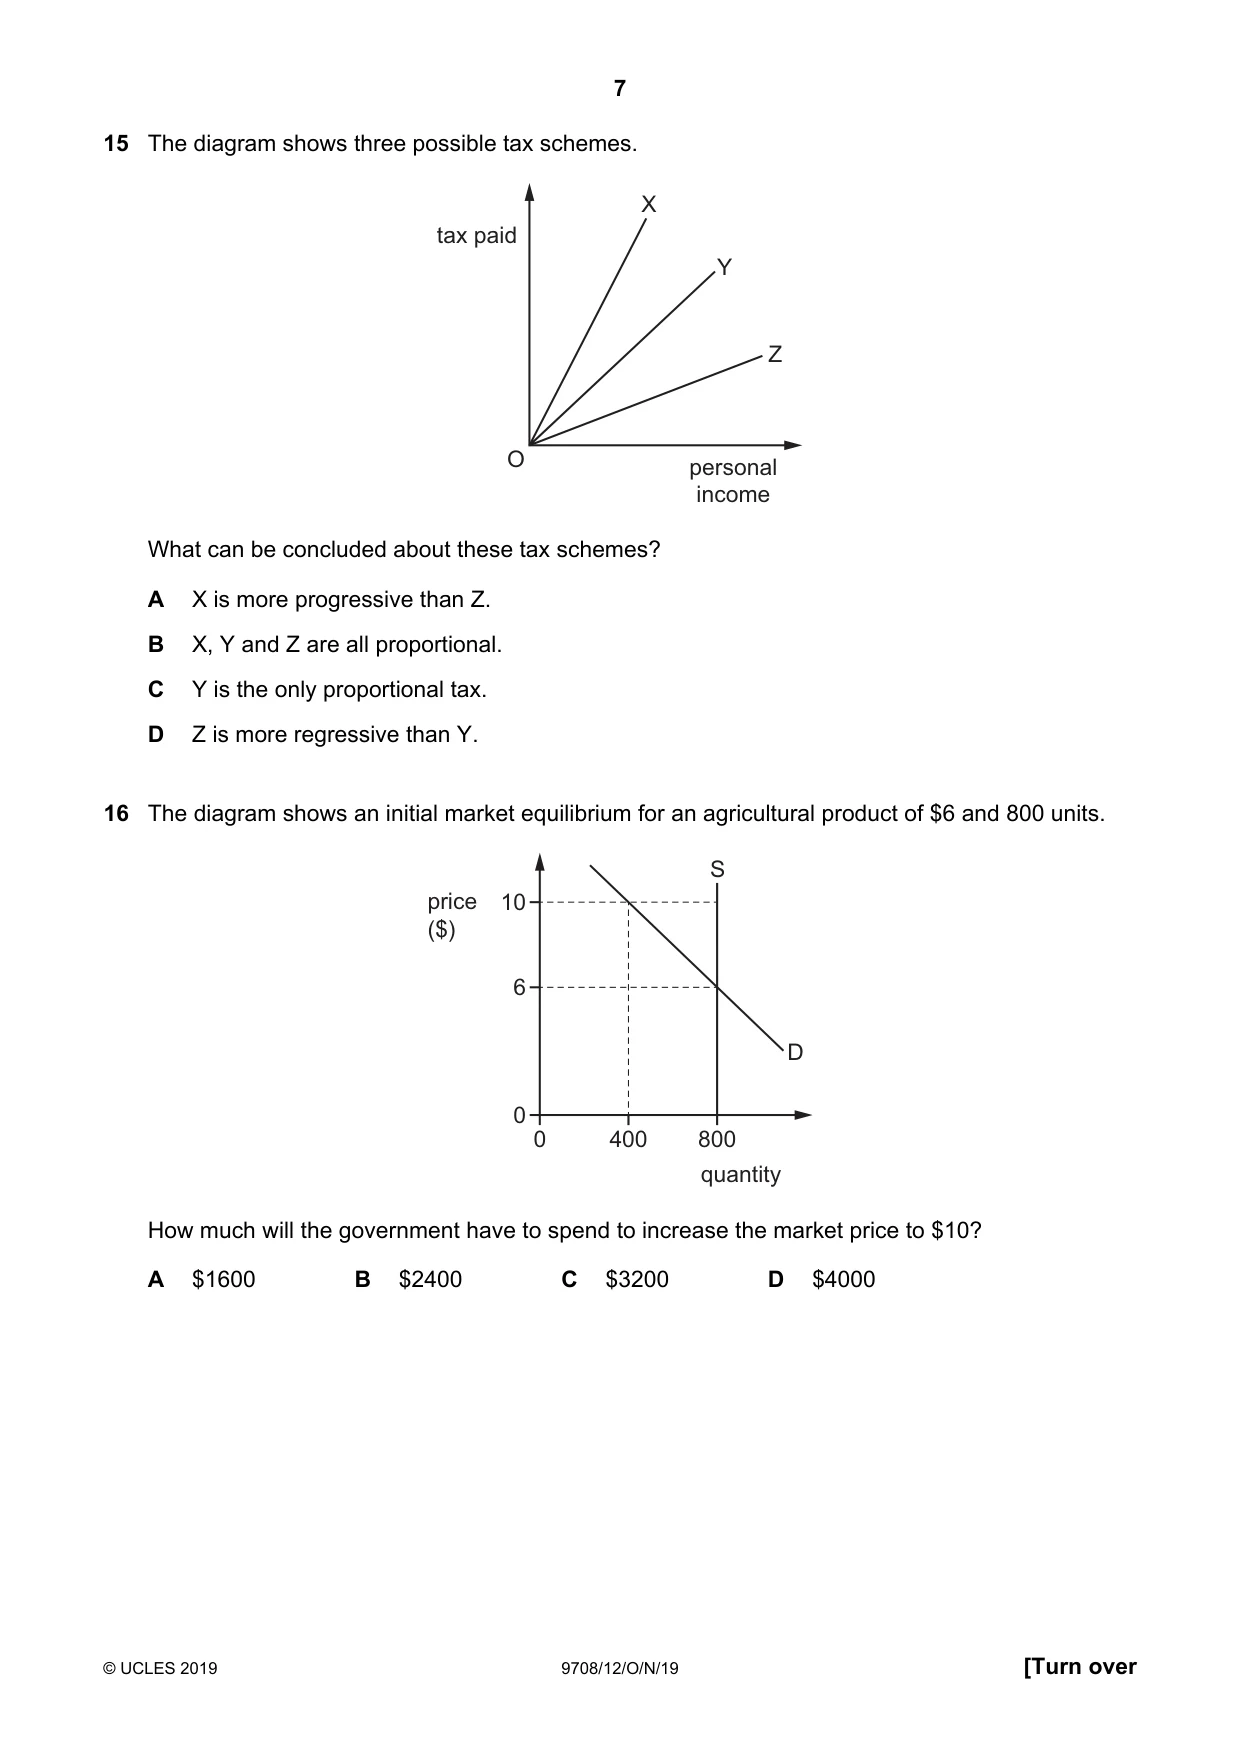
15 The diagram shows three possible tax schemes. X tax paid Y Z O personal income What can be concluded about these tax schemes? A X is more progressive than Z. B X, Y and Z are all proportional. C Y is the only proportional tax. D Z is more regressive than Y.
Mark scheme: B
Q16 · The diagram shows an initial market equilibrium for an agricultural product of $6 and 800…
16 The diagram shows an initial market equilibrium for an agricultural product of $6 and 800 units. S price 10 ($) 6 D 0 0 400 800 quantity How much will the government have to spend to increase the market price to $10? A $1600 B $2400 C $3200 D $4000
Mark scheme: D
More questions on Methods and effects of government intervention in markets
Q17 · The table identifies items of government annual spending
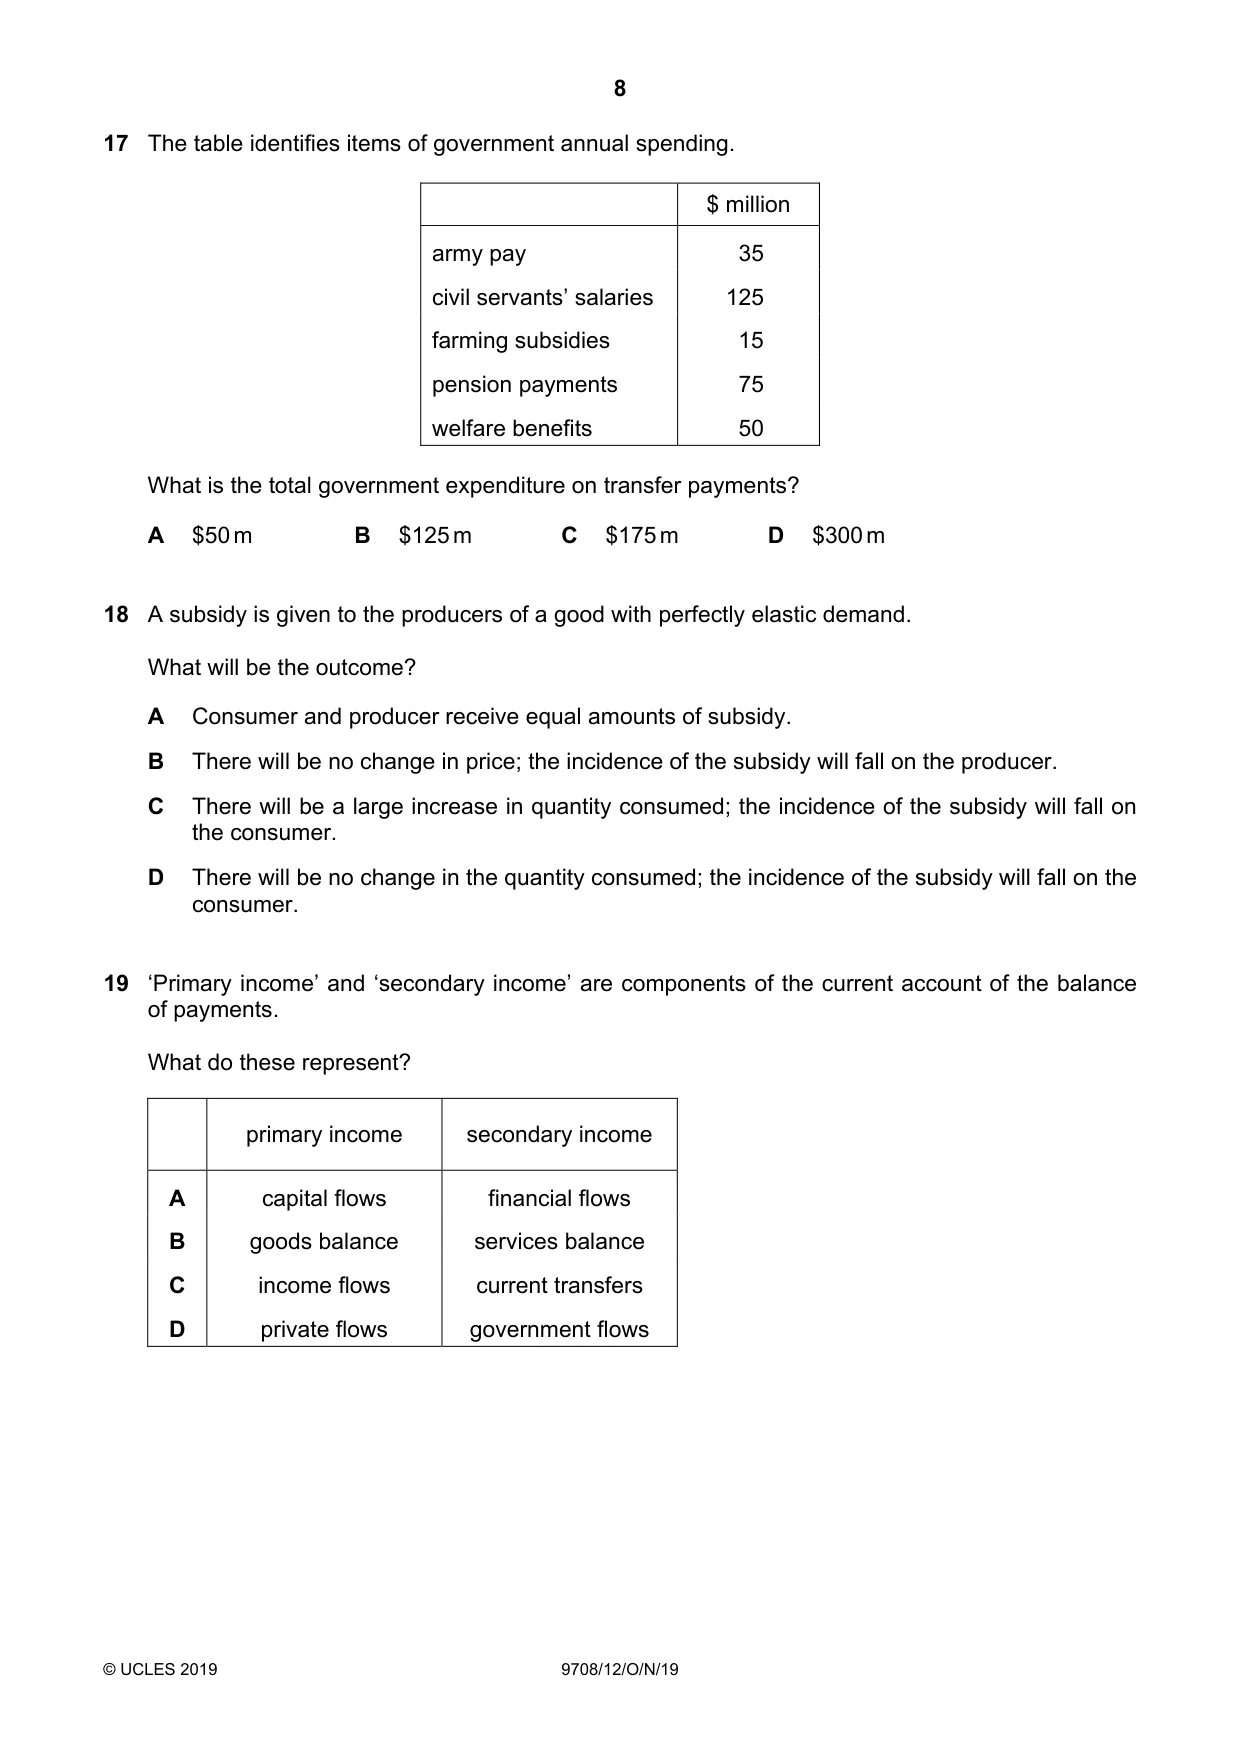
17 The table identifies items of government annual spending. $ million army pay 35 civil servants’ salaries 125 farming subsidies 15 pension payments 75 welfare benefits 50 What is the total government expenditure on transfer payments? A $50 m B $125 m C $175 m D $300 m
Mark scheme: B
Q18 · A subsidy is given to the producers of a good with perfectly elastic demand
18 A subsidy is given to the producers of a good with perfectly elastic demand. What will be the outcome? A Consumer and producer receive equal amounts of subsidy. B There will be no change in price; the incidence of the subsidy will fall on the producer. C There will be a large increase in quantity consumed; the incidence of the subsidy will fall on the consumer. D There will be no change in the quantity consumed; the incidence of the subsidy will fall on the consumer.
Mark scheme: B
More questions on Methods and effects of government intervention in markets
Q19 · ‘Primary income’ and ‘secondary income’ are components of the current account of the…
19 ‘Primary income’ and ‘secondary income’ are components of the current account of the balance of payments. What do these represent? primary income secondary income A capital flows financial flows B goods balance services balance C income flows current transfers D private flows government flows
Mark scheme: C
More questions on Current account of the balance of payments
Q20 · The diagram shows the original aggregate demand curve, AD1, and original aggregate supply…
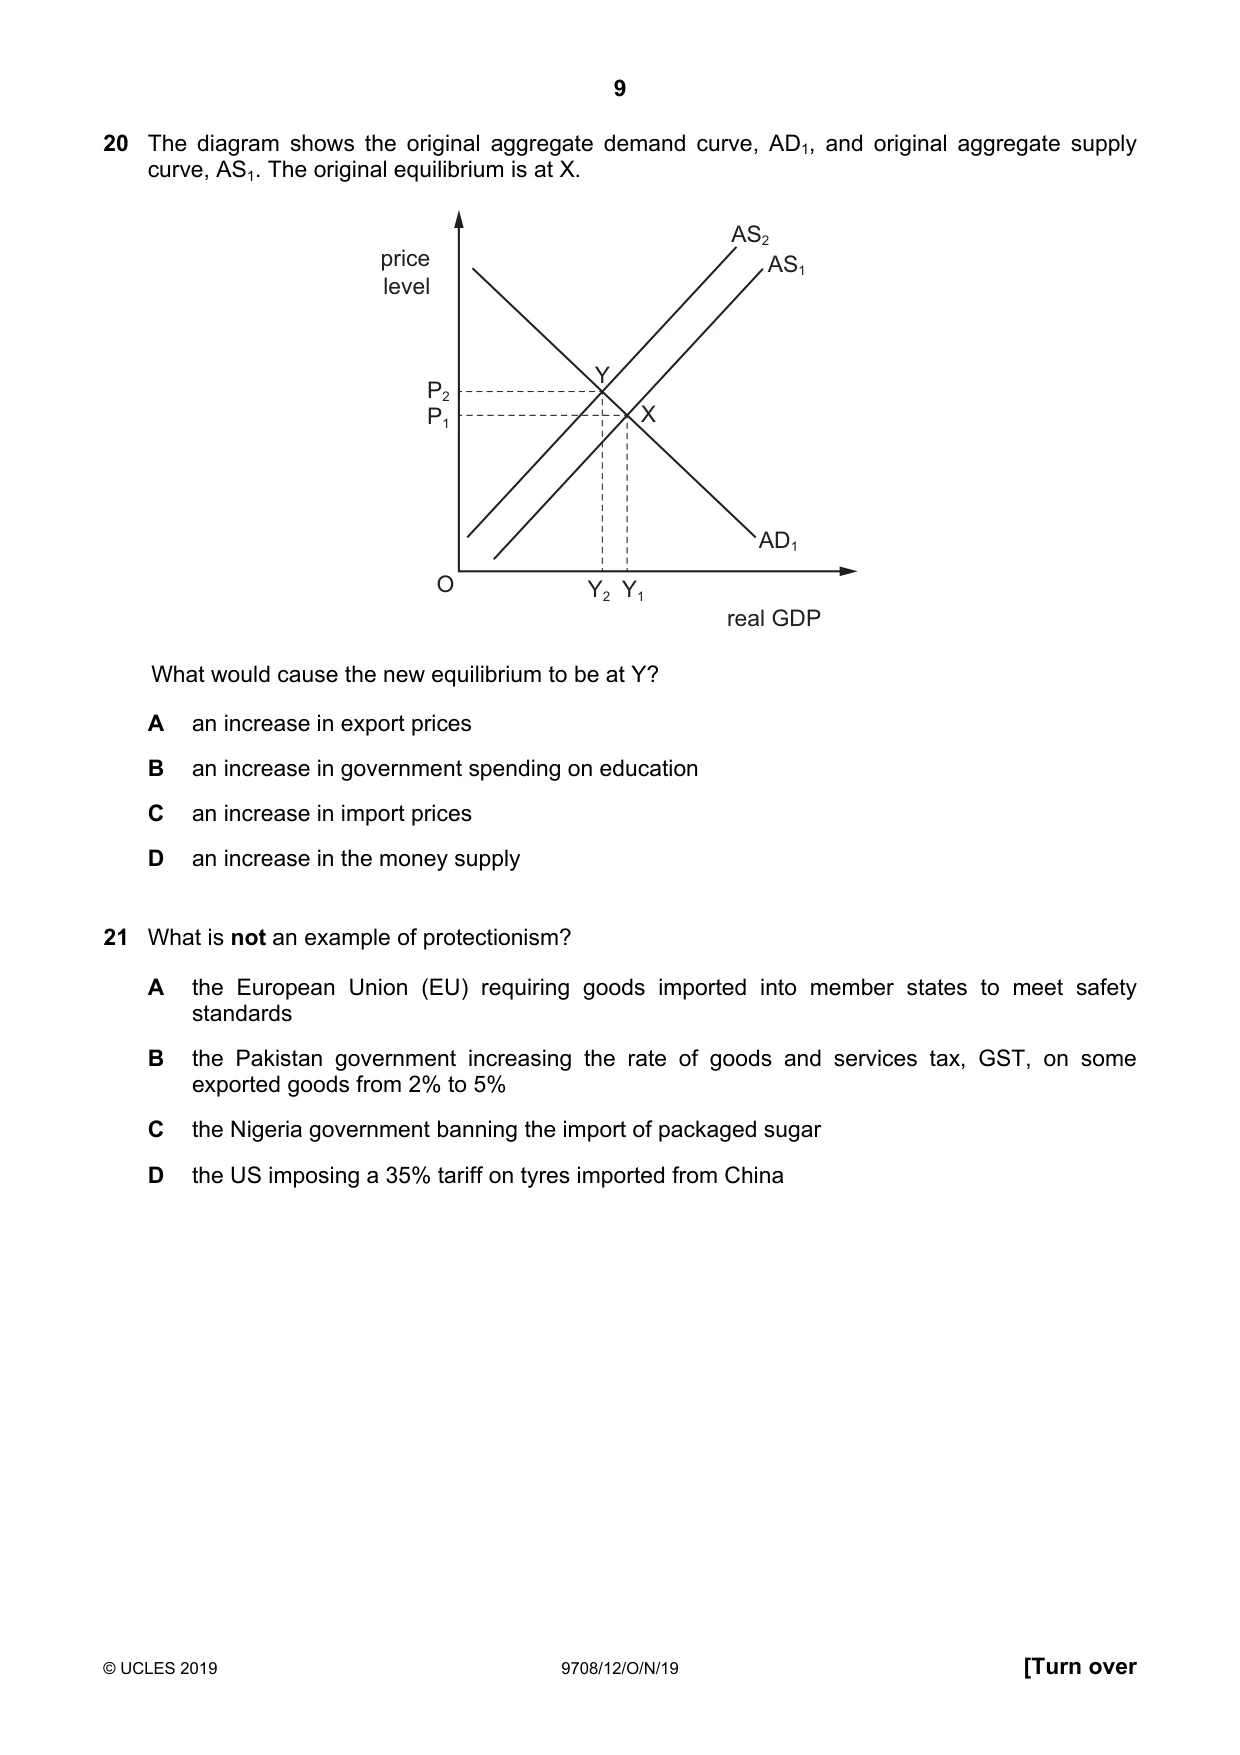
20 The diagram shows the original aggregate demand curve, AD1, and original aggregate supply curve, AS1. The original equilibrium is at X. AS2 price AS1 level Y P2 P1 X AD1 O Y2 Y1 real GDP What would cause the new equilibrium to be at Y? A an increase in export prices B an increase in government spending on education C an increase in import prices D an increase in the money supply
Mark scheme: C
More questions on Aggregate Demand and Aggregate Supply analysis
Q21 · What is not an example of protectionism?
21 What is not an example of protectionism? A the European Union (EU) requiring goods imported into member states to meet safety standards B the Pakistan government increasing the rate of goods and services tax, GST, on some exported goods from 2% to 5% C the Nigeria government banning the import of packaged sugar D the US imposing a 35% tariff on tyres imported from China
Mark scheme: B
Q22 · The table shows the annual percentage increases in a country’s consumer prices index (CPI)
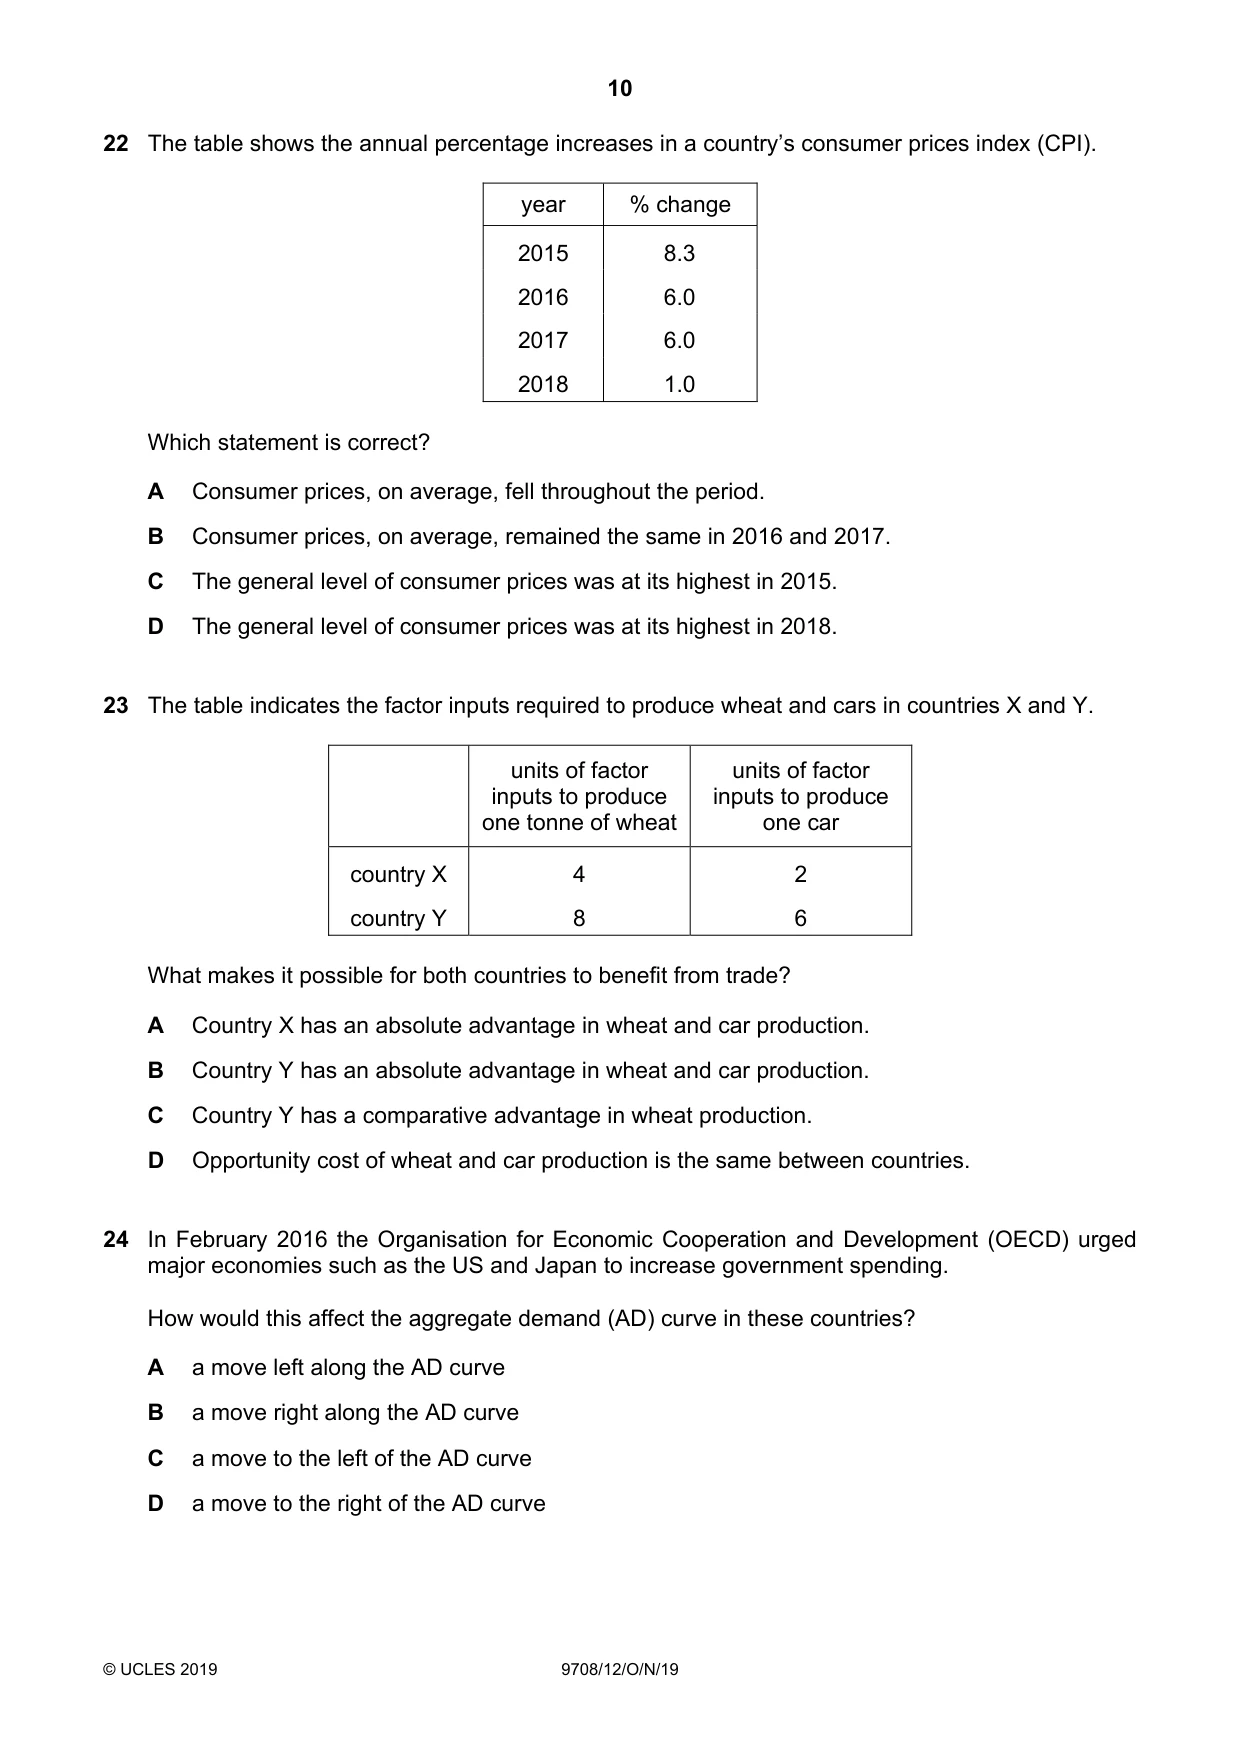
22 The table shows the annual percentage increases in a country’s consumer prices index (CPI). year % change 2015 8.3 2016 6.0 2017 6.0 2018 1.0 Which statement is correct? A Consumer prices, on average, fell throughout the period. B Consumer prices, on average, remained the same in 2016 and 2017. C The general level of consumer prices was at its highest in 2015. D The general level of consumer prices was at its highest in 2018.
Mark scheme: D
Q23 · The table indicates the factor inputs required to produce wheat and cars in countries X…
23 The table indicates the factor inputs required to produce wheat and cars in countries X and Y. units of factor units of factor inputs to produce inputs to produce one tonne of wheat one car country X 4 2 country Y 8 6 What makes it possible for both countries to benefit from trade? A Country X has an absolute advantage in wheat and car production. B Country Y has an absolute advantage in wheat and car production. C Country Y has a comparative advantage in wheat production. D Opportunity cost of wheat and car production is the same between countries.
Mark scheme: C
Q24 · In February 2016 the Organisation for Economic Cooperation and Development (OECD) urged…
24 In February 2016 the Organisation for Economic Cooperation and Development (OECD) urged major economies such as the US and Japan to increase government spending. How would this affect the aggregate demand (AD) curve in these countries? A a move left along the AD curve B a move right along the AD curve C a move to the left of the AD curve D a move to the right of the AD curve
Mark scheme: D
Q25 · A foreign government pays a UK university to educate its students
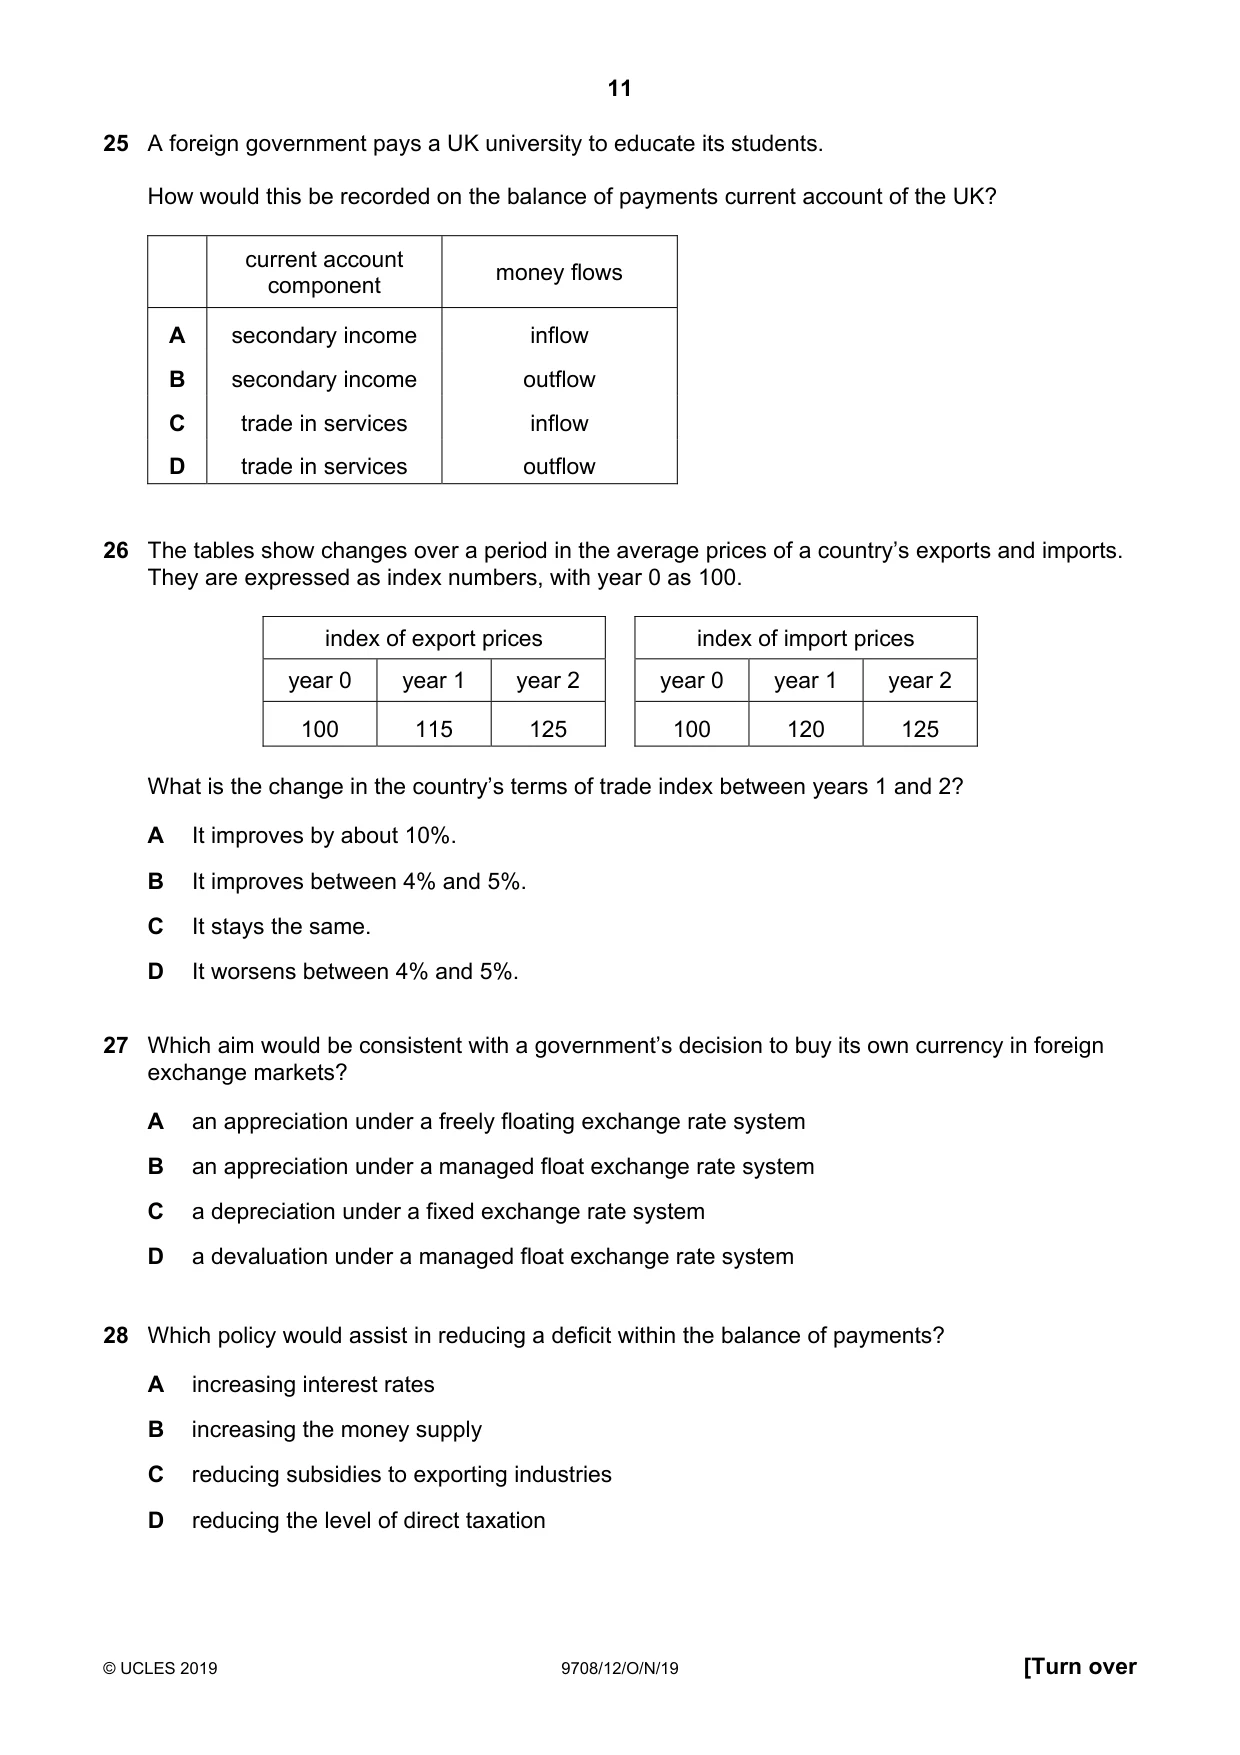
25 A foreign government pays a UK university to educate its students. How would this be recorded on the balance of payments current account of the UK? current account money flows component A secondary income inflow B secondary income outflow C trade in services inflow D trade in services outflow
Mark scheme: C
More questions on Current account of the balance of payments
Q26 · The tables show changes over a period in the average prices of a country’s exports and…
26 The tables show changes over a period in the average prices of a country’s exports and imports. They are expressed as index numbers, with year 0 as 100. index of export prices index of import prices year 0 year 1 year 2 year 0 year 1 year 2 100 115 125 100 120 125 What is the change in the country’s terms of trade index between years 1 and 2? A It improves by about 10%. B It improves between 4% and 5%. C It stays the same. D It worsens between 4% and 5%.
Mark scheme: B
Q27 · Which aim would be consistent with a government’s decision to buy its own currency in…
27 Which aim would be consistent with a government’s decision to buy its own currency in foreign exchange markets? A an appreciation under a freely floating exchange rate system B an appreciation under a managed float exchange rate system C a depreciation under a fixed exchange rate system D a devaluation under a managed float exchange rate system
Mark scheme: B
Q28 · Which policy would assist in reducing a deficit within the balance of payments?
28 Which policy would assist in reducing a deficit within the balance of payments? A increasing interest rates B increasing the money supply C reducing subsidies to exporting industries D reducing the level of direct taxation
Mark scheme: A
More questions on Policies to correct imbalances in the current account of the balance of payments
Q29 · An economy’s current account on the balance of payments is in surplus
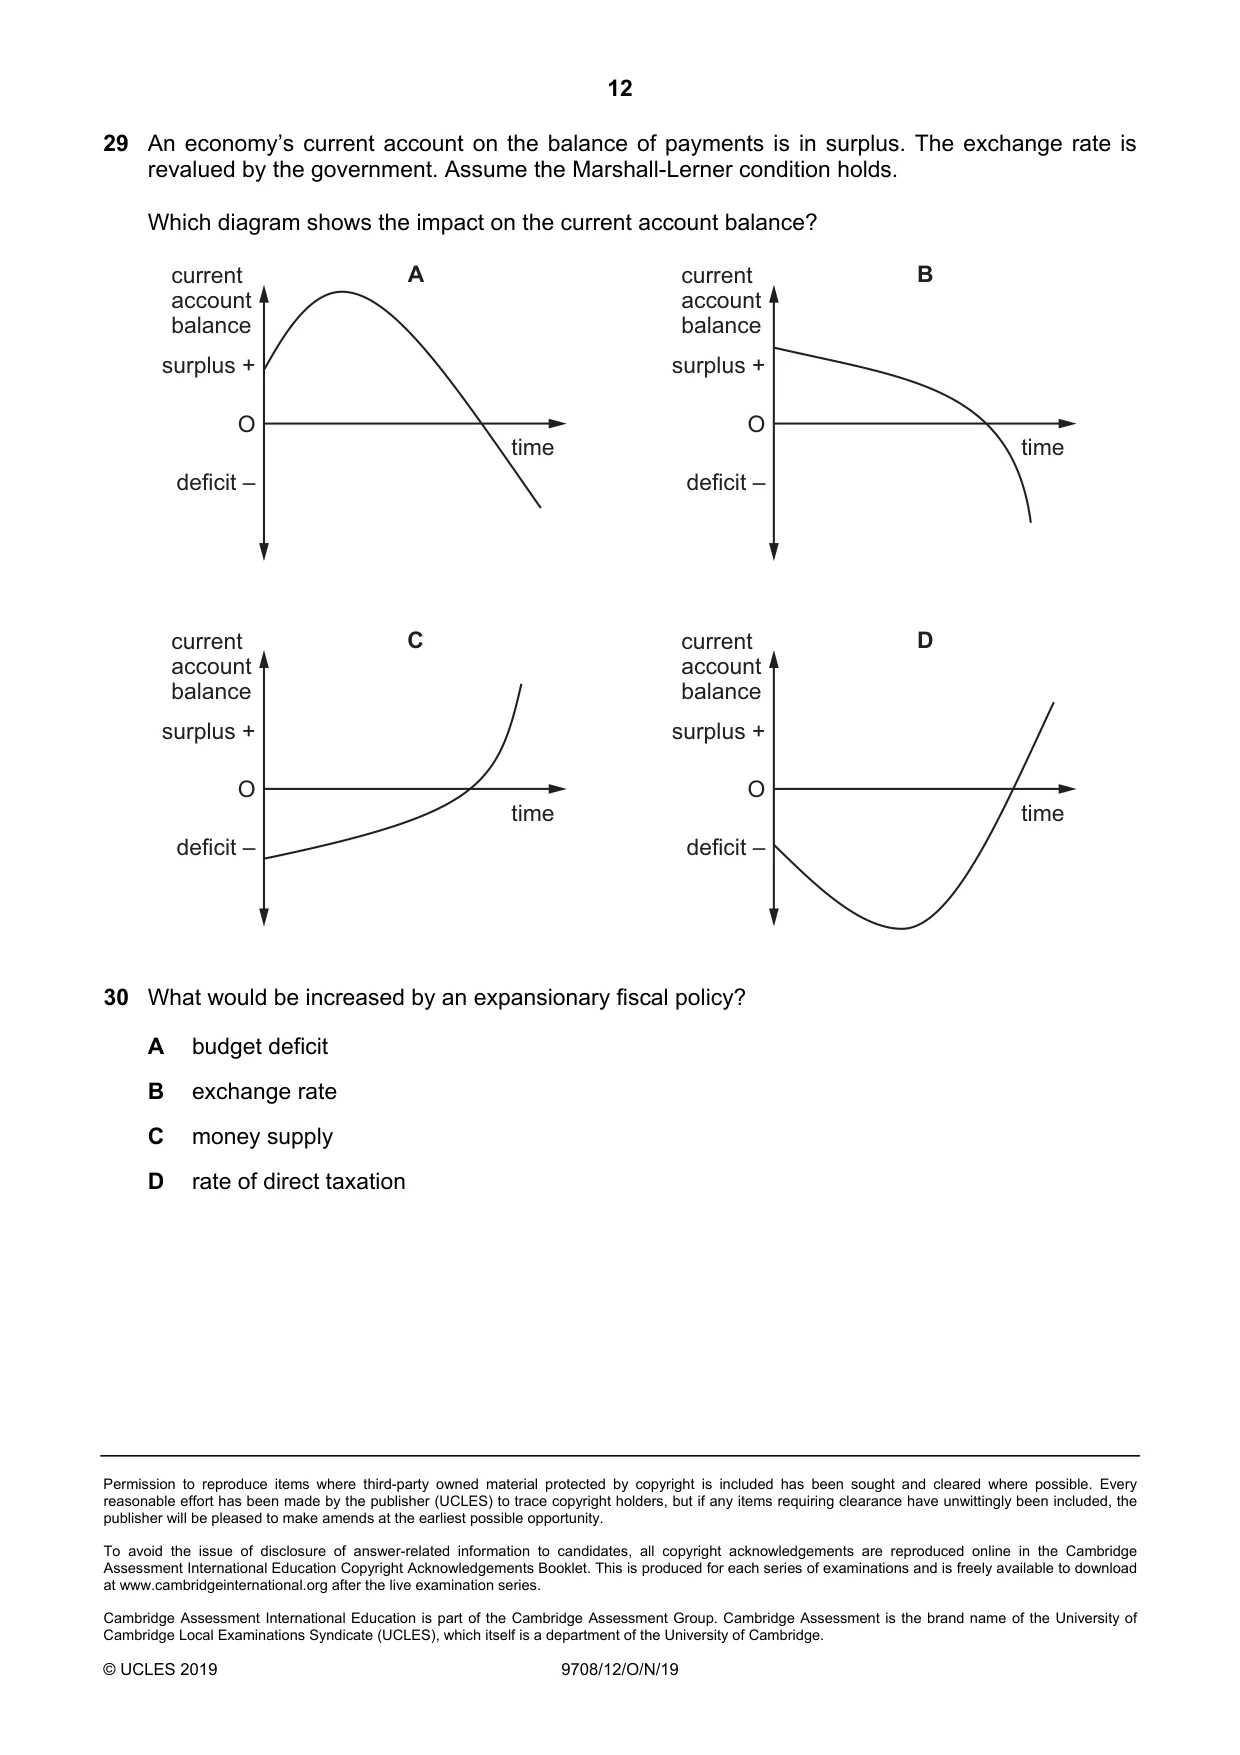
29 An economy’s current account on the balance of payments is in surplus. The exchange rate is revalued by the government. Assume the Marshall-Lerner condition holds. Which diagram shows the impact on the current account balance? current A current B account account balance balance surplus + surplus + O O time time deficit – deficit – current C current D account account balance balance surplus + surplus + O O time time deficit – deficit –
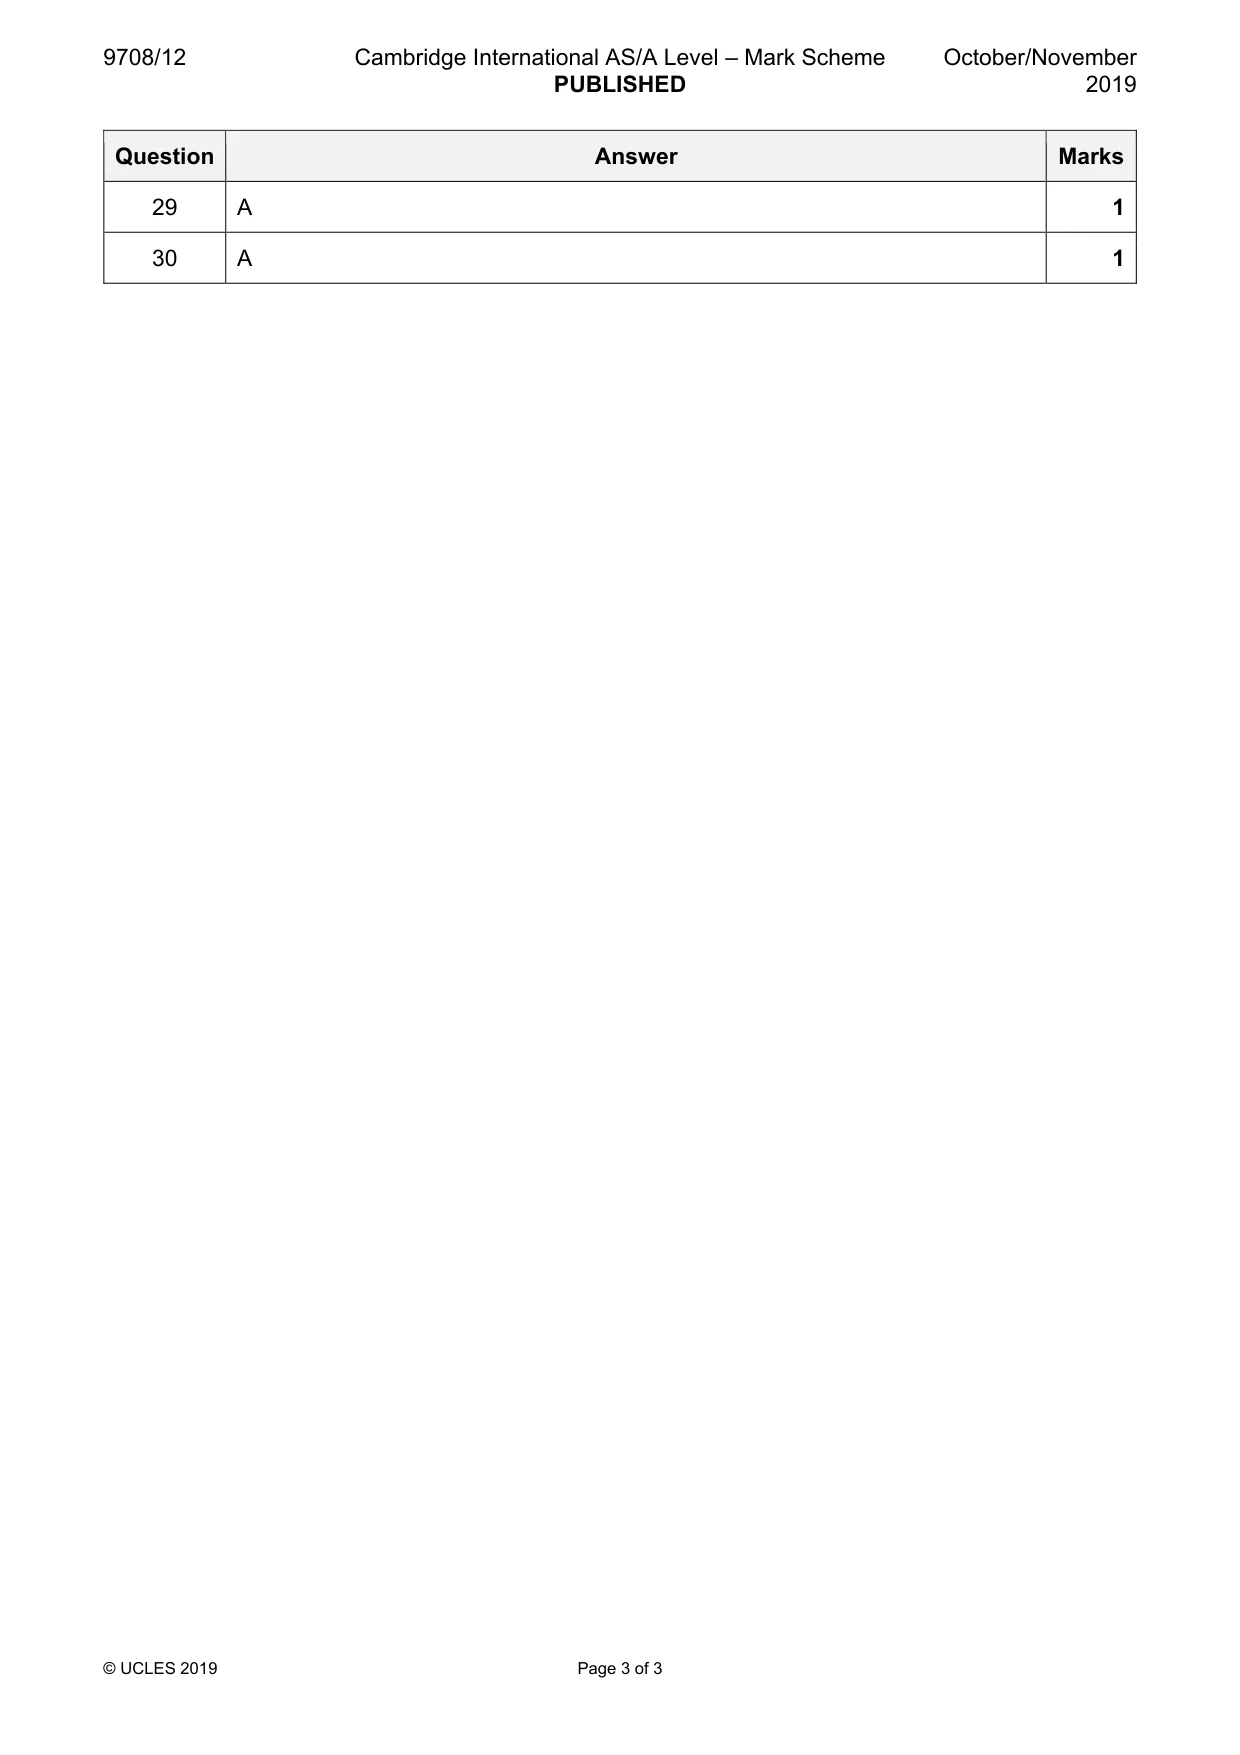
Mark scheme: A
Q30 · What would be increased by an expansionary fiscal policy?
30 What would be increased by an expansionary fiscal policy? A budget deficit B exchange rate C money supply D rate of direct taxation
Mark scheme: A
What was in this paper
The subtopics covered by these 30 questions, and how many questions each got. Open one in a new tab to see every Cambridge question on it.
4Exchange rates3Methods and effects of government intervention in markets3Addressing income and wealth inequality2Current account of the balance of payments2Fiscal policy2Aggregate Demand and Aggregate Supply analysis1Classification of goods and services1Consumer and producer surplus1Demand and supply curves1Economic methodology1Policies to correct imbalances in the current account of the balance of payments1Price elasticity, income elasticity and cross elasticity of demand1Price stability1Production possibility curves1Protectionism1Reasons for government intervention in markets1Resource allocation in different economic systems1Scarcity, choice and opportunity cost1The reasons for international trade1What you needed in this session
Cambridge’s own grade thresholds for 2019 Oct/Nov, Paper 1 · Variant 2. A higher threshold means an easier paper — the bar moves with how the cohort did.