Cambridge A Level Economics 9708 — 2020 Oct/Nov Paper 1 · Variant 2
9708/12/O/N/20 · 30 questions · 30 marks · ≈34 min
The question paper and its mark scheme, free to read here and free to download. This is Cambridge’s own paper, exactly as it was sat.
Question paper12 pages
Mark scheme3 pages
Answers below. Sit the paper first if you are practising.
Questions as text
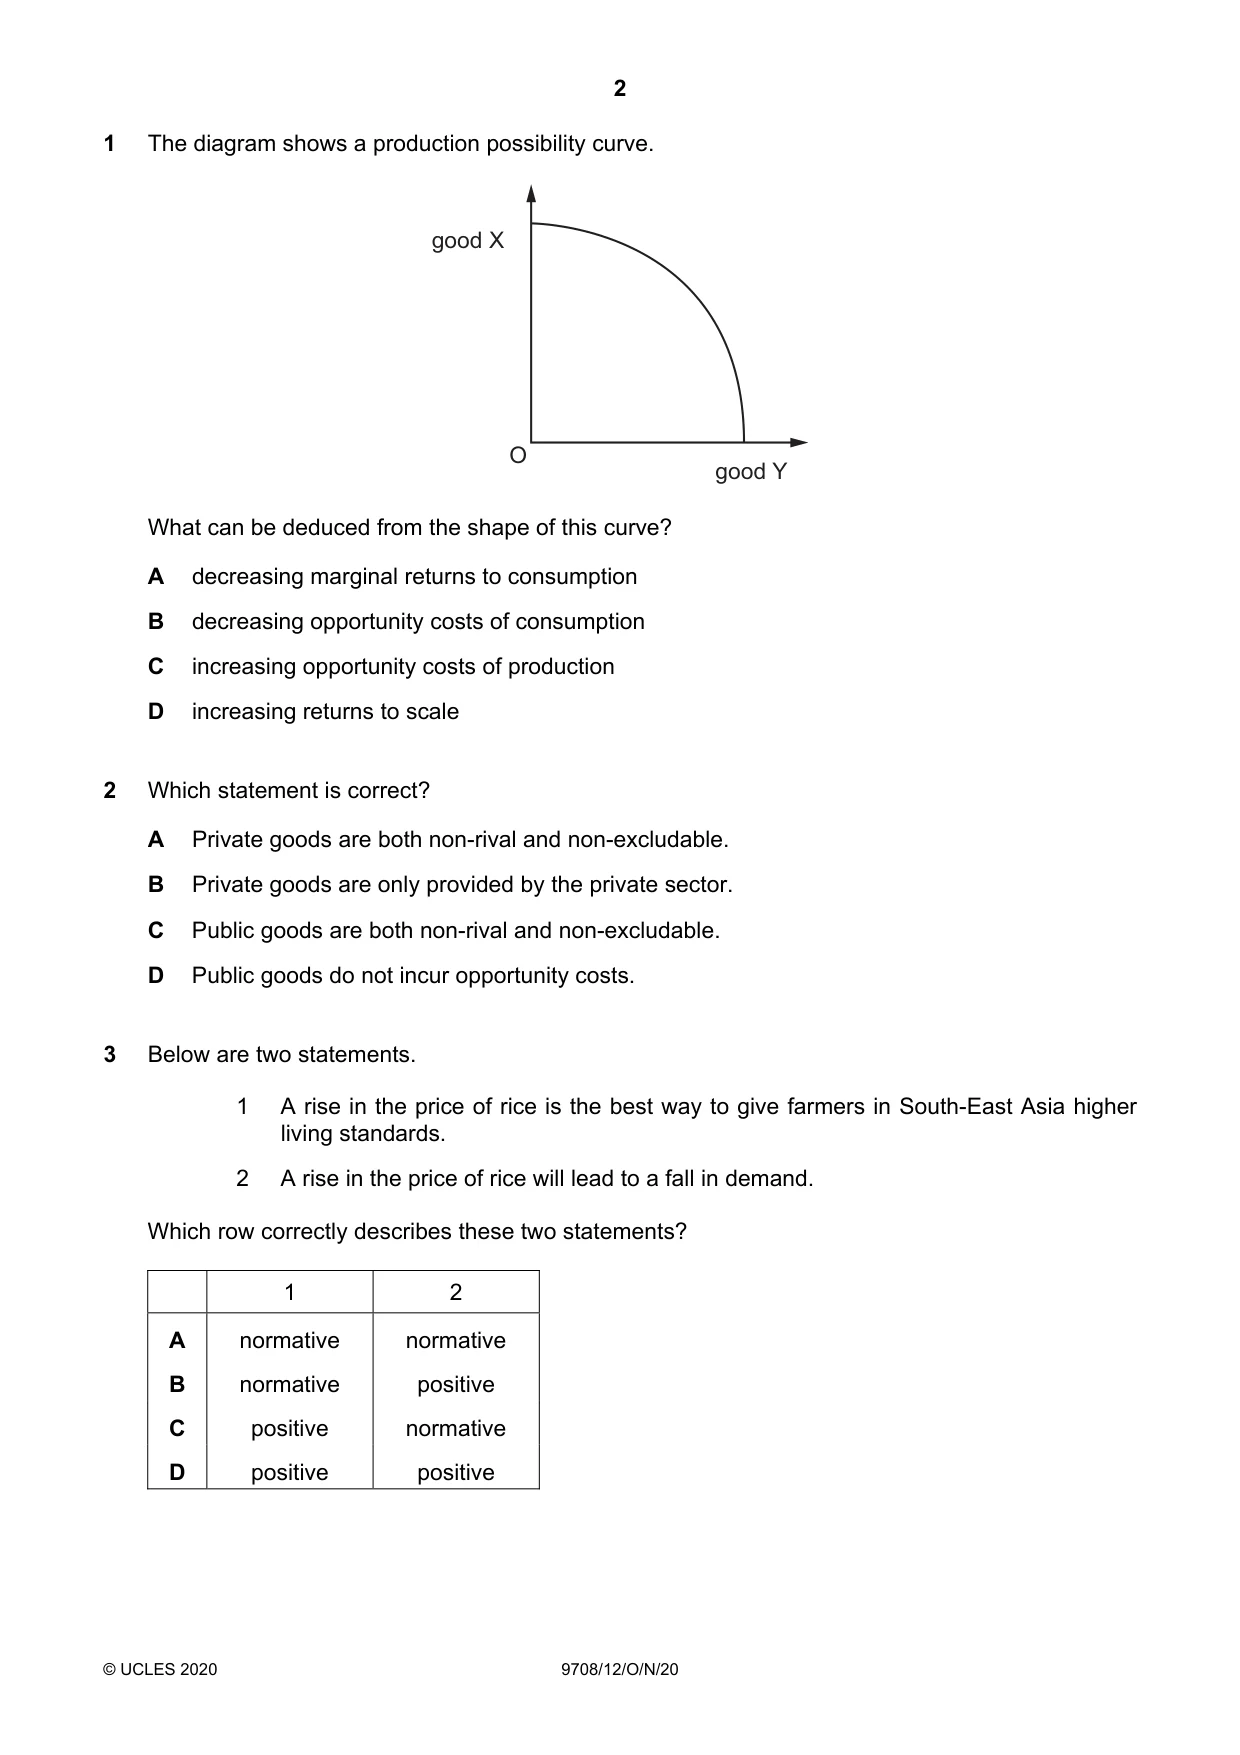
Q1 · The diagram shows a production possibility curve
1 The diagram shows a production possibility curve. good X O good Y What can be deduced from the shape of this curve? A decreasing marginal returns to consumption B decreasing opportunity costs of consumption C increasing opportunity costs of production D increasing returns to scale
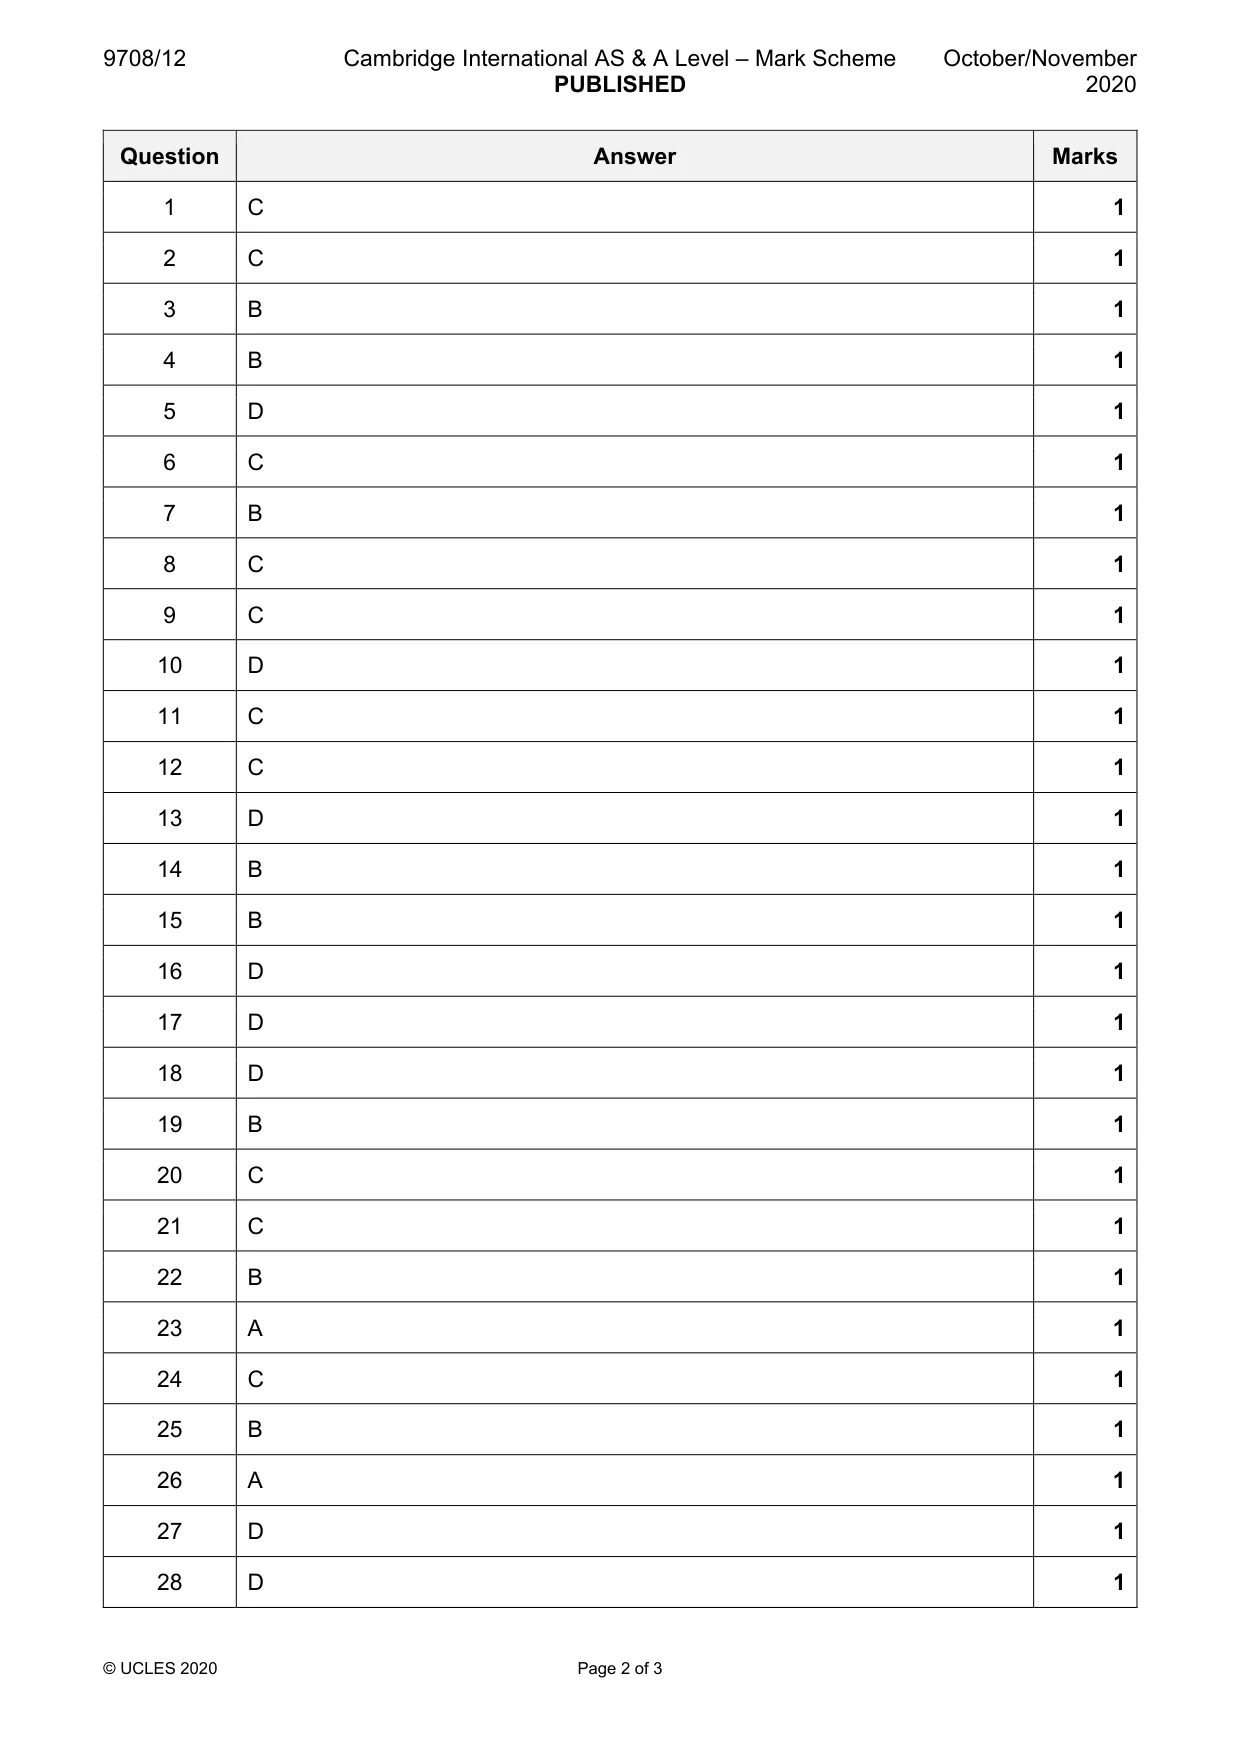
Mark scheme: C
Q2 · Which statement is correct?
2 Which statement is correct? A Private goods are both non-rival and non-excludable. B Private goods are only provided by the private sector. C Public goods are both non-rival and non-excludable. D Public goods do not incur opportunity costs.
Mark scheme: C
Q3 · Below are two statements
3 Below are two statements. 1 A rise in the price of rice is the best way to give farmers in South-East Asia higher living standards. 2 A rise in the price of rice will lead to a fall in demand. Which row correctly describes these two statements? 1 2 A normative normative B normative positive C positive normative D positive positive
Mark scheme: B
Q4 · What is a characteristic of money but not a function of money?
4 What is a characteristic of money but not a function of money? A medium of exchange B portability C standard of deferred payment D store of value
Mark scheme: B
Q5 · In the UK, attempts to encourage people to change from road to rail travel by the…
5 In the UK, attempts to encourage people to change from road to rail travel by the introduction of a system of road pricing were forecast to have little effect because ‘people like using their cars too much’. How would this forecast be explained? A The price elasticity of demand for cars is high. B The price elasticity of demand for petrol is high. C The price elasticity of demand for rail travel is low. D The price elasticity of demand for car travel is low.
Mark scheme: D
More questions on Price elasticity, income elasticity and cross elasticity of demand
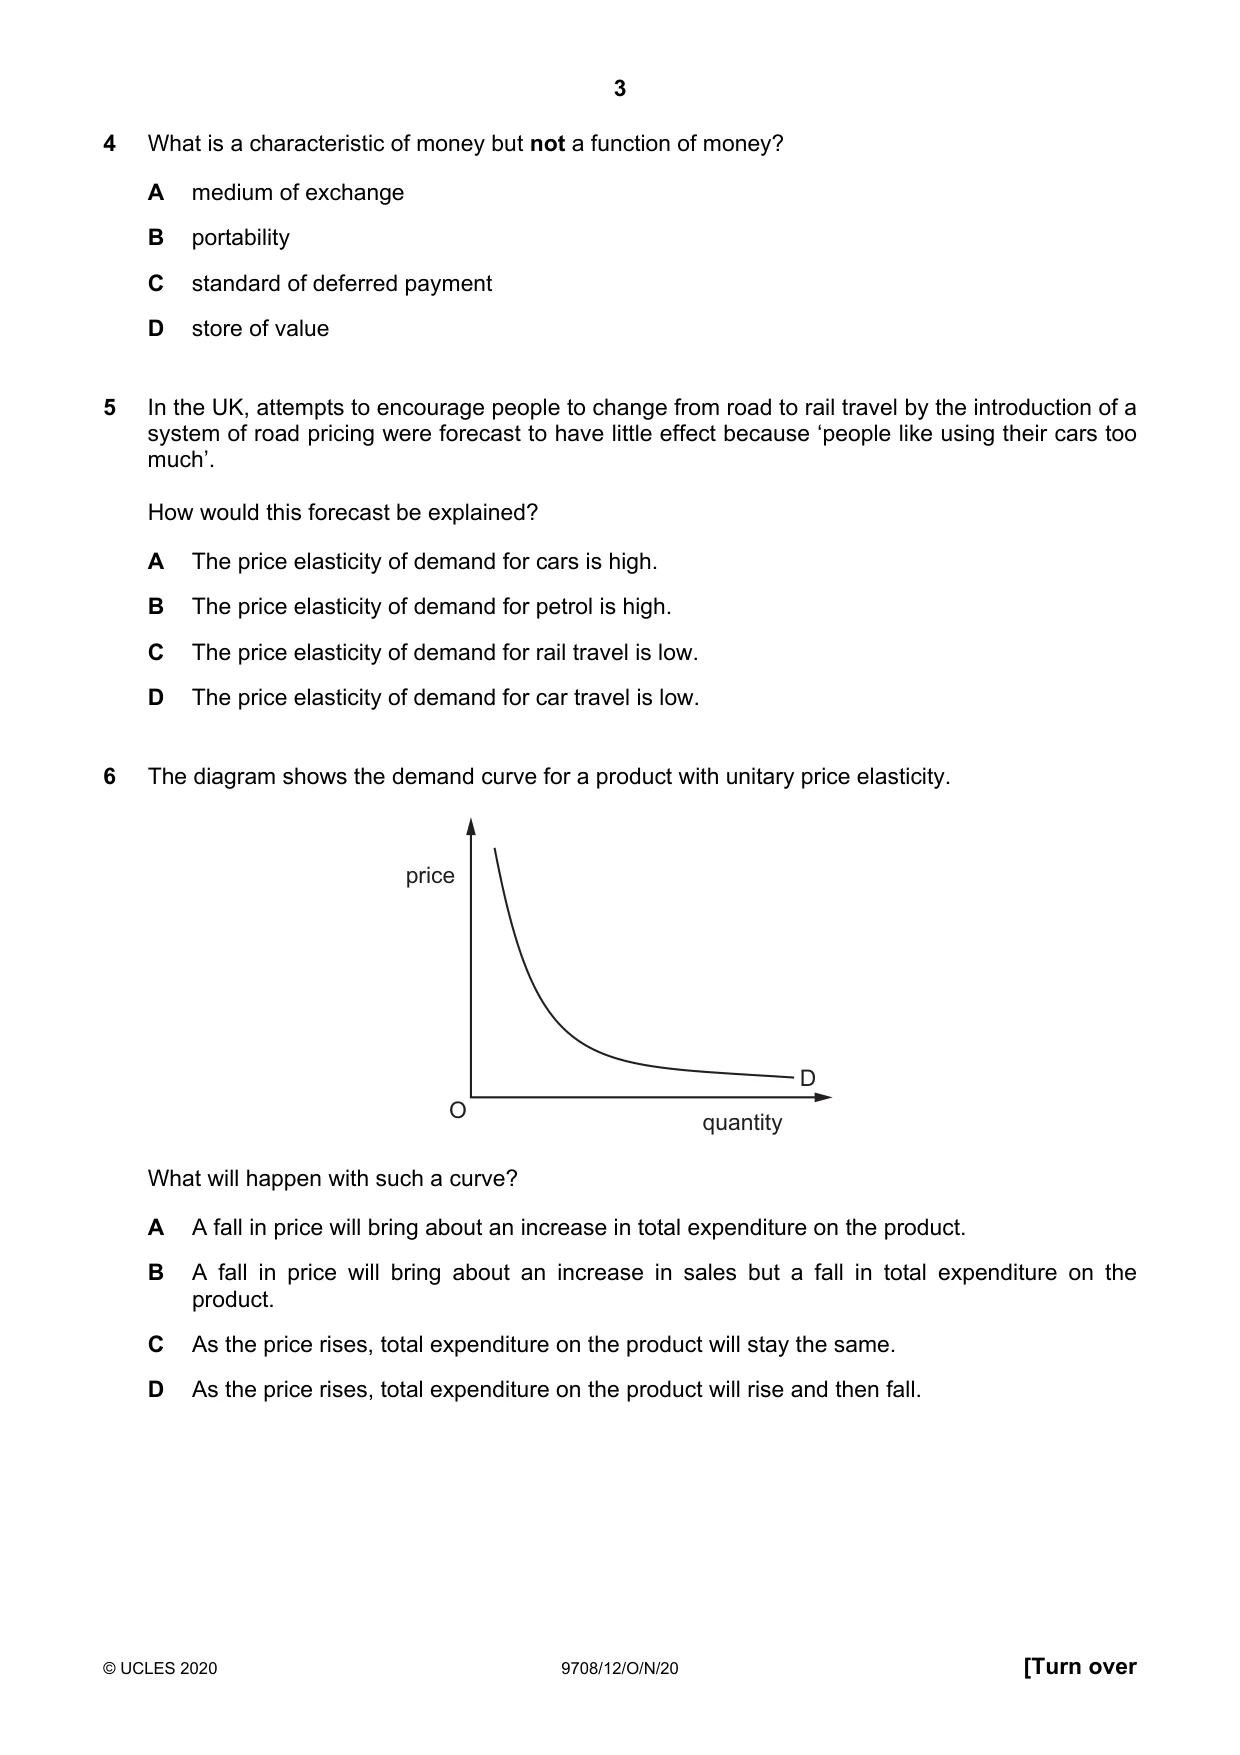
Q6 · The diagram shows the demand curve for a product with unitary price elasticity
6 The diagram shows the demand curve for a product with unitary price elasticity. price D O quantity What will happen with such a curve? A A fall in price will bring about an increase in total expenditure on the product. B A fall in price will bring about an increase in sales but a fall in total expenditure on the product. C As the price rises, total expenditure on the product will stay the same. D As the price rises, total expenditure on the product will rise and then fall.
Mark scheme: C
More questions on Price elasticity, income elasticity and cross elasticity of demand
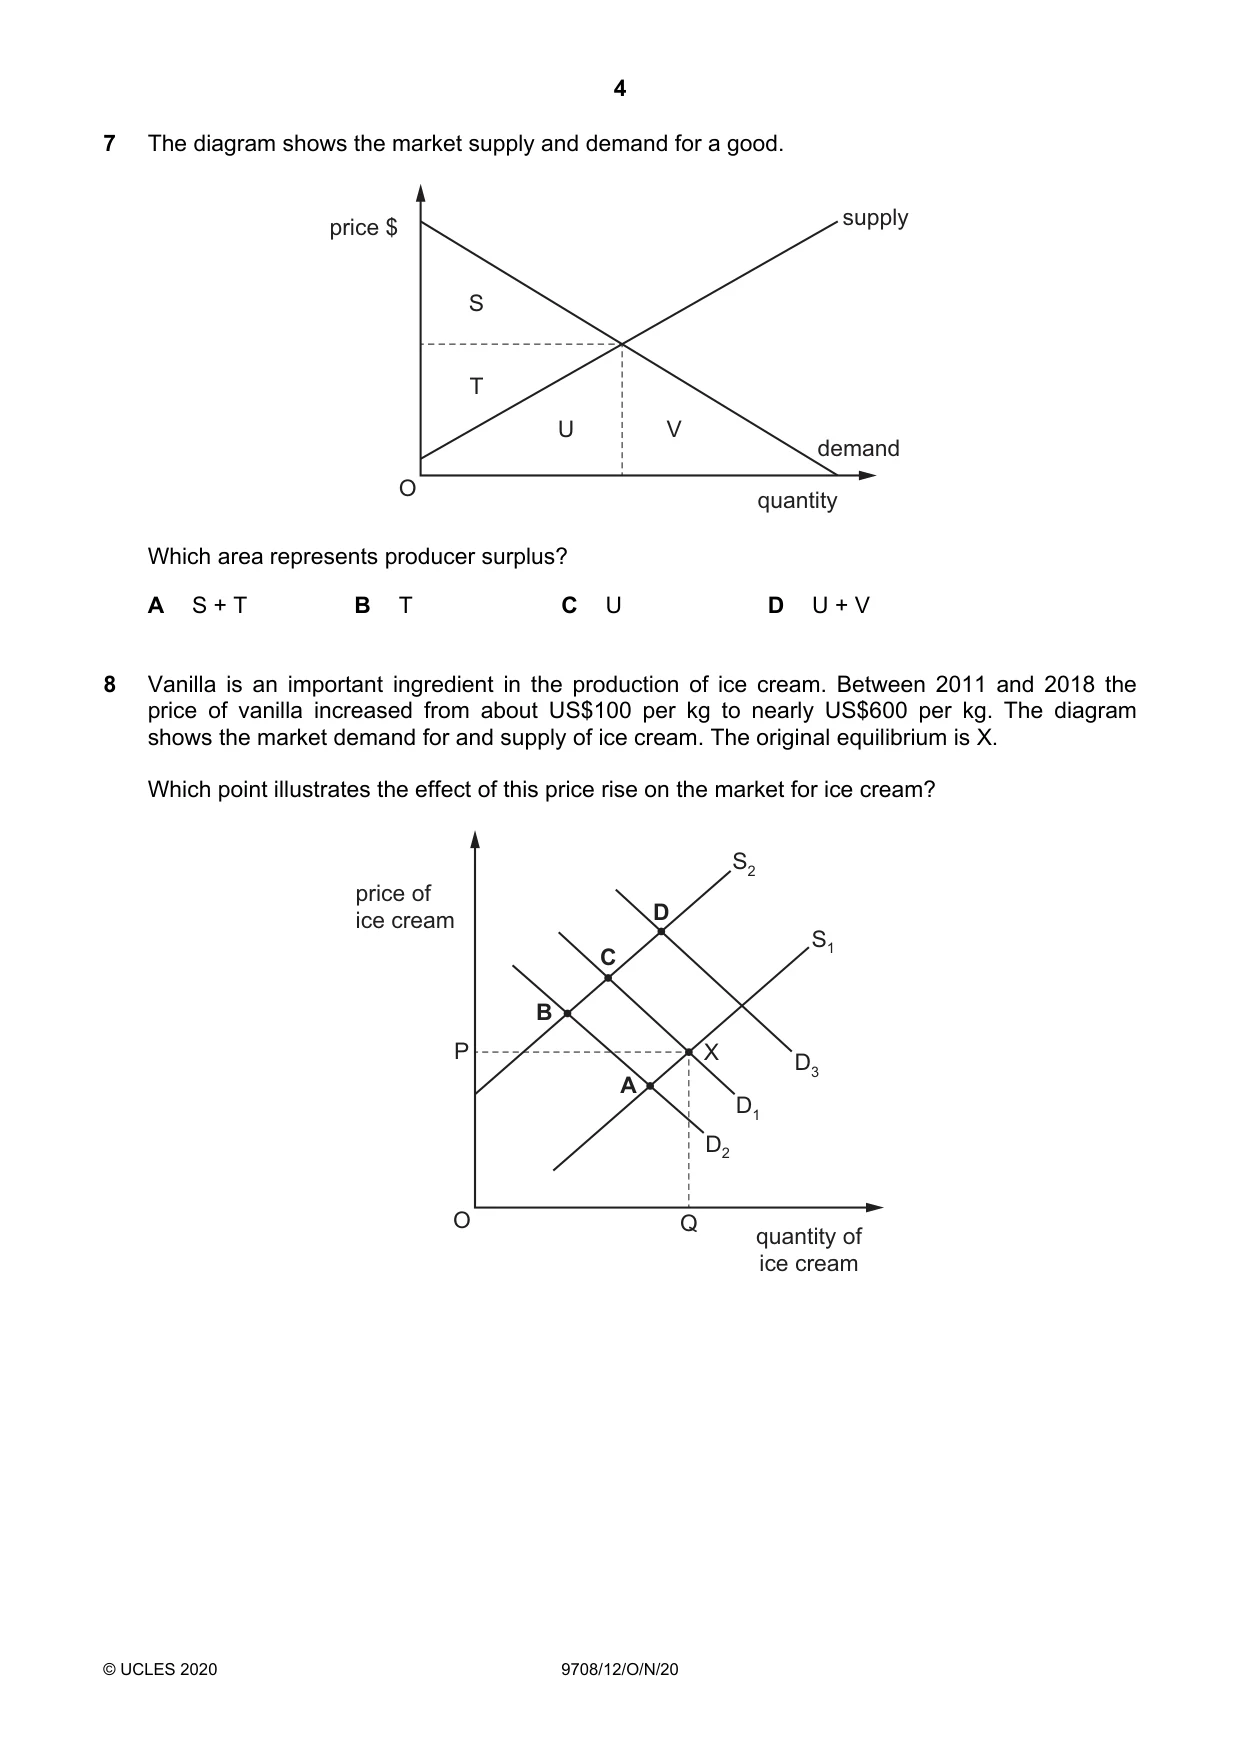
Q7 · The diagram shows the market supply and demand for a good
7 The diagram shows the market supply and demand for a good. supply price $ S T U V demand O quantity Which area represents producer surplus? A S + T B T C U D U + V
Mark scheme: B
Q8 · Vanilla is an important ingredient in the production of ice cream
8 Vanilla is an important ingredient in the production of ice cream. Between 2011 and 2018 the price of vanilla increased from about US$100 per kg to nearly US$600 per kg. The diagram shows the market demand for and supply of ice cream. The original equilibrium is X. Which point illustrates the effect of this price rise on the market for ice cream? S2 price of ice cream D S1 C B P X D3 A D1 D2 O Q quantity of ice cream
Mark scheme: C
Q9 · A government reduces income tax but at the same time raises the rate of sales tax (VAT)
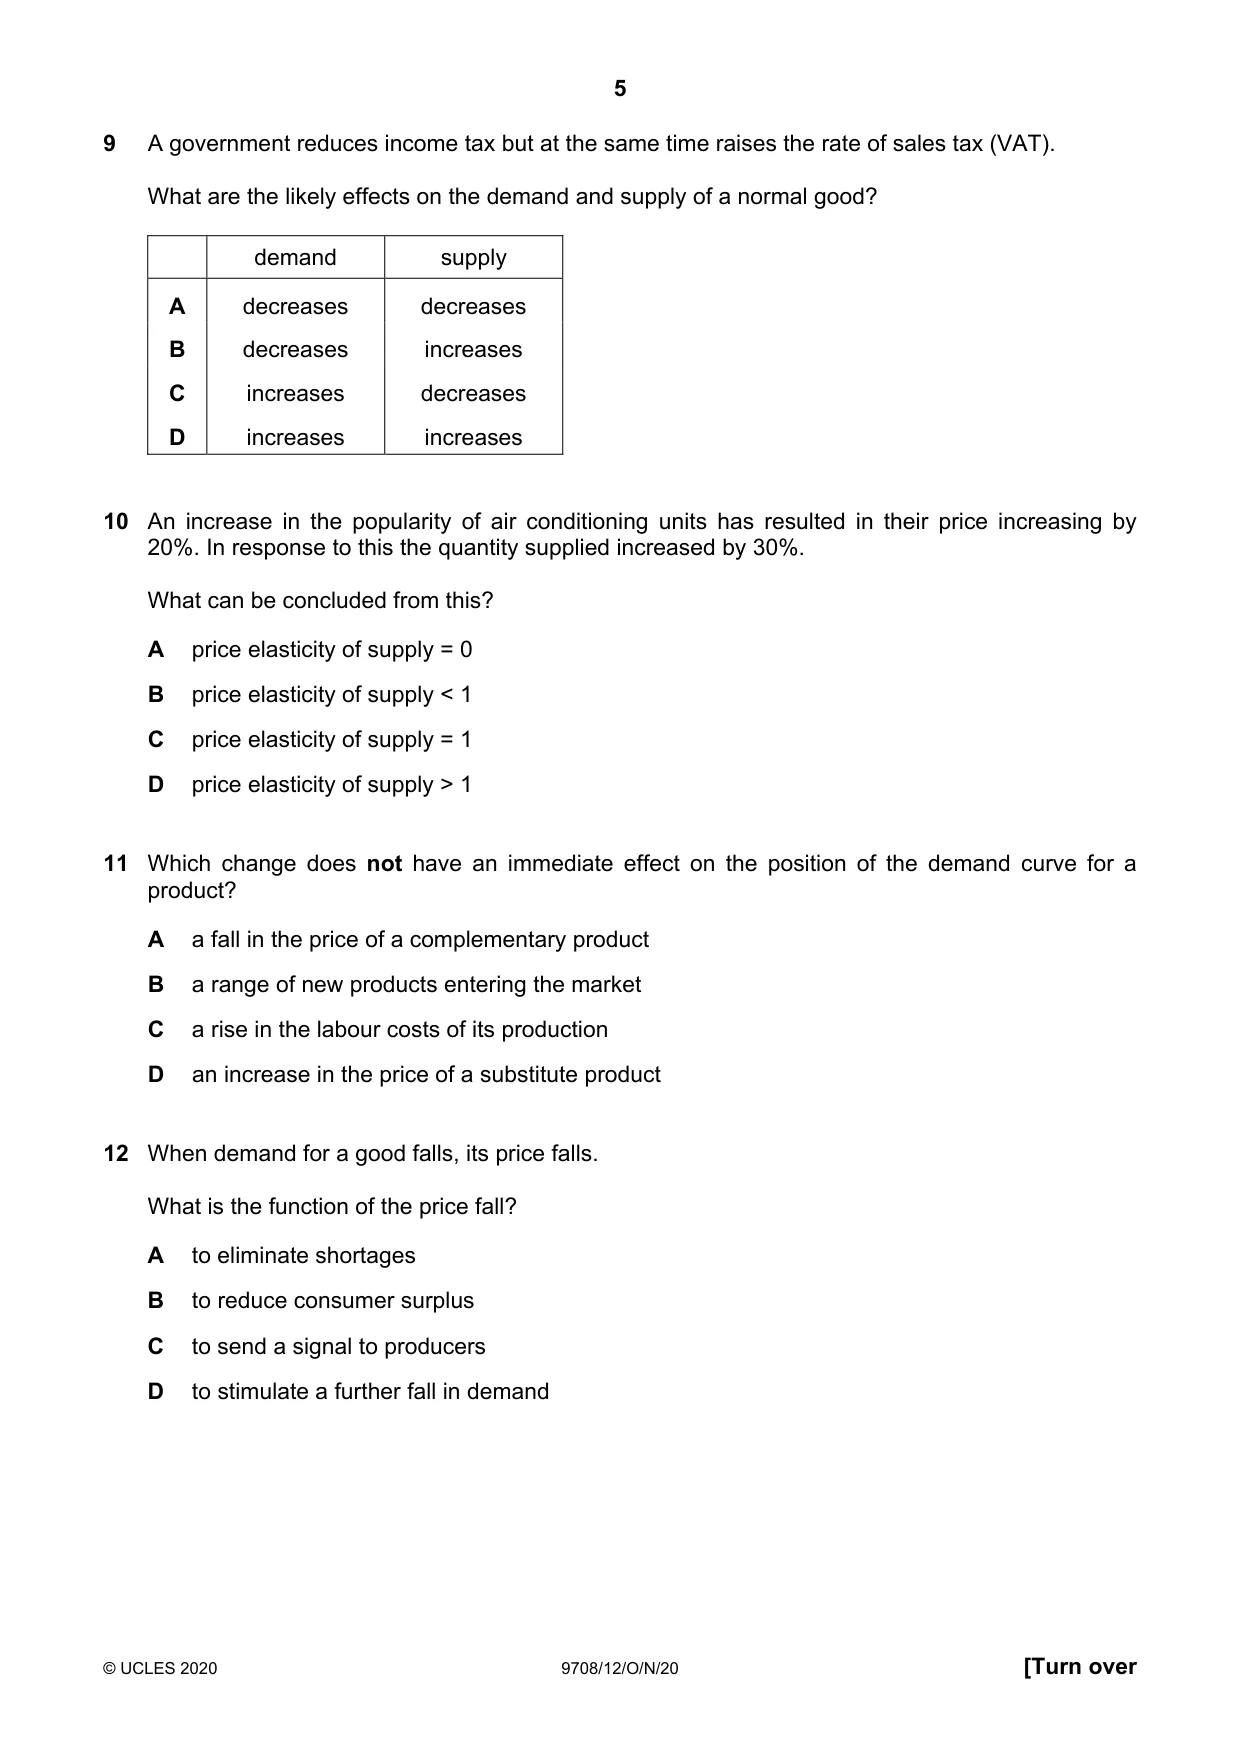
9 A government reduces income tax but at the same time raises the rate of sales tax (VAT). What are the likely effects on the demand and supply of a normal good? demand supply A decreases decreases B decreases increases C increases decreases D increases increases
Mark scheme: C
Q10 · An increase in the popularity of air conditioning units has resulted in their price…
10 An increase in the popularity of air conditioning units has resulted in their price increasing by 20%. In response to this the quantity supplied increased by 30%. What can be concluded from this? A price elasticity of supply = 0 B price elasticity of supply < 1 C price elasticity of supply = 1 D price elasticity of supply > 1
Mark scheme: D
Q11 · Which change does not have an immediate effect on the position of the demand curve for a…
11 Which change does not have an immediate effect on the position of the demand curve for a product? A a fall in the price of a complementary product B a range of new products entering the market C a rise in the labour costs of its production D an increase in the price of a substitute product
Mark scheme: C
Q12 · When demand for a good falls, its price falls
12 When demand for a good falls, its price falls. What is the function of the price fall? A to eliminate shortages B to reduce consumer surplus C to send a signal to producers D to stimulate a further fall in demand
Mark scheme: C
Q13 · A firm estimates that the price elasticity of supply of its product is 0.4
13 A firm estimates that the price elasticity of supply of its product is 0.4. Should the firm be concerned by this figure? A No, as it implies that the firm will be able to raise revenue by raising price. B No, as it suggests there are few substitutes for the product. C Yes, as it means that demand for its product is increasing at a slow rate. D Yes, as it shows that the firm is not able to adjust supply easily when demand changes.
Mark scheme: D
Q14 · A government decides to privatise a state-owned company
14 A government decides to privatise a state-owned company. What should the government do to try to ensure that this will result in an improvement in efficiency? A allocate vouchers to all citizens entitling them to a share in the ownership of the company B encourage competition C impose a maximum profit margin D increase business tax rates
Mark scheme: B
More questions on Reasons for government intervention in markets
Q15 · The graph shows an individual’s income before and after the deduction of income tax
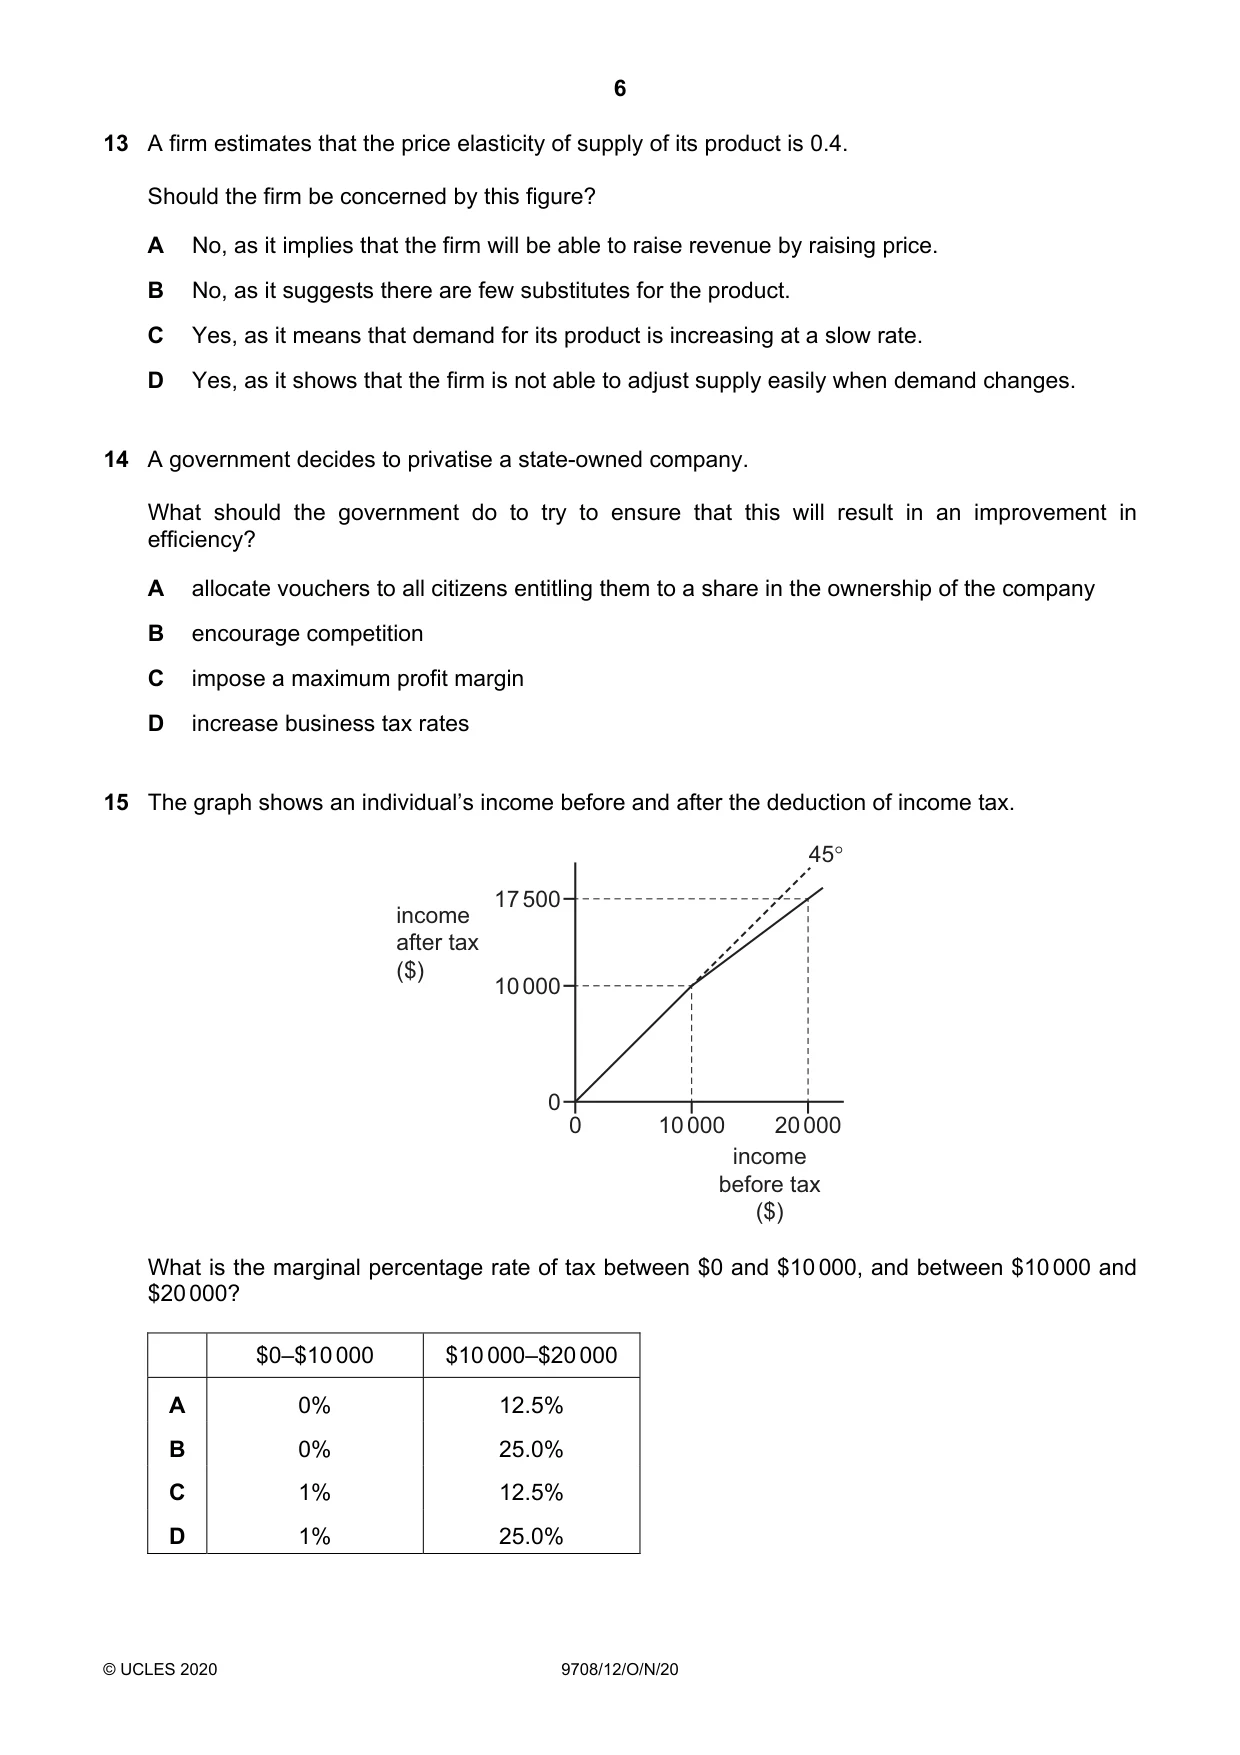
15 The graph shows an individual’s income before and after the deduction of income tax. 45° 17 500 income after tax ($) 10 000 0 0 10 000 20 000 income before tax ($) What is the marginal percentage rate of tax between $0 and $10 000, and between $10 000 and $20 000? $0–$10 000 $10 000–$20 000 A 0% 12.5% B 0% 25.0% C 1% 12.5% D 1% 25.0%
Mark scheme: B
Q16 · In year 1, in the market for a good represented in the diagram, the initial demand and…
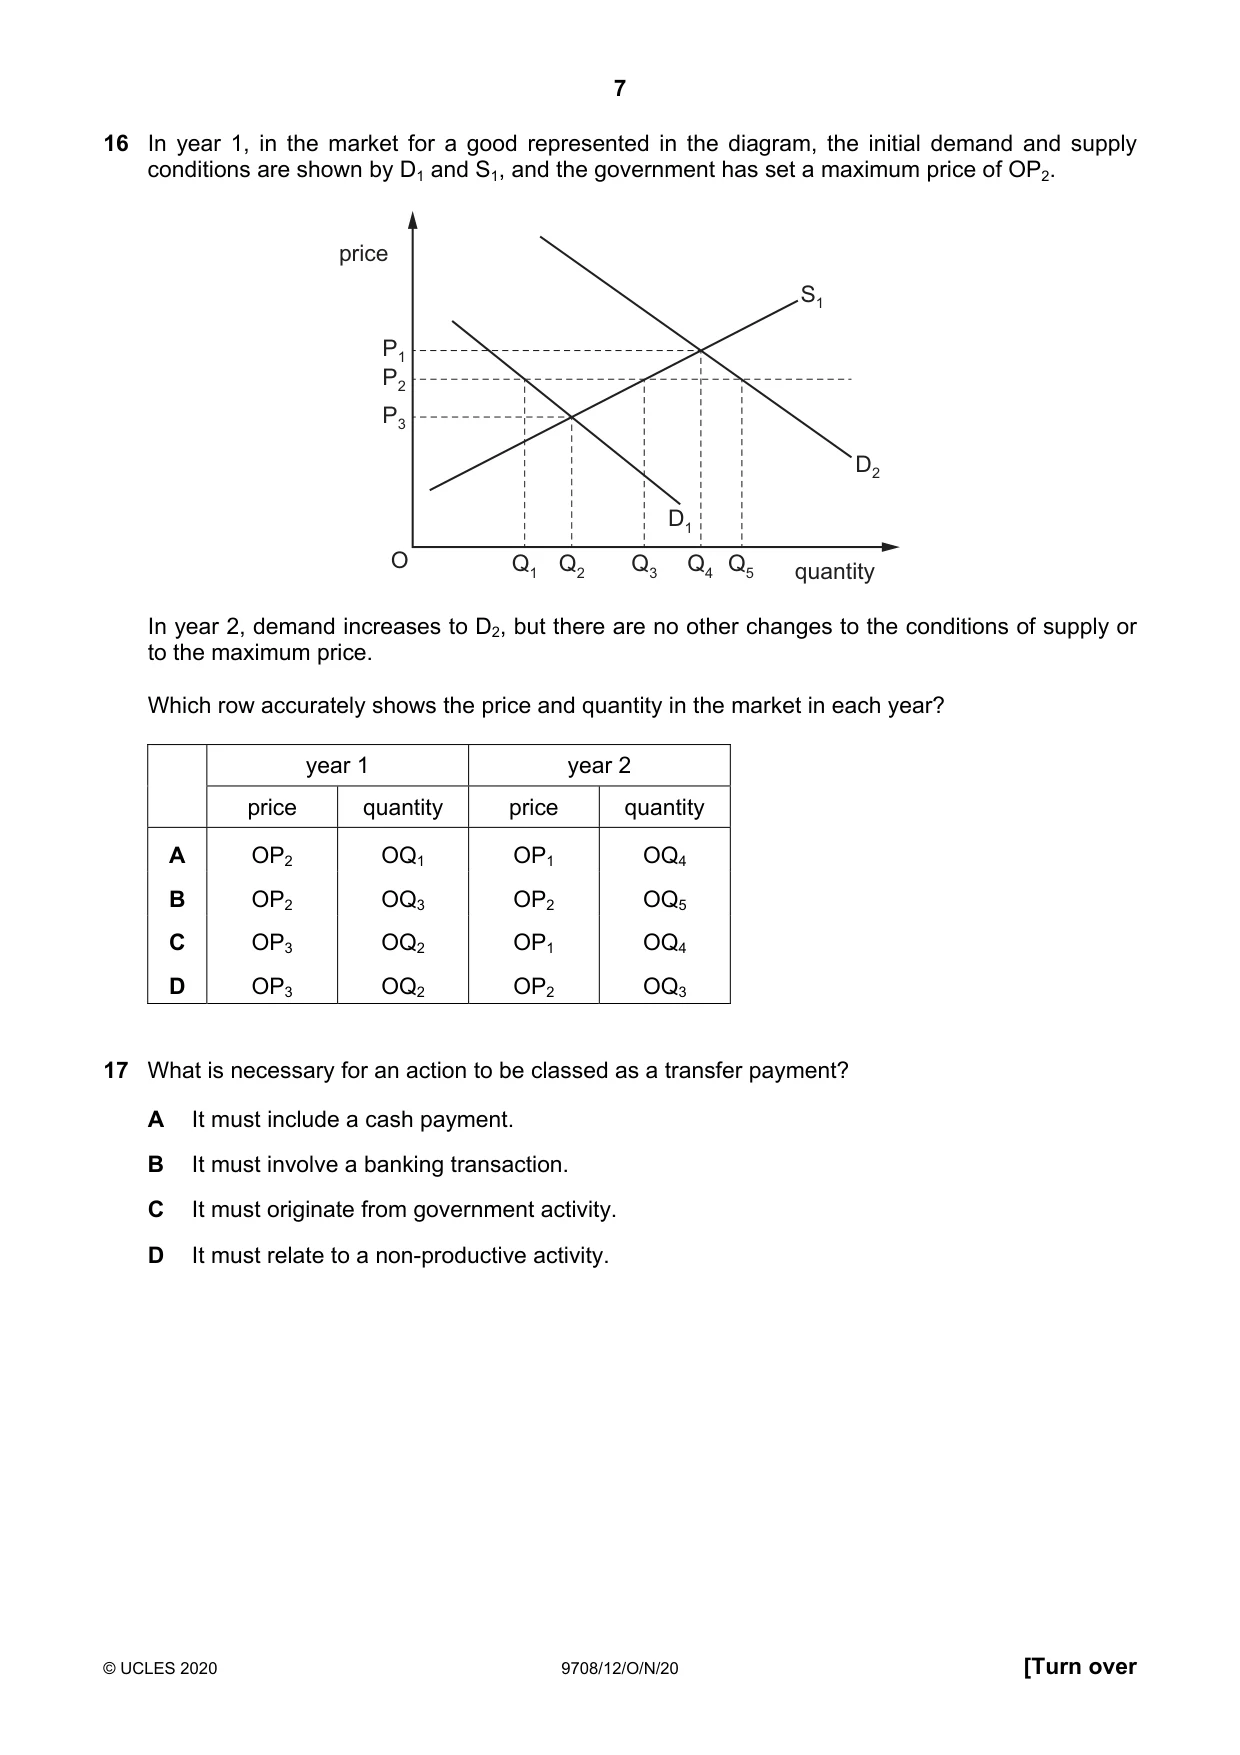
16 In year 1, in the market for a good represented in the diagram, the initial demand and supply conditions are shown by D1 and S1, and the government has set a maximum price of OP2. price S1 P1 P2 P3 D2 D1 O Q1 Q2 Q3 Q4 Q5 quantity In year 2, demand increases to D2, but there are no other changes to the conditions of supply or to the maximum price. Which row accurately shows the price and quantity in the market in each year? year 1 year 2 price quantity price quantity A OP2 OQ1 OP1 OQ4 B OP2 OQ3 OP2 OQ5 C OP3 OQ2 OP1 OQ4 D OP3 OQ2 OP2 OQ3
Mark scheme: D
More questions on Methods and effects of government intervention in markets
Q17 · What is necessary for an action to be classed as a transfer payment?
17 What is necessary for an action to be classed as a transfer payment? A It must include a cash payment. B It must involve a banking transaction. C It must originate from government activity. D It must relate to a non-productive activity.
Mark scheme: D
Q18 · The market for good X is in equilibrium
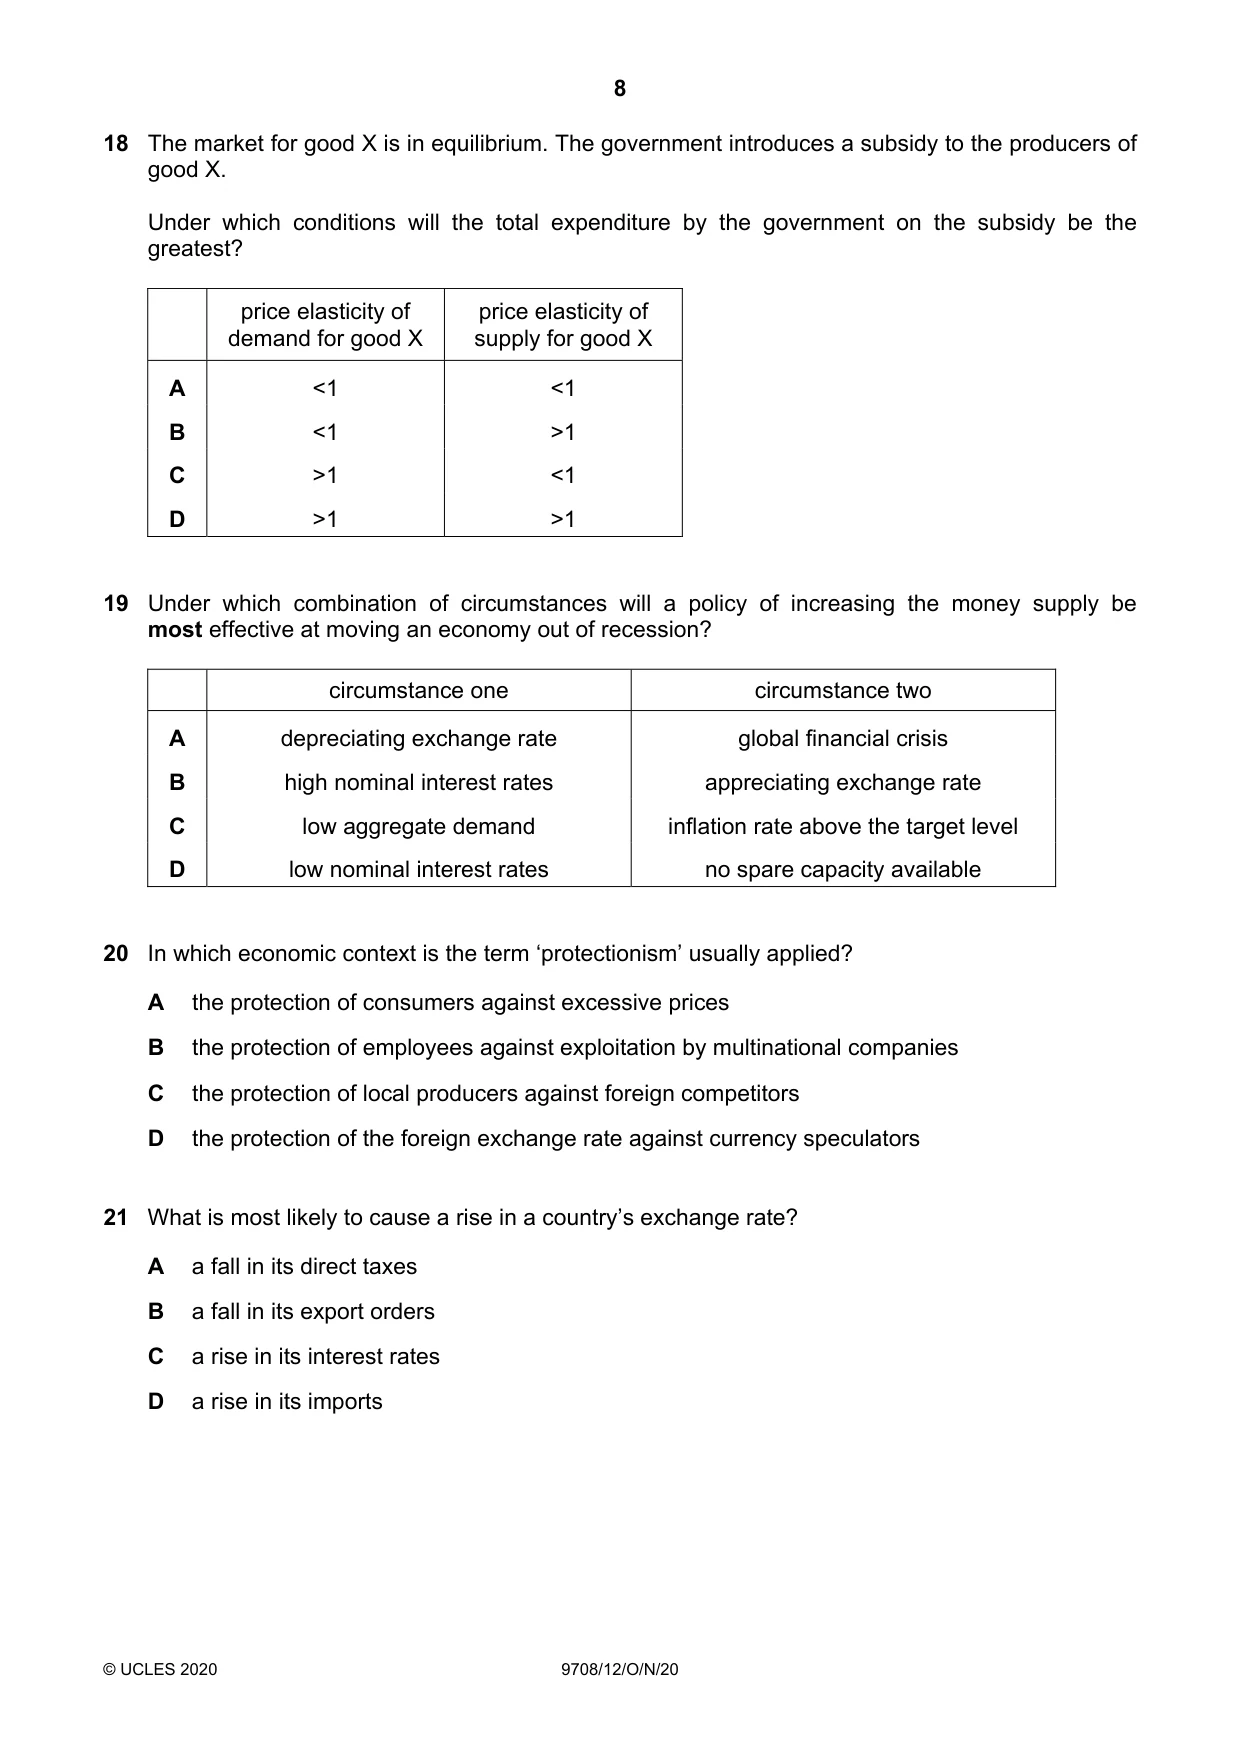
18 The market for good X is in equilibrium. The government introduces a subsidy to the producers of good X. Under which conditions will the total expenditure by the government on the subsidy be the greatest? price elasticity of price elasticity of demand for good X supply for good X A <1 <1 B <1 >1 C >1 <1 D >1 >1
Mark scheme: D
More questions on Methods and effects of government intervention in markets
Q19 · Under which combination of circumstances will a policy of increasing the money supply be…
19 Under which combination of circumstances will a policy of increasing the money supply be most effective at moving an economy out of recession? circumstance one circumstance two A depreciating exchange rate global financial crisis B high nominal interest rates appreciating exchange rate C low aggregate demand inflation rate above the target level D low nominal interest rates no spare capacity available
Mark scheme: B
Q20 · In which economic context is the term ‘protectionism’ usually applied?
20 In which economic context is the term ‘protectionism’ usually applied? A the protection of consumers against excessive prices B the protection of employees against exploitation by multinational companies C the protection of local producers against foreign competitors D the protection of the foreign exchange rate against currency speculators
Mark scheme: C
Q21 · What is most likely to cause a rise in a country’s exchange rate?
21 What is most likely to cause a rise in a country’s exchange rate? A a fall in its direct taxes B a fall in its export orders C a rise in its interest rates D a rise in its imports
Mark scheme: C
Q22 · The table shows an approximate summary of the current account of the balance of payments…
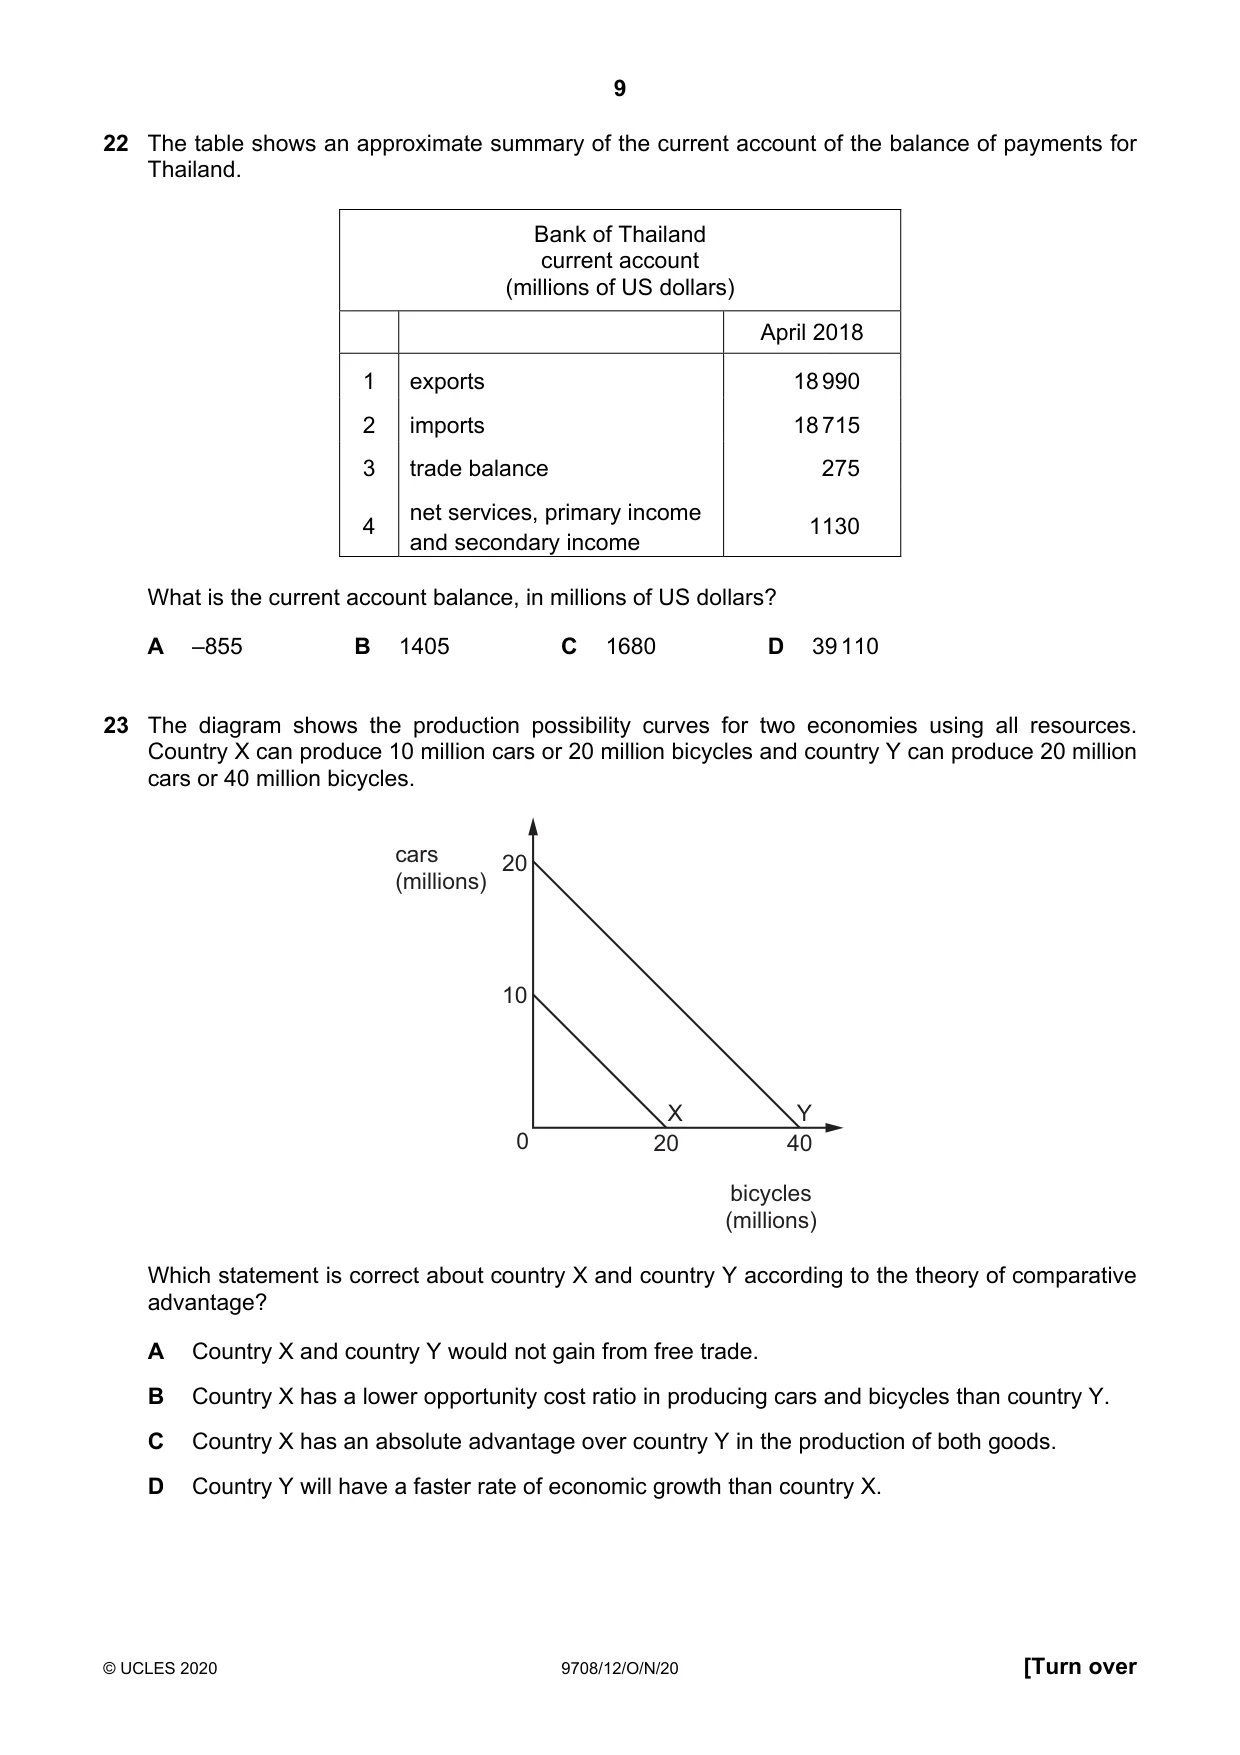
22 The table shows an approximate summary of the current account of the balance of payments for Thailand. Bank of Thailand current account (millions of US dollars) April 2018 1 exports 18 990 2 imports 18 715 3 trade balance 275 net services, primary income 4 1130 and secondary income What is the current account balance, in millions of US dollars? A –855 B 1405 C 1680 D 39 110
Mark scheme: B
More questions on Current account of the balance of payments
Q23 · The diagram shows the production possibility curves for two economies using all resources
23 The diagram shows the production possibility curves for two economies using all resources. Country X can produce 10 million cars or 20 million bicycles and country Y can produce 20 million cars or 40 million bicycles. cars 20 (millions) 10 X Y 0 20 40 bicycles (millions) Which statement is correct about country X and country Y according to the theory of comparative advantage? A Country X and country Y would not gain from free trade. B Country X has a lower opportunity cost ratio in producing cars and bicycles than country Y. C Country X has an absolute advantage over country Y in the production of both goods. D Country Y will have a faster rate of economic growth than country X.
Mark scheme: A
Q24 · A country has a balance of payments deficit
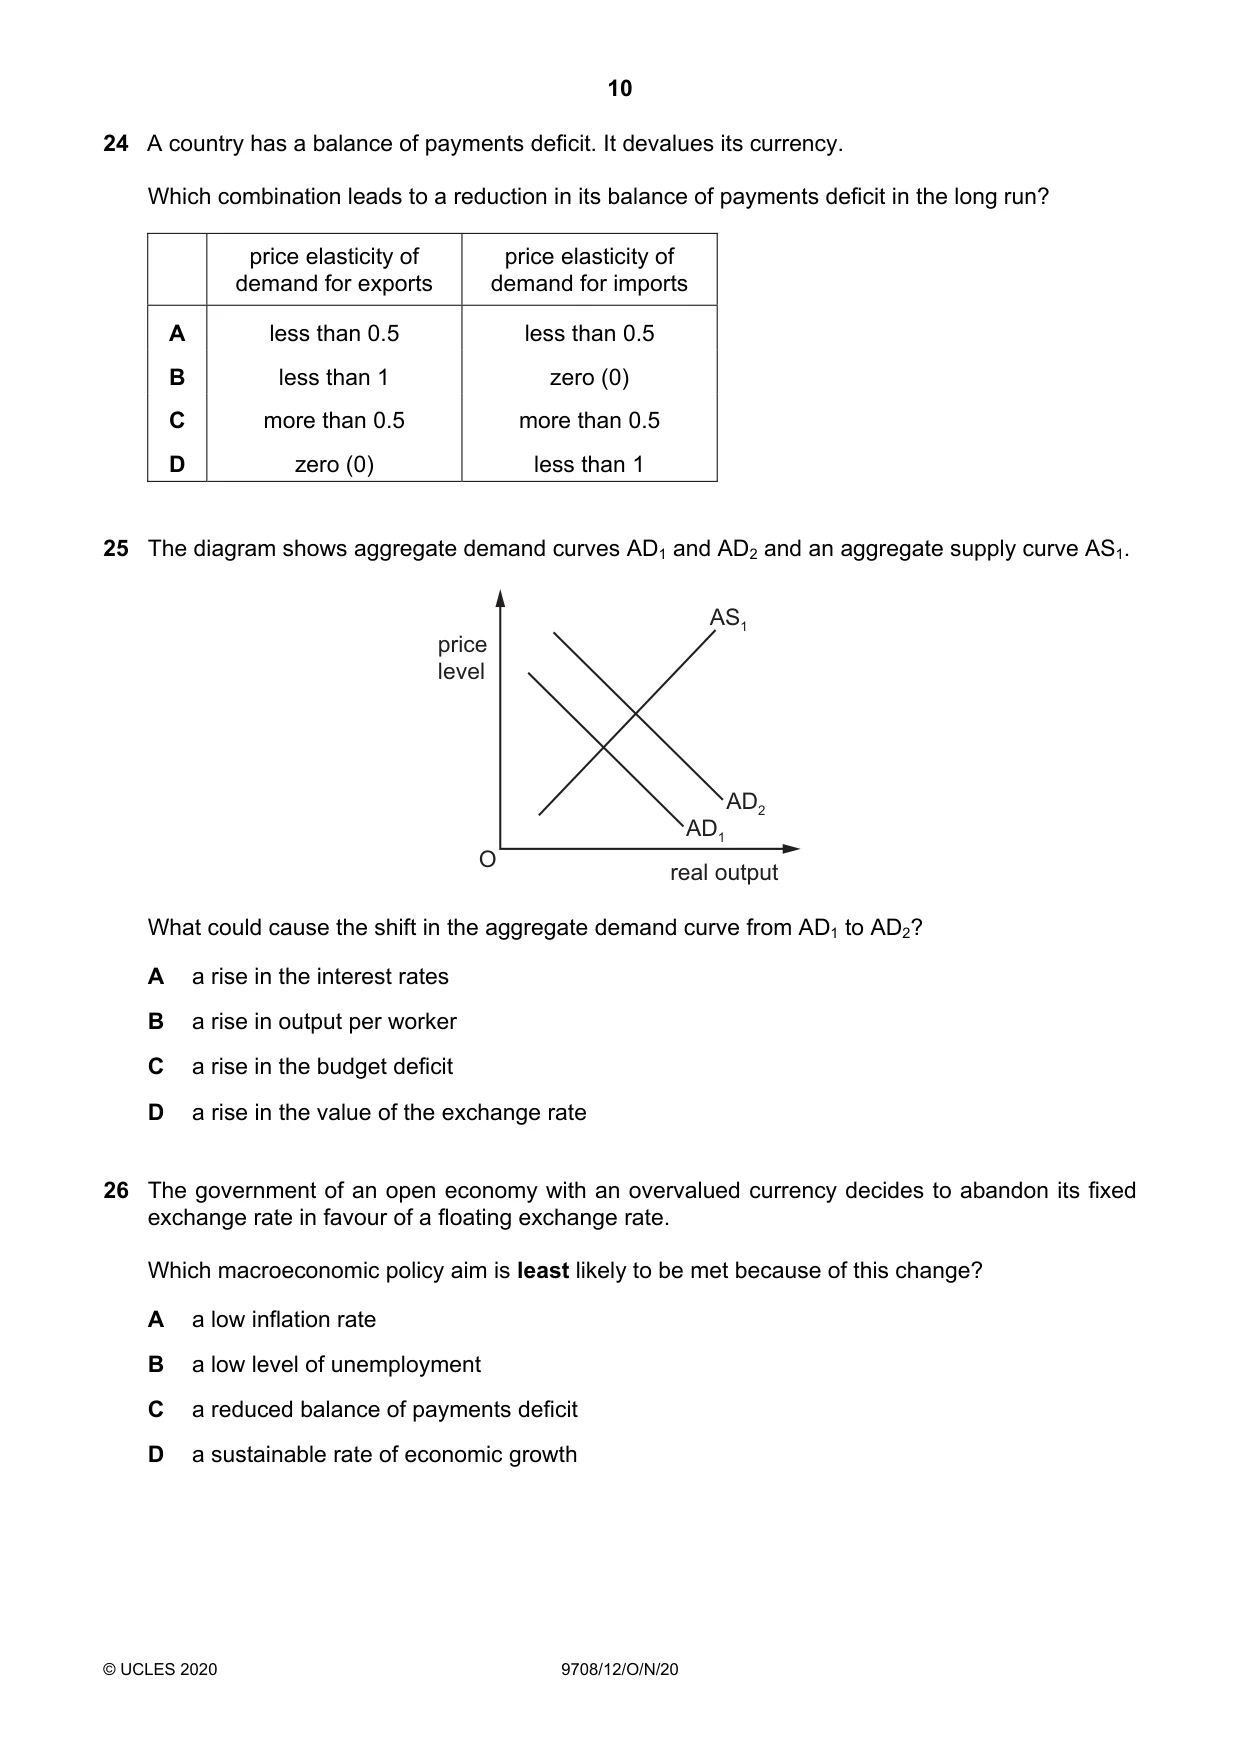
24 A country has a balance of payments deficit. It devalues its currency. Which combination leads to a reduction in its balance of payments deficit in the long run? price elasticity of price elasticity of demand for exports demand for imports A less than 0.5 less than 0.5 B less than 1 zero (0) C more than 0.5 more than 0.5 D zero (0) less than 1
Mark scheme: C
More questions on Policies to correct imbalances in the current account of the balance of payments
Q25 · The diagram shows aggregate demand curves AD1 and AD2 and an aggregate supply curve AS1
25 The diagram shows aggregate demand curves AD1 and AD2 and an aggregate supply curve AS1. AS1 price level AD2 AD1 O real output What could cause the shift in the aggregate demand curve from AD1 to AD2? A a rise in the interest rates B a rise in output per worker C a rise in the budget deficit D a rise in the value of the exchange rate
Mark scheme: B
More questions on Aggregate Demand and Aggregate Supply analysis
Q26 · The government of an open economy with an overvalued currency decides to abandon its…
26 The government of an open economy with an overvalued currency decides to abandon its fixed exchange rate in favour of a floating exchange rate. Which macroeconomic policy aim is least likely to be met because of this change? A a low inflation rate B a low level of unemployment C a reduced balance of payments deficit D a sustainable rate of economic growth
Mark scheme: A
Q27 · Devaluation always has the effect of A decreasing the price of imports
27 Devaluation always has the effect of A decreasing the price of imports. B decreasing the value of imports. C worsening the balance of payments. D worsening the terms of trade.
Mark scheme: D
Q28 · A government uses monetary policy and fiscal policy to solve a problem of deflation
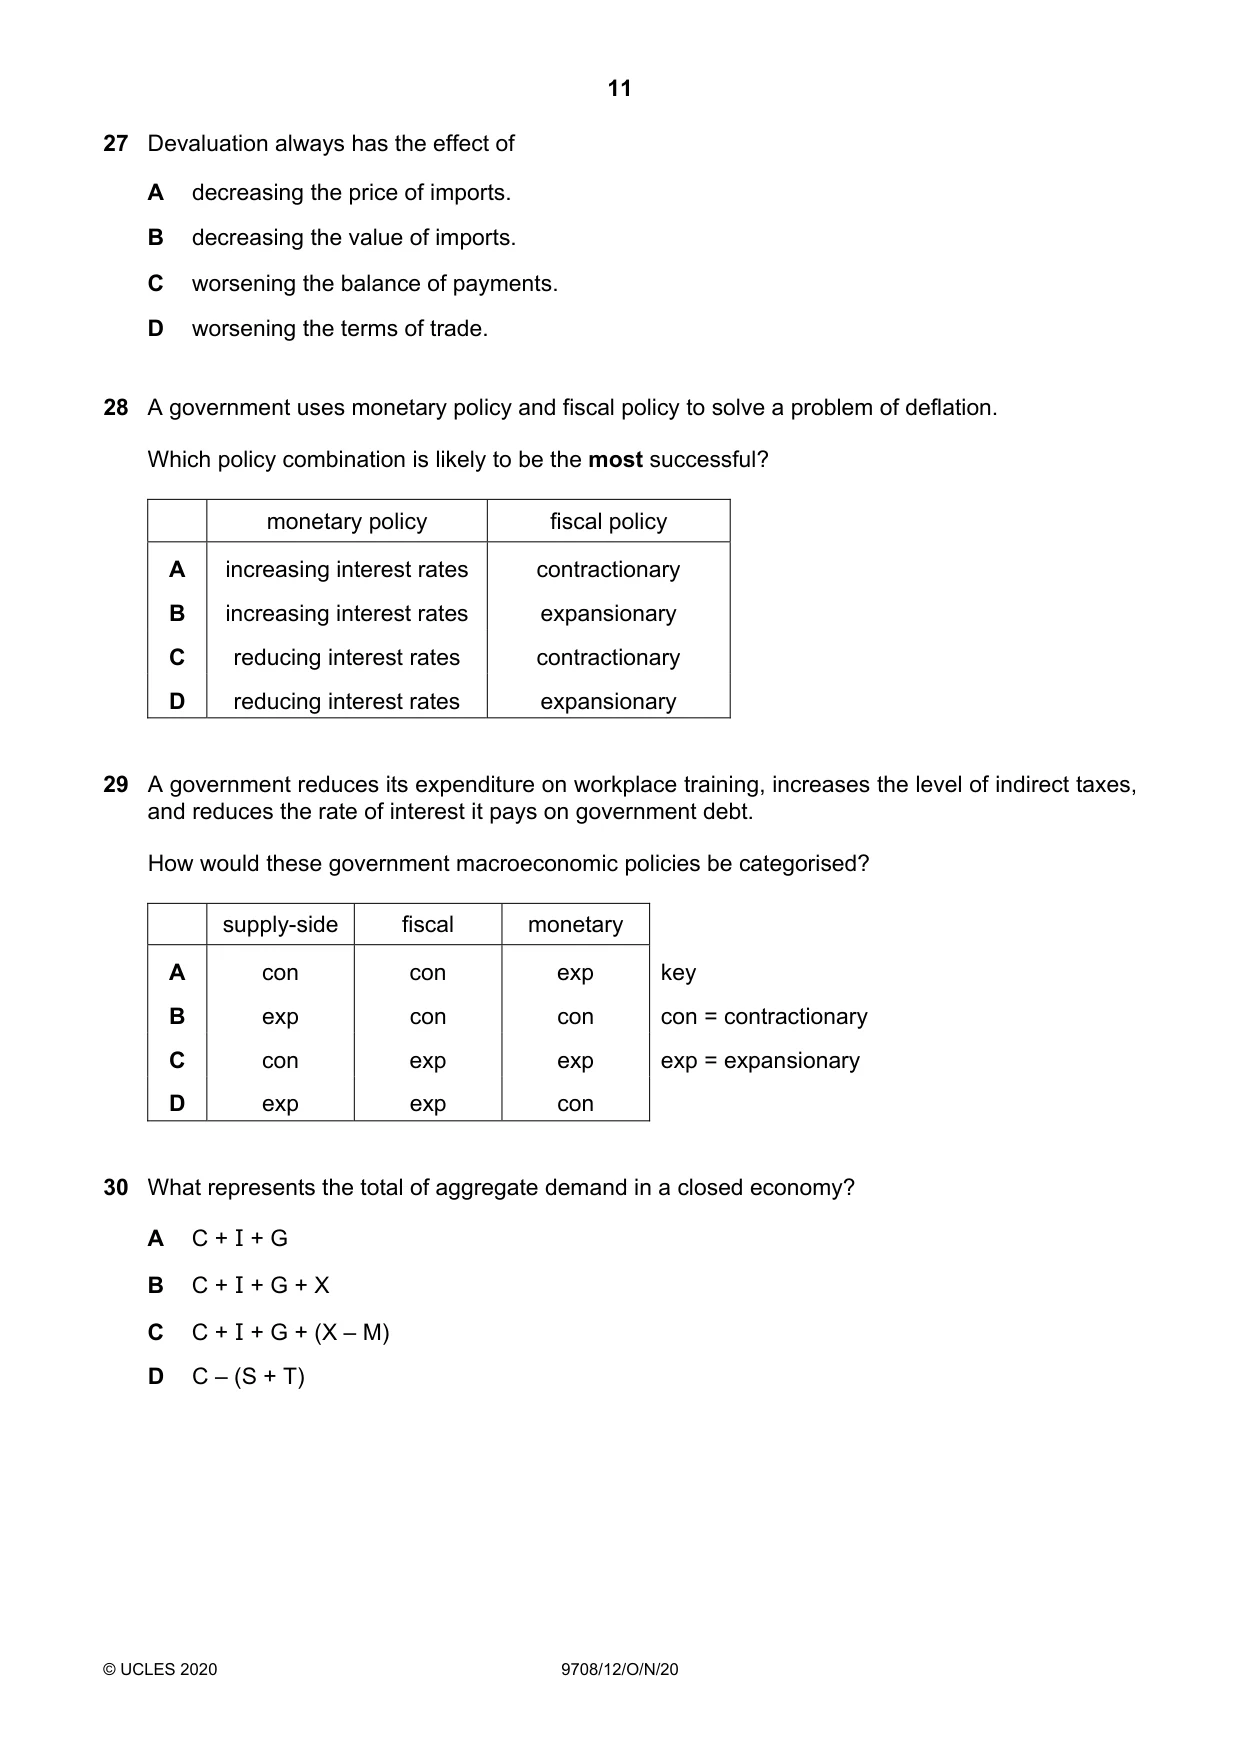
28 A government uses monetary policy and fiscal policy to solve a problem of deflation. Which policy combination is likely to be the most successful? monetary policy fiscal policy A increasing interest rates contractionary B increasing interest rates expansionary C reducing interest rates contractionary D reducing interest rates expansionary
Mark scheme: D
Q29 · A government reduces its expenditure on workplace training, increases the level of…
29 A government reduces its expenditure on workplace training, increases the level of indirect taxes, and reduces the rate of interest it pays on government debt. How would these government macroeconomic policies be categorised? supply-side fiscal monetary A con con exp key B exp con con con = contractionary C con exp exp exp = expansionary D exp exp con
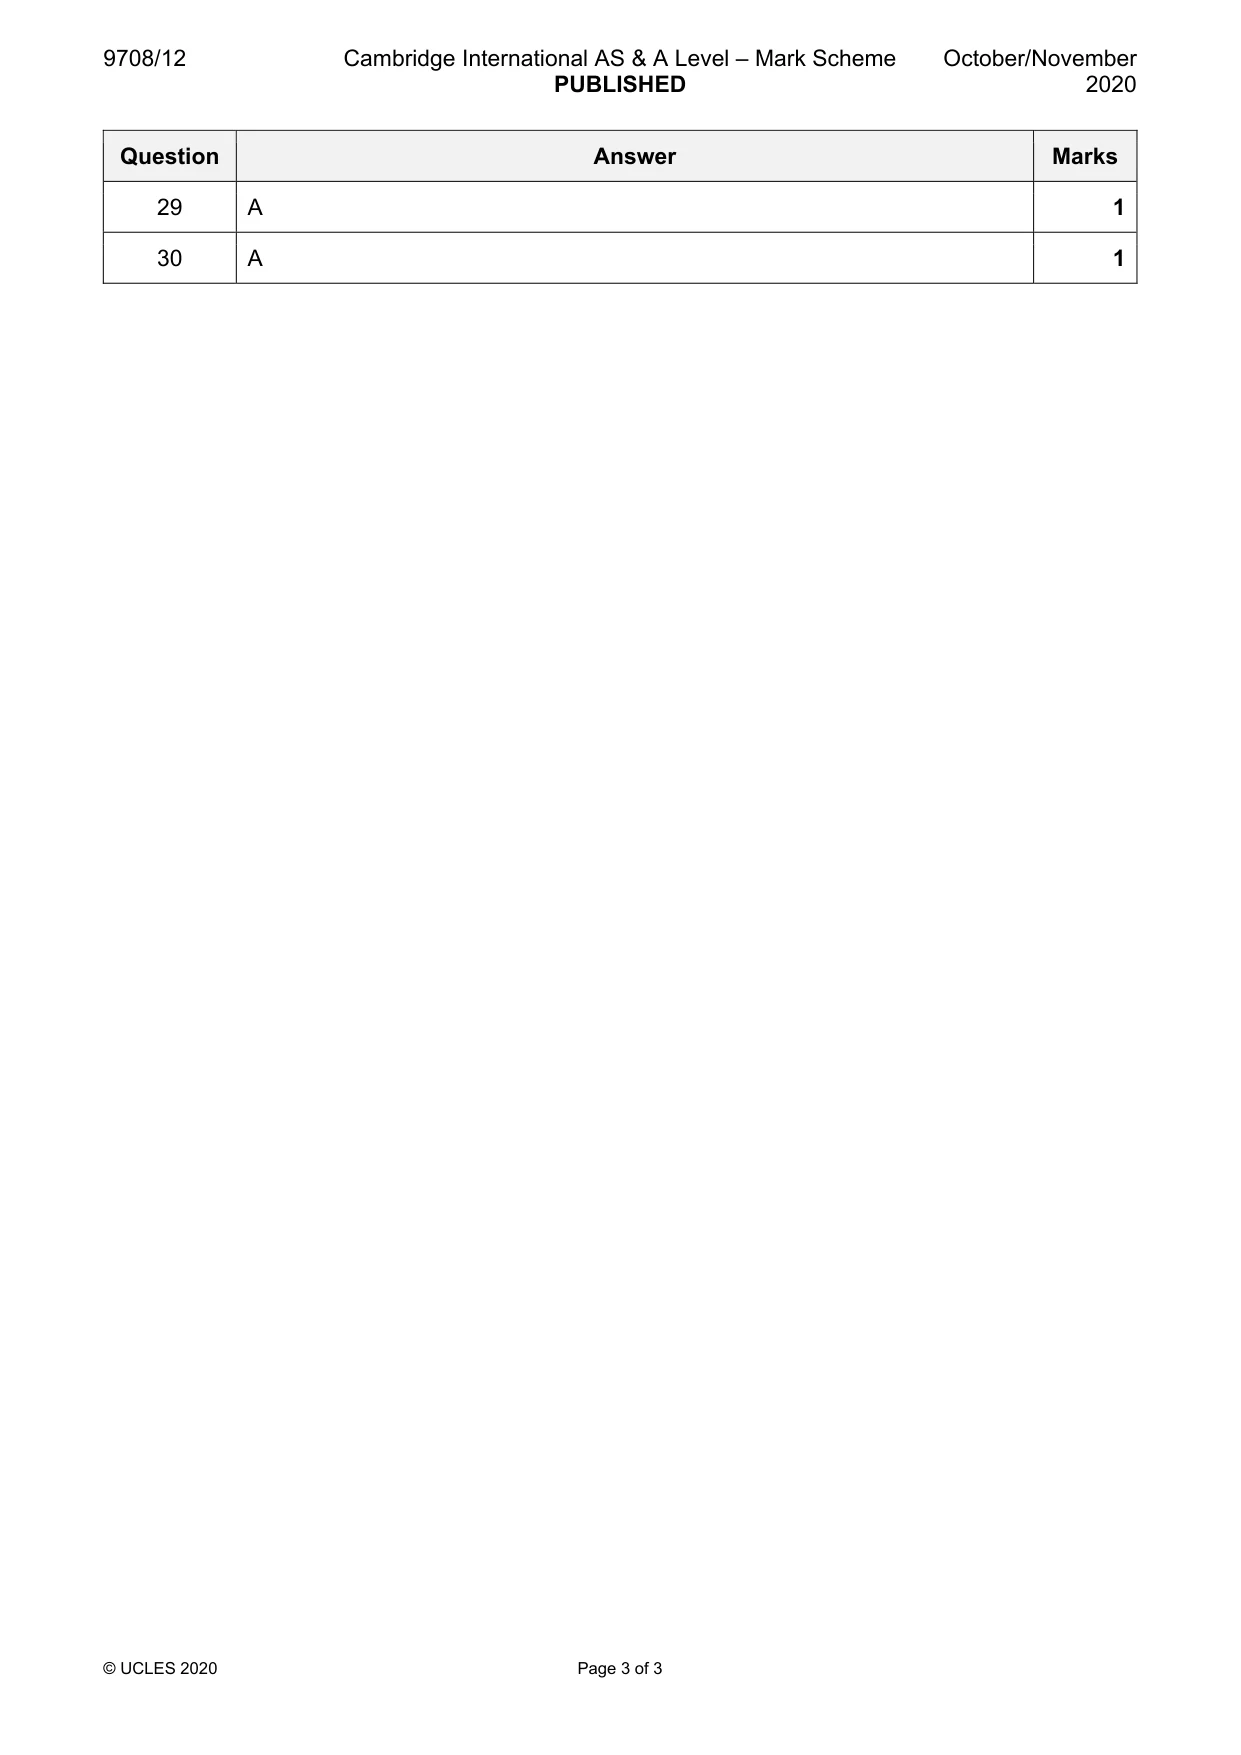
Mark scheme: A
Q30 · What represents the total of aggregate demand in a closed economy?
30 What represents the total of aggregate demand in a closed economy? A C + I + G B C + I + G + X C C + I + G + (X – M) D C – (S + T)
Mark scheme: A
More questions on Aggregate Demand and Aggregate Supply analysis
What was in this paper
The subtopics covered by these 30 questions, and how many questions each got. Open one in a new tab to see every Cambridge question on it.
3Addressing income and wealth inequality2Aggregate Demand and Aggregate Supply analysis2Exchange rates2Fiscal policy2Methods and effects of government intervention in markets2Price elasticity of supply2Price elasticity, income elasticity and cross elasticity of demand2Classification of goods and services1Consumer and producer surplus1Current account of the balance of payments1Demand and supply curves1Economic methodology1Monetary policy1Money and banking1Policies to correct imbalances in the current account of the balance of payments1Price stability1Production possibility curves1Protectionism1Reasons for government intervention in markets1The reasons for international trade1What you needed in this session
Cambridge’s own grade thresholds for 2020 Oct/Nov, Paper 1 · Variant 2. A higher threshold means an easier paper — the bar moves with how the cohort did.