Cambridge A Level Economics 9708 — 2016 May/June Paper 1 · Variant 1
9708/11/M/J/16 · 30 questions · 30 marks · ≈34 min
The question paper and its mark scheme, free to read here and free to download. This is Cambridge’s own paper, exactly as it was sat.
Question paper16 pages
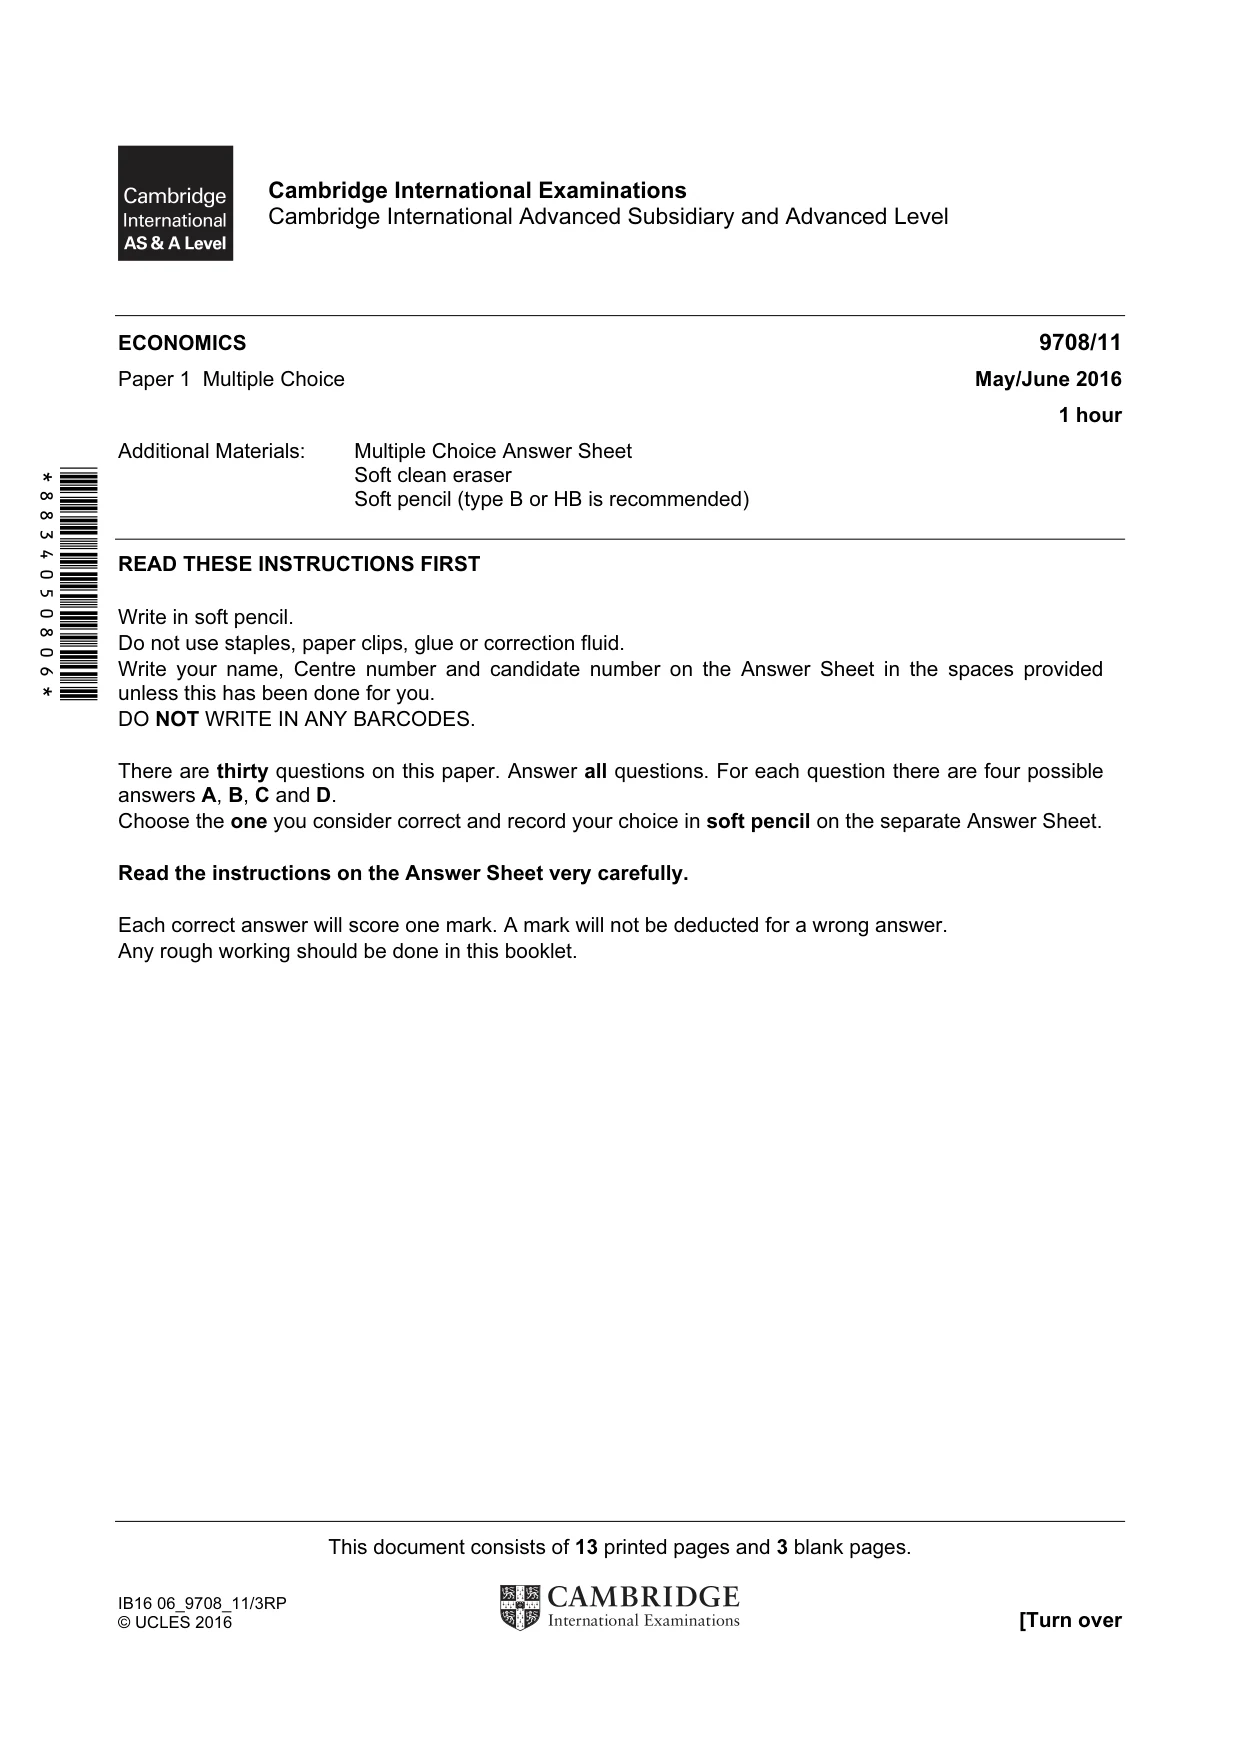


Mark scheme2 pages
Answers below. Sit the paper first if you are practising.
Questions as text
Q1 · A driver makes the following estimates in considering the purchase of a car which she…
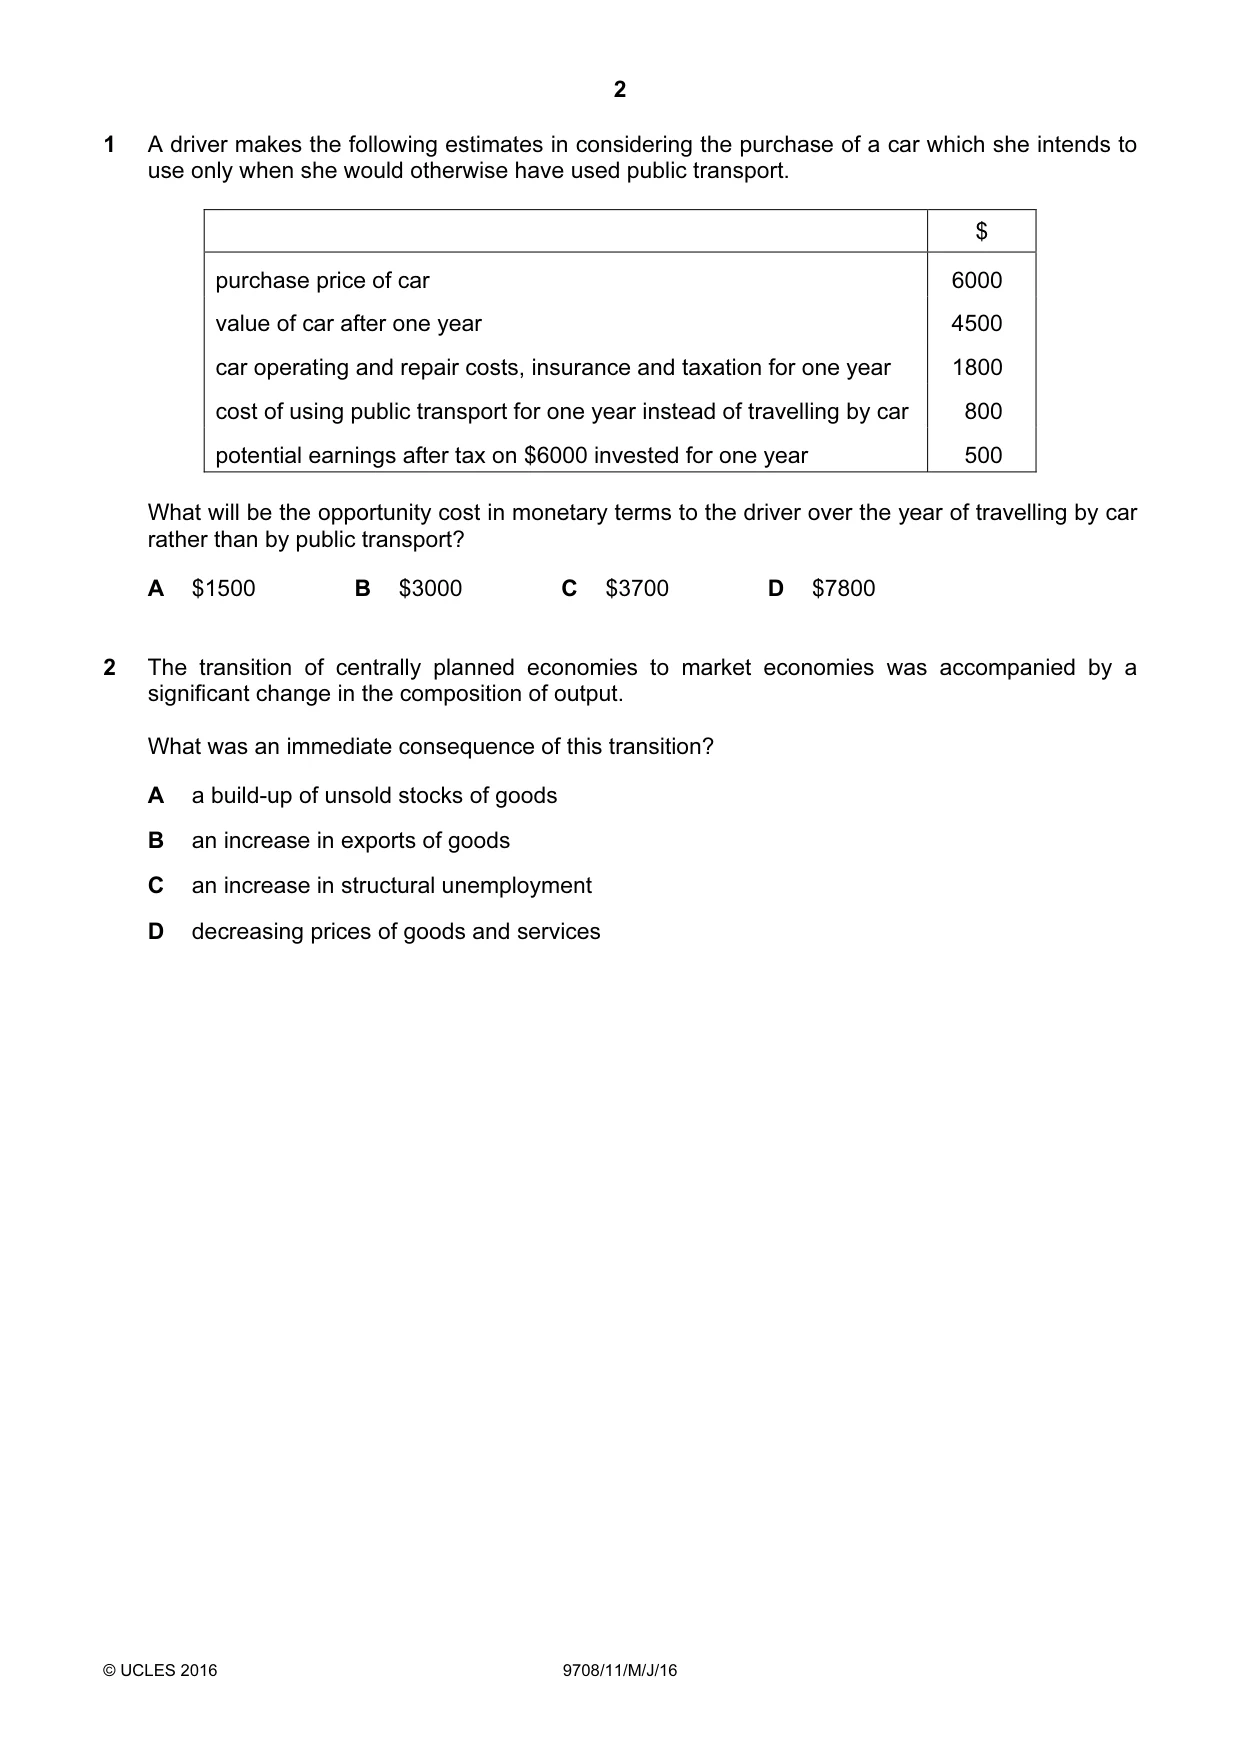
1 A driver makes the following estimates in considering the purchase of a car which she intends to use only when she would otherwise have used public transport. $ purchase price of car 6000 value of car after one year 4500 car operating and repair costs, insurance and taxation for one year 1800 cost of using public transport for one year instead of travelling by car 800 potential earnings after tax on $6000 invested for one year 500 What will be the opportunity cost in monetary terms to the driver over the year of travelling by car rather than by public transport? A $1500 B $3000 C $3700 D $7800
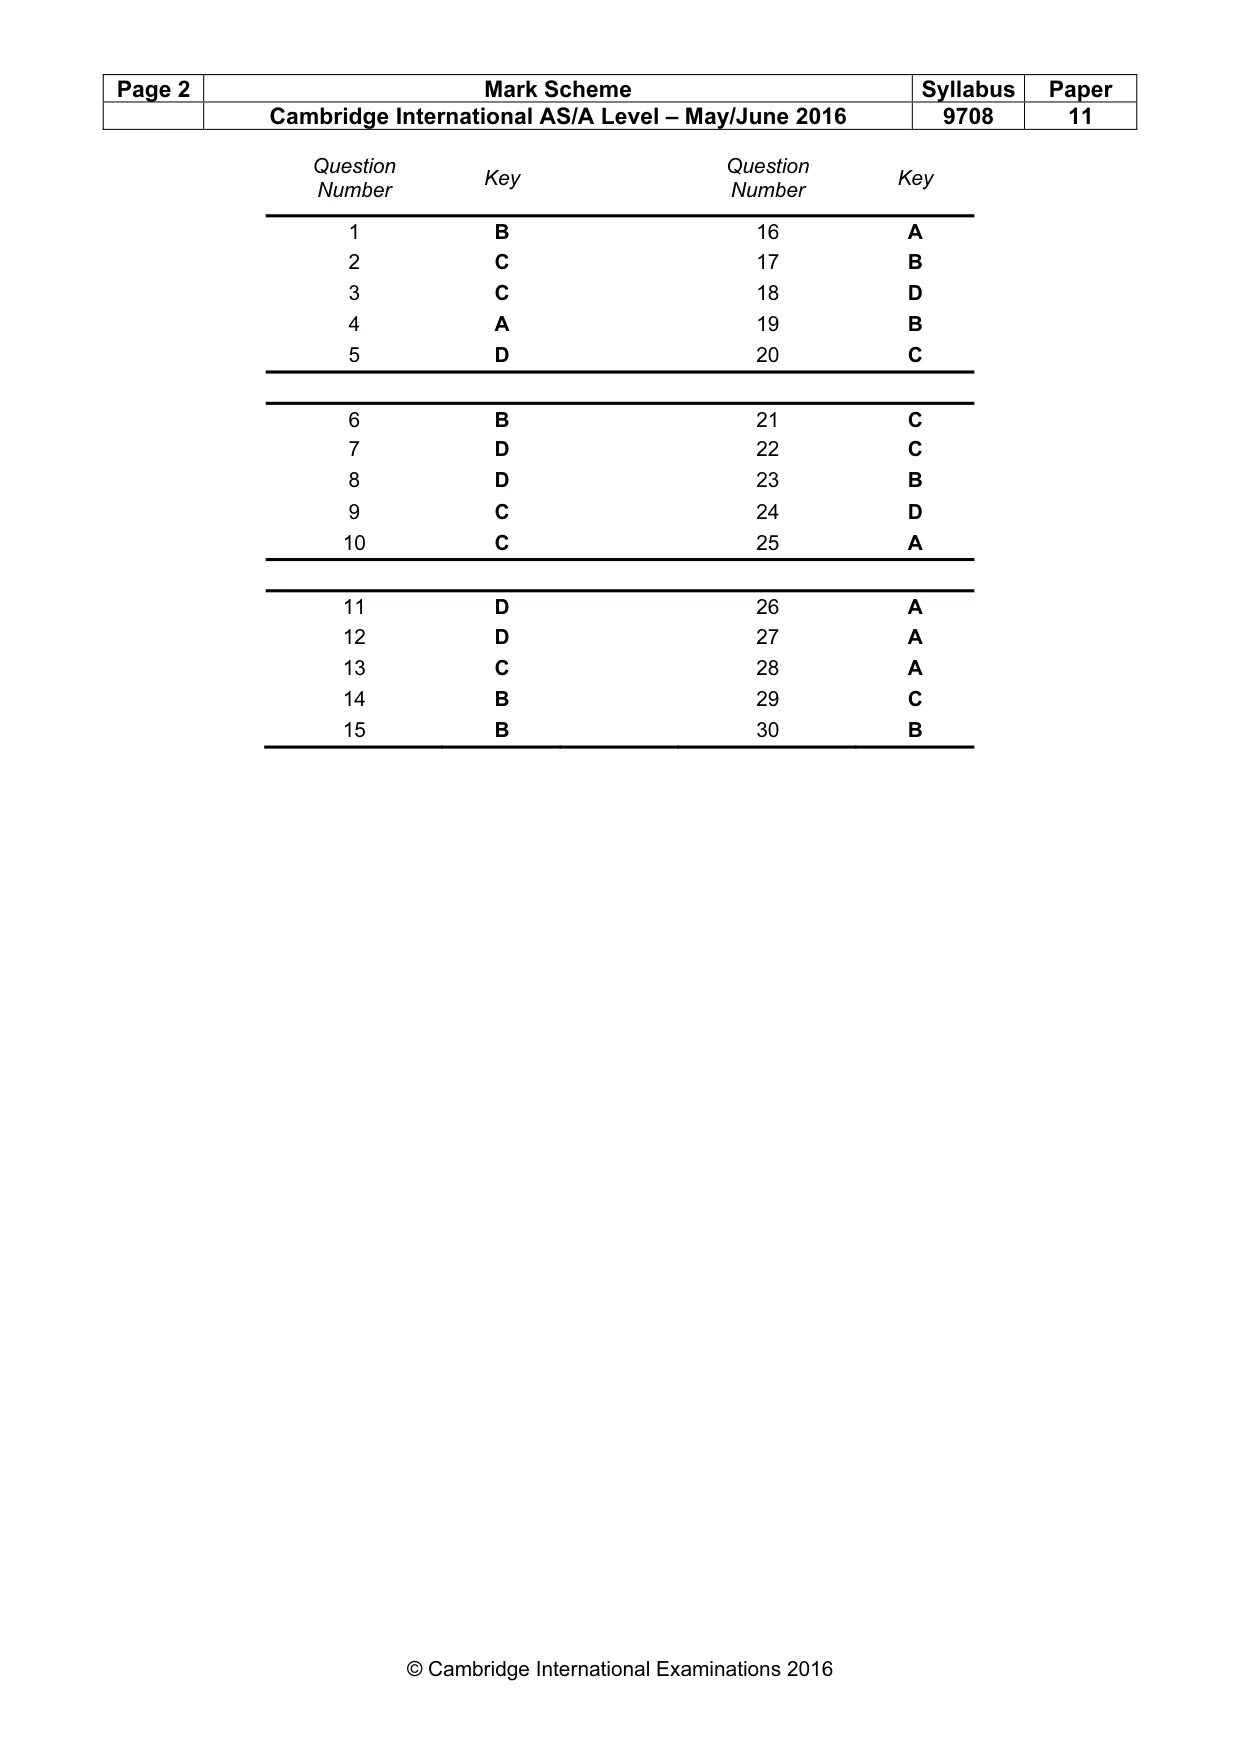
Mark scheme: B
Q2 · The transition of centrally planned economies to market economies was accompanied by a…
2 The transition of centrally planned economies to market economies was accompanied by a significant change in the composition of output. What was an immediate consequence of this transition? A a build-up of unsold stocks of goods B an increase in exports of goods C an increase in structural unemployment D decreasing prices of goods and services
Mark scheme: C
More questions on Resource allocation in different economic systems
Q3 · The diagram shows the production possibility curves of two economies, X and Y
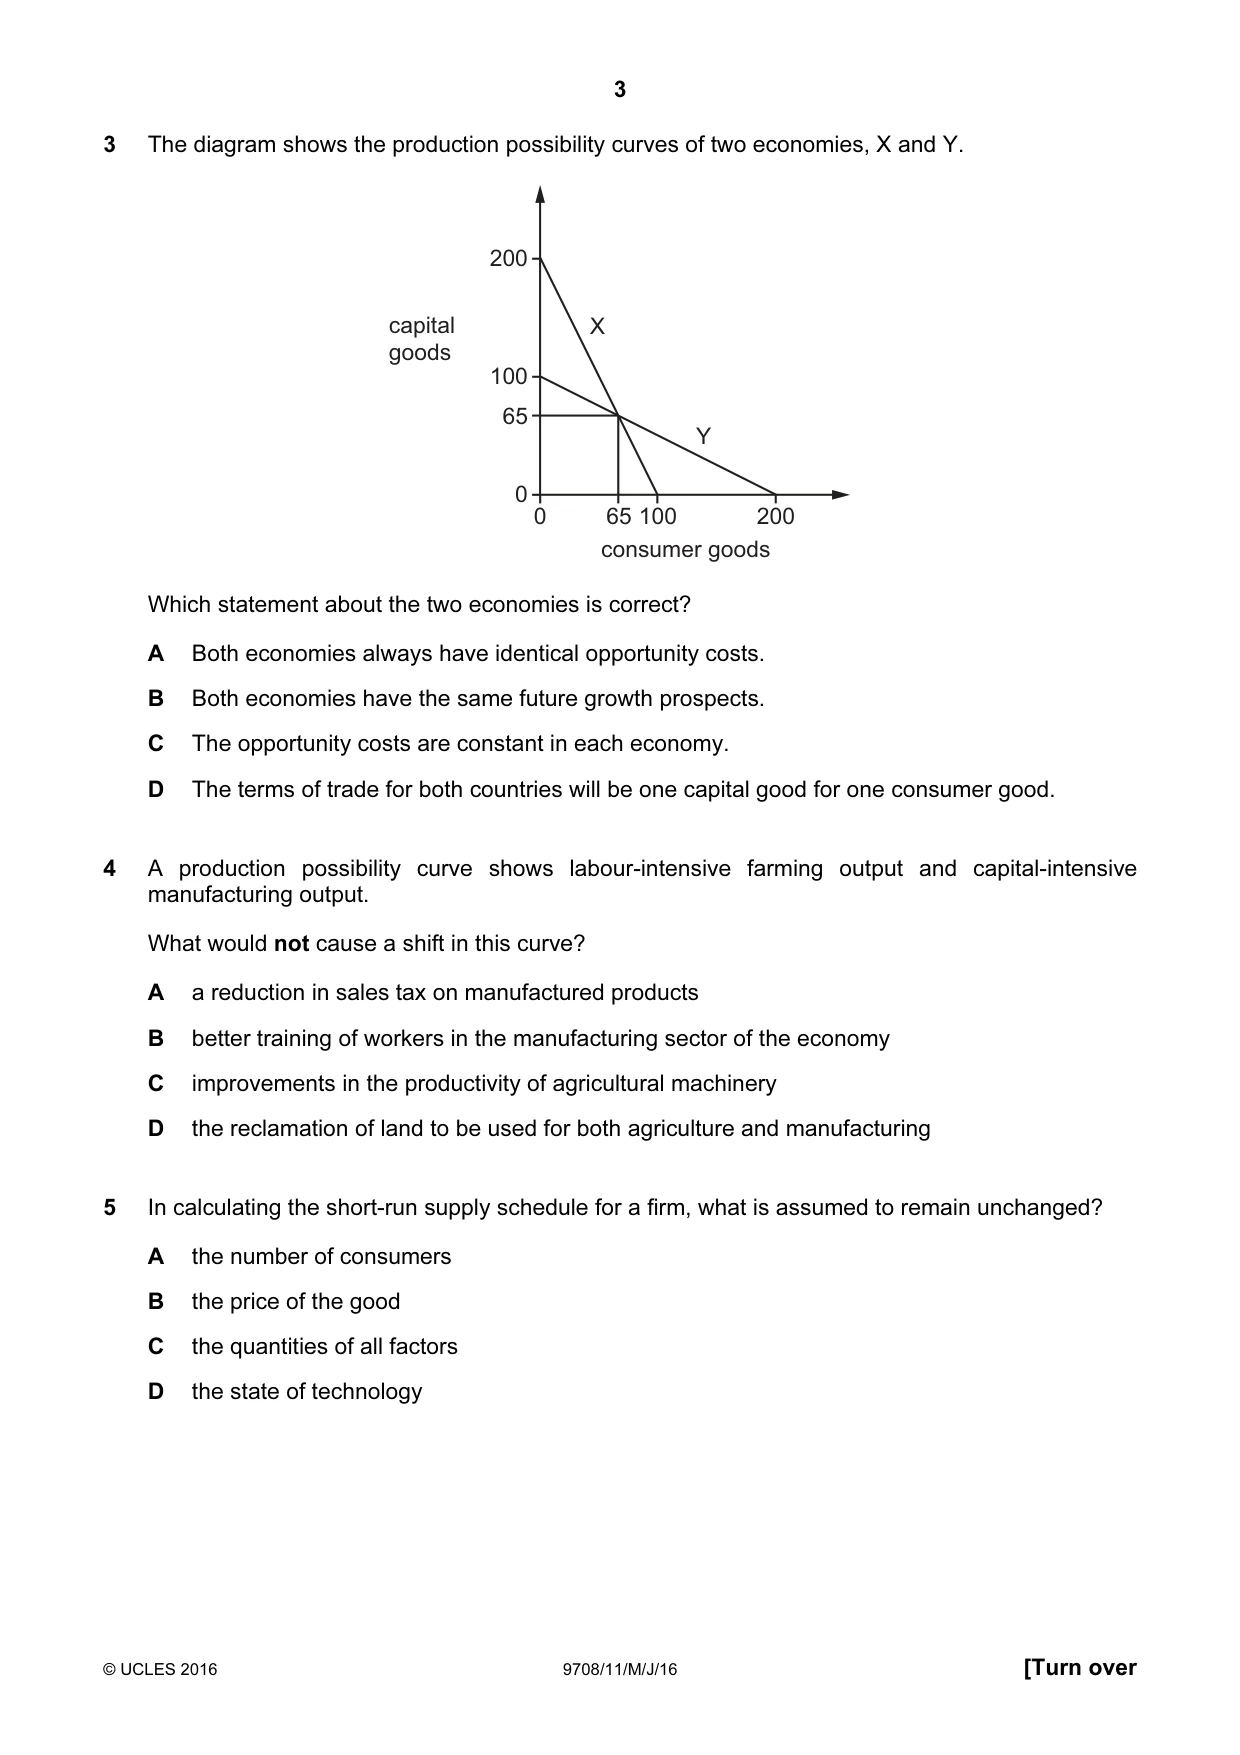
3 The diagram shows the production possibility curves of two economies, X and Y. 200 capital X goods 100 65 Y 0 0 65 100 200 consumer goods Which statement about the two economies is correct? A Both economies always have identical opportunity costs. B Both economies have the same future growth prospects. C The opportunity costs are constant in each economy. D The terms of trade for both countries will be one capital good for one consumer good.
Mark scheme: C
Q4 · A production possibility curve shows labour-intensive farming output and…
4 A production possibility curve shows labour-intensive farming output and capital-intensive manufacturing output. What would not cause a shift in this curve? A a reduction in sales tax on manufactured products B better training of workers in the manufacturing sector of the economy C improvements in the productivity of agricultural machinery D the reclamation of land to be used for both agriculture and manufacturing
Mark scheme: A
Q5 · In calculating the short-run supply schedule for a firm, what is assumed to remain…
5 In calculating the short-run supply schedule for a firm, what is assumed to remain unchanged? A the number of consumers B the price of the good C the quantities of all factors D the state of technology
Mark scheme: D
Q6 · There are two main types of coffee grown, arabica and robusta
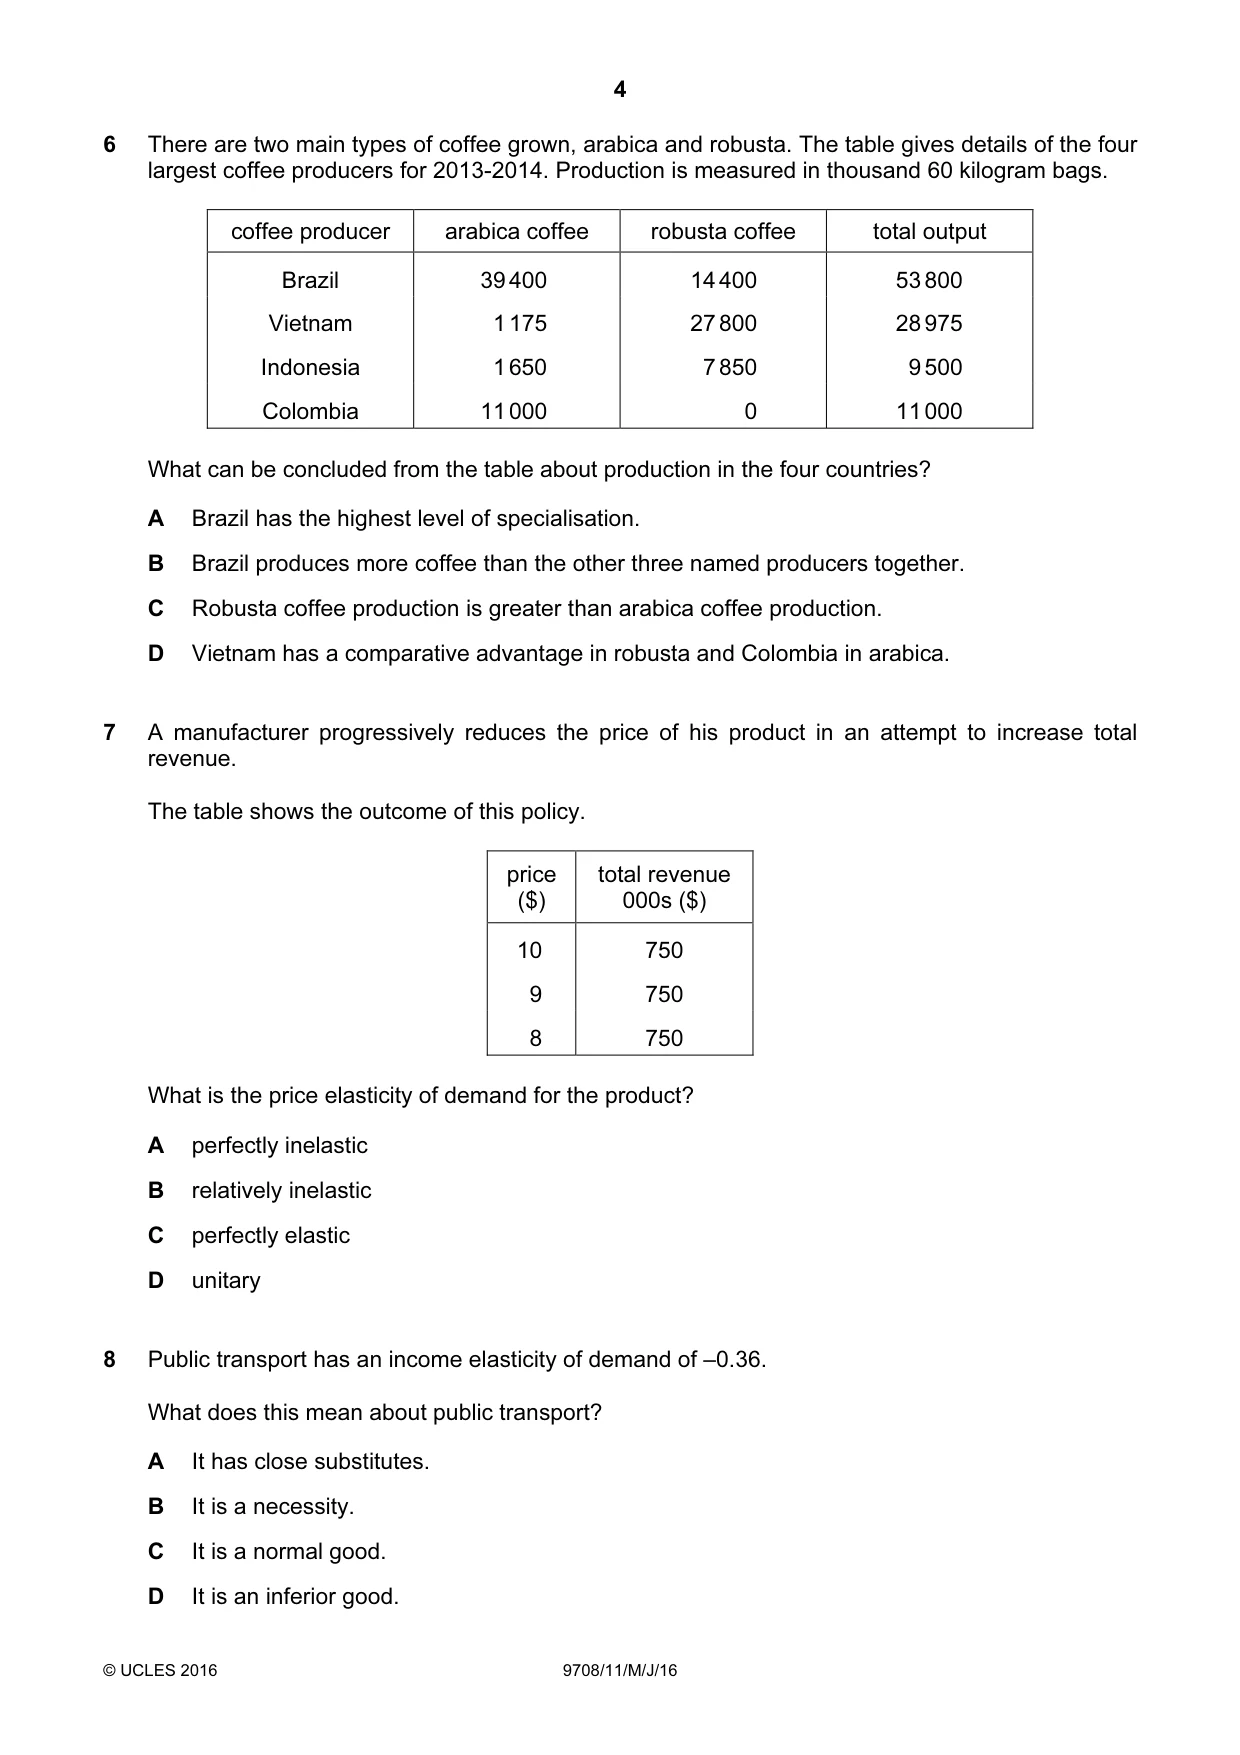
6 There are two main types of coffee grown, arabica and robusta. The table gives details of the four largest coffee producers for 2013-2014. Production is measured in thousand 60 kilogram bags. coffee producer arabica coffee robusta coffee total output Brazil 39 400 14 400 53 800 Vietnam 1 175 27 800 28 975 Indonesia 1 650 7 850 9 500 Colombia 11 000 0 11 000 What can be concluded from the table about production in the four countries? A Brazil has the highest level of specialisation. B Brazil produces more coffee than the other three named producers together. C Robusta coffee production is greater than arabica coffee production. D Vietnam has a comparative advantage in robusta and Colombia in arabica.
Mark scheme: B
Q7 · A manufacturer progressively reduces the price of his product in an attempt to increase…
7 A manufacturer progressively reduces the price of his product in an attempt to increase total revenue. The table shows the outcome of this policy. price total revenue ($) 000s ($) 10 750 9 750 8 750 What is the price elasticity of demand for the product? A perfectly inelastic B relatively inelastic C perfectly elastic D unitary
Mark scheme: D
More questions on Price elasticity, income elasticity and cross elasticity of demand
Q8 · Public transport has an income elasticity of demand of –0.36
8 Public transport has an income elasticity of demand of –0.36. What does this mean about public transport? A It has close substitutes. B It is a necessity. C It is a normal good. D It is an inferior good.
Mark scheme: D
More questions on Price elasticity, income elasticity and cross elasticity of demand
Q9 · The price elasticity of supply of an ‘App’ for a phone is perfectly elastic
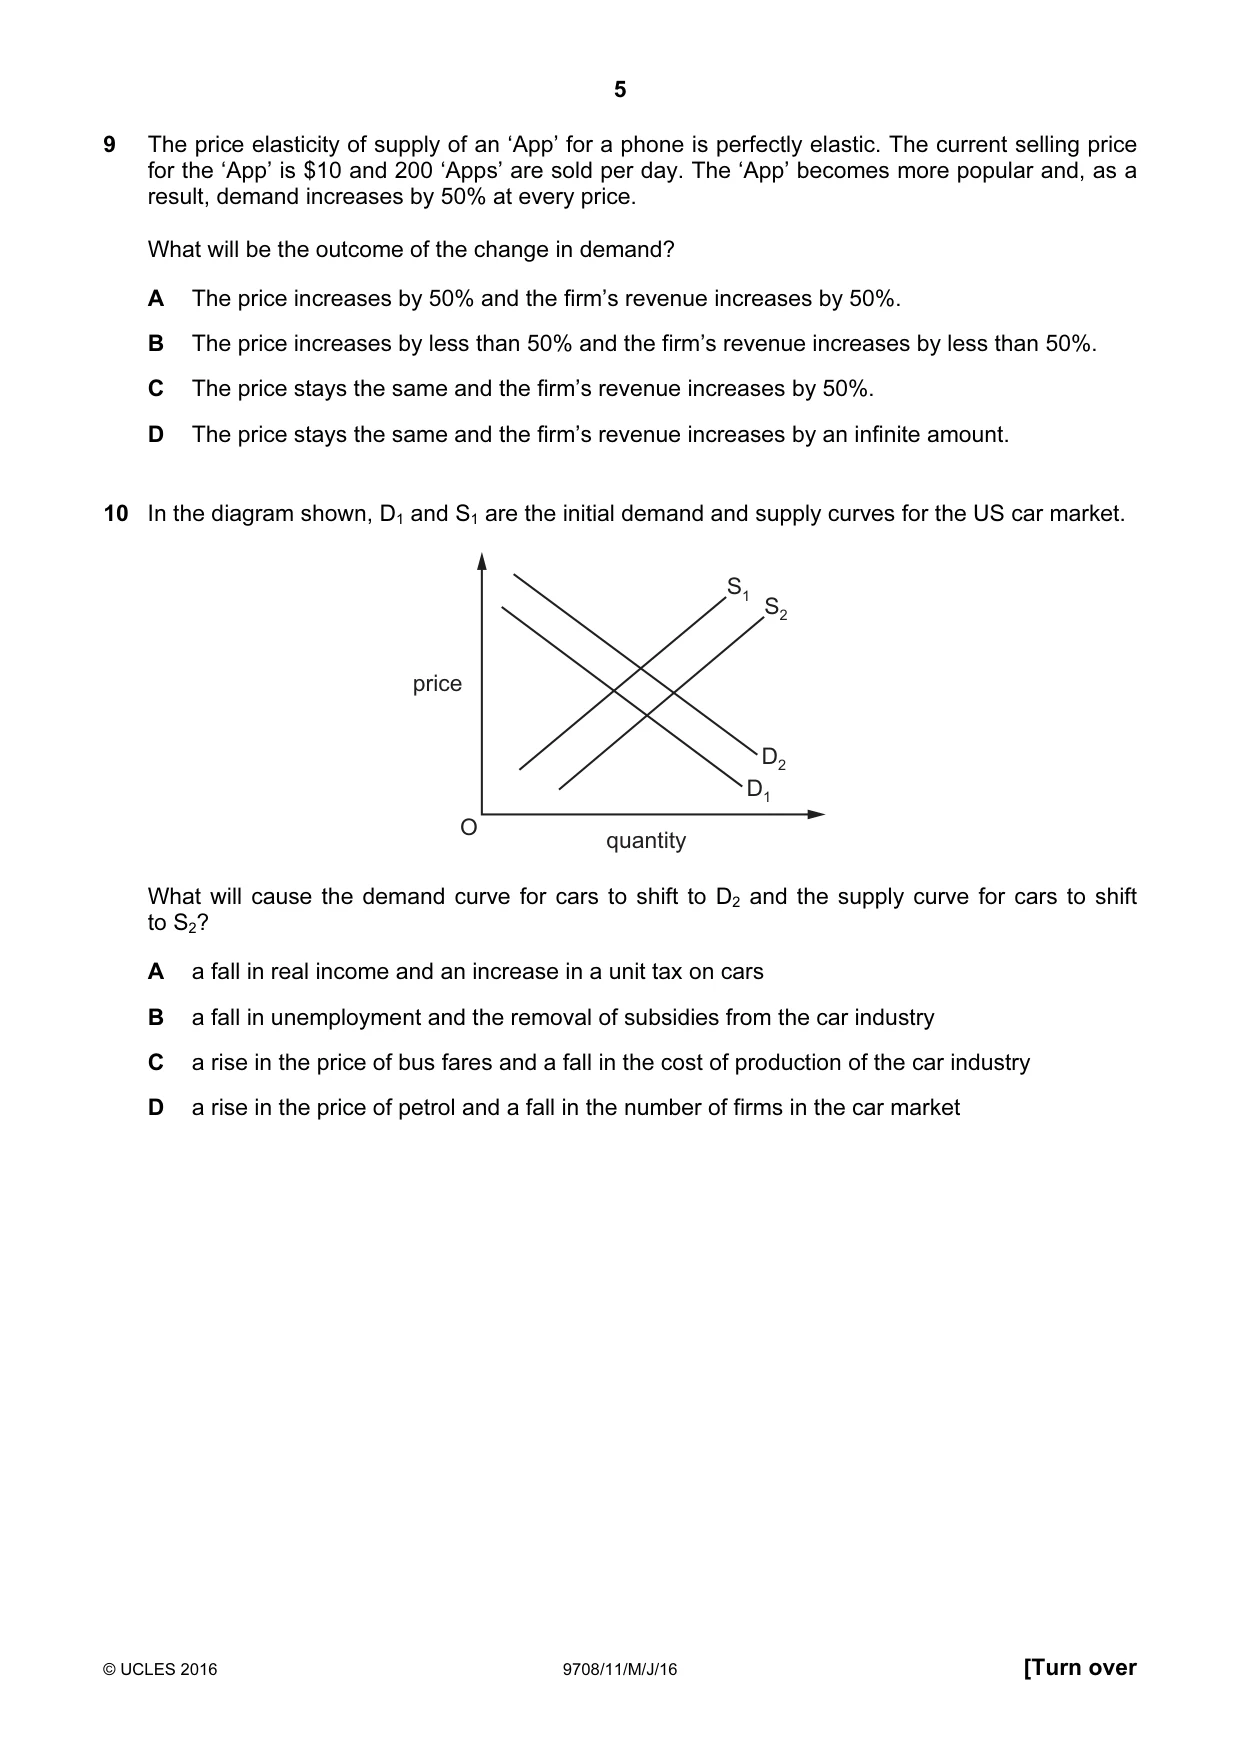
9 The price elasticity of supply of an ‘App’ for a phone is perfectly elastic. The current selling price for the ‘App’ is $10 and 200 ‘Apps’ are sold per day. The ‘App’ becomes more popular and, as a result, demand increases by 50% at every price. What will be the outcome of the change in demand? A The price increases by 50% and the firm’s revenue increases by 50%. B The price increases by less than 50% and the firm’s revenue increases by less than 50%. C The price stays the same and the firm’s revenue increases by 50%. D The price stays the same and the firm’s revenue increases by an infinite amount.
Mark scheme: C
Q10 · In the diagram shown, D1 and S1 are the initial demand and supply curves for the US car…
10 In the diagram shown, D1 and S1 are the initial demand and supply curves for the US car market. S1 S2 price D2 D1 O quantity What will cause the demand curve for cars to shift to D2 and the supply curve for cars to shift to S2? A a fall in real income and an increase in a unit tax on cars B a fall in unemployment and the removal of subsidies from the car industry C a rise in the price of bus fares and a fall in the cost of production of the car industry D a rise in the price of petrol and a fall in the number of firms in the car market
Mark scheme: C
Q11 · A specific tax is placed upon each bottle of perfume sold
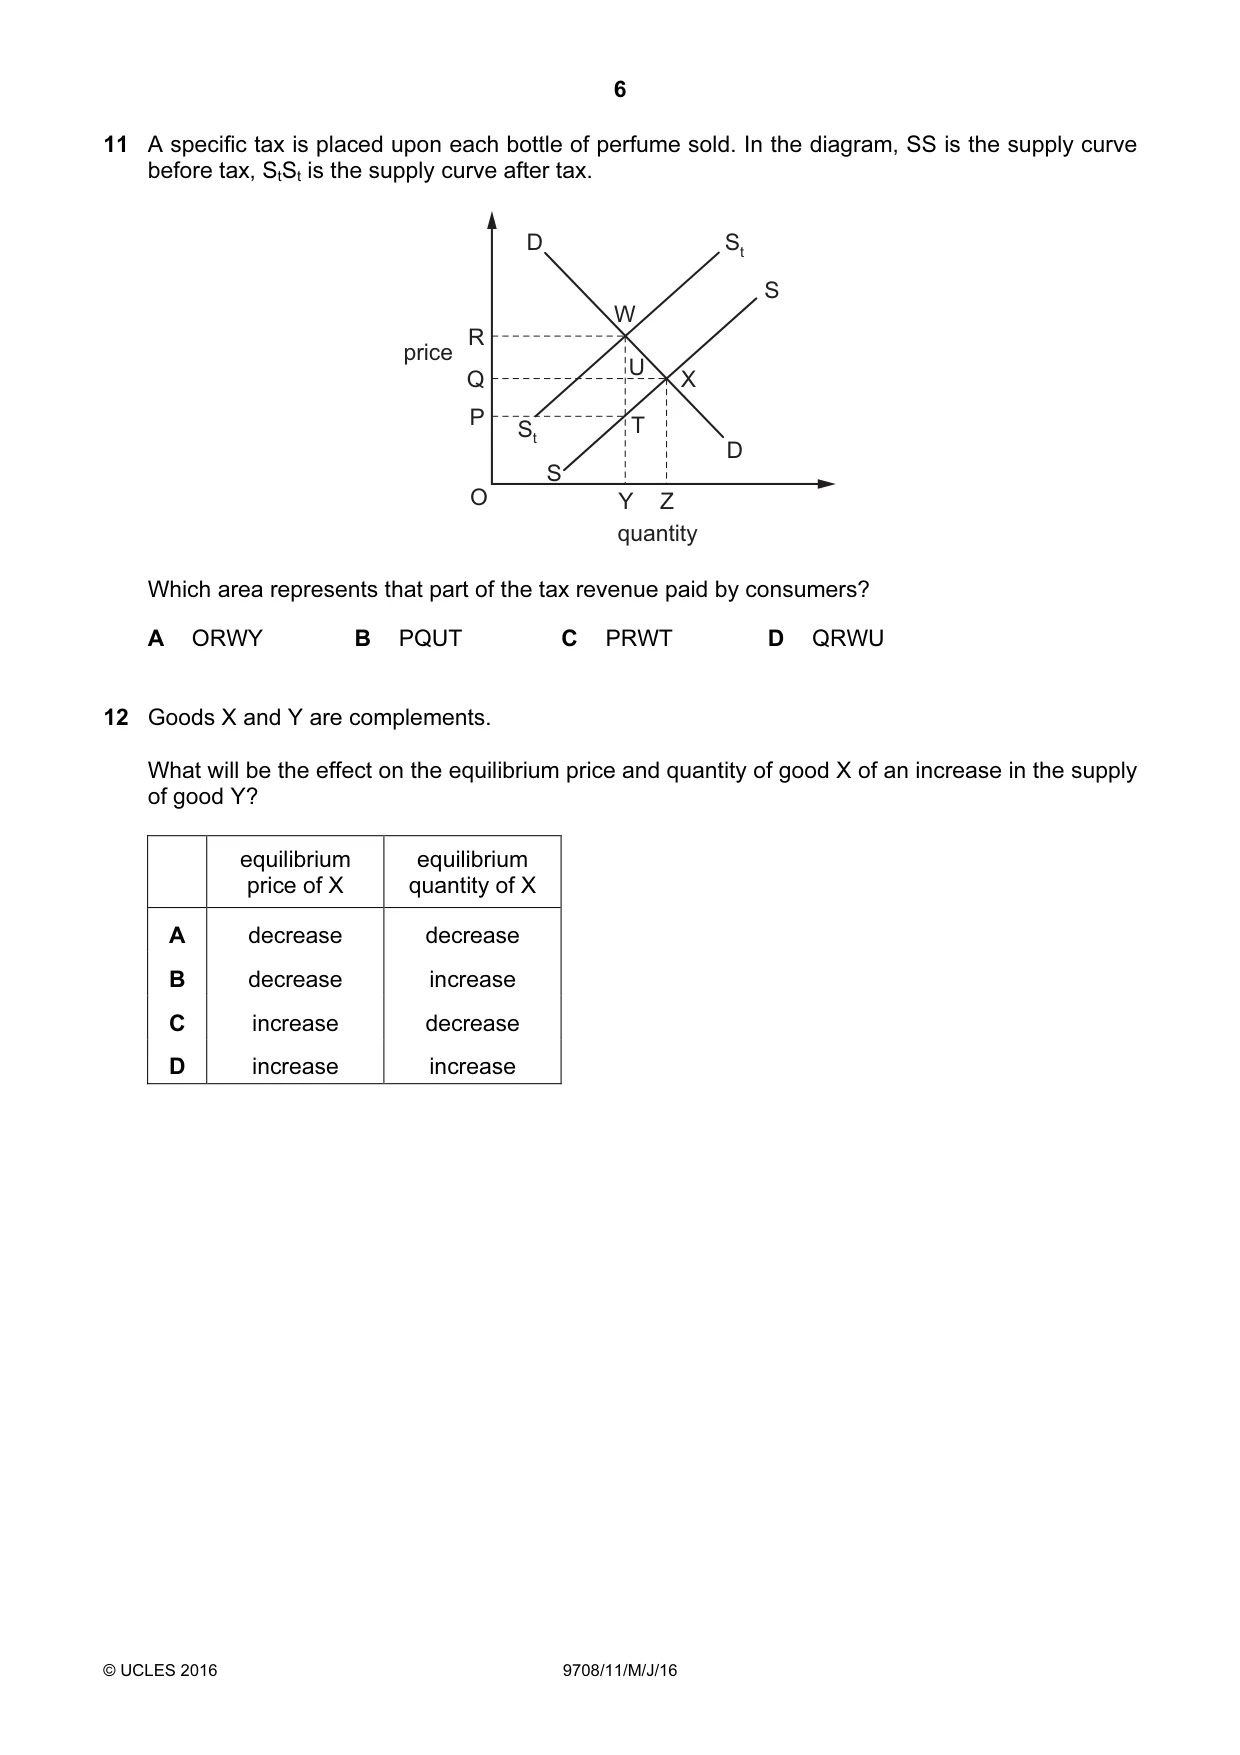
11 A specific tax is placed upon each bottle of perfume sold. In the diagram, SS is the supply curve before tax, StSt is the supply curve after tax. D St S W R price U Q X P T St D S O Y Z quantity Which area represents that part of the tax revenue paid by consumers? A ORWY B PQUT C PRWT D QRWU
Mark scheme: D
More questions on Methods and effects of government intervention in markets
Q12 · Goods X and Y are complements
12 Goods X and Y are complements. What will be the effect on the equilibrium price and quantity of good X of an increase in the supply of good Y? equilibrium equilibrium price of X quantity of X A decrease decrease B decrease increase C increase decrease D increase increase
Mark scheme: D
Q13 · The table shows the price Rashid is willing to pay for successive cakes and their…
13 The table shows the price Rashid is willing to pay for successive cakes and their production cost. cakes 1st 2nd 3rd 4th price willing to pay $0.90 $0.80 $0.65 $0.50 production cost $0.20 $0.30 $0.40 $0.50 If the price is $0.50 and Rashid buys four cakes, what is the monetary value of the consumer surplus and the producer surplus? consumer producer surplus ($) surplus ($) A 0 0 B 0.15 0.10 C 0.85 0.60 D 2.85 1.40
Mark scheme: C
Q14 · The diagram shows the market supply and demand curves for wheat
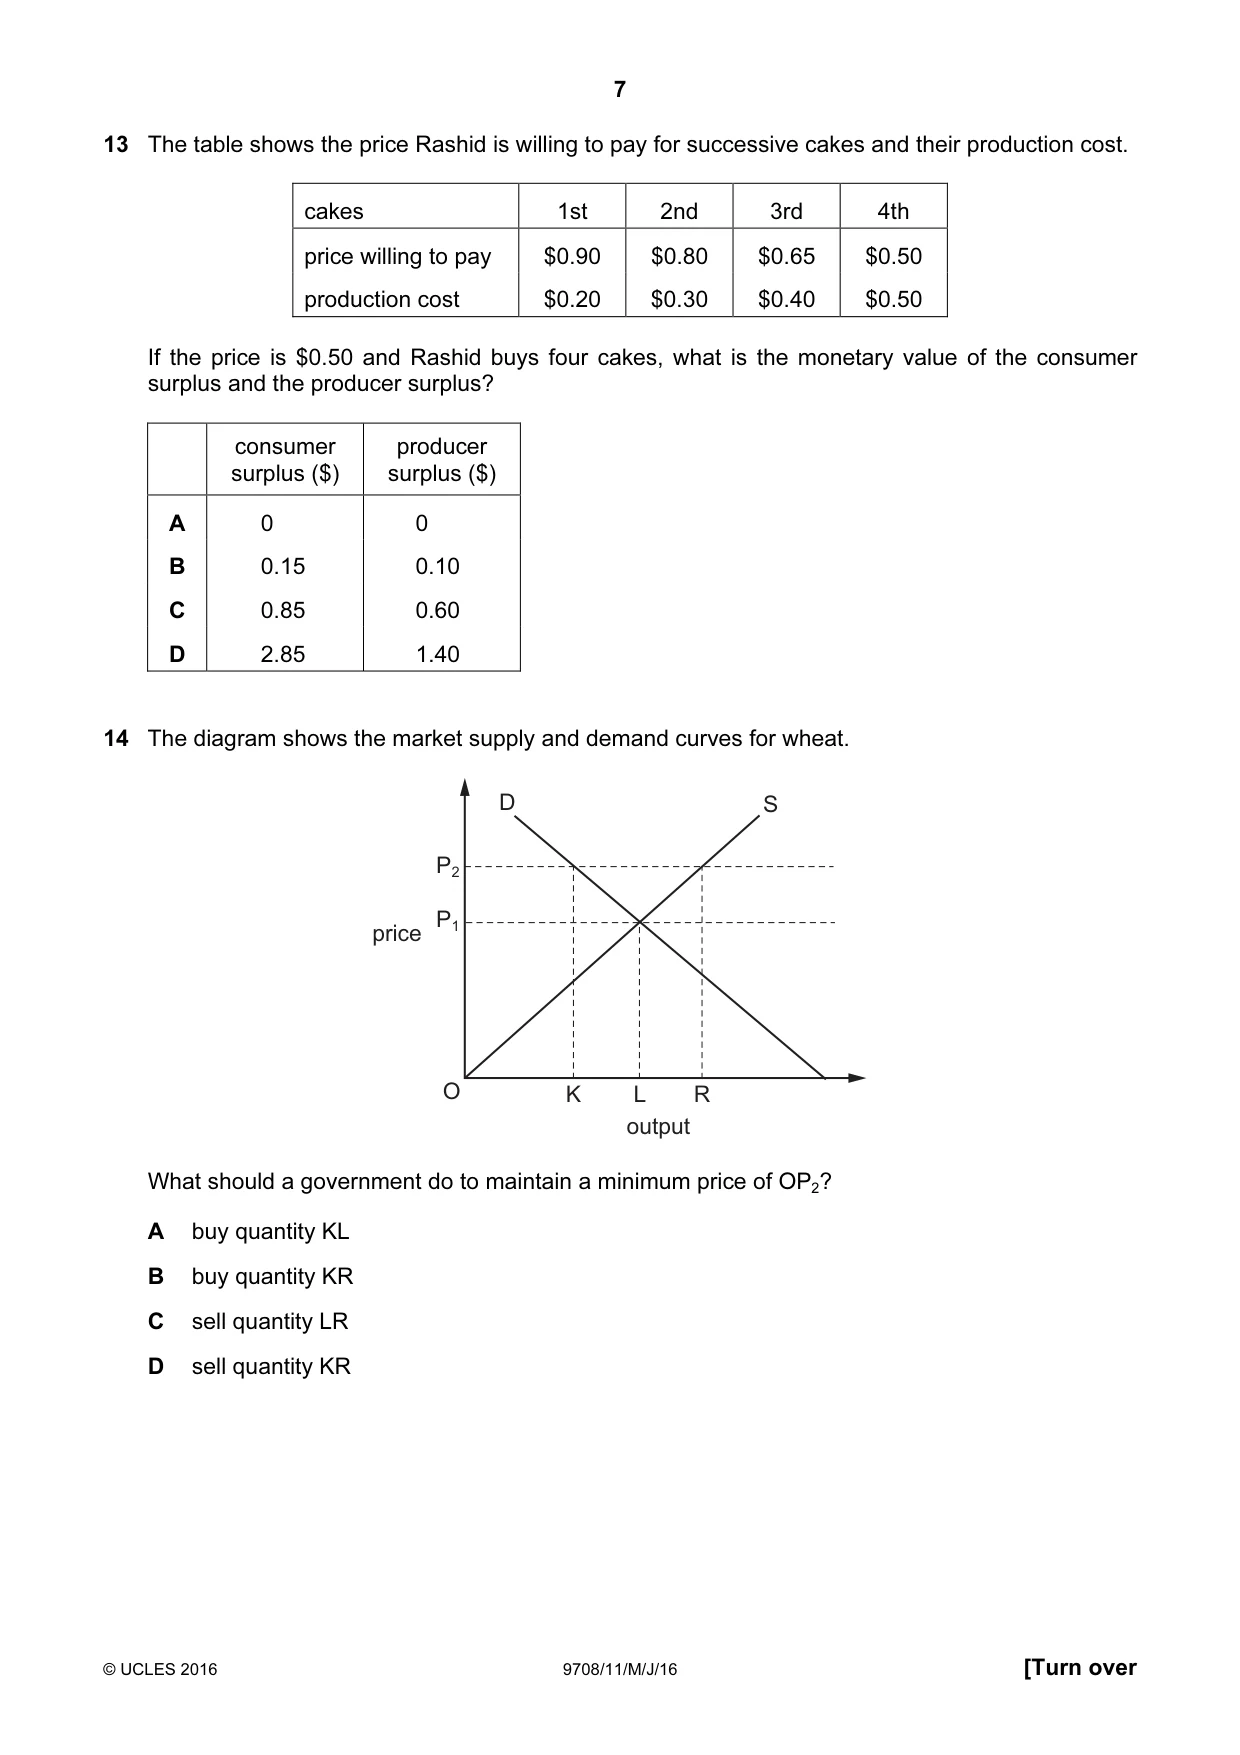
14 The diagram shows the market supply and demand curves for wheat. D S P2 P1 price O K L R output What should a government do to maintain a minimum price of OP2? A buy quantity KL B buy quantity KR C sell quantity LR D sell quantity KR
Mark scheme: B
More questions on Methods and effects of government intervention in markets
Q15 · A product with infinite elasticity of supply has sales of 1000 units a week at a price of…
15 A product with infinite elasticity of supply has sales of 1000 units a week at a price of $1 per unit. Price elasticity of demand is 1.5 over the relevant range. The government imposes a tax of 10%. What will be the government’s weekly tax revenue? A $15 B $85 C $100 D $150
Mark scheme: B
More questions on Methods and effects of government intervention in markets
Q16 · A government pays a subsidy to a country’s onion producers
16 A government pays a subsidy to a country’s onion producers. With which price elasticity of demand (PED) will this action be most effective in reducing the price of onions? A PED equals 0. B PED is greater than 0 but less than 1. C PED equals 1. D PED is greater than 1 but less than infinity.
Mark scheme: A
More questions on Methods and effects of government intervention in markets
Q17 · Which statement best describes a transfer payment?
17 Which statement best describes a transfer payment? A It is a loan from the government to help firms. B It is a payment to individuals not linked to economic activity. C It is the redistribution of income from government to individuals for work done. D It is the redistribution of income from households to firms for goods purchased.
Mark scheme: B
Q18 · On 1 May 2012 President Morales of Bolivia announced the nationalisation of…
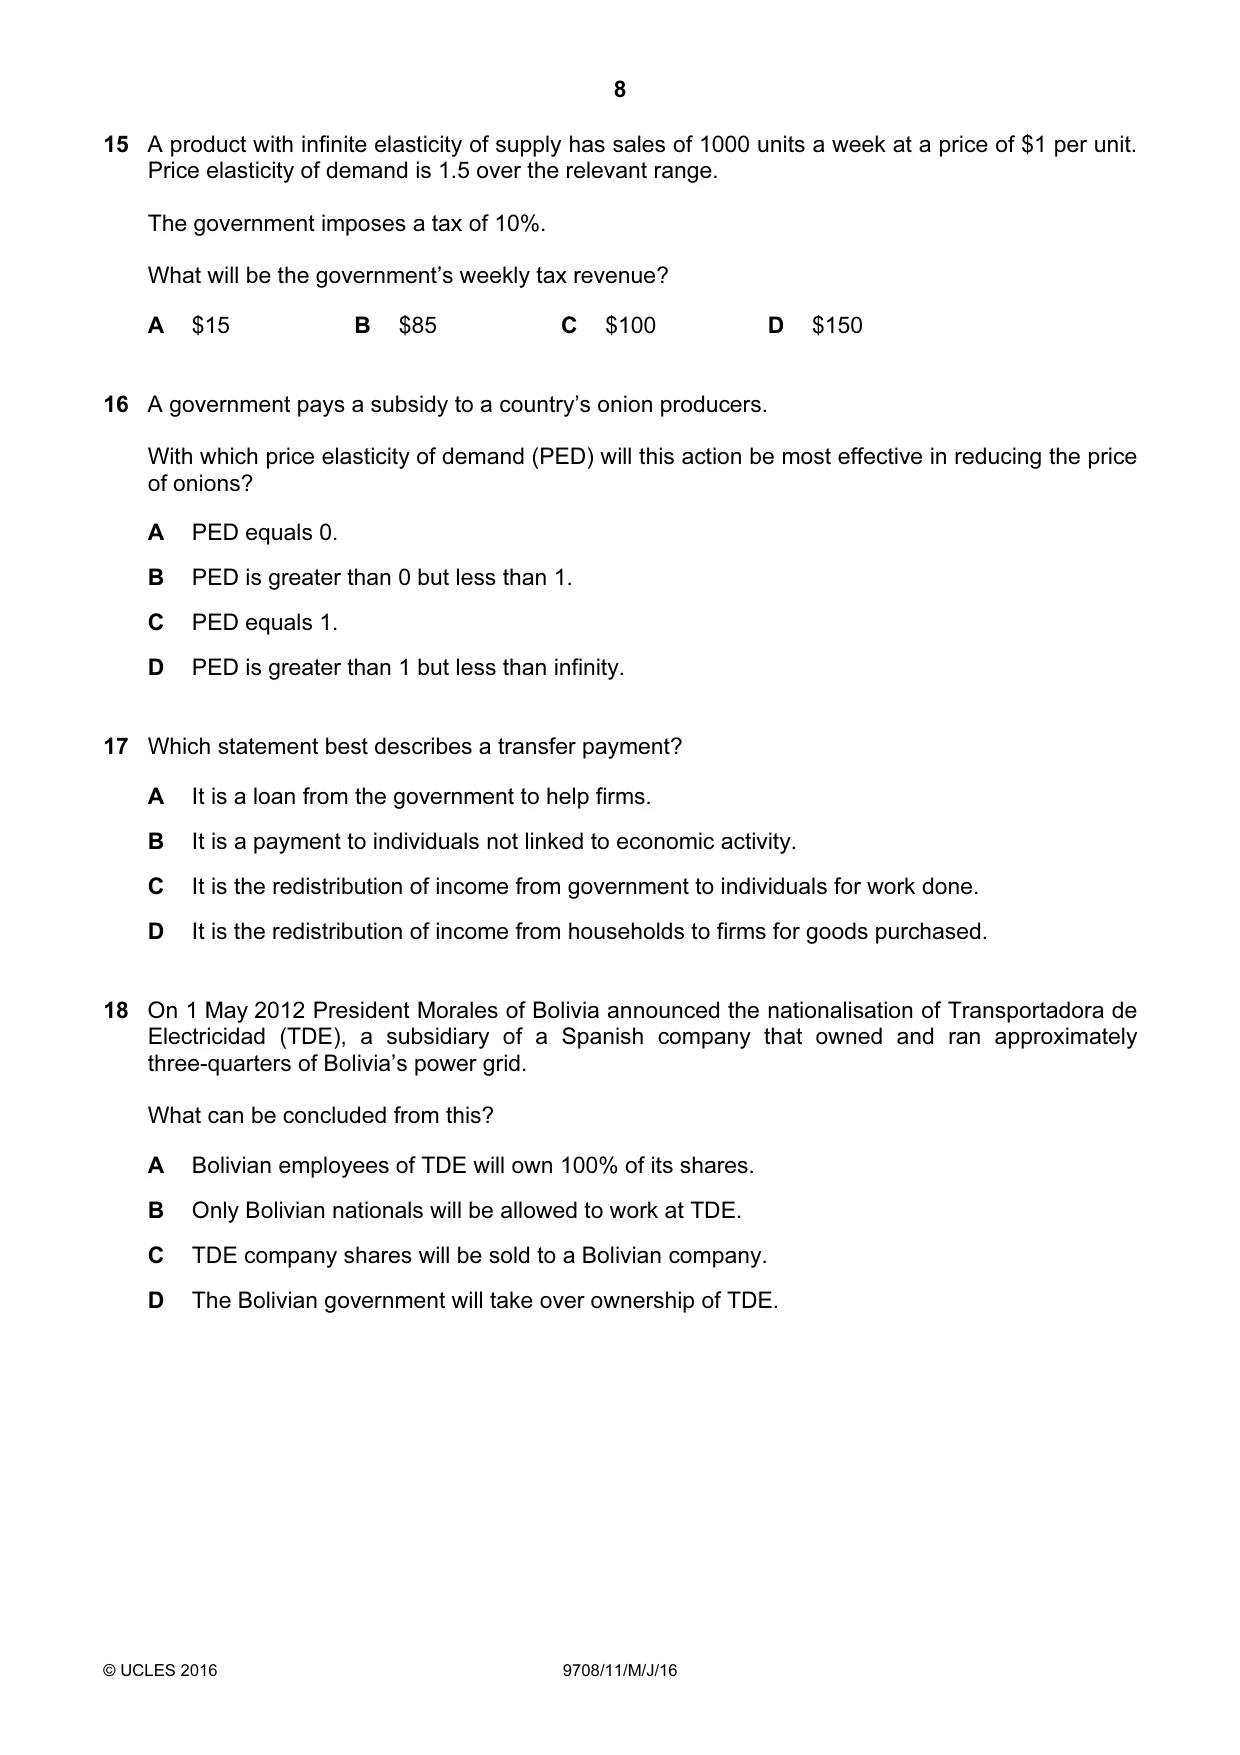
18 On 1 May 2012 President Morales of Bolivia announced the nationalisation of Transportadora de Electricidad (TDE), a subsidiary of a Spanish company that owned and ran approximately three-quarters of Bolivia’s power grid. What can be concluded from this? A Bolivian employees of TDE will own 100% of its shares. B Only Bolivian nationals will be allowed to work at TDE. C TDE company shares will be sold to a Bolivian company. D The Bolivian government will take over ownership of TDE.
Mark scheme: D
More questions on Resource allocation in different economic systems
Q19 · An economy faces rising raw material costs and a fall in business confidence
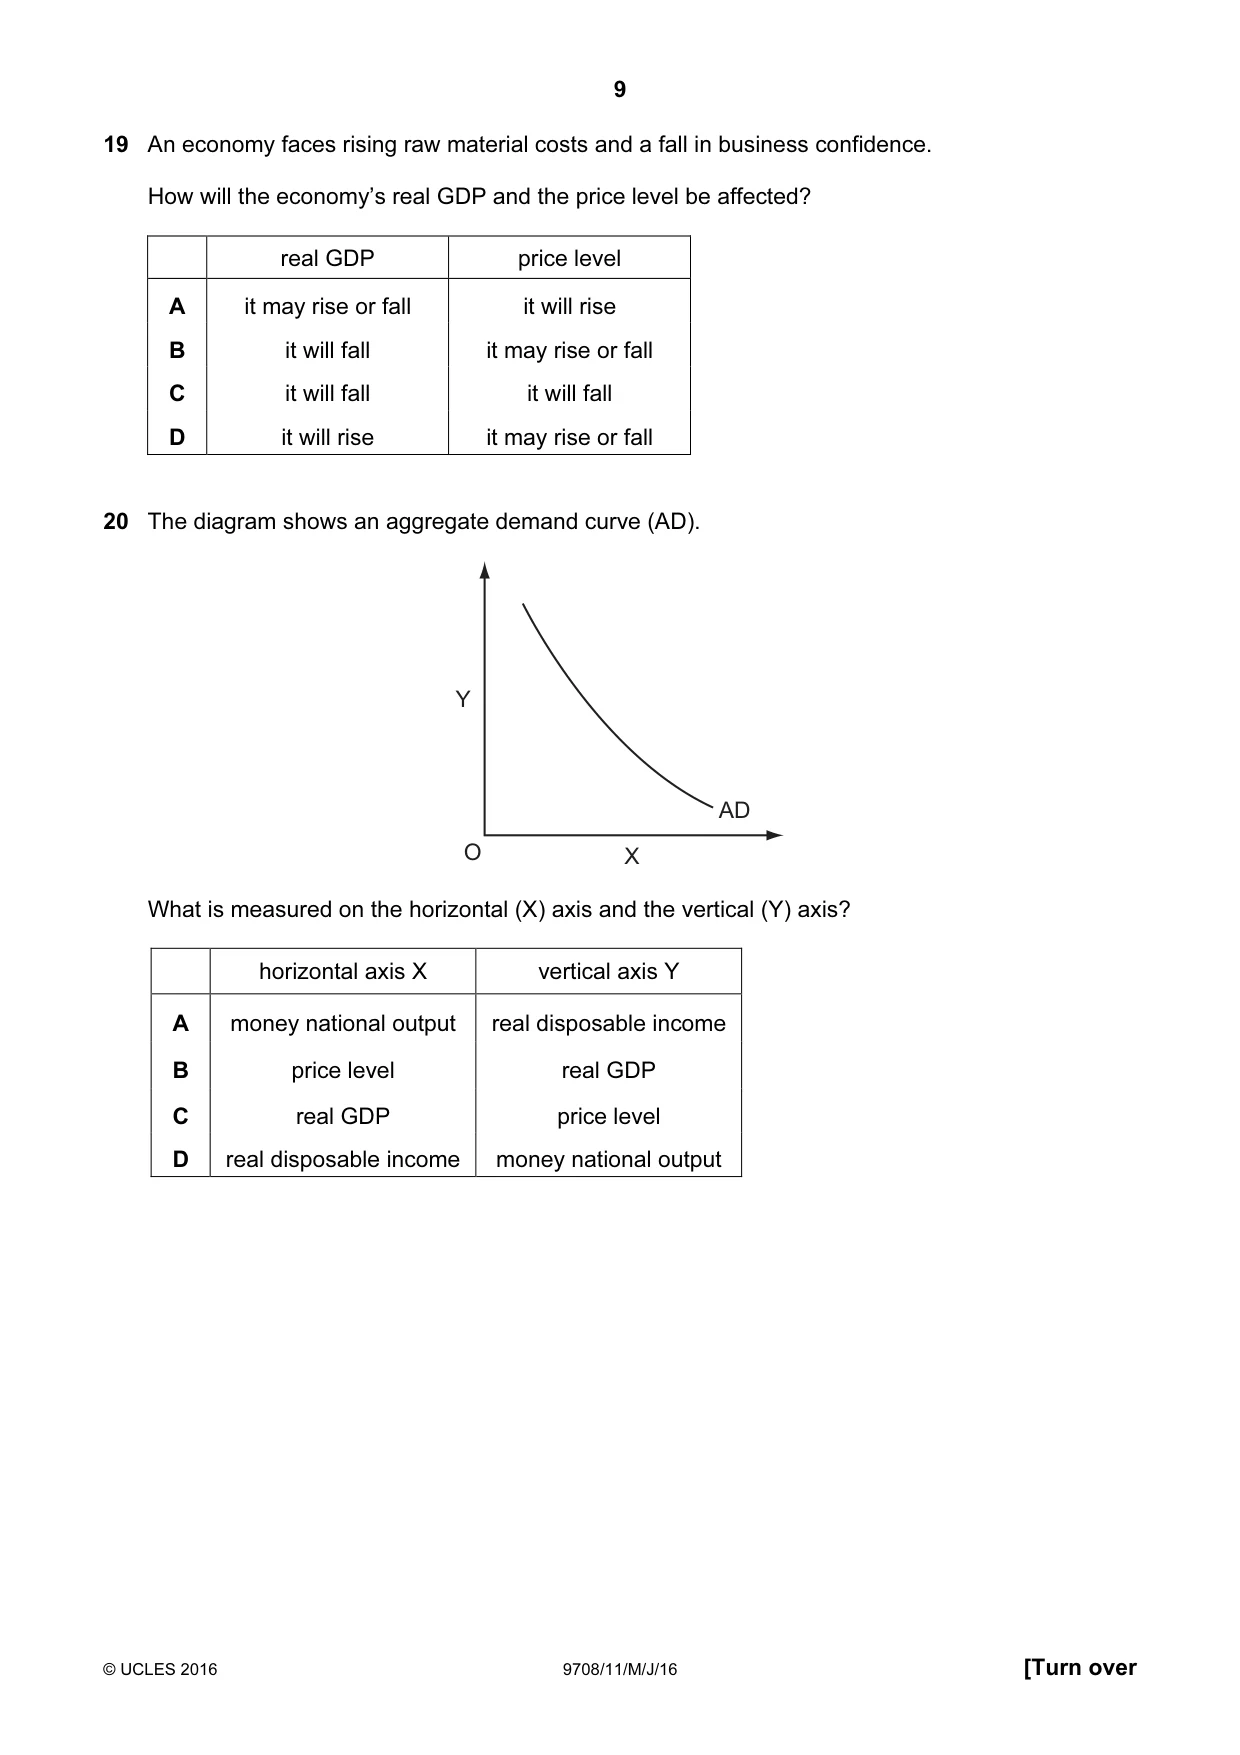
19 An economy faces rising raw material costs and a fall in business confidence. How will the economy’s real GDP and the price level be affected? real GDP price level A it may rise or fall it will rise B it will fall it may rise or fall C it will fall it will fall D it will rise it may rise or fall
Mark scheme: B
More questions on Aggregate Demand and Aggregate Supply analysis
Q20 · The diagram shows an aggregate demand curve (AD)
20 The diagram shows an aggregate demand curve (AD). Y AD O X What is measured on the horizontal (X) axis and the vertical (Y) axis? horizontal axis X vertical axis Y A money national output real disposable income B price level real GDP C real GDP price level D real disposable income money national output
Mark scheme: C
More questions on Aggregate Demand and Aggregate Supply analysis
Q21 · The table shows information about a country whose consumers spend their income on three…
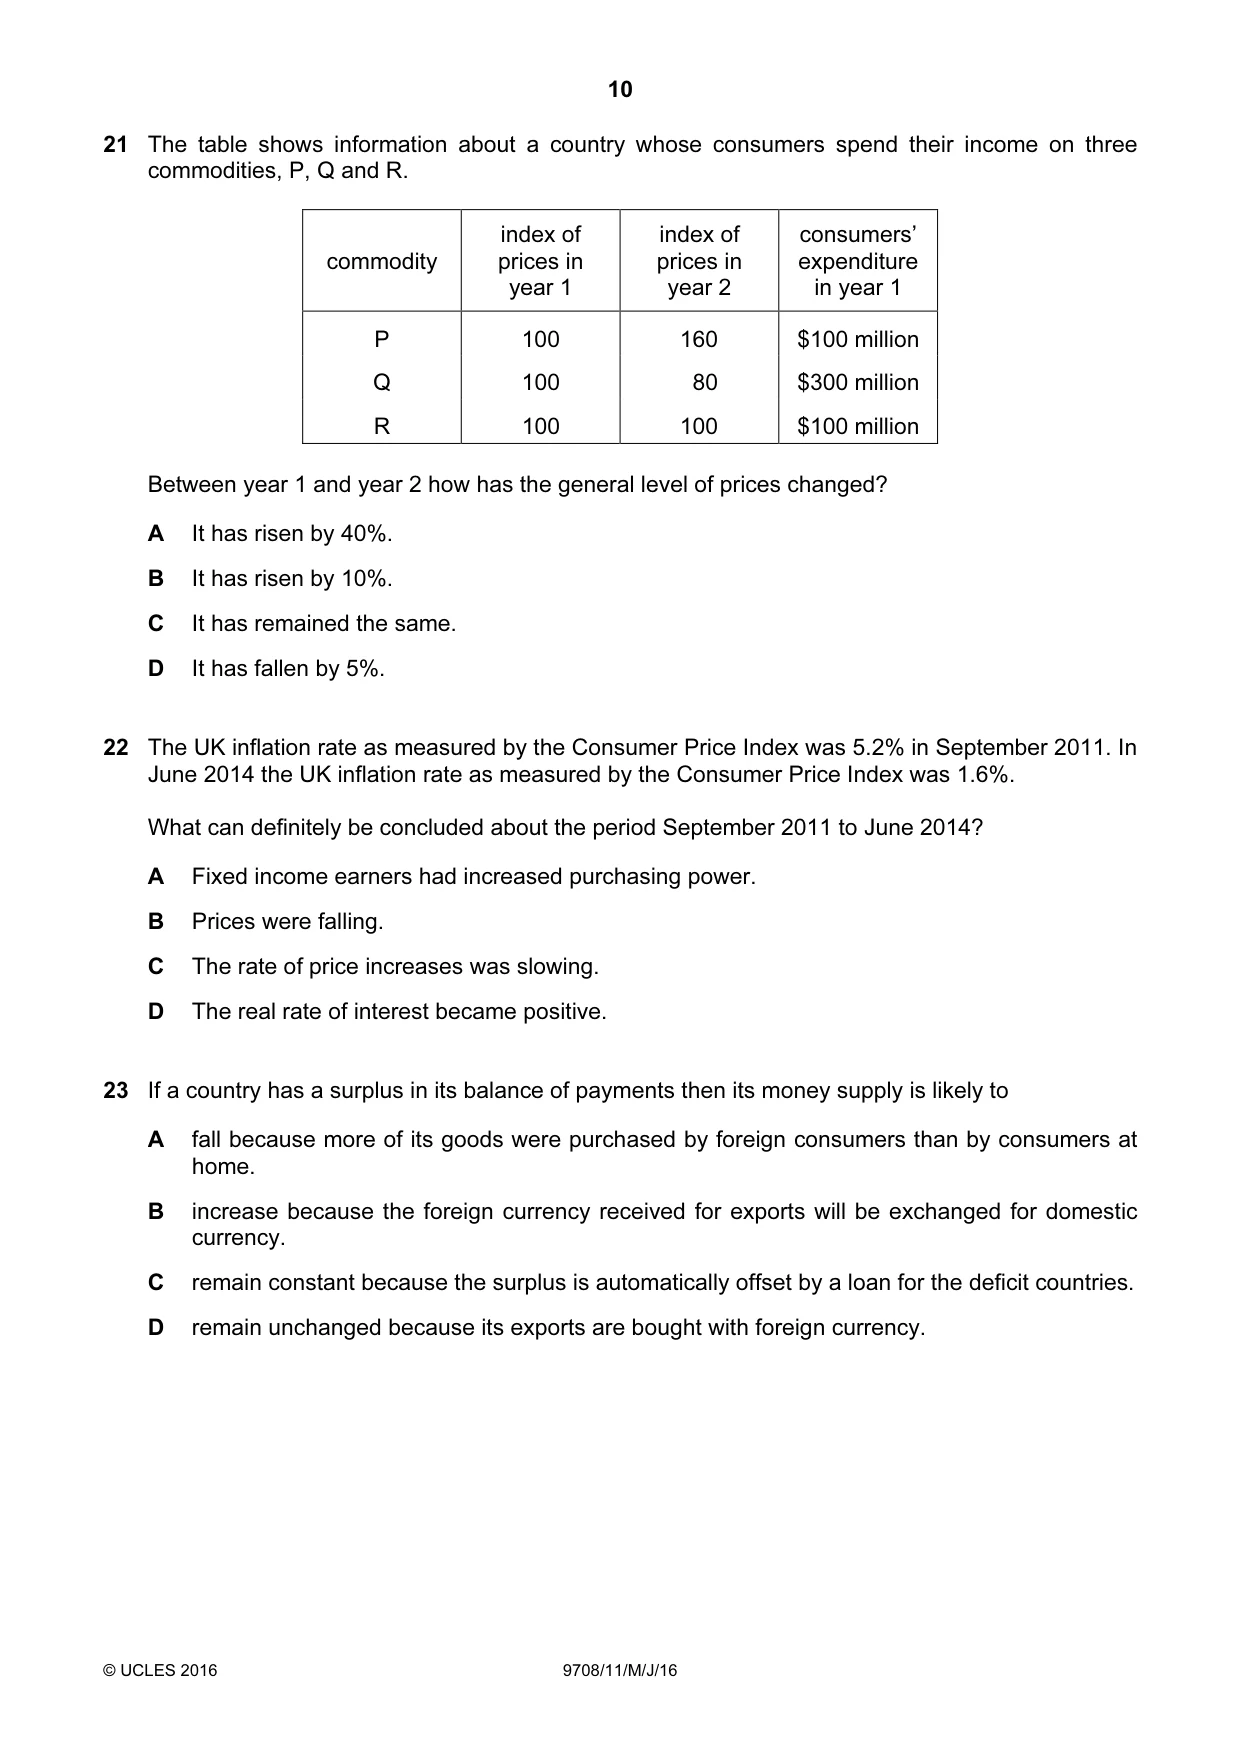
21 The table shows information about a country whose consumers spend their income on three commodities, P, Q and R. index of index of consumers’ commodity prices in prices in expenditure year 1 year 2 in year 1 P 100 160 $100 million Q 100 80 $300 million R 100 100 $100 million Between year 1 and year 2 how has the general level of prices changed? A It has risen by 40%. B It has risen by 10%. C It has remained the same. D It has fallen by 5%.
Mark scheme: C
Q22 · The UK inflation rate as measured by the Consumer Price Index was 5.2% in September 2011
22 The UK inflation rate as measured by the Consumer Price Index was 5.2% in September 2011. In June 2014 the UK inflation rate as measured by the Consumer Price Index was 1.6%. What can definitely be concluded about the period September 2011 to June 2014? A Fixed income earners had increased purchasing power. B Prices were falling. C The rate of price increases was slowing. D The real rate of interest became positive.
Mark scheme: C
Q23 · If a country has a surplus in its balance of payments then its money supply is likely to…
23 If a country has a surplus in its balance of payments then its money supply is likely to A fall because more of its goods were purchased by foreign consumers than by consumers at home. B increase because the foreign currency received for exports will be exchanged for domestic currency. C remain constant because the surplus is automatically offset by a loan for the deficit countries. D remain unchanged because its exports are bought with foreign currency.
Mark scheme: B
More questions on Current account of the balance of payments
Q24 · In the diagram the foreign exchange market is initially in equilibrium at X
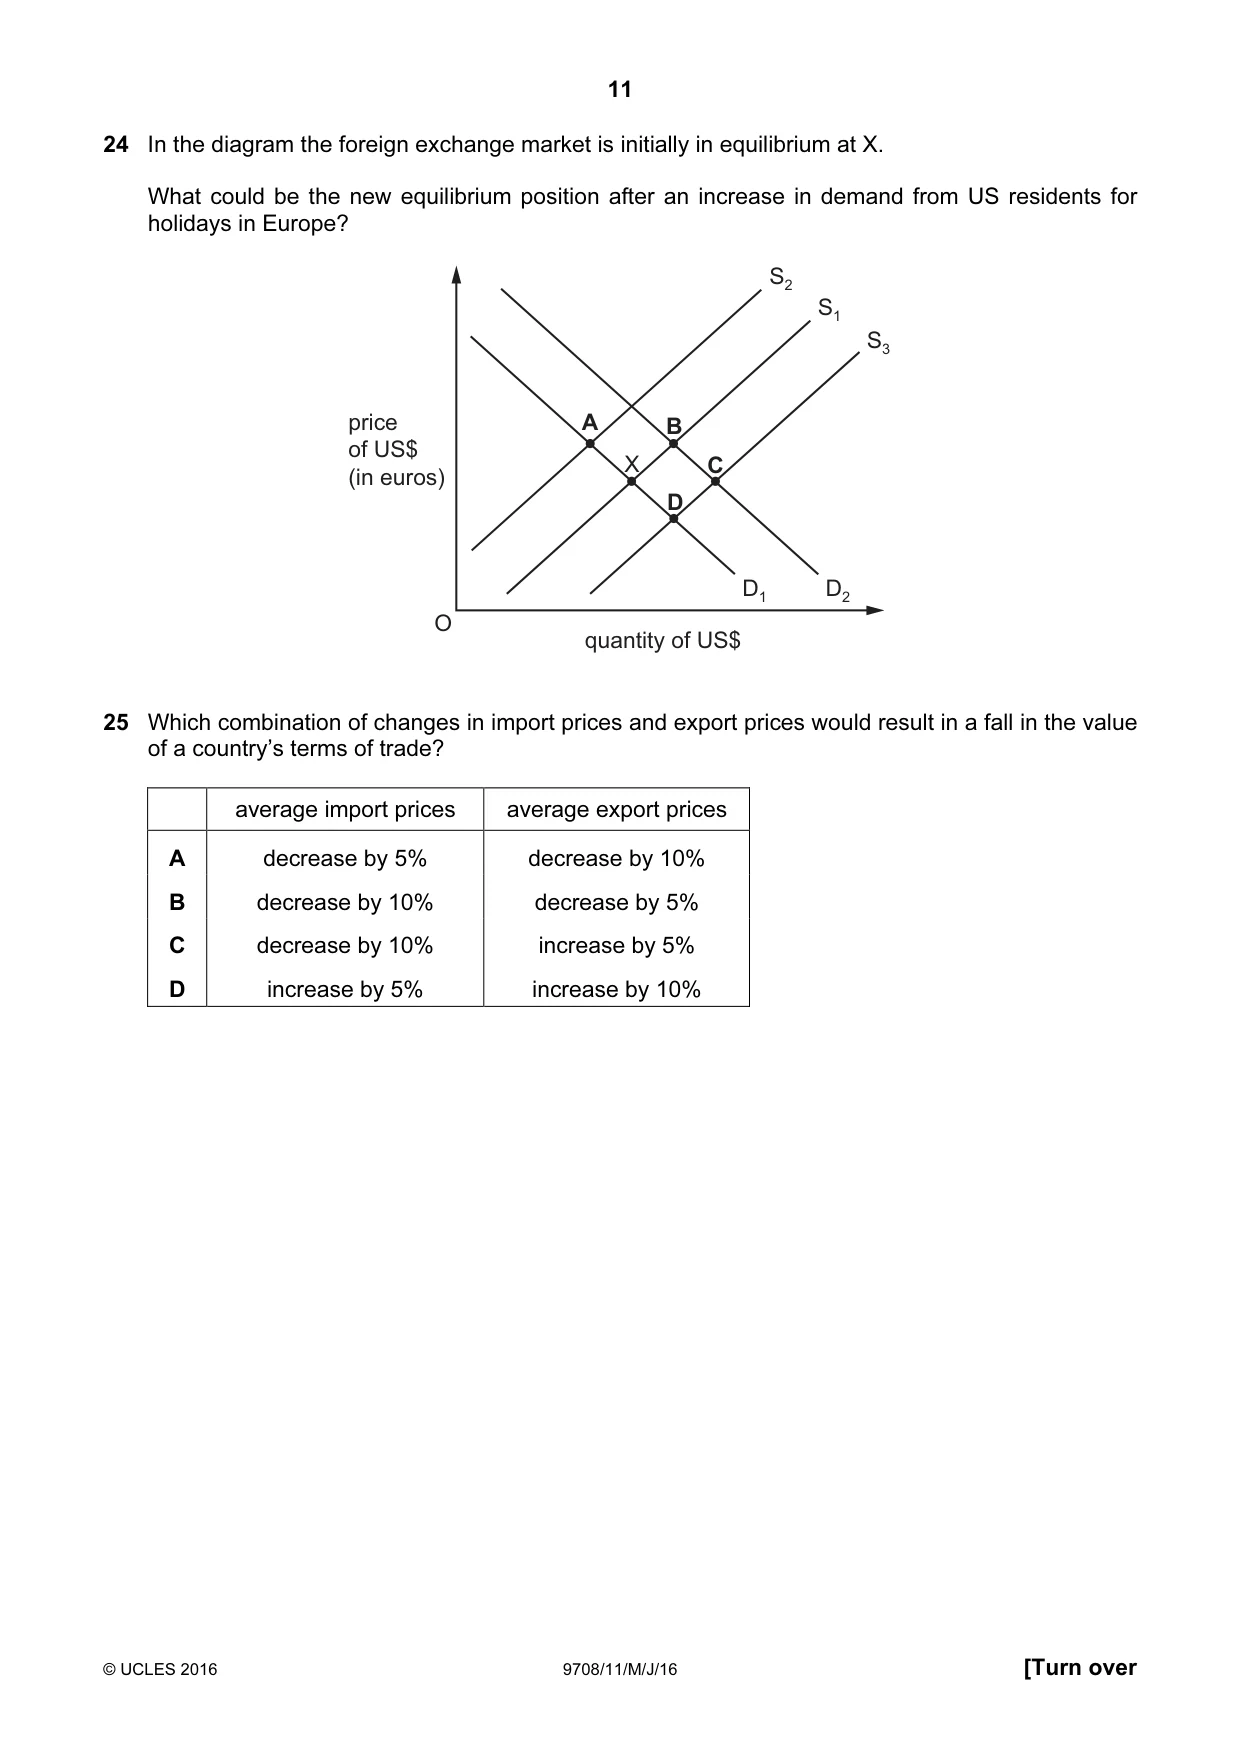
24 In the diagram the foreign exchange market is initially in equilibrium at X. What could be the new equilibrium position after an increase in demand from US residents for holidays in Europe? S2 S1 S3 price A B of US$ X C (in euros) D D1 D2 O quantity of US$
Mark scheme: D
Q25 · Which combination of changes in import prices and export prices would result in a fall in…
25 Which combination of changes in import prices and export prices would result in a fall in the value of a country’s terms of trade? average import prices average export prices A decrease by 5% decrease by 10% B decrease by 10% decrease by 5% C decrease by 10% increase by 5% D increase by 5% increase by 10%
Mark scheme: A
Q26 · The diagram shows the production possibility curves for two countries, X and Y
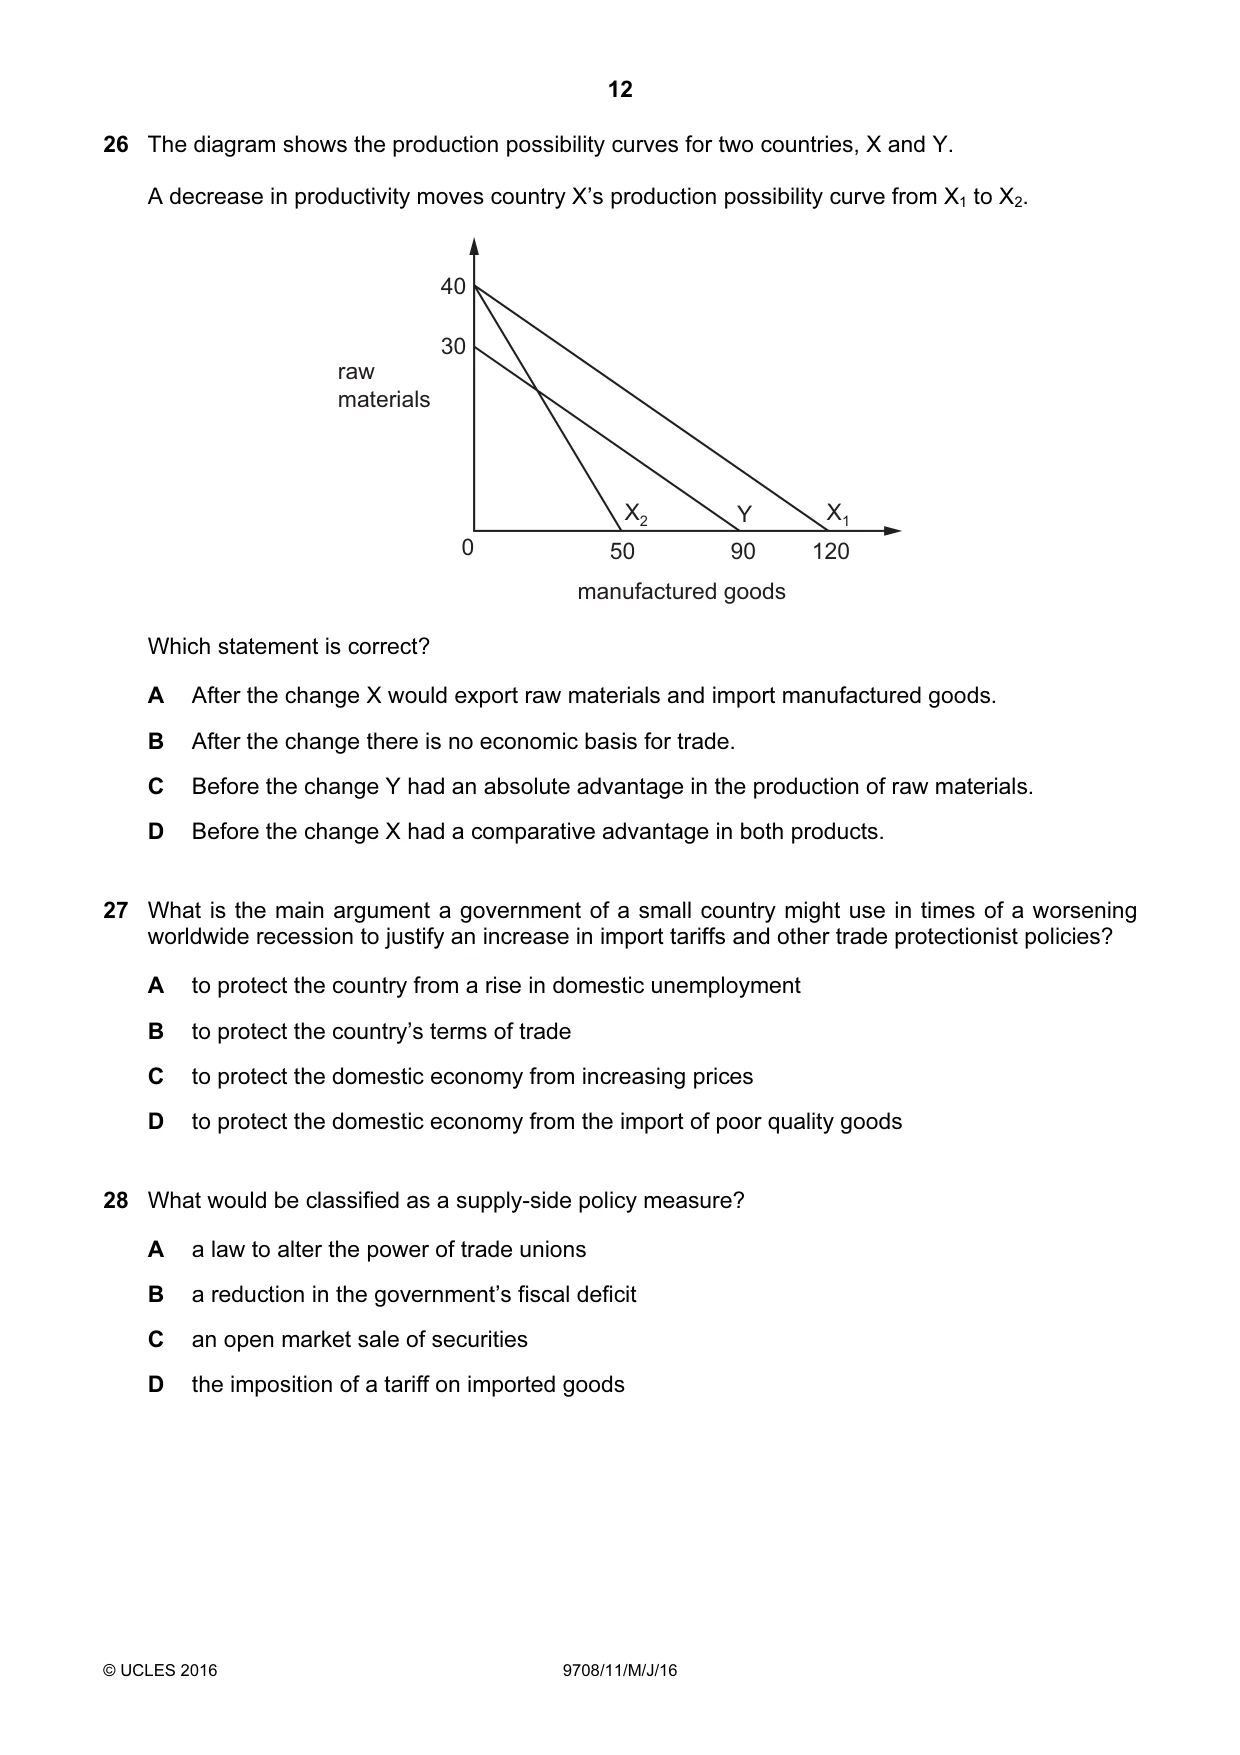
26 The diagram shows the production possibility curves for two countries, X and Y. A decrease in productivity moves country X’s production possibility curve from X1 to X2. 40 30 raw materials X2 Y X1 0 50 90 120 manufactured goods Which statement is correct? A After the change X would export raw materials and import manufactured goods. B After the change there is no economic basis for trade. C Before the change Y had an absolute advantage in the production of raw materials. D Before the change X had a comparative advantage in both products.
Mark scheme: A
Q27 · What is the main argument a government of a small country might use in times of a…
27 What is the main argument a government of a small country might use in times of a worsening worldwide recession to justify an increase in import tariffs and other trade protectionist policies? A to protect the country from a rise in domestic unemployment B to protect the country’s terms of trade C to protect the domestic economy from increasing prices D to protect the domestic economy from the import of poor quality goods
Mark scheme: A
Q28 · What would be classified as a supply-side policy measure?
28 What would be classified as a supply-side policy measure? A a law to alter the power of trade unions B a reduction in the government’s fiscal deficit C an open market sale of securities D the imposition of a tariff on imported goods
Mark scheme: A
Q29 · Which policy measure is an expenditure-switching measure designed to reduce a current…
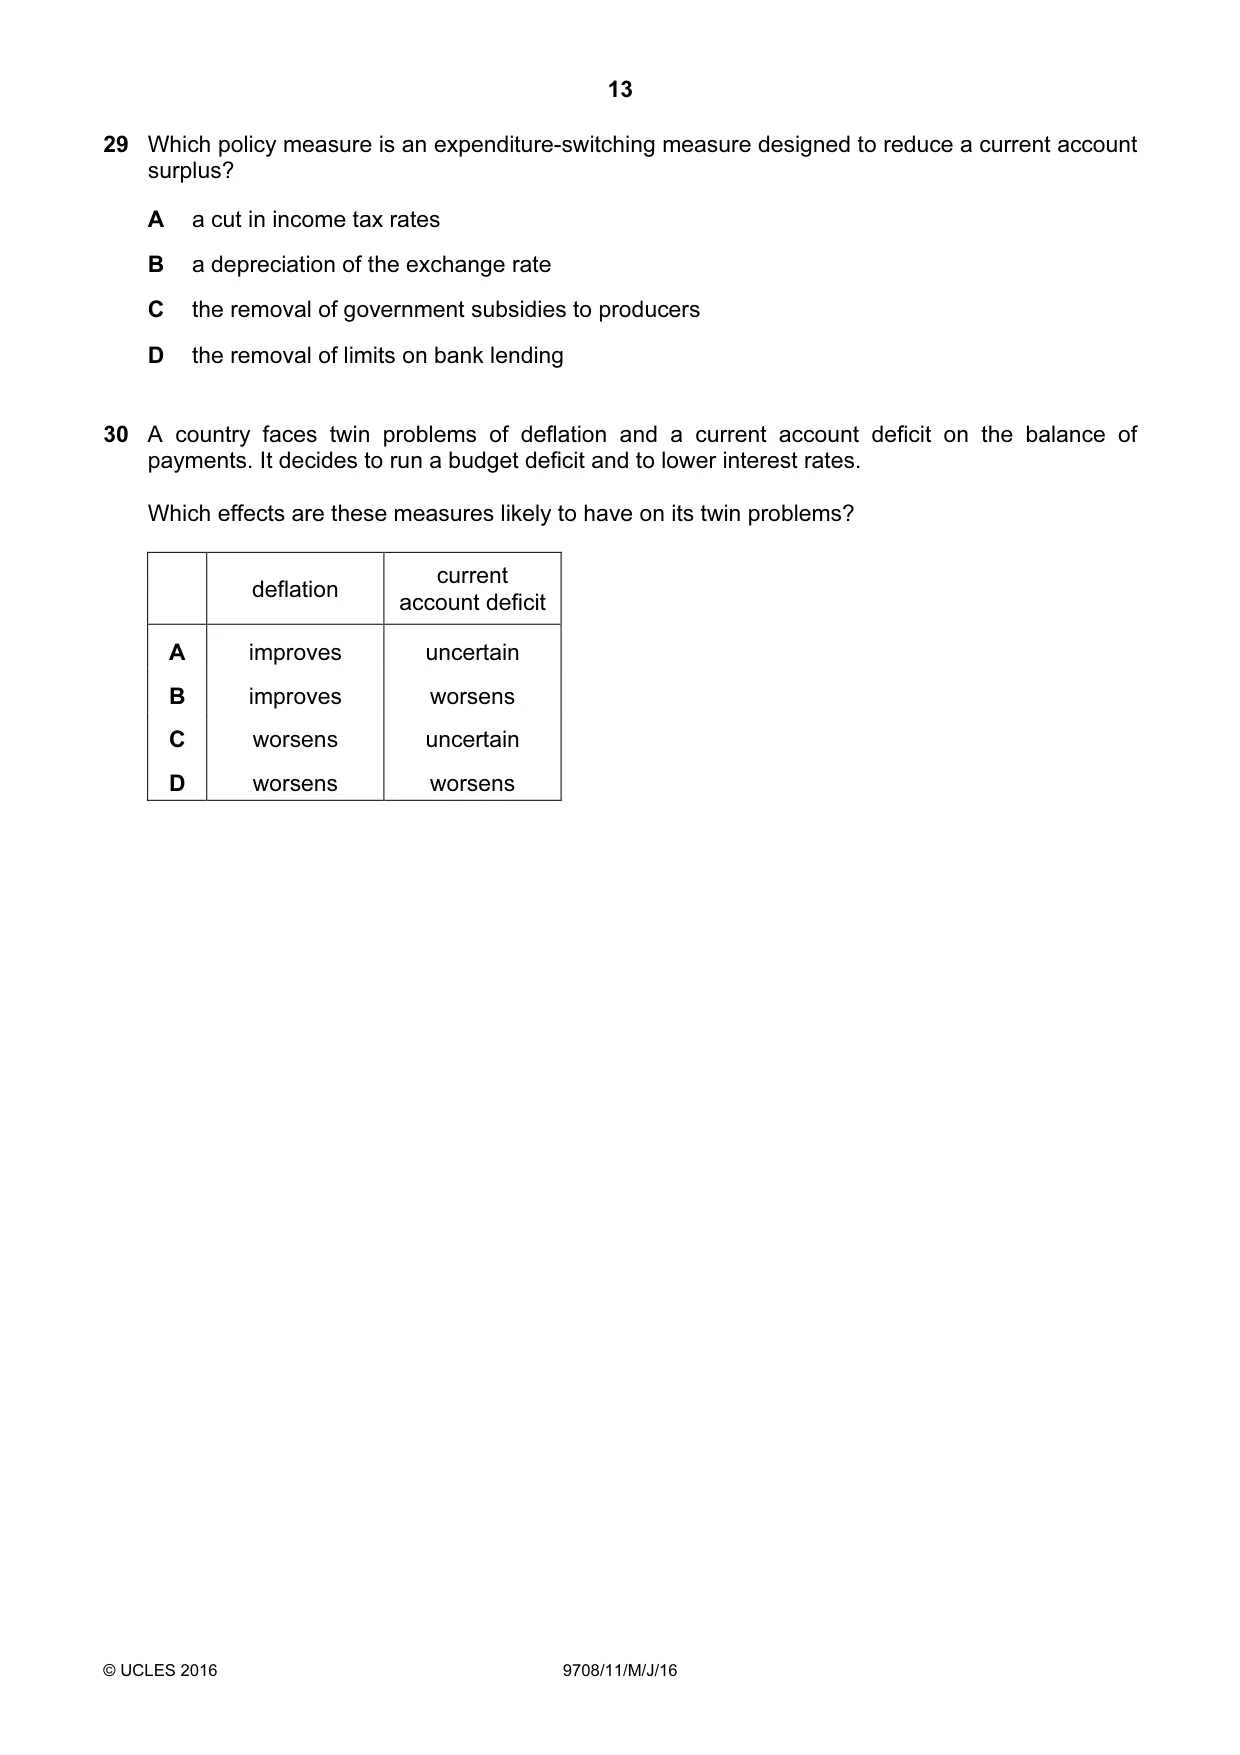
29 Which policy measure is an expenditure-switching measure designed to reduce a current account surplus? A a cut in income tax rates B a depreciation of the exchange rate C the removal of government subsidies to producers D the removal of limits on bank lending
Mark scheme: C
More questions on Policies to correct imbalances in the current account of the balance of payments
Q30 · A country faces twin problems of deflation and a current account deficit on the balance…
30 A country faces twin problems of deflation and a current account deficit on the balance of payments. It decides to run a budget deficit and to lower interest rates. Which effects are these measures likely to have on its twin problems? current deflation account deficit A improves uncertain B improves worsens C worsens uncertain D worsens worsens
Mark scheme: B
What was in this paper
The subtopics covered by these 30 questions, and how many questions each got. Open one in a new tab to see every Cambridge question on it.
4The reasons for international trade3Aggregate Demand and Aggregate Supply analysis2Price elasticity of supply2Price elasticity, income elasticity and cross elasticity of demand2Price stability2Production possibility curves2Resource allocation in different economic systems2The interaction of demand and supply2Addressing income and wealth inequality1Consumer and producer surplus1Current account of the balance of payments1Exchange rates1Fiscal policy1Policies to correct imbalances in the current account of the balance of payments1Protectionism1Scarcity, choice and opportunity cost1Supply-side policy1What you needed in this session
Cambridge’s own grade thresholds for 2016 May/June, Paper 1 · Variant 1. A higher threshold means an easier paper — the bar moves with how the cohort did.