Cambridge A Level Economics 9708 — 2024 Feb/March Paper 1 · Variant 2
9708/12/F/M/24 · 30 questions · 30 marks · ≈34 min
The question paper and its mark scheme, free to read here and free to download. This is Cambridge’s own paper, exactly as it was sat.
Question paper12 pages
Mark scheme3 pages
Answers below. Sit the paper first if you are practising.
Questions as text
Q1 · Why does a production possibility curve exist for every economy?
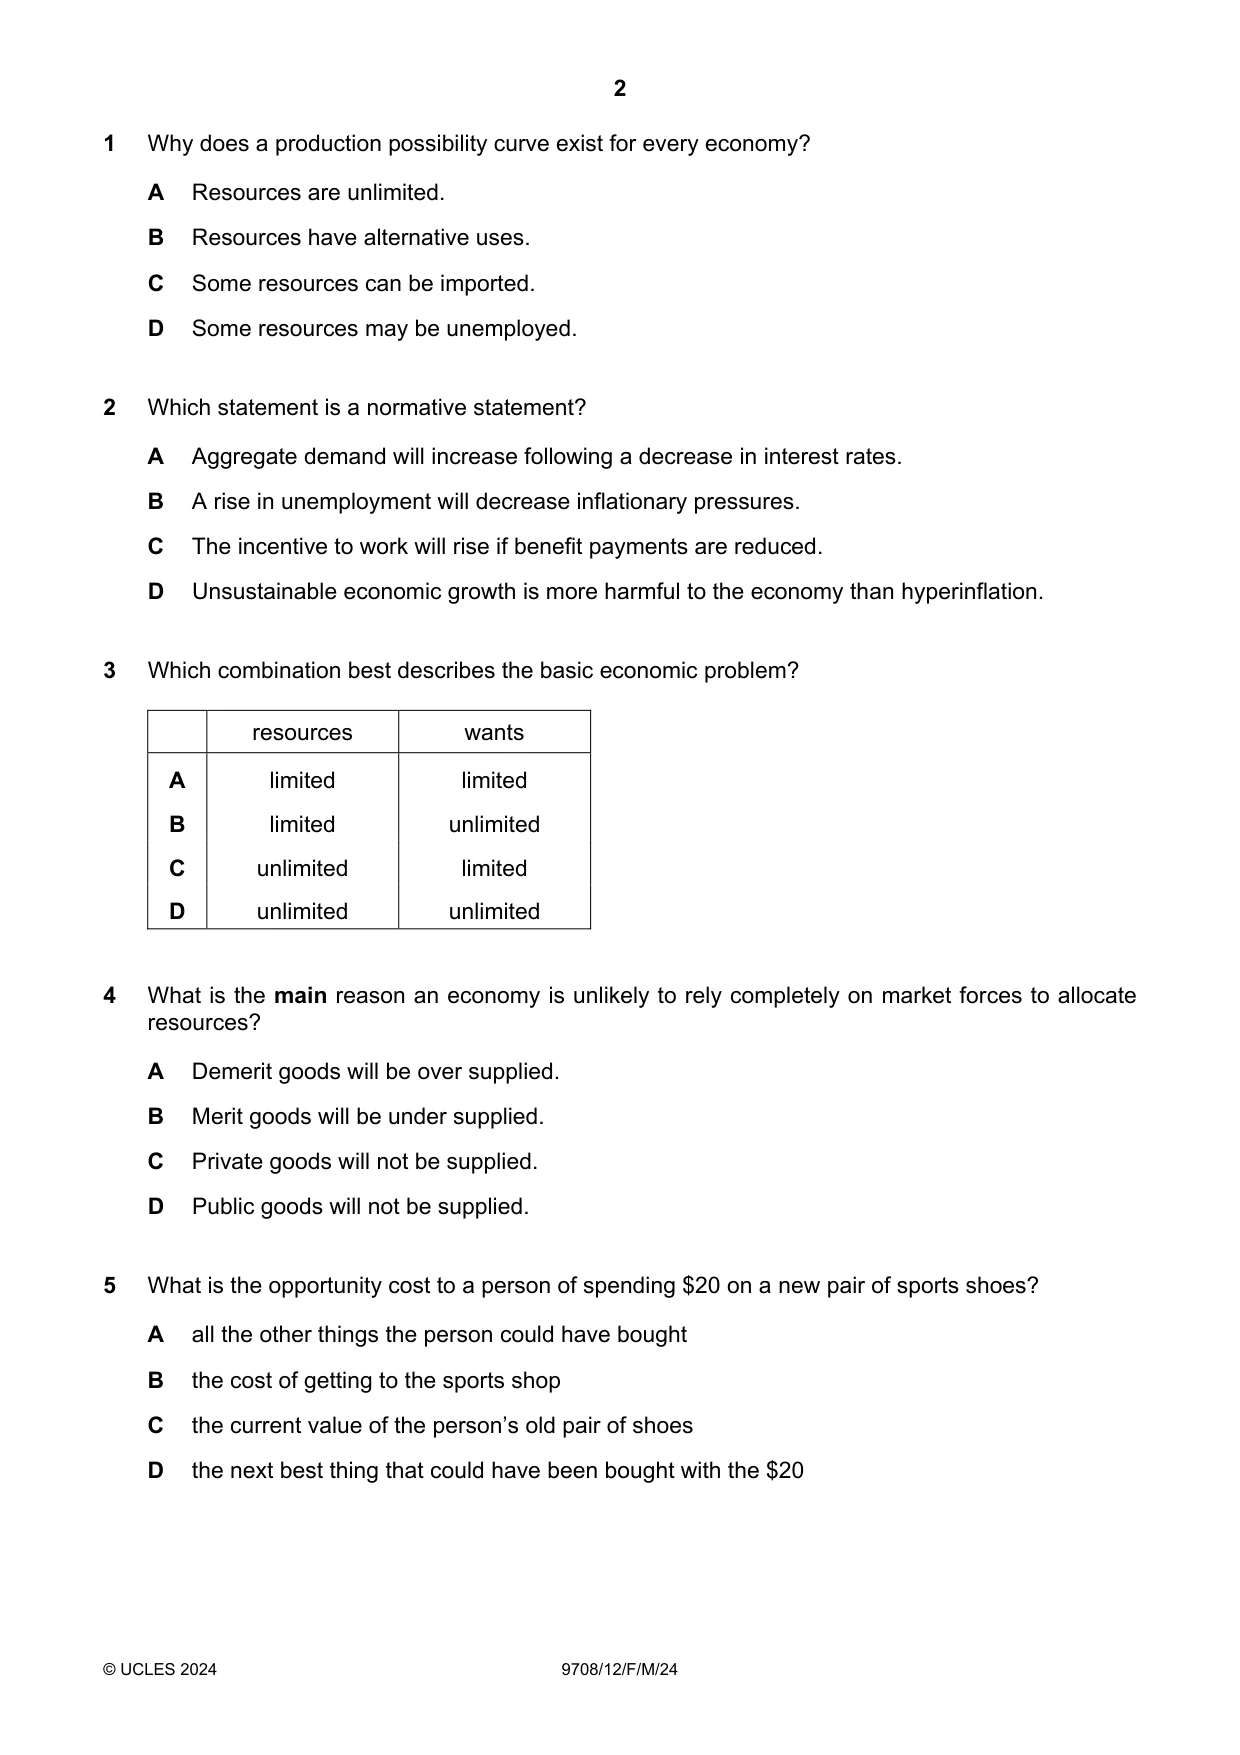
1 Why does a production possibility curve exist for every economy? A Resources are unlimited. B Resources have alternative uses. C Some resources can be imported. D Some resources may be unemployed.
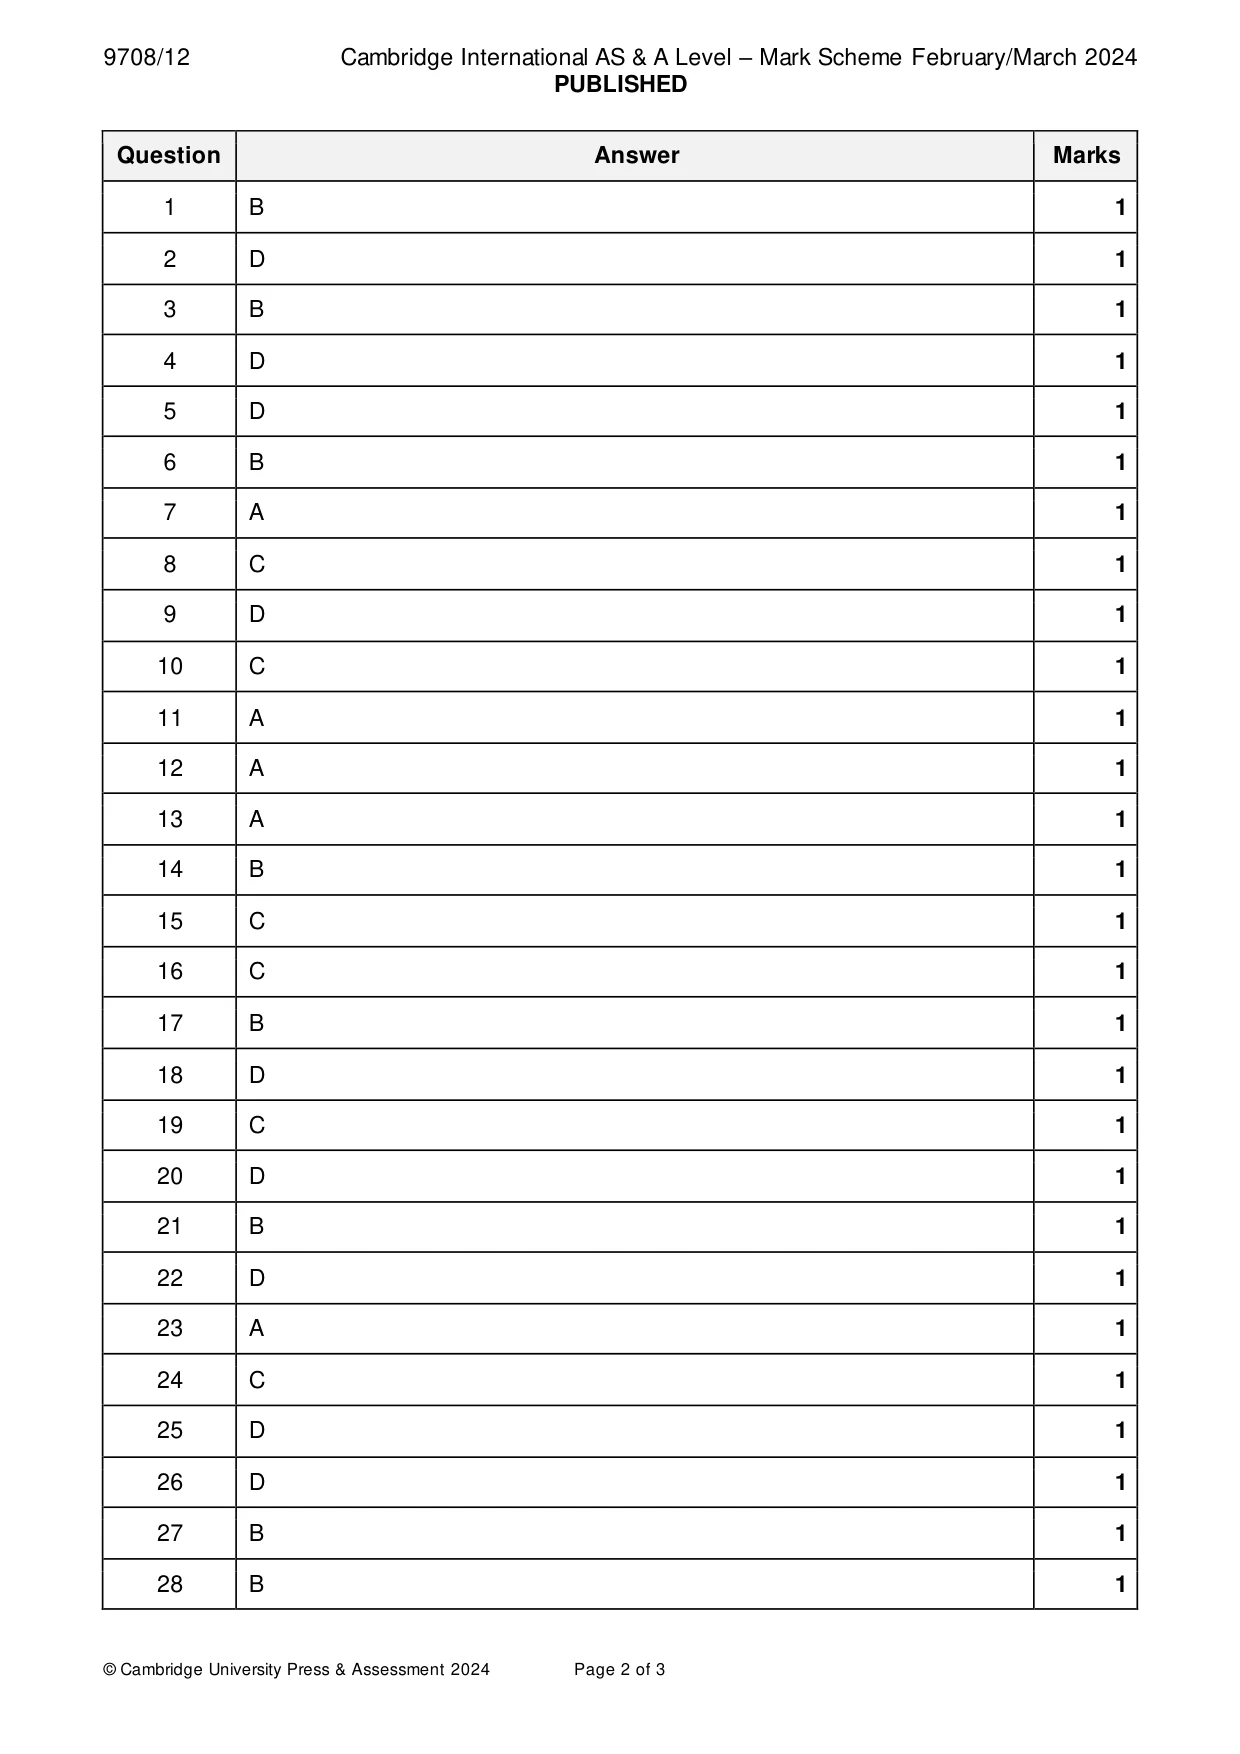
Mark scheme: B
Q2 · Which statement is a normative statement?
2 Which statement is a normative statement? A Aggregate demand will increase following a decrease in interest rates. B A rise in unemployment will decrease inflationary pressures. C The incentive to work will rise if benefit payments are reduced. D Unsustainable economic growth is more harmful to the economy than hyperinflation.
Mark scheme: D
Q3 · Which combination best describes the basic economic problem?
3 Which combination best describes the basic economic problem? resources wants A limited limited B limited unlimited C unlimited limited D unlimited unlimited
Mark scheme: B
Q4 · What is the main reason an economy is unlikely to rely completely on market forces to…
4 What is the main reason an economy is unlikely to rely completely on market forces to allocate resources? A Demerit goods will be over supplied. B Merit goods will be under supplied. C Private goods will not be supplied. D Public goods will not be supplied.
Mark scheme: D
More questions on Resource allocation in different economic systems
Q5 · What is the opportunity cost to a person of spending $20 on a new pair of sports shoes?
5 What is the opportunity cost to a person of spending $20 on a new pair of sports shoes? A all the other things the person could have bought B the cost of getting to the sports shop C the current value of the person’s old pair of shoes D the next best thing that could have been bought with the $20
Mark scheme: D
Q6 · What is the definition of effective demand?
6 What is the definition of effective demand? A demand that is speculative B demand that is supported by the ability to pay C the relationship between price and quantity demanded D the total amount demanded by consumers
Mark scheme: B
Q7 · The price elasticity of demand for good X is –2.4, its income elasticity of demand is…
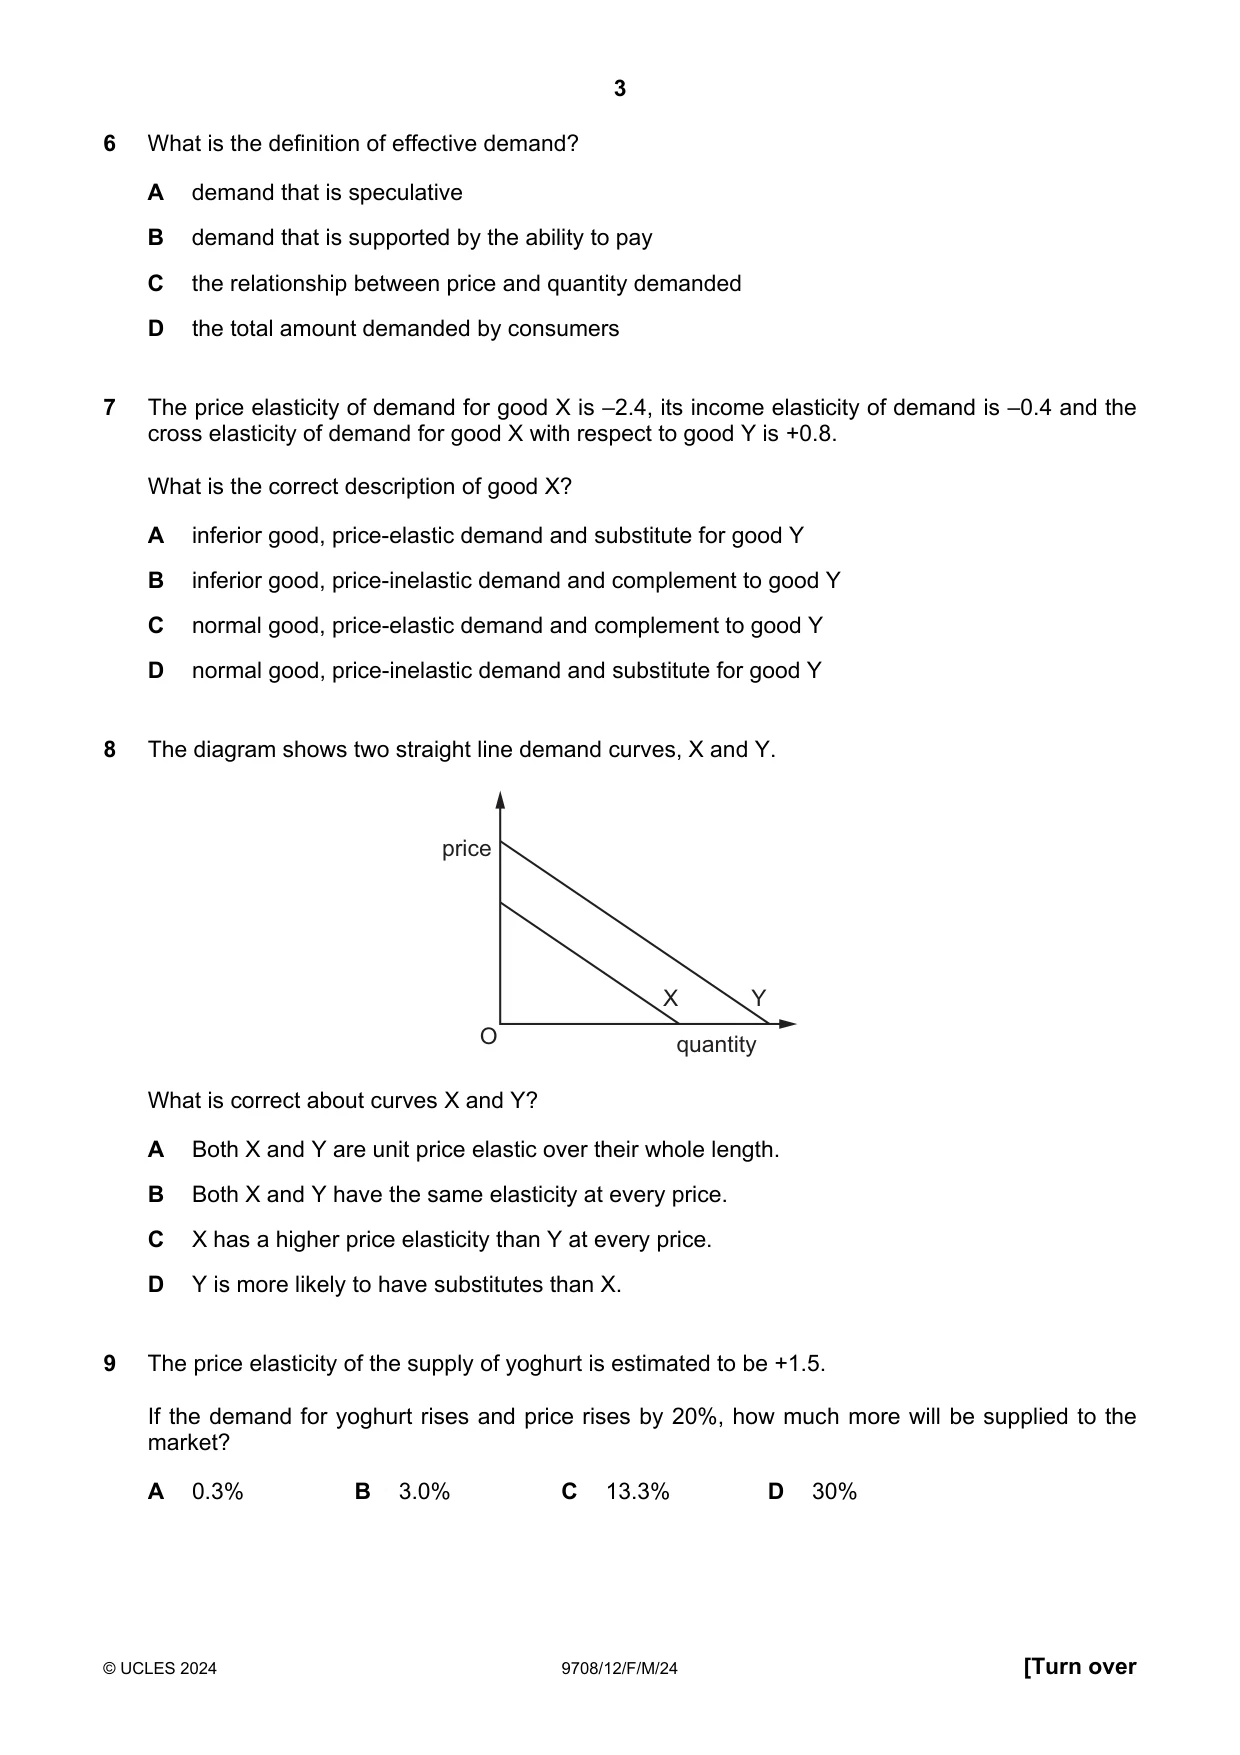
7 The price elasticity of demand for good X is –2.4, its income elasticity of demand is –0.4 and the cross elasticity of demand for good X with respect to good Y is +0.8. What is the correct description of good X? A inferior good, price-elastic demand and substitute for good Y B inferior good, price-inelastic demand and complement to good Y C normal good, price-elastic demand and complement to good Y D normal good, price-inelastic demand and substitute for good Y
Mark scheme: A
More questions on Price elasticity, income elasticity and cross elasticity of demand
Q8 · The diagram shows two straight line demand curves, X and Y
8 The diagram shows two straight line demand curves, X and Y. price X Y O quantity What is correct about curves X and Y? A Both X and Y are unit price elastic over their whole length. B Both X and Y have the same elasticity at every price. C X has a higher price elasticity than Y at every price. D Y is more likely to have substitutes than X.
Mark scheme: C
More questions on Price elasticity, income elasticity and cross elasticity of demand
Q9 · The price elasticity of the supply of yoghurt is estimated to be +1.5
9 The price elasticity of the supply of yoghurt is estimated to be +1.5. If the demand for yoghurt rises and price rises by 20%, how much more will be supplied to the market? A 0.3% B 3.0% C 13.3% D 30%
Mark scheme: D
Q10 · Butter is a normal good
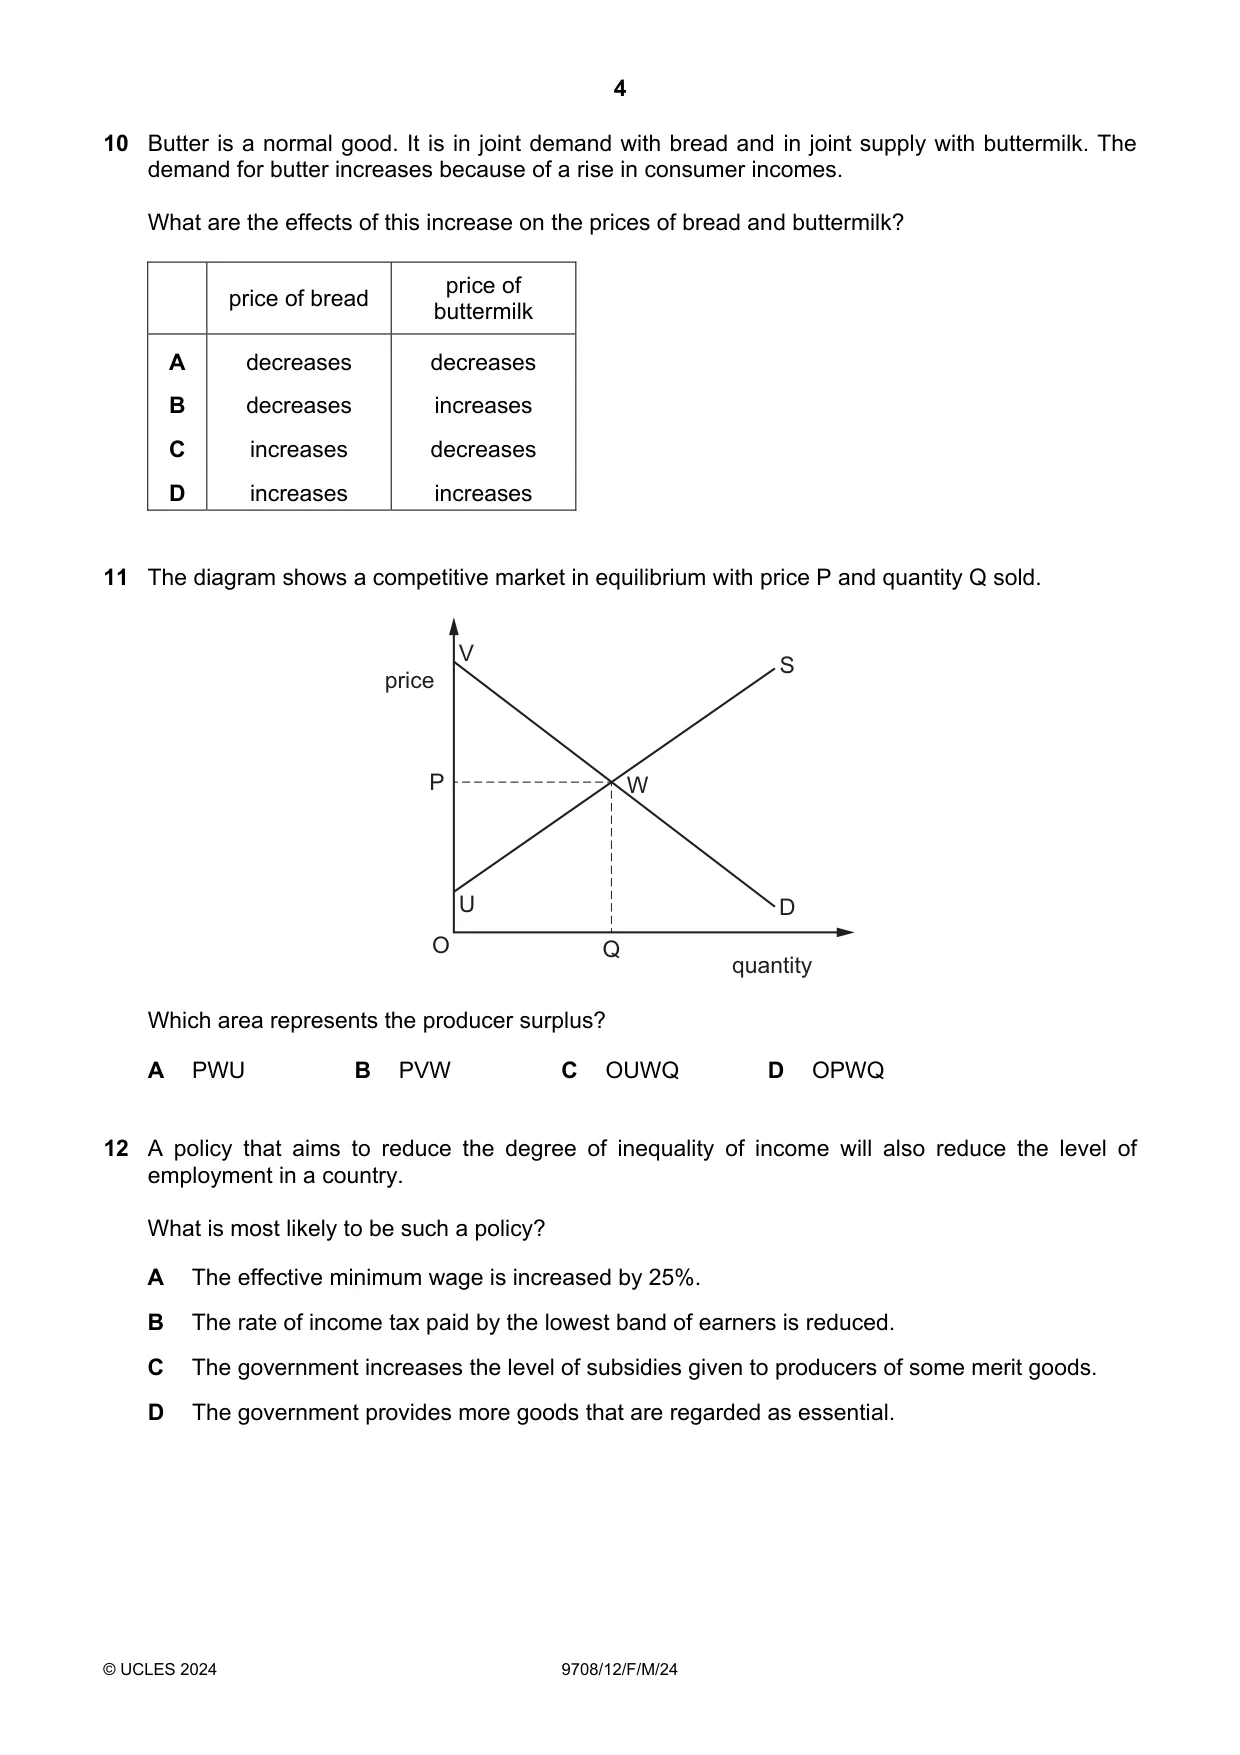
10 Butter is a normal good. It is in joint demand with bread and in joint supply with buttermilk. The demand for butter increases because of a rise in consumer incomes. What are the effects of this increase on the prices of bread and buttermilk? price of price of bread buttermilk A decreases decreases B decreases increases C increases decreases D increases increases
Mark scheme: C
Q11 · The diagram shows a competitive market in equilibrium with price P and quantity Q sold
11 The diagram shows a competitive market in equilibrium with price P and quantity Q sold. V S price P W U D O Q quantity Which area represents the producer surplus? A PWU B PVW C OUWQ D OPWQ
Mark scheme: A
Q12 · A policy that aims to reduce the degree of inequality of income will also reduce the…
12 A policy that aims to reduce the degree of inequality of income will also reduce the level of employment in a country. What is most likely to be such a policy? A The effective minimum wage is increased by 25%. B The rate of income tax paid by the lowest band of earners is reduced. C The government increases the level of subsidies given to producers of some merit goods. D The government provides more goods that are regarded as essential.
Mark scheme: A
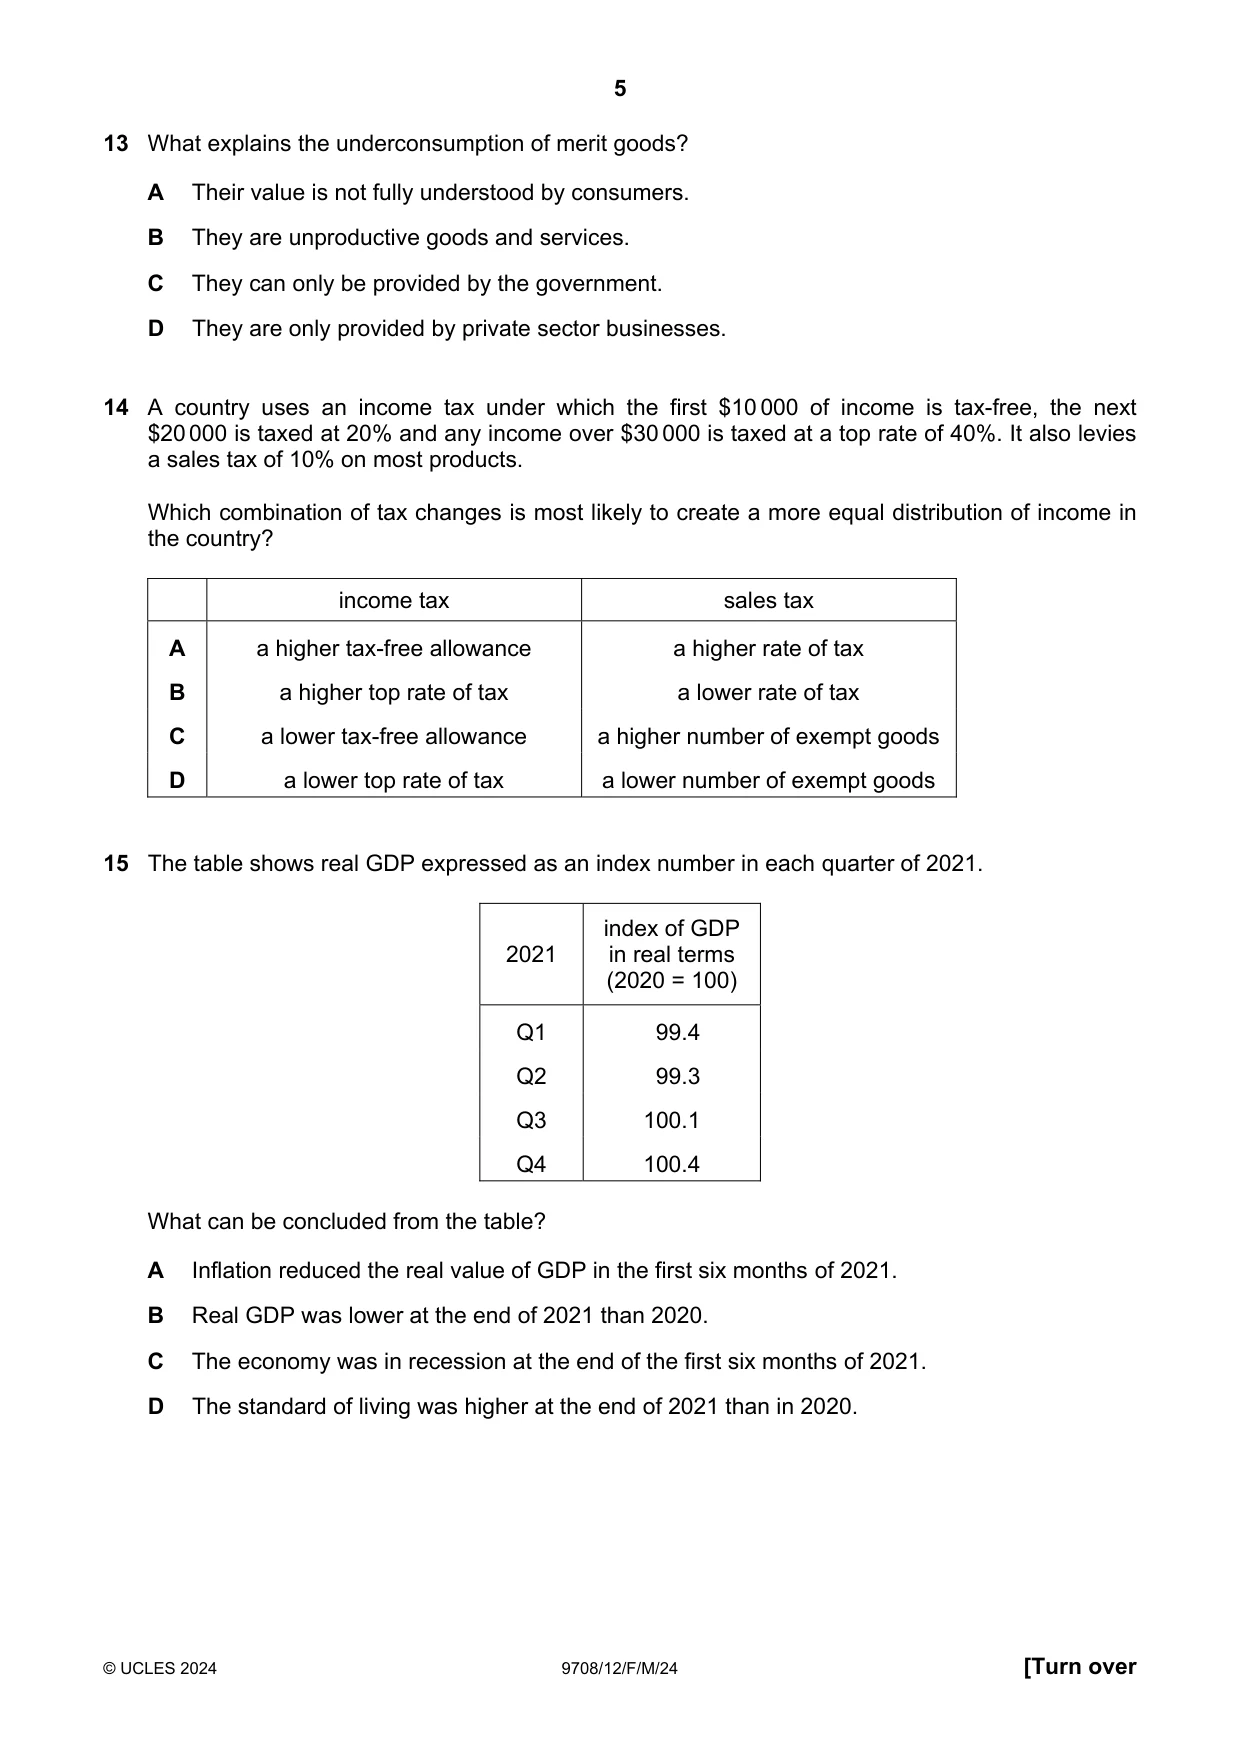
Q13 · What explains the underconsumption of merit goods?
13 What explains the underconsumption of merit goods? A Their value is not fully understood by consumers. B They are unproductive goods and services. C They can only be provided by the government. D They are only provided by private sector businesses.
Mark scheme: A
More questions on Reasons for government intervention in markets
Q14 · A country uses an income tax under which the first $10 000 of income is tax-free, the…
14 A country uses an income tax under which the first $10 000 of income is tax-free, the next $20 000 is taxed at 20% and any income over $30 000 is taxed at a top rate of 40%. It also levies a sales tax of 10% on most products. Which combination of tax changes is most likely to create a more equal distribution of income in the country? income tax sales tax A a higher tax-free allowance a higher rate of tax B a higher top rate of tax a lower rate of tax C a lower tax-free allowance a higher number of exempt goods D a lower top rate of tax a lower number of exempt goods
Mark scheme: B
Q15 · The table shows real GDP expressed as an index number in each quarter of 2021
15 The table shows real GDP expressed as an index number in each quarter of 2021. index of GDP 2021 in real terms (2020 = 100) Q1 99.4 Q2 99.3 Q3 100.1 Q4 100.4 What can be concluded from the table? A Inflation reduced the real value of GDP in the first six months of 2021. B Real GDP was lower at the end of 2021 than 2020. C The economy was in recession at the end of the first six months of 2021. D The standard of living was higher at the end of 2021 than in 2020.
Mark scheme: C
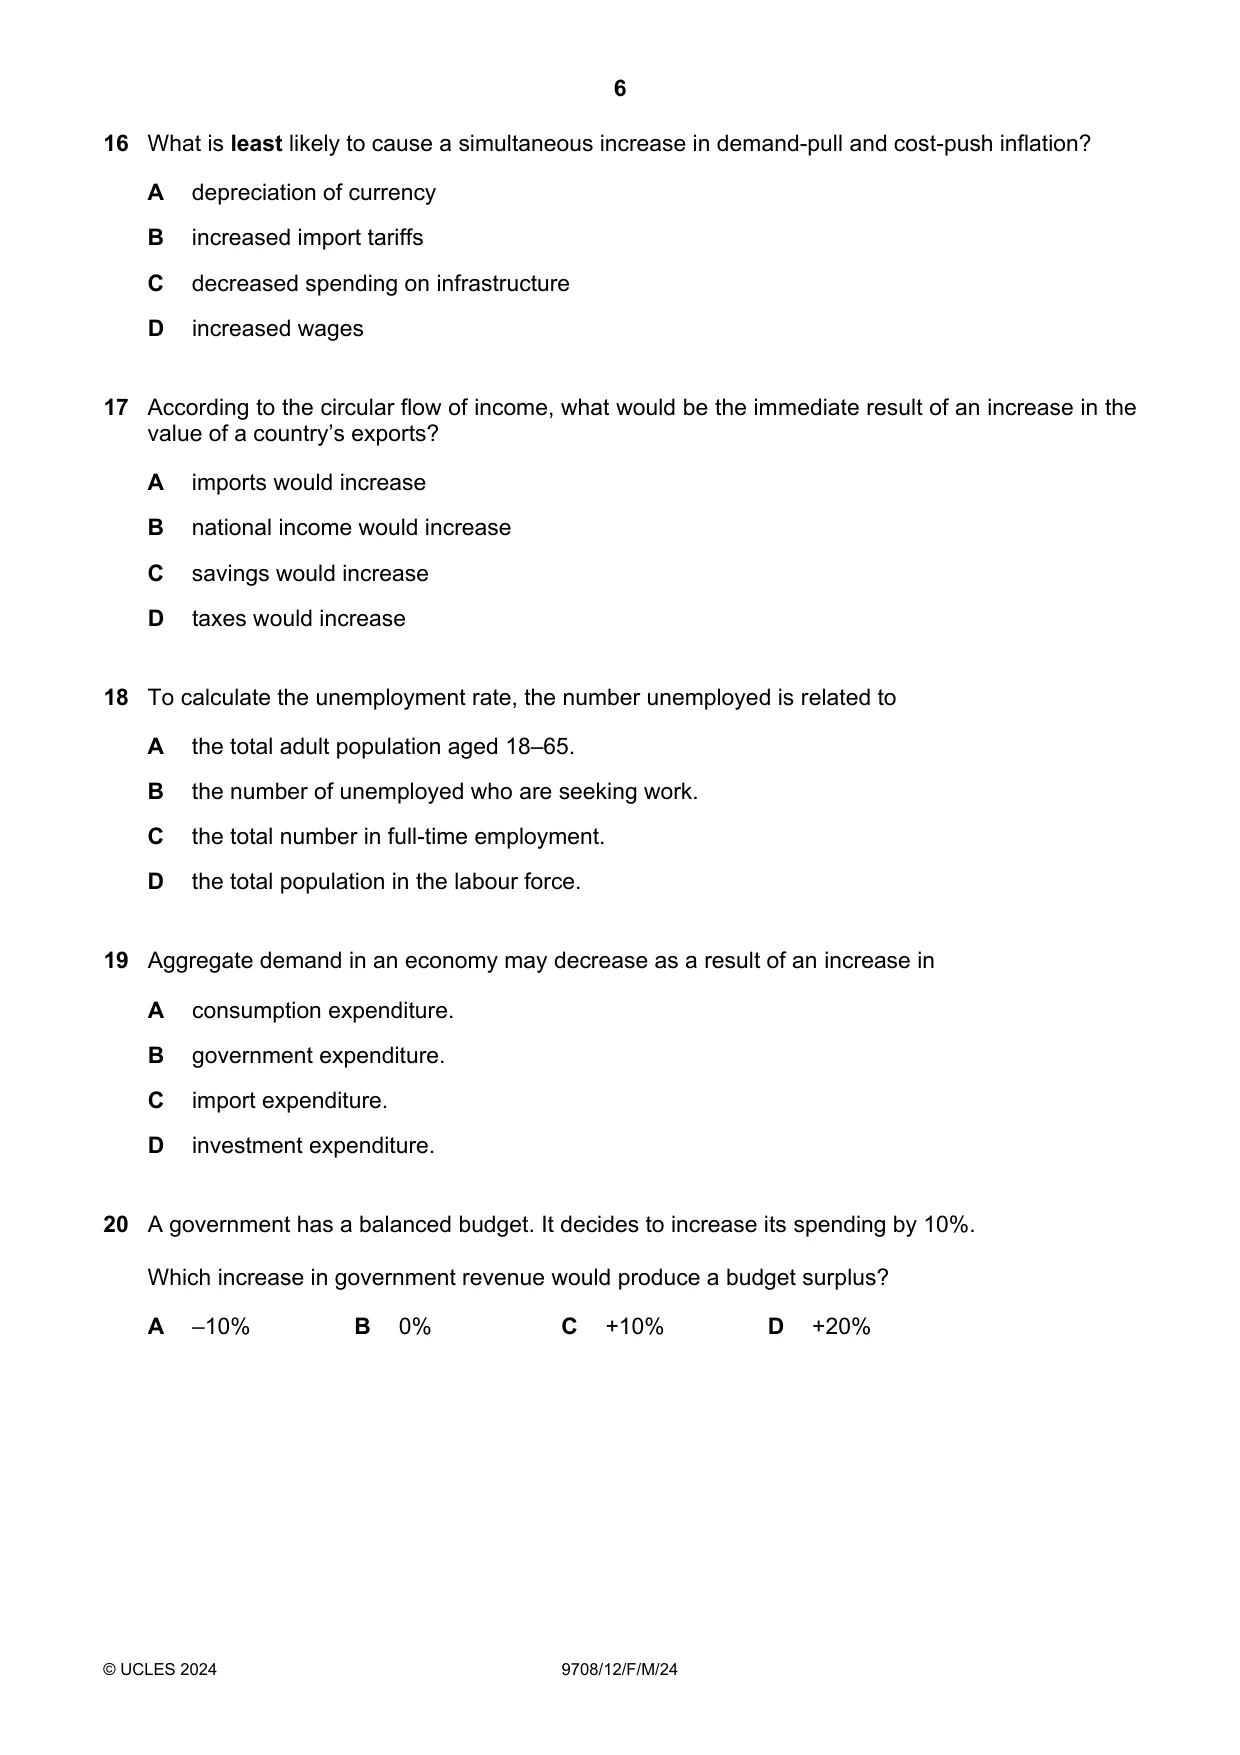
Q16 · What is least likely to cause a simultaneous increase in demand-pull and cost-push…
16 What is least likely to cause a simultaneous increase in demand-pull and cost-push inflation? A depreciation of currency B increased import tariffs C decreased spending on infrastructure D increased wages
Mark scheme: C
Q17 · According to the circular flow of income, what would be the immediate result of an…
17 According to the circular flow of income, what would be the immediate result of an increase in the value of a country’s exports? A imports would increase B national income would increase C savings would increase D taxes would increase
Mark scheme: B
More questions on Introduction to the circular flow of income
Q18 · To calculate the unemployment rate, the number unemployed is related to A the total adult…
18 To calculate the unemployment rate, the number unemployed is related to A the total adult population aged 18–65. B the number of unemployed who are seeking work. C the total number in full-time employment. D the total population in the labour force.
Mark scheme: D
Q19 · Aggregate demand in an economy may decrease as a result of an increase in A consumption…
19 Aggregate demand in an economy may decrease as a result of an increase in A consumption expenditure. B government expenditure. C import expenditure. D investment expenditure.
Mark scheme: C
More questions on Aggregate Demand and Aggregate Supply analysis
Q20 · A government has a balanced budget
20 A government has a balanced budget. It decides to increase its spending by 10%. Which increase in government revenue would produce a budget surplus? A –10% B 0% C +10% D +20%
Mark scheme: D
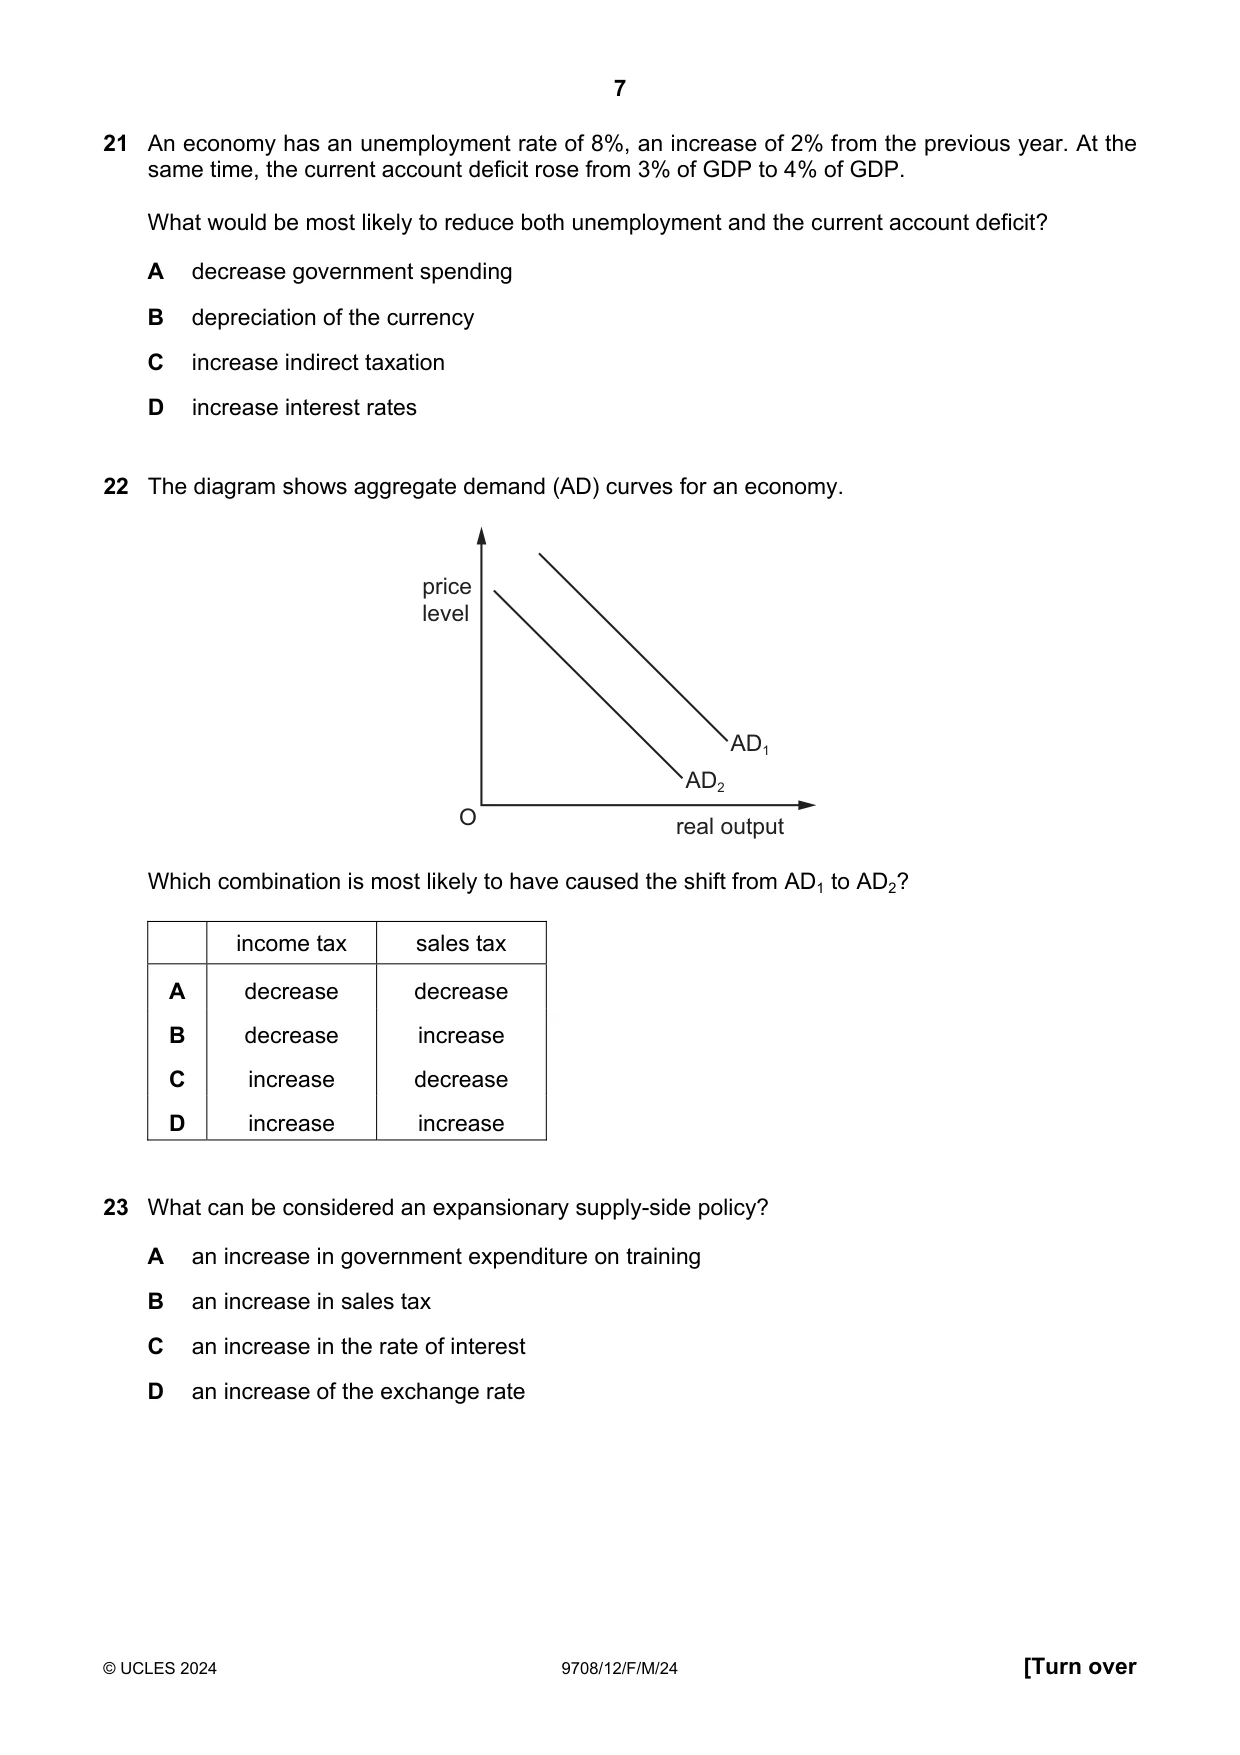
Q21 · An economy has an unemployment rate of 8%, an increase of 2% from the previous year
21 An economy has an unemployment rate of 8%, an increase of 2% from the previous year. At the same time, the current account deficit rose from 3% of GDP to 4% of GDP. What would be most likely to reduce both unemployment and the current account deficit? A decrease government spending B depreciation of the currency C increase indirect taxation D increase interest rates
Mark scheme: B
More questions on Policies to correct disequilibrium in the balance of payments
Q22 · The diagram shows aggregate demand (AD) curves for an economy
22 The diagram shows aggregate demand (AD) curves for an economy. price level AD1 AD2 O real output Which combination is most likely to have caused the shift from AD1 to AD2? income tax sales tax A decrease decrease B decrease increase C increase decrease D increase increase
Mark scheme: D
Q23 · What can be considered an expansionary supply-side policy?
23 What can be considered an expansionary supply-side policy? A an increase in government expenditure on training B an increase in sales tax C an increase in the rate of interest D an increase of the exchange rate
Mark scheme: A
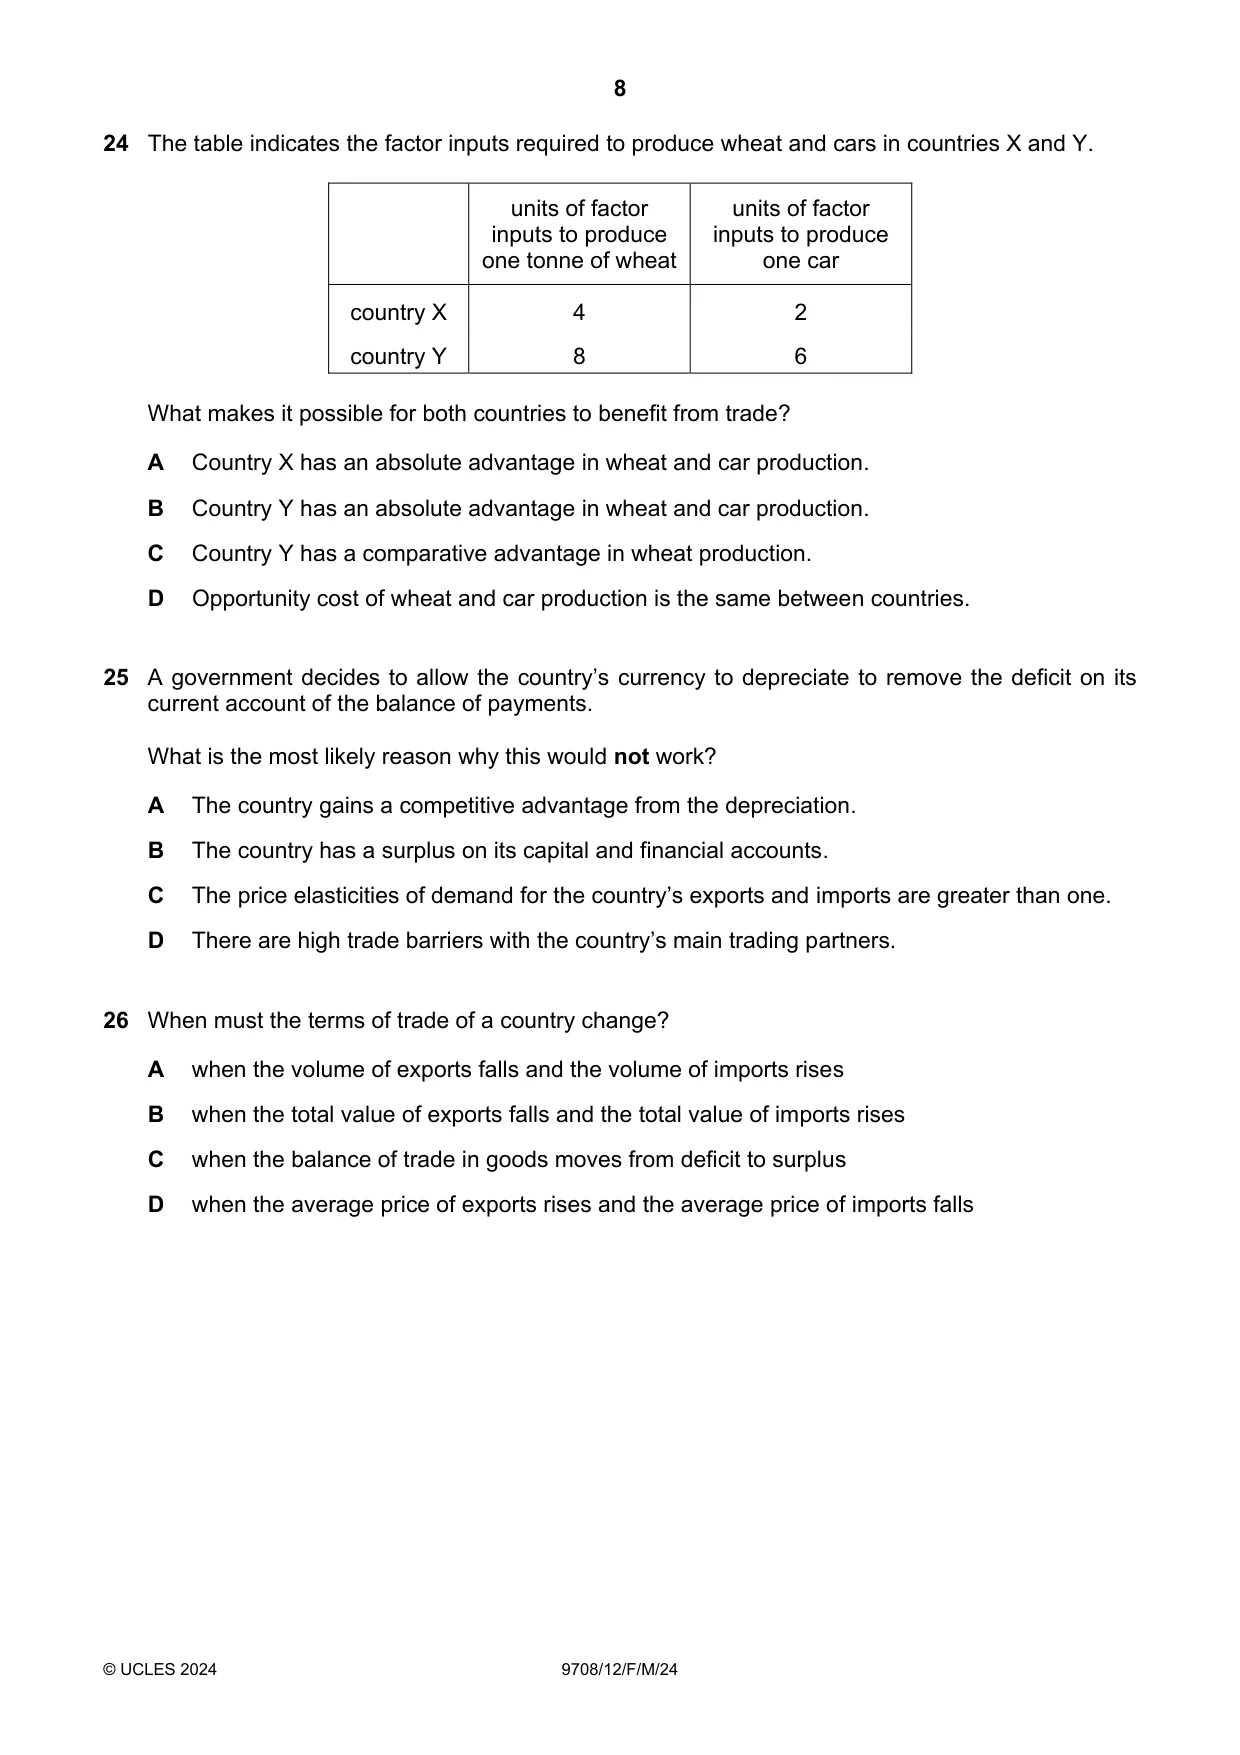
Q24 · The table indicates the factor inputs required to produce wheat and cars in countries X…
24 The table indicates the factor inputs required to produce wheat and cars in countries X and Y. units of factor units of factor inputs to produce inputs to produce one tonne of wheat one car country X 4 2 country Y 8 6 What makes it possible for both countries to benefit from trade? A Country X has an absolute advantage in wheat and car production. B Country Y has an absolute advantage in wheat and car production. C Country Y has a comparative advantage in wheat production. D Opportunity cost of wheat and car production is the same between countries.
Mark scheme: C
Q25 · A government decides to allow the country’s currency to depreciate to remove the deficit…
25 A government decides to allow the country’s currency to depreciate to remove the deficit on its current account of the balance of payments. What is the most likely reason why this would not work? A The country gains a competitive advantage from the depreciation. B The country has a surplus on its capital and financial accounts. C The price elasticities of demand for the country’s exports and imports are greater than one. D There are high trade barriers with the country’s main trading partners.
Mark scheme: D
More questions on Policies to correct imbalances in the current account of the balance of payments
Q26 · When must the terms of trade of a country change?
26 When must the terms of trade of a country change? A when the volume of exports falls and the volume of imports rises B when the total value of exports falls and the total value of imports rises C when the balance of trade in goods moves from deficit to surplus D when the average price of exports rises and the average price of imports falls
Mark scheme: D
More questions on Relationship between countries at different levels of development
Q27 · The table shows an extract from a country’s balance of payments
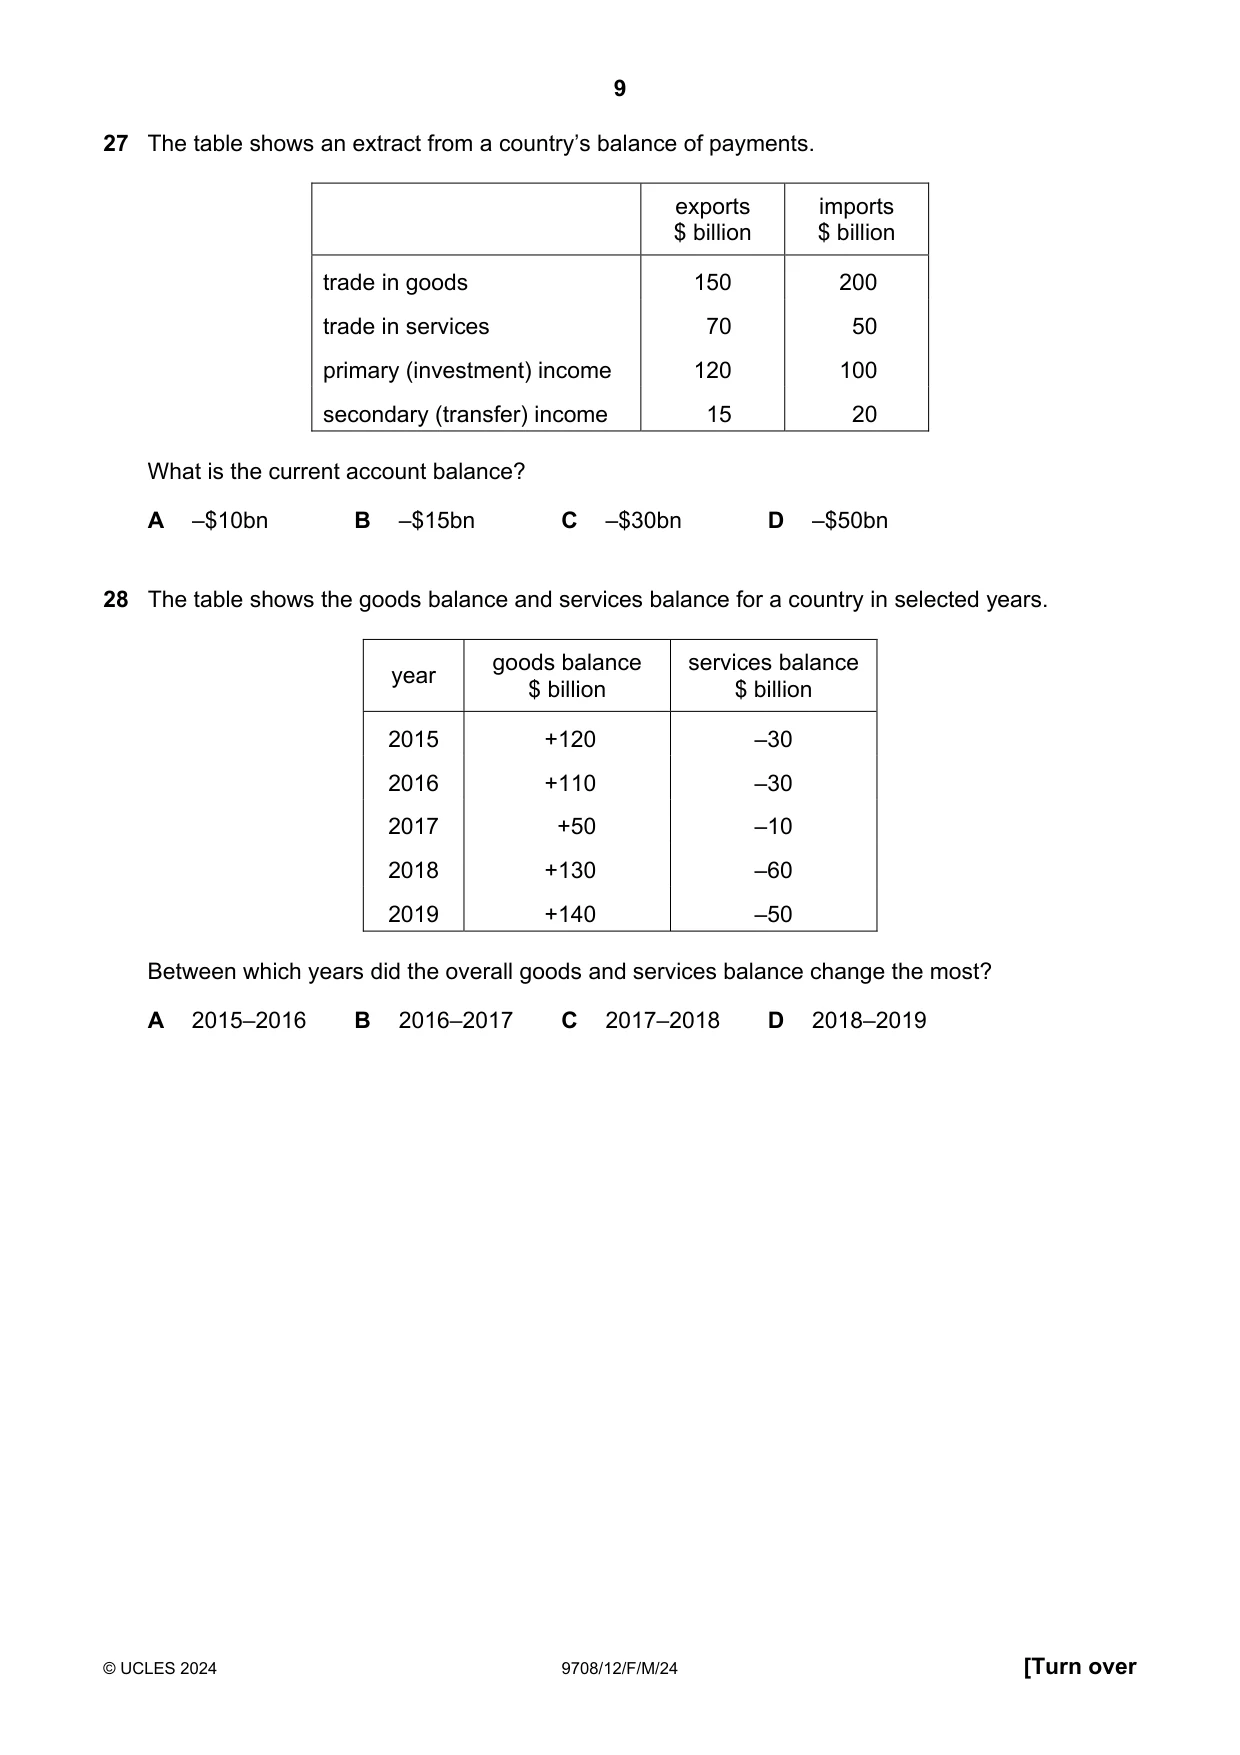
27 The table shows an extract from a country’s balance of payments. exports imports $ billion $ billion trade in goods 150 200 trade in services 70 50 primary (investment) income 120 100 secondary (transfer) income 15 20 What is the current account balance? A –$10bn B –$15bn C –$30bn D –$50bn
Mark scheme: B
More questions on Current account of the balance of payments
Q28 · The table shows the goods balance and services balance for a country in selected years
28 The table shows the goods balance and services balance for a country in selected years. goods balance services balance year $ billion $ billion 2015 +120 –30 2016 +110 –30 2017 +50 –10 2018 +130 –60 2019 +140 –50 Between which years did the overall goods and services balance change the most? A 2015–2016 B 2016–2017 C 2017–2018 D 2018–2019
Mark scheme: B
More questions on Current account of the balance of payments
Q29 · The diagram shows the market for both domestic and imported computers for an economy
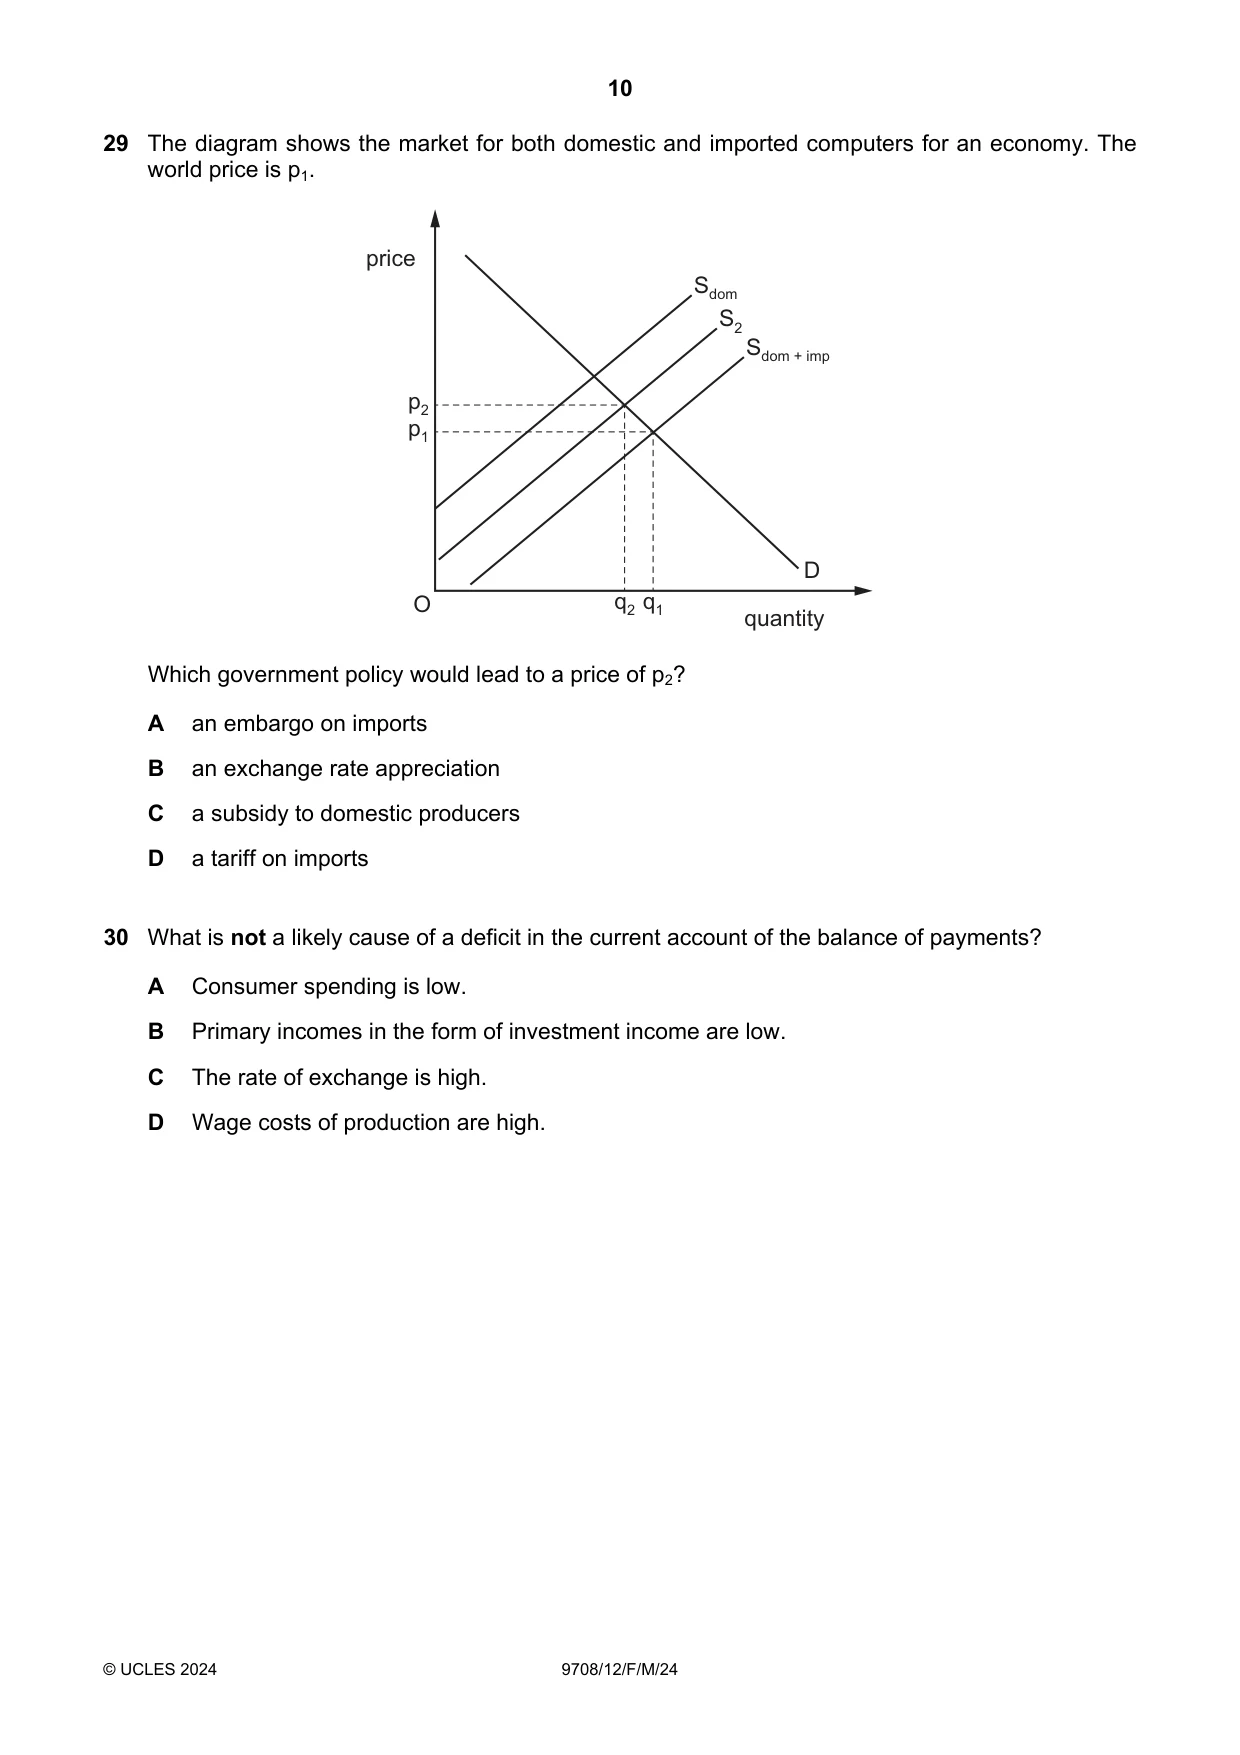
29 The diagram shows the market for both domestic and imported computers for an economy. The world price is p1. price Sdom S2 Sdom + imp p2 p1 D O q2 q1 quantity Which government policy would lead to a price of p2? A an embargo on imports B an exchange rate appreciation C a subsidy to domestic producers D a tariff on imports
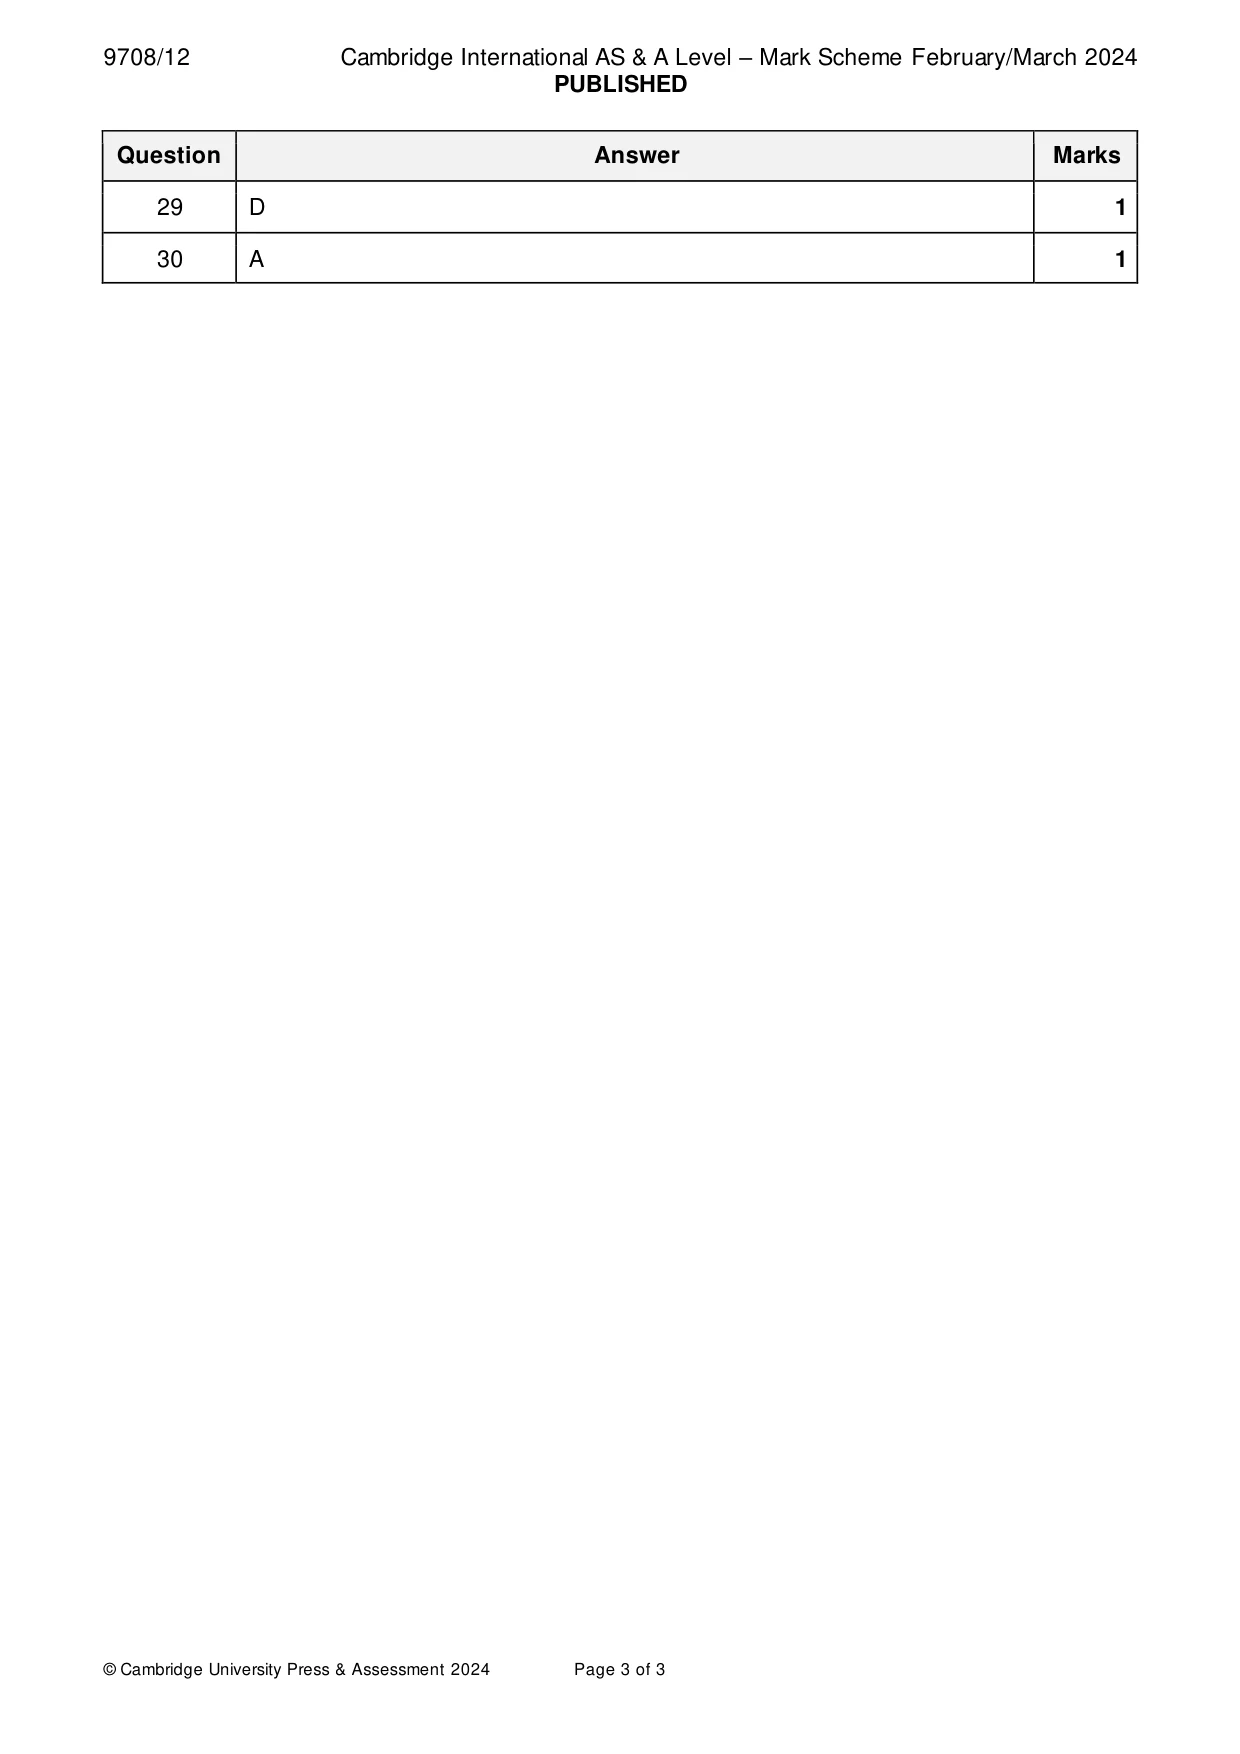
Mark scheme: D
Q30 · What is not a likely cause of a deficit in the current account of the balance of payments?
30 What is not a likely cause of a deficit in the current account of the balance of payments? A Consumer spending is low. B Primary incomes in the form of investment income are low. C The rate of exchange is high. D Wage costs of production are high.
Mark scheme: A
More questions on Current account of the balance of payments
What was in this paper
The subtopics covered by these 30 questions, and how many questions each got. Open one in a new tab to see every Cambridge question on it.
3Addressing income and wealth inequality2Fiscal policy2Price elasticity, income elasticity and cross elasticity of demand2Scarcity, choice and opportunity cost2Aggregate Demand and Aggregate Supply analysis1Consumer and producer surplus1Demand and supply curves1Economic methodology1Introduction to the circular flow of income1National income statistics1Policies to correct disequilibrium in the balance of payments1Policies to correct imbalances in the current account of the balance of payments1Price elasticity of supply1Price stability1Production possibility curves1Protectionism1Reasons for government intervention in markets1Relationship between countries at different levels of development1Resource allocation in different economic systems1Supply-side policy1The interaction of demand and supply1The reasons for international trade1Unemployment1What you needed in this session
Cambridge’s own grade thresholds for 2024 Feb/March, Paper 1 · Variant 2. A higher threshold means an easier paper — the bar moves with how the cohort did.