Cambridge A Level Economics 9708 — 2021 Oct/Nov Paper 1 · Variant 3
9708/13/O/N/21 · 30 questions · 30 marks · ≈34 min
The question paper and its mark scheme, free to read here and free to download. This is Cambridge’s own paper, exactly as it was sat.
Question paper12 pages
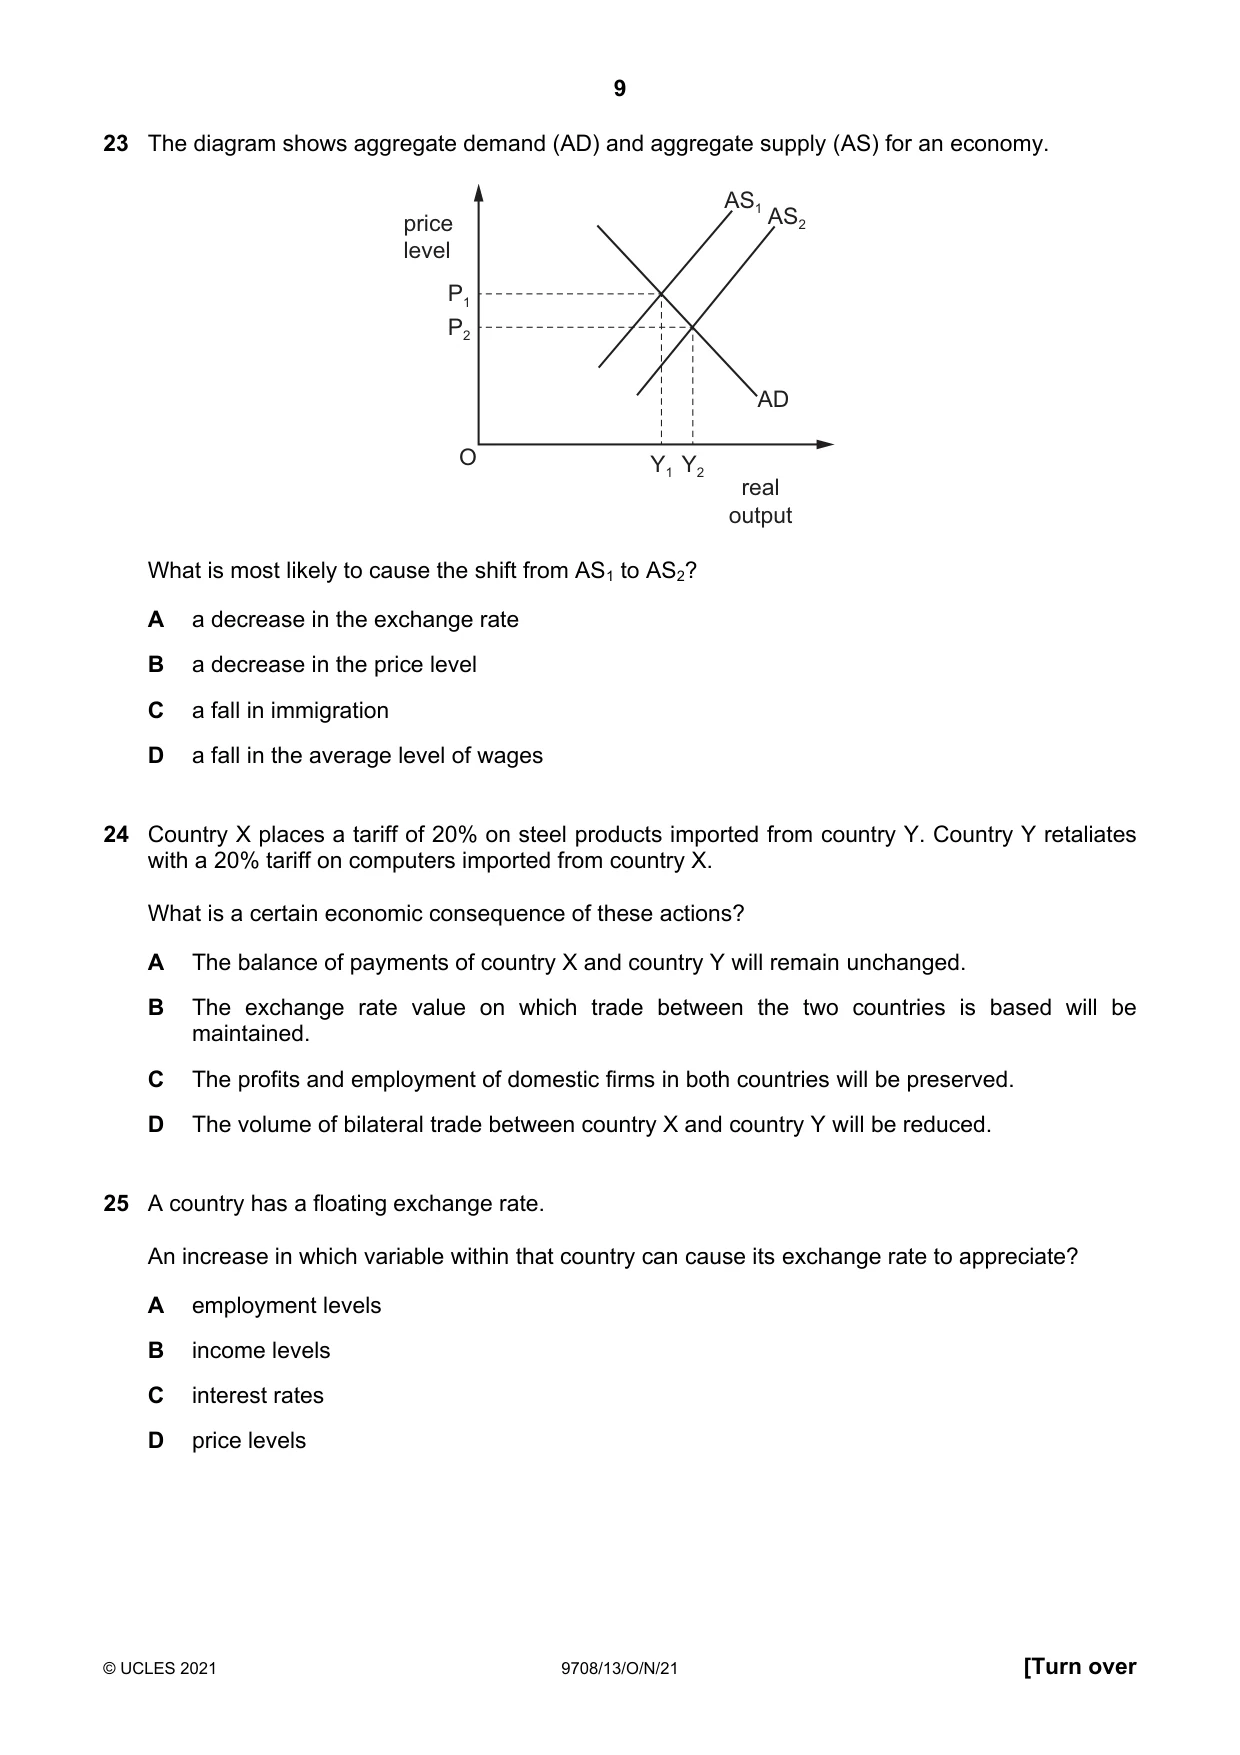
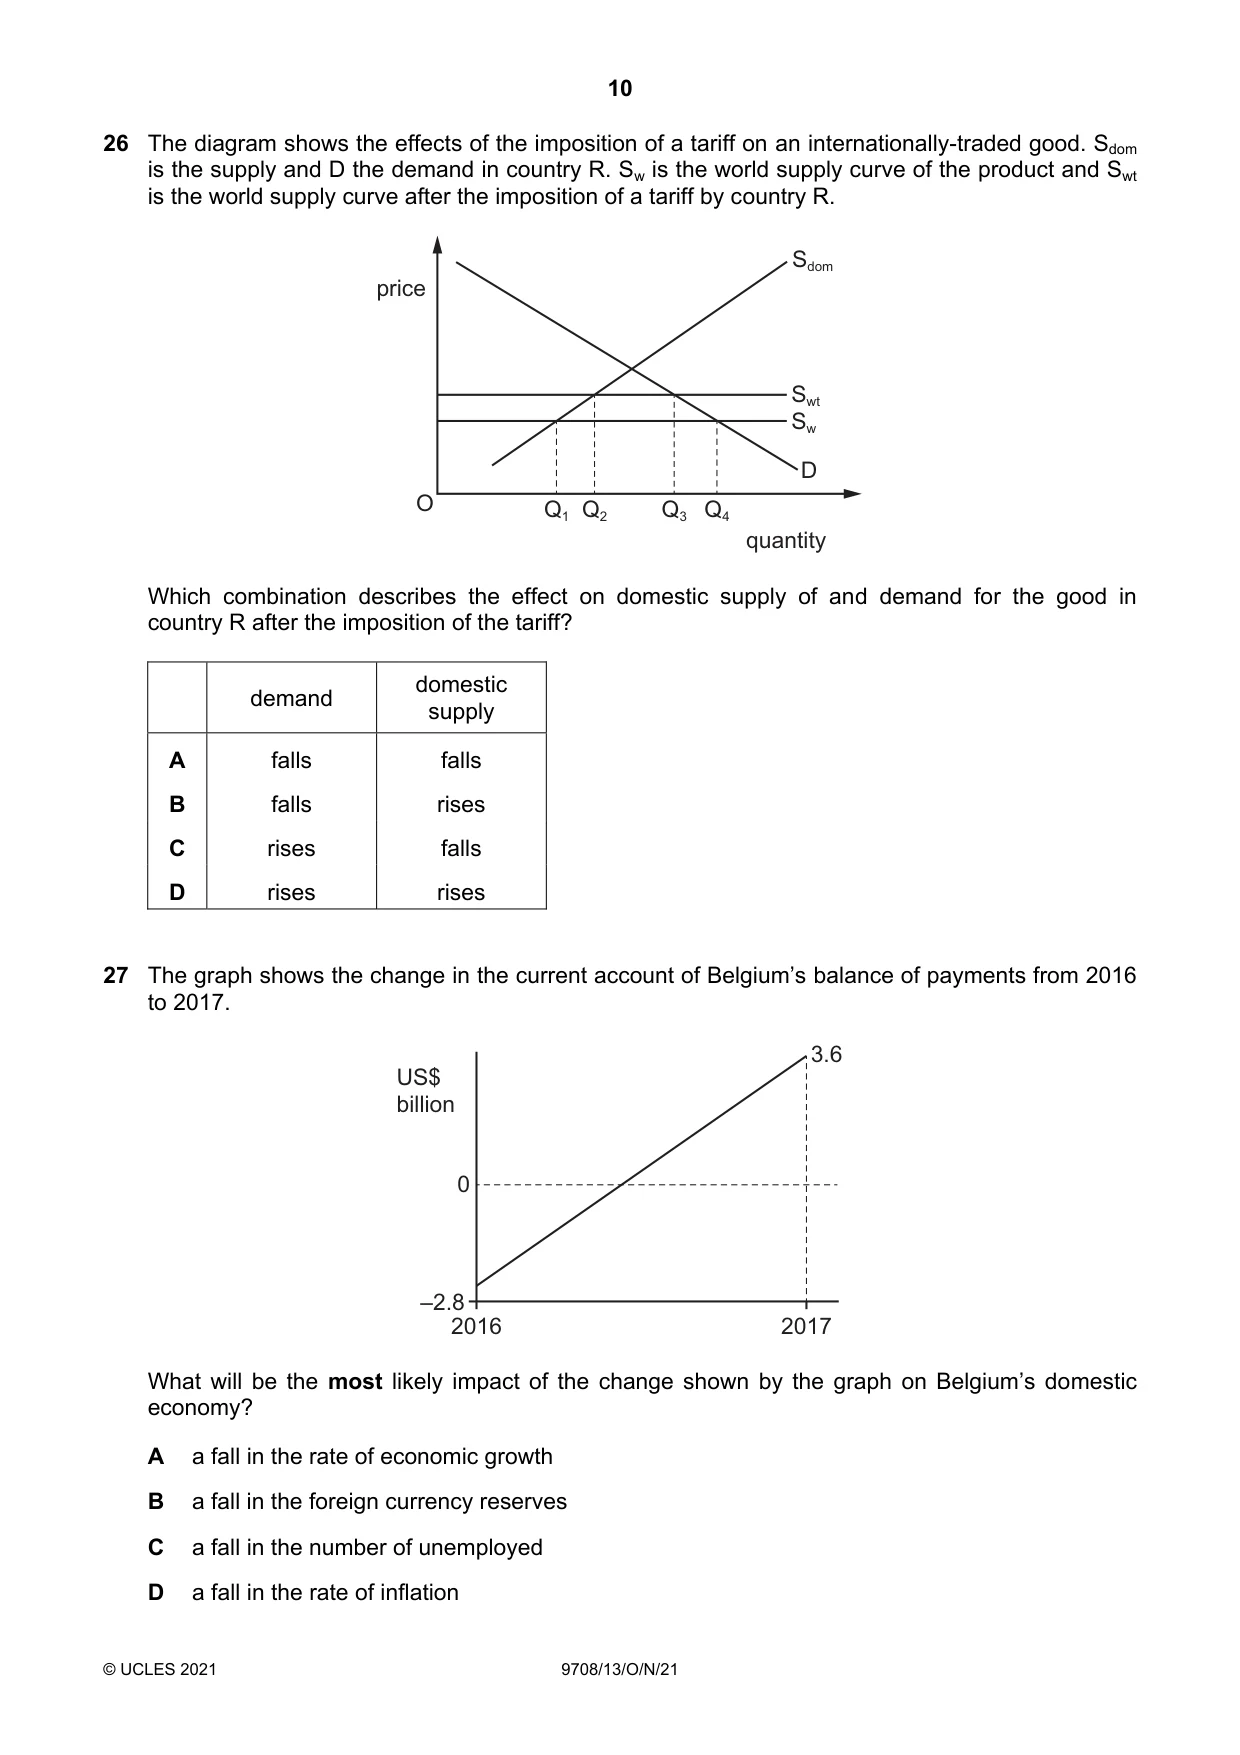
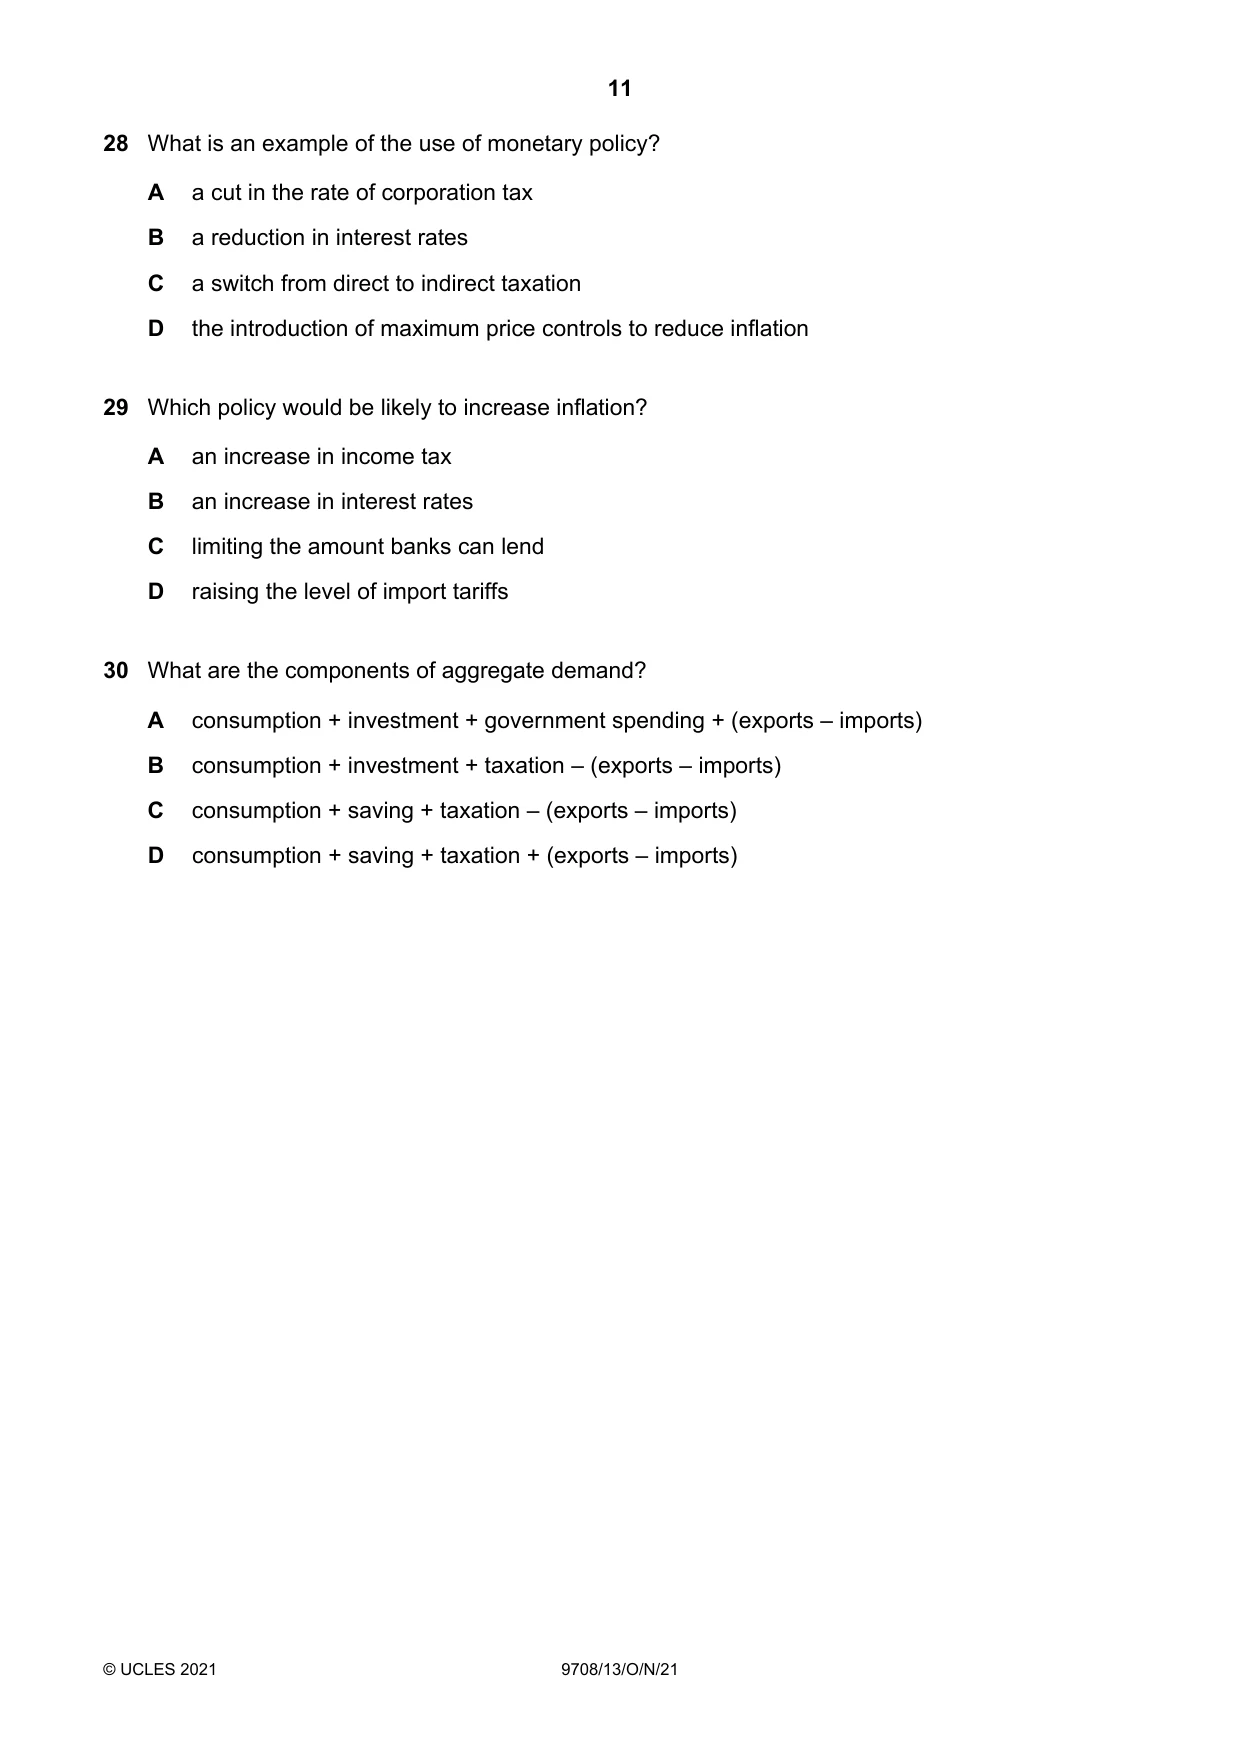
Mark scheme3 pages
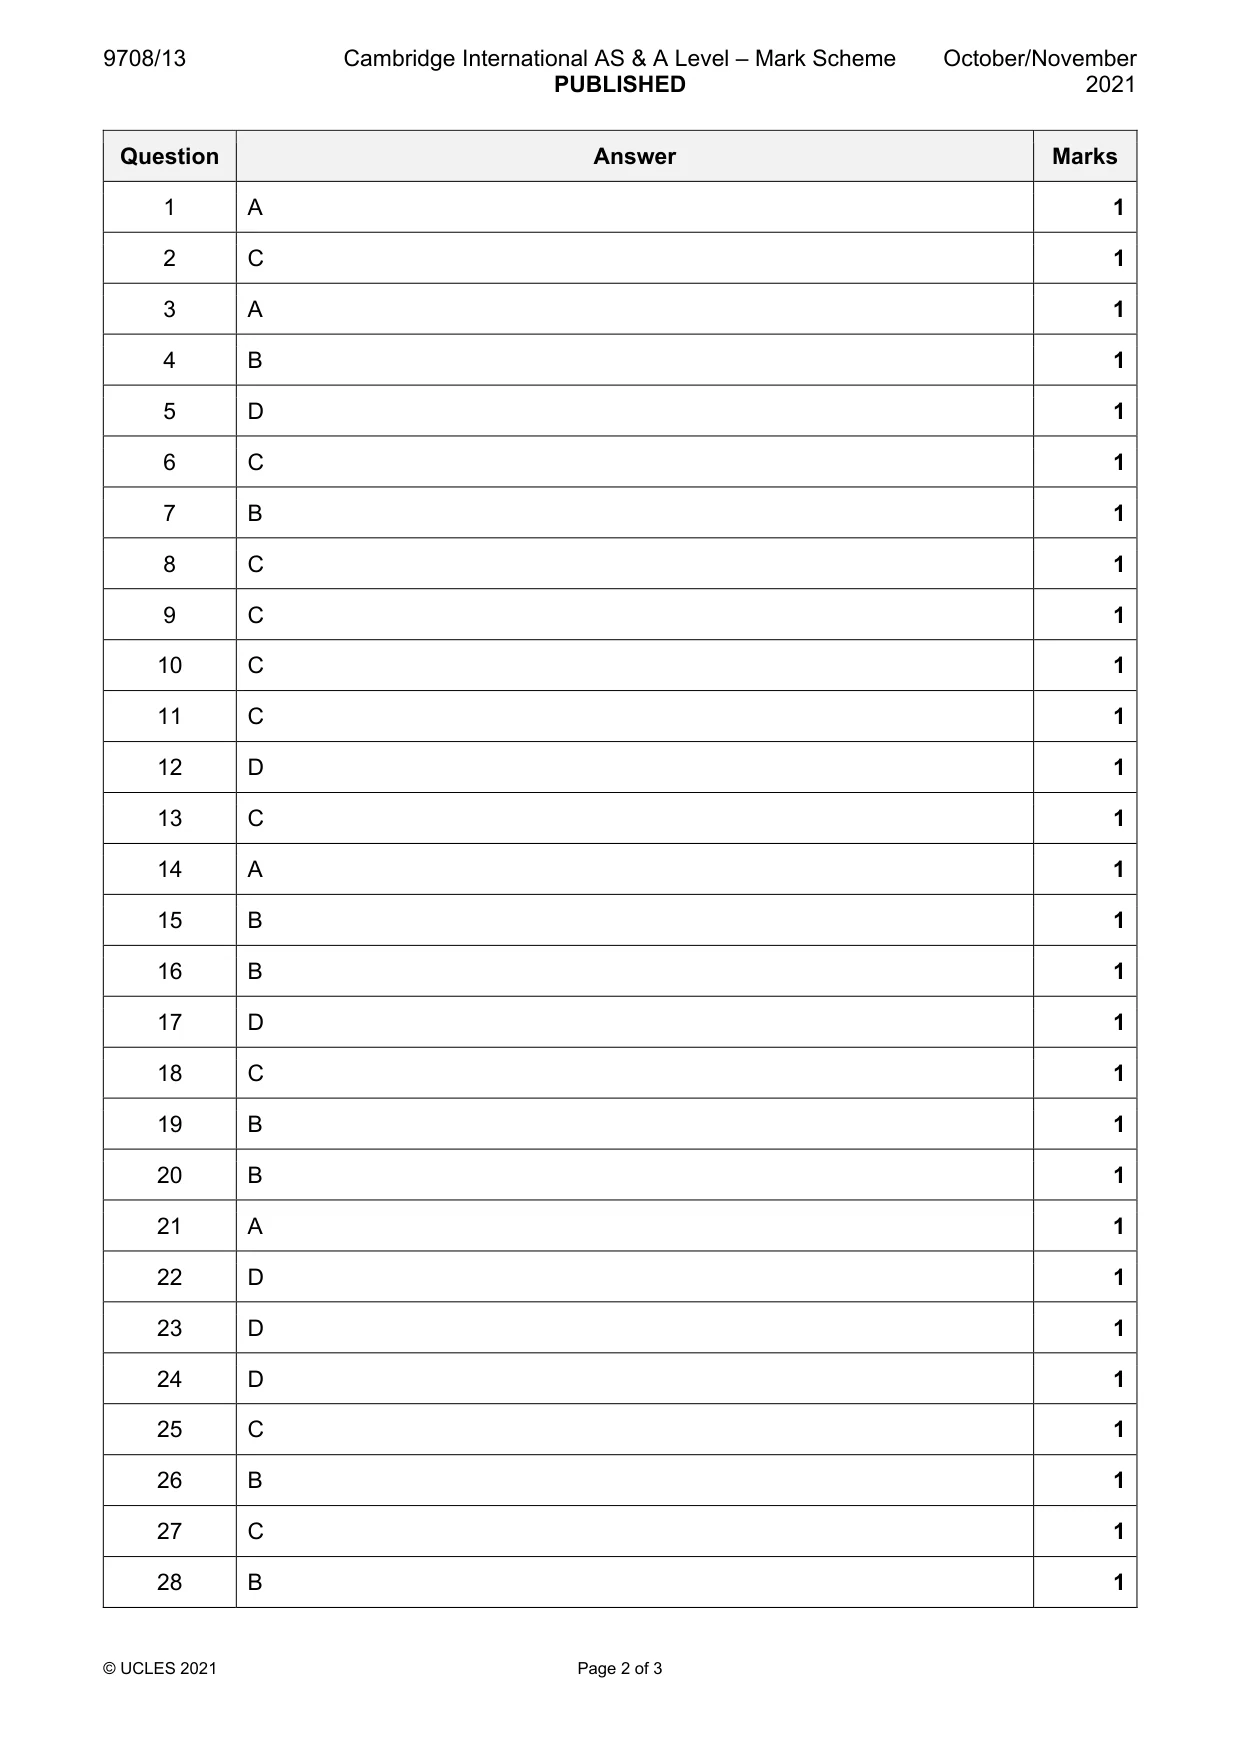
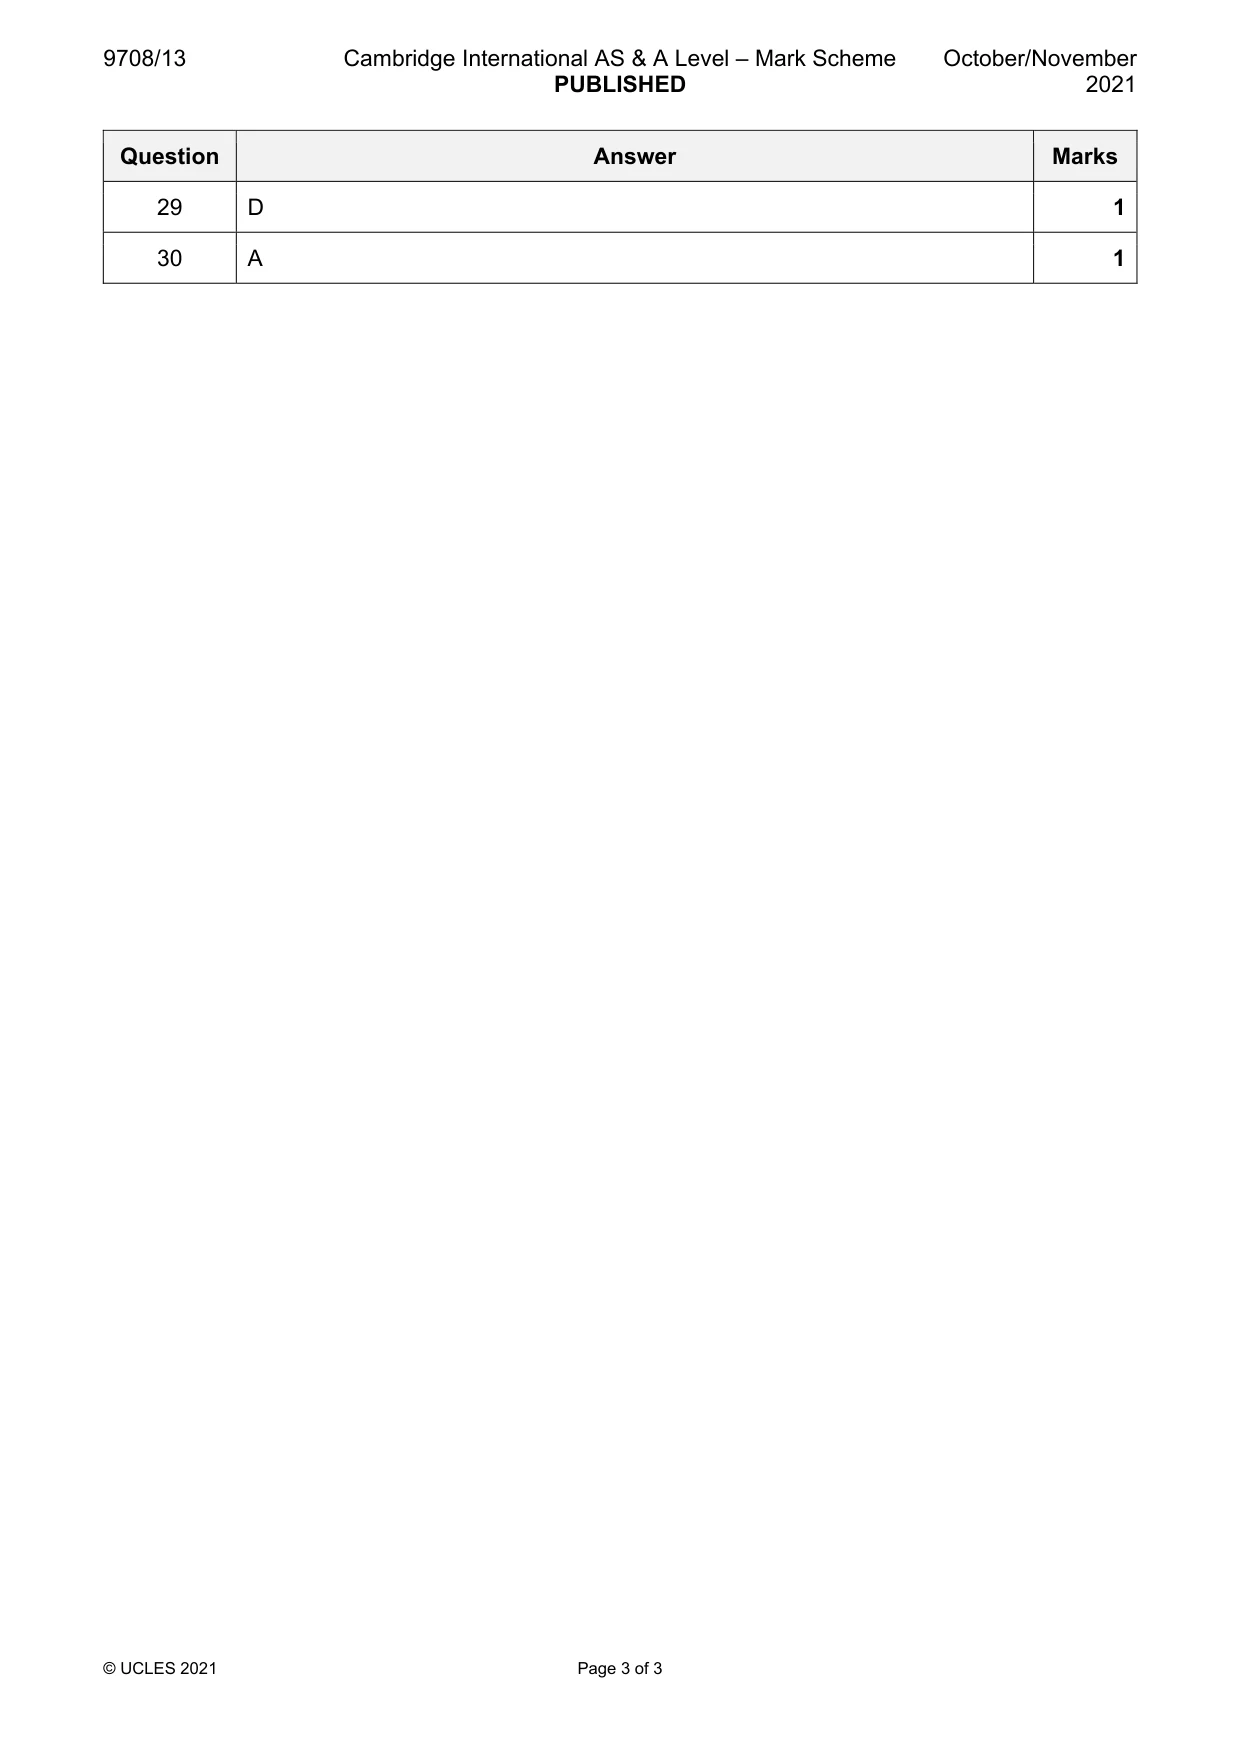
Answers below. Sit the paper first if you are practising.
Questions as text
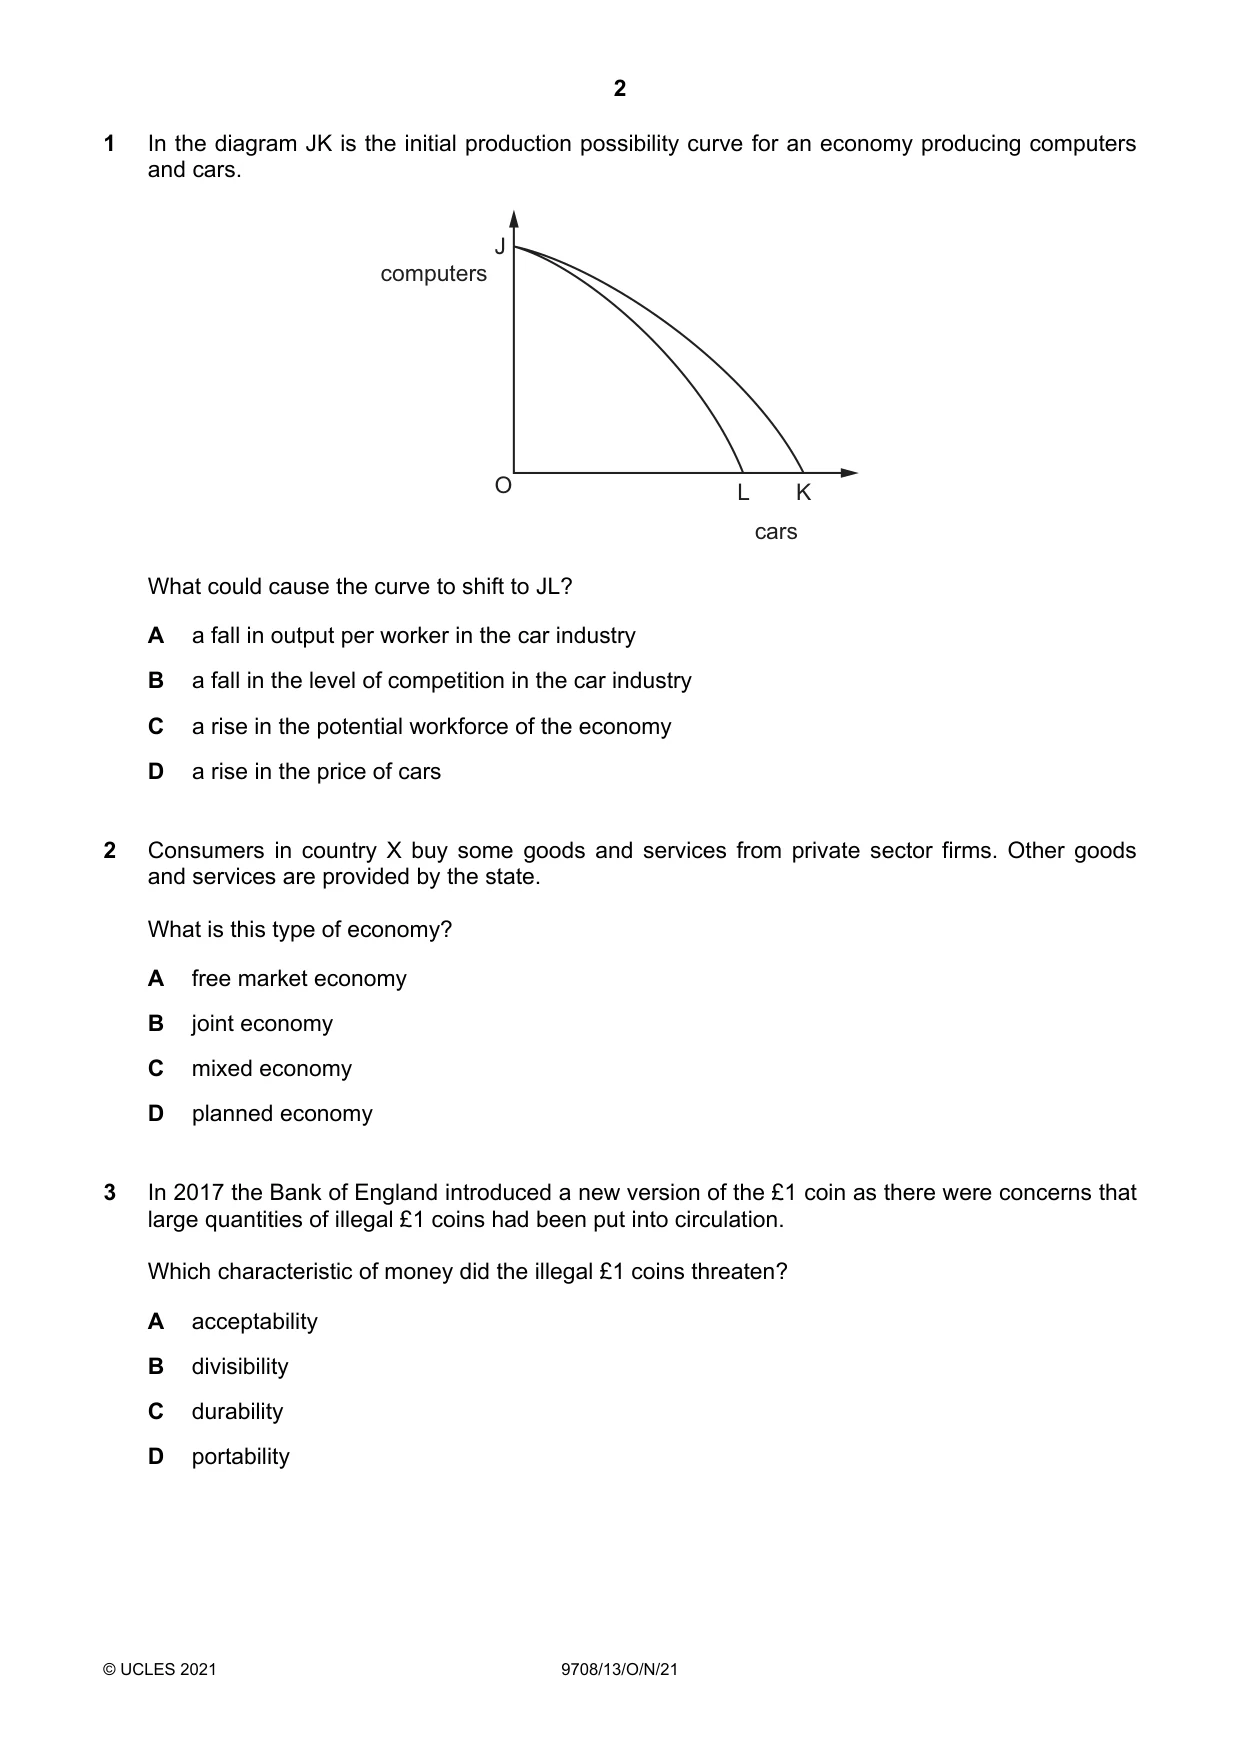
Q1 · In the diagram JK is the initial production possibility curve for an economy producing…
1 In the diagram JK is the initial production possibility curve for an economy producing computers and cars. J computers O L K cars What could cause the curve to shift to JL? A a fall in output per worker in the car industry B a fall in the level of competition in the car industry C a rise in the potential workforce of the economy D a rise in the price of cars
Mark scheme: A
Q2 · Consumers in country X buy some goods and services from private sector firms
2 Consumers in country X buy some goods and services from private sector firms. Other goods and services are provided by the state. What is this type of economy? A free market economy B joint economy C mixed economy D planned economy
Mark scheme: C
More questions on Resource allocation in different economic systems
Q3 · In 2017 the Bank of England introduced a new version of the £1 coin as there were…
3 In 2017 the Bank of England introduced a new version of the £1 coin as there were concerns that large quantities of illegal £1 coins had been put into circulation. Which characteristic of money did the illegal £1 coins threaten? A acceptability B divisibility C durability D portability
Mark scheme: A
Q4 · Which statement is a positive statement?
4 Which statement is a positive statement? A Low inflation is preferable to low unemployment as a government aim. B Low inflation will provide a more stable macro economy. C The government must intervene in all markets to improve resource allocation. D The government should cut income tax so living standards can improve.
Mark scheme: B
Q5 · What could cause an increase in consumer surplus in the market for a good?
5 What could cause an increase in consumer surplus in the market for a good? an increase in an increase in demand for supply of the good the good A no no B no yes C yes no D yes yes
Mark scheme: D
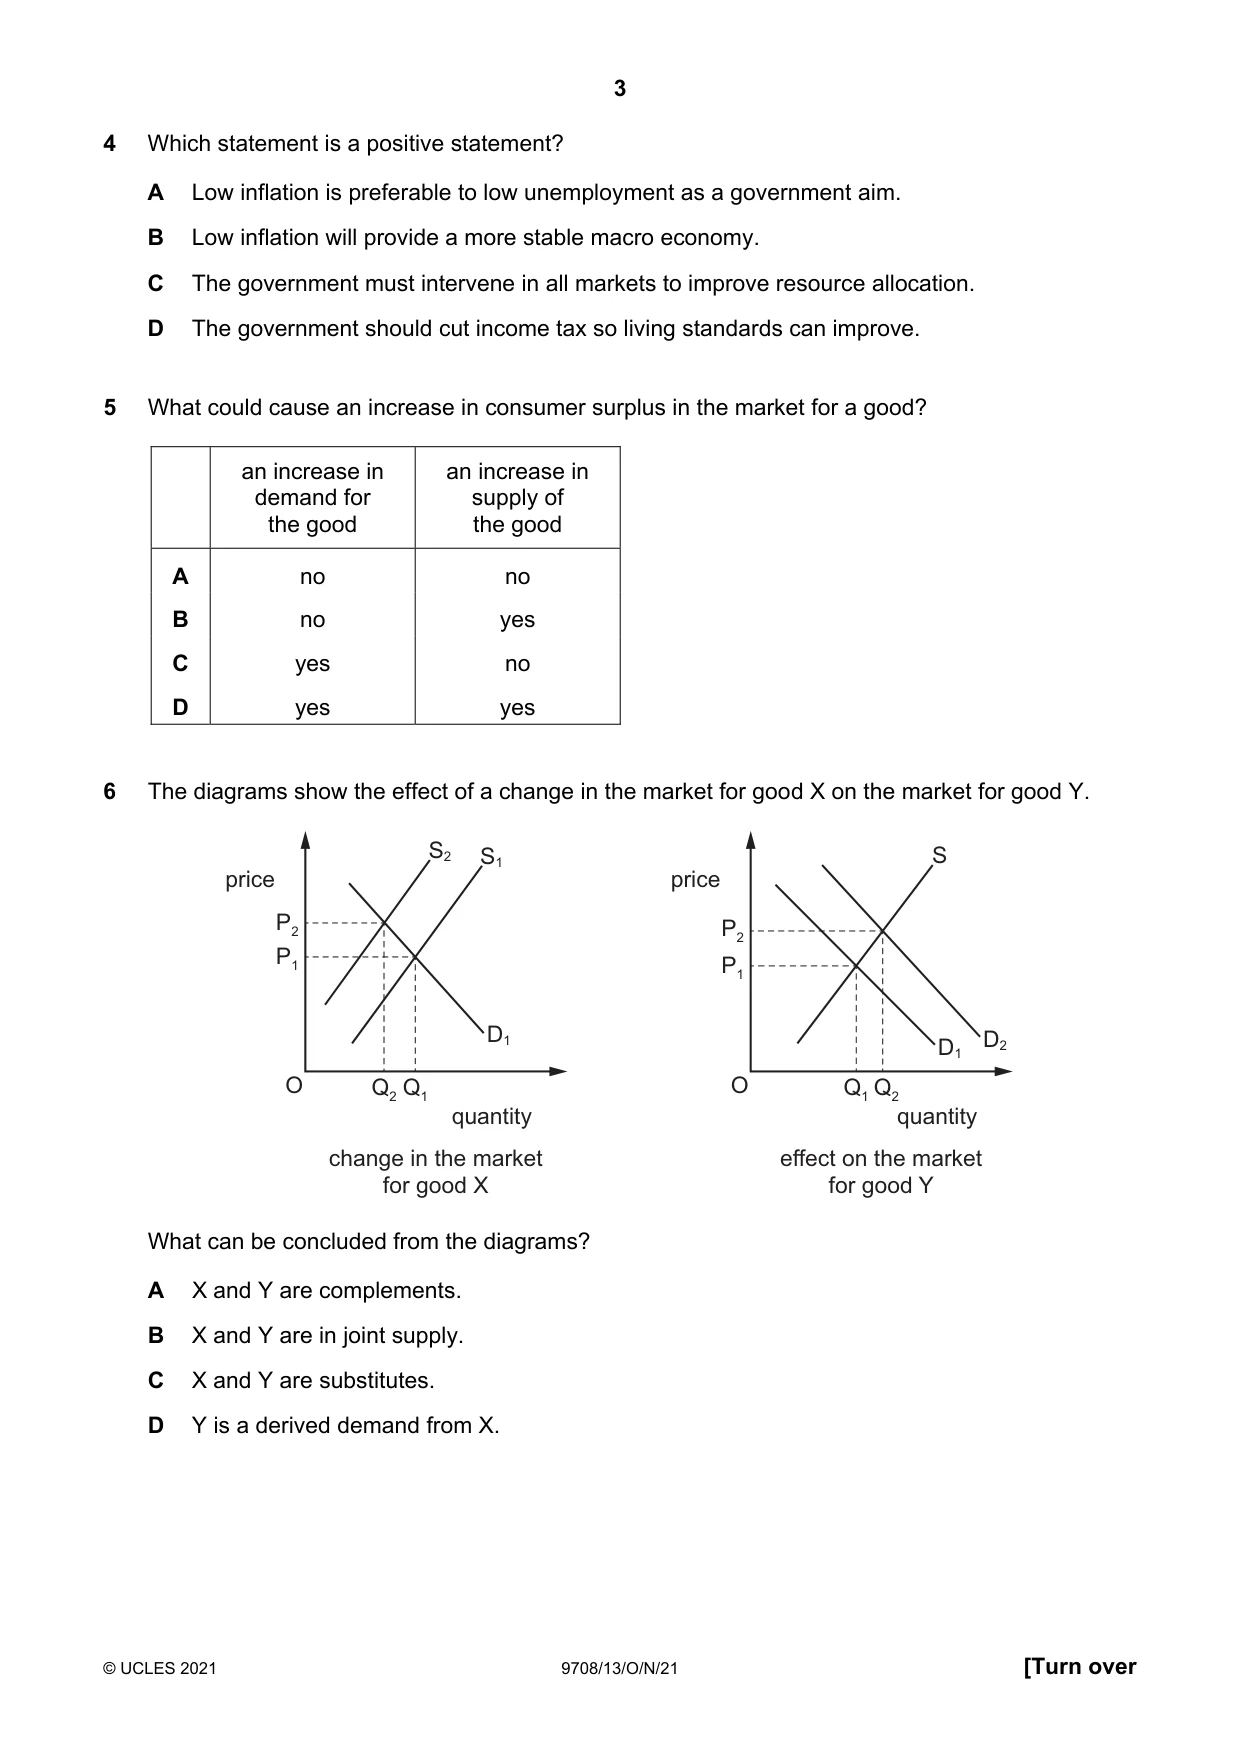
Q6 · The diagrams show the effect of a change in the market for good X on the market for good Y
6 The diagrams show the effect of a change in the market for good X on the market for good Y. S2 S1 S price price P2 P2 P1 P1 D1 D2 D1 O Q2 Q1 O Q1 Q2 quantity quantity change in the market effect on the market for good X for good Y What can be concluded from the diagrams? A X and Y are complements. B X and Y are in joint supply. C X and Y are substitutes. D Y is a derived demand from X.
Mark scheme: C
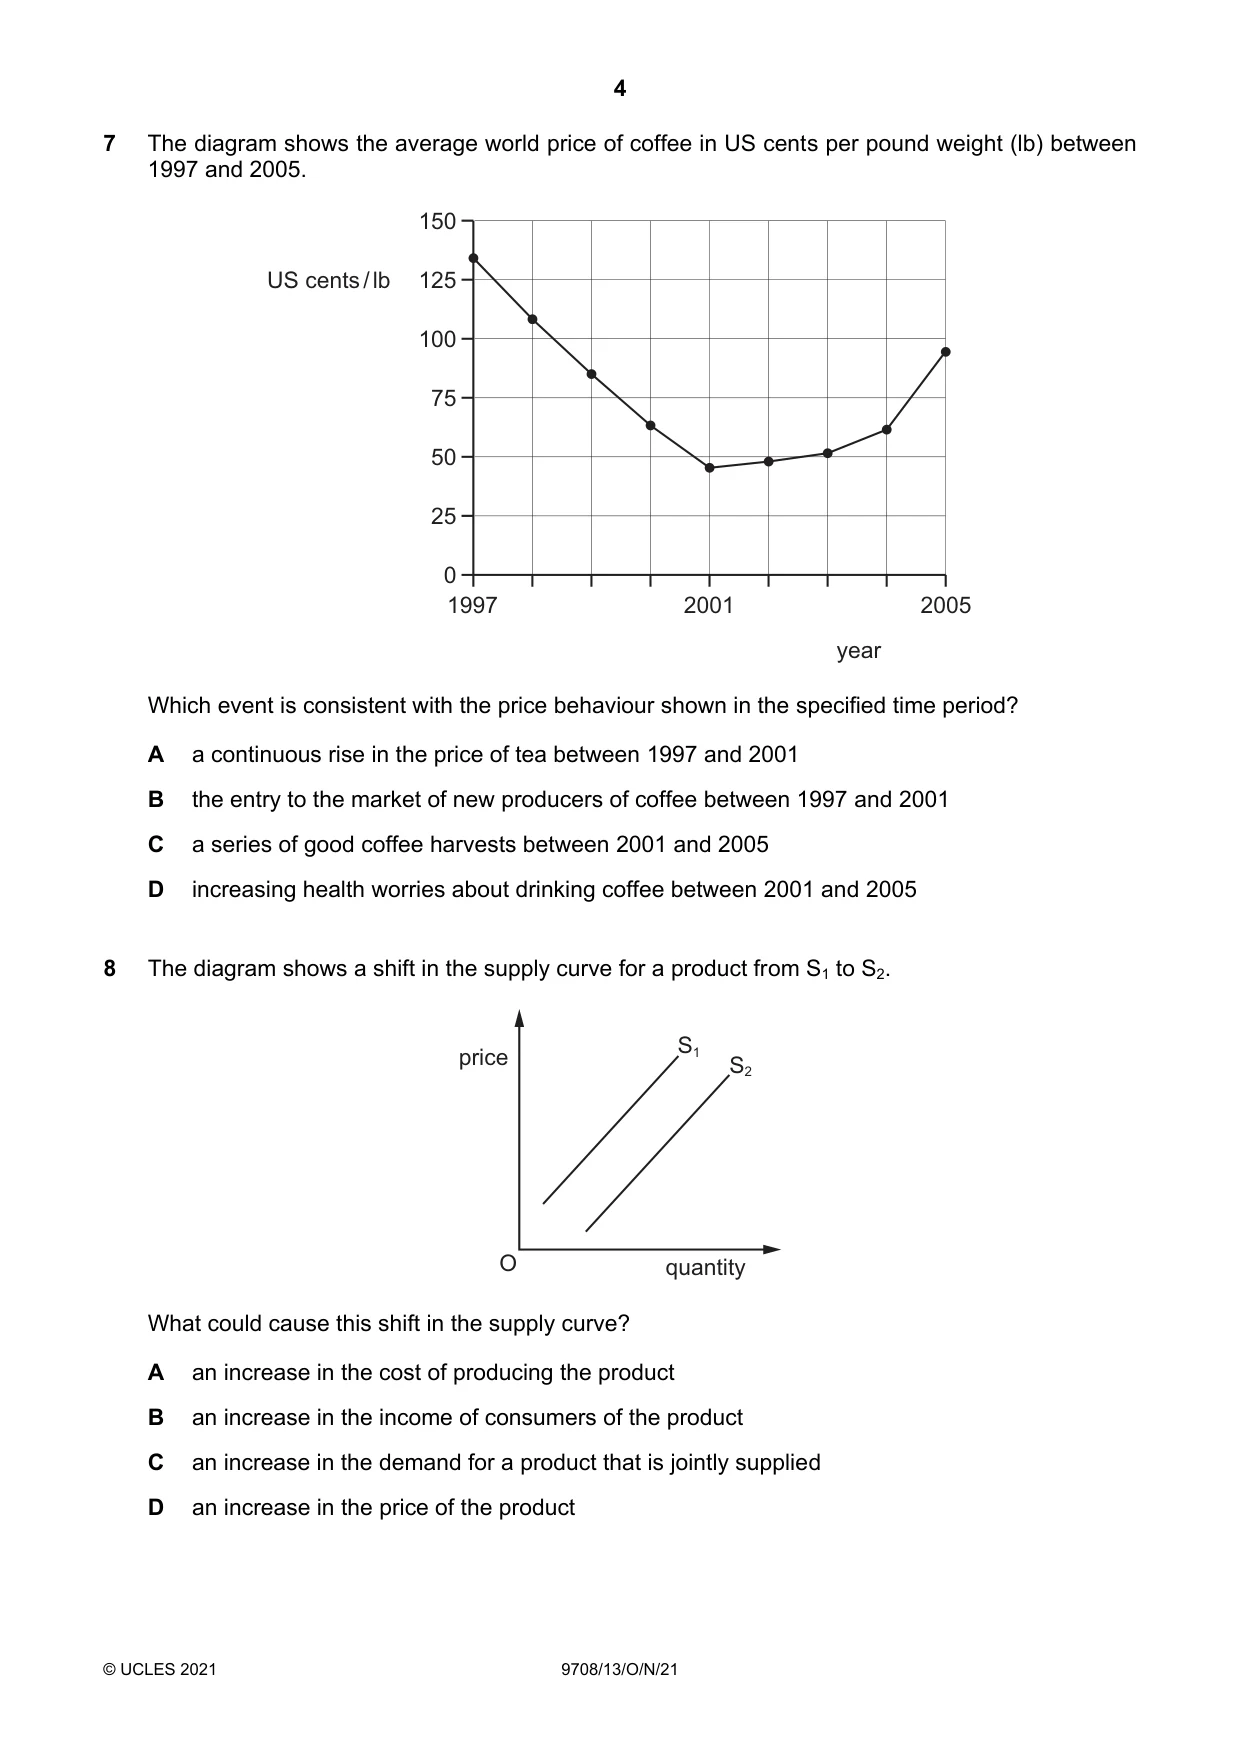
Q7 · The diagram shows the average world price of coffee in US cents per pound weight (lb)…
7 The diagram shows the average world price of coffee in US cents per pound weight (lb) between 1997 and 2005. 150 US cents / lb 125 100 75 50 25 0 1997 2001 2005 year Which event is consistent with the price behaviour shown in the specified time period? A a continuous rise in the price of tea between 1997 and 2001 B the entry to the market of new producers of coffee between 1997 and 2001 C a series of good coffee harvests between 2001 and 2005 D increasing health worries about drinking coffee between 2001 and 2005
Mark scheme: B
Q8 · The diagram shows a shift in the supply curve for a product from S1 to S2
8 The diagram shows a shift in the supply curve for a product from S1 to S2. S1 price S2 O quantity What could cause this shift in the supply curve? A an increase in the cost of producing the product B an increase in the income of consumers of the product C an increase in the demand for a product that is jointly supplied D an increase in the price of the product
Mark scheme: C
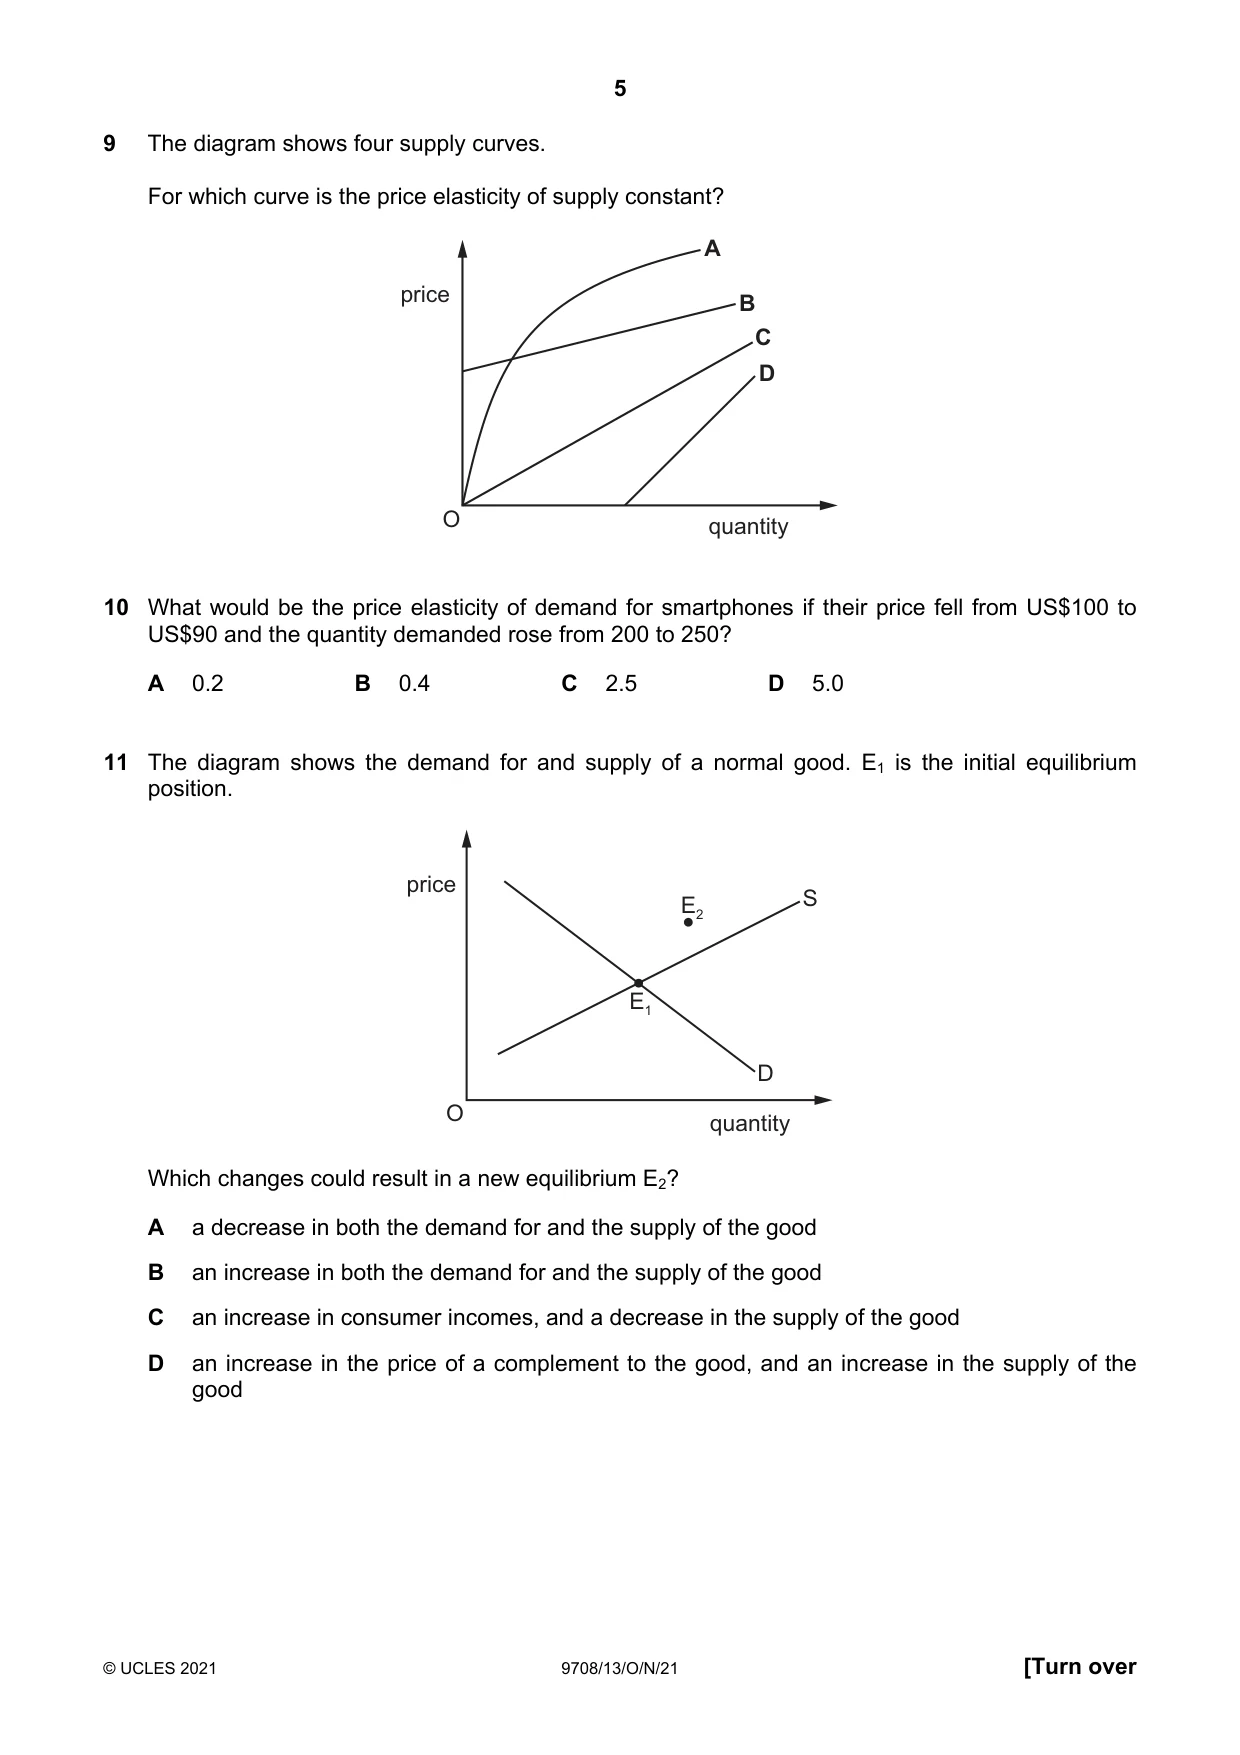
Q9 · The diagram shows four supply curves
9 The diagram shows four supply curves. For which curve is the price elasticity of supply constant? A price B C D O quantity
Mark scheme: C
Q10 · What would be the price elasticity of demand for smartphones if their price fell from…
10 What would be the price elasticity of demand for smartphones if their price fell from US$100 to US$90 and the quantity demanded rose from 200 to 250? A 0.2 B 0.4 C 2.5 D 5.0
Mark scheme: C
More questions on Price elasticity, income elasticity and cross elasticity of demand
Q11 · The diagram shows the demand for and supply of a normal good
11 The diagram shows the demand for and supply of a normal good. E1 is the initial equilibrium position. price E2 S E1 D O quantity Which changes could result in a new equilibrium E2? A a decrease in both the demand for and the supply of the good B an increase in both the demand for and the supply of the good C an increase in consumer incomes, and a decrease in the supply of the good D an increase in the price of a complement to the good, and an increase in the supply of the good
Mark scheme: C
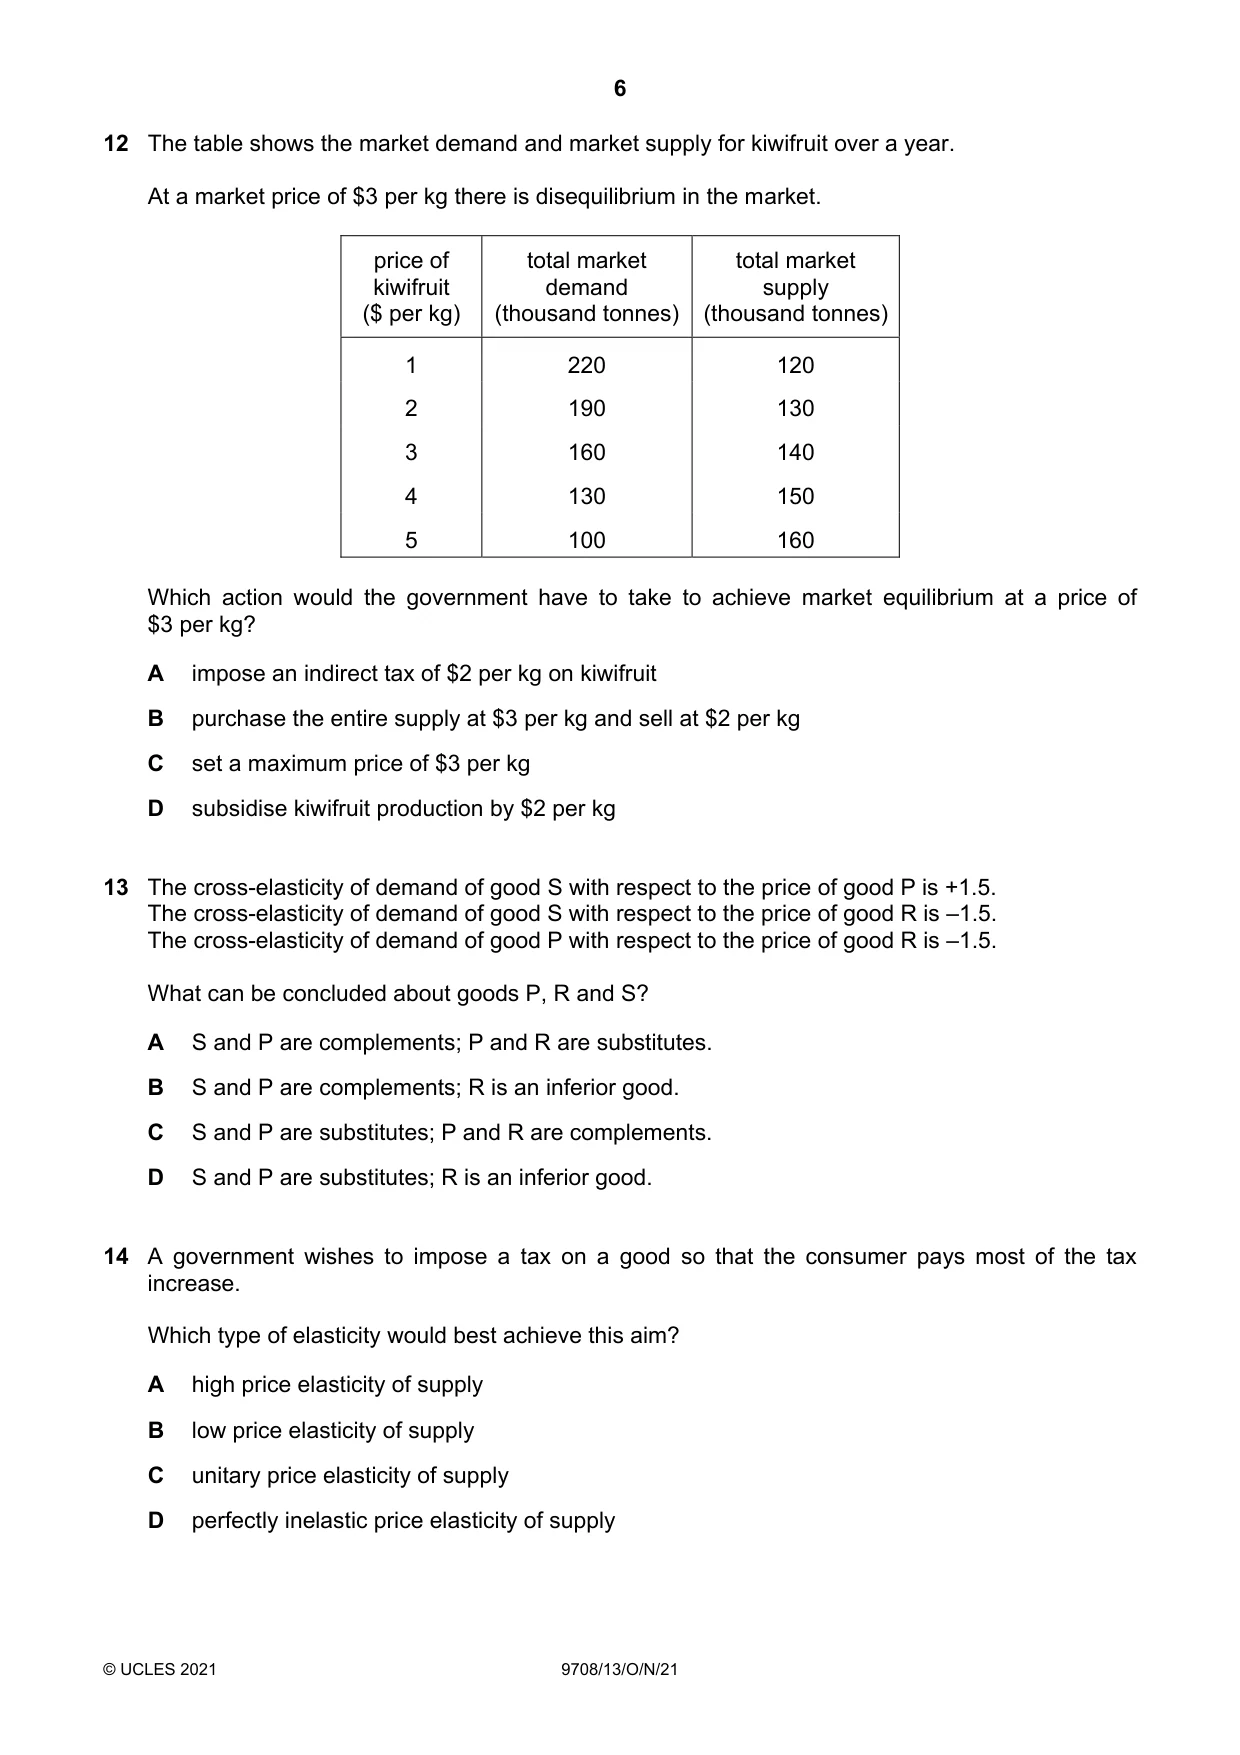
Q12 · The table shows the market demand and market supply for kiwifruit over a year
12 The table shows the market demand and market supply for kiwifruit over a year. At a market price of $3 per kg there is disequilibrium in the market. price of total market total market kiwifruit demand supply ($ per kg) (thousand tonnes) (thousand tonnes) 1 220 120 2 190 130 3 160 140 4 130 150 5 100 160 Which action would the government have to take to achieve market equilibrium at a price of $3 per kg? A impose an indirect tax of $2 per kg on kiwifruit B purchase the entire supply at $3 per kg and sell at $2 per kg C set a maximum price of $3 per kg D subsidise kiwifruit production by $2 per kg
Mark scheme: D
More questions on Methods and effects of government intervention in markets
Q13 · The cross-elasticity of demand of good S with respect to the price of good P is +1.5
13 The cross-elasticity of demand of good S with respect to the price of good P is +1.5. The cross-elasticity of demand of good S with respect to the price of good R is –1.5. The cross-elasticity of demand of good P with respect to the price of good R is –1.5. What can be concluded about goods P, R and S? A S and P are complements; P and R are substitutes. B S and P are complements; R is an inferior good. C S and P are substitutes; P and R are complements. D S and P are substitutes; R is an inferior good.
Mark scheme: C
More questions on Price elasticity, income elasticity and cross elasticity of demand
Q14 · A government wishes to impose a tax on a good so that the consumer pays most of the tax…
14 A government wishes to impose a tax on a good so that the consumer pays most of the tax increase. Which type of elasticity would best achieve this aim? A high price elasticity of supply B low price elasticity of supply C unitary price elasticity of supply D perfectly inelastic price elasticity of supply
Mark scheme: A
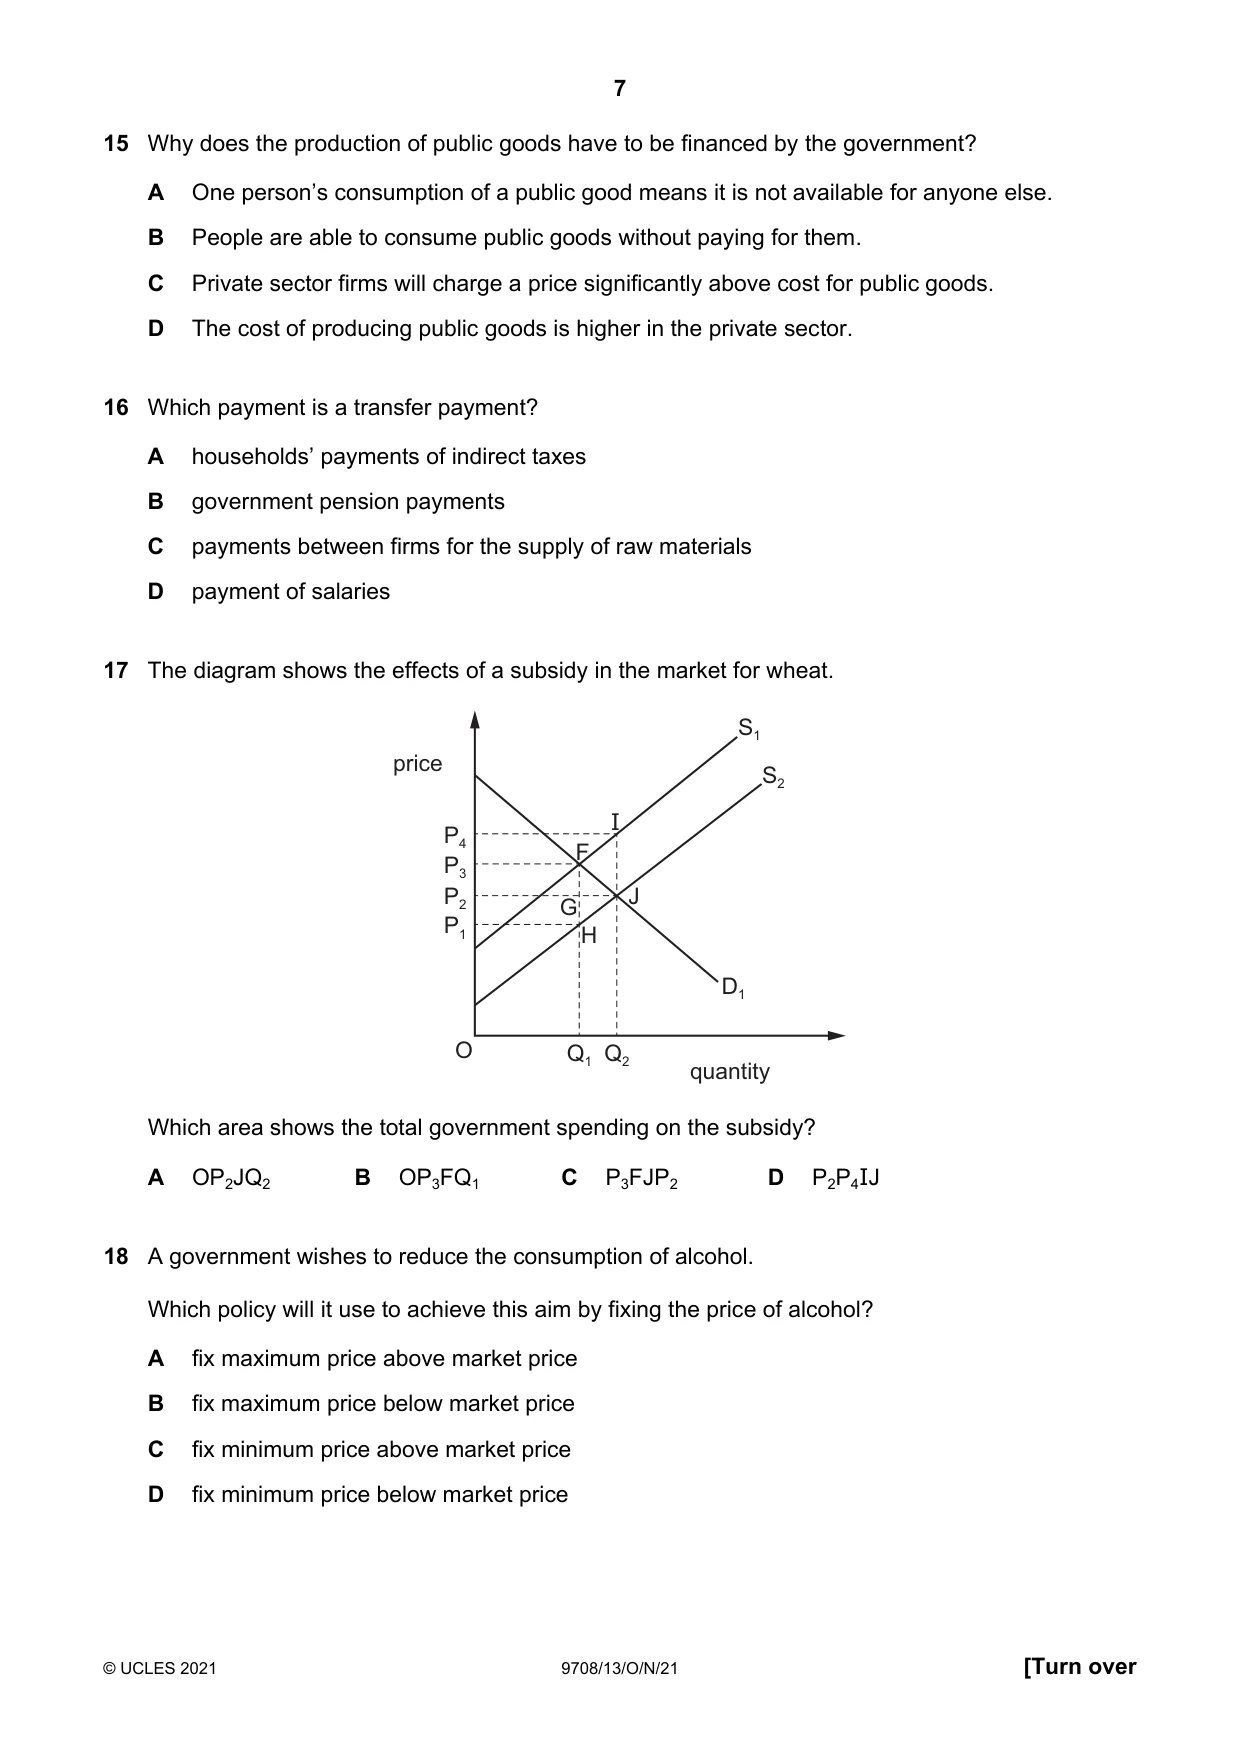
Q15 · Why does the production of public goods have to be financed by the government?
15 Why does the production of public goods have to be financed by the government? A One person’s consumption of a public good means it is not available for anyone else. B People are able to consume public goods without paying for them. C Private sector firms will charge a price significantly above cost for public goods. D The cost of producing public goods is higher in the private sector.
Mark scheme: B
Q16 · Which payment is a transfer payment?
16 Which payment is a transfer payment? A households’ payments of indirect taxes B government pension payments C payments between firms for the supply of raw materials D payment of salaries
Mark scheme: B
Q17 · The diagram shows the effects of a subsidy in the market for wheat
17 The diagram shows the effects of a subsidy in the market for wheat. S1 price S2 I P4 F P3 P2 J G P1 H D1 O Q1 Q2 quantity Which area shows the total government spending on the subsidy? A OP2JQ2 B OP3FQ1 C P3FJP2 D P2P4IJ
Mark scheme: D
More questions on Methods and effects of government intervention in markets
Q18 · A government wishes to reduce the consumption of alcohol
18 A government wishes to reduce the consumption of alcohol. Which policy will it use to achieve this aim by fixing the price of alcohol? A fix maximum price above market price B fix maximum price below market price C fix minimum price above market price D fix minimum price below market price
Mark scheme: C
More questions on Methods and effects of government intervention in markets
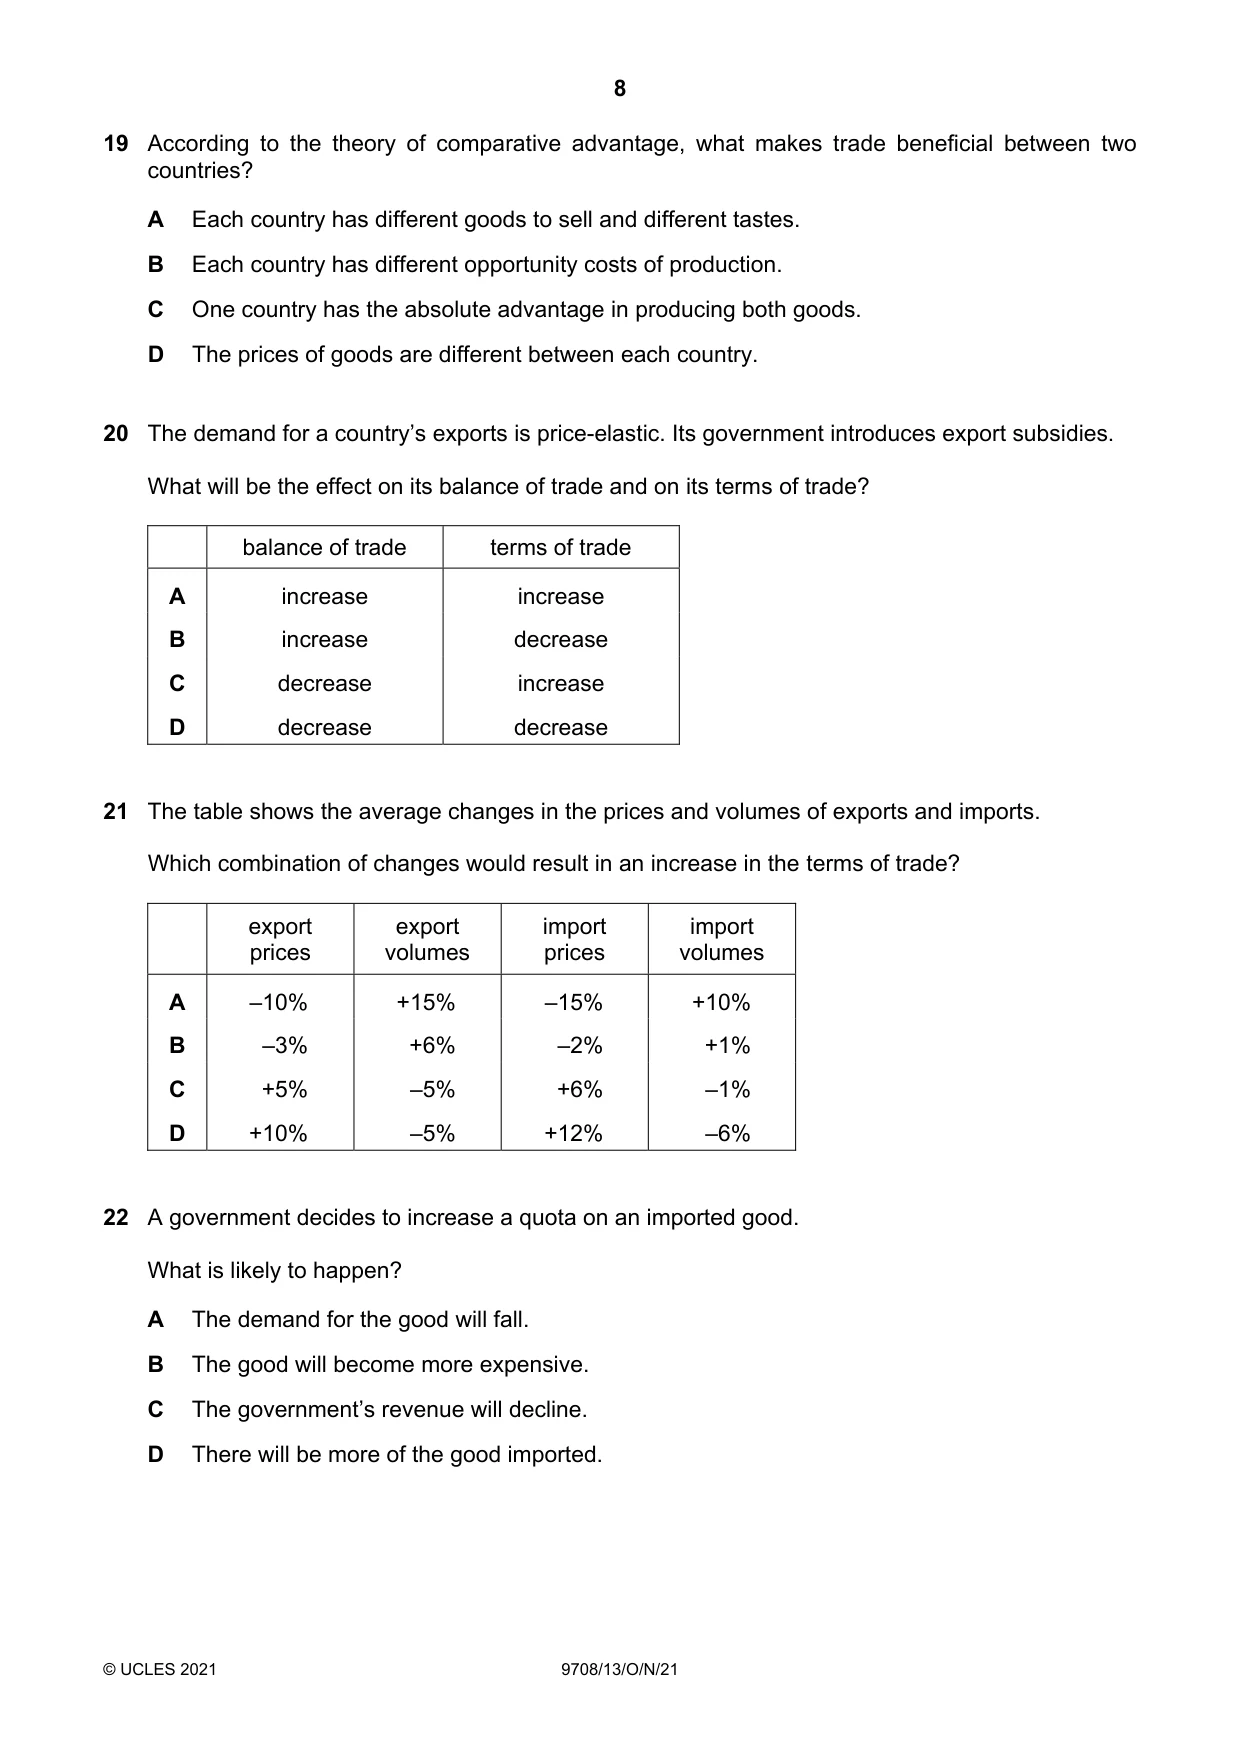
Q19 · According to the theory of comparative advantage, what makes trade beneficial between two…
19 According to the theory of comparative advantage, what makes trade beneficial between two countries? A Each country has different goods to sell and different tastes. B Each country has different opportunity costs of production. C One country has the absolute advantage in producing both goods. D The prices of goods are different between each country.
Mark scheme: B
Q20 · The demand for a country’s exports is price-elastic
20 The demand for a country’s exports is price-elastic. Its government introduces export subsidies. What will be the effect on its balance of trade and on its terms of trade? balance of trade terms of trade A increase increase B increase decrease C decrease increase D decrease decrease
Mark scheme: B
More questions on Current account of the balance of payments
Q21 · The table shows the average changes in the prices and volumes of exports and imports
21 The table shows the average changes in the prices and volumes of exports and imports. Which combination of changes would result in an increase in the terms of trade? export export import import prices volumes prices volumes A –10% +15% –15% +10% B –3% +6% –2% +1% C +5% –5% +6% –1% D +10% –5% +12% –6%
Mark scheme: A
Q22 · A government decides to increase a quota on an imported good
22 A government decides to increase a quota on an imported good. What is likely to happen? A The demand for the good will fall. B The good will become more expensive. C The government’s revenue will decline. D There will be more of the good imported.
Mark scheme: D
Q23 · The diagram shows aggregate demand (AD) and aggregate supply (AS) for an economy
23 The diagram shows aggregate demand (AD) and aggregate supply (AS) for an economy. AS1 AS2 price level P1 P2 AD O Y1 Y2 real output What is most likely to cause the shift from AS1 to AS2? A a decrease in the exchange rate B a decrease in the price level C a fall in immigration D a fall in the average level of wages
Mark scheme: D
More questions on Aggregate Demand and Aggregate Supply analysis
Q24 · Country X places a tariff of 20% on steel products imported from country Y
24 Country X places a tariff of 20% on steel products imported from country Y. Country Y retaliates with a 20% tariff on computers imported from country X. What is a certain economic consequence of these actions? A The balance of payments of country X and country Y will remain unchanged. B The exchange rate value on which trade between the two countries is based will be maintained. C The profits and employment of domestic firms in both countries will be preserved. D The volume of bilateral trade between country X and country Y will be reduced.
Mark scheme: D
Q25 · A country has a floating exchange rate
25 A country has a floating exchange rate. An increase in which variable within that country can cause its exchange rate to appreciate? A employment levels B income levels C interest rates D price levels
Mark scheme: C
Q26 · The diagram shows the effects of the imposition of a tariff on an internationally-traded…
26 The diagram shows the effects of the imposition of a tariff on an internationally-traded good. Sdom is the supply and D the demand in country R. Sw is the world supply curve of the product and Swt is the world supply curve after the imposition of a tariff by country R. Sdom price Swt Sw D O Q1 Q2 Q3 Q4 quantity Which combination describes the effect on domestic supply of and demand for the good in country R after the imposition of the tariff? domestic demand supply A falls falls B falls rises C rises falls D rises rises
Mark scheme: B
Q27 · The graph shows the change in the current account of Belgium’s balance of payments from…
27 The graph shows the change in the current account of Belgium’s balance of payments from 2016 to 2017. 3.6 US$ billion 0 –2.8 2016 2017 What will be the most likely impact of the change shown by the graph on Belgium’s domestic economy? A a fall in the rate of economic growth B a fall in the foreign currency reserves C a fall in the number of unemployed D a fall in the rate of inflation
Mark scheme: C
Q28 · What is an example of the use of monetary policy?
28 What is an example of the use of monetary policy? A a cut in the rate of corporation tax B a reduction in interest rates C a switch from direct to indirect taxation D the introduction of maximum price controls to reduce inflation
Mark scheme: B
Q29 · Which policy would be likely to increase inflation?
29 Which policy would be likely to increase inflation? A an increase in income tax B an increase in interest rates C limiting the amount banks can lend D raising the level of import tariffs
Mark scheme: D
Q30 · What are the components of aggregate demand?
30 What are the components of aggregate demand? A consumption + investment + government spending + (exports – imports) B consumption + investment + taxation – (exports – imports) C consumption + saving + taxation – (exports – imports) D consumption + saving + taxation + (exports – imports)
Mark scheme: A
More questions on Aggregate Demand and Aggregate Supply analysis
What was in this paper
The subtopics covered by these 30 questions, and how many questions each got. Open one in a new tab to see every Cambridge question on it.
4Methods and effects of government intervention in markets3Aggregate Demand and Aggregate Supply analysis2Demand and supply curves2Exchange rates2Price elasticity of supply2Price elasticity, income elasticity and cross elasticity of demand2The interaction of demand and supply2Classification of goods and services1Consumer and producer surplus1Current account of the balance of payments1Economic methodology1Monetary policy1Money and banking1National income statistics1Production possibility curves1Resource allocation in different economic systems1The reasons for international trade1Unemployment1What you needed in this session
Cambridge’s own grade thresholds for 2021 Oct/Nov, Paper 1 · Variant 3. A higher threshold means an easier paper — the bar moves with how the cohort did.