Cambridge A Level Economics 9708 — 2024 May/June Paper 1 · Variant 3
9708/13/M/J/24 · 30 questions · 30 marks · ≈34 min
The question paper and its mark scheme, free to read here and free to download. This is Cambridge’s own paper, exactly as it was sat.
Question paper12 pages
Mark scheme3 pages
Answers below. Sit the paper first if you are practising.
Questions as text
Q1 · What is not an example of a public good?
1 What is not an example of a public good? A education B flood control systems C national defence D street lighting
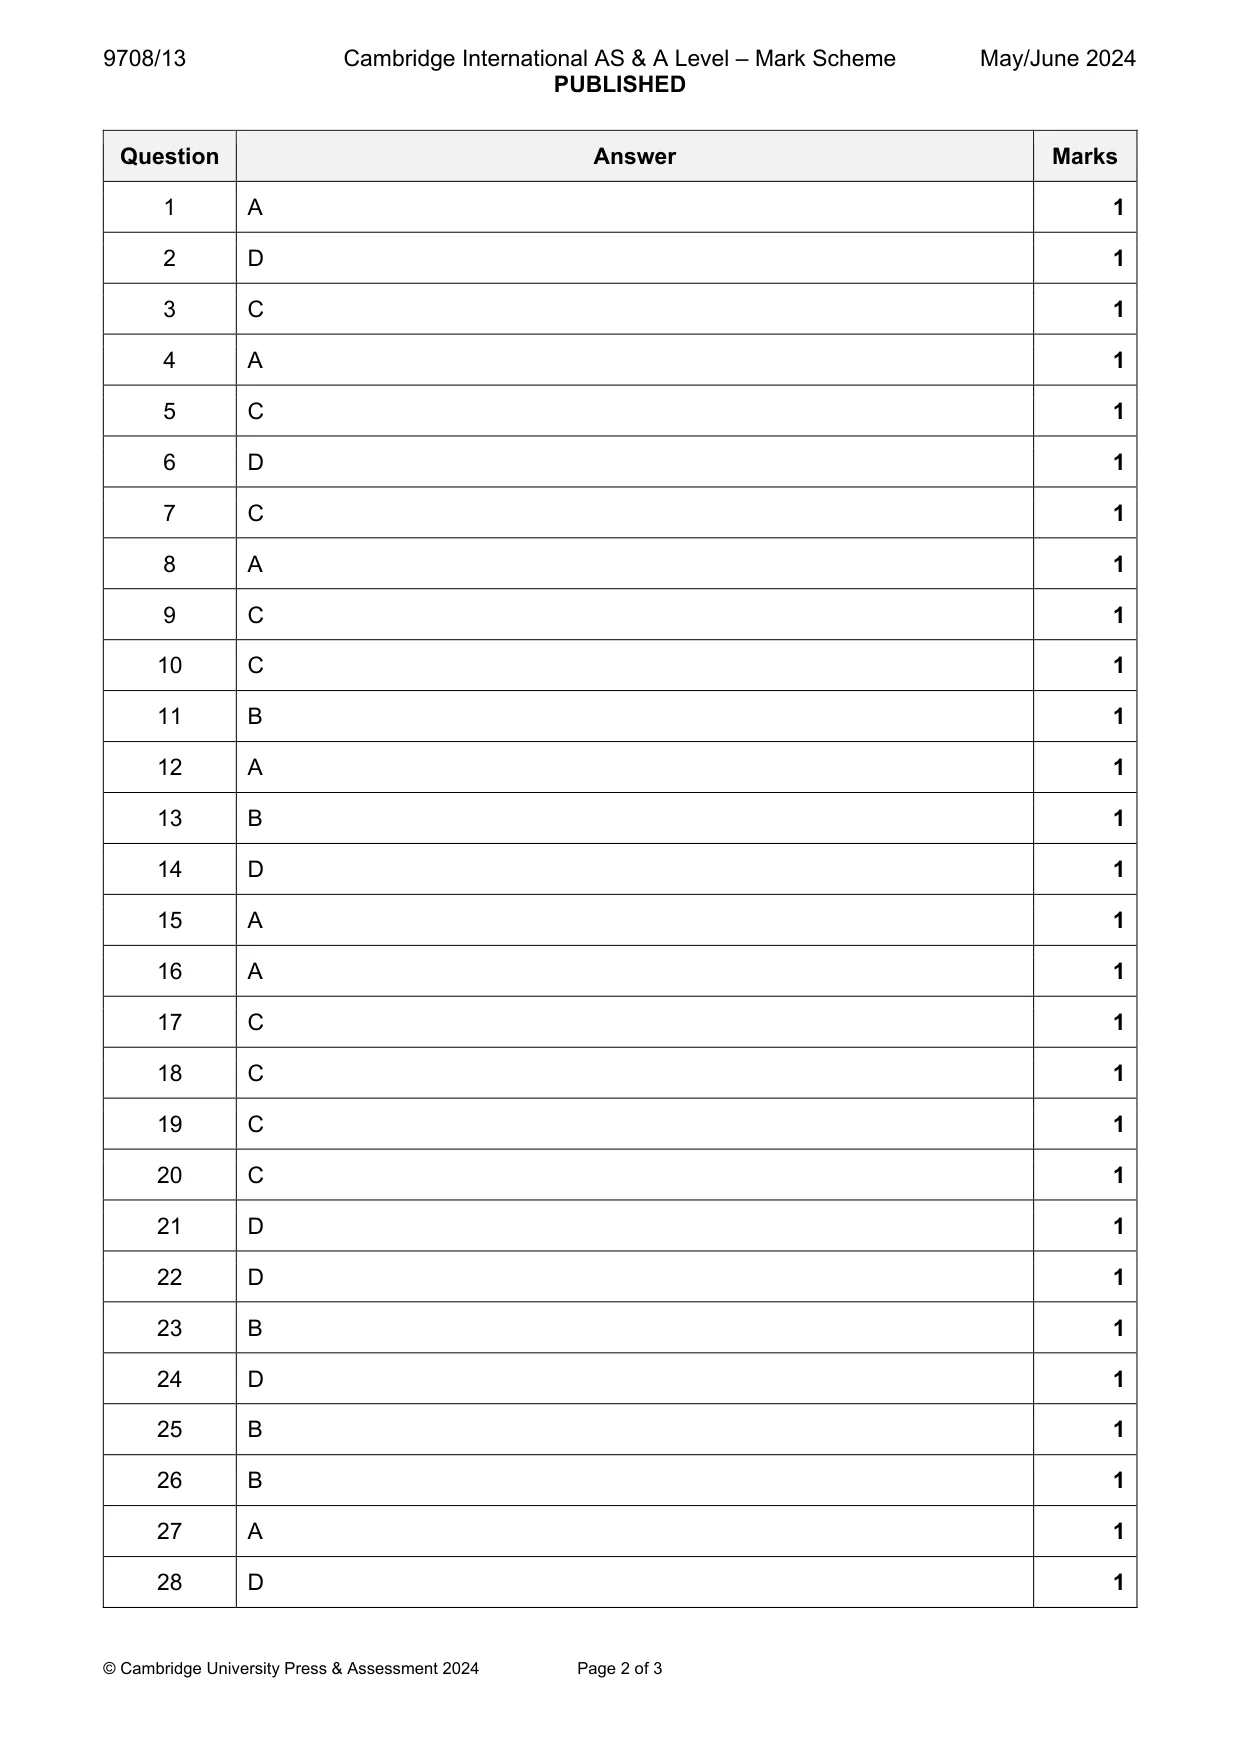
Mark scheme: A
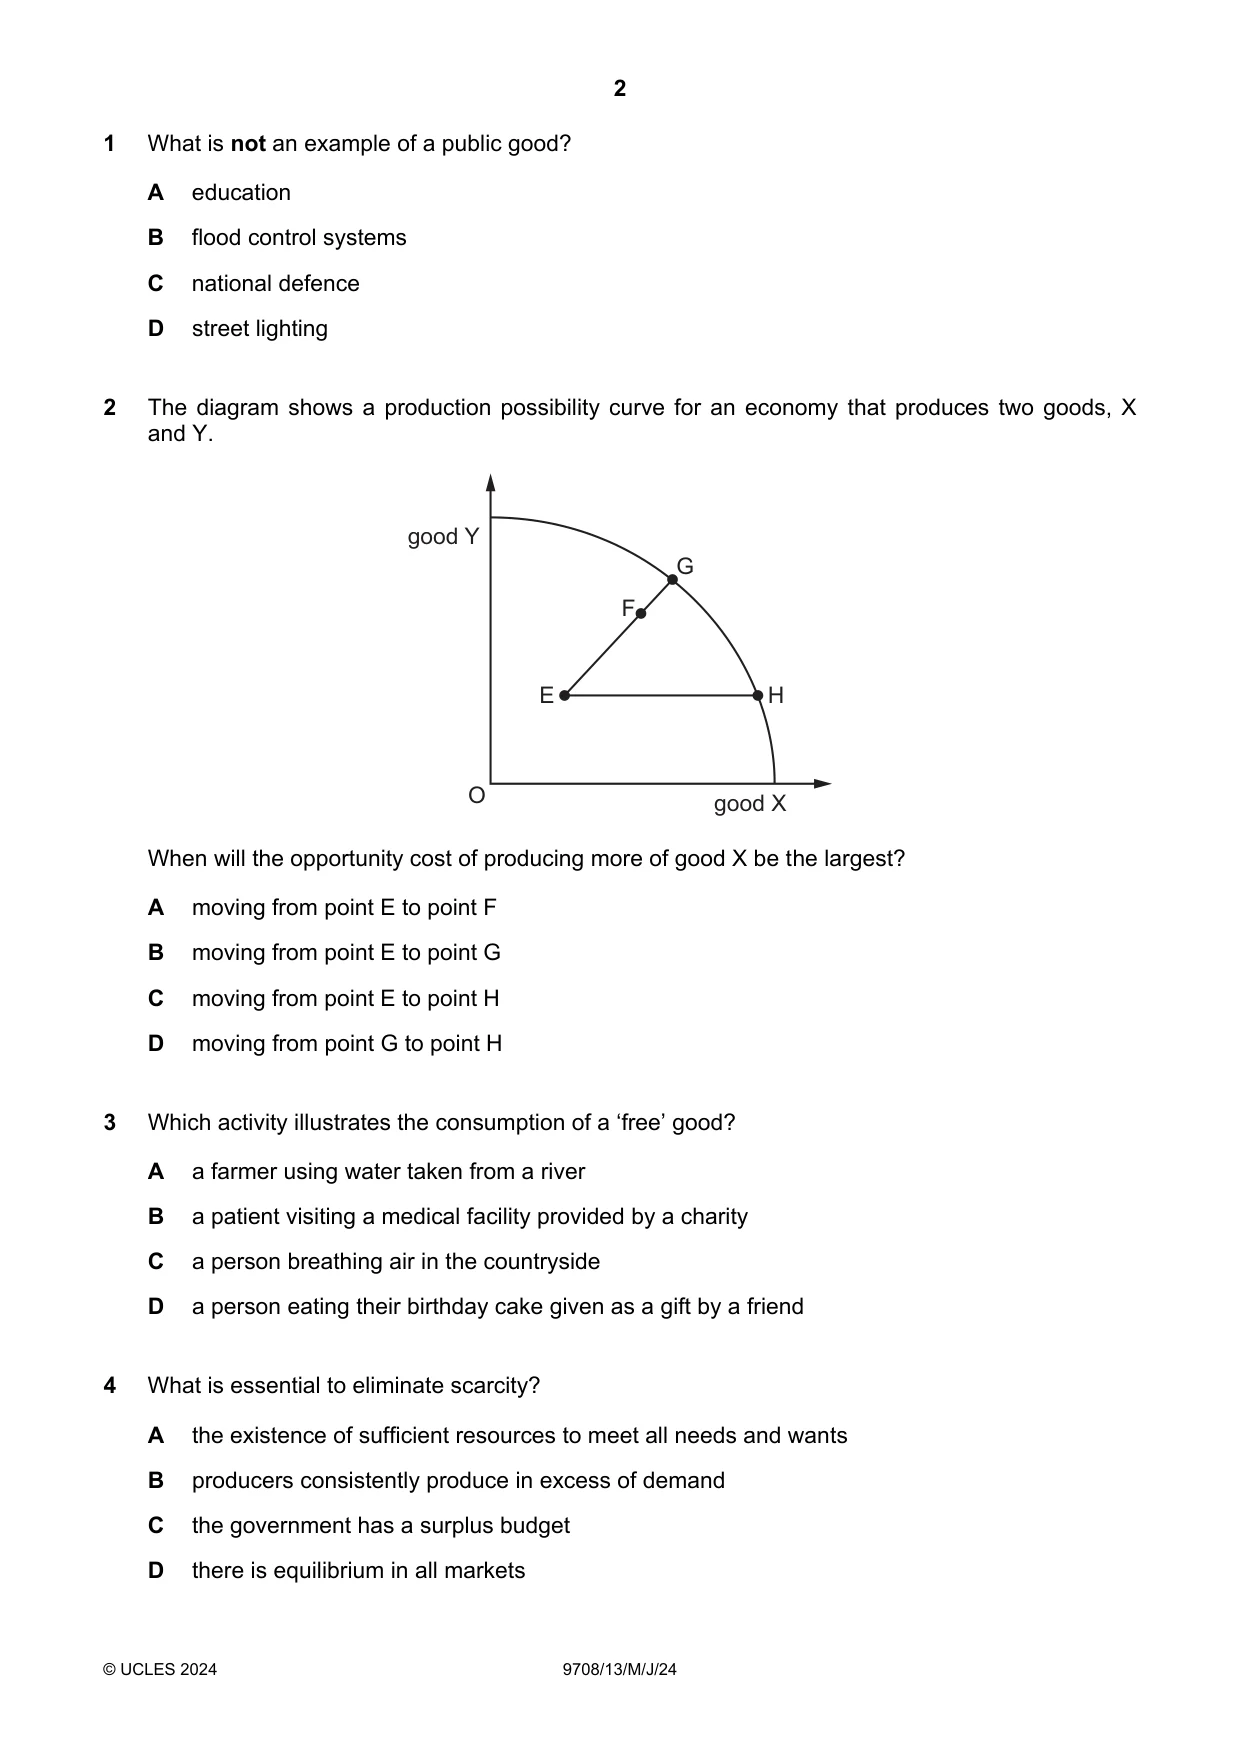
Q2 · The diagram shows a production possibility curve for an economy that produces two goods…
2 The diagram shows a production possibility curve for an economy that produces two goods, X and Y. good Y G F E H O good X When will the opportunity cost of producing more of good X be the largest? A moving from point E to point F B moving from point E to point G C moving from point E to point H D moving from point G to point H
Mark scheme: D
Q3 · Which activity illustrates the consumption of a ‘free’ good?
3 Which activity illustrates the consumption of a ‘free’ good? A a farmer using water taken from a river B a patient visiting a medical facility provided by a charity C a person breathing air in the countryside D a person eating their birthday cake given as a gift by a friend
Mark scheme: C
Q4 · What is essential to eliminate scarcity?
4 What is essential to eliminate scarcity? A the existence of sufficient resources to meet all needs and wants B producers consistently produce in excess of demand C the government has a surplus budget D there is equilibrium in all markets
Mark scheme: A
Q5 · What will encourage a higher degree of division of labour?
5 What will encourage a higher degree of division of labour? A firms wishing for a greater level of self-sufficiency B firms wishing to increase their flexibility in production C firms wishing to raise their level of productivity D firms wishing to reduce their level of risk
Mark scheme: C
Q6 · Which business is likely to be the slowest to alter its output in response to a sustained…
6 Which business is likely to be the slowest to alter its output in response to a sustained increase in demand for its product? A a fast-food restaurant B a household cleaning service C a newspaper printer D an oil exploration company
Mark scheme: D
Q7 · A company uses large amounts of gas to produce steel
7 A company uses large amounts of gas to produce steel. Supplies of gas are reduced at the same time as the market for steel is hit by a recession. What can be said about the likely changes in the market for steel? equilibrium equilibrium price quantity A falls uncertain B rises uncertain C uncertain falls D uncertain rises
Mark scheme: C
Q8 · A firm is charging a price of $12 for its product and using 80% of its production…
8 A firm is charging a price of $12 for its product and using 80% of its production capacity of 10 000 units per month. Assuming the product has unitary price elastic demand, which price should the firm charge to utilise its full capacity? A $9.00 B $9.60 C $10.00 D $10.60
Mark scheme: A
More questions on Price elasticity, income elasticity and cross elasticity of demand
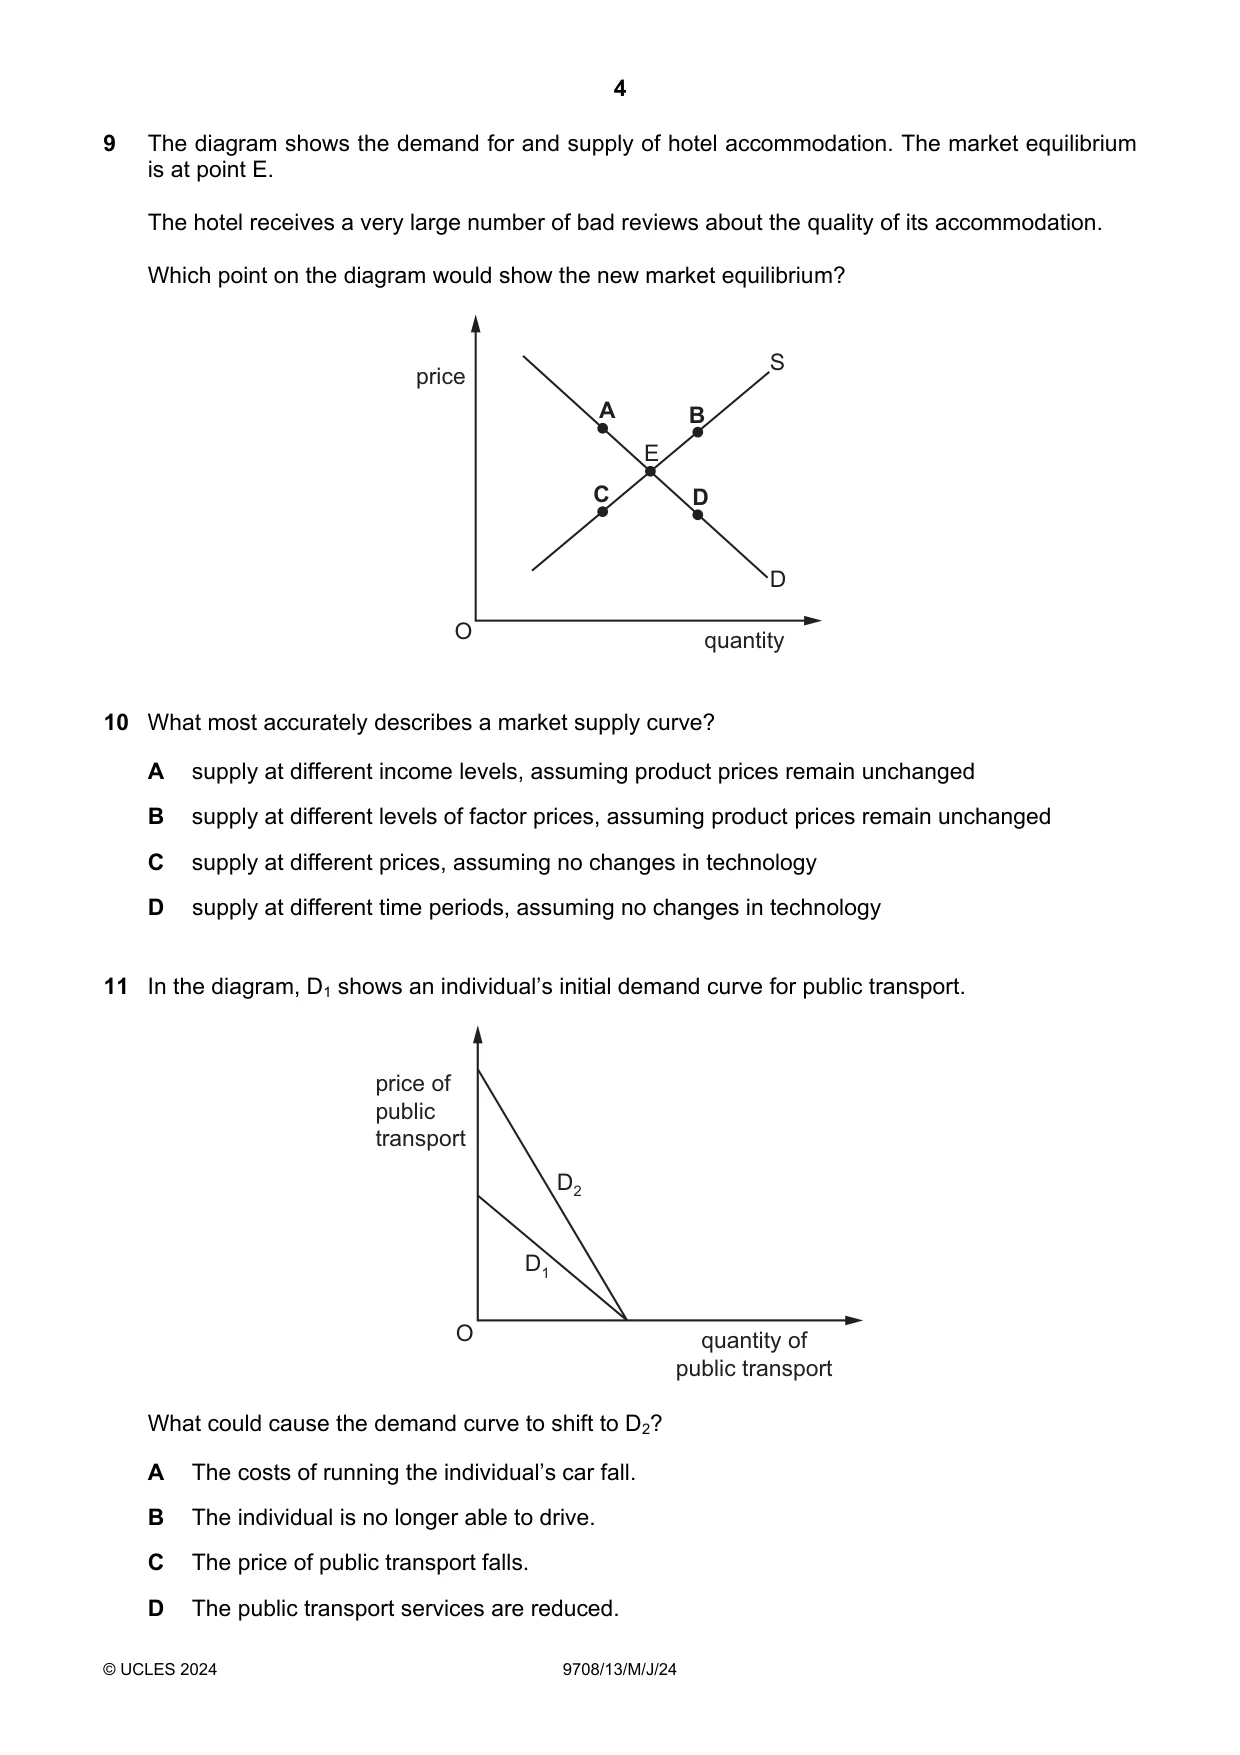
Q9 · The diagram shows the demand for and supply of hotel accommodation
9 The diagram shows the demand for and supply of hotel accommodation. The market equilibrium is at point E. The hotel receives a very large number of bad reviews about the quality of its accommodation. Which point on the diagram would show the new market equilibrium? S price A B E C D D O quantity
Mark scheme: C
Q10 · What most accurately describes a market supply curve?
10 What most accurately describes a market supply curve? A supply at different income levels, assuming product prices remain unchanged B supply at different levels of factor prices, assuming product prices remain unchanged C supply at different prices, assuming no changes in technology D supply at different time periods, assuming no changes in technology
Mark scheme: C
Q11 · In the diagram, D1 shows an individual’s initial demand curve for public transport
11 In the diagram, D1 shows an individual’s initial demand curve for public transport. price of public transport D2 D1 O quantity of public transport What could cause the demand curve to shift to D2? A The costs of running the individual’s car fall. B The individual is no longer able to drive. C The price of public transport falls. D The public transport services are reduced.
Mark scheme: B
Q12 · A government introduces an effective minimum price for a product but makes no other…
12 A government introduces an effective minimum price for a product but makes no other intervention in the market. This policy suggests that the government’s objective is A to discourage consumption of a demerit good. B to increase the consumption of a merit good. C to reduce the price of a private good. D to support the incomes of producers.
Mark scheme: A
More questions on Methods and effects of government intervention in markets
Q13 · The diagram shows the effect of an indirect tax imposed on cigarettes
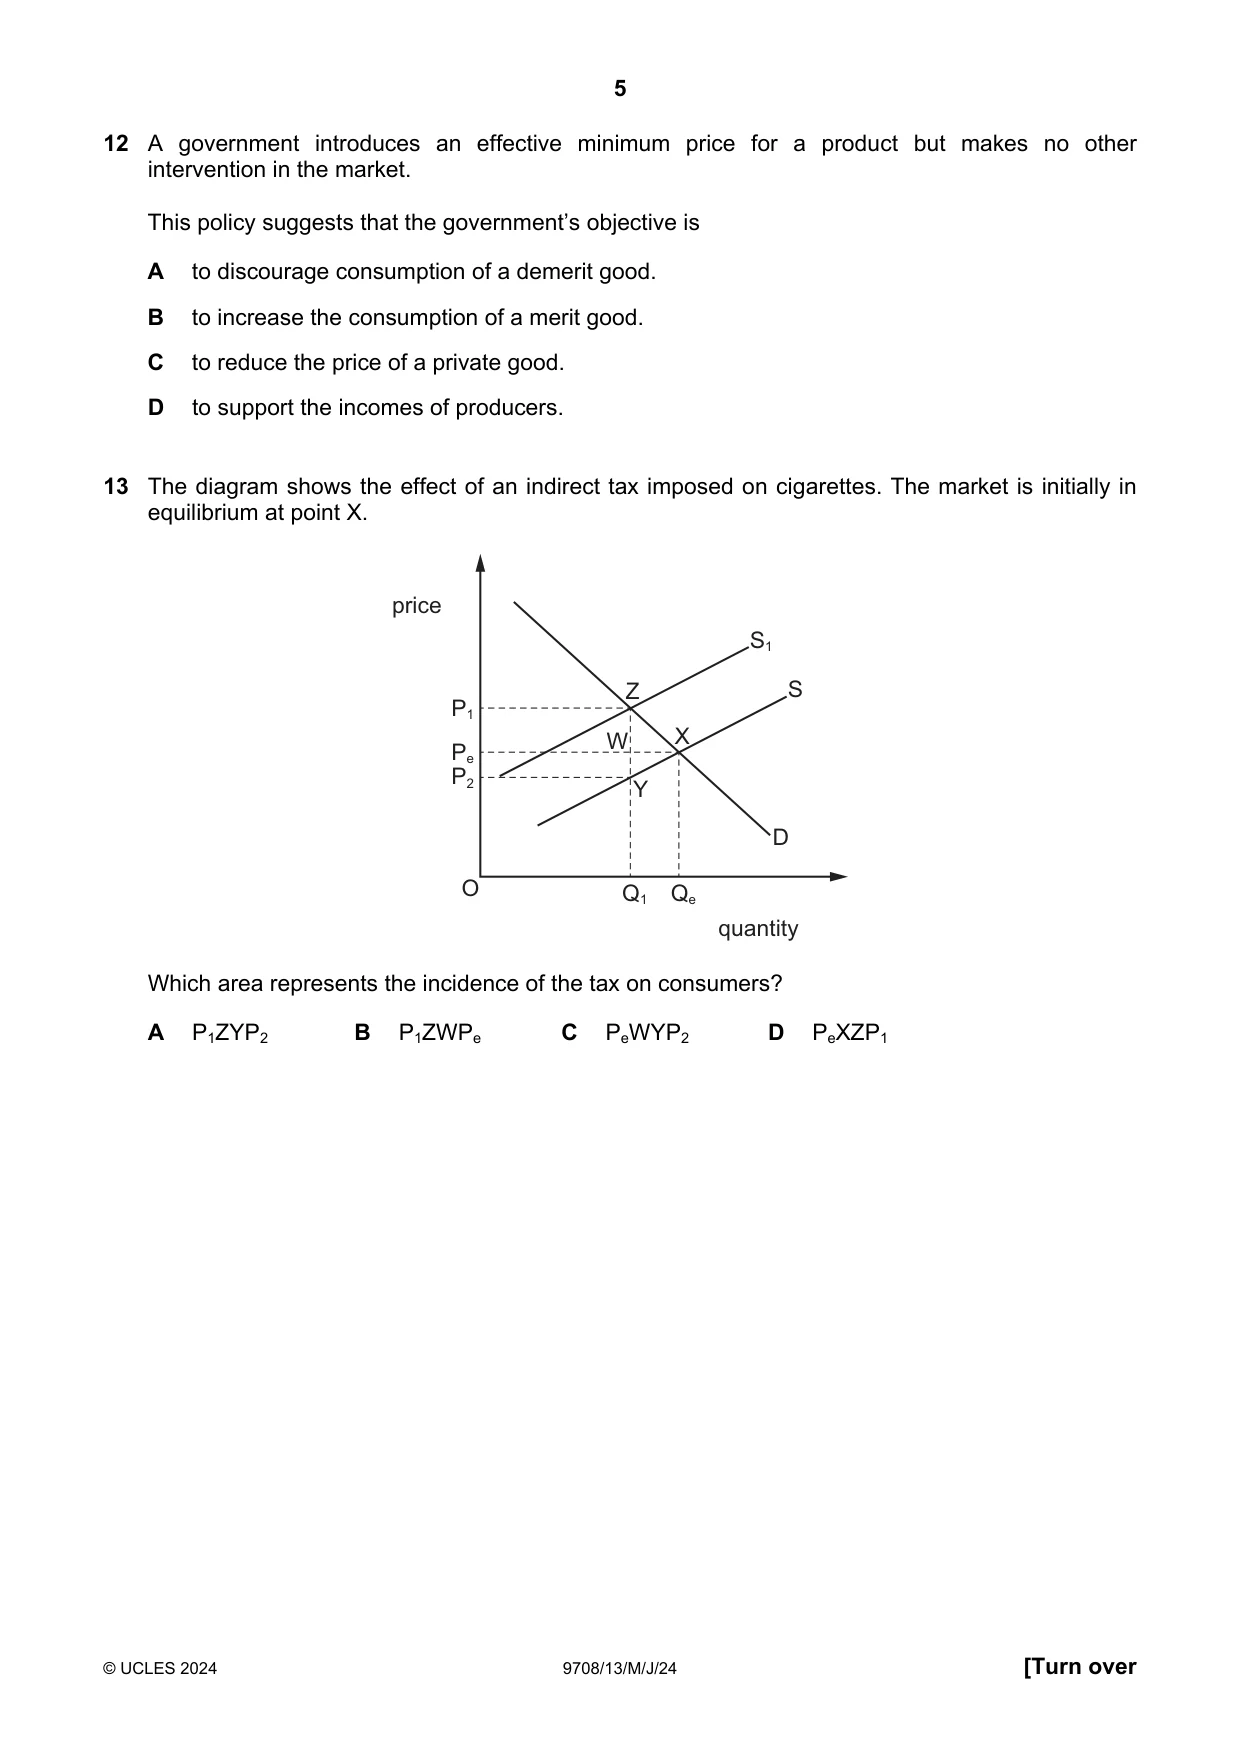
13 The diagram shows the effect of an indirect tax imposed on cigarettes. The market is initially in equilibrium at point X. price S1 Z S P1 W X Pe P2 Y D O Q1 Qe quantity Which area represents the incidence of the tax on consumers? A P1ZYP2 B P1ZWPe C PeWYP2 D PeXZP1
Mark scheme: B
More questions on Methods and effects of government intervention in markets
Q14 · The diagram shows the supply curve of a product
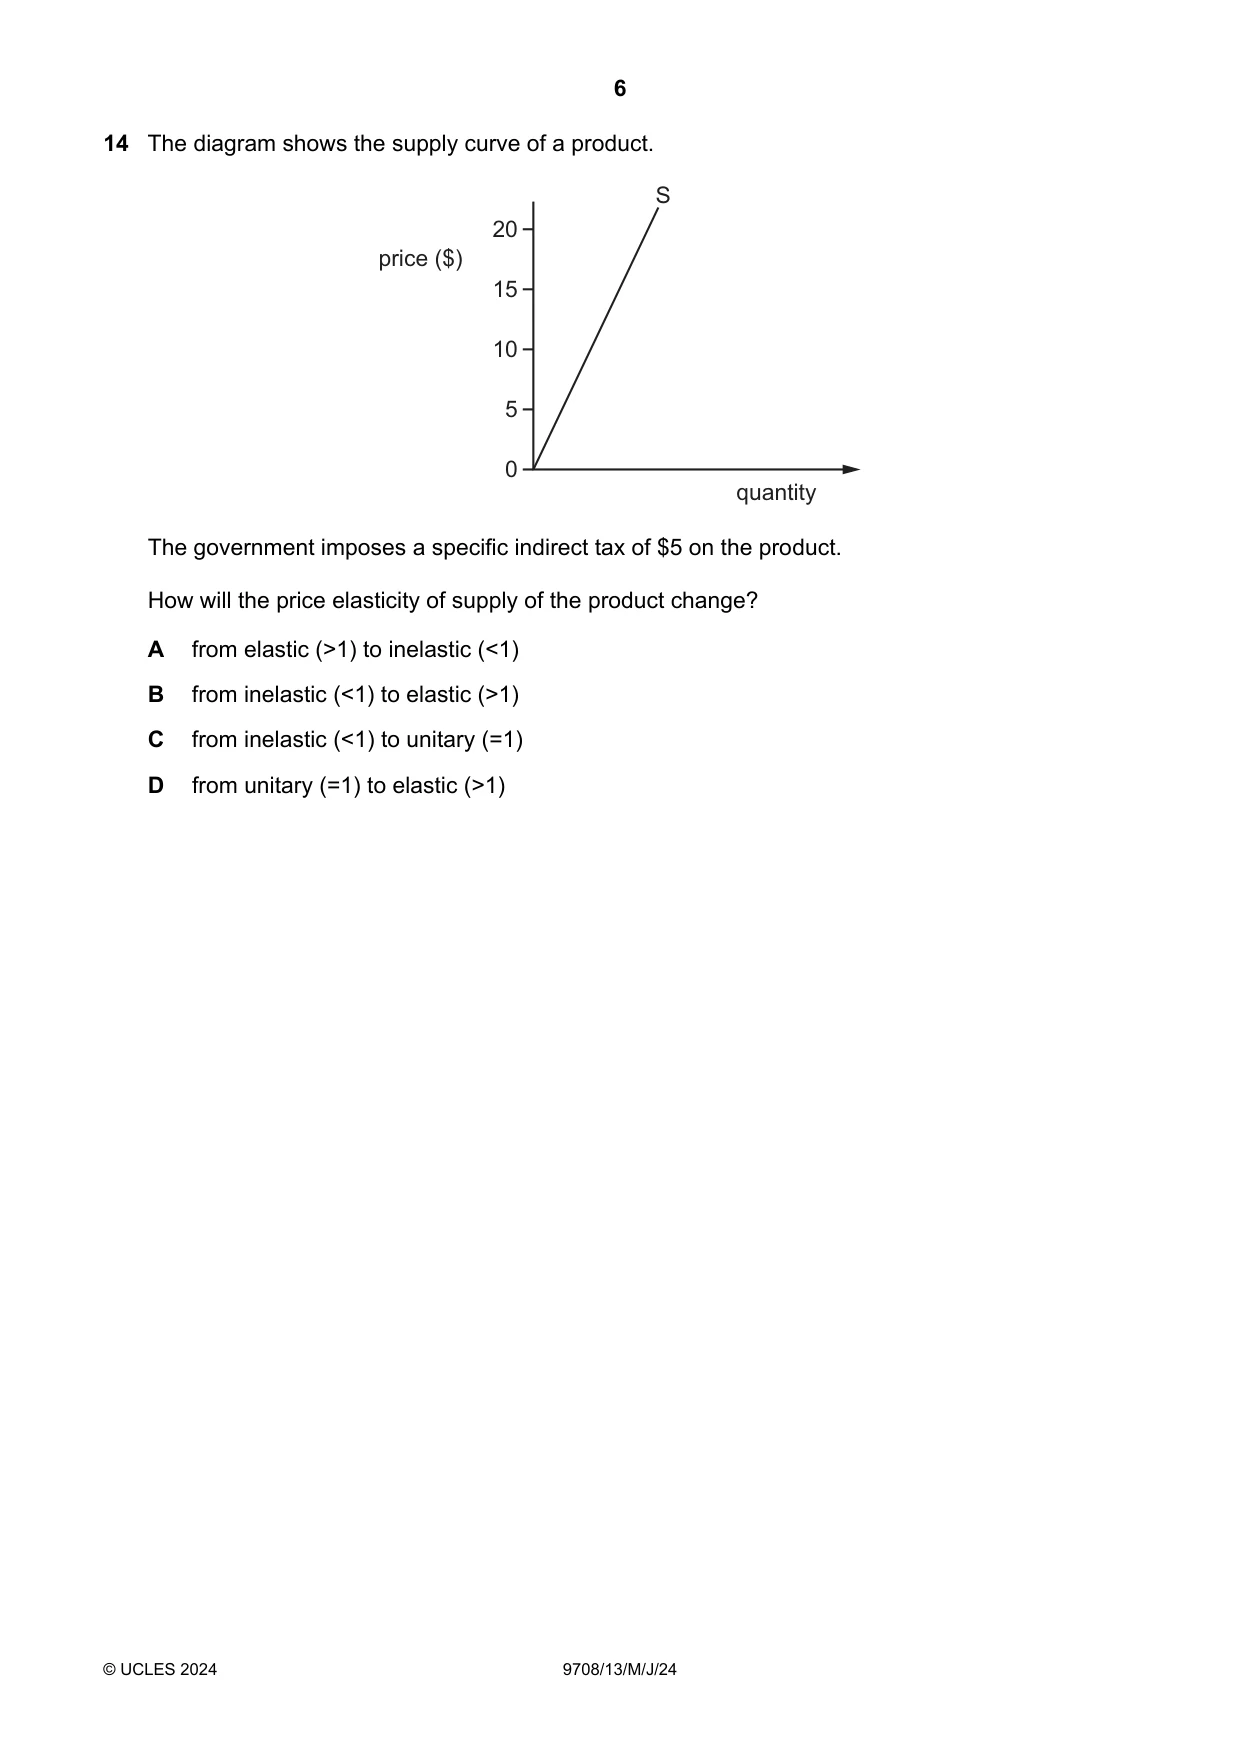
14 The diagram shows the supply curve of a product. S 20 price ($) 15 10 5 0 quantity The government imposes a specific indirect tax of $5 on the product. How will the price elasticity of supply of the product change? A from elastic (>1) to inelastic (<1) B from inelastic (<1) to elastic (>1) C from inelastic (<1) to unitary (=1) D from unitary (=1) to elastic (>1)
Mark scheme: D
Q15 · The diagrams show a country’s aggregate demand (AD1) and aggregate supply (AS1) curves
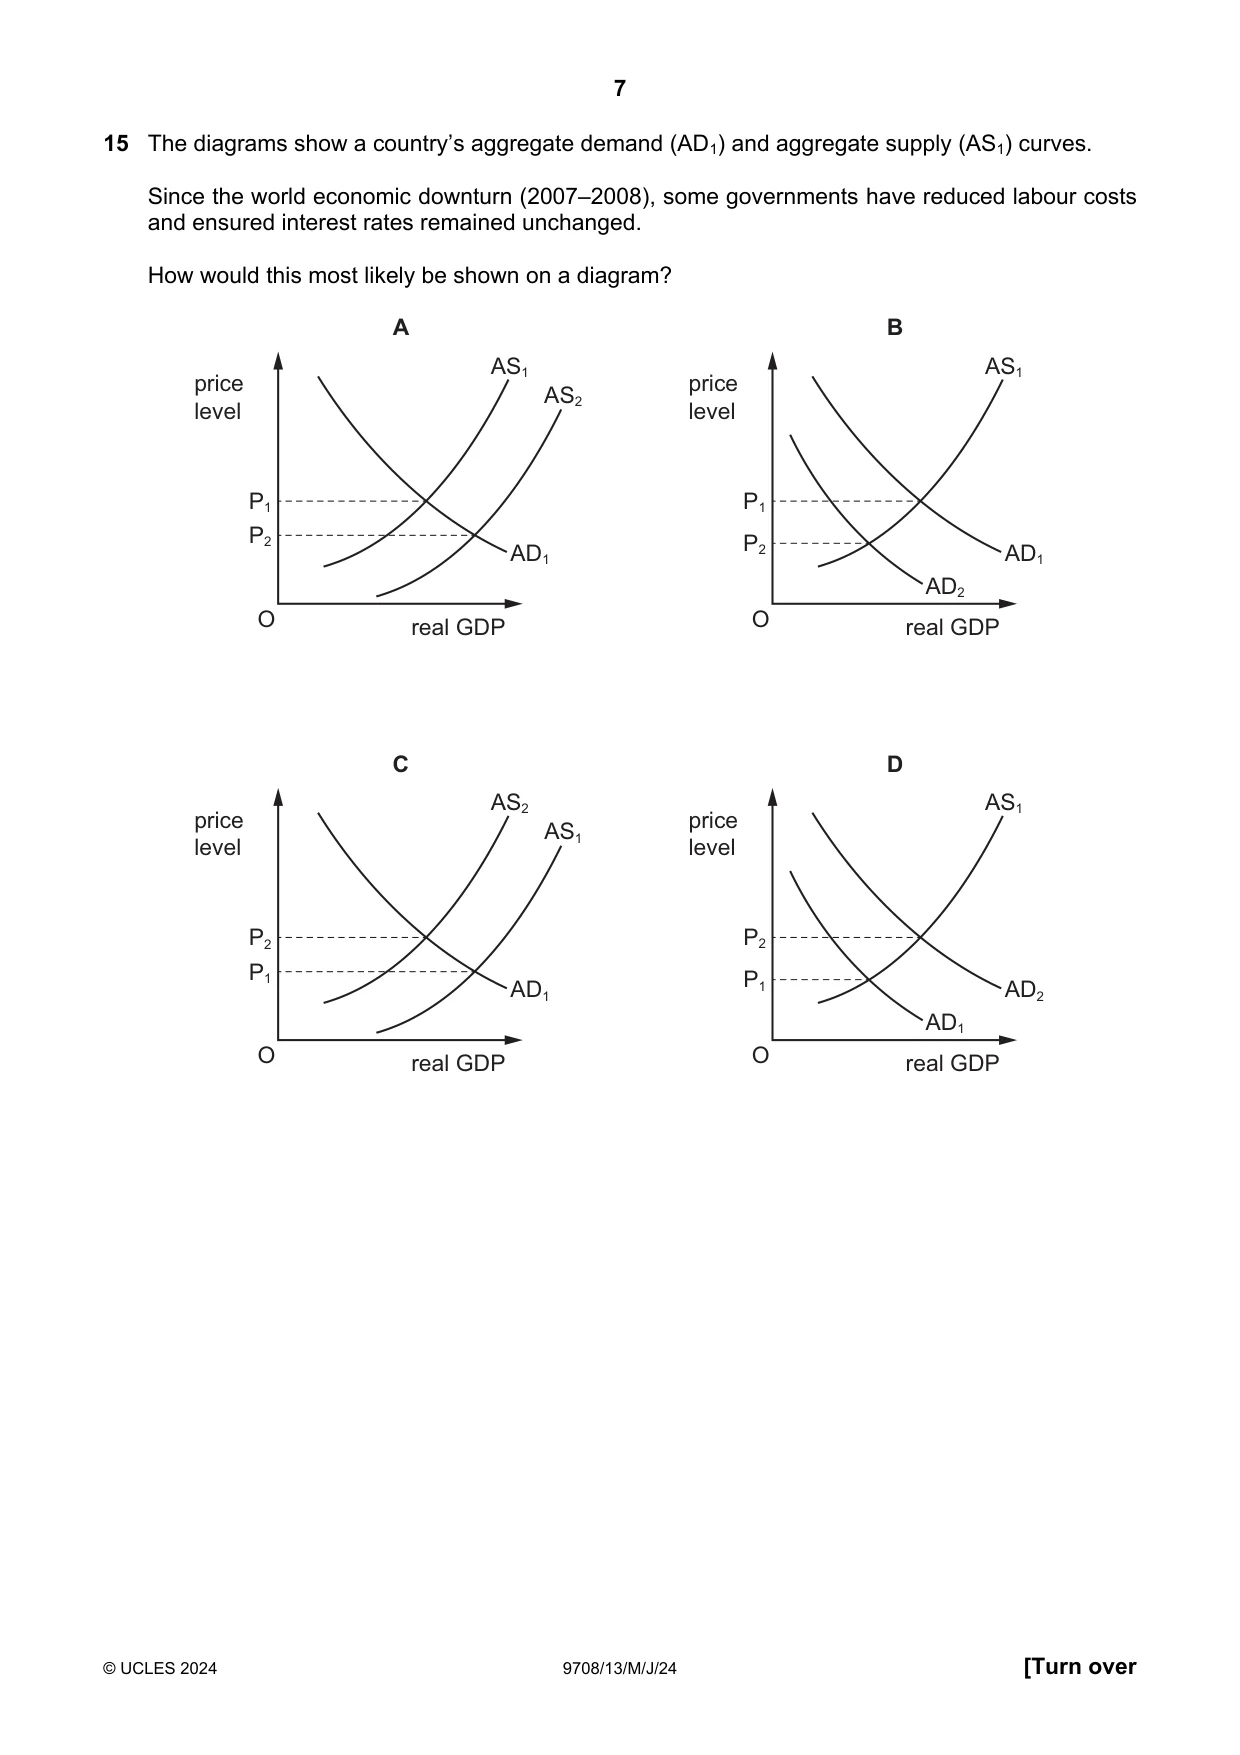
15 The diagrams show a country’s aggregate demand (AD1) and aggregate supply (AS1) curves. Since the world economic downturn (2007–2008), some governments have reduced labour costs and ensured interest rates remained unchanged. How would this most likely be shown on a diagram? A B AS1 AS1 price price AS2 level level P1 P1 P2 P2 AD1 AD1 AD2 O real GDP O real GDP C D AS2 AS1 price price AS1 level level P2 P2 P1 P1 AD1 AD2 AD1 O real GDP O real GDP
Mark scheme: A
Q16 · The diagram shows the effect on the average price level when aggregate demand (AD)…
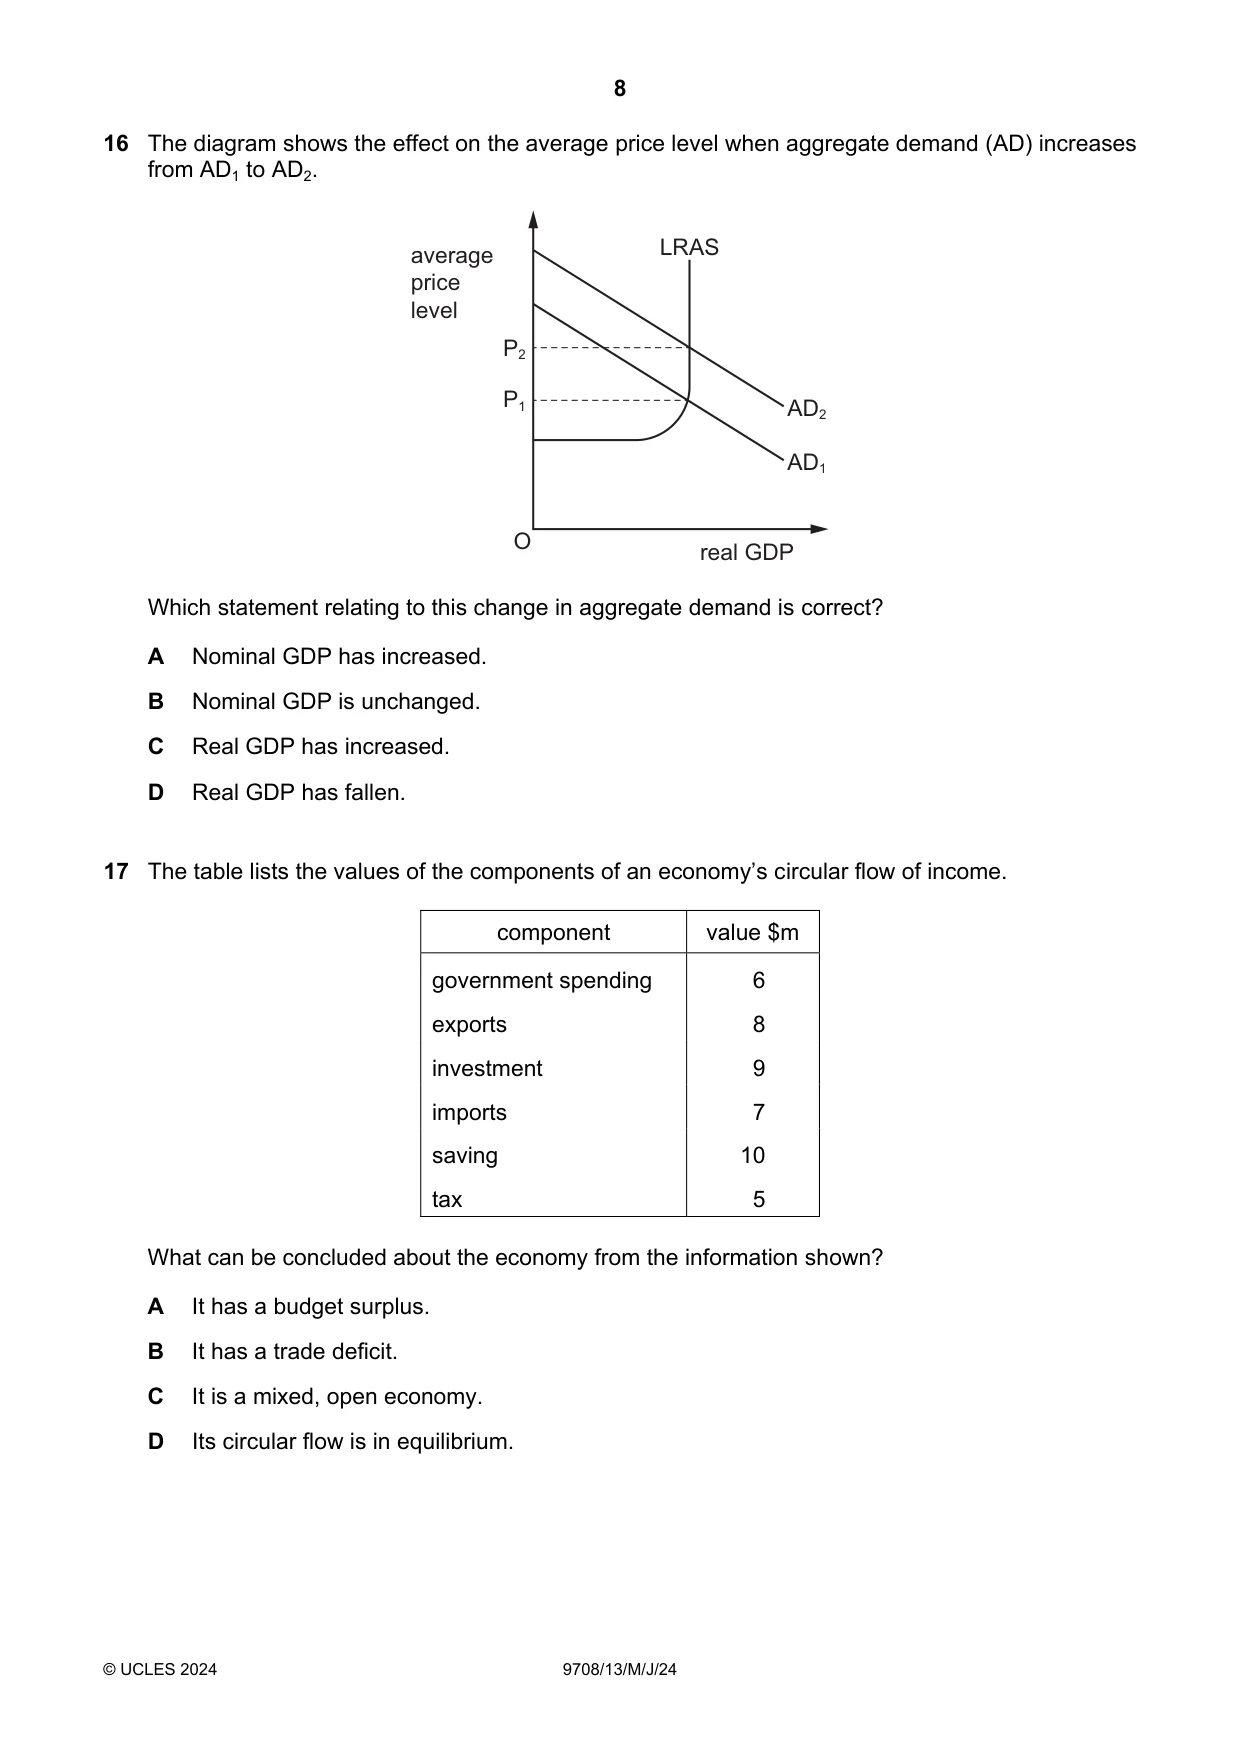
16 The diagram shows the effect on the average price level when aggregate demand (AD) increases from AD1 to AD2. average LRAS price level P2 P1 AD2 AD1 O real GDP Which statement relating to this change in aggregate demand is correct? A Nominal GDP has increased. B Nominal GDP is unchanged. C Real GDP has increased. D Real GDP has fallen.
Mark scheme: A
More questions on Aggregate Demand and Aggregate Supply analysis
Q17 · The table lists the values of the components of an economy’s circular flow of income
17 The table lists the values of the components of an economy’s circular flow of income. component value $m government spending 6 exports 8 investment 9 imports 7 saving 10 tax 5 What can be concluded about the economy from the information shown? A It has a budget surplus. B It has a trade deficit. C It is a mixed, open economy. D Its circular flow is in equilibrium.
Mark scheme: C
More questions on Introduction to the circular flow of income
Q18 · What is a cost of negative economic growth?
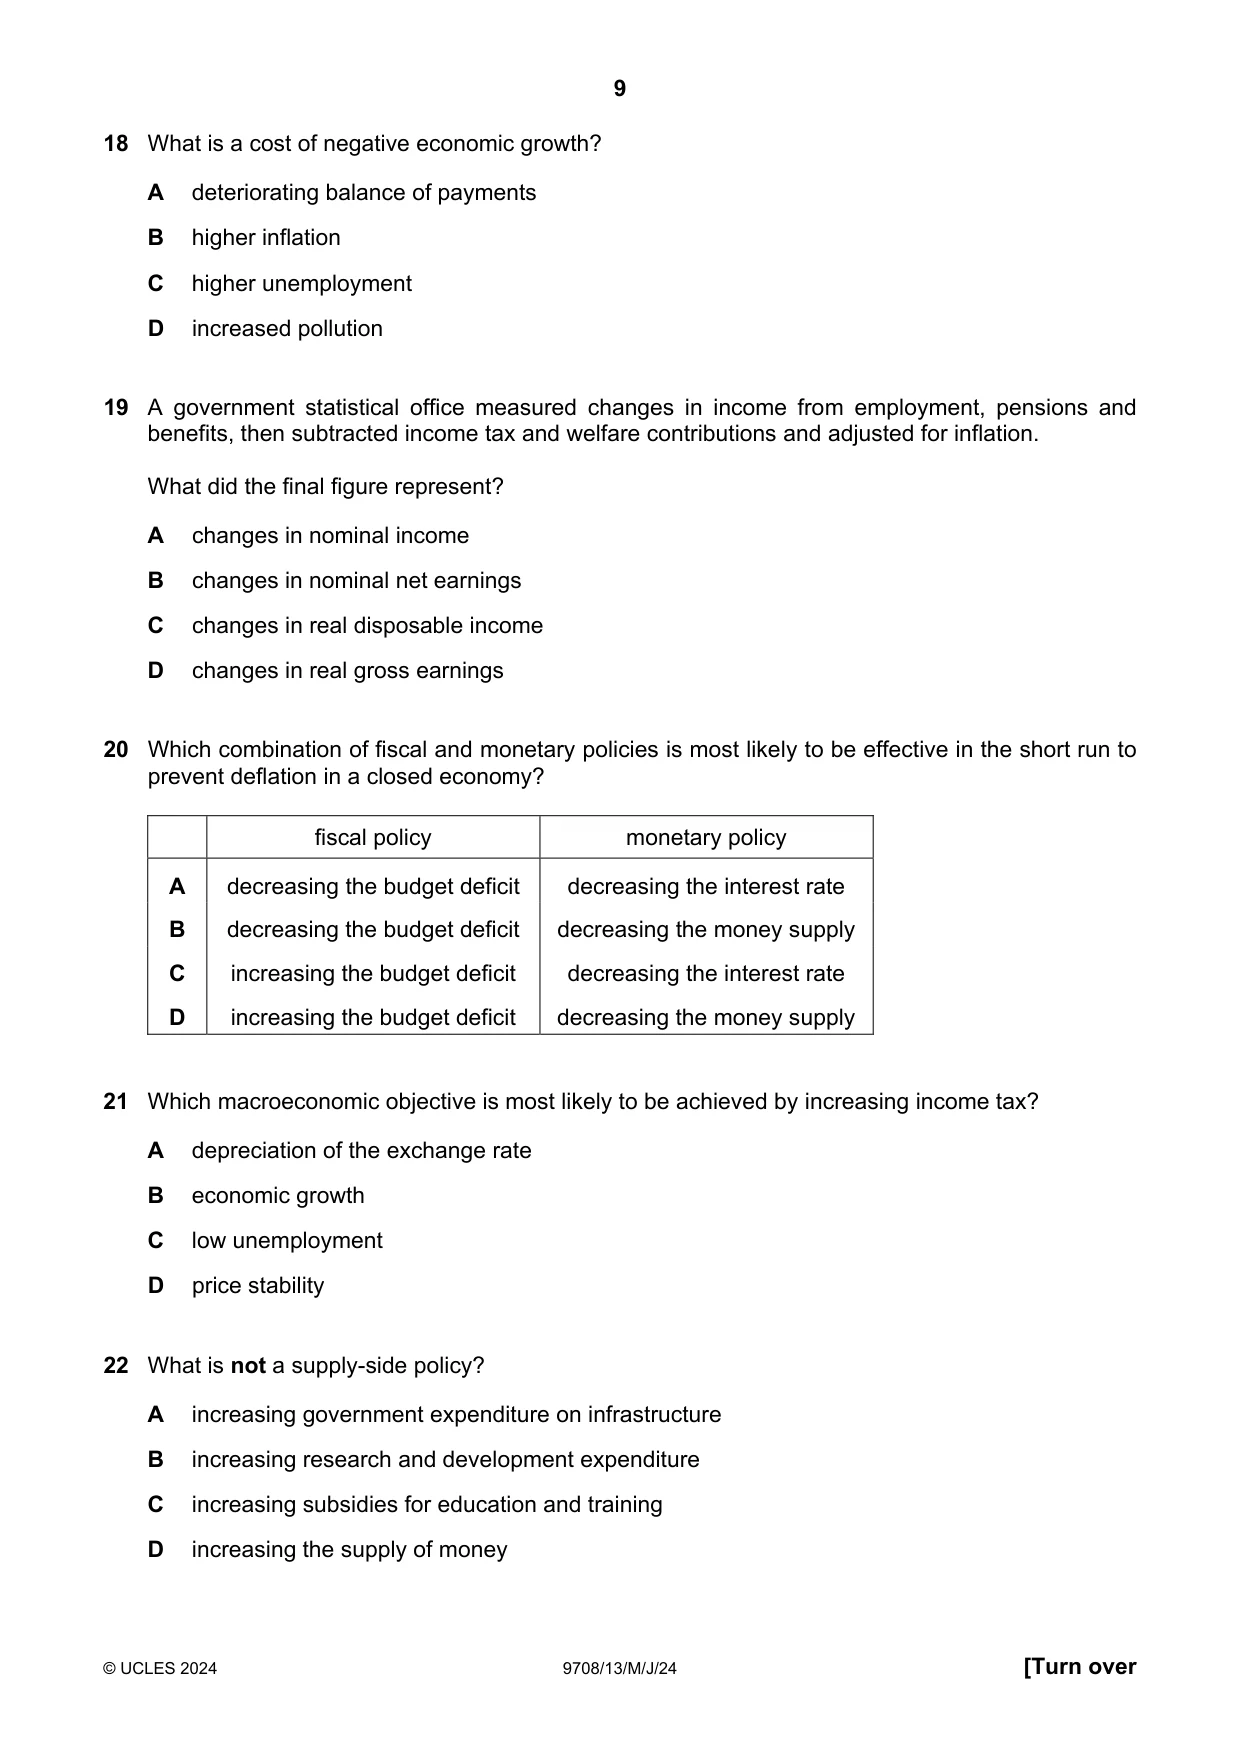
18 What is a cost of negative economic growth? A deteriorating balance of payments B higher inflation C higher unemployment D increased pollution
Mark scheme: C
Q19 · A government statistical office measured changes in income from employment, pensions and…
19 A government statistical office measured changes in income from employment, pensions and benefits, then subtracted income tax and welfare contributions and adjusted for inflation. What did the final figure represent? A changes in nominal income B changes in nominal net earnings C changes in real disposable income D changes in real gross earnings
Mark scheme: C
Q20 · Which combination of fiscal and monetary policies is most likely to be effective in the…
20 Which combination of fiscal and monetary policies is most likely to be effective in the short run to prevent deflation in a closed economy? fiscal policy monetary policy A decreasing the budget deficit decreasing the interest rate B decreasing the budget deficit decreasing the money supply C increasing the budget deficit decreasing the interest rate D increasing the budget deficit decreasing the money supply
Mark scheme: C
Q21 · Which macroeconomic objective is most likely to be achieved by increasing income tax?
21 Which macroeconomic objective is most likely to be achieved by increasing income tax? A depreciation of the exchange rate B economic growth C low unemployment D price stability
Mark scheme: D
More questions on Government macroeconomic policy objectives
Q22 · What is not a supply-side policy?
22 What is not a supply-side policy? A increasing government expenditure on infrastructure B increasing research and development expenditure C increasing subsidies for education and training D increasing the supply of money
Mark scheme: D
Q23 · When can a policy be classified as macroeconomic?
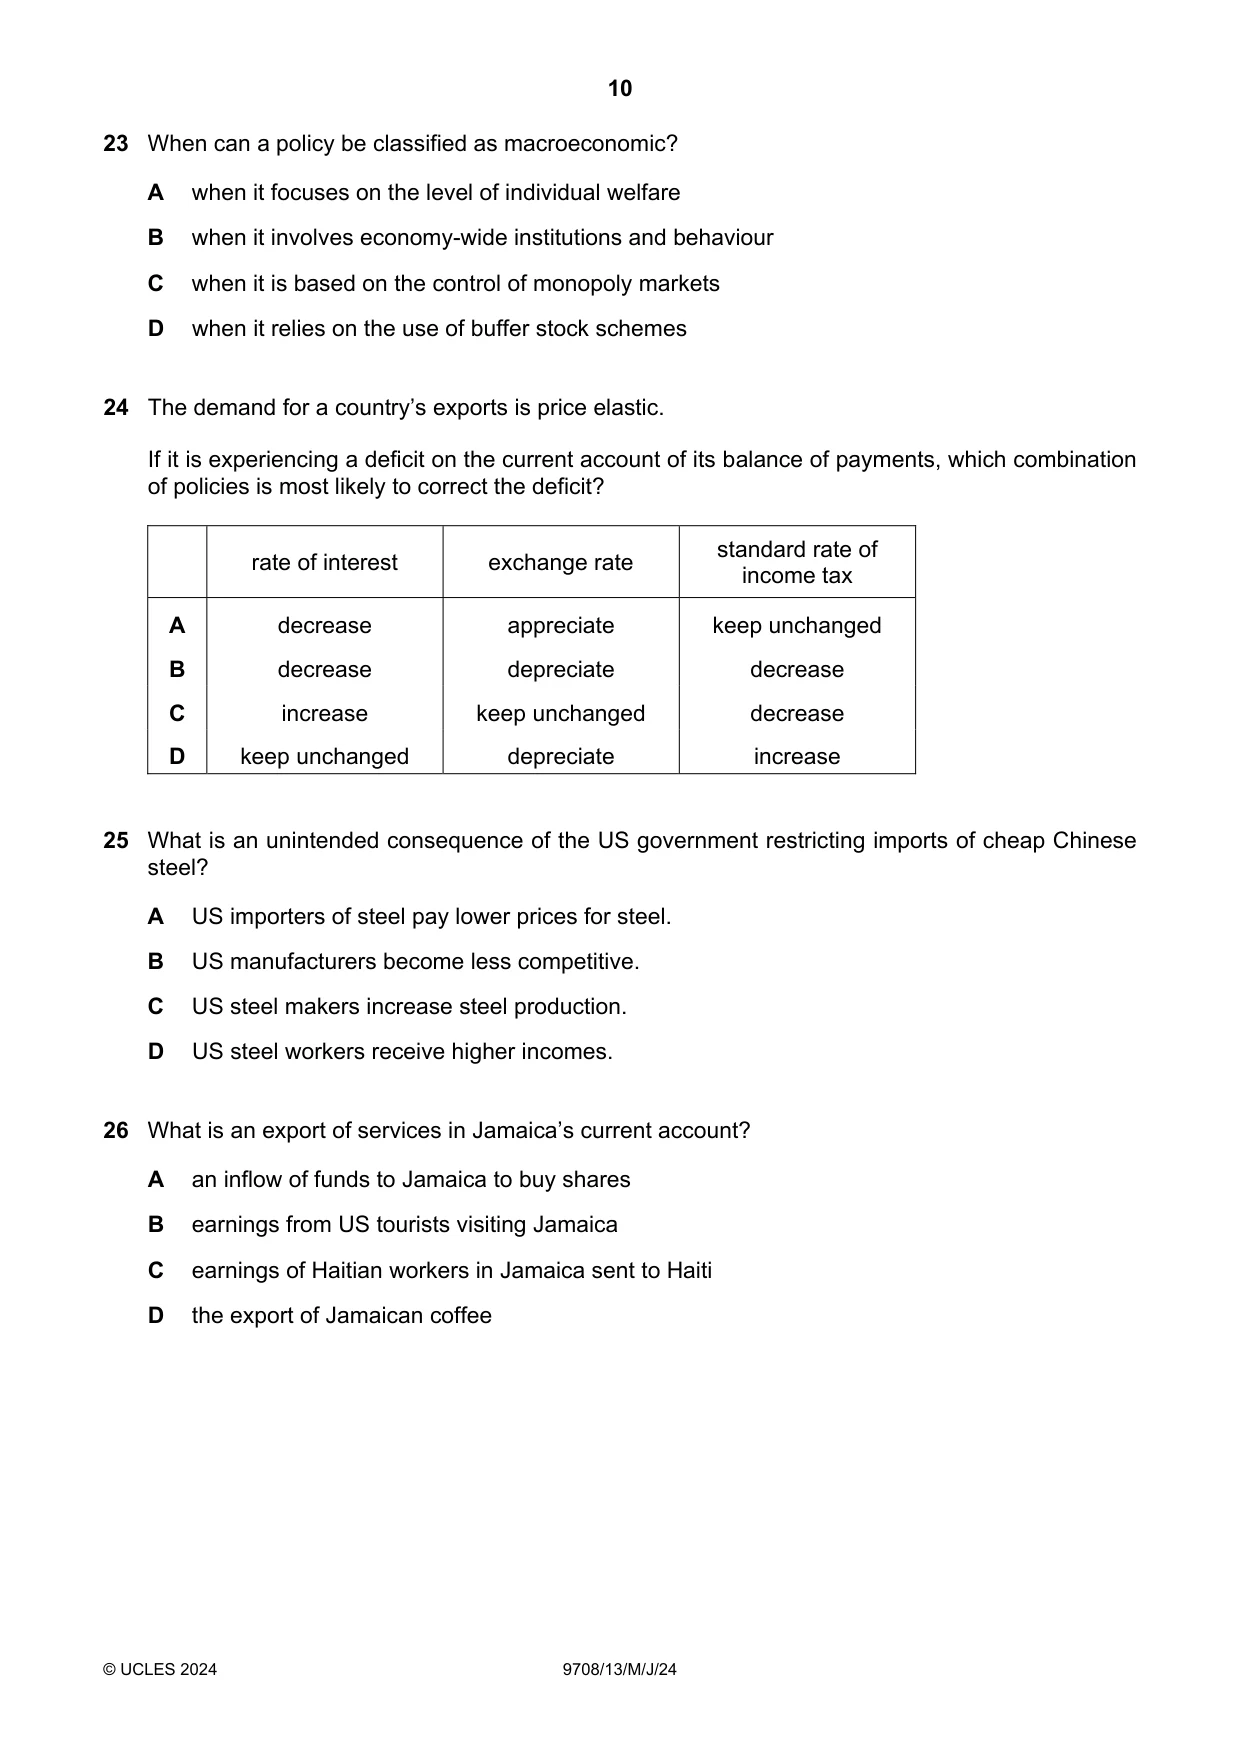
23 When can a policy be classified as macroeconomic? A when it focuses on the level of individual welfare B when it involves economy-wide institutions and behaviour C when it is based on the control of monopoly markets D when it relies on the use of buffer stock schemes
Mark scheme: B
More questions on Government macroeconomic policy objectives
Q24 · The demand for a country’s exports is price elastic
24 The demand for a country’s exports is price elastic. If it is experiencing a deficit on the current account of its balance of payments, which combination of policies is most likely to correct the deficit? standard rate of rate of interest exchange rate income tax A decrease appreciate keep unchanged B decrease depreciate decrease C increase keep unchanged decrease D keep unchanged depreciate increase
Mark scheme: D
More questions on Policies to correct imbalances in the current account of the balance of payments
Q25 · What is an unintended consequence of the US government restricting imports of cheap…
25 What is an unintended consequence of the US government restricting imports of cheap Chinese steel? A US importers of steel pay lower prices for steel. B US manufacturers become less competitive. C US steel makers increase steel production. D US steel workers receive higher incomes.
Mark scheme: B
Q26 · What is an export of services in Jamaica’s current account?
26 What is an export of services in Jamaica’s current account? A an inflow of funds to Jamaica to buy shares B earnings from US tourists visiting Jamaica C earnings of Haitian workers in Jamaica sent to Haiti D the export of Jamaican coffee
Mark scheme: B
More questions on Current account of the balance of payments
Q27 · A country imports natural gas for which it has price-inelastic demand
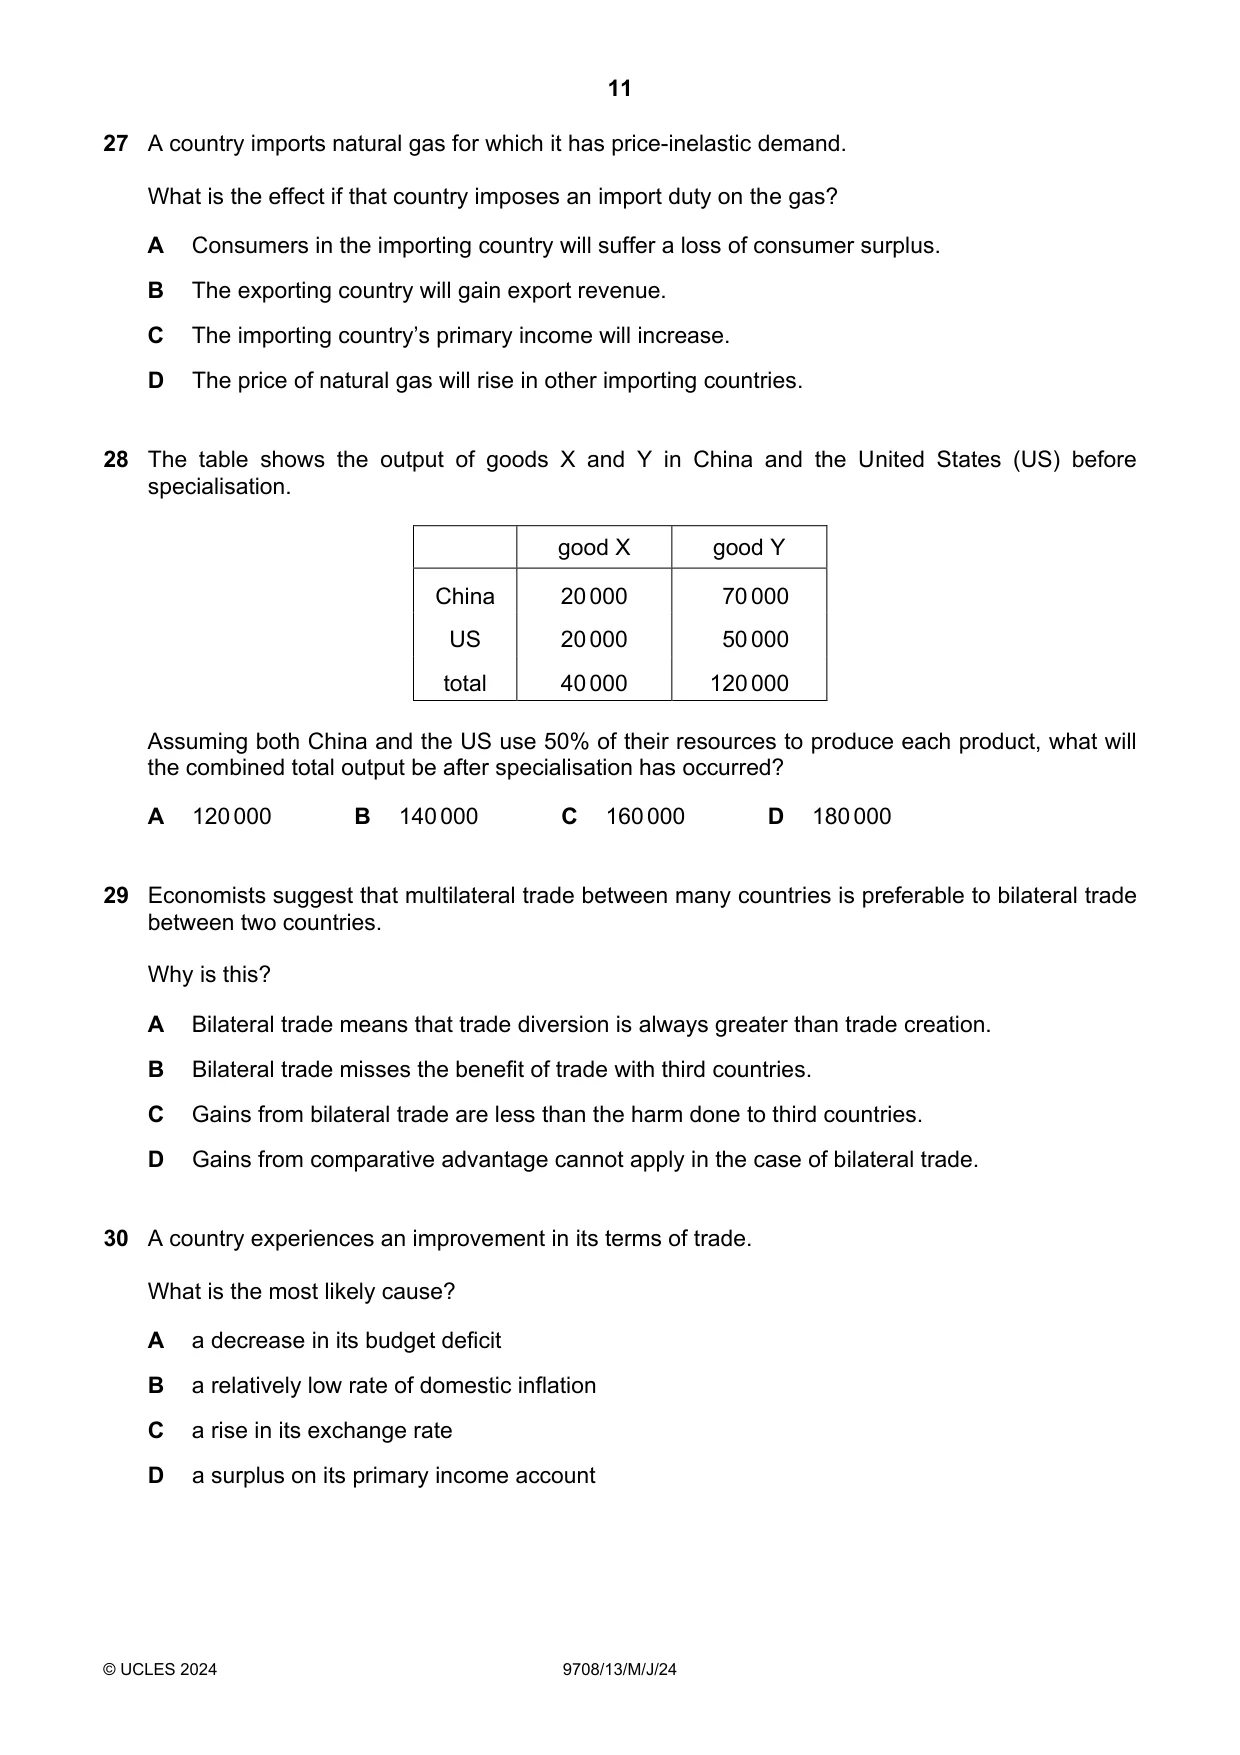
27 A country imports natural gas for which it has price-inelastic demand. What is the effect if that country imposes an import duty on the gas? A Consumers in the importing country will suffer a loss of consumer surplus. B The exporting country will gain export revenue. C The importing country’s primary income will increase. D The price of natural gas will rise in other importing countries.
Mark scheme: A
Q28 · The table shows the output of goods X and Y in China and the United States (US) before…
28 The table shows the output of goods X and Y in China and the United States (US) before specialisation. good X good Y China 20 000 70 000 US 20 000 50 000 total 40 000 120 000 Assuming both China and the US use 50% of their resources to produce each product, what will the combined total output be after specialisation has occurred? A 120 000 B 140 000 C 160 000 D 180 000
Mark scheme: D
Q29 · Economists suggest that multilateral trade between many countries is preferable to…
29 Economists suggest that multilateral trade between many countries is preferable to bilateral trade between two countries. Why is this? A Bilateral trade means that trade diversion is always greater than trade creation. B Bilateral trade misses the benefit of trade with third countries. C Gains from bilateral trade are less than the harm done to third countries. D Gains from comparative advantage cannot apply in the case of bilateral trade.
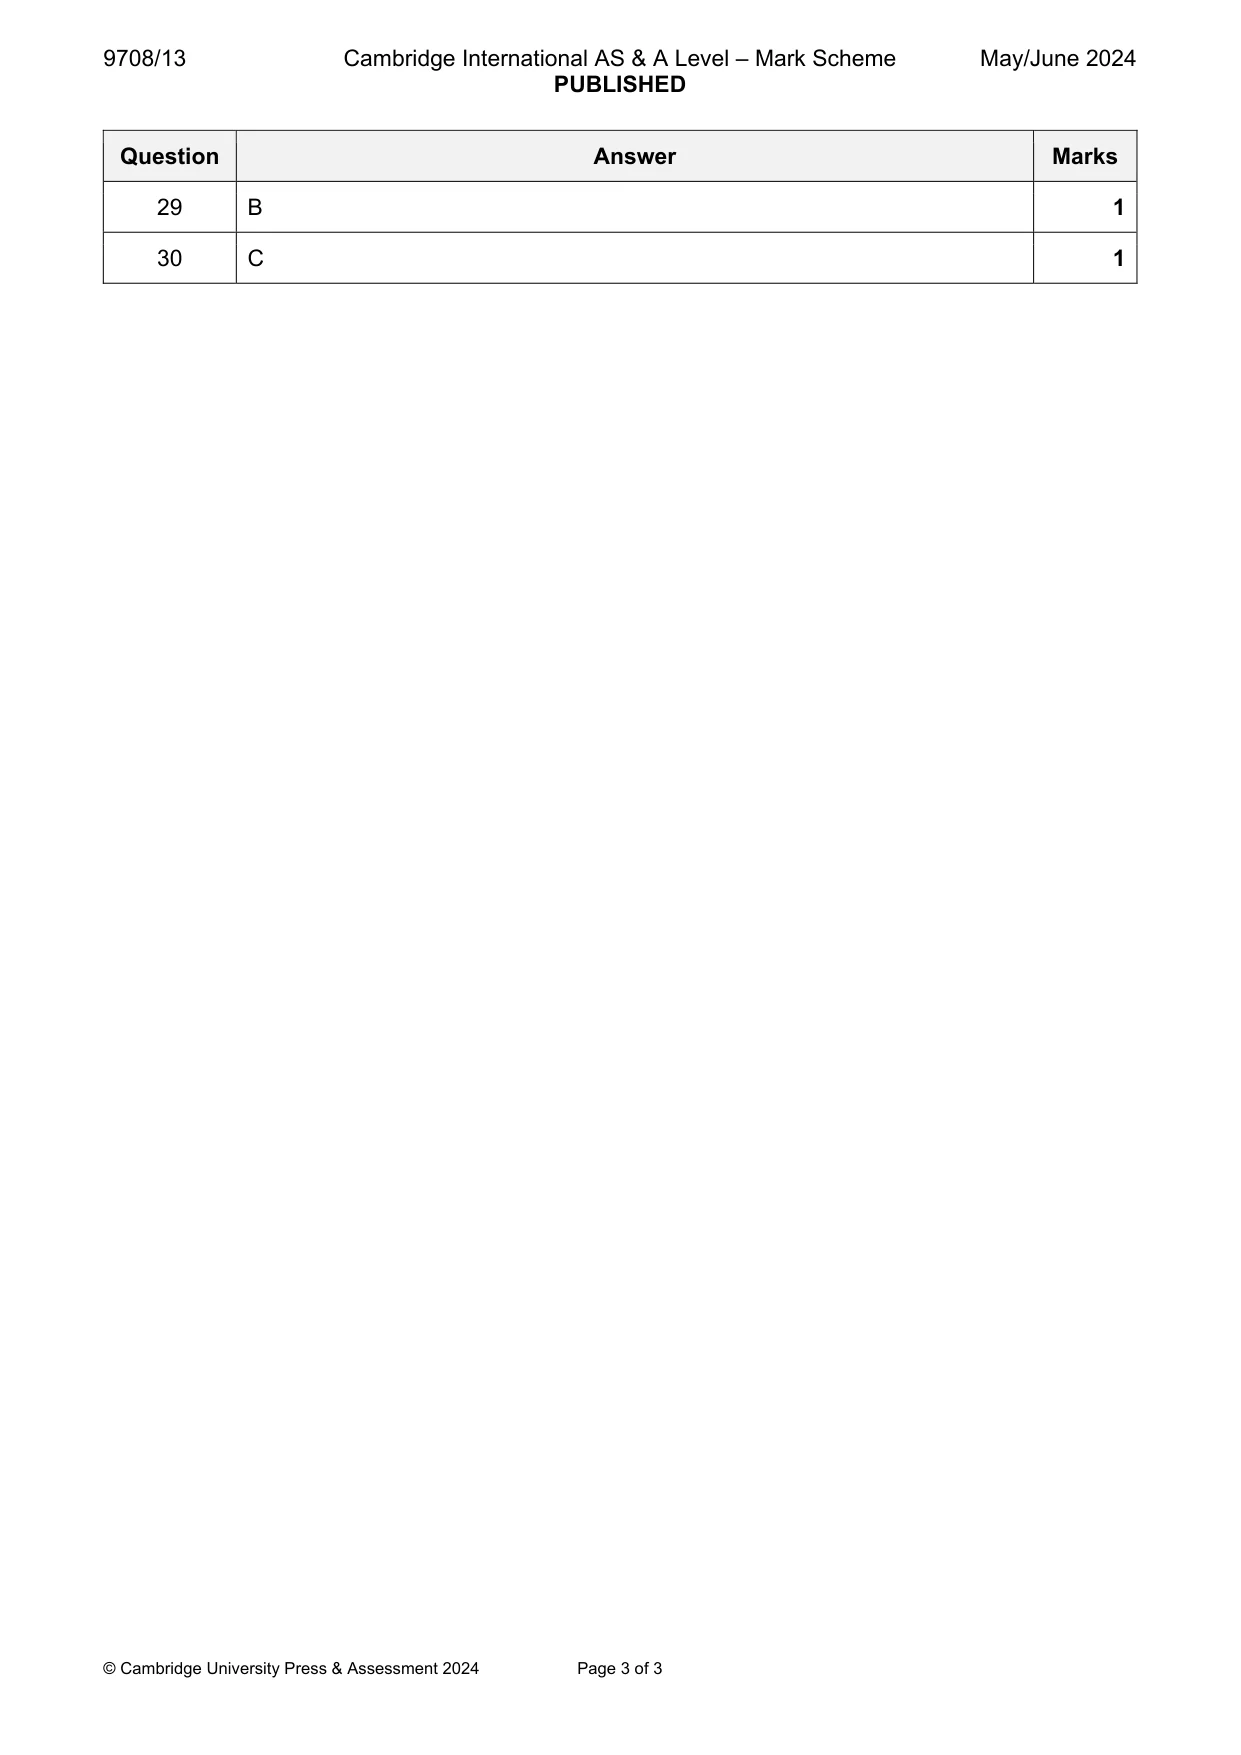
Mark scheme: B
Q30 · A country experiences an improvement in its terms of trade
30 A country experiences an improvement in its terms of trade. What is the most likely cause? A a decrease in its budget deficit B a relatively low rate of domestic inflation C a rise in its exchange rate D a surplus on its primary income account
Mark scheme: C
What was in this paper
The subtopics covered by these 30 questions, and how many questions each got. Open one in a new tab to see every Cambridge question on it.
2Demand and supply curves2Government macroeconomic policy objectives2Methods and effects of government intervention in markets2Price elasticity of supply2Protectionism2Supply-side policy2The interaction of demand and supply2The reasons for international trade2Aggregate Demand and Aggregate Supply analysis1Current account of the balance of payments1Economic growth1Exchange rates1Factors of production1Fiscal policy1Introduction to the circular flow of income1National income statistics1Policies to correct imbalances in the current account of the balance of payments1Price elasticity, income elasticity and cross elasticity of demand1Production possibility curves1Scarcity, choice and opportunity cost1What you needed in this session
Cambridge’s own grade thresholds for 2024 May/June, Paper 1 · Variant 3. A higher threshold means an easier paper — the bar moves with how the cohort did.