Cambridge A Level Economics 9708 — 2018 Oct/Nov Paper 1 · Variant 2
9708/12/O/N/18 · 30 questions · 30 marks · ≈34 min
The question paper and its mark scheme, free to read here and free to download. This is Cambridge’s own paper, exactly as it was sat.
Question paper12 pages
Mark scheme3 pages
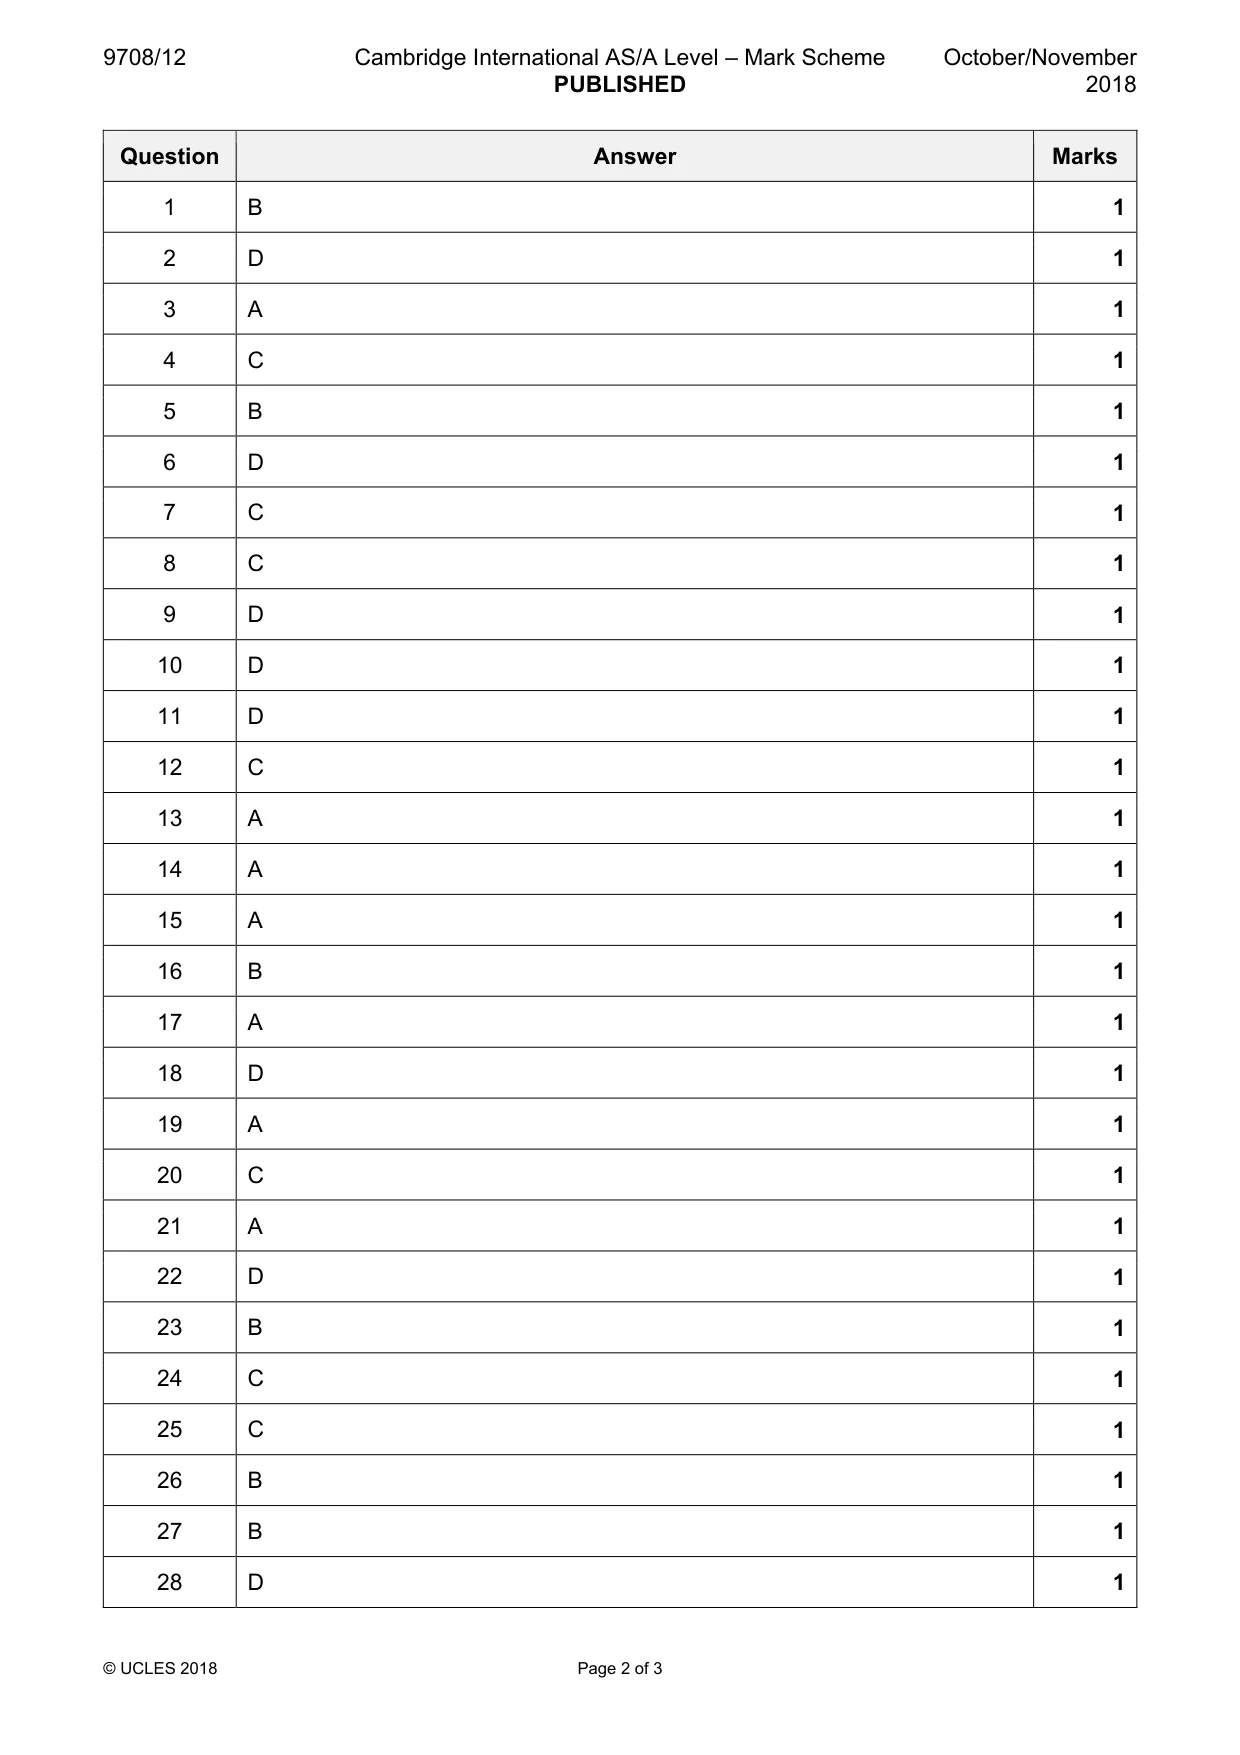
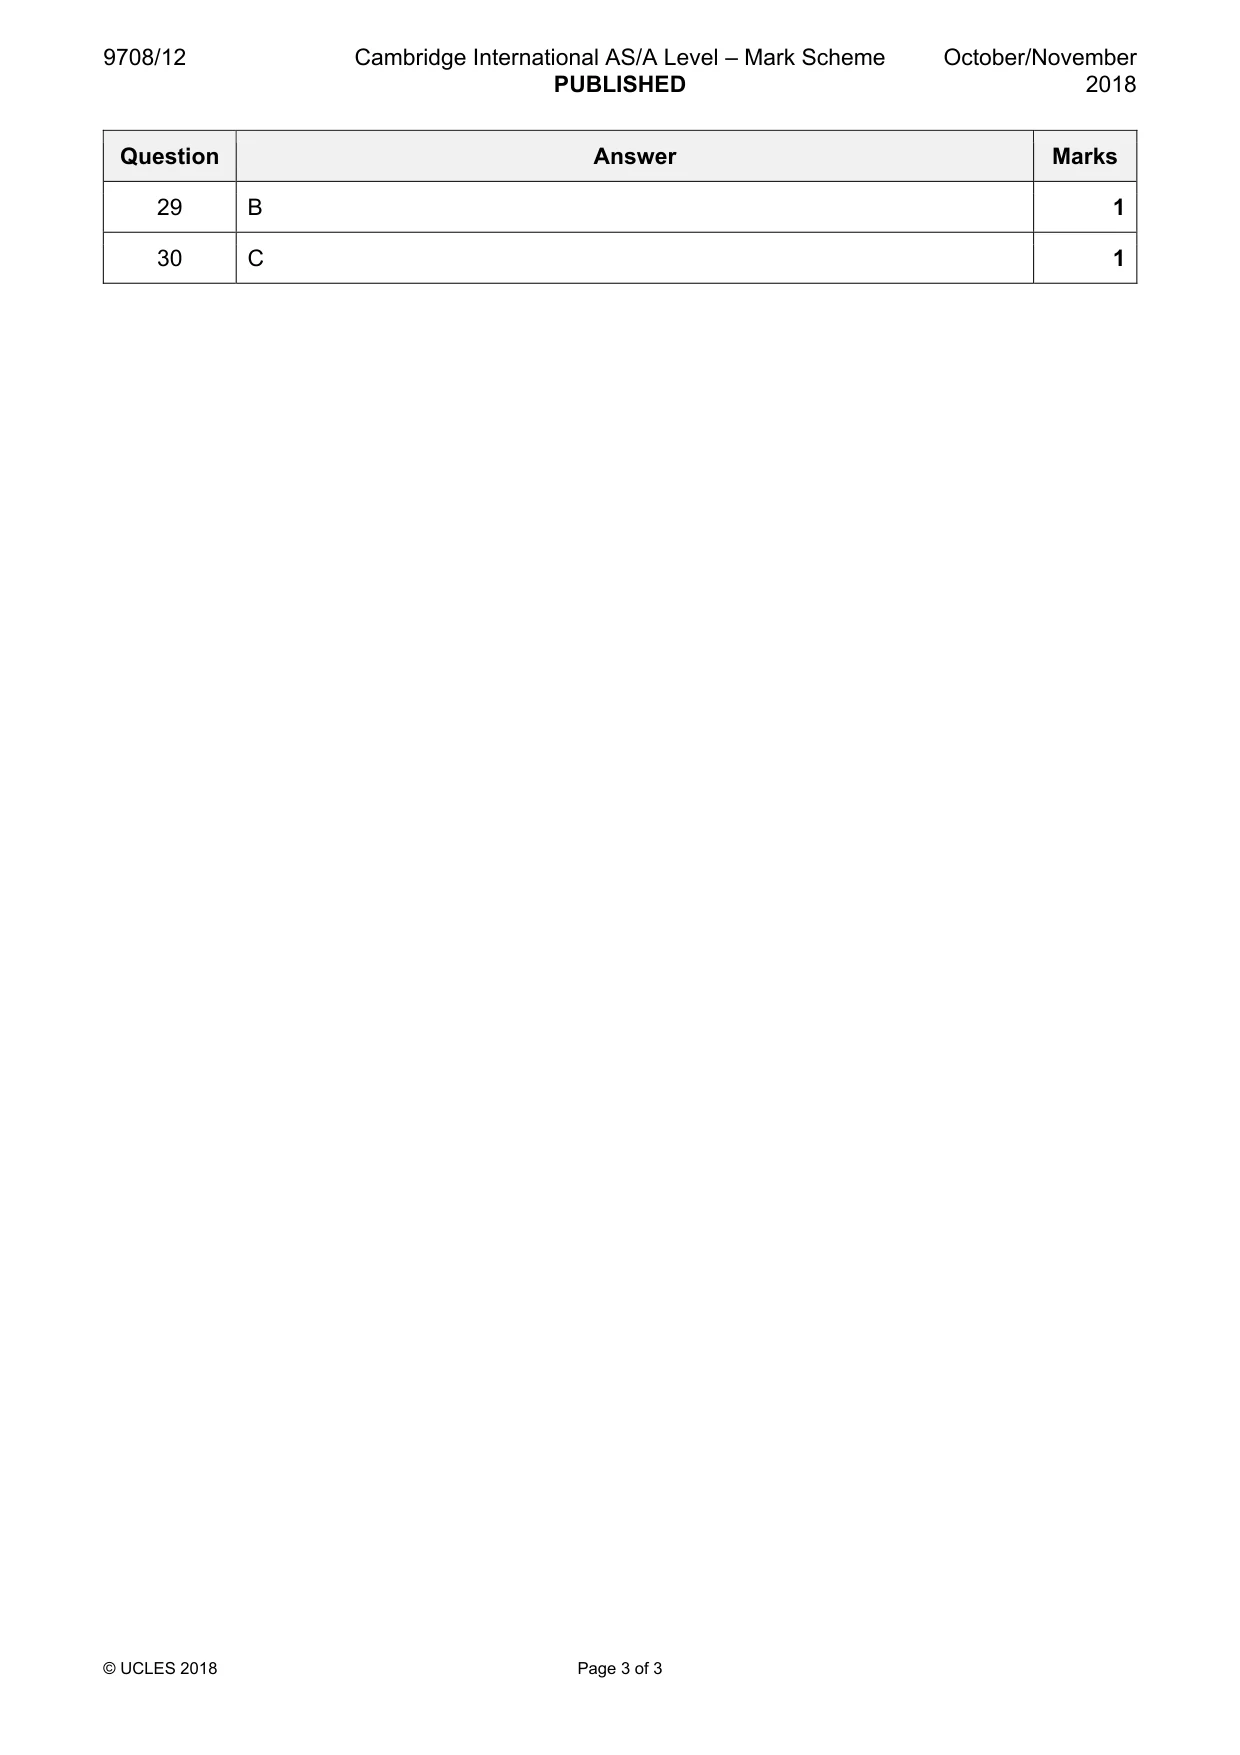
Answers below. Sit the paper first if you are practising.
Questions as text
Q1 · Which statement by a company is normative?
1 Which statement by a company is normative? A In the past three years we have carried out the biggest merger acquisition in the group’s history. B The business has fallen behind competitors and needs to improve its ethical standards. C The growth of the business has been in retail and financial services. D The structure of the business has been simplified.
Mark scheme: B
Q2 · The diagram shows an economy's production possibility curve for goods X and Y
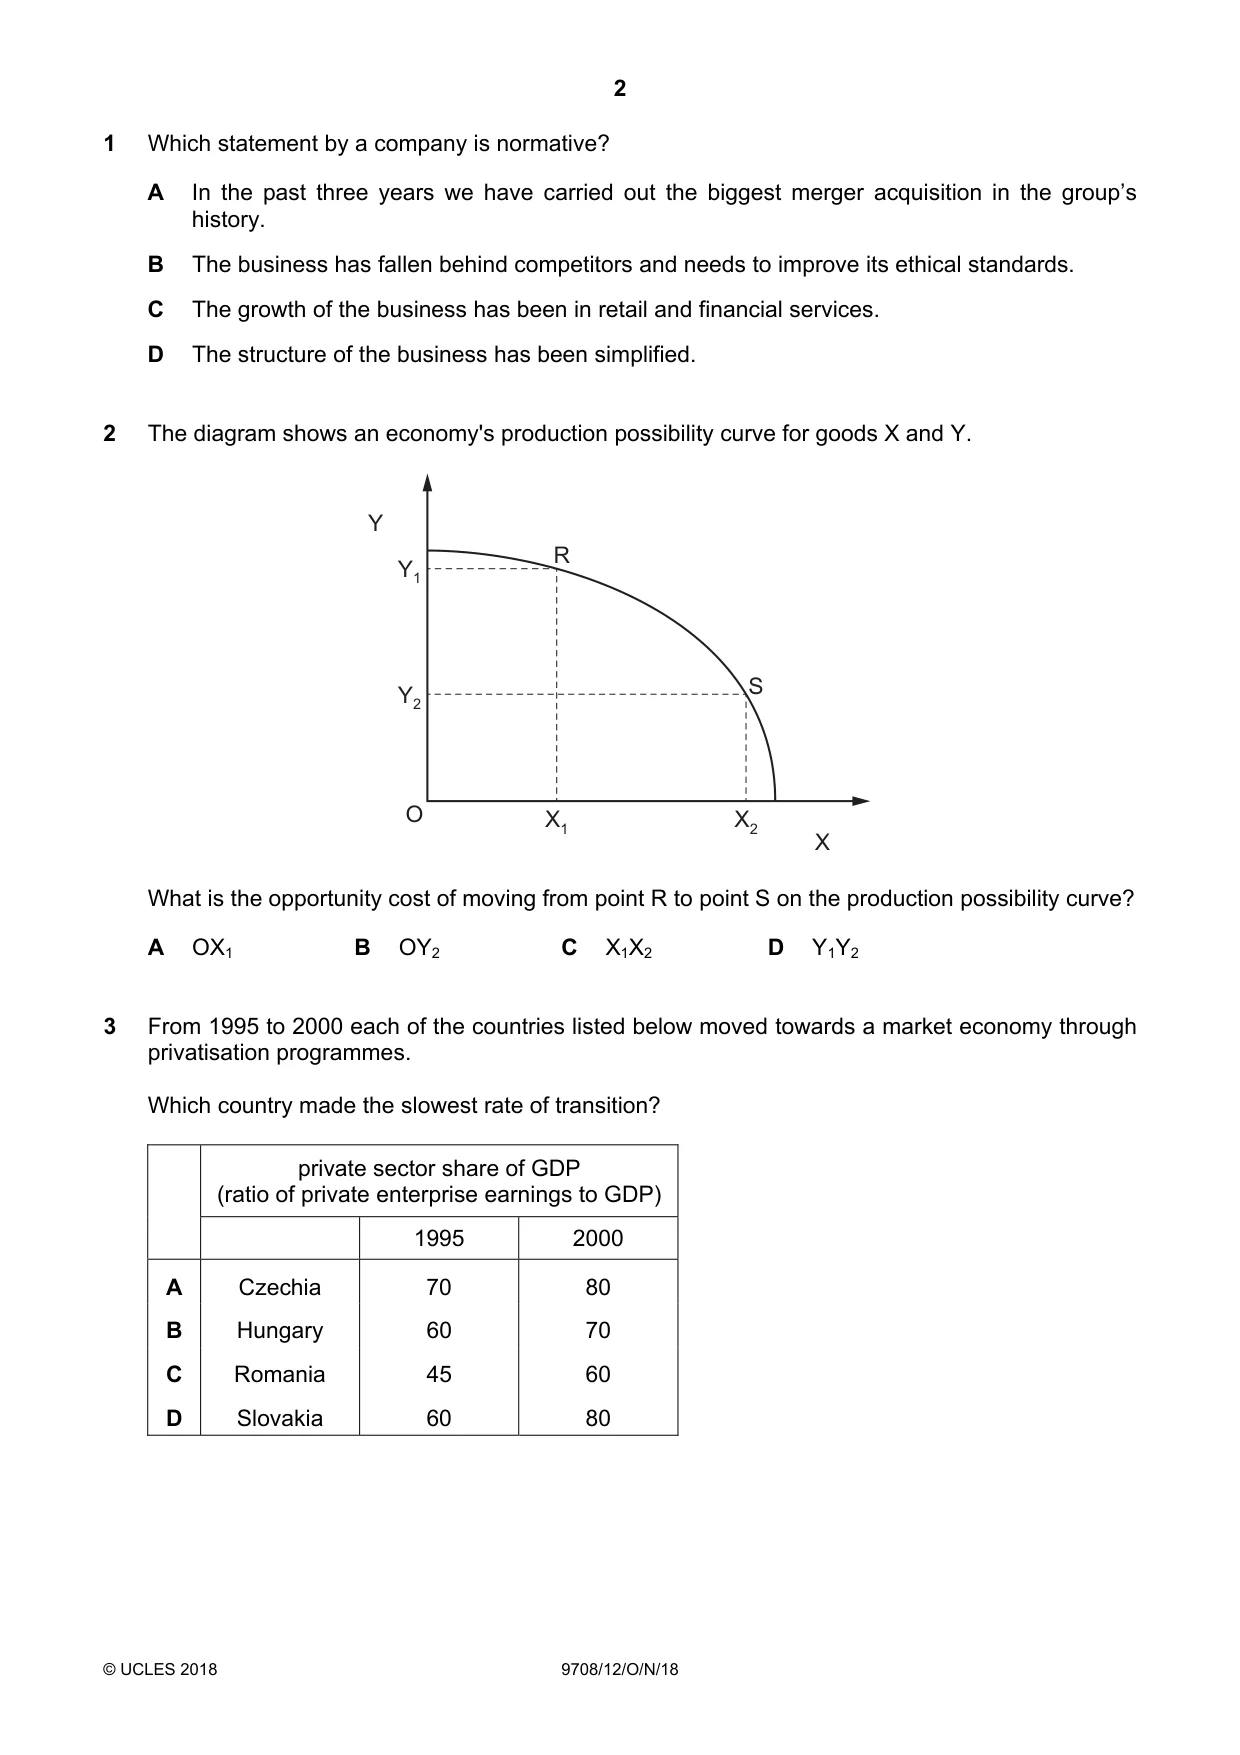
2 The diagram shows an economy's production possibility curve for goods X and Y. Y R Y1 Y2 S O X1 X2 X What is the opportunity cost of moving from point R to point S on the production possibility curve? A OX1 B OY2 C X1X2 D Y1Y2
Mark scheme: D
Q3 · From 1995 to 2000 each of the countries listed below moved towards a market economy…
3 From 1995 to 2000 each of the countries listed below moved towards a market economy through privatisation programmes. Which country made the slowest rate of transition? private sector share of GDP (ratio of private enterprise earnings to GDP) 1995 2000 A Czechia 70 80 B Hungary 60 70 C Romania 45 60 D Slovakia 60 80
Mark scheme: A
More questions on Resource allocation in different economic systems
Q4 · A businesswoman sets up a charity to provide toys for young children of low income…
4 A businesswoman sets up a charity to provide toys for young children of low income families. Which term most accurately describes these toys? A free goods B merit goods C private goods D public goods
Mark scheme: C
Q5 · What will happen to an industry’s supply curve if new firms enter the industry?
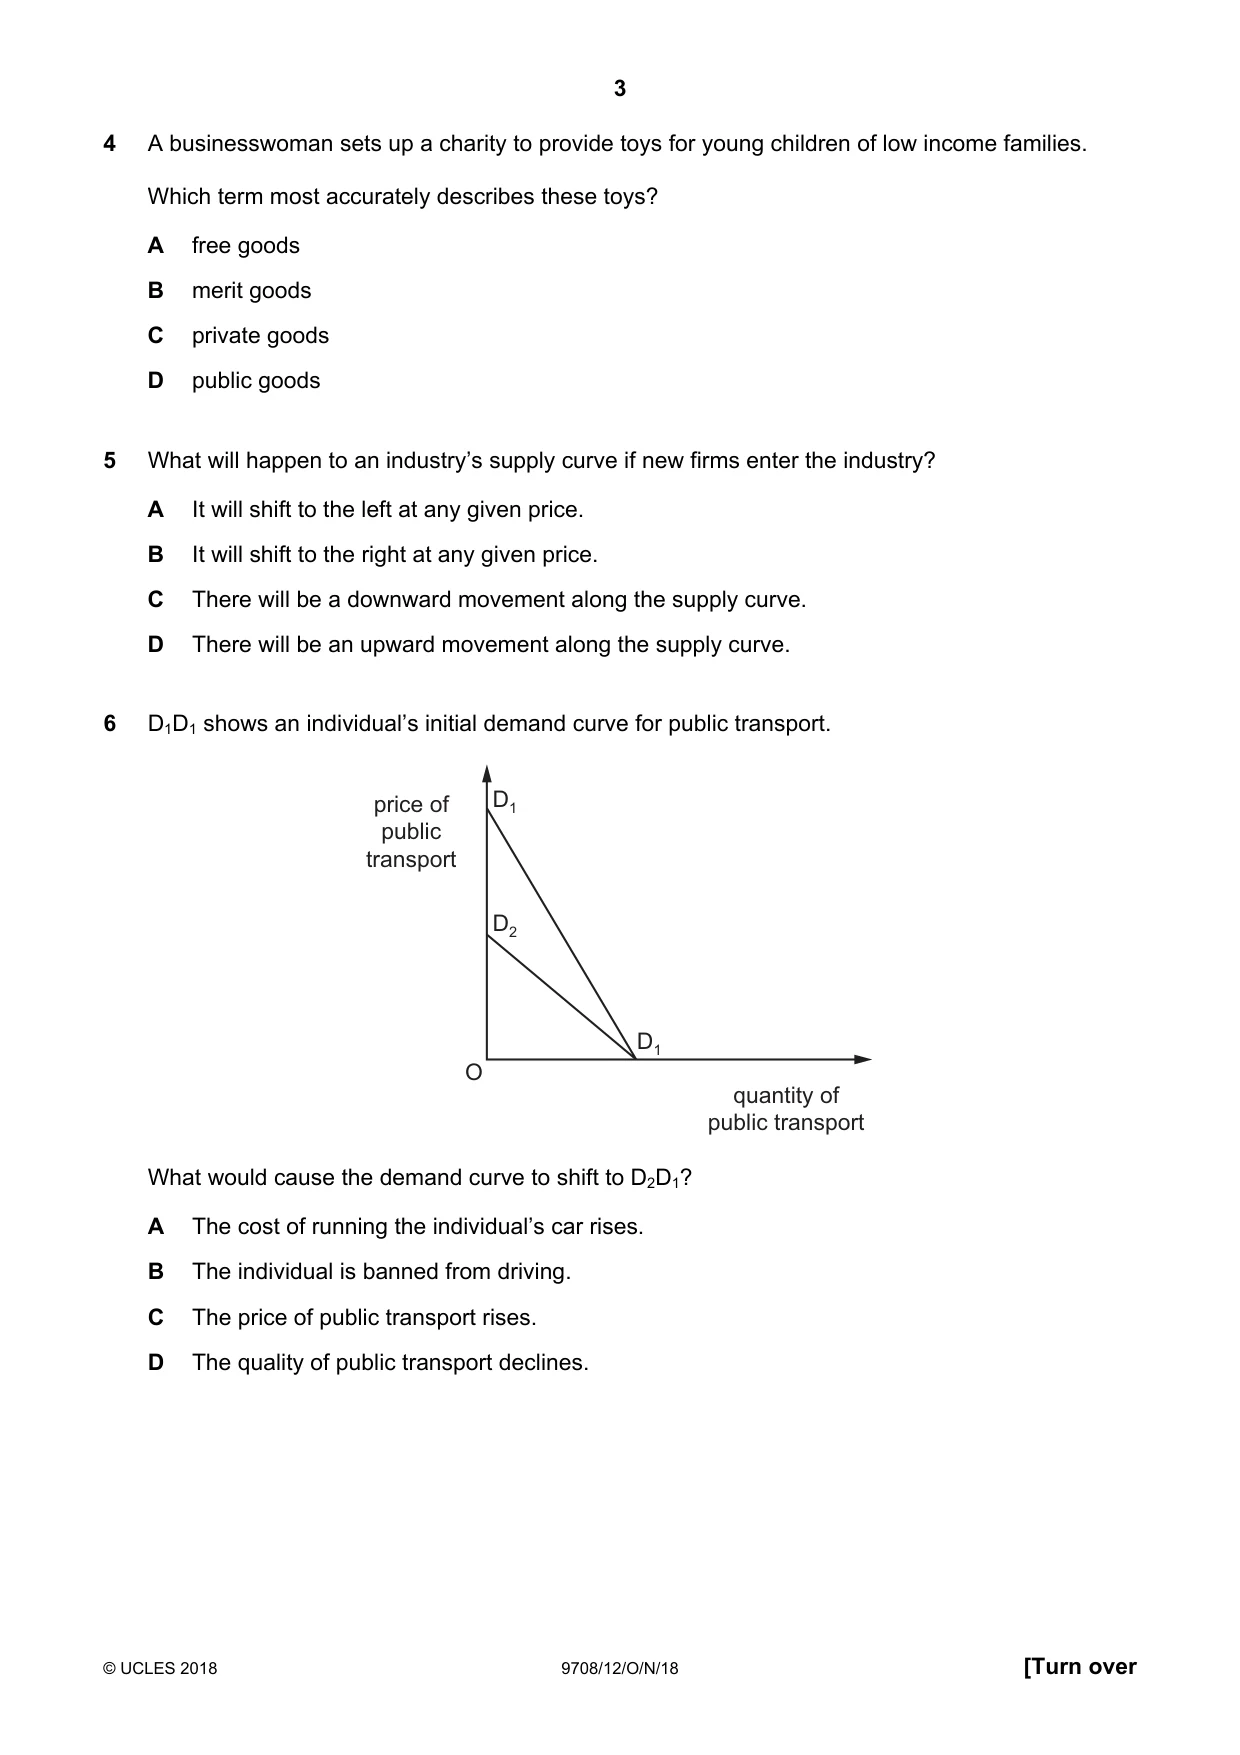
5 What will happen to an industry’s supply curve if new firms enter the industry? A It will shift to the left at any given price. B It will shift to the right at any given price. C There will be a downward movement along the supply curve. D There will be an upward movement along the supply curve.
Mark scheme: B
Q6 · D1D1 shows an individual’s initial demand curve for public transport
6 D1D1 shows an individual’s initial demand curve for public transport. price of D1 public transport D2 D1 O quantity of public transport What would cause the demand curve to shift to D2D1? A The cost of running the individual’s car rises. B The individual is banned from driving. C The price of public transport rises. D The quality of public transport declines.
Mark scheme: D
Q7 · Two goods X and Y have a positive cross-elasticity of demand and upward-sloping supply…
7 Two goods X and Y have a positive cross-elasticity of demand and upward-sloping supply curves. What will be the effect of a reduction in the price of good Y? A The demand for good X will increase. B The demand for good Y will decrease. C The price of good X will decrease. D The quantity of good X supplied will increase.
Mark scheme: C
More questions on Price elasticity, income elasticity and cross elasticity of demand
Q8 · Which statement best describes the meaning of price elasticity of supply?
8 Which statement best describes the meaning of price elasticity of supply? A how much price changes when there has been a change in supply B how much supply changes when there is a change in demand C how much supply changes when there is a change in price D how much supply changes when there is a change in the price of a substitute
Mark scheme: C
Q9 · The table shows changes in a consumer’s expenditure on various goods when her income…
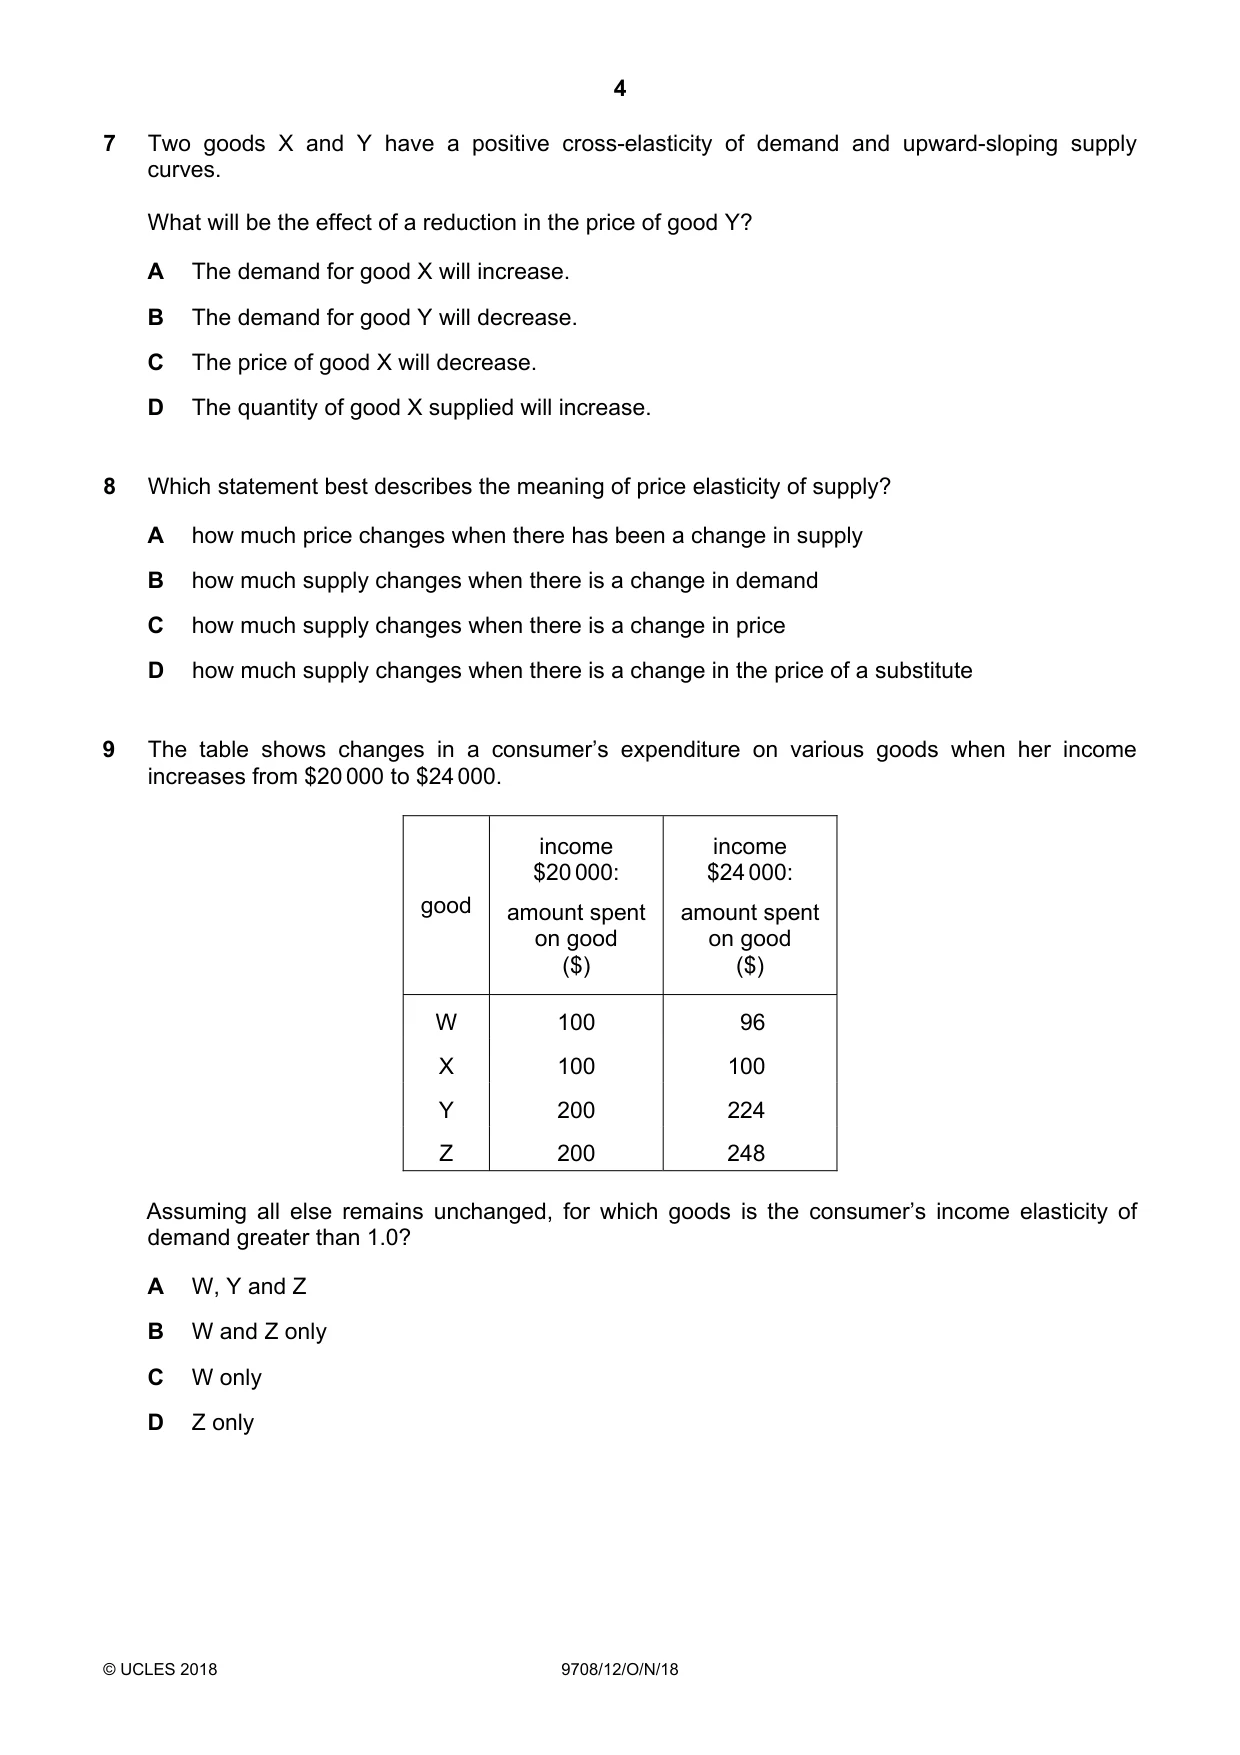
9 The table shows changes in a consumer’s expenditure on various goods when her income increases from $20 000 to $24 000. income income $20 000: $24 000: good amount spent amount spent on good on good ($) ($) W 100 96 X 100 100 Y 200 224 Z 200 248 Assuming all else remains unchanged, for which goods is the consumer’s income elasticity of demand greater than 1.0? A W, Y and Z B W and Z only C W only D Z only
Mark scheme: D
More questions on Price elasticity, income elasticity and cross elasticity of demand
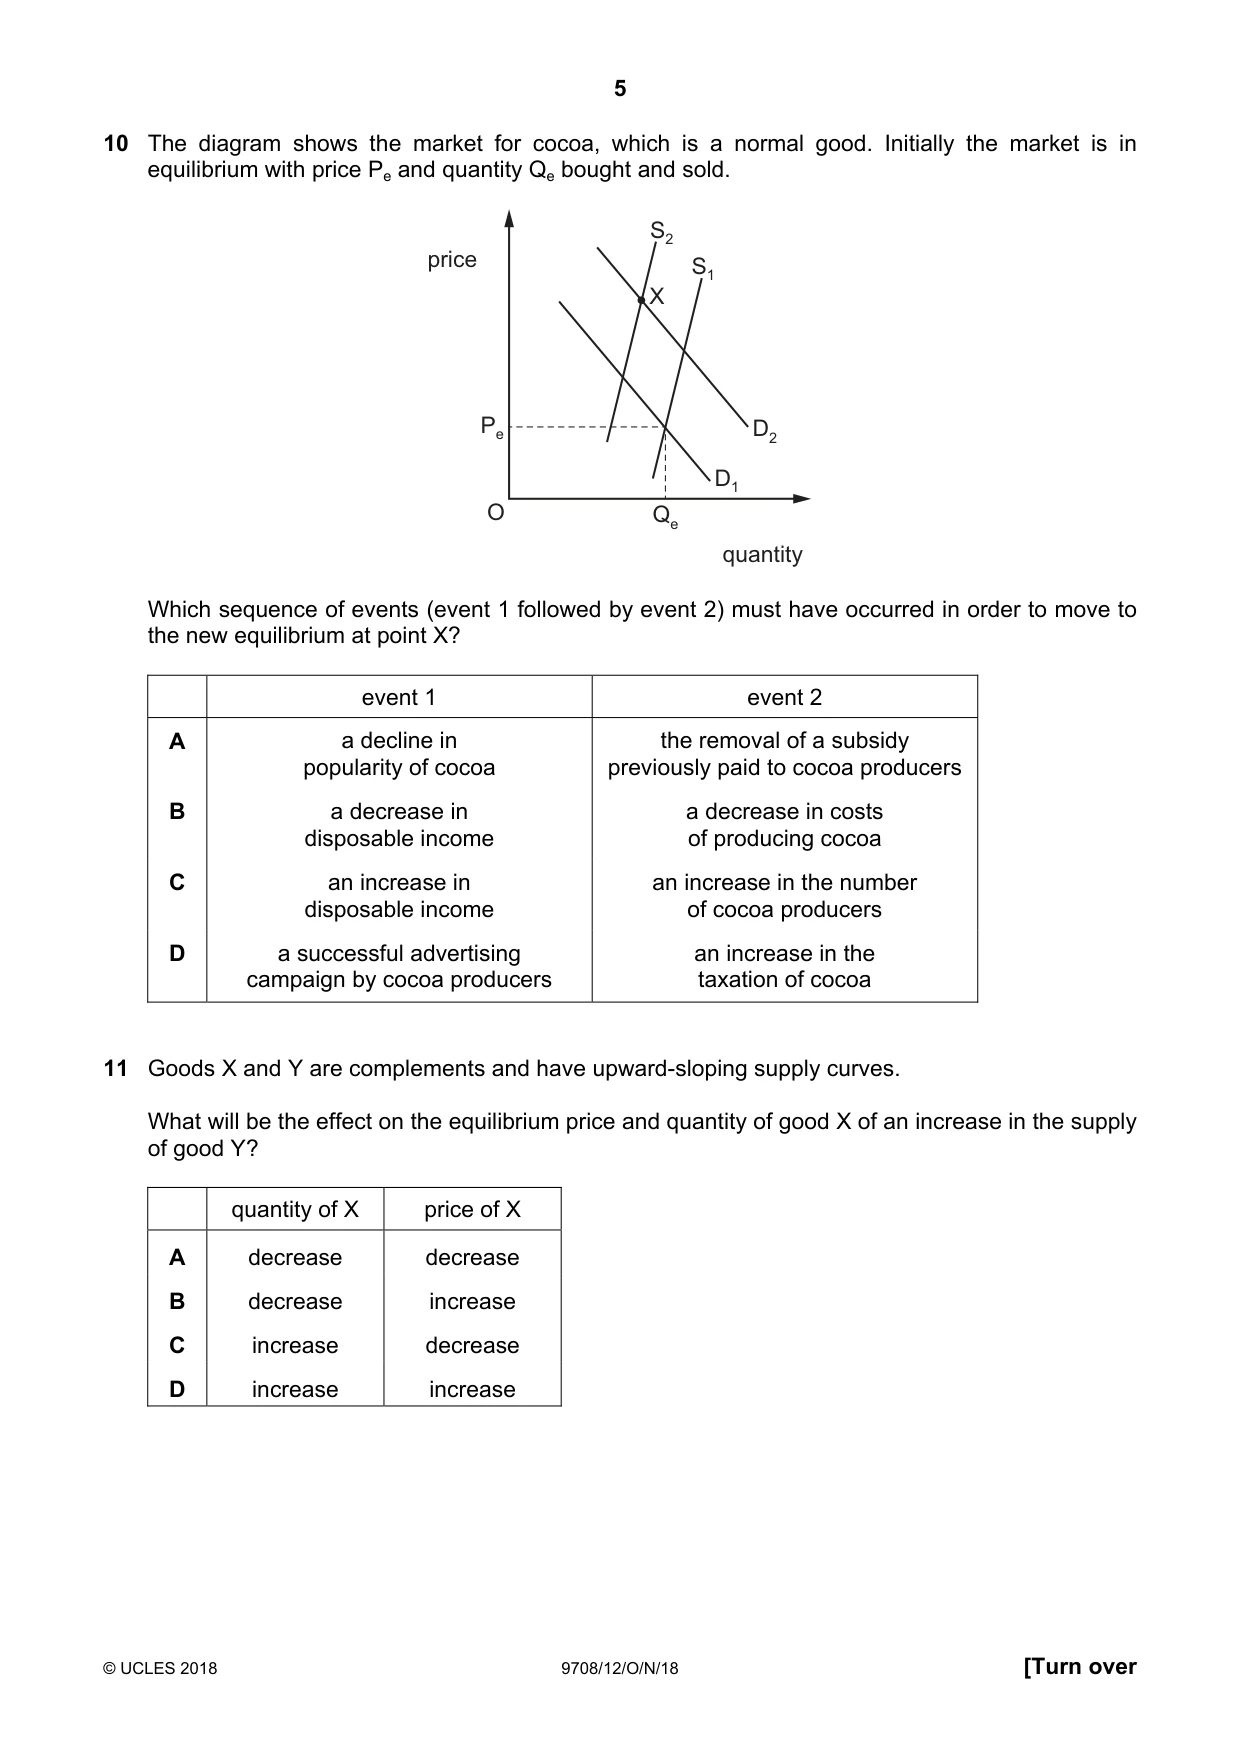
Q10 · The diagram shows the market for cocoa, which is a normal good
10 The diagram shows the market for cocoa, which is a normal good. Initially the market is in equilibrium with price Pe and quantity Qe bought and sold. S2 price S1 X Pe D2 D1 O Qe quantity Which sequence of events (event 1 followed by event 2) must have occurred in order to move to the new equilibrium at point X? event 1 event 2 A a decline in the removal of a subsidy popularity of cocoa previously paid to cocoa producers B a decrease in a decrease in costs disposable income of producing cocoa C an increase in an increase in the number disposable income of cocoa producers D a successful advertising an increase in the campaign by cocoa producers taxation of cocoa
Mark scheme: D
Q11 · Goods X and Y are complements and have upward-sloping supply curves
11 Goods X and Y are complements and have upward-sloping supply curves. What will be the effect on the equilibrium price and quantity of good X of an increase in the supply of good Y? quantity of X price of X A decrease decrease B decrease increase C increase decrease D increase increase
Mark scheme: D
Q12 · What is generally considered to be one of the advantages of using the price mechanism as…
12 What is generally considered to be one of the advantages of using the price mechanism as a rationing device? A It ensures that goods are allocated in accordance with the wants of consumers. B It ensures that suppliers cannot make excessive profits. C No one can be prevented from consuming a good if they are willing and able to pay the market price. D The allocation of goods is determined by consumers’ wealth.
Mark scheme: C
More questions on Resource allocation in different economic systems
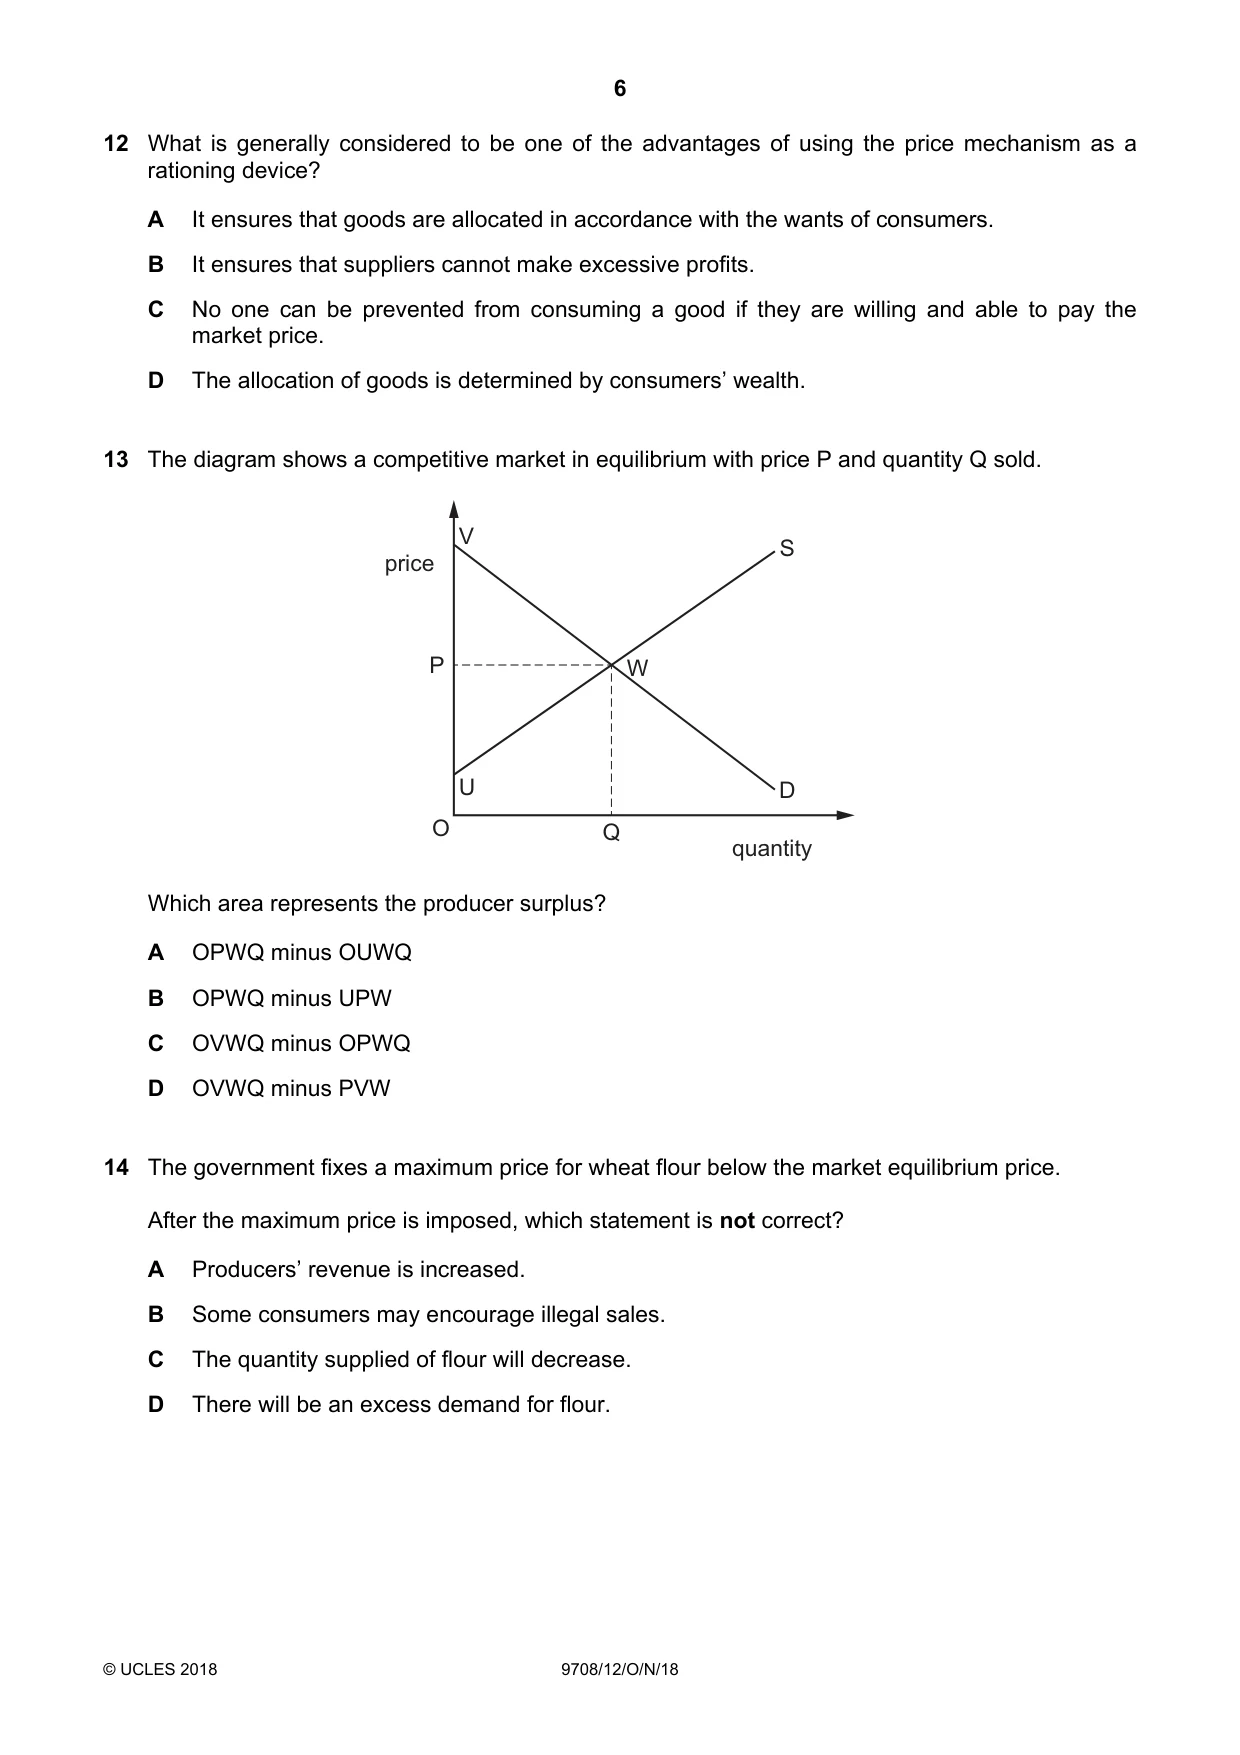
Q13 · The diagram shows a competitive market in equilibrium with price P and quantity Q sold
13 The diagram shows a competitive market in equilibrium with price P and quantity Q sold. V S price P W U D O Q quantity Which area represents the producer surplus? A OPWQ minus OUWQ B OPWQ minus UPW C OVWQ minus OPWQ D OVWQ minus PVW
Mark scheme: A
Q14 · The government fixes a maximum price for wheat flour below the market equilibrium price
14 The government fixes a maximum price for wheat flour below the market equilibrium price. After the maximum price is imposed, which statement is not correct? A Producers’ revenue is increased. B Some consumers may encourage illegal sales. C The quantity supplied of flour will decrease. D There will be an excess demand for flour.
Mark scheme: A
More questions on Methods and effects of government intervention in markets
Q15 · The income tax structure of a country has two elements
15 The income tax structure of a country has two elements. 1 The first $20 000 of earned income is not taxed. 2 Any income earned above $20 000 is taxed at 20%. What would be a correct description of this tax structure? A a progressive tax on incomes of more than $20 000 B a progressive tax throughout the whole income range C a proportional tax on incomes of more than $20 000 D a regressive tax throughout the whole income range
Mark scheme: A
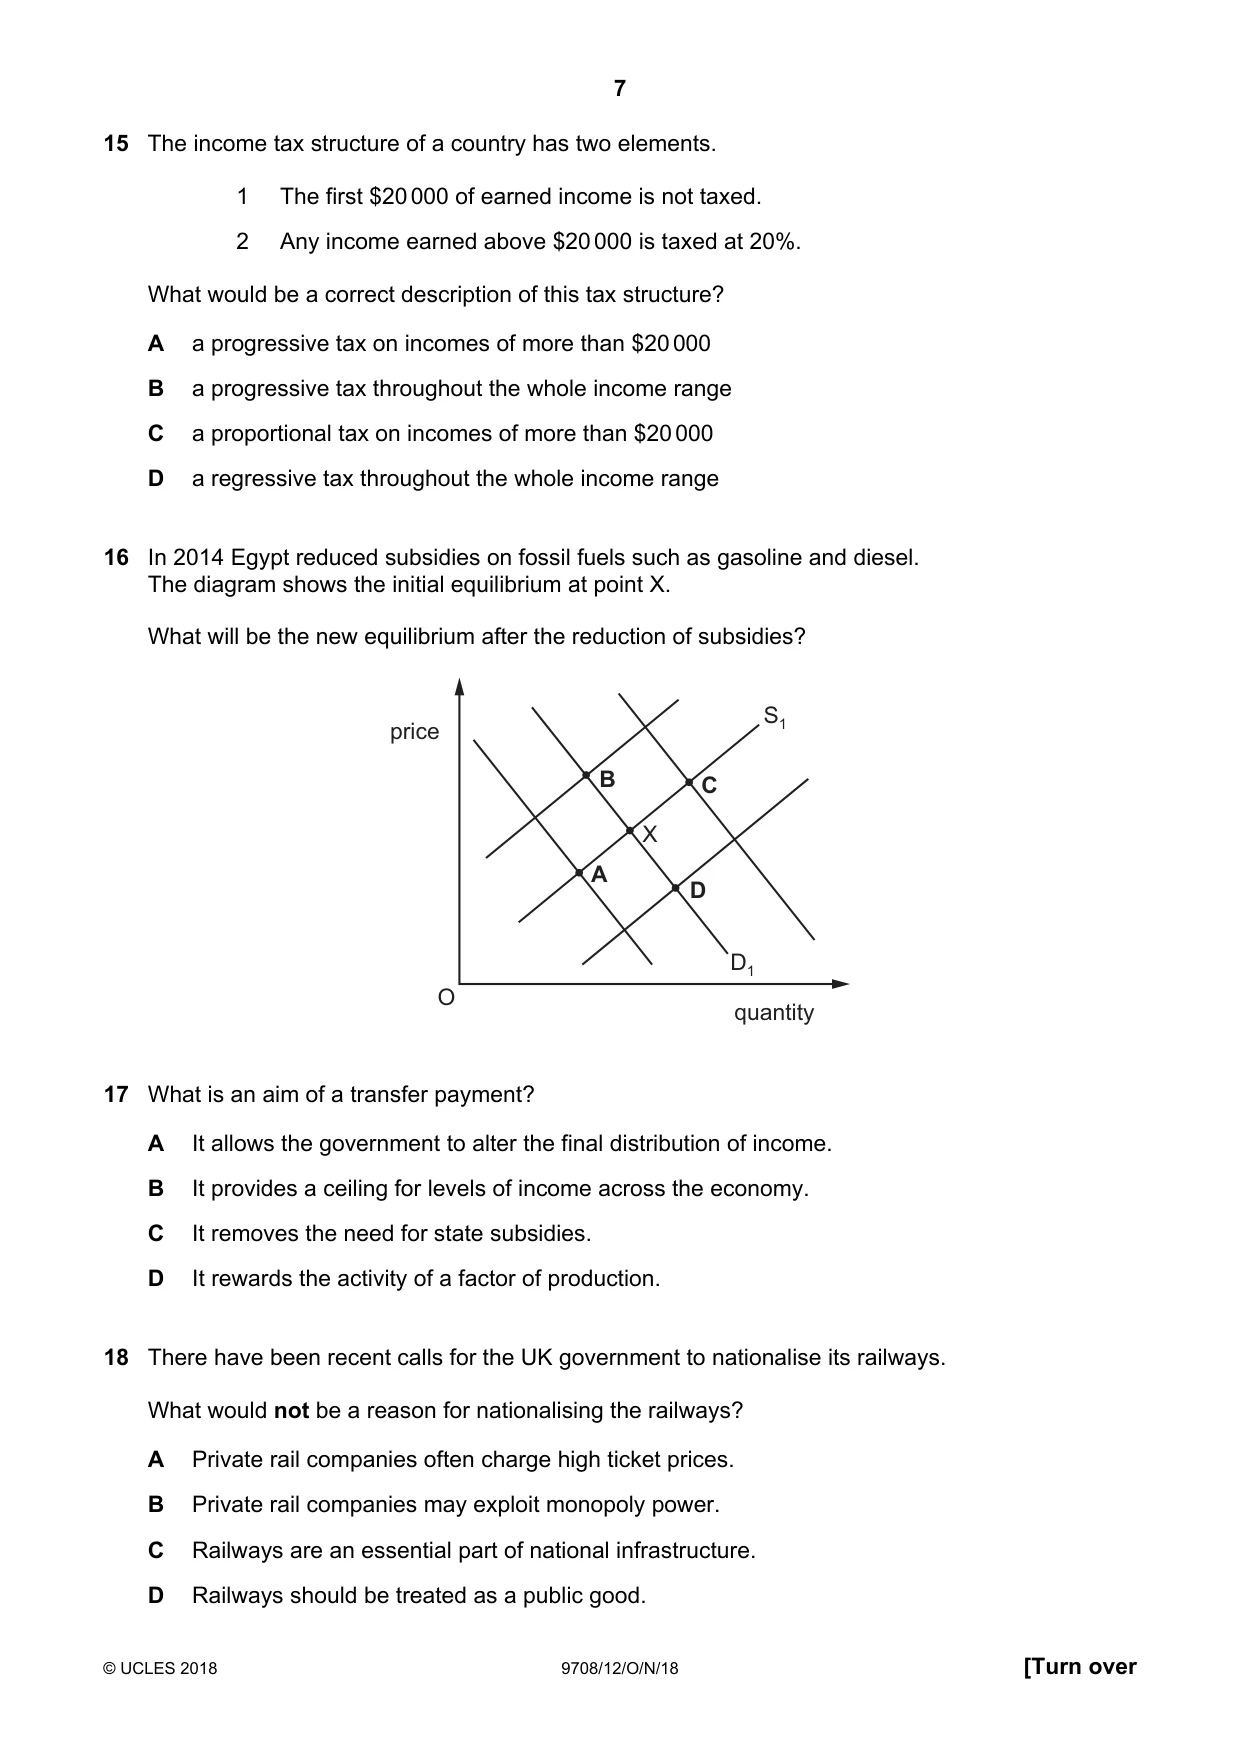
Q16 · In 2014 Egypt reduced subsidies on fossil fuels such as gasoline and diesel
16 In 2014 Egypt reduced subsidies on fossil fuels such as gasoline and diesel. The diagram shows the initial equilibrium at point X. What will be the new equilibrium after the reduction of subsidies? S1 price B C X A D D1 O quantity
Mark scheme: B
More questions on Methods and effects of government intervention in markets
Q17 · What is an aim of a transfer payment?
17 What is an aim of a transfer payment? A It allows the government to alter the final distribution of income. B It provides a ceiling for levels of income across the economy. C It removes the need for state subsidies. D It rewards the activity of a factor of production.
Mark scheme: A
Q18 · There have been recent calls for the UK government to nationalise its railways
18 There have been recent calls for the UK government to nationalise its railways. What would not be a reason for nationalising the railways? A Private rail companies often charge high ticket prices. B Private rail companies may exploit monopoly power. C Railways are an essential part of national infrastructure. D Railways should be treated as a public good.
Mark scheme: D
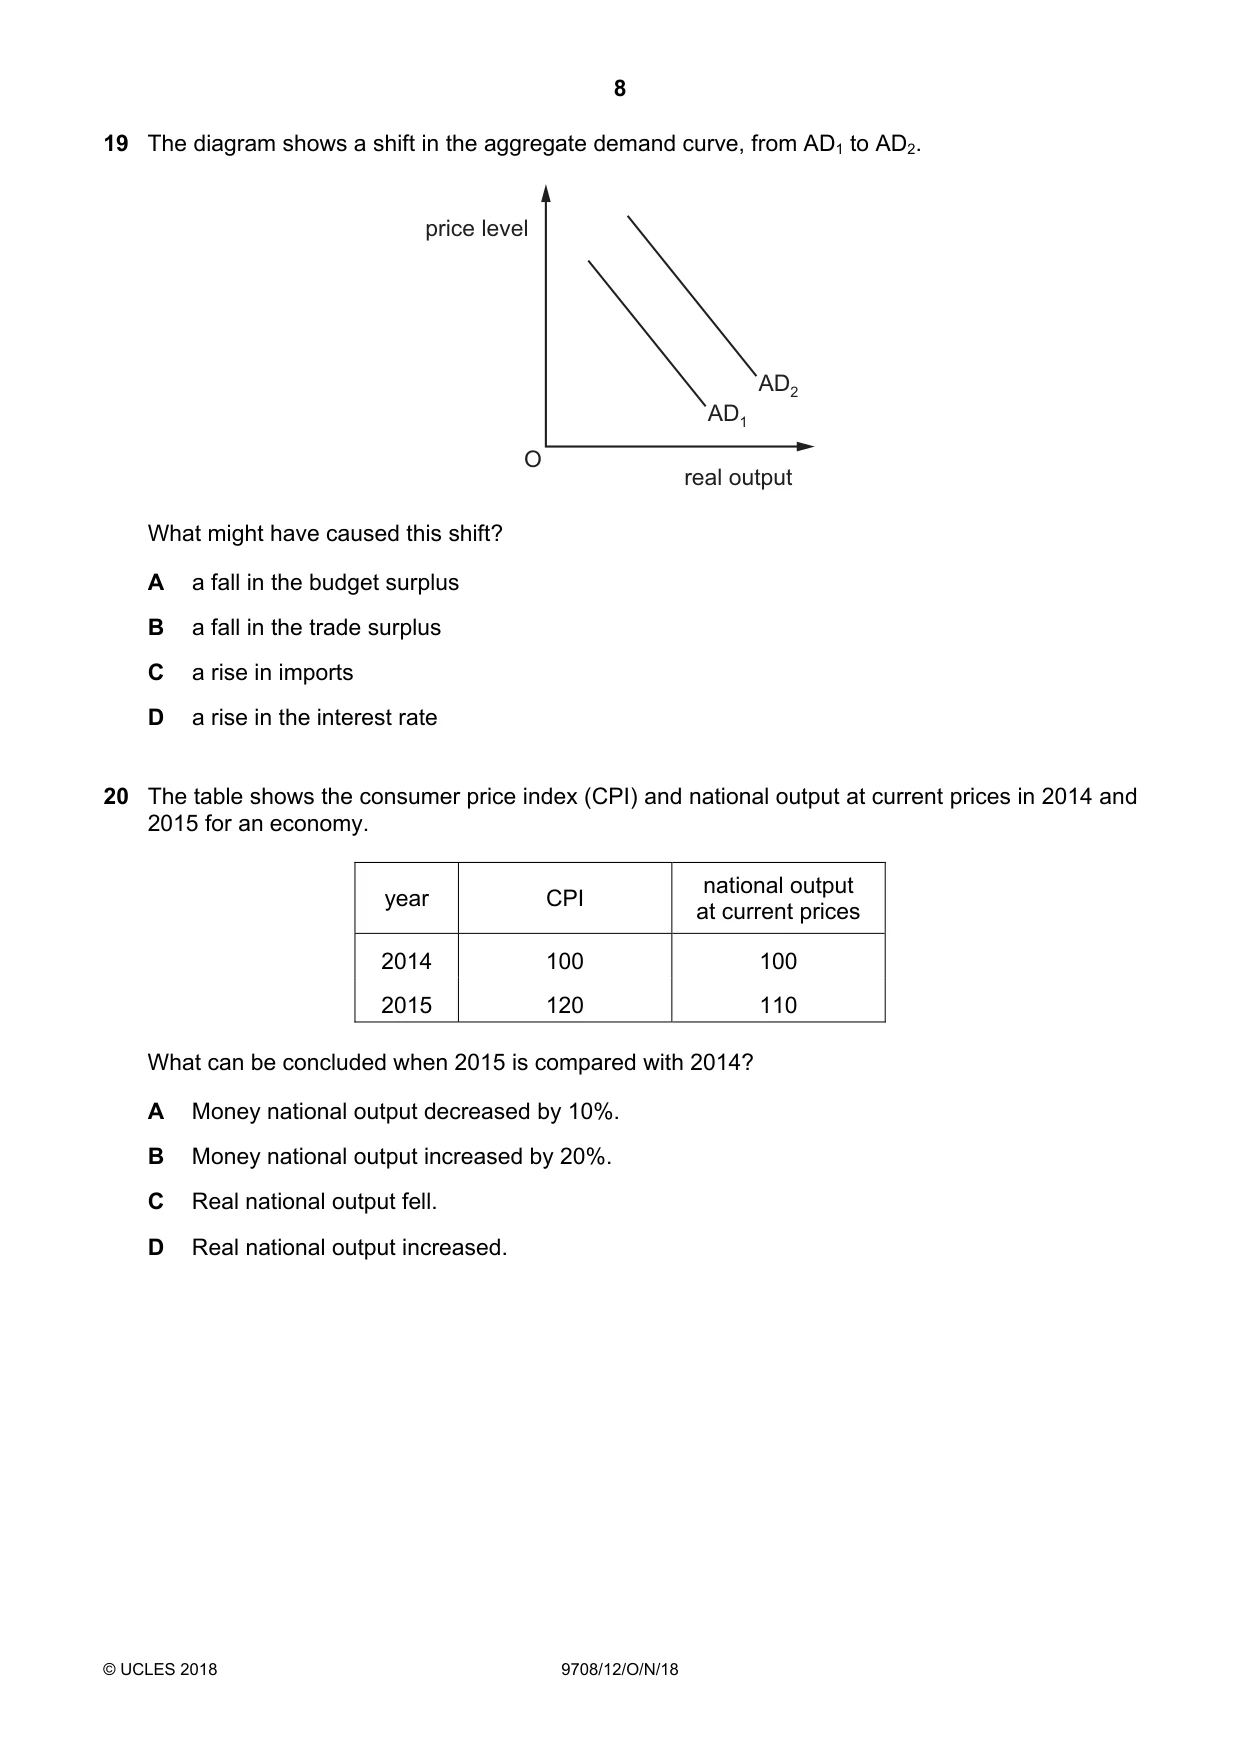
Q19 · The diagram shows a shift in the aggregate demand curve, from AD1 to AD2
19 The diagram shows a shift in the aggregate demand curve, from AD1 to AD2. price level AD2 AD1 O real output What might have caused this shift? A a fall in the budget surplus B a fall in the trade surplus C a rise in imports D a rise in the interest rate
Mark scheme: A
More questions on Aggregate Demand and Aggregate Supply analysis
Q20 · The table shows the consumer price index (CPI) and national output at current prices in…
20 The table shows the consumer price index (CPI) and national output at current prices in 2014 and 2015 for an economy. national output year CPI at current prices 2014 100 100 2015 120 110 What can be concluded when 2015 is compared with 2014? A Money national output decreased by 10%. B Money national output increased by 20%. C Real national output fell. D Real national output increased.
Mark scheme: C
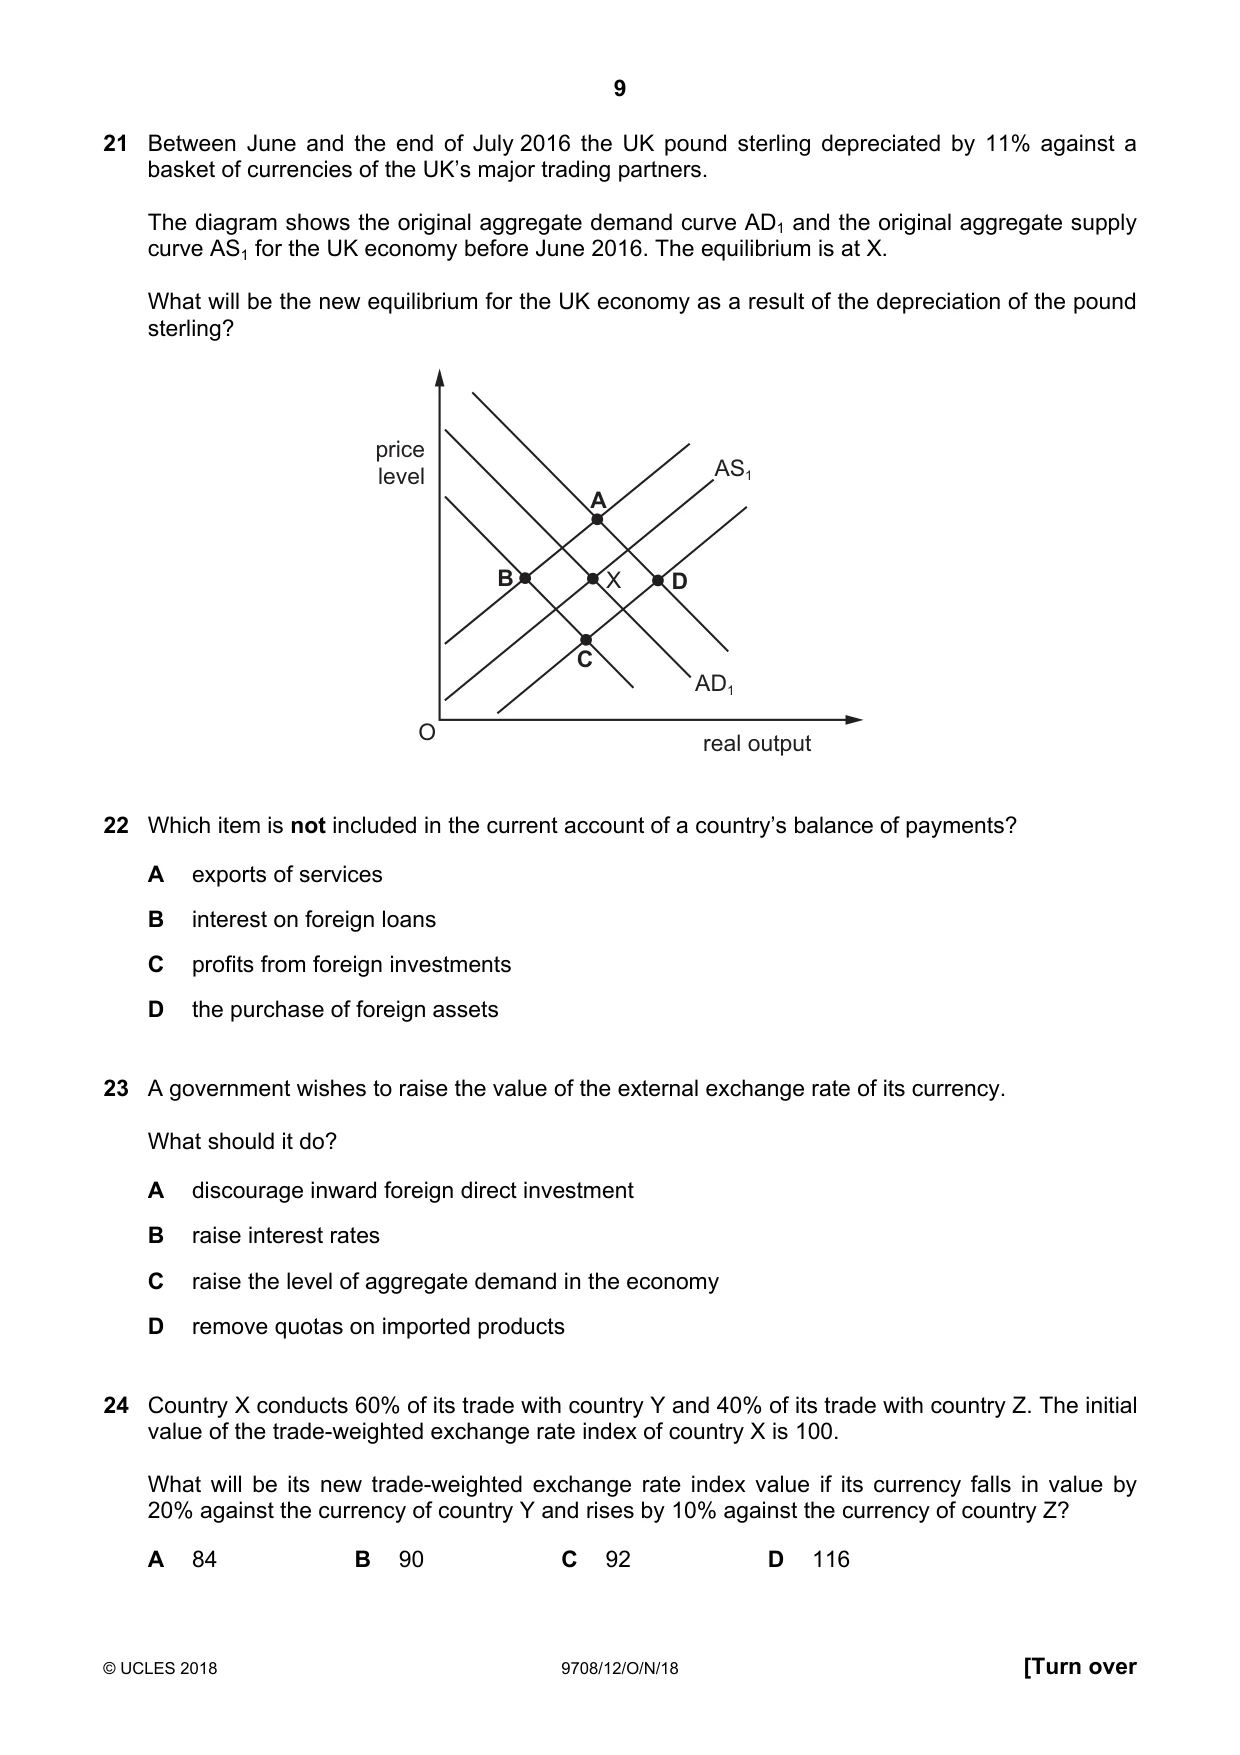
Q21 · Between June and the end of July 2016 the UK pound sterling depreciated by 11% against a…
21 Between June and the end of July 2016 the UK pound sterling depreciated by 11% against a basket of currencies of the UK’s major trading partners. The diagram shows the original aggregate demand curve AD1 and the original aggregate supply curve AS1 for the UK economy before June 2016. The equilibrium is at X. What will be the new equilibrium for the UK economy as a result of the depreciation of the pound sterling? price level AS1 A B X D C AD1 O real output
Mark scheme: A
More questions on Aggregate Demand and Aggregate Supply analysis
Q22 · Which item is not included in the current account of a country’s balance of payments?
22 Which item is not included in the current account of a country’s balance of payments? A exports of services B interest on foreign loans C profits from foreign investments D the purchase of foreign assets
Mark scheme: D
More questions on Current account of the balance of payments
Q23 · A government wishes to raise the value of the external exchange rate of its currency
23 A government wishes to raise the value of the external exchange rate of its currency. What should it do? A discourage inward foreign direct investment B raise interest rates C raise the level of aggregate demand in the economy D remove quotas on imported products
Mark scheme: B
Q24 · Country X conducts 60% of its trade with country Y and 40% of its trade with country Z
24 Country X conducts 60% of its trade with country Y and 40% of its trade with country Z. The initial value of the trade-weighted exchange rate index of country X is 100. What will be its new trade-weighted exchange rate index value if its currency falls in value by 20% against the currency of country Y and rises by 10% against the currency of country Z? A 84 B 90 C 92 D 116
Mark scheme: C
Q25 · The index for a country’s terms of trade changed from 100 in year 2015, to 104 in year…
25 The index for a country’s terms of trade changed from 100 in year 2015, to 104 in year 2016. What could have caused this change? A a fall in export prices with import prices unchanged B a fall in revenue from the export of services C an appreciation of the country’s currency D a rise in the value of imports
Mark scheme: C
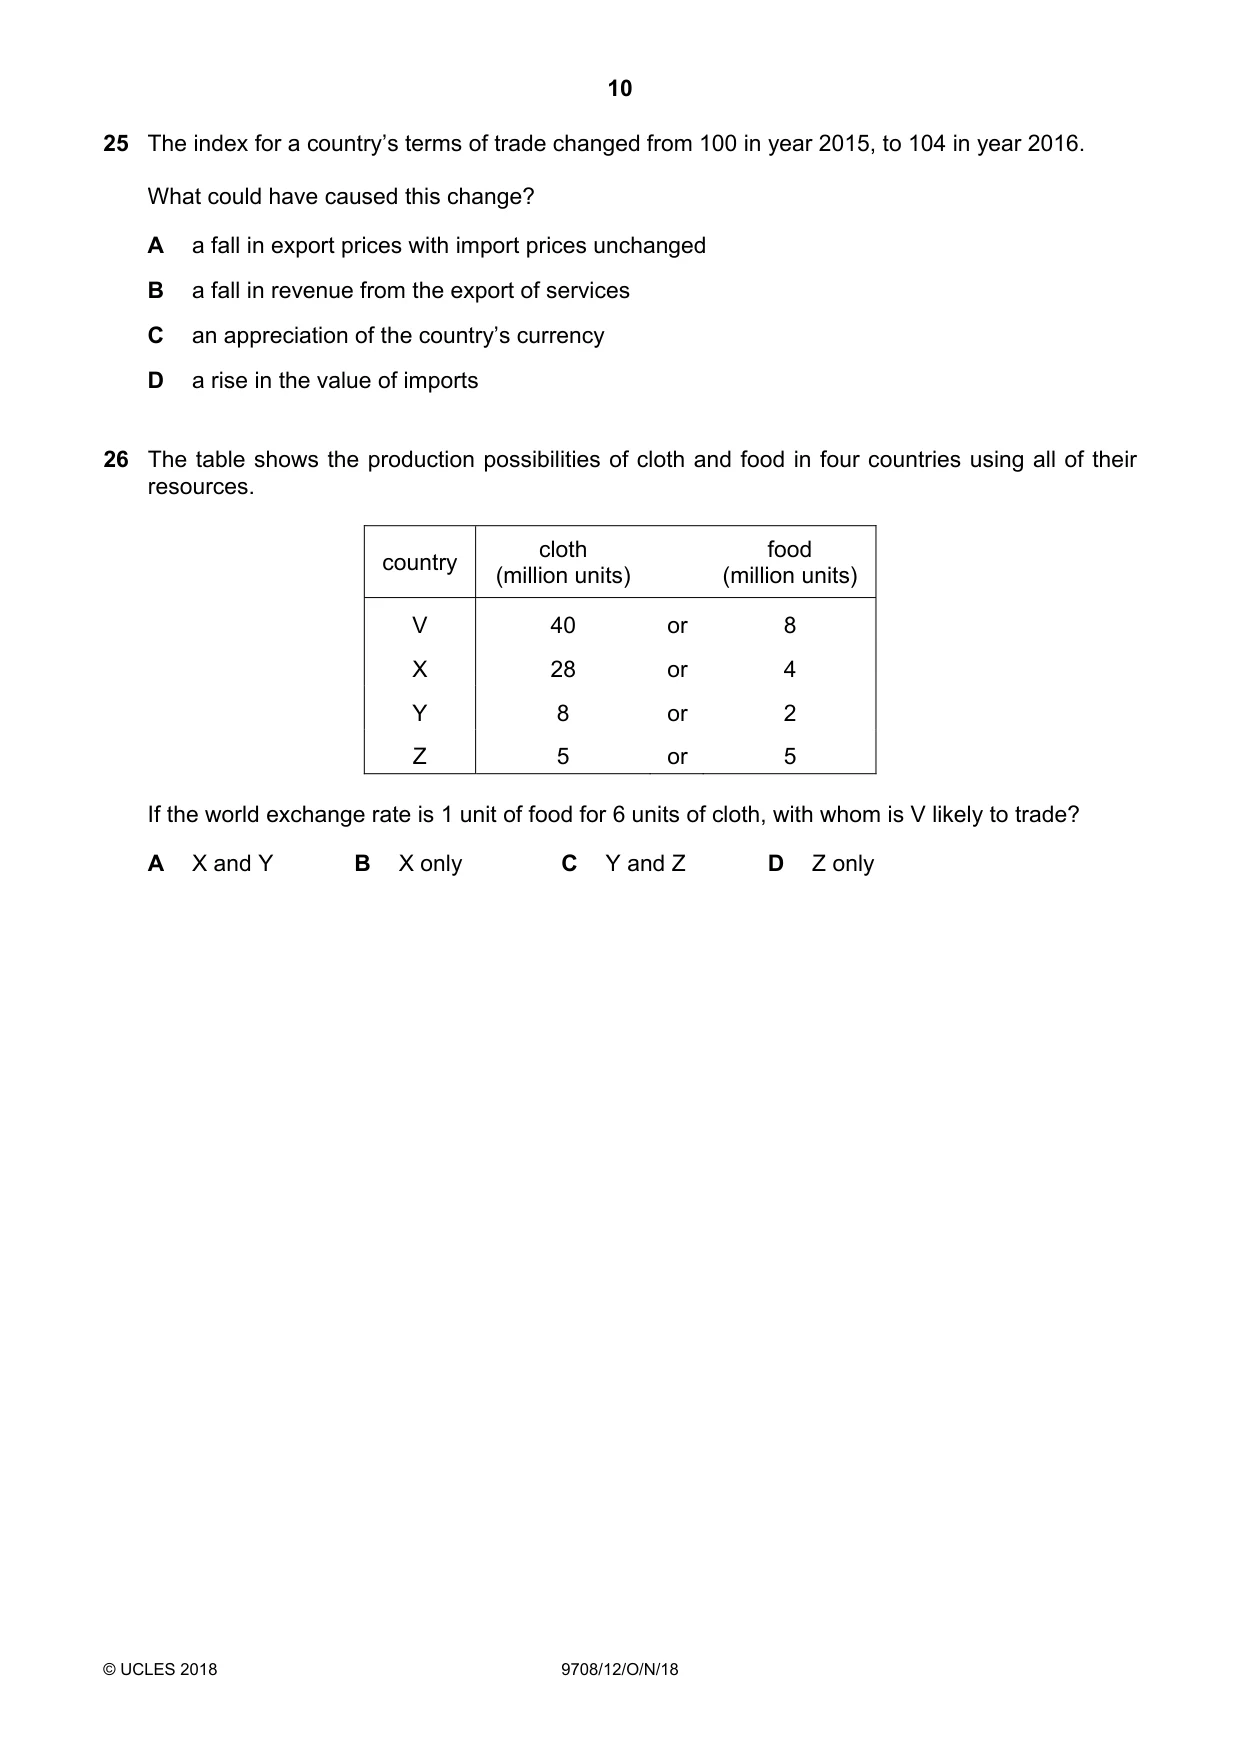
Q26 · The table shows the production possibilities of cloth and food in four countries using…
26 The table shows the production possibilities of cloth and food in four countries using all of their resources. cloth food country (million units) (million units) V 40 or 8 X 28 or 4 Y 8 or 2 Z 5 or 5 If the world exchange rate is 1 unit of food for 6 units of cloth, with whom is V likely to trade? A X and Y B X only C Y and Z D Z only
Mark scheme: B
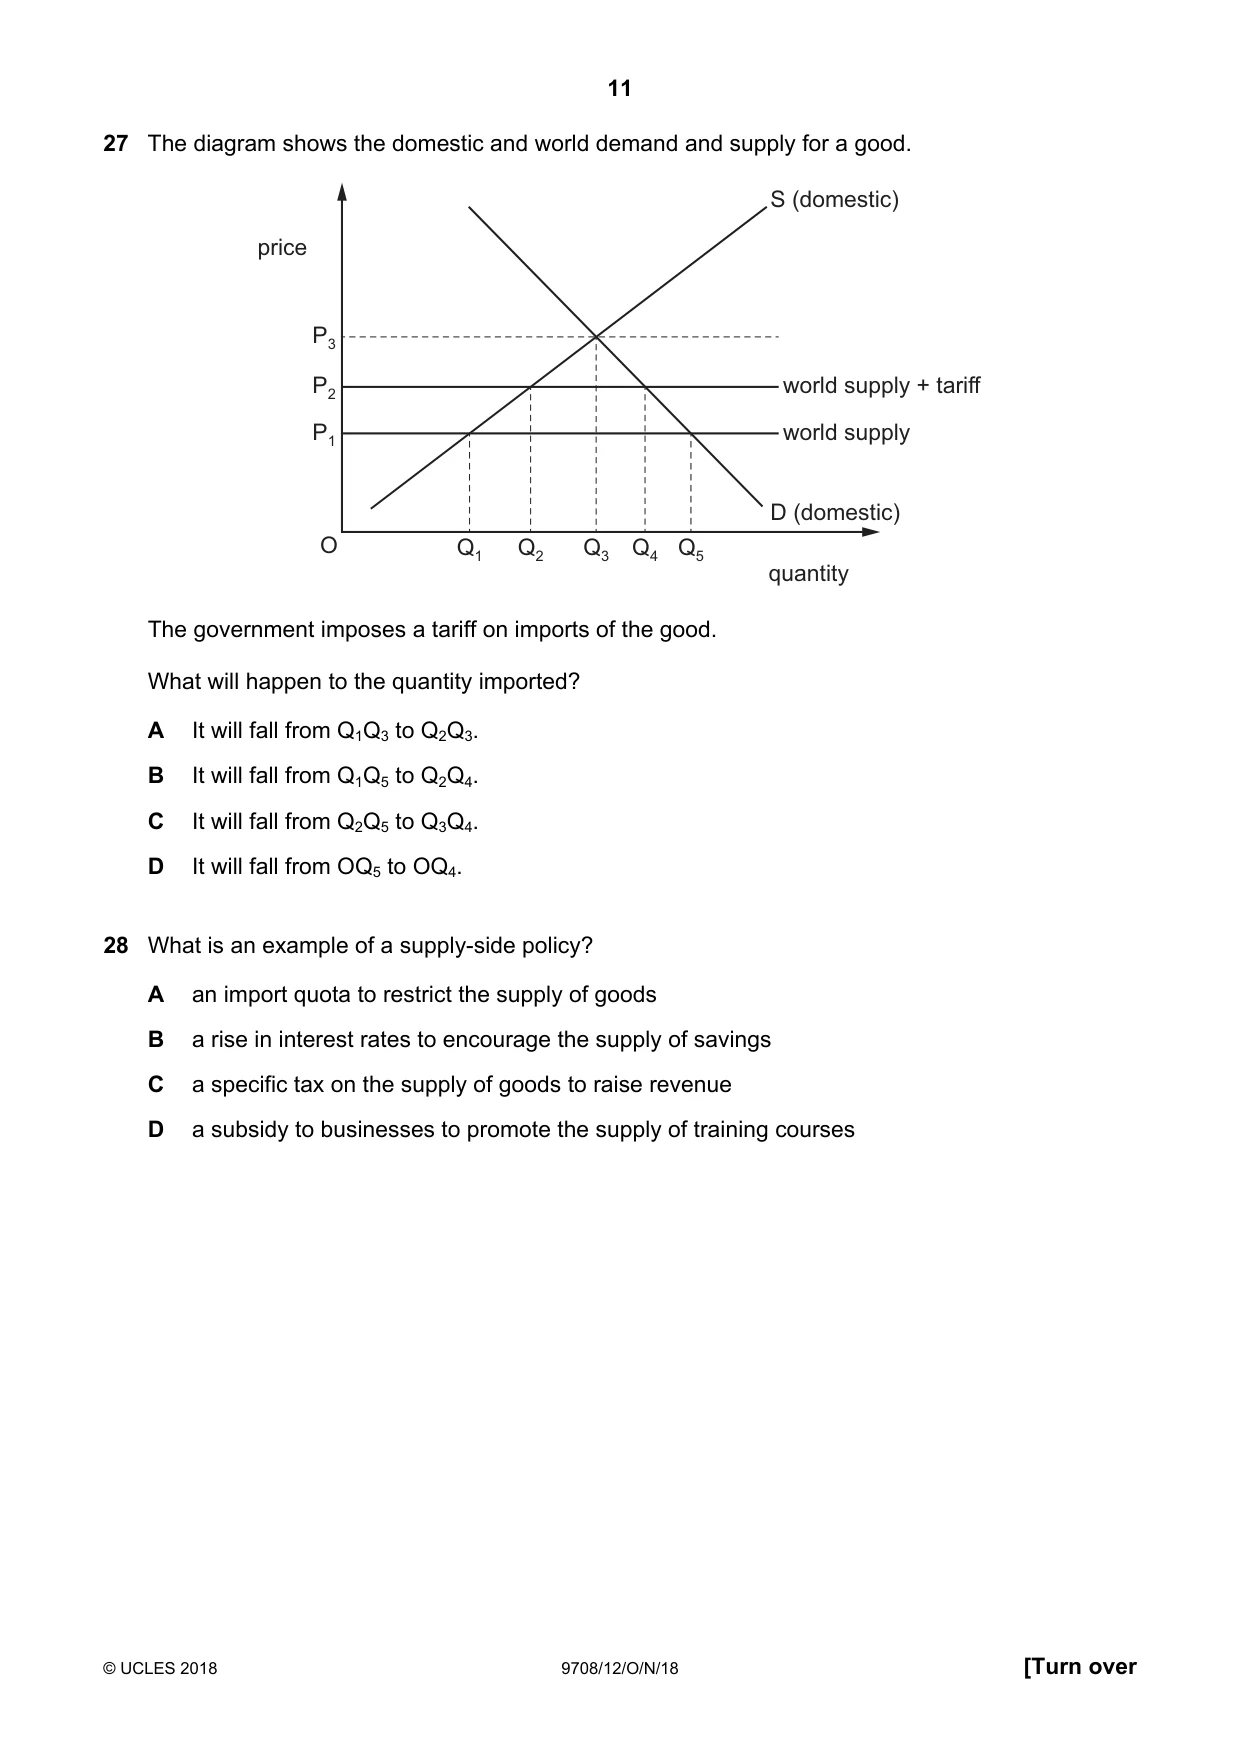
Q27 · The diagram shows the domestic and world demand and supply for a good
27 The diagram shows the domestic and world demand and supply for a good. S (domestic) price P3 P2 world supply + tariff P1 world supply D (domestic) O Q1 Q2 Q3 Q4 Q5 quantity The government imposes a tariff on imports of the good. What will happen to the quantity imported? A It will fall from Q1Q3 to Q2Q3. B It will fall from Q1Q5 to Q2Q4. C It will fall from Q2Q5 to Q3Q4. D It will fall from OQ5 to OQ4.
Mark scheme: B
Q28 · What is an example of a supply-side policy?
28 What is an example of a supply-side policy? A an import quota to restrict the supply of goods B a rise in interest rates to encourage the supply of savings C a specific tax on the supply of goods to raise revenue D a subsidy to businesses to promote the supply of training courses
Mark scheme: D
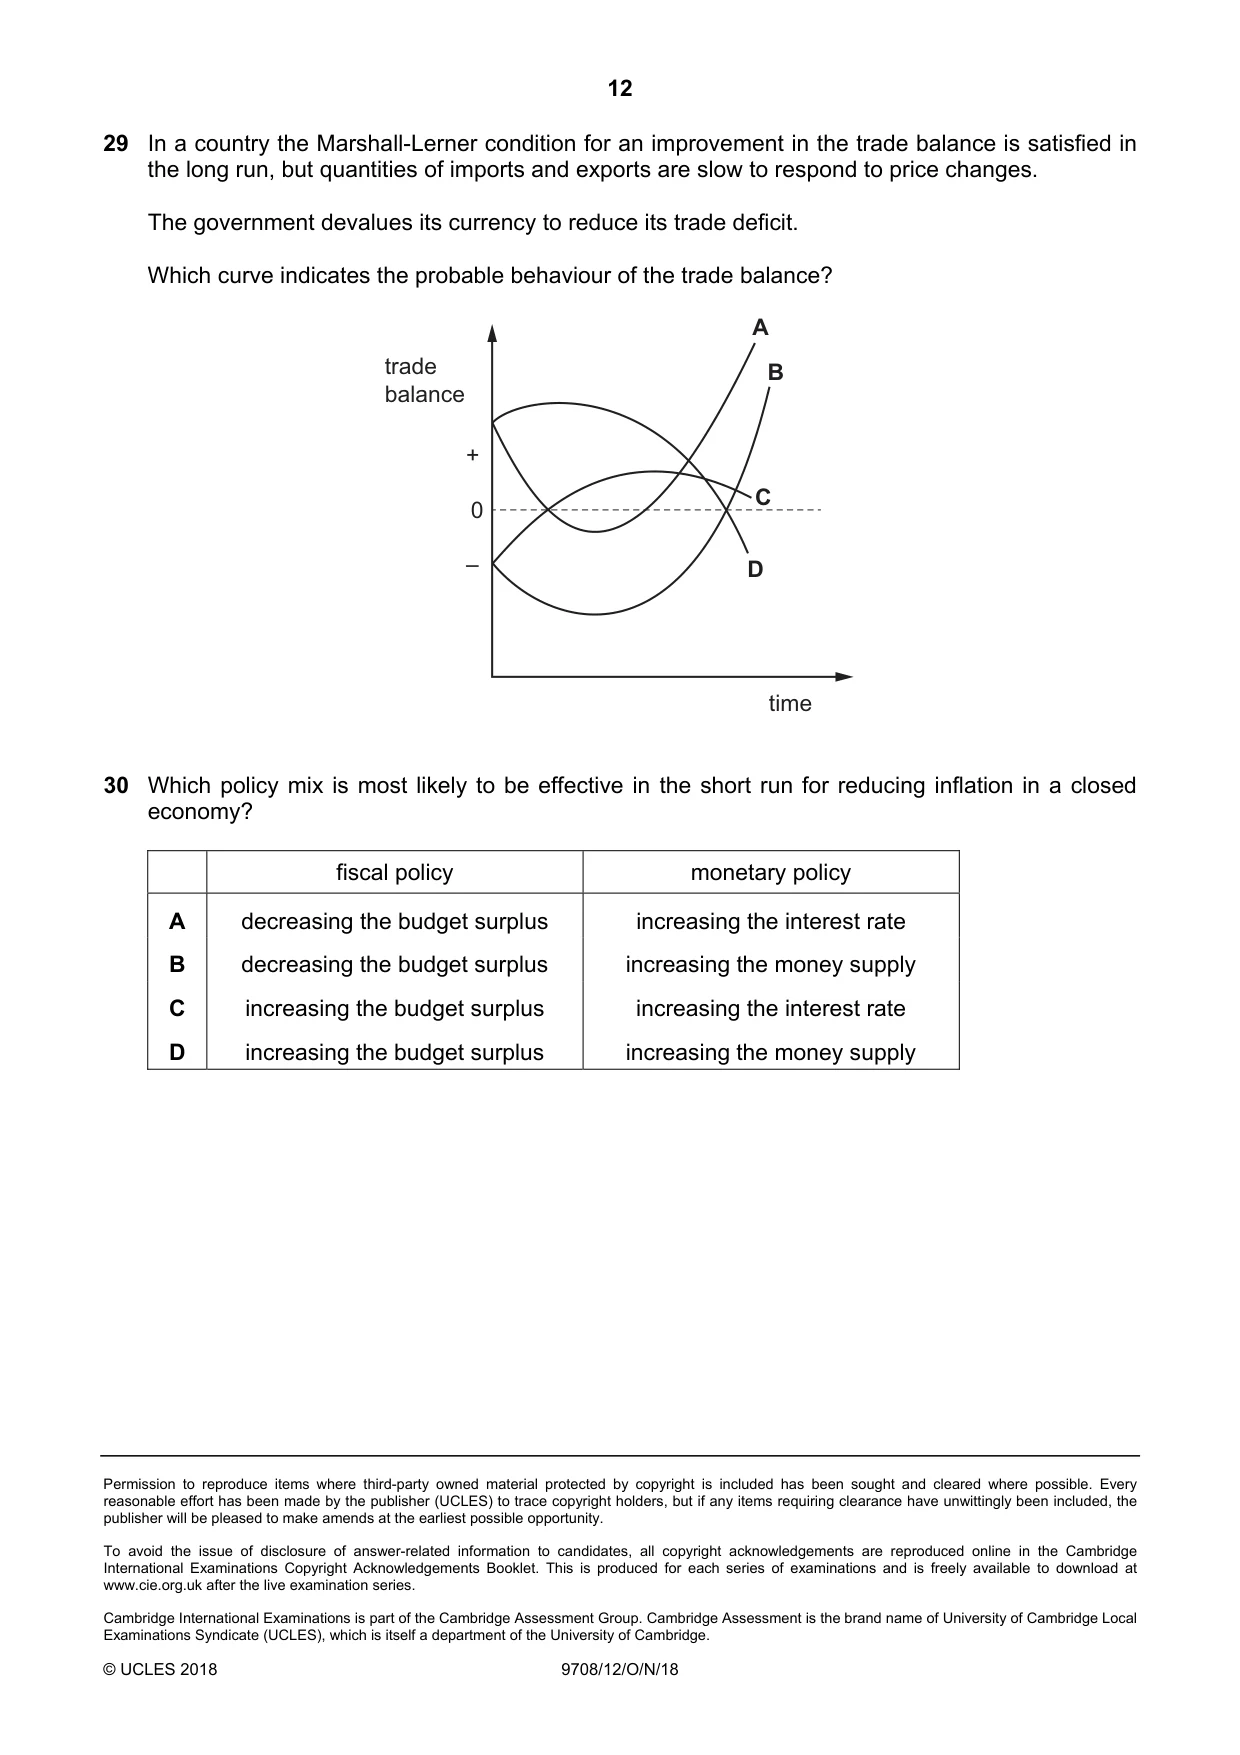
Q29 · In a country the Marshall-Lerner condition for an improvement in the trade balance is…
29 In a country the Marshall-Lerner condition for an improvement in the trade balance is satisfied in the long run, but quantities of imports and exports are slow to respond to price changes. The government devalues its currency to reduce its trade deficit. Which curve indicates the probable behaviour of the trade balance? A trade B balance + 0 C – D time
Mark scheme: B
More questions on Policies to correct imbalances in the current account of the balance of payments
Q30 · Which policy mix is most likely to be effective in the short run for reducing inflation…
30 Which policy mix is most likely to be effective in the short run for reducing inflation in a closed economy? fiscal policy monetary policy A decreasing the budget surplus increasing the interest rate B decreasing the budget surplus increasing the money supply C increasing the budget surplus increasing the interest rate D increasing the budget surplus increasing the money supply
Mark scheme: C
What was in this paper
The subtopics covered by these 30 questions, and how many questions each got. Open one in a new tab to see every Cambridge question on it.
3Addressing income and wealth inequality2Aggregate Demand and Aggregate Supply analysis2Classification of goods and services2Demand and supply curves2Methods and effects of government intervention in markets2Price elasticity, income elasticity and cross elasticity of demand2Resource allocation in different economic systems2The interaction of demand and supply2Consumer and producer surplus1Current account of the balance of payments1Economic methodology1Fiscal policy1National income statistics1Policies to correct imbalances in the current account of the balance of payments1Price elasticity of supply1Production possibility curves1Protectionism1Supply-side policy1The reasons for international trade1What you needed in this session
Cambridge’s own grade thresholds for 2018 Oct/Nov, Paper 1 · Variant 2. A higher threshold means an easier paper — the bar moves with how the cohort did.