Cambridge A Level Economics 9708 — 2012 Oct/Nov Paper 1 · Variant 1
9708/11/O/N/12 · 30 questions · 30 marks · ≈34 min
The question paper and its mark scheme, free to read here and free to download. This is Cambridge’s own paper, exactly as it was sat.
Question paper12 pages
Mark scheme2 pages
Answers below. Sit the paper first if you are practising.
Questions as text
Q1 · Which type of firm is able to exploit division of labour to the greatest extent?
1 Which type of firm is able to exploit division of labour to the greatest extent? A a bakery employing two workers making a range of bread and cakes B a motorcycle assembler employing two hundred workers making a standardised model C a tailor employing ten workers making men’s suits to order D a well established furniture maker employing three hundred workers making high quality individual items
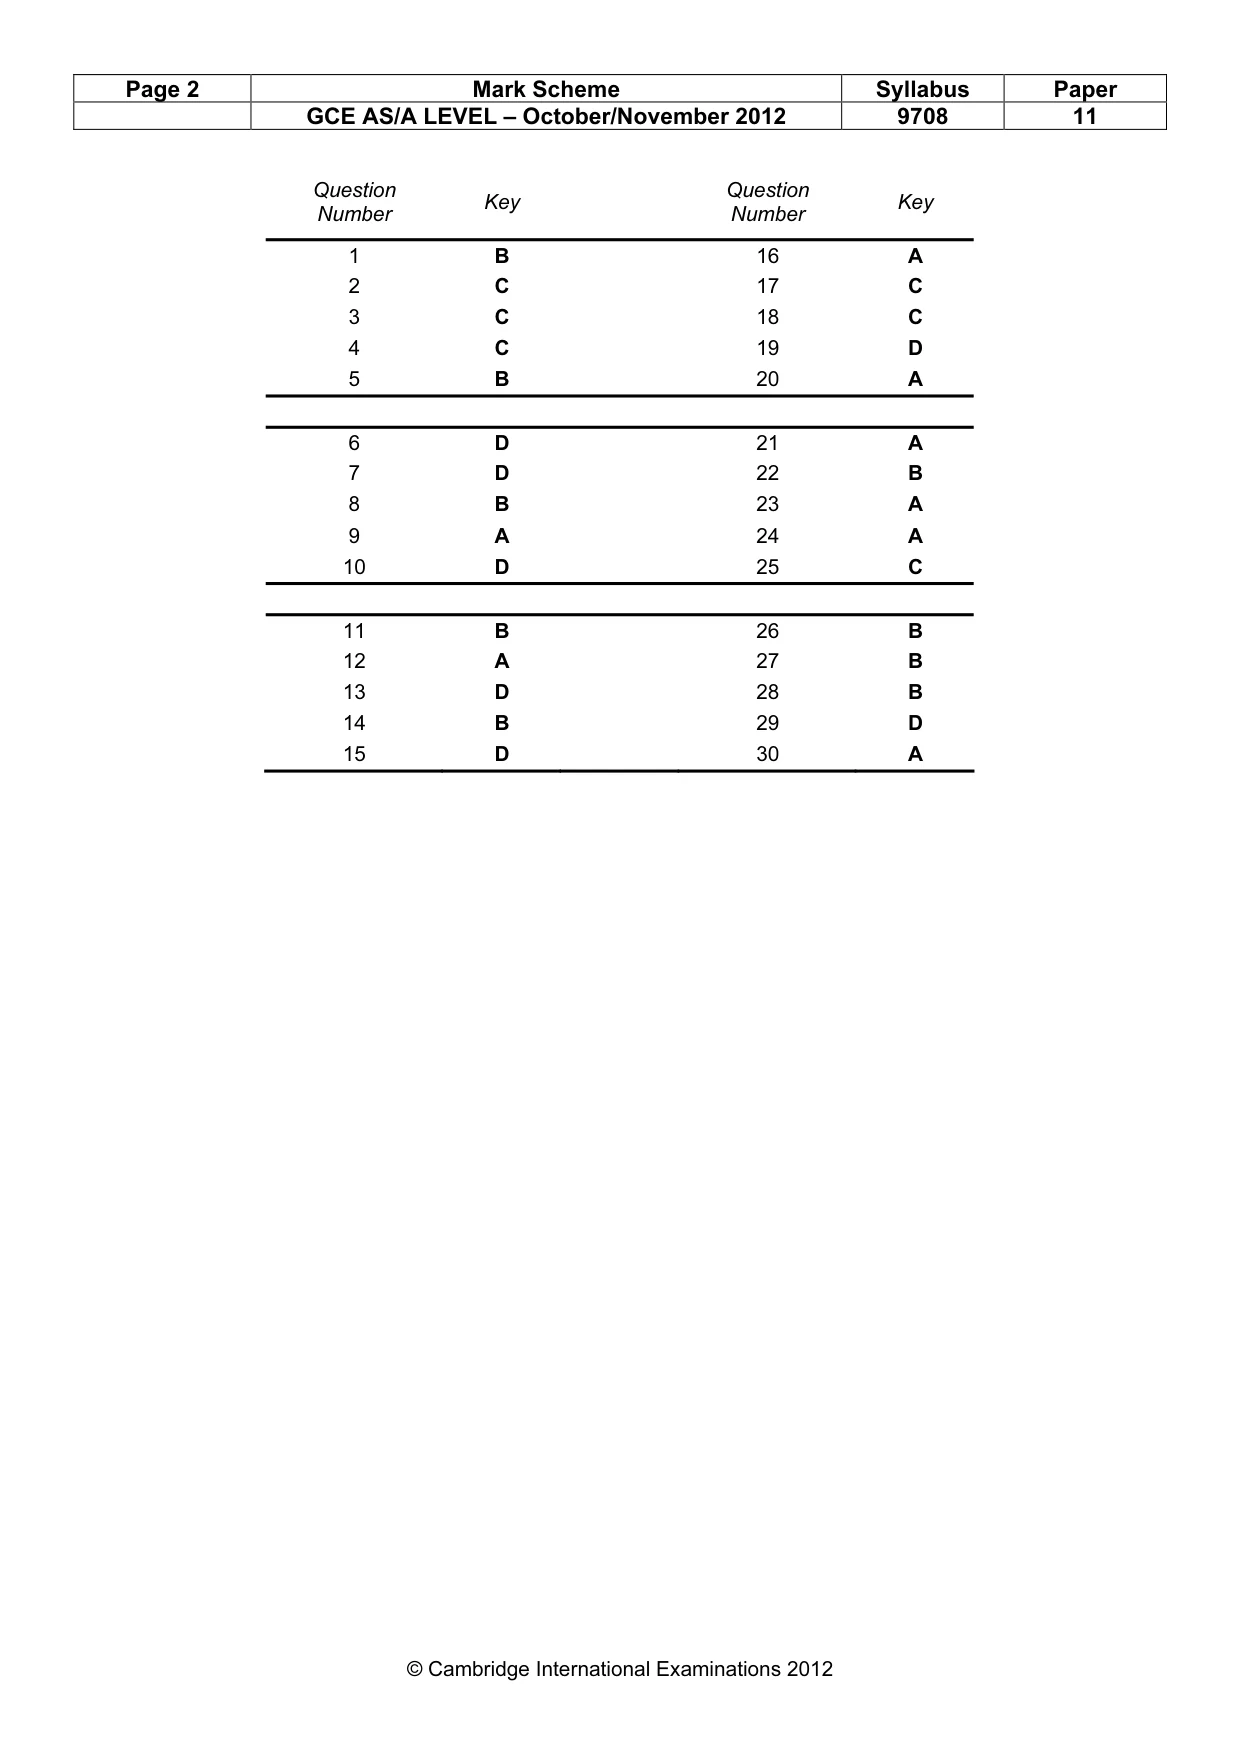
Mark scheme: B
Q2 · The diagram shows the production possibility frontier of a desert island economy where…
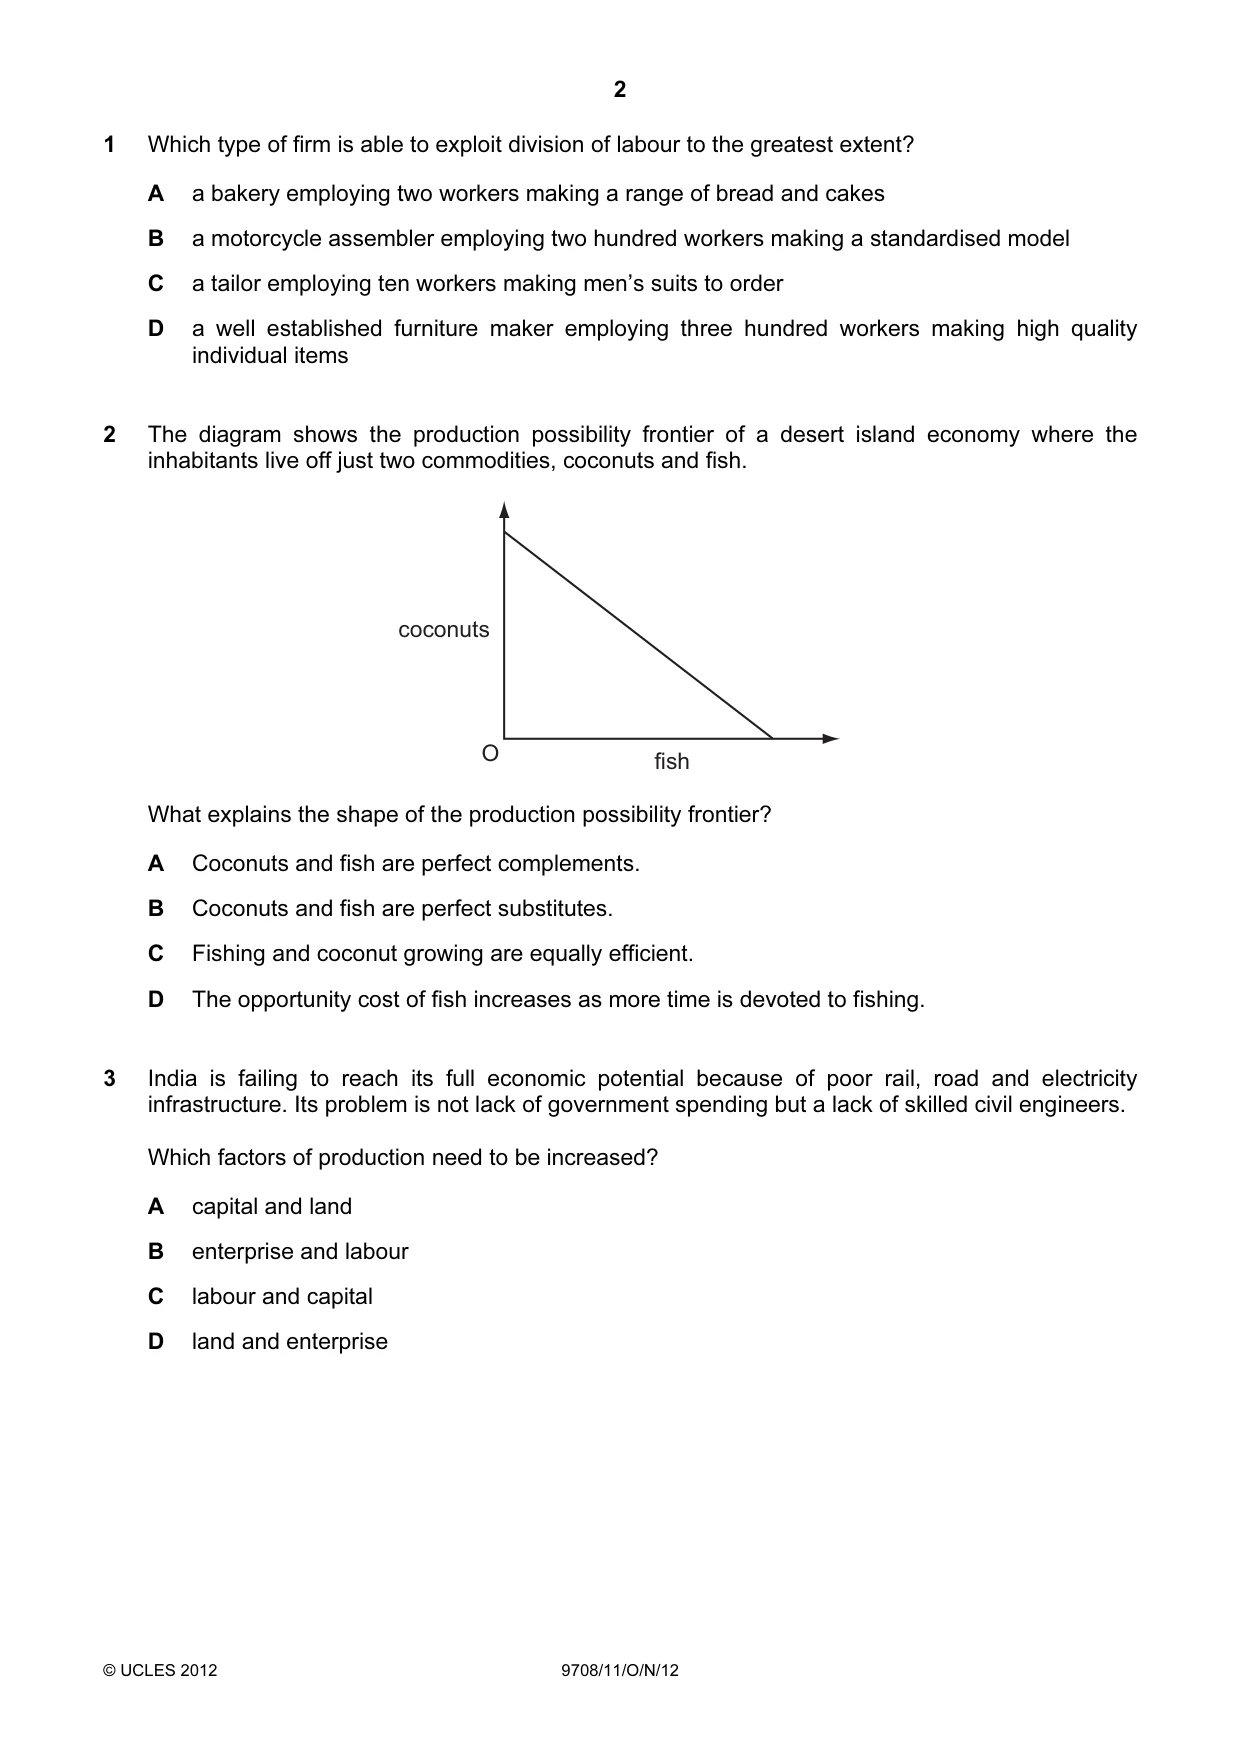
2 The diagram shows the production possibility frontier of a desert island economy where the inhabitants live off just two commodities, coconuts and fish. coconuts O fish What explains the shape of the production possibility frontier? A Coconuts and fish are perfect complements. B Coconuts and fish are perfect substitutes. C Fishing and coconut growing are equally efficient. D The opportunity cost of fish increases as more time is devoted to fishing.
Mark scheme: C
Q3 · India is failing to reach its full economic potential because of poor rail, road and…
3 India is failing to reach its full economic potential because of poor rail, road and electricity infrastructure. Its problem is not lack of government spending but a lack of skilled civil engineers. Which factors of production need to be increased? A capital and land B enterprise and labour C labour and capital D land and enterprise
Mark scheme: C
Q4 · There is a worldwide shortage of oil
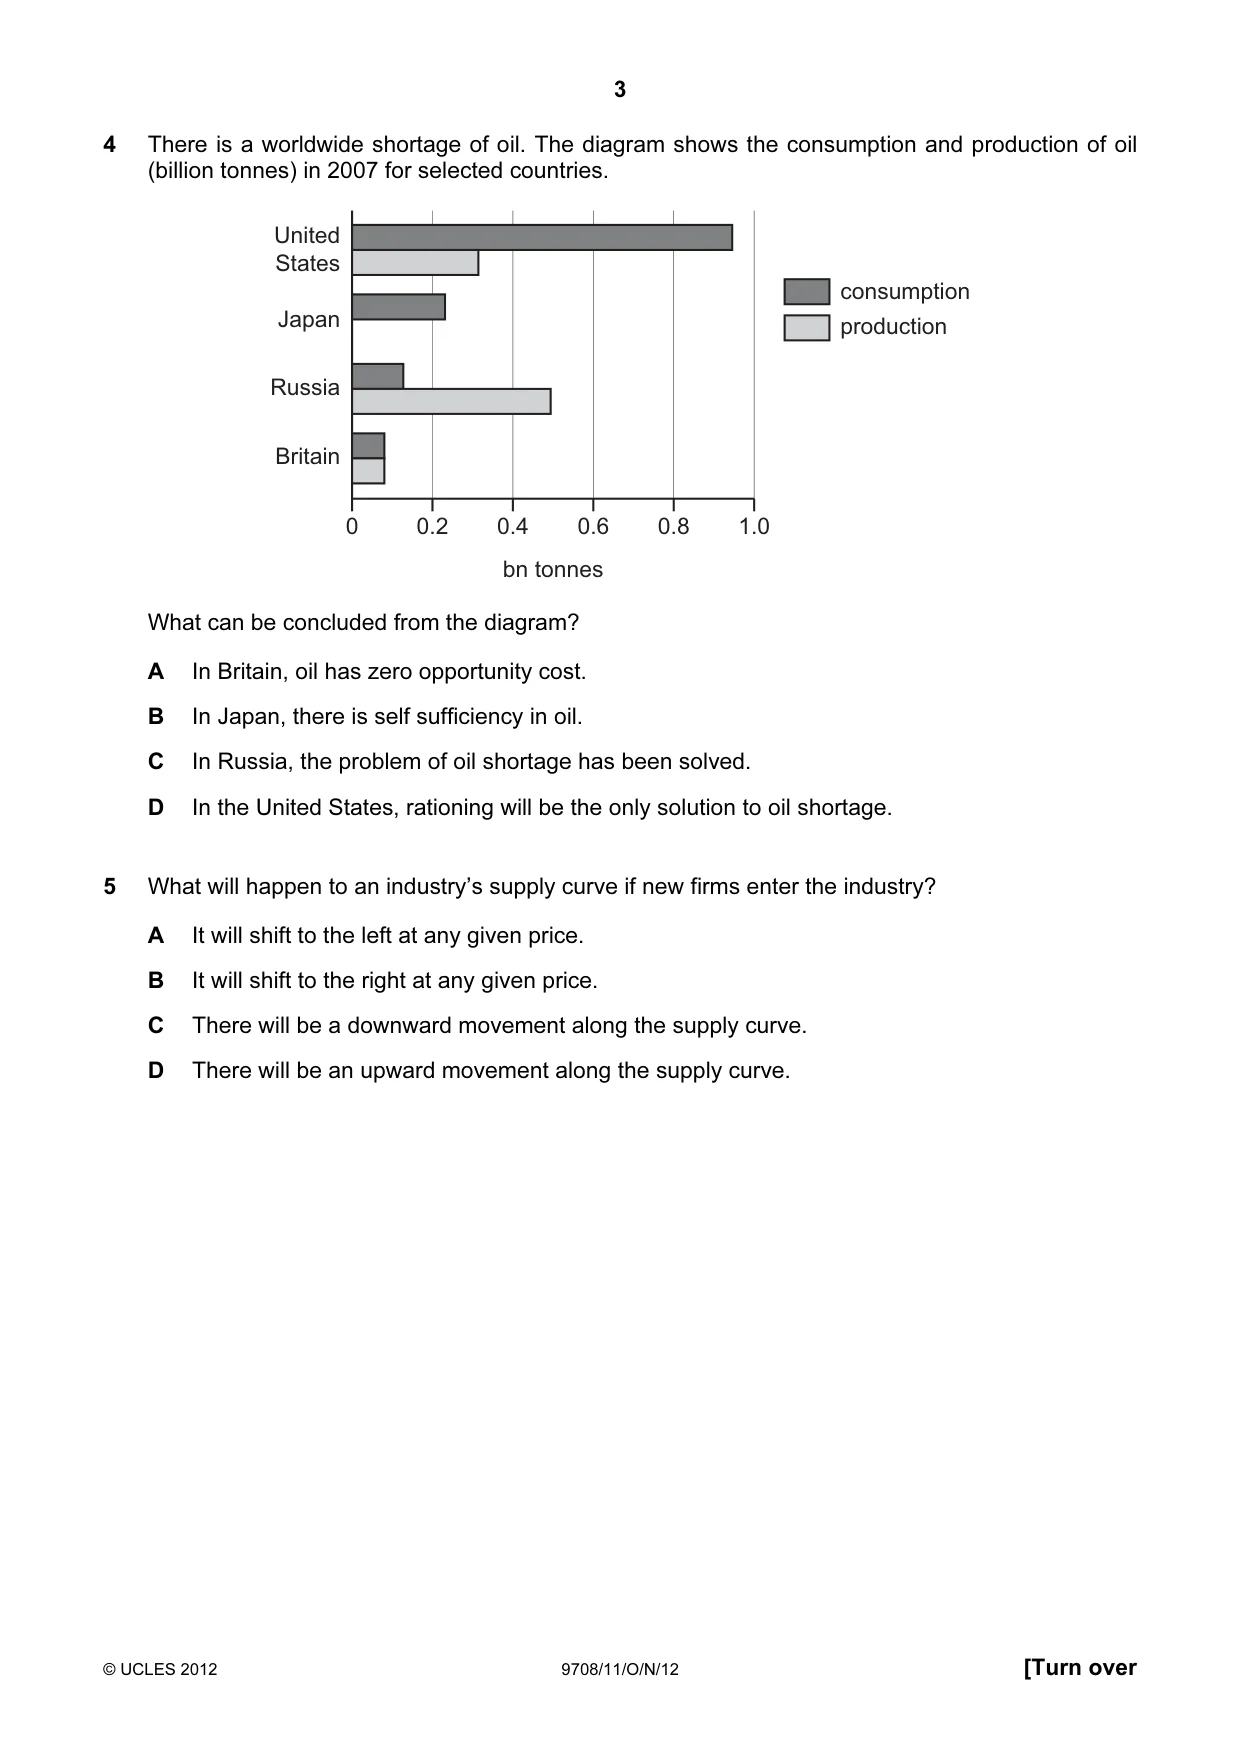
4 There is a worldwide shortage of oil. The diagram shows the consumption and production of oil (billion tonnes) in 2007 for selected countries. United States consumption Japan production Russia Britain 0 0.2 0.4 0.6 0.8 1.0 bn tonnes What can be concluded from the diagram? A In Britain, oil has zero opportunity cost. B In Japan, there is self sufficiency in oil. C In Russia, the problem of oil shortage has been solved. D In the United States, rationing will be the only solution to oil shortage.
Mark scheme: C
Q5 · What will happen to an industry’s supply curve if new firms enter the industry?
5 What will happen to an industry’s supply curve if new firms enter the industry? A It will shift to the left at any given price. B It will shift to the right at any given price. C There will be a downward movement along the supply curve. D There will be an upward movement along the supply curve.
Mark scheme: B
Q6 · The number of passenger journeys per week by train on a certain route is shown by the…
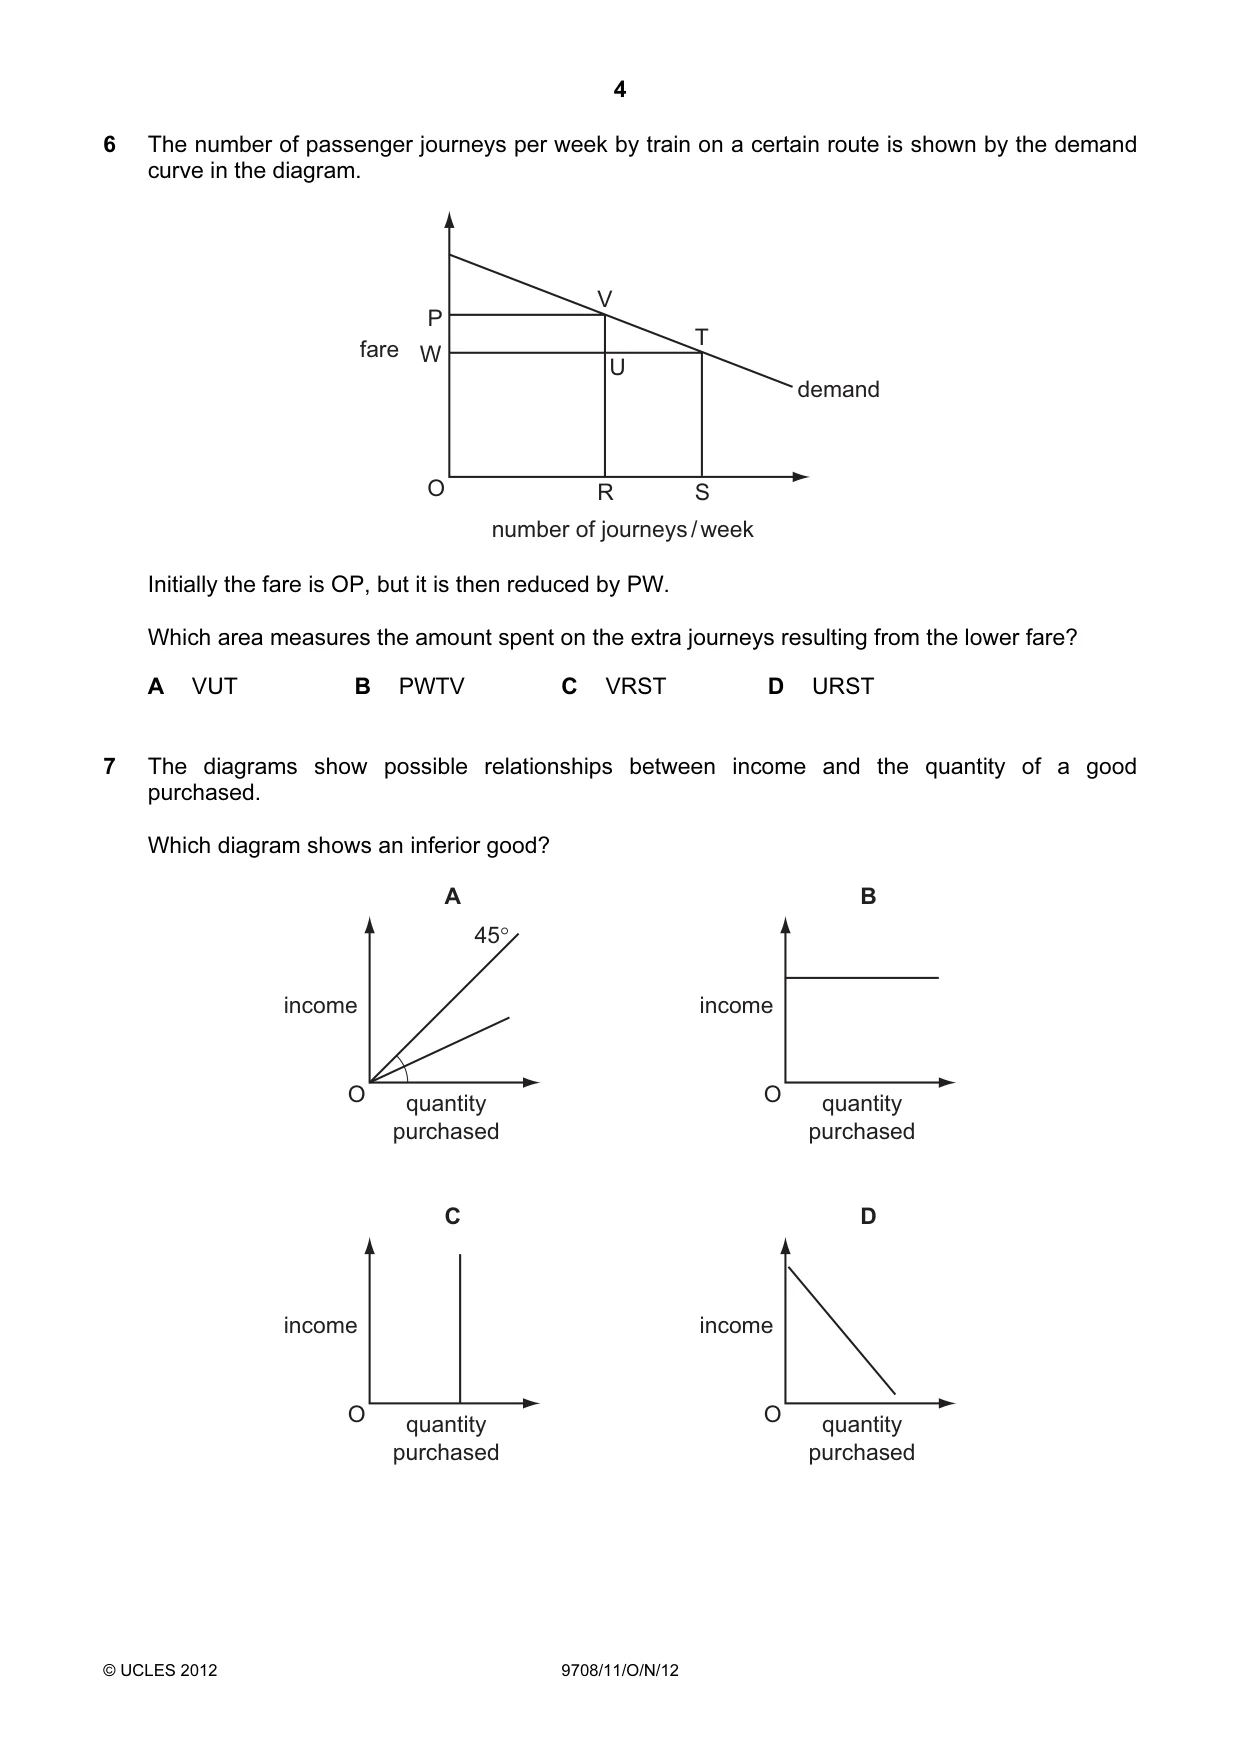
6 The number of passenger journeys per week by train on a certain route is shown by the demand curve in the diagram. V P T fare W U demand O R S number of journeys / week Initially the fare is OP, but it is then reduced by PW. Which area measures the amount spent on the extra journeys resulting from the lower fare? A VUT B PWTV C VRST D URST
Mark scheme: D
Q7 · The diagrams show possible relationships between income and the quantity of a good…
7 The diagrams show possible relationships between income and the quantity of a good purchased. Which diagram shows an inferior good? A B 45° income income O quantity O quantity purchased purchased C D income income O quantity O quantity purchased purchased
Mark scheme: D
More questions on Price elasticity, income elasticity and cross elasticity of demand
Q8 · The price elasticity of demand for good X is 1
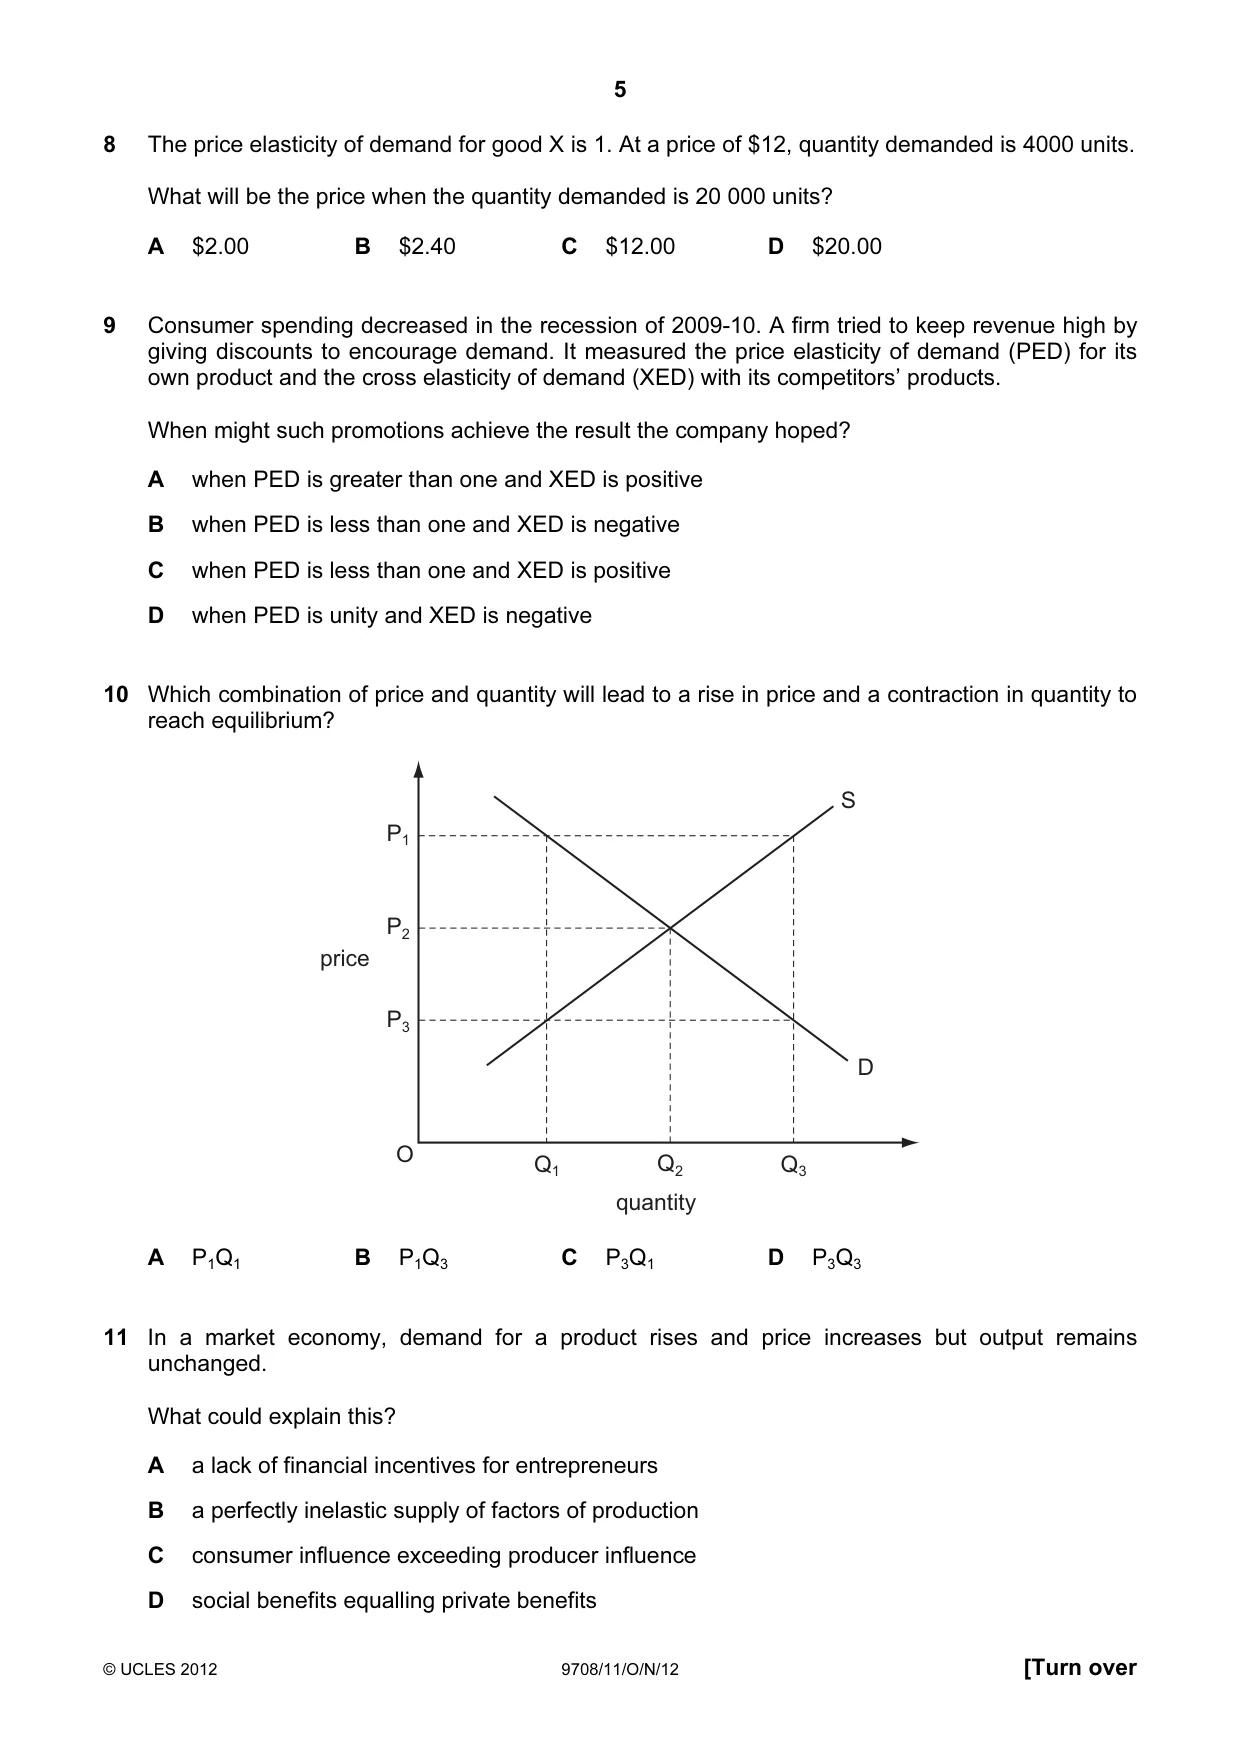
8 The price elasticity of demand for good X is 1. At a price of $12, quantity demanded is 4000 units. What will be the price when the quantity demanded is 20 000 units? A $2.00 B $2.40 C $12.00 D $20.00
Mark scheme: B
More questions on Price elasticity, income elasticity and cross elasticity of demand
Q9 · Consumer spending decreased in the recession of 2009-10
9 Consumer spending decreased in the recession of 2009-10. A firm tried to keep revenue high by giving discounts to encourage demand. It measured the price elasticity of demand (PED) for its own product and the cross elasticity of demand (XED) with its competitors’ products. When might such promotions achieve the result the company hoped? A when PED is greater than one and XED is positive B when PED is less than one and XED is negative C when PED is less than one and XED is positive D when PED is unity and XED is negative
Mark scheme: A
More questions on Price elasticity, income elasticity and cross elasticity of demand
Q10 · Which combination of price and quantity will lead to a rise in price and a contraction in…
10 Which combination of price and quantity will lead to a rise in price and a contraction in quantity to reach equilibrium? S P1 P2 price P3 D O Q1 Q2 Q3 quantity A P1Q1 B P1Q3 C P3Q1 D P3Q3
Mark scheme: D
Q11 · In a market economy, demand for a product rises and price increases but output remains…
11 In a market economy, demand for a product rises and price increases but output remains unchanged. What could explain this? A a lack of financial incentives for entrepreneurs B a perfectly inelastic supply of factors of production C consumer influence exceeding producer influence D social benefits equalling private benefits
Mark scheme: B
Q12 · What must be the effect on consumer surplus if the supply of a product, that has a normal…
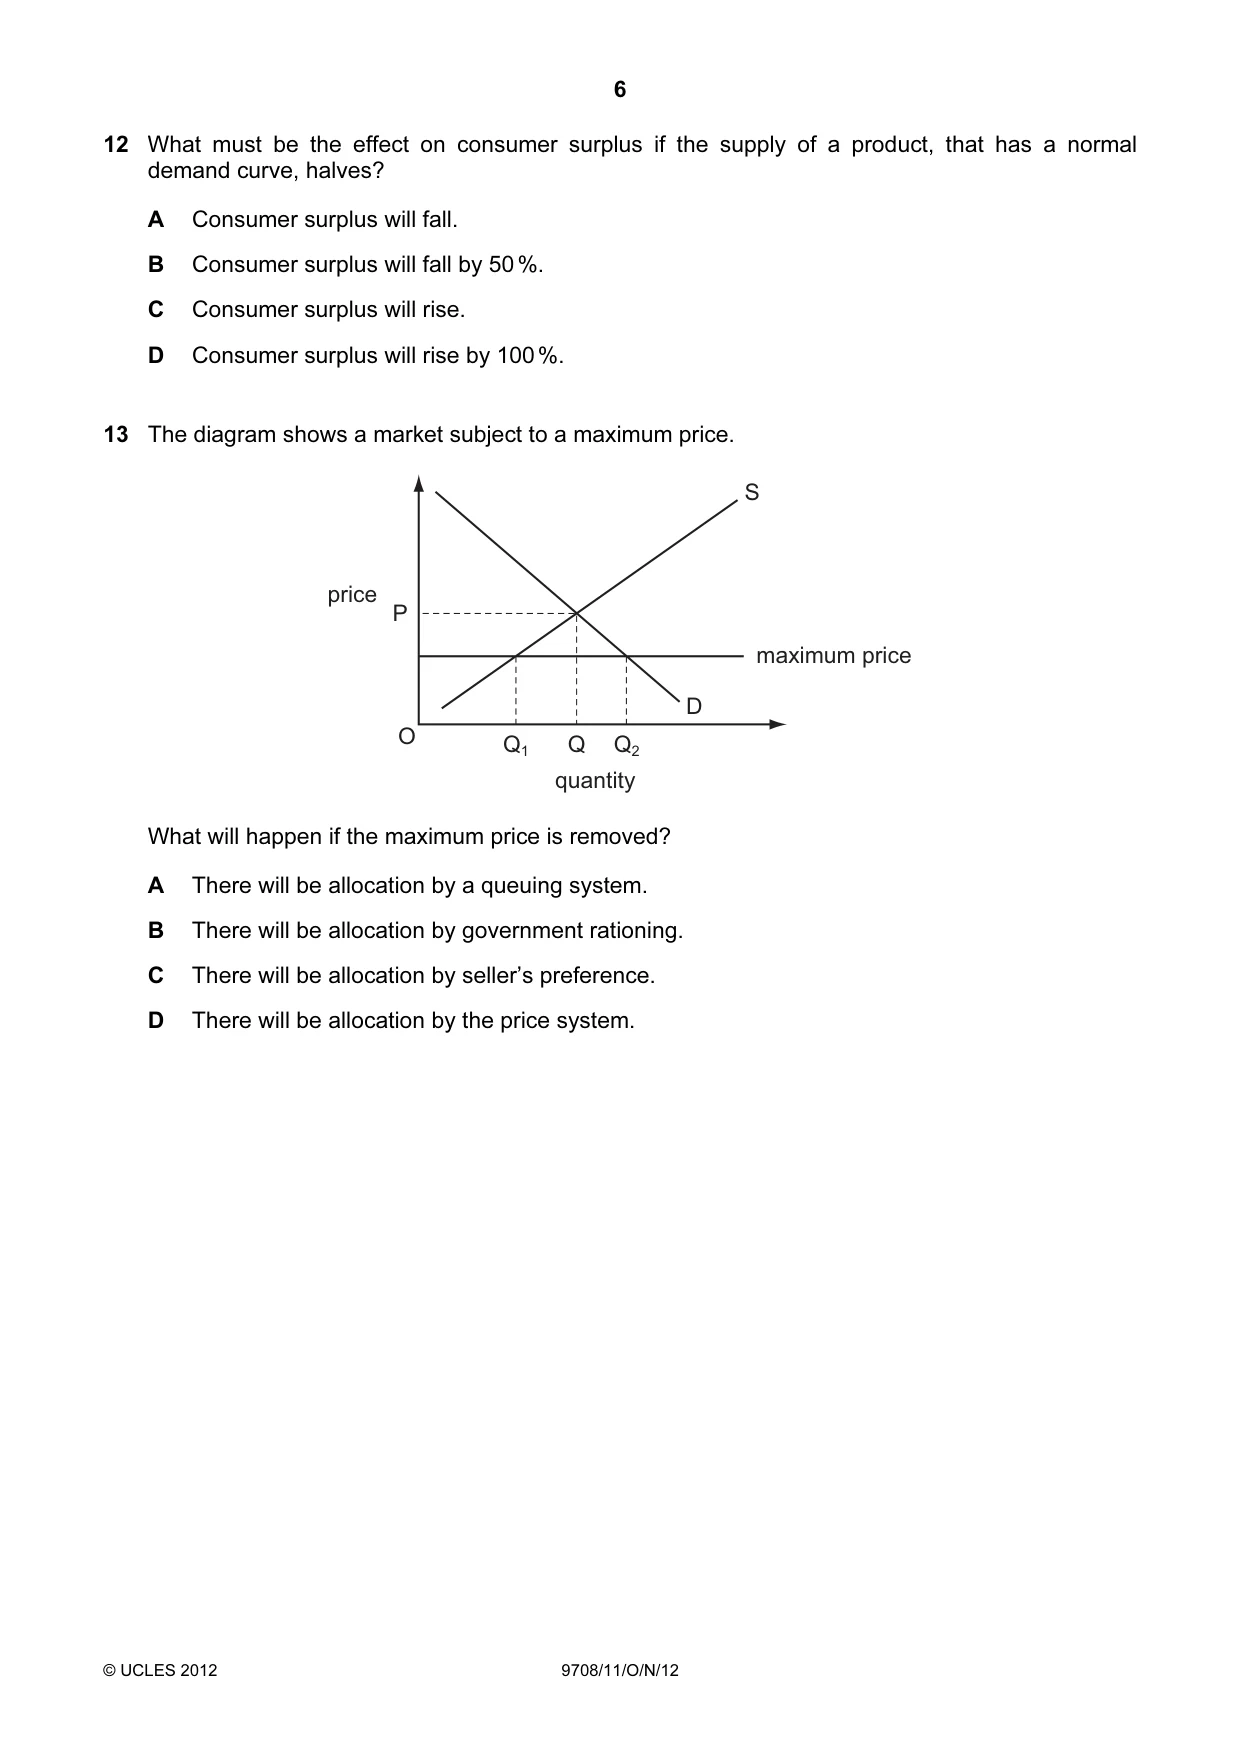
12 What must be the effect on consumer surplus if the supply of a product, that has a normal demand curve, halves? A Consumer surplus will fall. B Consumer surplus will fall by 50 %. C Consumer surplus will rise. D Consumer surplus will rise by 100 %.
Mark scheme: A
Q13 · The diagram shows a market subject to a maximum price
13 The diagram shows a market subject to a maximum price. S price P maximum price D O Q1 Q Q2 quantity What will happen if the maximum price is removed? A There will be allocation by a queuing system. B There will be allocation by government rationing. C There will be allocation by seller’s preference. D There will be allocation by the price system.
Mark scheme: D
More questions on Methods and effects of government intervention in markets
Q14 · In the diagram, Q1 is the quantity produced of a good as the result of market forces
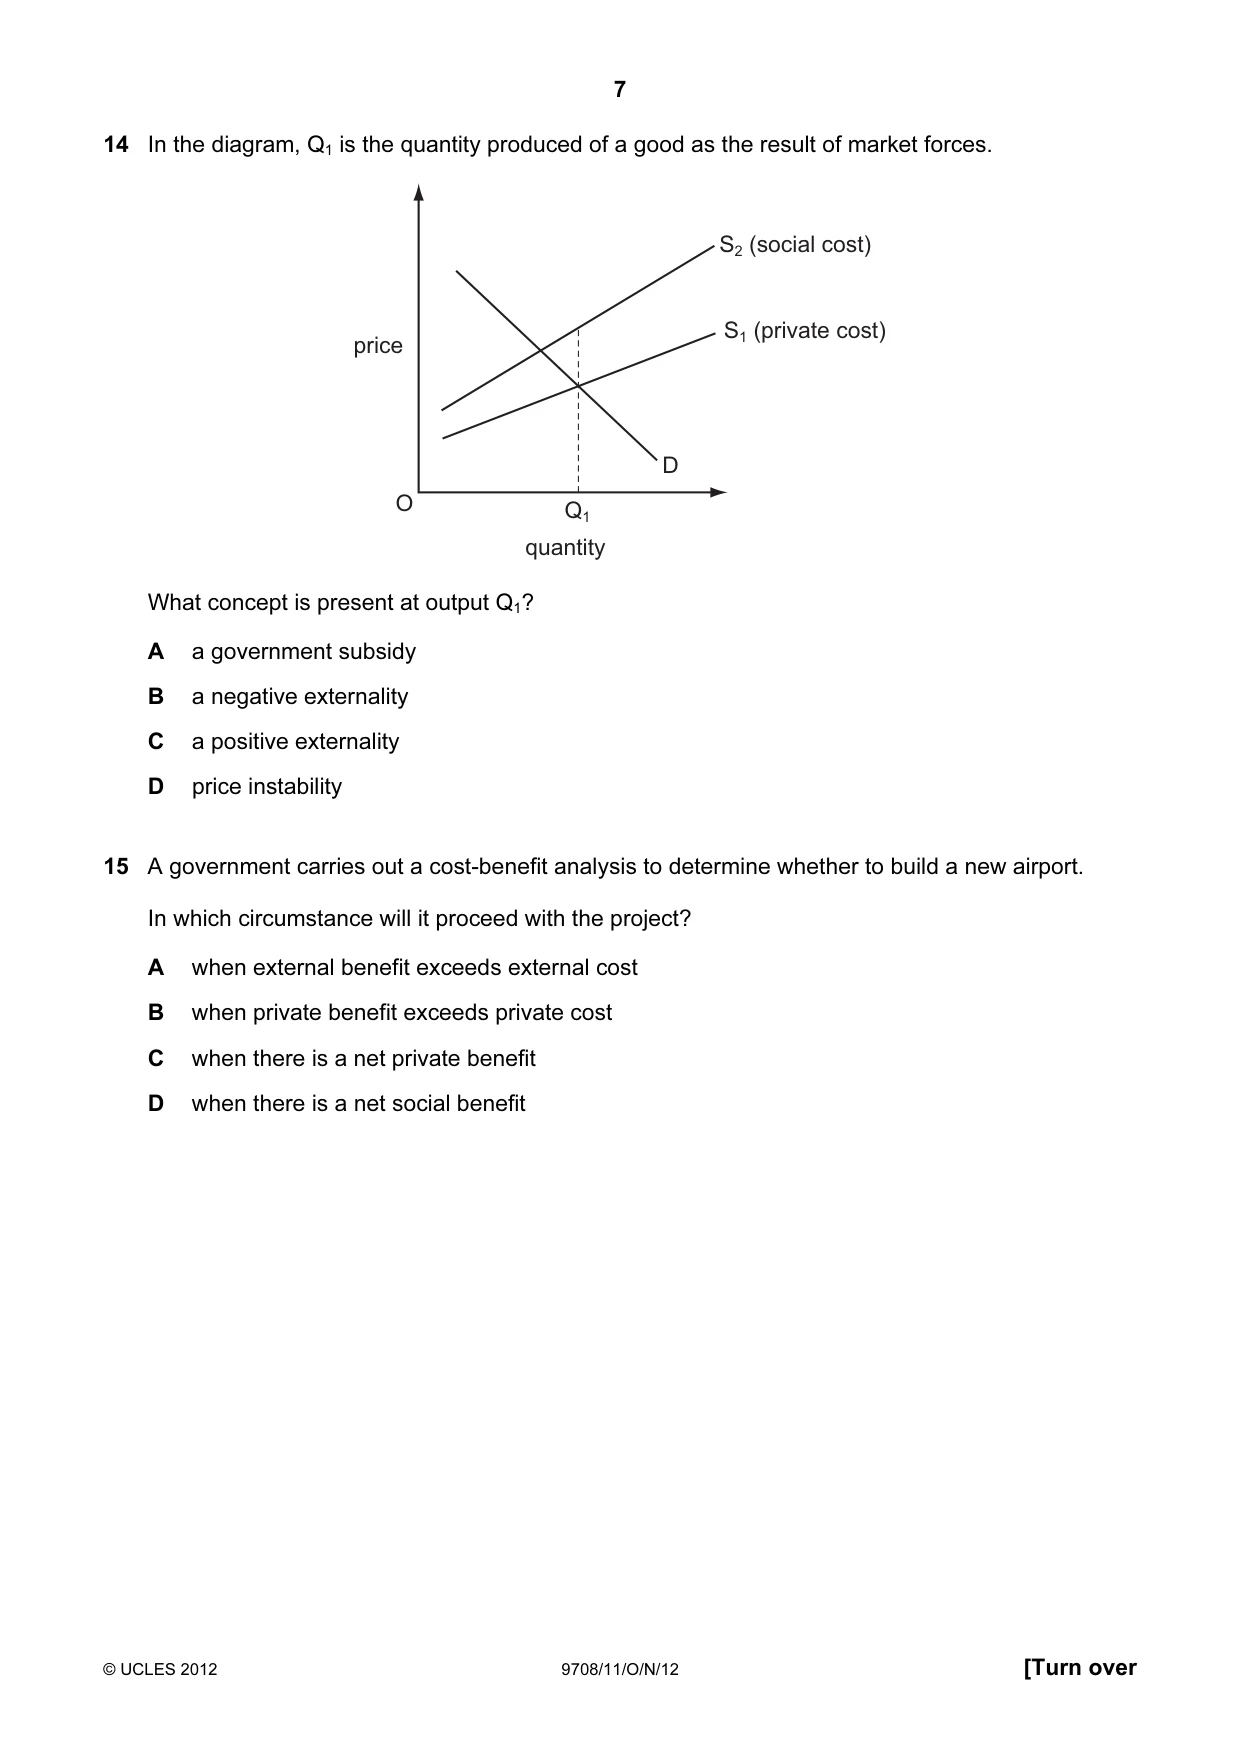
14 In the diagram, Q1 is the quantity produced of a good as the result of market forces. S2 (social cost) S1 (private cost) price D O Q1 quantity What concept is present at output Q1? A a government subsidy B a negative externality C a positive externality D price instability
Mark scheme: B
More questions on Private costs and benefits, externalities and social costs and benefits
Q15 · A government carries out a cost-benefit analysis to determine whether to build a new…
15 A government carries out a cost-benefit analysis to determine whether to build a new airport. In which circumstance will it proceed with the project? A when external benefit exceeds external cost B when private benefit exceeds private cost C when there is a net private benefit D when there is a net social benefit
Mark scheme: D
More questions on Private costs and benefits, externalities and social costs and benefits
Q16 · An international oil company announced that it would stop exploring for oil off the coast…
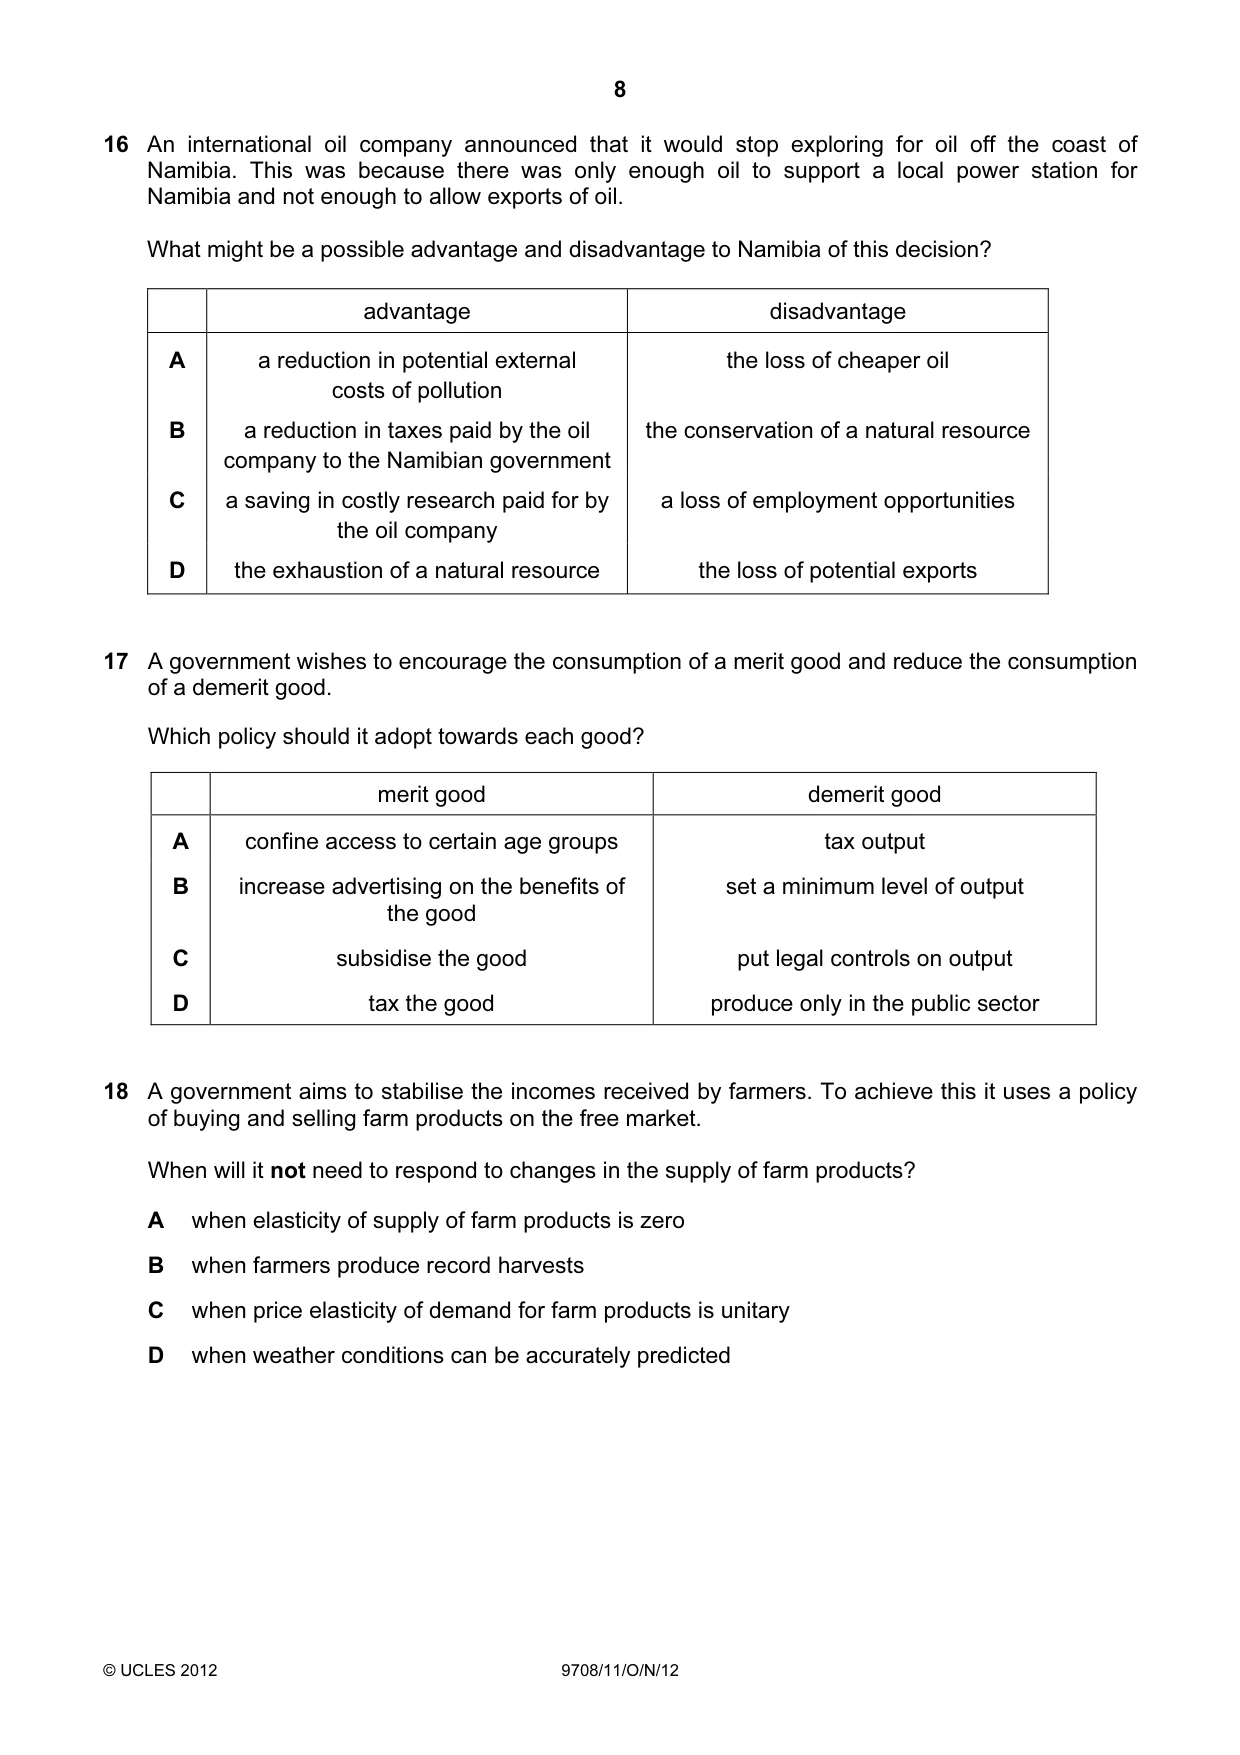
16 An international oil company announced that it would stop exploring for oil off the coast of Namibia. This was because there was only enough oil to support a local power station for Namibia and not enough to allow exports of oil. What might be a possible advantage and disadvantage to Namibia of this decision? advantage disadvantage A a reduction in potential external the loss of cheaper oil costs of pollution B a reduction in taxes paid by the oil the conservation of a natural resource company to the Namibian government C a saving in costly research paid for by a loss of employment opportunities the oil company D the exhaustion of a natural resource the loss of potential exports
Mark scheme: A
More questions on Private costs and benefits, externalities and social costs and benefits
Q17 · A government wishes to encourage the consumption of a merit good and reduce the…
17 A government wishes to encourage the consumption of a merit good and reduce the consumption of a demerit good. Which policy should it adopt towards each good? merit good demerit good A confine access to certain age groups tax output B increase advertising on the benefits of set a minimum level of output the good C subsidise the good put legal controls on output D tax the good produce only in the public sector
Mark scheme: C
More questions on Methods and effects of government intervention in markets
Q18 · A government aims to stabilise the incomes received by farmers
18 A government aims to stabilise the incomes received by farmers. To achieve this it uses a policy of buying and selling farm products on the free market. When will it not need to respond to changes in the supply of farm products? A when elasticity of supply of farm products is zero B when farmers produce record harvests C when price elasticity of demand for farm products is unitary D when weather conditions can be accurately predicted
Mark scheme: C
More questions on Methods and effects of government intervention in markets
Q19 · The table shows the levels of output which three countries can produce
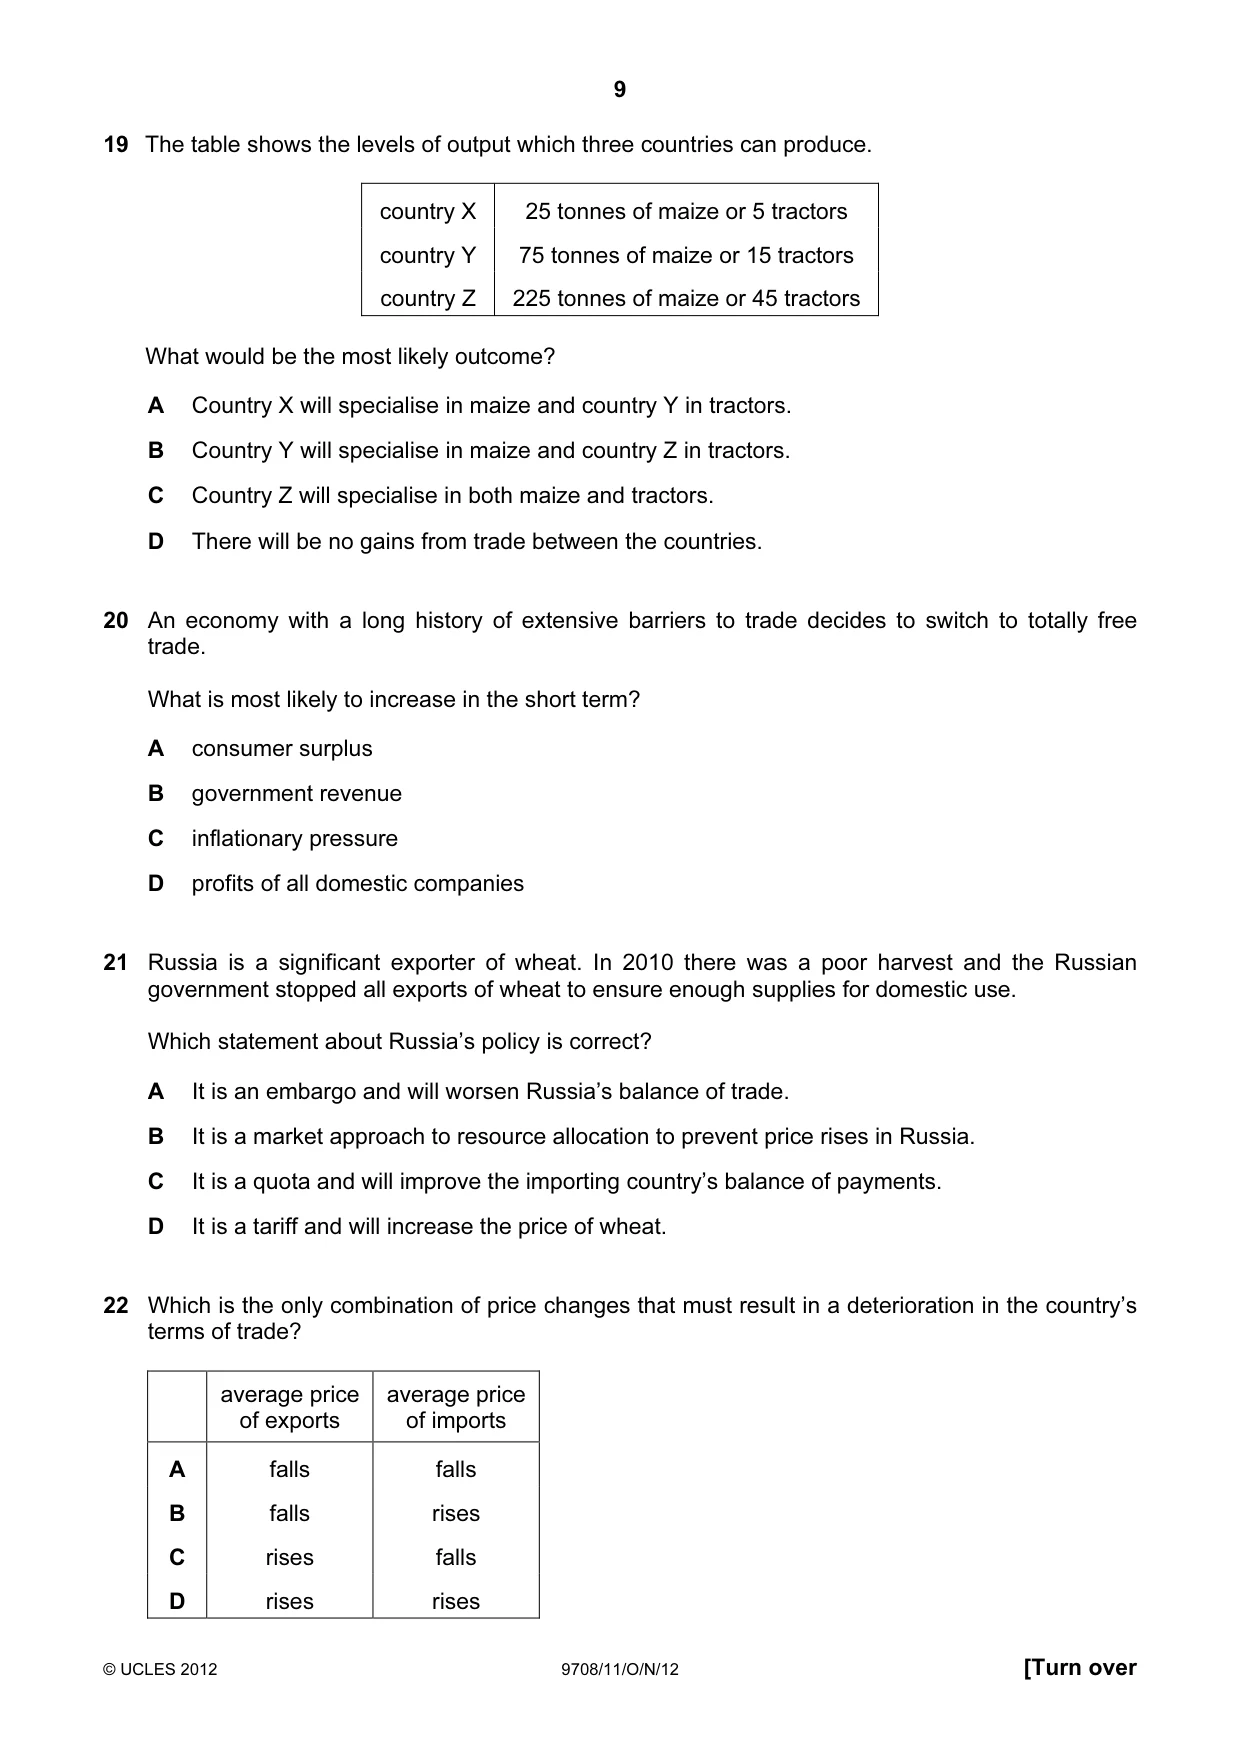
19 The table shows the levels of output which three countries can produce. country X 25 tonnes of maize or 5 tractors country Y 75 tonnes of maize or 15 tractors country Z 225 tonnes of maize or 45 tractors What would be the most likely outcome? A Country X will specialise in maize and country Y in tractors. B Country Y will specialise in maize and country Z in tractors. C Country Z will specialise in both maize and tractors. D There will be no gains from trade between the countries.
Mark scheme: D
Q20 · An economy with a long history of extensive barriers to trade decides to switch to…
20 An economy with a long history of extensive barriers to trade decides to switch to totally free trade. What is most likely to increase in the short term? A consumer surplus B government revenue C inflationary pressure D profits of all domestic companies
Mark scheme: A
Q21 · Russia is a significant exporter of wheat
21 Russia is a significant exporter of wheat. In 2010 there was a poor harvest and the Russian government stopped all exports of wheat to ensure enough supplies for domestic use. Which statement about Russia’s policy is correct? A It is an embargo and will worsen Russia’s balance of trade. B It is a market approach to resource allocation to prevent price rises in Russia. C It is a quota and will improve the importing country’s balance of payments. D It is a tariff and will increase the price of wheat.
Mark scheme: A
Q22 · Which is the only combination of price changes that must result in a deterioration in the…
22 Which is the only combination of price changes that must result in a deterioration in the country’s terms of trade? average price average price of exports of imports A falls falls B falls rises C rises falls D rises rises
Mark scheme: B
Q23 · The table shows the number of workers and the annual output of an industry
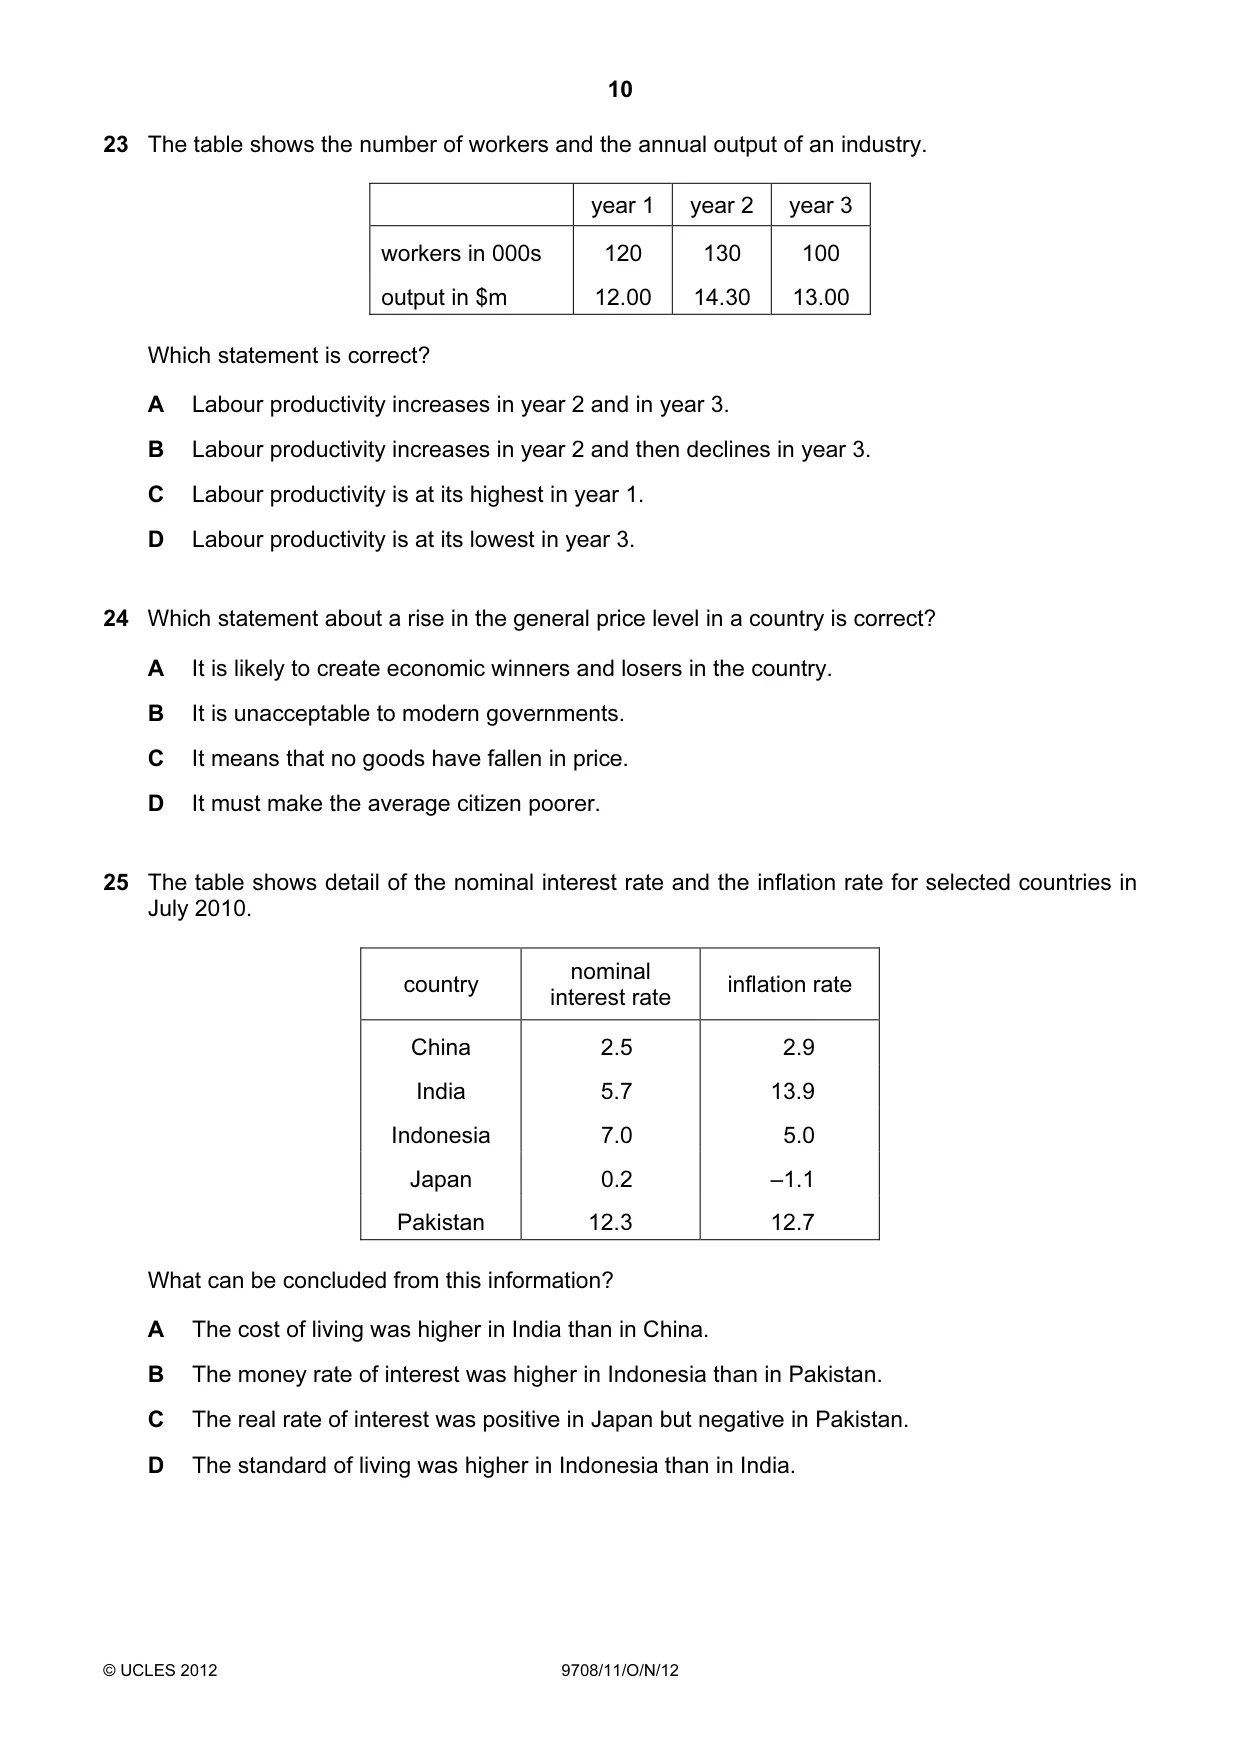
23 The table shows the number of workers and the annual output of an industry. year 1 year 2 year 3 workers in 000s 120 130 100 output in $m 12.00 14.30 13.00 Which statement is correct? A Labour productivity increases in year 2 and in year 3. B Labour productivity increases in year 2 and then declines in year 3. C Labour productivity is at its highest in year 1. D Labour productivity is at its lowest in year 3.
Mark scheme: A
Q24 · Which statement about a rise in the general price level in a country is correct?
24 Which statement about a rise in the general price level in a country is correct? A It is likely to create economic winners and losers in the country. B It is unacceptable to modern governments. C It means that no goods have fallen in price. D It must make the average citizen poorer.
Mark scheme: A
Q25 · The table shows detail of the nominal interest rate and the inflation rate for selected…
25 The table shows detail of the nominal interest rate and the inflation rate for selected countries in July 2010. nominal country inflation rate interest rate China 2.5 2.9 India 5.7 13.9 Indonesia 7.0 5.0 Japan 0.2 –1.1 Pakistan 12.3 12.7 What can be concluded from this information? A The cost of living was higher in India than in China. B The money rate of interest was higher in Indonesia than in Pakistan. C The real rate of interest was positive in Japan but negative in Pakistan. D The standard of living was higher in Indonesia than in India.
Mark scheme: C
Q26 · Two industries in a country are fishing and tourism
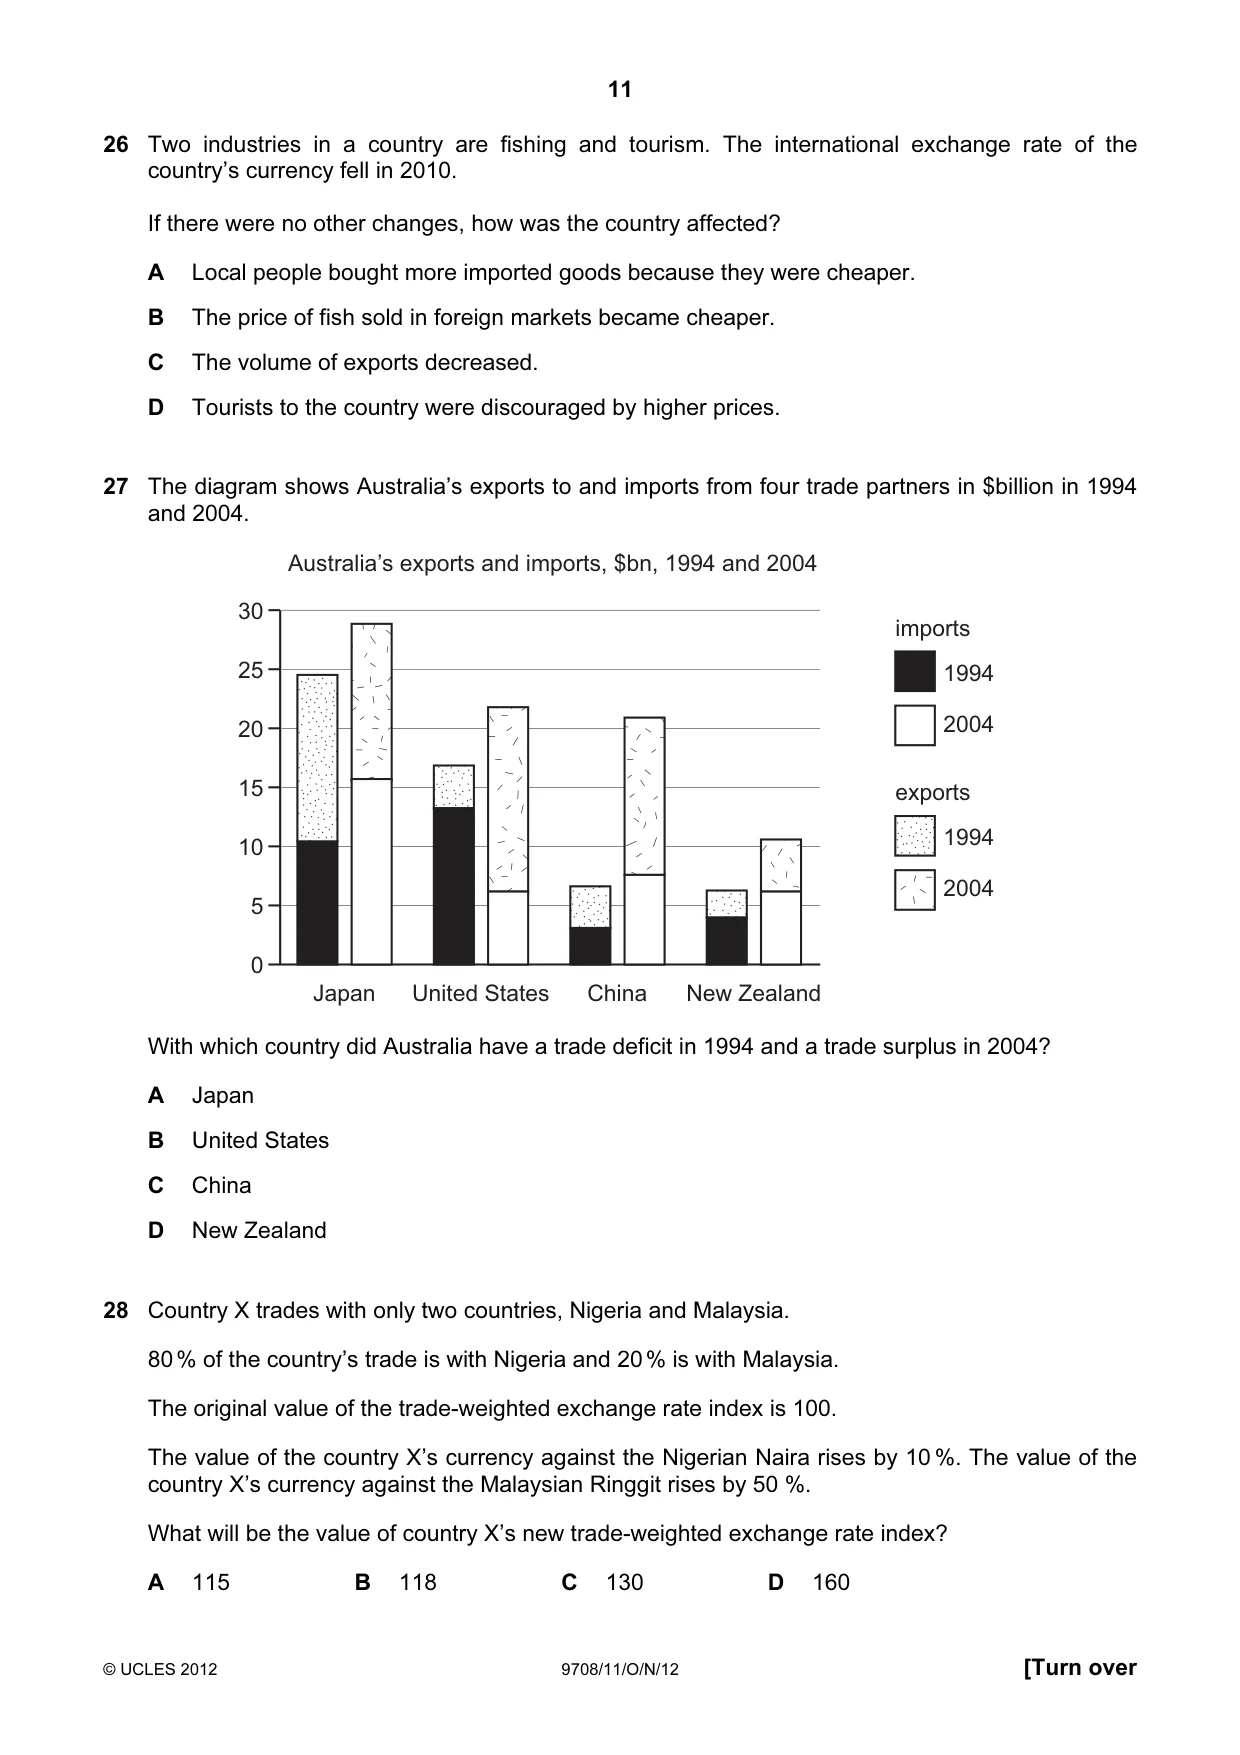
26 Two industries in a country are fishing and tourism. The international exchange rate of the country’s currency fell in 2010. If there were no other changes, how was the country affected? A Local people bought more imported goods because they were cheaper. B The price of fish sold in foreign markets became cheaper. C The volume of exports decreased. D Tourists to the country were discouraged by higher prices.
Mark scheme: B
Q27 · The diagram shows Australia’s exports to and imports from four trade partners in $billion…
27 The diagram shows Australia’s exports to and imports from four trade partners in $billion in 1994 and 2004. Australia’s exports and imports, $bn, 1994 and 2004 30 imports 25 1994 20 2004 15 exports 10 1994 2004 5 0 Japan United States China New Zealand With which country did Australia have a trade deficit in 1994 and a trade surplus in 2004? A Japan B United States C China D New Zealand
Mark scheme: B
More questions on Current account of the balance of payments
Q28 · Country X trades with only two countries, Nigeria and Malaysia
28 Country X trades with only two countries, Nigeria and Malaysia. 80 % of the country’s trade is with Nigeria and 20 % is with Malaysia. The original value of the trade-weighted exchange rate index is 100. The value of the country X’s currency against the Nigerian Naira rises by 10 %. The value of the country X’s currency against the Malaysian Ringgit rises by 50 %. What will be the value of country X’s new trade-weighted exchange rate index? A 115 B 118 C 130 D 160
Mark scheme: B
Q29 · In the diagram, curves D1D1 and SS relate to the demand for and supply of £ sterling in…
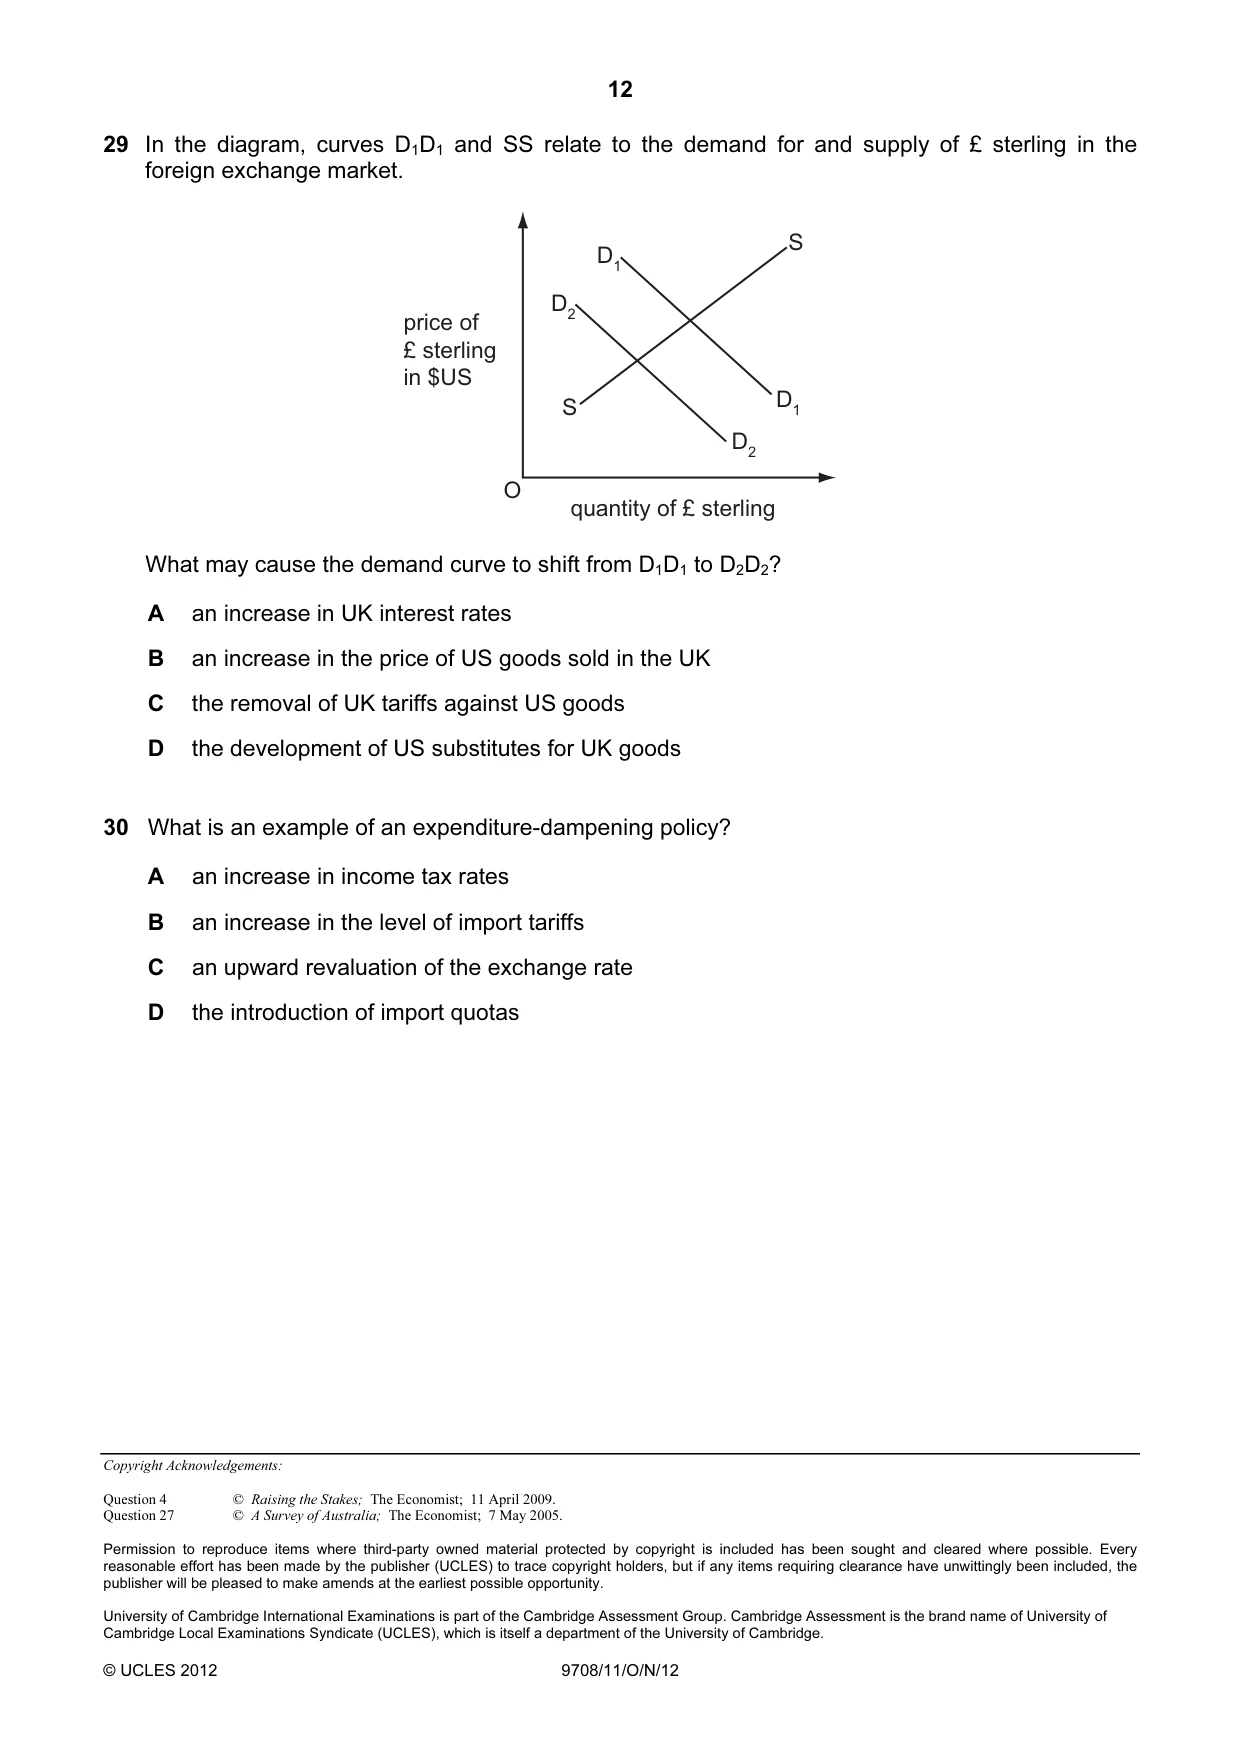
29 In the diagram, curves D1D1 and SS relate to the demand for and supply of £ sterling in the foreign exchange market. S D1 D2 price of £ sterling in $US S D1 D2 O quantity of £ sterling What may cause the demand curve to shift from D1D1 to D2D2? A an increase in UK interest rates B an increase in the price of US goods sold in the UK C the removal of UK tariffs against US goods D the development of US substitutes for UK goods
Mark scheme: D
Q30 · What is an example of an expenditure-dampening policy?
30 What is an example of an expenditure-dampening policy? A an increase in income tax rates B an increase in the level of import tariffs C an upward revaluation of the exchange rate D the introduction of import quotas
Mark scheme: A
More questions on Policies to correct imbalances in the current account of the balance of payments
What was in this paper
The subtopics covered by these 30 questions, and how many questions each got. Open one in a new tab to see every Cambridge question on it.
4Methods and effects of government intervention in markets3Price elasticity, income elasticity and cross elasticity of demand3Private costs and benefits, externalities and social costs and benefits3Demand and supply curves2Factors of production2Price stability2The interaction of demand and supply2The reasons for international trade2Consumer and producer surplus1Current account of the balance of payments1National income statistics1Policies to correct imbalances in the current account of the balance of payments1Production possibility curves1Protectionism1Scarcity, choice and opportunity cost1What you needed in this session
Cambridge’s own grade thresholds for 2012 Oct/Nov, Paper 1 · Variant 1. A higher threshold means an easier paper — the bar moves with how the cohort did.