Cambridge A Level Economics 9708 — 2017 May/June Paper 1 · Variant 1
9708/11/M/J/17 · 30 questions · 30 marks · ≈34 min
The question paper and its mark scheme, free to read here and free to download. This is Cambridge’s own paper, exactly as it was sat.
Question paper12 pages
Mark scheme3 pages
Answers below. Sit the paper first if you are practising.
Questions as text
Q1 · What must follow when scarcity exists?
1 What must follow when scarcity exists? A Consumers have to make choices. B Governments are unable to supply public goods. C Producers must be misallocating resources. D Workers must be earning low wages.
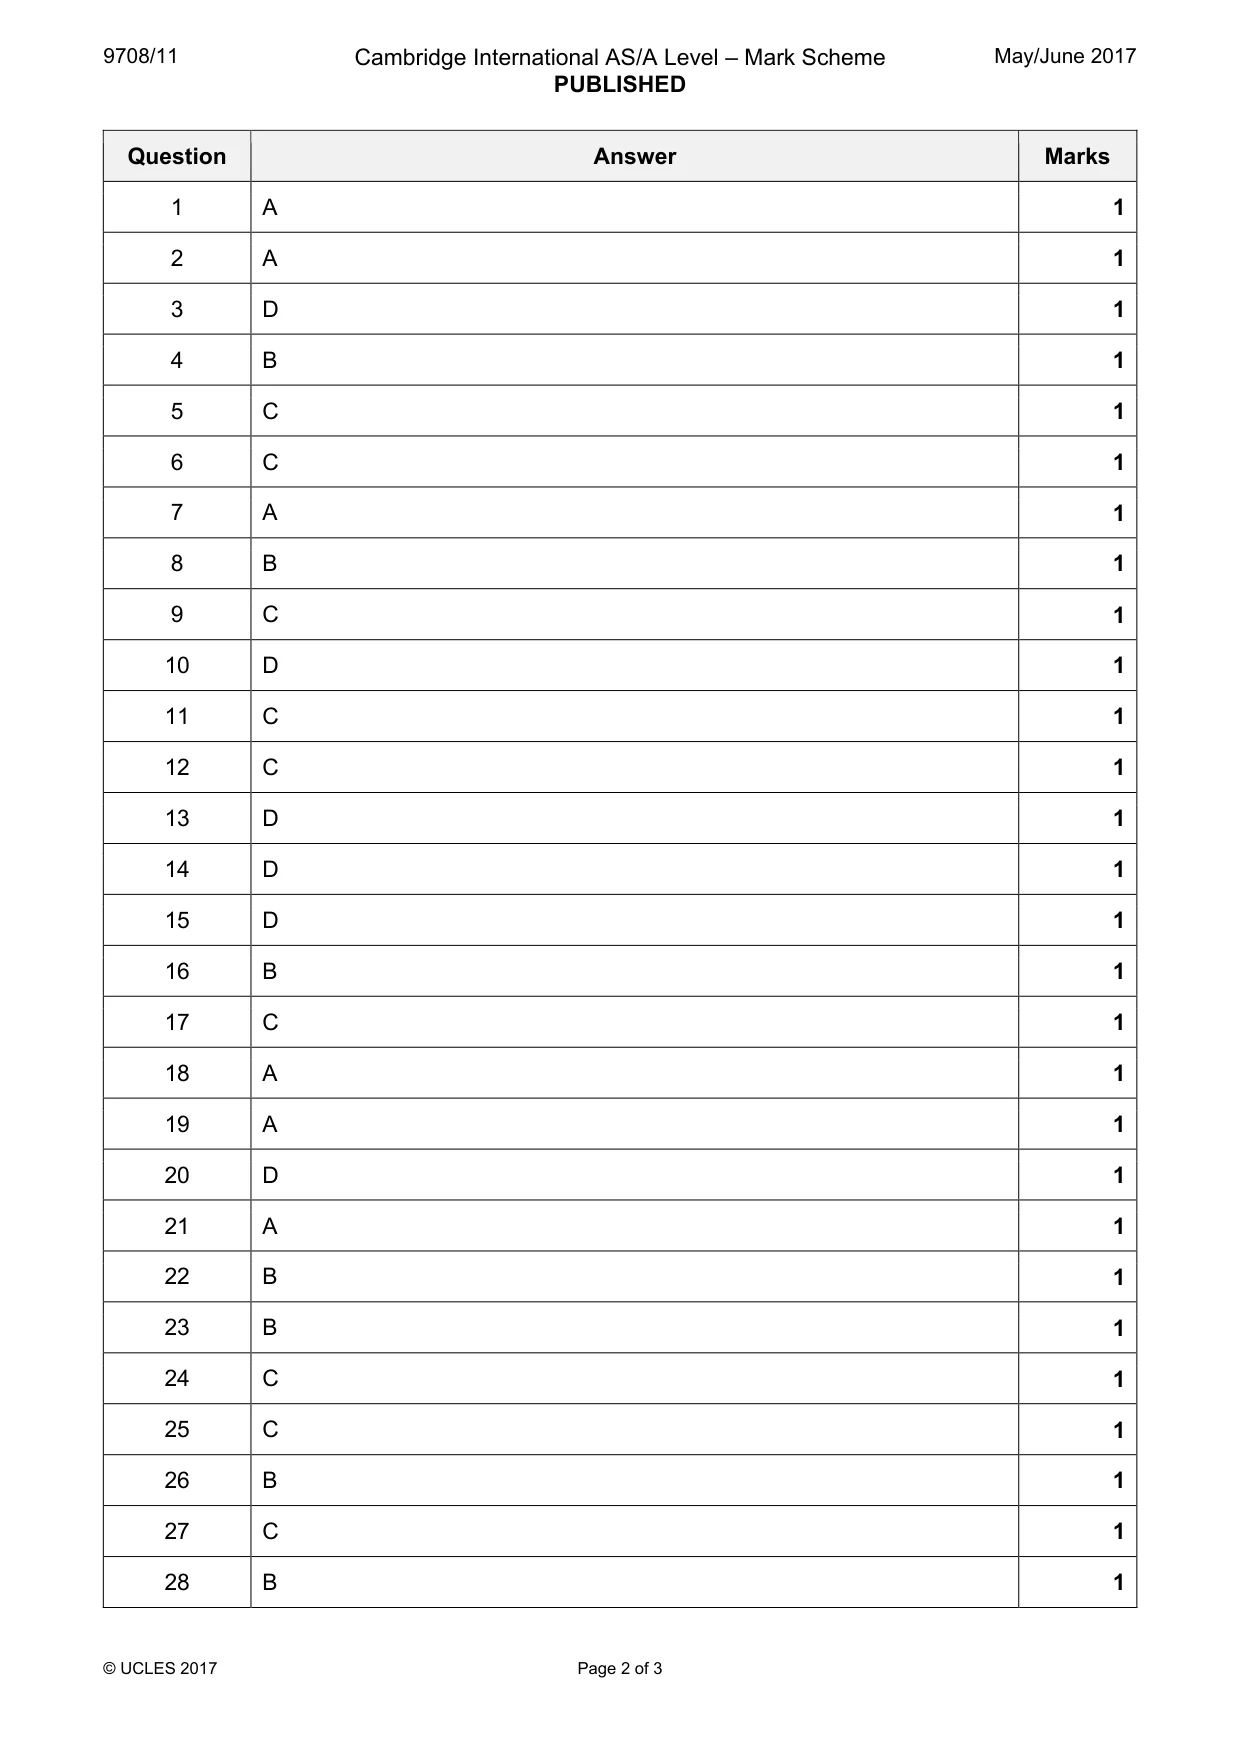
Mark scheme: A
Q2 · What is likely to be introduced in the market for bus travel if an economy moved from a…
2 What is likely to be introduced in the market for bus travel if an economy moved from a mixed economy to a market economy? A allowing companies to bid for bus routes B free bus travel for school children C maximum prices for bus travel D subsidies to bus operators
Mark scheme: A
More questions on Resource allocation in different economic systems
Q3 · The diagram shows that the production possibility frontier of maize and beans has changed…
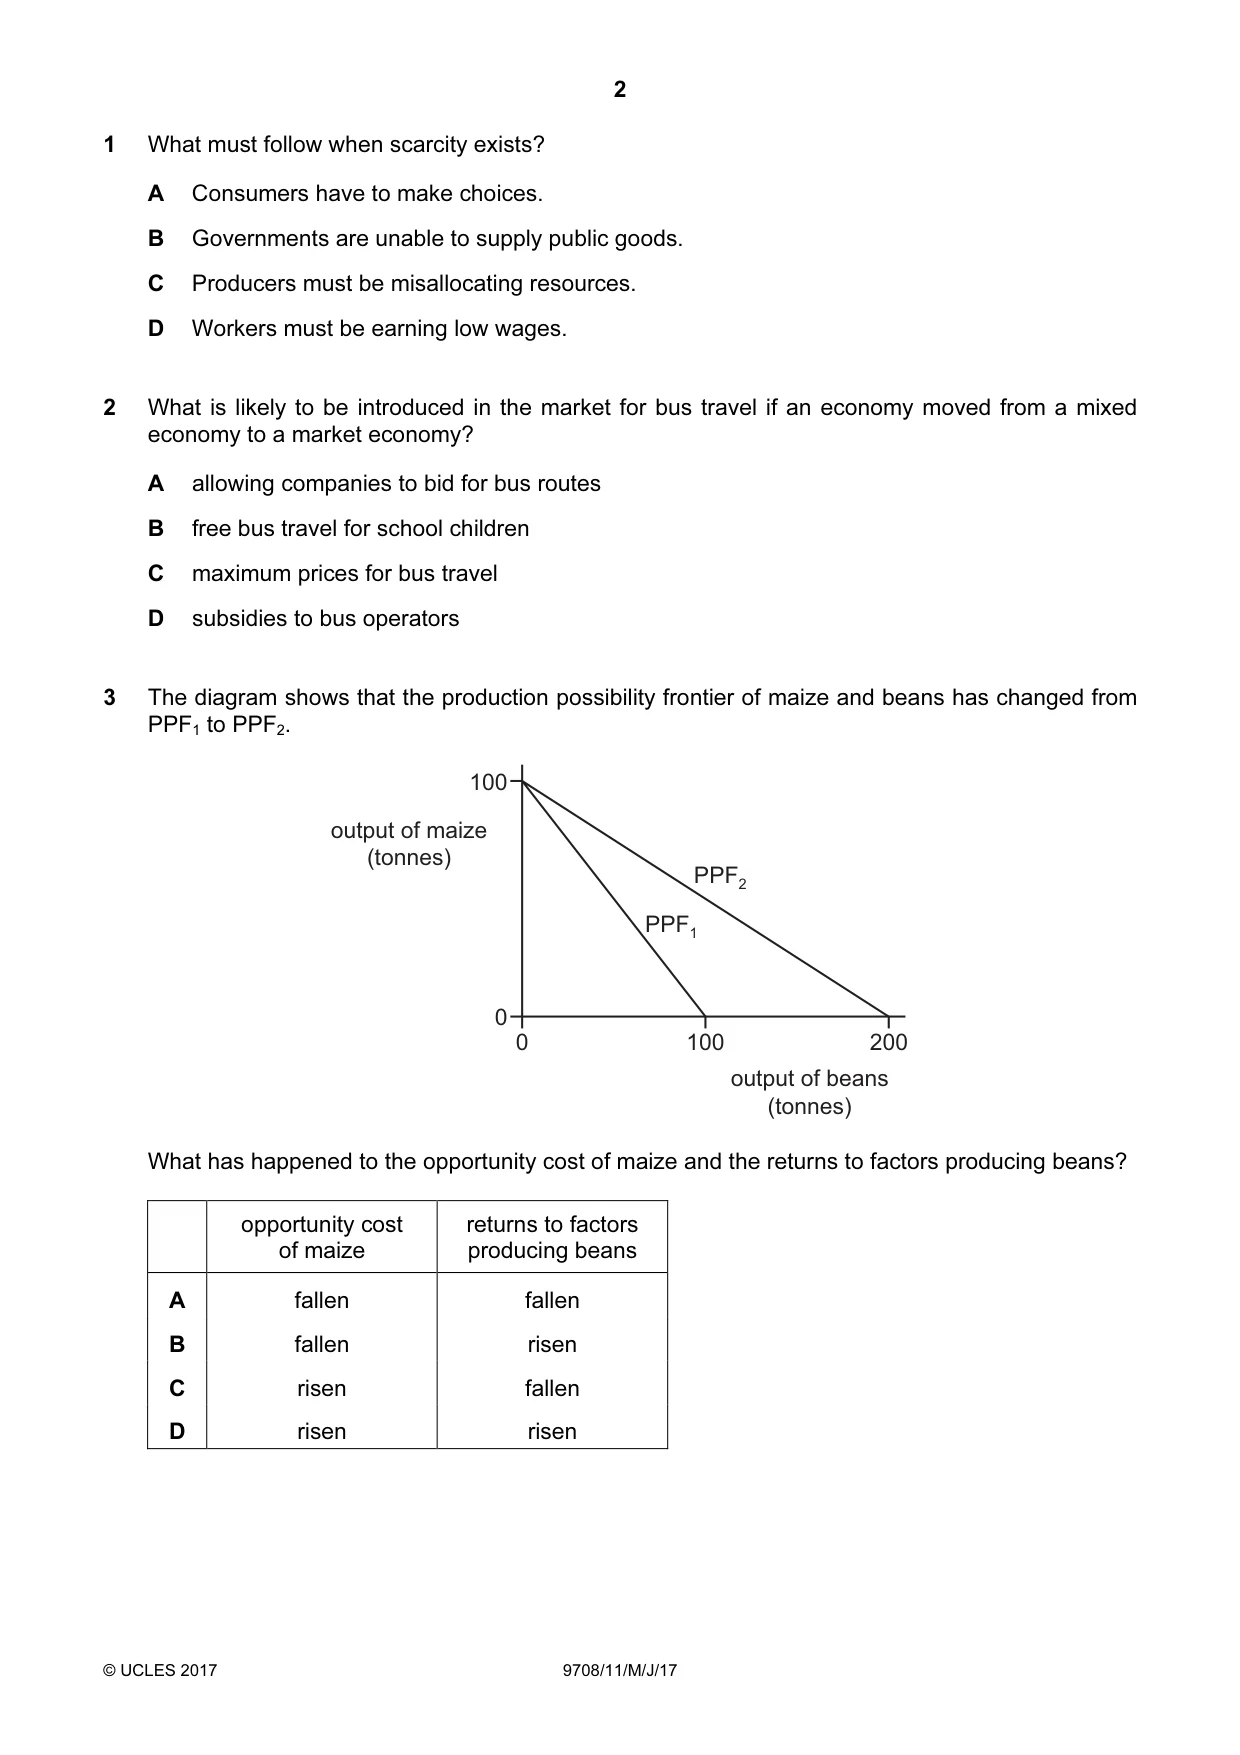
3 The diagram shows that the production possibility frontier of maize and beans has changed from PPF1 to PPF2. 100 output of maize (tonnes) PPF2 PPF1 0 0 100 200 output of beans (tonnes) What has happened to the opportunity cost of maize and the returns to factors producing beans? opportunity cost returns to factors of maize producing beans A fallen fallen B fallen risen C risen fallen D risen risen
Mark scheme: D
Q4 · An individual buys a ticket to visit a government-owned art gallery
4 An individual buys a ticket to visit a government-owned art gallery. How would this visit be classified by an economist? A private and demerit good B private and merit good C public and demerit good D public and merit good
Mark scheme: B
Q5 · The diagram shows a shift in a firm’s supply curve from S1 to S2
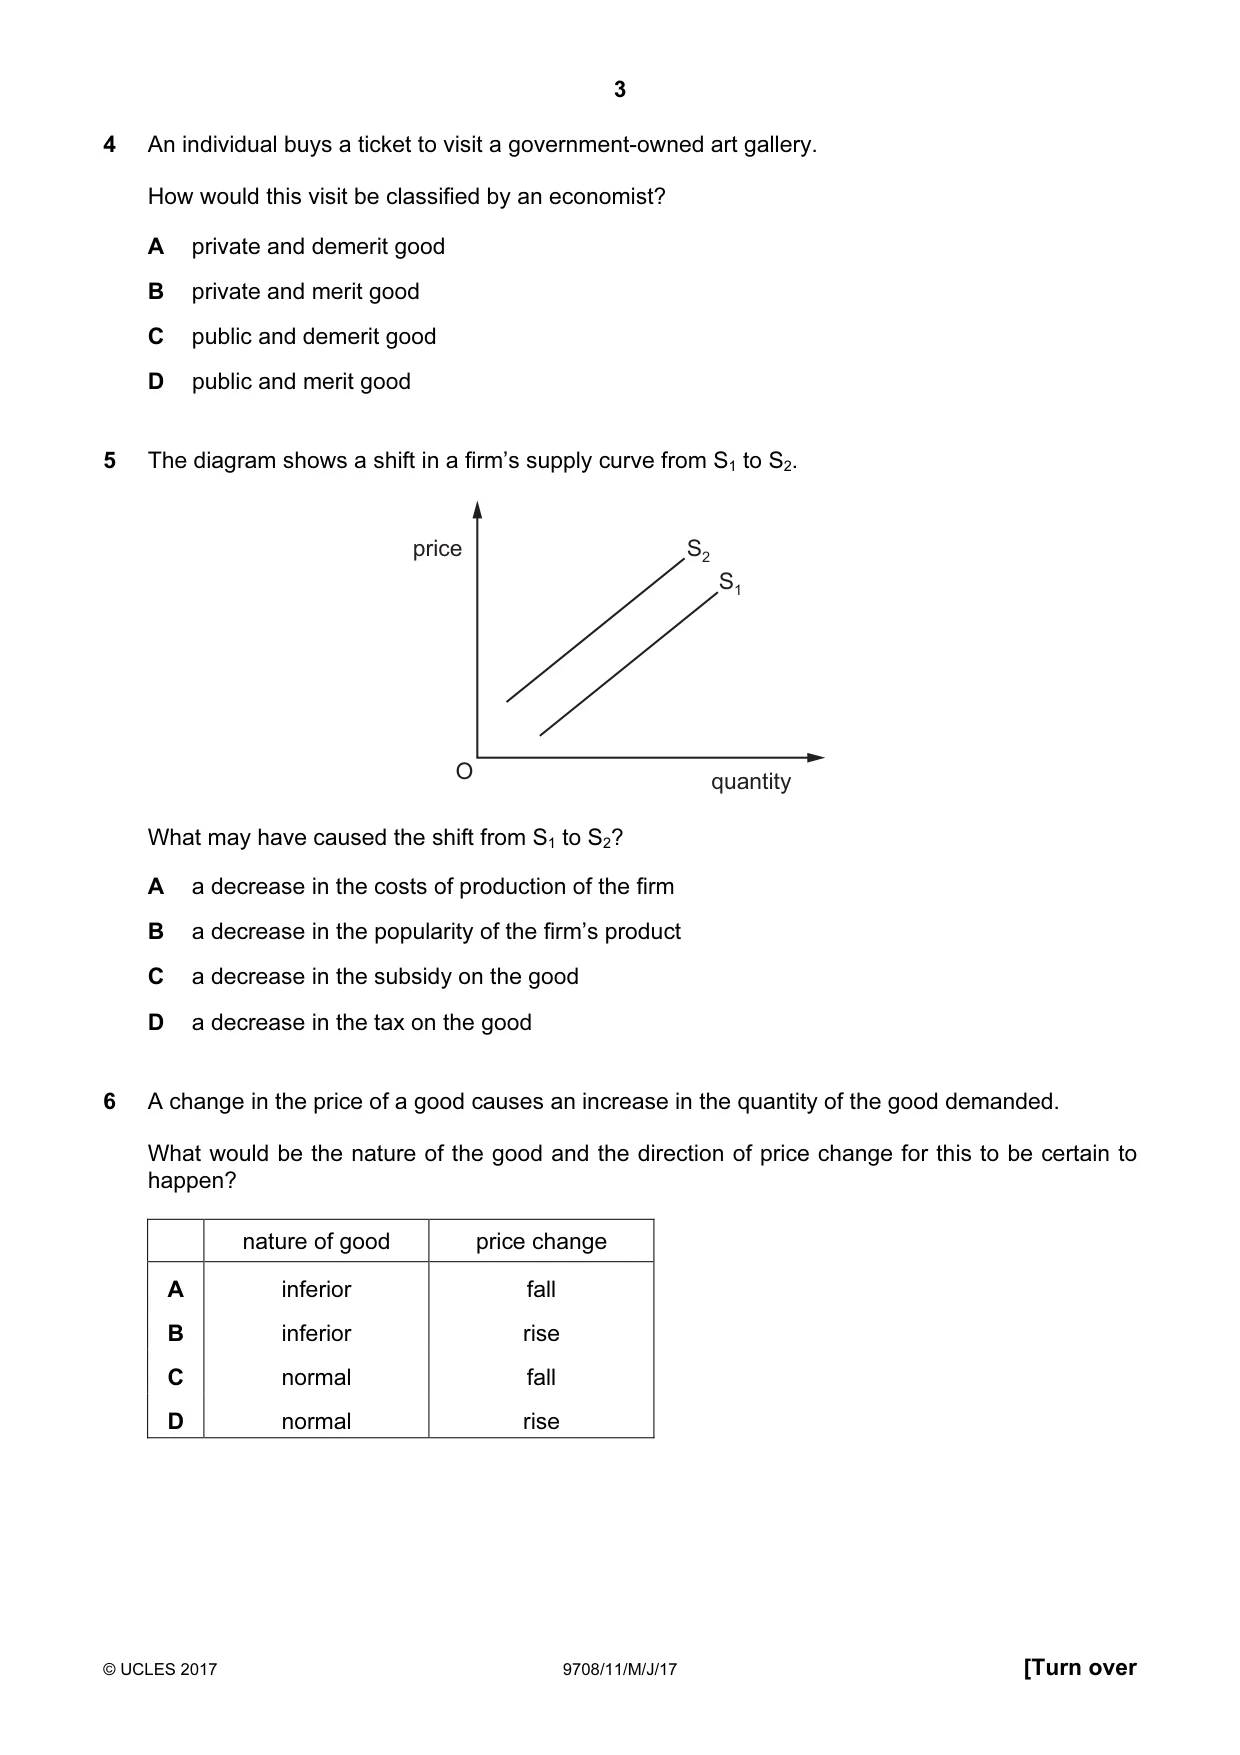
5 The diagram shows a shift in a firm’s supply curve from S1 to S2. price S2 S1 O quantity What may have caused the shift from S1 to S2? A a decrease in the costs of production of the firm B a decrease in the popularity of the firm’s product C a decrease in the subsidy on the good D a decrease in the tax on the good
Mark scheme: C
Q6 · A change in the price of a good causes an increase in the quantity of the good demanded
6 A change in the price of a good causes an increase in the quantity of the good demanded. What would be the nature of the good and the direction of price change for this to be certain to happen? nature of good price change A inferior fall B inferior rise C normal fall D normal rise
Mark scheme: C
Q7 · Which combination is most likely to result in the demand for a product being highly price…
7 Which combination is most likely to result in the demand for a product being highly price elastic? number of close % of income substitutes spent on product A large large B large small C small large D small small
Mark scheme: A
More questions on Price elasticity, income elasticity and cross elasticity of demand
Q8 · A manufacturer increases the price of his product from $4 in an attempt to increase total…
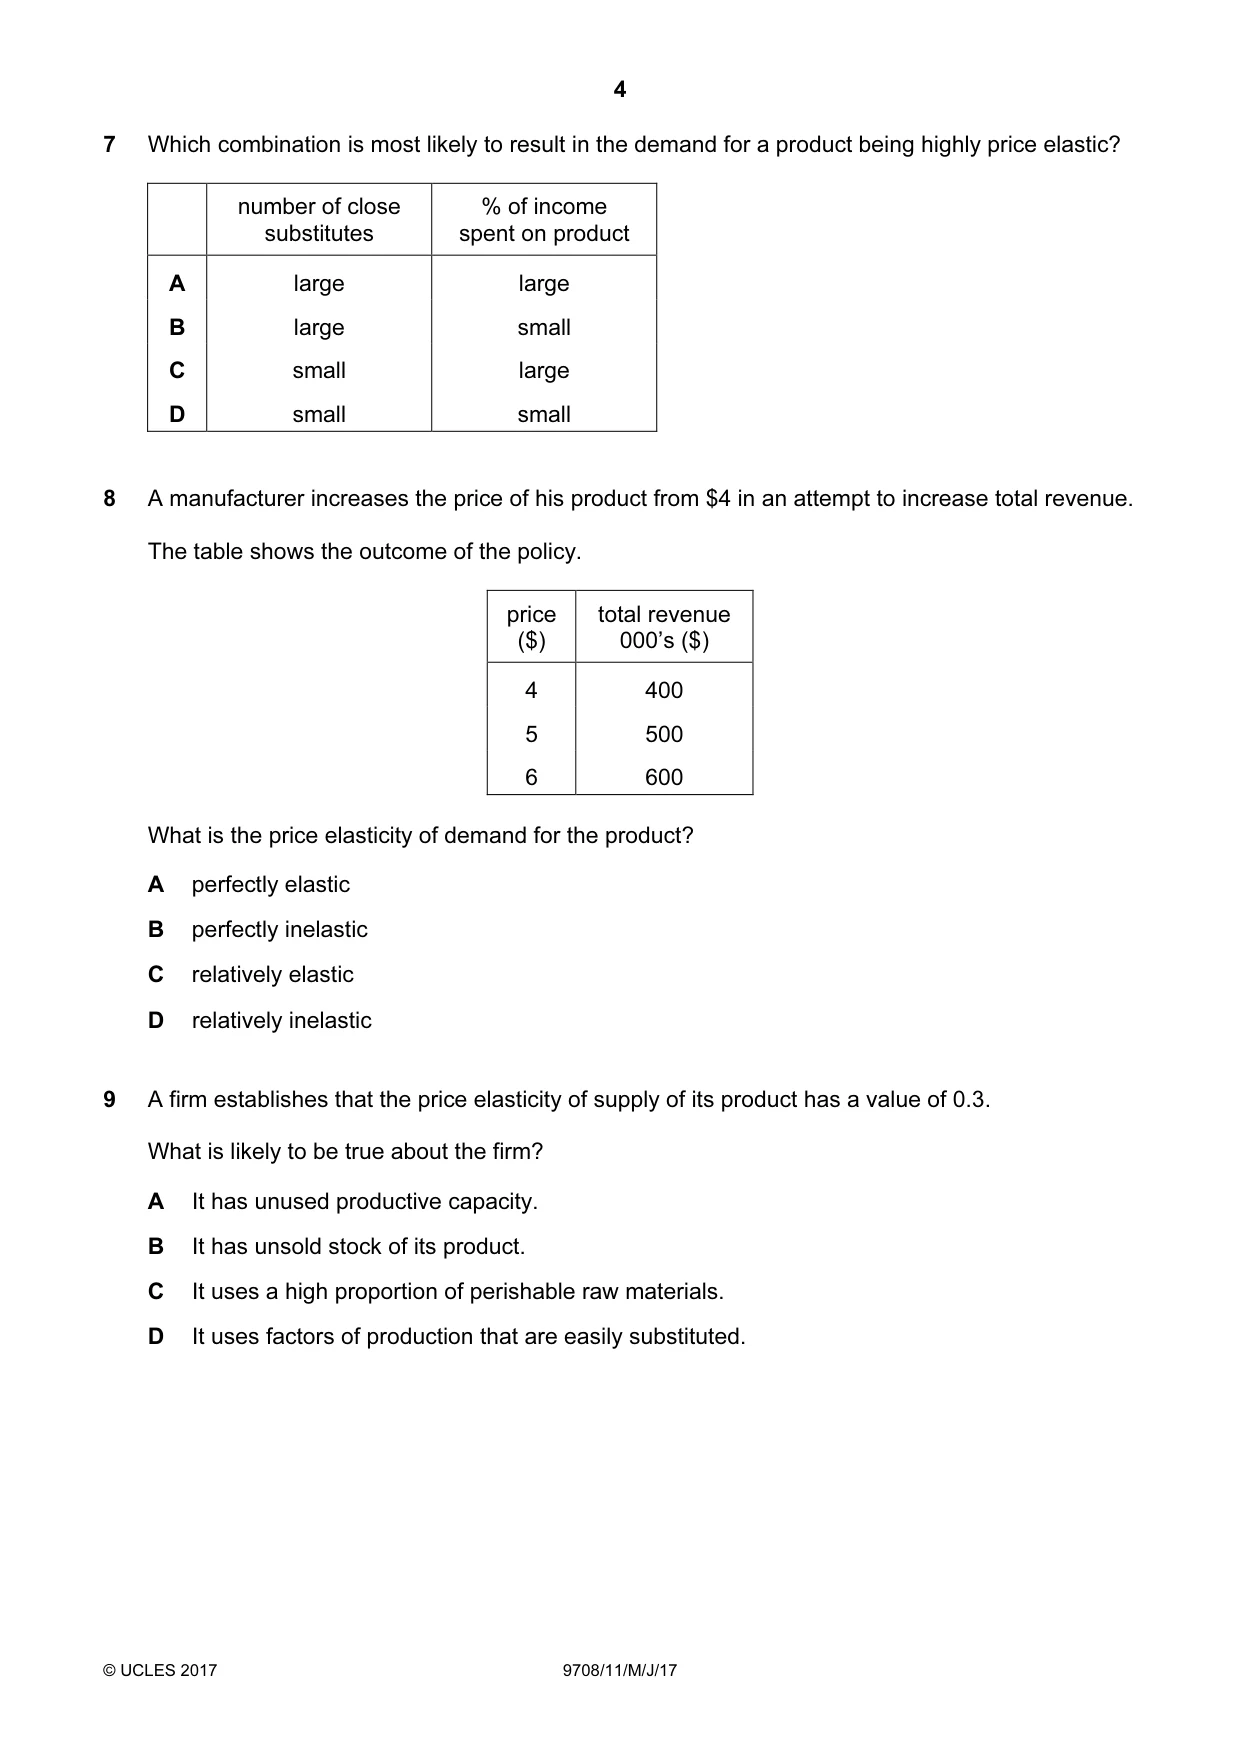
8 A manufacturer increases the price of his product from $4 in an attempt to increase total revenue. The table shows the outcome of the policy. price total revenue ($) 000’s ($) 4 400 5 500 6 600 What is the price elasticity of demand for the product? A perfectly elastic B perfectly inelastic C relatively elastic D relatively inelastic
Mark scheme: B
More questions on Price elasticity, income elasticity and cross elasticity of demand
Q9 · A firm establishes that the price elasticity of supply of its product has a value of 0.3
9 A firm establishes that the price elasticity of supply of its product has a value of 0.3. What is likely to be true about the firm? A It has unused productive capacity. B It has unsold stock of its product. C It uses a high proportion of perishable raw materials. D It uses factors of production that are easily substituted.
Mark scheme: C
Q10 · There is a reduction in world oil supplies due to war in some supplying countries at a…
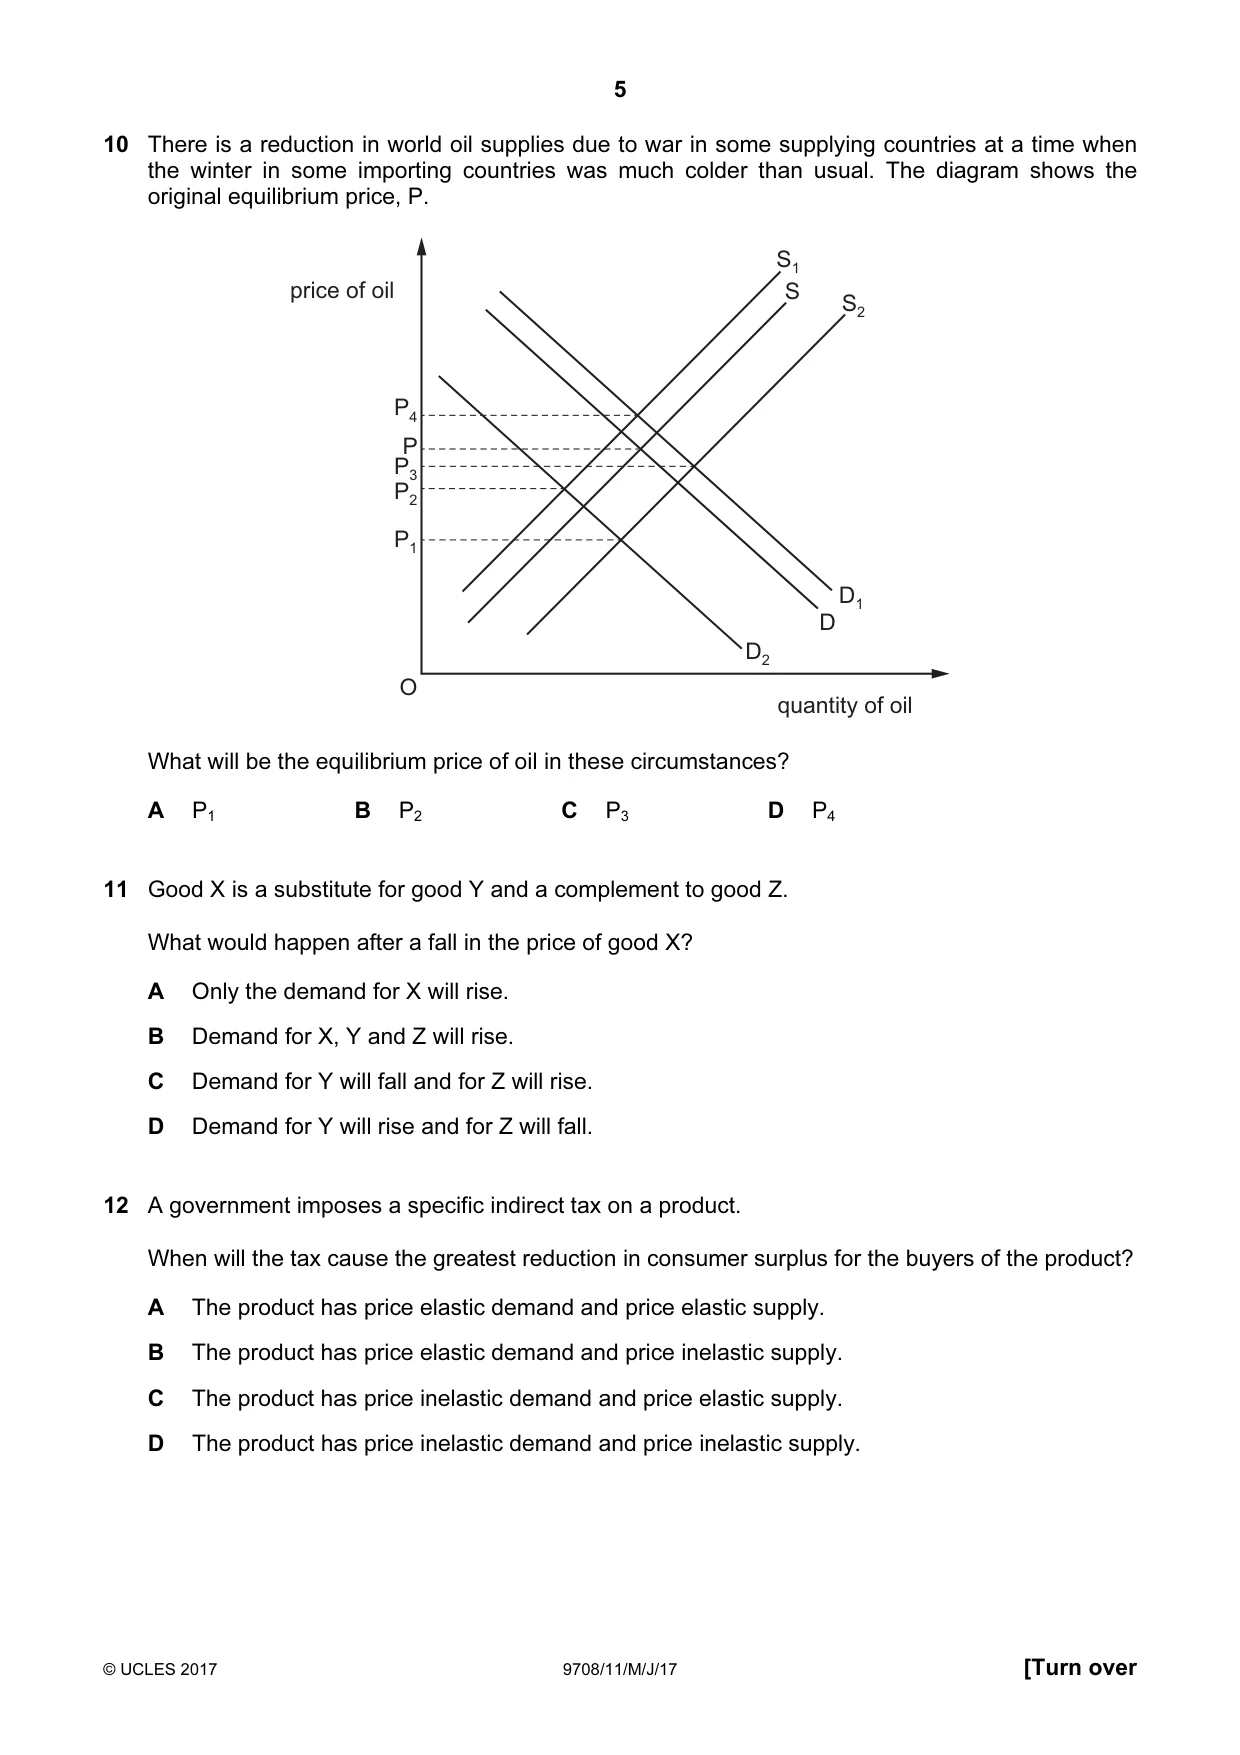
10 There is a reduction in world oil supplies due to war in some supplying countries at a time when the winter in some importing countries was much colder than usual. The diagram shows the original equilibrium price, P. S1 price of oil S S2 P4 P P3 P2 P1 D1 D D2 O quantity of oil What will be the equilibrium price of oil in these circumstances? A P1 B P2 C P3 D P4
Mark scheme: D
Q11 · Good X is a substitute for good Y and a complement to good Z
11 Good X is a substitute for good Y and a complement to good Z. What would happen after a fall in the price of good X? A Only the demand for X will rise. B Demand for X, Y and Z will rise. C Demand for Y will fall and for Z will rise. D Demand for Y will rise and for Z will fall.
Mark scheme: C
Q12 · A government imposes a specific indirect tax on a product
12 A government imposes a specific indirect tax on a product. When will the tax cause the greatest reduction in consumer surplus for the buyers of the product? A The product has price elastic demand and price elastic supply. B The product has price elastic demand and price inelastic supply. C The product has price inelastic demand and price elastic supply. D The product has price inelastic demand and price inelastic supply.
Mark scheme: C
More questions on Methods and effects of government intervention in markets
Q13 · The table shows the maximum amount three students would each be willing to pay for a taxi…
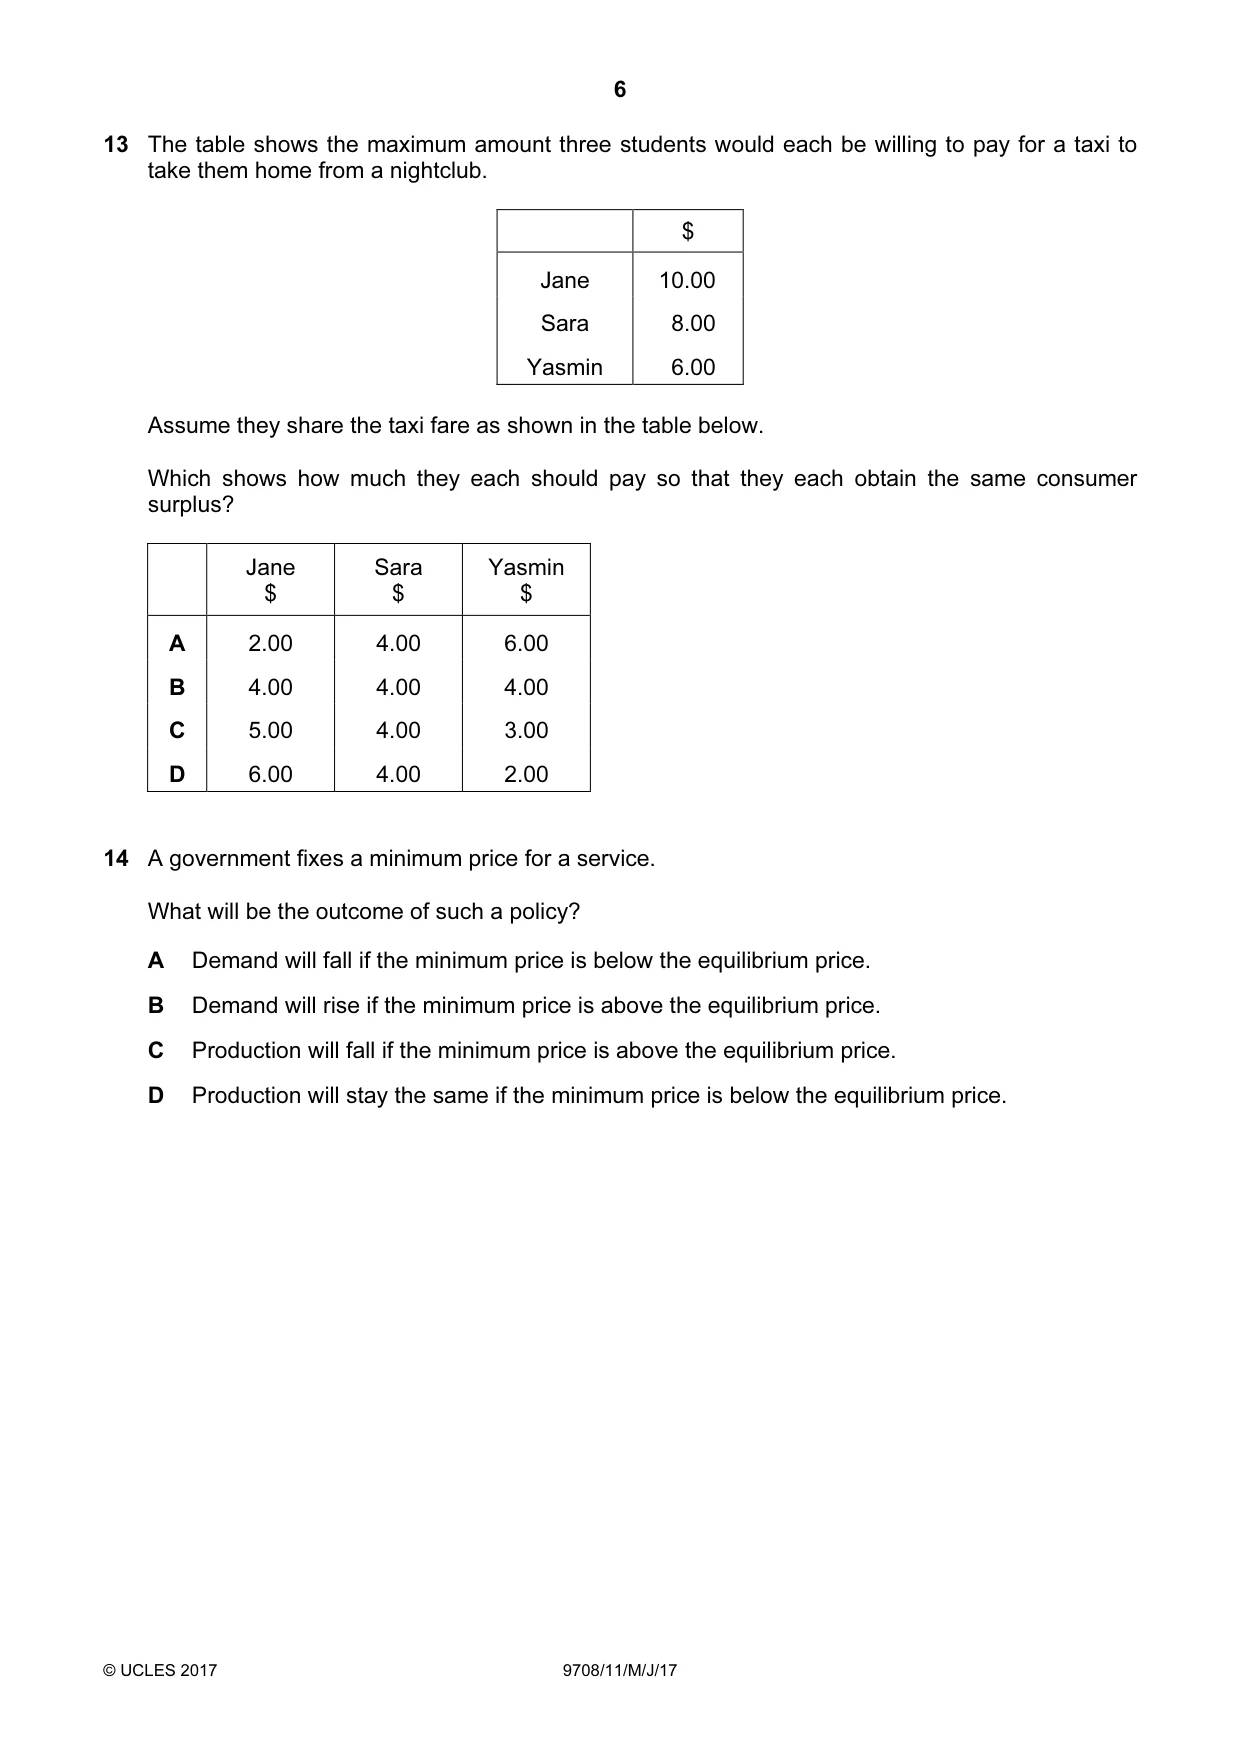
13 The table shows the maximum amount three students would each be willing to pay for a taxi to take them home from a nightclub. $ Jane 10.00 Sara 8.00 Yasmin 6.00 Assume they share the taxi fare as shown in the table below. Which shows how much they each should pay so that they each obtain the same consumer surplus? Jane Sara Yasmin $ $ $ A 2.00 4.00 6.00 B 4.00 4.00 4.00 C 5.00 4.00 3.00 D 6.00 4.00 2.00
Mark scheme: D
Q14 · A government fixes a minimum price for a service
14 A government fixes a minimum price for a service. What will be the outcome of such a policy? A Demand will fall if the minimum price is below the equilibrium price. B Demand will rise if the minimum price is above the equilibrium price. C Production will fall if the minimum price is above the equilibrium price. D Production will stay the same if the minimum price is below the equilibrium price.
Mark scheme: D
More questions on Methods and effects of government intervention in markets
Q15 · The diagram illustrates the effects of placing a specific tax equal to JM on a good
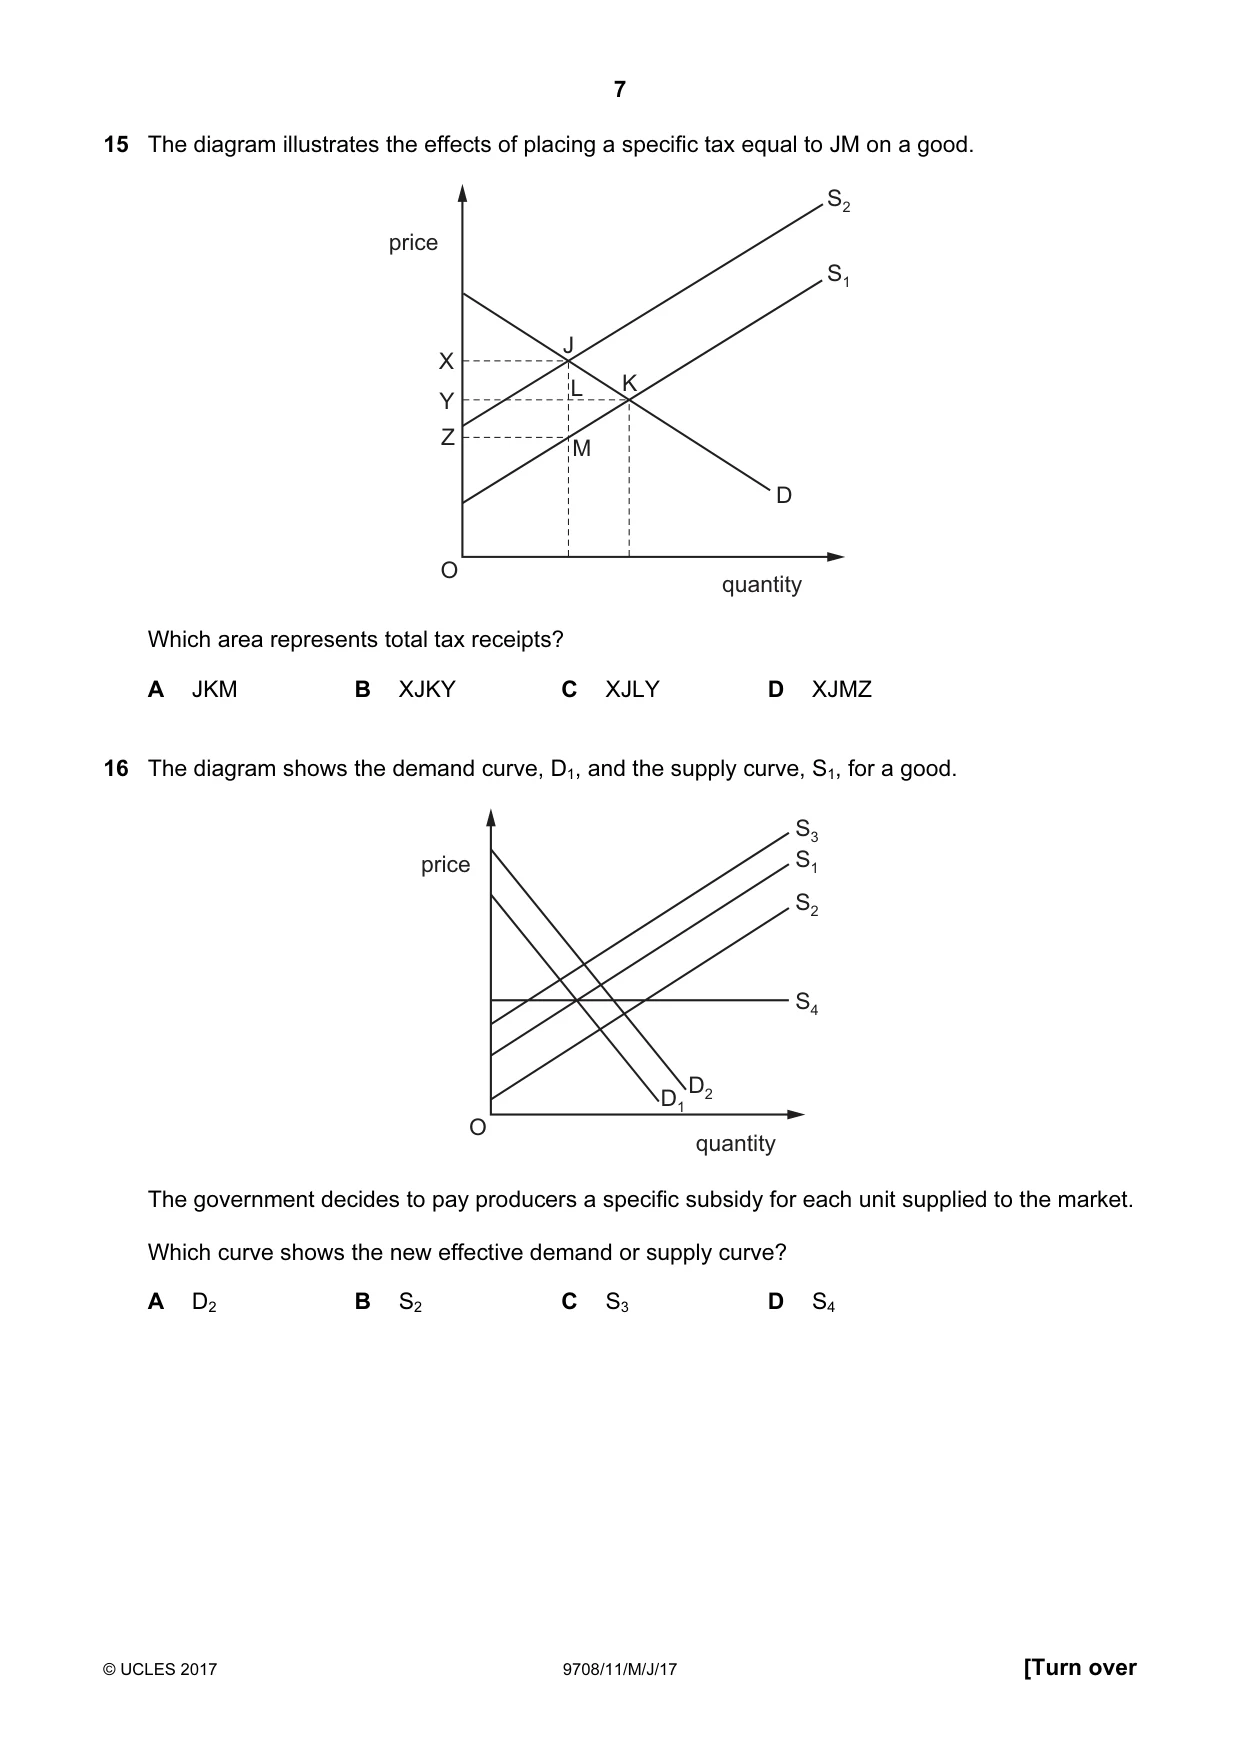
15 The diagram illustrates the effects of placing a specific tax equal to JM on a good. S2 price S1 J X L K Y Z M D O quantity Which area represents total tax receipts? A JKM B XJKY C XJLY D XJMZ
Mark scheme: D
More questions on Methods and effects of government intervention in markets
Q16 · The diagram shows the demand curve, D1, and the supply curve, S1, for a good
16 The diagram shows the demand curve, D1, and the supply curve, S1, for a good. S3 price S1 S2 S4 D2 D1 O quantity The government decides to pay producers a specific subsidy for each unit supplied to the market. Which curve shows the new effective demand or supply curve? A D2 B S2 C S3 D S4
Mark scheme: B
More questions on Methods and effects of government intervention in markets
Q17 · Planned government expenditure for the UK in the fiscal year 2016 is estimated at £760…
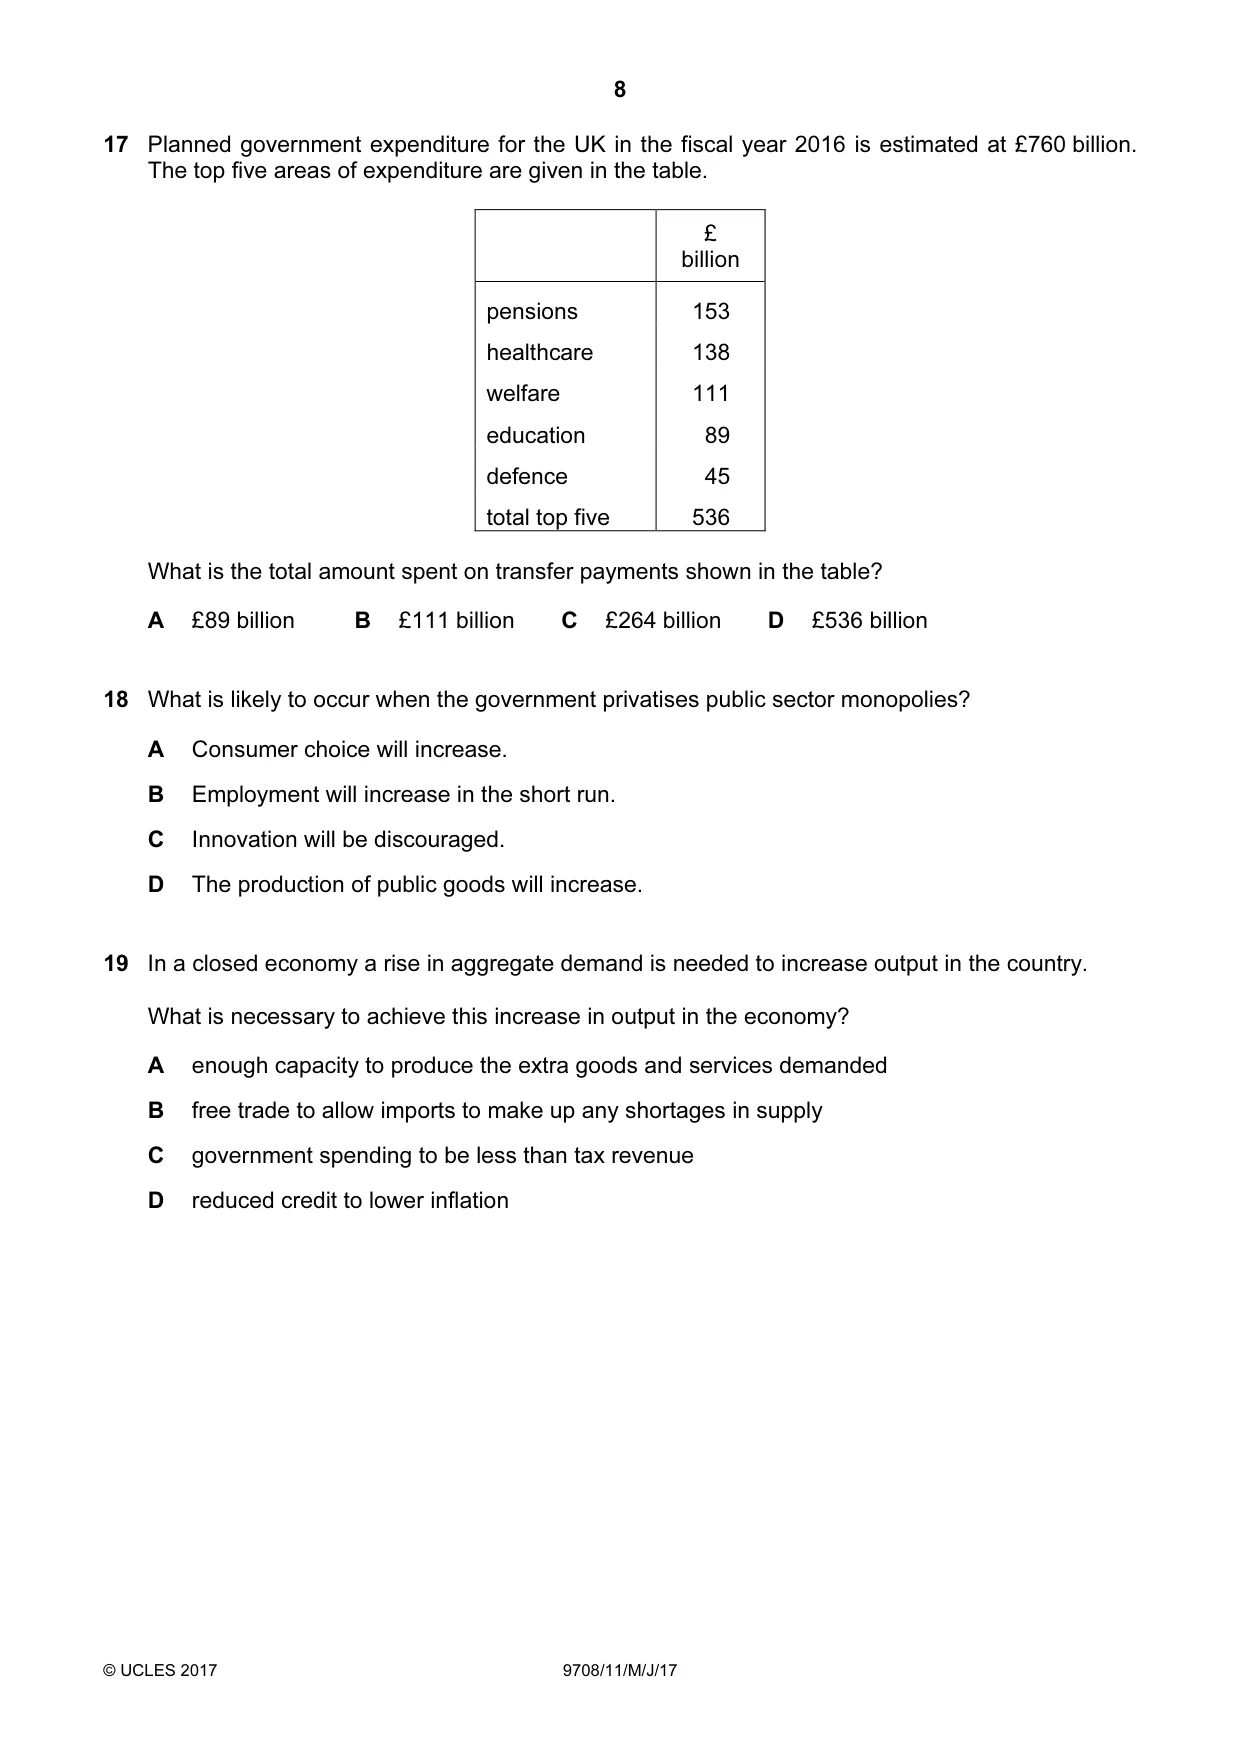
17 Planned government expenditure for the UK in the fiscal year 2016 is estimated at £760 billion. The top five areas of expenditure are given in the table. £ billion pensions 153 healthcare 138 welfare 111 education 89 defence 45 total top five 536 What is the total amount spent on transfer payments shown in the table? A £89 billion B £111 billion C £264 billion D £536 billion
Mark scheme: C
Q18 · What is likely to occur when the government privatises public sector monopolies?
18 What is likely to occur when the government privatises public sector monopolies? A Consumer choice will increase. B Employment will increase in the short run. C Innovation will be discouraged. D The production of public goods will increase.
Mark scheme: A
More questions on Methods and effects of government intervention in markets
Q19 · In a closed economy a rise in aggregate demand is needed to increase output in the country
19 In a closed economy a rise in aggregate demand is needed to increase output in the country. What is necessary to achieve this increase in output in the economy? A enough capacity to produce the extra goods and services demanded B free trade to allow imports to make up any shortages in supply C government spending to be less than tax revenue D reduced credit to lower inflation
Mark scheme: A
More questions on Aggregate Demand and Aggregate Supply analysis
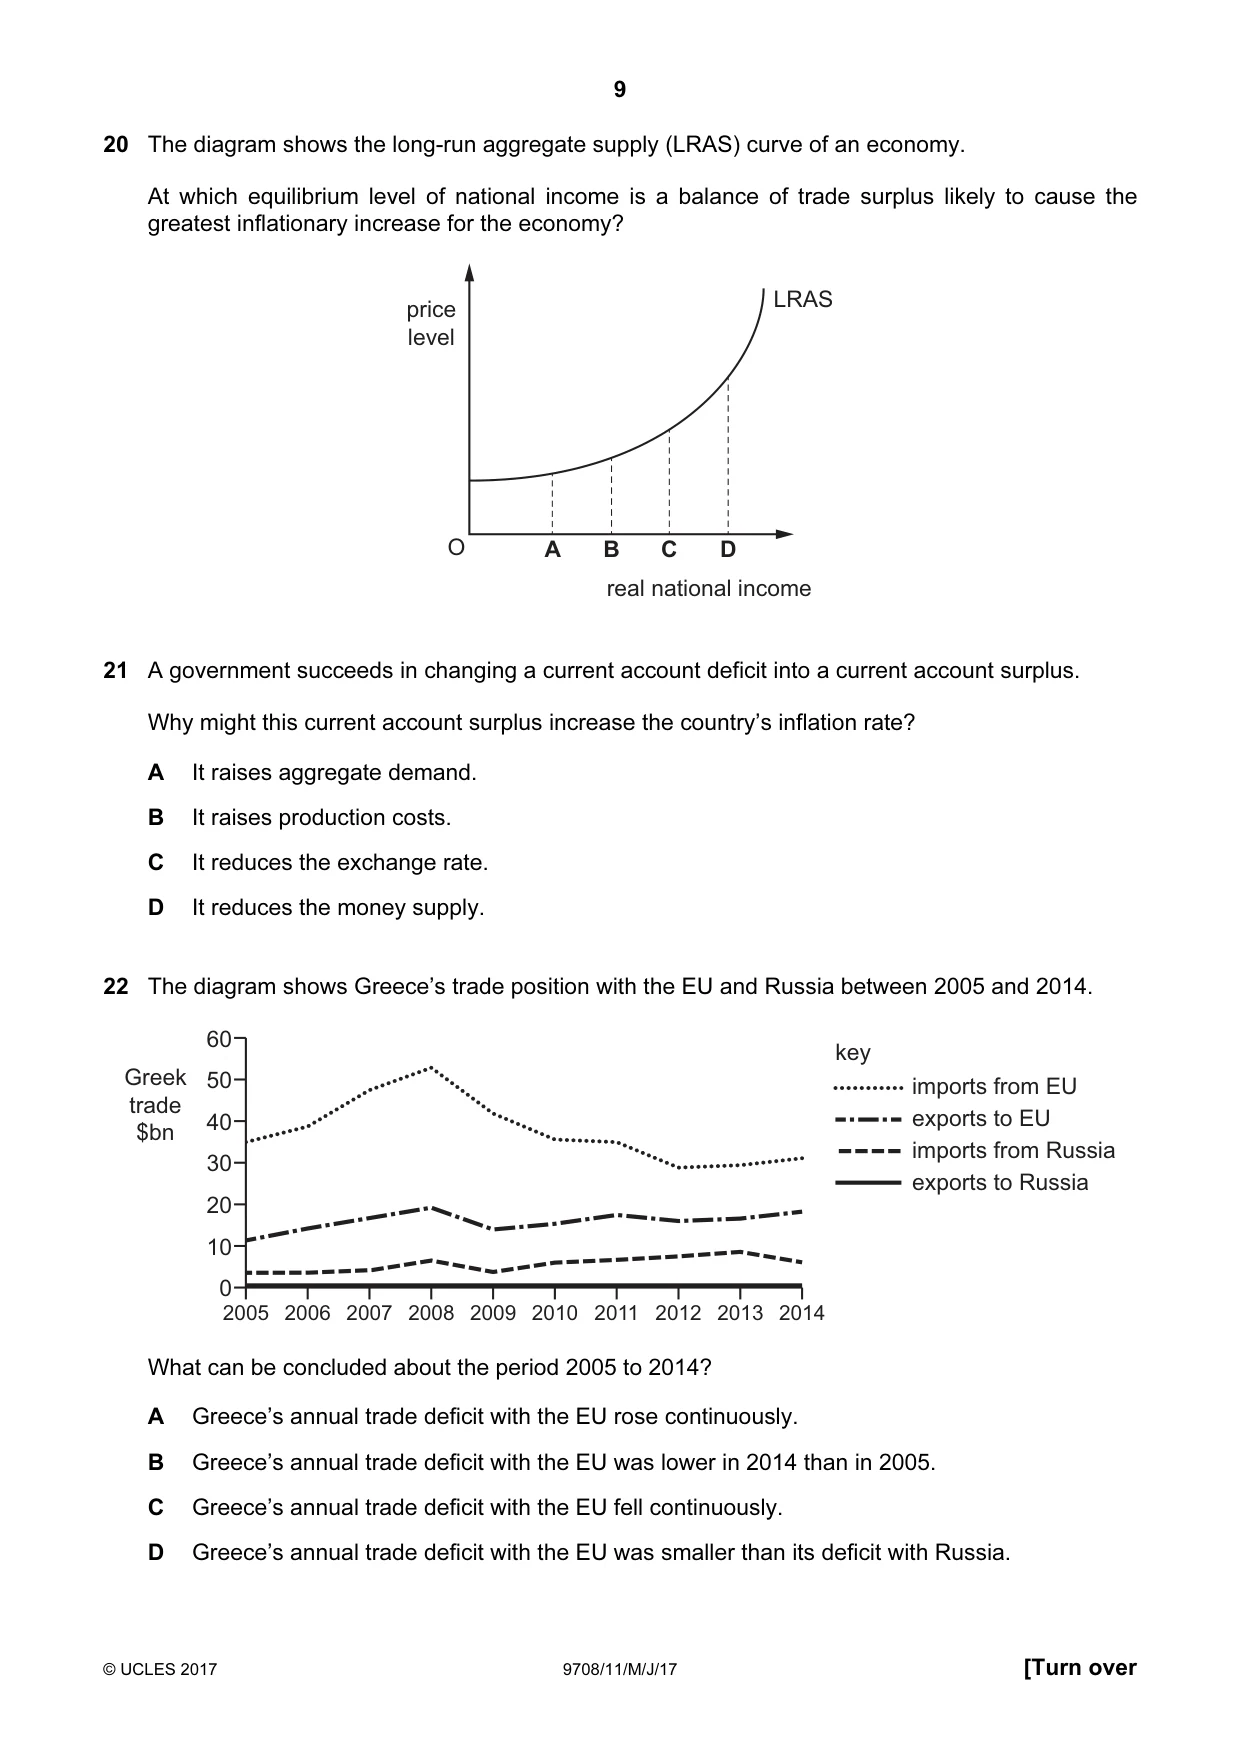
Q20 · The diagram shows the long-run aggregate supply (LRAS) curve of an economy
20 The diagram shows the long-run aggregate supply (LRAS) curve of an economy. At which equilibrium level of national income is a balance of trade surplus likely to cause the greatest inflationary increase for the economy? price LRAS level O A B C D real national income
Mark scheme: D
More questions on Aggregate Demand and Aggregate Supply analysis
Q21 · A government succeeds in changing a current account deficit into a current account surplus
21 A government succeeds in changing a current account deficit into a current account surplus. Why might this current account surplus increase the country’s inflation rate? A It raises aggregate demand. B It raises production costs. C It reduces the exchange rate. D It reduces the money supply.
Mark scheme: A
More questions on Current account of the balance of payments
Q22 · The diagram shows Greece’s trade position with the EU and Russia between 2005 and 2014
22 The diagram shows Greece’s trade position with the EU and Russia between 2005 and 2014. 60 key Greek 50 imports from EU trade 40 exports to EU $bn imports from Russia 30 exports to Russia 20 10 0 2005 2006 2007 2008 2009 2010 2011 2012 2013 2014 What can be concluded about the period 2005 to 2014? A Greece’s annual trade deficit with the EU rose continuously. B Greece’s annual trade deficit with the EU was lower in 2014 than in 2005. C Greece’s annual trade deficit with the EU fell continuously. D Greece’s annual trade deficit with the EU was smaller than its deficit with Russia.
Mark scheme: B
More questions on Current account of the balance of payments
Q23 · There is a rise in the exchange rate of the US$
23 There is a rise in the exchange rate of the US$. Which would cause the greatest increase in the US current account deficit? A a high level of domestic unemployment B a high price elasticity of demand for imports C a low price elasticity of demand for exports D a low rate of domestic inflation
Mark scheme: B
Q24 · Since 2000 a country’s export prices have increased on average by 50% and its import…
24 Since 2000 a country’s export prices have increased on average by 50% and its import prices by 25%. What is the current figure for the country’s terms of trade (2000 = 100)? A 75 B 83 C 120 D 125
Mark scheme: C
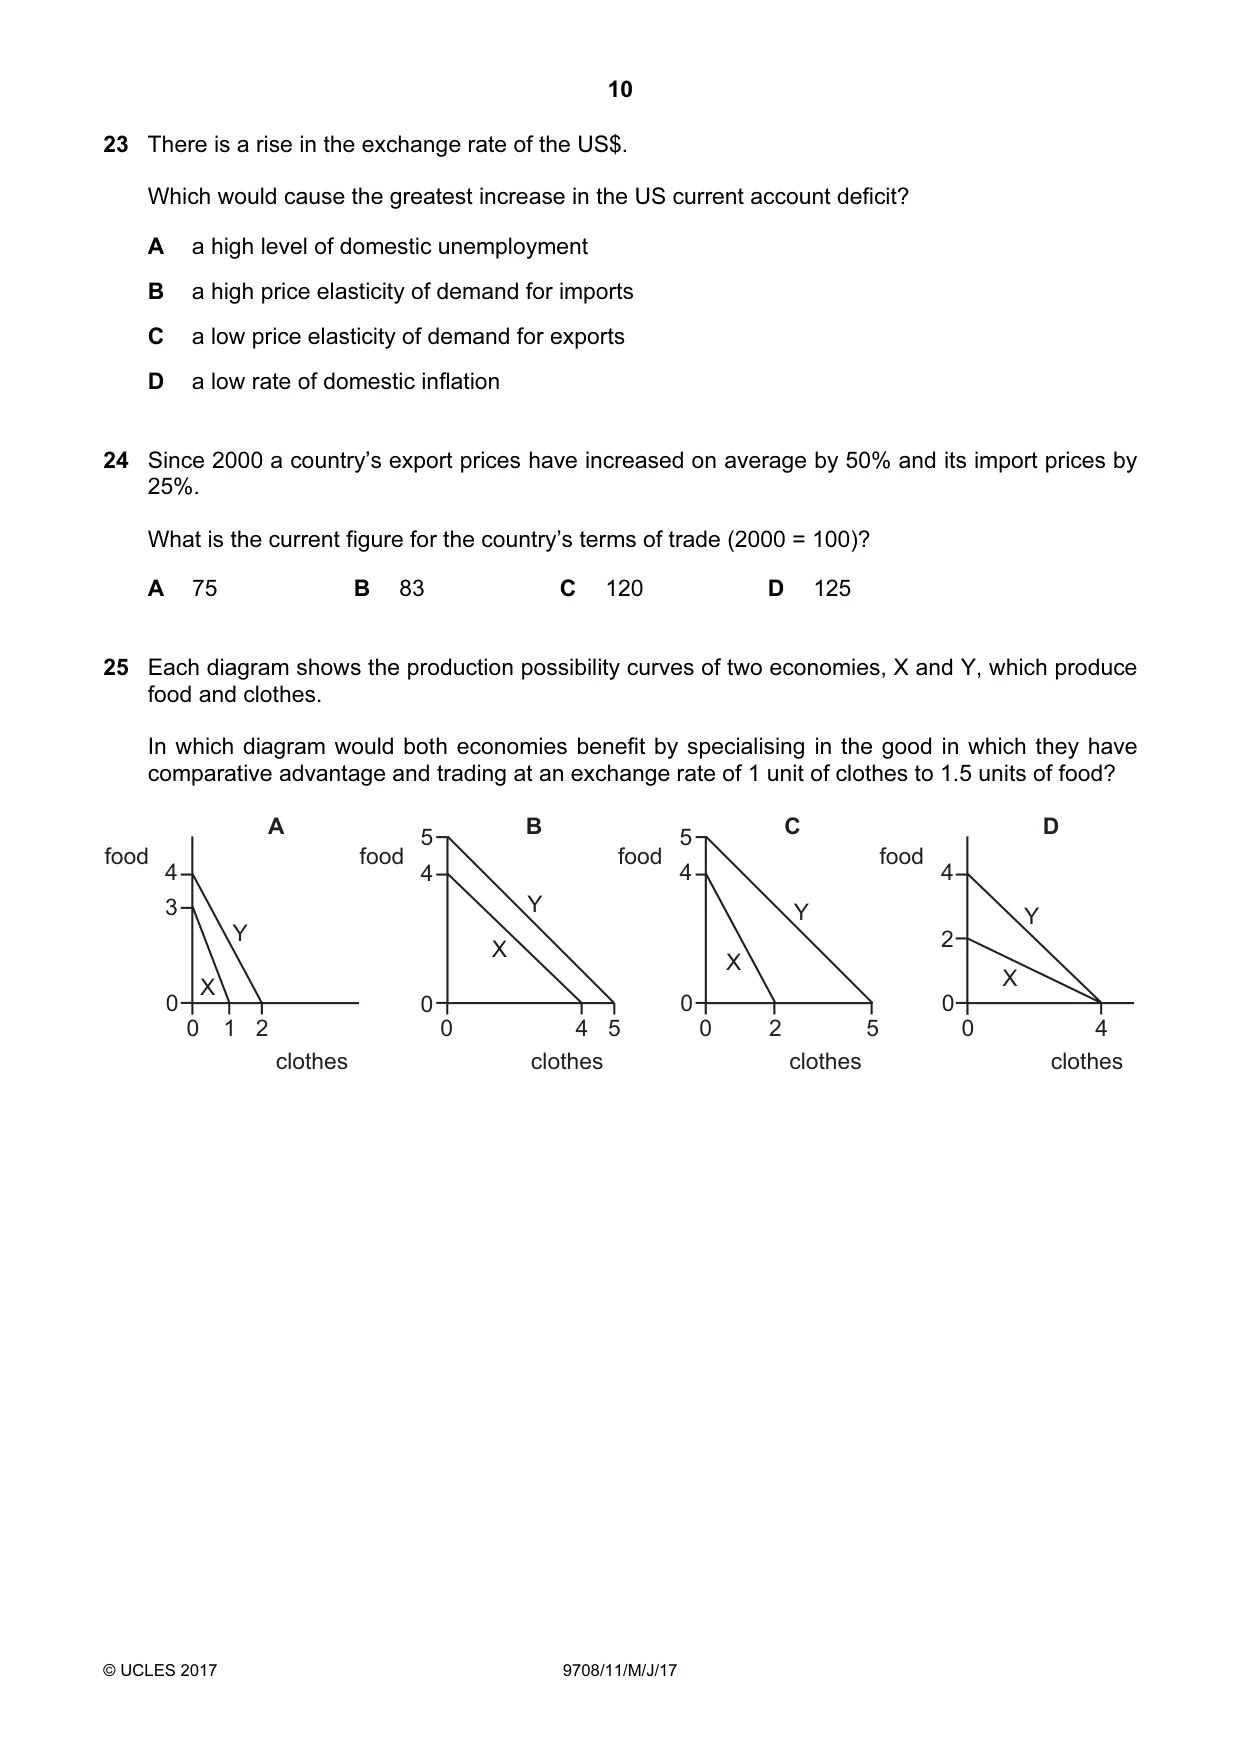
Q25 · Each diagram shows the production possibility curves of two economies, X and Y, which…
25 Each diagram shows the production possibility curves of two economies, X and Y, which produce food and clothes. In which diagram would both economies benefit by specialising in the good in which they have comparative advantage and trading at an exchange rate of 1 unit of clothes to 1.5 units of food? A B C D 5 5 food food food food 4 4 4 4 3 Y Y Y Y 2 X X X X 0 0 0 0 0 1 2 0 4 5 0 2 5 0 4 clothes clothes clothes clothes
Mark scheme: C
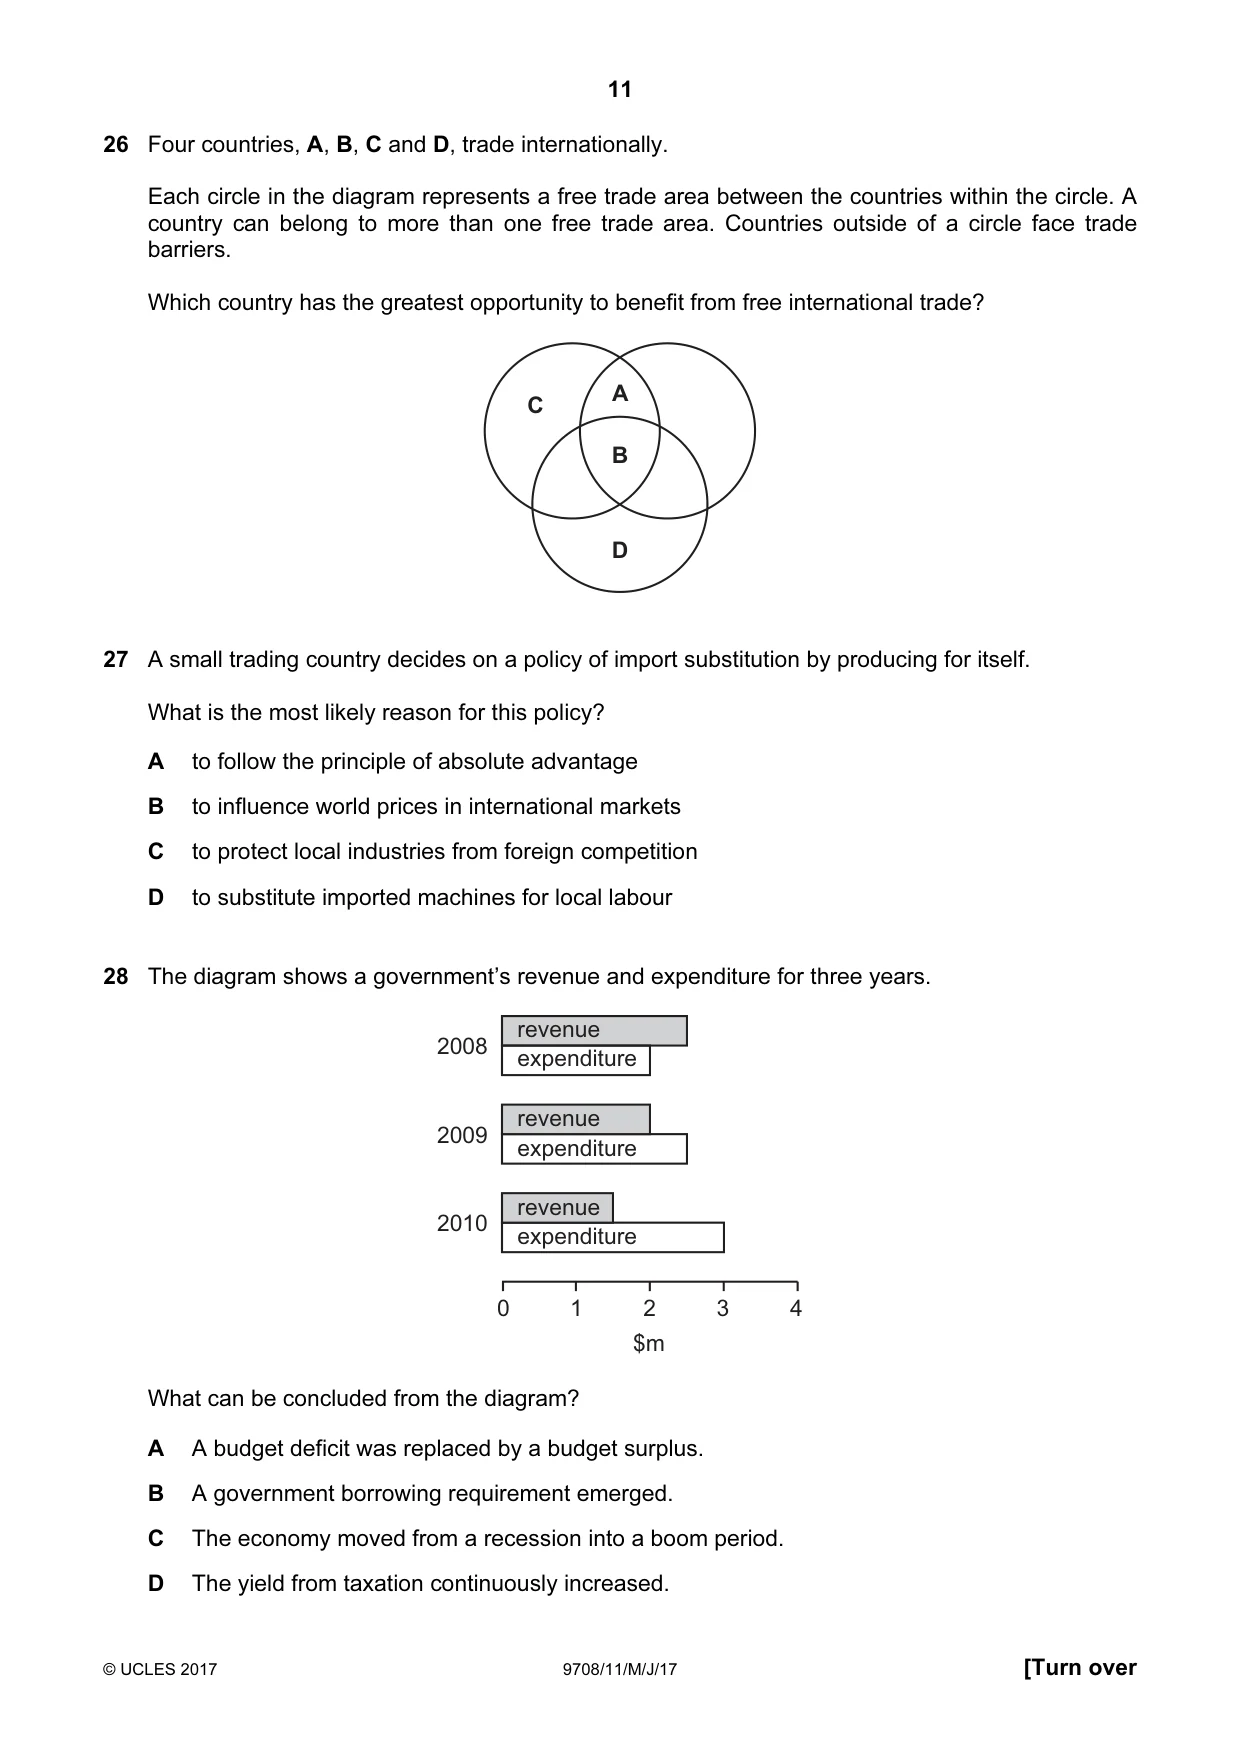
Q26 · Four countries, A, B, C and D, trade internationally
26 Four countries, A, B, C and D, trade internationally. Each circle in the diagram represents a free trade area between the countries within the circle. A country can belong to more than one free trade area. Countries outside of a circle face trade barriers. Which country has the greatest opportunity to benefit from free international trade? A C B D
Mark scheme: B
Q27 · A small trading country decides on a policy of import substitution by producing for itself
27 A small trading country decides on a policy of import substitution by producing for itself. What is the most likely reason for this policy? A to follow the principle of absolute advantage B to influence world prices in international markets C to protect local industries from foreign competition D to substitute imported machines for local labour
Mark scheme: C
Q28 · The diagram shows a government’s revenue and expenditure for three years
28 The diagram shows a government’s revenue and expenditure for three years. revenue 2008 expenditure revenue 2009 expenditure revenue 2010 expenditure 0 1 2 3 4 $m What can be concluded from the diagram? A A budget deficit was replaced by a budget surplus. B A government borrowing requirement emerged. C The economy moved from a recession into a boom period. D The yield from taxation continuously increased.
Mark scheme: B
Q29 · A country with a fixed exchange rate has a current account surplus on its balance of…
29 A country with a fixed exchange rate has a current account surplus on its balance of payments. What is most likely to reduce this surplus? A higher interest rates B higher investment spending C higher tariffs D higher taxes
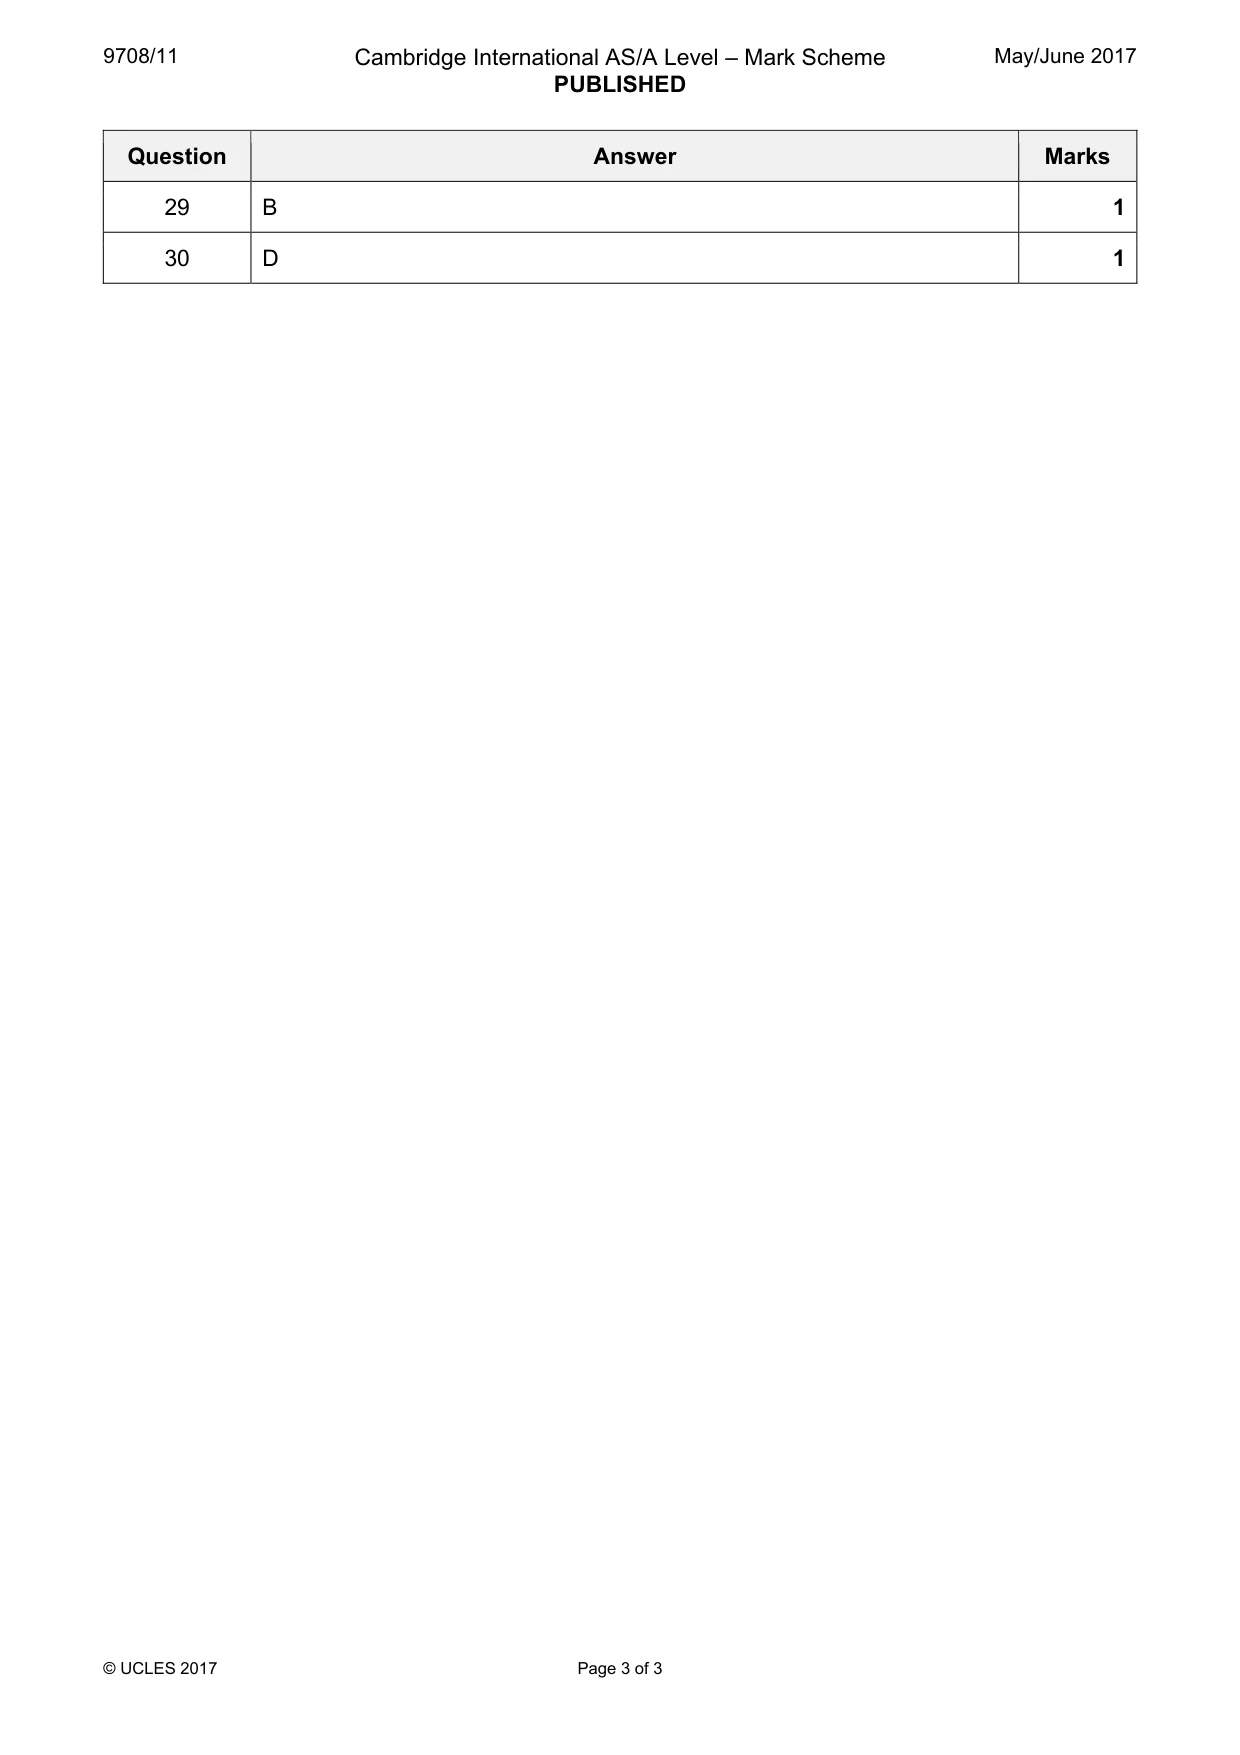
Mark scheme: B
More questions on Policies to correct imbalances in the current account of the balance of payments
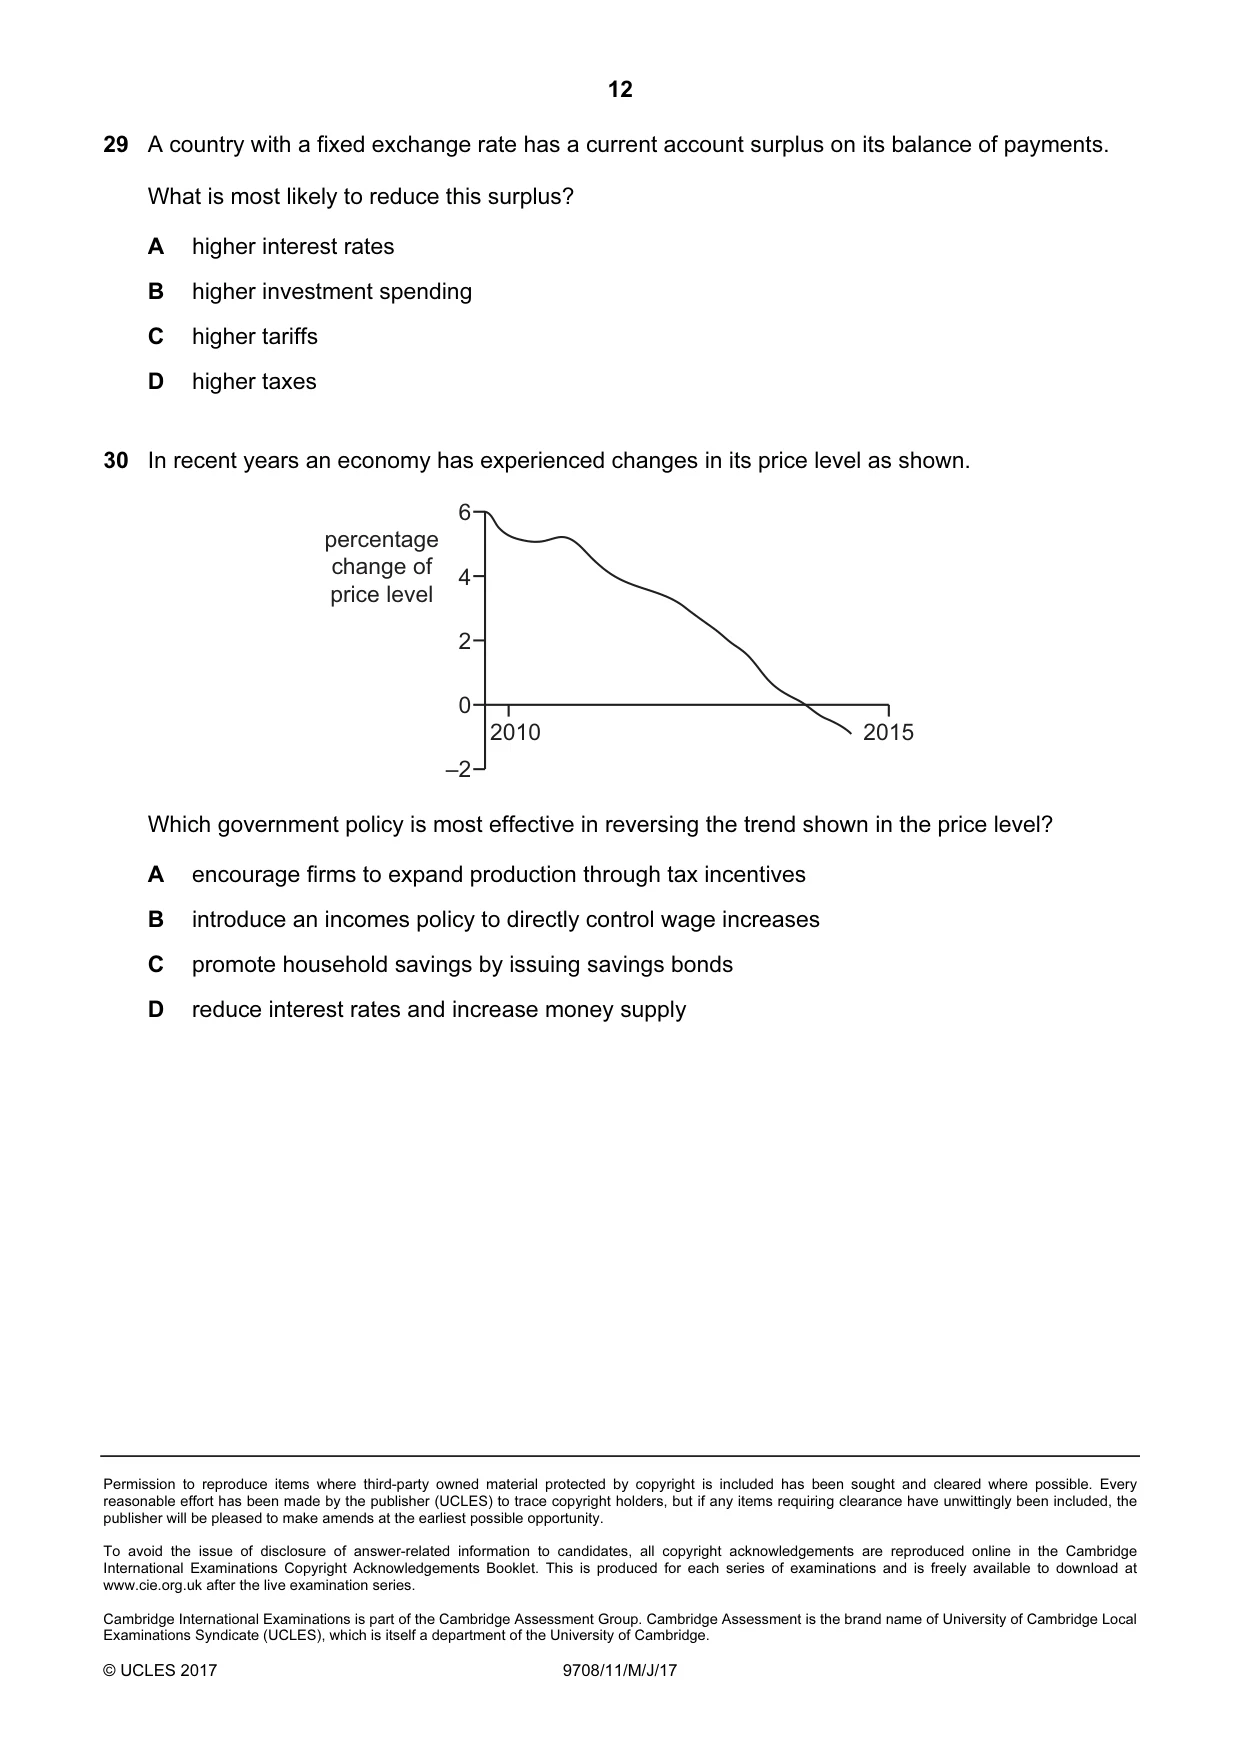
Q30 · In recent years an economy has experienced changes in its price level as shown
30 In recent years an economy has experienced changes in its price level as shown. 6 percentage change of 4 price level 2 0 2010 2015 –2 Which government policy is most effective in reversing the trend shown in the price level? A encourage firms to expand production through tax incentives B introduce an incomes policy to directly control wage increases C promote household savings by issuing savings bonds D reduce interest rates and increase money supply
Mark scheme: D
What was in this paper
The subtopics covered by these 30 questions, and how many questions each got. Open one in a new tab to see every Cambridge question on it.
5Demand and supply curves3Aggregate Demand and Aggregate Supply analysis2Current account of the balance of payments2Price elasticity, income elasticity and cross elasticity of demand2Protectionism2The reasons for international trade2Classification of goods and services1Consumer and producer surplus1Exchange rates1Fiscal policy1Monetary policy1National income statistics1Policies to correct imbalances in the current account of the balance of payments1Price elasticity of supply1Production possibility curves1Resource allocation in different economic systems1Scarcity, choice and opportunity cost1The interaction of demand and supply1What you needed in this session
Cambridge’s own grade thresholds for 2017 May/June, Paper 1 · Variant 1. A higher threshold means an easier paper — the bar moves with how the cohort did.