Cambridge A Level Economics 9708 — 2022 Feb/March Paper 1 · Variant 2
9708/12/F/M/22 · 30 questions · 30 marks · ≈34 min
The question paper and its mark scheme, free to read here and free to download. This is Cambridge’s own paper, exactly as it was sat.
Question paper12 pages
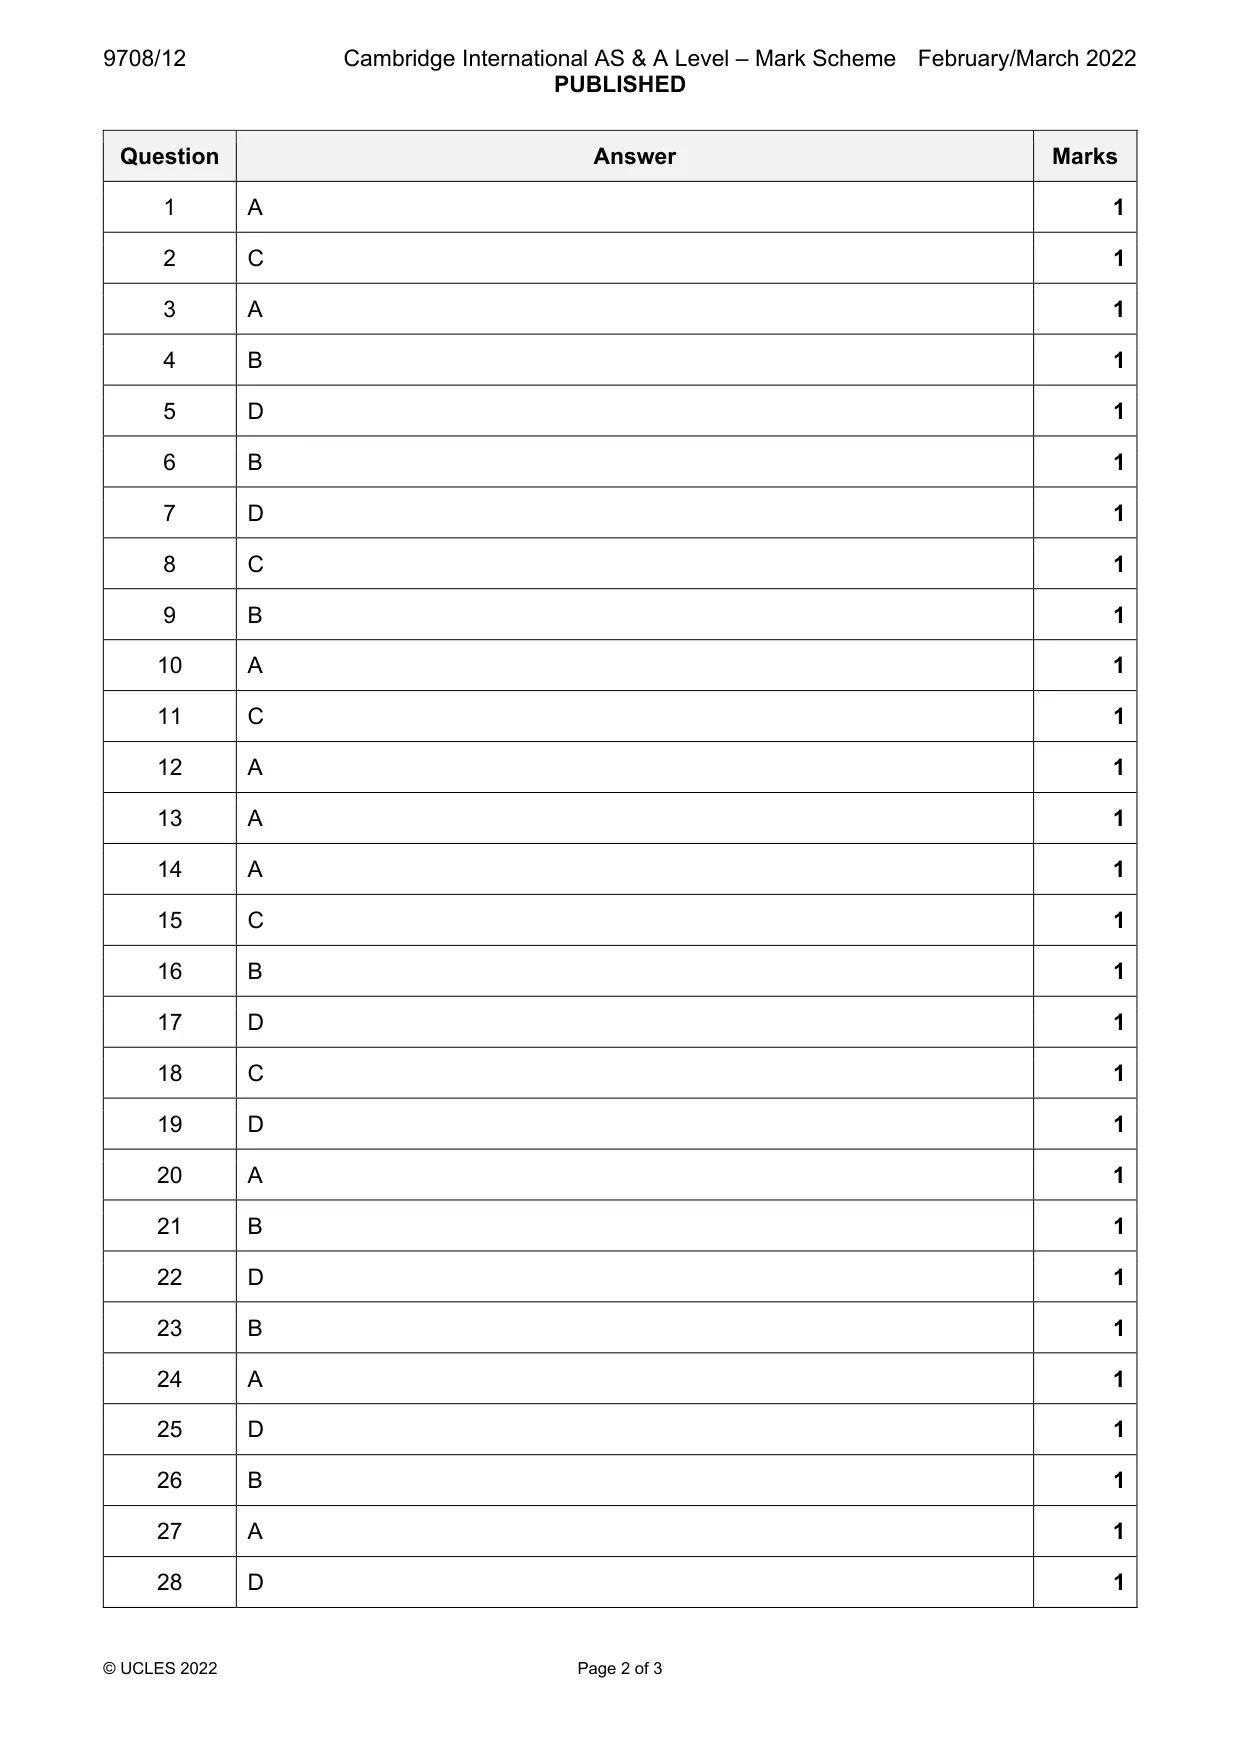
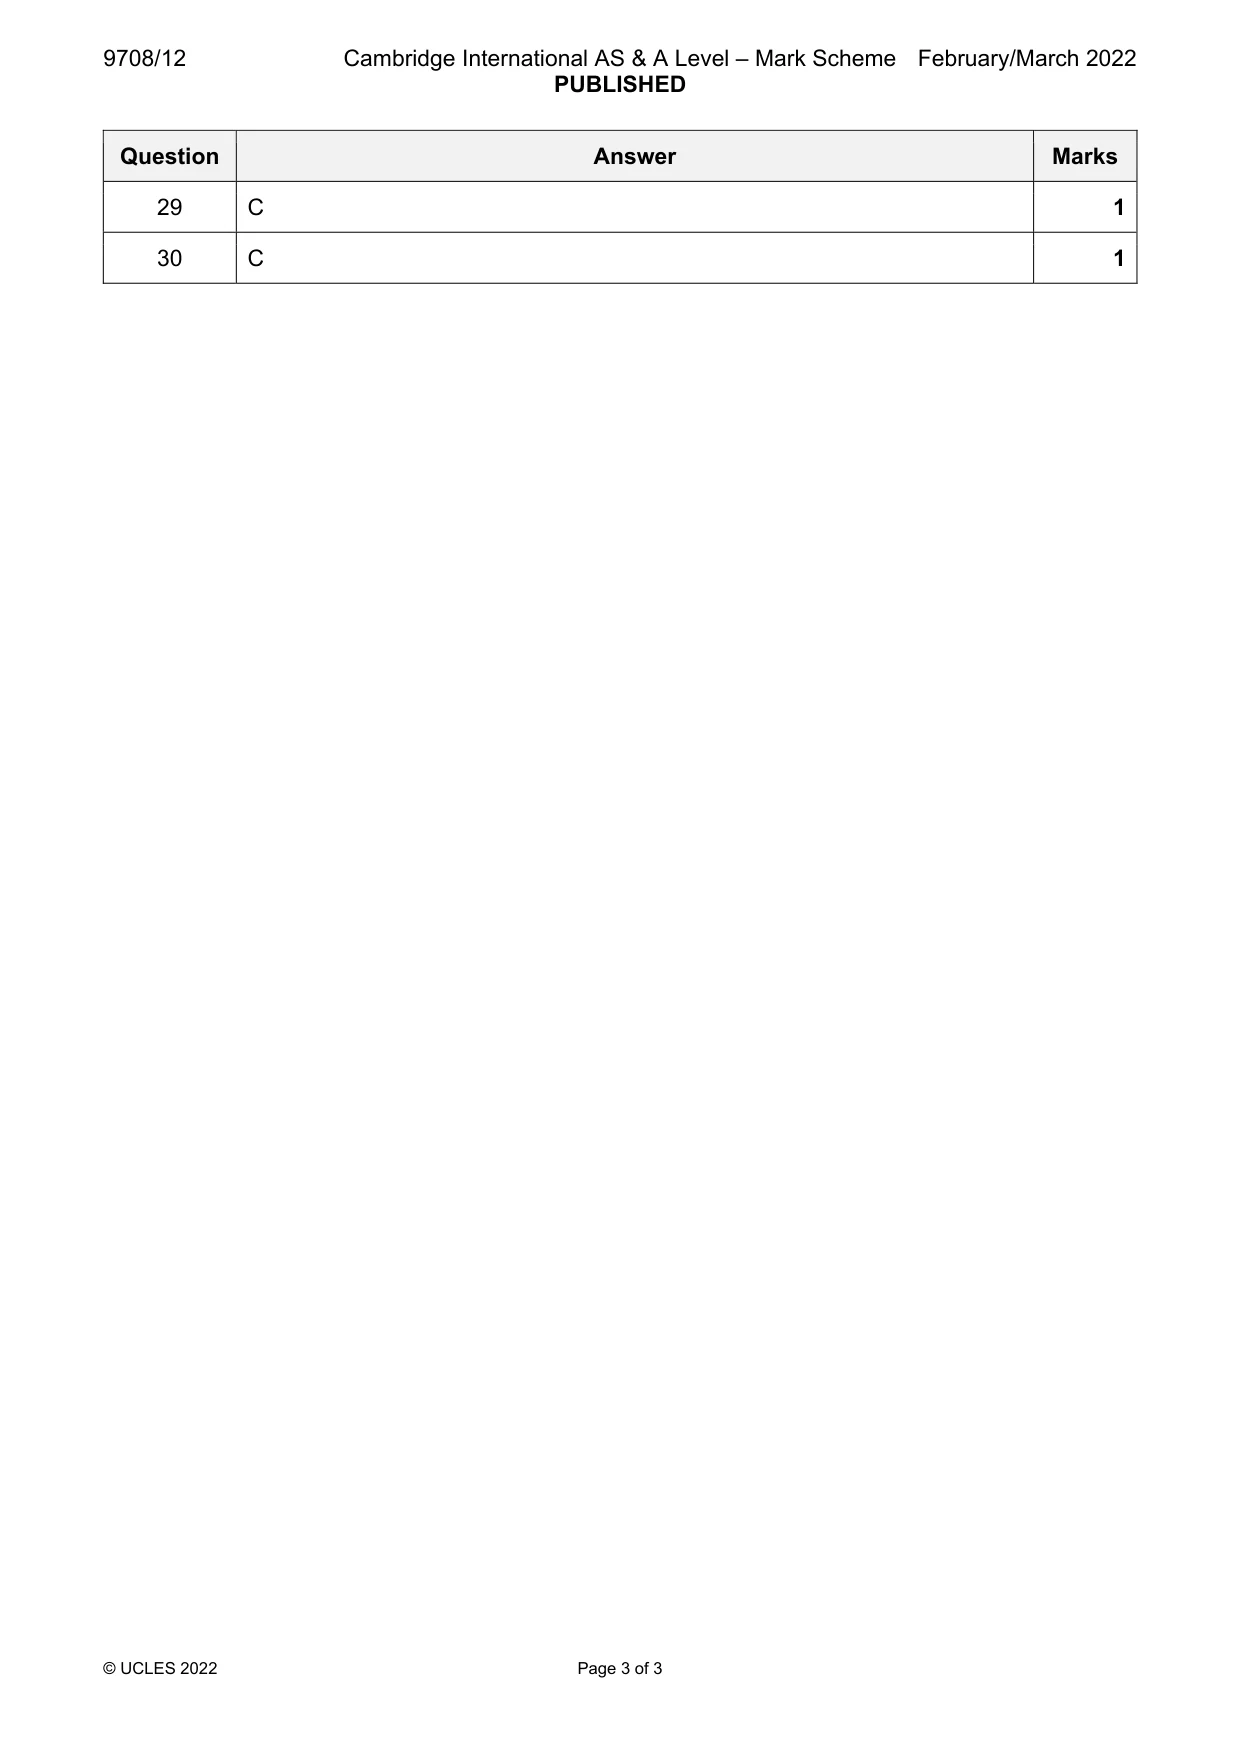
Mark scheme3 pages
Answers below. Sit the paper first if you are practising.
Questions as text
Q1 · A production possibility curve shows the combinations of outputs an economy can produce…
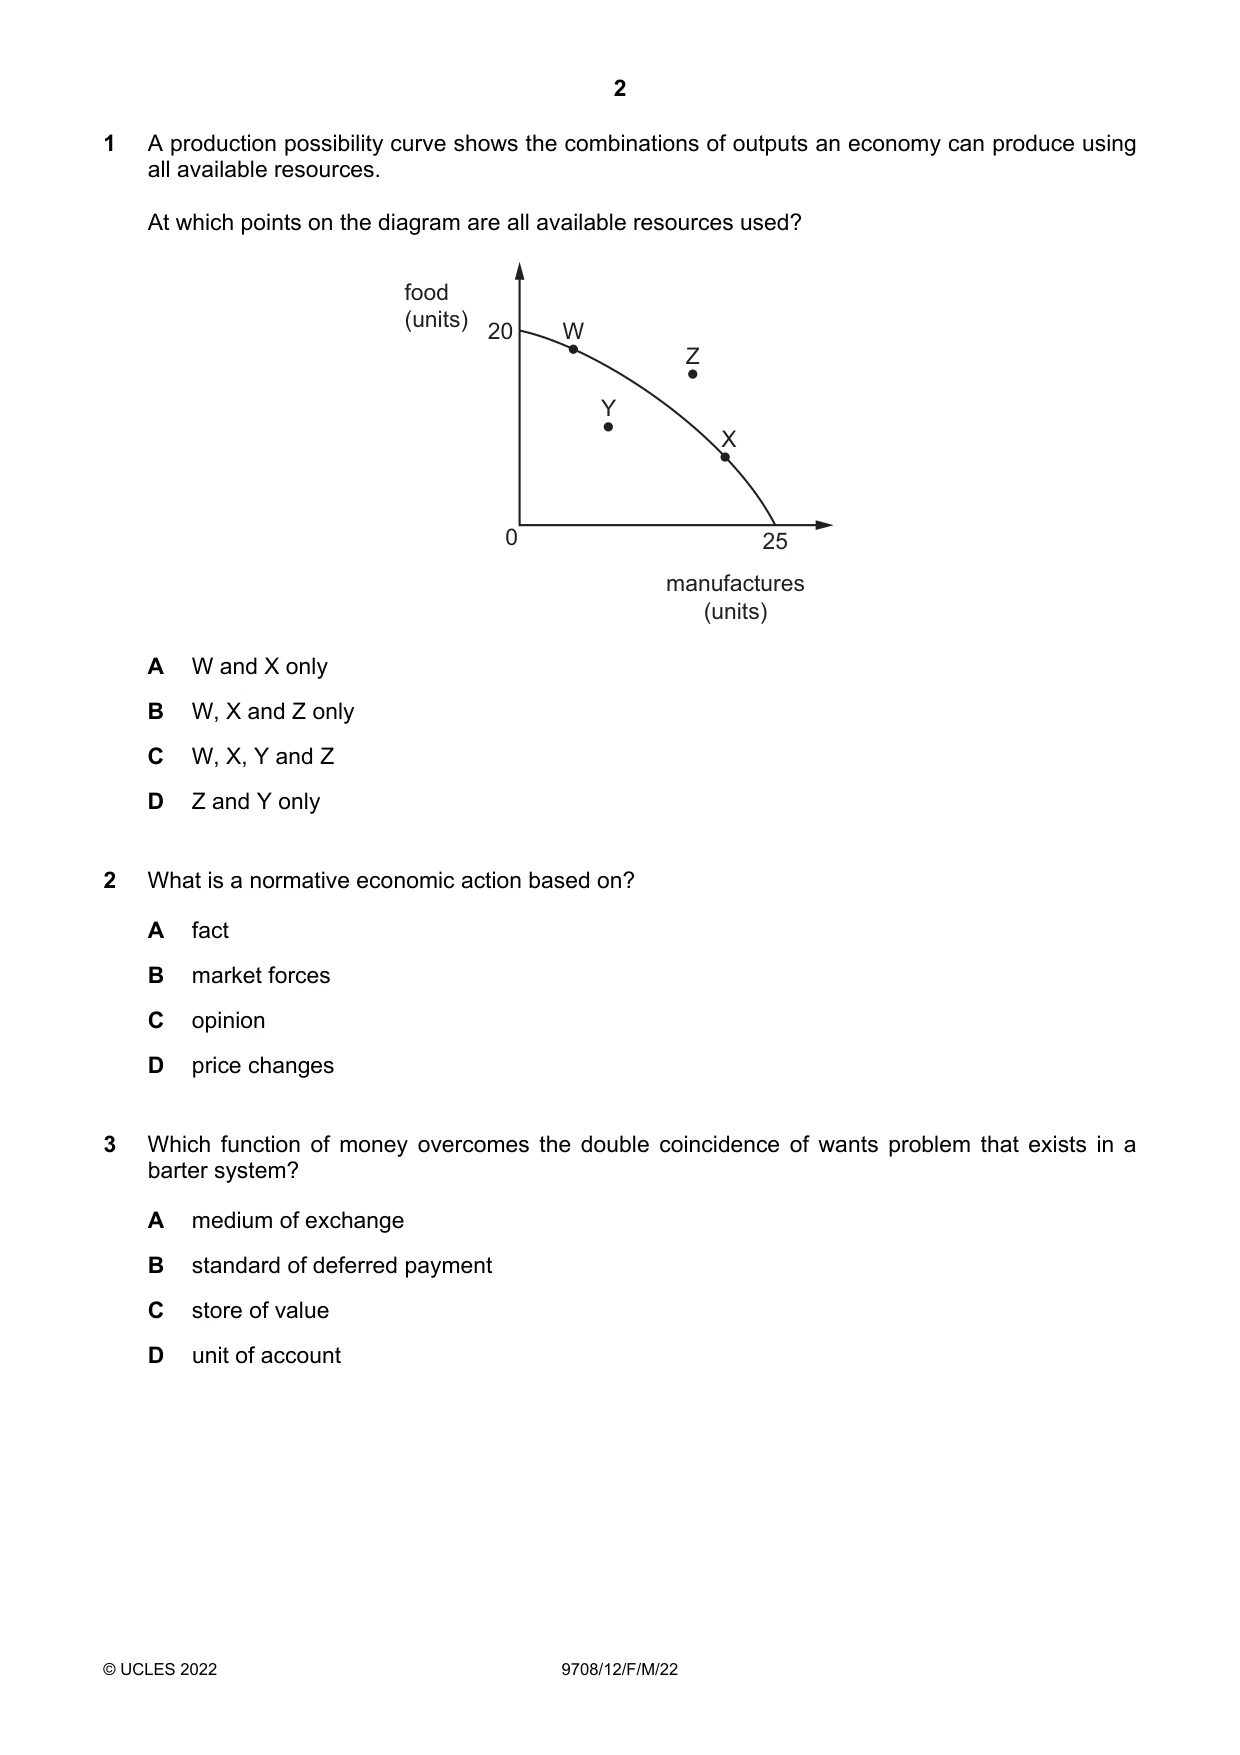
1 A production possibility curve shows the combinations of outputs an economy can produce using all available resources. At which points on the diagram are all available resources used? food (units) 20 W Z Y X 0 25 manufactures (units) A W and X only B W, X and Z only C W, X, Y and Z D Z and Y only
Mark scheme: A
Q2 · What is a normative economic action based on?
2 What is a normative economic action based on? A fact B market forces C opinion D price changes
Mark scheme: C
Q3 · Which function of money overcomes the double coincidence of wants problem that exists in…
3 Which function of money overcomes the double coincidence of wants problem that exists in a barter system? A medium of exchange B standard of deferred payment C store of value D unit of account
Mark scheme: A
Q4 · The production possibility curves (PPCs) show the abilities of four economies to produce…
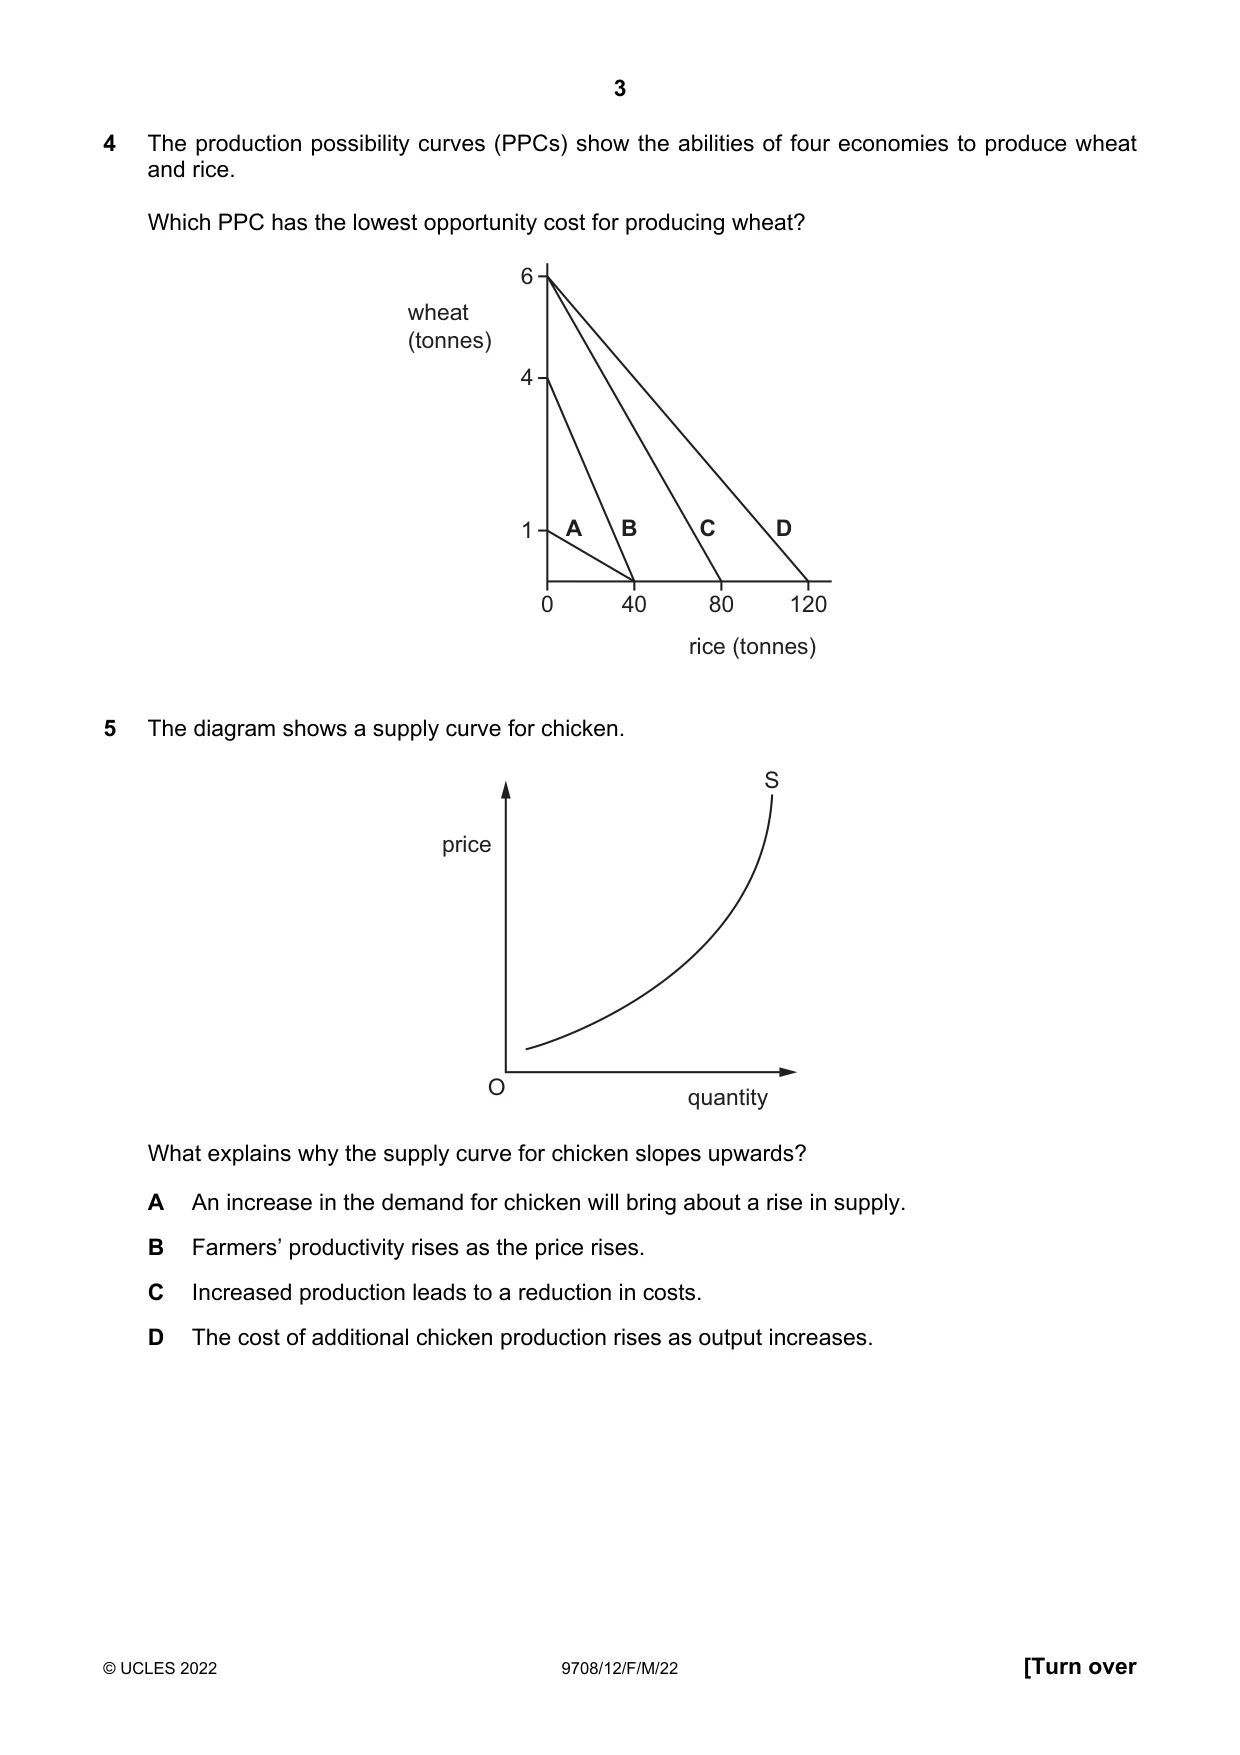
4 The production possibility curves (PPCs) show the abilities of four economies to produce wheat and rice. Which PPC has the lowest opportunity cost for producing wheat? 6 wheat (tonnes) 4 1 A B C D 0 40 80 120 rice (tonnes)
Mark scheme: B
Q5 · The diagram shows a supply curve for chicken
5 The diagram shows a supply curve for chicken. S price O quantity What explains why the supply curve for chicken slopes upwards? A An increase in the demand for chicken will bring about a rise in supply. B Farmers’ productivity rises as the price rises. C Increased production leads to a reduction in costs. D The cost of additional chicken production rises as output increases.
Mark scheme: D
Q6 · The diagram shows the demand and supply curves for cars in India
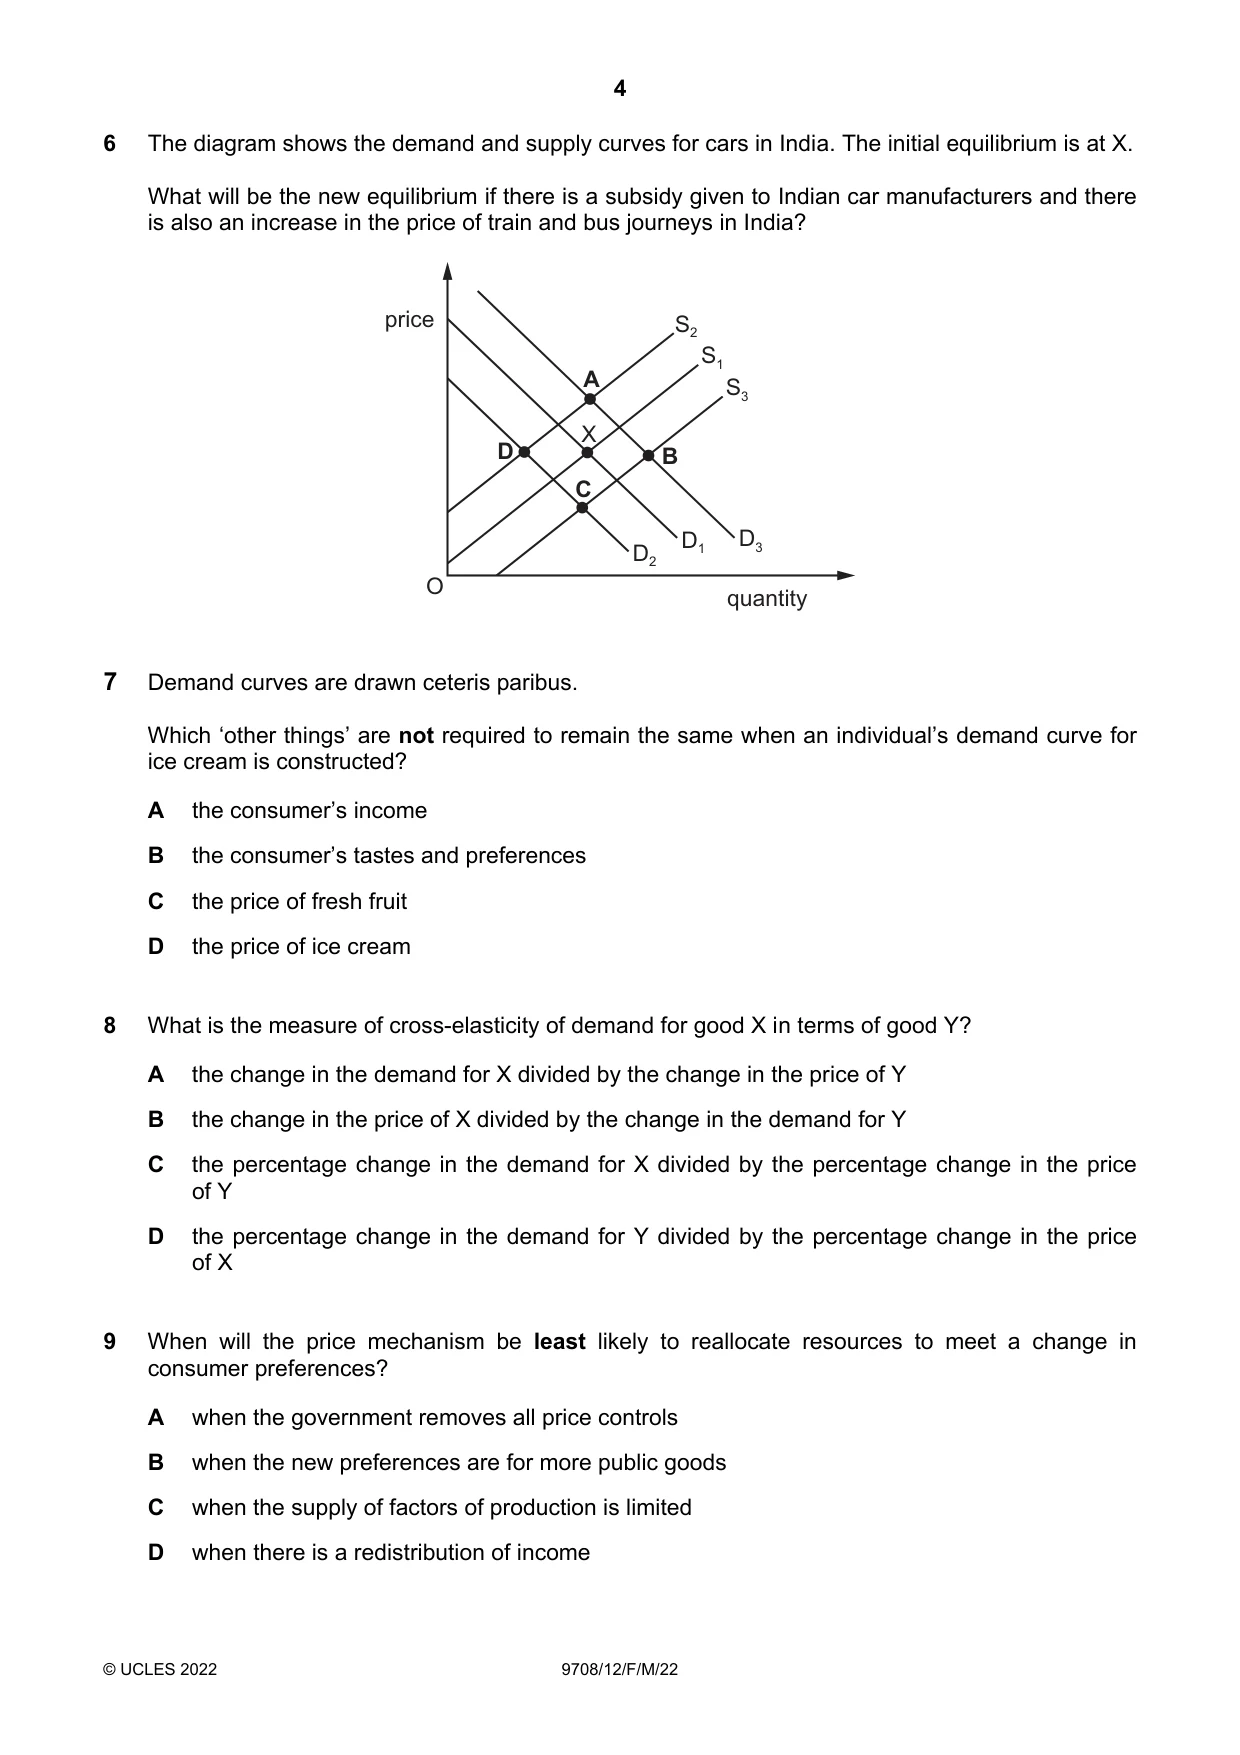
6 The diagram shows the demand and supply curves for cars in India. The initial equilibrium is at X. What will be the new equilibrium if there is a subsidy given to Indian car manufacturers and there is also an increase in the price of train and bus journeys in India? price S2 S1 A S3 X D B C D1 D3 D2 O quantity
Mark scheme: B
Q7 · Demand curves are drawn ceteris paribus
7 Demand curves are drawn ceteris paribus. Which ‘other things’ are not required to remain the same when an individual’s demand curve for ice cream is constructed? A the consumer’s income B the consumer’s tastes and preferences C the price of fresh fruit D the price of ice cream
Mark scheme: D
Q8 · What is the measure of cross-elasticity of demand for good X in terms of good Y?
8 What is the measure of cross-elasticity of demand for good X in terms of good Y? A the change in the demand for X divided by the change in the price of Y B the change in the price of X divided by the change in the demand for Y C the percentage change in the demand for X divided by the percentage change in the price of Y D the percentage change in the demand for Y divided by the percentage change in the price of X
Mark scheme: C
More questions on Price elasticity, income elasticity and cross elasticity of demand
Q9 · When will the price mechanism be least likely to reallocate resources to meet a change in…
9 When will the price mechanism be least likely to reallocate resources to meet a change in consumer preferences? A when the government removes all price controls B when the new preferences are for more public goods C when the supply of factors of production is limited D when there is a redistribution of income
Mark scheme: B
Q10 · A firm estimates that the price elasticity of supply of its product is +1.5
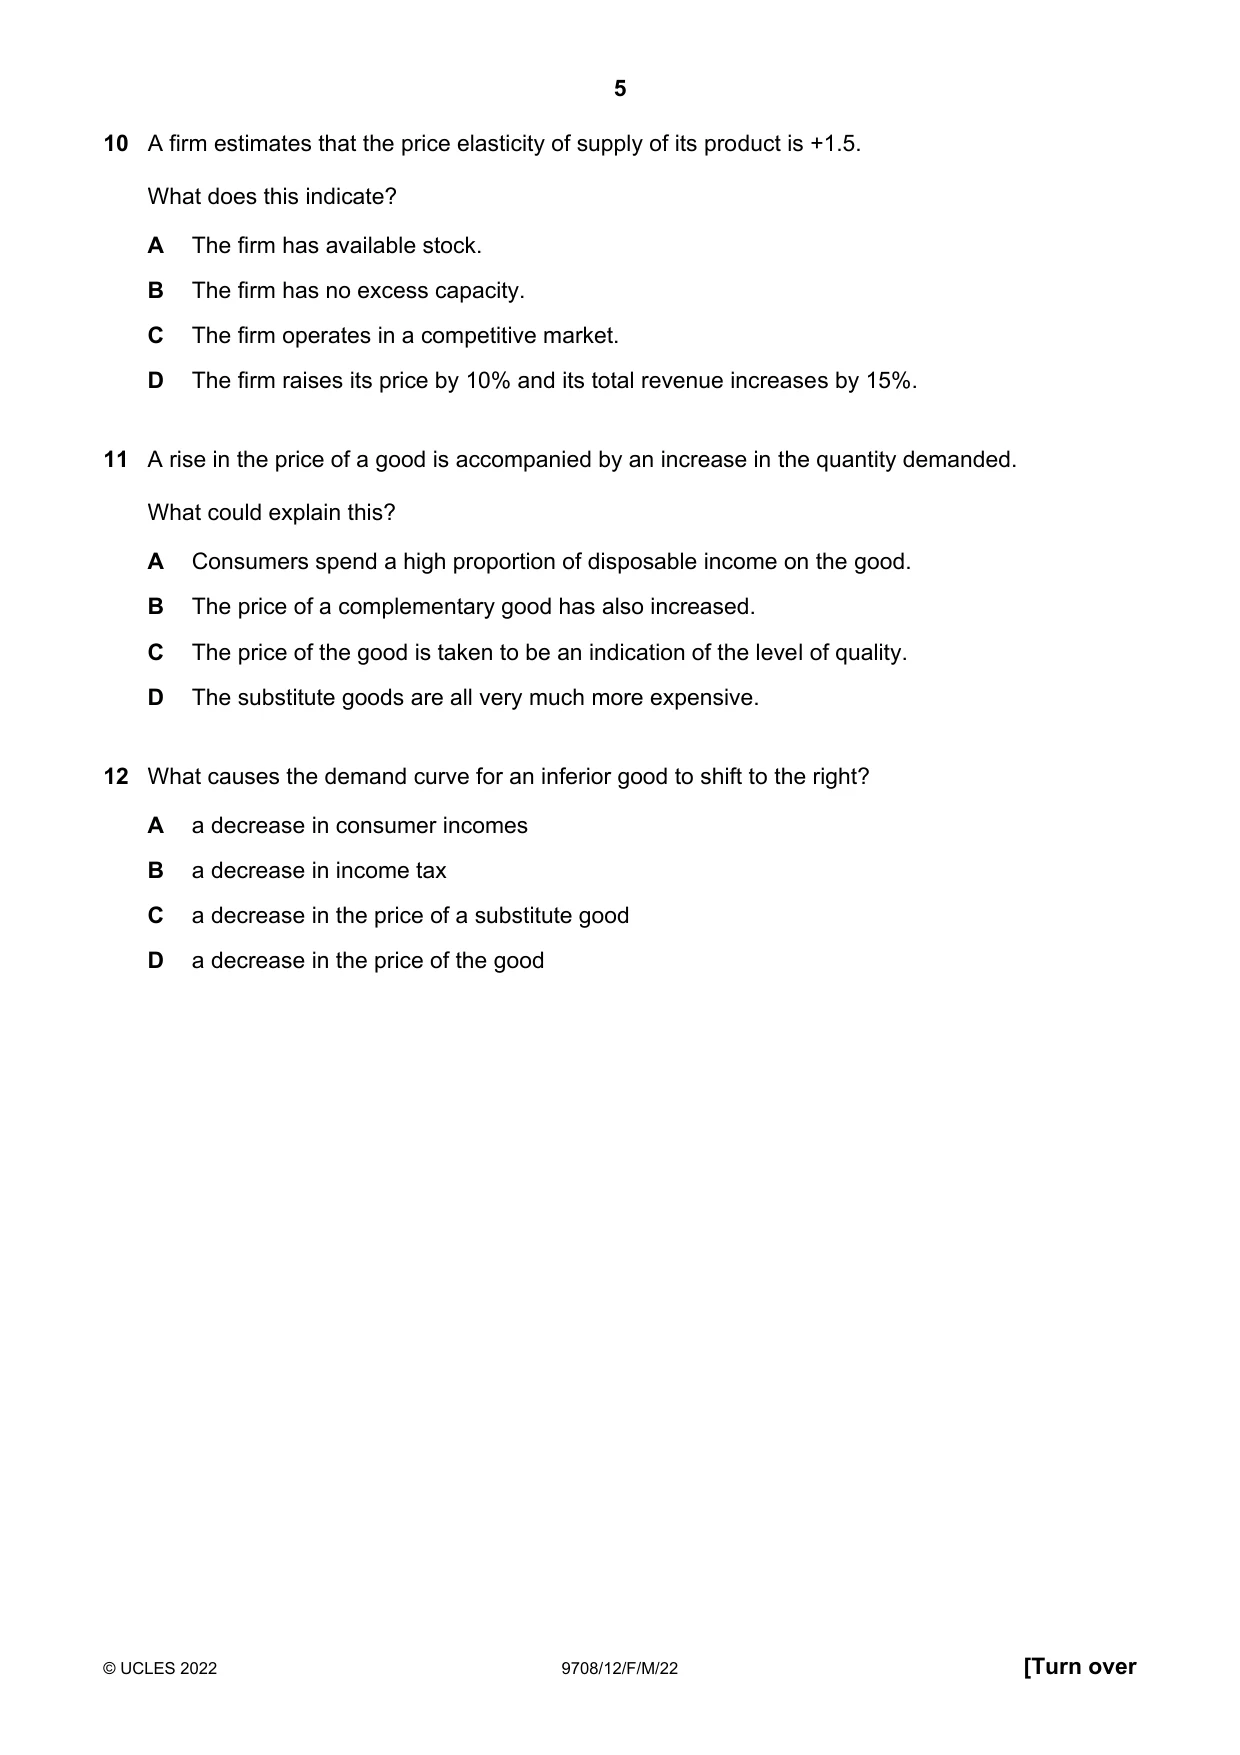
10 A firm estimates that the price elasticity of supply of its product is +1.5. What does this indicate? A The firm has available stock. B The firm has no excess capacity. C The firm operates in a competitive market. D The firm raises its price by 10% and its total revenue increases by 15%.
Mark scheme: A
Q11 · A rise in the price of a good is accompanied by an increase in the quantity demanded
11 A rise in the price of a good is accompanied by an increase in the quantity demanded. What could explain this? A Consumers spend a high proportion of disposable income on the good. B The price of a complementary good has also increased. C The price of the good is taken to be an indication of the level of quality. D The substitute goods are all very much more expensive.
Mark scheme: C
Q12 · What causes the demand curve for an inferior good to shift to the right?
12 What causes the demand curve for an inferior good to shift to the right? A a decrease in consumer incomes B a decrease in income tax C a decrease in the price of a substitute good D a decrease in the price of the good
Mark scheme: A
Q13 · The diagrams show the effect of a change in the market for good X on the market for good Y
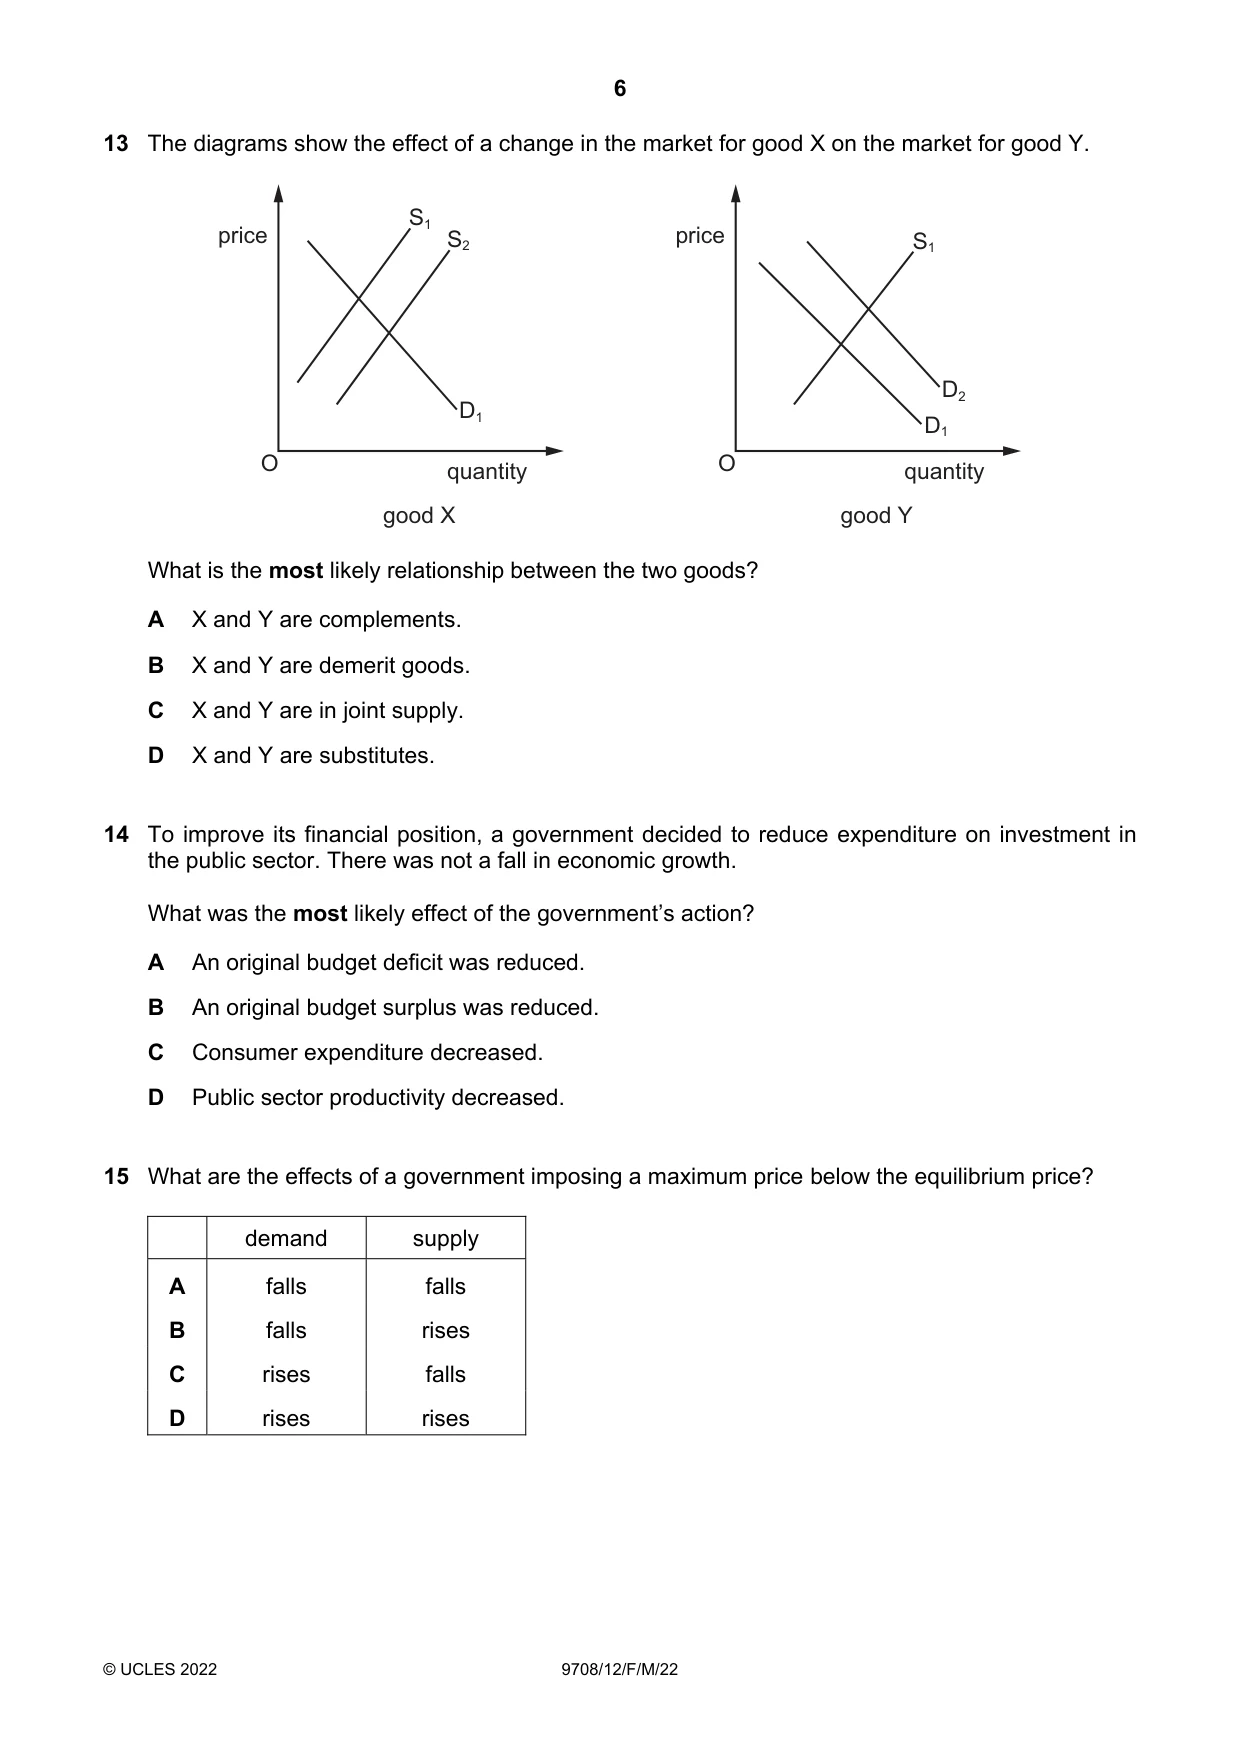
13 The diagrams show the effect of a change in the market for good X on the market for good Y. S1 price S2 price S1 D2 D1 D1 O quantity O quantity good X good Y What is the most likely relationship between the two goods? A X and Y are complements. B X and Y are demerit goods. C X and Y are in joint supply. D X and Y are substitutes.
Mark scheme: A
Q14 · To improve its financial position, a government decided to reduce expenditure on…
14 To improve its financial position, a government decided to reduce expenditure on investment in the public sector. There was not a fall in economic growth. What was the most likely effect of the government’s action? A An original budget deficit was reduced. B An original budget surplus was reduced. C Consumer expenditure decreased. D Public sector productivity decreased.
Mark scheme: A
Q15 · What are the effects of a government imposing a maximum price below the equilibrium price?
15 What are the effects of a government imposing a maximum price below the equilibrium price? demand supply A falls falls B falls rises C rises falls D rises rises
Mark scheme: C
More questions on Methods and effects of government intervention in markets
Q16 · The National Library Board of Singapore is a public sector organisation that finances and…
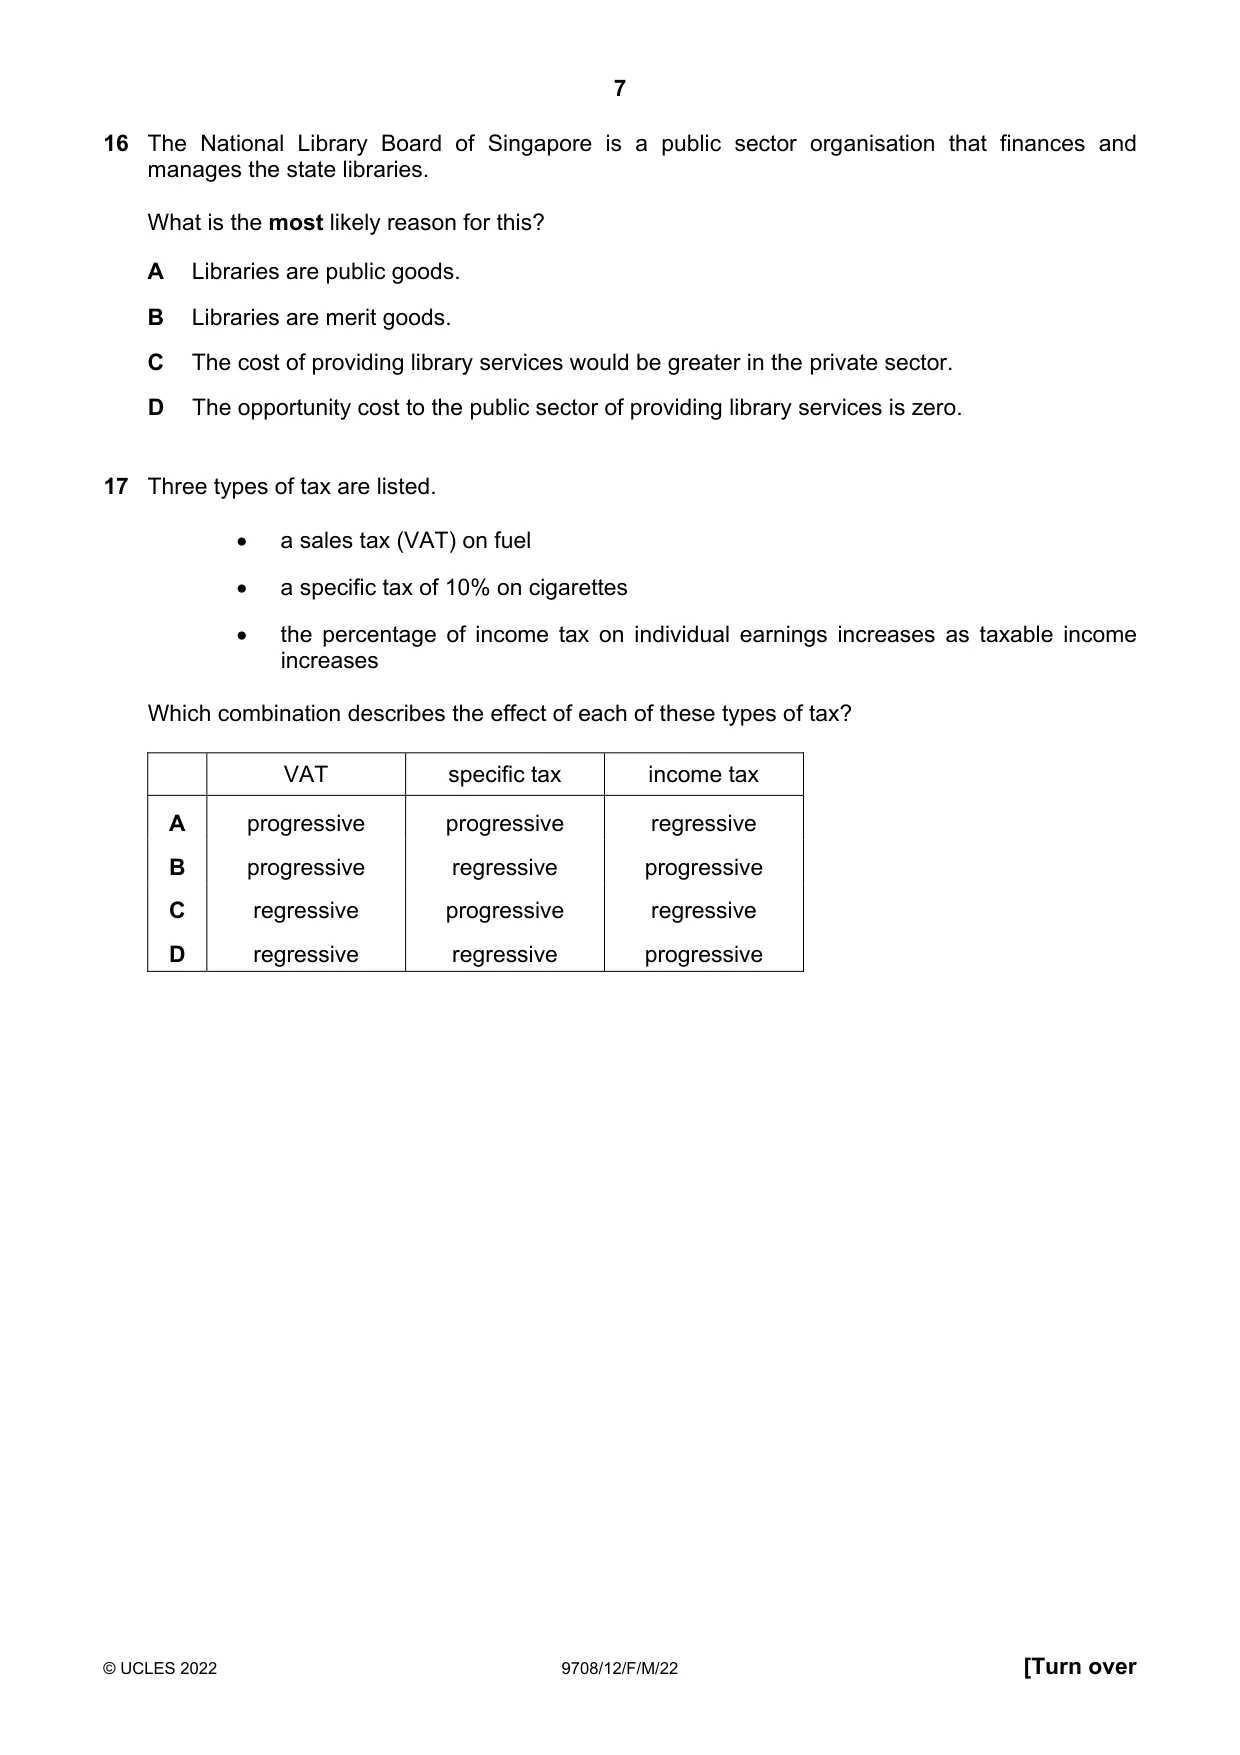
16 The National Library Board of Singapore is a public sector organisation that finances and manages the state libraries. What is the most likely reason for this? A Libraries are public goods. B Libraries are merit goods. C The cost of providing library services would be greater in the private sector. D The opportunity cost to the public sector of providing library services is zero.
Mark scheme: B
More questions on Reasons for government intervention in markets
Q17 · Three types of tax are listed
17 Three types of tax are listed. a sales tax (VAT) on fuel a specific tax of 10% on cigarettes the percentage of income tax on individual earnings increases as taxable income increases Which combination describes the effect of each of these types of tax? VAT specific tax income tax A progressive progressive regressive B progressive regressive progressive C regressive progressive regressive D regressive regressive progressive
Mark scheme: D
More questions on Methods and effects of government intervention in markets
Q18 · The bus fare in a rural area is $5 per journey
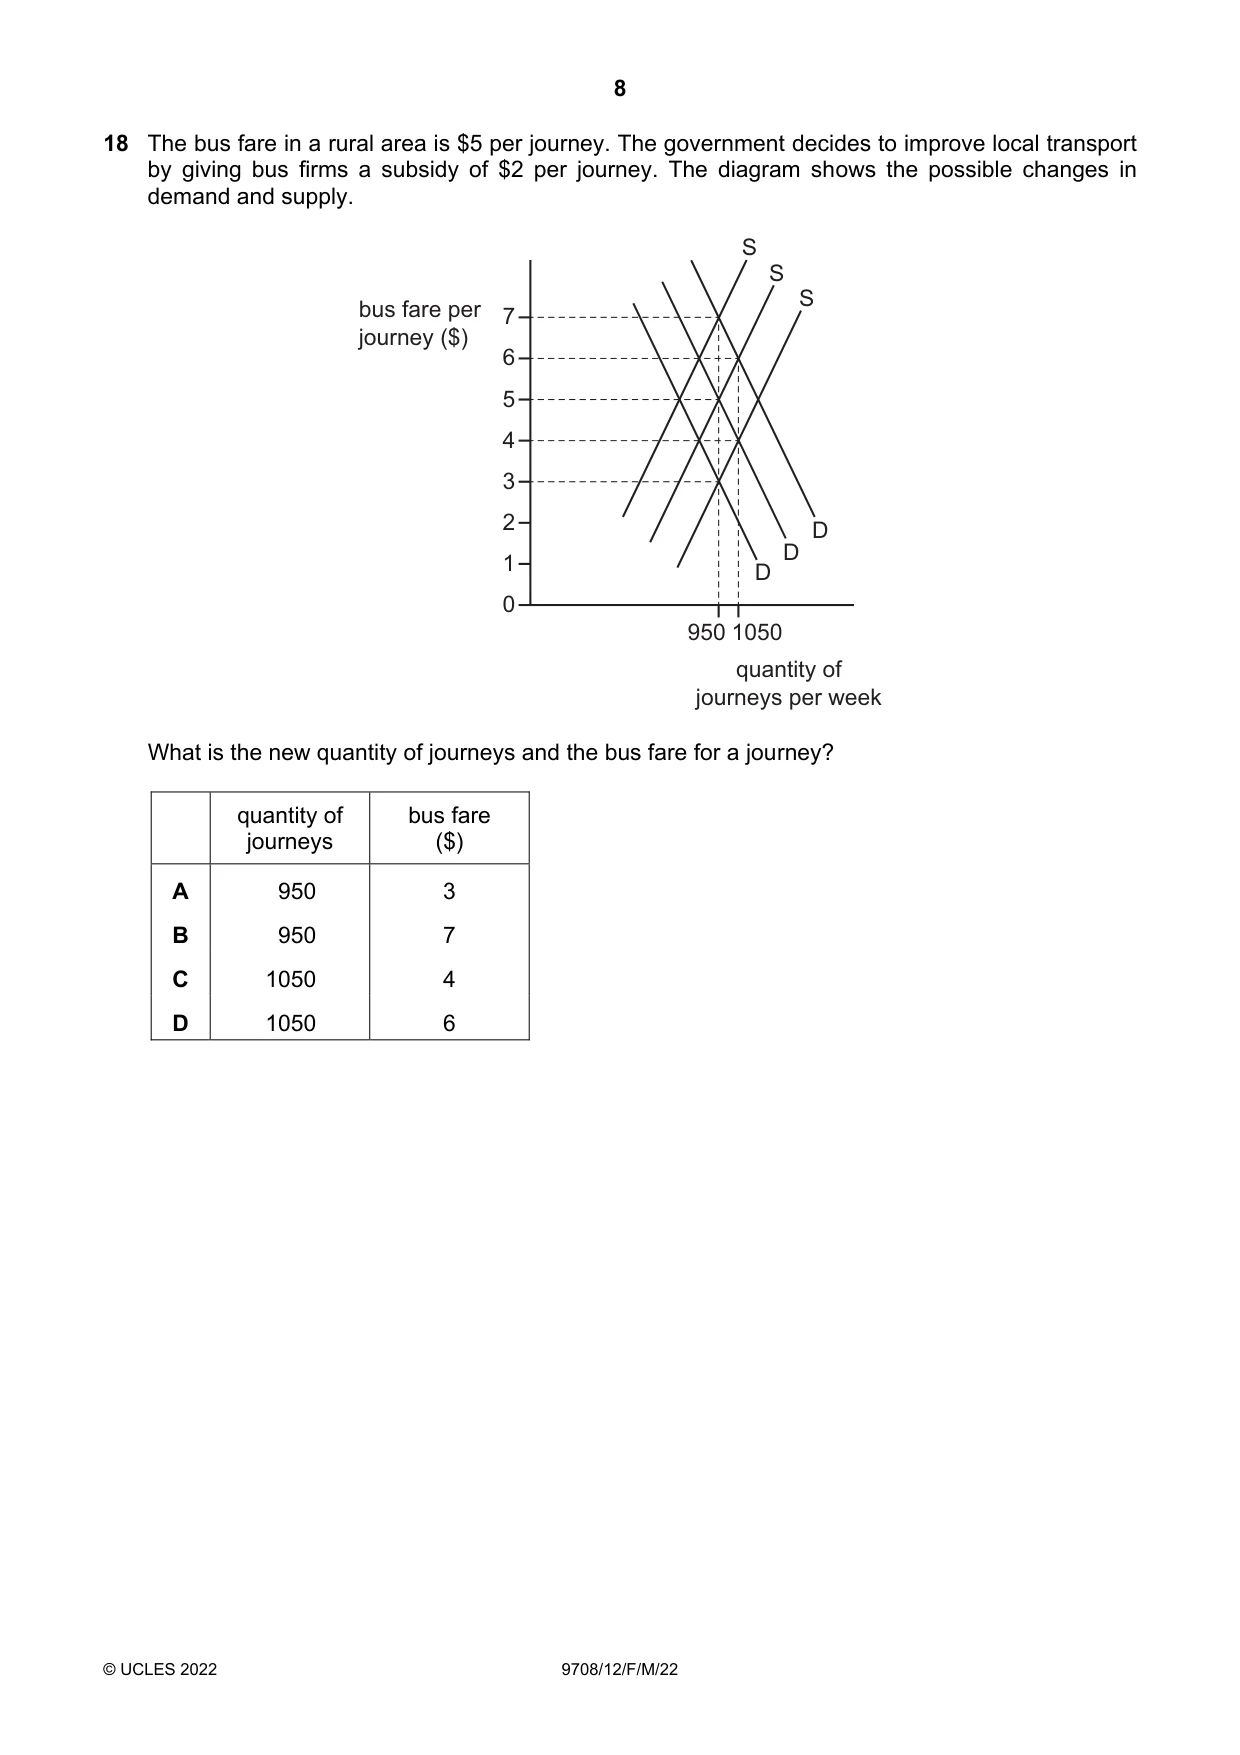
18 The bus fare in a rural area is $5 per journey. The government decides to improve local transport by giving bus firms a subsidy of $2 per journey. The diagram shows the possible changes in demand and supply. S S S bus fare per 7 journey ($) 6 5 4 3 2 D D 1 D 0 950 1050 quantity of journeys per week What is the new quantity of journeys and the bus fare for a journey? quantity of bus fare journeys ($) A 950 3 B 950 7 C 1050 4 D 1050 6
Mark scheme: C
More questions on Methods and effects of government intervention in markets
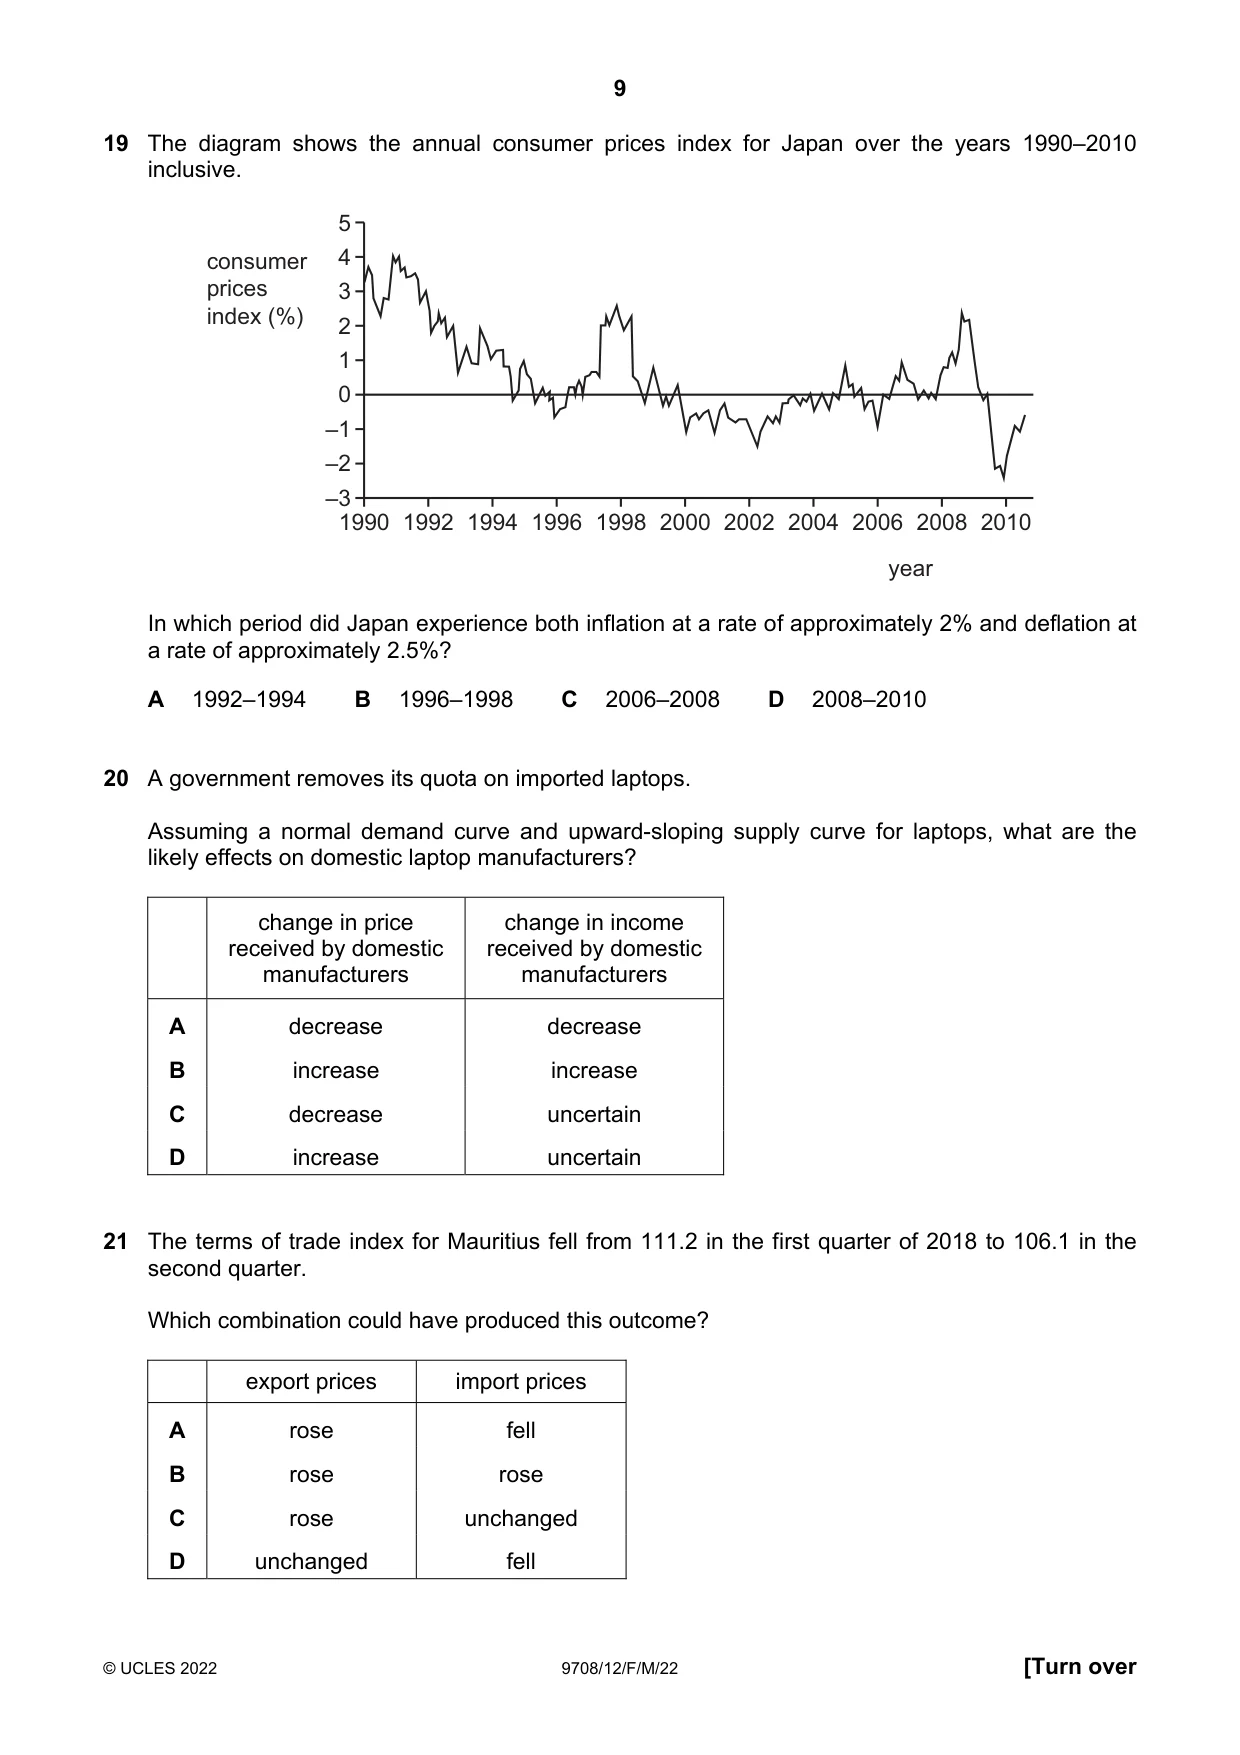
Q19 · The diagram shows the annual consumer prices index for Japan over the years 1990–2010…
19 The diagram shows the annual consumer prices index for Japan over the years 1990–2010 inclusive. 5 consumer 4 prices 3 index (%) 2 1 0 –1 –2 –3 1990 1992 1994 1996 1998 2000 2002 2004 2006 2008 2010 year In which period did Japan experience both inflation at a rate of approximately 2% and deflation at a rate of approximately 2.5%? A 1992–1994 B 1996–1998 C 2006–2008 D 2008–2010
Mark scheme: D
Q20 · A government removes its quota on imported laptops
20 A government removes its quota on imported laptops. Assuming a normal demand curve and upward-sloping supply curve for laptops, what are the likely effects on domestic laptop manufacturers? change in price change in income received by domestic received by domestic manufacturers manufacturers A decrease decrease B increase increase C decrease uncertain D increase uncertain
Mark scheme: A
Q21 · The terms of trade index for Mauritius fell from 111.2 in the first quarter of 2018 to…
21 The terms of trade index for Mauritius fell from 111.2 in the first quarter of 2018 to 106.1 in the second quarter. Which combination could have produced this outcome? export prices import prices A rose fell B rose rose C rose unchanged D unchanged fell
Mark scheme: B
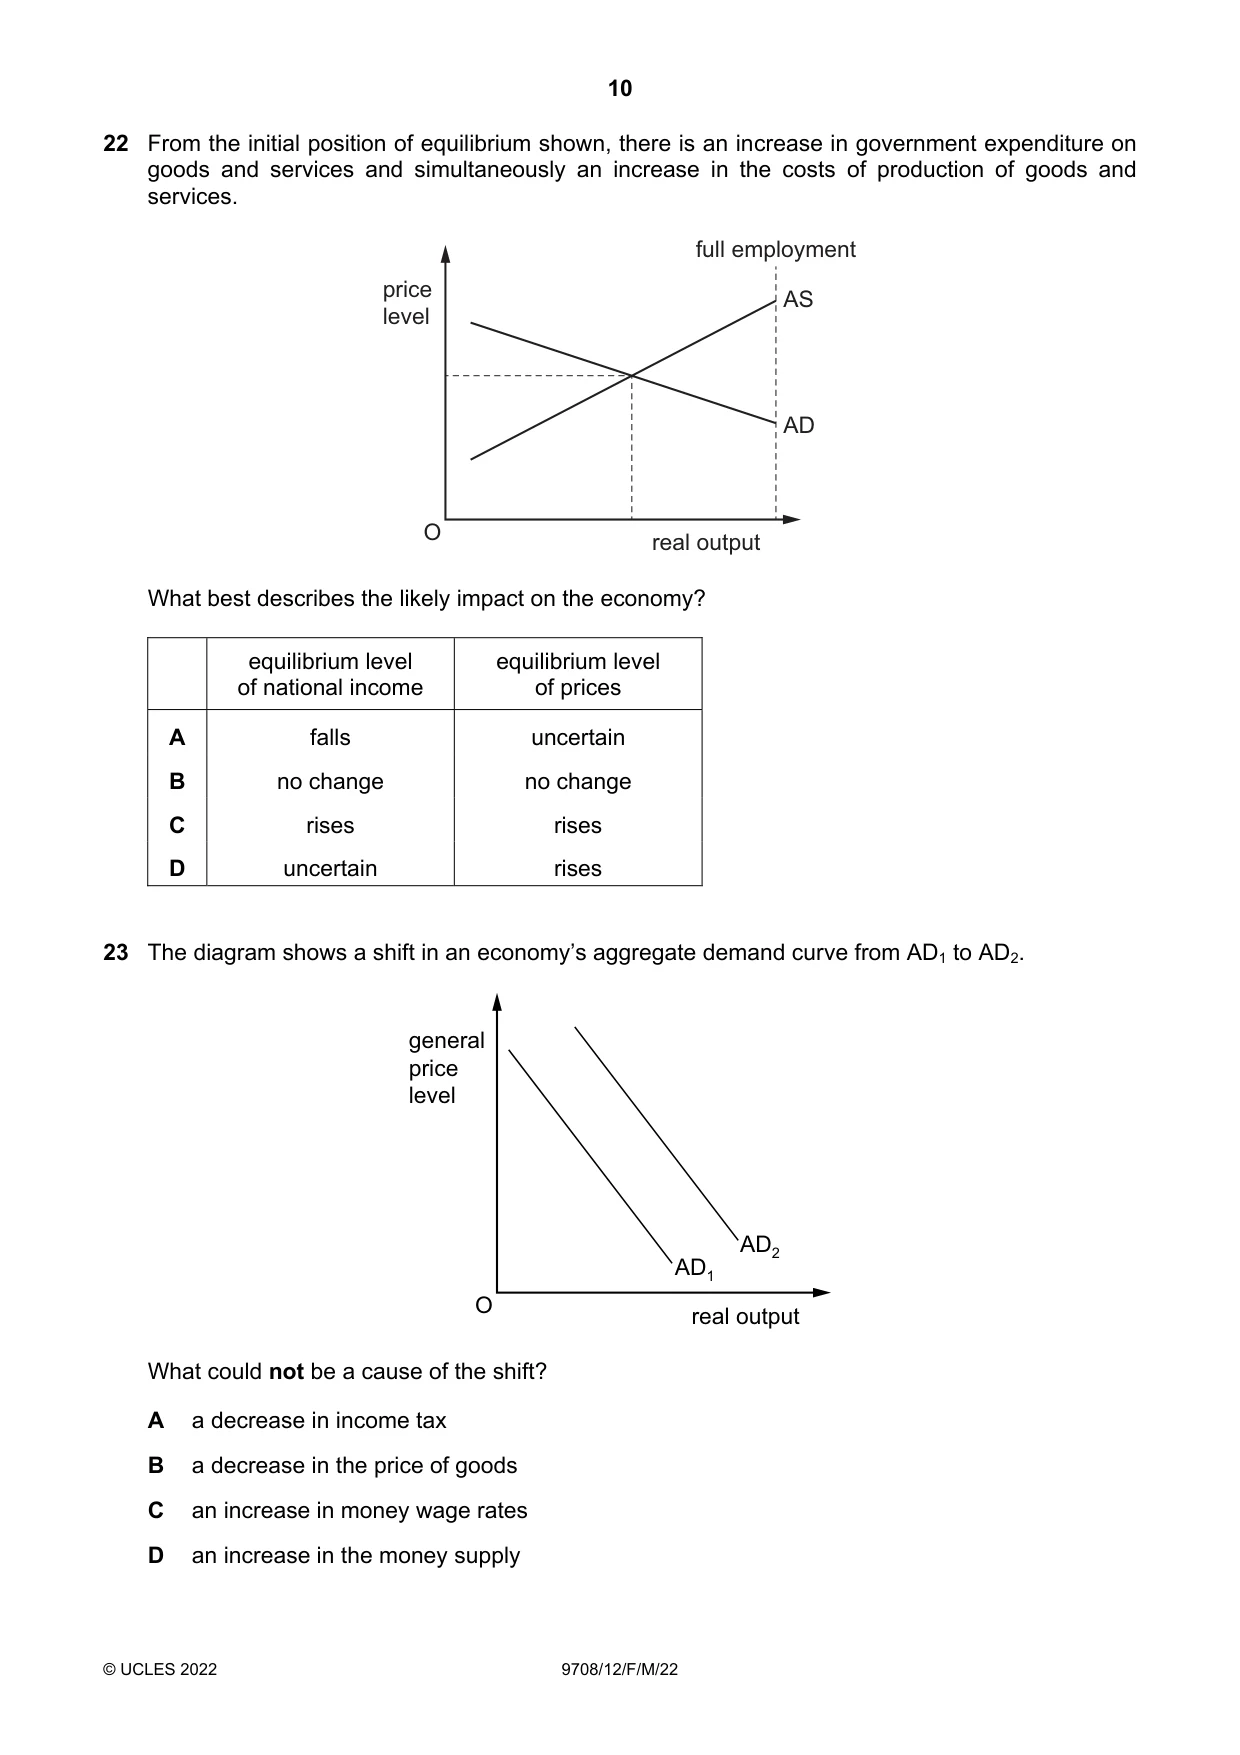
Q22 · From the initial position of equilibrium shown, there is an increase in government…
22 From the initial position of equilibrium shown, there is an increase in government expenditure on goods and services and simultaneously an increase in the costs of production of goods and services. full employment price AS level AD O real output What best describes the likely impact on the economy? equilibrium level equilibrium level of national income of prices A falls uncertain B no change no change C rises rises D uncertain rises
Mark scheme: D
More questions on Aggregate Demand and Aggregate Supply analysis
Q23 · The diagram shows a shift in an economy’s aggregate demand curve from AD1 to AD2
23 The diagram shows a shift in an economy’s aggregate demand curve from AD1 to AD2. general price level AD2 AD1 O real output What could not be a cause of the shift? A a decrease in income tax B a decrease in the price of goods C an increase in money wage rates D an increase in the money supply
Mark scheme: B
More questions on Aggregate Demand and Aggregate Supply analysis
Q24 · Which item is not included in the current account on the balance of payments statement?
24 Which item is not included in the current account on the balance of payments statement? A the balancing item B the export of services C the import of goods D the interest received from investment overseas
Mark scheme: A
More questions on Current account of the balance of payments
Q25 · The prices of a country’s exports rise by 5% while the prices of its imports fall by 5%
25 The prices of a country’s exports rise by 5% while the prices of its imports fall by 5%. What will definitely improve in the country as a result of these changes? A balance of trade B current account balance C exchange rate D terms of trade
Mark scheme: D
Q26 · What is not a form of protectionism?
26 What is not a form of protectionism? A embargoes B increase in sales tax (VAT) C subsidies on goods for export D voluntary export restraints
Mark scheme: B
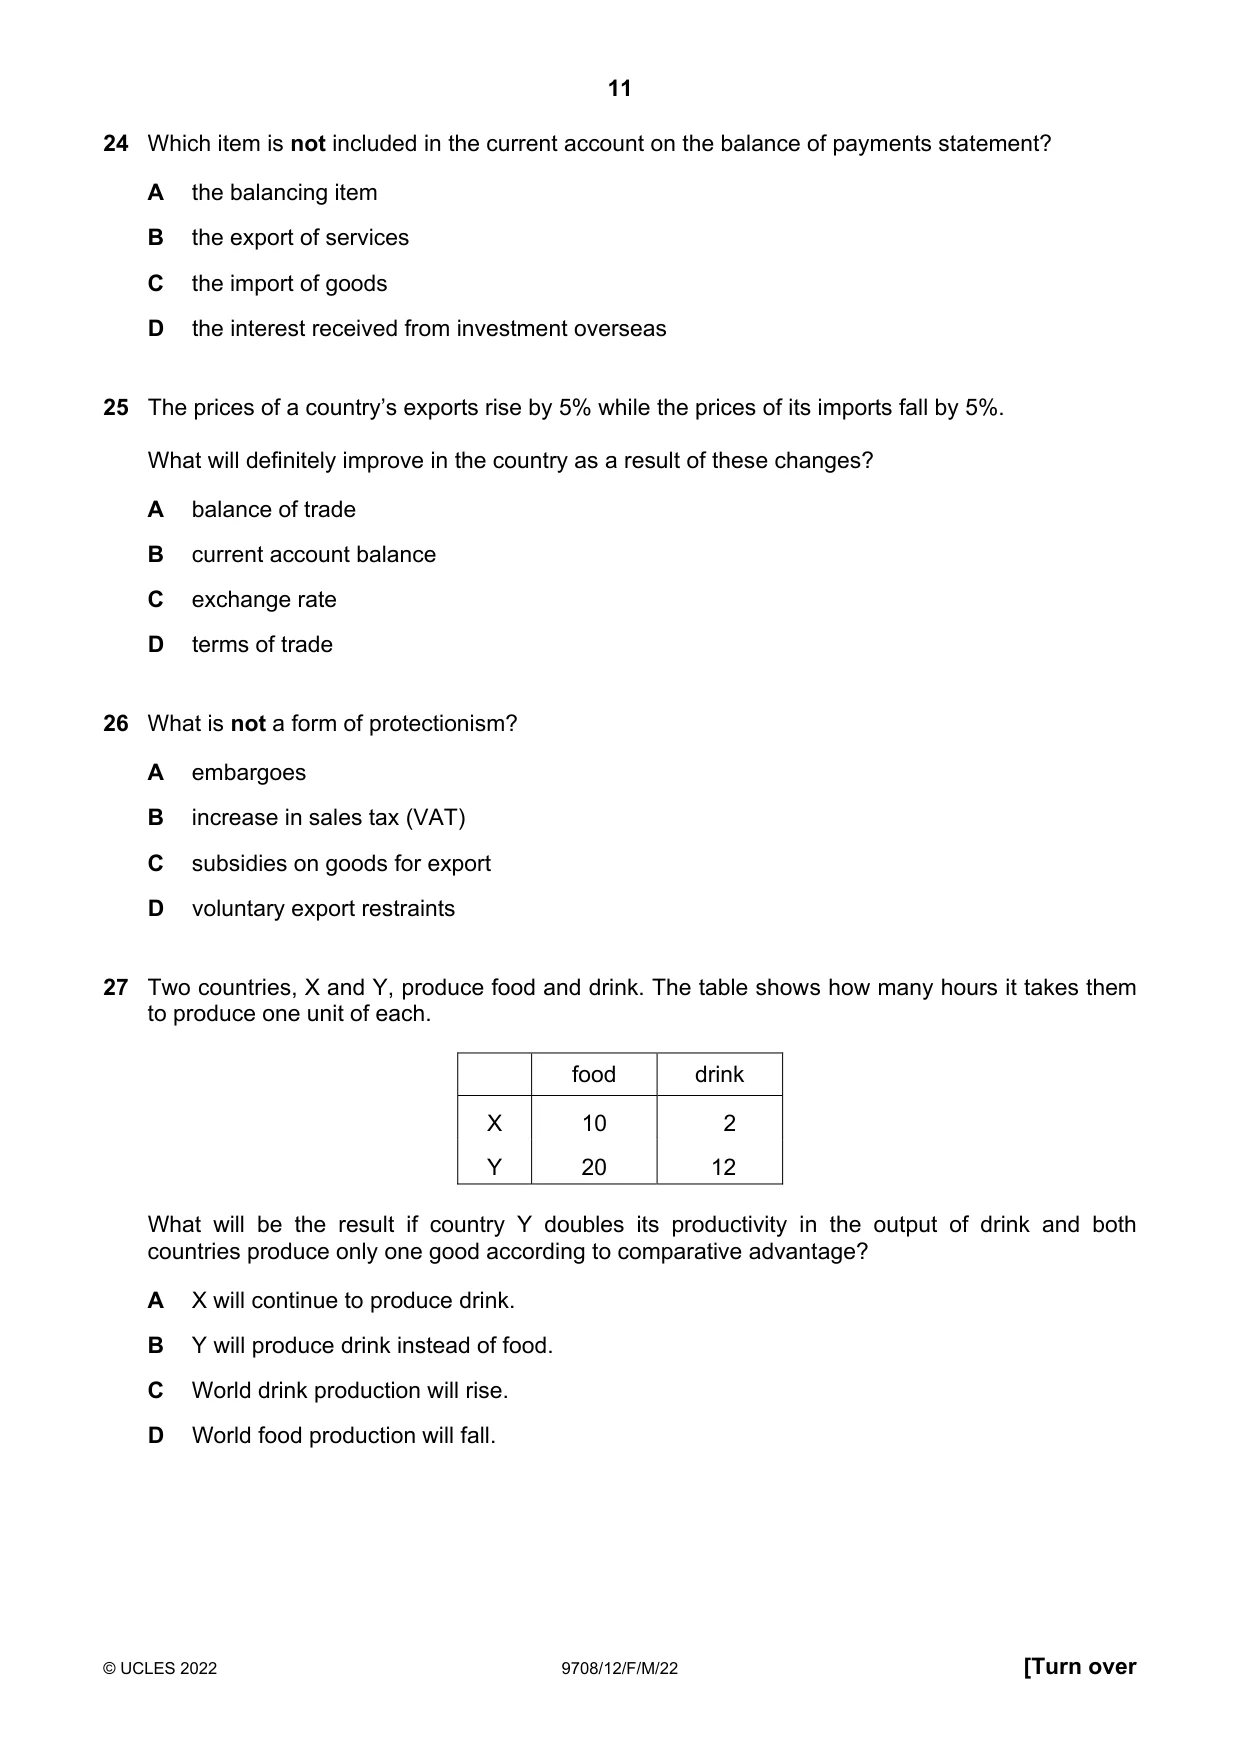
Q27 · Two countries, X and Y, produce food and drink
27 Two countries, X and Y, produce food and drink. The table shows how many hours it takes them to produce one unit of each. food drink X 10 2 Y 20 12 What will be the result if country Y doubles its productivity in the output of drink and both countries produce only one good according to comparative advantage? A X will continue to produce drink. B Y will produce drink instead of food. C World drink production will rise. D World food production will fall.
Mark scheme: A
Q28 · ‘Reducing the exchange rate helps to decrease a country’s balance of payments deficit…
28 ‘Reducing the exchange rate helps to decrease a country’s balance of payments deficit because it makes imports more expensive and exports cheaper.’ What does this statement describe? A a deflationary policy B a policy of direct controls C an expenditure-reducing policy D an expenditure-switching policy
Mark scheme: D
More questions on Policies to correct imbalances in the current account of the balance of payments
Q29 · An increase in which variable is a contractionary monetary policy?
29 An increase in which variable is a contractionary monetary policy? A the budget deficit B the budget surplus C the interest rate D the money supply
Mark scheme: C
Q30 · What are government monetary policies that would be the most effective in a global…
30 What are government monetary policies that would be the most effective in a global recession? A allowing the rate of interest to fluctuate and increasing business taxation B increasing the budget surplus and raising tariffs on imports C keeping the rate of interest very low and increasing the money supply D raising the rate of interest and restricting the money supply
Mark scheme: C
What was in this paper
The subtopics covered by these 30 questions, and how many questions each got. Open one in a new tab to see every Cambridge question on it.
3Methods and effects of government intervention in markets3Aggregate Demand and Aggregate Supply analysis2Exchange rates2Monetary policy2Price elasticity of supply2Production possibility curves2Protectionism2The interaction of demand and supply2Classification of goods and services1Current account of the balance of payments1Economic methodology1Fiscal policy1Money and banking1Policies to correct imbalances in the current account of the balance of payments1Price elasticity, income elasticity and cross elasticity of demand1Price stability1Reasons for government intervention in markets1The reasons for international trade1What you needed in this session
Cambridge’s own grade thresholds for 2022 Feb/March, Paper 1 · Variant 2. A higher threshold means an easier paper — the bar moves with how the cohort did.