Cambridge A Level Economics 9708 — 2024 Oct/Nov Paper 1 · Variant 2
9708/12/O/N/24 · 30 questions · 30 marks · ≈34 min
The question paper and its mark scheme, free to read here and free to download. This is Cambridge’s own paper, exactly as it was sat.
Question paper12 pages
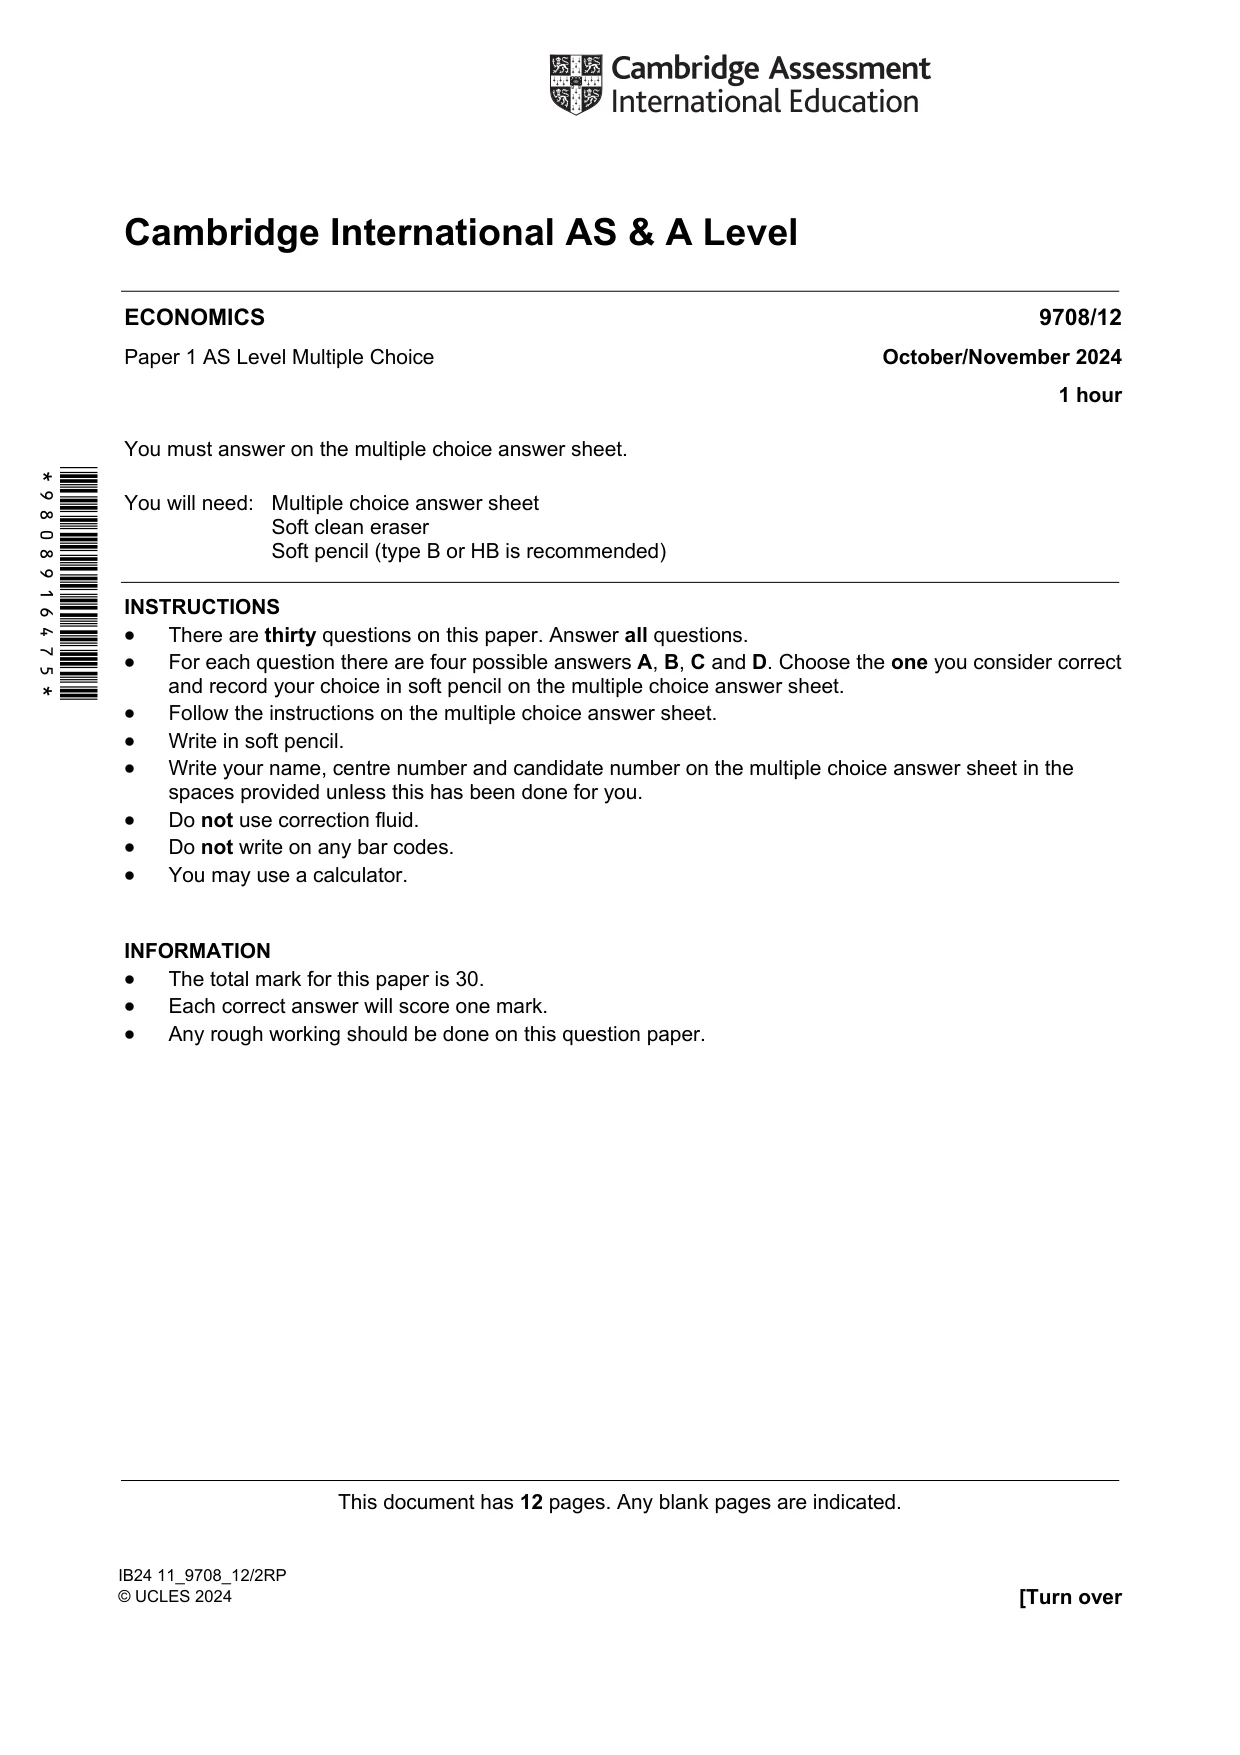
Mark scheme3 pages
Answers below. Sit the paper first if you are practising.
Questions as text
Q1 · The production possibility curve for a country is shown
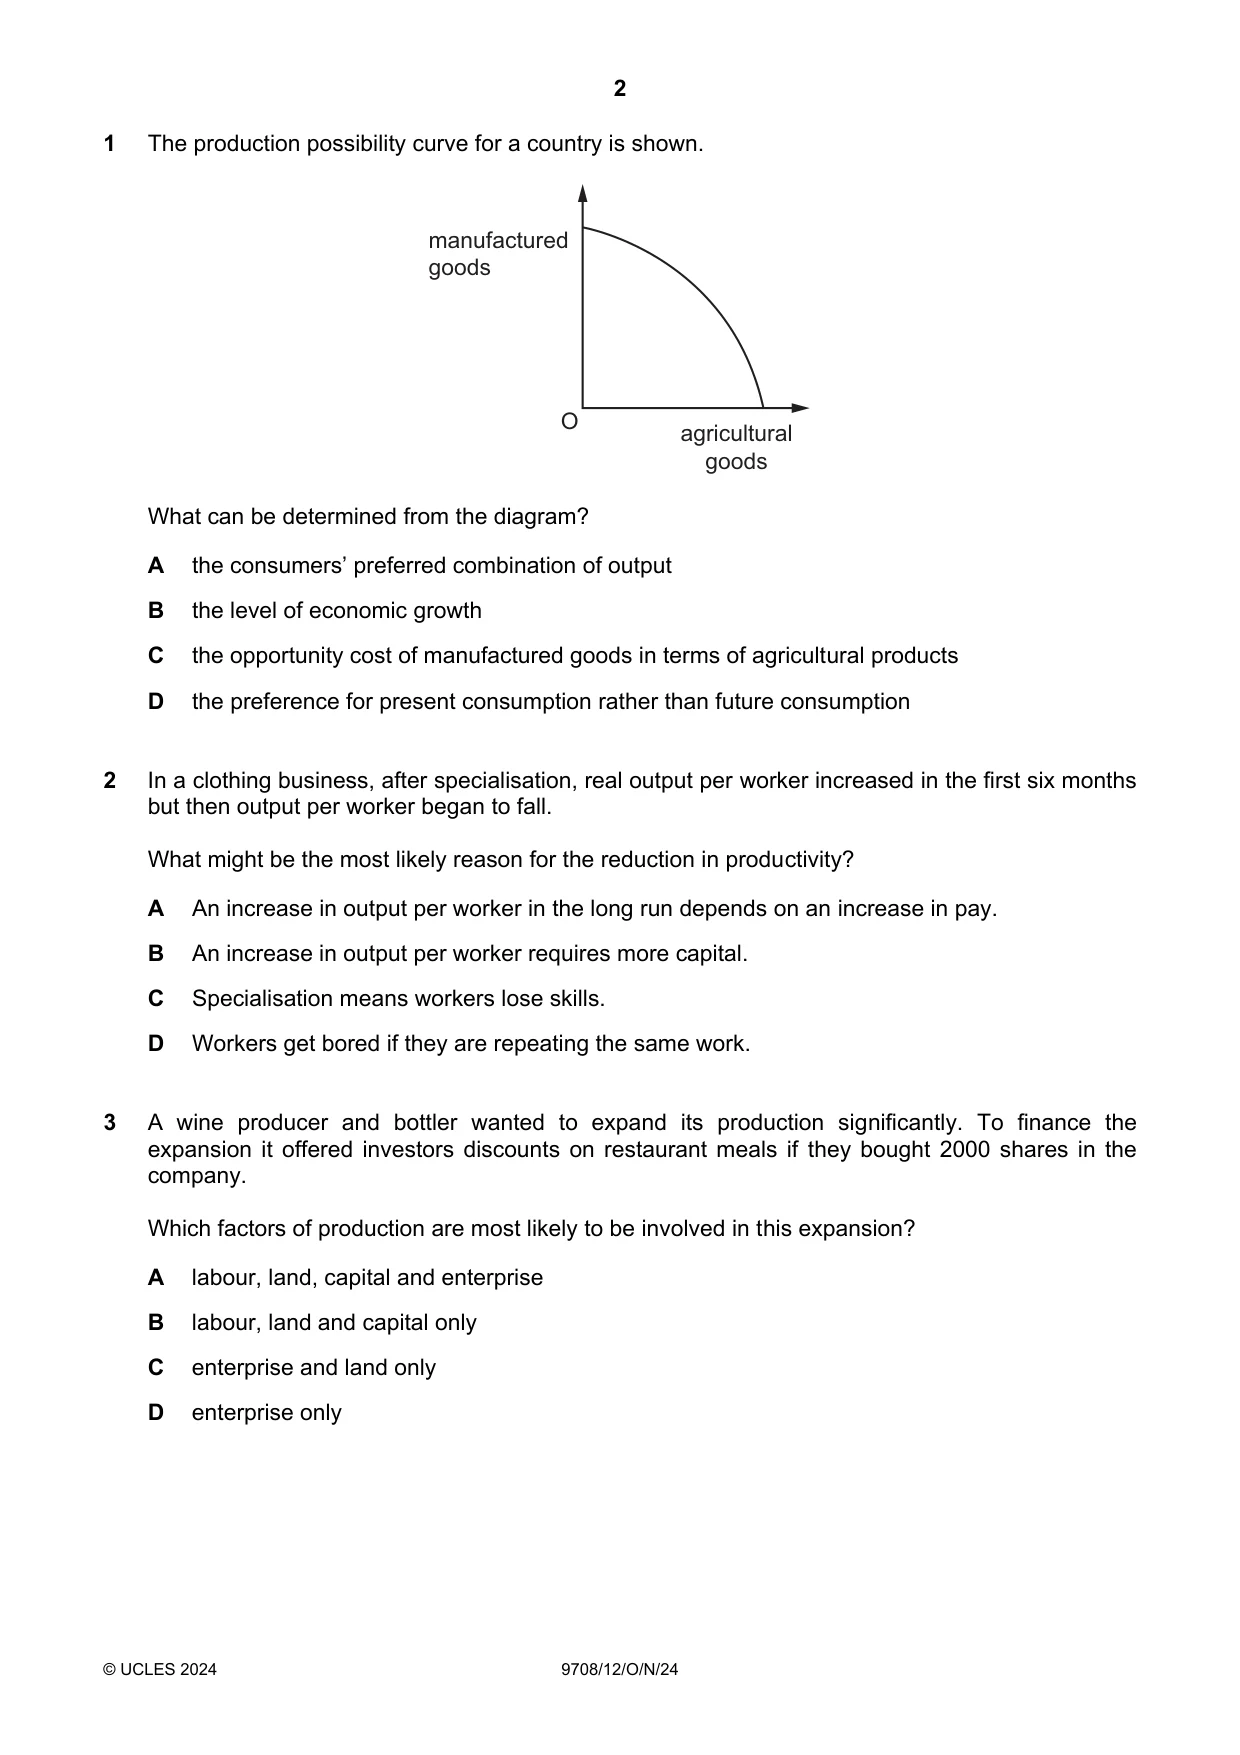
1 The production possibility curve for a country is shown. manufactured goods O agricultural goods What can be determined from the diagram? A the consumers’ preferred combination of output B the level of economic growth C the opportunity cost of manufactured goods in terms of agricultural products D the preference for present consumption rather than future consumption
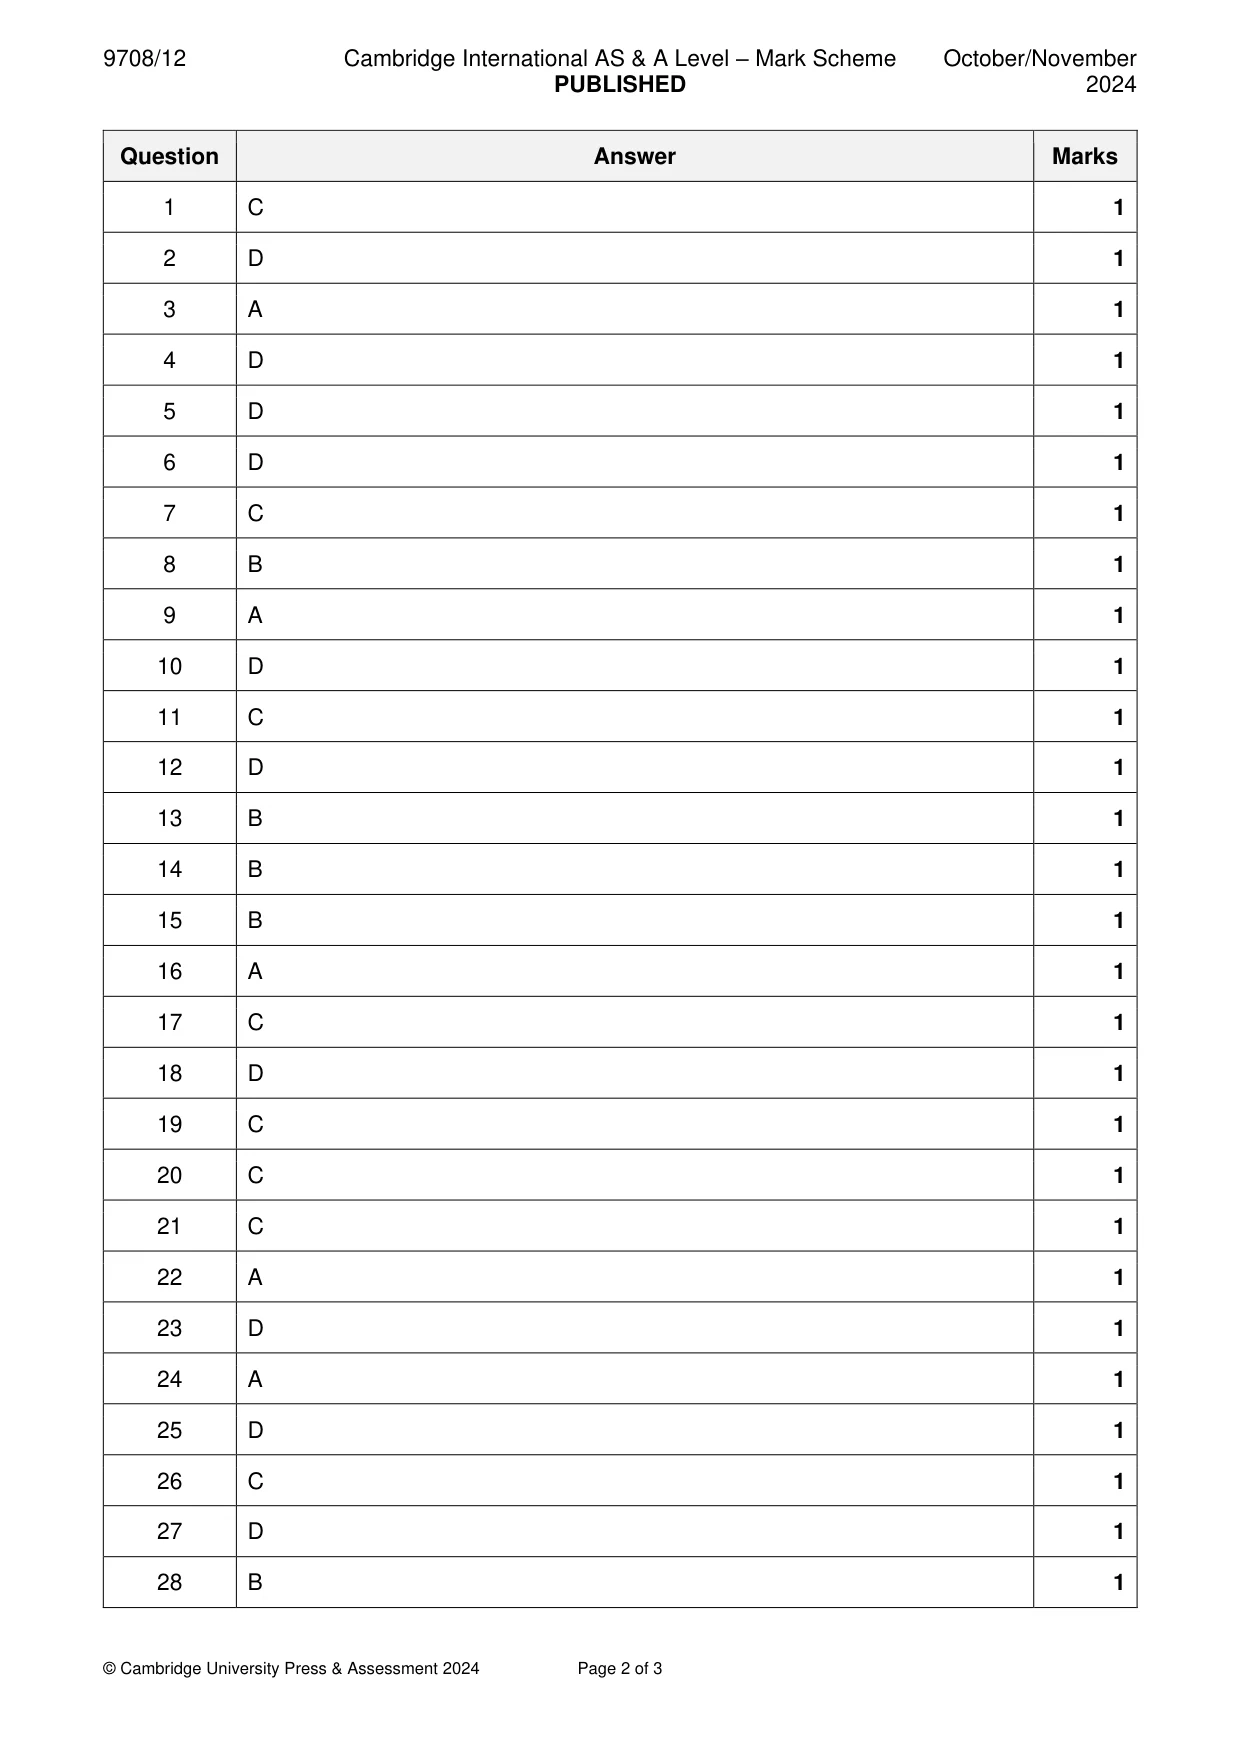
Mark scheme: C
Q2 · In a clothing business, after specialisation, real output per worker increased in the…
2 In a clothing business, after specialisation, real output per worker increased in the first six months but then output per worker began to fall. What might be the most likely reason for the reduction in productivity? A An increase in output per worker in the long run depends on an increase in pay. B An increase in output per worker requires more capital. C Specialisation means workers lose skills. D Workers get bored if they are repeating the same work.
Mark scheme: D
Q3 · A wine producer and bottler wanted to expand its production significantly
3 A wine producer and bottler wanted to expand its production significantly. To finance the expansion it offered investors discounts on restaurant meals if they bought 2000 shares in the company. Which factors of production are most likely to be involved in this expansion? A labour, land, capital and enterprise B labour, land and capital only C enterprise and land only D enterprise only
Mark scheme: A
Q4 · Which statement is positive?
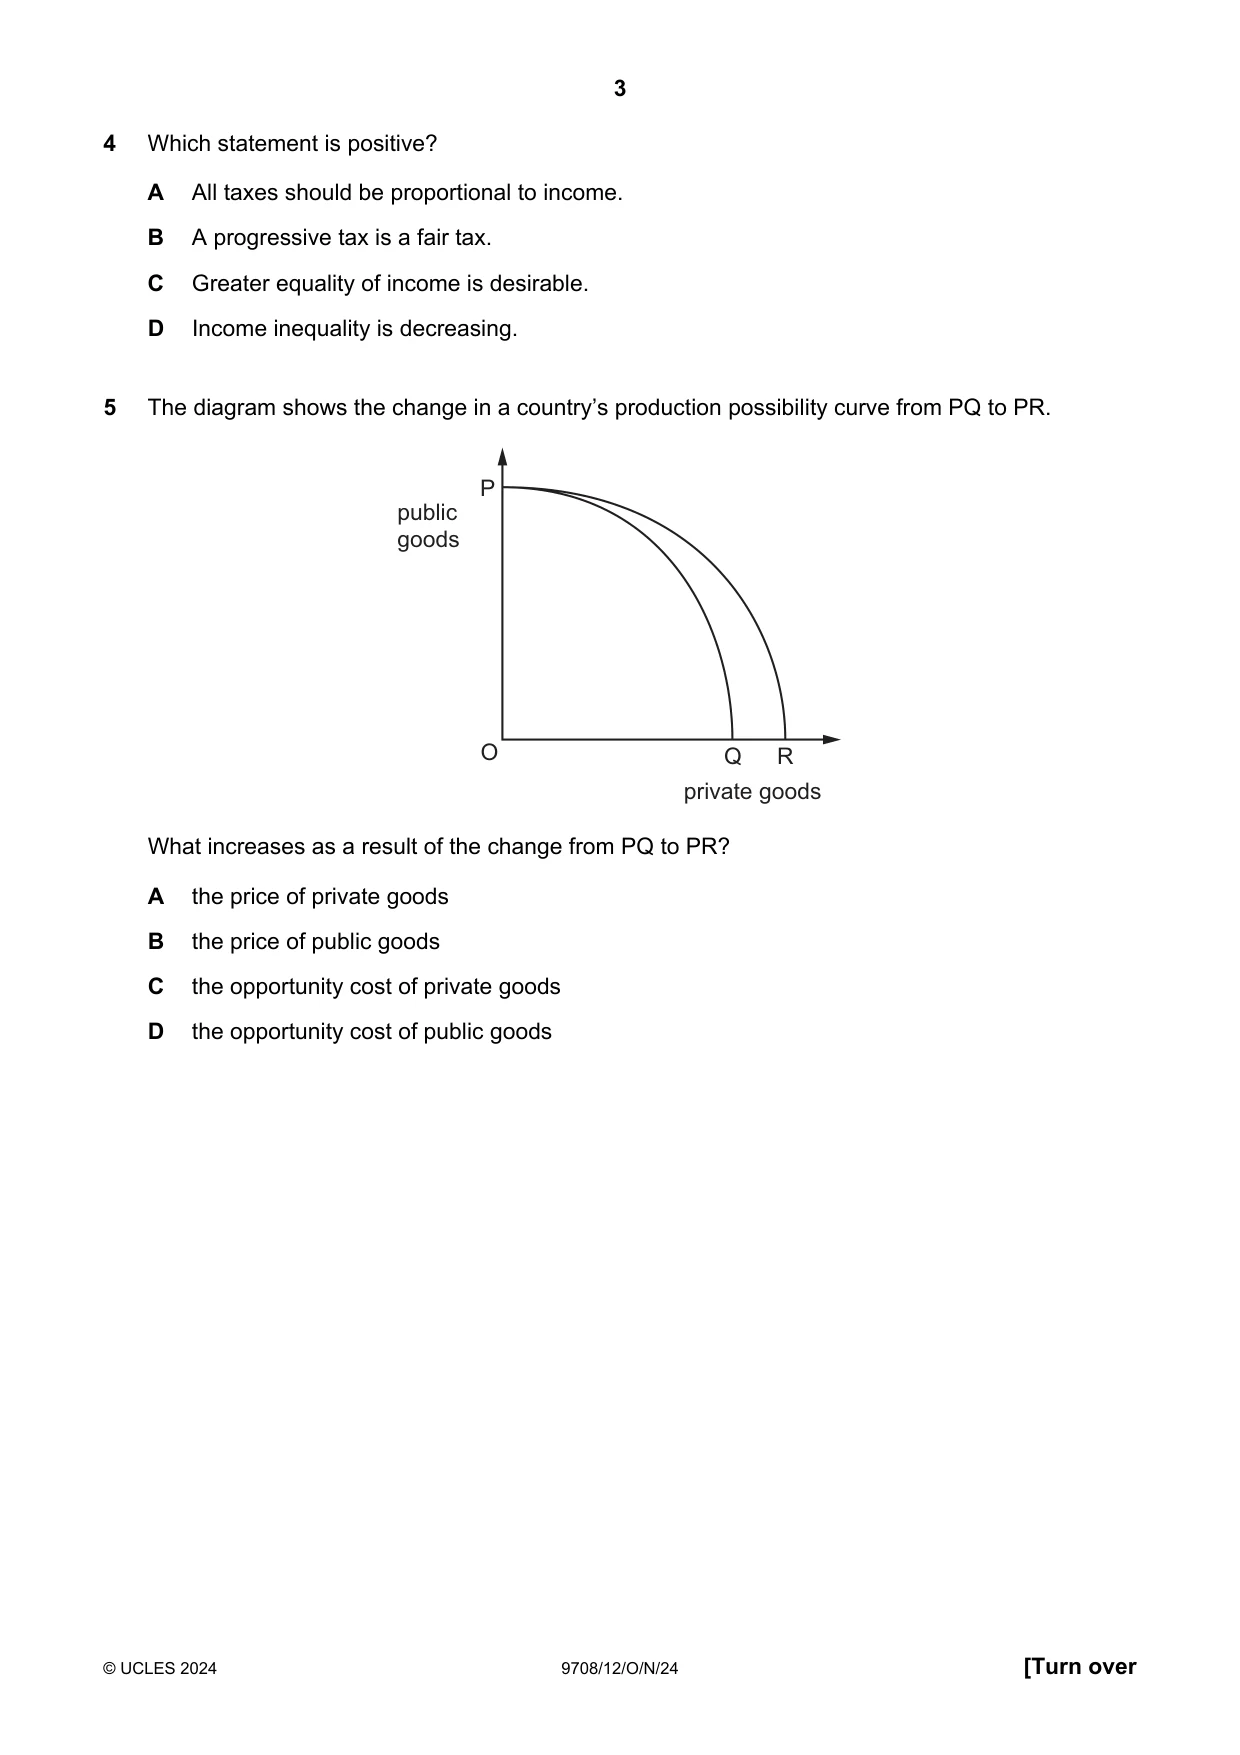
4 Which statement is positive? A All taxes should be proportional to income. B A progressive tax is a fair tax. C Greater equality of income is desirable. D Income inequality is decreasing.
Mark scheme: D
Q5 · The diagram shows the change in a country’s production possibility curve from PQ to PR
5 The diagram shows the change in a country’s production possibility curve from PQ to PR. P public goods O Q R private goods What increases as a result of the change from PQ to PR? A the price of private goods B the price of public goods C the opportunity cost of private goods D the opportunity cost of public goods
Mark scheme: D
Q6 · The graph shows the demand and supply curves for an industry
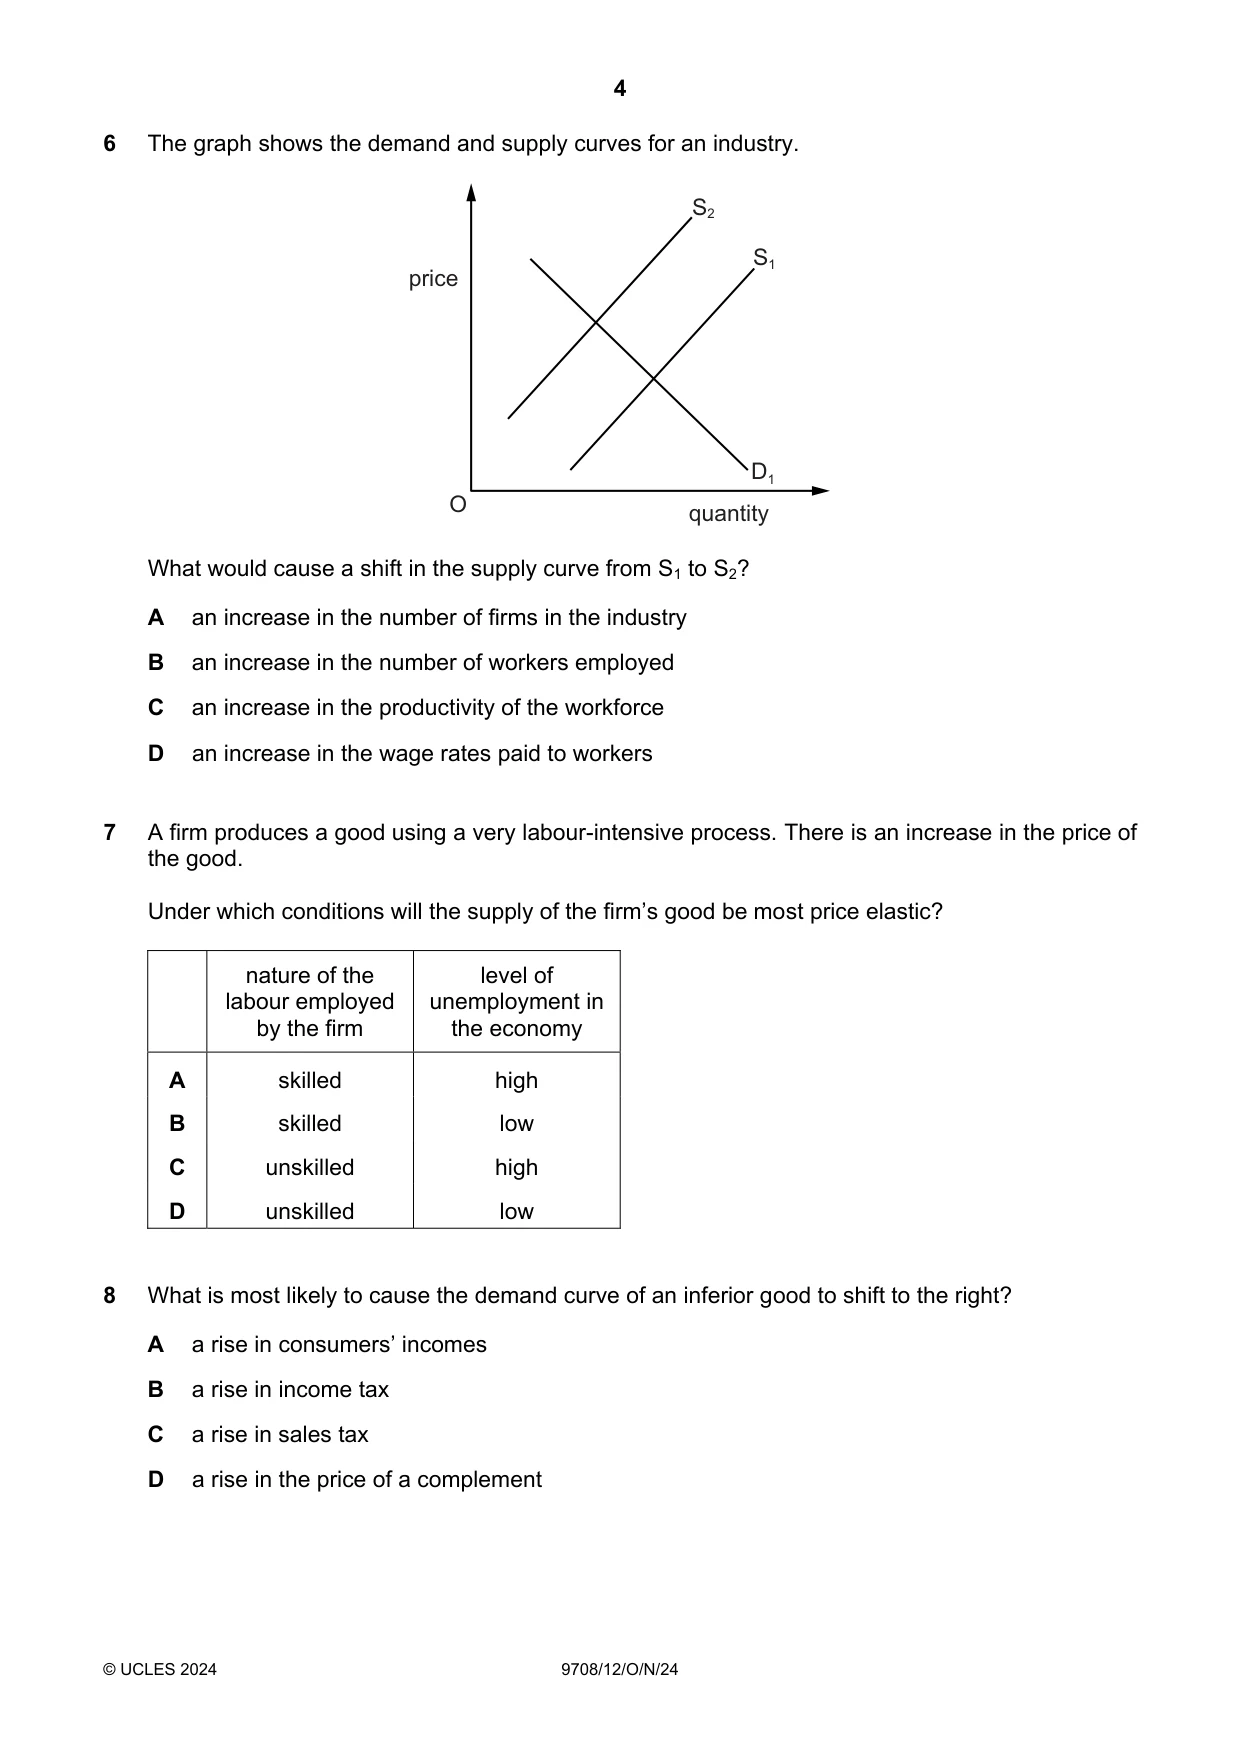
6 The graph shows the demand and supply curves for an industry. S2 S1 price D1 O quantity What would cause a shift in the supply curve from S1 to S2? A an increase in the number of firms in the industry B an increase in the number of workers employed C an increase in the productivity of the workforce D an increase in the wage rates paid to workers
Mark scheme: D
Q7 · A firm produces a good using a very labour-intensive process
7 A firm produces a good using a very labour-intensive process. There is an increase in the price of the good. Under which conditions will the supply of the firm’s good be most price elastic? nature of the level of labour employed unemployment in by the firm the economy A skilled high B skilled low C unskilled high D unskilled low
Mark scheme: C
Q8 · What is most likely to cause the demand curve of an inferior good to shift to the right?
8 What is most likely to cause the demand curve of an inferior good to shift to the right? A a rise in consumers’ incomes B a rise in income tax C a rise in sales tax D a rise in the price of a complement
Mark scheme: B
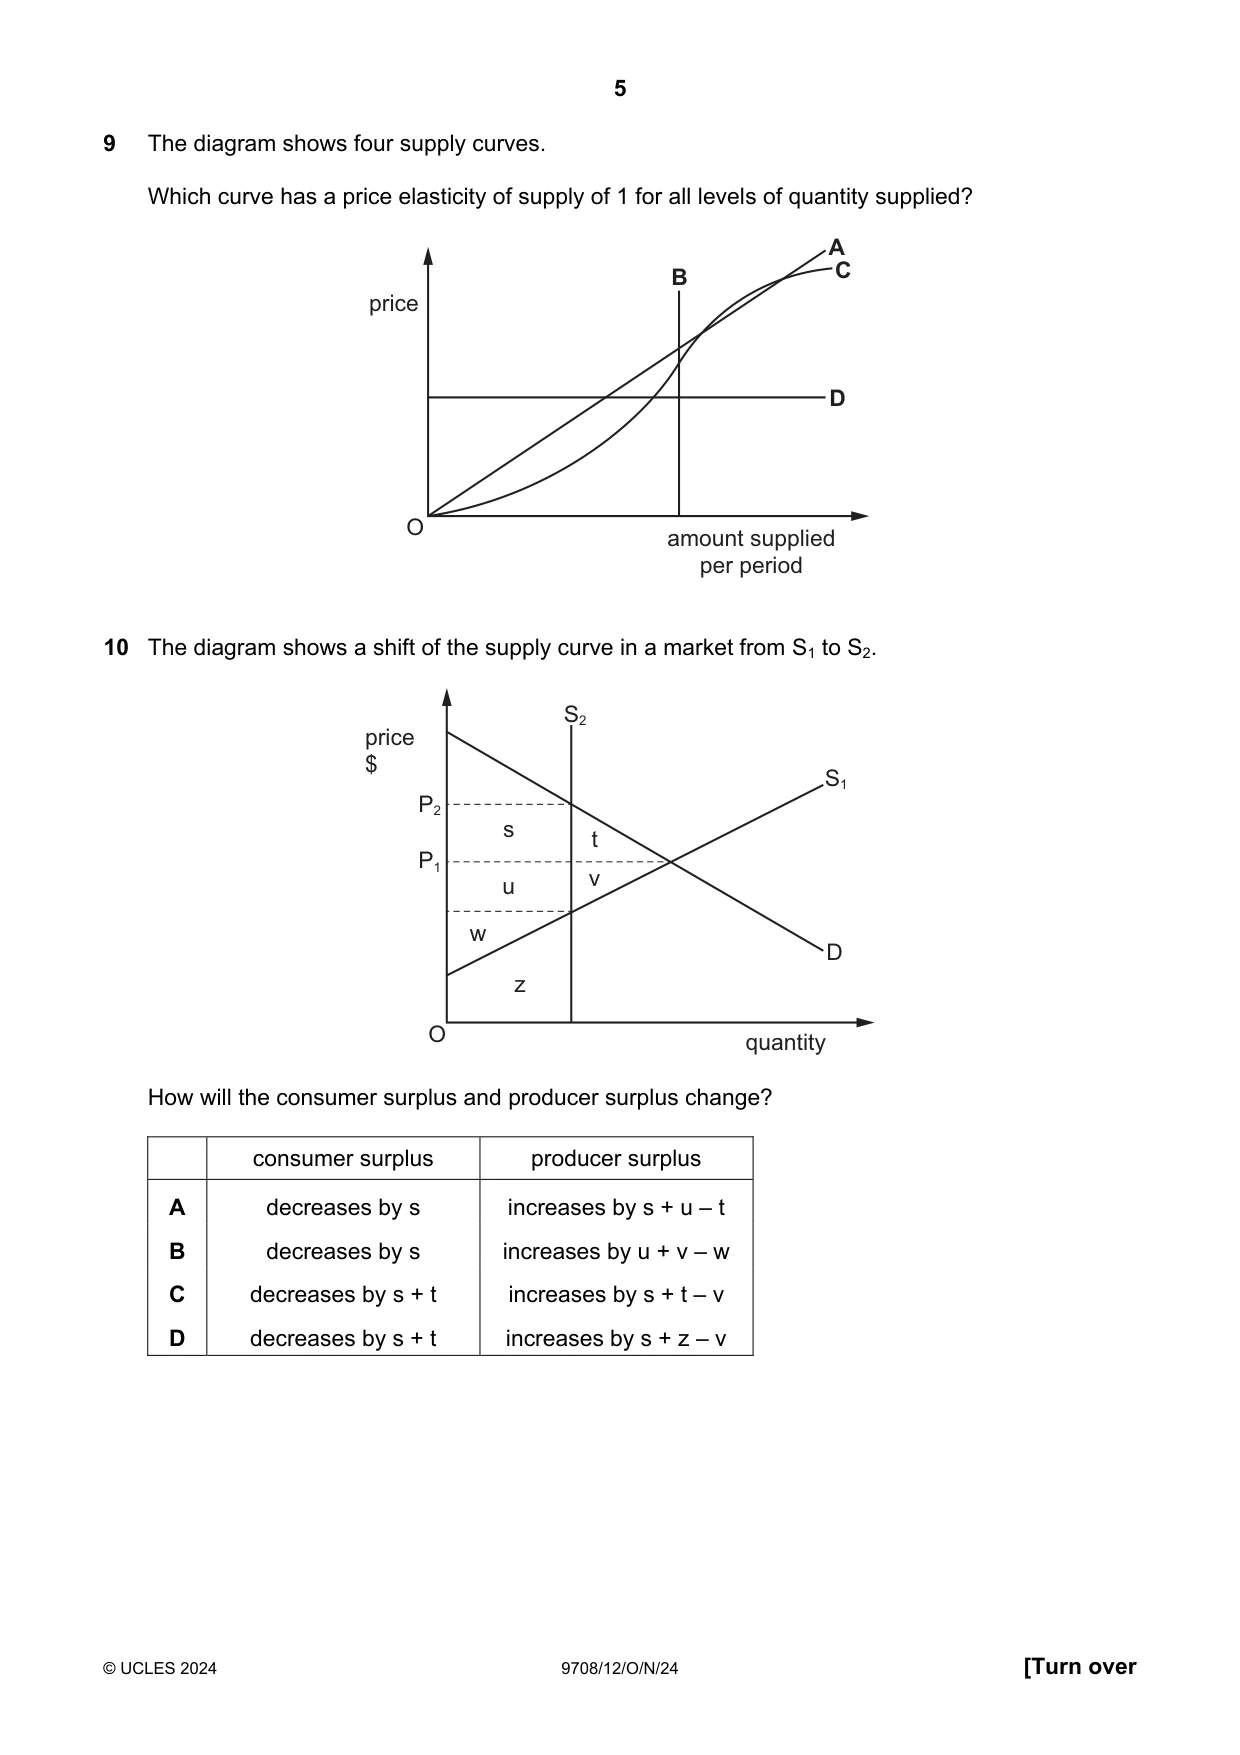
Q9 · The diagram shows four supply curves
9 The diagram shows four supply curves. Which curve has a price elasticity of supply of 1 for all levels of quantity supplied? A B C price D O amount supplied per period
Mark scheme: A
Q10 · The diagram shows a shift of the supply curve in a market from S1 to S2
10 The diagram shows a shift of the supply curve in a market from S1 to S2. S2 price $ S1 P2 s t P1 u v w D z O quantity How will the consumer surplus and producer surplus change? consumer surplus producer surplus A decreases by s increases by s + u – t B decreases by s increases by u + v – w C decreases by s + t increases by s + t – v D decreases by s + t increases by s + z – v
Mark scheme: D
Q11 · Good X has a substitute, good Y, and a complement, good Z
11 Good X has a substitute, good Y, and a complement, good Z. The price of good Y decreases and the price of good Z increases. Why might the equilibrium price of good X remain unchanged? A Producers of good X adopt new technology. B Producers of good X receive a subsidy. C Some firms stop production of good X. D The tax on the production of good X is cut.
Mark scheme: C
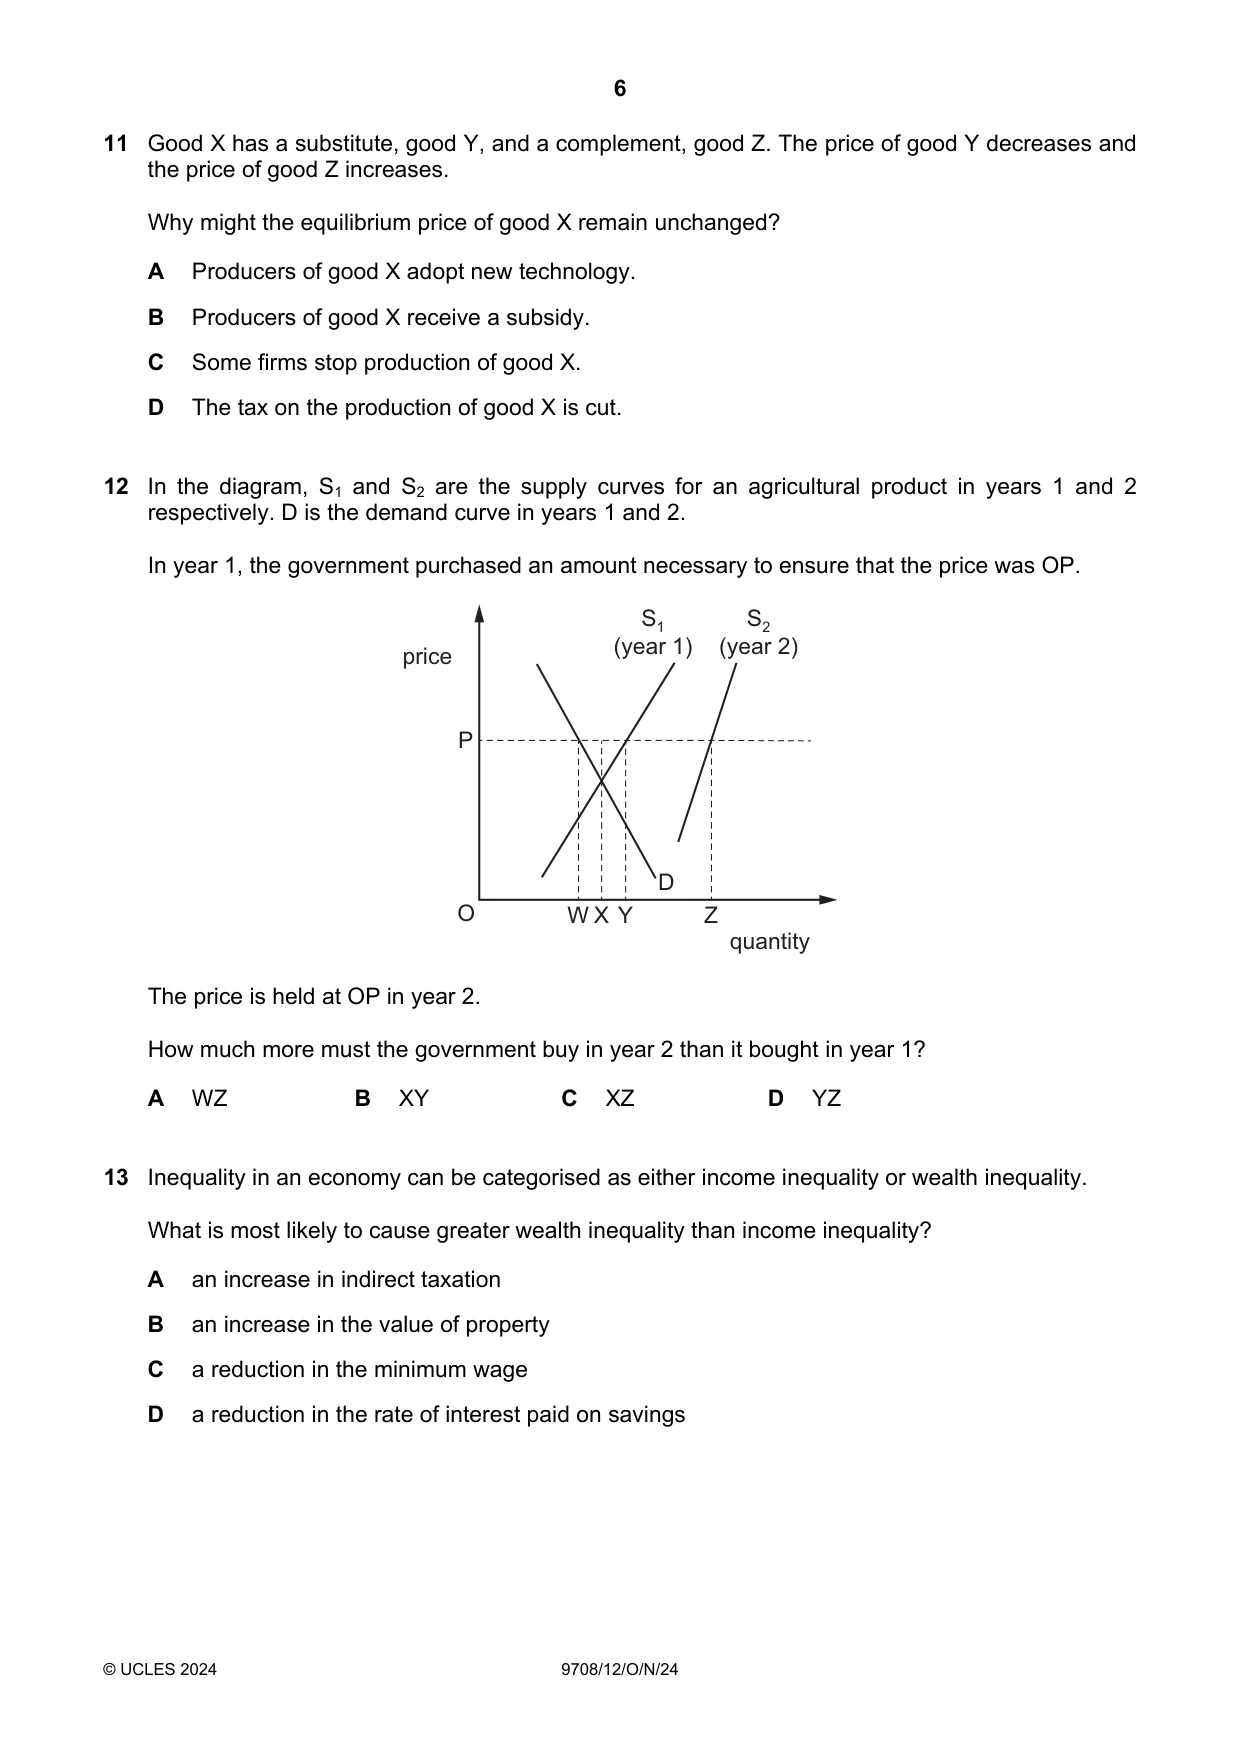
Q12 · In the diagram, S1 and S2 are the supply curves for an agricultural product in years 1…
12 In the diagram, S1 and S2 are the supply curves for an agricultural product in years 1 and 2 respectively. D is the demand curve in years 1 and 2. In year 1, the government purchased an amount necessary to ensure that the price was OP. S1 S2 price (year 1) (year 2) P D O W X Y Z quantity The price is held at OP in year 2. How much more must the government buy in year 2 than it bought in year 1? A WZ B XY C XZ D YZ
Mark scheme: D
More questions on Methods and effects of government intervention in markets
Q13 · Inequality in an economy can be categorised as either income inequality or wealth…
13 Inequality in an economy can be categorised as either income inequality or wealth inequality. What is most likely to cause greater wealth inequality than income inequality? A an increase in indirect taxation B an increase in the value of property C a reduction in the minimum wage D a reduction in the rate of interest paid on savings
Mark scheme: B
Q14 · A product with infinite elasticity of supply has sales of 1000 units a week at a price of…
14 A product with infinite elasticity of supply has sales of 1000 units a week at a price of $1 per unit. Price elasticity of demand is 1.5 over the relevant range. The government imposes a tax of 10%. What will be the government’s weekly tax revenue from this product? A $15 B $85 C $100 D $150
Mark scheme: B
More questions on Methods and effects of government intervention in markets
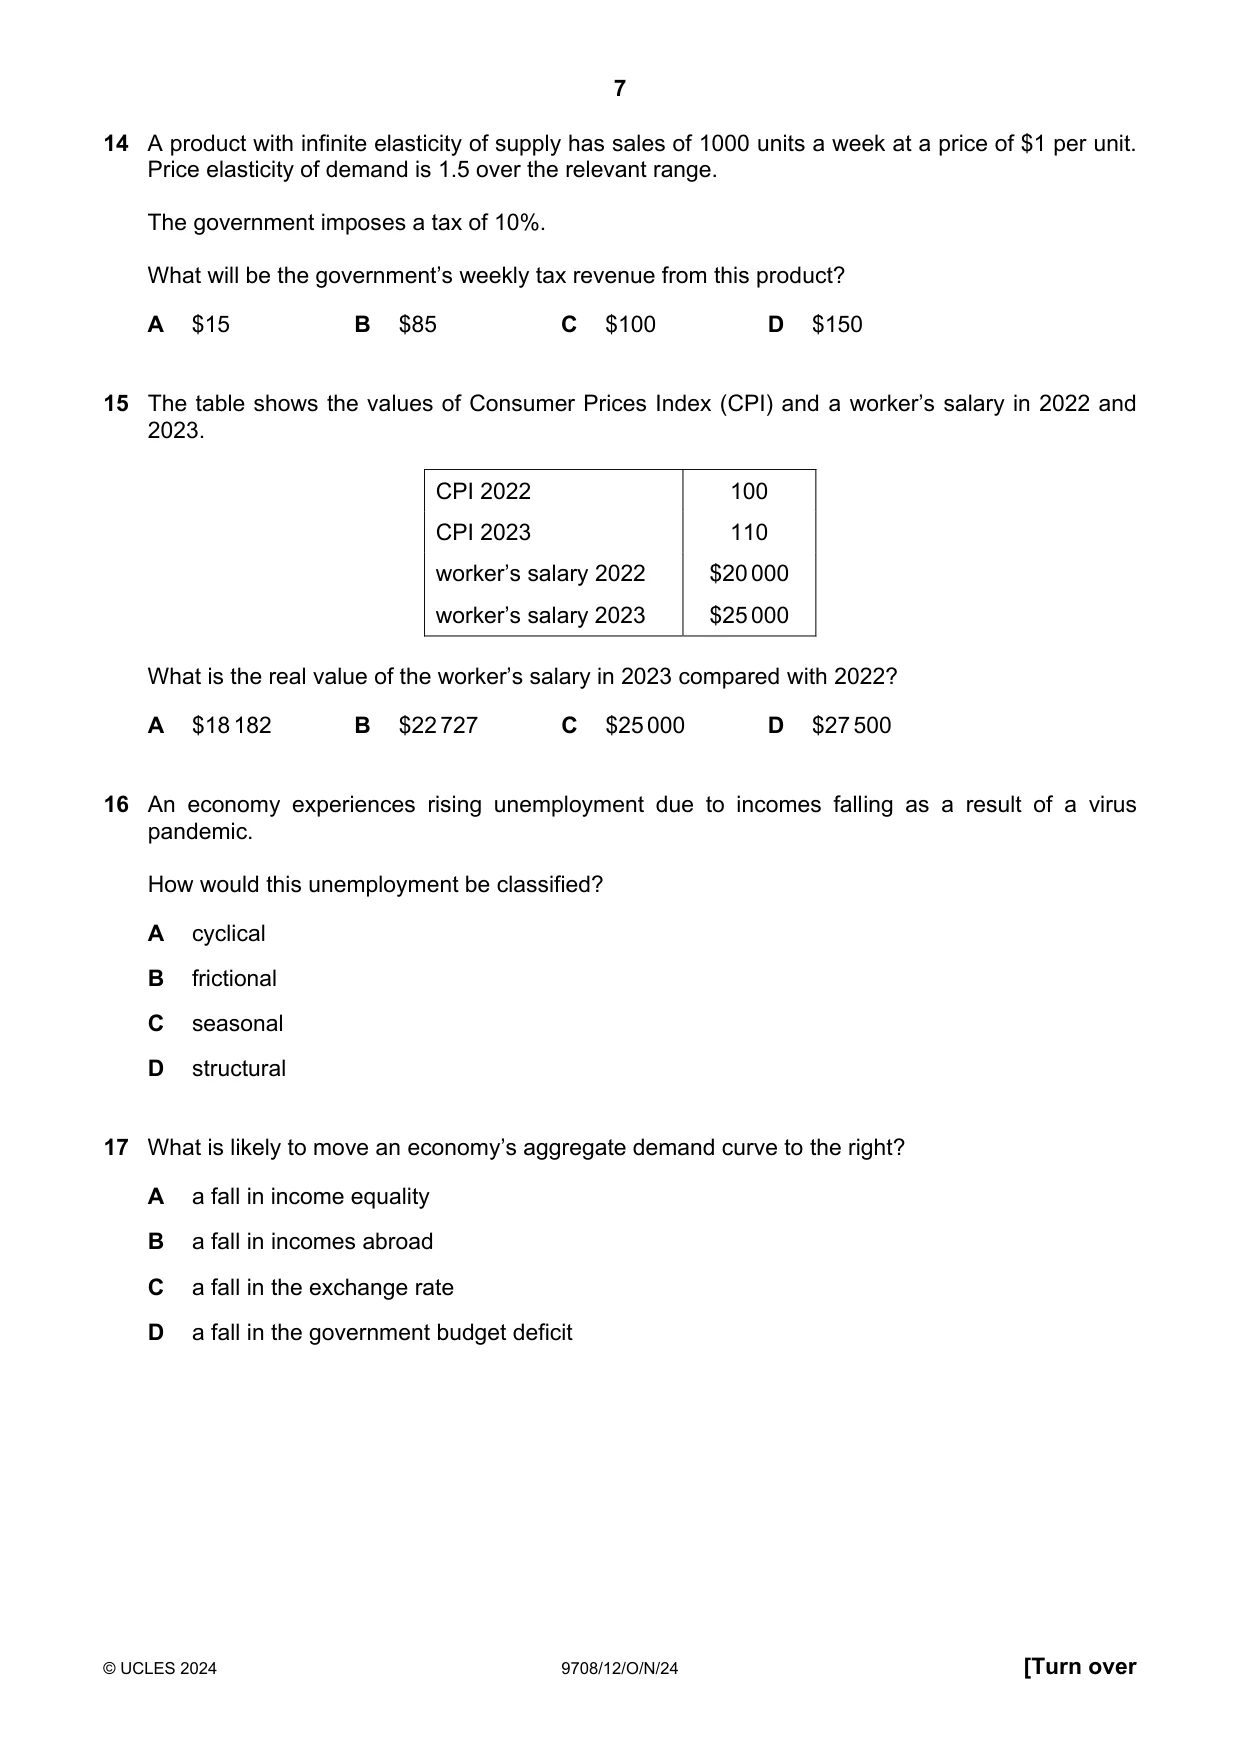
Q15 · The table shows the values of Consumer Prices Index (CPI) and a worker’s salary in 2022…
15 The table shows the values of Consumer Prices Index (CPI) and a worker’s salary in 2022 and 2023. CPI 2022 100 CPI 2023 110 worker’s salary 2022 $20 000 worker’s salary 2023 $25 000 What is the real value of the worker’s salary in 2023 compared with 2022? A $18 182 B $22 727 C $25 000 D $27 500
Mark scheme: B
Q16 · An economy experiences rising unemployment due to incomes falling as a result of a virus…
16 An economy experiences rising unemployment due to incomes falling as a result of a virus pandemic. How would this unemployment be classified? A cyclical B frictional C seasonal D structural
Mark scheme: A
Q17 · What is likely to move an economy’s aggregate demand curve to the right?
17 What is likely to move an economy’s aggregate demand curve to the right? A a fall in income equality B a fall in incomes abroad C a fall in the exchange rate D a fall in the government budget deficit
Mark scheme: C
More questions on Aggregate Demand and Aggregate Supply analysis
Q18 · Which items have to be added to and subtracted from Gross Domestic Product at market…
18 Which items have to be added to and subtracted from Gross Domestic Product at market prices to calculate the value of Gross Domestic Product at basic prices? A capital consumption and net property income from abroad B expenditure taxes and capital consumption C net property income from abroad and subsidies D subsidies and expenditure taxes
Mark scheme: D
Q19 · In an economy with an interest rate of 4% per annum, the rate of inflation falls from 5%…
19 In an economy with an interest rate of 4% per annum, the rate of inflation falls from 5% to 3% per annum. What will be a benefit of this fall? A Menu costs will fall to zero. B People on fixed incomes will be better off in real terms. C Savers will gain in real terms. D The purchasing power of the currency will rise.
Mark scheme: C
Q20 · What is an example of a macroeconomic policy?
20 What is an example of a macroeconomic policy? A encourage the consumption of merit goods B reduce pollution in the steel industry C maintain general price stability D reduce unemployment in the service sector
Mark scheme: C
More questions on Government macroeconomic policy objectives
Q21 · Which supply-side policy is likely to lower real output before raising it?
21 Which supply-side policy is likely to lower real output before raising it? A increased spending on early years education B increased spending on infrastructure C reduced import barriers D subsidies to exporters
Mark scheme: C
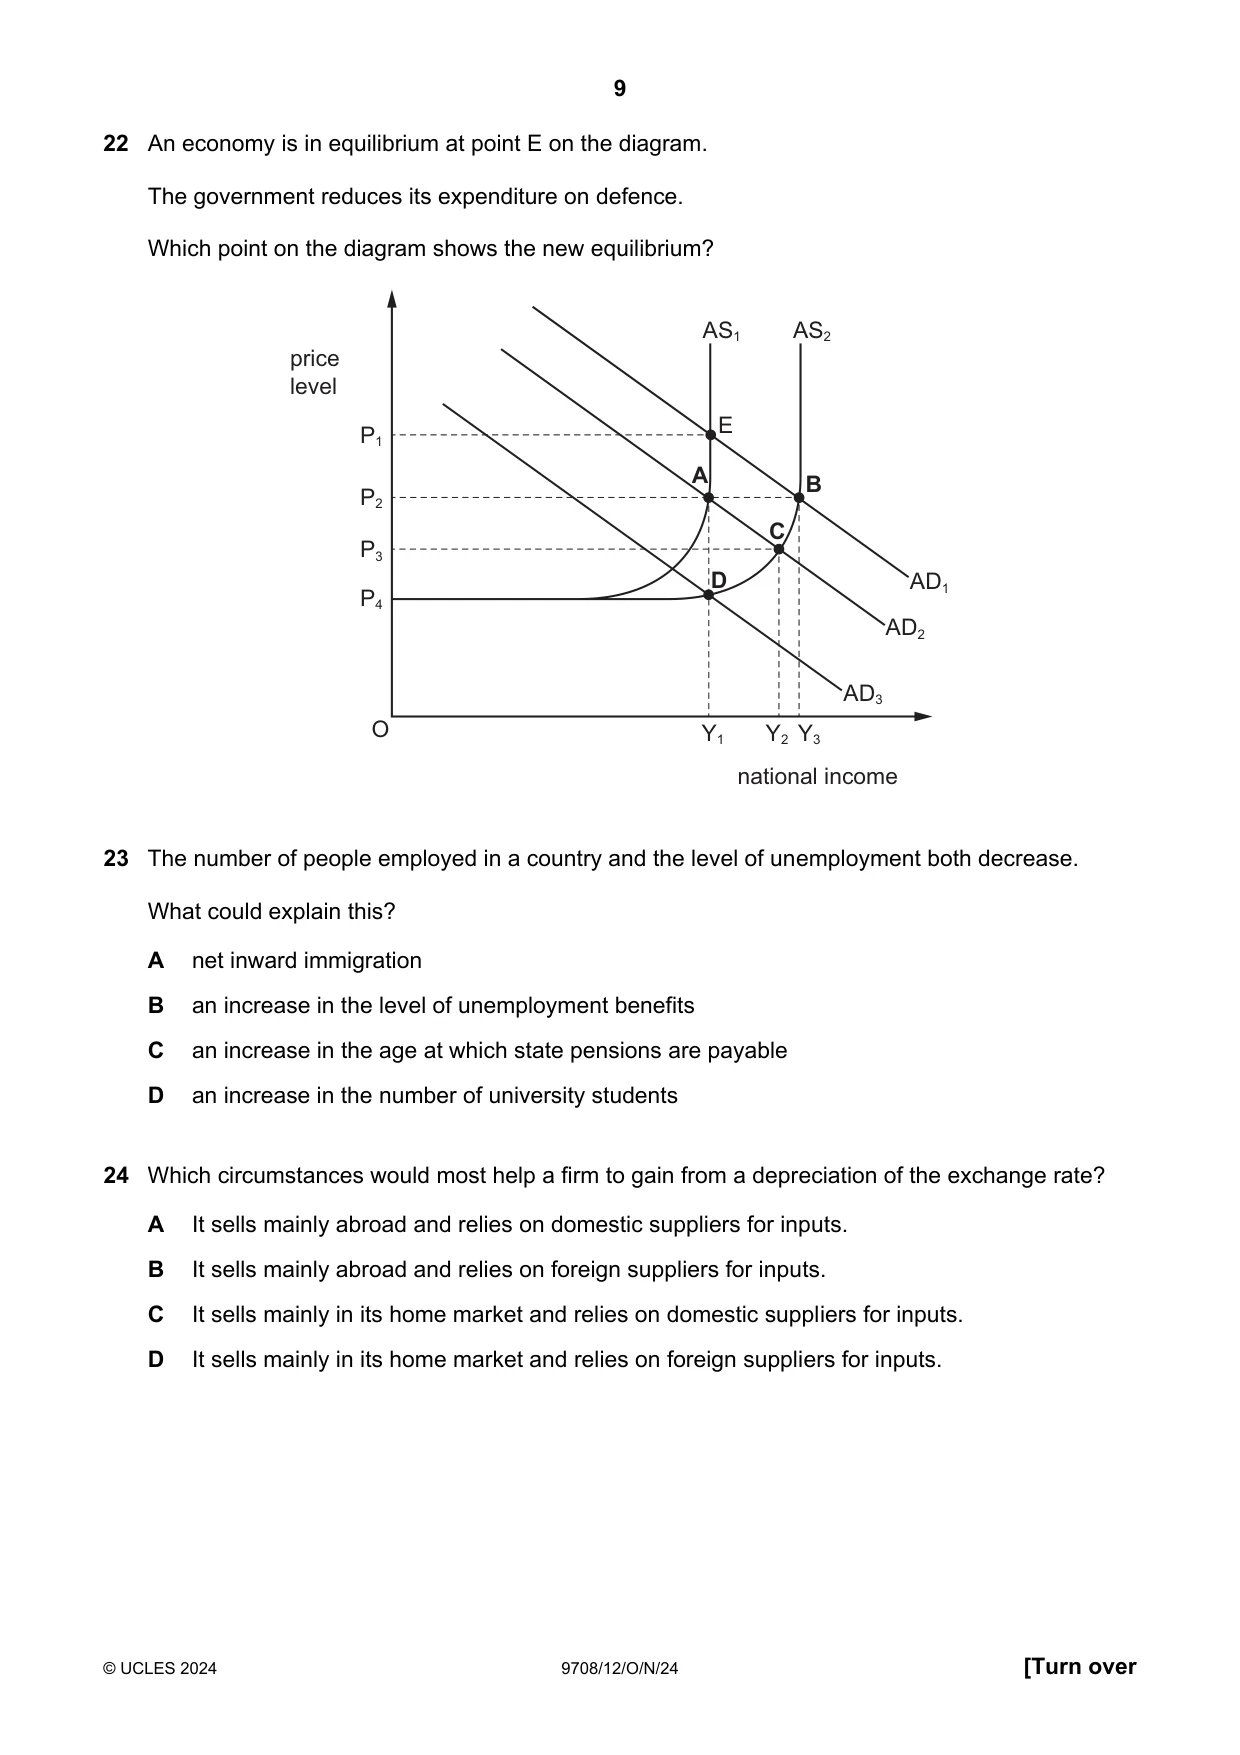
Q22 · An economy is in equilibrium at point E on the diagram
22 An economy is in equilibrium at point E on the diagram. The government reduces its expenditure on defence. Which point on the diagram shows the new equilibrium? AS1 AS2 price level P1 E A B P2 C P3 D AD1 P4 AD2 AD3 O Y1 Y2 Y3 national income
Mark scheme: A
More questions on Aggregate Demand and Aggregate Supply analysis
Q23 · The number of people employed in a country and the level of unemployment both decrease
23 The number of people employed in a country and the level of unemployment both decrease. What could explain this? A net inward immigration B an increase in the level of unemployment benefits C an increase in the age at which state pensions are payable D an increase in the number of university students
Mark scheme: D
Q24 · Which circumstances would most help a firm to gain from a depreciation of the exchange…
24 Which circumstances would most help a firm to gain from a depreciation of the exchange rate? A It sells mainly abroad and relies on domestic suppliers for inputs. B It sells mainly abroad and relies on foreign suppliers for inputs. C It sells mainly in its home market and relies on domestic suppliers for inputs. D It sells mainly in its home market and relies on foreign suppliers for inputs.
Mark scheme: A
Q25 · A country has a floating exchange rate
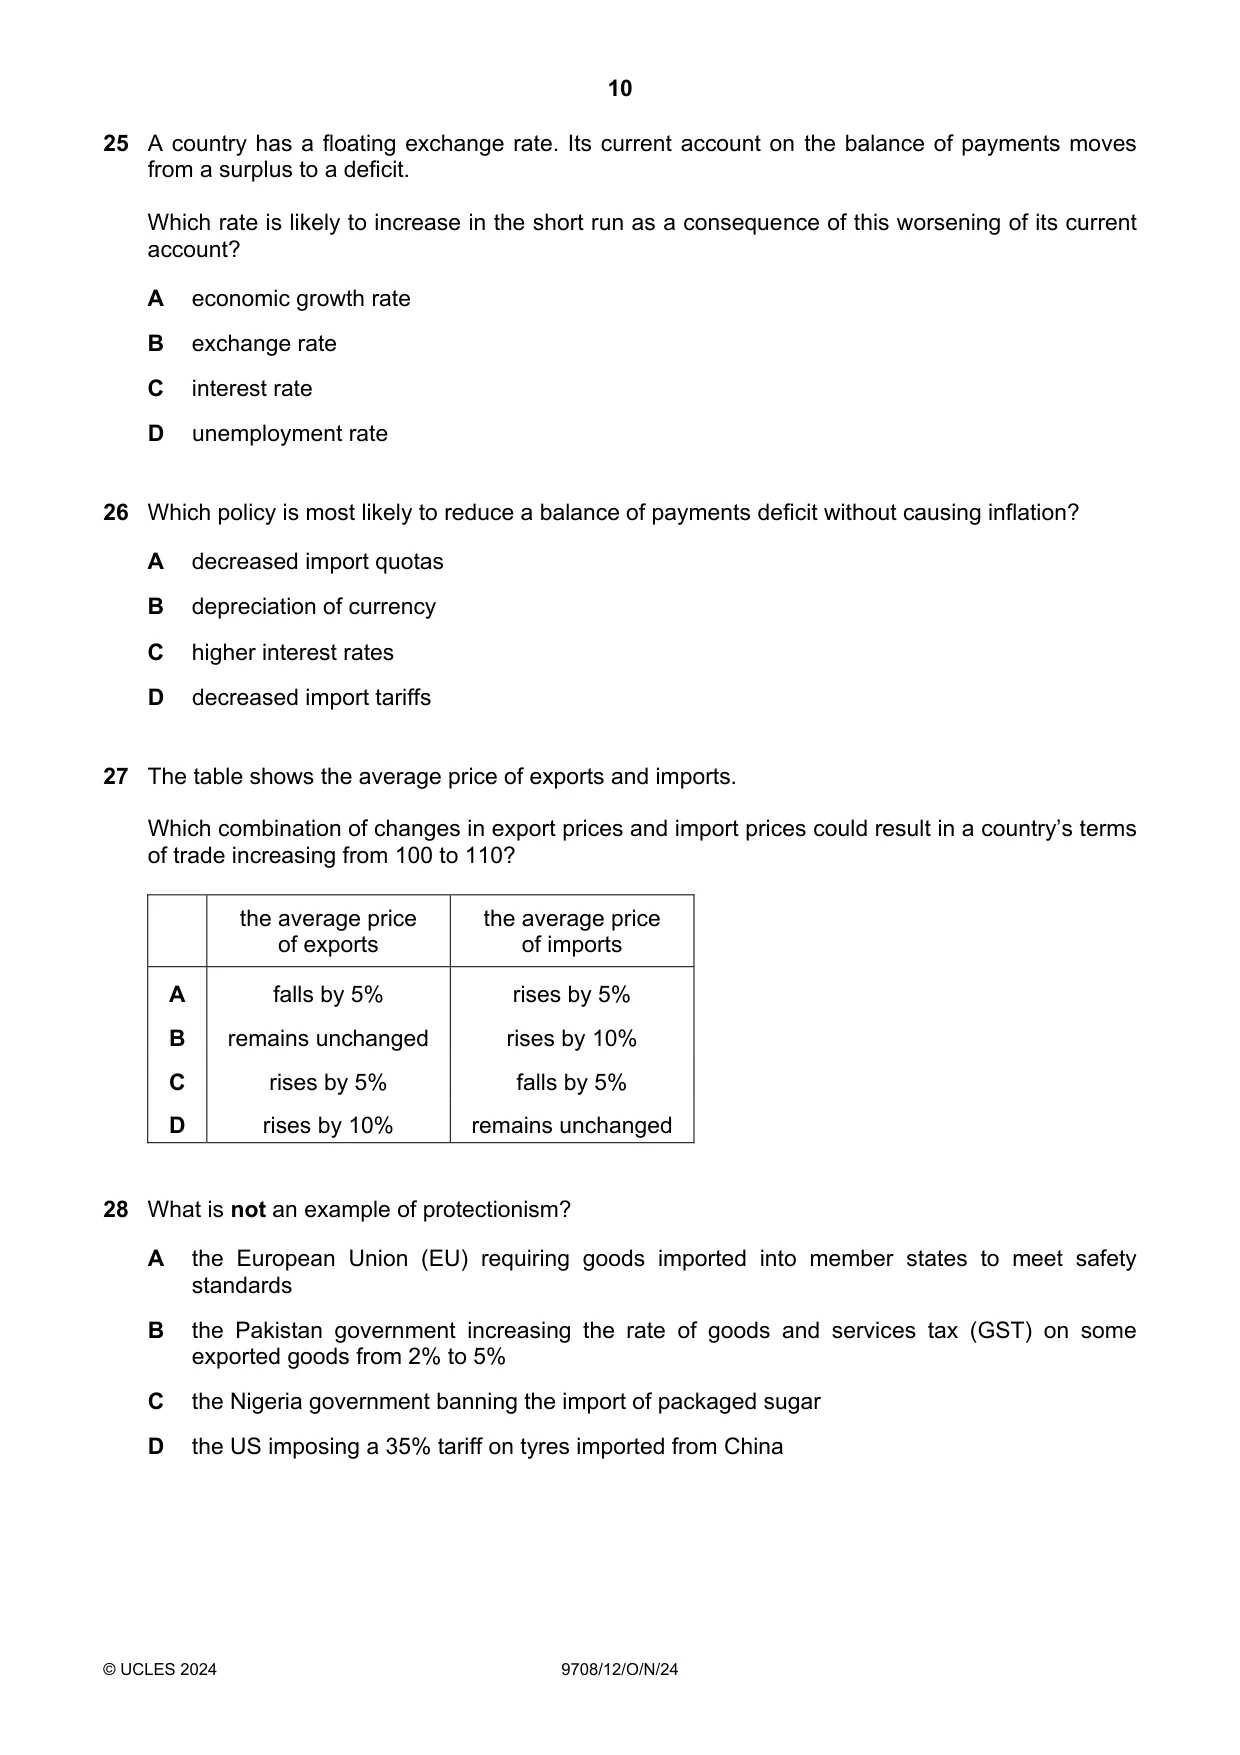
25 A country has a floating exchange rate. Its current account on the balance of payments moves from a surplus to a deficit. Which rate is likely to increase in the short run as a consequence of this worsening of its current account? A economic growth rate B exchange rate C interest rate D unemployment rate
Mark scheme: D
Q26 · Which policy is most likely to reduce a balance of payments deficit without causing…
26 Which policy is most likely to reduce a balance of payments deficit without causing inflation? A decreased import quotas B depreciation of currency C higher interest rates D decreased import tariffs
Mark scheme: C
More questions on Policies to correct imbalances in the current account of the balance of payments
Q27 · The table shows the average price of exports and imports
27 The table shows the average price of exports and imports. Which combination of changes in export prices and import prices could result in a country’s terms of trade increasing from 100 to 110? the average price the average price of exports of imports A falls by 5% rises by 5% B remains unchanged rises by 10% C rises by 5% falls by 5% D rises by 10% remains unchanged
Mark scheme: D
More questions on Current account of the balance of payments
Q28 · What is not an example of protectionism?
28 What is not an example of protectionism? A the European Union (EU) requiring goods imported into member states to meet safety standards B the Pakistan government increasing the rate of goods and services tax (GST) on some exported goods from 2% to 5% C the Nigeria government banning the import of packaged sugar D the US imposing a 35% tariff on tyres imported from China
Mark scheme: B
Q29 · Turkey imported $220 million worth of goods and services
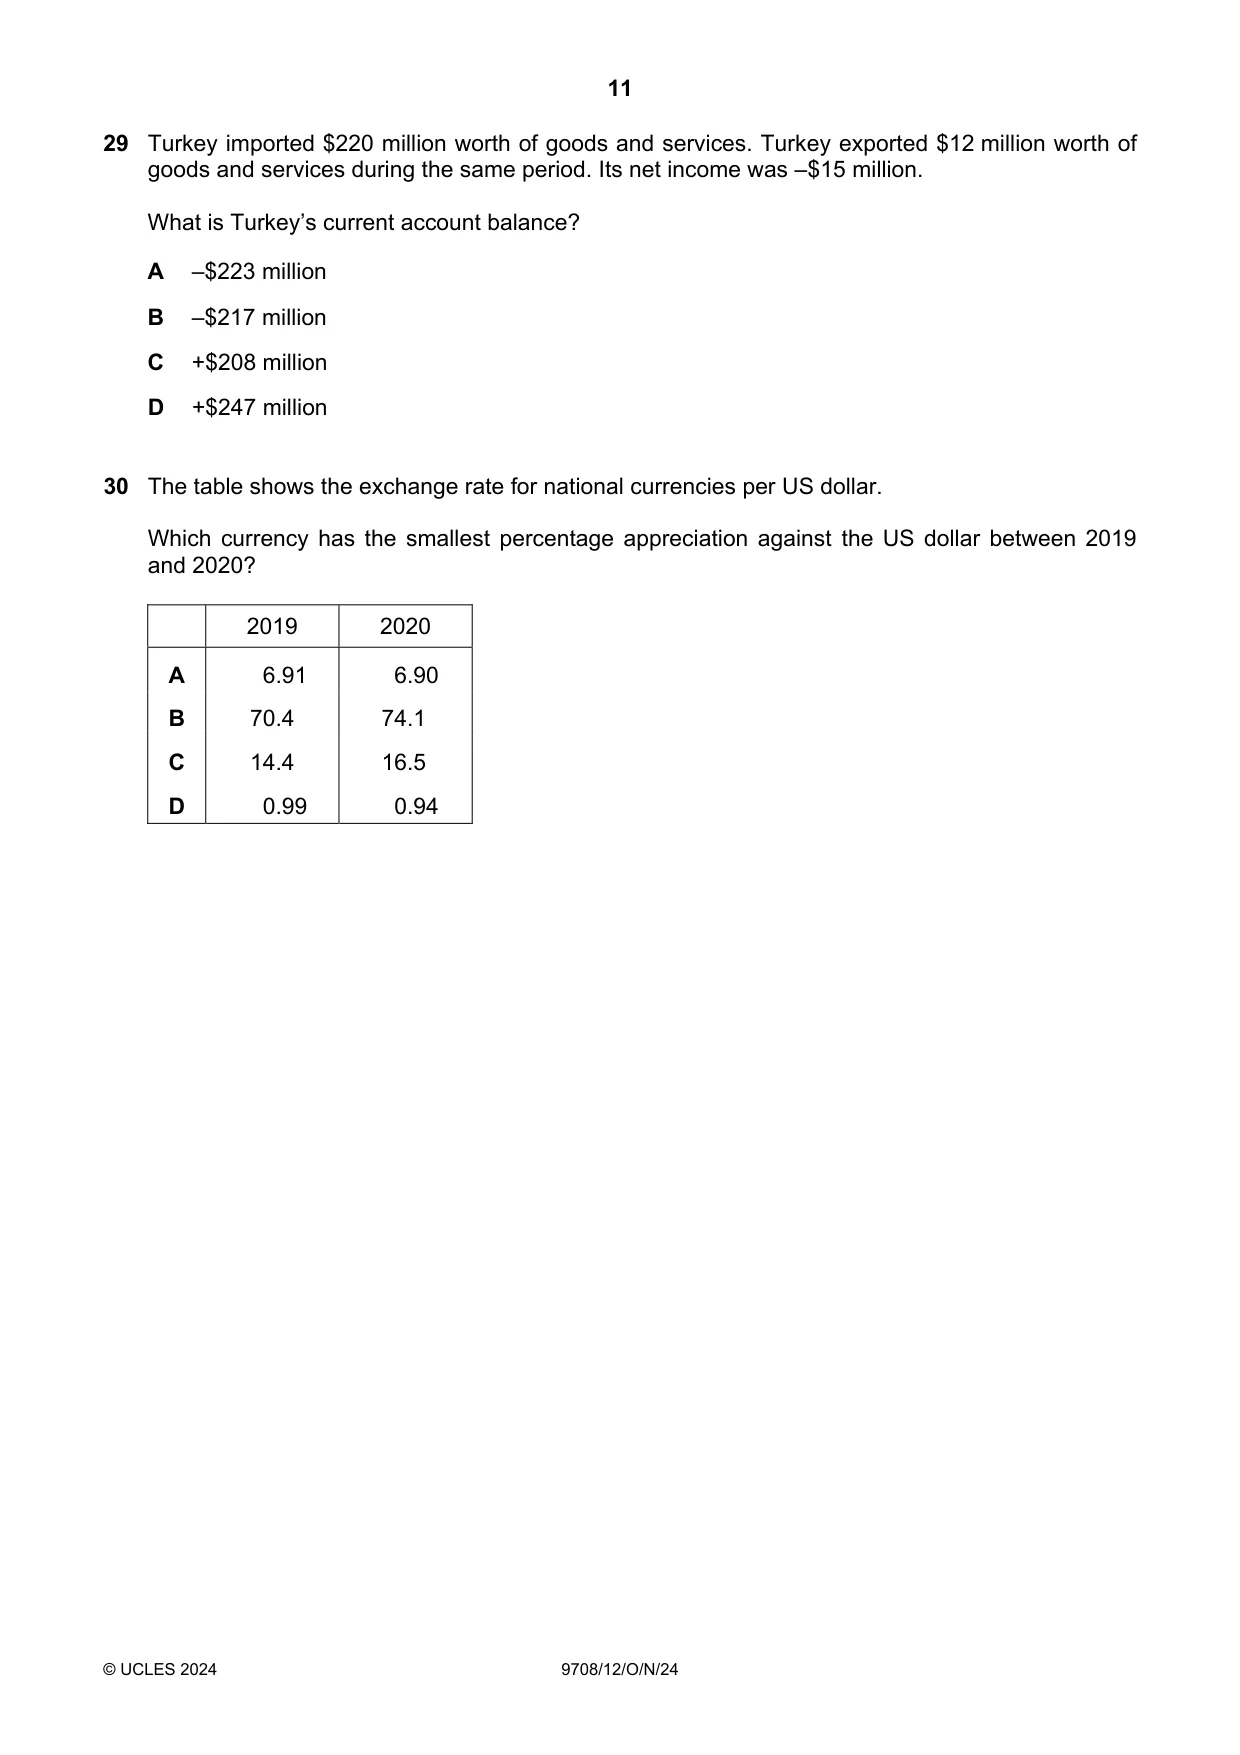
29 Turkey imported $220 million worth of goods and services. Turkey exported $12 million worth of goods and services during the same period. Its net income was –$15 million. What is Turkey’s current account balance? A –$223 million B –$217 million C +$208 million D +$247 million
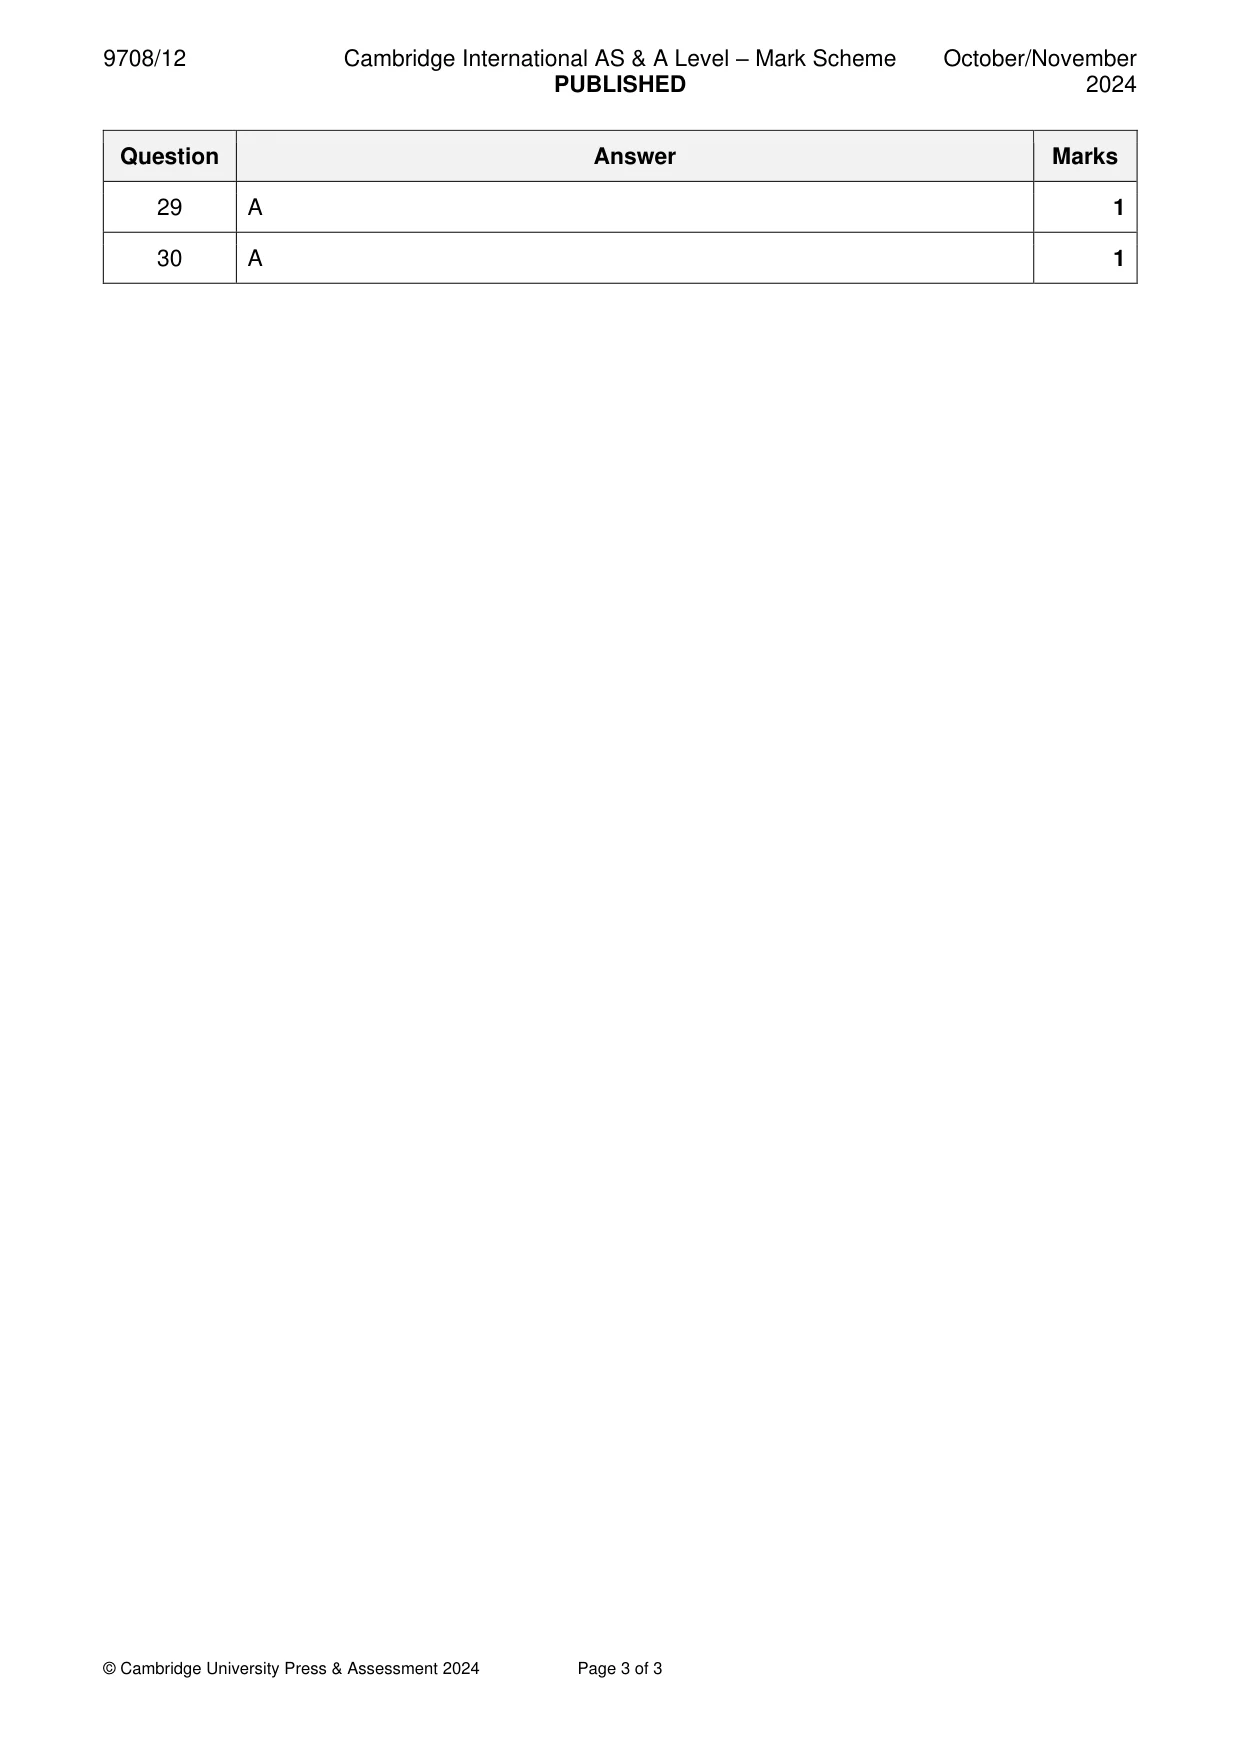
Mark scheme: A
More questions on Current account of the balance of payments
Q30 · The table shows the exchange rate for national currencies per US dollar
30 The table shows the exchange rate for national currencies per US dollar. Which currency has the smallest percentage appreciation against the US dollar between 2019 and 2020? 2019 2020 A 6.91 6.90 B 70.4 74.1 C 14.4 16.5 D 0.99 0.94
Mark scheme: A
What was in this paper
The subtopics covered by these 30 questions, and how many questions each got. Open one in a new tab to see every Cambridge question on it.
3Aggregate Demand and Aggregate Supply analysis2Current account of the balance of payments2Demand and supply curves2Factors of production2Methods and effects of government intervention in markets2National income statistics2Price elasticity of supply2Production possibility curves2Unemployment2Addressing income and wealth inequality1Consumer and producer surplus1Economic methodology1Government macroeconomic policy objectives1Policies to correct imbalances in the current account of the balance of payments1Price stability1Protectionism1Supply-side policy1The interaction of demand and supply1What you needed in this session
Cambridge’s own grade thresholds for 2024 Oct/Nov, Paper 1 · Variant 2. A higher threshold means an easier paper — the bar moves with how the cohort did.