Cambridge A Level Economics 9708 — 2019 Feb/March Paper 1 · Variant 2
9708/12/F/M/19 · 30 questions · 30 marks · ≈34 min
The question paper and its mark scheme, free to read here and free to download. This is Cambridge’s own paper, exactly as it was sat.
Question paper12 pages
Mark scheme3 pages
Answers below. Sit the paper first if you are practising.
Questions as text
Q1 · Which outcome depends upon the division of labour?
1 Which outcome depends upon the division of labour? A a decrease in boredom at work B a decrease in comparative advantage C a decrease in efficiency D a decrease in opportunity cost
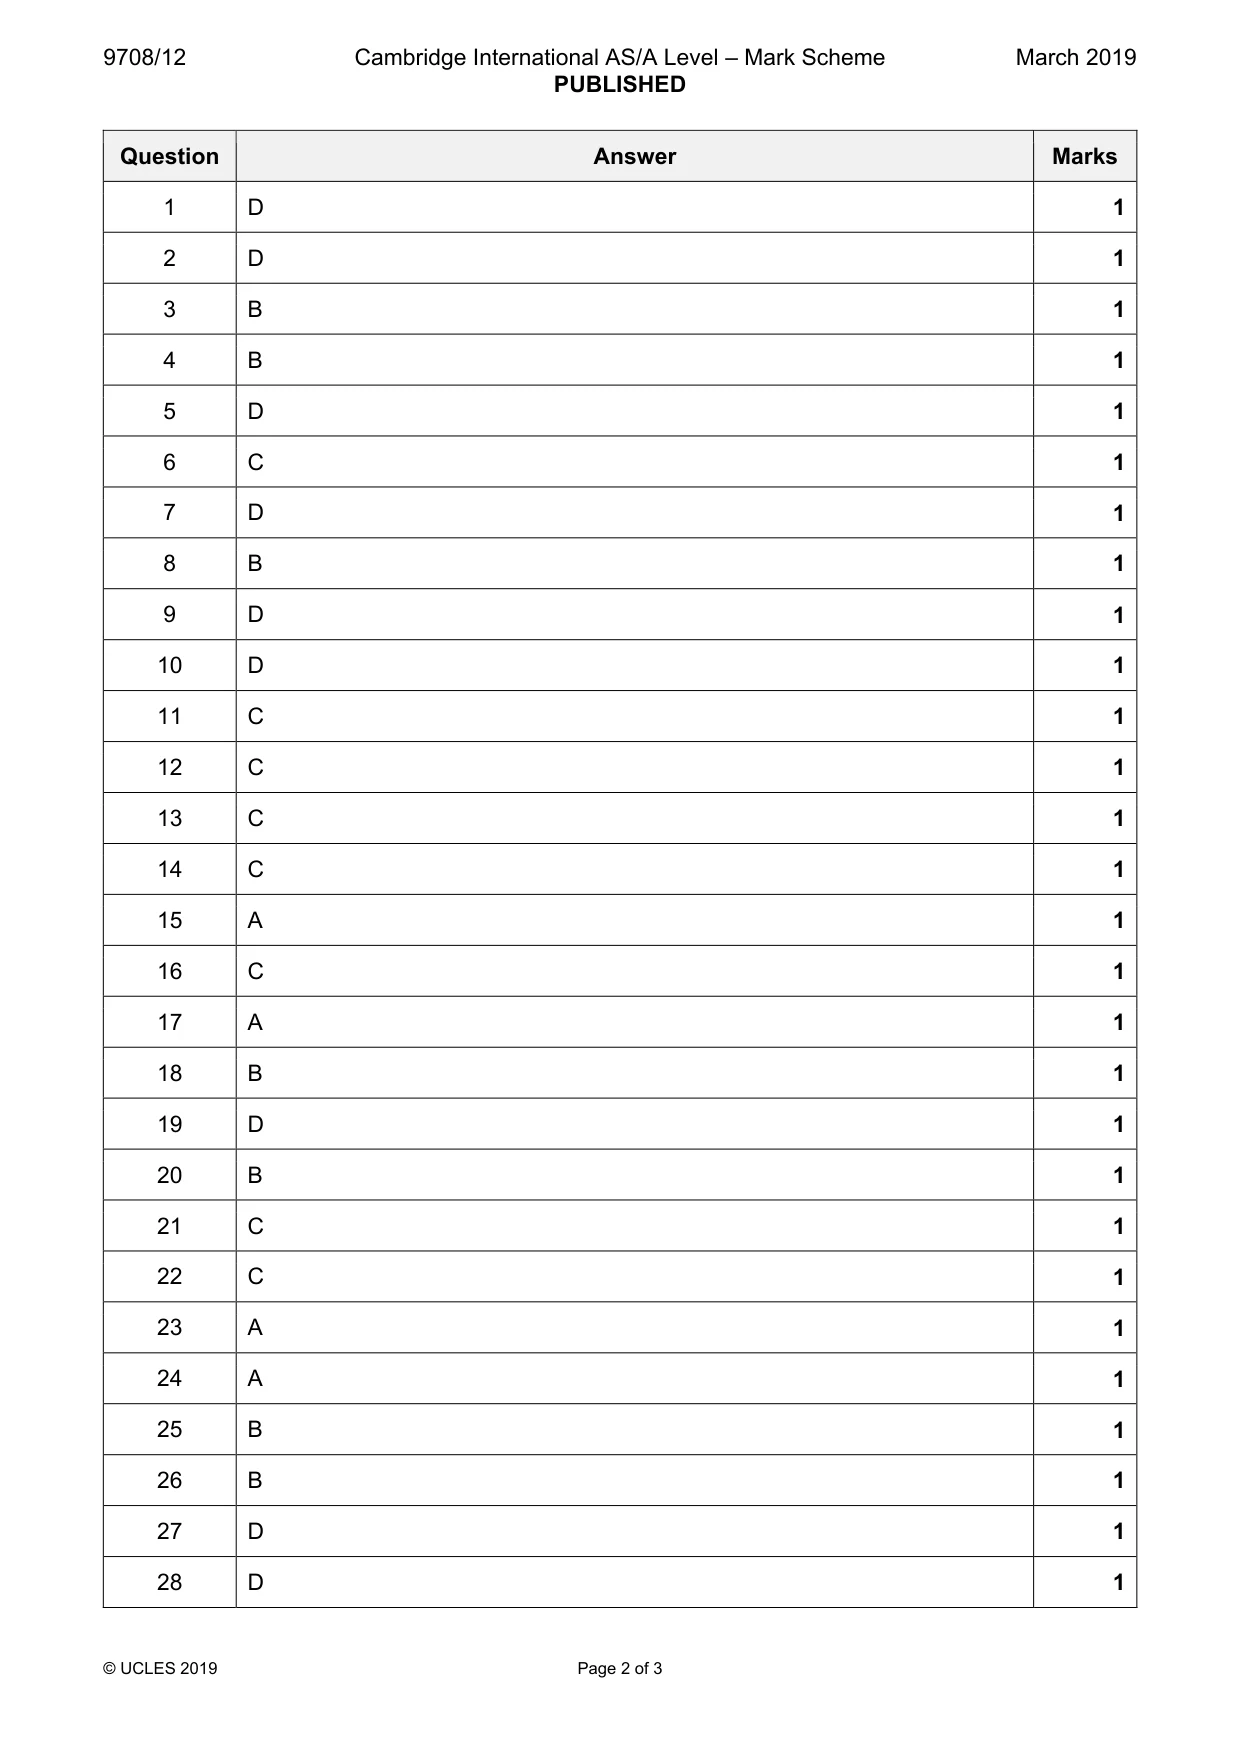
Mark scheme: D
Q2 · ‘An increase in consumption by one person leaves the benefits available to others…
2 ‘An increase in consumption by one person leaves the benefits available to others undiminished’. Which good does this statement define? A a demerit good B a merit good C a private good D a public good
Mark scheme: D
Q3 · The diagram shows a production possibility curve for a farmer
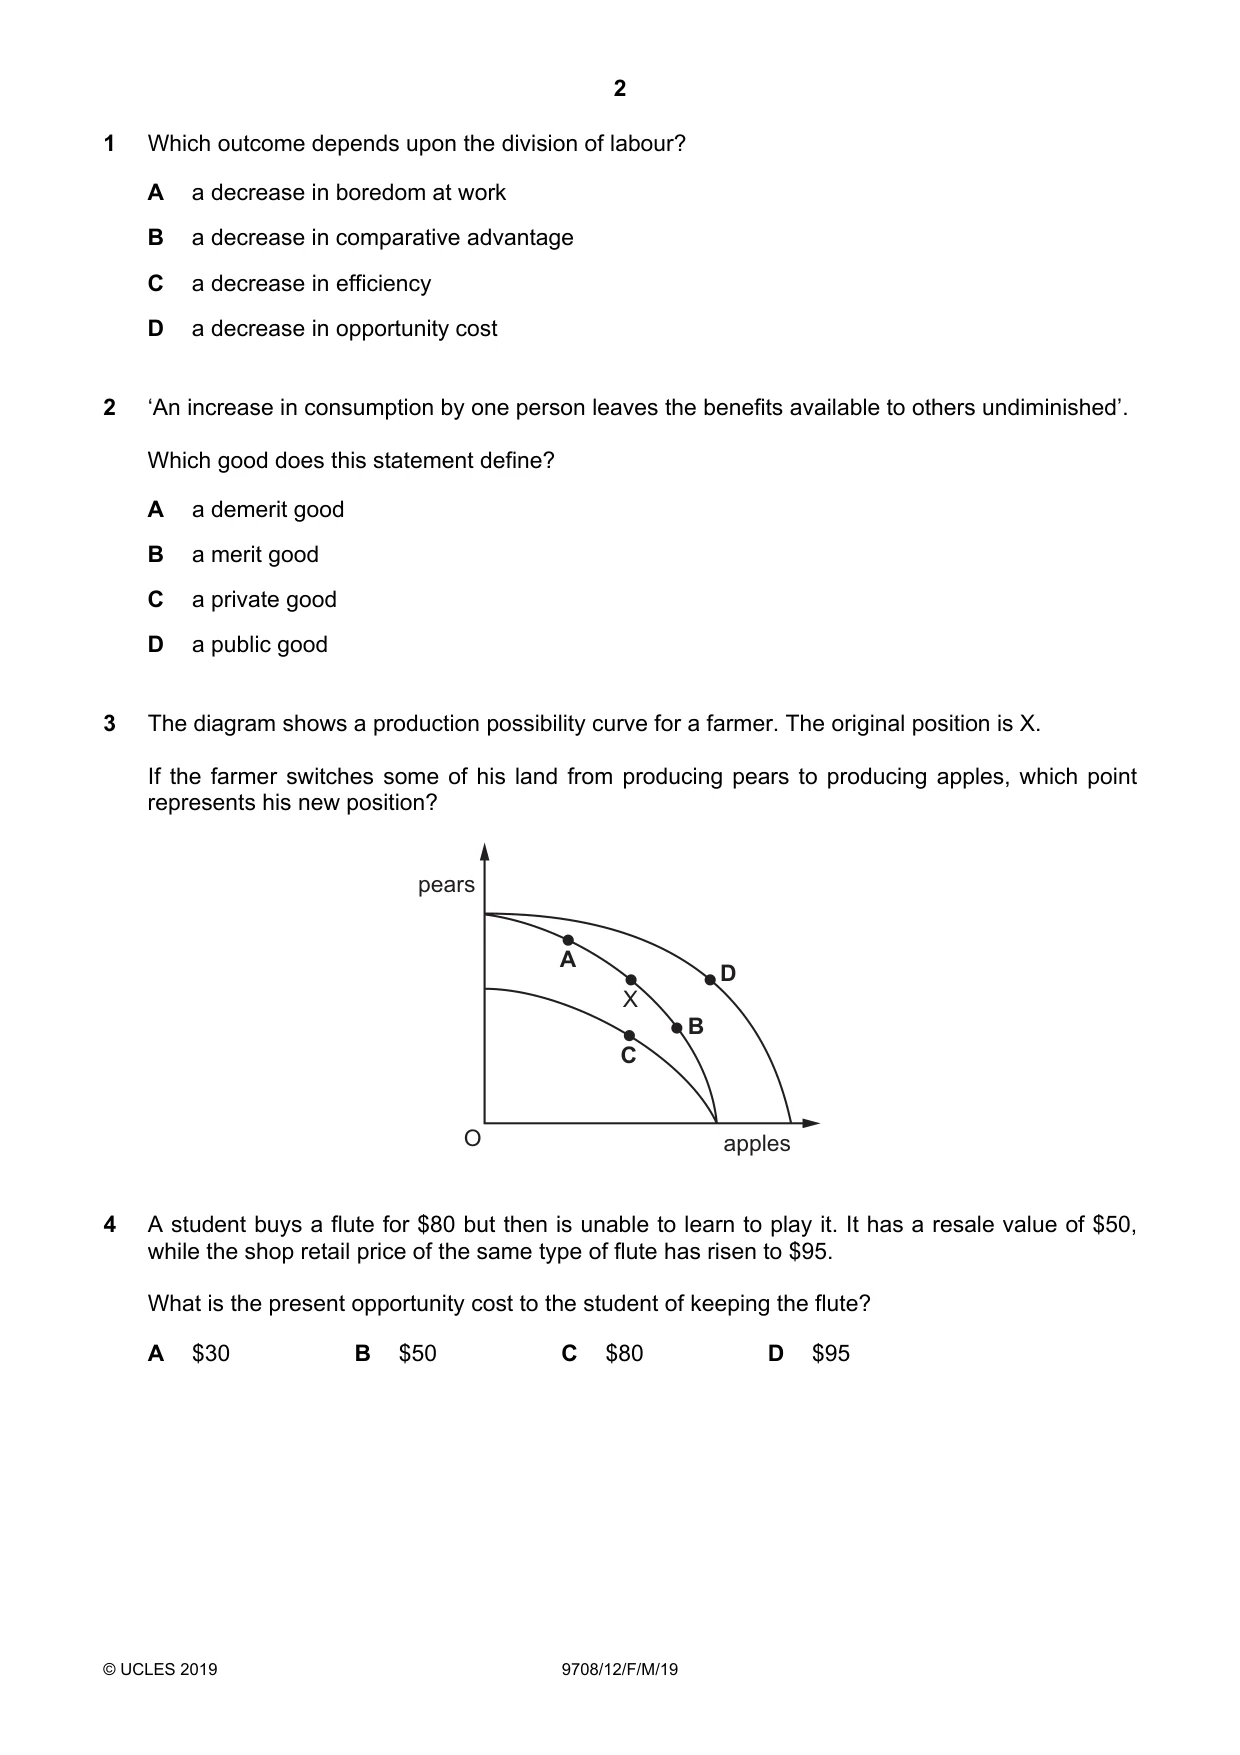
3 The diagram shows a production possibility curve for a farmer. The original position is X. If the farmer switches some of his land from producing pears to producing apples, which point represents his new position? pears A D X B C O apples
Mark scheme: B
Q4 · A student buys a flute for $80 but then is unable to learn to play it
4 A student buys a flute for $80 but then is unable to learn to play it. It has a resale value of $50, while the shop retail price of the same type of flute has risen to $95. What is the present opportunity cost to the student of keeping the flute? A $30 B $50 C $80 D $95
Mark scheme: B
Q5 · The diagram shows a supply curve for beef
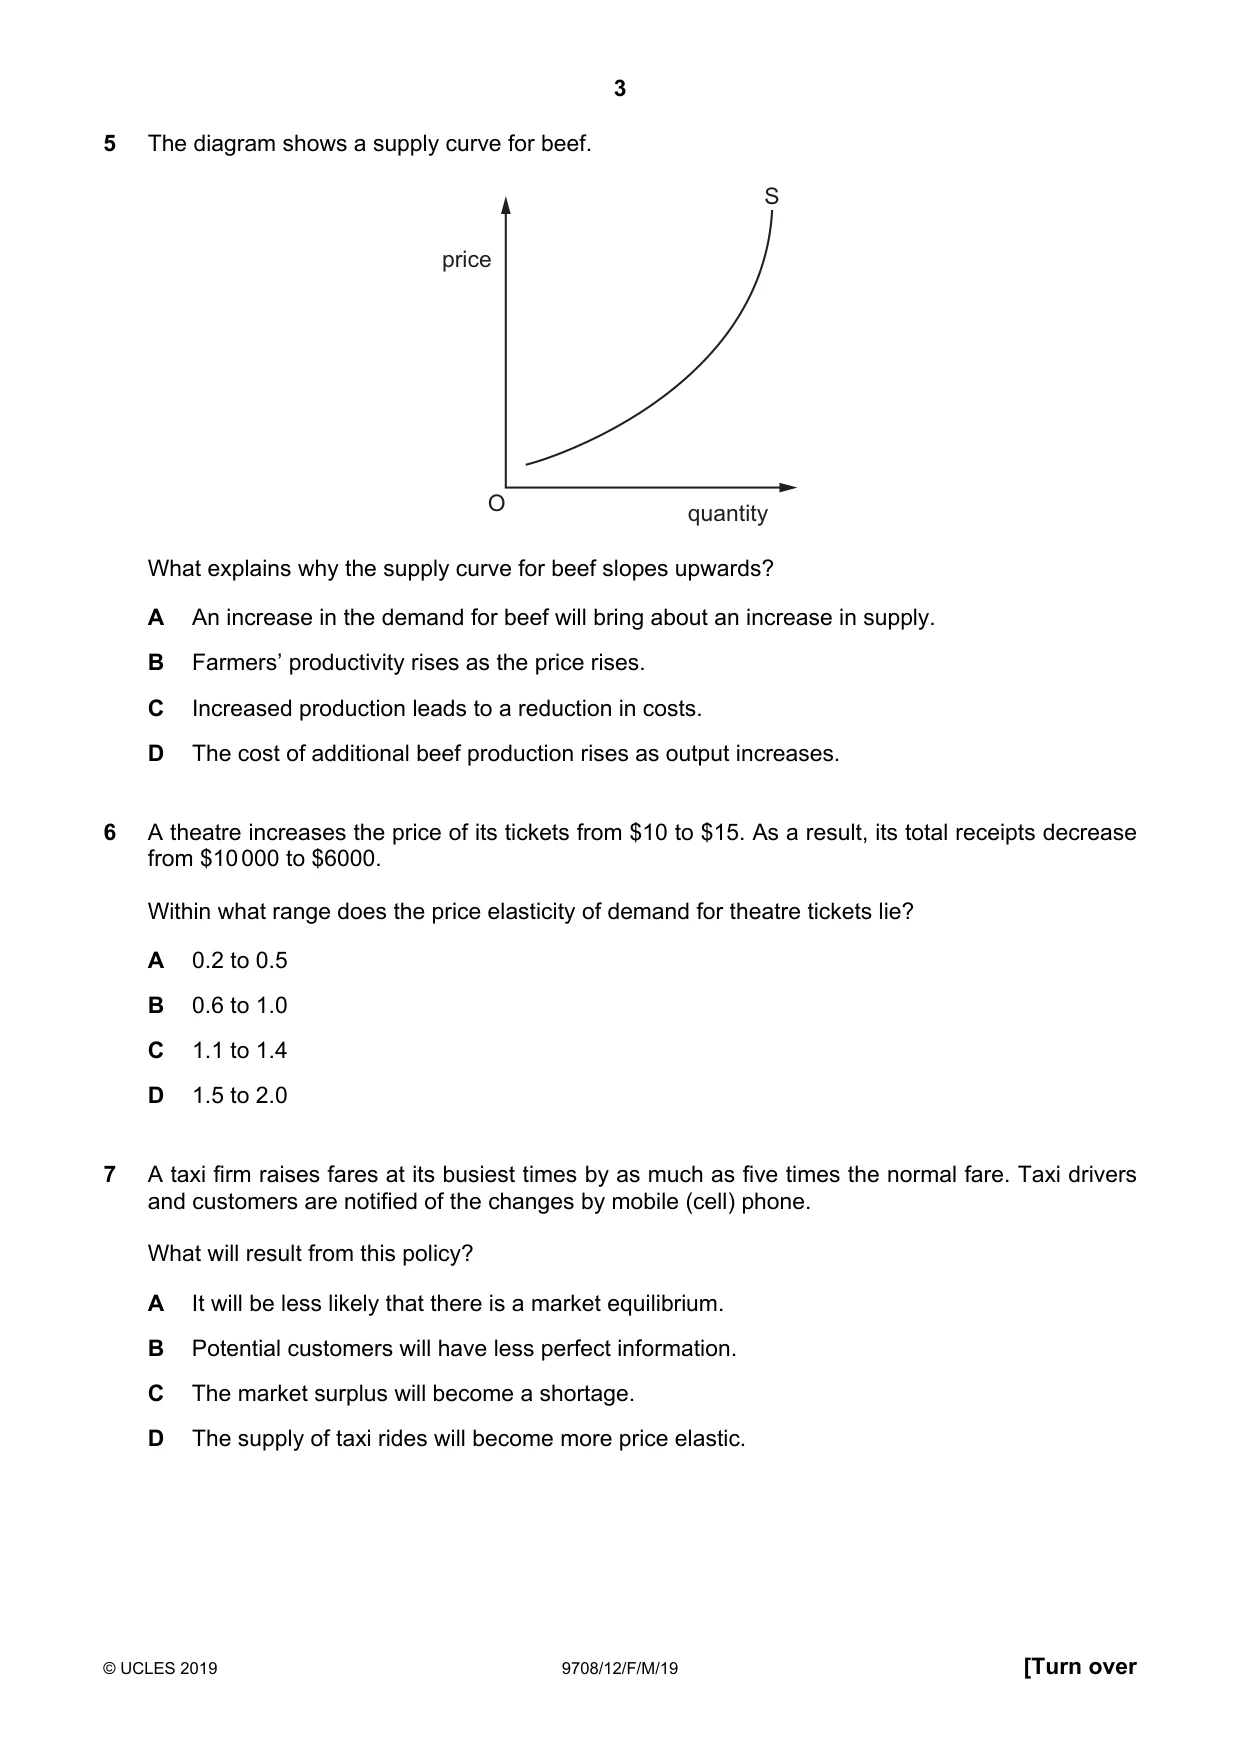
5 The diagram shows a supply curve for beef. S price O quantity What explains why the supply curve for beef slopes upwards? A An increase in the demand for beef will bring about an increase in supply. B Farmers’ productivity rises as the price rises. C Increased production leads to a reduction in costs. D The cost of additional beef production rises as output increases.
Mark scheme: D
Q6 · A theatre increases the price of its tickets from $10 to $15
6 A theatre increases the price of its tickets from $10 to $15. As a result, its total receipts decrease from $10 000 to $6000. Within what range does the price elasticity of demand for theatre tickets lie? A 0.2 to 0.5 B 0.6 to 1.0 C 1.1 to 1.4 D 1.5 to 2.0
Mark scheme: C
More questions on Price elasticity, income elasticity and cross elasticity of demand
Q7 · A taxi firm raises fares at its busiest times by as much as five times the normal fare
7 A taxi firm raises fares at its busiest times by as much as five times the normal fare. Taxi drivers and customers are notified of the changes by mobile (cell) phone. What will result from this policy? A It will be less likely that there is a market equilibrium. B Potential customers will have less perfect information. C The market surplus will become a shortage. D The supply of taxi rides will become more price elastic.
Mark scheme: D
Q8 · The table shows Shanaz’s and Sunil’s price elasticity of demand for restaurant meals and…
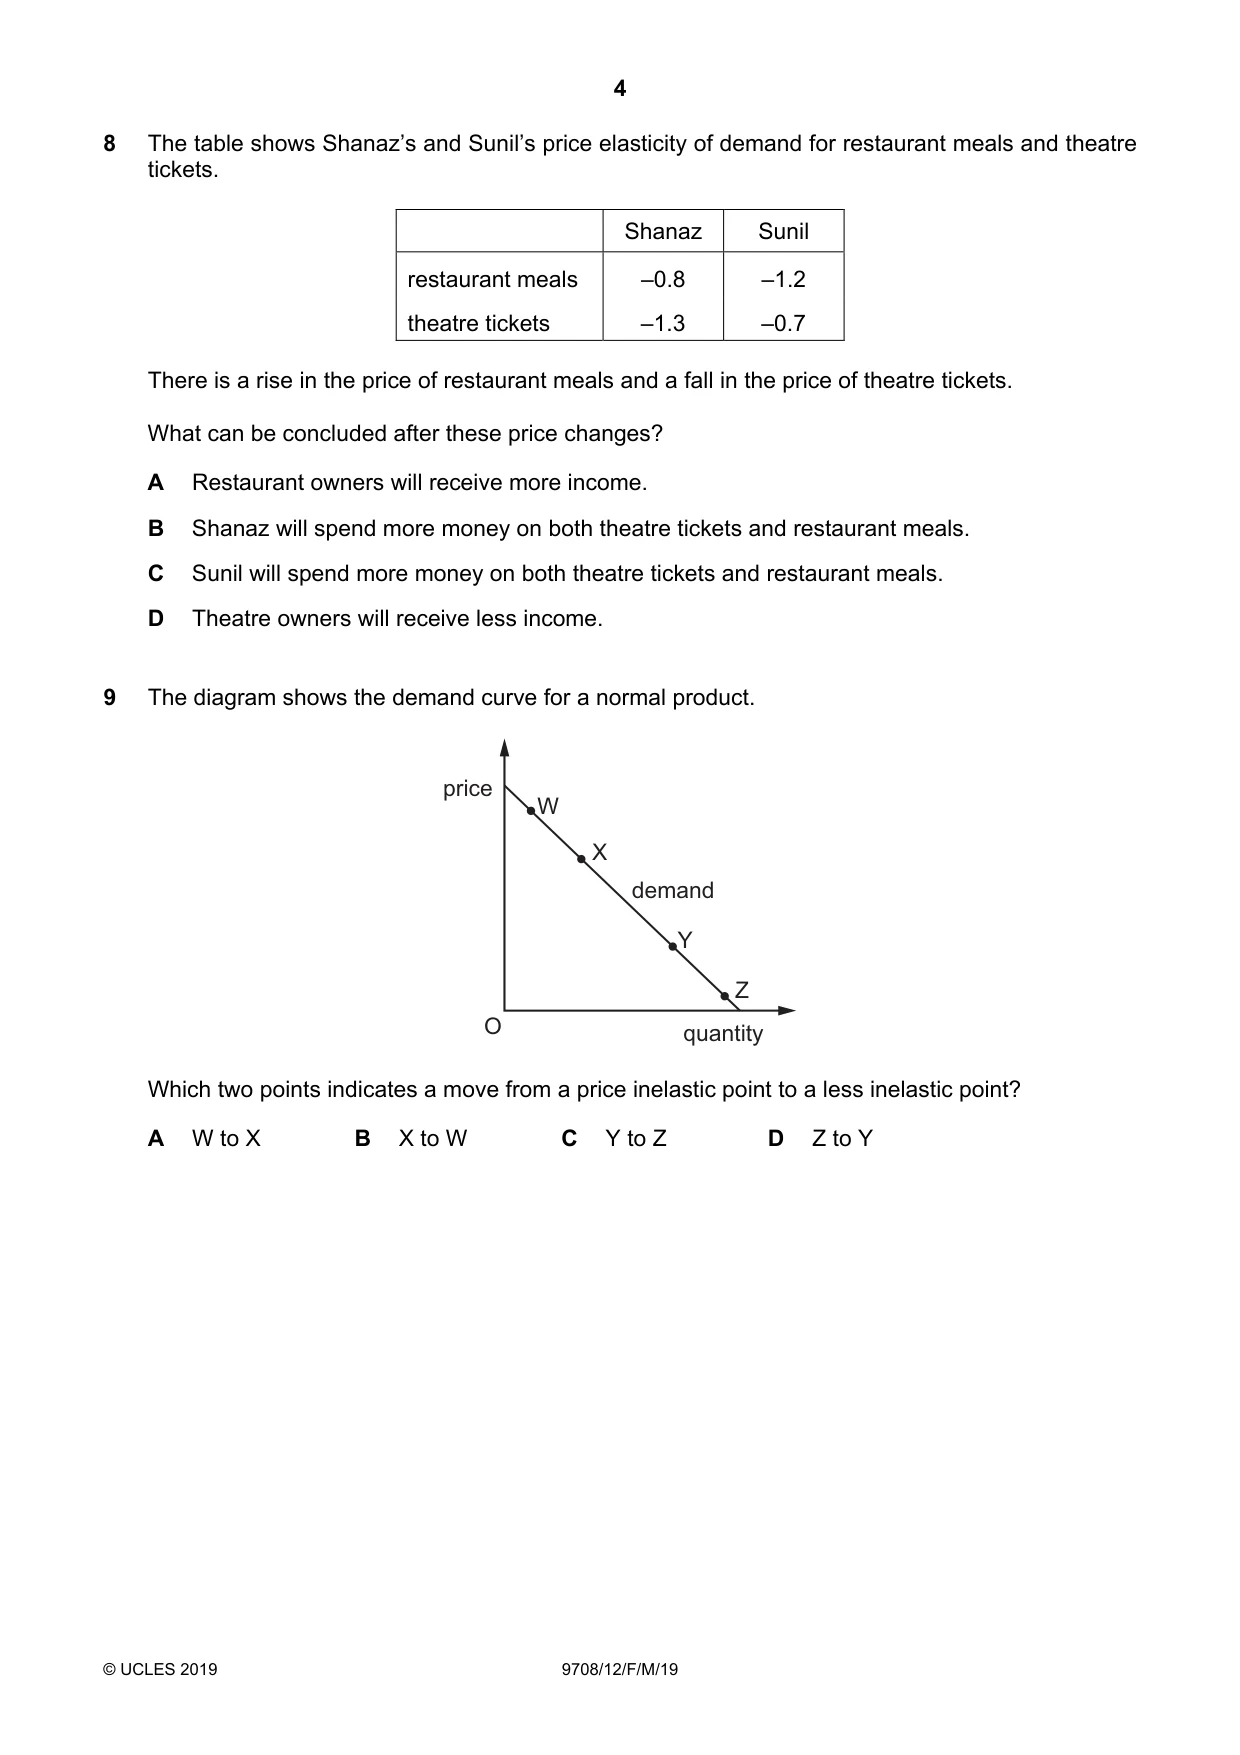
8 The table shows Shanaz’s and Sunil’s price elasticity of demand for restaurant meals and theatre tickets. Shanaz Sunil restaurant meals –0.8 –1.2 theatre tickets –1.3 –0.7 There is a rise in the price of restaurant meals and a fall in the price of theatre tickets. What can be concluded after these price changes? A Restaurant owners will receive more income. B Shanaz will spend more money on both theatre tickets and restaurant meals. C Sunil will spend more money on both theatre tickets and restaurant meals. D Theatre owners will receive less income.
Mark scheme: B
More questions on Price elasticity, income elasticity and cross elasticity of demand
Q9 · The diagram shows the demand curve for a normal product
9 The diagram shows the demand curve for a normal product. price W X demand Y Z O quantity Which two points indicates a move from a price inelastic point to a less inelastic point? A W to X B X to W C Y to Z D Z to Y
Mark scheme: D
More questions on Price elasticity, income elasticity and cross elasticity of demand
Q10 · In the diagram, the supply of a product increases while the demand curve does not shift
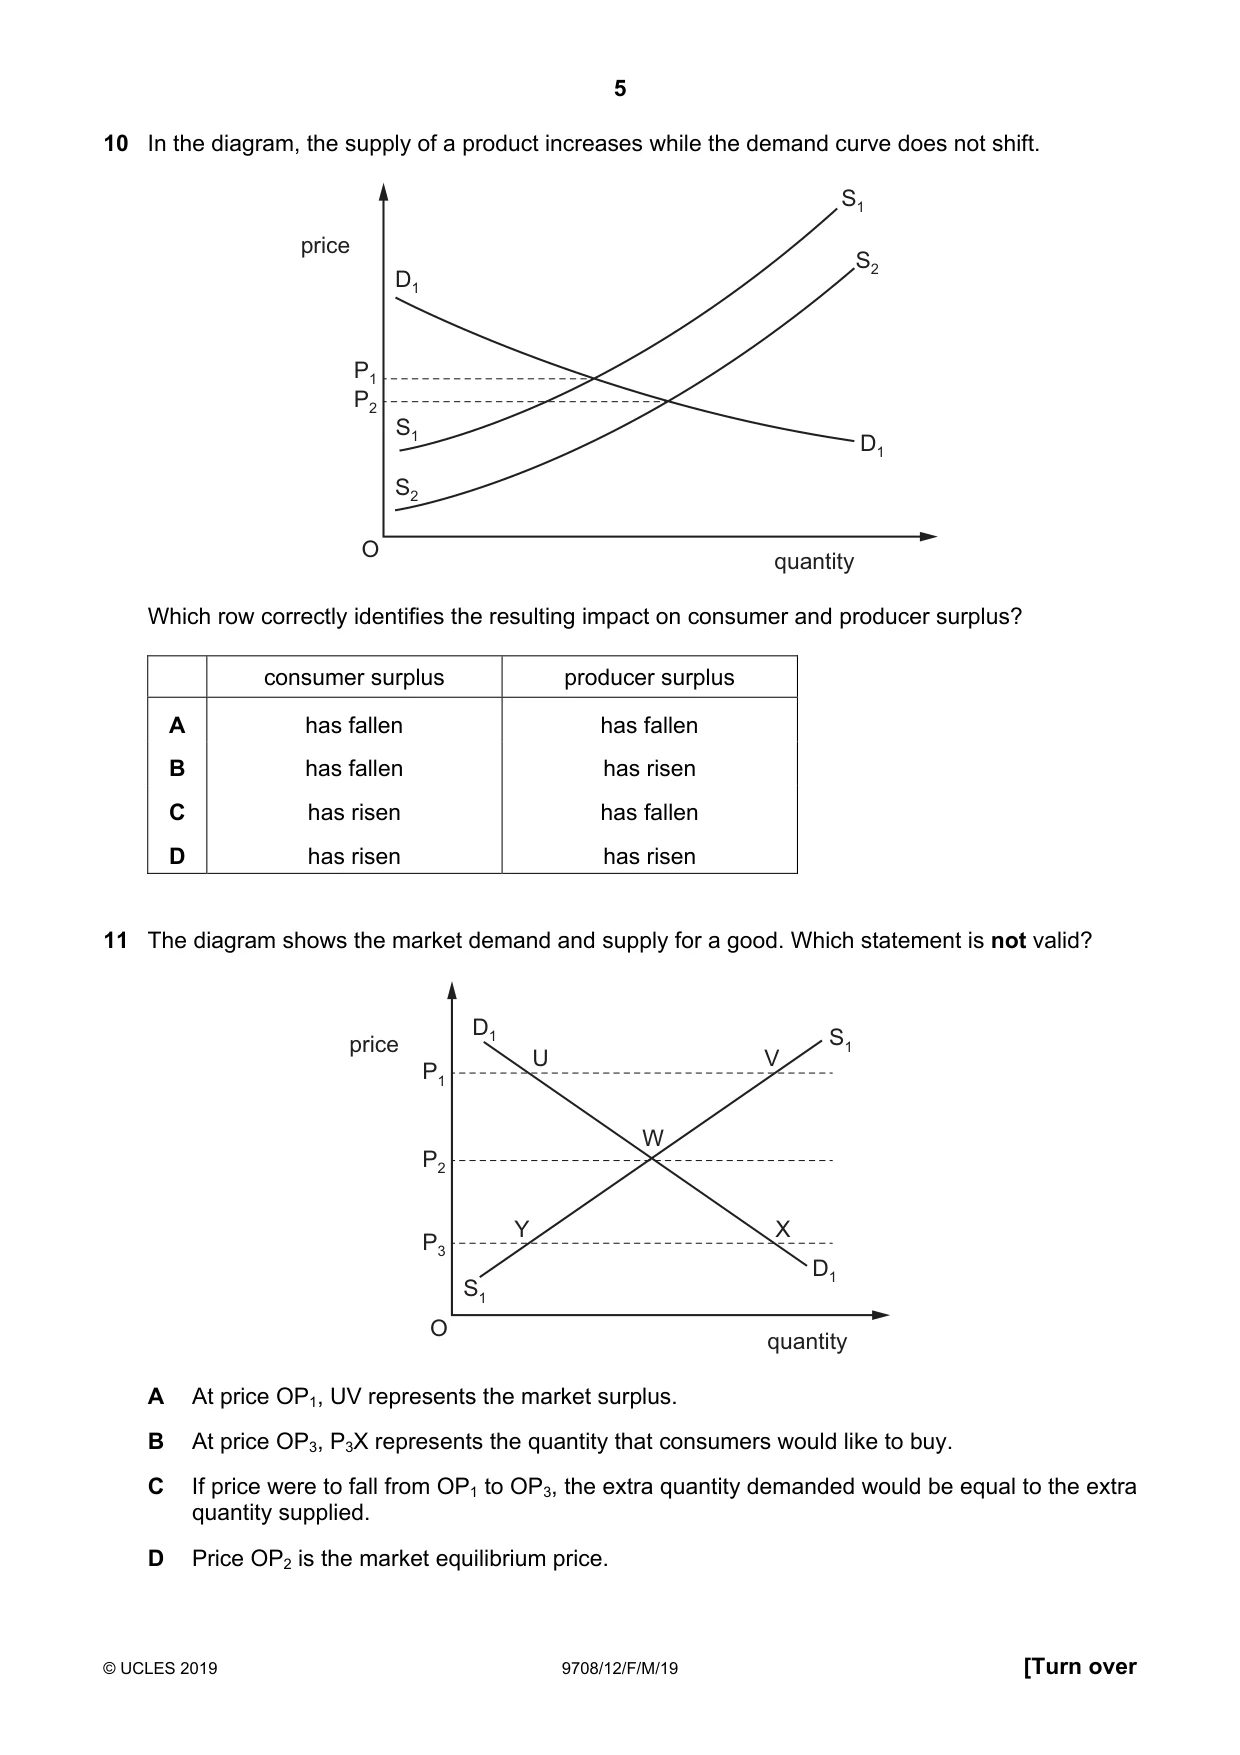
10 In the diagram, the supply of a product increases while the demand curve does not shift. S1 price S2 D1 P1 P2 S1 D1 S2 O quantity Which row correctly identifies the resulting impact on consumer and producer surplus? consumer surplus producer surplus A has fallen has fallen B has fallen has risen C has risen has fallen D has risen has risen
Mark scheme: D
Q11 · The diagram shows the market demand and supply for a good
11 The diagram shows the market demand and supply for a good. Which statement is not valid? D1 S1 price U V P1 W P2 Y X P3 D1 S1 O quantity A At price OP1, UV represents the market surplus. B At price OP3, P3X represents the quantity that consumers would like to buy. C If price were to fall from OP1 to OP3, the extra quantity demanded would be equal to the extra quantity supplied. D Price OP2 is the market equilibrium price.
Mark scheme: C
Q12 · For which supply curve is the value of price elasticity of supply not the same at all…
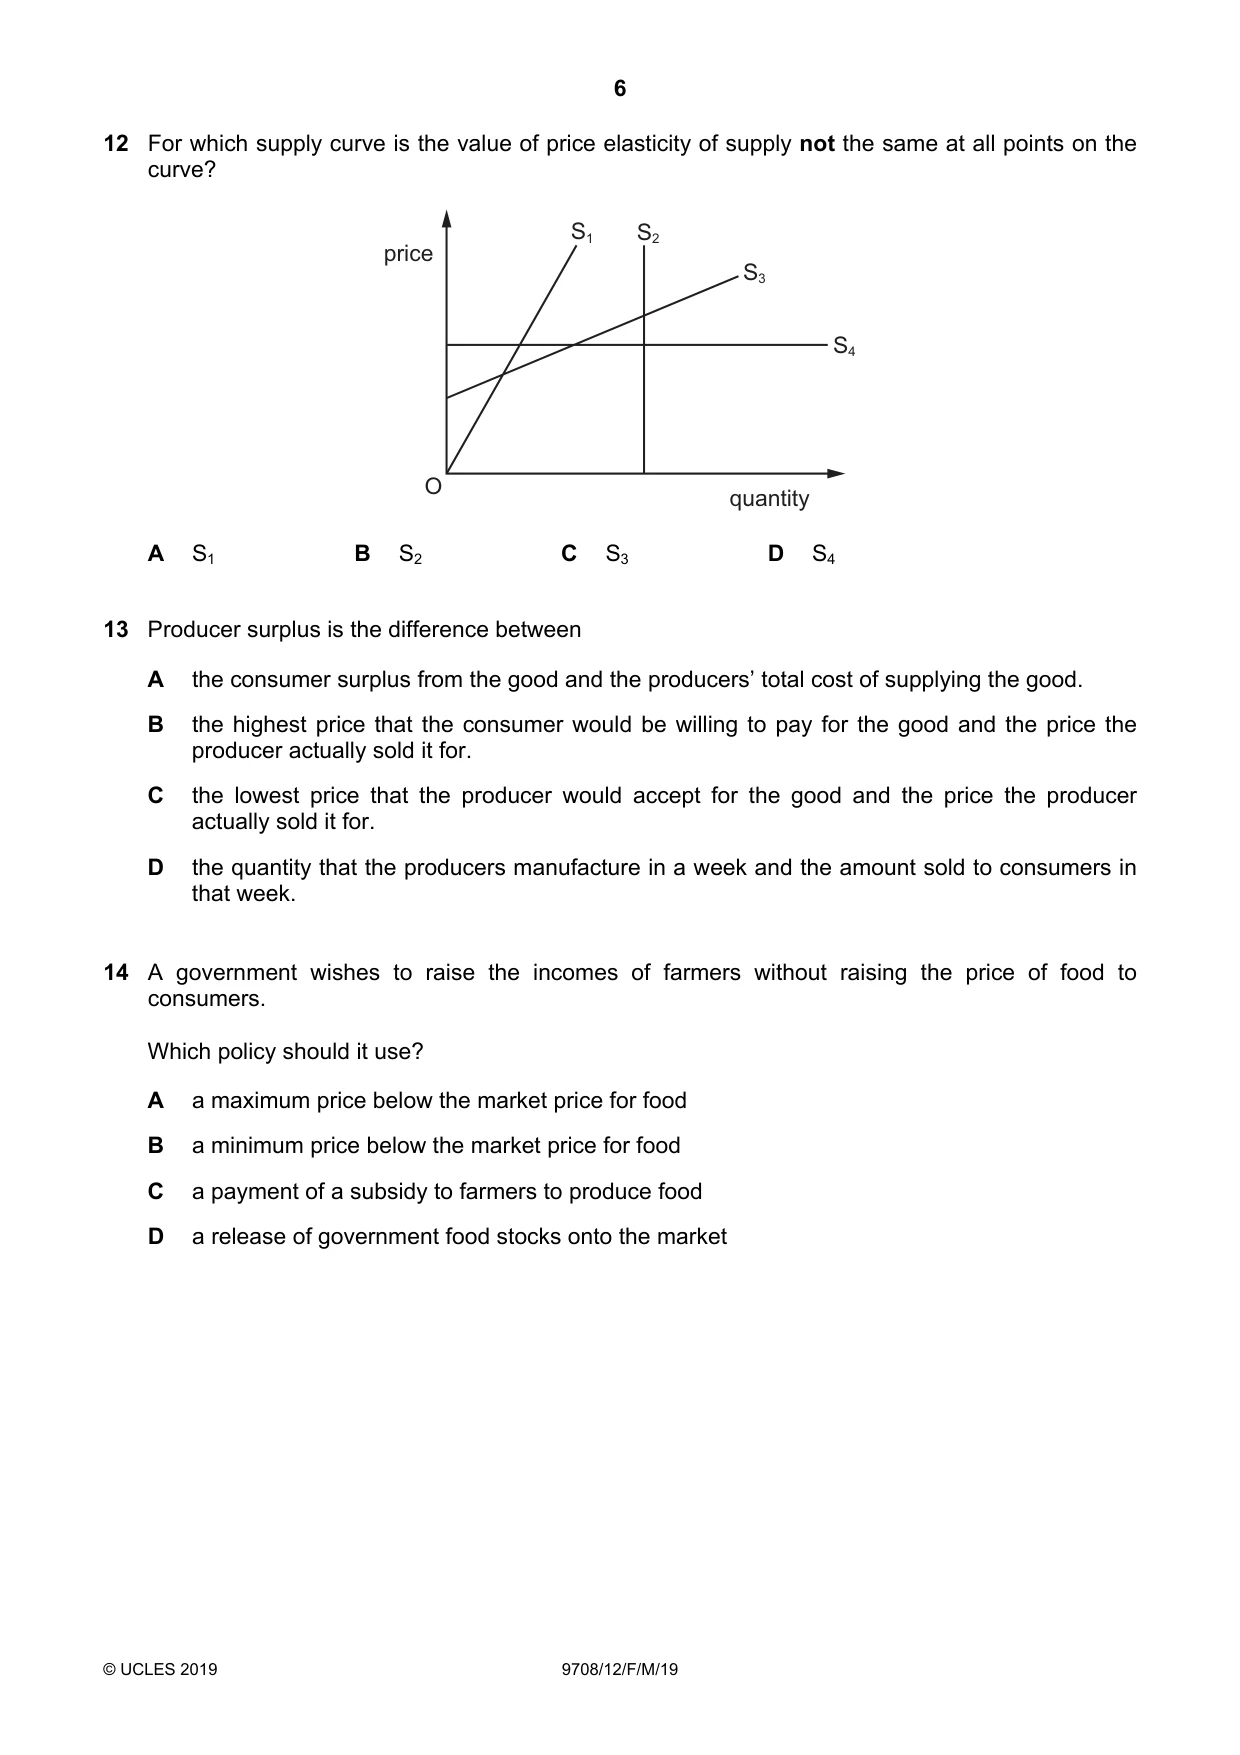
12 For which supply curve is the value of price elasticity of supply not the same at all points on the curve? S1 S2 price S3 S4 O quantity A S1 B S2 C S3 D S4
Mark scheme: C
Q13 · Producer surplus is the difference between A the consumer surplus from the good and the…
13 Producer surplus is the difference between A the consumer surplus from the good and the producers’ total cost of supplying the good. B the highest price that the consumer would be willing to pay for the good and the price the producer actually sold it for. C the lowest price that the producer would accept for the good and the price the producer actually sold it for. D the quantity that the producers manufacture in a week and the amount sold to consumers in that week.
Mark scheme: C
Q14 · A government wishes to raise the incomes of farmers without raising the price of food to…
14 A government wishes to raise the incomes of farmers without raising the price of food to consumers. Which policy should it use? A a maximum price below the market price for food B a minimum price below the market price for food C a payment of a subsidy to farmers to produce food D a release of government food stocks onto the market
Mark scheme: C
More questions on Methods and effects of government intervention in markets
Q15 · The diagram shows the demand and supply of rice
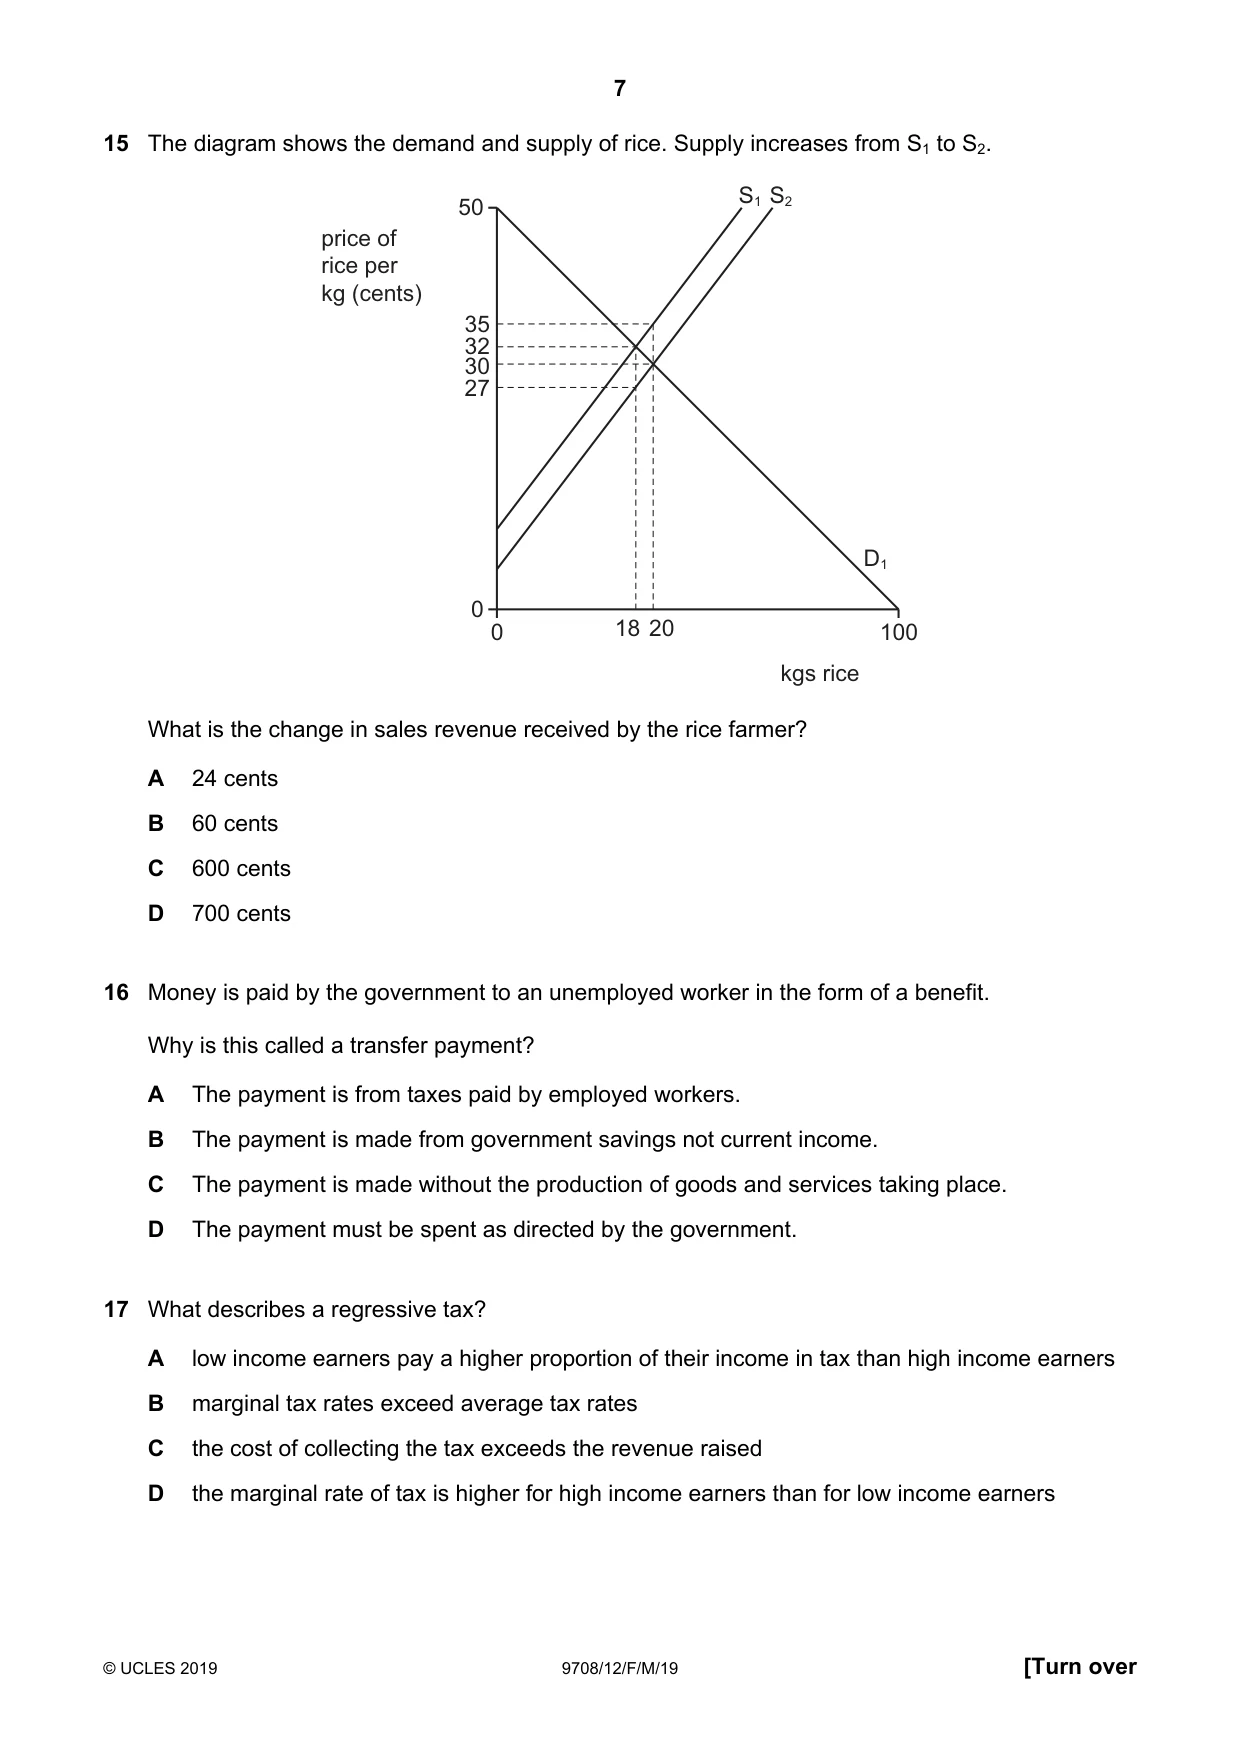
15 The diagram shows the demand and supply of rice. Supply increases from S1 to S2. S1 S2 50 price of rice per kg (cents) 35 32 30 27 D1 0 0 18 20 100 kgs rice What is the change in sales revenue received by the rice farmer? A 24 cents B 60 cents C 600 cents D 700 cents
Mark scheme: A
Q16 · Money is paid by the government to an unemployed worker in the form of a benefit
16 Money is paid by the government to an unemployed worker in the form of a benefit. Why is this called a transfer payment? A The payment is from taxes paid by employed workers. B The payment is made from government savings not current income. C The payment is made without the production of goods and services taking place. D The payment must be spent as directed by the government.
Mark scheme: C
Q17 · What describes a regressive tax?
17 What describes a regressive tax? A low income earners pay a higher proportion of their income in tax than high income earners B marginal tax rates exceed average tax rates C the cost of collecting the tax exceeds the revenue raised D the marginal rate of tax is higher for high income earners than for low income earners
Mark scheme: A
Q18 · A government is concerned that foreign-owned companies are responsible for a high…
18 A government is concerned that foreign-owned companies are responsible for a high proportion of the economy’s output. Therefore it nationalises timber extraction, which is controlled by a foreign-owned company. What benefit will the economy gain from the change in ownership? A forestry workers will become the new owners B profits will no longer be sent abroad to foreign shareholders C social costs arising from forestry will be eliminated D the market for timber will become more competitive
Mark scheme: B
More questions on Resource allocation in different economic systems
Q19 · What will definitely lead to an improvement in the terms of trade?
19 What will definitely lead to an improvement in the terms of trade? A Export prices fall whilst import prices rise. B Export prices rise by the same amount as import prices. C Export prices rise slower than import prices. D Export prices rise whilst import prices stay the same.
Mark scheme: D
More questions on Current account of the balance of payments
Q20 · In the diagram Sd is the domestic supply of a product, Sw is the world supply and Dd is…
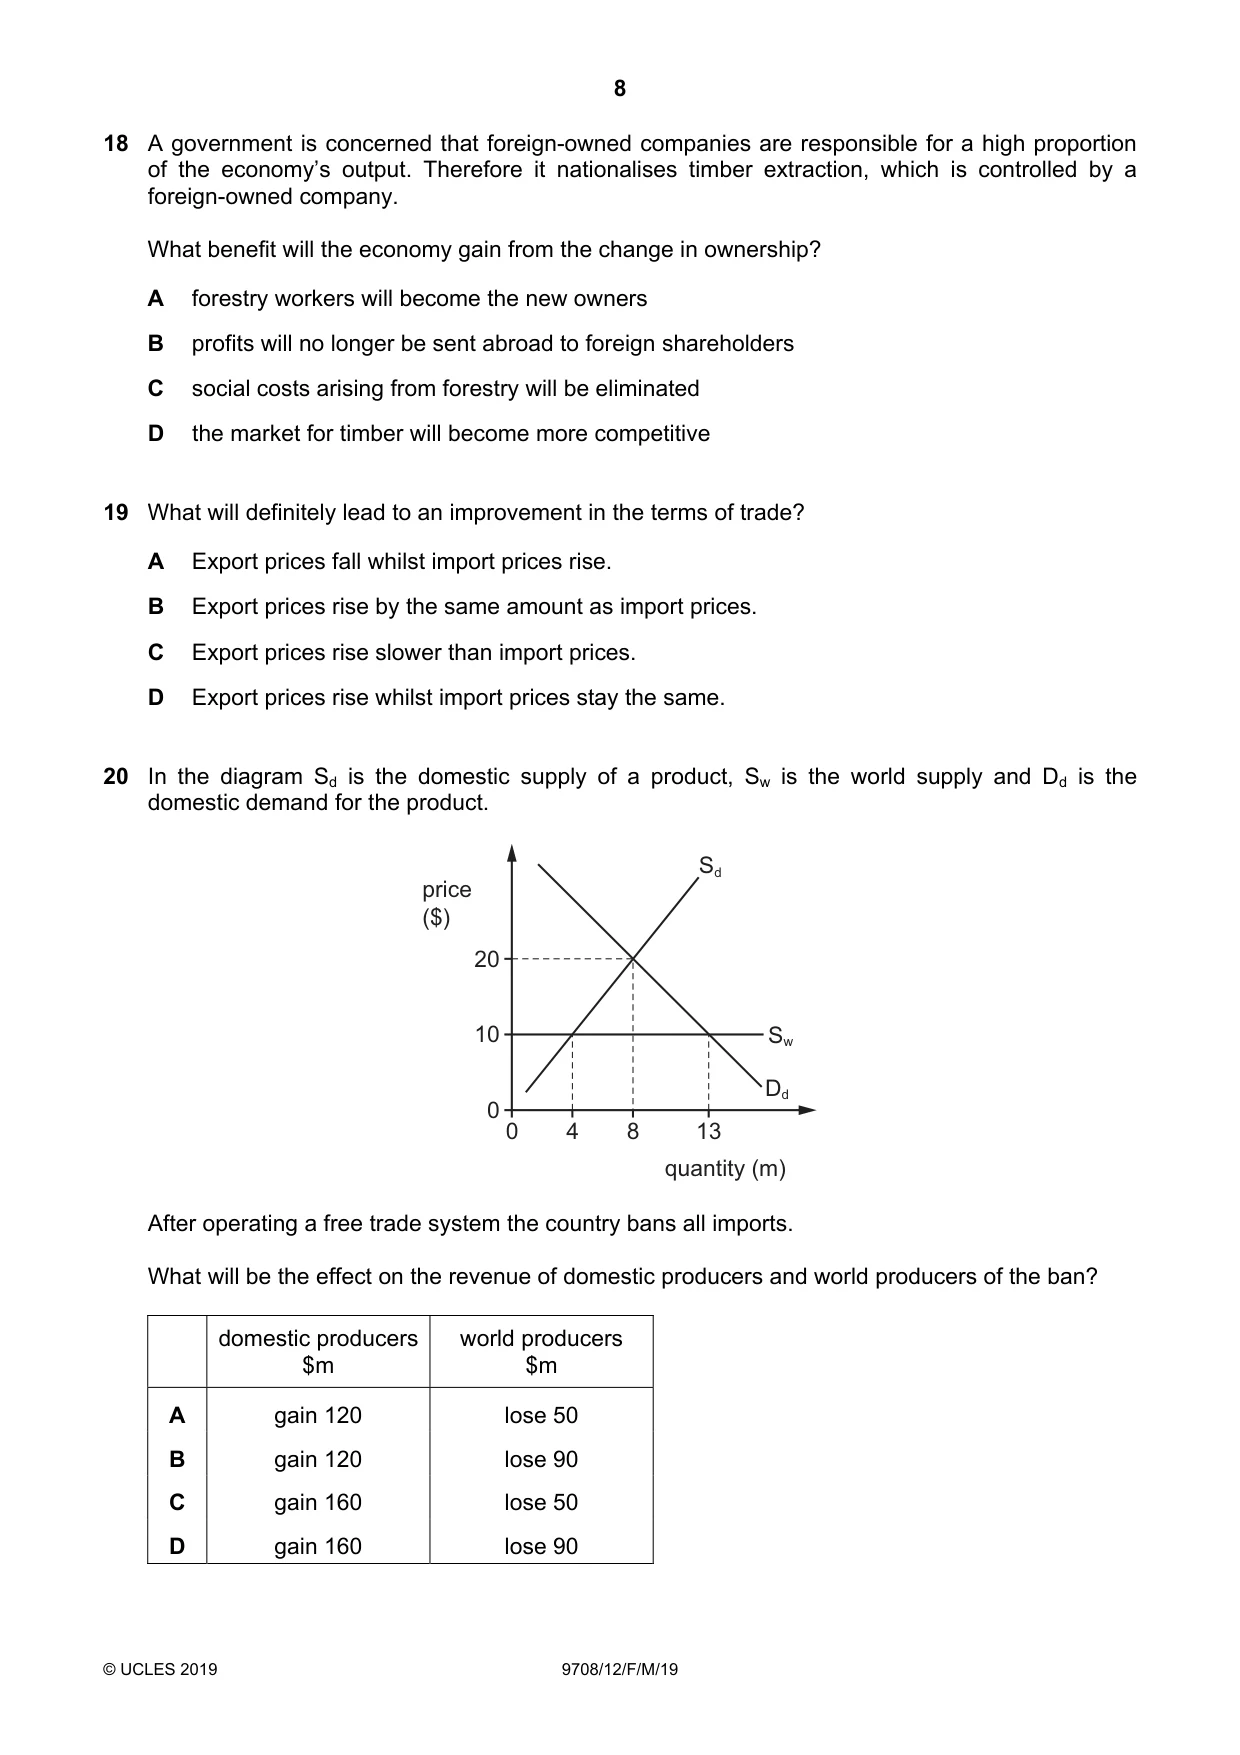
20 In the diagram Sd is the domestic supply of a product, Sw is the world supply and Dd is the domestic demand for the product. Sd price ($) 20 10 Sw Dd 0 0 4 8 13 quantity (m) After operating a free trade system the country bans all imports. What will be the effect on the revenue of domestic producers and world producers of the ban? domestic producers world producers $m $m A gain 120 lose 50 B gain 120 lose 90 C gain 160 lose 50 D gain 160 lose 90
Mark scheme: B
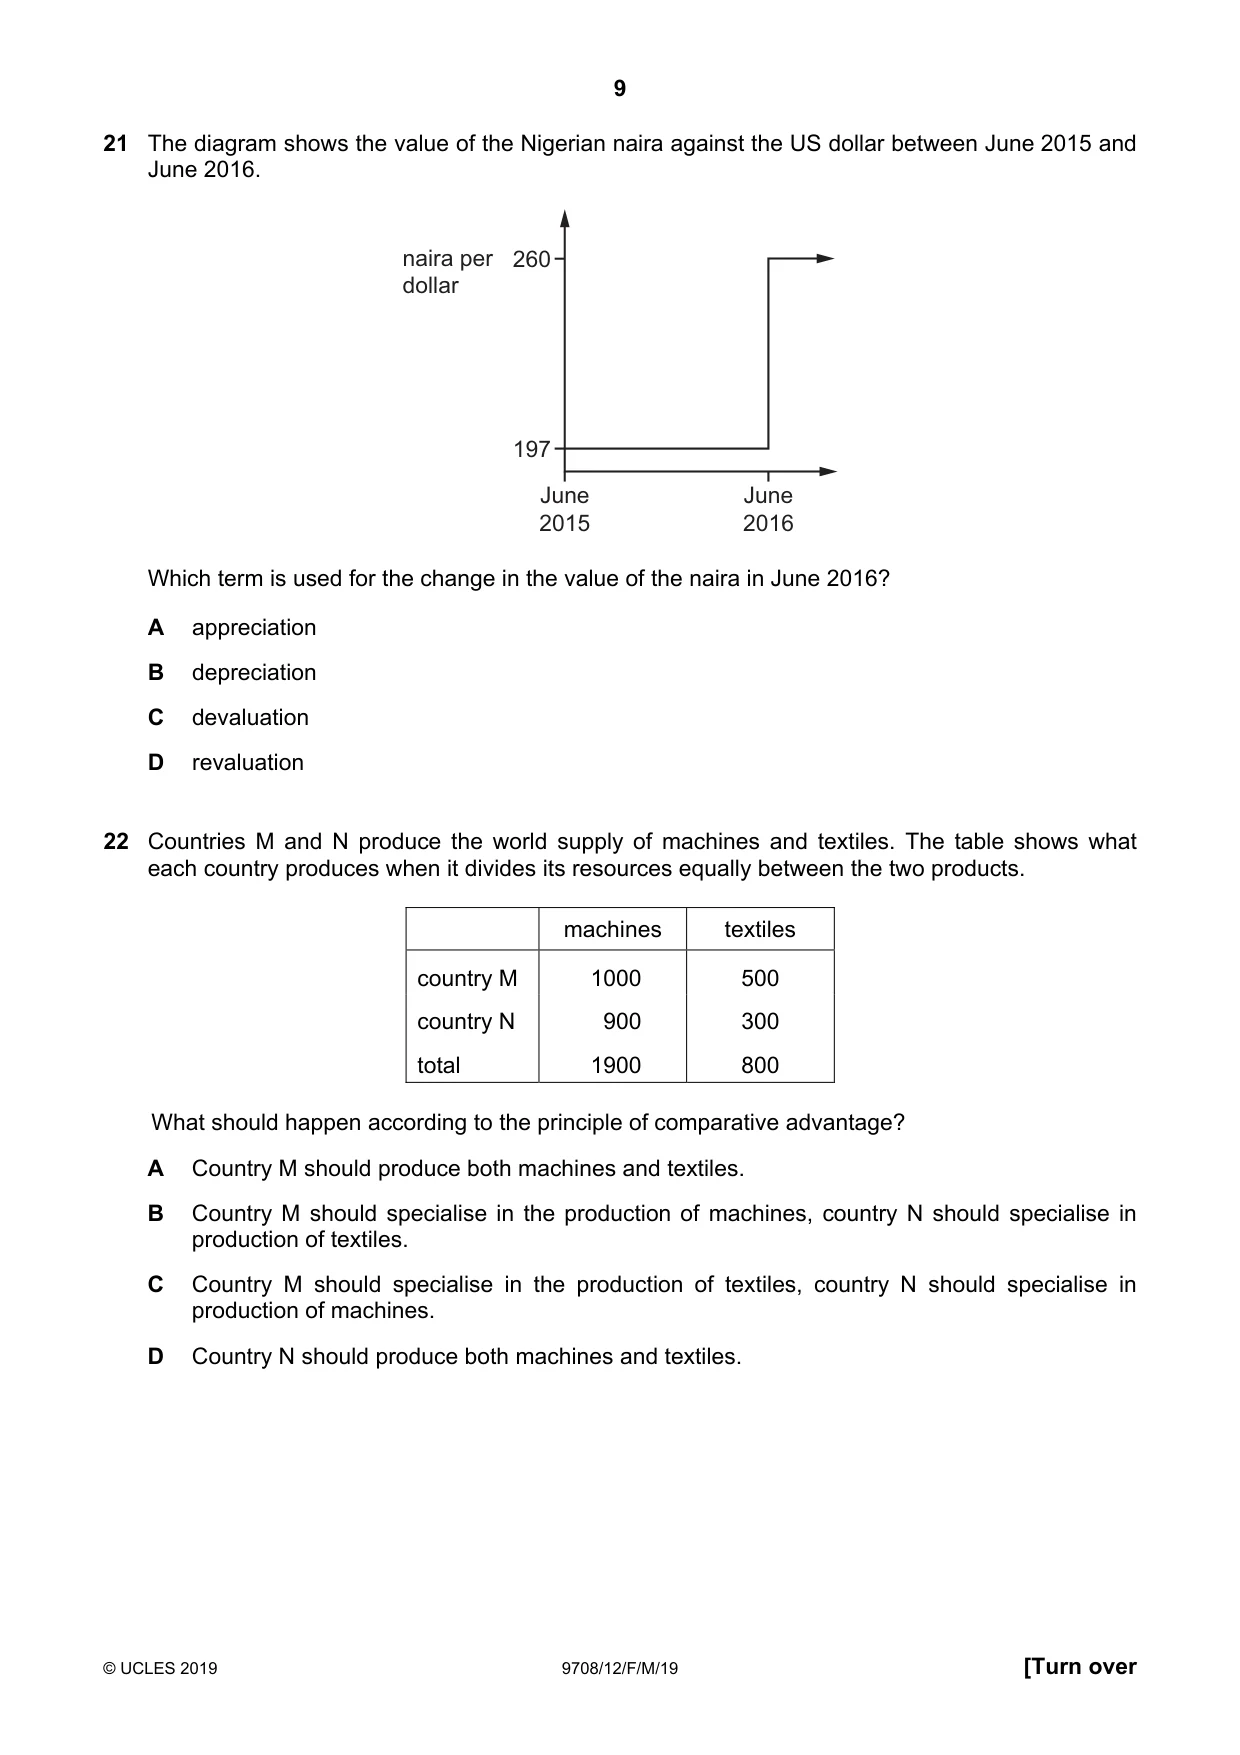
Q21 · The diagram shows the value of the Nigerian naira against the US dollar between June 2015…
21 The diagram shows the value of the Nigerian naira against the US dollar between June 2015 and June 2016. naira per 260 dollar 197 June June 2015 2016 Which term is used for the change in the value of the naira in June 2016? A appreciation B depreciation C devaluation D revaluation
Mark scheme: C
Q22 · Countries M and N produce the world supply of machines and textiles
22 Countries M and N produce the world supply of machines and textiles. The table shows what each country produces when it divides its resources equally between the two products. machines textiles country M 1000 500 country N 900 300 total 1900 800 What should happen according to the principle of comparative advantage? A Country M should produce both machines and textiles. B Country M should specialise in the production of machines, country N should specialise in production of textiles. C Country M should specialise in the production of textiles, country N should specialise in production of machines. D Country N should produce both machines and textiles.
Mark scheme: C
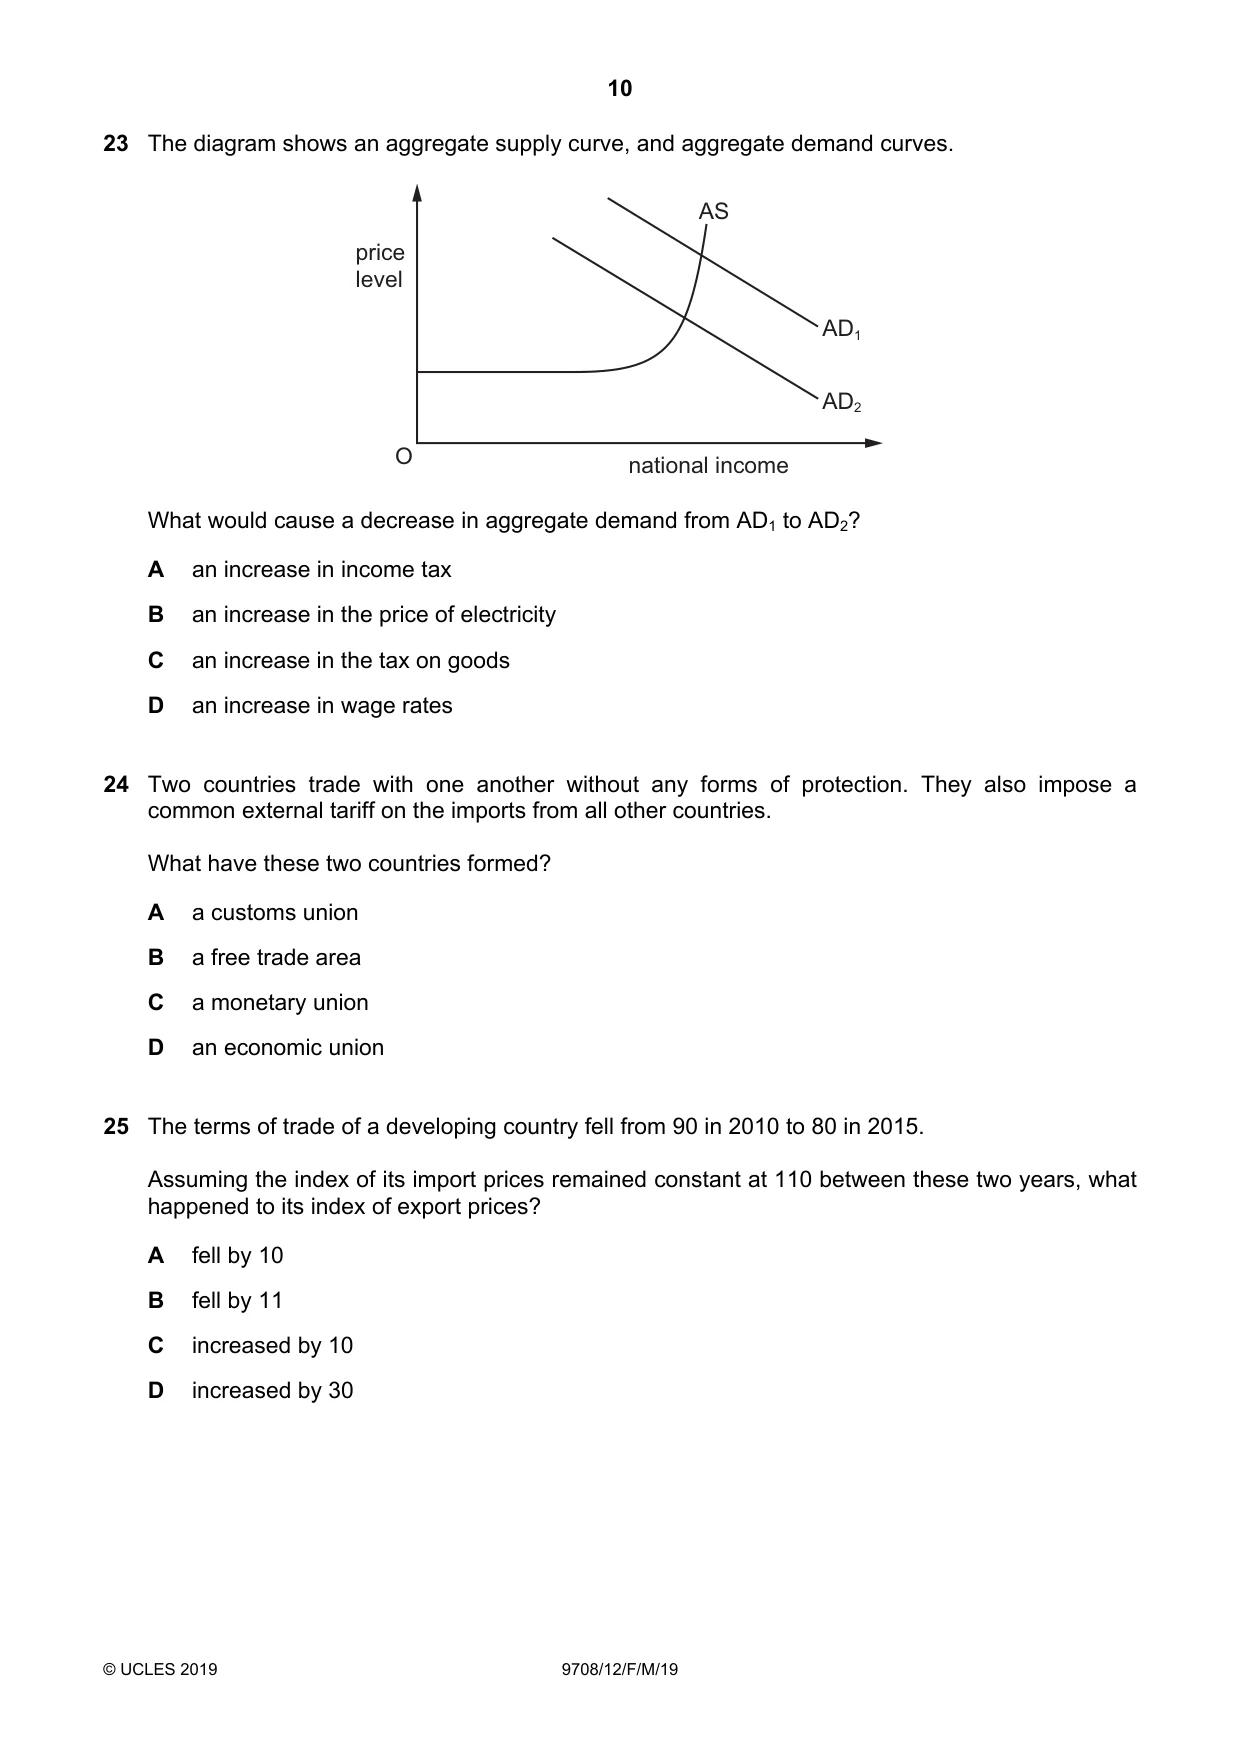
Q23 · The diagram shows an aggregate supply curve, and aggregate demand curves
23 The diagram shows an aggregate supply curve, and aggregate demand curves. AS price level AD1 AD2 O national income What would cause a decrease in aggregate demand from AD1 to AD2? A an increase in income tax B an increase in the price of electricity C an increase in the tax on goods D an increase in wage rates
Mark scheme: A
More questions on Aggregate Demand and Aggregate Supply analysis
Q24 · Two countries trade with one another without any forms of protection
24 Two countries trade with one another without any forms of protection. They also impose a common external tariff on the imports from all other countries. What have these two countries formed? A a customs union B a free trade area C a monetary union D an economic union
Mark scheme: A
Q25 · The terms of trade of a developing country fell from 90 in 2010 to 80 in 2015
25 The terms of trade of a developing country fell from 90 in 2010 to 80 in 2015. Assuming the index of its import prices remained constant at 110 between these two years, what happened to its index of export prices? A fell by 10 B fell by 11 C increased by 10 D increased by 30
Mark scheme: B
More questions on Current account of the balance of payments
Q26 · Which type of import control allows a country to develop a potential comparative…
26 Which type of import control allows a country to develop a potential comparative advantage in a particular good? A a quota that protects jobs in a depressed region B a short-term tariff that protects an infant industry C a tariff that improves an industry’s terms of trade D an embargo on goods with negative externalities
Mark scheme: B
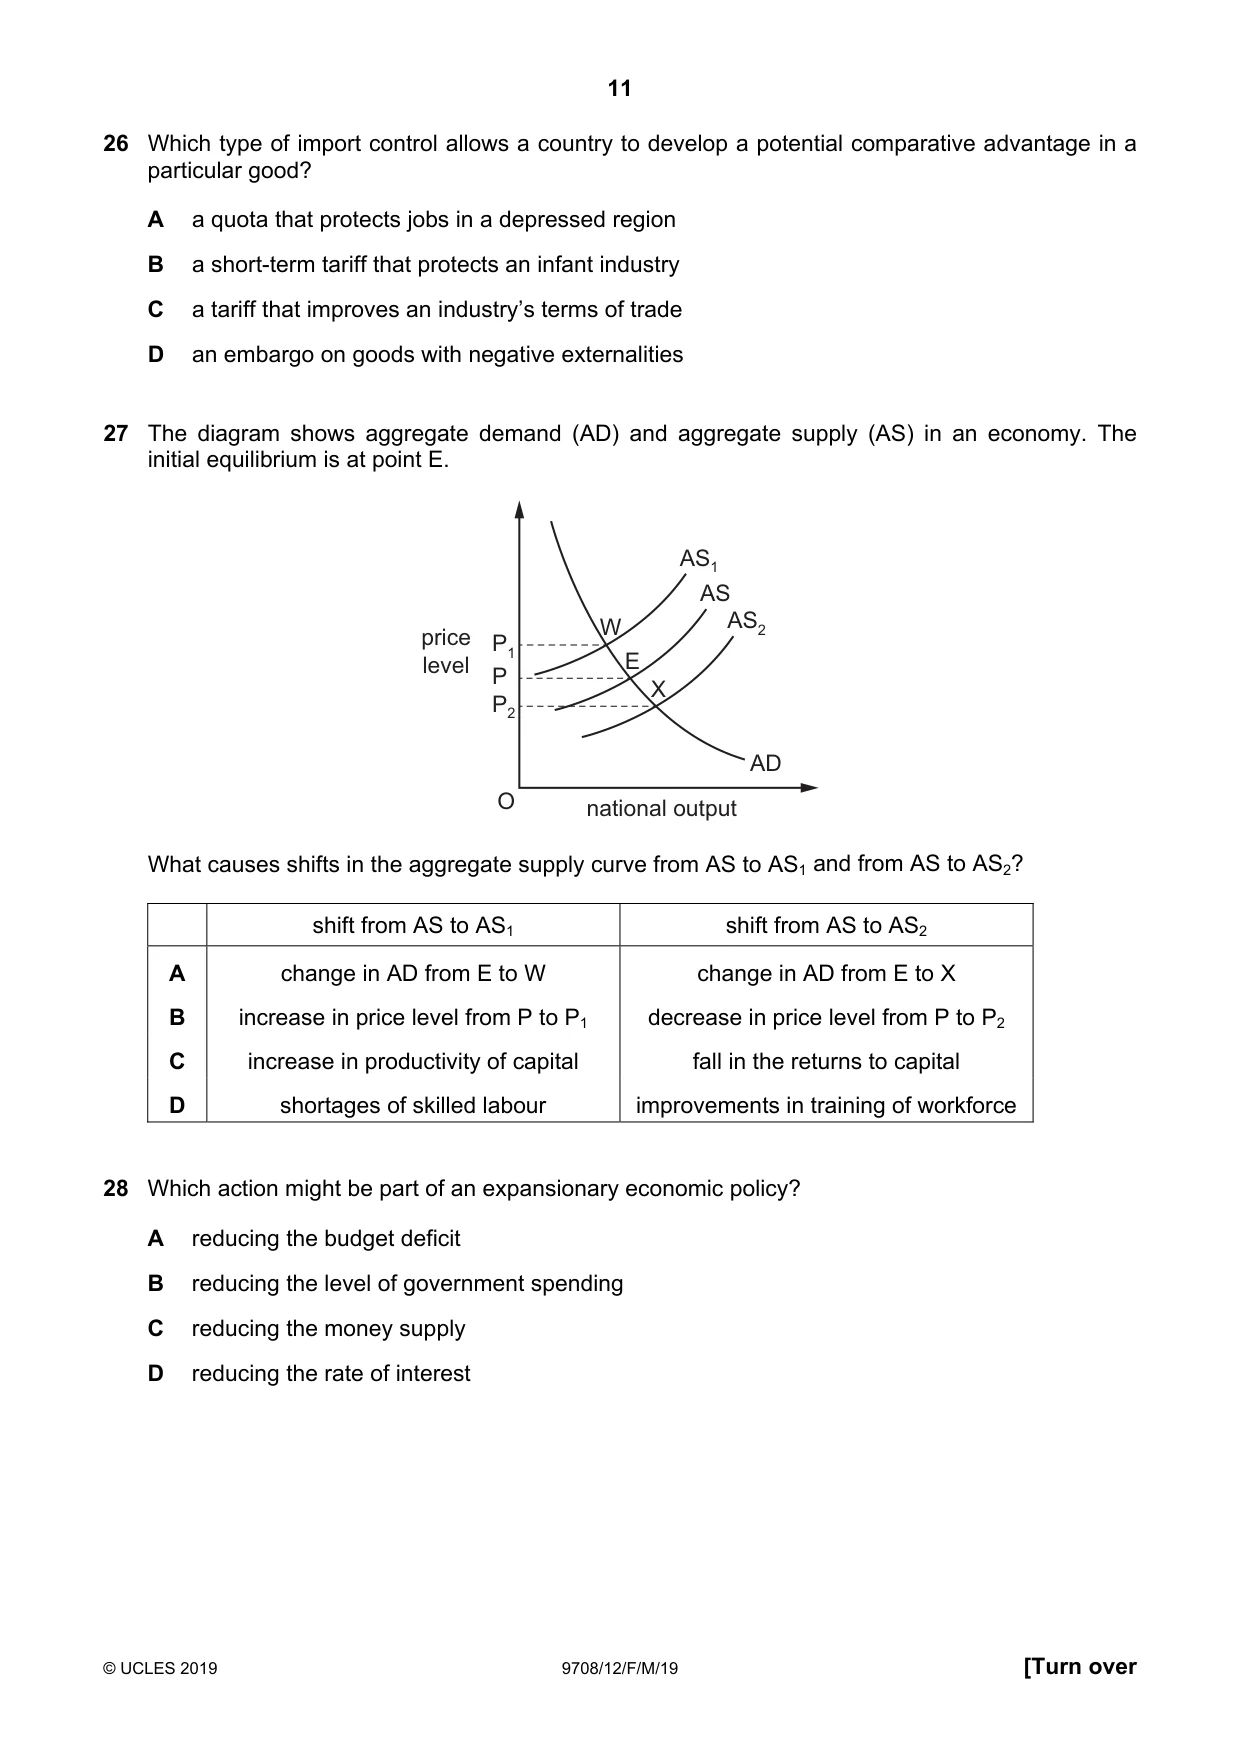
Q27 · The diagram shows aggregate demand (AD) and aggregate supply (AS) in an economy
27 The diagram shows aggregate demand (AD) and aggregate supply (AS) in an economy. The initial equilibrium is at point E. AS1 AS W AS2 price P1 level E P X P2 AD O national output What causes shifts in the aggregate supply curve from AS to AS1 and from AS to AS2? shift from AS to AS1 shift from AS to AS2 A change in AD from E to W change in AD from E to X B increase in price level from P to P1 decrease in price level from P to P2 C increase in productivity of capital fall in the returns to capital D shortages of skilled labour improvements in training of workforce
Mark scheme: D
More questions on Aggregate Demand and Aggregate Supply analysis
Q28 · Which action might be part of an expansionary economic policy?
28 Which action might be part of an expansionary economic policy? A reducing the budget deficit B reducing the level of government spending C reducing the money supply D reducing the rate of interest
Mark scheme: D
Q29 · A government is faced with rising inflation
29 A government is faced with rising inflation. It wishes to reduce inflationary pressure while avoiding a fall in output. Which action is most likely to meet its needs? A an increase in laws to promote competition B an increase in taxation C an increase in the budget surplus D an increase in the exchange rate
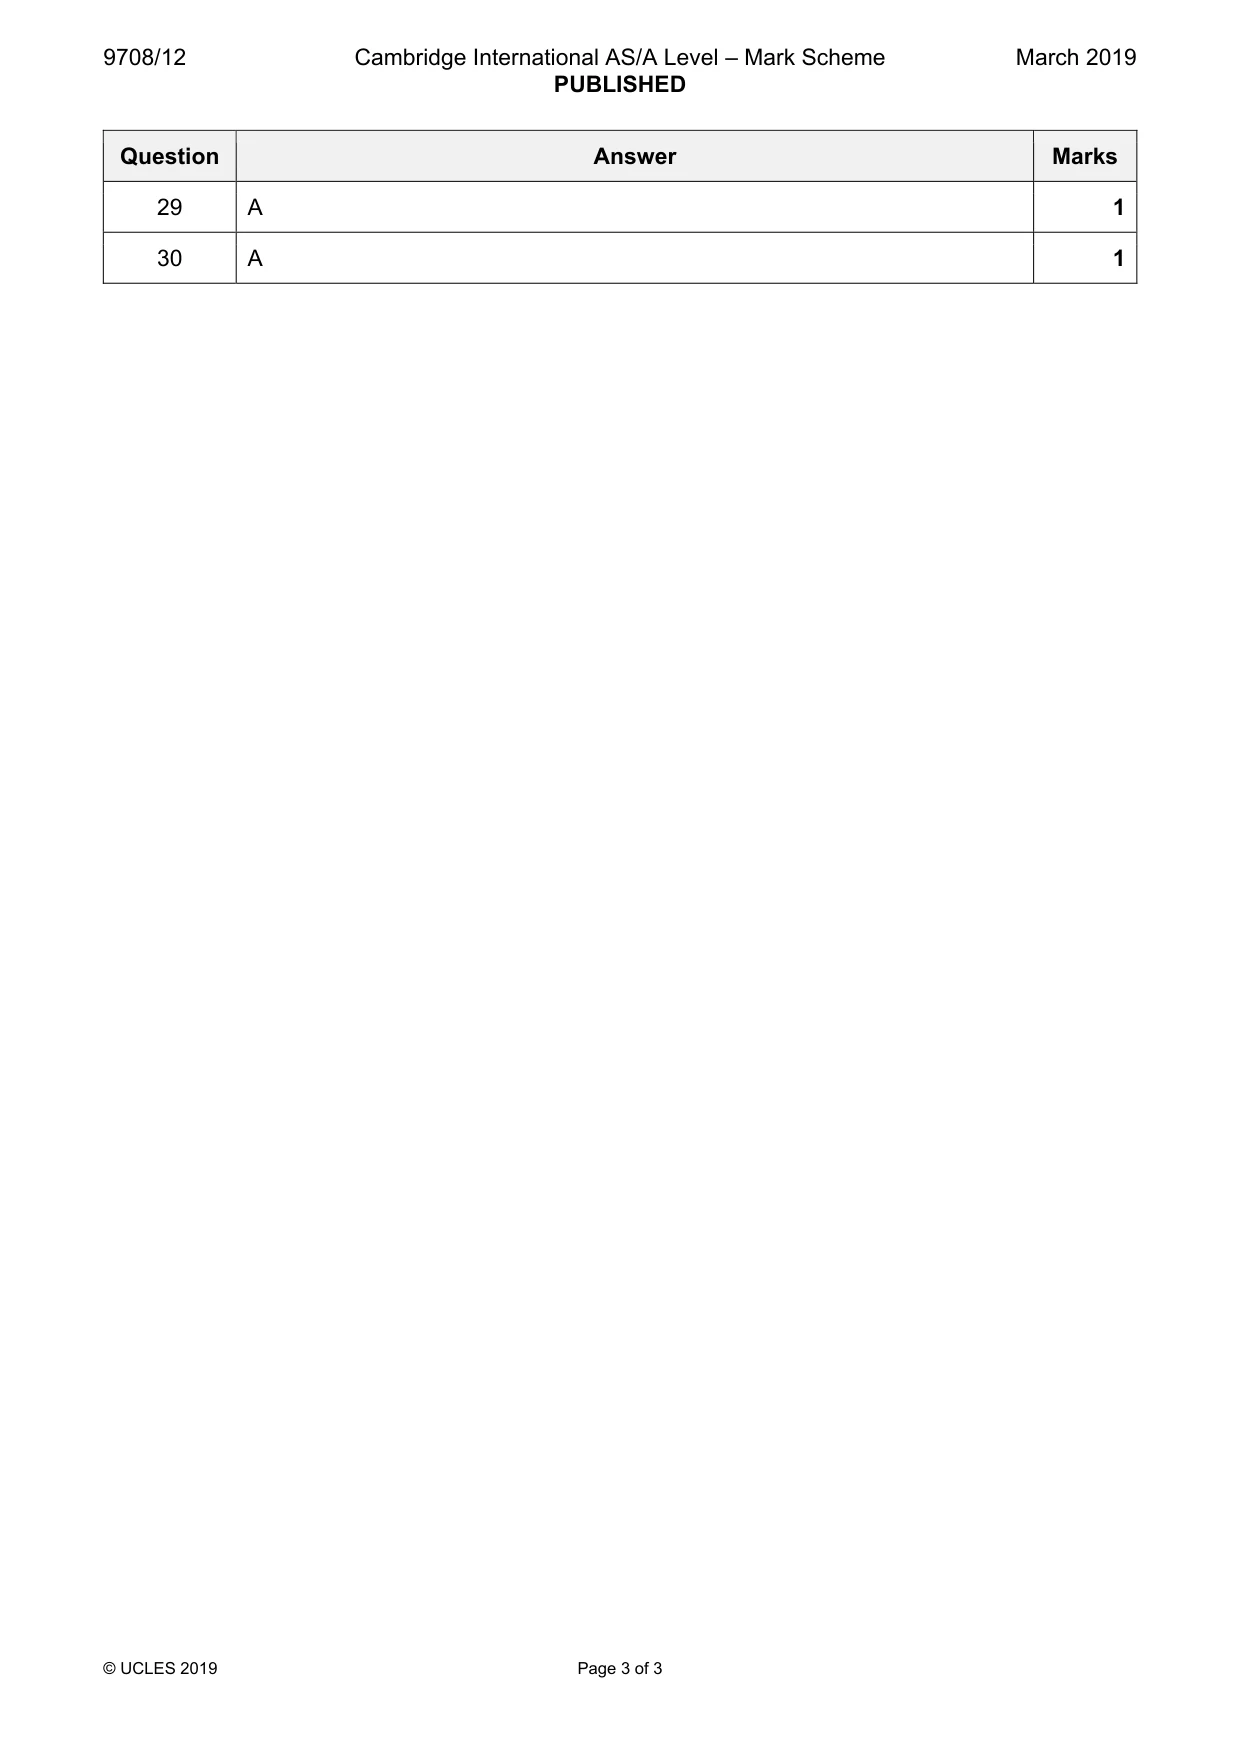
Mark scheme: A
Q30 · Why may a government seek to reduce a current account surplus on the balance of payments?
30 Why may a government seek to reduce a current account surplus on the balance of payments? A to lower inflation B to lower unemployment C to raise the economic growth rate D to raise the exchange rate
Mark scheme: A
More questions on Current account of the balance of payments
What was in this paper
The subtopics covered by these 30 questions, and how many questions each got. Open one in a new tab to see every Cambridge question on it.
3Price elasticity, income elasticity and cross elasticity of demand3The interaction of demand and supply3Aggregate Demand and Aggregate Supply analysis2Consumer and producer surplus2Price elasticity of supply2Protectionism2Classification of goods and services1Exchange rates1Factors of production1Fiscal policy1Globalisation1Methods and effects of government intervention in markets1Monetary policy1National income statistics1Production possibility curves1Resource allocation in different economic systems1Scarcity, choice and opportunity cost1Supply-side policy1The reasons for international trade1What you needed in this session
Cambridge’s own grade thresholds for 2019 Feb/March, Paper 1 · Variant 2. A higher threshold means an easier paper — the bar moves with how the cohort did.