Cambridge A Level Economics 9708 — 2023 Oct/Nov Paper 1 · Variant 2
9708/12/O/N/23 · 30 questions · 30 marks · ≈34 min
The question paper and its mark scheme, free to read here and free to download. This is Cambridge’s own paper, exactly as it was sat.
Question paper12 pages

Mark scheme3 pages
Answers below. Sit the paper first if you are practising.
Questions as text
Q1 · PPC is the production possibility curve in country T
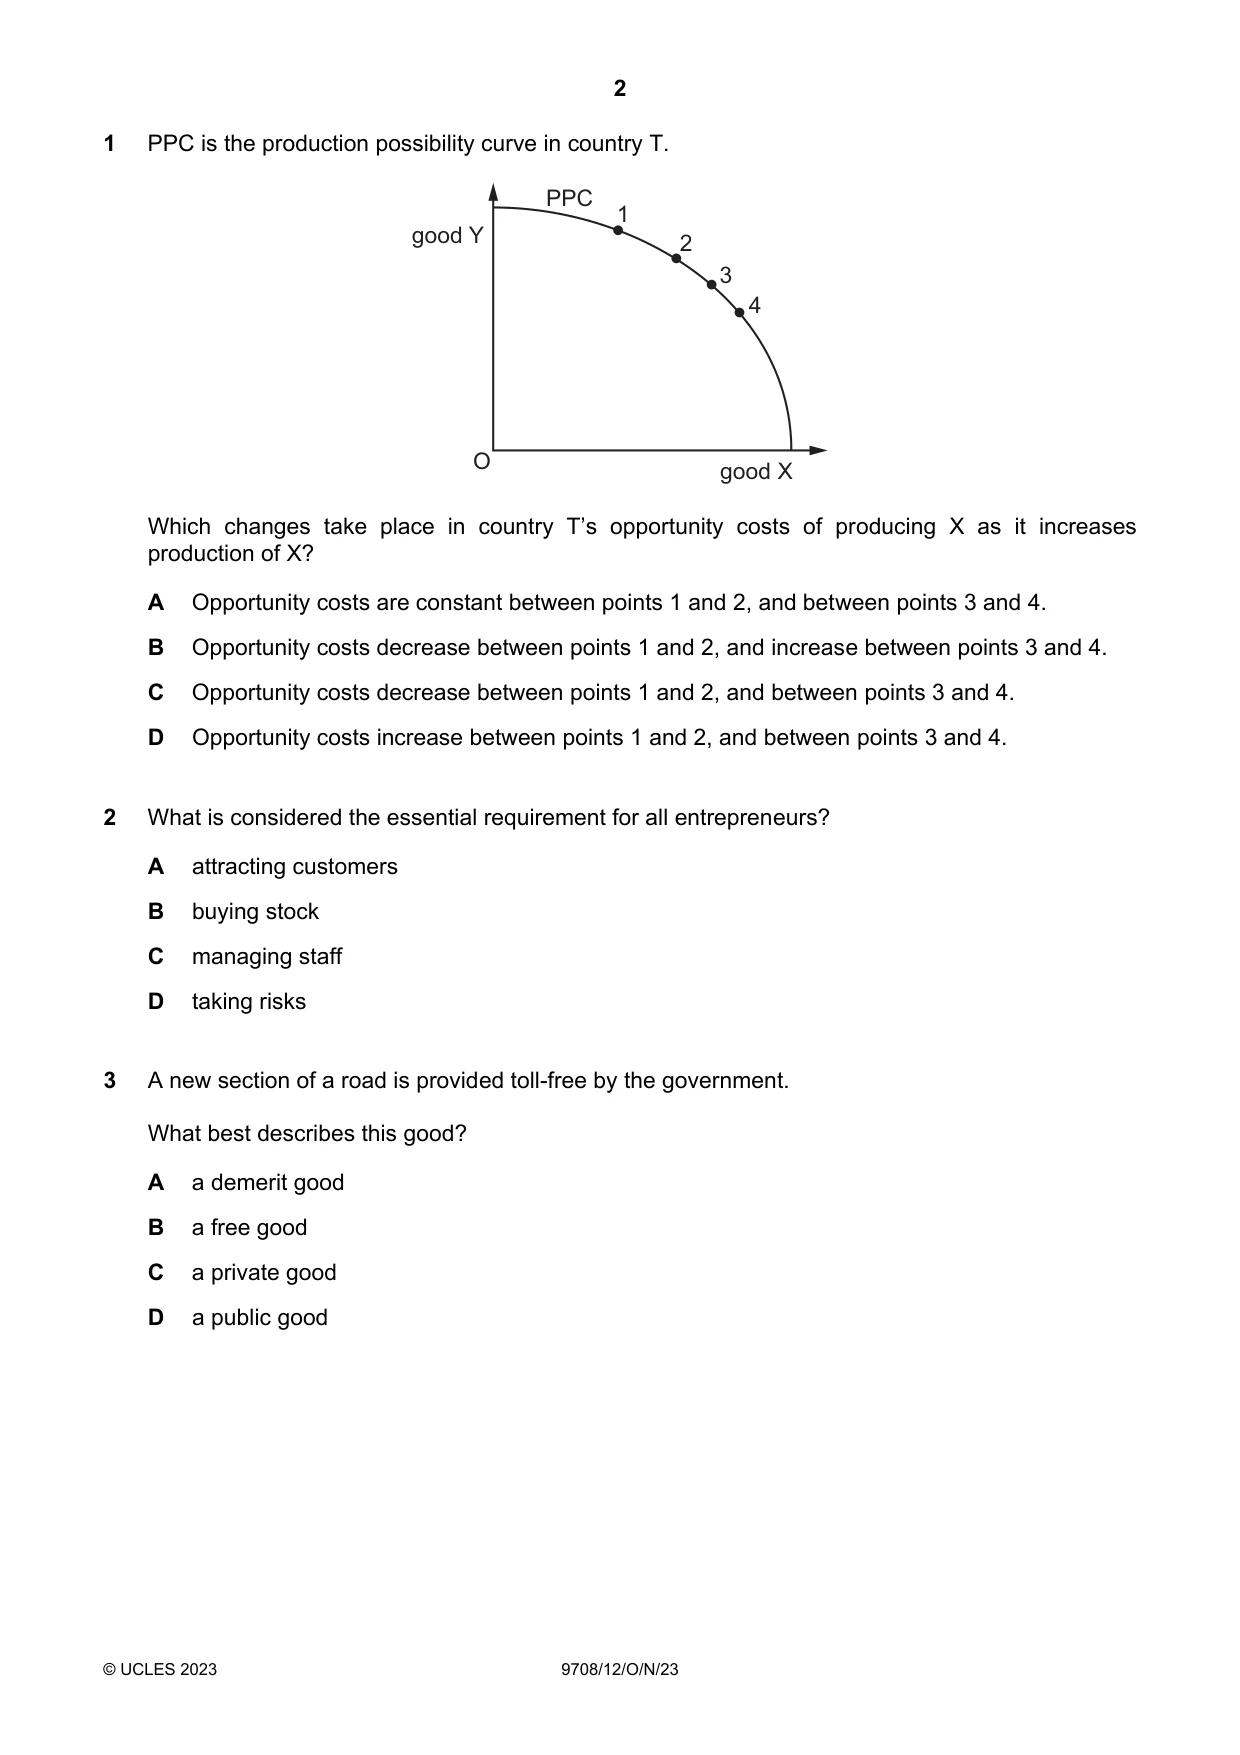
1 PPC is the production possibility curve in country T. PPC 1 good Y 2 3 4 O good X Which changes take place in country T’s opportunity costs of producing X as it increases production of X? A Opportunity costs are constant between points 1 and 2, and between points 3 and 4. B Opportunity costs decrease between points 1 and 2, and increase between points 3 and 4. C Opportunity costs decrease between points 1 and 2, and between points 3 and 4. D Opportunity costs increase between points 1 and 2, and between points 3 and 4.
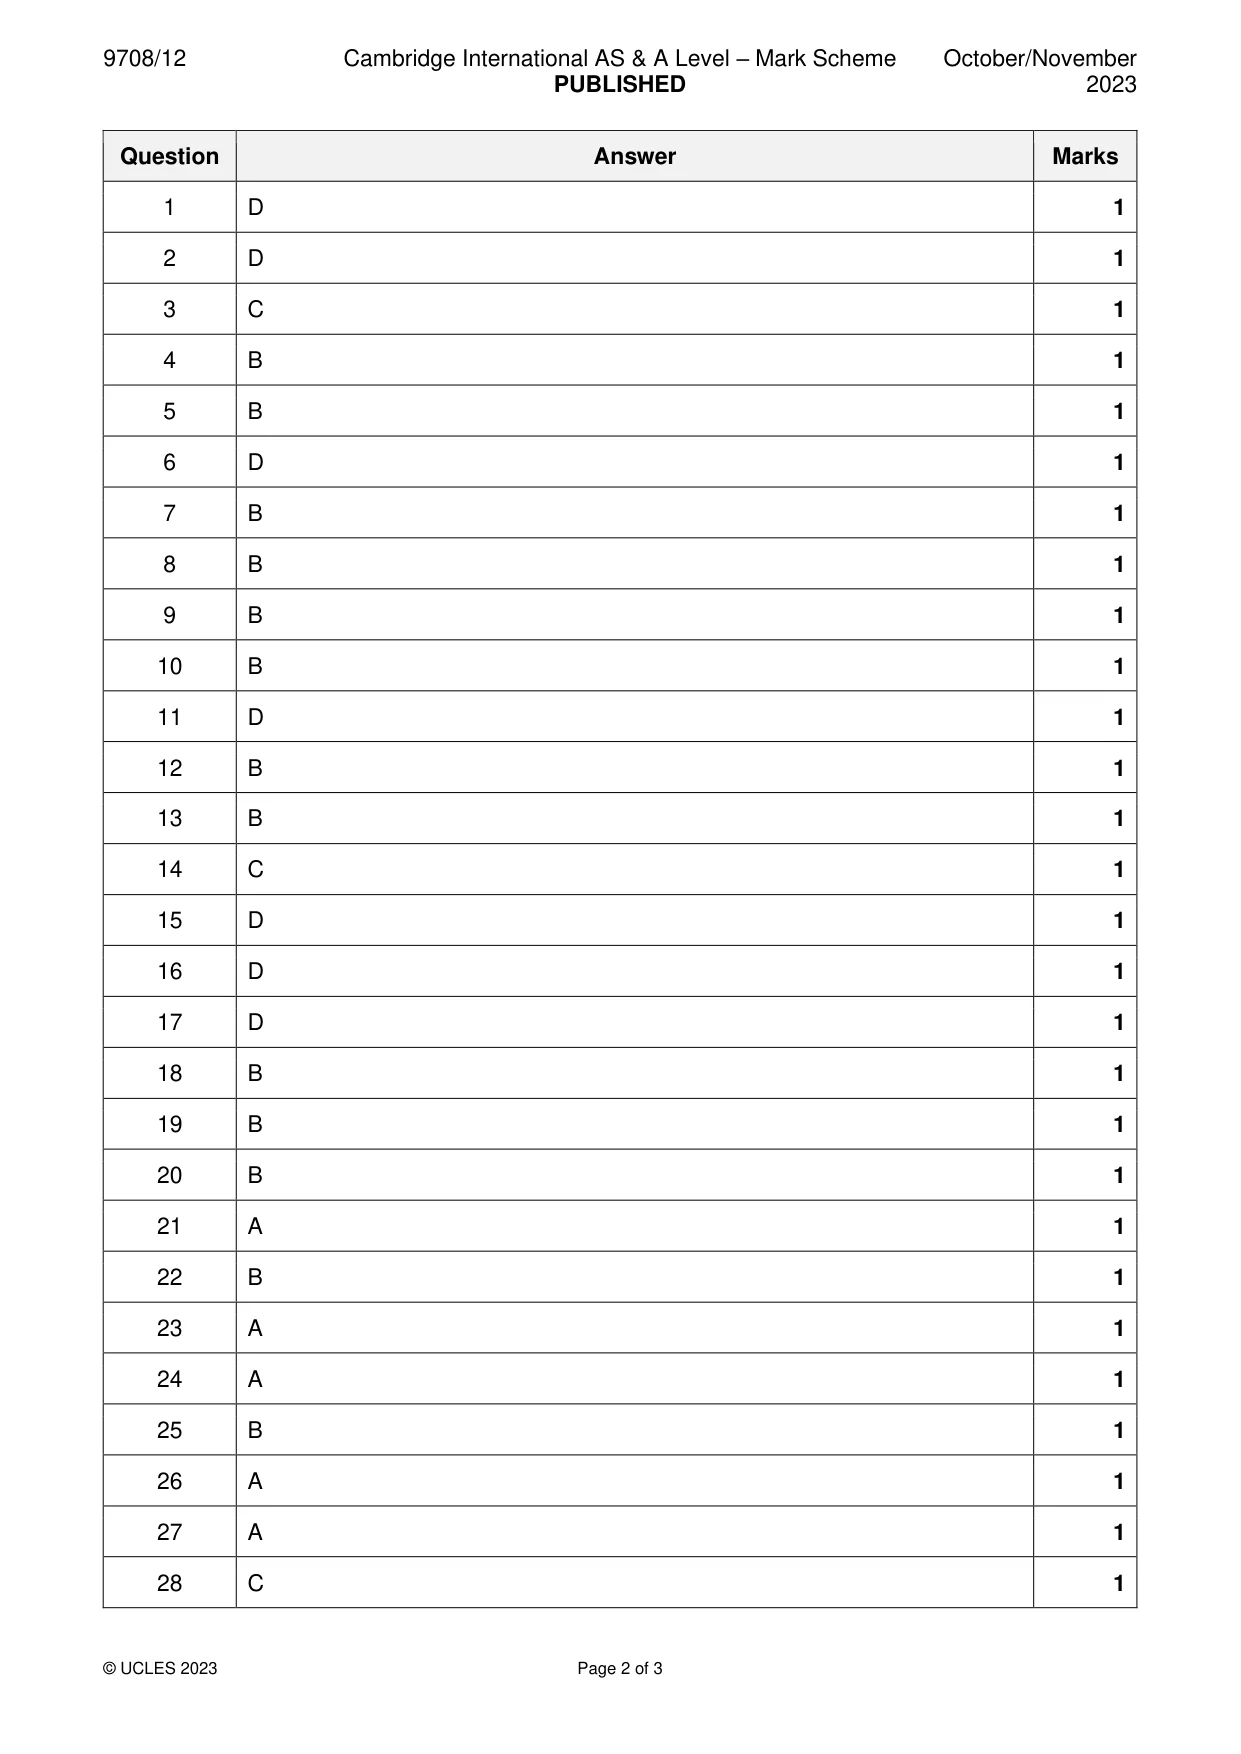
Mark scheme: D
Q2 · What is considered the essential requirement for all entrepreneurs?
2 What is considered the essential requirement for all entrepreneurs? A attracting customers B buying stock C managing staff D taking risks
Mark scheme: D
Q3 · A new section of a road is provided toll-free by the government
3 A new section of a road is provided toll-free by the government. What best describes this good? A a demerit good B a free good C a private good D a public good
Mark scheme: C
Q4 · Eastern European nations have changed from planned to market economies
4 Eastern European nations have changed from planned to market economies. Which policy was least likely to have been adopted? A allowing prices to fluctuate B keeping established economic organisations C privatising essential industries D permitting changes in the money supply
Mark scheme: B
More questions on Resource allocation in different economic systems
Q5 · Rice and pasta are both basic foods in a country
5 Rice and pasta are both basic foods in a country. How would a health scare concerning rice affect the market for pasta? A There will be a shift of demand and a contraction of supply. B There will be a shift of demand and an extension of supply. C There will be a shift of supply and a contraction of demand. D There will be a shift of supply and an extension of demand.
Mark scheme: B
Q6 · Some goods are over-consumed in a market economy
6 Some goods are over-consumed in a market economy. What is likely to be the cause of this? A Consumer surplus exceeds producer surplus. B Consumers undervalue the benefits of consuming the goods. C There is excess supply in the market for the goods. D There is imperfect information in the market.
Mark scheme: D
Q7 · A family is willing to pay a maximum of $600, $500 and $400 for air tickets for the…
7 A family is willing to pay a maximum of $600, $500 and $400 for air tickets for the mother, father and daughter to attend a wedding in another city. The airline announces a promotional air fare of $450 per ticket, provided at least three tickets are purchased. What will be the consumer surplus gained by the family if they use the promotional offer? A $100 B $150 C $200 D $250
Mark scheme: B
Q8 · After a 10% decrease in a consumer’s income, the consumer’s demand for a good rises from…
8 After a 10% decrease in a consumer’s income, the consumer’s demand for a good rises from 100 to 105. What is the value of the consumer’s income elasticity of demand for this good? A –2.0 B –0.5 C +0.5 D +2.0
Mark scheme: B
More questions on Price elasticity, income elasticity and cross elasticity of demand
Q9 · In 2010, poor harvests reduced fruit crops and furniture producers gave big discounts on…
9 In 2010, poor harvests reduced fruit crops and furniture producers gave big discounts on furniture products. How might these changes have affected the position of the supply curve for the products? fruit furniture producers A no change shift to the left B shift to the left no change C shift to the left shift to the left D shift to the right no change
Mark scheme: B
Q10 · In the diagram, D and S represent the demand for and supply of smartphones
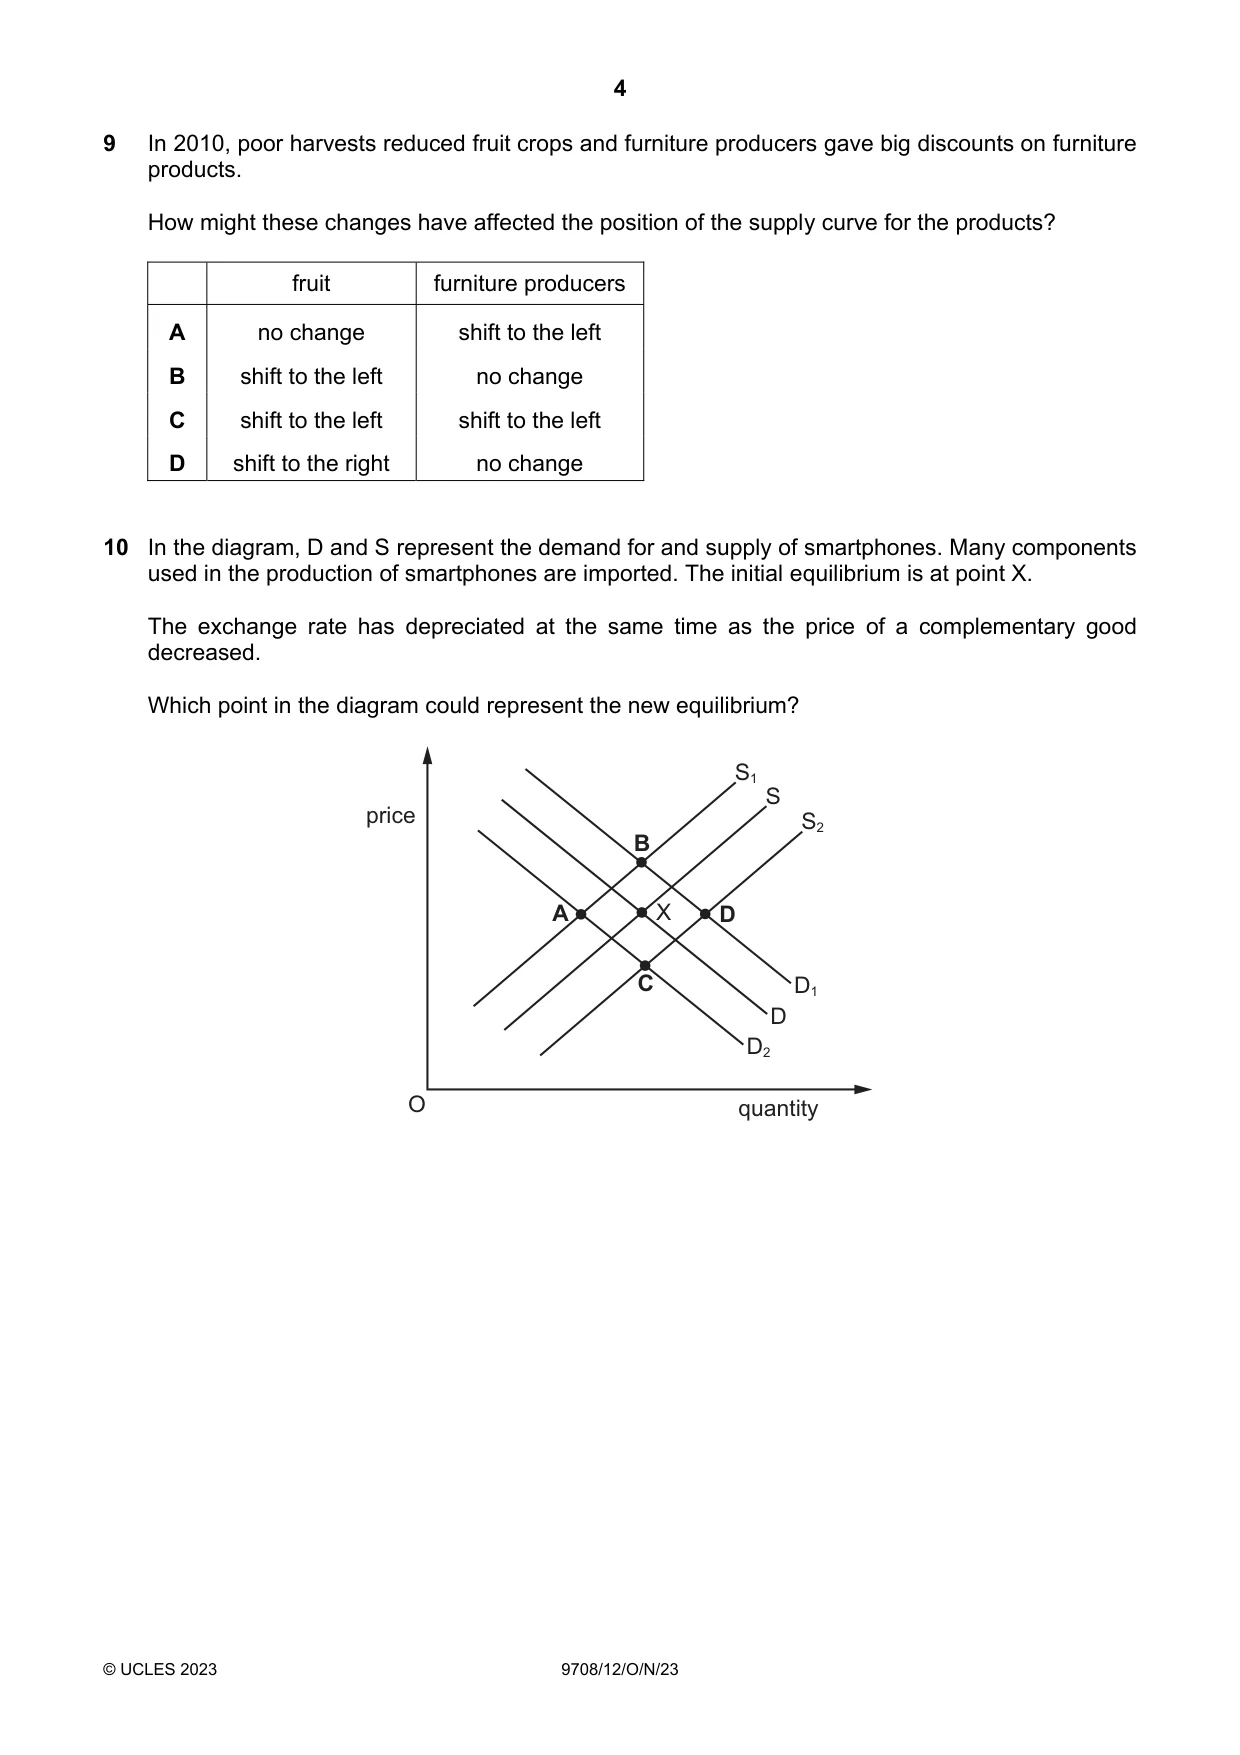
10 In the diagram, D and S represent the demand for and supply of smartphones. Many components used in the production of smartphones are imported. The initial equilibrium is at point X. The exchange rate has depreciated at the same time as the price of a complementary good decreased. Which point in the diagram could represent the new equilibrium? S1 S price S2 B A X D C D1 D D2 O quantity
Mark scheme: B
Q11 · The diagrams show the demand for and the supply of houses
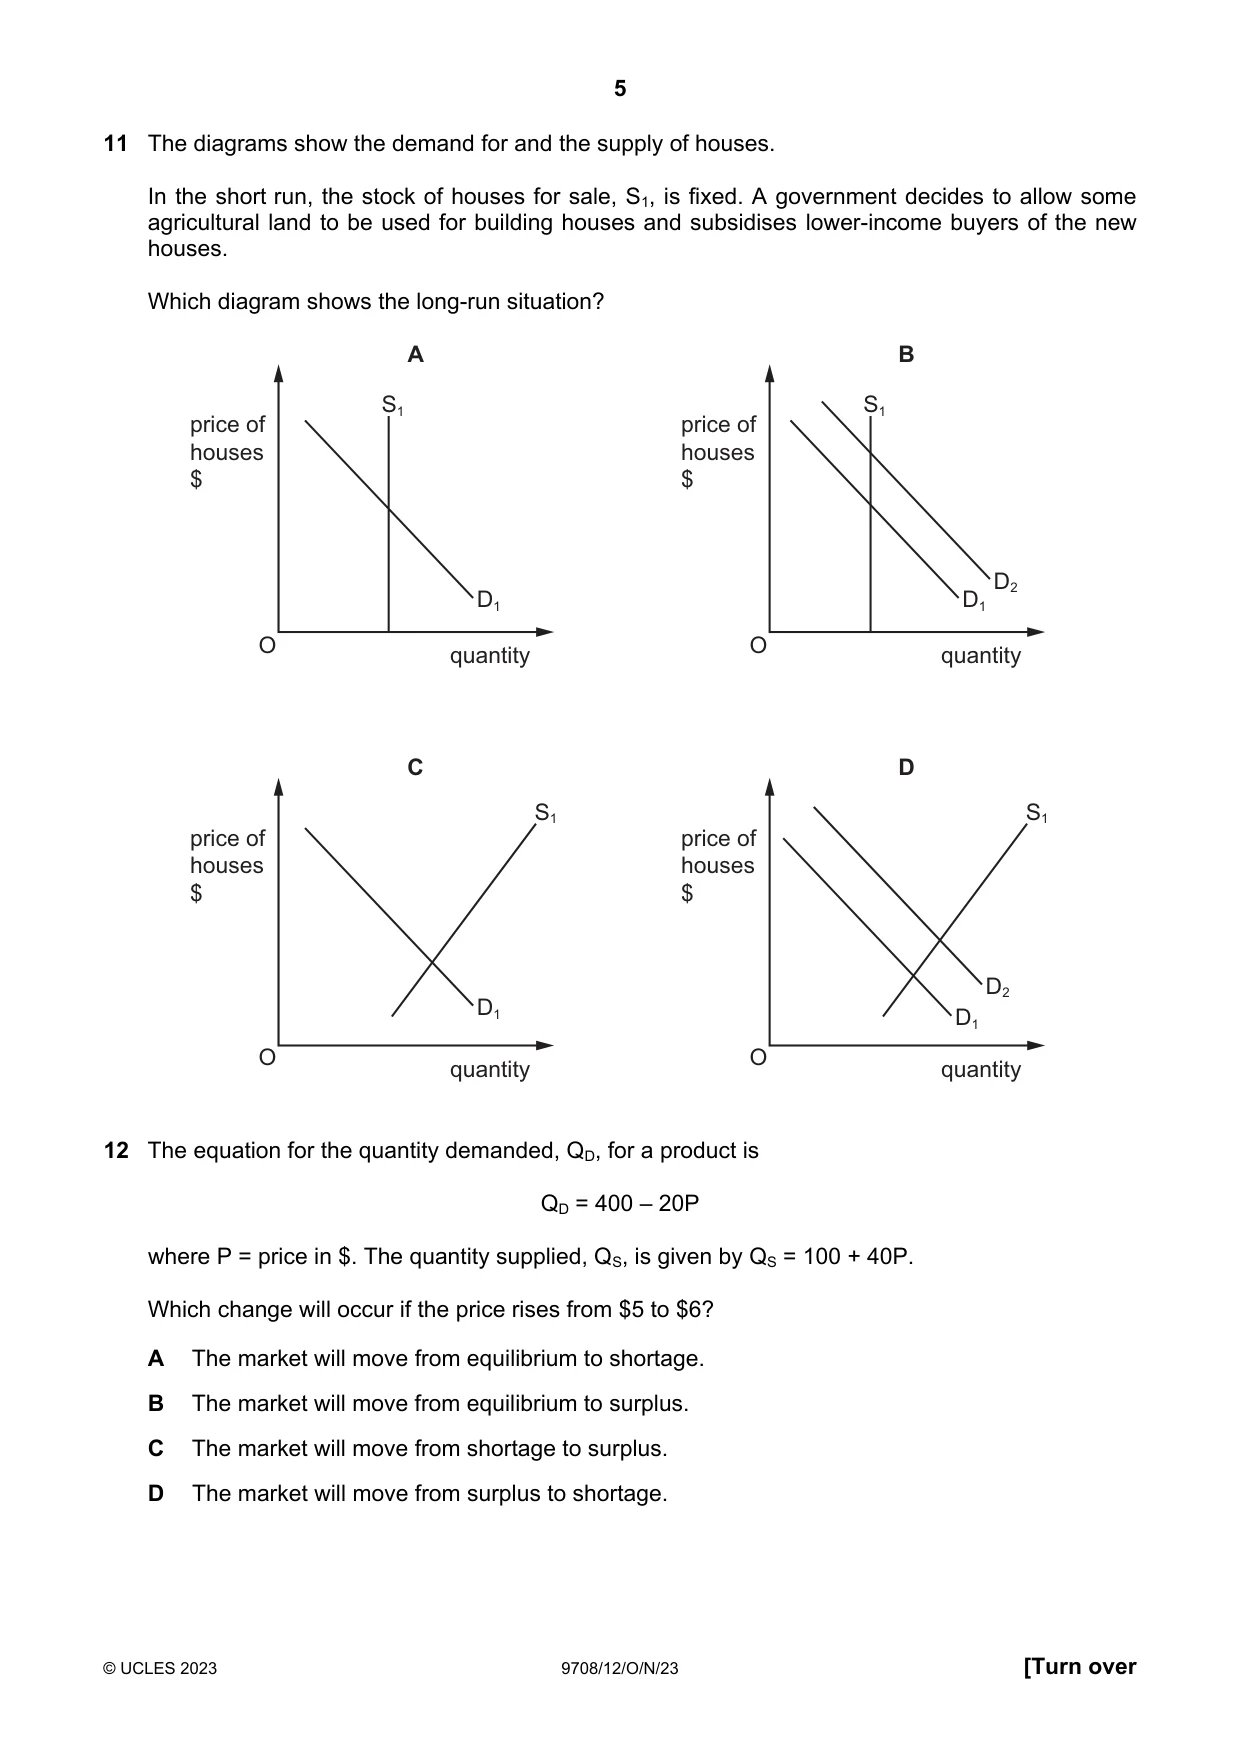
11 The diagrams show the demand for and the supply of houses. In the short run, the stock of houses for sale, S1, is fixed. A government decides to allow some agricultural land to be used for building houses and subsidises lower-income buyers of the new houses. Which diagram shows the long-run situation? A B S1 S1 price of price of houses houses $ $ D2 D1 D1 O O quantity quantity C D S1 S1 price of price of houses houses $ $ D2 D1 D1 O O quantity quantity
Mark scheme: D
Q12 · The equation for the quantity demanded, QD, for a product is QD = 400 – 20P where P =…
12 The equation for the quantity demanded, QD, for a product is QD = 400 – 20P where P = price in $. The quantity supplied, QS, is given by QS = 100 + 40P. Which change will occur if the price rises from $5 to $6? A The market will move from equilibrium to shortage. B The market will move from equilibrium to surplus. C The market will move from shortage to surplus. D The market will move from surplus to shortage.
Mark scheme: B
Q13 · What is the most likely cause of the continuous increase in prices of famous paintings by…
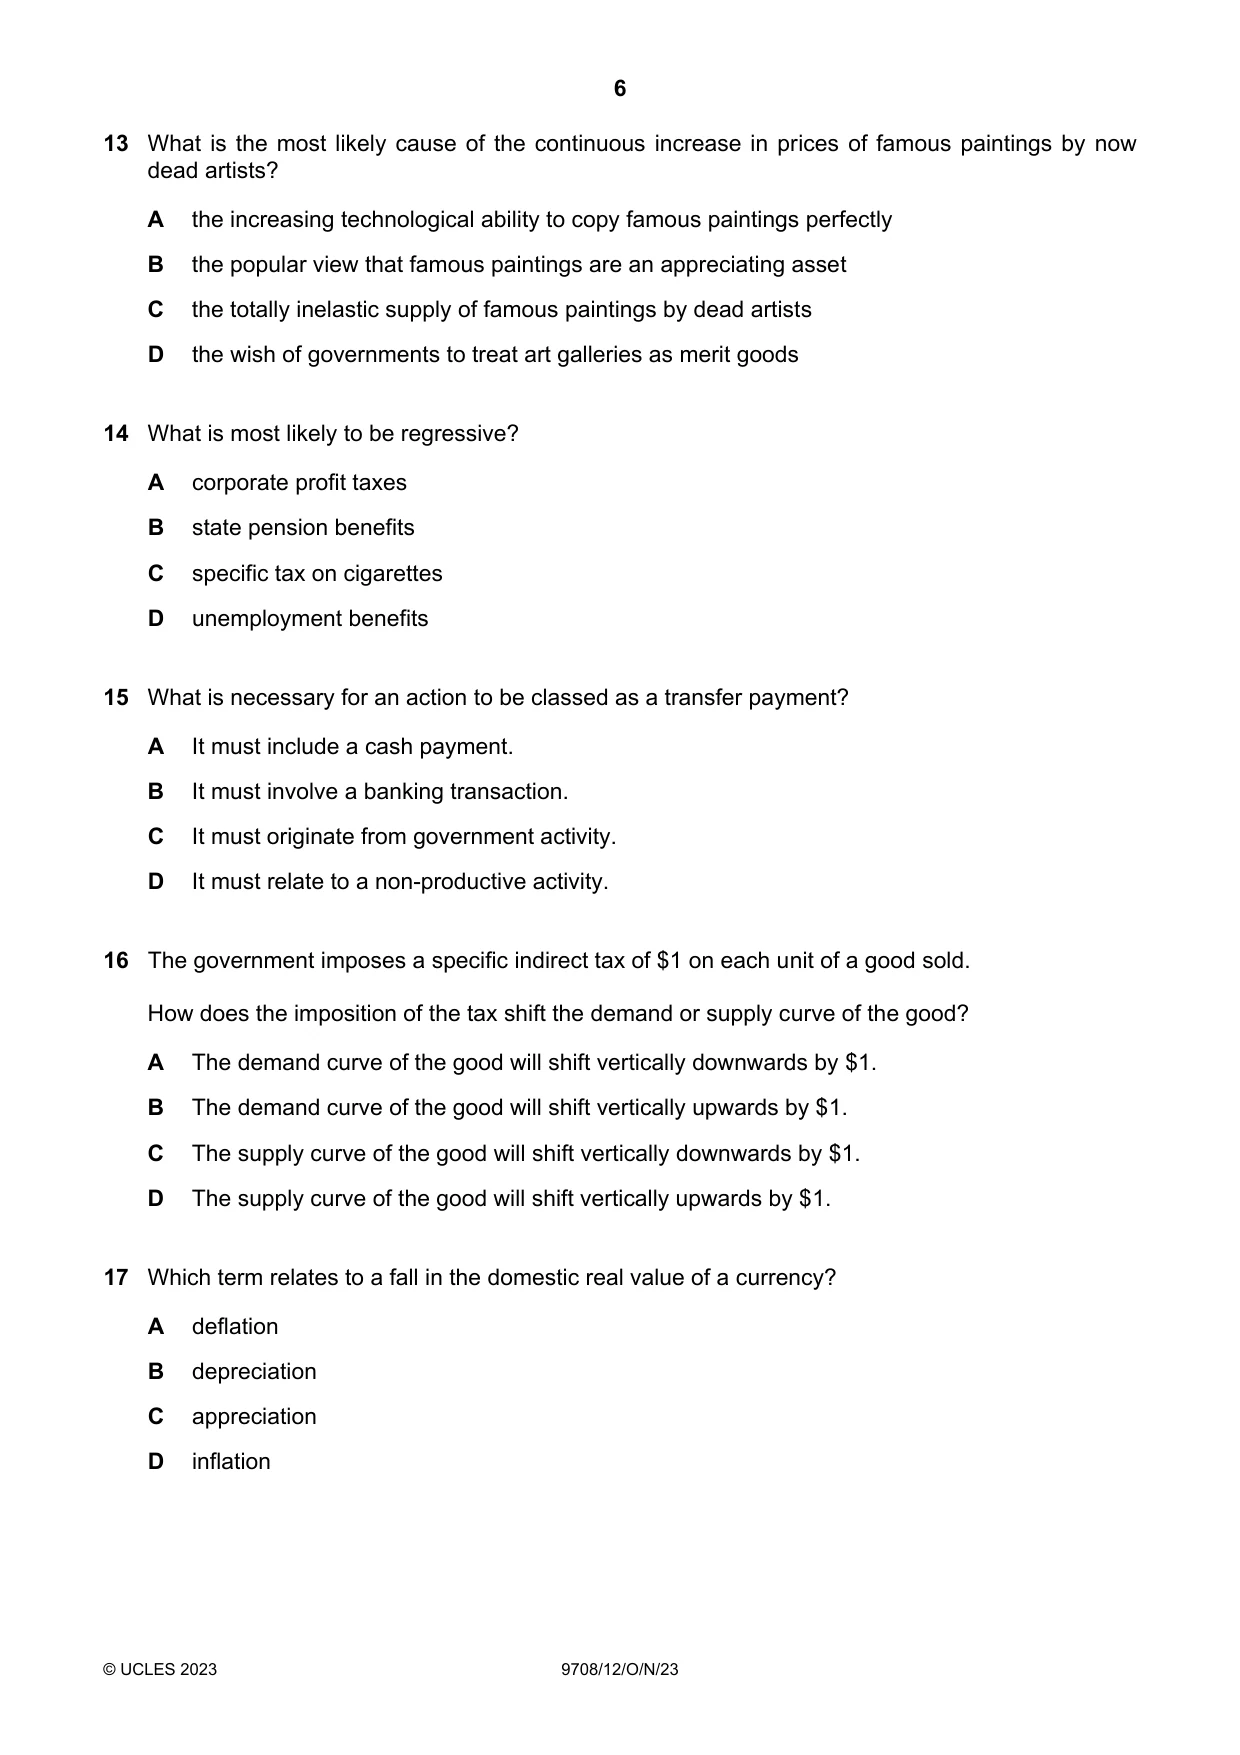
13 What is the most likely cause of the continuous increase in prices of famous paintings by now dead artists? A the increasing technological ability to copy famous paintings perfectly B the popular view that famous paintings are an appreciating asset C the totally inelastic supply of famous paintings by dead artists D the wish of governments to treat art galleries as merit goods
Mark scheme: B
Q14 · What is most likely to be regressive?
14 What is most likely to be regressive? A corporate profit taxes B state pension benefits C specific tax on cigarettes D unemployment benefits
Mark scheme: C
Q15 · What is necessary for an action to be classed as a transfer payment?
15 What is necessary for an action to be classed as a transfer payment? A It must include a cash payment. B It must involve a banking transaction. C It must originate from government activity. D It must relate to a non-productive activity.
Mark scheme: D
Q16 · The government imposes a specific indirect tax of $1 on each unit of a good sold
16 The government imposes a specific indirect tax of $1 on each unit of a good sold. How does the imposition of the tax shift the demand or supply curve of the good? A The demand curve of the good will shift vertically downwards by $1. B The demand curve of the good will shift vertically upwards by $1. C The supply curve of the good will shift vertically downwards by $1. D The supply curve of the good will shift vertically upwards by $1.
Mark scheme: D
More questions on Methods and effects of government intervention in markets
Q17 · Which term relates to a fall in the domestic real value of a currency?
17 Which term relates to a fall in the domestic real value of a currency? A deflation B depreciation C appreciation D inflation
Mark scheme: D
Q18 · What must be the result for a country of a rise in its export prices relative to its…
18 What must be the result for a country of a rise in its export prices relative to its import prices? A a deficit in its trade in goods B an improvement in its terms of trade C an increase in its inflation rate D a rise in its exchange rate
Mark scheme: B
Q19 · Country X can produce a product at a lower opportunity cost than country Y
19 Country X can produce a product at a lower opportunity cost than country Y. Which term best describes this statement? A absolute advantage B comparative advantage C specialisation D terms of trade
Mark scheme: B
Q20 · For a given year, economy X publishes the following
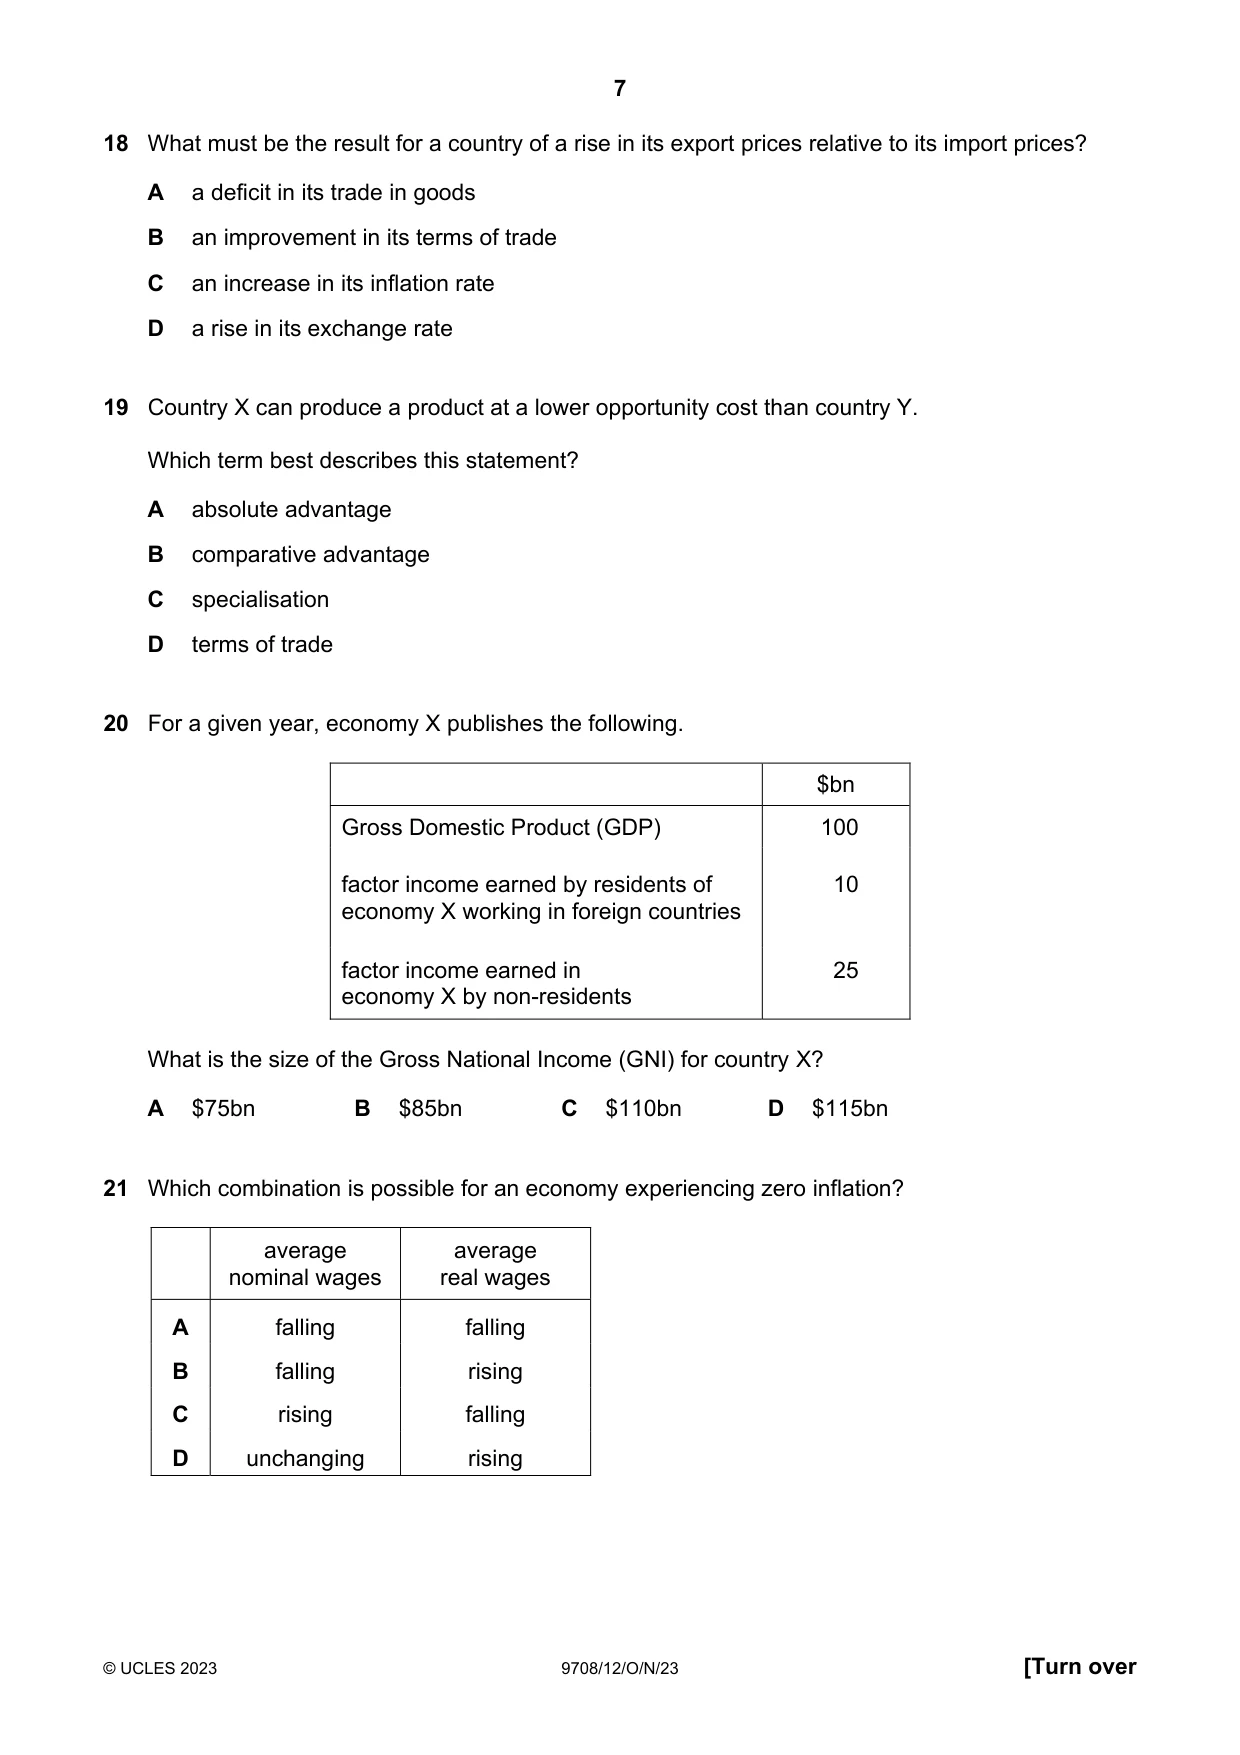
20 For a given year, economy X publishes the following. $bn Gross Domestic Product (GDP) 100 factor income earned by residents of 10 economy X working in foreign countries factor income earned in 25 economy X by non-residents What is the size of the Gross National Income (GNI) for country X? A $75bn B $85bn C $110bn D $115bn
Mark scheme: B
Q21 · Which combination is possible for an economy experiencing zero inflation?
21 Which combination is possible for an economy experiencing zero inflation? average average nominal wages real wages A falling falling B falling rising C rising falling D unchanging rising
Mark scheme: A
Q22 · The graph shows the rate of inflation in Japan from April 2020 to February 2021
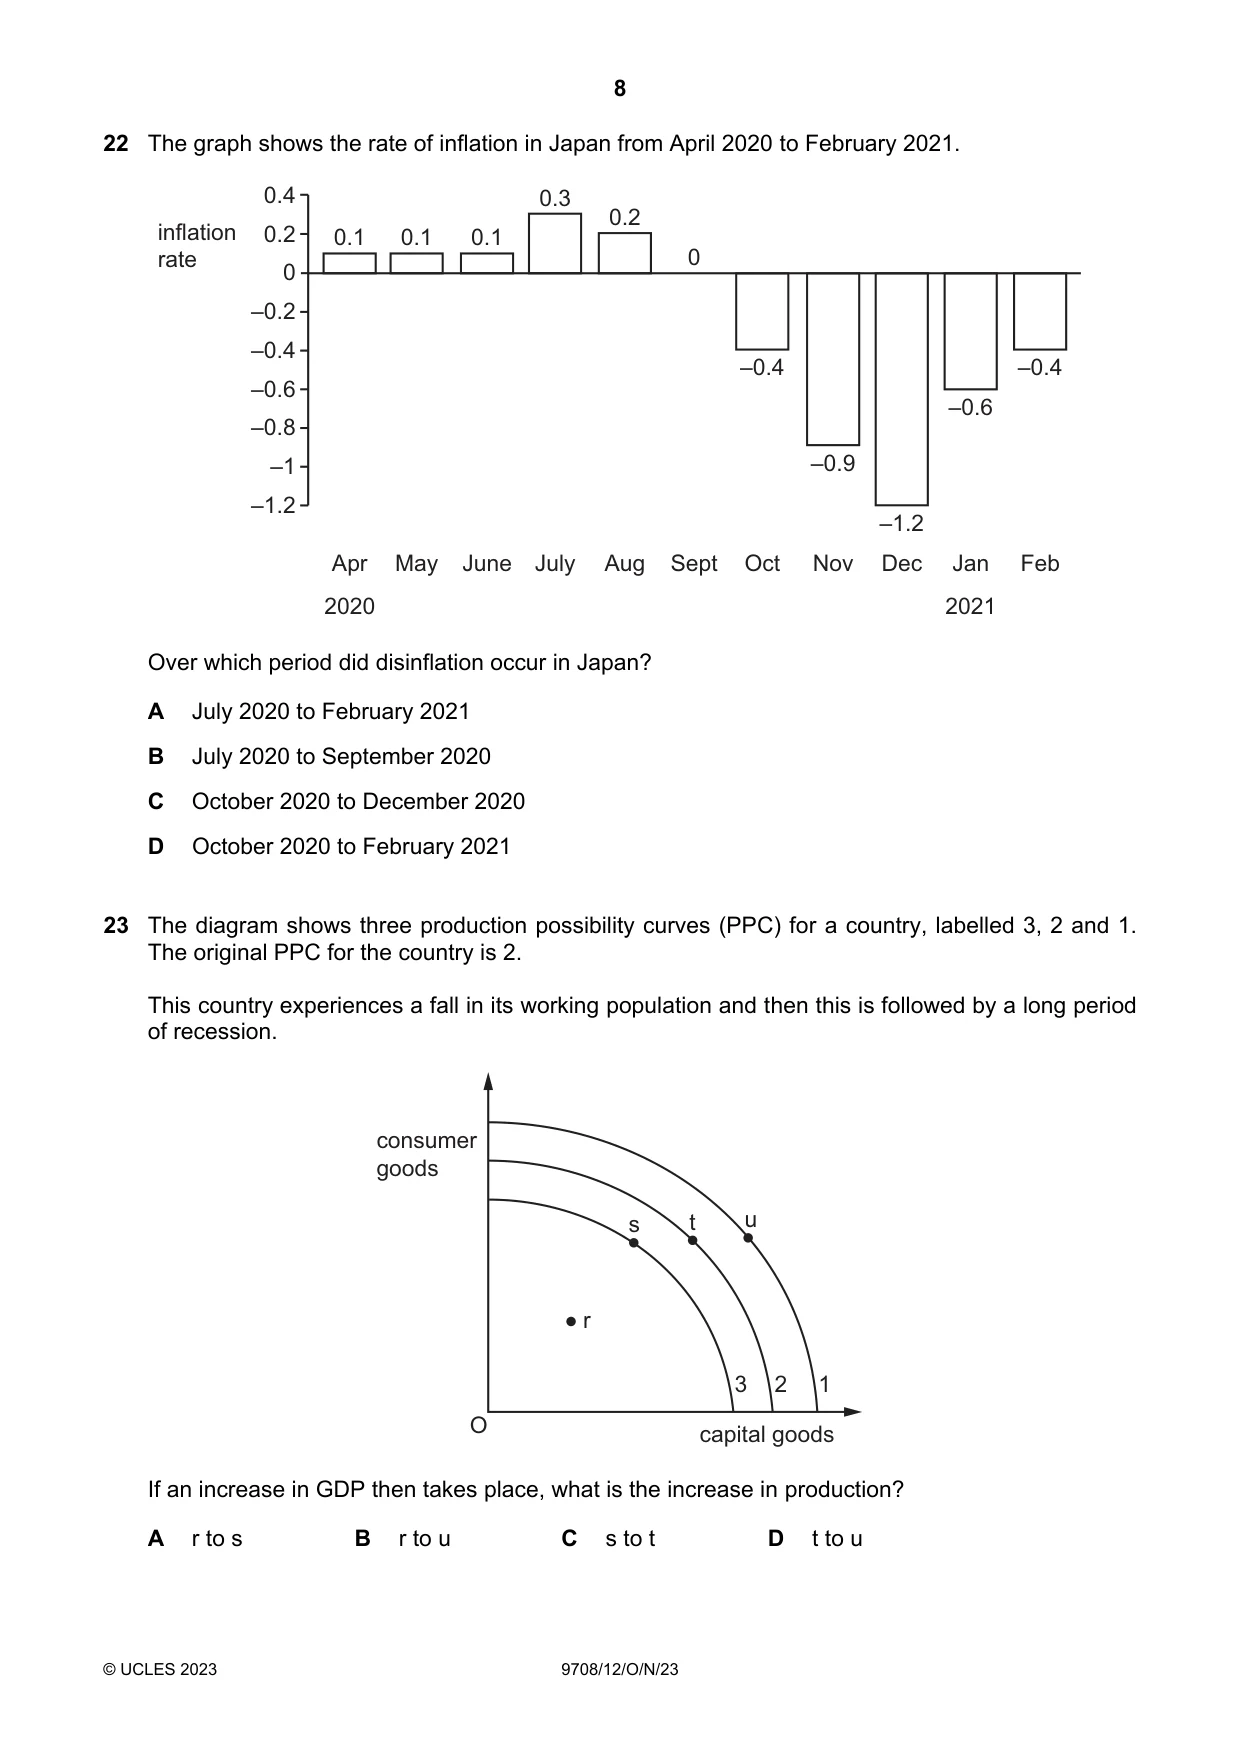
22 The graph shows the rate of inflation in Japan from April 2020 to February 2021. 0.4 0.3 0.2 inflation 0.2 0.1 0.1 0.1 rate 0 0 –0.2 –0.4 –0.4 –0.4 –0.6 –0.6 –0.8 –1 –0.9 –1.2 –1.2 Apr May June July Aug Sept Oct Nov Dec Jan Feb 2020 2021 Over which period did disinflation occur in Japan? A July 2020 to February 2021 B July 2020 to September 2020 C October 2020 to December 2020 D October 2020 to February 2021
Mark scheme: B
Q23 · The diagram shows three production possibility curves (PPC) for a country, labelled 3, 2…
23 The diagram shows three production possibility curves (PPC) for a country, labelled 3, 2 and 1. The original PPC for the country is 2. This country experiences a fall in its working population and then this is followed by a long period of recession. consumer goods s t u r 3 2 1 O capital goods If an increase in GDP then takes place, what is the increase in production? A r to s B r to u C s to t D t to u
Mark scheme: A
Q24 · A government increases the rate of income tax
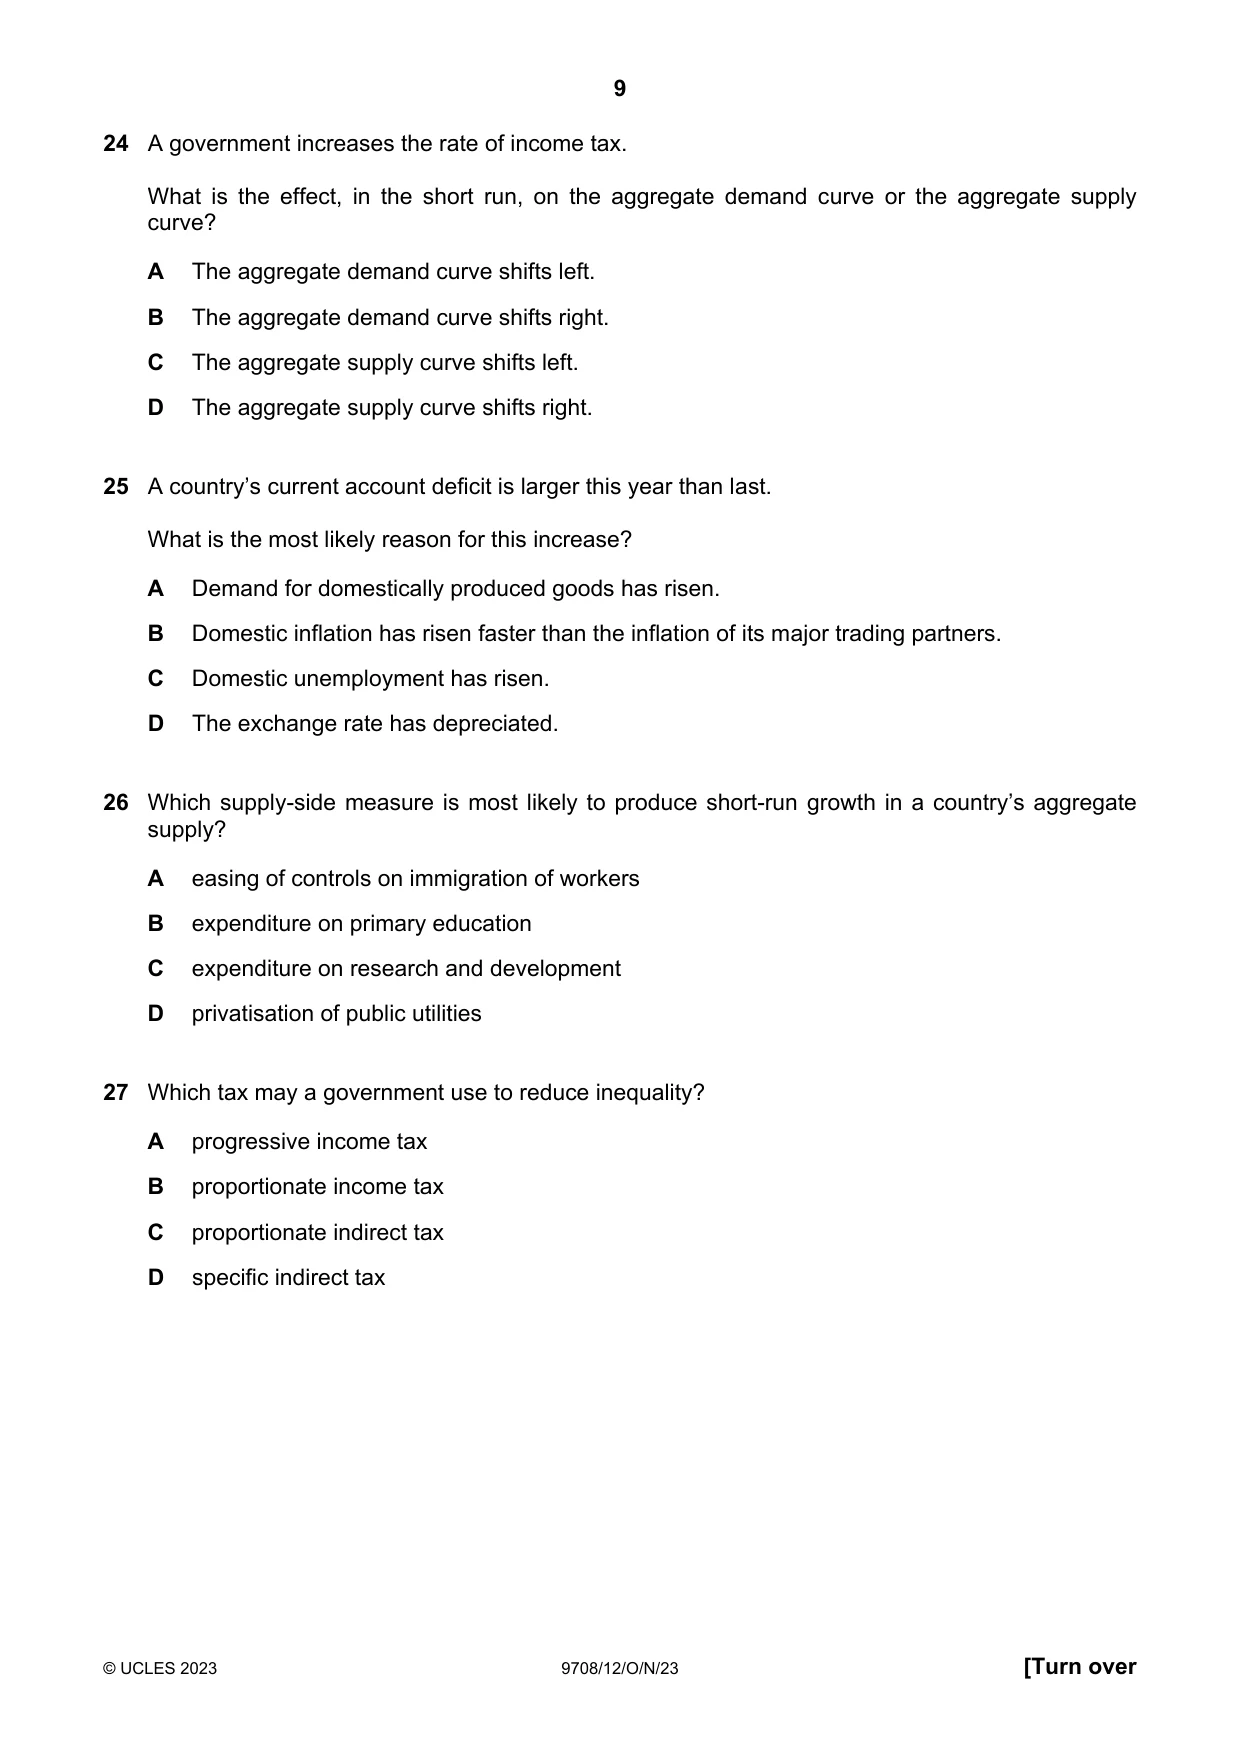
24 A government increases the rate of income tax. What is the effect, in the short run, on the aggregate demand curve or the aggregate supply curve? A The aggregate demand curve shifts left. B The aggregate demand curve shifts right. C The aggregate supply curve shifts left. D The aggregate supply curve shifts right.
Mark scheme: A
Q25 · A country’s current account deficit is larger this year than last
25 A country’s current account deficit is larger this year than last. What is the most likely reason for this increase? A Demand for domestically produced goods has risen. B Domestic inflation has risen faster than the inflation of its major trading partners. C Domestic unemployment has risen. D The exchange rate has depreciated.
Mark scheme: B
More questions on Current account of the balance of payments
Q26 · Which supply-side measure is most likely to produce short-run growth in a country’s…
26 Which supply-side measure is most likely to produce short-run growth in a country’s aggregate supply? A easing of controls on immigration of workers B expenditure on primary education C expenditure on research and development D privatisation of public utilities
Mark scheme: A
Q27 · Which tax may a government use to reduce inequality?
27 Which tax may a government use to reduce inequality? A progressive income tax B proportionate income tax C proportionate indirect tax D specific indirect tax
Mark scheme: A
Q28 · A foreign government pays a UK university to educate its students
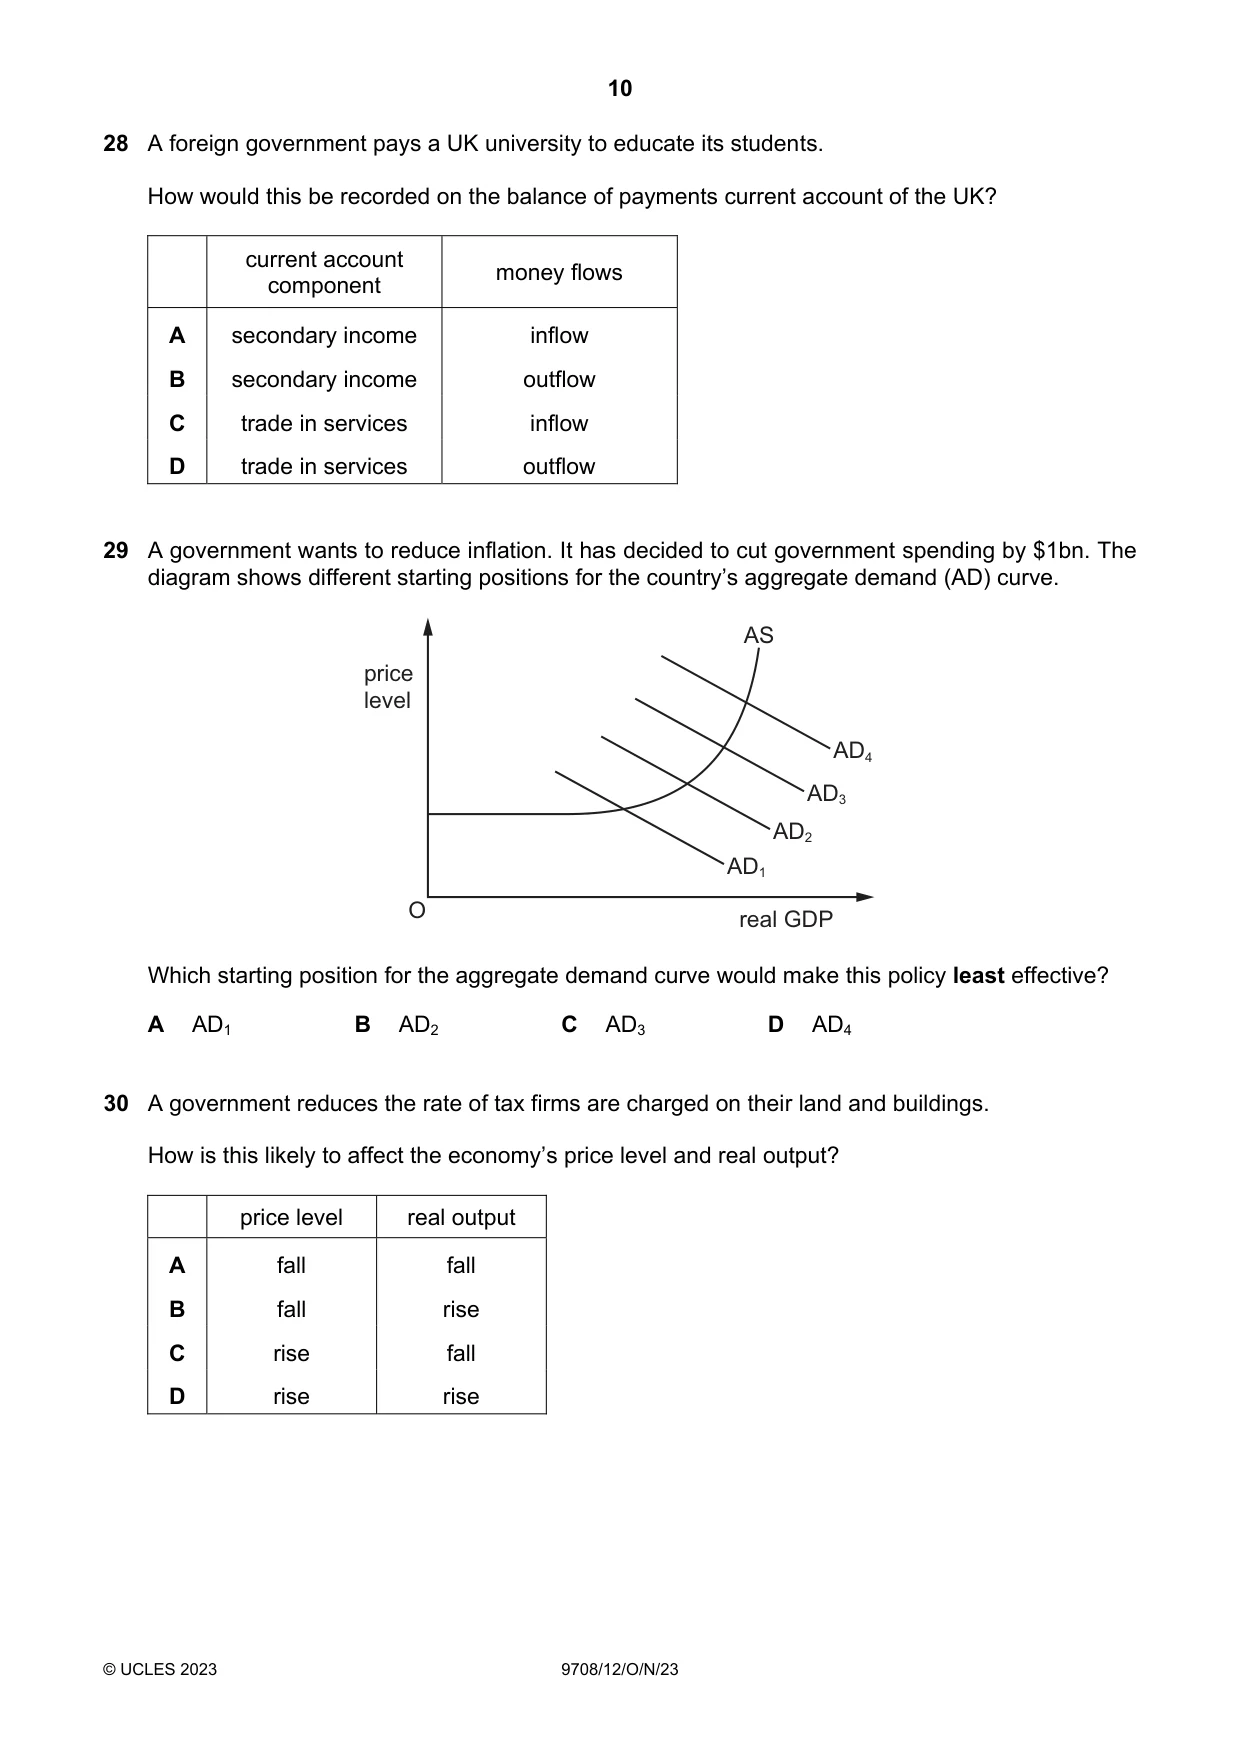
28 A foreign government pays a UK university to educate its students. How would this be recorded on the balance of payments current account of the UK? current account money flows component A secondary income inflow B secondary income outflow C trade in services inflow D trade in services outflow
Mark scheme: C
More questions on Current account of the balance of payments
Q29 · A government wants to reduce inflation
29 A government wants to reduce inflation. It has decided to cut government spending by $1bn. The diagram shows different starting positions for the country’s aggregate demand (AD) curve. AS price level AD4 AD3 AD2 AD1 O real GDP Which starting position for the aggregate demand curve would make this policy least effective? A AD1 B AD2 C AD3 D AD4
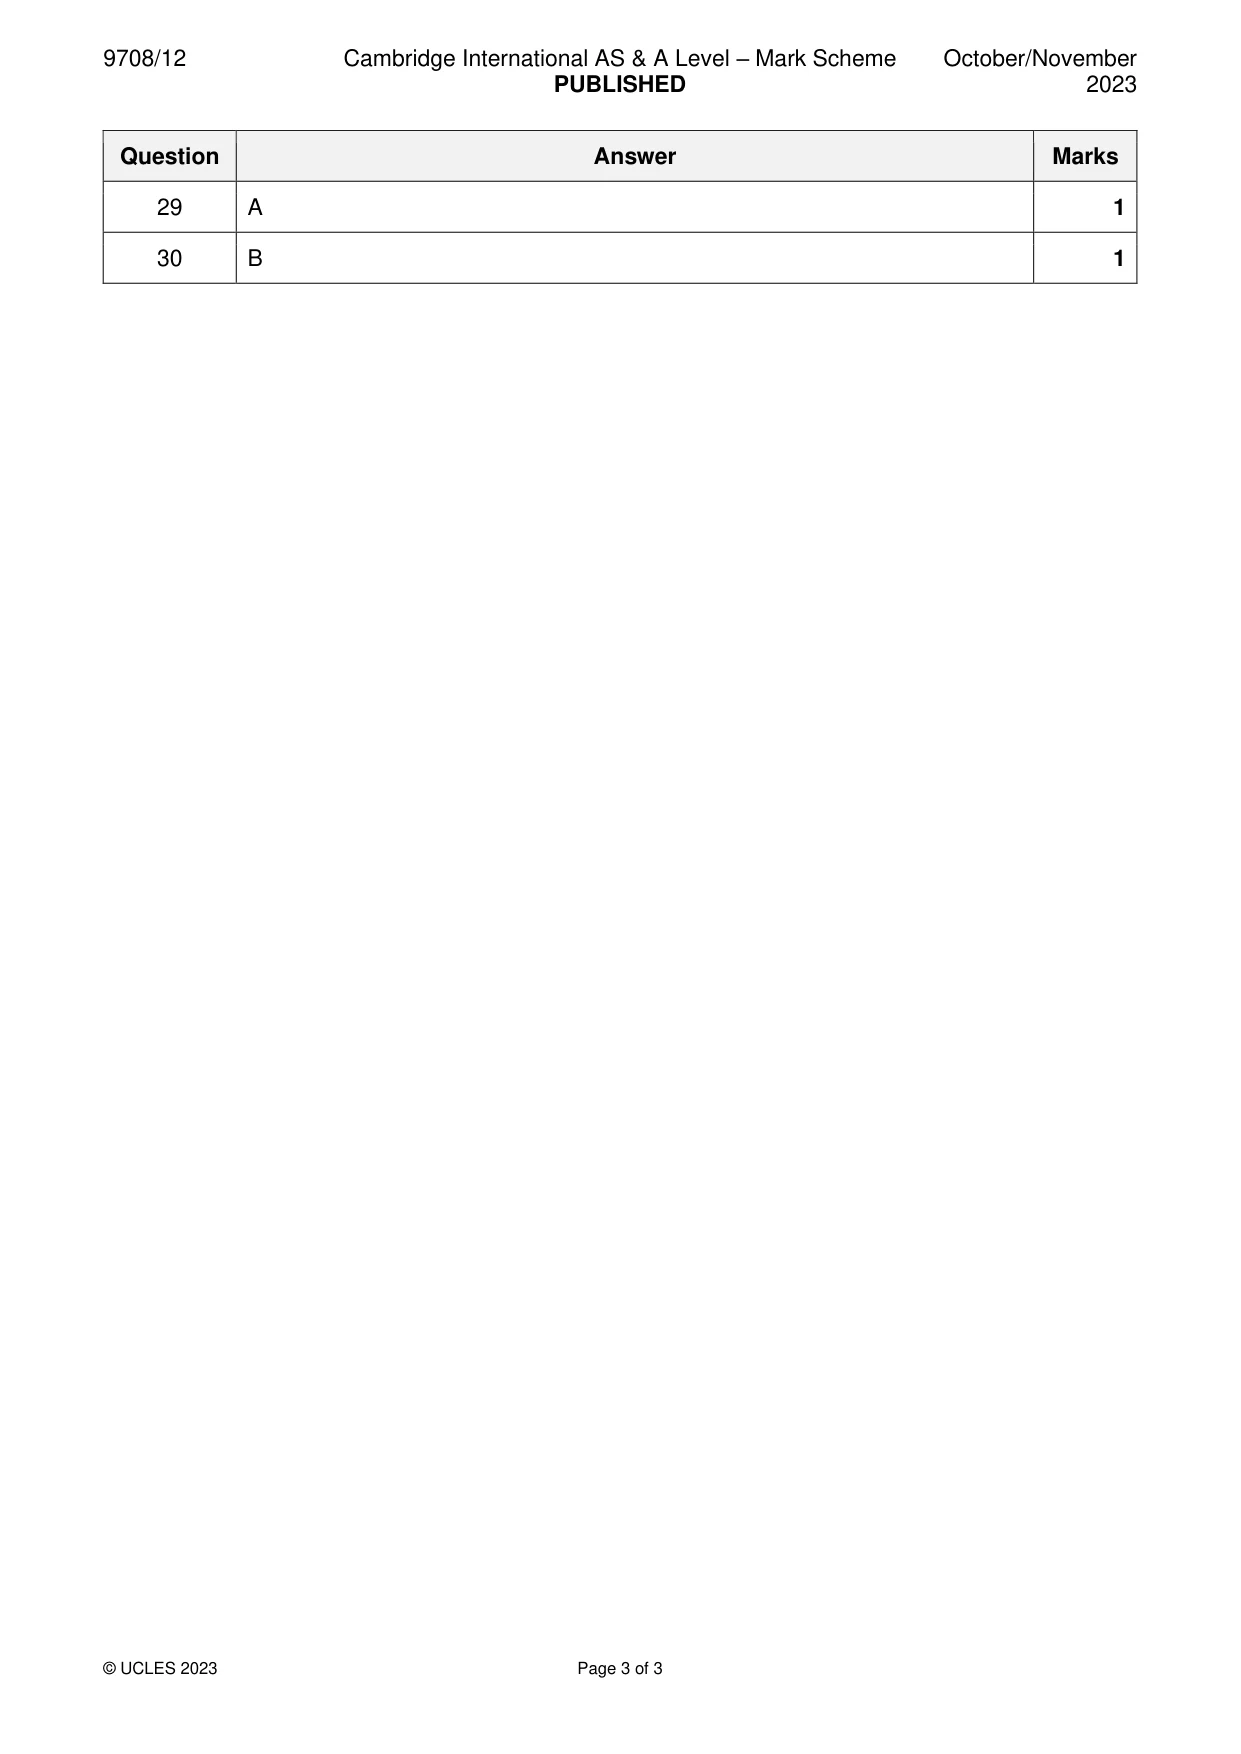
Mark scheme: A
More questions on Aggregate Demand and Aggregate Supply analysis
Q30 · A government reduces the rate of tax firms are charged on their land and buildings
30 A government reduces the rate of tax firms are charged on their land and buildings. How is this likely to affect the economy’s price level and real output? price level real output A fall fall B fall rise C rise fall D rise rise
Mark scheme: B
What was in this paper
The subtopics covered by these 30 questions, and how many questions each got. Open one in a new tab to see every Cambridge question on it.
4Addressing income and wealth inequality2Current account of the balance of payments2National income statistics2Price stability2Production possibility curves2Supply-side policy2The reasons for international trade2Aggregate Demand and Aggregate Supply analysis1Classification of goods and services1Consumer and producer surplus1Demand and supply curves1Efficiency and market failure1Exchange rates1Factors of production1Fiscal policy1Methods and effects of government intervention in markets1Price elasticity of supply1Price elasticity, income elasticity and cross elasticity of demand1Resource allocation in different economic systems1What you needed in this session
Cambridge’s own grade thresholds for 2023 Oct/Nov, Paper 1 · Variant 2. A higher threshold means an easier paper — the bar moves with how the cohort did.