Cambridge A Level Economics 9708 — 2020 May/June Paper 1 · Variant 3
9708/13/M/J/20 · 30 questions · 30 marks · ≈34 min
The question paper and its mark scheme, free to read here and free to download. This is Cambridge’s own paper, exactly as it was sat.
Question paper12 pages
Mark scheme3 pages
Answers below. Sit the paper first if you are practising.
Questions as text
Q1 · An economist knows the current point at which an economy is operating within its…
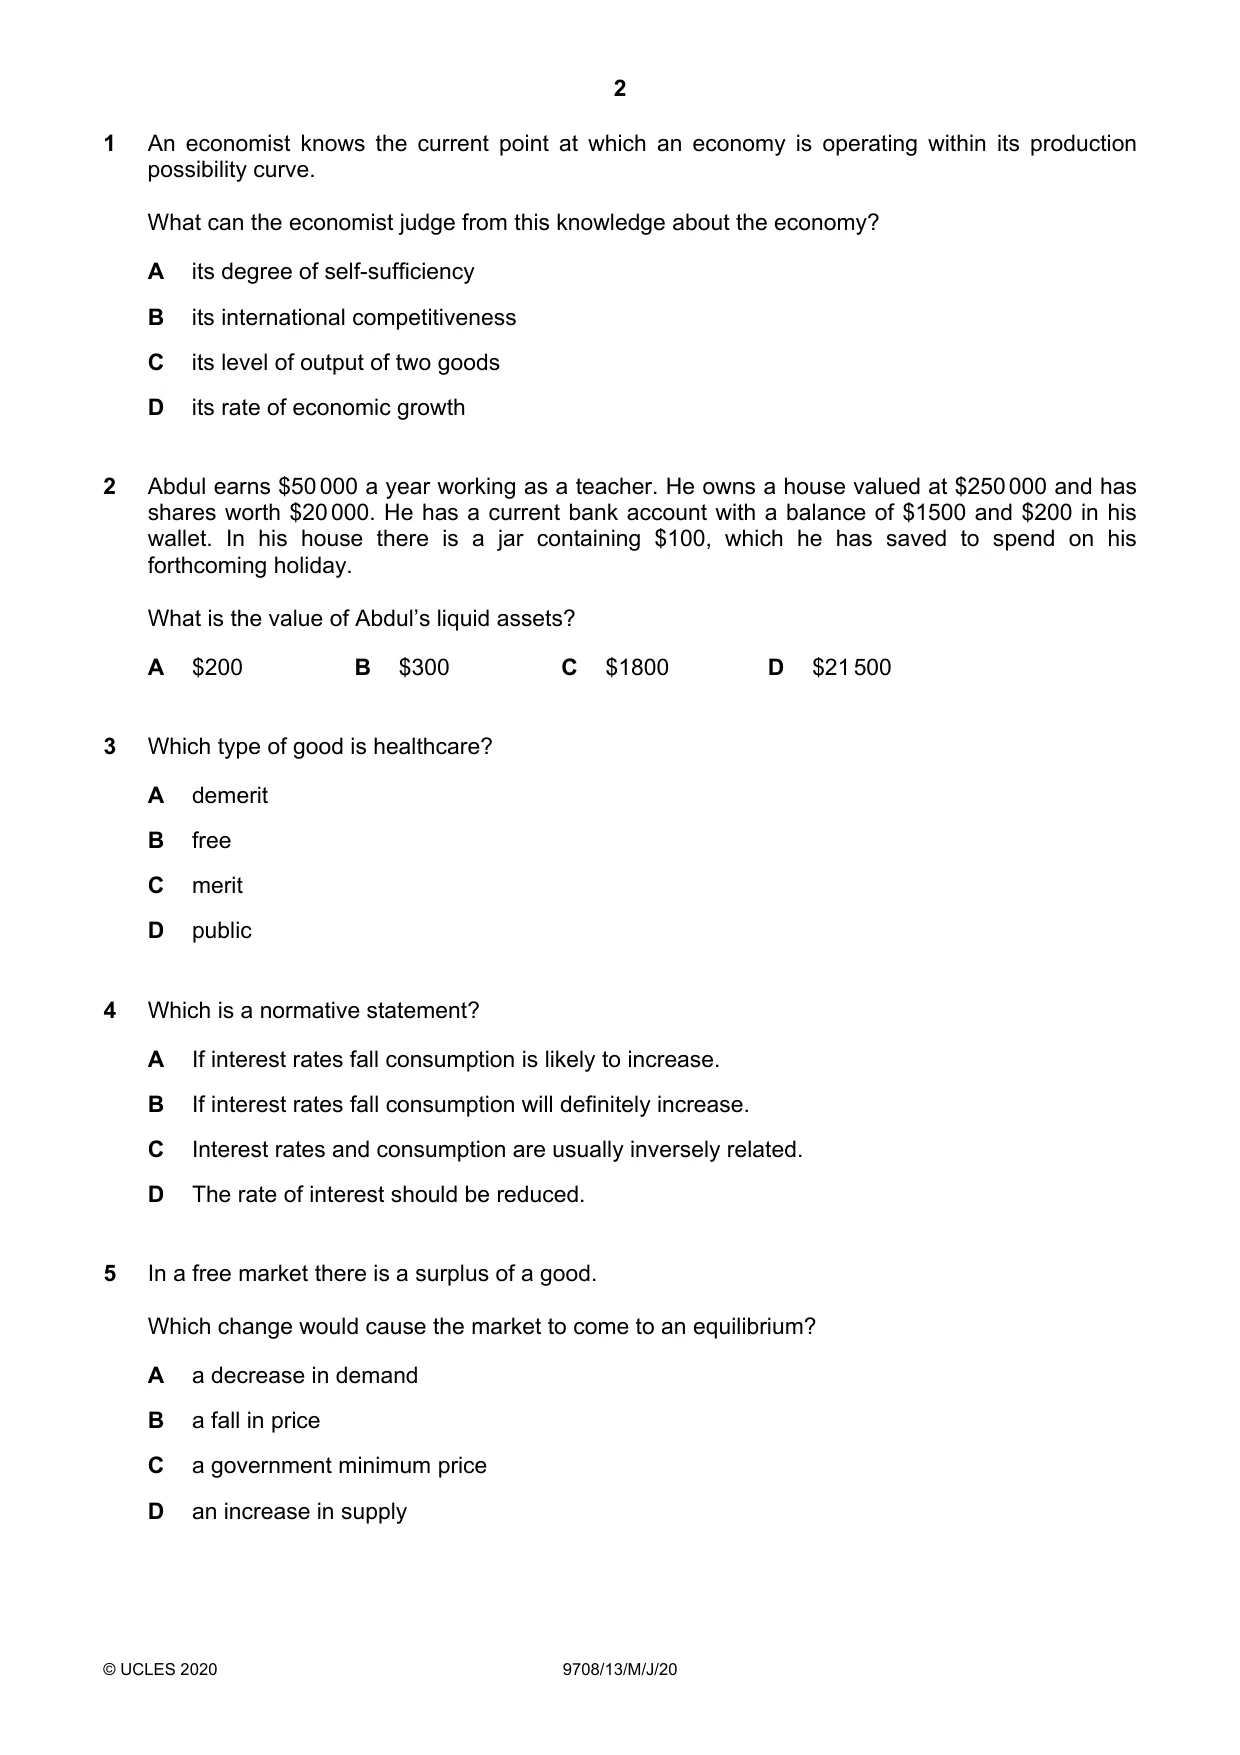
1 An economist knows the current point at which an economy is operating within its production possibility curve. What can the economist judge from this knowledge about the economy? A its degree of self-sufficiency B its international competitiveness C its level of output of two goods D its rate of economic growth
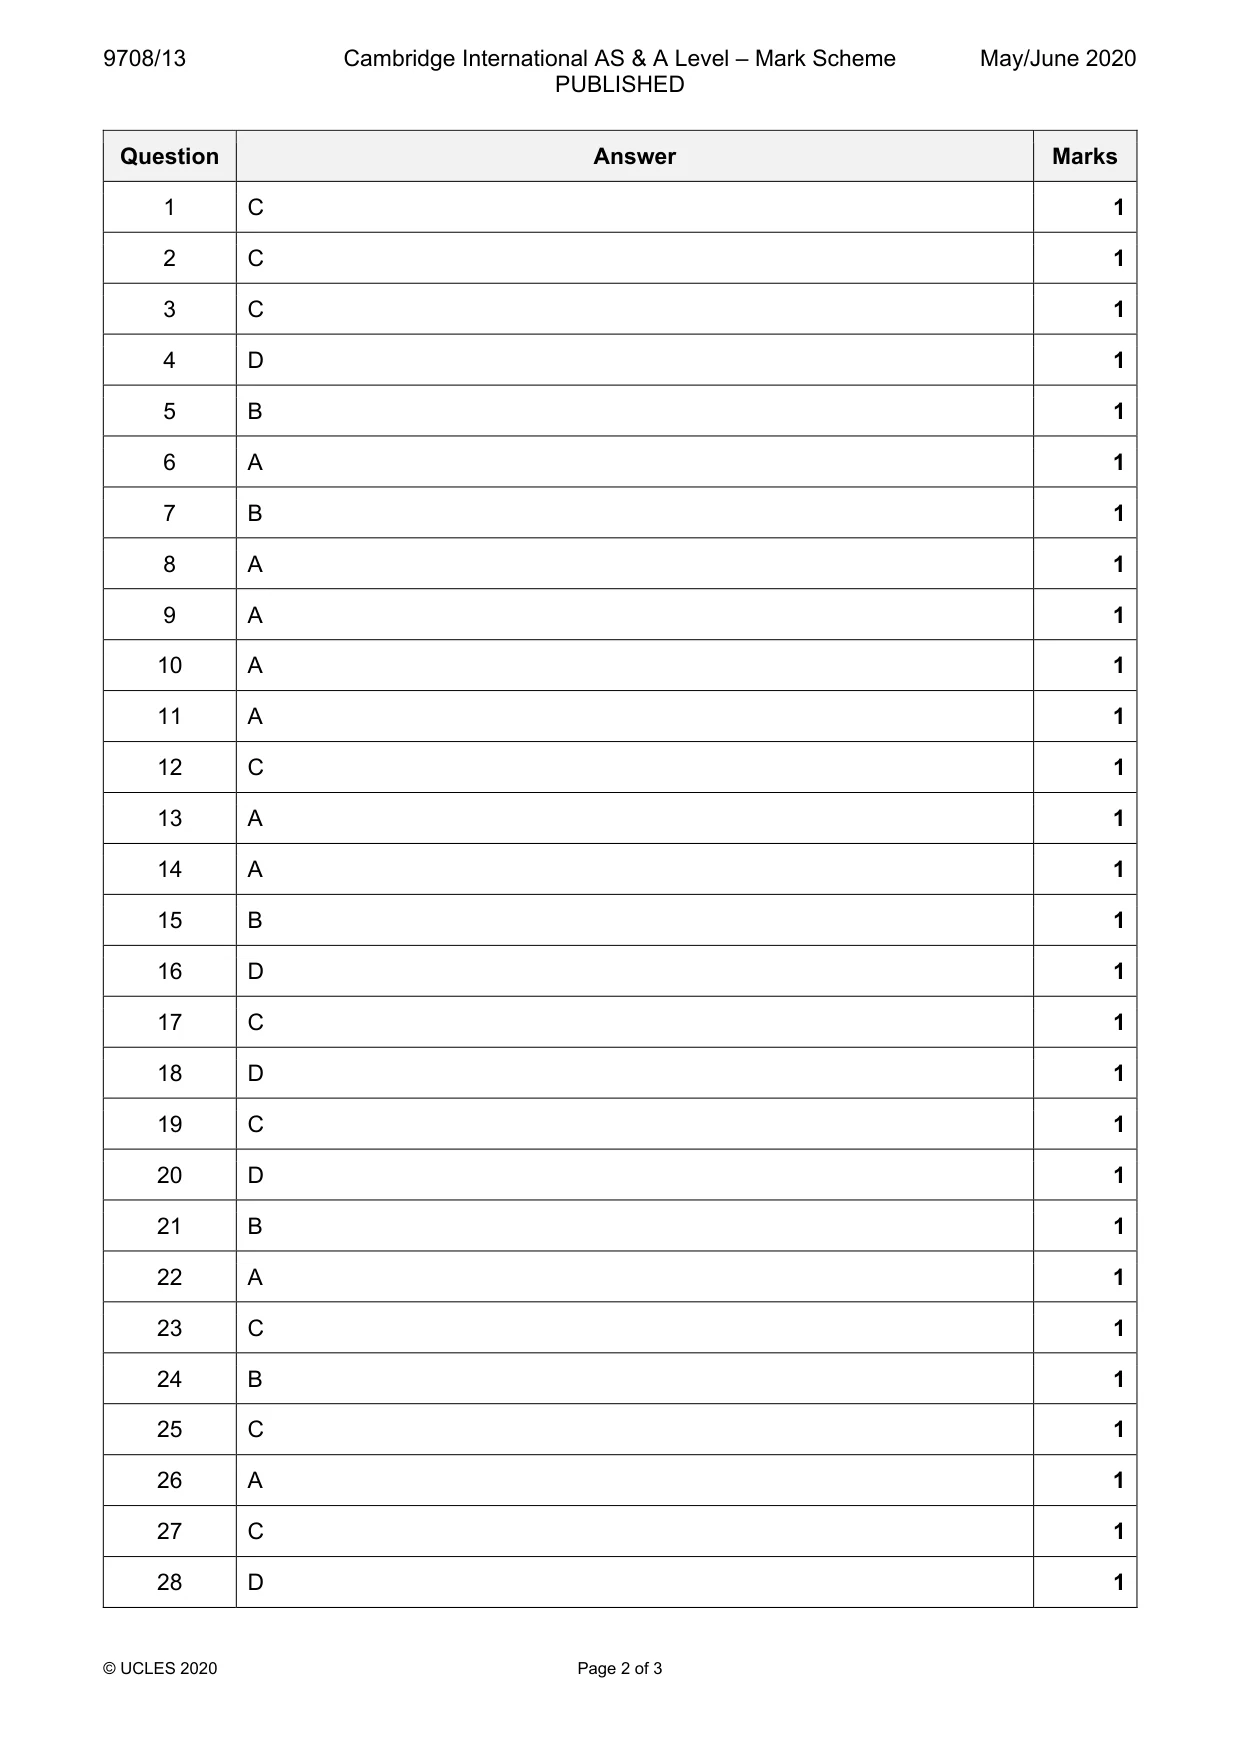
Mark scheme: C
Q2 · Abdul earns $50 000 a year working as a teacher
2 Abdul earns $50 000 a year working as a teacher. He owns a house valued at $250 000 and has shares worth $20 000. He has a current bank account with a balance of $1500 and $200 in his wallet. In his house there is a jar containing $100, which he has saved to spend on his forthcoming holiday. What is the value of Abdul’s liquid assets? A $200 B $300 C $1800 D $21 500
Mark scheme: C
Q3 · Which type of good is healthcare?
3 Which type of good is healthcare? A demerit B free C merit D public
Mark scheme: C
Q4 · Which is a normative statement?
4 Which is a normative statement? A If interest rates fall consumption is likely to increase. B If interest rates fall consumption will definitely increase. C Interest rates and consumption are usually inversely related. D The rate of interest should be reduced.
Mark scheme: D
Q5 · In a free market there is a surplus of a good
5 In a free market there is a surplus of a good. Which change would cause the market to come to an equilibrium? A a decrease in demand B a fall in price C a government minimum price D an increase in supply
Mark scheme: B
Q6 · What is most likely to increase the quantity of houses supplied?
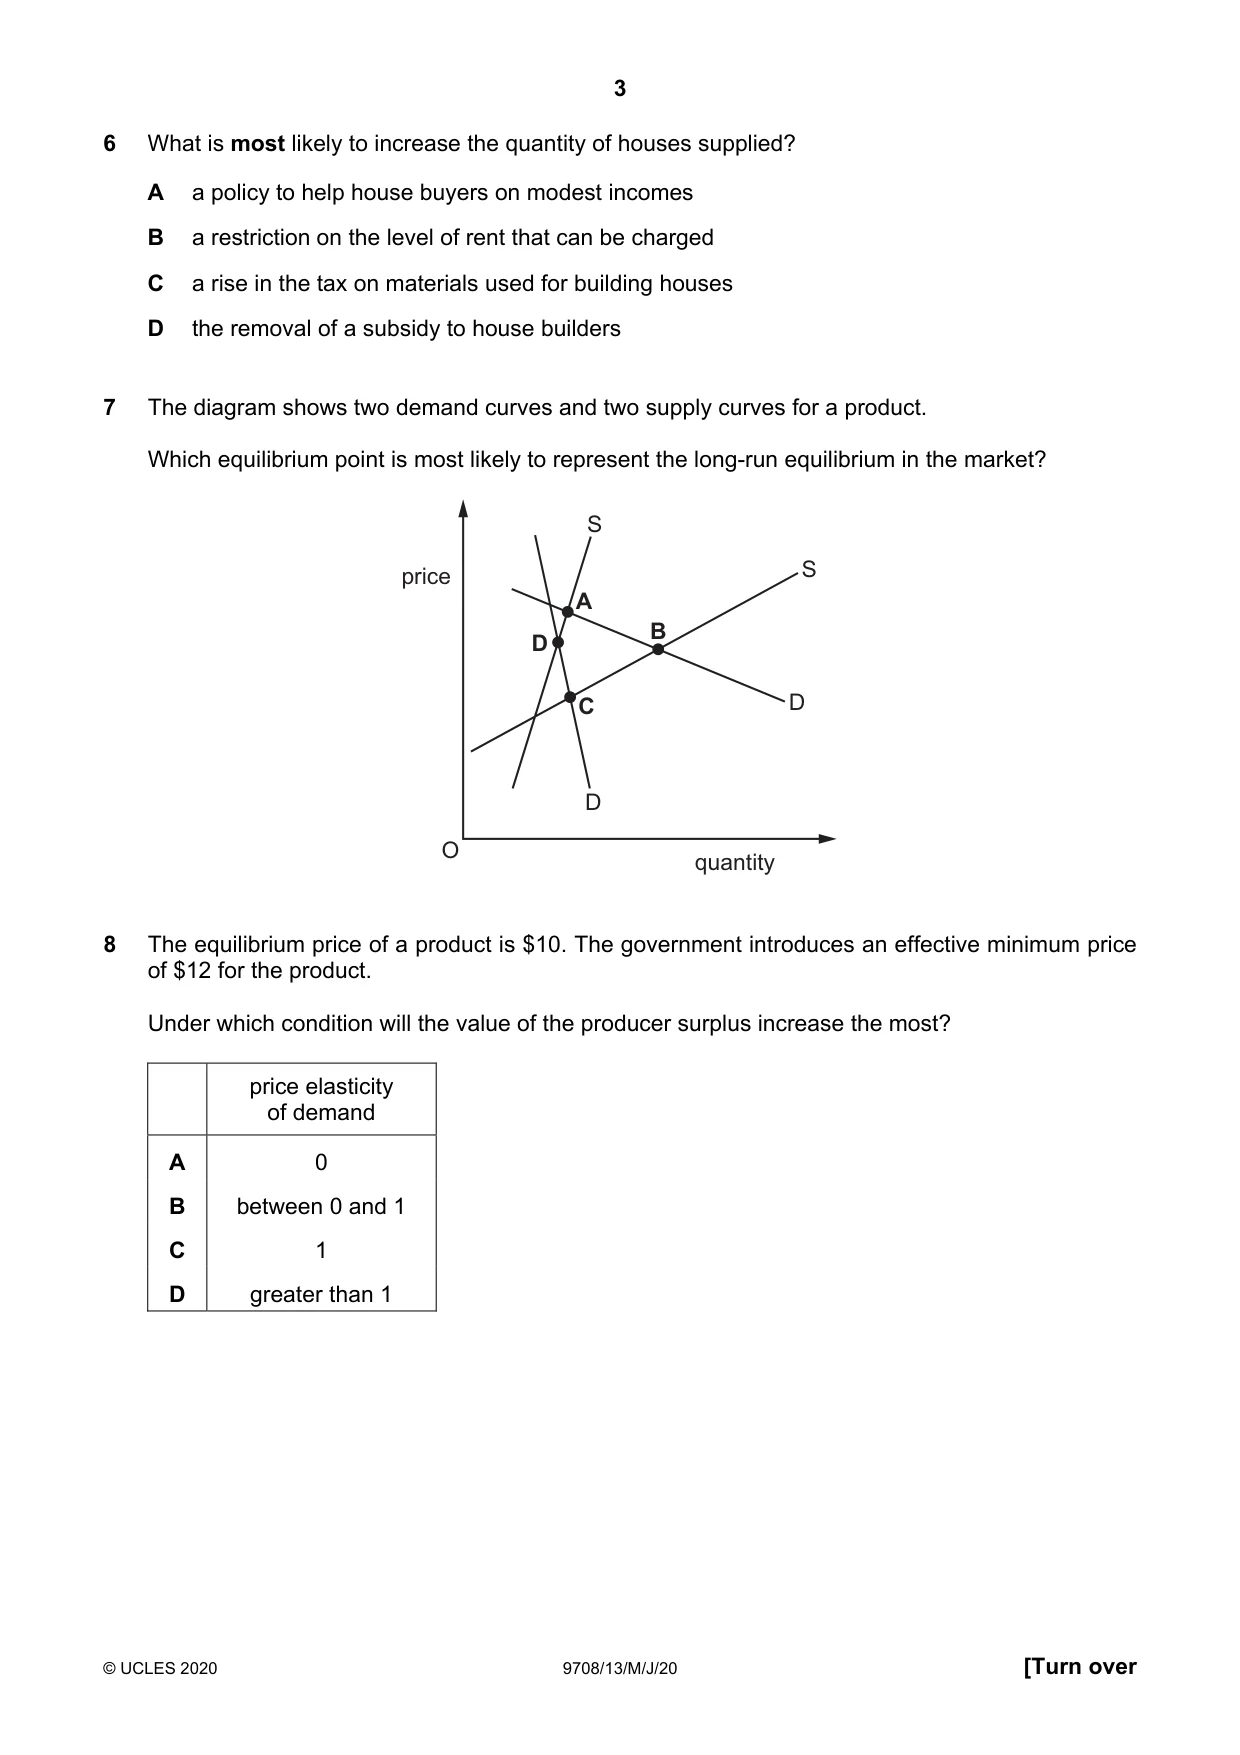
6 What is most likely to increase the quantity of houses supplied? A a policy to help house buyers on modest incomes B a restriction on the level of rent that can be charged C a rise in the tax on materials used for building houses D the removal of a subsidy to house builders
Mark scheme: A
Q7 · The diagram shows two demand curves and two supply curves for a product
7 The diagram shows two demand curves and two supply curves for a product. Which equilibrium point is most likely to represent the long-run equilibrium in the market? S price S A B D C D D O quantity
Mark scheme: B
Q8 · The equilibrium price of a product is $10
8 The equilibrium price of a product is $10. The government introduces an effective minimum price of $12 for the product. Under which condition will the value of the producer surplus increase the most? price elasticity of demand A 0 B between 0 and 1 C 1 D greater than 1
Mark scheme: A
More questions on Methods and effects of government intervention in markets
Q9 · Diesel engines are a major cause of air pollution in cities
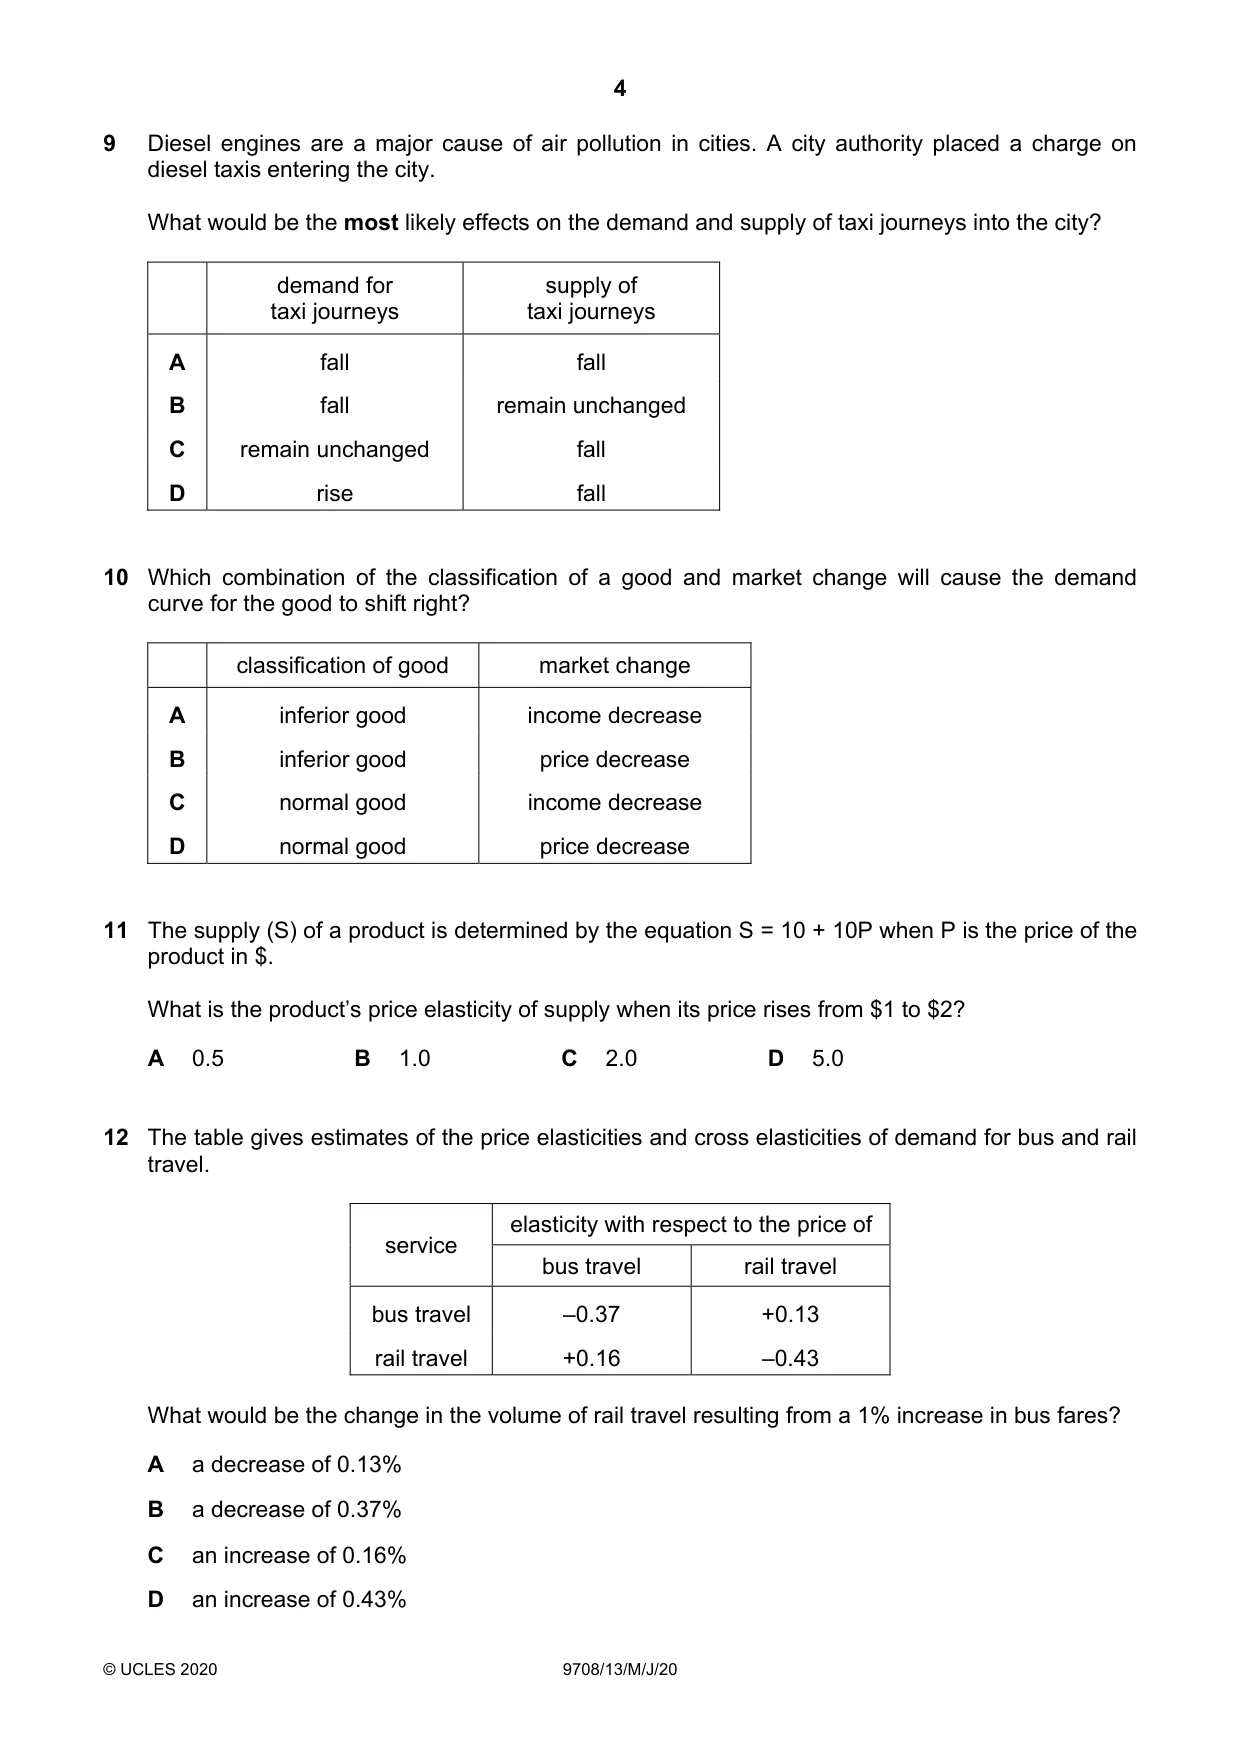
9 Diesel engines are a major cause of air pollution in cities. A city authority placed a charge on diesel taxis entering the city. What would be the most likely effects on the demand and supply of taxi journeys into the city? demand for supply of taxi journeys taxi journeys A fall fall B fall remain unchanged C remain unchanged fall D rise fall
Mark scheme: A
Q10 · Which combination of the classification of a good and market change will cause the demand…
10 Which combination of the classification of a good and market change will cause the demand curve for the good to shift right? classification of good market change A inferior good income decrease B inferior good price decrease C normal good income decrease D normal good price decrease
Mark scheme: A
Q11 · The supply (S) of a product is determined by the equation S = 10 + 10P when P is the…
11 The supply (S) of a product is determined by the equation S = 10 + 10P when P is the price of the product in $. What is the product’s price elasticity of supply when its price rises from $1 to $2? A 0.5 B 1.0 C 2.0 D 5.0
Mark scheme: A
Q12 · The table gives estimates of the price elasticities and cross elasticities of demand for…
12 The table gives estimates of the price elasticities and cross elasticities of demand for bus and rail travel. elasticity with respect to the price of service bus travel rail travel bus travel –0.37 +0.13 rail travel +0.16 –0.43 What would be the change in the volume of rail travel resulting from a 1% increase in bus fares? A a decrease of 0.13% B a decrease of 0.37% C an increase of 0.16% D an increase of 0.43%
Mark scheme: C
More questions on Price elasticity, income elasticity and cross elasticity of demand
Q13 · Which combination is most likely to result in the demand for a product being highly…
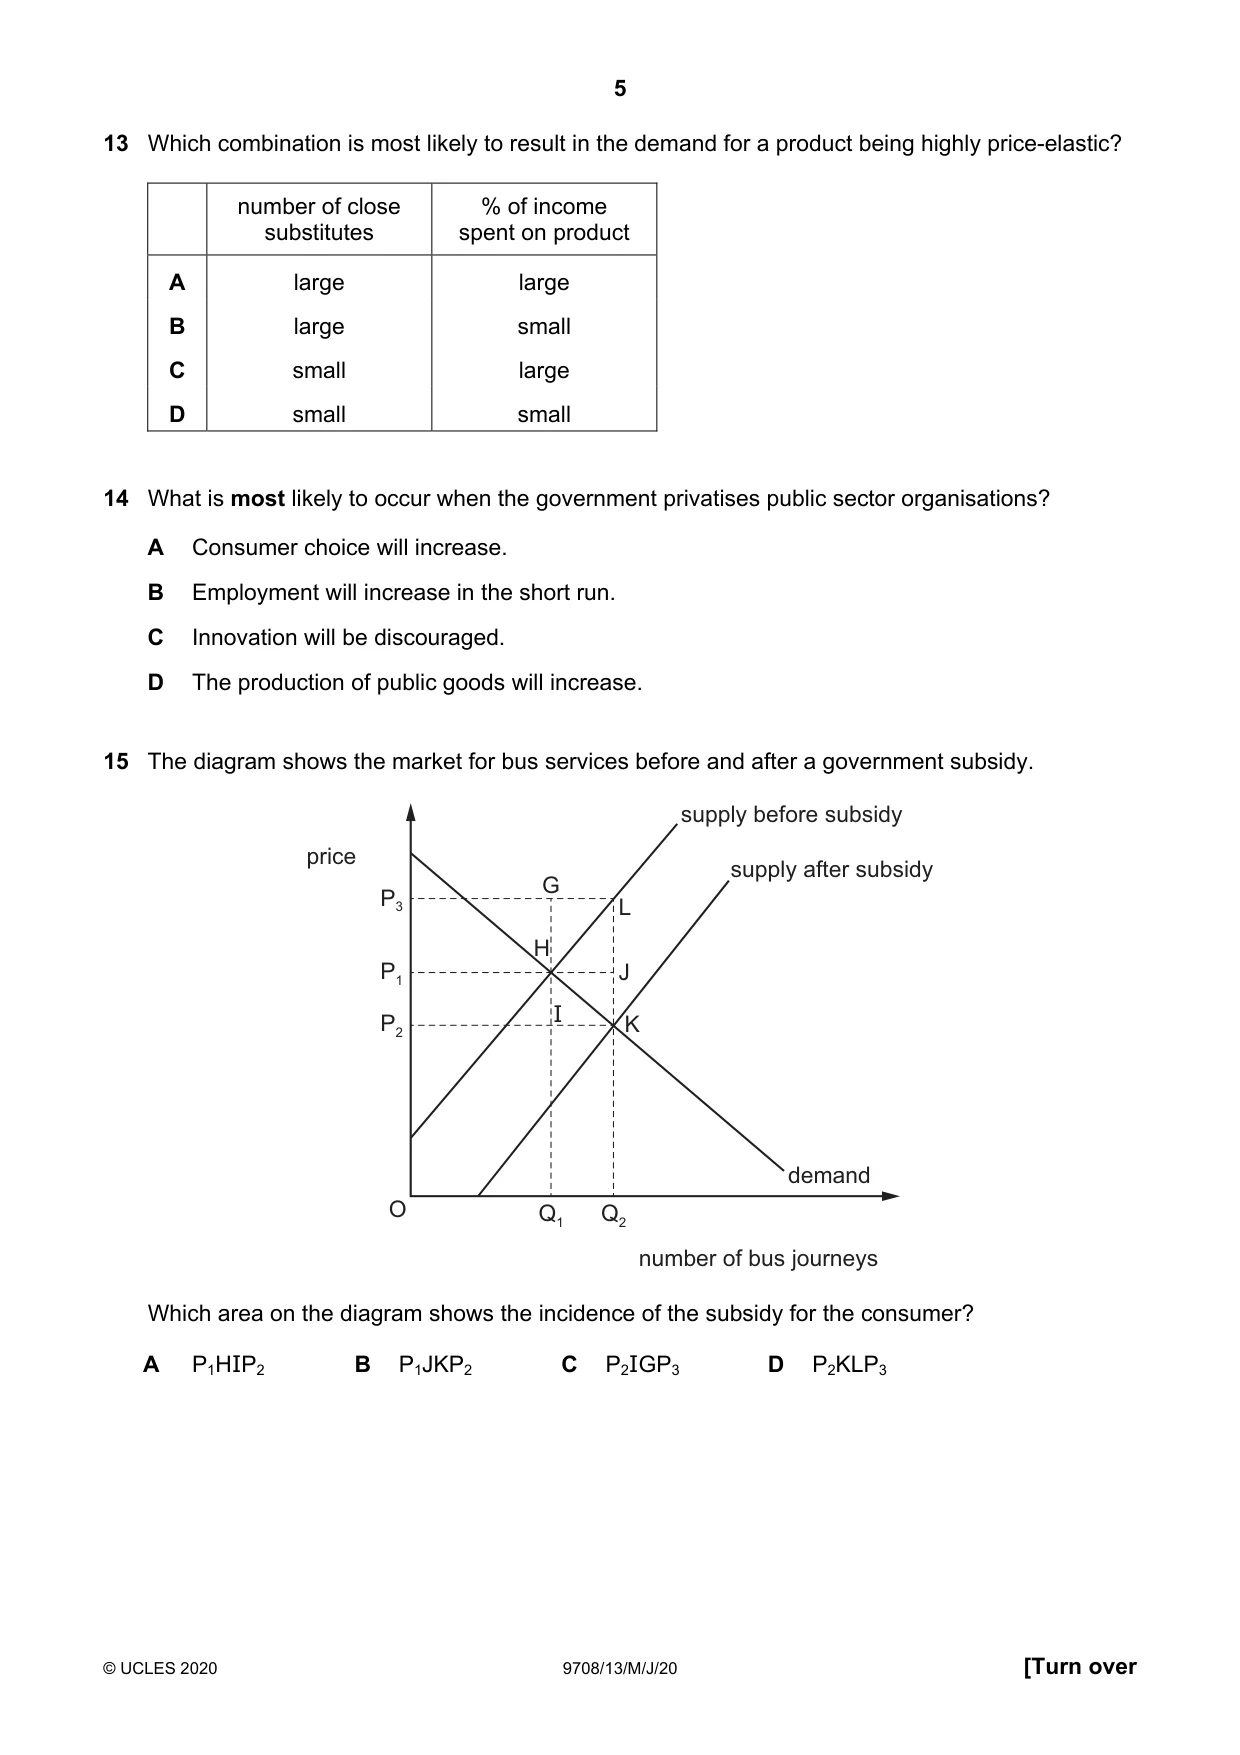
13 Which combination is most likely to result in the demand for a product being highly price-elastic? number of close % of income substitutes spent on product A large large B large small C small large D small small
Mark scheme: A
More questions on Price elasticity, income elasticity and cross elasticity of demand
Q14 · What is most likely to occur when the government privatises public sector organisations?
14 What is most likely to occur when the government privatises public sector organisations? A Consumer choice will increase. B Employment will increase in the short run. C Innovation will be discouraged. D The production of public goods will increase.
Mark scheme: A
More questions on Resource allocation in different economic systems
Q15 · The diagram shows the market for bus services before and after a government subsidy
15 The diagram shows the market for bus services before and after a government subsidy. supply before subsidy price supply after subsidy G P3 L H P1 J P2 I K demand O Q1 Q2 number of bus journeys Which area on the diagram shows the incidence of the subsidy for the consumer? A P1HIP2 B P1JKP2 C P2IGP3 D P2KLP3
Mark scheme: B
More questions on Methods and effects of government intervention in markets
Q16 · The diagram shows the market for eye tests
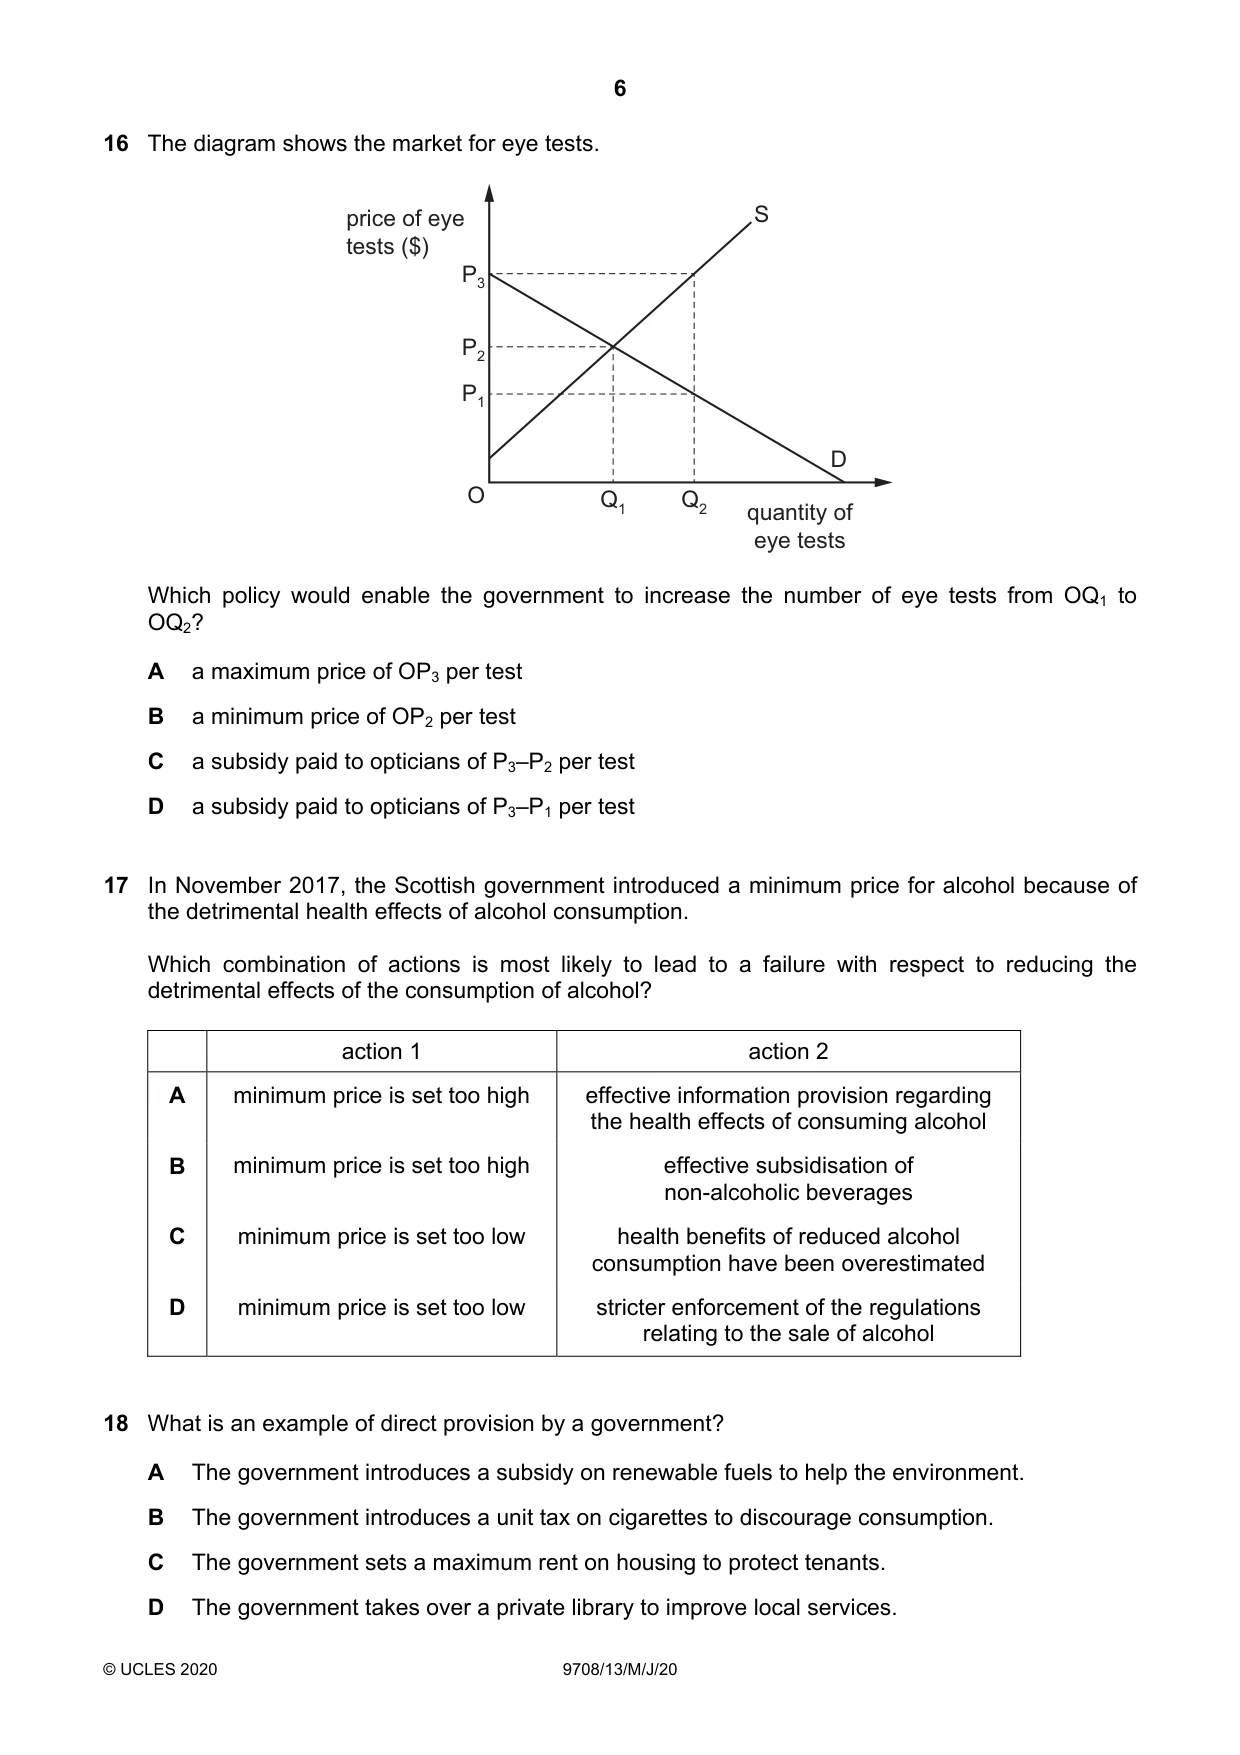
16 The diagram shows the market for eye tests. price of eye S tests ($) P3 P2 P1 D O Q1 Q2 quantity of eye tests Which policy would enable the government to increase the number of eye tests from OQ1 to OQ2? A a maximum price of OP3 per test B a minimum price of OP2 per test C a subsidy paid to opticians of P3–P2 per test D a subsidy paid to opticians of P3–P1 per test
Mark scheme: D
More questions on Methods and effects of government intervention in markets
Q17 · In November 2017, the Scottish government introduced a minimum price for alcohol because…
17 In November 2017, the Scottish government introduced a minimum price for alcohol because of the detrimental health effects of alcohol consumption. Which combination of actions is most likely to lead to a failure with respect to reducing the detrimental effects of the consumption of alcohol? action 1 action 2 A minimum price is set too high effective information provision regarding the health effects of consuming alcohol B minimum price is set too high effective subsidisation of non-alcoholic beverages C minimum price is set too low health benefits of reduced alcohol consumption have been overestimated D minimum price is set too low stricter enforcement of the regulations relating to the sale of alcohol
Mark scheme: C
More questions on Methods and effects of government intervention in markets
Q18 · What is an example of direct provision by a government?
18 What is an example of direct provision by a government? A The government introduces a subsidy on renewable fuels to help the environment. B The government introduces a unit tax on cigarettes to discourage consumption. C The government sets a maximum rent on housing to protect tenants. D The government takes over a private library to improve local services.
Mark scheme: D
More questions on Methods and effects of government intervention in markets
Q19 · The graph shows the annual percentage change in the prices of services and in the prices…
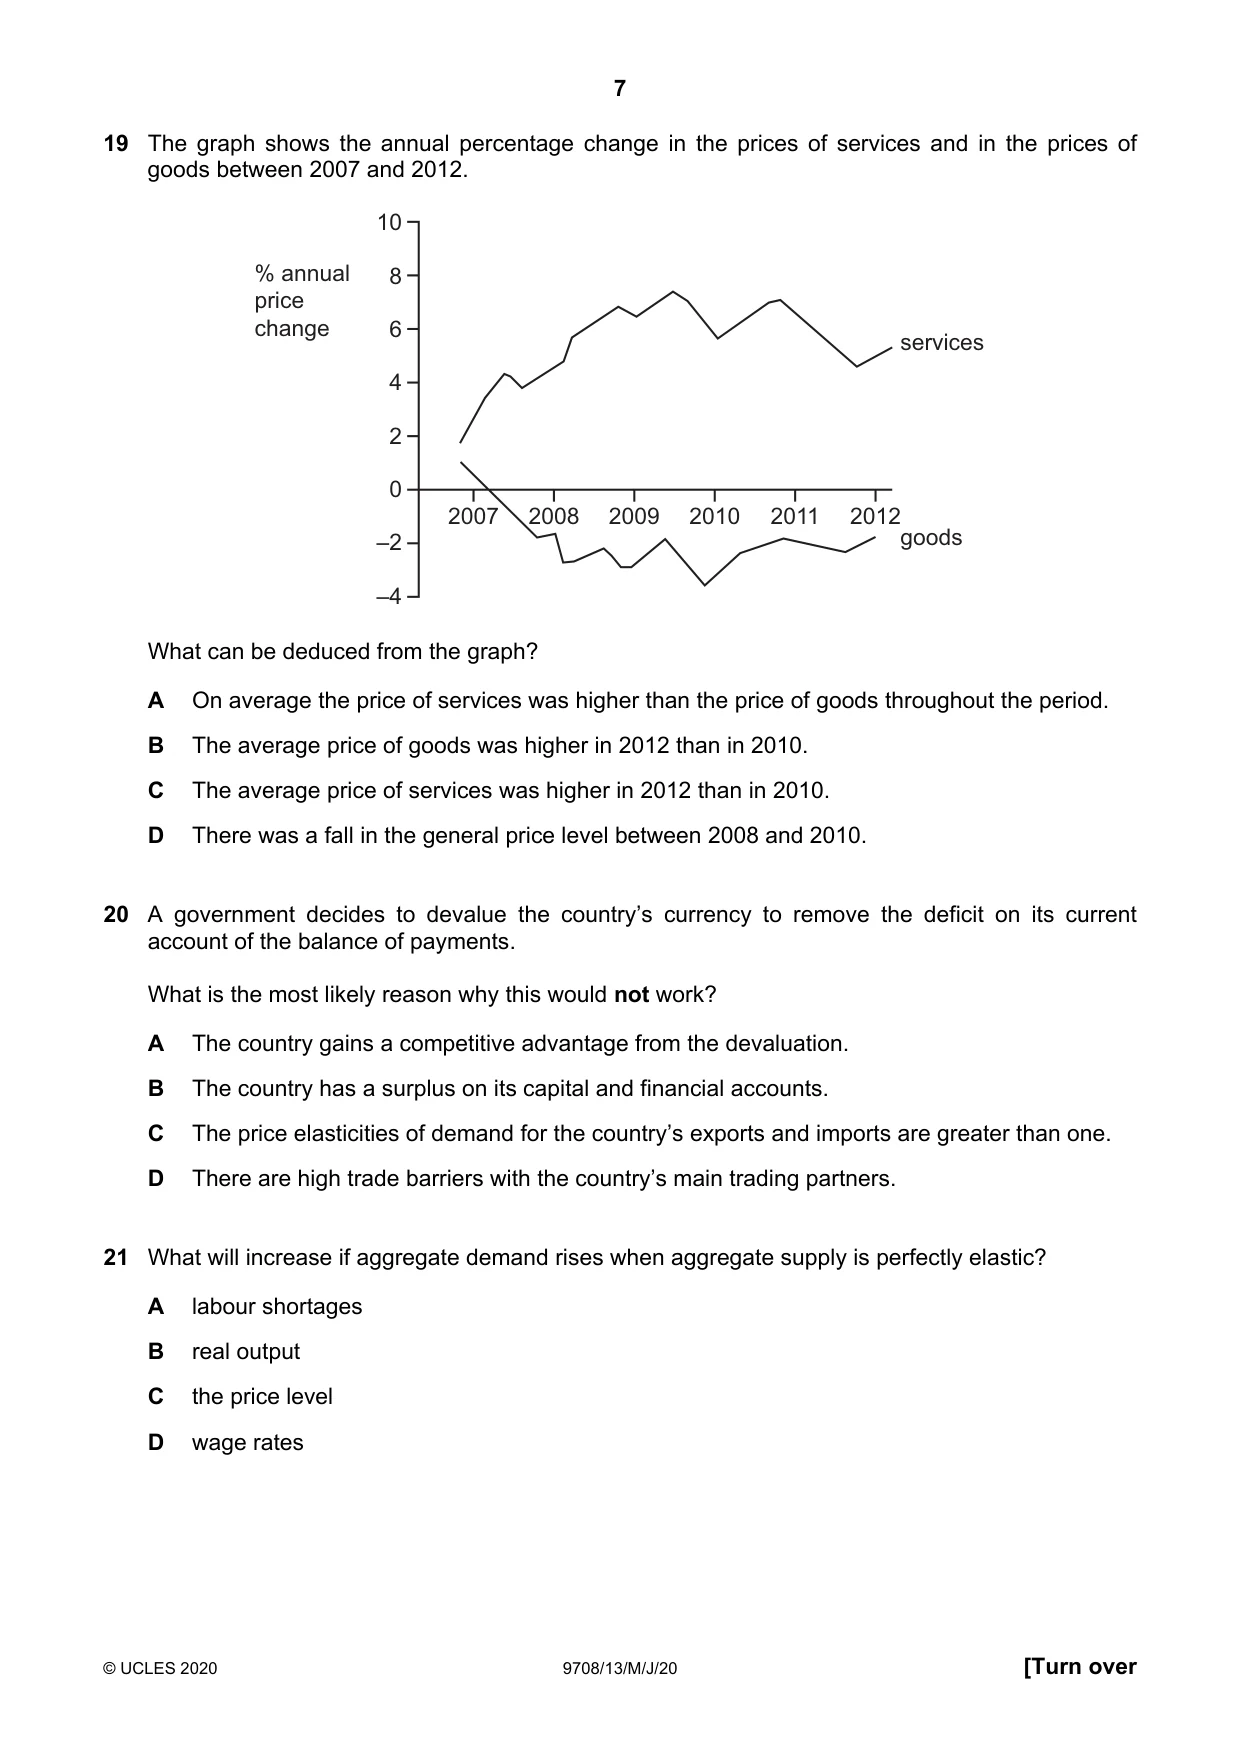
19 The graph shows the annual percentage change in the prices of services and in the prices of goods between 2007 and 2012. 10 % annual 8 price change 6 services 4 2 0 2007 2008 2009 2010 2011 2012 –2 goods –4 What can be deduced from the graph? A On average the price of services was higher than the price of goods throughout the period. B The average price of goods was higher in 2012 than in 2010. C The average price of services was higher in 2012 than in 2010. D There was a fall in the general price level between 2008 and 2010.
Mark scheme: C
Q20 · A government decides to devalue the country’s currency to remove the deficit on its…
20 A government decides to devalue the country’s currency to remove the deficit on its current account of the balance of payments. What is the most likely reason why this would not work? A The country gains a competitive advantage from the devaluation. B The country has a surplus on its capital and financial accounts. C The price elasticities of demand for the country’s exports and imports are greater than one. D There are high trade barriers with the country’s main trading partners.
Mark scheme: D
More questions on Policies to correct imbalances in the current account of the balance of payments
Q21 · What will increase if aggregate demand rises when aggregate supply is perfectly elastic?
21 What will increase if aggregate demand rises when aggregate supply is perfectly elastic? A labour shortages B real output C the price level D wage rates
Mark scheme: B
More questions on Aggregate Demand and Aggregate Supply analysis
Q22 · A country operates a floating exchange rate
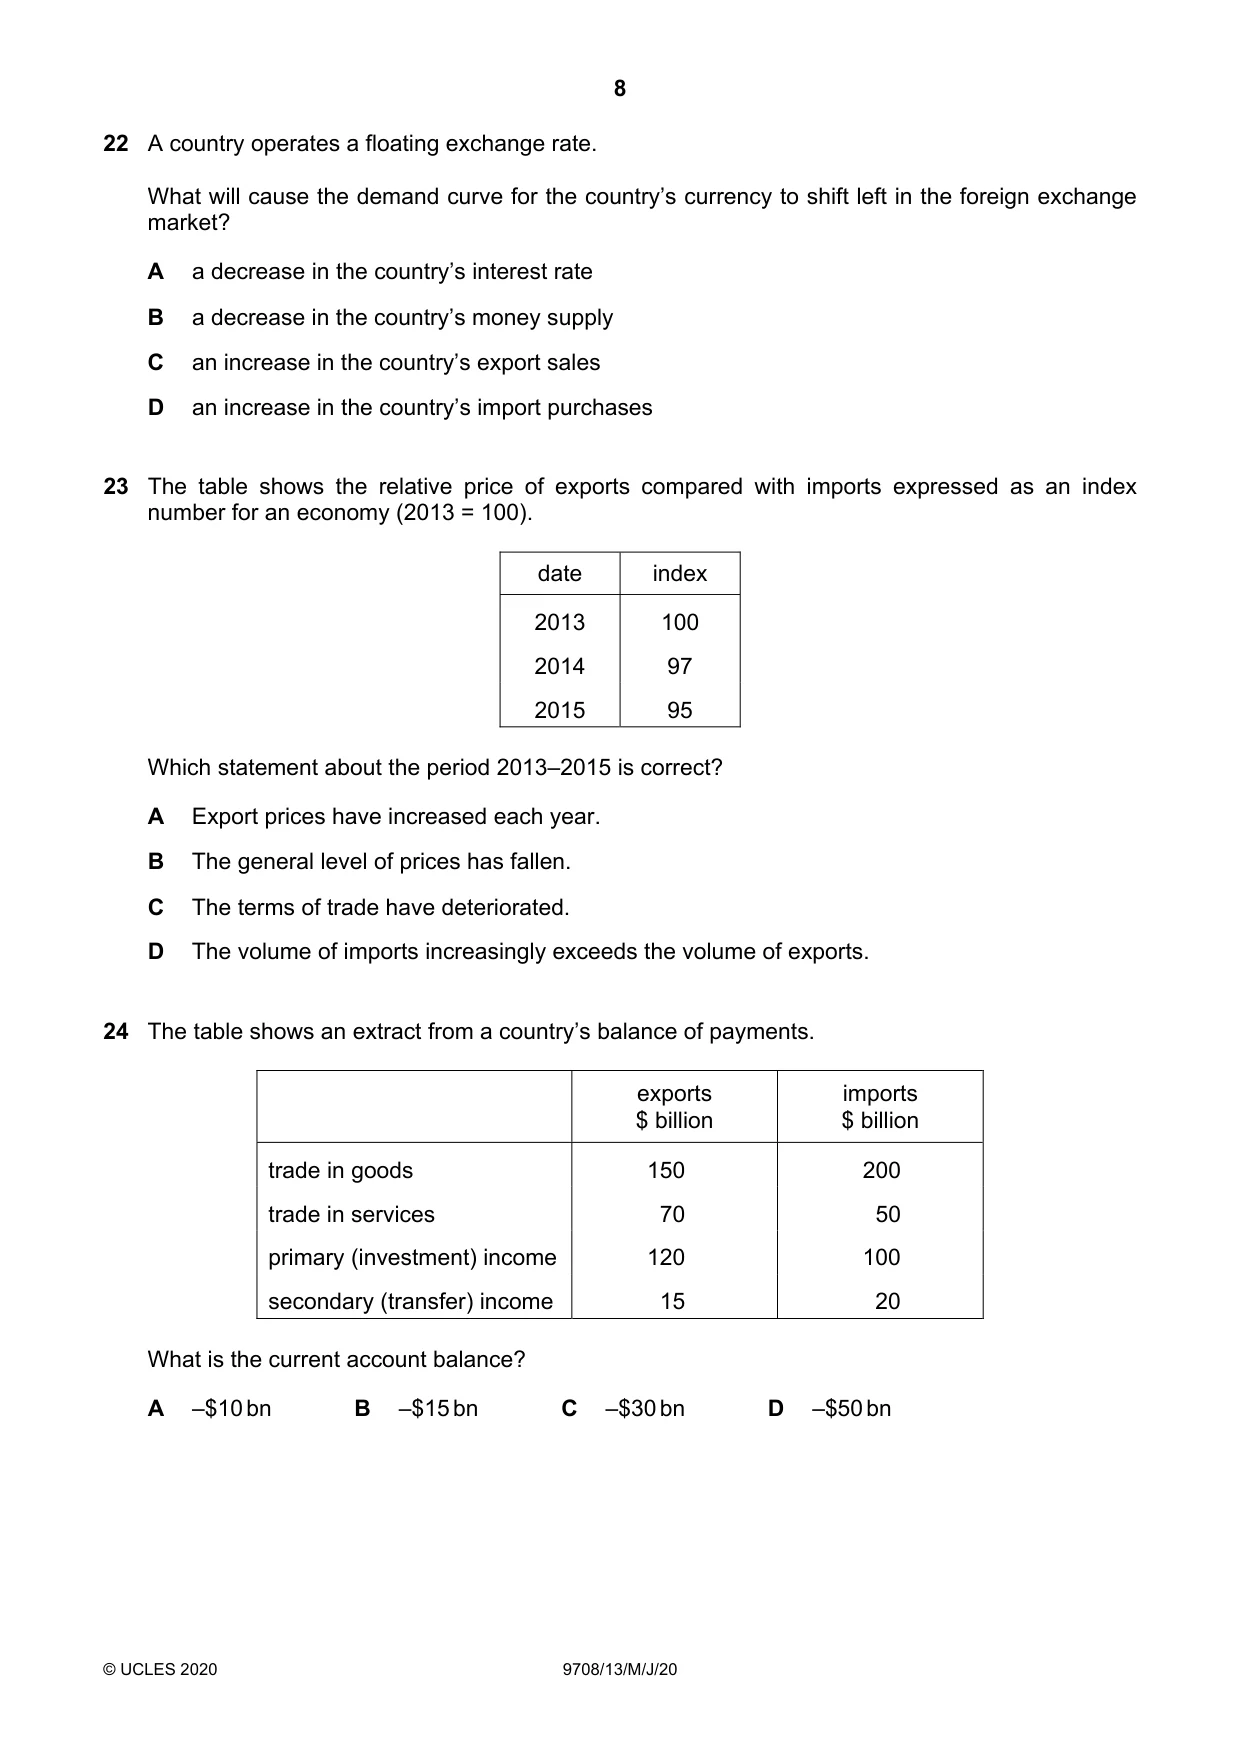
22 A country operates a floating exchange rate. What will cause the demand curve for the country’s currency to shift left in the foreign exchange market? A a decrease in the country’s interest rate B a decrease in the country’s money supply C an increase in the country’s export sales D an increase in the country’s import purchases
Mark scheme: A
Q23 · The table shows the relative price of exports compared with imports expressed as an index…
23 The table shows the relative price of exports compared with imports expressed as an index number for an economy (2013 = 100). date index 2013 100 2014 97 2015 95 Which statement about the period 2013–2015 is correct? A Export prices have increased each year. B The general level of prices has fallen. C The terms of trade have deteriorated. D The volume of imports increasingly exceeds the volume of exports.
Mark scheme: C
Q24 · The table shows an extract from a country’s balance of payments
24 The table shows an extract from a country’s balance of payments. exports imports $ billion $ billion trade in goods 150 200 trade in services 70 50 primary (investment) income 120 100 secondary (transfer) income 15 20 What is the current account balance? A –$10 bn B –$15 bn C –$30 bn D –$50 bn
Mark scheme: B
More questions on Current account of the balance of payments
Q25 · The real national income of a country fell by 3%
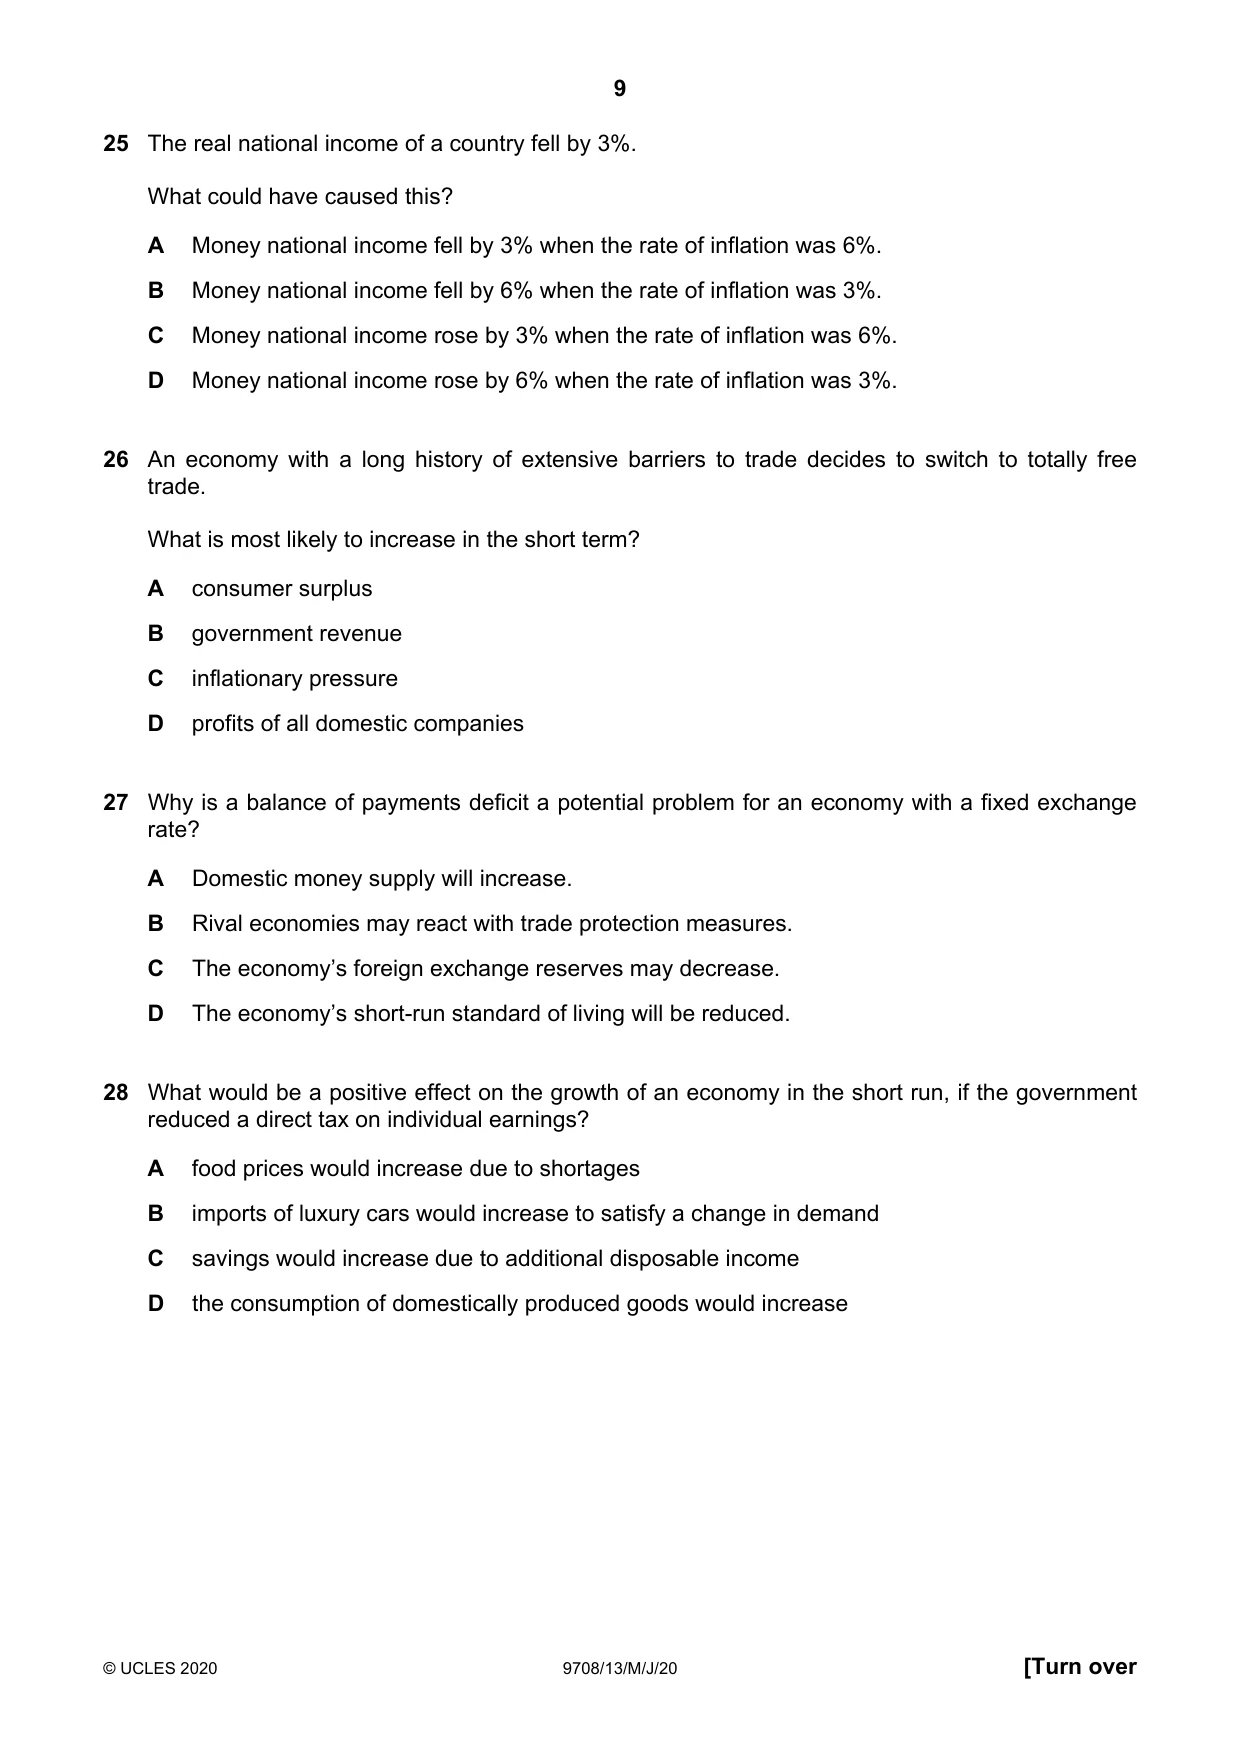
25 The real national income of a country fell by 3%. What could have caused this? A Money national income fell by 3% when the rate of inflation was 6%. B Money national income fell by 6% when the rate of inflation was 3%. C Money national income rose by 3% when the rate of inflation was 6%. D Money national income rose by 6% when the rate of inflation was 3%.
Mark scheme: C
Q26 · An economy with a long history of extensive barriers to trade decides to switch to…
26 An economy with a long history of extensive barriers to trade decides to switch to totally free trade. What is most likely to increase in the short term? A consumer surplus B government revenue C inflationary pressure D profits of all domestic companies
Mark scheme: A
Q27 · Why is a balance of payments deficit a potential problem for an economy with a fixed…
27 Why is a balance of payments deficit a potential problem for an economy with a fixed exchange rate? A Domestic money supply will increase. B Rival economies may react with trade protection measures. C The economy’s foreign exchange reserves may decrease. D The economy’s short-run standard of living will be reduced.
Mark scheme: C
Q28 · What would be a positive effect on the growth of an economy in the short run, if the…
28 What would be a positive effect on the growth of an economy in the short run, if the government reduced a direct tax on individual earnings? A food prices would increase due to shortages B imports of luxury cars would increase to satisfy a change in demand C savings would increase due to additional disposable income D the consumption of domestically produced goods would increase
Mark scheme: D
Q29 · Which combination of fiscal and monetary policies is most likely to be effective in the…
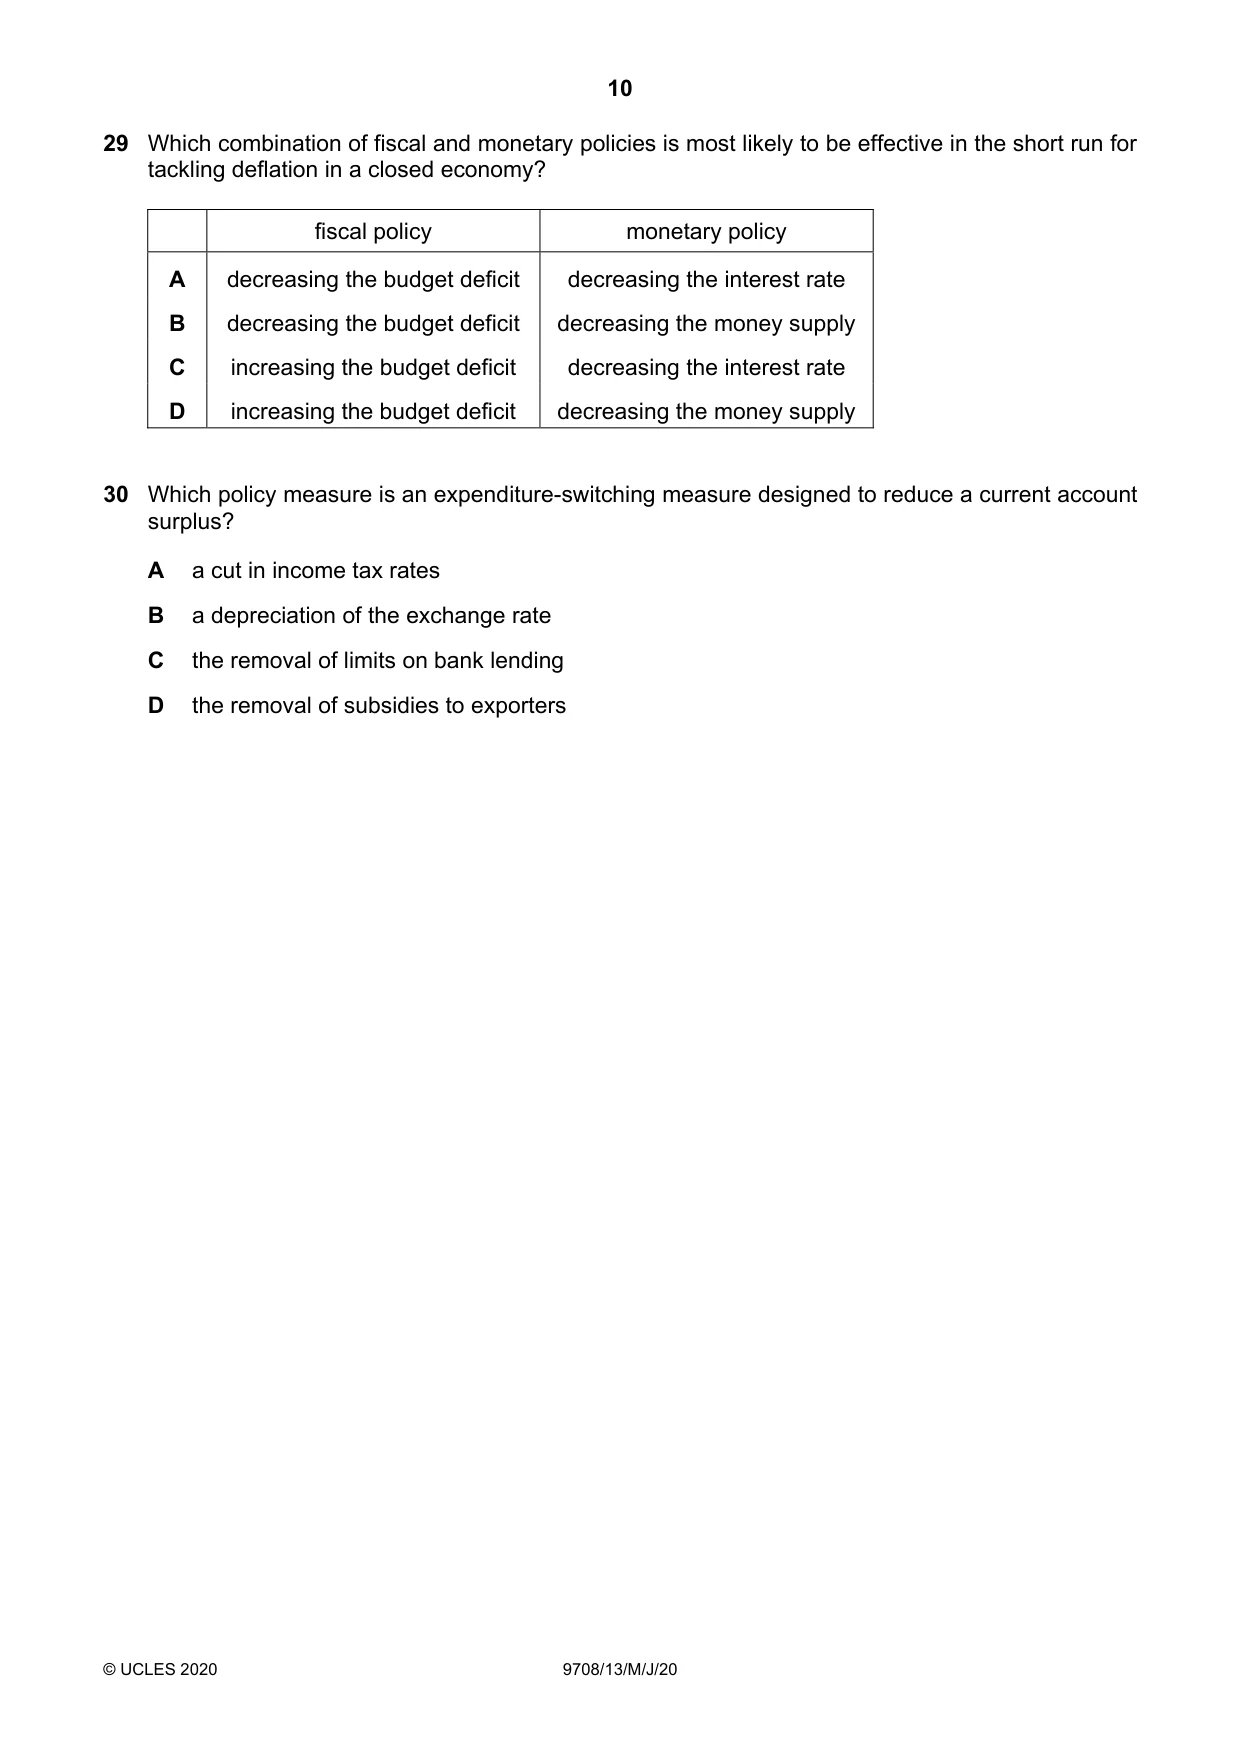
29 Which combination of fiscal and monetary policies is most likely to be effective in the short run for tackling deflation in a closed economy? fiscal policy monetary policy A decreasing the budget deficit decreasing the interest rate B decreasing the budget deficit decreasing the money supply C increasing the budget deficit decreasing the interest rate D increasing the budget deficit decreasing the money supply
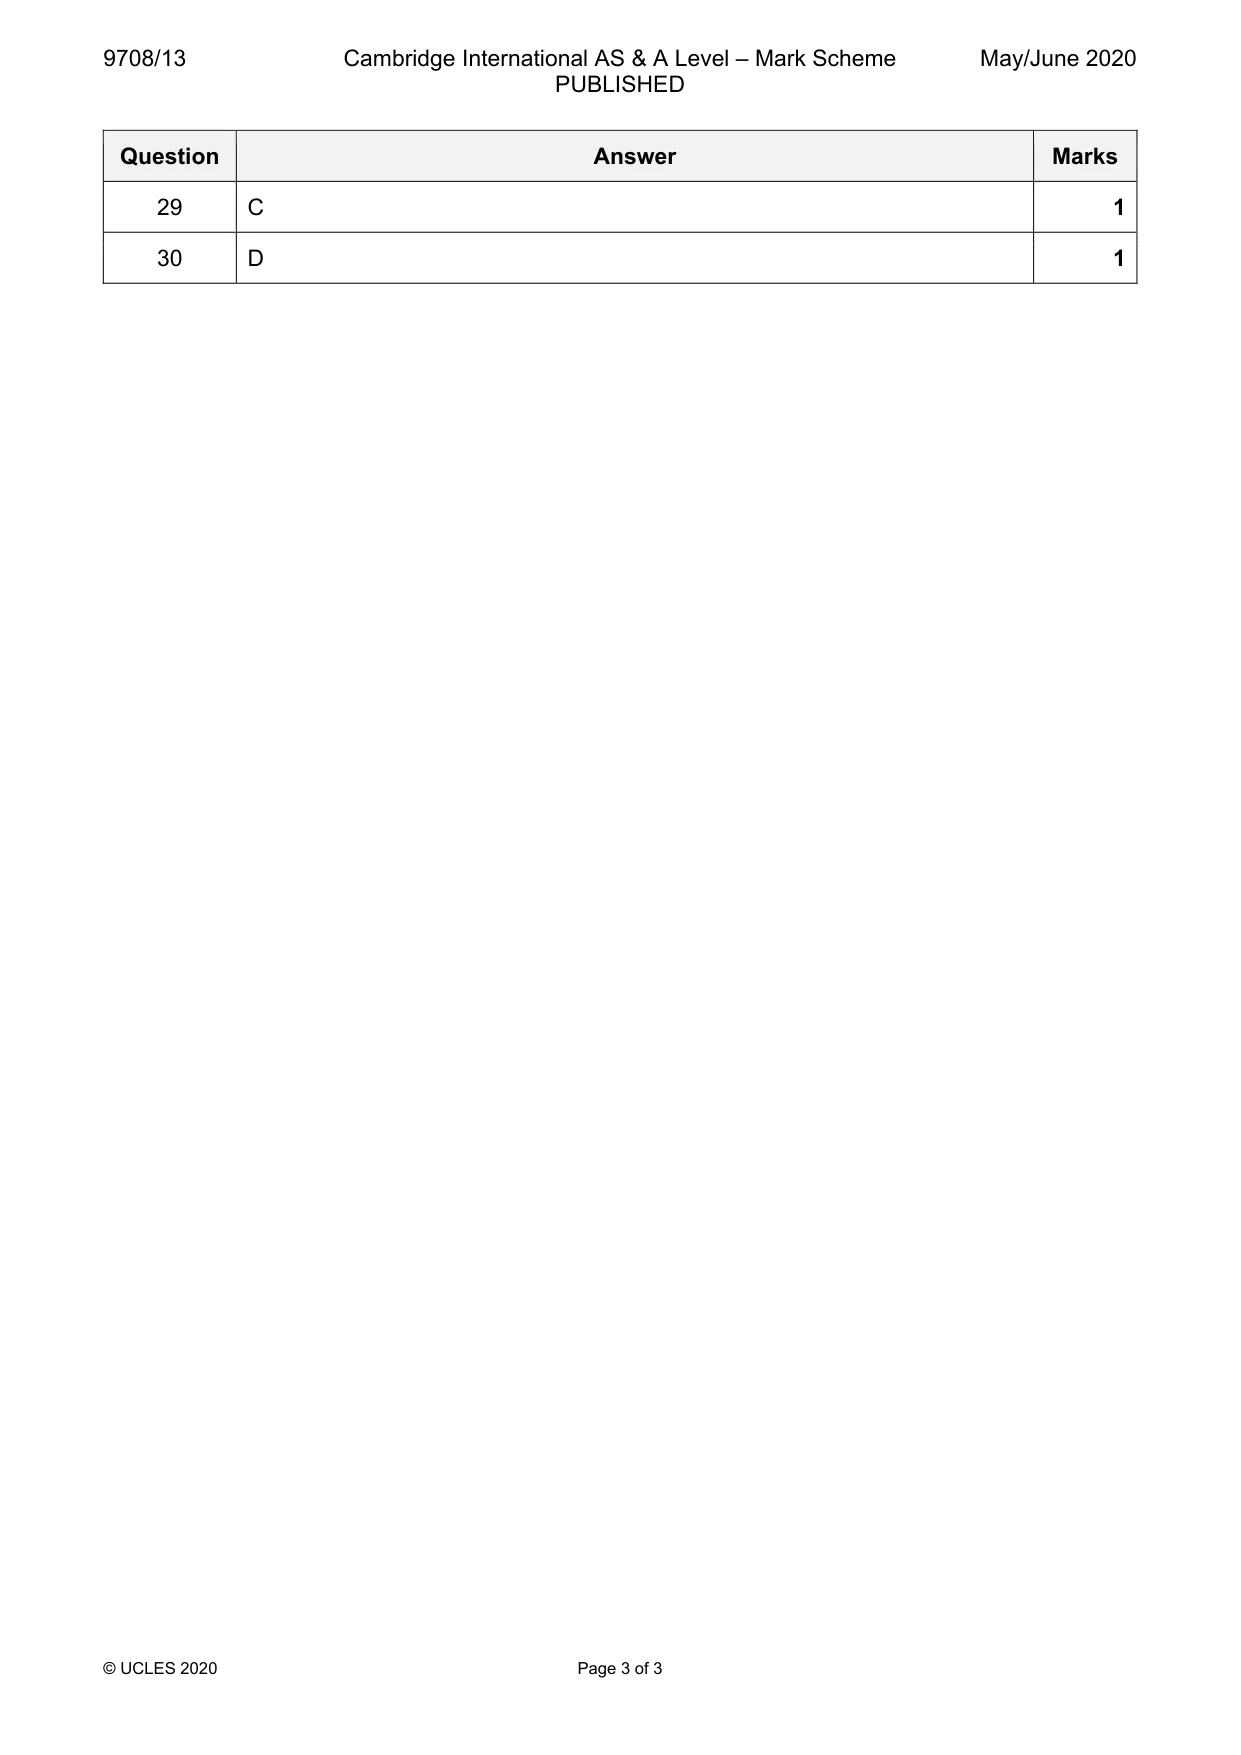
Mark scheme: C
Q30 · Which policy measure is an expenditure-switching measure designed to reduce a current…
30 Which policy measure is an expenditure-switching measure designed to reduce a current account surplus? A a cut in income tax rates B a depreciation of the exchange rate C the removal of limits on bank lending D the removal of subsidies to exporters
Mark scheme: D
More questions on Policies to correct imbalances in the current account of the balance of payments
What was in this paper
The subtopics covered by these 30 questions, and how many questions each got. Open one in a new tab to see every Cambridge question on it.
5Demand and supply curves3Exchange rates2Fiscal policy2Policies to correct imbalances in the current account of the balance of payments2Price elasticity, income elasticity and cross elasticity of demand2The interaction of demand and supply2The reasons for international trade2Aggregate Demand and Aggregate Supply analysis1Classification of goods and services1Current account of the balance of payments1Economic methodology1Factors of production1National income statistics1Price elasticity of supply1Price stability1Production possibility curves1Resource allocation in different economic systems1