Cambridge A Level Economics 9708 — 2016 Oct/Nov Paper 1 · Variant 3
9708/13/O/N/16 · 30 questions · 30 marks · ≈34 min
The question paper and its mark scheme, free to read here and free to download. This is Cambridge’s own paper, exactly as it was sat.
Question paper12 pages
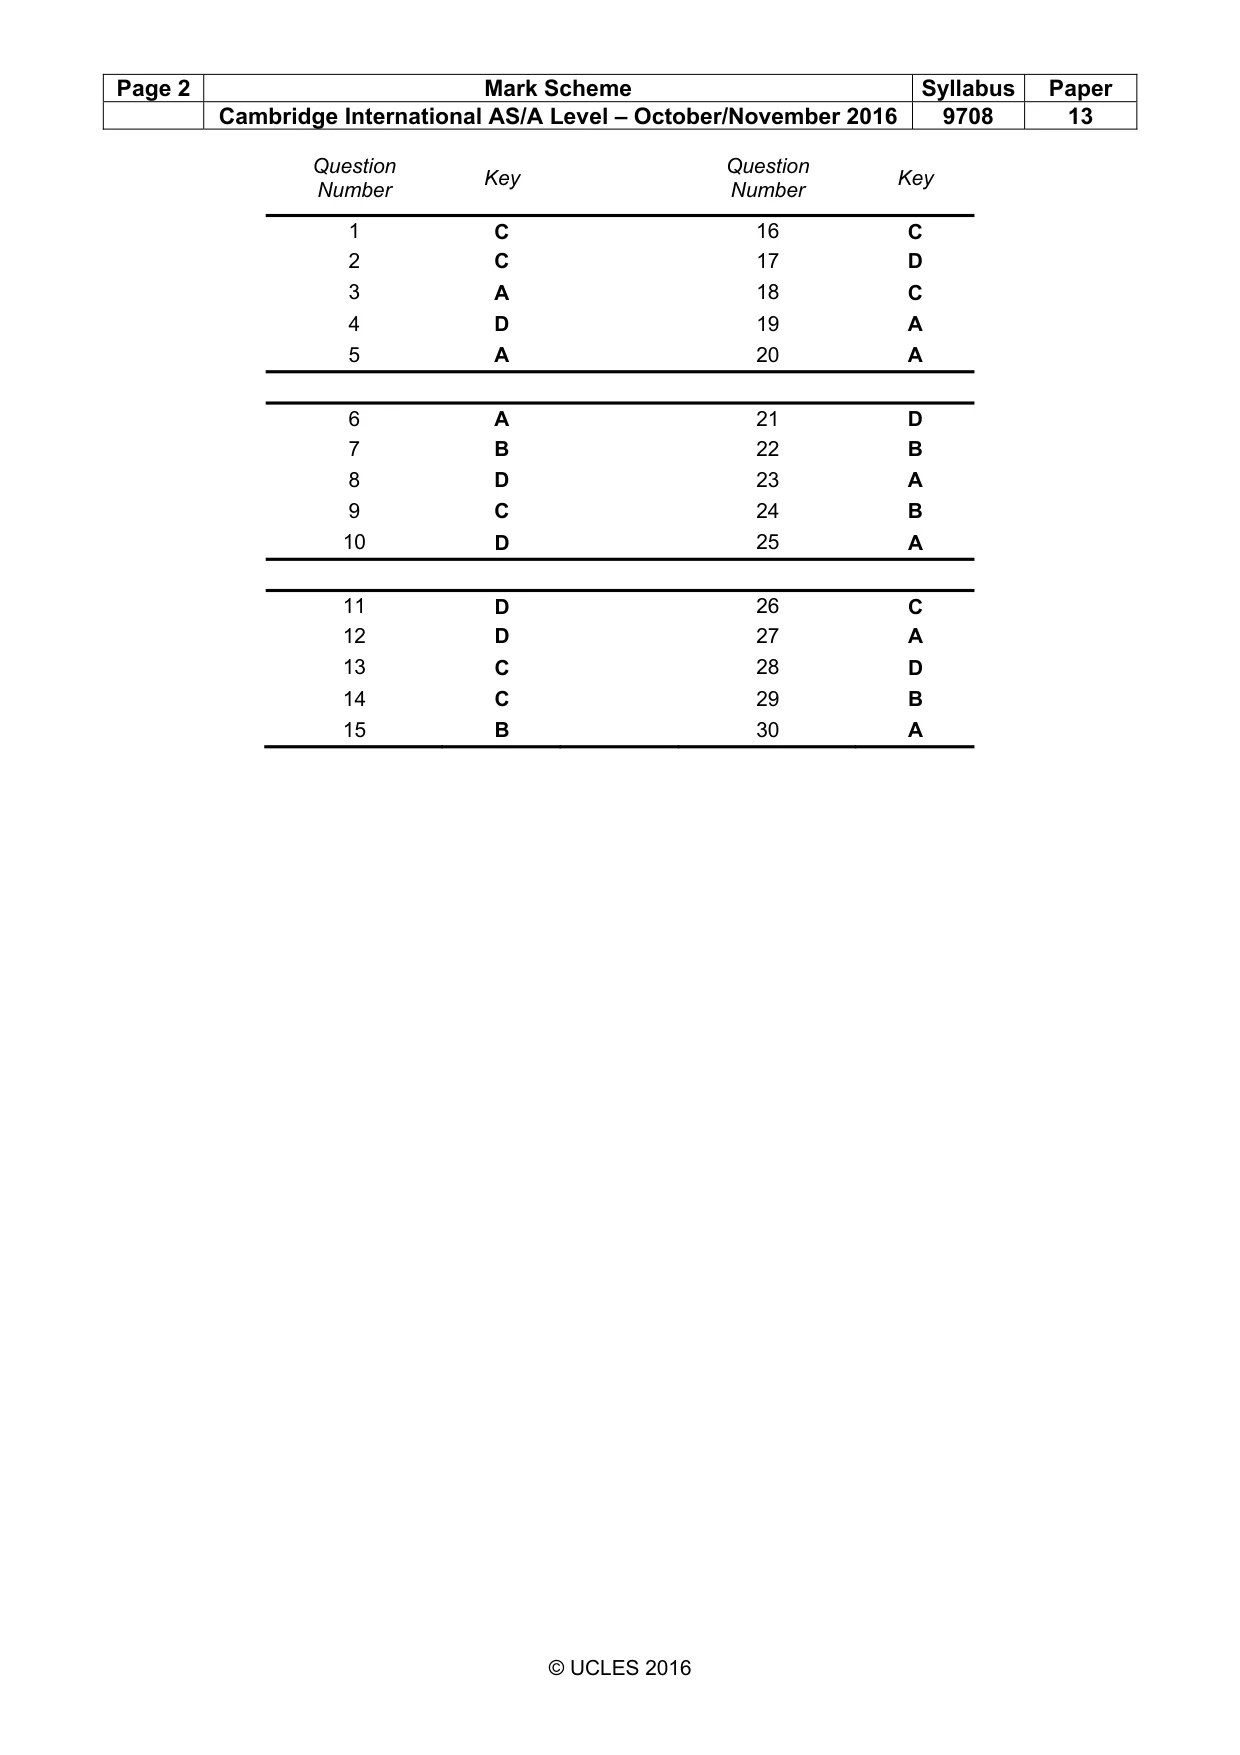
Mark scheme2 pages
Answers below. Sit the paper first if you are practising.
Questions as text
Q1 · Why is choice central to the economic problem?
1 Why is choice central to the economic problem? A Different governments have different objectives. B Firms have access to unlimited resources. C Most resources have alternative uses. D People’s wants are limited.
Mark scheme: C
Q2 · Which change in economic system is likely to result in the greatest rise in unemployment…
2 Which change in economic system is likely to result in the greatest rise in unemployment combined with the greatest fall in economic regulation? A market to mixed B mixed to planned C planned to market D planned to mixed
Mark scheme: C
More questions on Resource allocation in different economic systems
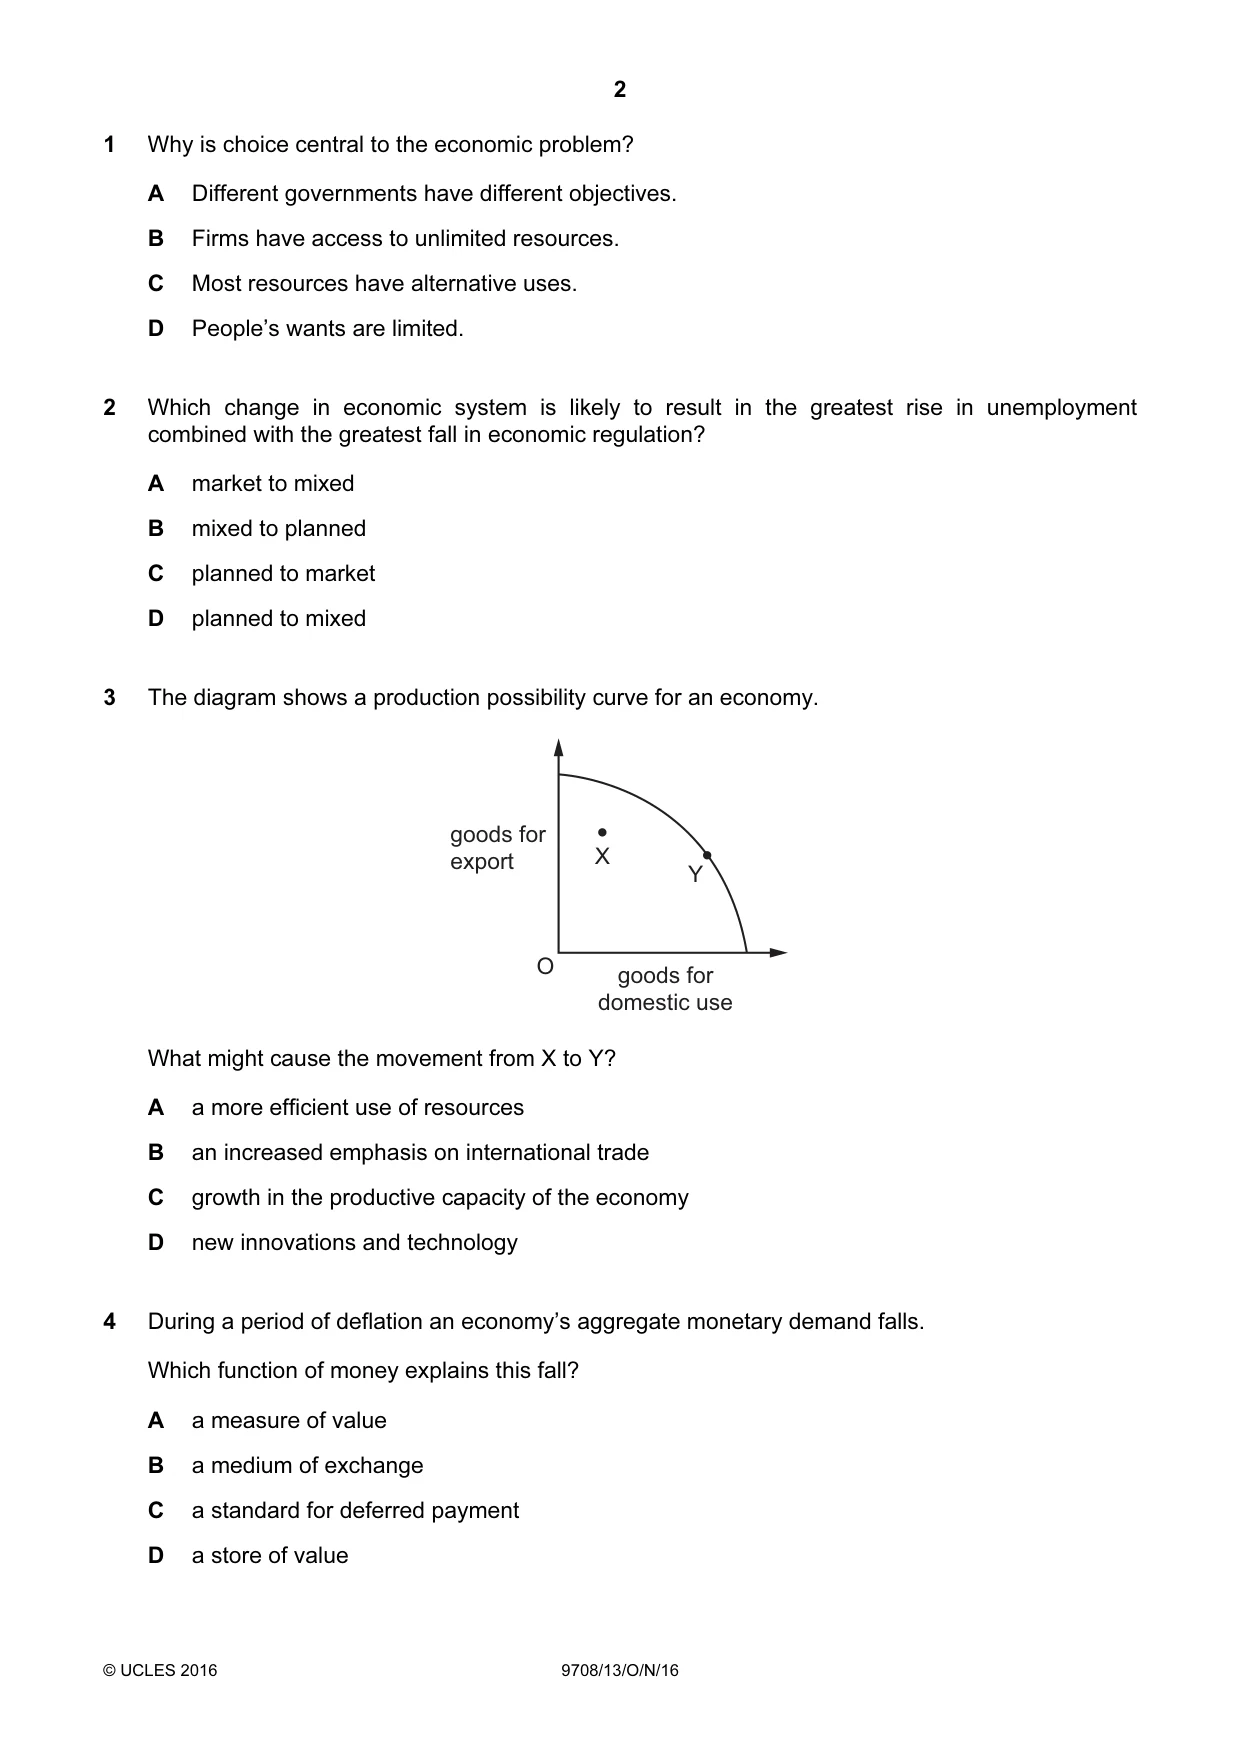
Q3 · The diagram shows a production possibility curve for an economy
3 The diagram shows a production possibility curve for an economy. goods for export X Y O goods for domestic use What might cause the movement from X to Y? A a more efficient use of resources B an increased emphasis on international trade C growth in the productive capacity of the economy D new innovations and technology
Mark scheme: A
Q4 · During a period of deflation an economy’s aggregate monetary demand falls
4 During a period of deflation an economy’s aggregate monetary demand falls. Which function of money explains this fall? A a measure of value B a medium of exchange C a standard for deferred payment D a store of value
Mark scheme: D
Q5 · What ensures that demand for a product is effective?
5 What ensures that demand for a product is effective? A The consumer must have the ability to buy the product. B The consumer must purchase in the private sector of the economy. C The consumer must receive consumer surplus. D The consumer must want to buy the product.
Mark scheme: A
Q6 · What will happen to an industry’s supply curve if firms leave the industry?
6 What will happen to an industry’s supply curve if firms leave the industry? A It will shift to the left at any given price. B It will shift to the right at any given price. C There will be a downward movement along the supply curve. D There will be an upward movement along the supply curve.
Mark scheme: A
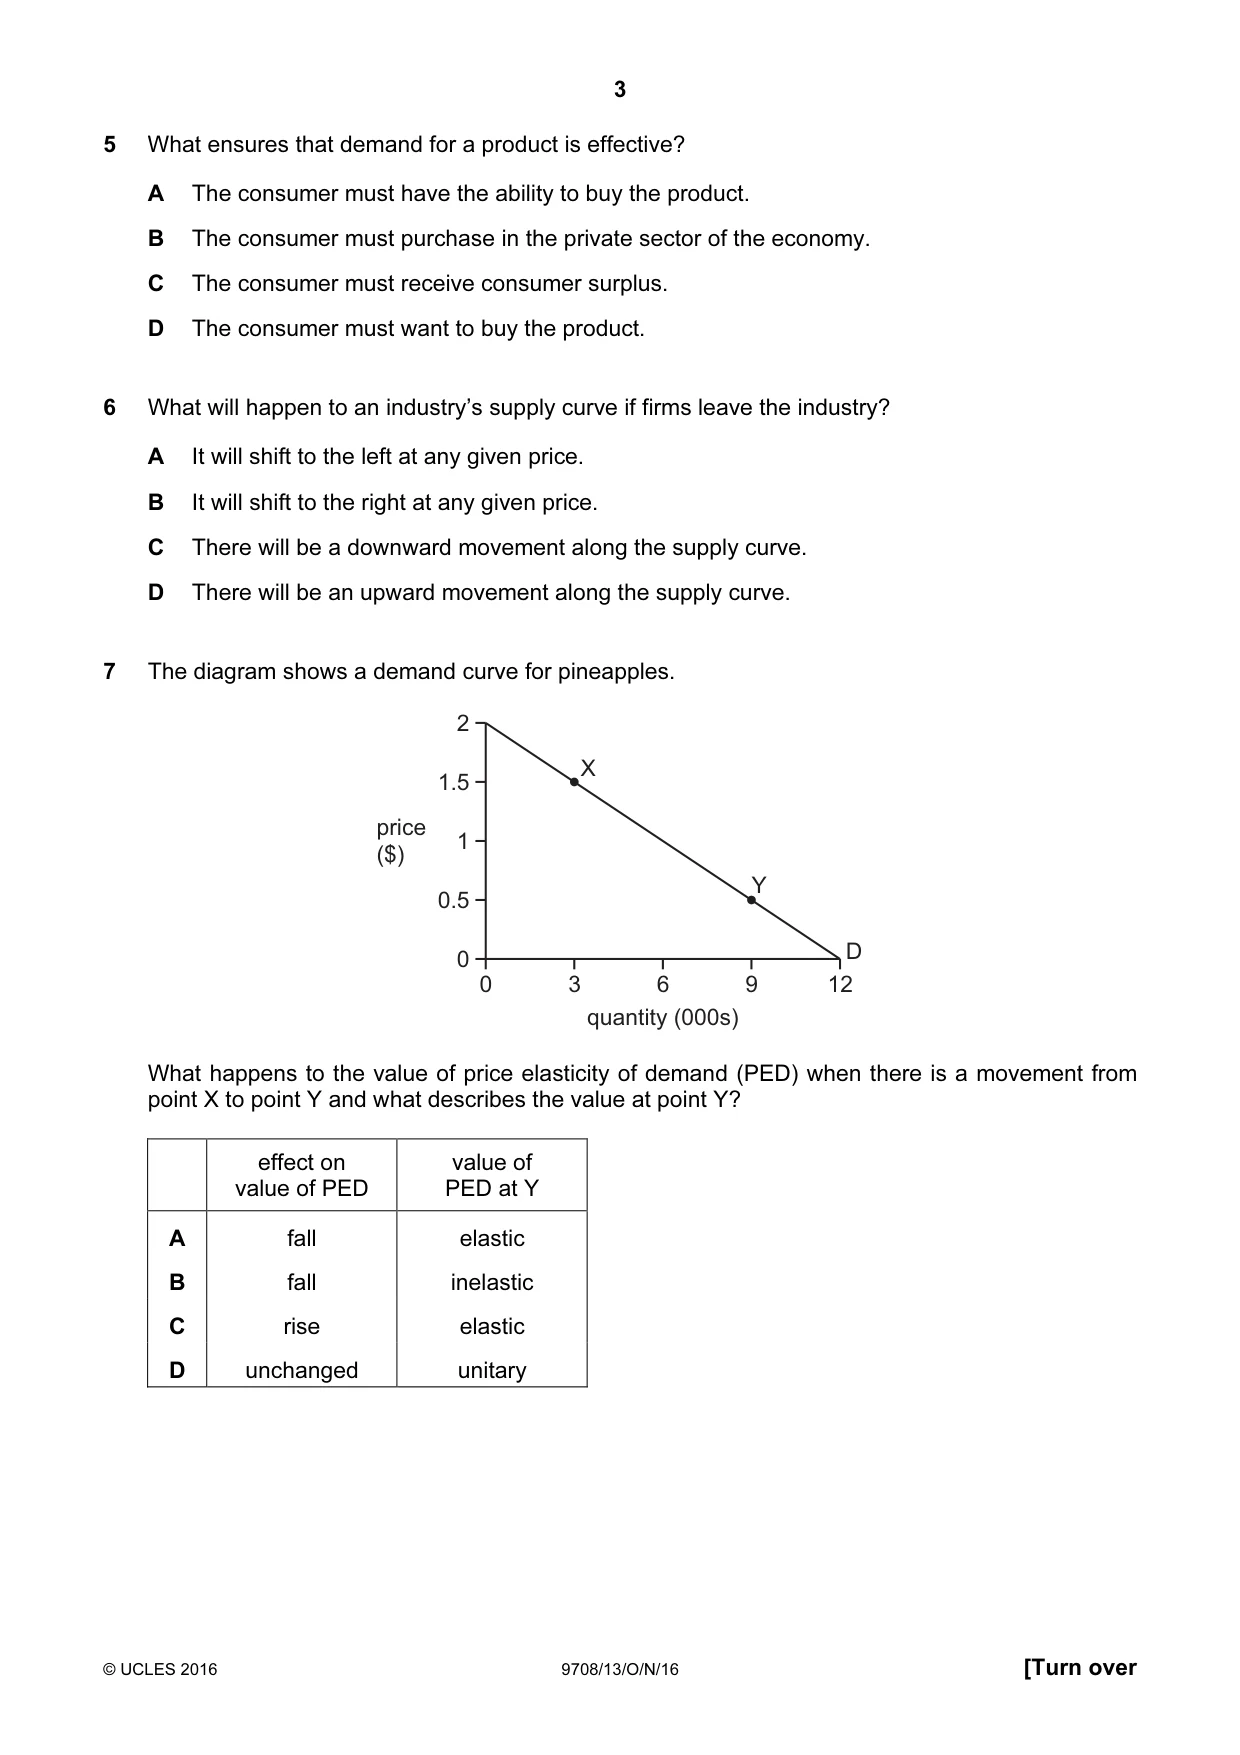
Q7 · The diagram shows a demand curve for pineapples
7 The diagram shows a demand curve for pineapples. 2 X 1.5 price 1 ($) Y 0.5 0 D 0 3 6 9 12 quantity (000s) What happens to the value of price elasticity of demand (PED) when there is a movement from point X to point Y and what describes the value at point Y? effect on value of value of PED PED at Y A fall elastic B fall inelastic C rise elastic D unchanged unitary
Mark scheme: B
More questions on Price elasticity, income elasticity and cross elasticity of demand
Q8 · A product is an inferior good with no close substitutes
8 A product is an inferior good with no close substitutes. It is also a complement to good X. Which product matches the above description? cross-elasticity of price elasticity income elasticity demand with respect of demand of demand to the price of X A –2 +2 +1 B –2 +2 –1 C –0.5 –2 +1 D –0.5 –2 –1
Mark scheme: D
More questions on Price elasticity, income elasticity and cross elasticity of demand
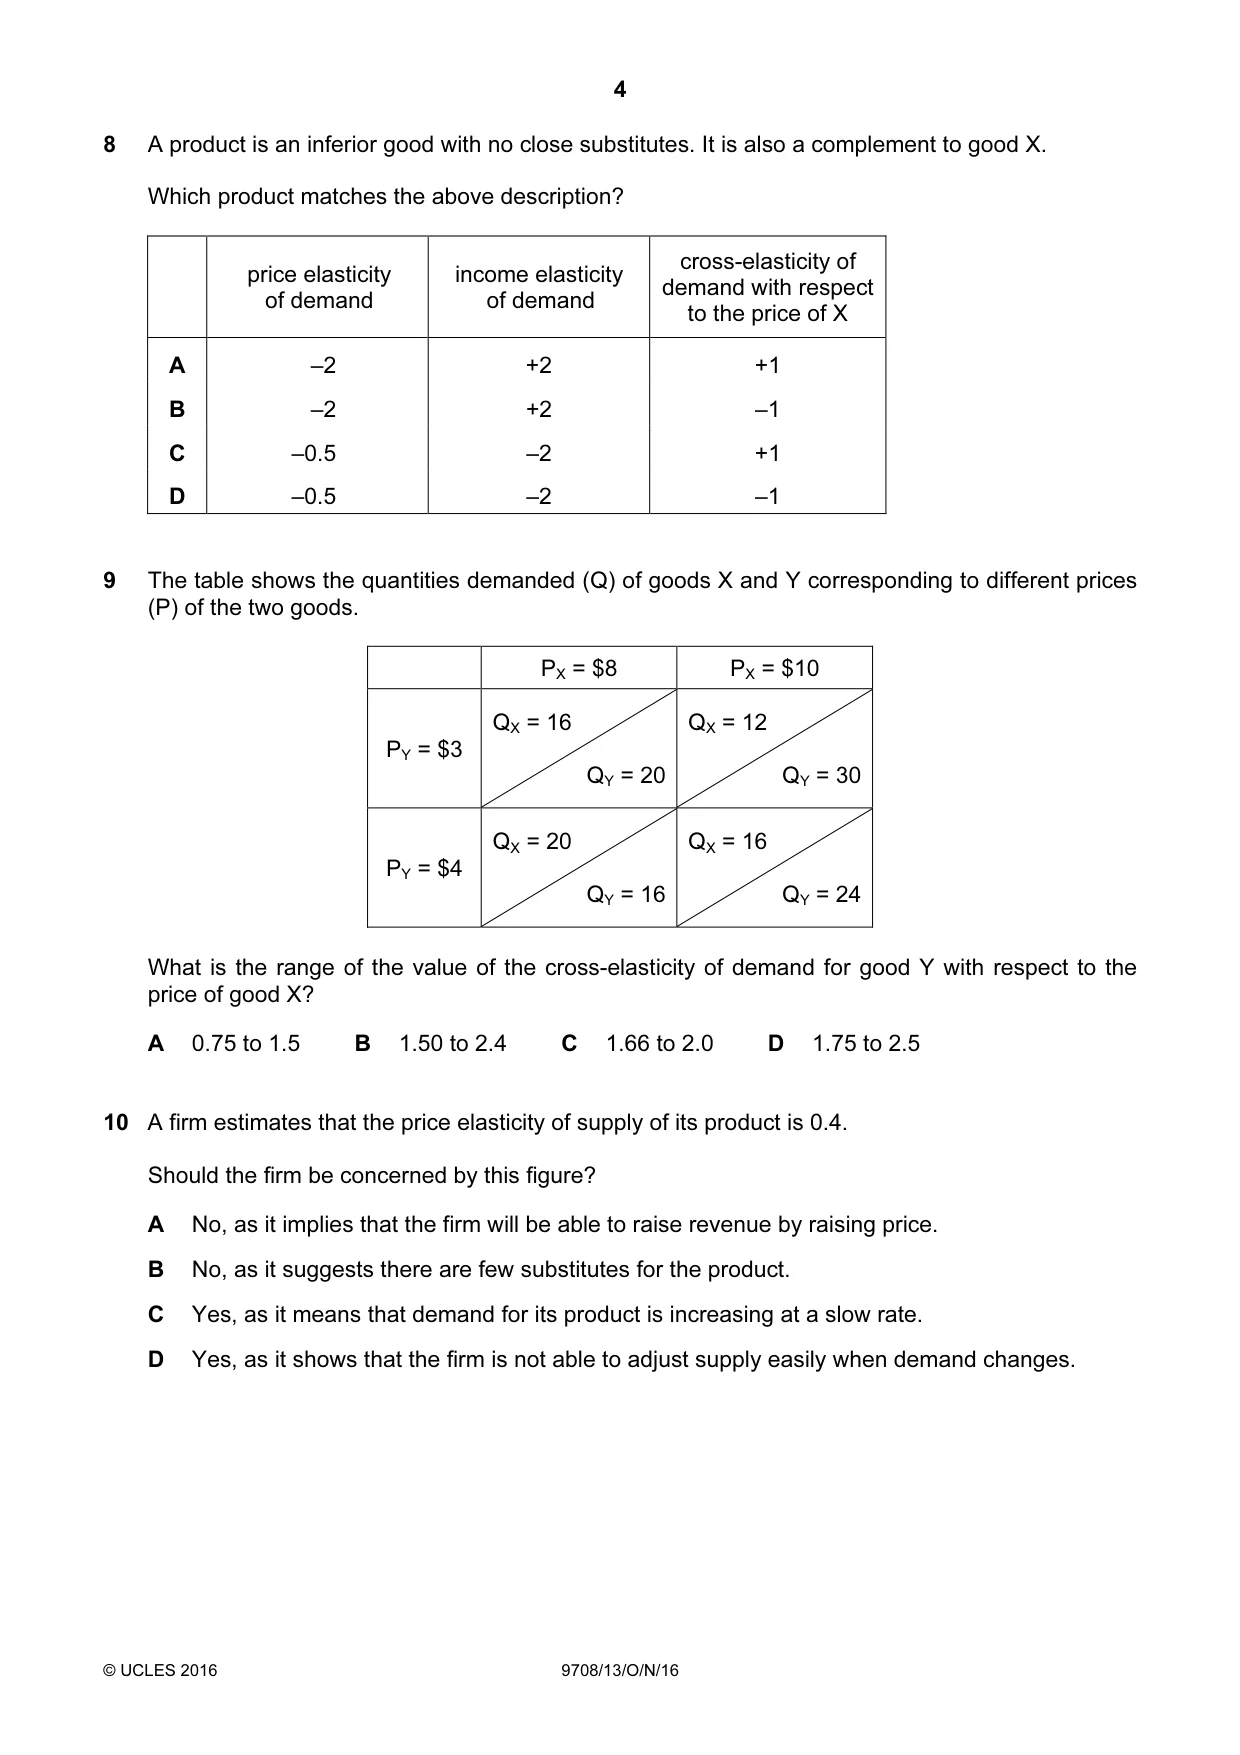
Q9 · The table shows the quantities demanded (Q) of goods X and Y corresponding to different…
9 The table shows the quantities demanded (Q) of goods X and Y corresponding to different prices (P) of the two goods. PX = $8 PX = $10 QX = 16 QX = 12 PY = $3 QY = 20 QY = 30 QX = 20 QX = 16 PY = $4 QY = 16 QY = 24 What is the range of the value of the cross-elasticity of demand for good Y with respect to the price of good X? A 0.75 to 1.5 B 1.50 to 2.4 C 1.66 to 2.0 D 1.75 to 2.5
Mark scheme: C
More questions on Price elasticity, income elasticity and cross elasticity of demand
Q10 · A firm estimates that the price elasticity of supply of its product is 0.4
10 A firm estimates that the price elasticity of supply of its product is 0.4. Should the firm be concerned by this figure? A No, as it implies that the firm will be able to raise revenue by raising price. B No, as it suggests there are few substitutes for the product. C Yes, as it means that demand for its product is increasing at a slow rate. D Yes, as it shows that the firm is not able to adjust supply easily when demand changes.
Mark scheme: D
Q11 · The diagram shows a country’s domestic supply of, and demand for, a commodity that it…
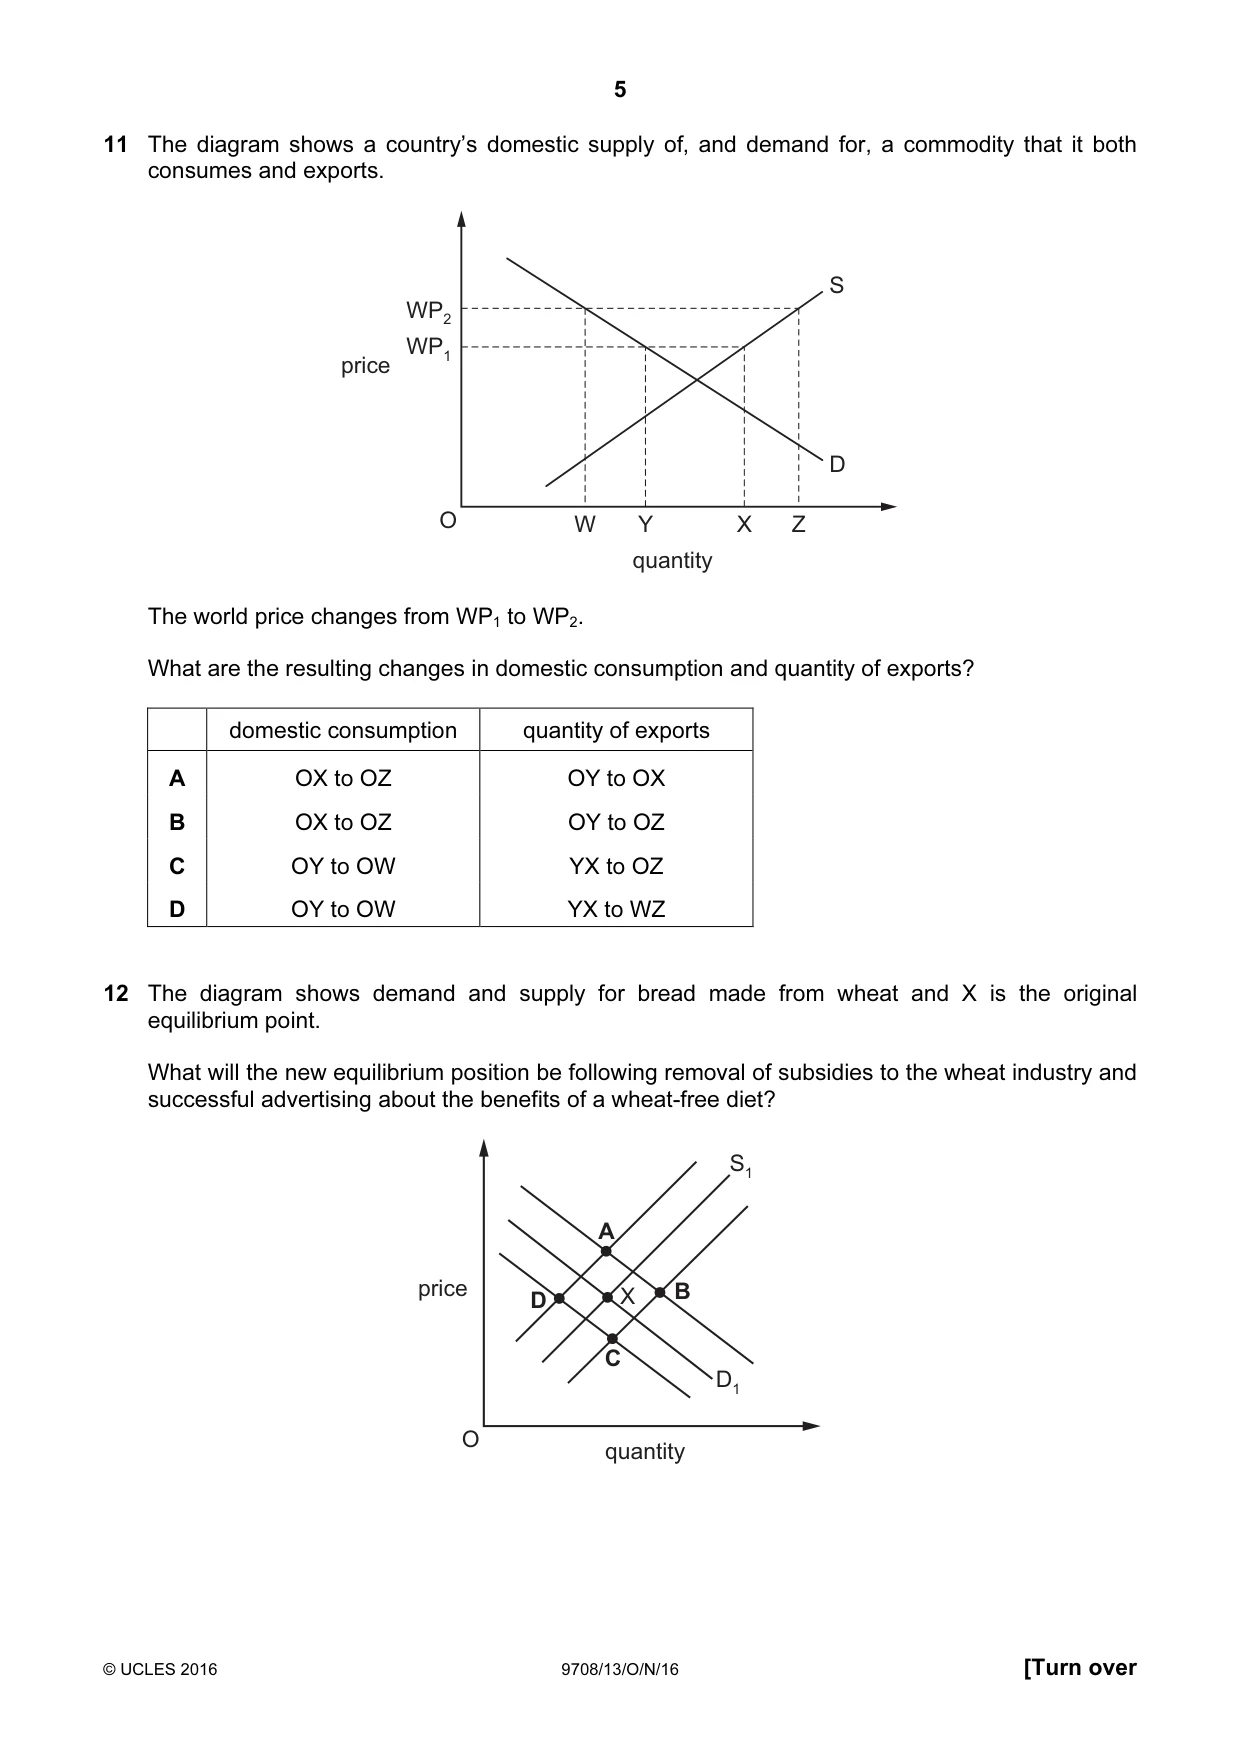
11 The diagram shows a country’s domestic supply of, and demand for, a commodity that it both consumes and exports. S WP2 WP1 price D O W Y X Z quantity The world price changes from WP1 to WP2. What are the resulting changes in domestic consumption and quantity of exports? domestic consumption quantity of exports A OX to OZ OY to OX B OX to OZ OY to OZ C OY to OW YX to OZ D OY to OW YX to WZ
Mark scheme: D
Q12 · The diagram shows demand and supply for bread made from wheat and X is the original…
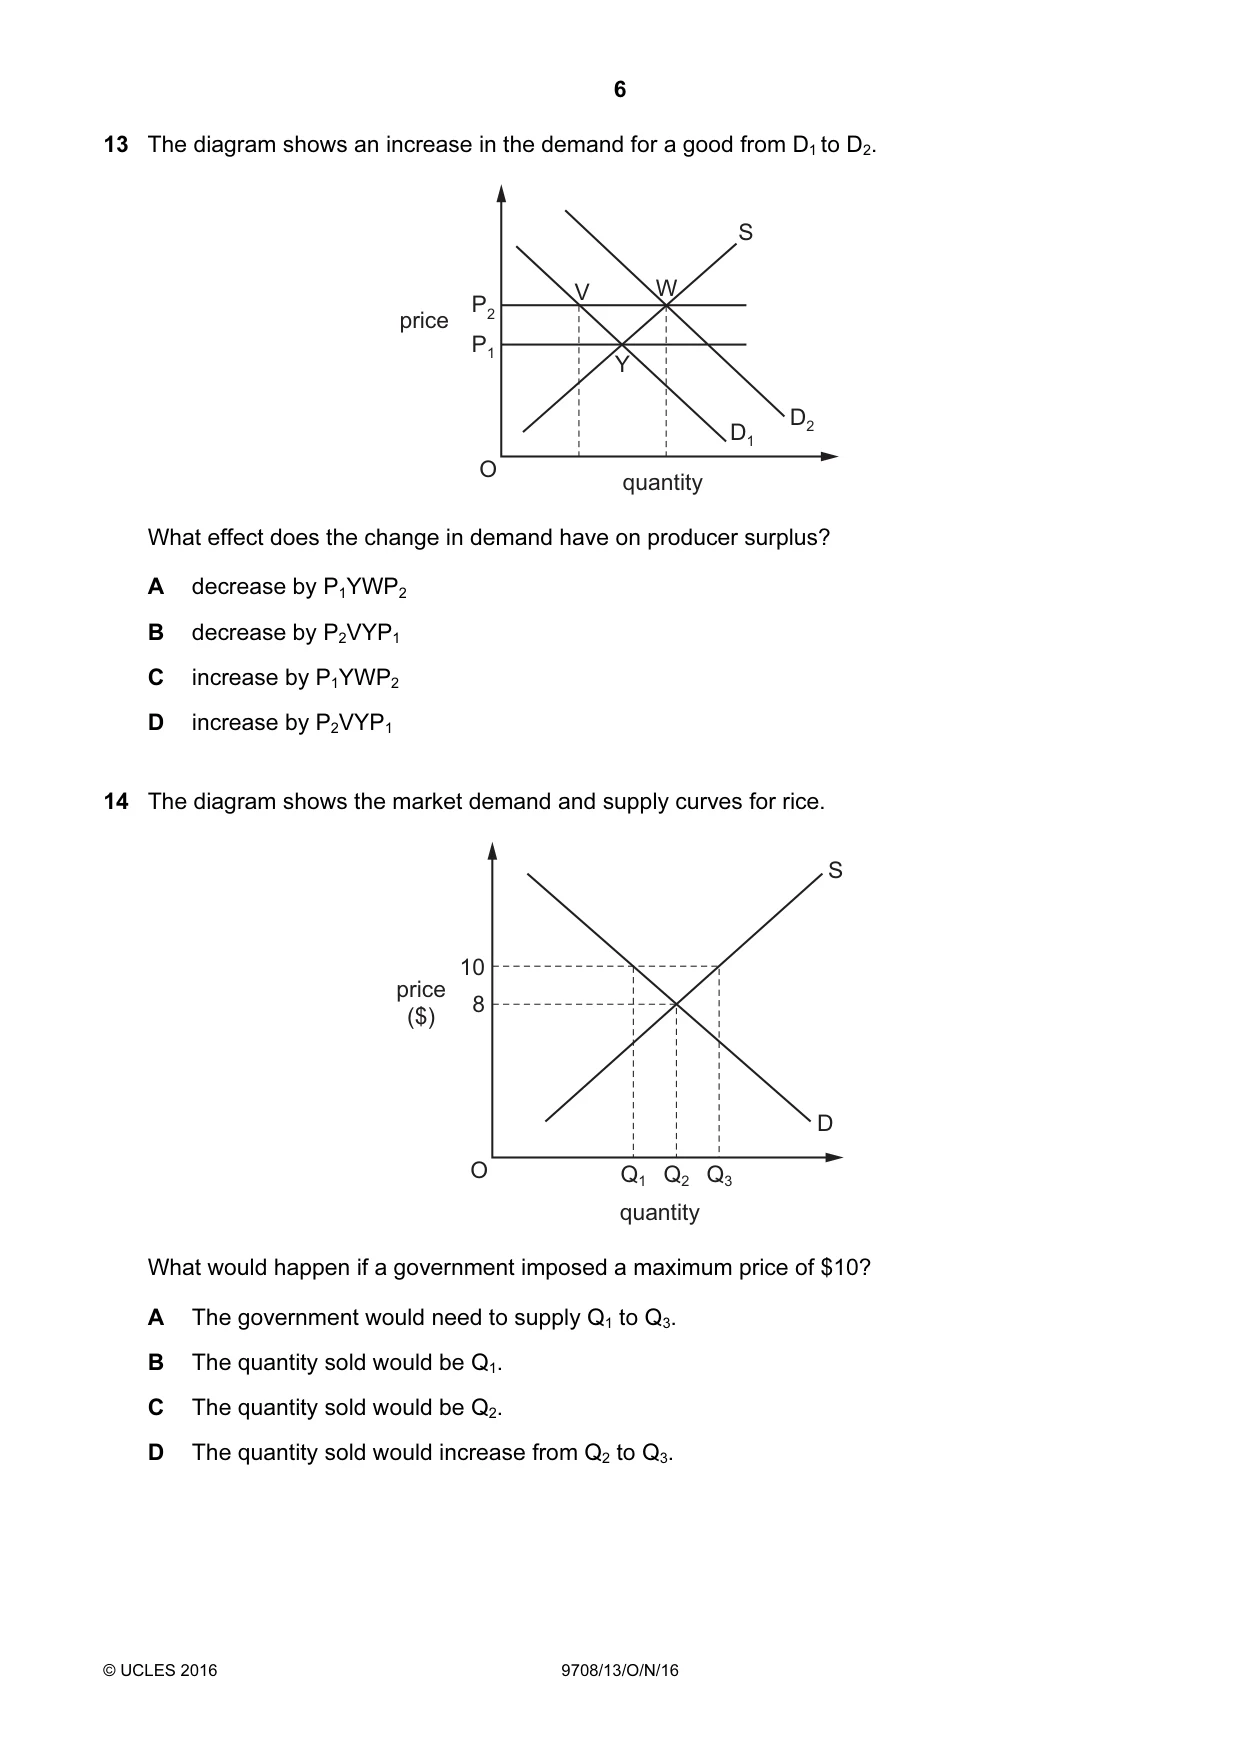
12 The diagram shows demand and supply for bread made from wheat and X is the original equilibrium point. What will the new equilibrium position be following removal of subsidies to the wheat industry and successful advertising about the benefits of a wheat-free diet? S1 A price X B D C D1 O quantity
Mark scheme: D
Q13 · The diagram shows an increase in the demand for a good from D1 to D2
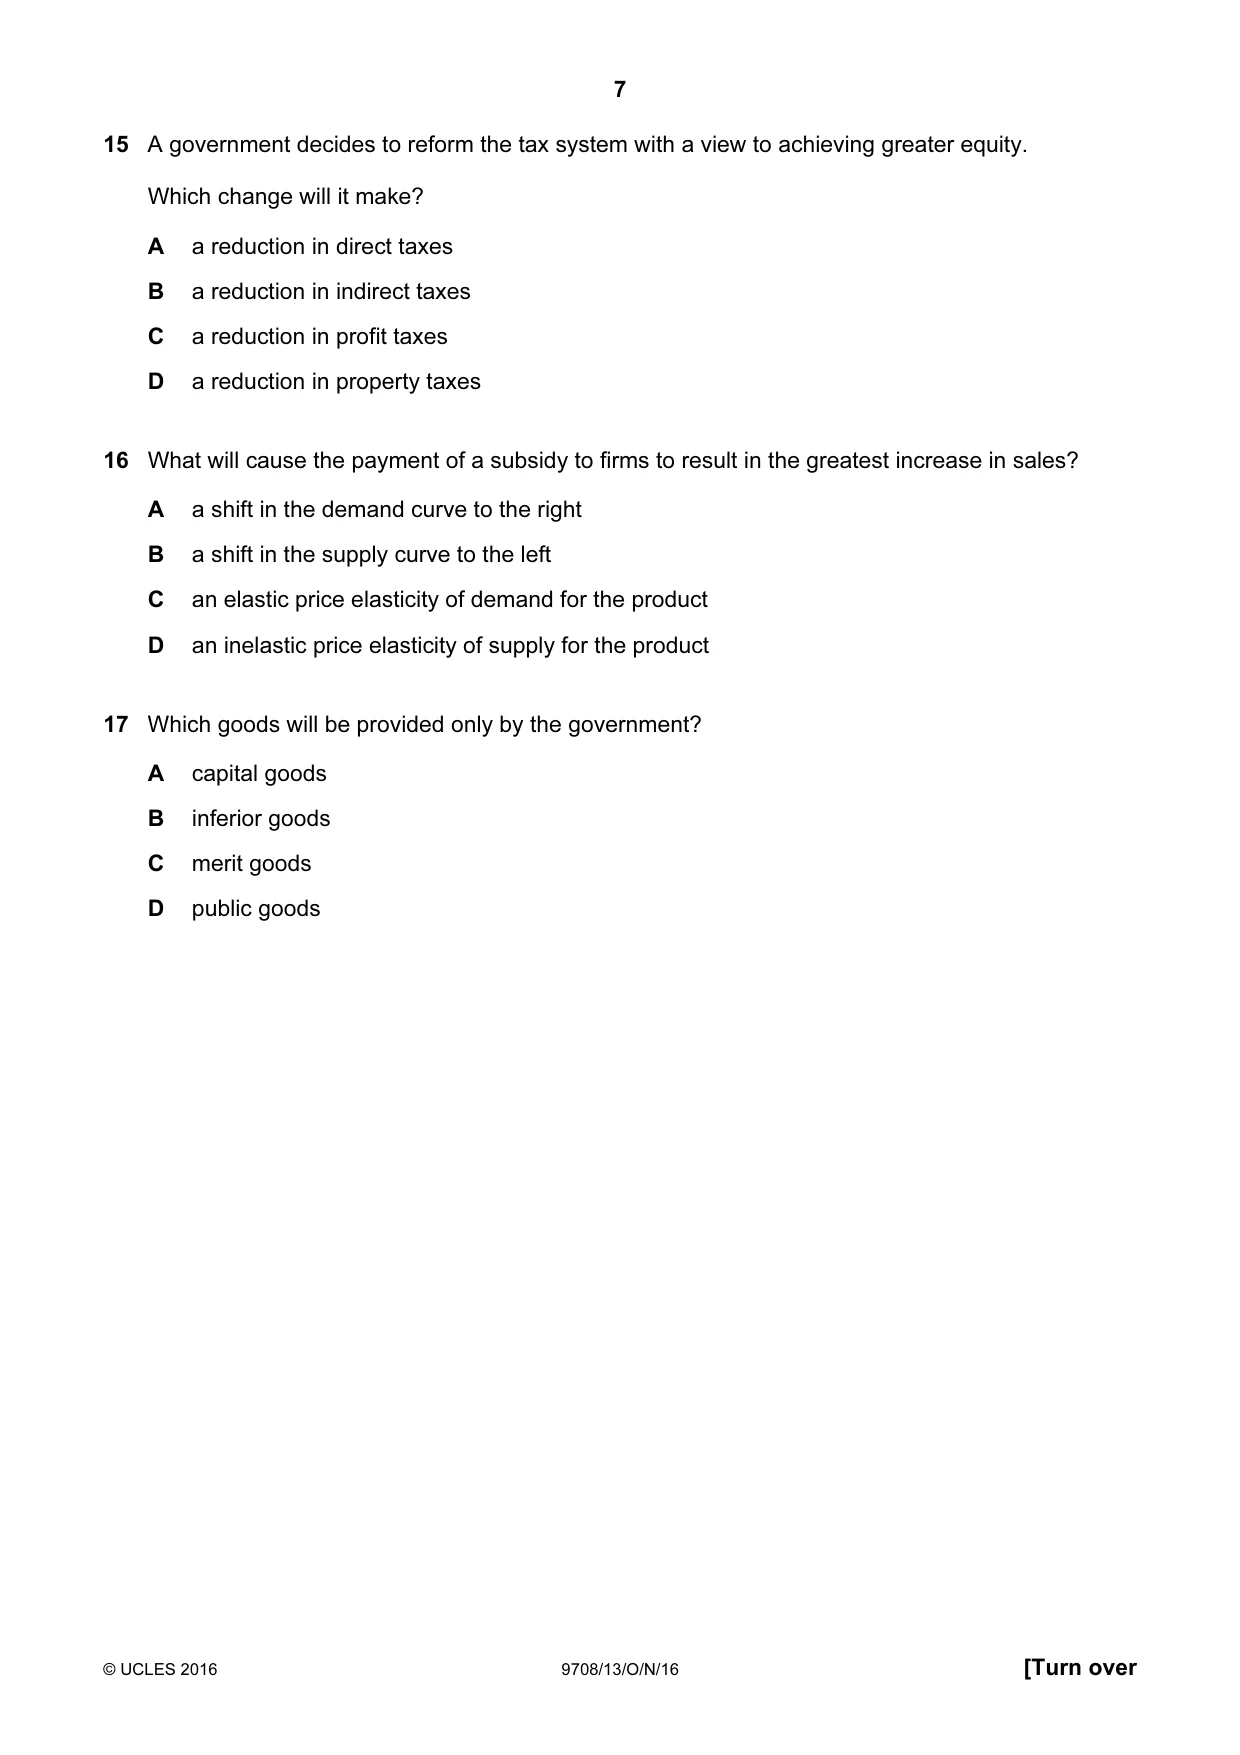
13 The diagram shows an increase in the demand for a good from D1 to D2. S V W P2 price P1 Y D2 D1 O quantity What effect does the change in demand have on producer surplus? A decrease by P1YWP2 B decrease by P2VYP1 C increase by P1YWP2 D increase by P2VYP1
Mark scheme: C
Q14 · The diagram shows the market demand and supply curves for rice
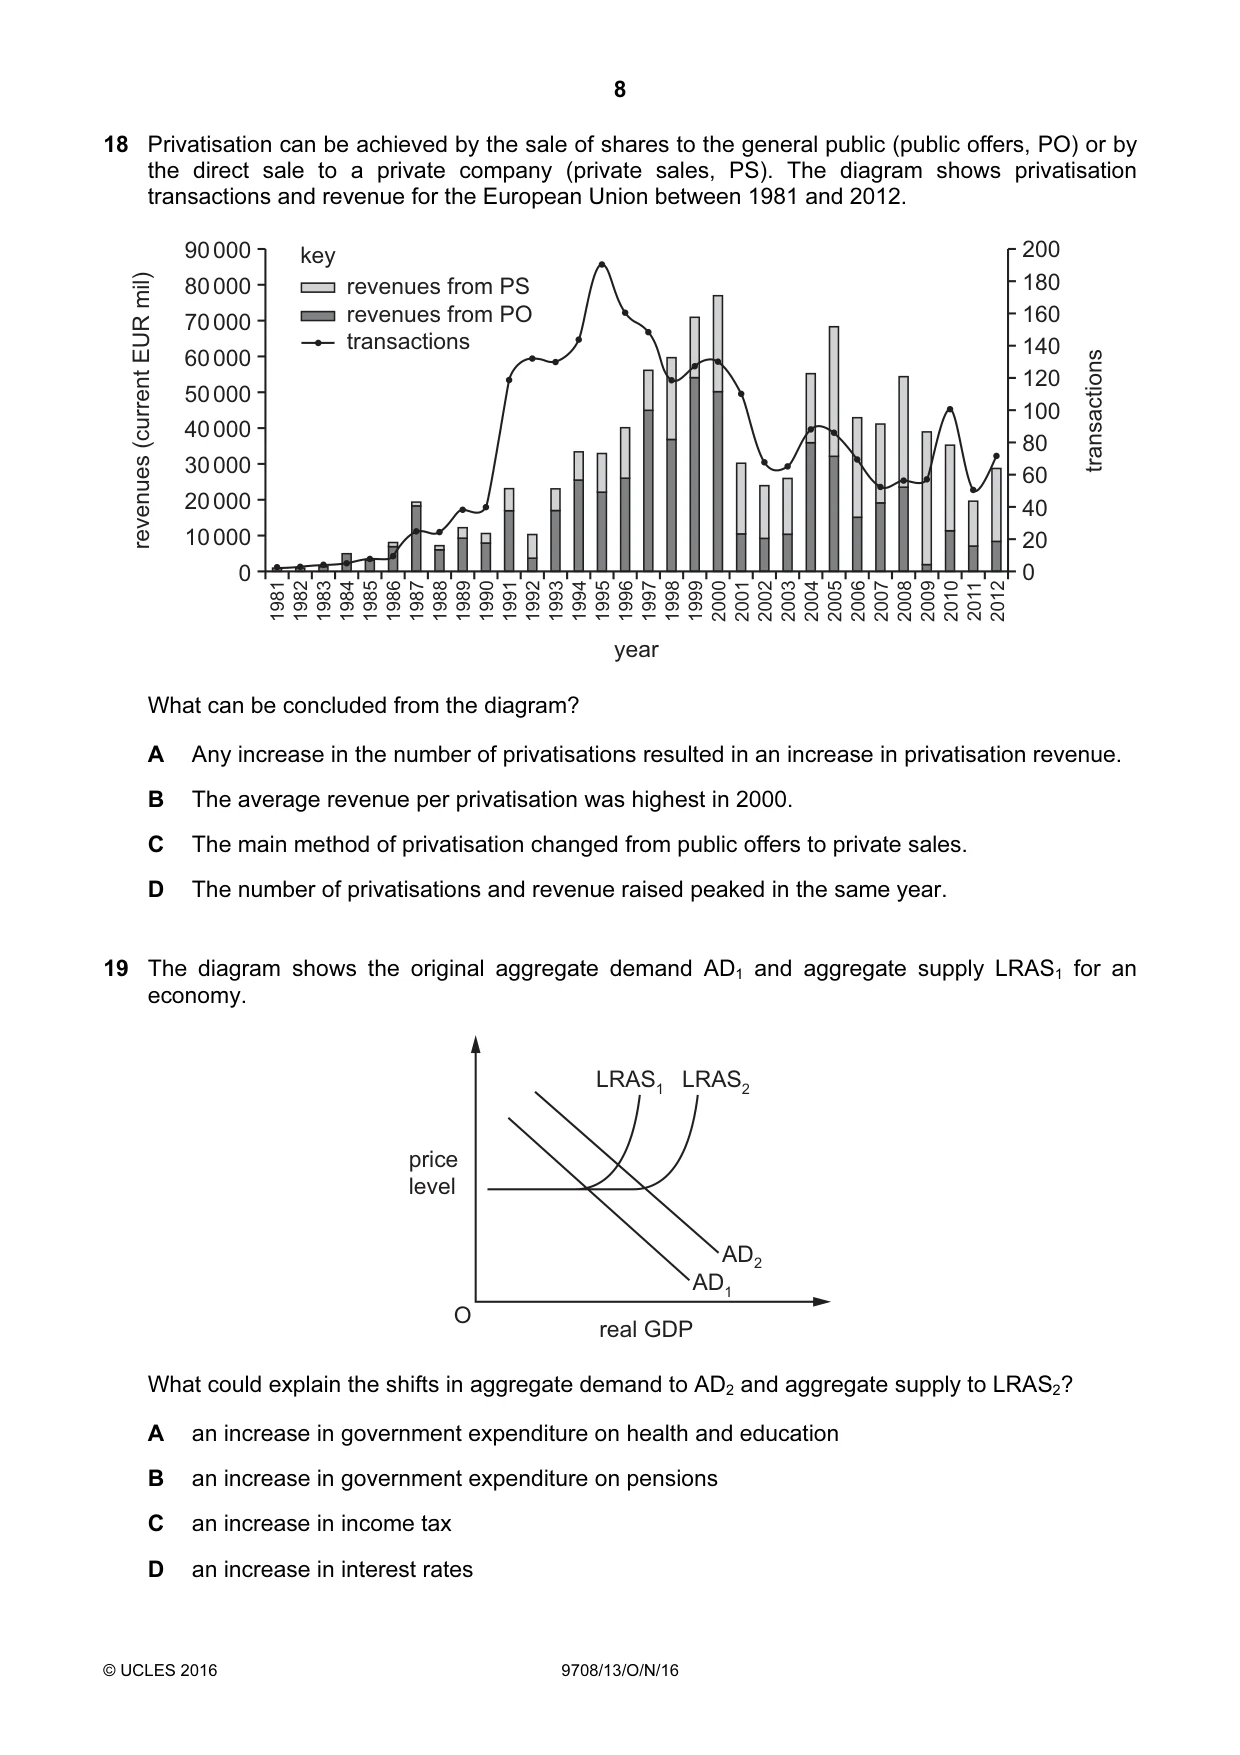
14 The diagram shows the market demand and supply curves for rice. S 10 price 8 ($) D O Q1 Q2 Q3 quantity What would happen if a government imposed a maximum price of $10? A The government would need to supply Q1 to Q3. B The quantity sold would be Q1. C The quantity sold would be Q2. D The quantity sold would increase from Q2 to Q3.
Mark scheme: C
More questions on Methods and effects of government intervention in markets
Q15 · A government decides to reform the tax system with a view to achieving greater equity
15 A government decides to reform the tax system with a view to achieving greater equity. Which change will it make? A a reduction in direct taxes B a reduction in indirect taxes C a reduction in profit taxes D a reduction in property taxes
Mark scheme: B
Q16 · What will cause the payment of a subsidy to firms to result in the greatest increase in…
16 What will cause the payment of a subsidy to firms to result in the greatest increase in sales? A a shift in the demand curve to the right B a shift in the supply curve to the left C an elastic price elasticity of demand for the product D an inelastic price elasticity of supply for the product
Mark scheme: C
More questions on Methods and effects of government intervention in markets
Q17 · Which goods will be provided only by the government?
17 Which goods will be provided only by the government? A capital goods B inferior goods C merit goods D public goods
Mark scheme: D
Q18 · Privatisation can be achieved by the sale of shares to the general public (public offers…
18 Privatisation can be achieved by the sale of shares to the general public (public offers, PO) or by the direct sale to a private company (private sales, PS). The diagram shows privatisation transactions and revenue for the European Union between 1981 and 2012. 90 000 key 200 revenues (current EUR mil) 80 000 revenues from PS 180 70 000 revenues from PO 160 transactions 140 60 000 transactions 120 50 000 100 40 000 80 30 000 60 20 000 40 10 000 20 0 0 1981 1982 1983 1984 1985 1986 1987 1988 1989 1990 1991 1992 1993 1994 1995 1996 1997 1998 1999 2000 2001 2002 2003 2004 2005 2006 2007 2008 2009 2010 2011 2012 year What can be concluded from the diagram? A Any increase in the number of privatisations resulted in an increase in privatisation revenue. B The average revenue per privatisation was highest in 2000. C The main method of privatisation changed from public offers to private sales. D The number of privatisations and revenue raised peaked in the same year.
Mark scheme: C
More questions on Methods and effects of government intervention in markets
Q19 · The diagram shows the original aggregate demand AD1 and aggregate supply LRAS1 for an…
19 The diagram shows the original aggregate demand AD1 and aggregate supply LRAS1 for an economy. LRAS1 LRAS2 price level AD2 AD1 O real GDP What could explain the shifts in aggregate demand to AD2 and aggregate supply to LRAS2? A an increase in government expenditure on health and education B an increase in government expenditure on pensions C an increase in income tax D an increase in interest rates
Mark scheme: A
Q20 · An increase in a country’s consumer price index implies an increase in A the cost of…
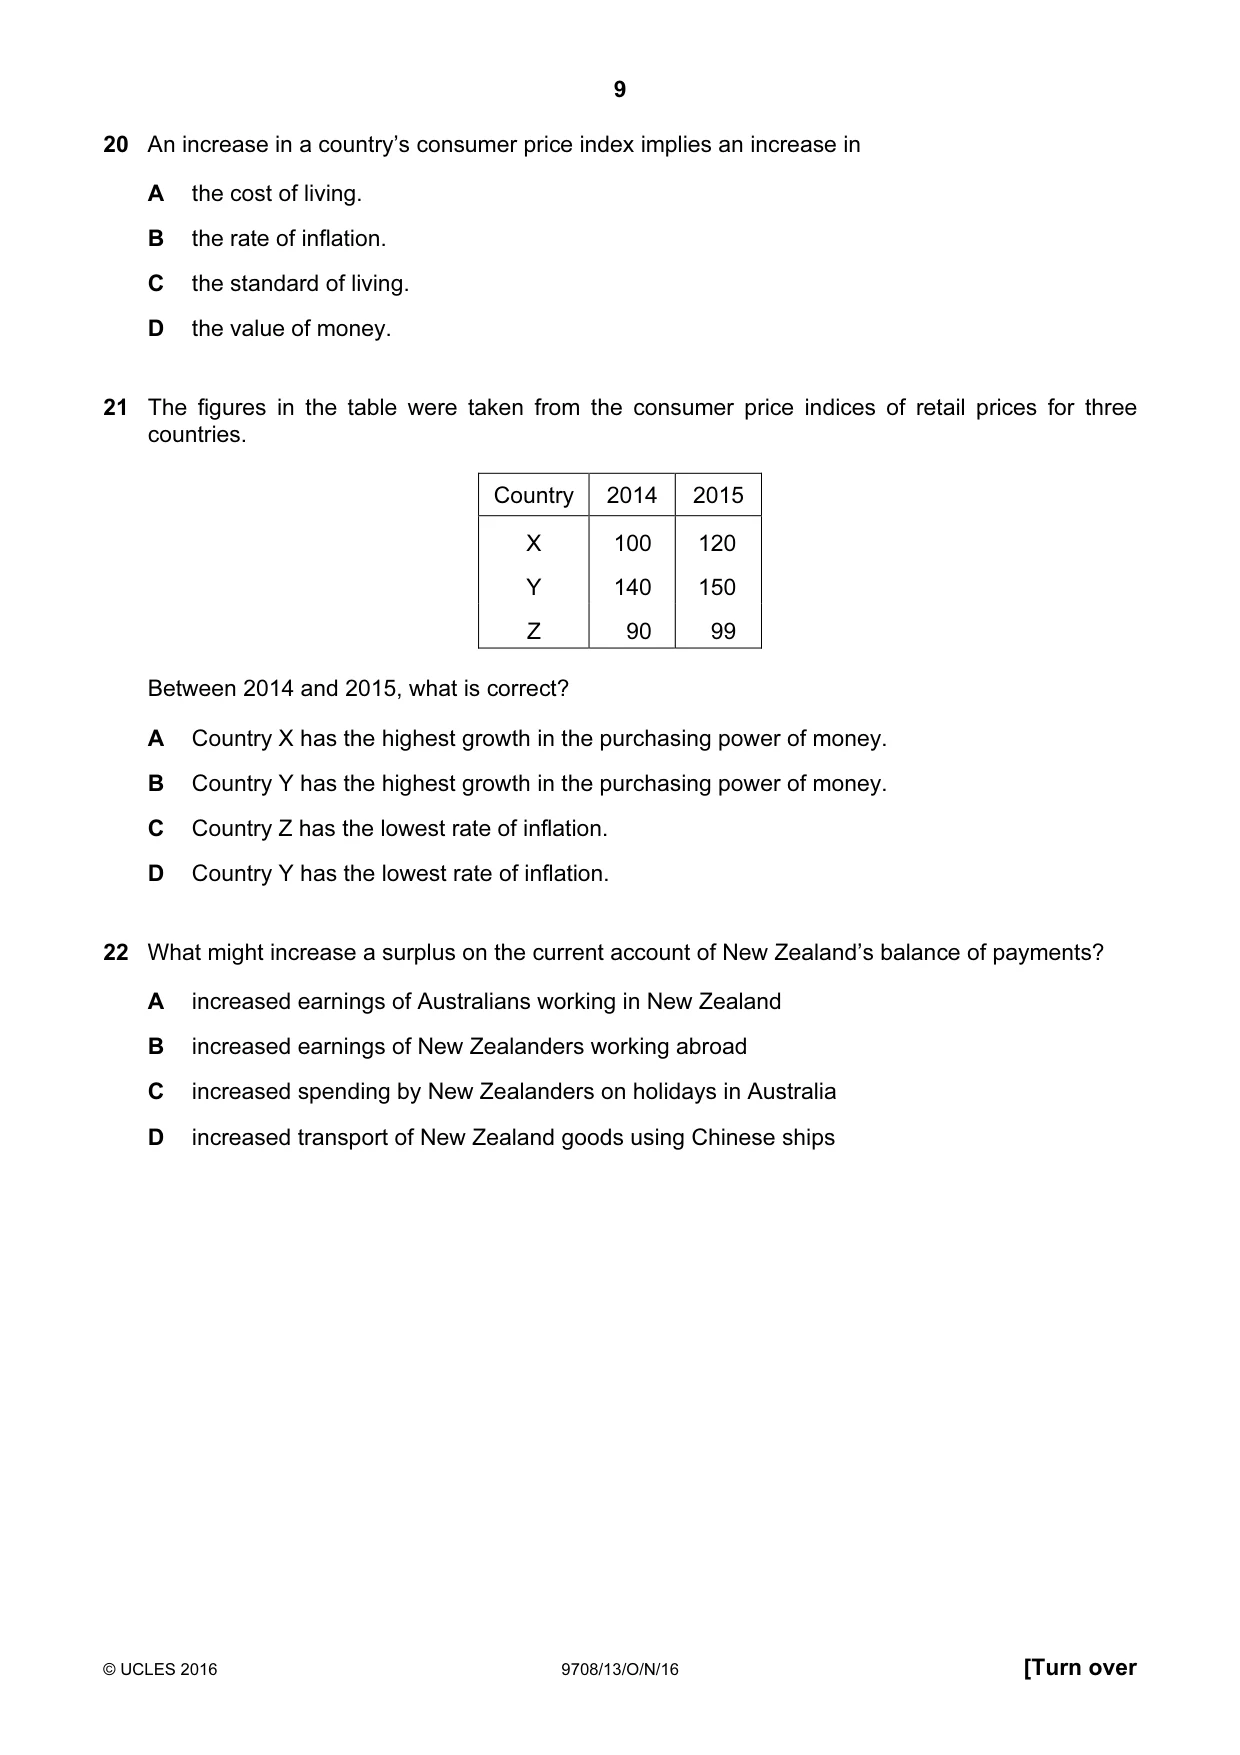
20 An increase in a country’s consumer price index implies an increase in A the cost of living. B the rate of inflation. C the standard of living. D the value of money.
Mark scheme: A
Q21 · The figures in the table were taken from the consumer price indices of retail prices for…
21 The figures in the table were taken from the consumer price indices of retail prices for three countries. Country 2014 2015 X 100 120 Y 140 150 Z 90 99 Between 2014 and 2015, what is correct? A Country X has the highest growth in the purchasing power of money. B Country Y has the highest growth in the purchasing power of money. C Country Z has the lowest rate of inflation. D Country Y has the lowest rate of inflation.
Mark scheme: D
Q22 · What might increase a surplus on the current account of New Zealand’s balance of payments?
22 What might increase a surplus on the current account of New Zealand’s balance of payments? A increased earnings of Australians working in New Zealand B increased earnings of New Zealanders working abroad C increased spending by New Zealanders on holidays in Australia D increased transport of New Zealand goods using Chinese ships
Mark scheme: B
More questions on Current account of the balance of payments
Q23 · The diagram shows the market for £ sterling, which is in equilibrium
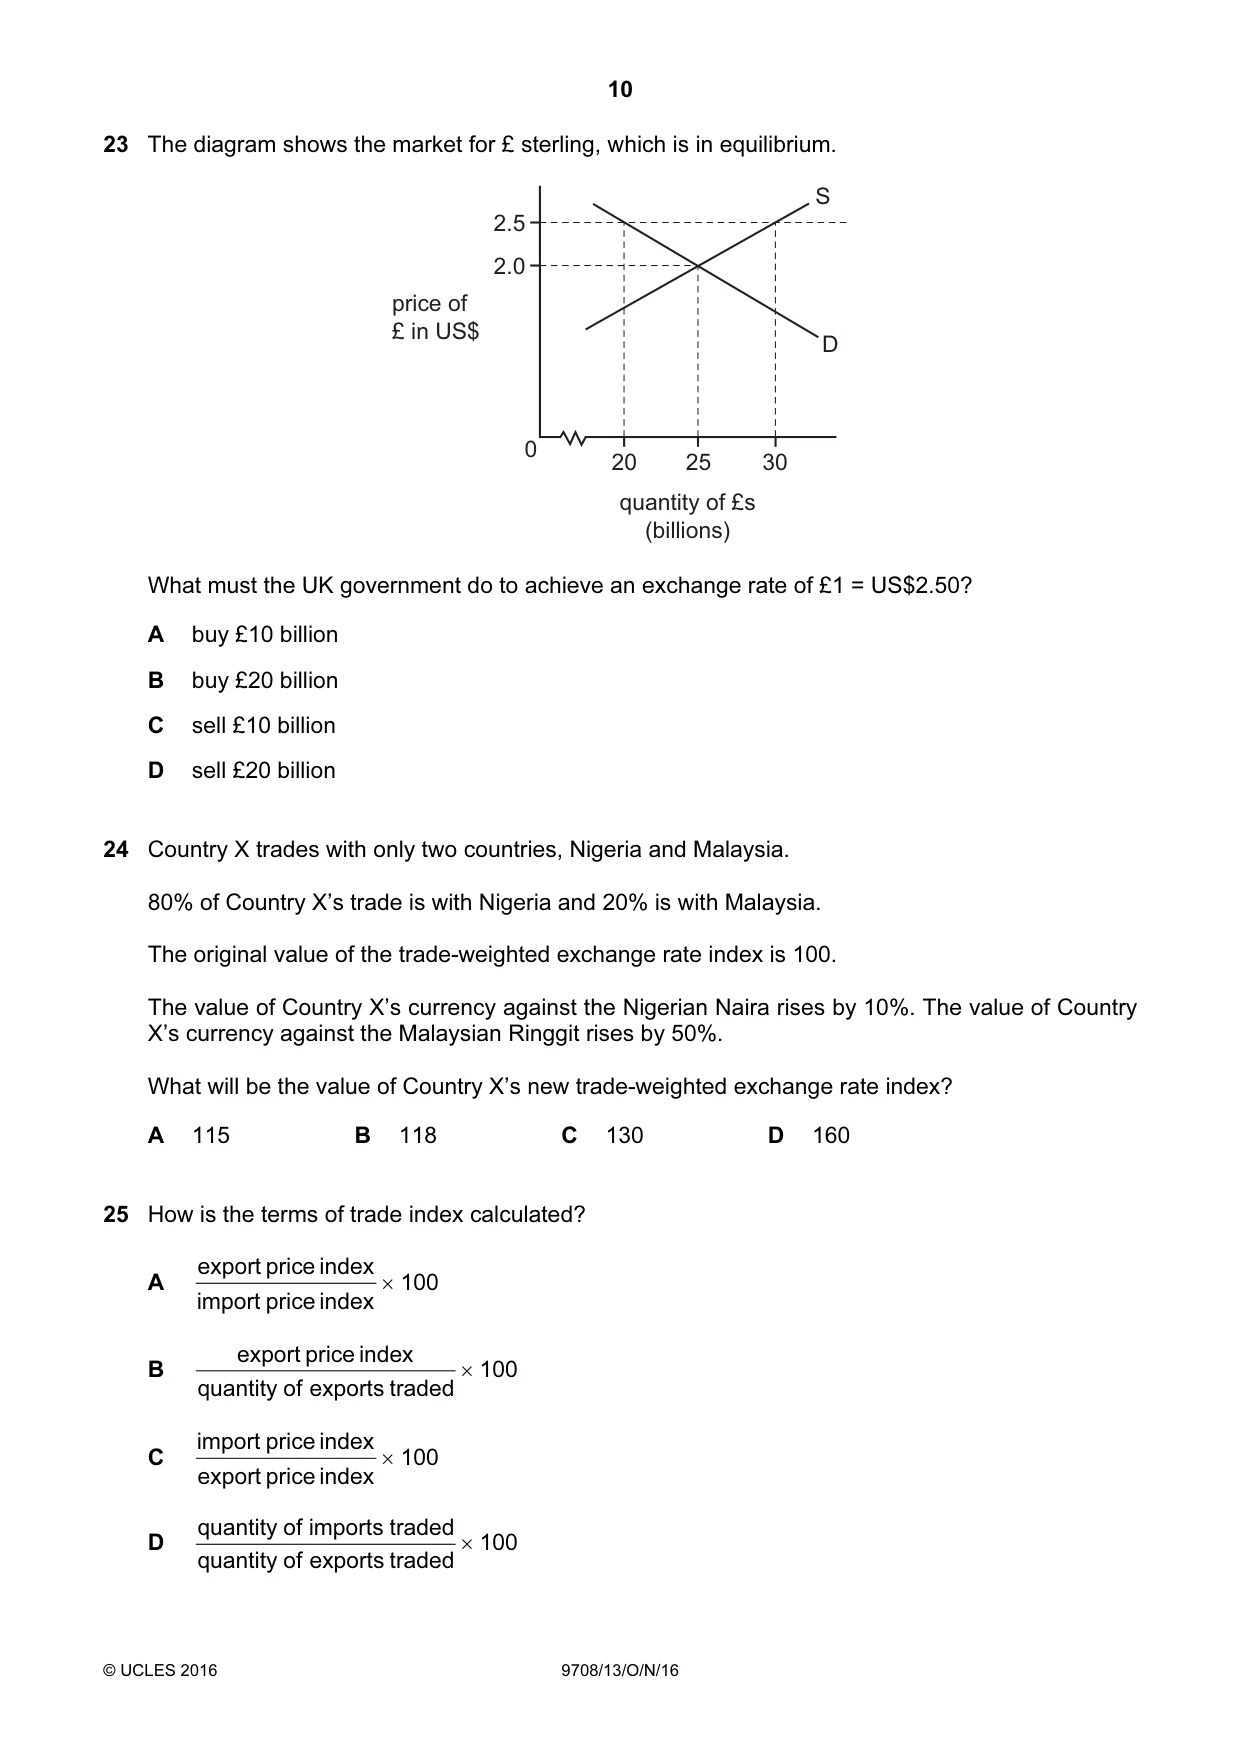
23 The diagram shows the market for £ sterling, which is in equilibrium. S 2.5 2.0 price of £ in US$ D 0 20 25 30 quantity of £s (billions) What must the UK government do to achieve an exchange rate of £1 = US$2.50? A buy £10 billion B buy £20 billion C sell £10 billion D sell £20 billion
Mark scheme: A
Q24 · Country X trades with only two countries, Nigeria and Malaysia
24 Country X trades with only two countries, Nigeria and Malaysia. 80% of Country X’s trade is with Nigeria and 20% is with Malaysia. The original value of the trade-weighted exchange rate index is 100. The value of Country X’s currency against the Nigerian Naira rises by 10%. The value of Country X’s currency against the Malaysian Ringgit rises by 50%. What will be the value of Country X’s new trade-weighted exchange rate index? A 115 B 118 C 130 D 160
Mark scheme: B
Q25 · How is the terms of trade index calculated?
25 How is the terms of trade index calculated? export price index A × 100 import price index export price index B × 100 quantity of exports traded import price index C × 100 export price index quantity of imports traded D × 100 quantity of exports traded
Mark scheme: A
More questions on Current account of the balance of payments
Q26 · The table shows different possible outputs of apples and bananas for Country X and…
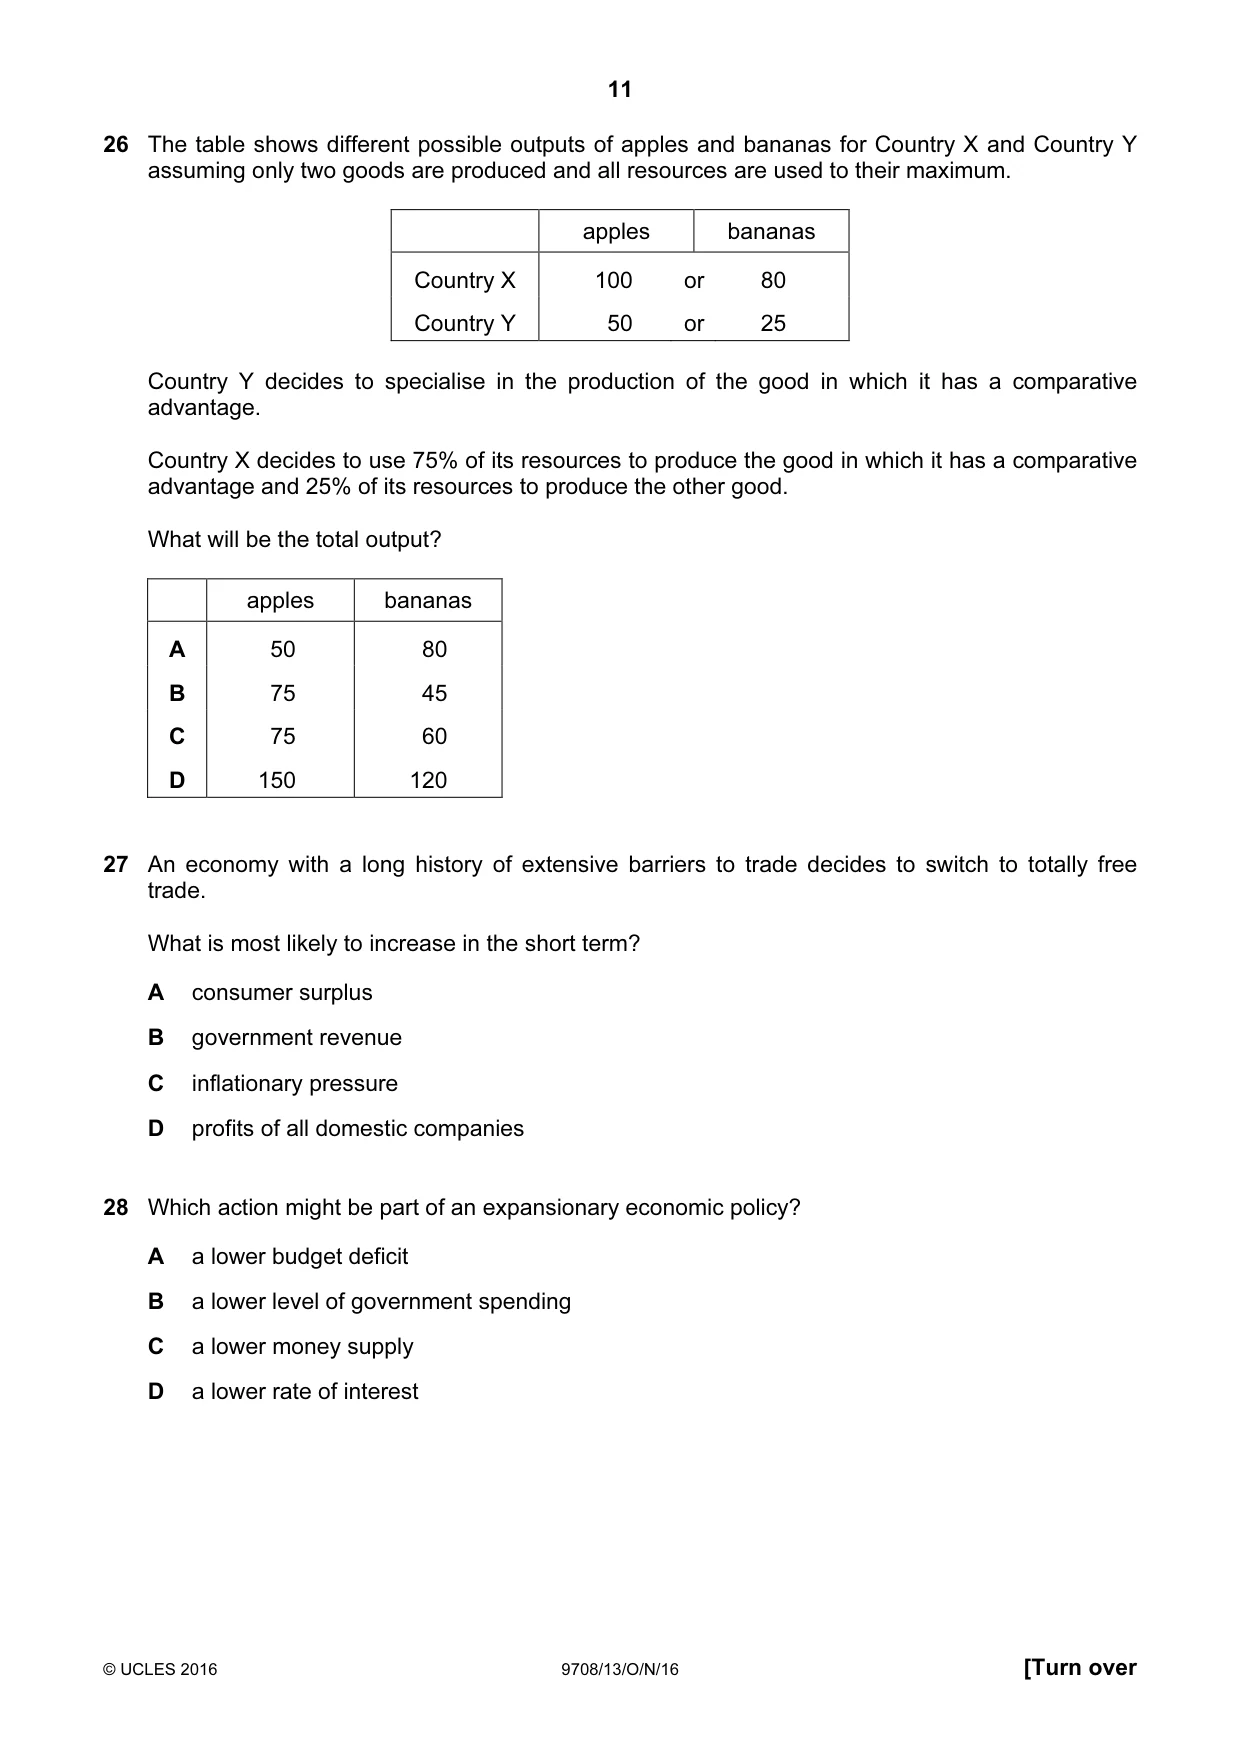
26 The table shows different possible outputs of apples and bananas for Country X and Country Y assuming only two goods are produced and all resources are used to their maximum. apples bananas Country X 100 or 80 Country Y 50 or 25 Country Y decides to specialise in the production of the good in which it has a comparative advantage. Country X decides to use 75% of its resources to produce the good in which it has a comparative advantage and 25% of its resources to produce the other good. What will be the total output? apples bananas A 50 80 B 75 45 C 75 60 D 150 120
Mark scheme: C
Q27 · An economy with a long history of extensive barriers to trade decides to switch to…
27 An economy with a long history of extensive barriers to trade decides to switch to totally free trade. What is most likely to increase in the short term? A consumer surplus B government revenue C inflationary pressure D profits of all domestic companies
Mark scheme: A
Q28 · Which action might be part of an expansionary economic policy?
28 Which action might be part of an expansionary economic policy? A a lower budget deficit B a lower level of government spending C a lower money supply D a lower rate of interest
Mark scheme: D
Q29 · What is the most effective policy to correct a deficit on the current account of the…
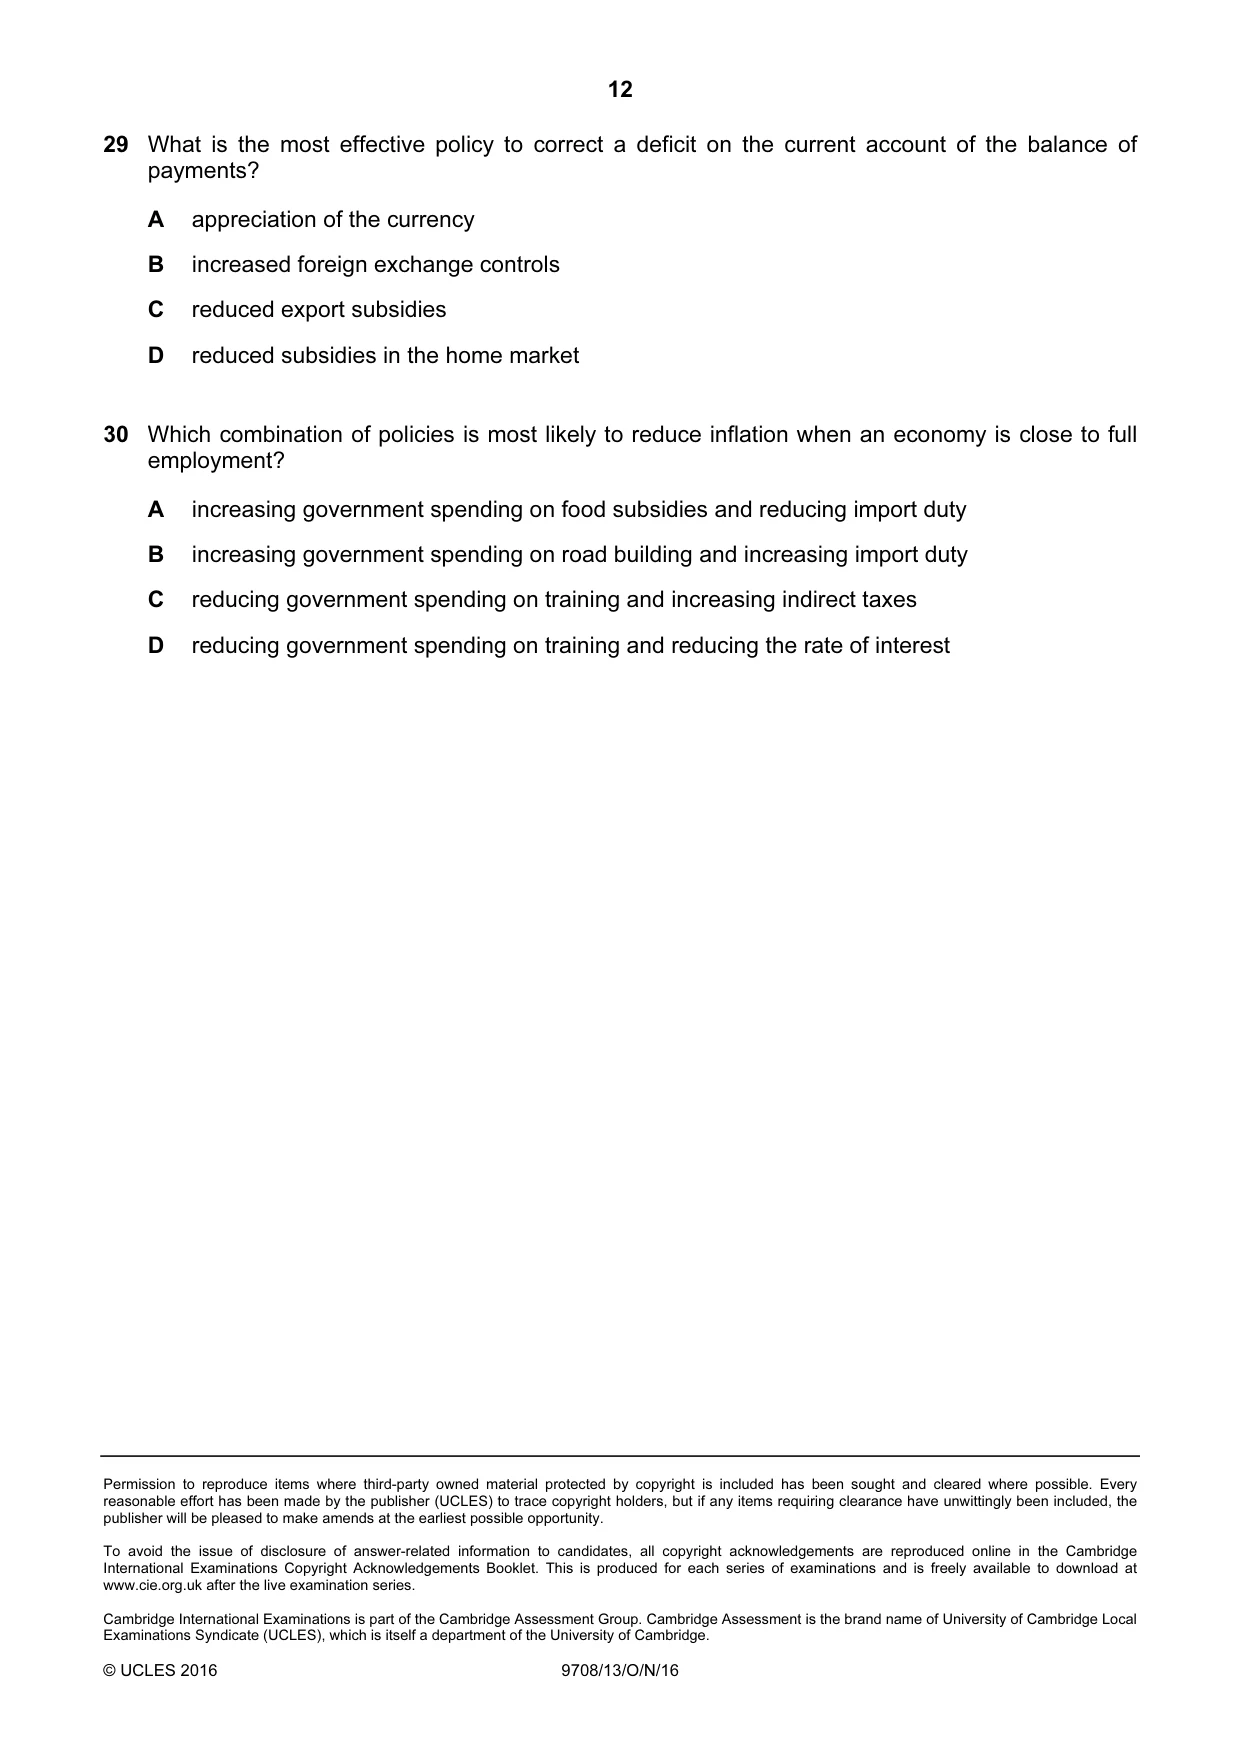
29 What is the most effective policy to correct a deficit on the current account of the balance of payments? A appreciation of the currency B increased foreign exchange controls C reduced export subsidies D reduced subsidies in the home market
Mark scheme: B
More questions on Policies to correct imbalances in the current account of the balance of payments
Q30 · Which combination of policies is most likely to reduce inflation when an economy is close…
30 Which combination of policies is most likely to reduce inflation when an economy is close to full employment? A increasing government spending on food subsidies and reducing import duty B increasing government spending on road building and increasing import duty C reducing government spending on training and increasing indirect taxes D reducing government spending on training and reducing the rate of interest
Mark scheme: A
What was in this paper
The subtopics covered by these 30 questions, and how many questions each got. Open one in a new tab to see every Cambridge question on it.
3Price elasticity, income elasticity and cross elasticity of demand3Current account of the balance of payments2Demand and supply curves2Exchange rates2Price stability2Supply-side policy2The reasons for international trade2Addressing income and wealth inequality1Classification of goods and services1Consumer and producer surplus1Monetary policy1Money and banking1Policies to correct imbalances in the current account of the balance of payments1Price elasticity of supply1Production possibility curves1Protectionism1Resource allocation in different economic systems1Scarcity, choice and opportunity cost1The interaction of demand and supply1What you needed in this session
Cambridge’s own grade thresholds for 2016 Oct/Nov, Paper 1 · Variant 3. A higher threshold means an easier paper — the bar moves with how the cohort did.