Cambridge A Level Economics 9708 — 2016 May/June Paper 1 · Variant 2
9708/12/M/J/16 · 30 questions · 30 marks · ≈34 min
The question paper and its mark scheme, free to read here and free to download. This is Cambridge’s own paper, exactly as it was sat.
Question paper16 pages
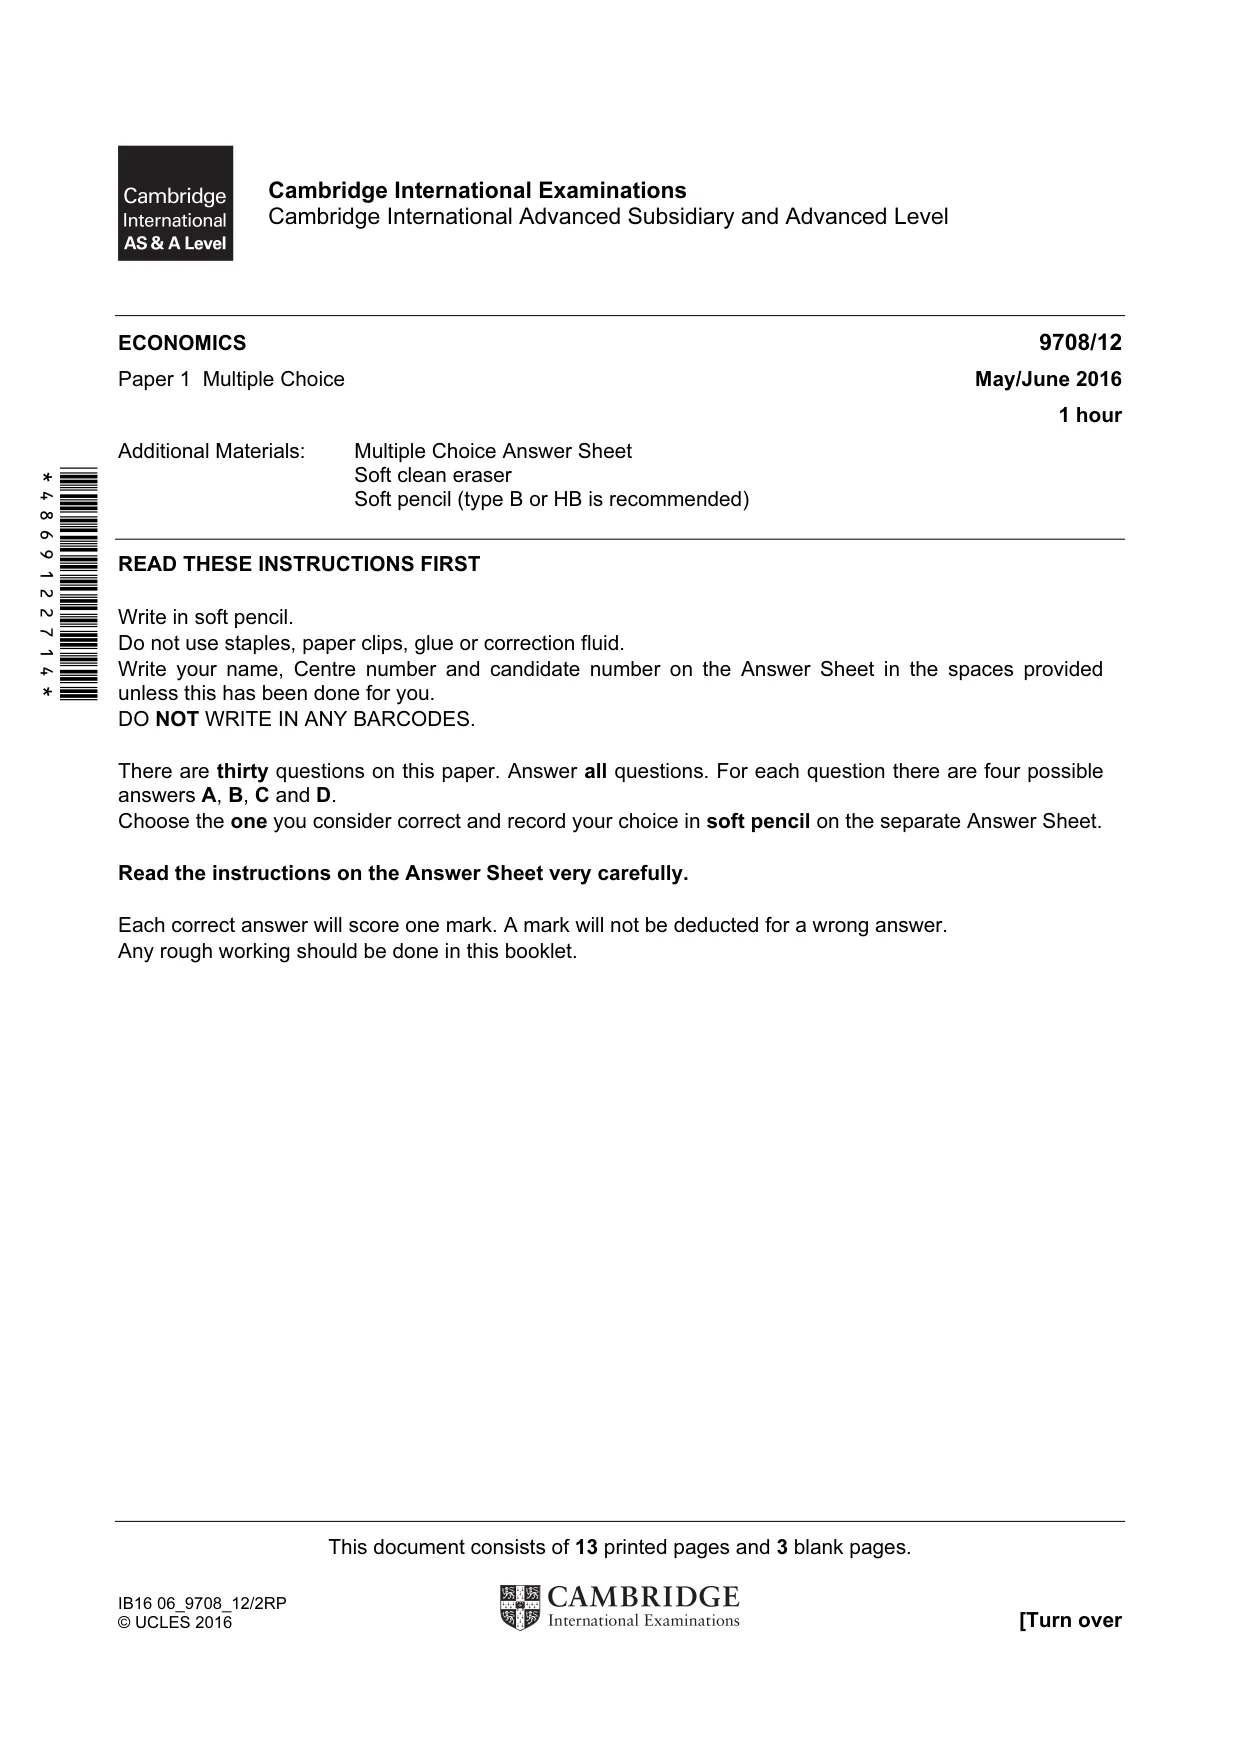
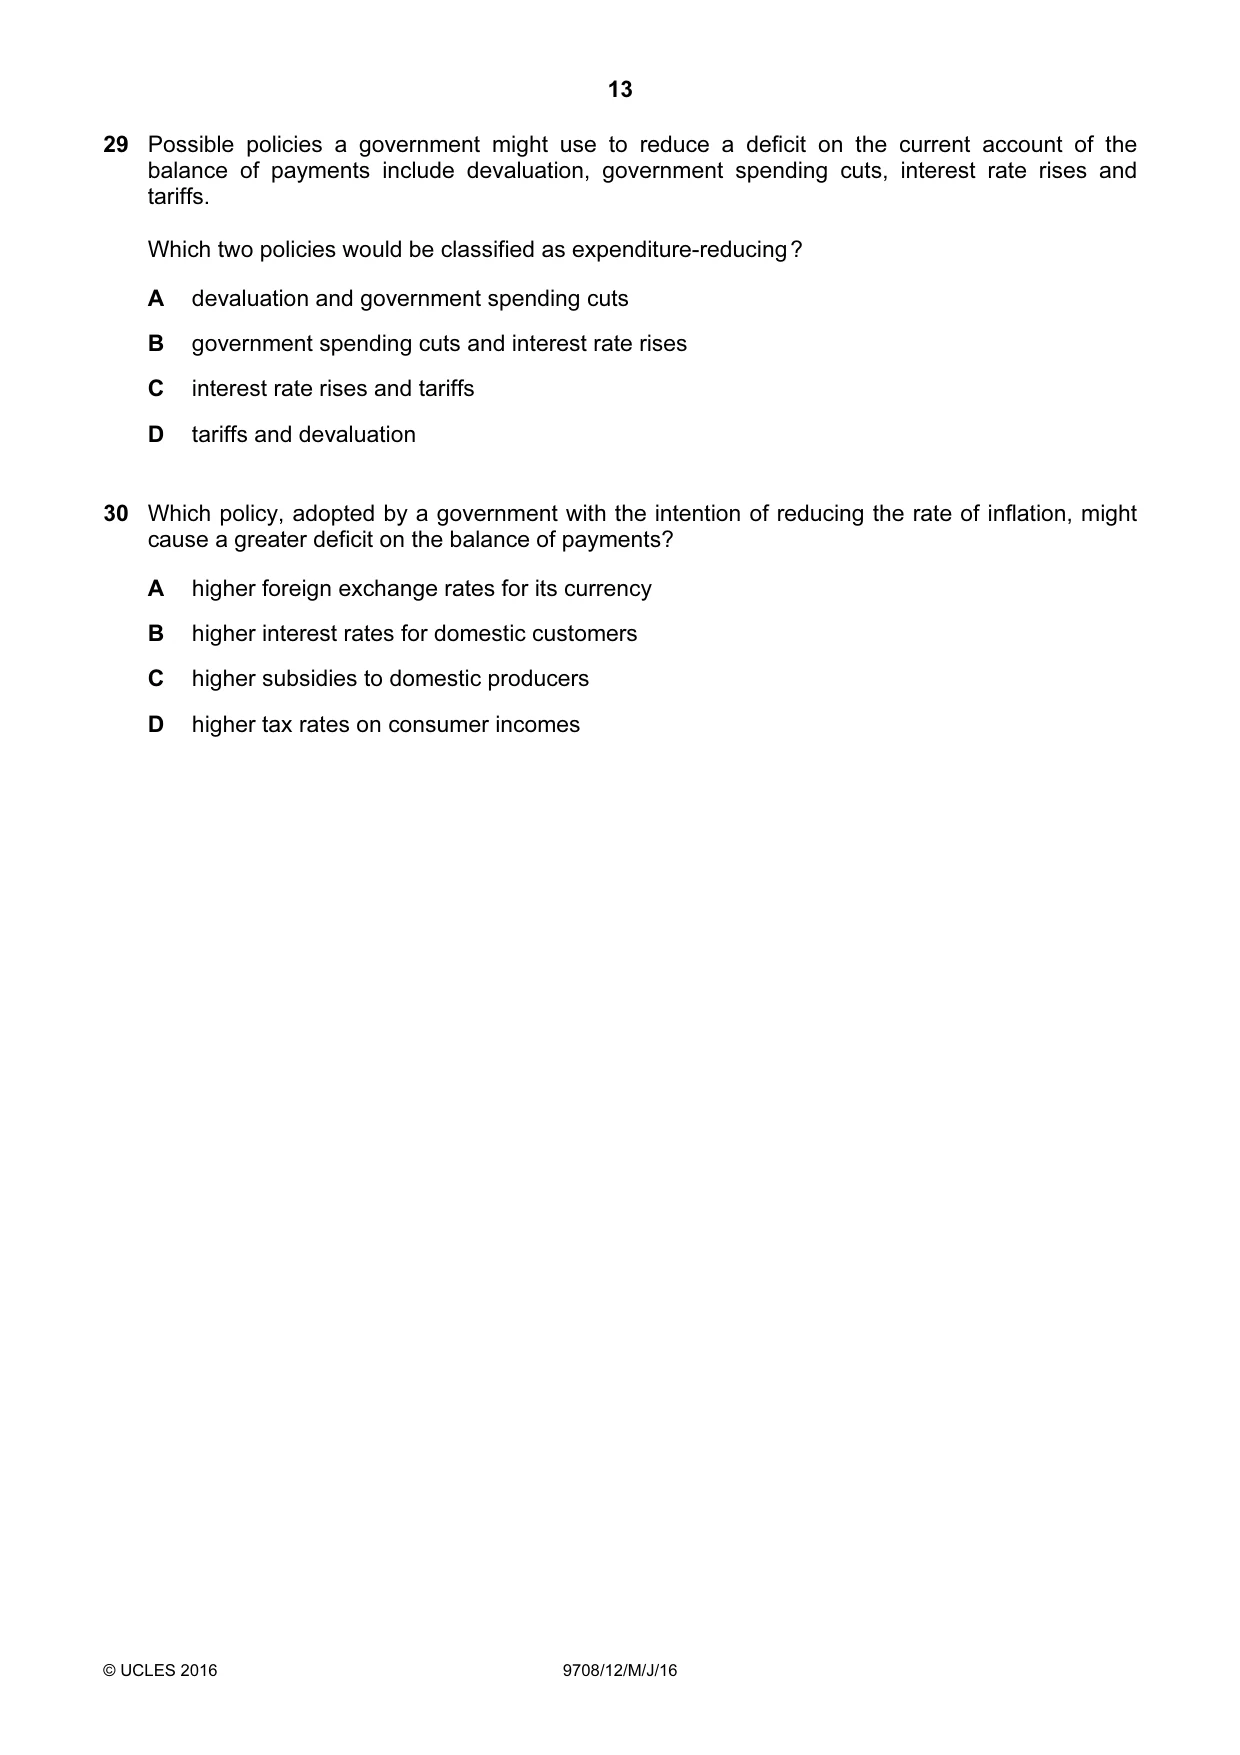
Mark scheme2 pages
Answers below. Sit the paper first if you are practising.
Questions as text
Q1 · In 2007 there was a worldwide shortage of oil
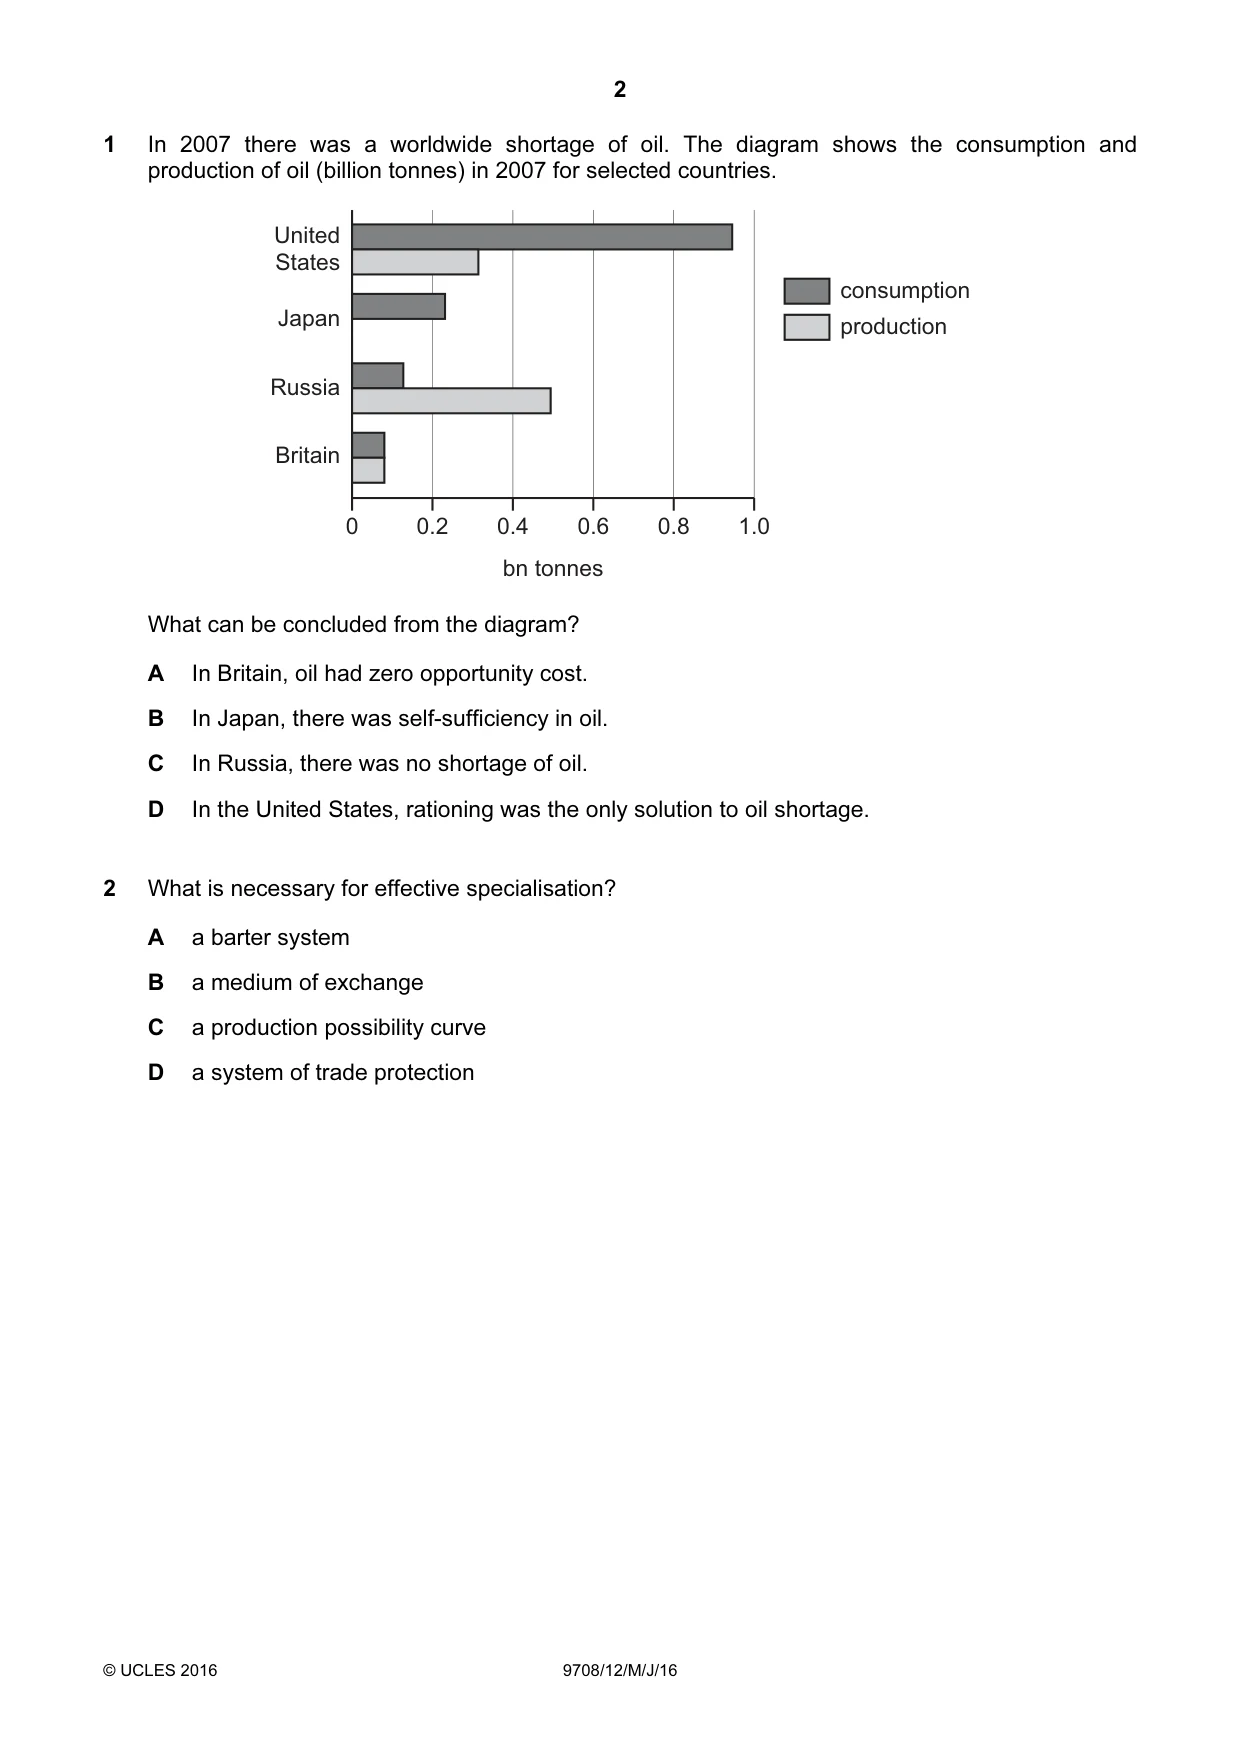
1 In 2007 there was a worldwide shortage of oil. The diagram shows the consumption and production of oil (billion tonnes) in 2007 for selected countries. United States consumption Japan production Russia Britain 0 0.2 0.4 0.6 0.8 1.0 bn tonnes What can be concluded from the diagram? A In Britain, oil had zero opportunity cost. B In Japan, there was self-sufficiency in oil. C In Russia, there was no shortage of oil. D In the United States, rationing was the only solution to oil shortage.
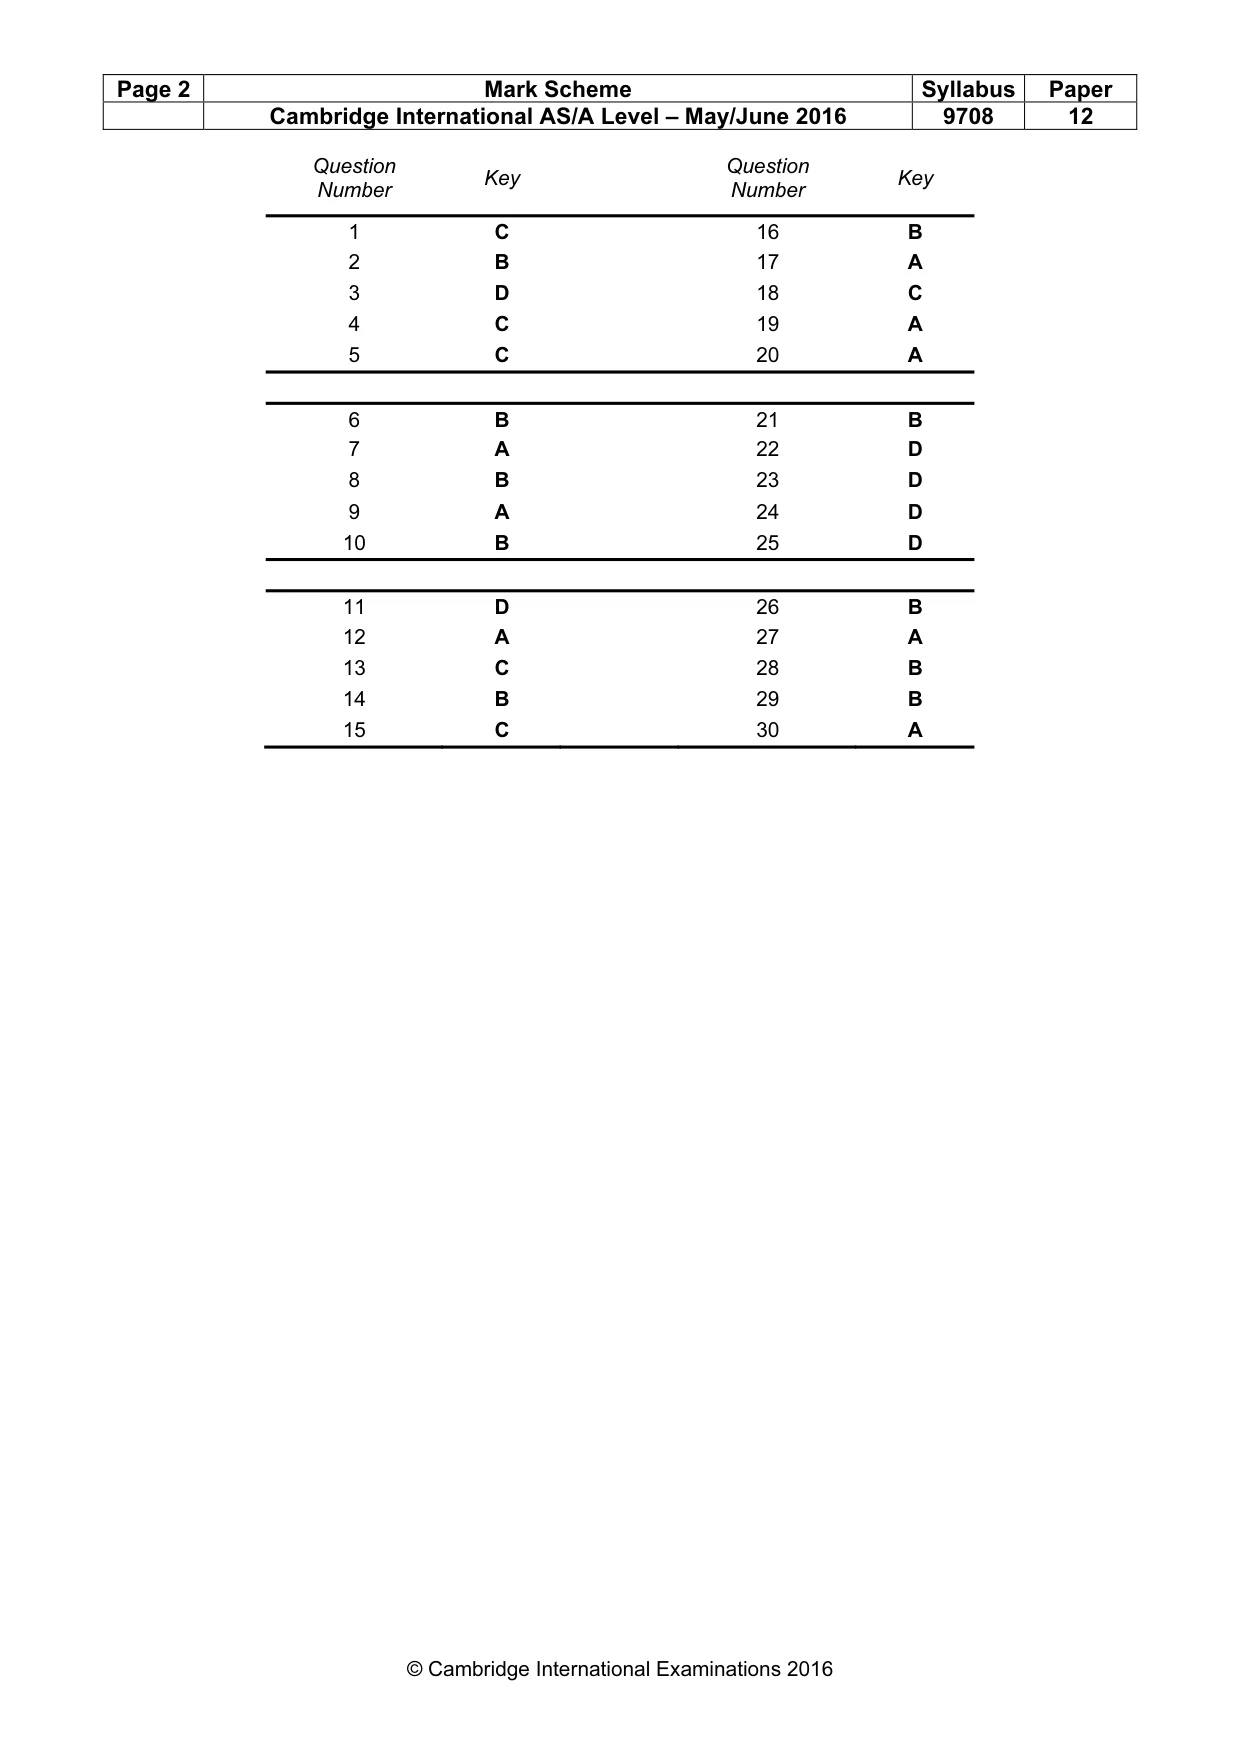
Mark scheme: C
Q2 · What is necessary for effective specialisation?
2 What is necessary for effective specialisation? A a barter system B a medium of exchange C a production possibility curve D a system of trade protection
Mark scheme: B
Q3 · The change from WX to YZ in a country’s production possibility curve is shown
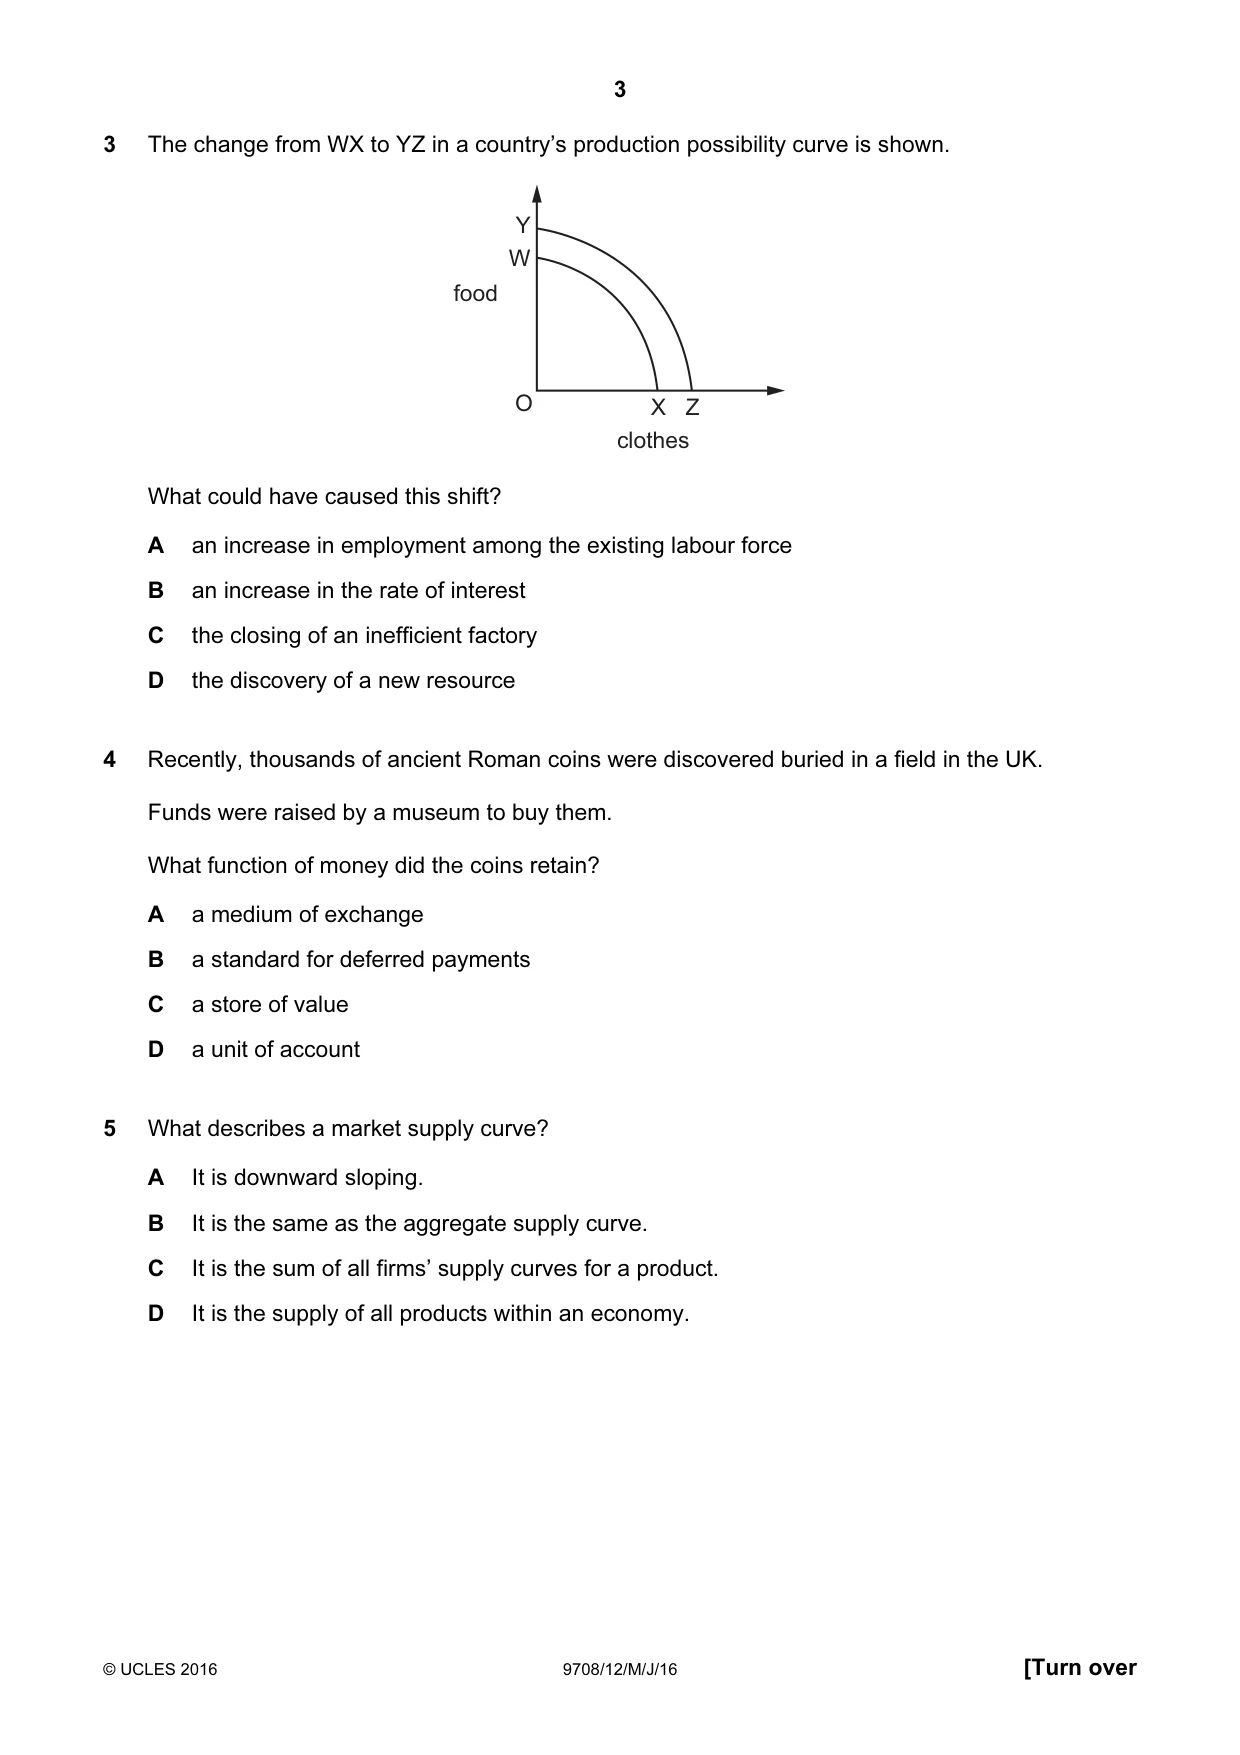
3 The change from WX to YZ in a country’s production possibility curve is shown. Y W food O X Z clothes What could have caused this shift? A an increase in employment among the existing labour force B an increase in the rate of interest C the closing of an inefficient factory D the discovery of a new resource
Mark scheme: D
Q4 · Recently, thousands of ancient Roman coins were discovered buried in a field in the UK
4 Recently, thousands of ancient Roman coins were discovered buried in a field in the UK. Funds were raised by a museum to buy them. What function of money did the coins retain? A a medium of exchange B a standard for deferred payments C a store of value D a unit of account
Mark scheme: C
Q5 · What describes a market supply curve?
5 What describes a market supply curve? A It is downward sloping. B It is the same as the aggregate supply curve. C It is the sum of all firms’ supply curves for a product. D It is the supply of all products within an economy.
Mark scheme: C
Q6 · The demand curve for new cars in a country shifted to the left
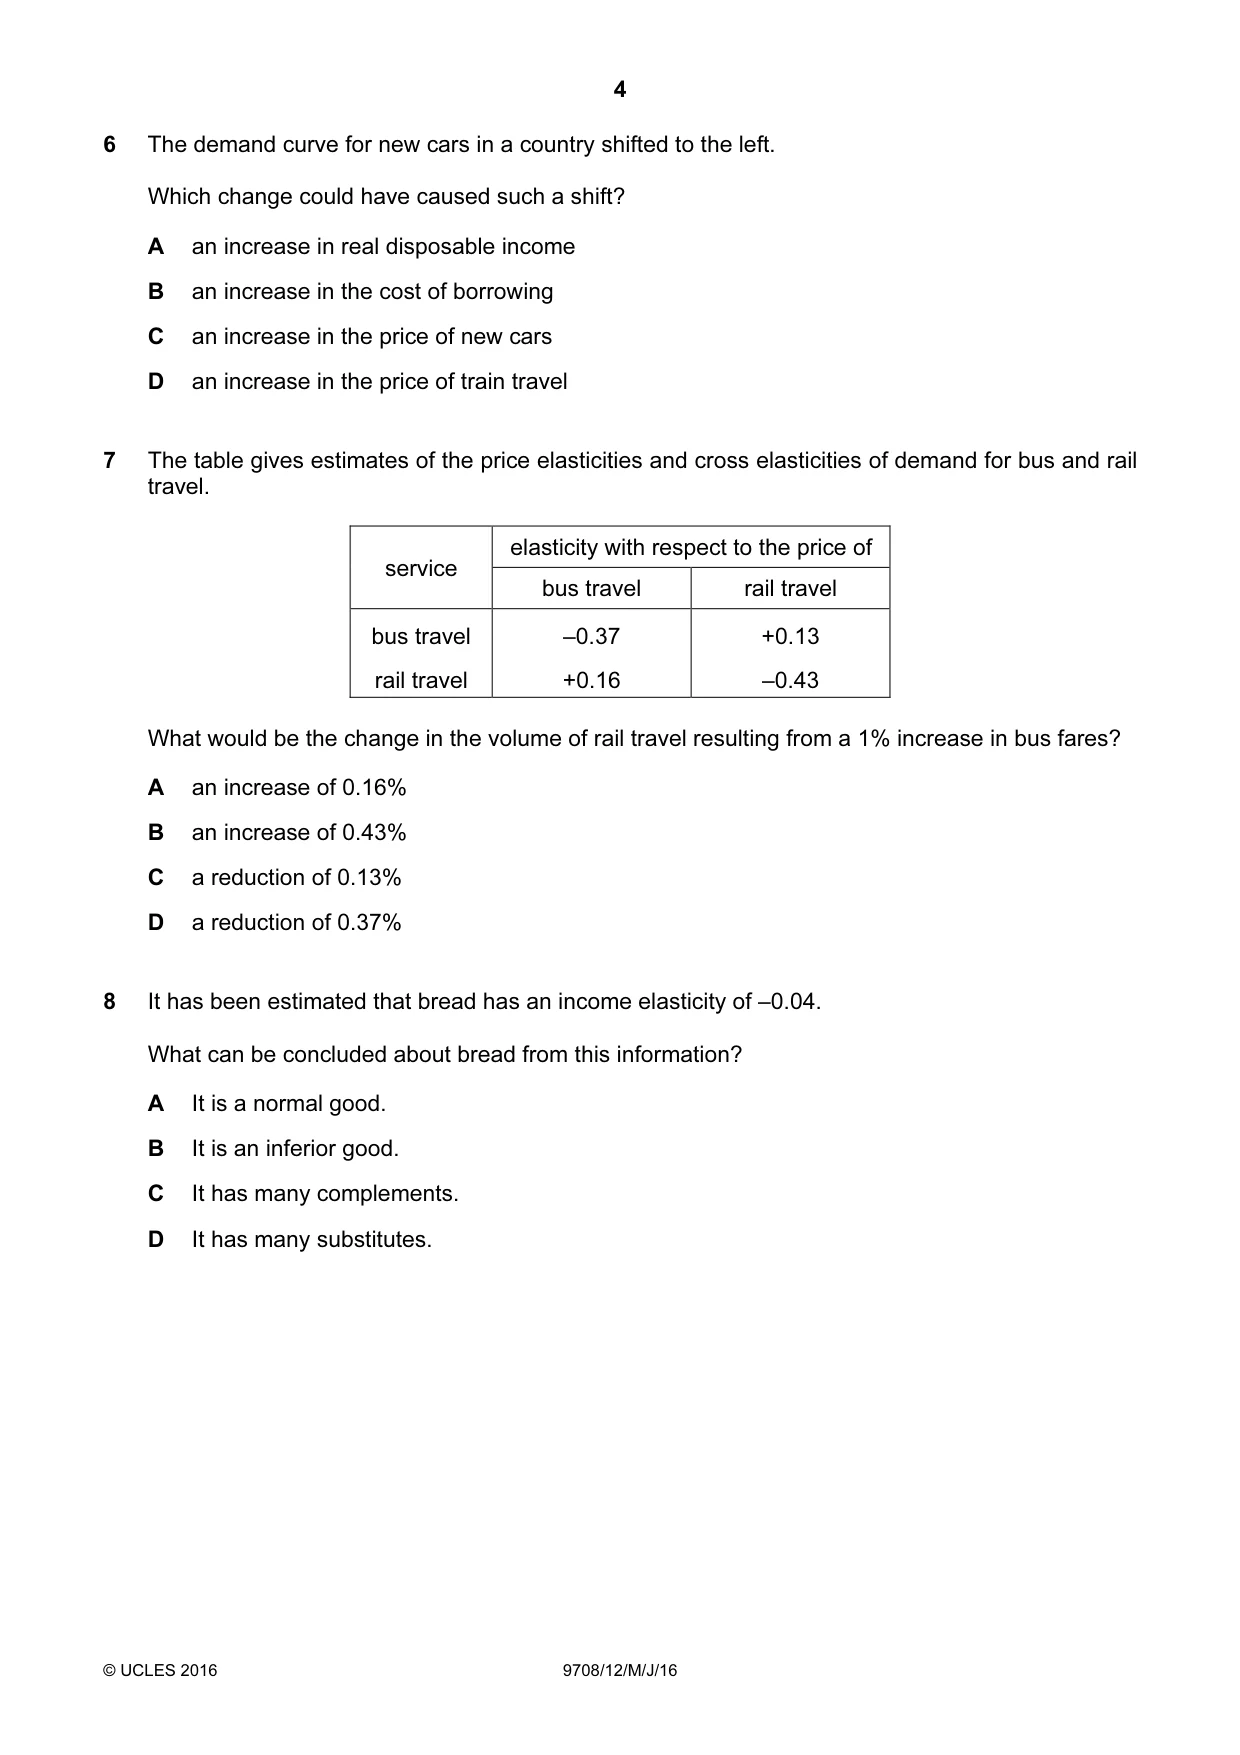
6 The demand curve for new cars in a country shifted to the left. Which change could have caused such a shift? A an increase in real disposable income B an increase in the cost of borrowing C an increase in the price of new cars D an increase in the price of train travel
Mark scheme: B
Q7 · The table gives estimates of the price elasticities and cross elasticities of demand for…
7 The table gives estimates of the price elasticities and cross elasticities of demand for bus and rail travel. elasticity with respect to the price of service bus travel rail travel bus travel –0.37 +0.13 rail travel +0.16 –0.43 What would be the change in the volume of rail travel resulting from a 1% increase in bus fares? A an increase of 0.16% B an increase of 0.43% C a reduction of 0.13% D a reduction of 0.37%
Mark scheme: A
More questions on Price elasticity, income elasticity and cross elasticity of demand
Q8 · It has been estimated that bread has an income elasticity of –0.04
8 It has been estimated that bread has an income elasticity of –0.04. What can be concluded about bread from this information? A It is a normal good. B It is an inferior good. C It has many complements. D It has many substitutes.
Mark scheme: B
More questions on Price elasticity, income elasticity and cross elasticity of demand
Q9 · SX, SY and SZ are the supply curves of goods X, Y and Z
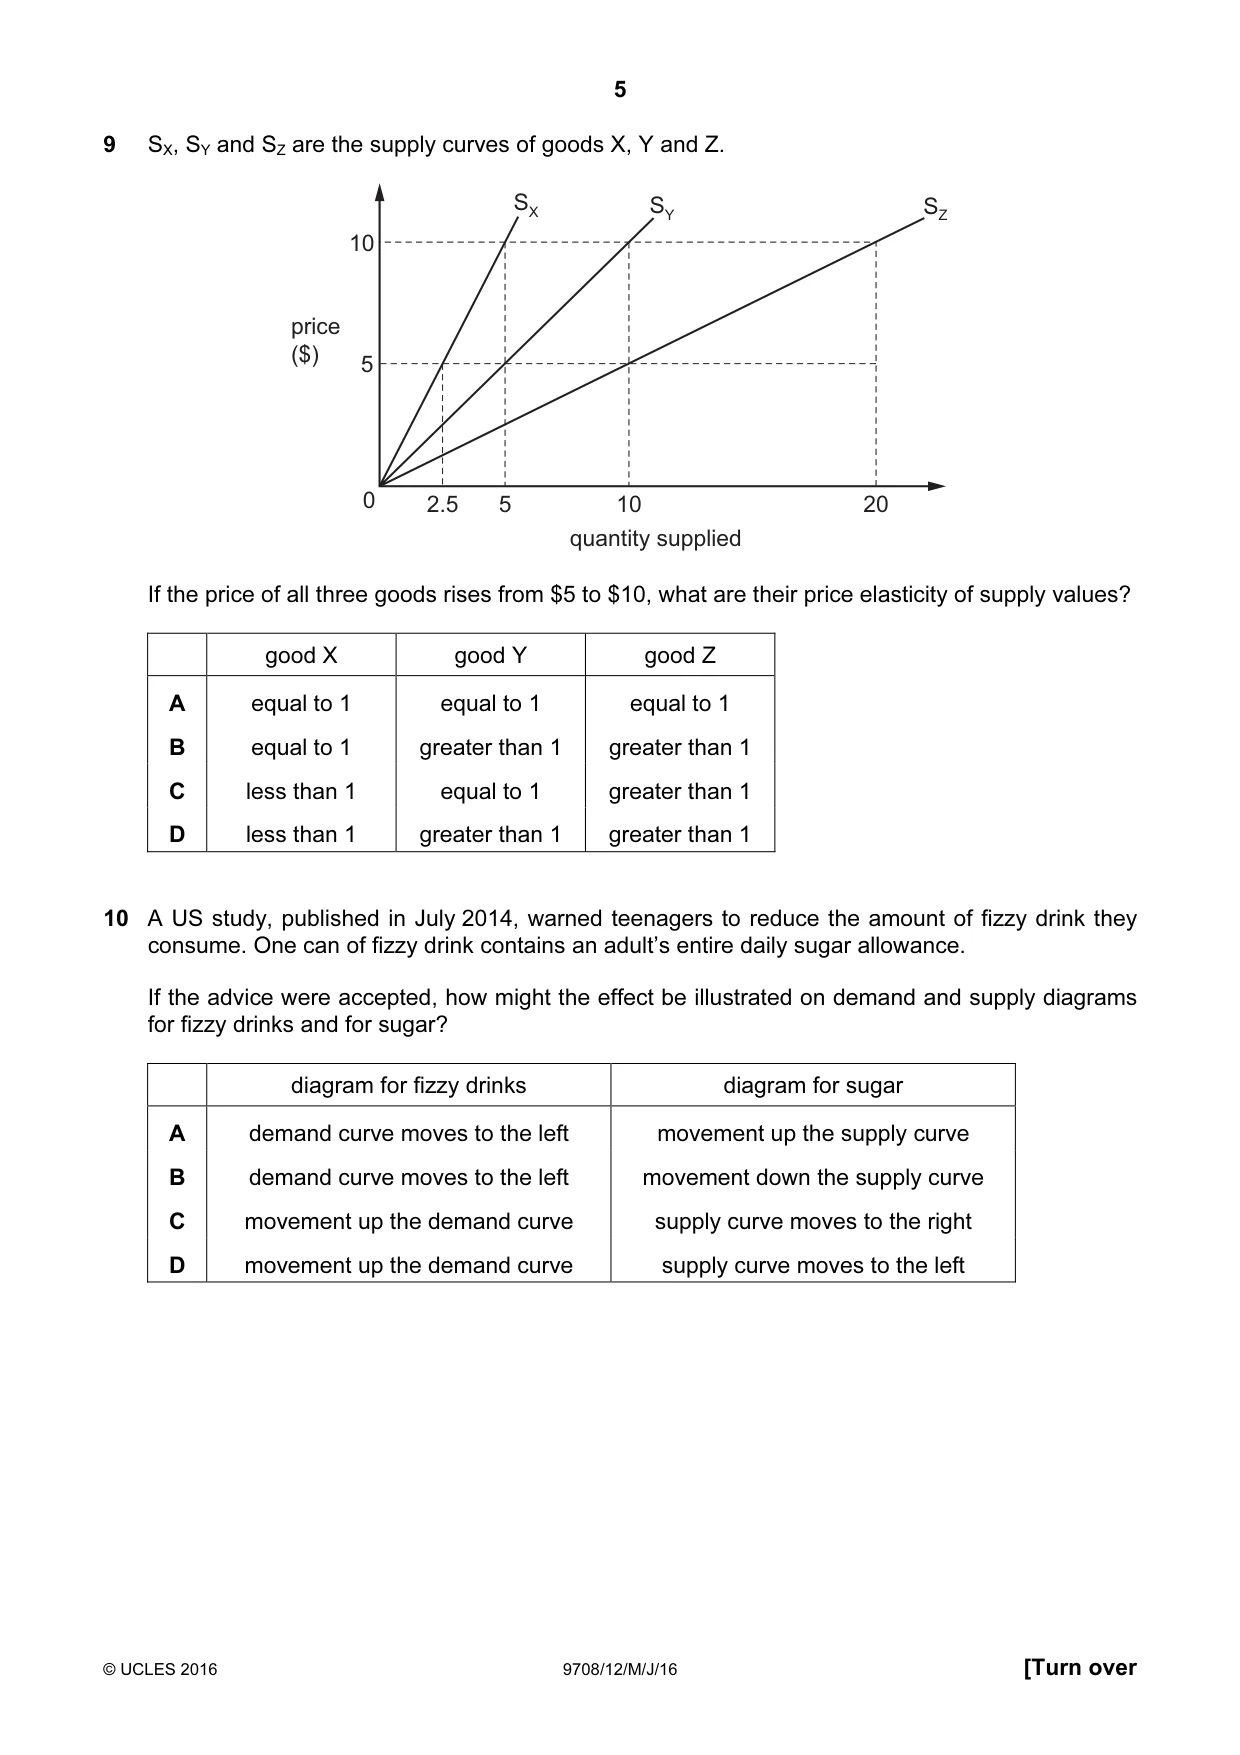
9 SX, SY and SZ are the supply curves of goods X, Y and Z. SX SY SZ 10 price ($) 5 0 2.5 5 10 20 quantity supplied If the price of all three goods rises from $5 to $10, what are their price elasticity of supply values? good X good Y good Z A equal to 1 equal to 1 equal to 1 B equal to 1 greater than 1 greater than 1 C less than 1 equal to 1 greater than 1 D less than 1 greater than 1 greater than 1
Mark scheme: A
Q10 · A US study, published in July 2014, warned teenagers to reduce the amount of fizzy drink…
10 A US study, published in July 2014, warned teenagers to reduce the amount of fizzy drink they consume. One can of fizzy drink contains an adult’s entire daily sugar allowance. If the advice were accepted, how might the effect be illustrated on demand and supply diagrams for fizzy drinks and for sugar? diagram for fizzy drinks diagram for sugar A demand curve moves to the left movement up the supply curve B demand curve moves to the left movement down the supply curve C movement up the demand curve supply curve moves to the right D movement up the demand curve supply curve moves to the left
Mark scheme: B
Q11 · In the diagram, the supply curve shows the number of spaces in a car park and the demand…
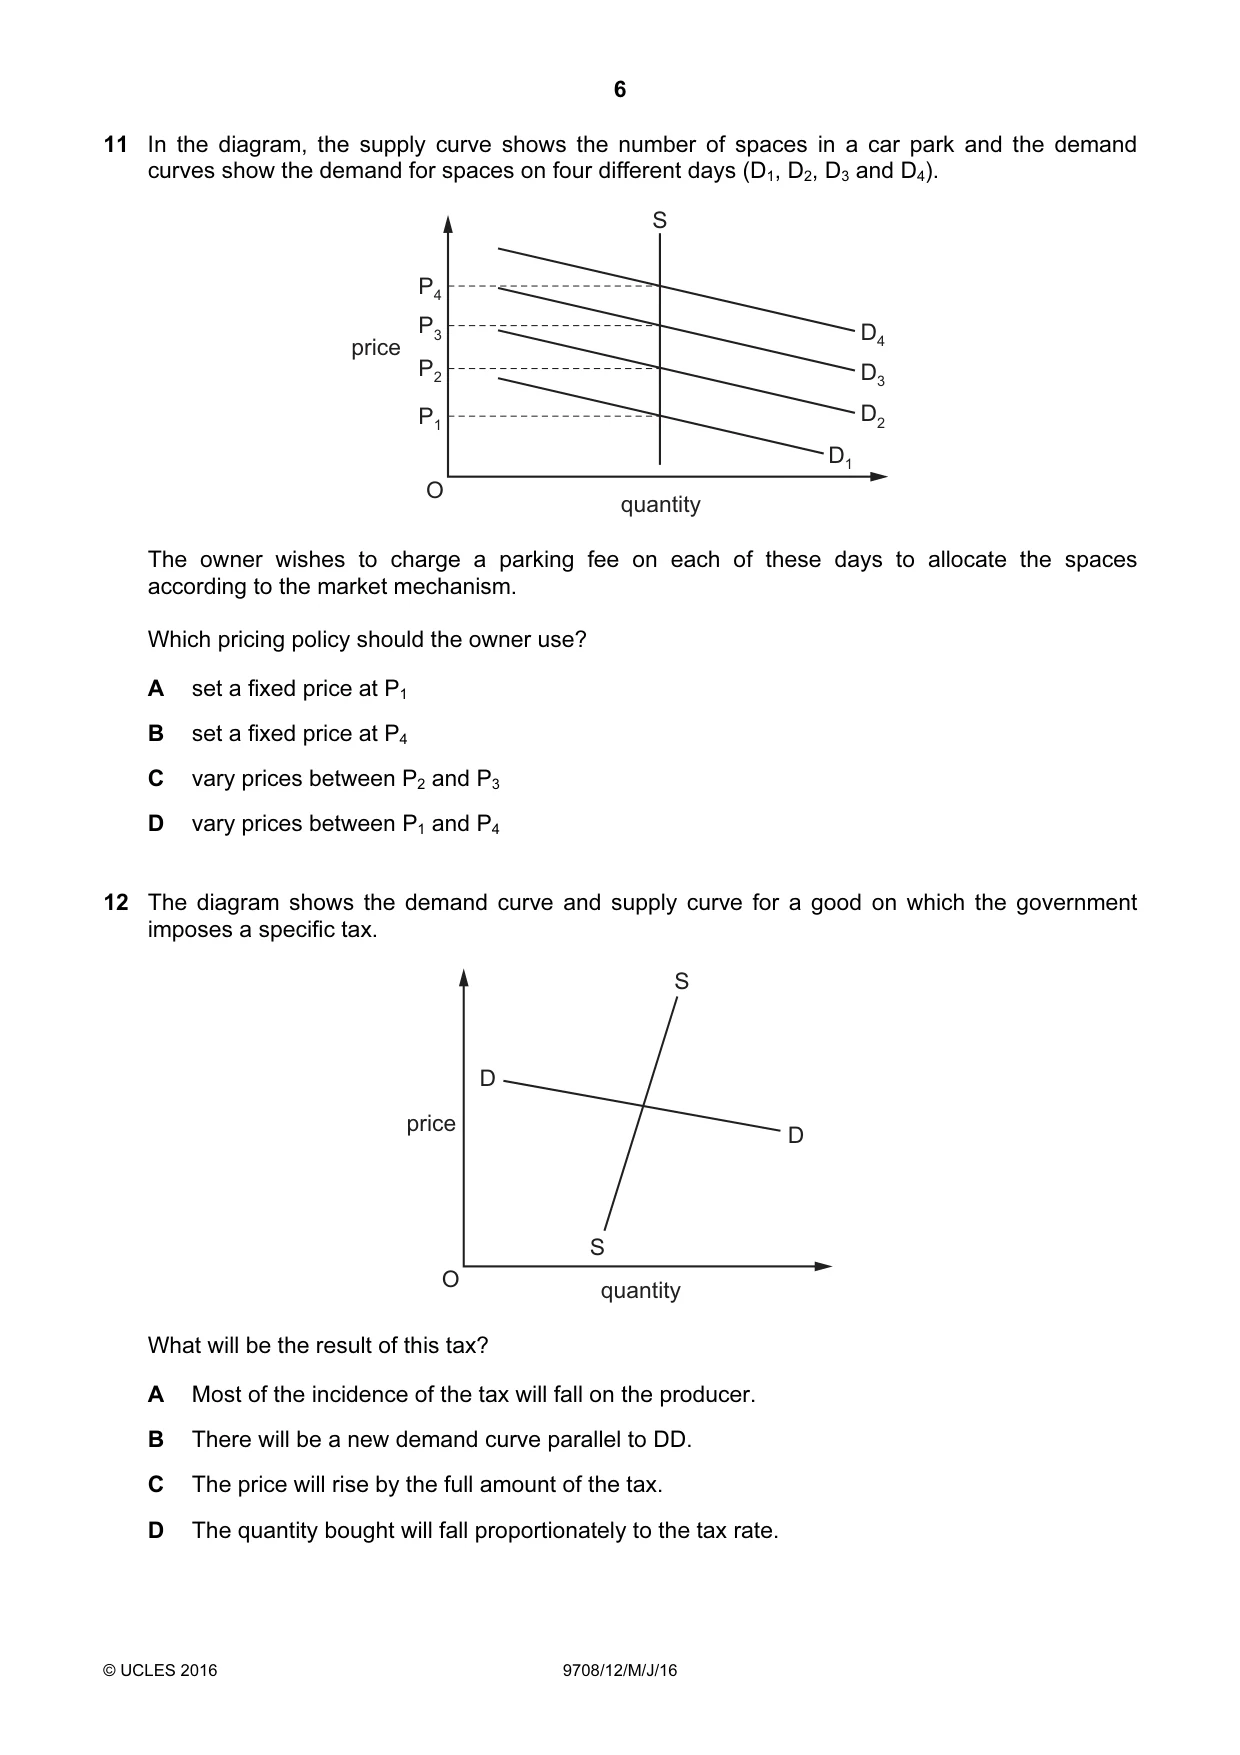
11 In the diagram, the supply curve shows the number of spaces in a car park and the demand curves show the demand for spaces on four different days (D1, D2, D3 and D4). S P4 P3 D4 price P2 D3 P1 D2 D1 O quantity The owner wishes to charge a parking fee on each of these days to allocate the spaces according to the market mechanism. Which pricing policy should the owner use? A set a fixed price at P1 B set a fixed price at P4 C vary prices between P2 and P3 D vary prices between P1 and P4
Mark scheme: D
Q12 · The diagram shows the demand curve and supply curve for a good on which the government…
12 The diagram shows the demand curve and supply curve for a good on which the government imposes a specific tax. S D price D S O quantity What will be the result of this tax? A Most of the incidence of the tax will fall on the producer. B There will be a new demand curve parallel to DD. C The price will rise by the full amount of the tax. D The quantity bought will fall proportionately to the tax rate.
Mark scheme: A
More questions on Methods and effects of government intervention in markets
Q13 · The diagram shows a consumer’s demand curve for a product
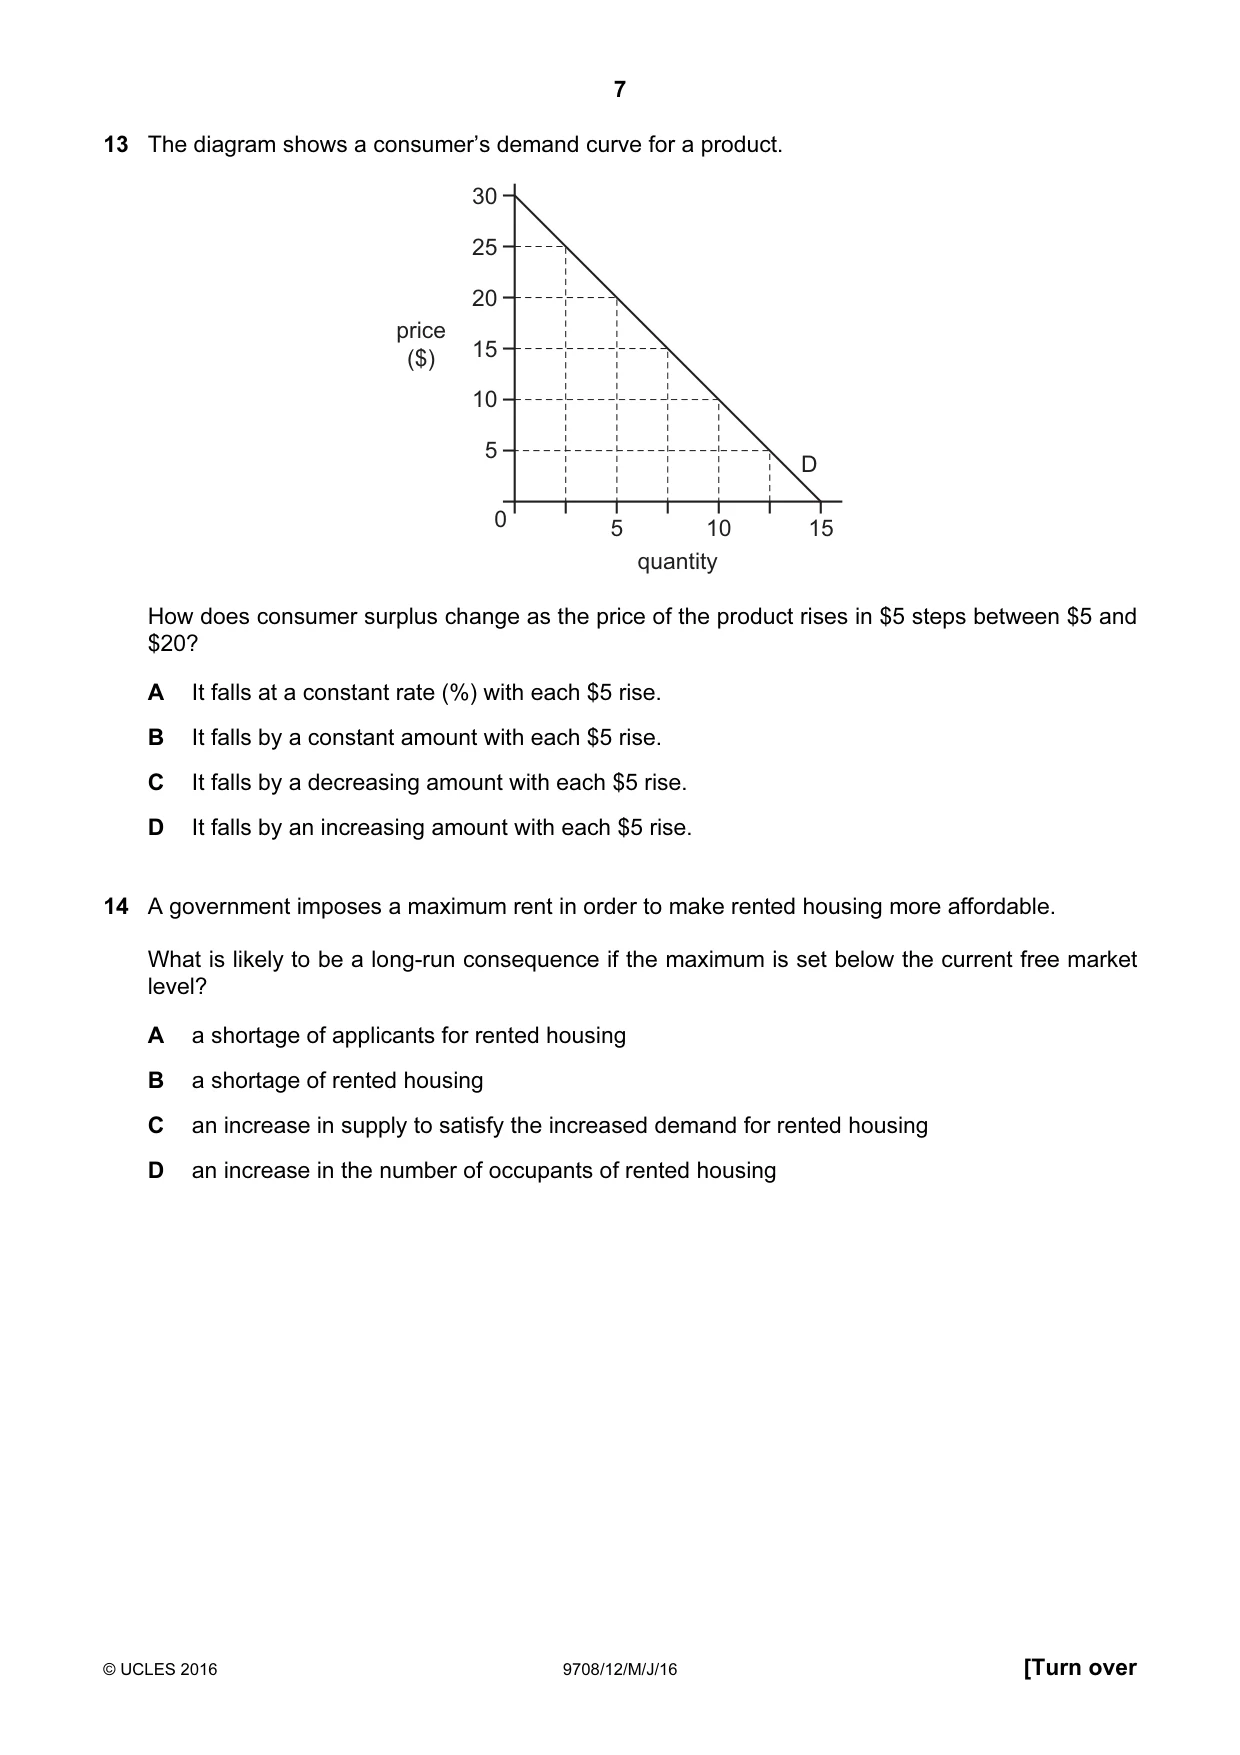
13 The diagram shows a consumer’s demand curve for a product. 30 25 20 price ($) 15 10 5 D 0 5 10 15 quantity How does consumer surplus change as the price of the product rises in $5 steps between $5 and $20? A It falls at a constant rate (%) with each $5 rise. B It falls by a constant amount with each $5 rise. C It falls by a decreasing amount with each $5 rise. D It falls by an increasing amount with each $5 rise.
Mark scheme: C
Q14 · A government imposes a maximum rent in order to make rented housing more affordable
14 A government imposes a maximum rent in order to make rented housing more affordable. What is likely to be a long-run consequence if the maximum is set below the current free market level? A a shortage of applicants for rented housing B a shortage of rented housing C an increase in supply to satisfy the increased demand for rented housing D an increase in the number of occupants of rented housing
Mark scheme: B
More questions on Methods and effects of government intervention in markets
Q15 · The diagram shows demand and supply curves for a good
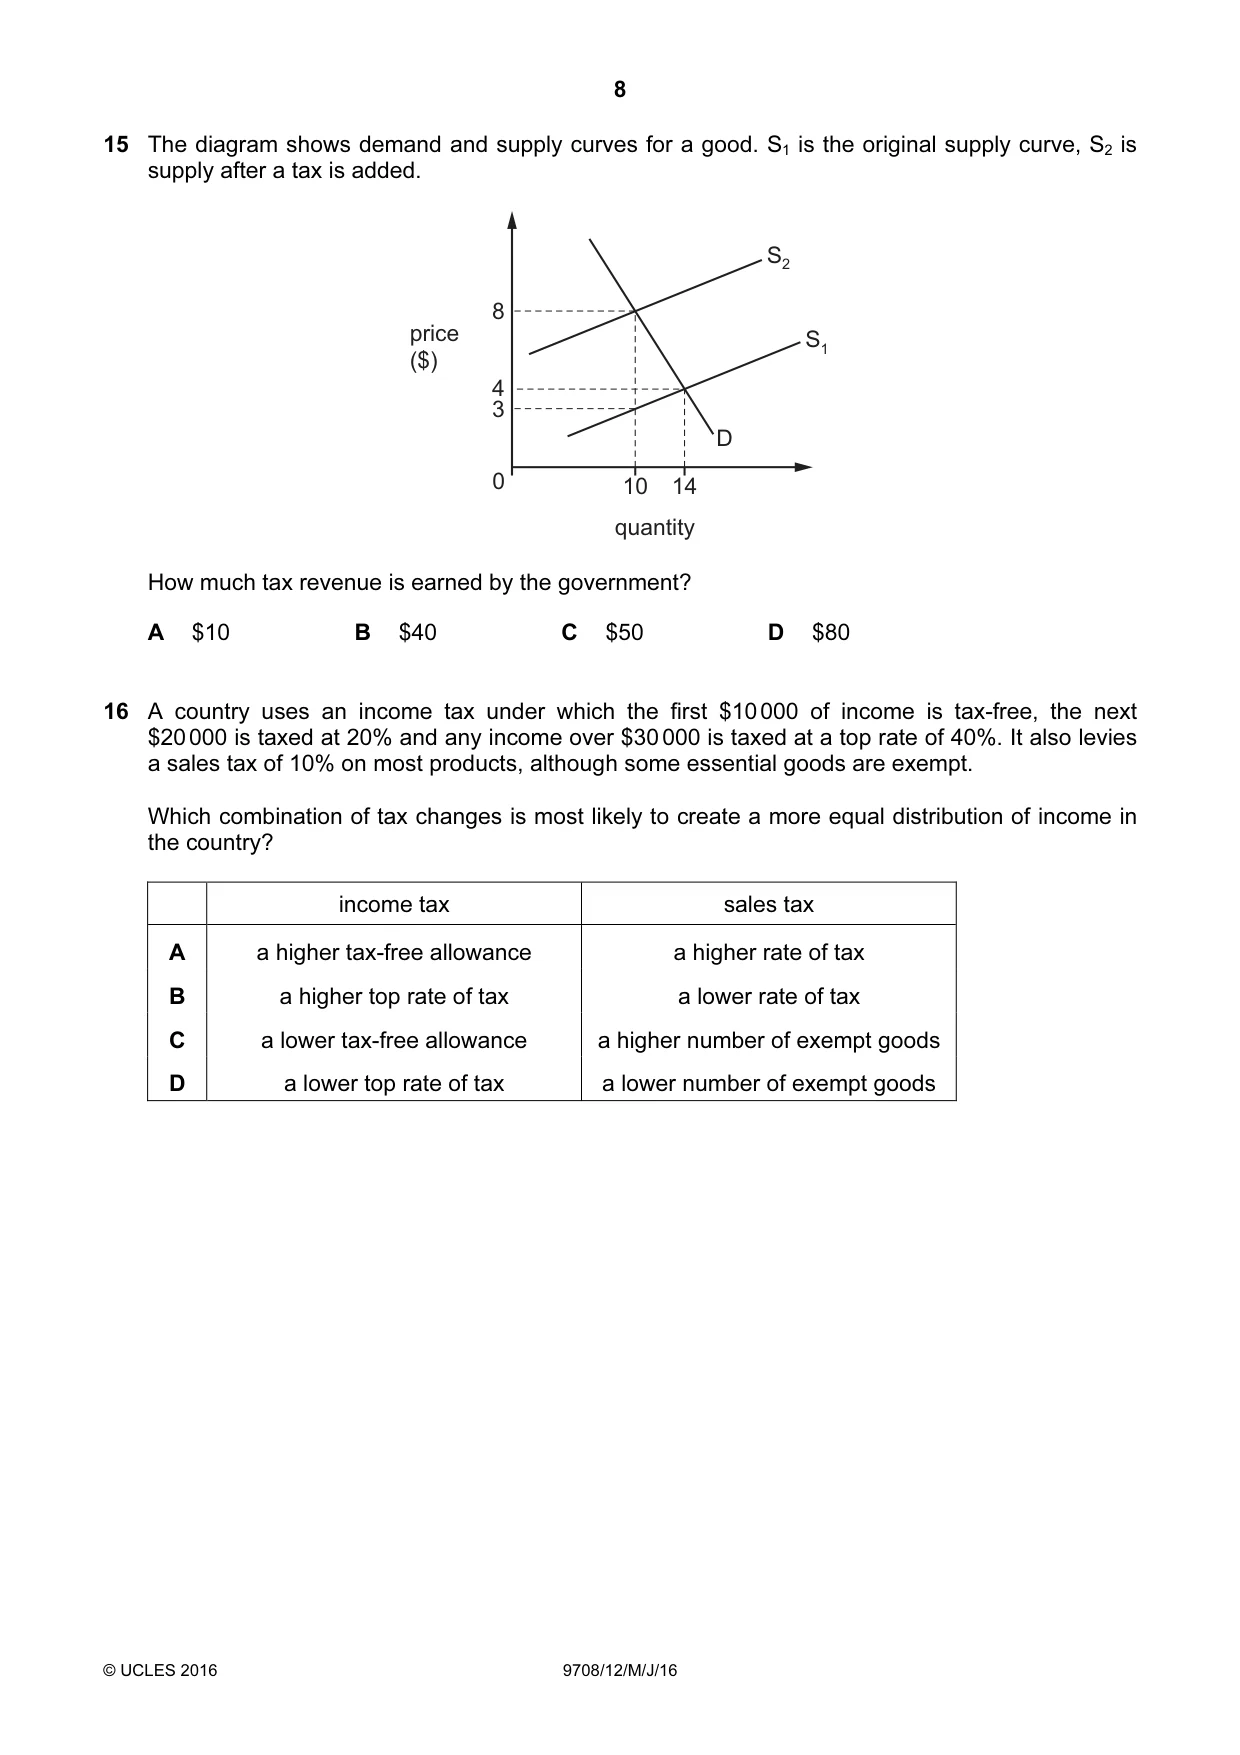
15 The diagram shows demand and supply curves for a good. S1 is the original supply curve, S2 is supply after a tax is added. S2 8 price S1 ($) 4 3 D 0 10 14 quantity How much tax revenue is earned by the government? A $10 B $40 C $50 D $80
Mark scheme: C
More questions on Methods and effects of government intervention in markets
Q16 · A country uses an income tax under which the first $10 000 of income is tax-free, the…
16 A country uses an income tax under which the first $10 000 of income is tax-free, the next $20 000 is taxed at 20% and any income over $30 000 is taxed at a top rate of 40%. It also levies a sales tax of 10% on most products, although some essential goods are exempt. Which combination of tax changes is most likely to create a more equal distribution of income in the country? income tax sales tax A a higher tax-free allowance a higher rate of tax B a higher top rate of tax a lower rate of tax C a lower tax-free allowance a higher number of exempt goods D a lower top rate of tax a lower number of exempt goods
Mark scheme: B
Q17 · In the diagram, DD is the demand curve for an agricultural commodity, S1 is the supply…
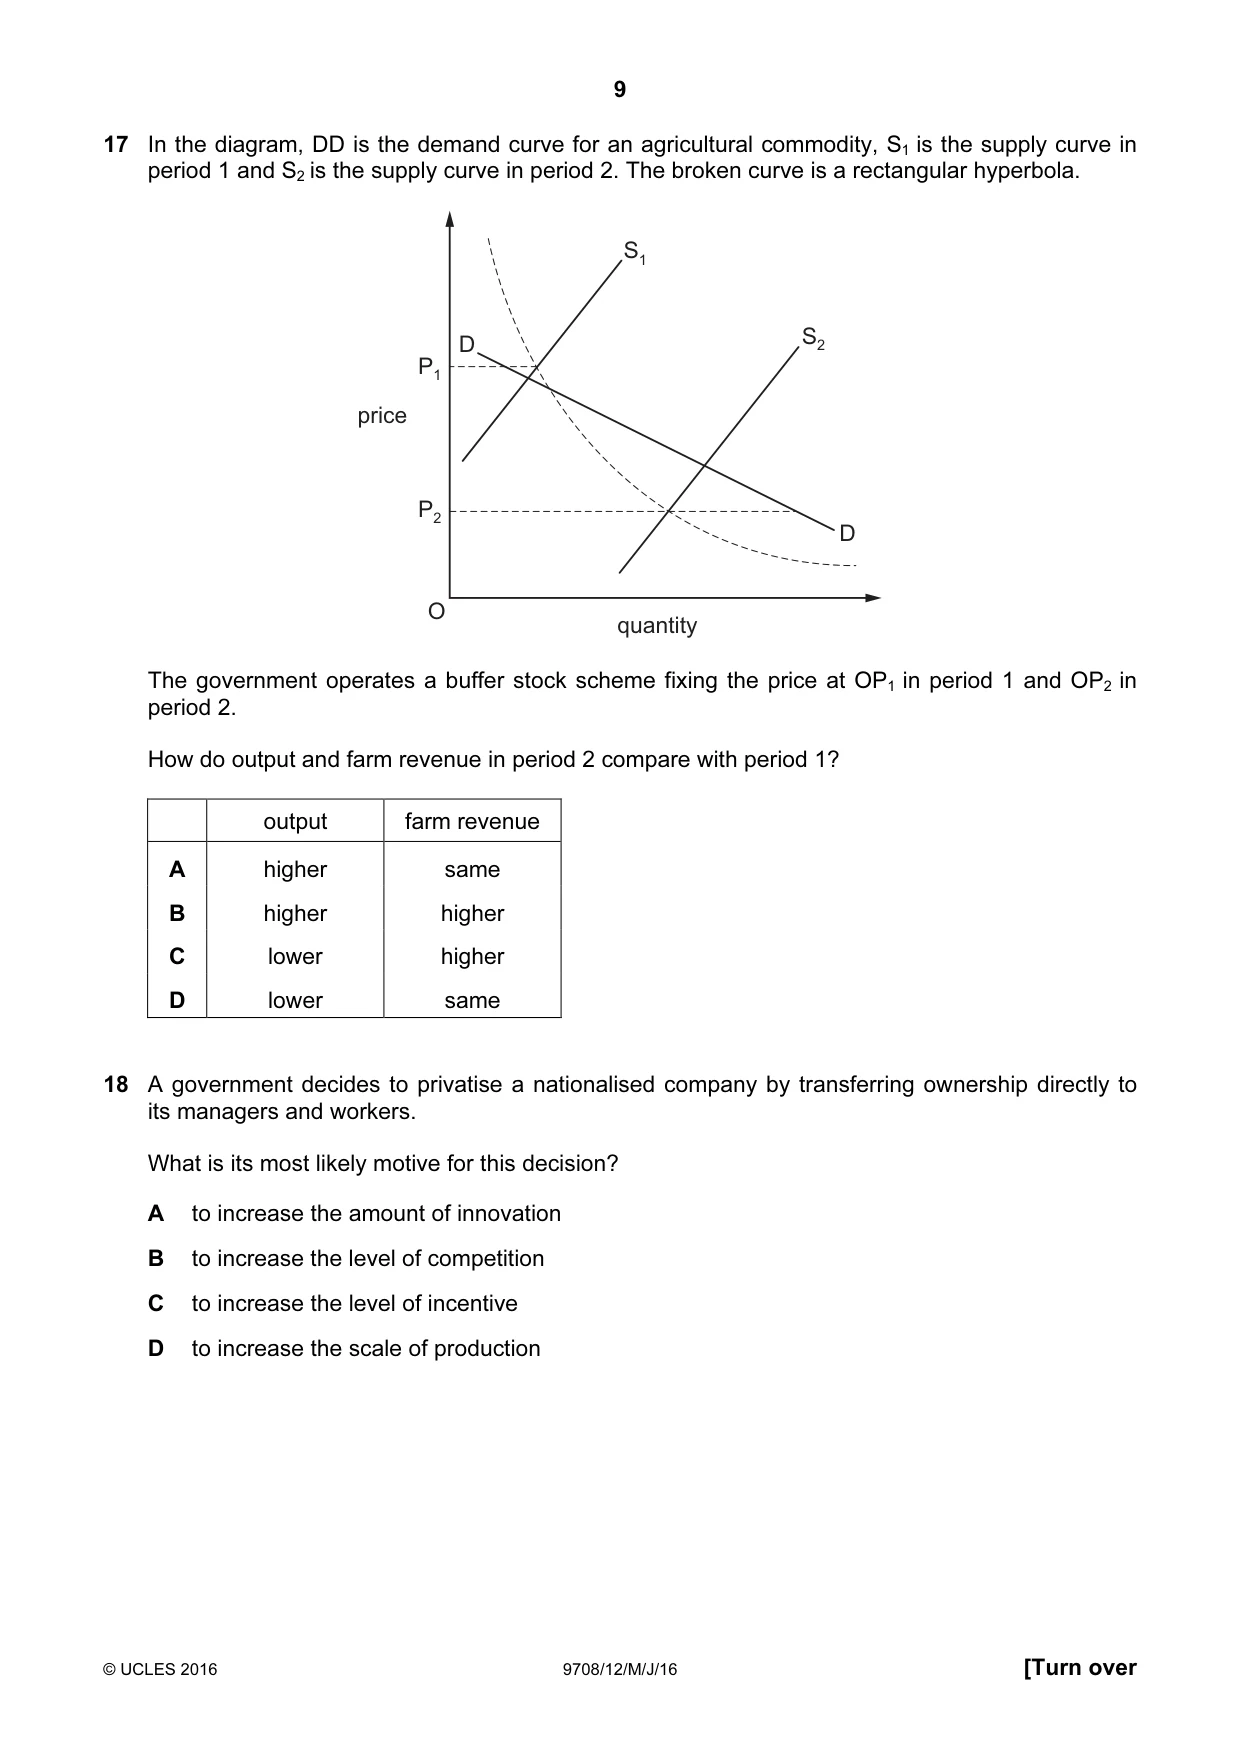
17 In the diagram, DD is the demand curve for an agricultural commodity, S1 is the supply curve in period 1 and S2 is the supply curve in period 2. The broken curve is a rectangular hyperbola. S1 D S2 P1 price P2 D O quantity The government operates a buffer stock scheme fixing the price at OP1 in period 1 and OP2 in period 2. How do output and farm revenue in period 2 compare with period 1? output farm revenue A higher same B higher higher C lower higher D lower same
Mark scheme: A
More questions on Methods and effects of government intervention in markets
Q18 · A government decides to privatise a nationalised company by transferring ownership…
18 A government decides to privatise a nationalised company by transferring ownership directly to its managers and workers. What is its most likely motive for this decision? A to increase the amount of innovation B to increase the level of competition C to increase the level of incentive D to increase the scale of production
Mark scheme: C
More questions on Methods and effects of government intervention in markets
Q19 · In 2012, high street shops reported a fall in sales as domestic demand in an economy fell
19 In 2012, high street shops reported a fall in sales as domestic demand in an economy fell. However, the impact on the overall economy was not as unfavourable as was first feared. What might have lessened the impact on the economy? A Exports increased. B Imports increased. C Savings increased. D Taxes increased.
Mark scheme: A
More questions on Aggregate Demand and Aggregate Supply analysis
Q20 · An economy is initially in equilibrium at point X in the diagram
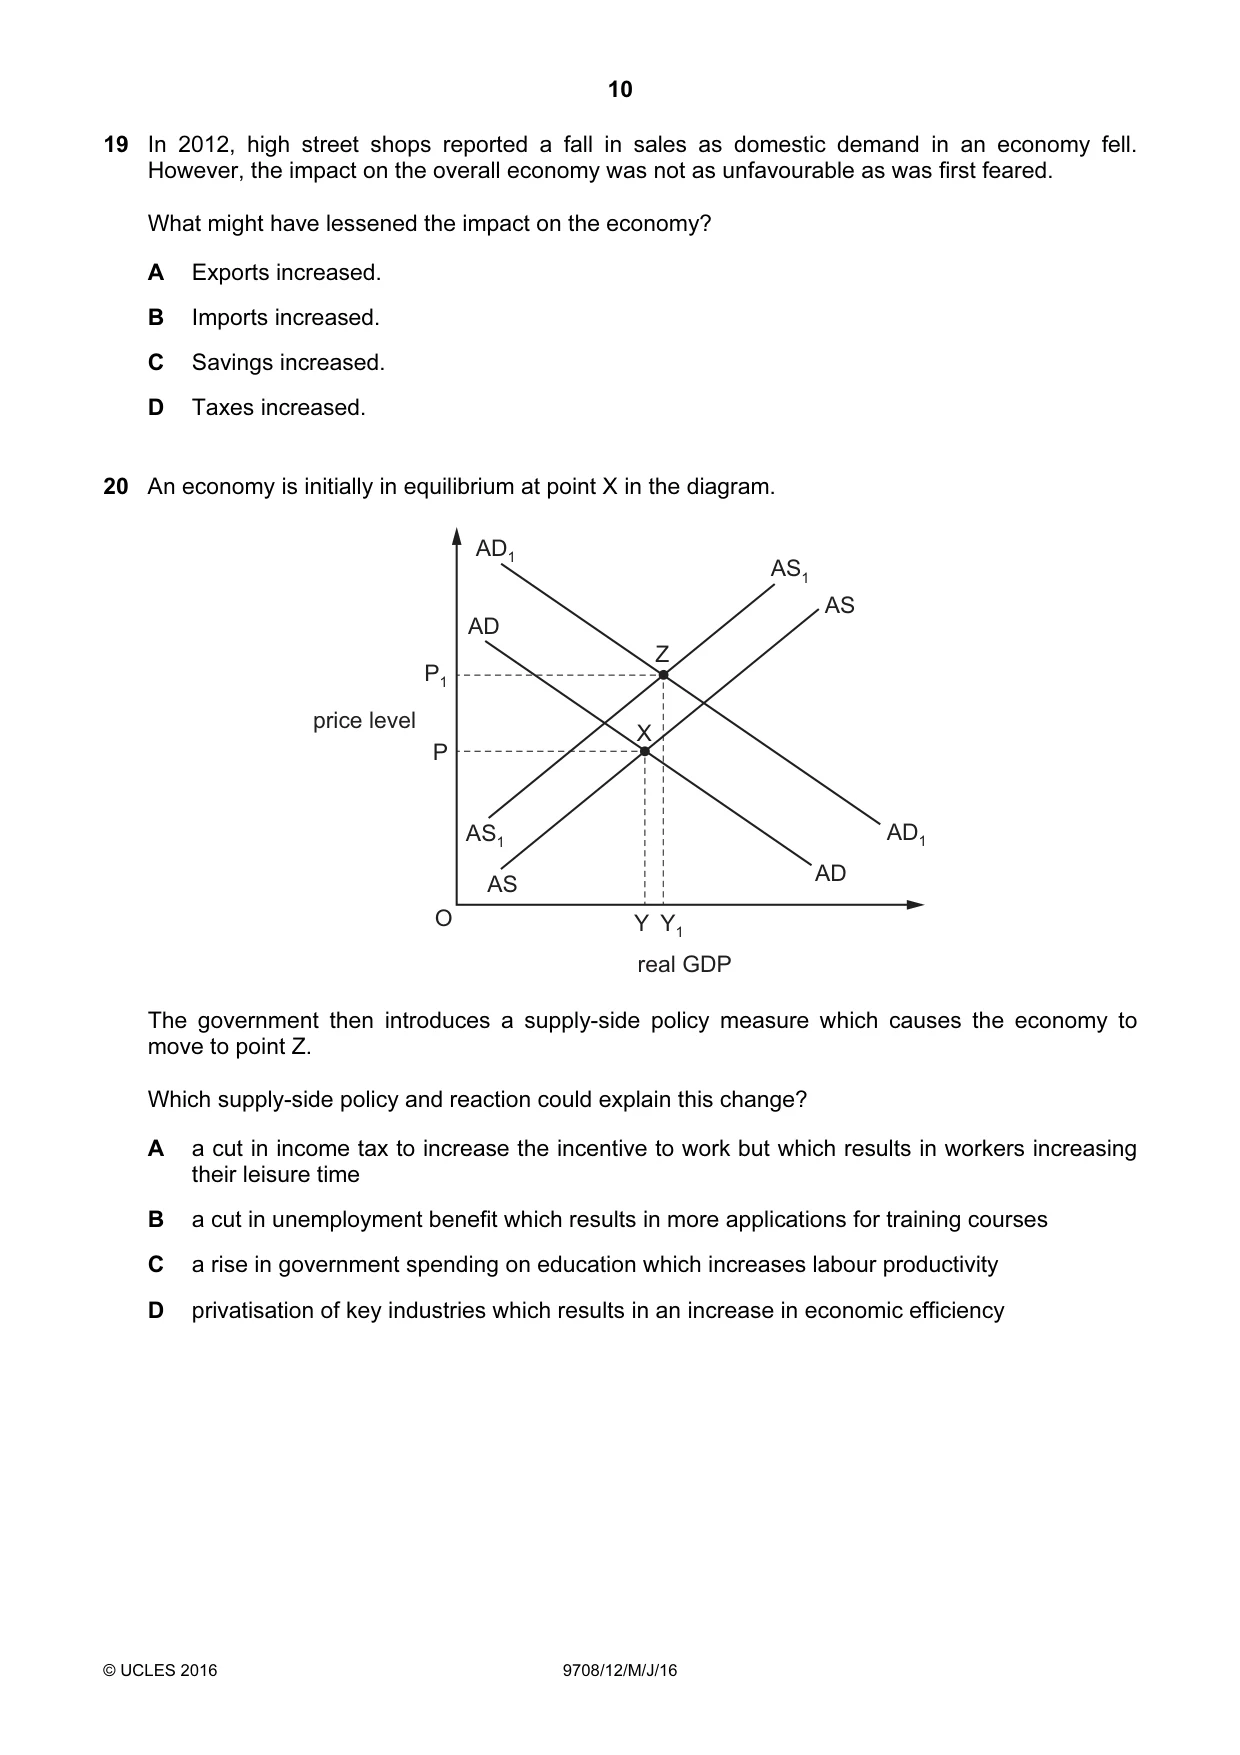
20 An economy is initially in equilibrium at point X in the diagram. AD1 AS1 AS AD Z P1 price level X P AS1 AD1 AD AS O Y Y1 real GDP The government then introduces a supply-side policy measure which causes the economy to move to point Z. Which supply-side policy and reaction could explain this change? A a cut in income tax to increase the incentive to work but which results in workers increasing their leisure time B a cut in unemployment benefit which results in more applications for training courses C a rise in government spending on education which increases labour productivity D privatisation of key industries which results in an increase in economic efficiency
Mark scheme: A
Q21 · A country experienced an annual deflation rate of 2% for four successive years
21 A country experienced an annual deflation rate of 2% for four successive years. Which statement is correct for the four-year period? A The price level fell by 8%. B The price level fell by less than 8%. C The real value of money fell by 8%. D The real value of money fell by less than 8%.
Mark scheme: B
Q22 · In July 2013, orders for durable US manufactured goods from computers to aircraft fell…
22 In July 2013, orders for durable US manufactured goods from computers to aircraft fell 7.3%, the biggest fall for a year. What might explain this change in trade and how would it have affected the US balance of payments? reason for change effect on balance of payments A an expansion in domestic production increased outflow in the current account B an expansion in foreign markets reduced inflow in the financial account C a recession in domestic production increased outflow in the financial account D a recession in foreign markets reduced inflow in the current account
Mark scheme: D
More questions on Current account of the balance of payments
Q23 · The following exchange rates were recorded in the foreign exchange market
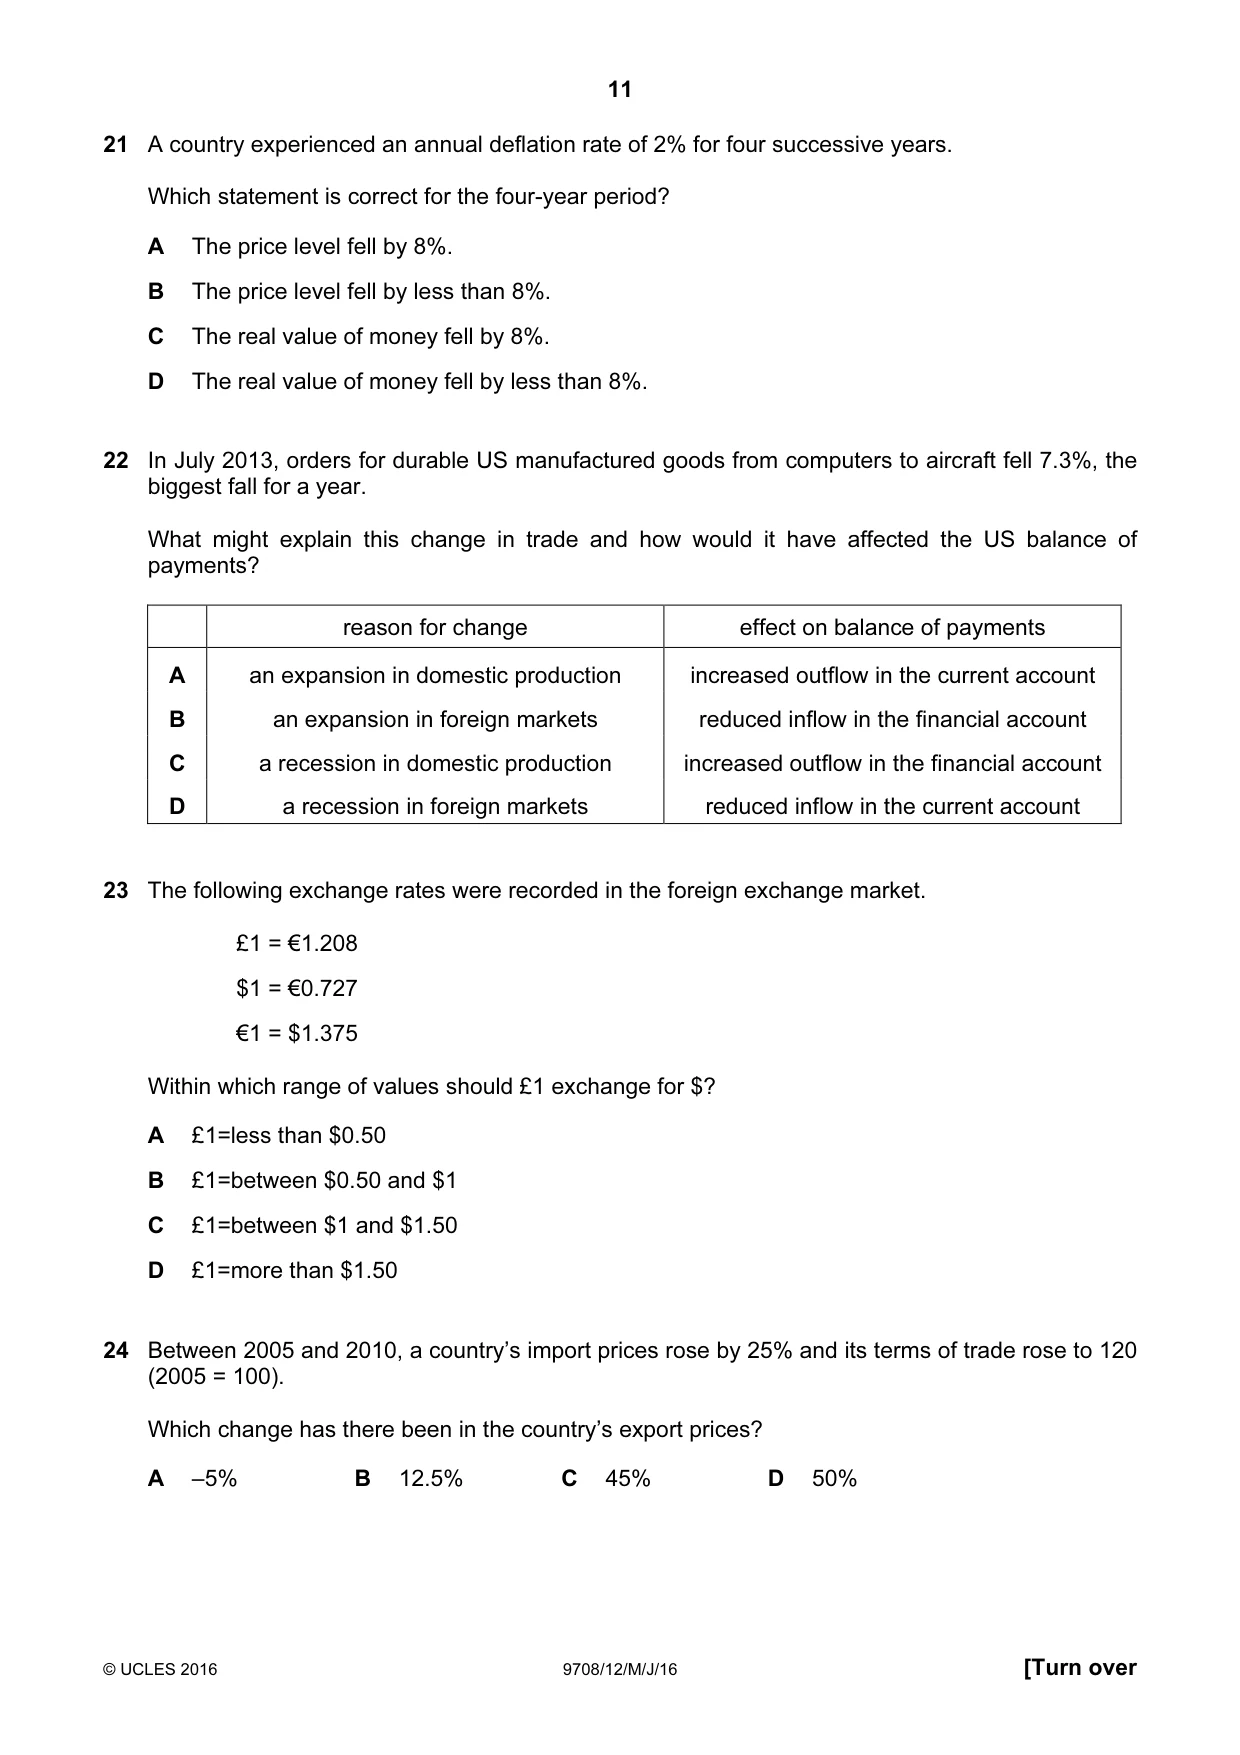
23 The following exchange rates were recorded in the foreign exchange market. £1 = €1.208 $1 = €0.727 €1 = $1.375 Within which range of values should £1 exchange for $? A £1=less than $0.50 B £1=between $0.50 and $1 C £1=between $1 and $1.50 D £1=more than $1.50
Mark scheme: D
Q24 · Between 2005 and 2010, a country’s import prices rose by 25% and its terms of trade rose…
24 Between 2005 and 2010, a country’s import prices rose by 25% and its terms of trade rose to 120 (2005 = 100). Which change has there been in the country’s export prices? A –5% B 12.5% C 45% D 50%
Mark scheme: D
Q25 · The diagram shows production possibility curves for two countries, X and Y
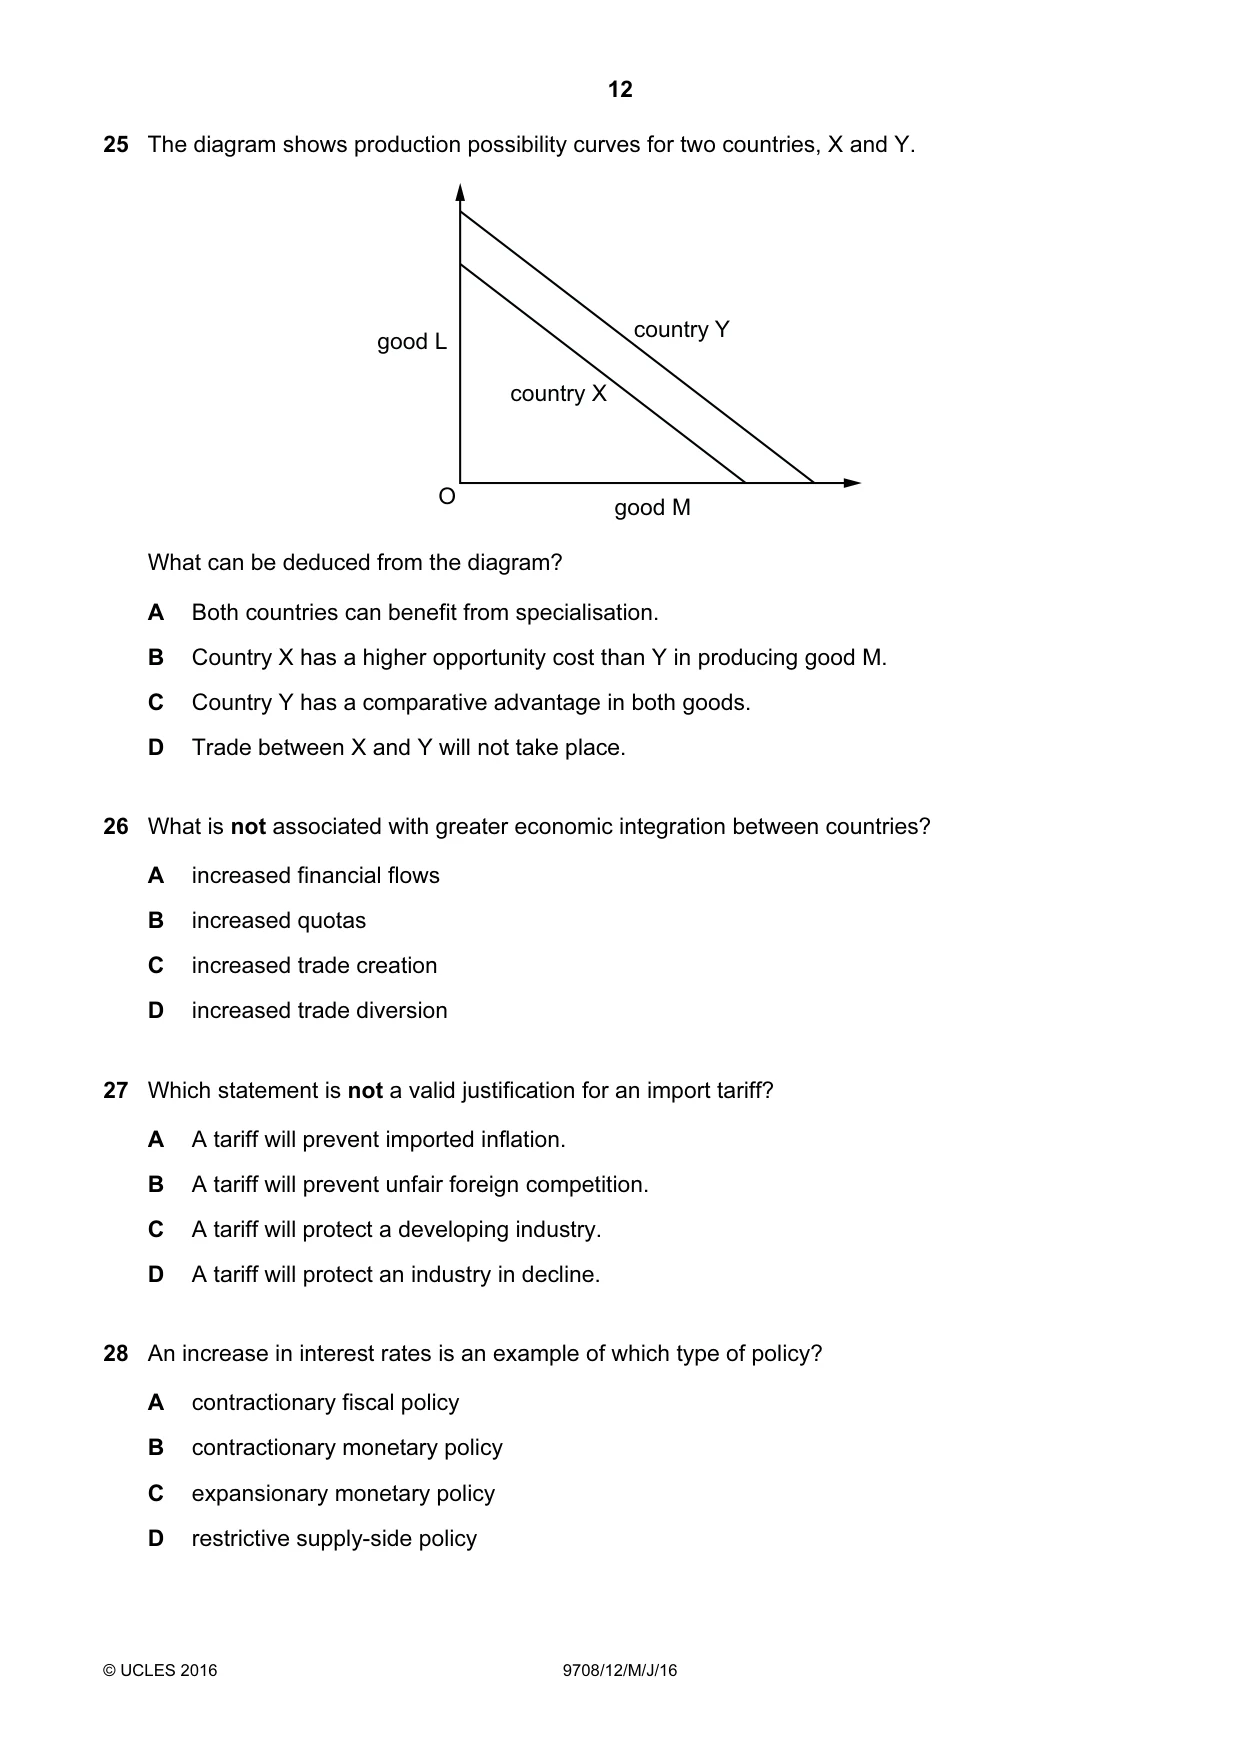
25 The diagram shows production possibility curves for two countries, X and Y. country Y good L country X O good M What can be deduced from the diagram? A Both countries can benefit from specialisation. B Country X has a higher opportunity cost than Y in producing good M. C Country Y has a comparative advantage in both goods. D Trade between X and Y will not take place.
Mark scheme: D
Q26 · What is not associated with greater economic integration between countries?
26 What is not associated with greater economic integration between countries? A increased financial flows B increased quotas C increased trade creation D increased trade diversion
Mark scheme: B
Q27 · Which statement is not a valid justification for an import tariff?
27 Which statement is not a valid justification for an import tariff? A A tariff will prevent imported inflation. B A tariff will prevent unfair foreign competition. C A tariff will protect a developing industry. D A tariff will protect an industry in decline.
Mark scheme: A
Q28 · An increase in interest rates is an example of which type of policy?
28 An increase in interest rates is an example of which type of policy? A contractionary fiscal policy B contractionary monetary policy C expansionary monetary policy D restrictive supply-side policy
Mark scheme: B
Q29 · Possible policies a government might use to reduce a deficit on the current account of…
29 Possible policies a government might use to reduce a deficit on the current account of the balance of payments include devaluation, government spending cuts, interest rate rises and tariffs. Which two policies would be classified as expenditure-reducing ? A devaluation and government spending cuts B government spending cuts and interest rate rises C interest rate rises and tariffs D tariffs and devaluation
Mark scheme: B
More questions on Policies to correct imbalances in the current account of the balance of payments
Q30 · Which policy, adopted by a government with the intention of reducing the rate of…
30 Which policy, adopted by a government with the intention of reducing the rate of inflation, might cause a greater deficit on the balance of payments? A higher foreign exchange rates for its currency B higher interest rates for domestic customers C higher subsidies to domestic producers D higher tax rates on consumer incomes
Mark scheme: A
More questions on Current account of the balance of payments
What was in this paper
The subtopics covered by these 30 questions, and how many questions each got. Open one in a new tab to see every Cambridge question on it.
5Current account of the balance of payments2Demand and supply curves2Price elasticity, income elasticity and cross elasticity of demand2Protectionism2The interaction of demand and supply2Addressing income and wealth inequality1Aggregate Demand and Aggregate Supply analysis1Consumer and producer surplus1Exchange rates1Exchange rates1Factors of production1Monetary policy1Money and banking1Policies to correct imbalances in the current account of the balance of payments1Price elasticity of supply1Price stability1Production possibility curves1Scarcity, choice and opportunity cost1Supply-side policy1The reasons for international trade1What you needed in this session
Cambridge’s own grade thresholds for 2016 May/June, Paper 1 · Variant 2. A higher threshold means an easier paper — the bar moves with how the cohort did.