Cambridge A Level Economics 9708 — 2011 May/June Paper 1 · Variant 1
9708/11/M/J/11 · 30 questions · 30 marks · ≈34 min
The question paper and its mark scheme, free to read here and free to download. This is Cambridge’s own paper, exactly as it was sat.
Question paper12 pages
Mark scheme2 pages
Answers below. Sit the paper first if you are practising.
Questions as text
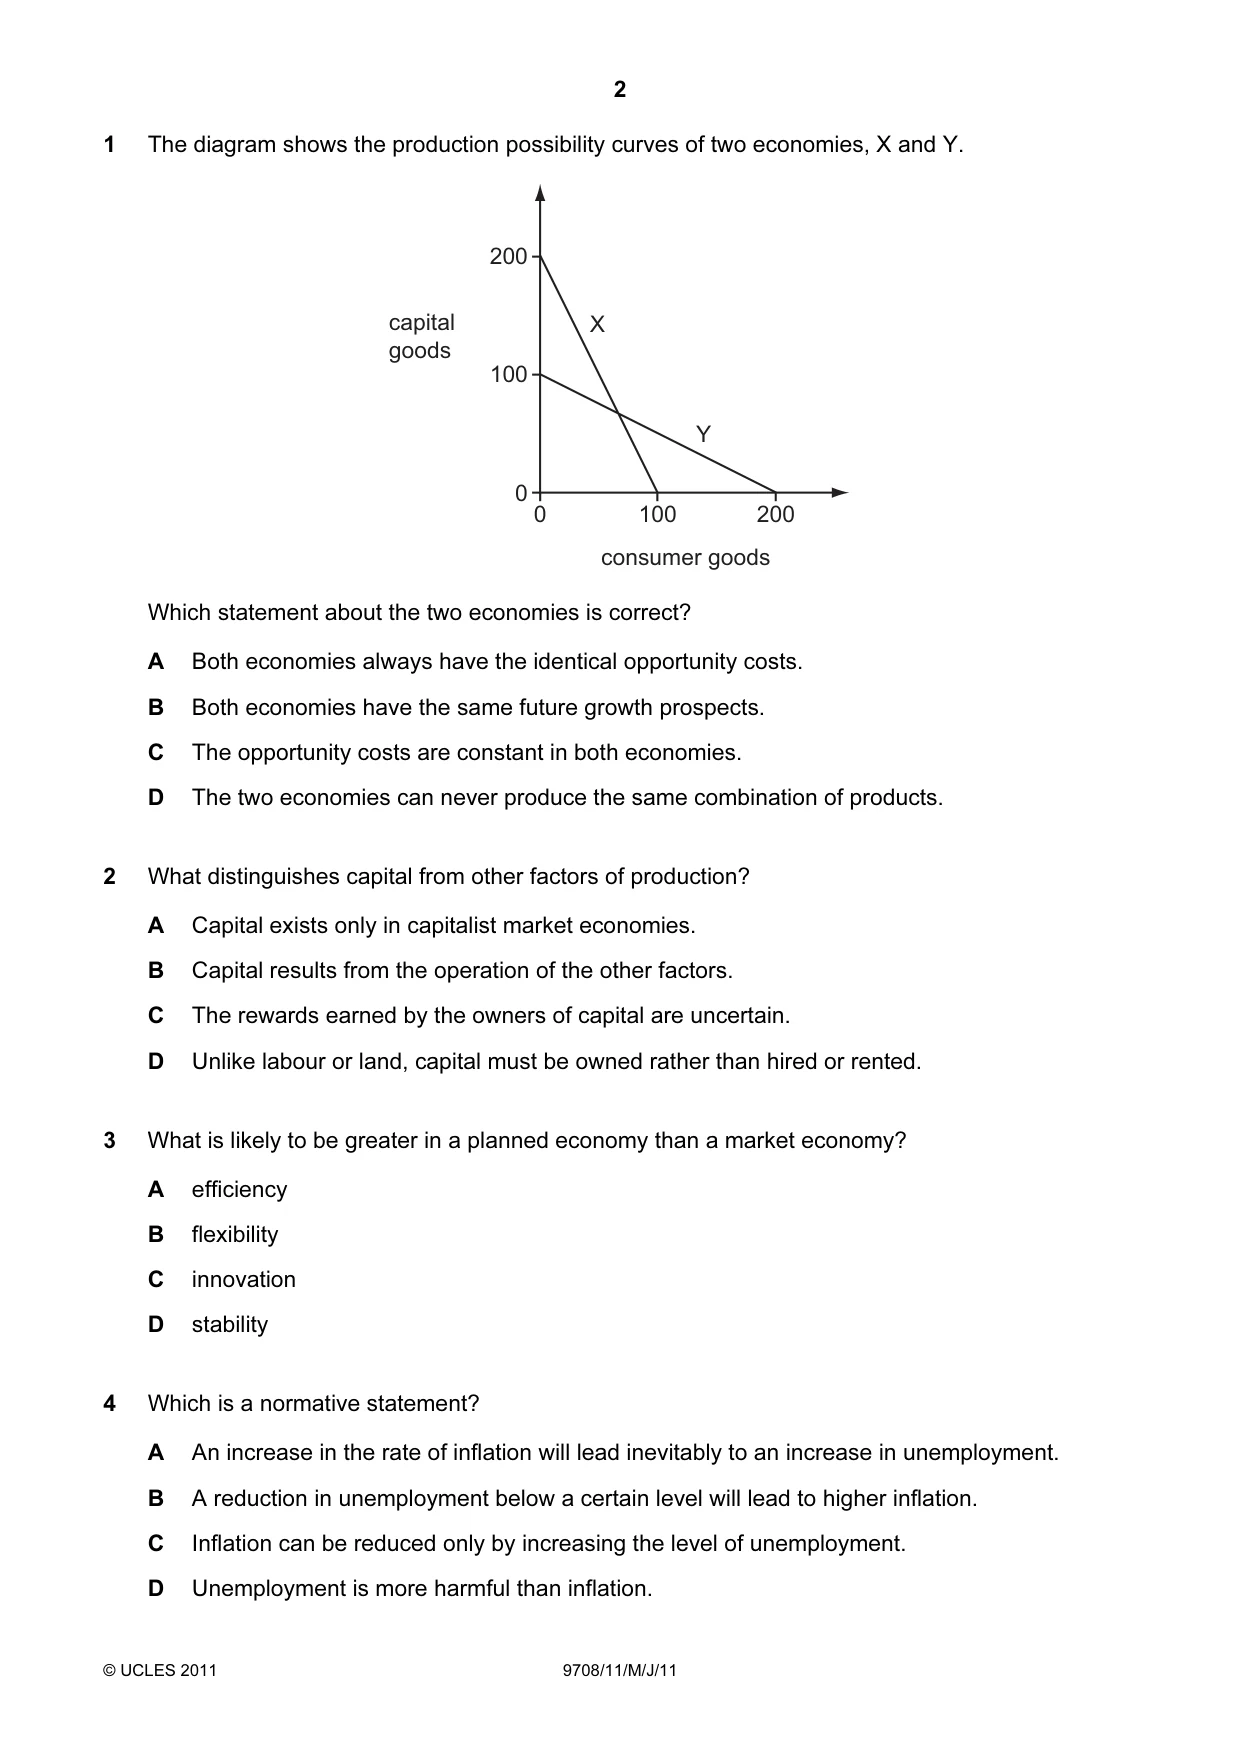
Q1 · The diagram shows the production possibility curves of two economies, X and Y
1 The diagram shows the production possibility curves of two economies, X and Y. 200 capital X goods 100 Y 0 0 100 200 consumer goods Which statement about the two economies is correct? A Both economies always have the identical opportunity costs. B Both economies have the same future growth prospects. C The opportunity costs are constant in both economies. D The two economies can never produce the same combination of products.
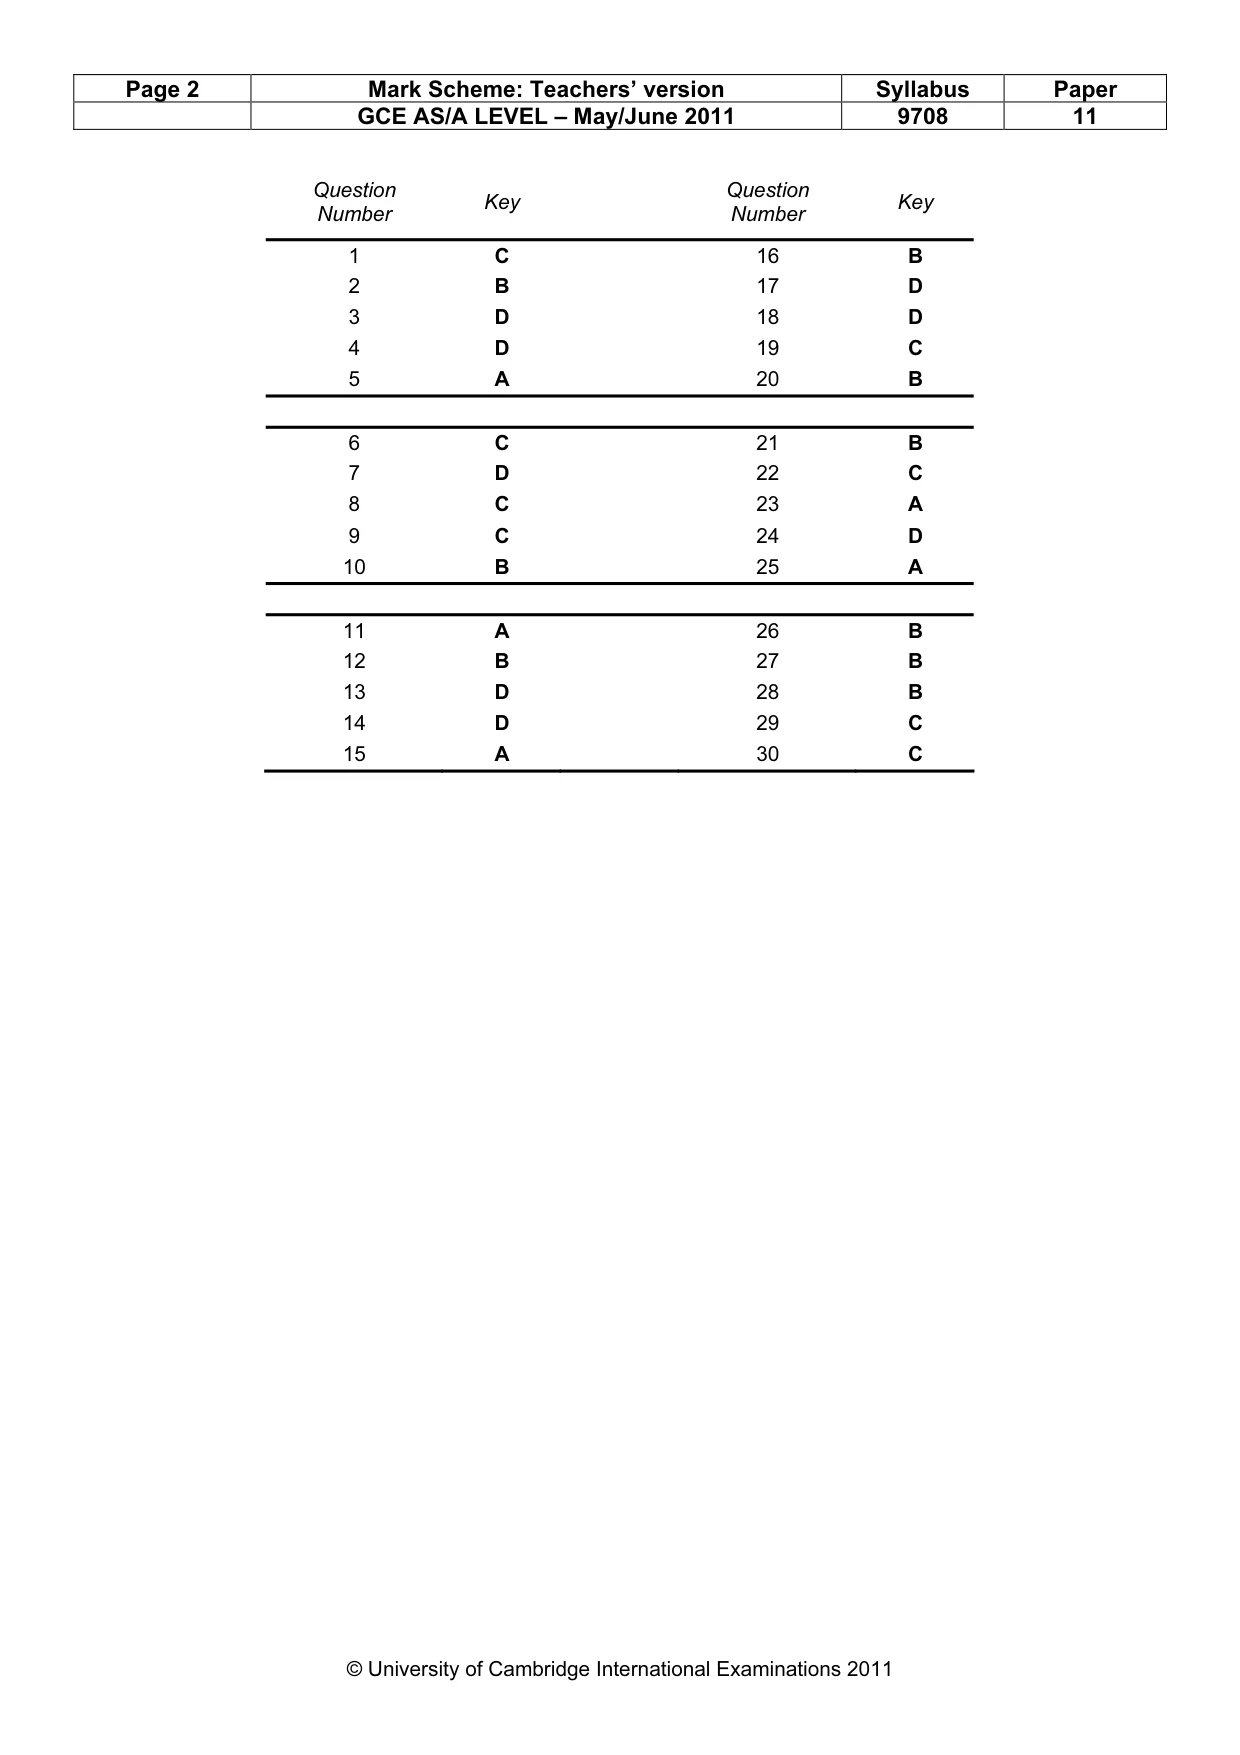
Mark scheme: C
Q2 · What distinguishes capital from other factors of production?
2 What distinguishes capital from other factors of production? A Capital exists only in capitalist market economies. B Capital results from the operation of the other factors. C The rewards earned by the owners of capital are uncertain. D Unlike labour or land, capital must be owned rather than hired or rented.
Mark scheme: B
Q3 · What is likely to be greater in a planned economy than a market economy?
3 What is likely to be greater in a planned economy than a market economy? A efficiency B flexibility C innovation D stability
Mark scheme: D
More questions on Resource allocation in different economic systems
Q4 · Which is a normative statement?
4 Which is a normative statement? A An increase in the rate of inflation will lead inevitably to an increase in unemployment. B A reduction in unemployment below a certain level will lead to higher inflation. C Inflation can be reduced only by increasing the level of unemployment. D Unemployment is more harmful than inflation.
Mark scheme: D
Q5 · What is consistent with an individual demand curve that slopes down from left to right?
5 What is consistent with an individual demand curve that slopes down from left to right? A As price falls, a person switches away from rival products towards the product. B As price falls, a person’s willingness and ability to buy the product will decline. C As price rises, a person becomes less sensitive to price changes. D As price rises, a person’s opportunity cost of purchasing the product falls.
Mark scheme: A
Q6 · What will cause the demand curve for domestically produced cars to shift to the left?
6 What will cause the demand curve for domestically produced cars to shift to the left? A an increase in the costs of production of domestically produced cars B a reduction in taxes on the purchase of cars C a reduction in the tariff on imported cars D a reduction in the tax on petrol
Mark scheme: C
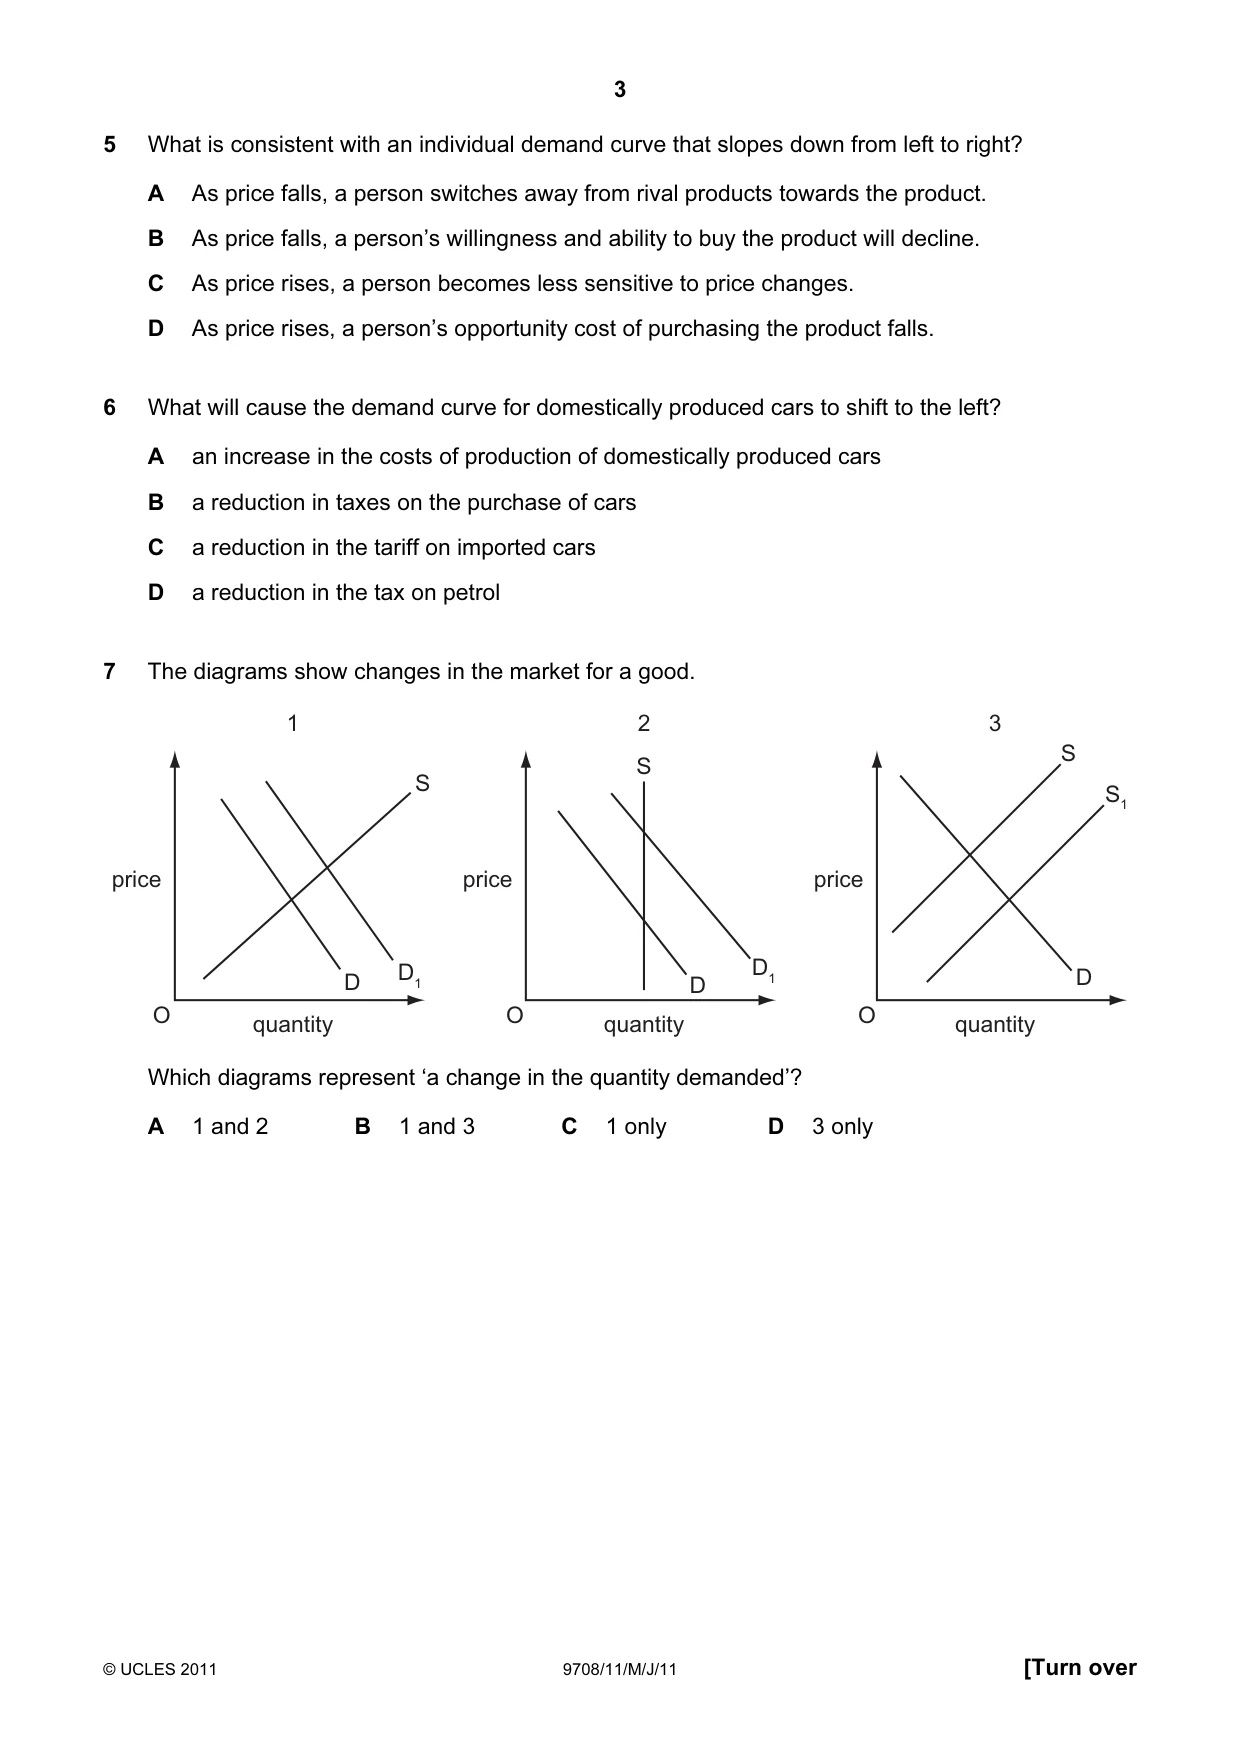
Q7 · The diagrams show changes in the market for a good
7 The diagrams show changes in the market for a good. 1 2 3 S S S S1 price price price D1 D1 D D D O quantity O quantity O quantity Which diagrams represent ‘a change in the quantity demanded’? A 1 and 2 B 1 and 3 C 1 only D 3 only
Mark scheme: D
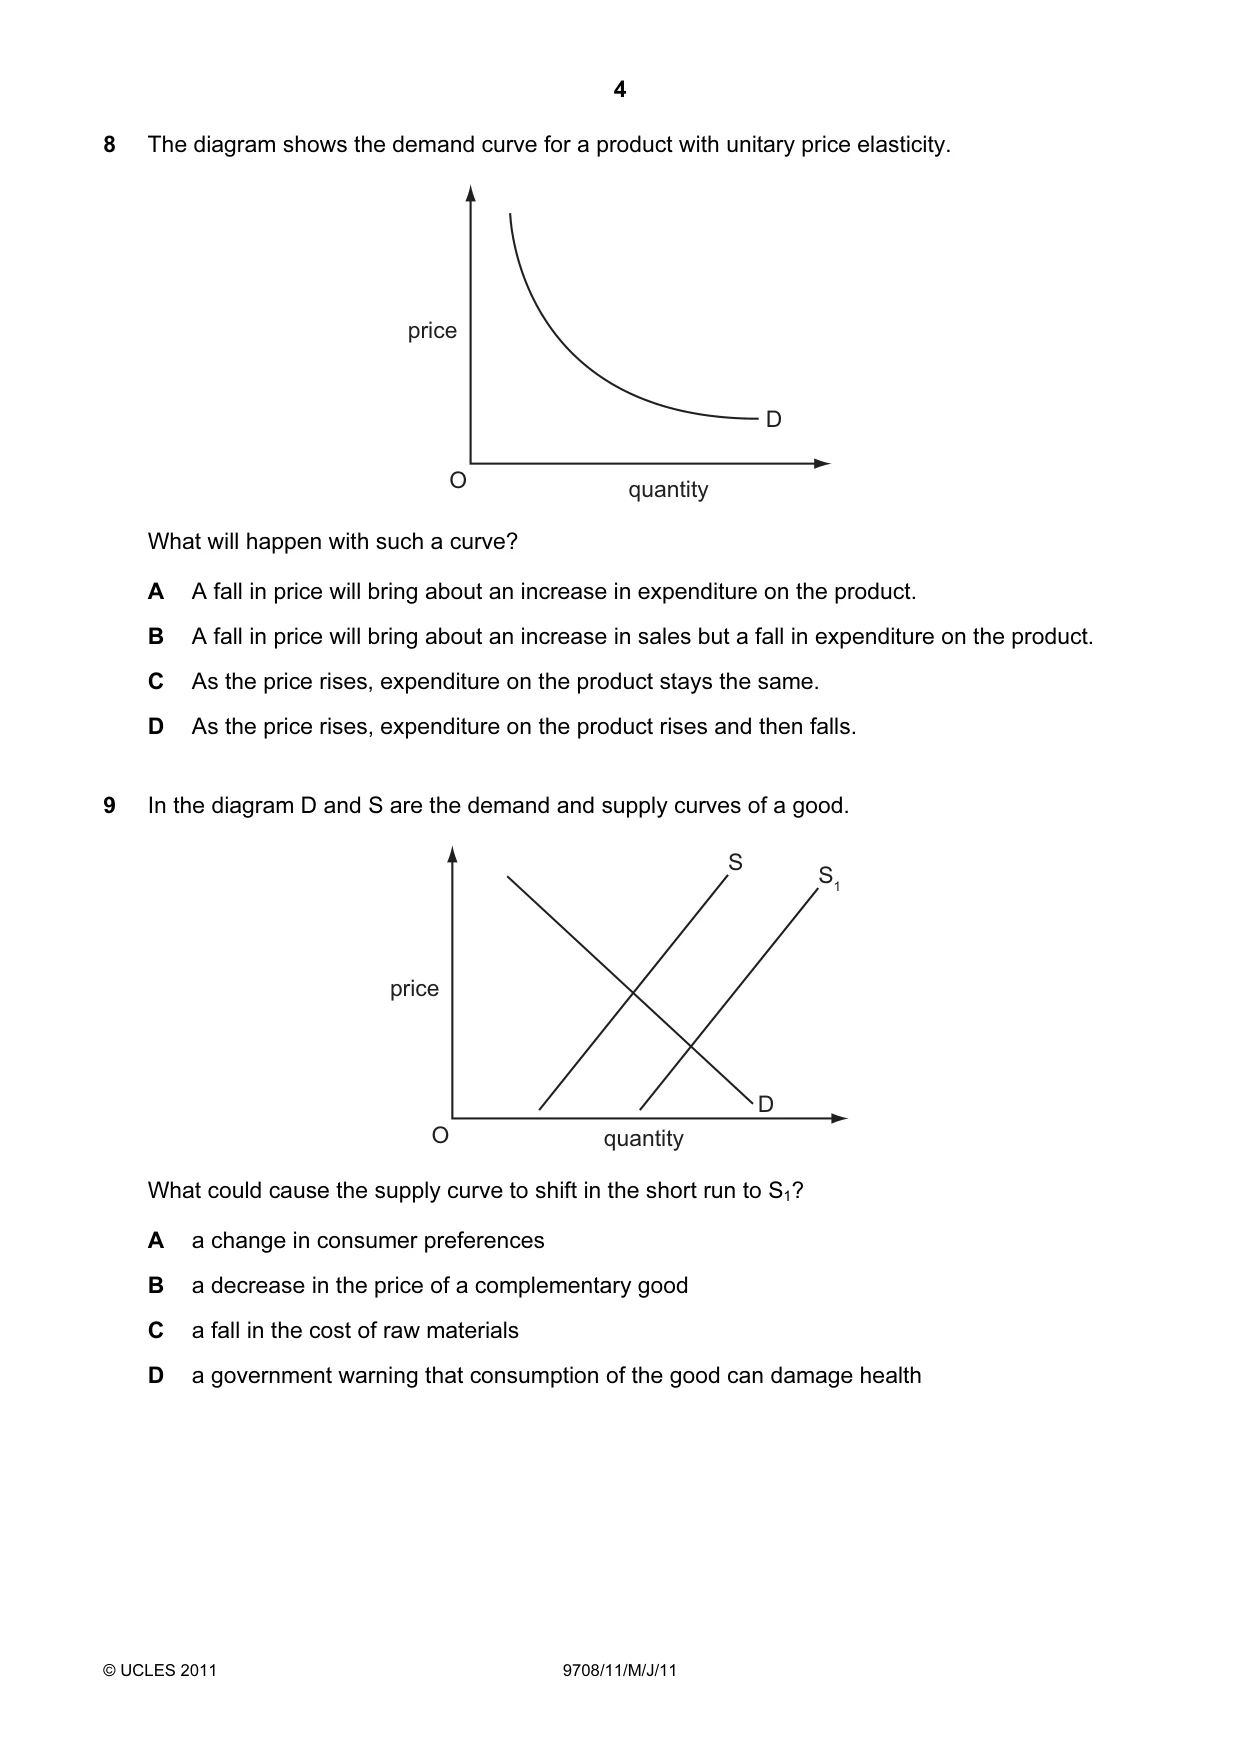
Q8 · The diagram shows the demand curve for a product with unitary price elasticity
8 The diagram shows the demand curve for a product with unitary price elasticity. price D O quantity What will happen with such a curve? A A fall in price will bring about an increase in expenditure on the product. B A fall in price will bring about an increase in sales but a fall in expenditure on the product. C As the price rises, expenditure on the product stays the same. D As the price rises, expenditure on the product rises and then falls.
Mark scheme: C
More questions on Price elasticity, income elasticity and cross elasticity of demand
Q9 · In the diagram D and S are the demand and supply curves of a good
9 In the diagram D and S are the demand and supply curves of a good. S S1 price D O quantity What could cause the supply curve to shift in the short run to S1? A a change in consumer preferences B a decrease in the price of a complementary good C a fall in the cost of raw materials D a government warning that consumption of the good can damage health
Mark scheme: C
Q10 · A refinery which processes oil into petrol (gas) is faced with the following conditions
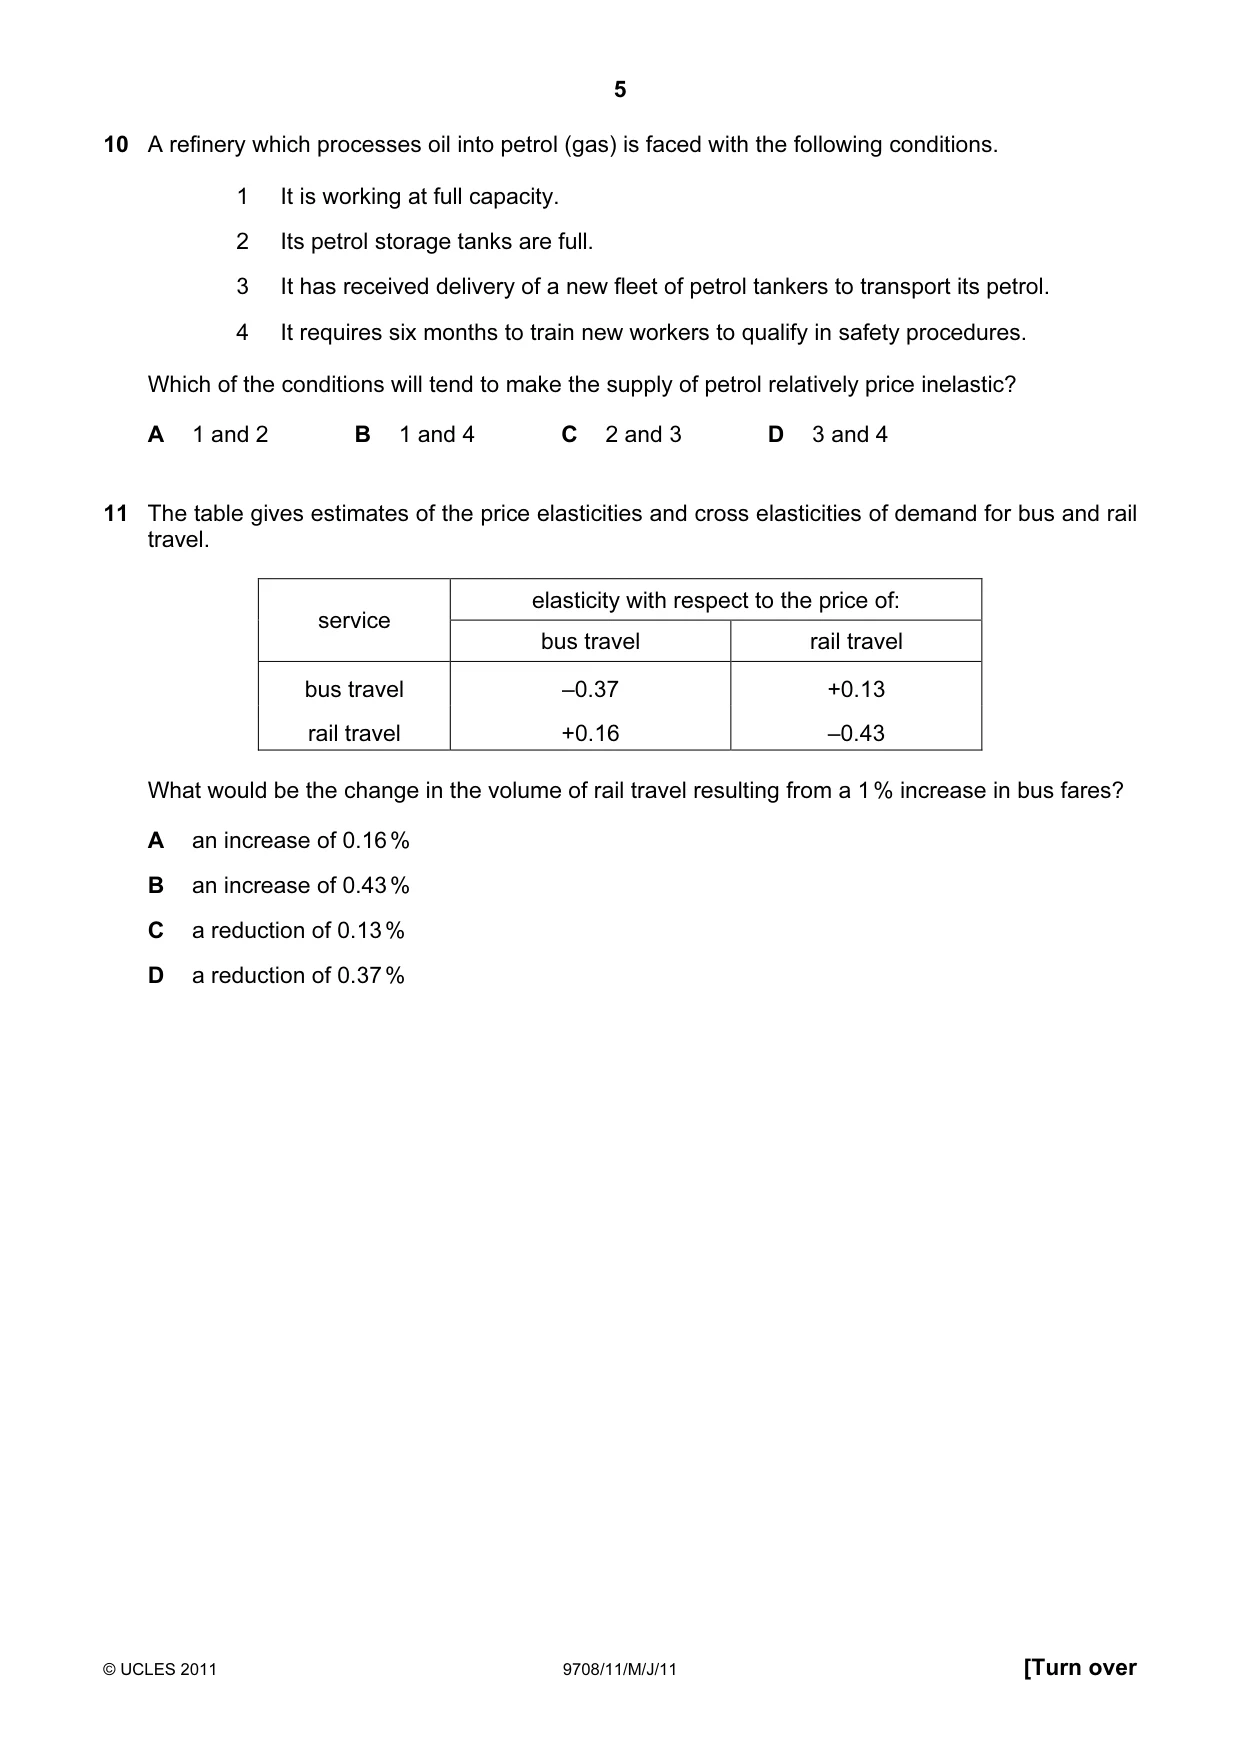
10 A refinery which processes oil into petrol (gas) is faced with the following conditions. 1 It is working at full capacity. 2 Its petrol storage tanks are full. 3 It has received delivery of a new fleet of petrol tankers to transport its petrol. 4 It requires six months to train new workers to qualify in safety procedures. Which of the conditions will tend to make the supply of petrol relatively price inelastic? A 1 and 2 B 1 and 4 C 2 and 3 D 3 and 4
Mark scheme: B
Q11 · The table gives estimates of the price elasticities and cross elasticities of demand for…
11 The table gives estimates of the price elasticities and cross elasticities of demand for bus and rail travel. elasticity with respect to the price of: service bus travel rail travel bus travel –0.37 +0.13 rail travel +0.16 –0.43 What would be the change in the volume of rail travel resulting from a 1 % increase in bus fares? A an increase of 0.16 % B an increase of 0.43 % C a reduction of 0.13 % D a reduction of 0.37 %
Mark scheme: A
More questions on Price elasticity, income elasticity and cross elasticity of demand
Q12 · The diagram shows the demand and supply curves for a good
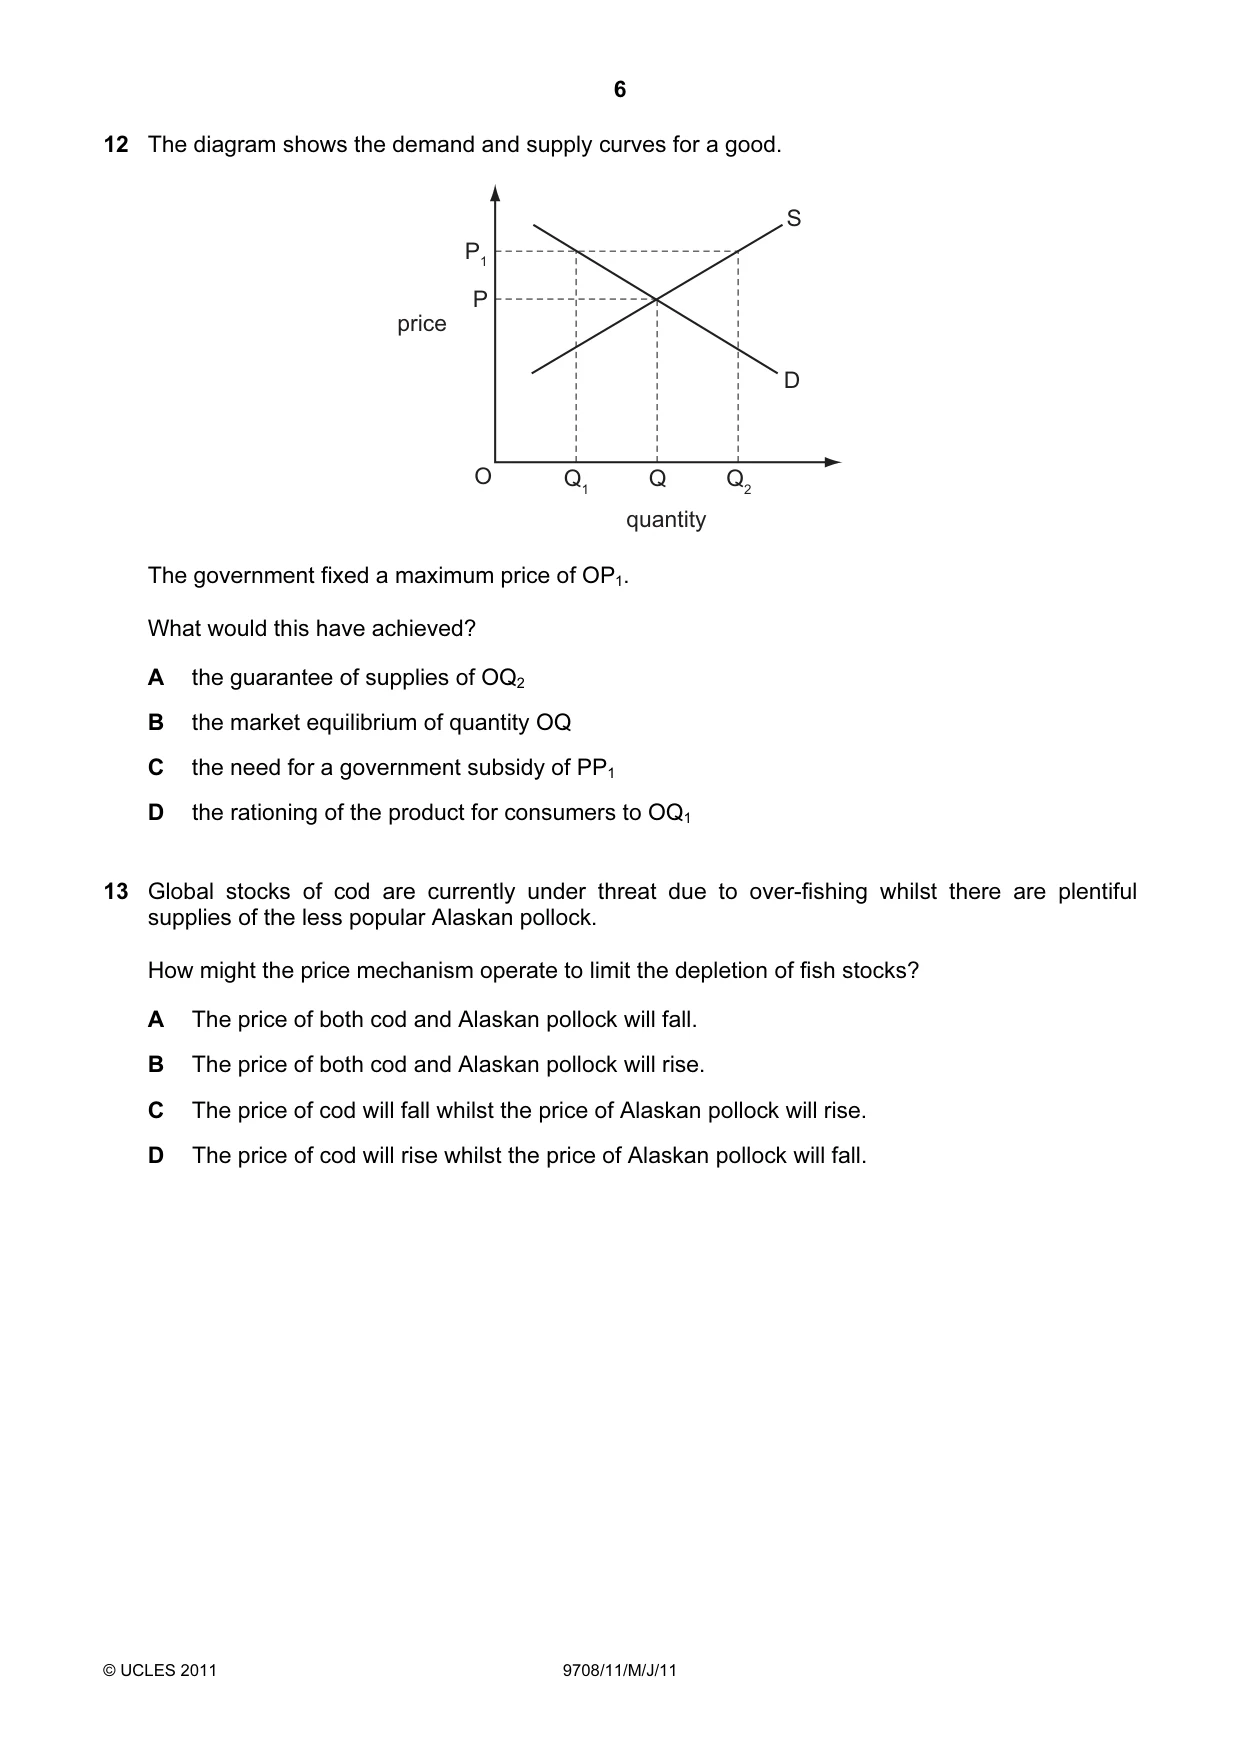
12 The diagram shows the demand and supply curves for a good. S P1 P price D O Q1 Q Q2 quantity The government fixed a maximum price of OP1. What would this have achieved? A the guarantee of supplies of OQ2 B the market equilibrium of quantity OQ C the need for a government subsidy of PP1 D the rationing of the product for consumers to OQ1
Mark scheme: B
More questions on Methods and effects of government intervention in markets
Q13 · Global stocks of cod are currently under threat due to over-fishing whilst there are…
13 Global stocks of cod are currently under threat due to over-fishing whilst there are plentiful supplies of the less popular Alaskan pollock. How might the price mechanism operate to limit the depletion of fish stocks? A The price of both cod and Alaskan pollock will fall. B The price of both cod and Alaskan pollock will rise. C The price of cod will fall whilst the price of Alaskan pollock will rise. D The price of cod will rise whilst the price of Alaskan pollock will fall.
Mark scheme: D
Q14 · The table shows some of the costs and benefits at a given level of production of a good
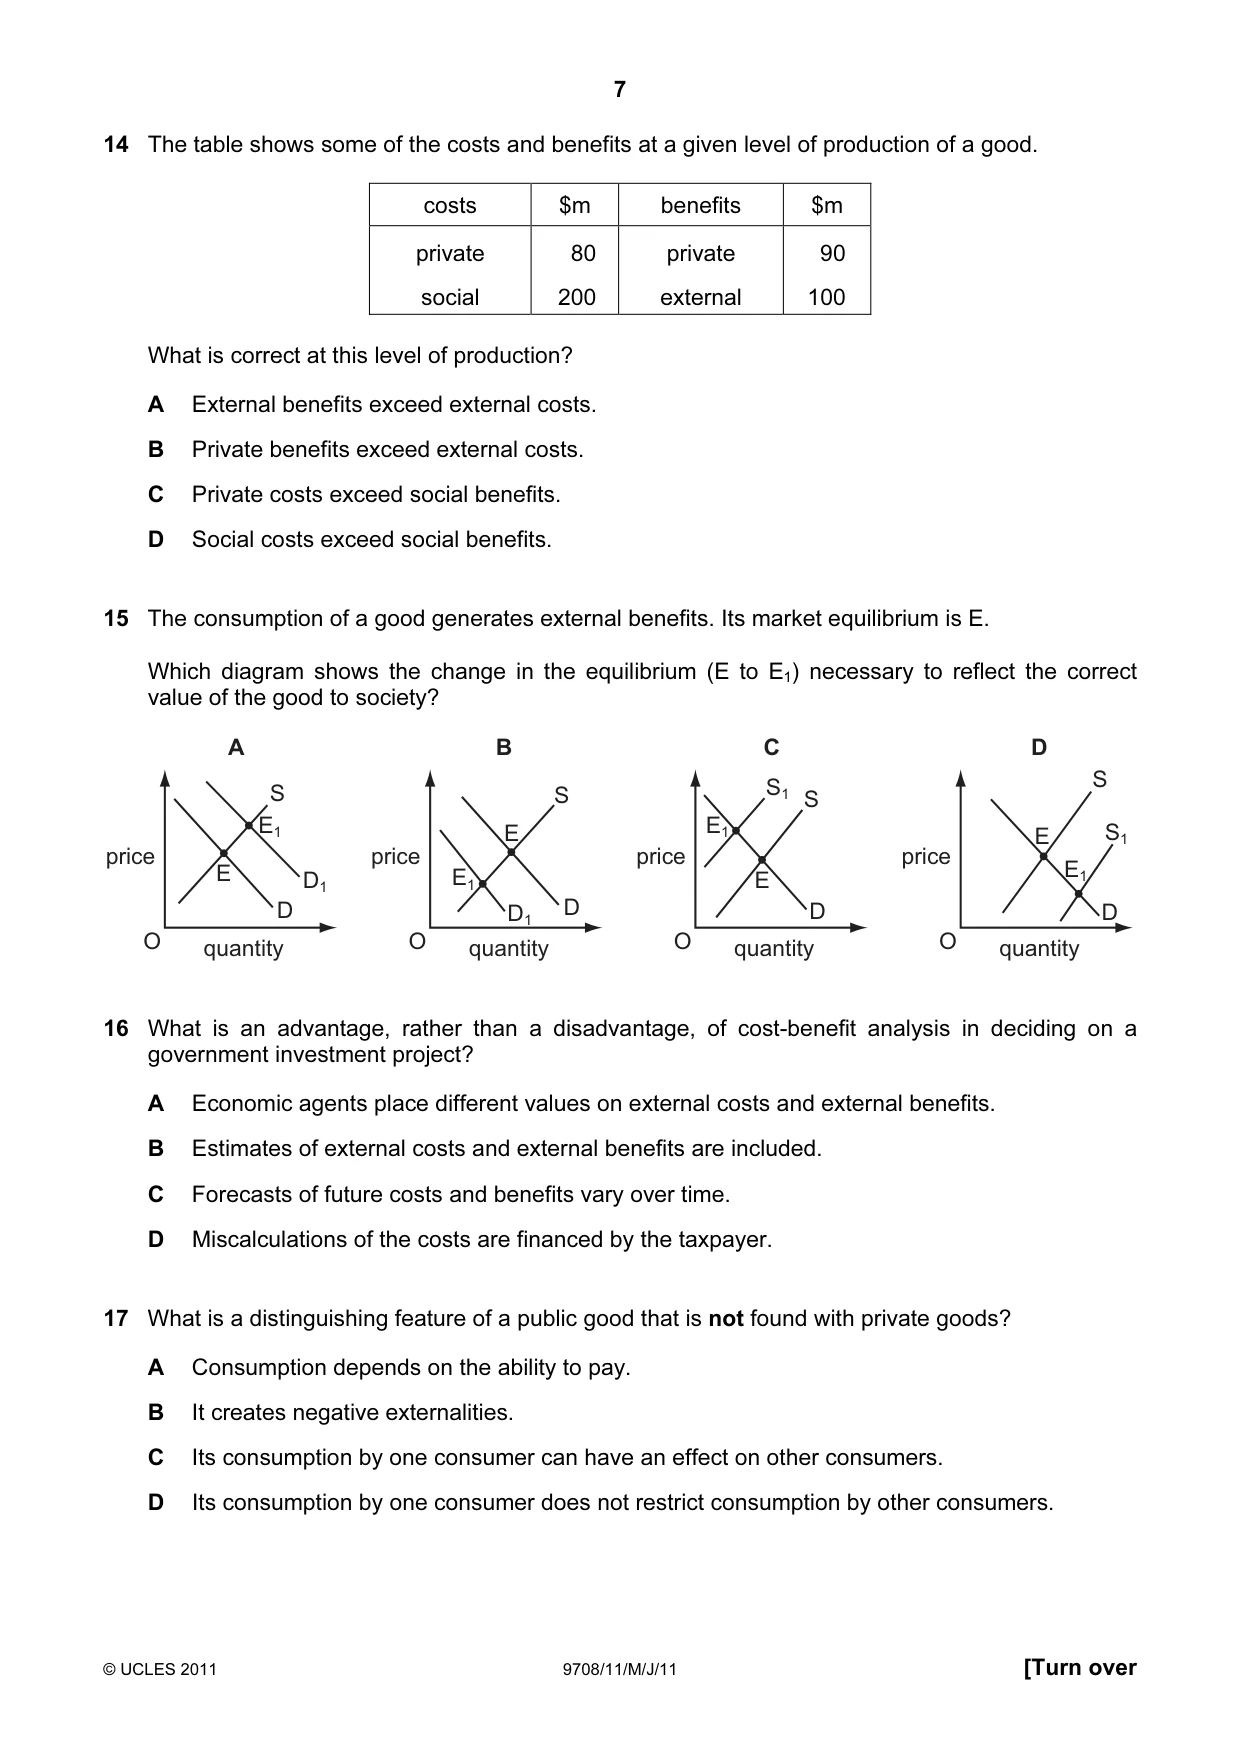
14 The table shows some of the costs and benefits at a given level of production of a good. costs $m benefits $m private 80 private 90 social 200 external 100 What is correct at this level of production? A External benefits exceed external costs. B Private benefits exceed external costs. C Private costs exceed social benefits. D Social costs exceed social benefits.
Mark scheme: D
More questions on Private costs and benefits, externalities and social costs and benefits
Q15 · The consumption of a good generates external benefits
15 The consumption of a good generates external benefits. Its market equilibrium is E. Which diagram shows the change in the equilibrium (E to E1) necessary to reflect the correct value of the good to society? A B C D S1 S S S S E1 E E1 S1 E price price price price E E1 E1 D1 E D D1 D D D O quantity O quantity O quantity O quantity
Mark scheme: A
More questions on Private costs and benefits, externalities and social costs and benefits
Q16 · What is an advantage, rather than a disadvantage, of cost-benefit analysis in deciding on…
16 What is an advantage, rather than a disadvantage, of cost-benefit analysis in deciding on a government investment project? A Economic agents place different values on external costs and external benefits. B Estimates of external costs and external benefits are included. C Forecasts of future costs and benefits vary over time. D Miscalculations of the costs are financed by the taxpayer.
Mark scheme: B
More questions on Private costs and benefits, externalities and social costs and benefits
Q17 · What is a distinguishing feature of a public good that is not found with private goods?
17 What is a distinguishing feature of a public good that is not found with private goods? A Consumption depends on the ability to pay. B It creates negative externalities. C Its consumption by one consumer can have an effect on other consumers. D Its consumption by one consumer does not restrict consumption by other consumers.
Mark scheme: D
Q18 · In the diagram S and S1 are the supply curves for an agricultural product in years 1 and…
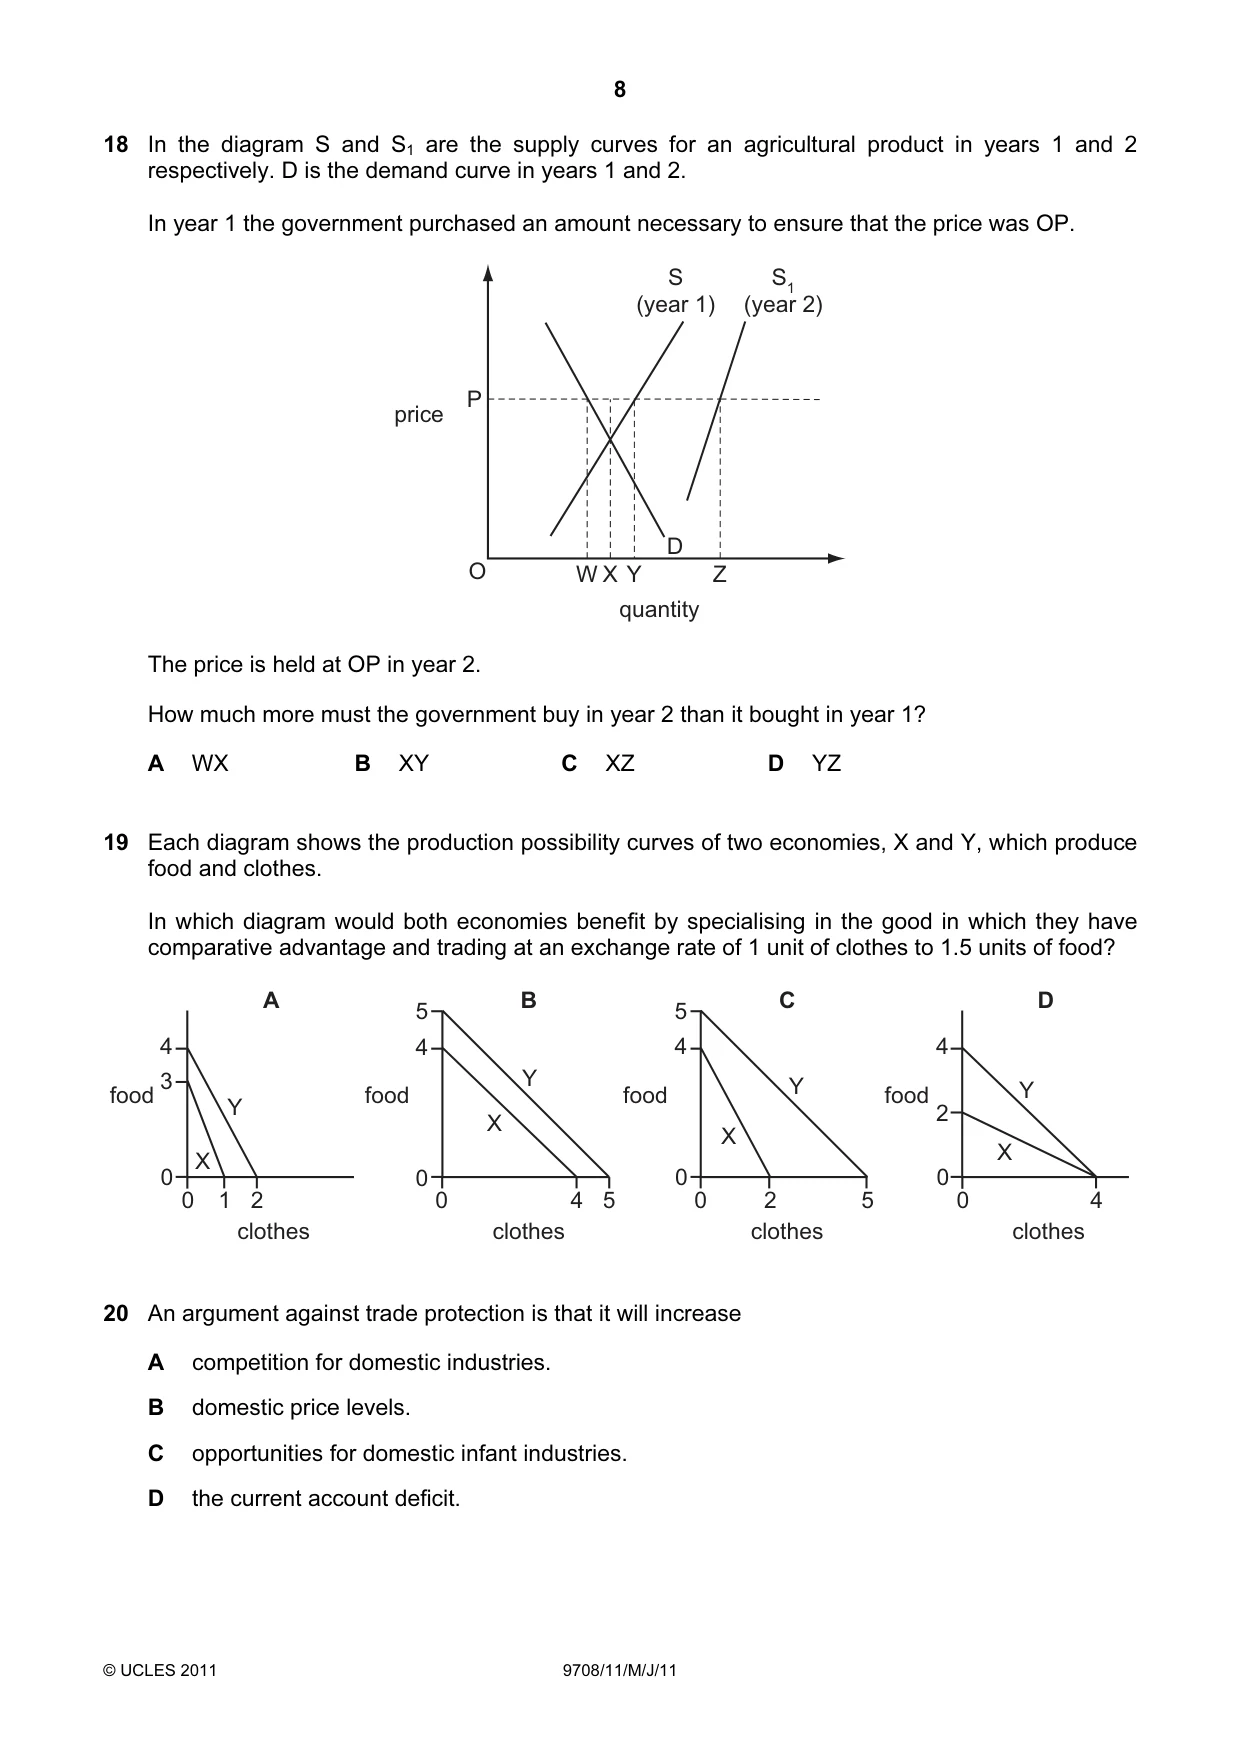
18 In the diagram S and S1 are the supply curves for an agricultural product in years 1 and 2 respectively. D is the demand curve in years 1 and 2. In year 1 the government purchased an amount necessary to ensure that the price was OP. S S1 (year 1) (year 2) P price D O W X Y Z quantity The price is held at OP in year 2. How much more must the government buy in year 2 than it bought in year 1? A WX B XY C XZ D YZ
Mark scheme: D
More questions on Methods and effects of government intervention in markets
Q19 · Each diagram shows the production possibility curves of two economies, X and Y, which…
19 Each diagram shows the production possibility curves of two economies, X and Y, which produce food and clothes. In which diagram would both economies benefit by specialising in the good in which they have comparative advantage and trading at an exchange rate of 1 unit of clothes to 1.5 units of food? A B C D 5 5 4 4 4 4 3 Y Y food food food food Y Y 2 X X X X 0 0 0 0 0 1 2 0 4 5 0 2 5 0 4 clothes clothes clothes clothes
Mark scheme: C
Q20 · An argument against trade protection is that it will increase A competition for domestic…
20 An argument against trade protection is that it will increase A competition for domestic industries. B domestic price levels. C opportunities for domestic infant industries. D the current account deficit.
Mark scheme: B
Q21 · A country’s terms of trade currently stands at 150 (base year 2000 = 100)
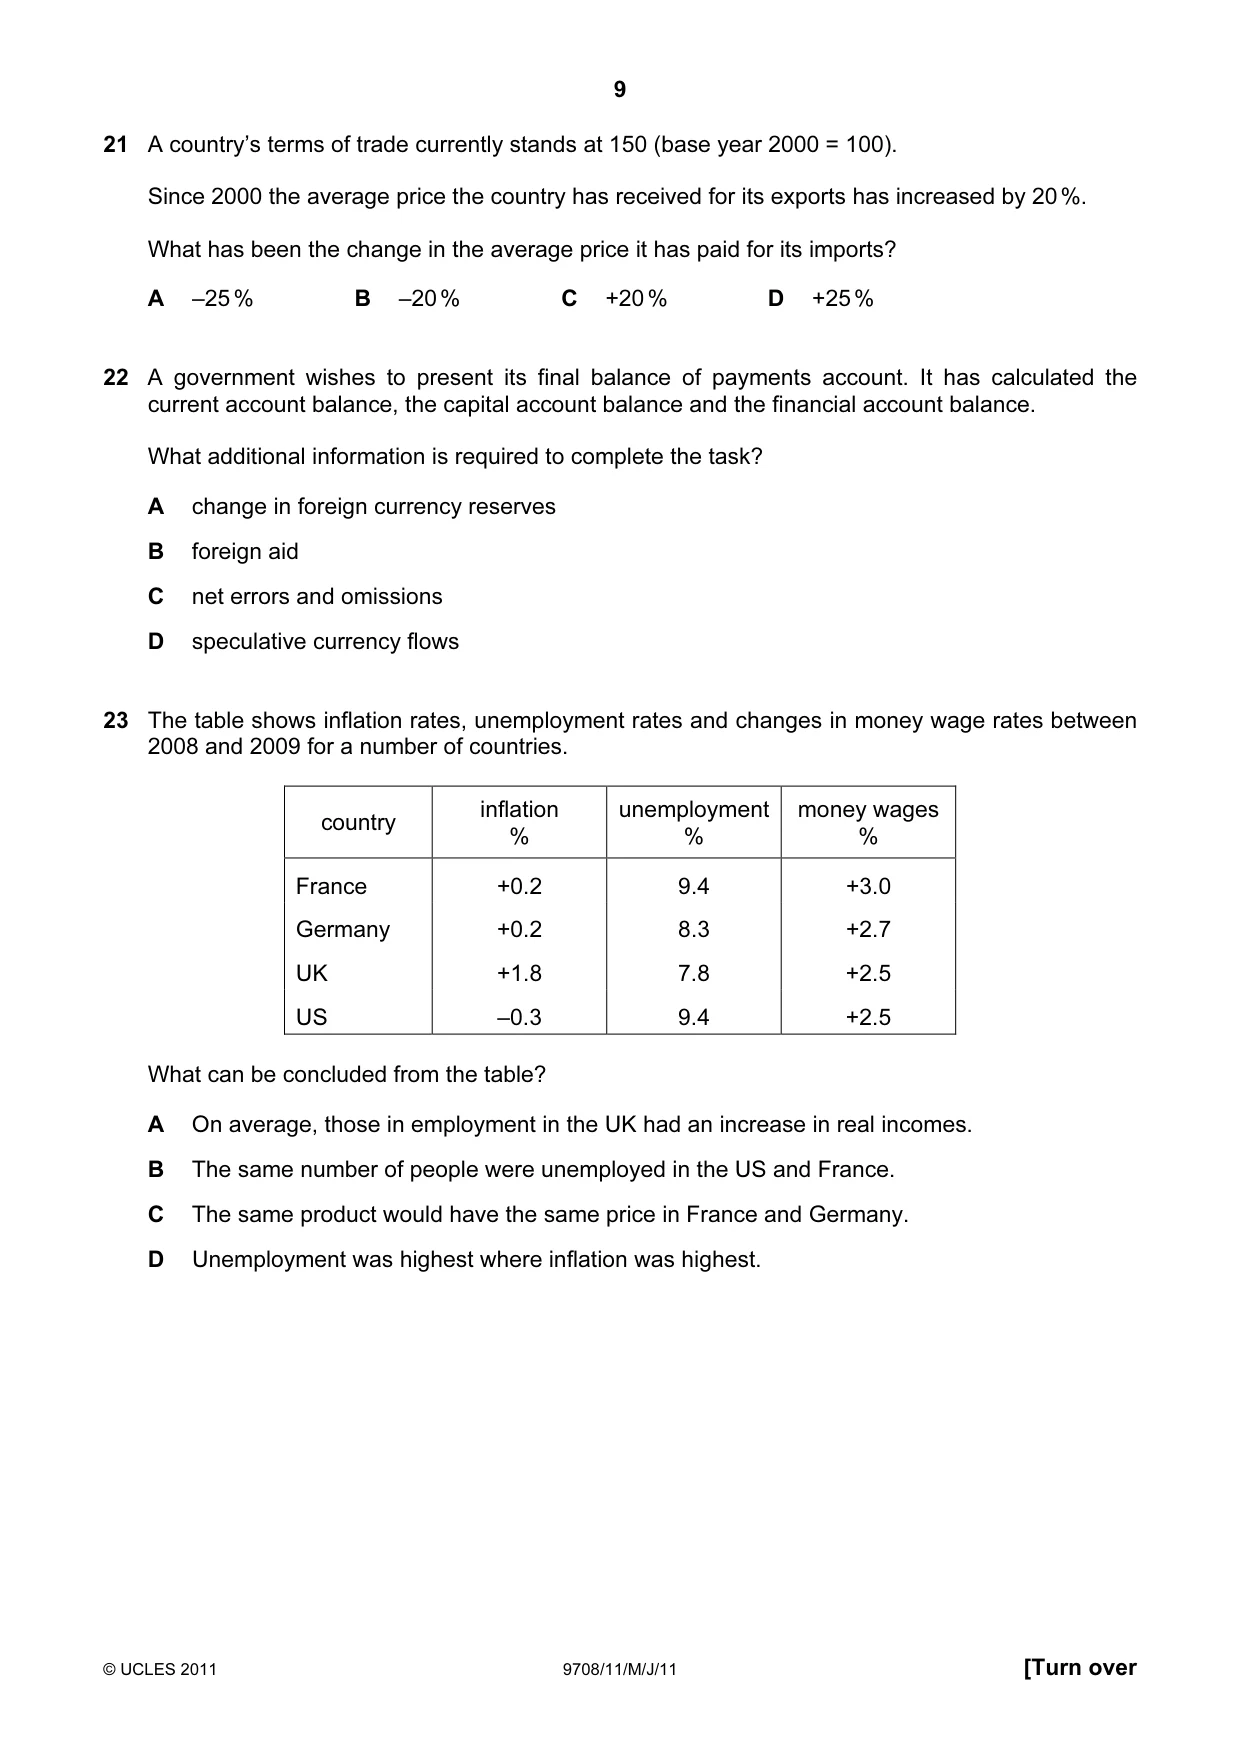
21 A country’s terms of trade currently stands at 150 (base year 2000 = 100). Since 2000 the average price the country has received for its exports has increased by 20 %. What has been the change in the average price it has paid for its imports? A –25 % B –20 % C +20 % D +25 %
Mark scheme: B
More questions on Current account of the balance of payments
Q22 · A government wishes to present its final balance of payments account
22 A government wishes to present its final balance of payments account. It has calculated the current account balance, the capital account balance and the financial account balance. What additional information is required to complete the task? A change in foreign currency reserves B foreign aid C net errors and omissions D speculative currency flows
Mark scheme: C
More questions on Current account of the balance of payments
Q23 · The table shows inflation rates, unemployment rates and changes in money wage rates…
23 The table shows inflation rates, unemployment rates and changes in money wage rates between 2008 and 2009 for a number of countries. inflation unemployment money wages country % % % France +0.2 9.4 +3.0 Germany +0.2 8.3 +2.7 UK +1.8 7.8 +2.5 US –0.3 9.4 +2.5 What can be concluded from the table? A On average, those in employment in the UK had an increase in real incomes. B The same number of people were unemployed in the US and France. C The same product would have the same price in France and Germany. D Unemployment was highest where inflation was highest.
Mark scheme: A
Q24 · The diagram compares the inflation rates of Paraguay and Argentina between 1950 and 2005
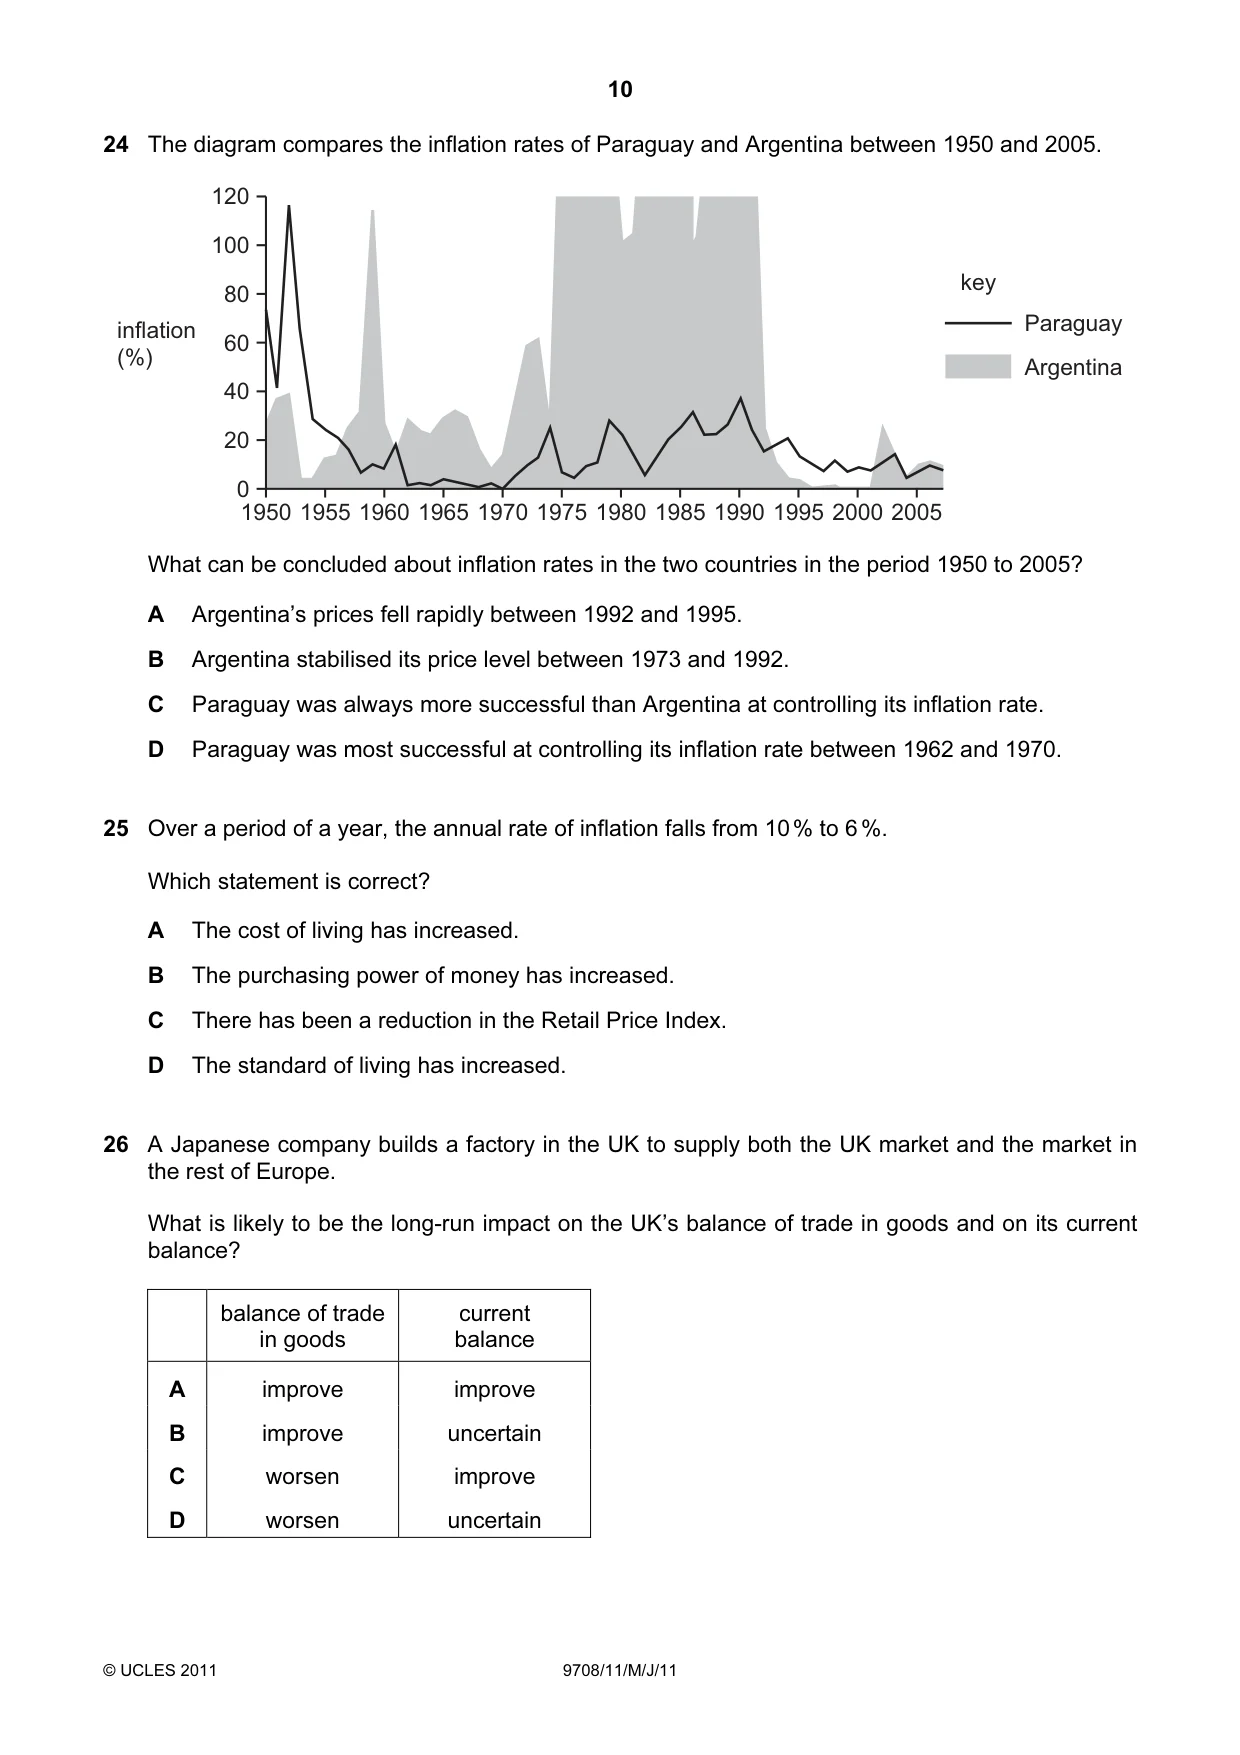
24 The diagram compares the inflation rates of Paraguay and Argentina between 1950 and 2005. 120 100 key 80 inflation Paraguay 60 (%) Argentina 40 20 0 1950 1955 1960 1965 1970 1975 1980 1985 1990 1995 2000 2005 What can be concluded about inflation rates in the two countries in the period 1950 to 2005? A Argentina’s prices fell rapidly between 1992 and 1995. B Argentina stabilised its price level between 1973 and 1992. C Paraguay was always more successful than Argentina at controlling its inflation rate. D Paraguay was most successful at controlling its inflation rate between 1962 and 1970.
Mark scheme: D
Q25 · Over a period of a year, the annual rate of inflation falls from 10 % to 6 %
25 Over a period of a year, the annual rate of inflation falls from 10 % to 6 %. Which statement is correct? A The cost of living has increased. B The purchasing power of money has increased. C There has been a reduction in the Retail Price Index. D The standard of living has increased.
Mark scheme: A
Q26 · A Japanese company builds a factory in the UK to supply both the UK market and the market…
26 A Japanese company builds a factory in the UK to supply both the UK market and the market in the rest of Europe. What is likely to be the long-run impact on the UK’s balance of trade in goods and on its current balance? balance of trade current in goods balance A improve improve B improve uncertain C worsen improve D worsen uncertain
Mark scheme: B
More questions on Current account of the balance of payments
Q27 · A country experiences changes in the value of its exports and imports of goods and…
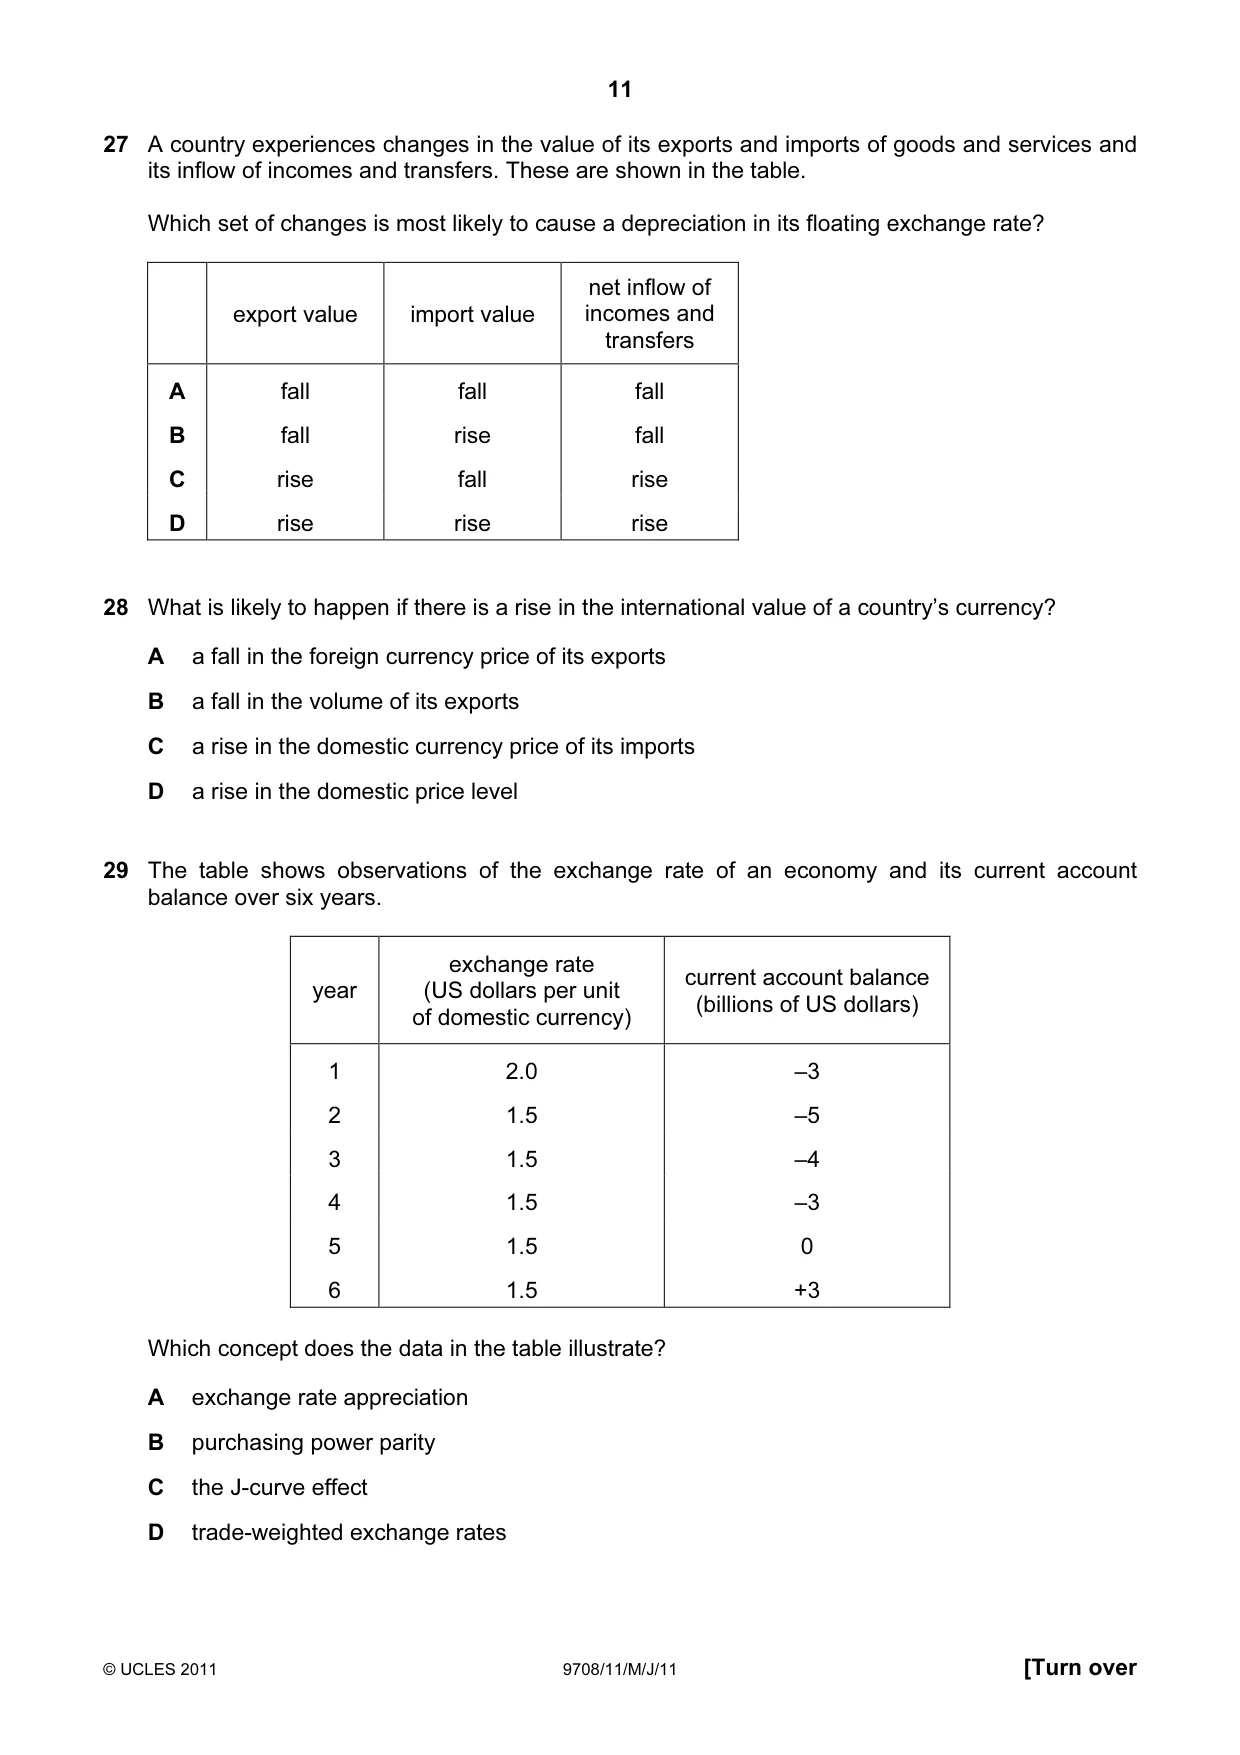
27 A country experiences changes in the value of its exports and imports of goods and services and its inflow of incomes and transfers. These are shown in the table. Which set of changes is most likely to cause a depreciation in its floating exchange rate? net inflow of export value import value incomes and transfers A fall fall fall B fall rise fall C rise fall rise D rise rise rise
Mark scheme: B
Q28 · What is likely to happen if there is a rise in the international value of a country’s…
28 What is likely to happen if there is a rise in the international value of a country’s currency? A a fall in the foreign currency price of its exports B a fall in the volume of its exports C a rise in the domestic currency price of its imports D a rise in the domestic price level
Mark scheme: B
Q29 · The table shows observations of the exchange rate of an economy and its current account…
29 The table shows observations of the exchange rate of an economy and its current account balance over six years. exchange rate current account balance year (US dollars per unit (billions of US dollars) of domestic currency) 1 2.0 –3 2 1.5 –5 3 1.5 –4 4 1.5 –3 5 1.5 0 6 1.5 +3 Which concept does the data in the table illustrate? A exchange rate appreciation B purchasing power parity C the J-curve effect D trade-weighted exchange rates
Mark scheme: C
More questions on Policies to correct imbalances in the current account of the balance of payments
Q30 · The diagram shows the exchange rate for the UK£ in terms of the US$
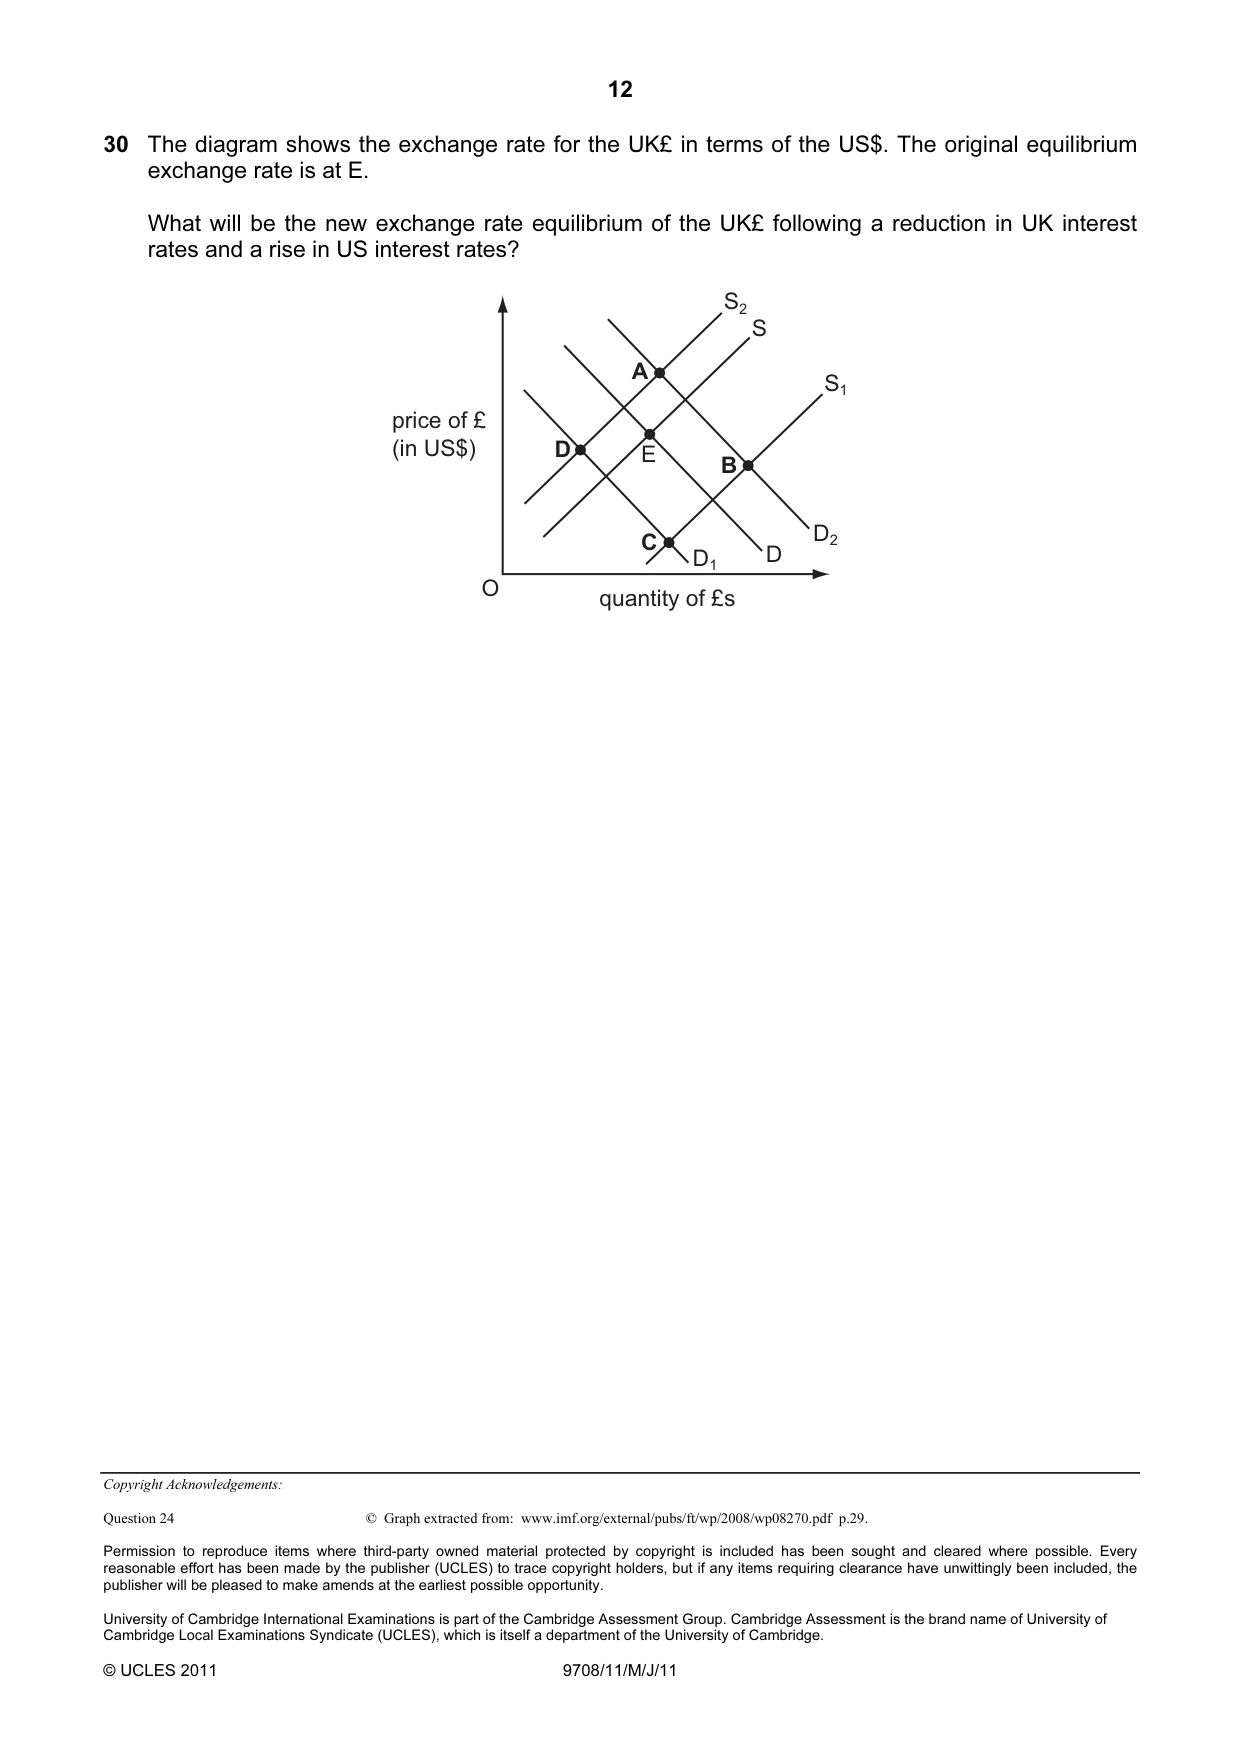
30 The diagram shows the exchange rate for the UK£ in terms of the US$. The original equilibrium exchange rate is at E. What will be the new exchange rate equilibrium of the UK£ following a reduction in UK interest rates and a rise in US interest rates? S2 S A S1 price of £ (in US$) D E B C D2 D1 D O quantity of £s
Mark scheme: C
What was in this paper
The subtopics covered by these 30 questions, and how many questions each got. Open one in a new tab to see every Cambridge question on it.
4Current account of the balance of payments3Exchange rates3Private costs and benefits, externalities and social costs and benefits3Methods and effects of government intervention in markets2Price elasticity, income elasticity and cross elasticity of demand2Price stability2Classification of goods and services1Economic methodology1Factors of production1Policies to correct imbalances in the current account of the balance of payments1Price elasticity of supply1Production possibility curves1Protectionism1Resource allocation in different economic systems1The interaction of demand and supply1The reasons for international trade1Unemployment1What you needed in this session
Cambridge’s own grade thresholds for 2011 May/June, Paper 1 · Variant 1. A higher threshold means an easier paper — the bar moves with how the cohort did.