Cambridge A Level Economics 9708 — 2018 Oct/Nov Paper 1 · Variant 3
9708/13/O/N/18 · 30 questions · 30 marks · ≈34 min
The question paper and its mark scheme, free to read here and free to download. This is Cambridge’s own paper, exactly as it was sat.
Question paper16 pages
Mark scheme3 pages
Answers below. Sit the paper first if you are practising.
Questions as text
Q1 · The statements are from a report by a water company that supplies water to homes and…
1 The statements are from a report by a water company that supplies water to homes and businesses. Which statement is normative? A It is important that we continue to invest in our infrastructure. B Our investment will have wider benefits, attracting visitors to the region. C We are investing more than ever in the region. D We use local suppliers on construction projects which boosts the local economy.
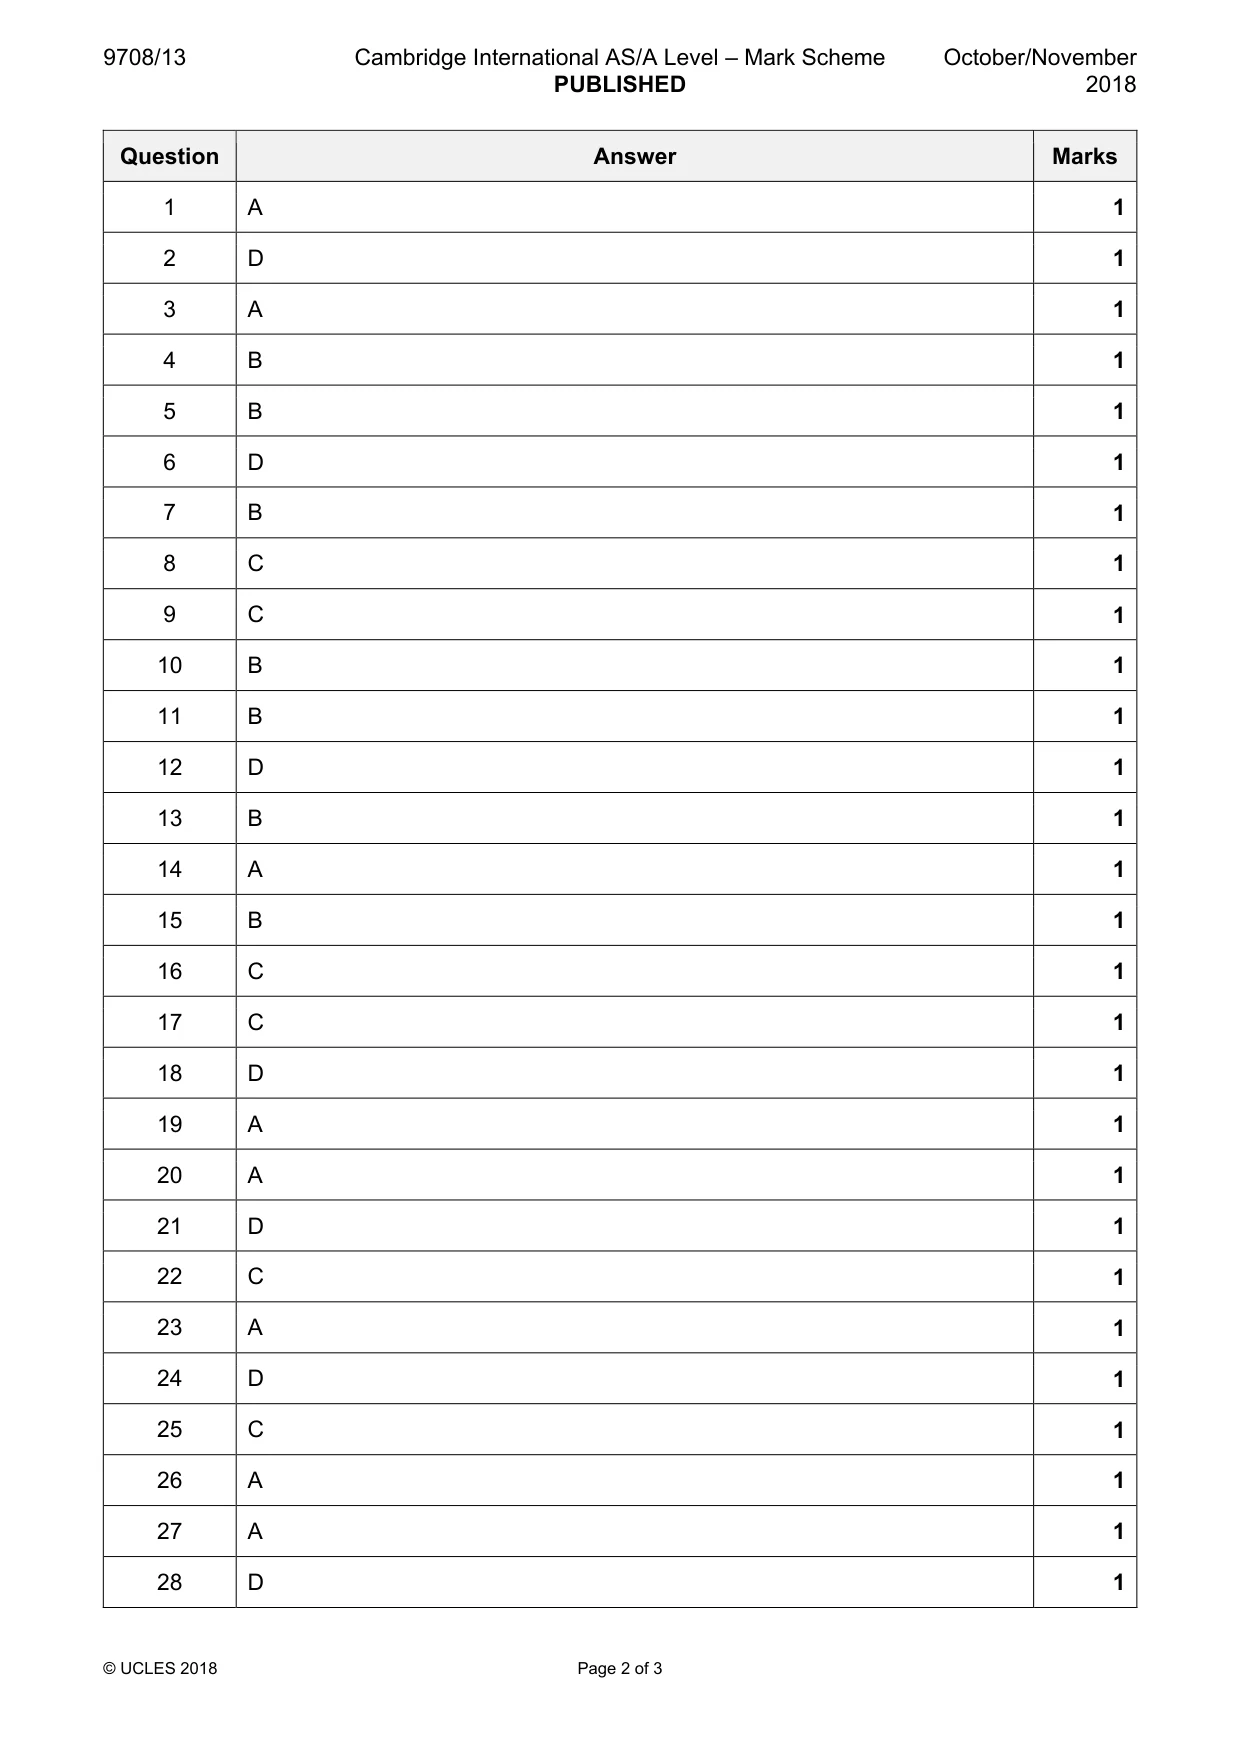
Mark scheme: A
Q2 · The combinations of output of goods X and Y shown in the table could all be produced…
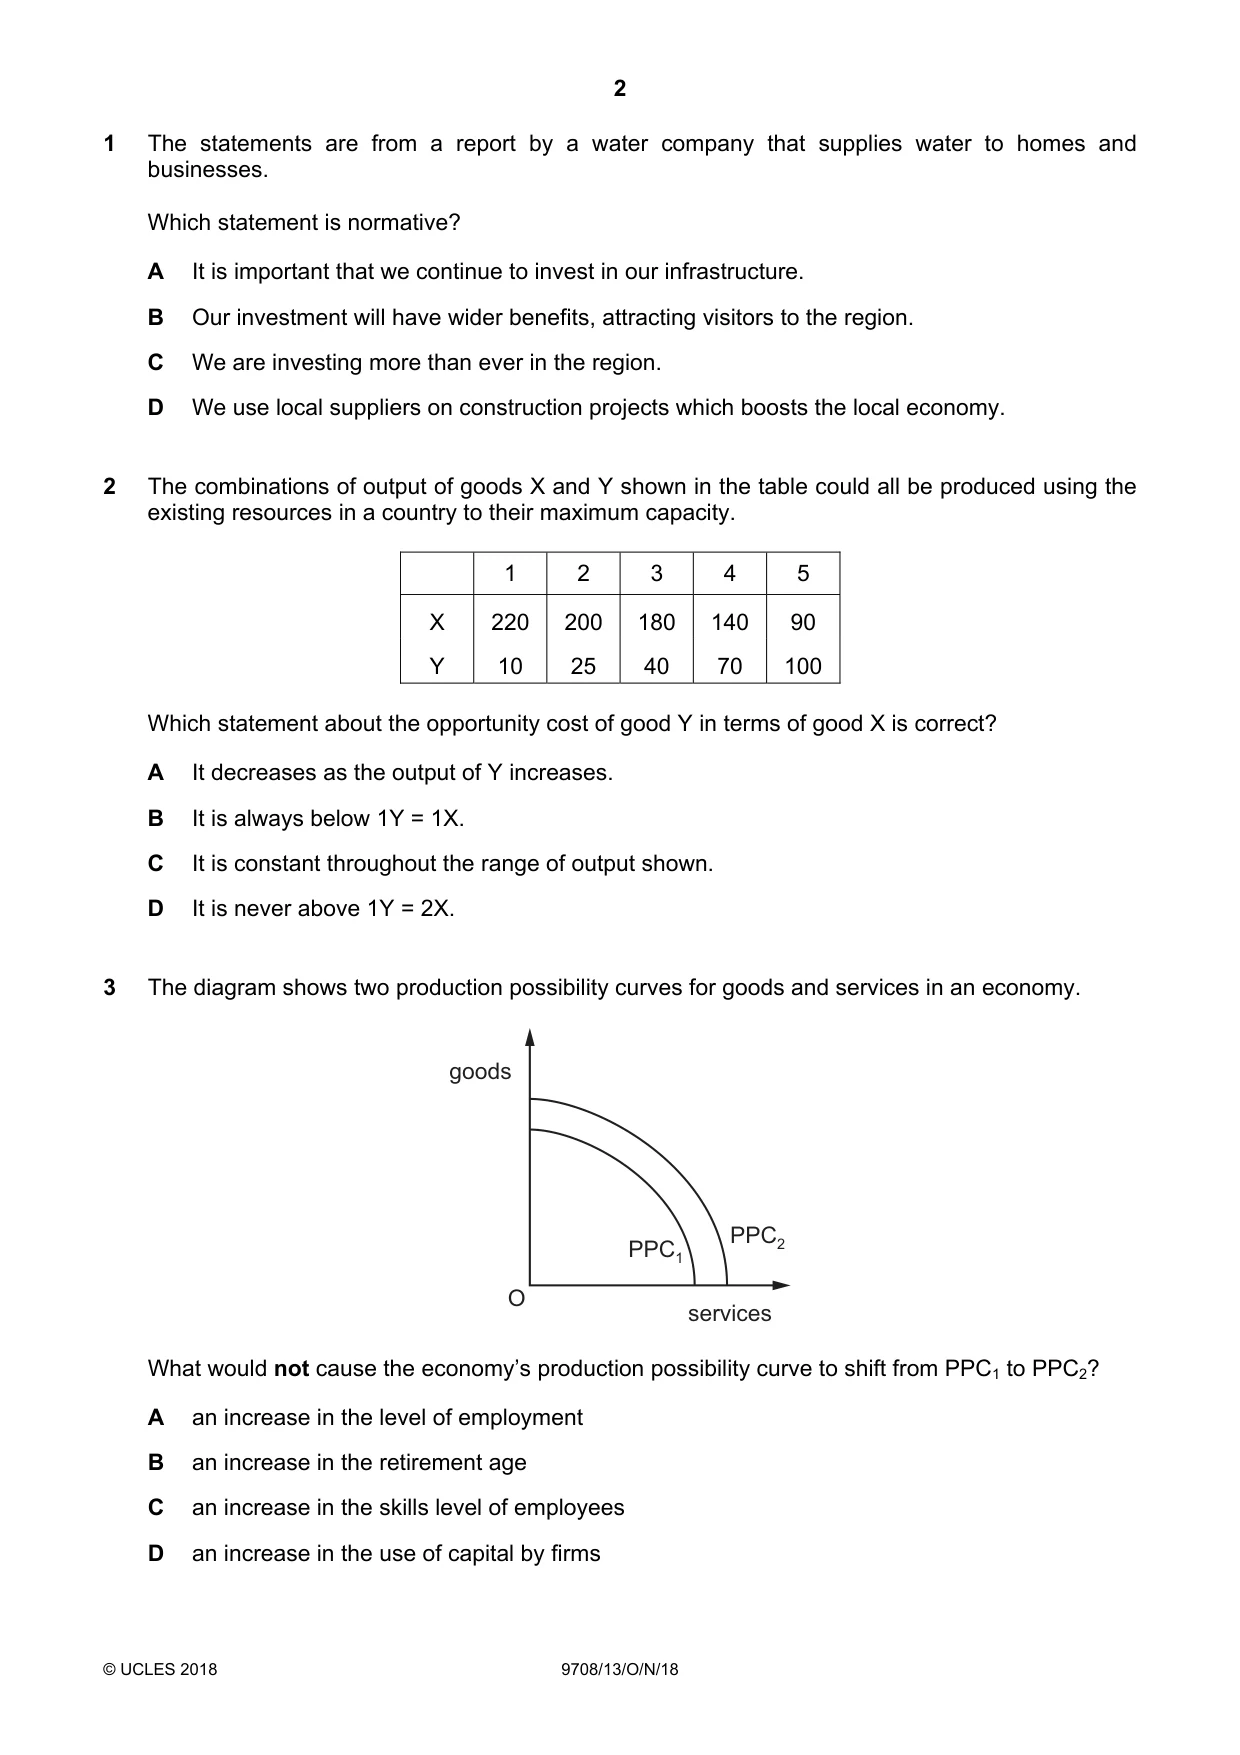
2 The combinations of output of goods X and Y shown in the table could all be produced using the existing resources in a country to their maximum capacity. 1 2 3 4 5 X 220 200 180 140 90 Y 10 25 40 70 100 Which statement about the opportunity cost of good Y in terms of good X is correct? A It decreases as the output of Y increases. B It is always below 1Y = 1X. C It is constant throughout the range of output shown. D It is never above 1Y = 2X.
Mark scheme: D
Q3 · The diagram shows two production possibility curves for goods and services in an economy
3 The diagram shows two production possibility curves for goods and services in an economy. goods PPC2 PPC1 O services What would not cause the economy’s production possibility curve to shift from PPC1 to PPC2? A an increase in the level of employment B an increase in the retirement age C an increase in the skills level of employees D an increase in the use of capital by firms
Mark scheme: A
Q4 · What is a statement of the non-rivalrous nature of public goods?
4 What is a statement of the non-rivalrous nature of public goods? A It is not possible to stop a non-payer from using the product. B One person consuming the product does not reduce the amount of it available to others. C People consume too little of the product because they are unaware of its true benefits. D There is an unlimited supply of the product.
Mark scheme: B
Q5 · What is not held constant when aggregating individual firms’ supply curves to give the…
5 What is not held constant when aggregating individual firms’ supply curves to give the short-run market supply curve? A the number of firms in the industry B the price of the product C the prices of factors of production D the state of technology
Mark scheme: B
Q6 · The diagram shows the demand for a product for which there are only three buyers…
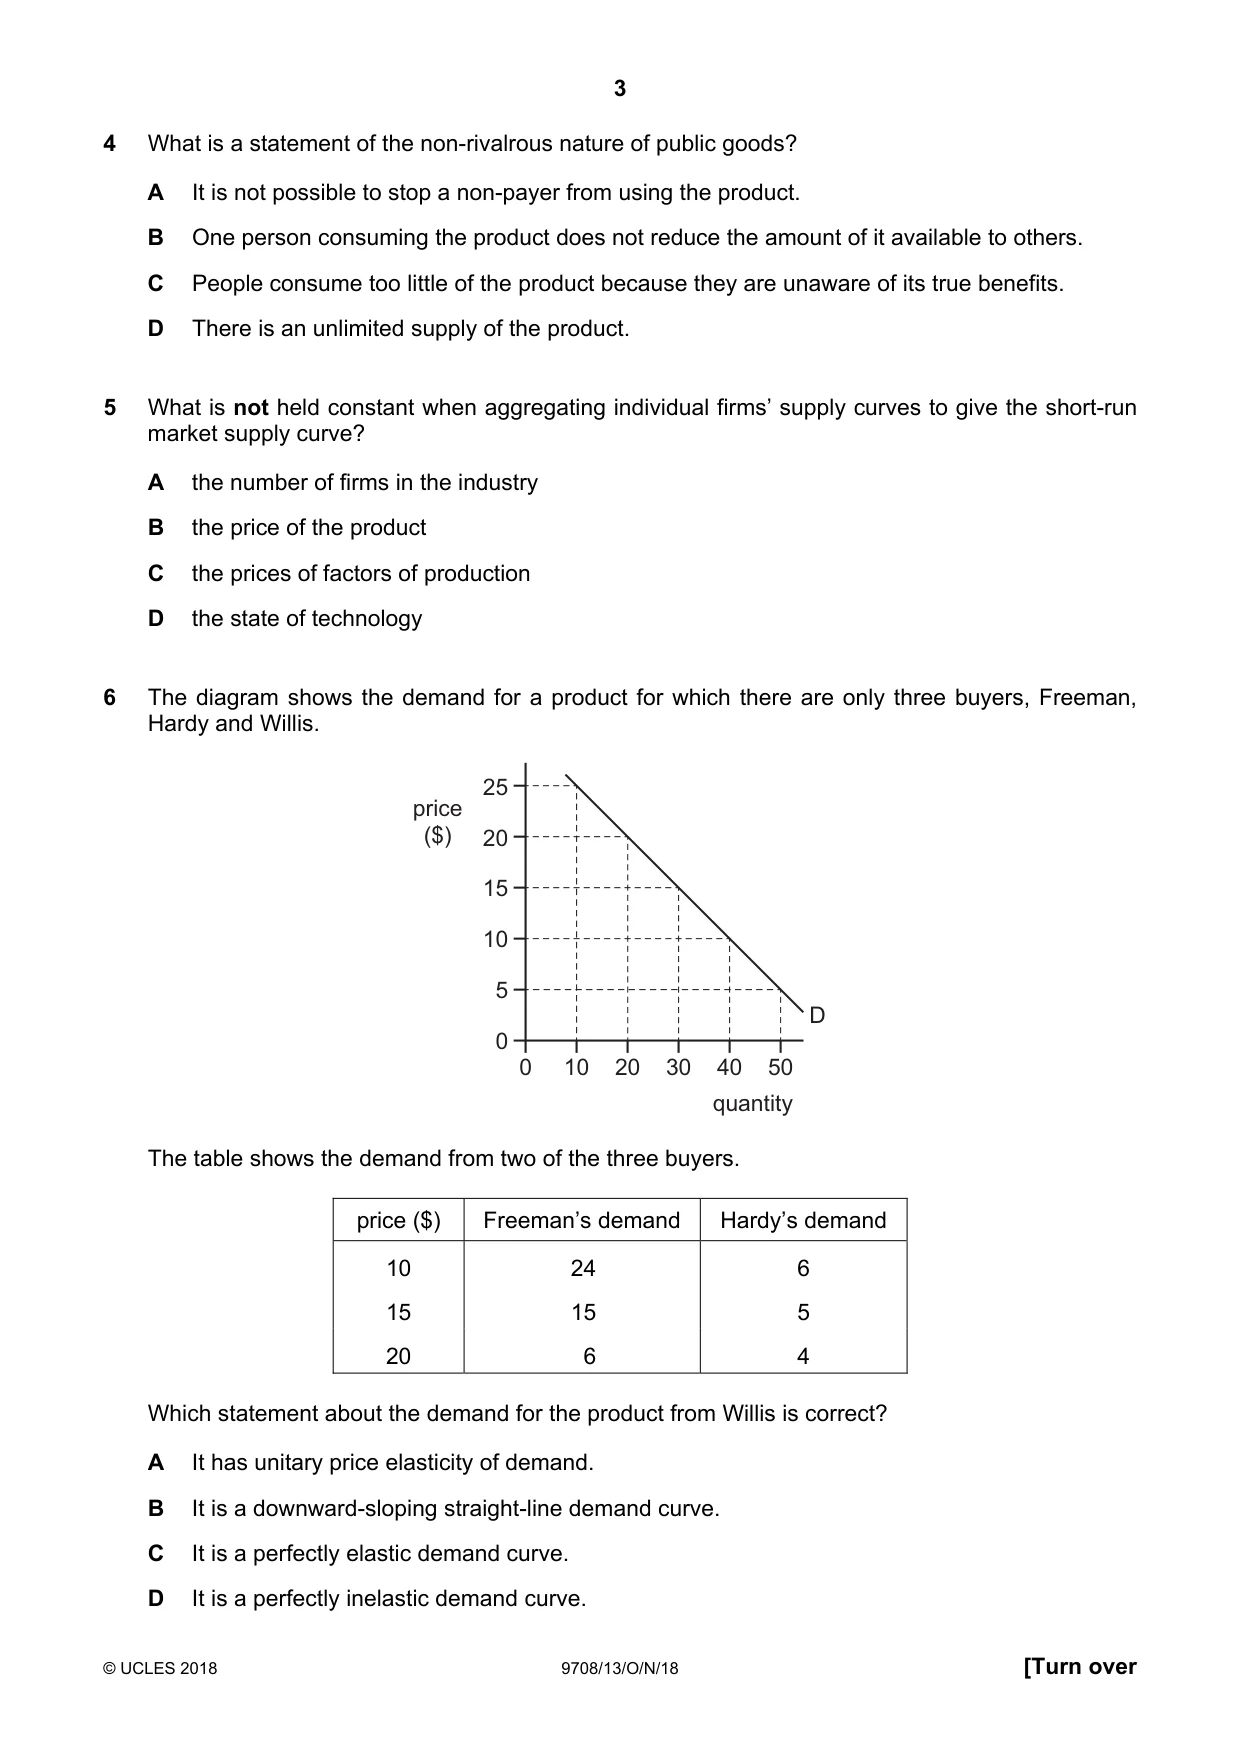
6 The diagram shows the demand for a product for which there are only three buyers, Freeman, Hardy and Willis. 25 price ($) 20 15 10 5 D 0 0 10 20 30 40 50 quantity The table shows the demand from two of the three buyers. price ($) Freeman’s demand Hardy’s demand 10 24 6 15 15 5 20 6 4 Which statement about the demand for the product from Willis is correct? A It has unitary price elasticity of demand. B It is a downward-sloping straight-line demand curve. C It is a perfectly elastic demand curve. D It is a perfectly inelastic demand curve.
Mark scheme: D
Q7 · Which statement about price elasticity of supply is correct?
7 Which statement about price elasticity of supply is correct? A It cannot change in the short run. B It increases as the time period lengthens. C It is infinite in the momentary time period. D It is zero in the long run.
Mark scheme: B
Q8 · At a price of $4 a manufacturer supplies 20 units of a good per week
8 At a price of $4 a manufacturer supplies 20 units of a good per week. The value of the price elasticity of supply is 2 over the range of price. How many goods will be supplied at $5? A 10 B 25 C 30 D 40
Mark scheme: C
Q9 · Consumers wishing to listen to music at home can now access it online
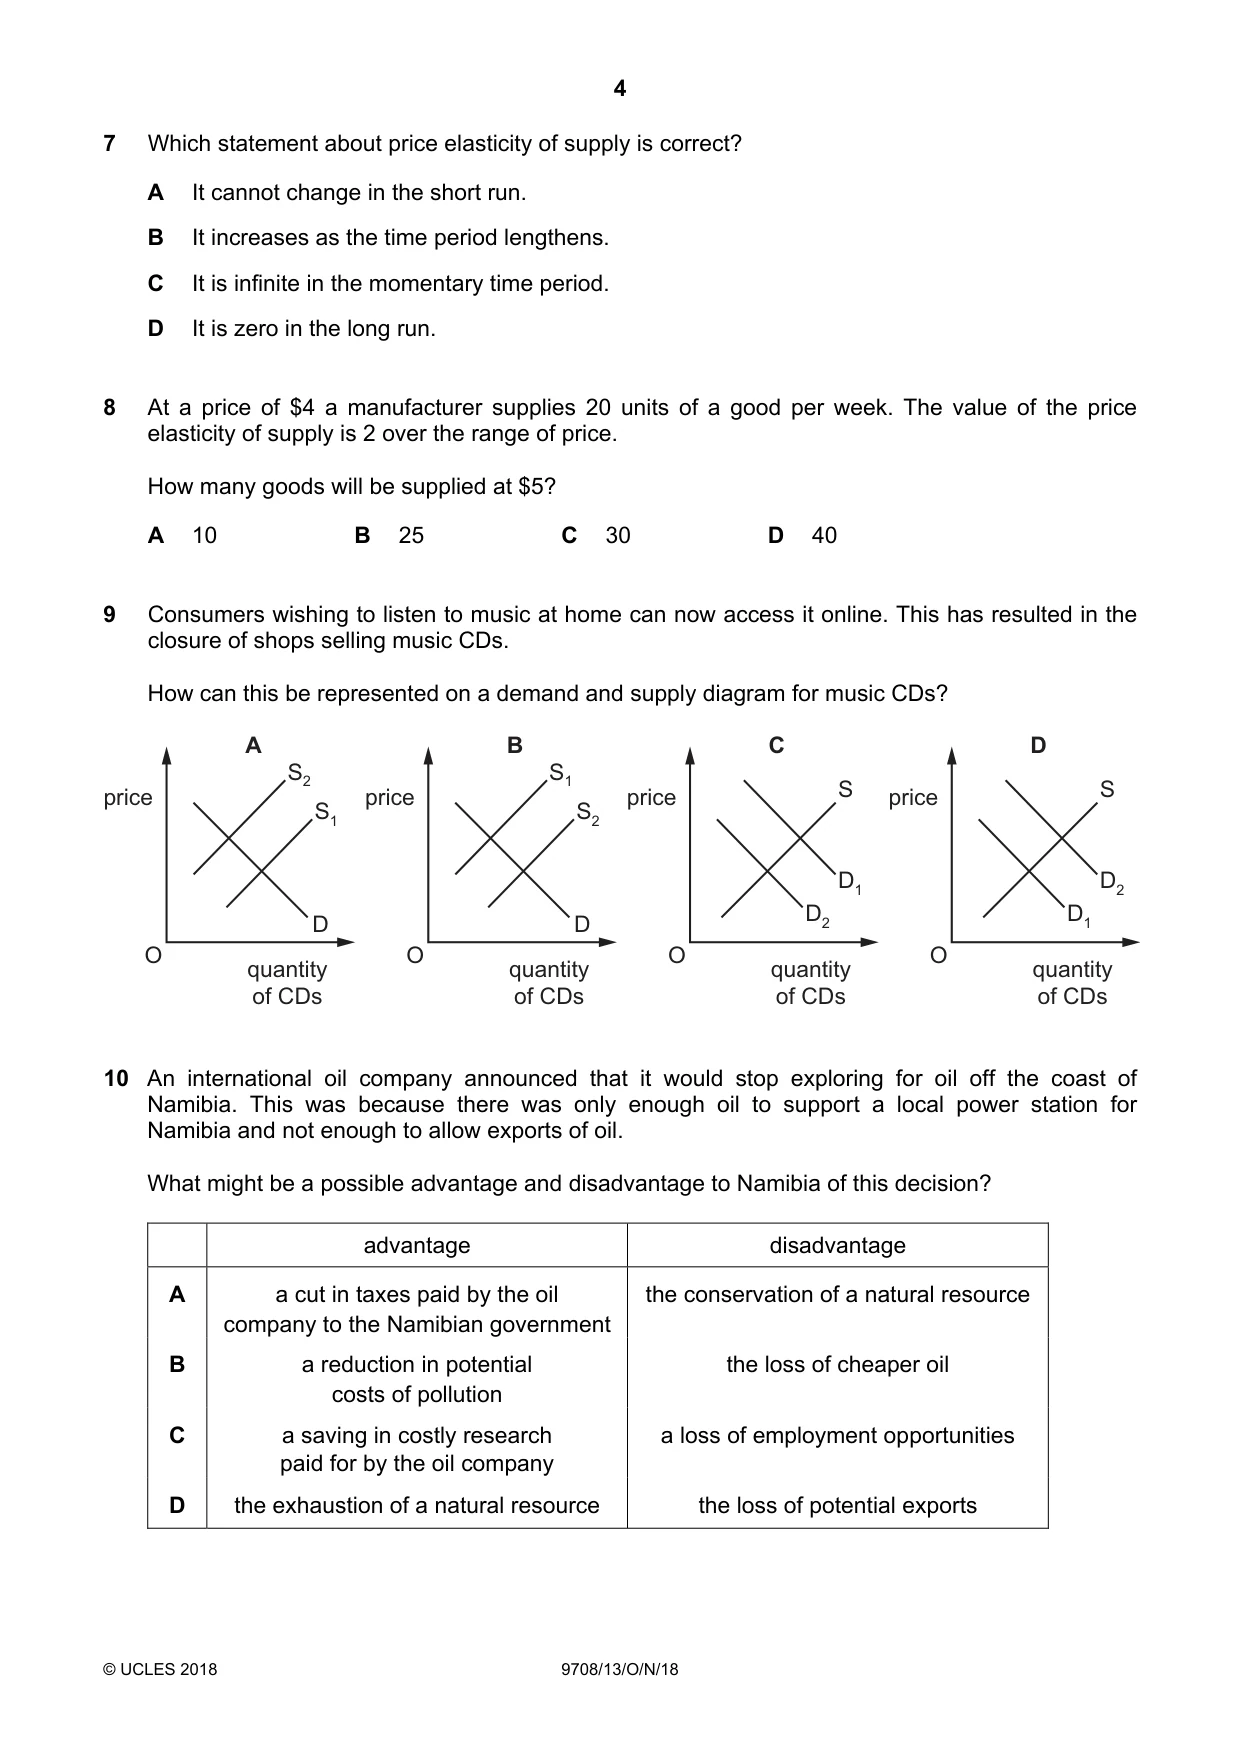
9 Consumers wishing to listen to music at home can now access it online. This has resulted in the closure of shops selling music CDs. How can this be represented on a demand and supply diagram for music CDs? A B C D S2 S1 price price price S price S S1 S2 D1 D2 D D D2 D1 O O O O quantity quantity quantity quantity of CDs of CDs of CDs of CDs
Mark scheme: C
Q10 · An international oil company announced that it would stop exploring for oil off the coast…
10 An international oil company announced that it would stop exploring for oil off the coast of Namibia. This was because there was only enough oil to support a local power station for Namibia and not enough to allow exports of oil. What might be a possible advantage and disadvantage to Namibia of this decision? advantage disadvantage A a cut in taxes paid by the oil the conservation of a natural resource company to the Namibian government B a reduction in potential the loss of cheaper oil costs of pollution C a saving in costly research a loss of employment opportunities paid for by the oil company D the exhaustion of a natural resource the loss of potential exports
Mark scheme: B
Q11 · The table shows a competitive market in equilibrium in two periods
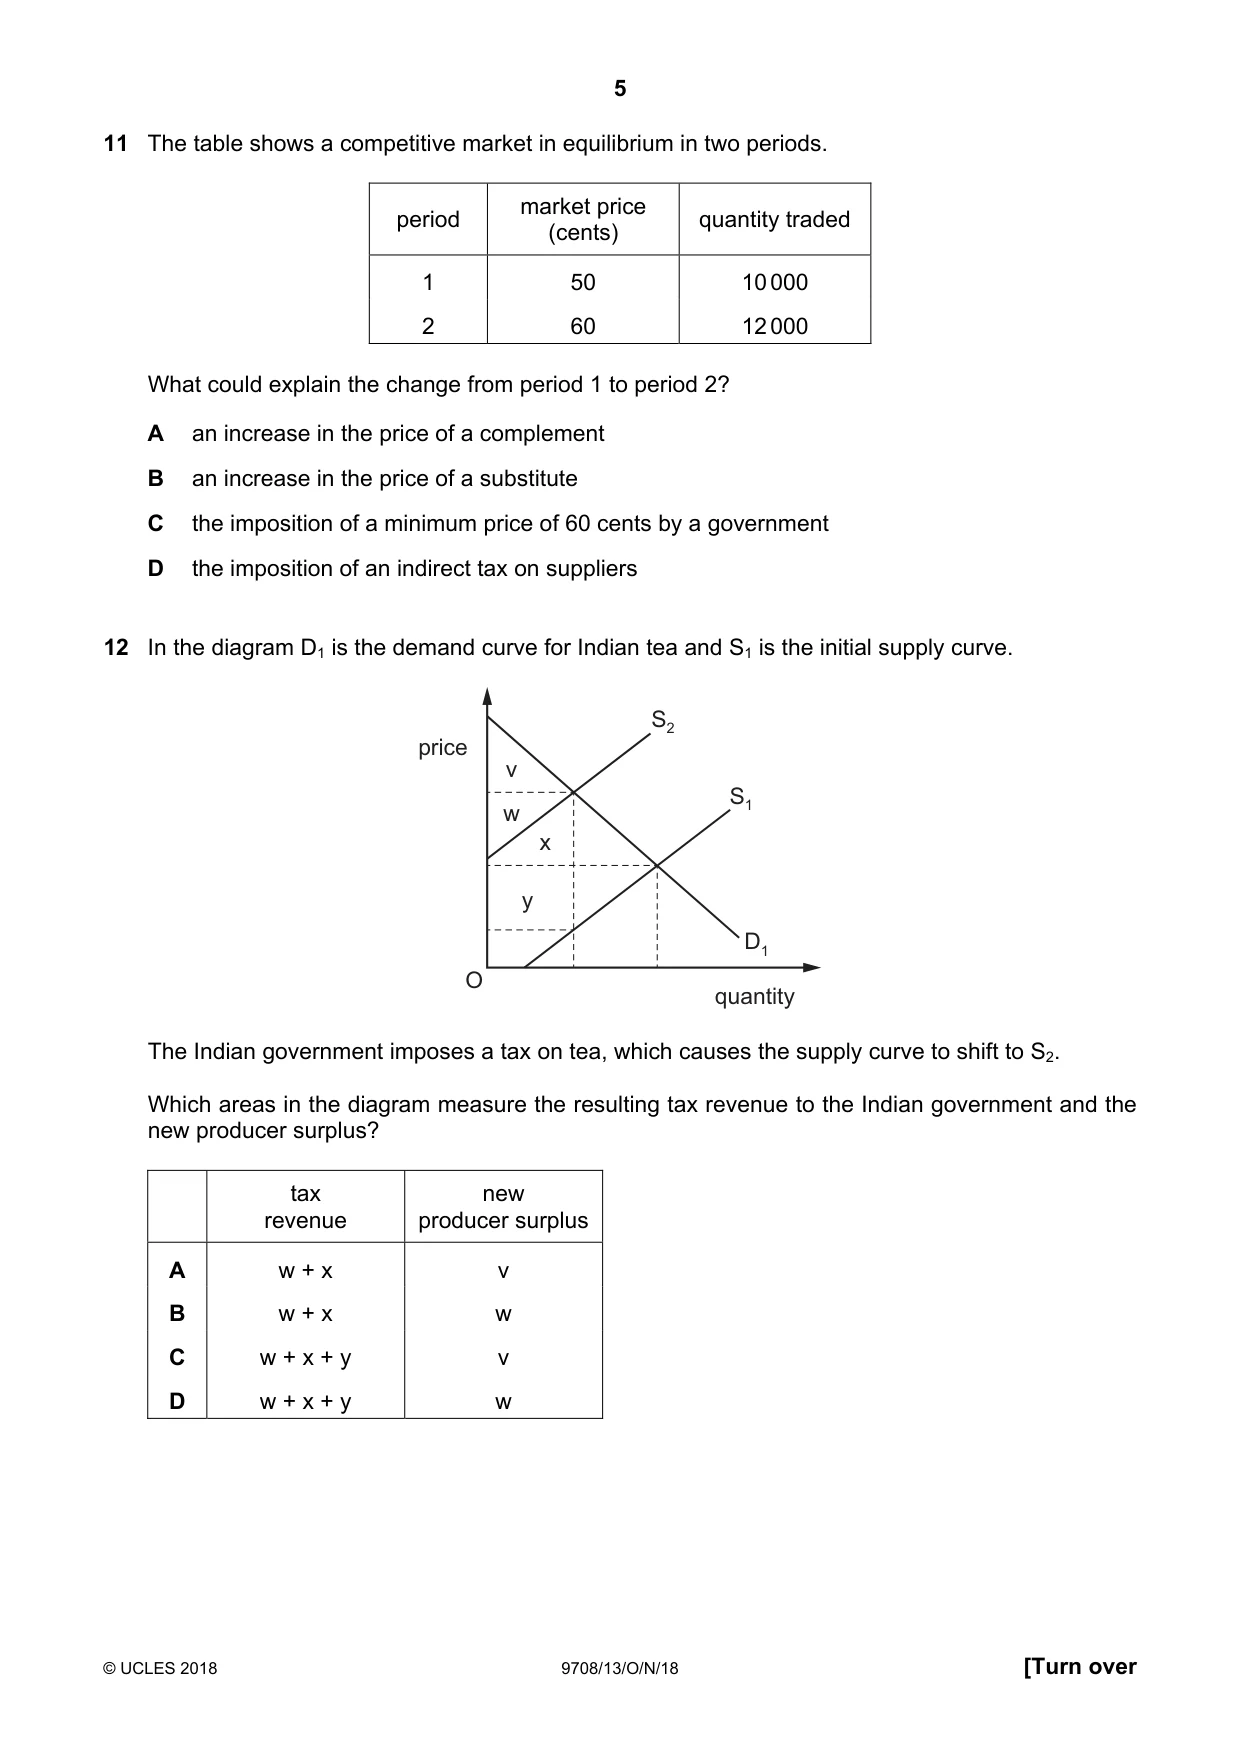
11 The table shows a competitive market in equilibrium in two periods. market price period quantity traded (cents) 1 50 10 000 2 60 12 000 What could explain the change from period 1 to period 2? A an increase in the price of a complement B an increase in the price of a substitute C the imposition of a minimum price of 60 cents by a government D the imposition of an indirect tax on suppliers
Mark scheme: B
Q12 · In the diagram D1 is the demand curve for Indian tea and S1 is the initial supply curve
12 In the diagram D1 is the demand curve for Indian tea and S1 is the initial supply curve. S2 price v S1 w x y D1 O quantity The Indian government imposes a tax on tea, which causes the supply curve to shift to S2. Which areas in the diagram measure the resulting tax revenue to the Indian government and the new producer surplus? tax new revenue producer surplus A w + x v B w + x w C w + x + y v D w + x + y w
Mark scheme: D
More questions on Methods and effects of government intervention in markets
Q13 · The diagram shows the supply and demand curve for bananas
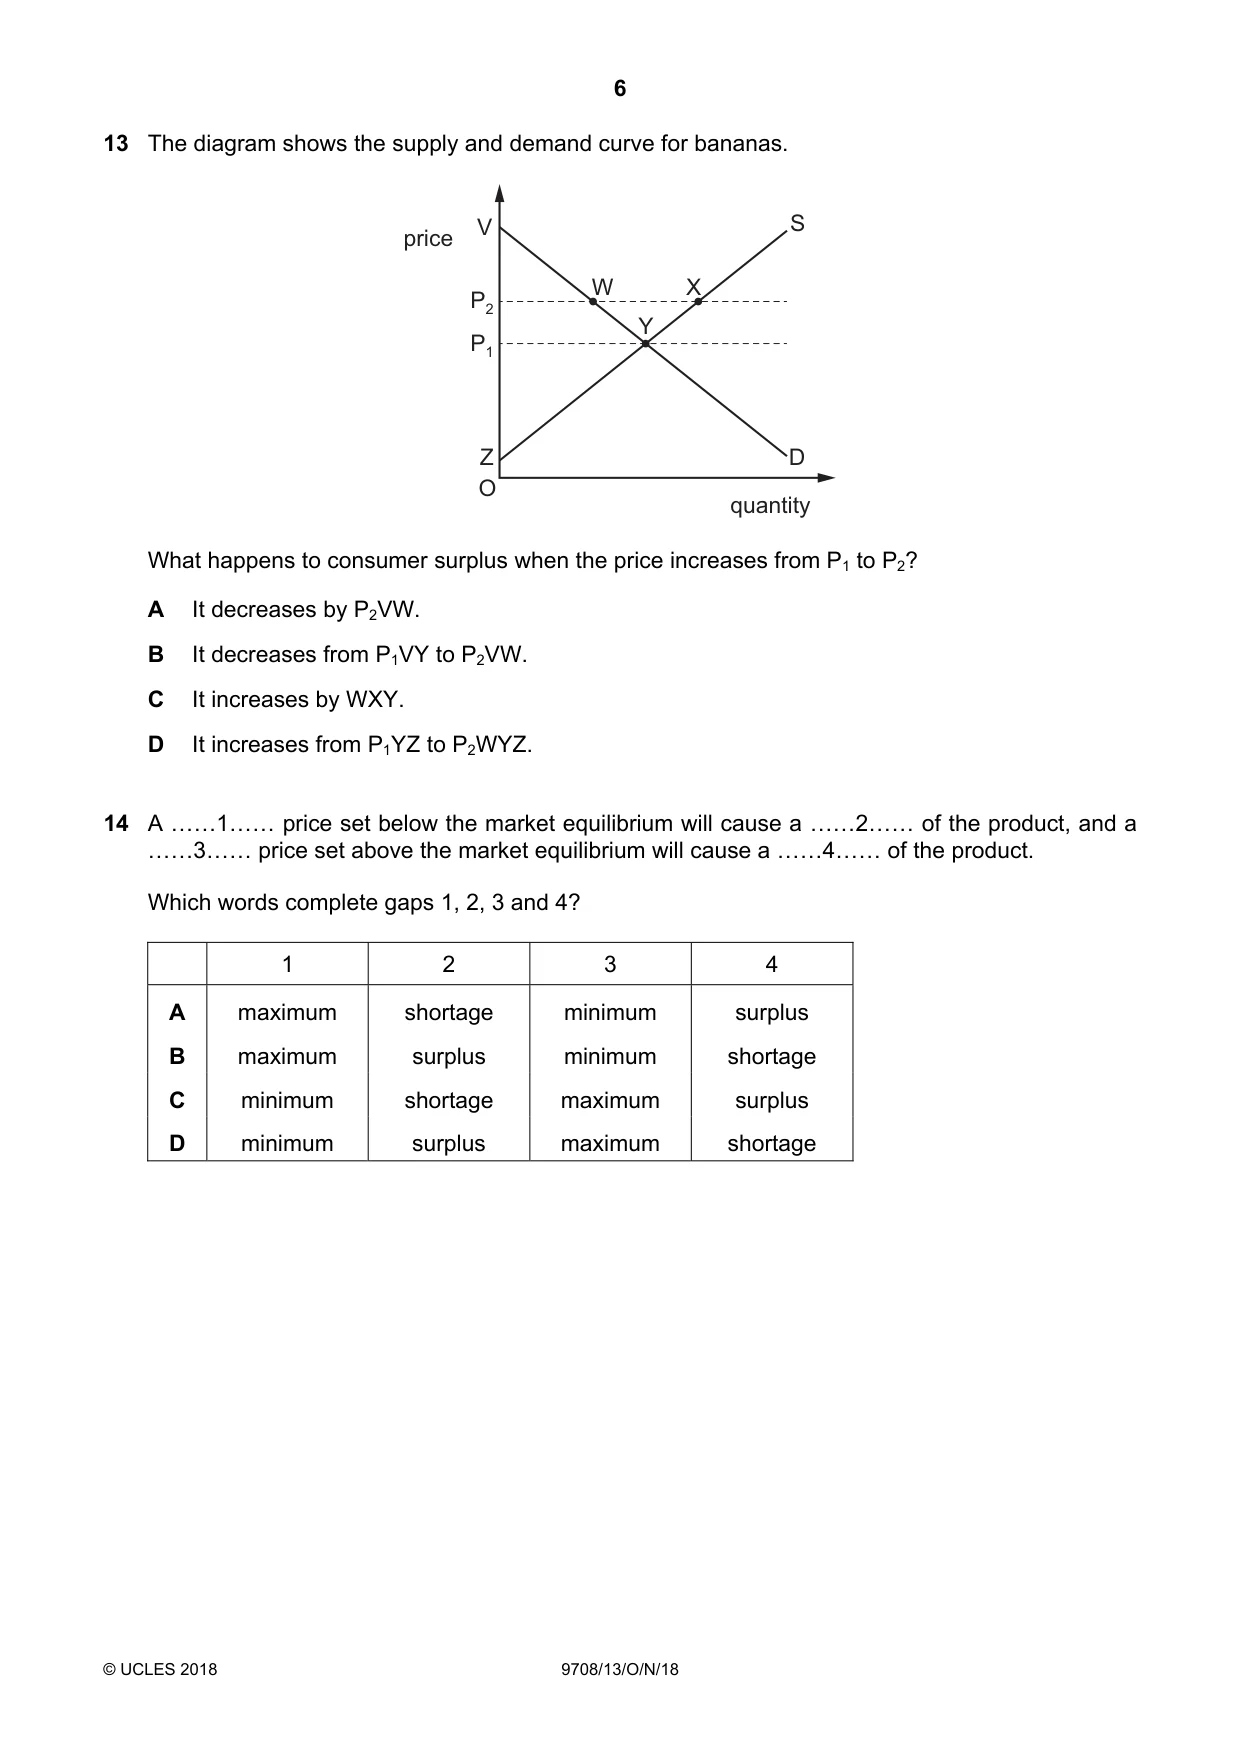
13 The diagram shows the supply and demand curve for bananas. V S price W X P2 Y P1 Z D O quantity What happens to consumer surplus when the price increases from P1 to P2? A It decreases by P2VW. B It decreases from P1VY to P2VW. C It increases by WXY. D It increases from P1YZ to P2WYZ.
Mark scheme: B
Q14 · A ««1«« price set below the market equilibrium will cause a ««2«« of the product, and a…
14 A ««1«« price set below the market equilibrium will cause a ««2«« of the product, and a ««3«« price set above the market equilibrium will cause a ««4«« of the product. Which words complete gaps 1, 2, 3 and 4? 1 2 3 4 A maximum shortage minimum surplus B maximum surplus minimum shortage C minimum shortage maximum surplus D minimum surplus maximum shortage
Mark scheme: A
More questions on Methods and effects of government intervention in markets
Q15 · The diagram shows the original demand curve D1 and original supply curve S1 for a good
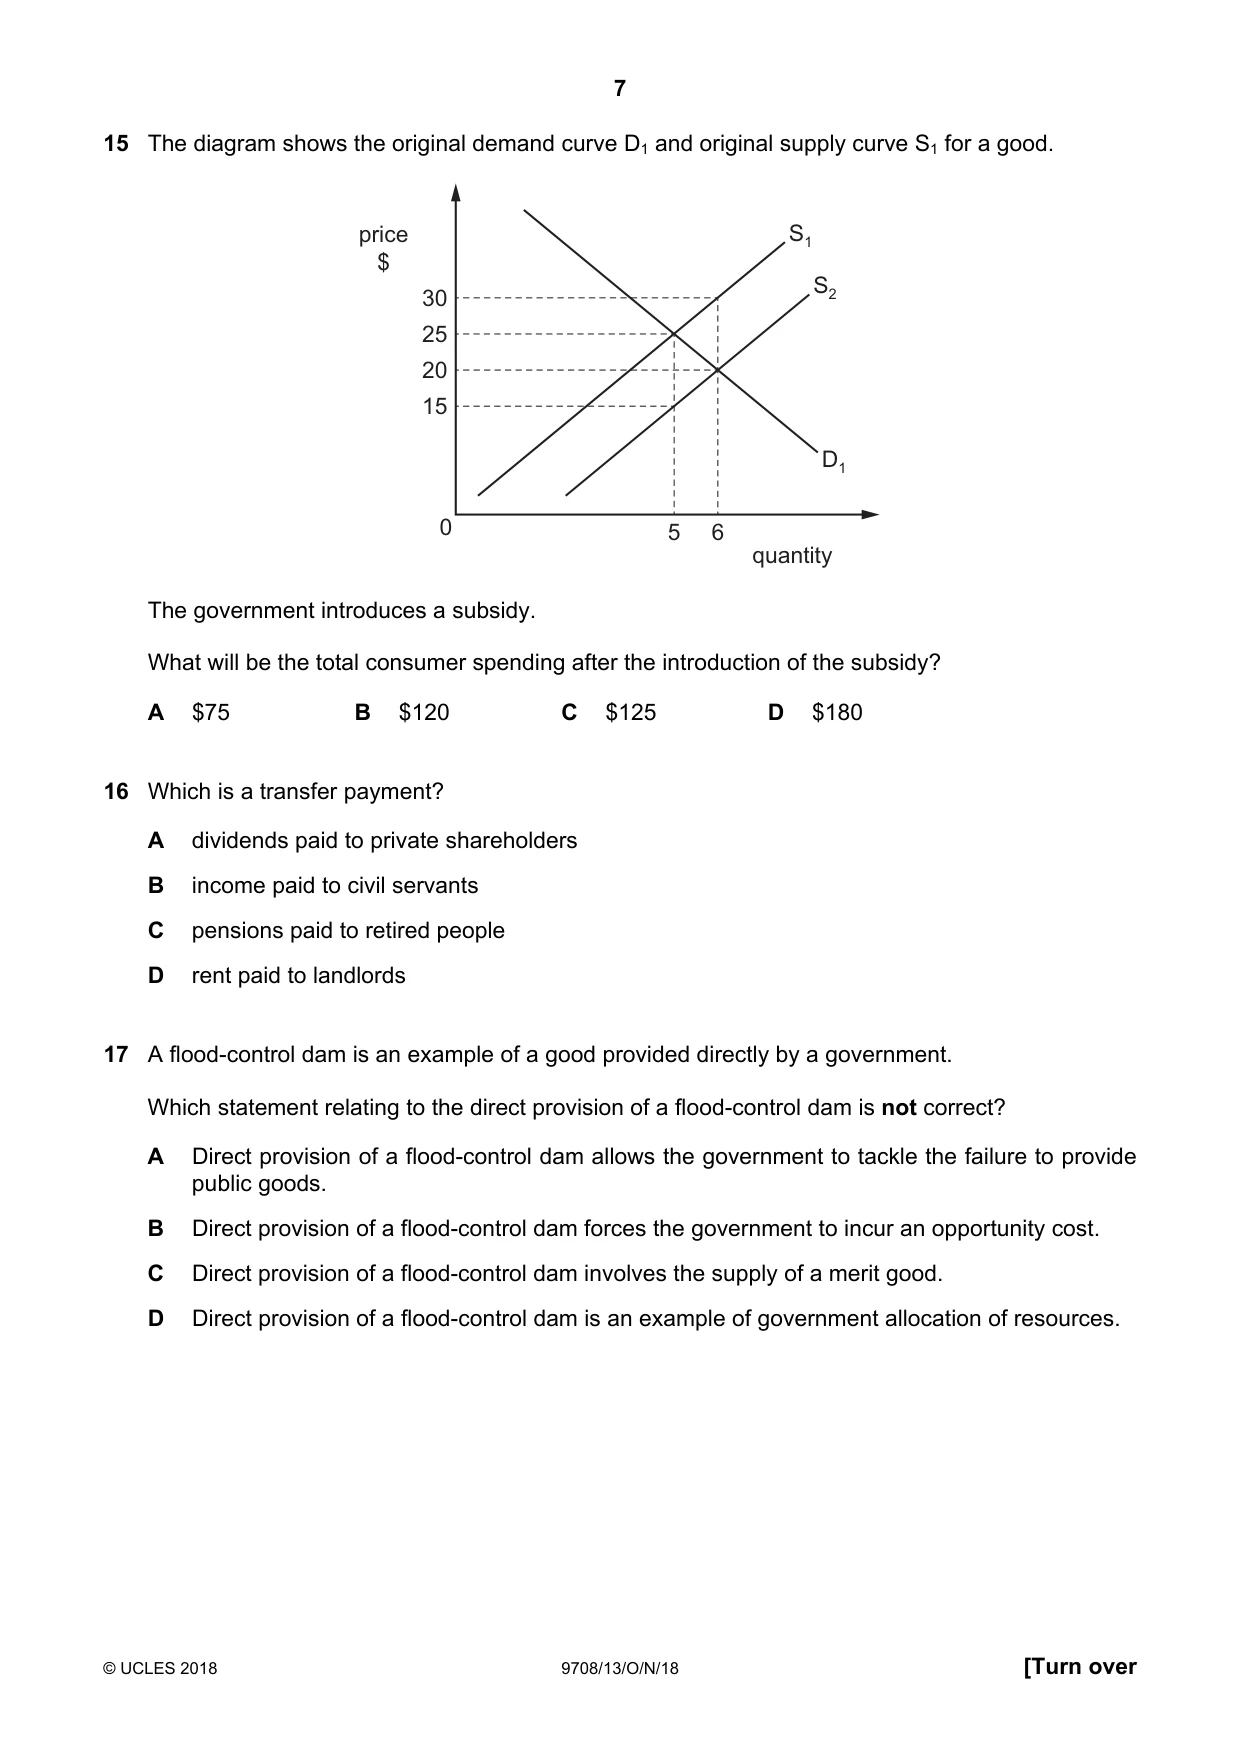
15 The diagram shows the original demand curve D1 and original supply curve S1 for a good. price S1 $ S2 30 25 20 15 D1 0 5 6 quantity The government introduces a subsidy. What will be the total consumer spending after the introduction of the subsidy? A $75 B $120 C $125 D $180
Mark scheme: B
More questions on Methods and effects of government intervention in markets
Q16 · Which is a transfer payment?
16 Which is a transfer payment? A dividends paid to private shareholders B income paid to civil servants C pensions paid to retired people D rent paid to landlords
Mark scheme: C
Q17 · A flood-control dam is an example of a good provided directly by a government
17 A flood-control dam is an example of a good provided directly by a government. Which statement relating to the direct provision of a flood-control dam is not correct? A Direct provision of a flood-control dam allows the government to tackle the failure to provide public goods. B Direct provision of a flood-control dam forces the government to incur an opportunity cost. C Direct provision of a flood-control dam involves the supply of a merit good. D Direct provision of a flood-control dam is an example of government allocation of resources.
Mark scheme: C
More questions on Reasons for government intervention in markets
Q18 · There has been a worldwide move towards market economies and away from state controlled…
18 There has been a worldwide move towards market economies and away from state controlled nationalised industries. Which policy would limit this transition? A development of well-functioning capital markets B establishment of a stable, convertible currency C national and international liberalisation of markets and trade D regulation of prices of former nationalised industries’ products
Mark scheme: D
More questions on Resource allocation in different economic systems
Q19 · An economy has an equilibrium level of real output Y, but wishes to move towards its full…
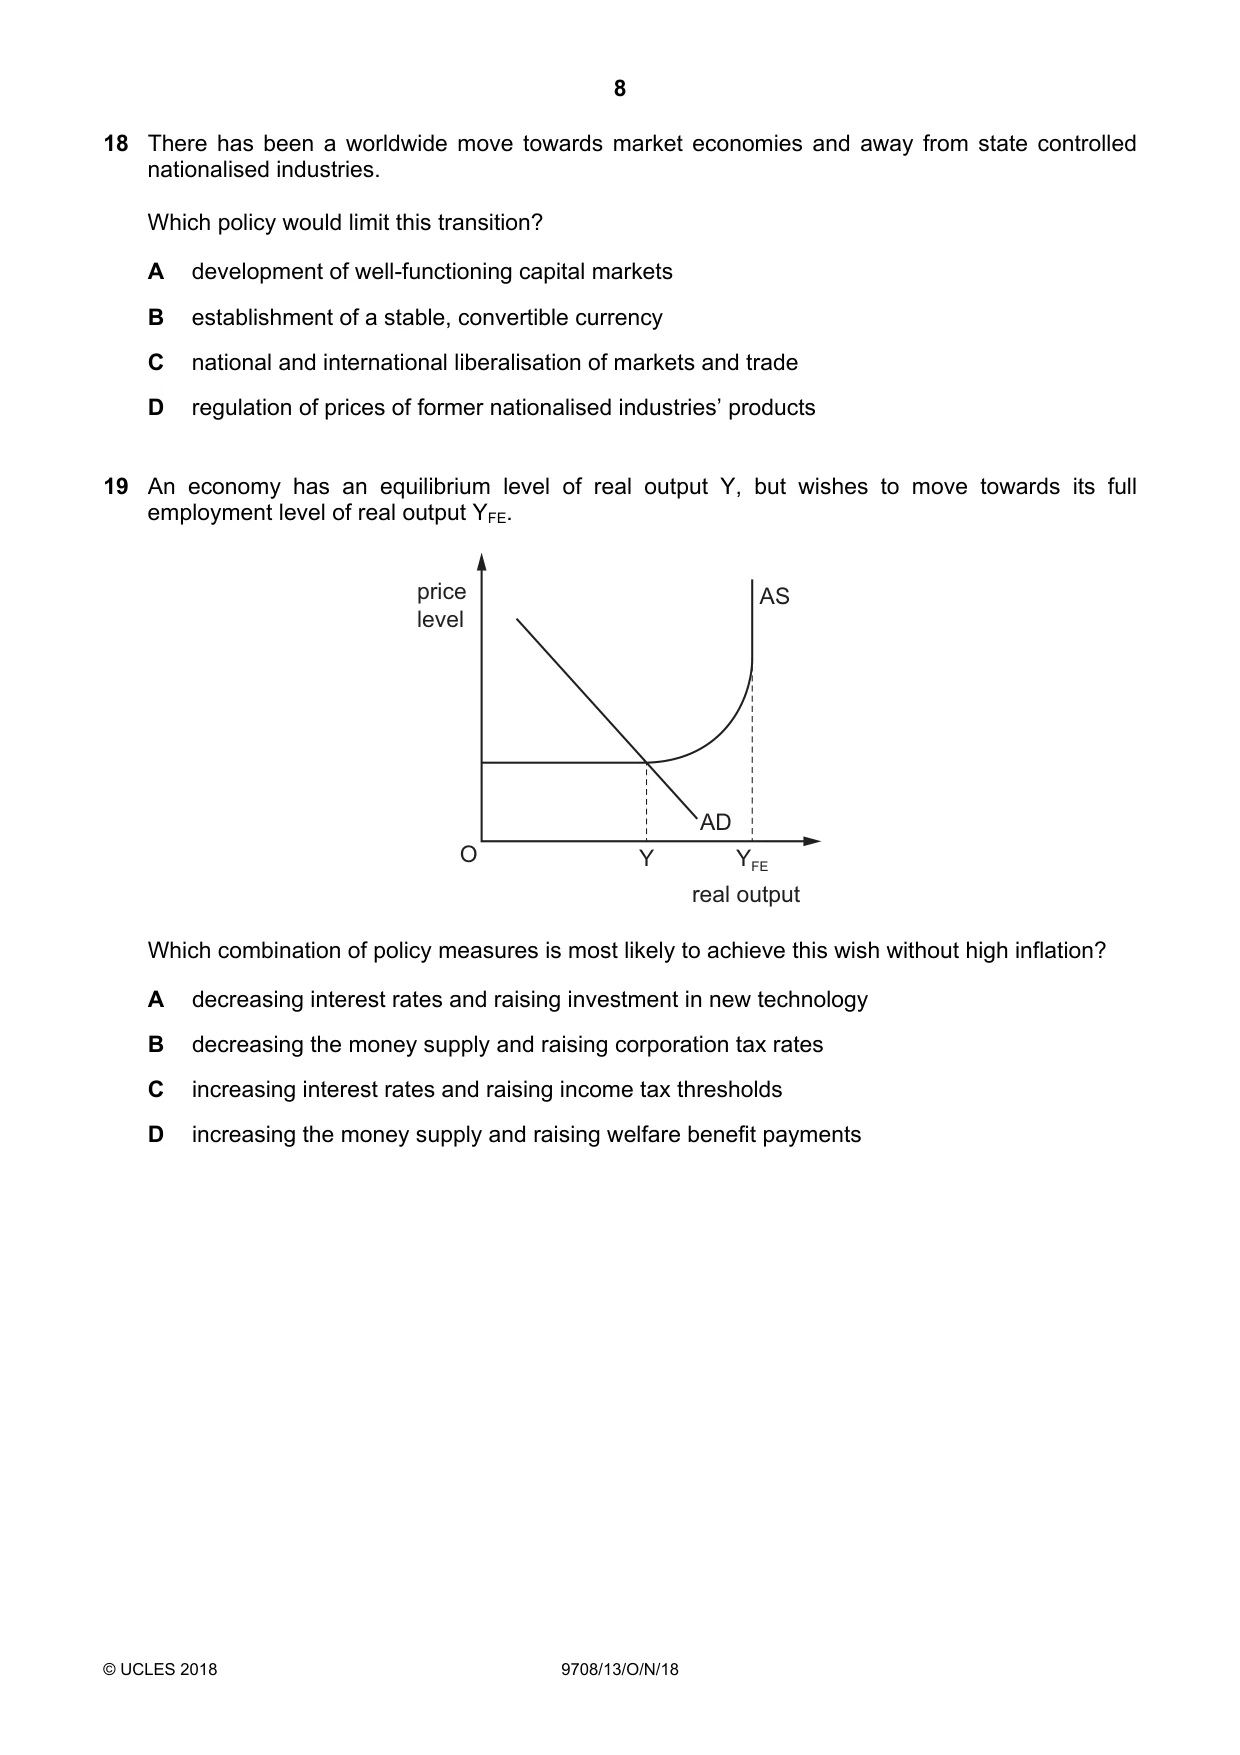
19 An economy has an equilibrium level of real output Y, but wishes to move towards its full employment level of real output YFE. price AS level AD O Y YFE real output Which combination of policy measures is most likely to achieve this wish without high inflation? A decreasing interest rates and raising investment in new technology B decreasing the money supply and raising corporation tax rates C increasing interest rates and raising income tax thresholds D increasing the money supply and raising welfare benefit payments
Mark scheme: A
More questions on Aggregate Demand and Aggregate Supply analysis
Q20 · In the diagram, AD1 and AS are an economy’s original aggregate demand and aggregate…
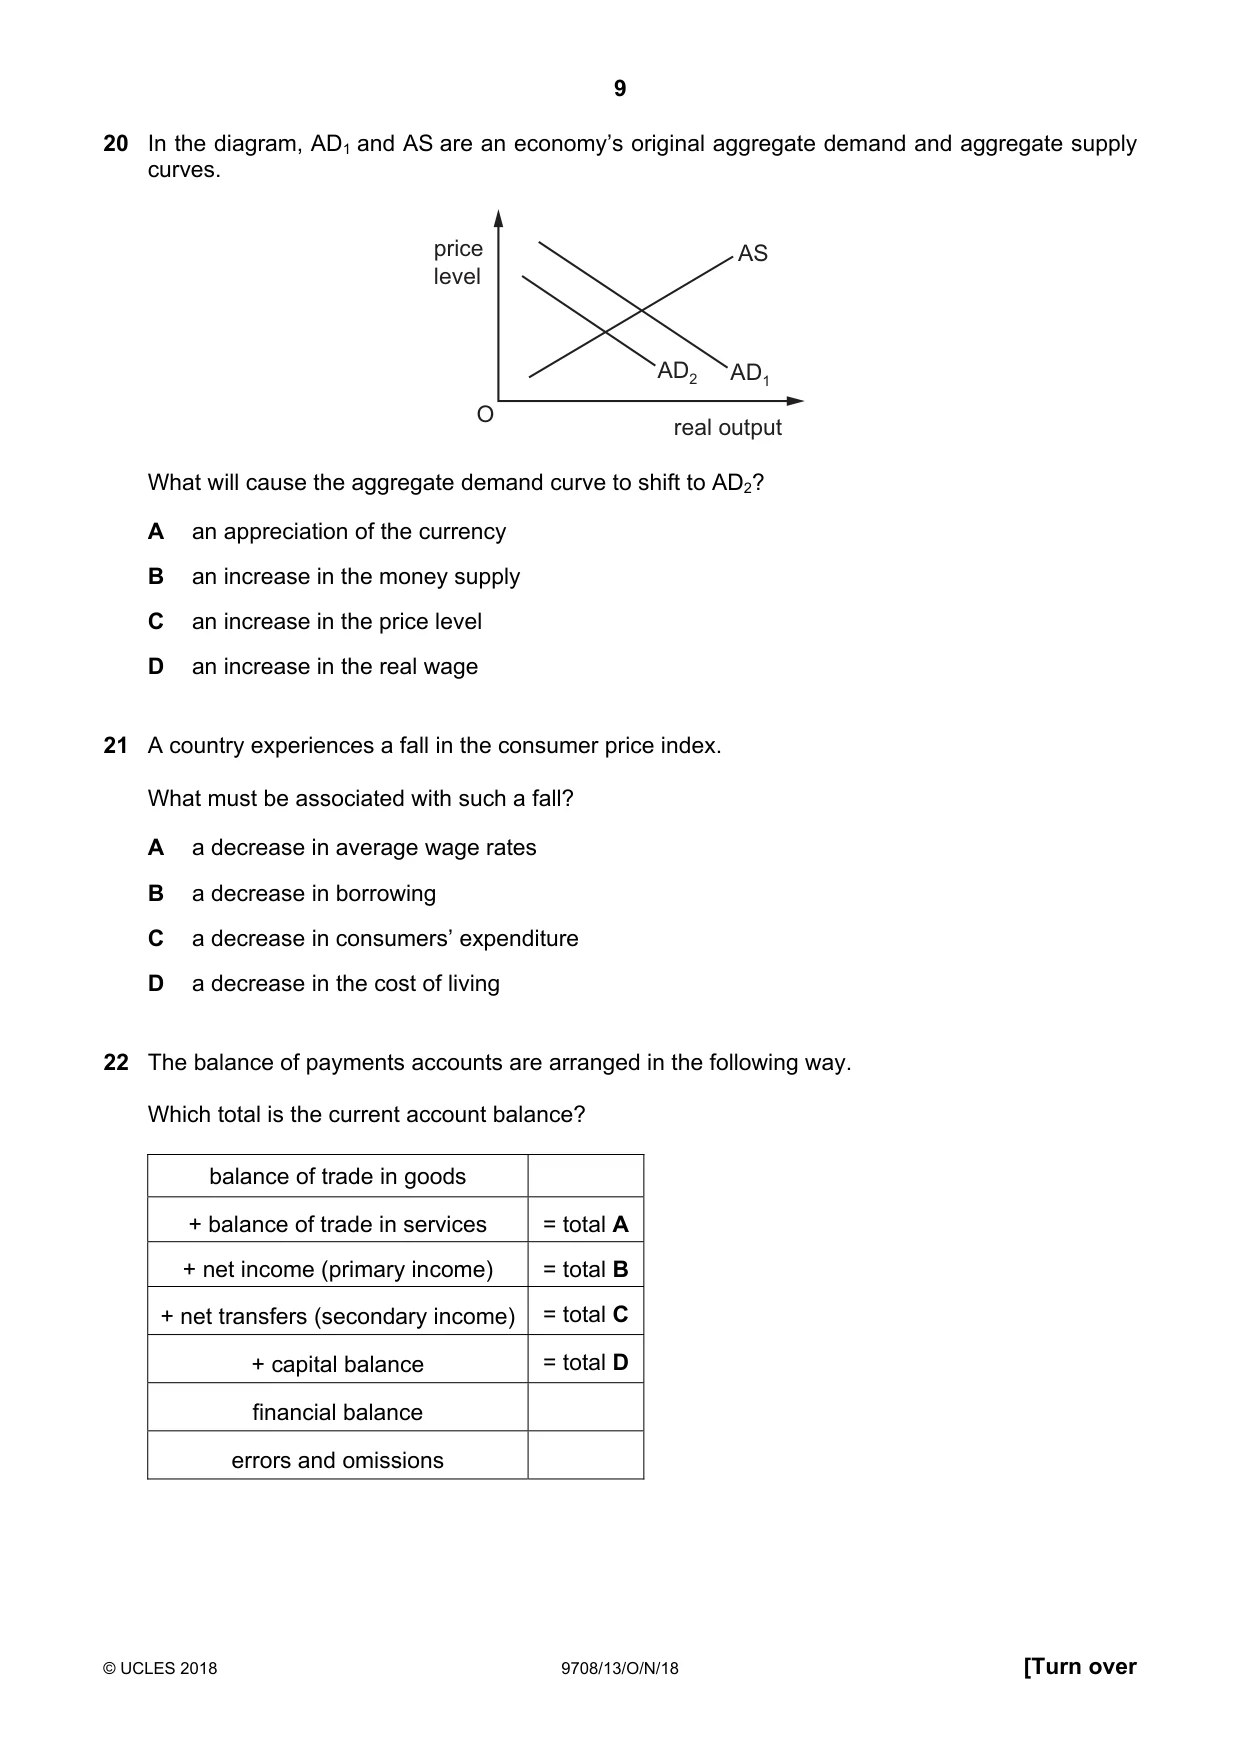
20 In the diagram, AD1 and AS are an economy’s original aggregate demand and aggregate supply curves. price AS level AD2 AD1 O real output What will cause the aggregate demand curve to shift to AD2? A an appreciation of the currency B an increase in the money supply C an increase in the price level D an increase in the real wage
Mark scheme: A
More questions on Aggregate Demand and Aggregate Supply analysis
Q21 · A country experiences a fall in the consumer price index
21 A country experiences a fall in the consumer price index. What must be associated with such a fall? A a decrease in average wage rates B a decrease in borrowing C a decrease in consumers’ expenditure D a decrease in the cost of living
Mark scheme: D
Q22 · The balance of payments accounts are arranged in the following way
22 The balance of payments accounts are arranged in the following way. Which total is the current account balance? balance of trade in goods + balance of trade in services = total A + net income (primary income) = total B + net transfers (secondary income) = total C + capital balance = total D financial balance errors and omissions
Mark scheme: C
More questions on Current account of the balance of payments
Q23 · The US central bank lowers its interest rate
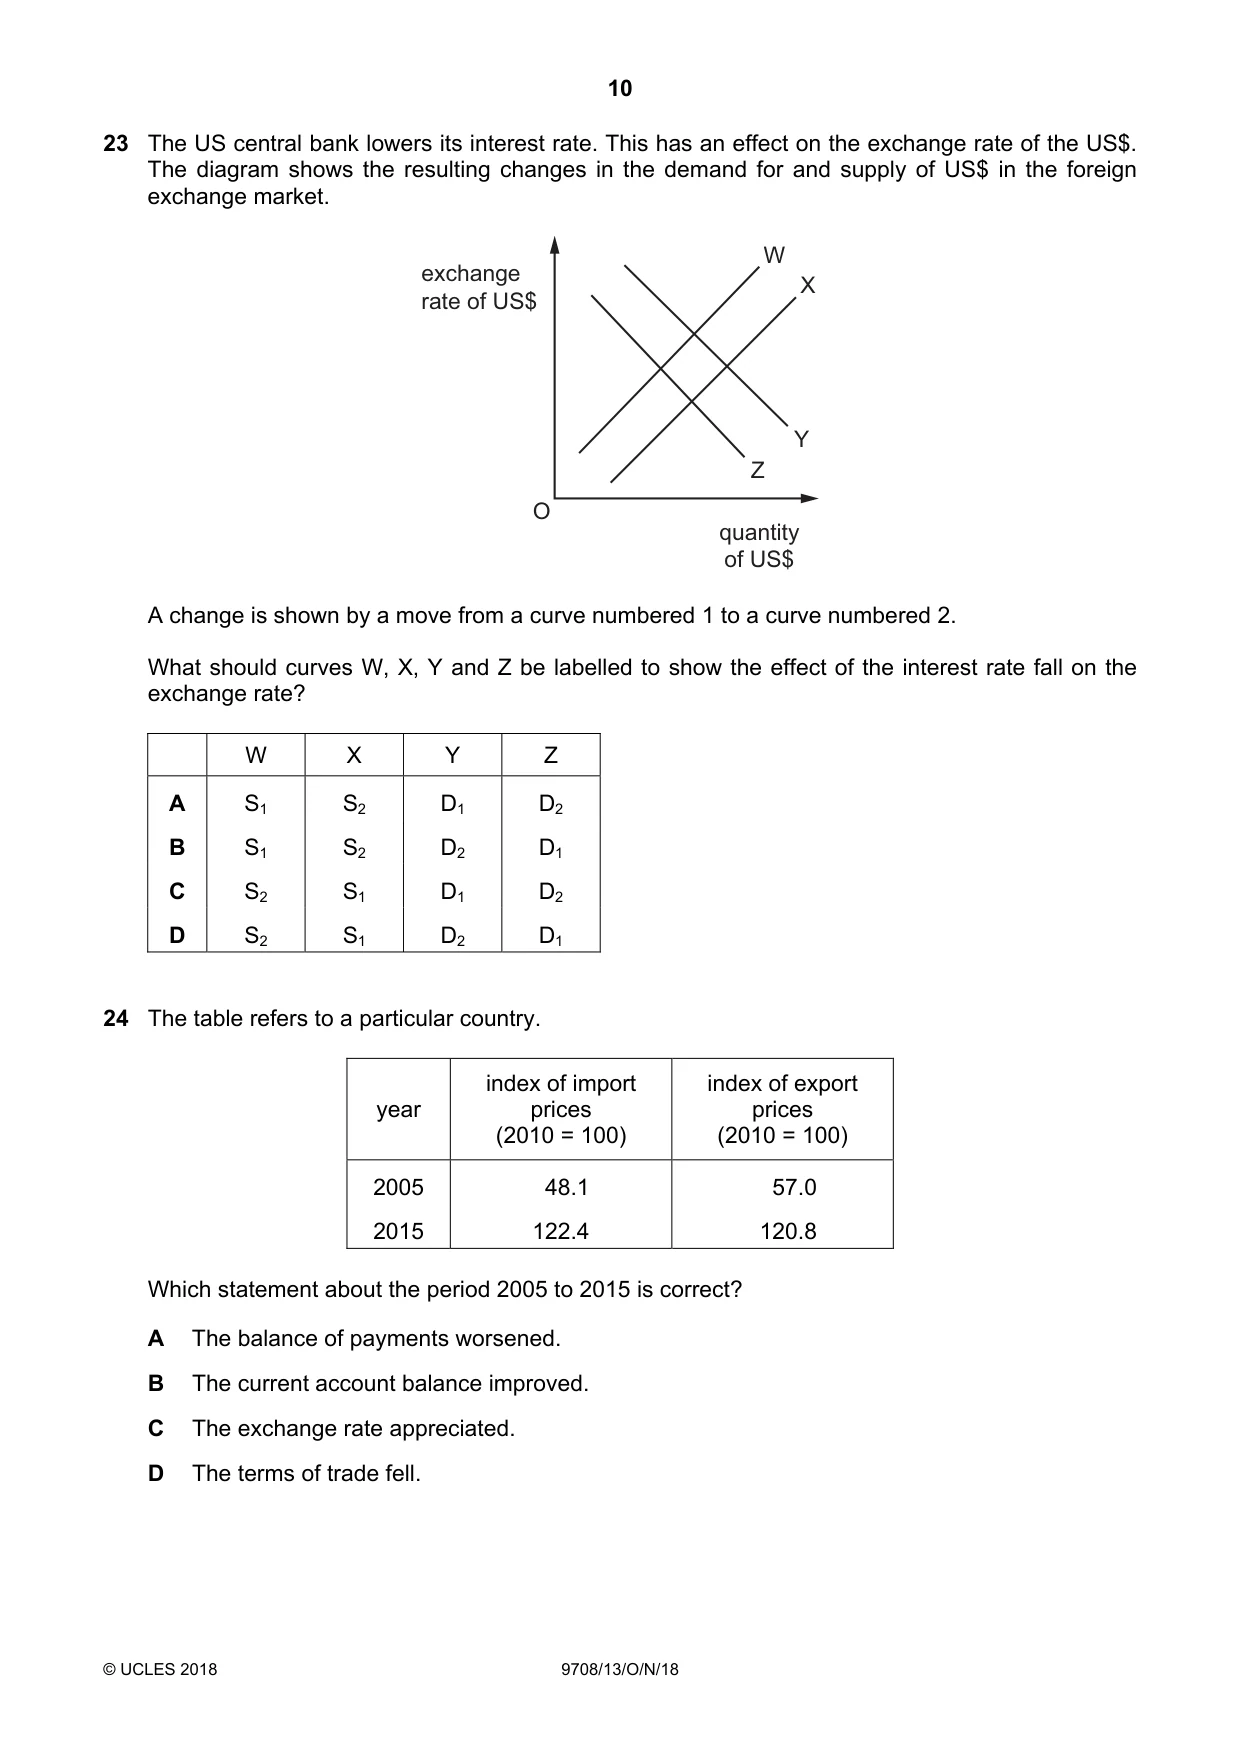
23 The US central bank lowers its interest rate. This has an effect on the exchange rate of the US$. The diagram shows the resulting changes in the demand for and supply of US$ in the foreign exchange market. W exchange X rate of US$ Y Z O quantity of US$ A change is shown by a move from a curve numbered 1 to a curve numbered 2. What should curves W, X, Y and Z be labelled to show the effect of the interest rate fall on the exchange rate? W X Y Z A S1 S2 D1 D2 B S1 S2 D2 D1 C S2 S1 D1 D2 D S2 S1 D2 D1
Mark scheme: A
Q24 · The table refers to a particular country
24 The table refers to a particular country. index of import index of export year prices prices (2010 = 100) (2010 = 100) 2005 48.1 57.0 2015 122.4 120.8 Which statement about the period 2005 to 2015 is correct? A The balance of payments worsened. B The current account balance improved. C The exchange rate appreciated. D The terms of trade fell.
Mark scheme: D
Q25 · Two countries, Northland and Southland, produce two goods, food and drink
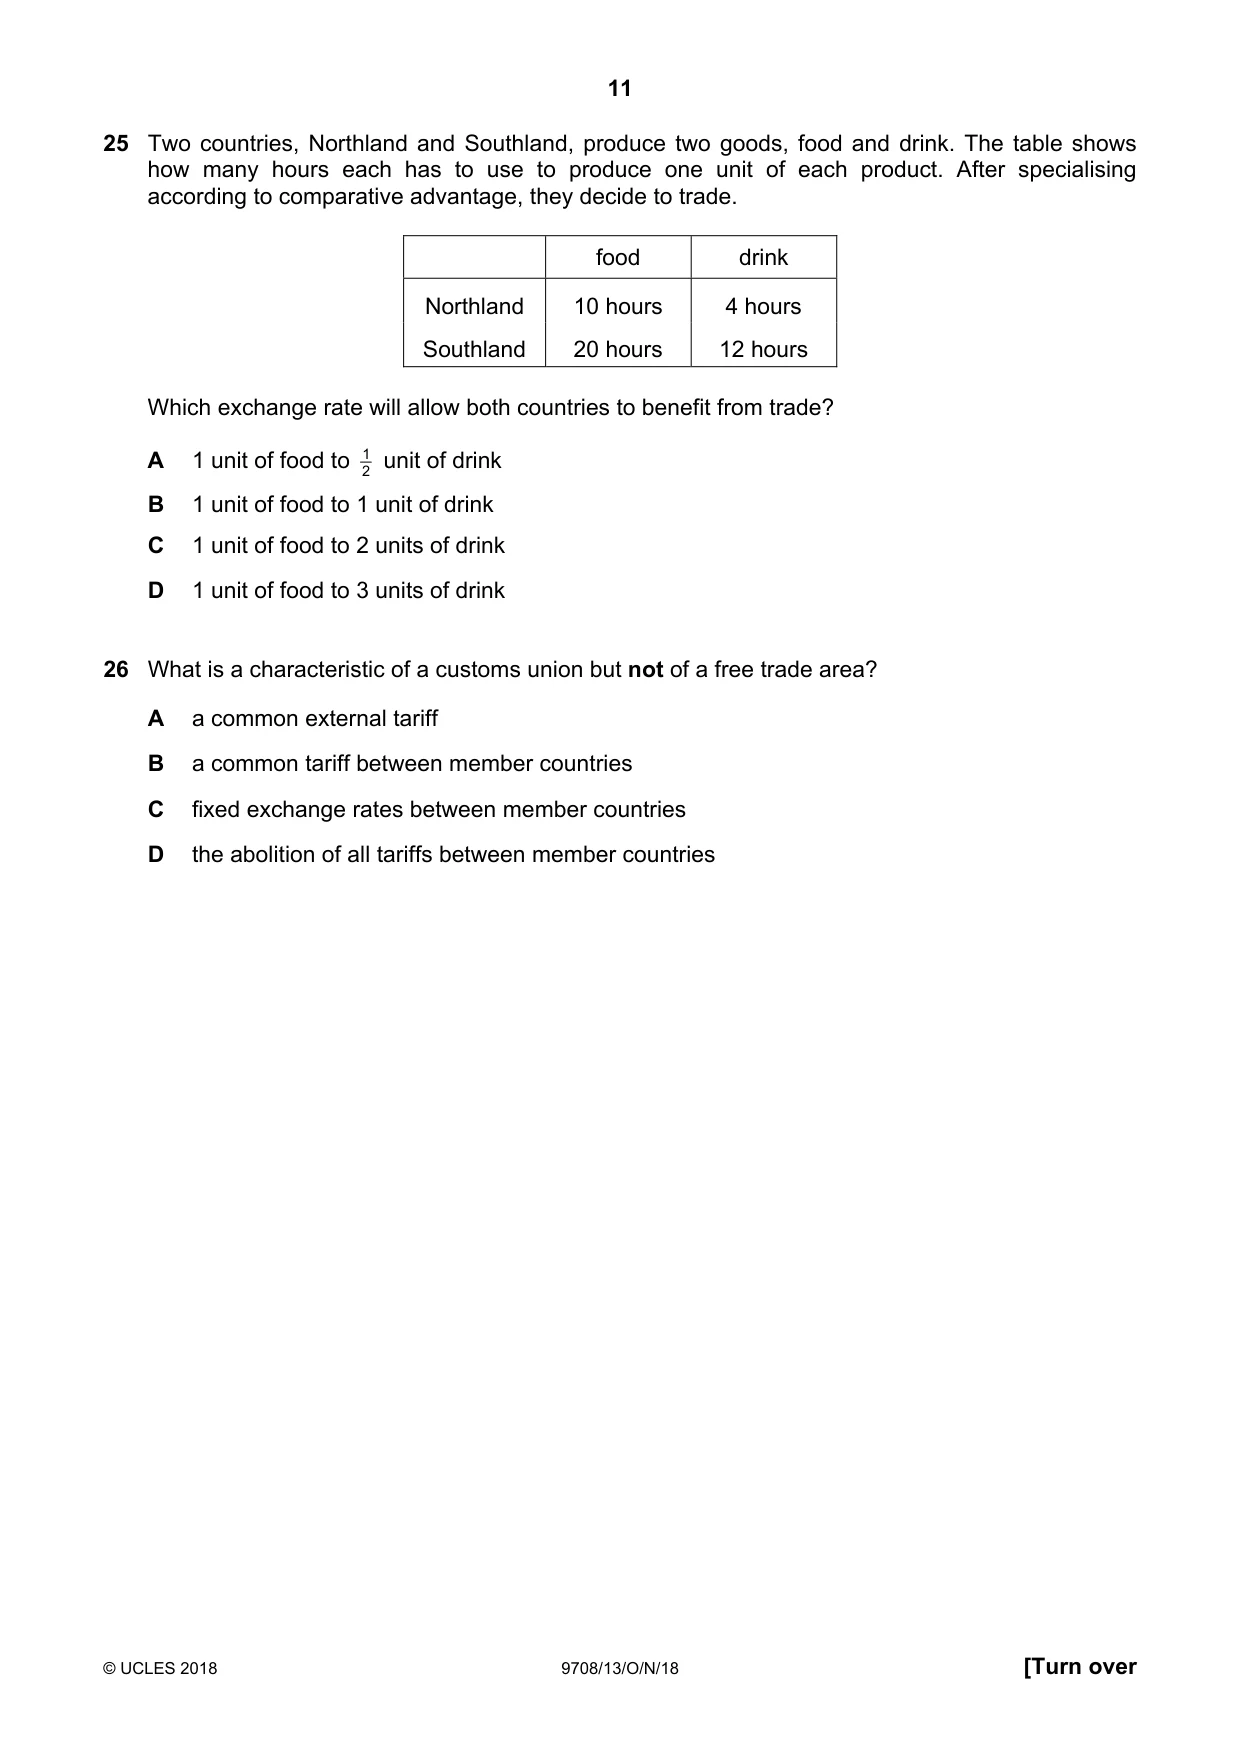
25 Two countries, Northland and Southland, produce two goods, food and drink. The table shows how many hours each has to use to produce one unit of each product. After specialising according to comparative advantage, they decide to trade. food drink Northland 10 hours 4 hours Southland 20 hours 12 hours Which exchange rate will allow both countries to benefit from trade? A 1 unit of food to 2 1 unit of drink B 1 unit of food to 1 unit of drink C 1 unit of food to 2 units of drink D 1 unit of food to 3 units of drink
Mark scheme: C
Q26 · What is a characteristic of a customs union but not of a free trade area?
26 What is a characteristic of a customs union but not of a free trade area? A a common external tariff B a common tariff between member countries C fixed exchange rates between member countries D the abolition of all tariffs between member countries
Mark scheme: A
Q27 · In the diagram, Dd and Sd represent the domestic demand and supply curves for a product
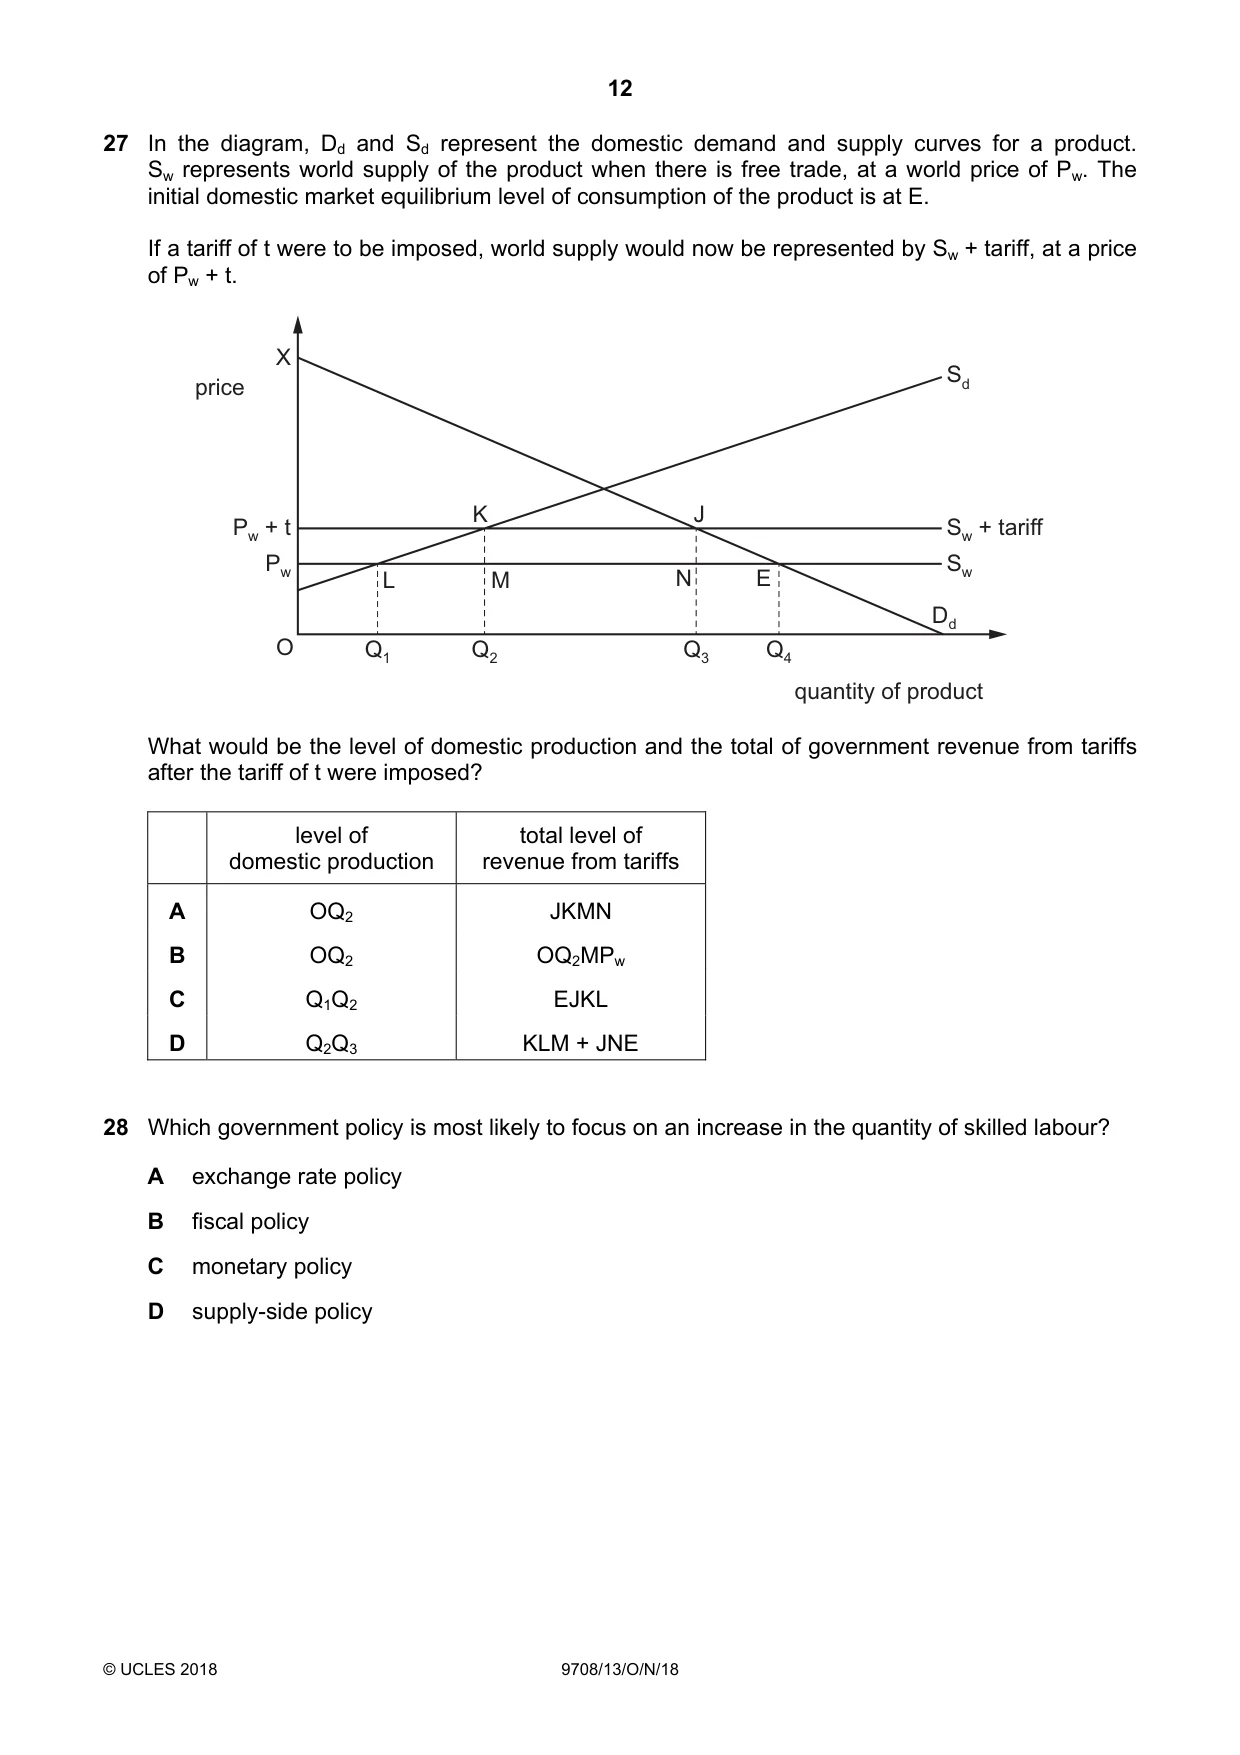
27 In the diagram, Dd and Sd represent the domestic demand and supply curves for a product. Sw represents world supply of the product when there is free trade, at a world price of Pw. The initial domestic market equilibrium level of consumption of the product is at E. If a tariff of t were to be imposed, world supply would now be represented by Sw + tariff, at a price of Pw + t. X Sd price K J Pw + t Sw + tariff Pw Sw L M N E Dd O Q1 Q2 Q3 Q4 quantity of product What would be the level of domestic production and the total of government revenue from tariffs after the tariff of t were imposed? level of total level of domestic production revenue from tariffs A OQ2 JKMN B OQ2 OQ2MPw C Q1Q2 EJKL D Q2Q3 KLM + JNE
Mark scheme: A
Q28 · Which government policy is most likely to focus on an increase in the quantity of skilled…
28 Which government policy is most likely to focus on an increase in the quantity of skilled labour? A exchange rate policy B fiscal policy C monetary policy D supply-side policy
Mark scheme: D
Q29 · A country has a long-running current account deficit on the balance of payments
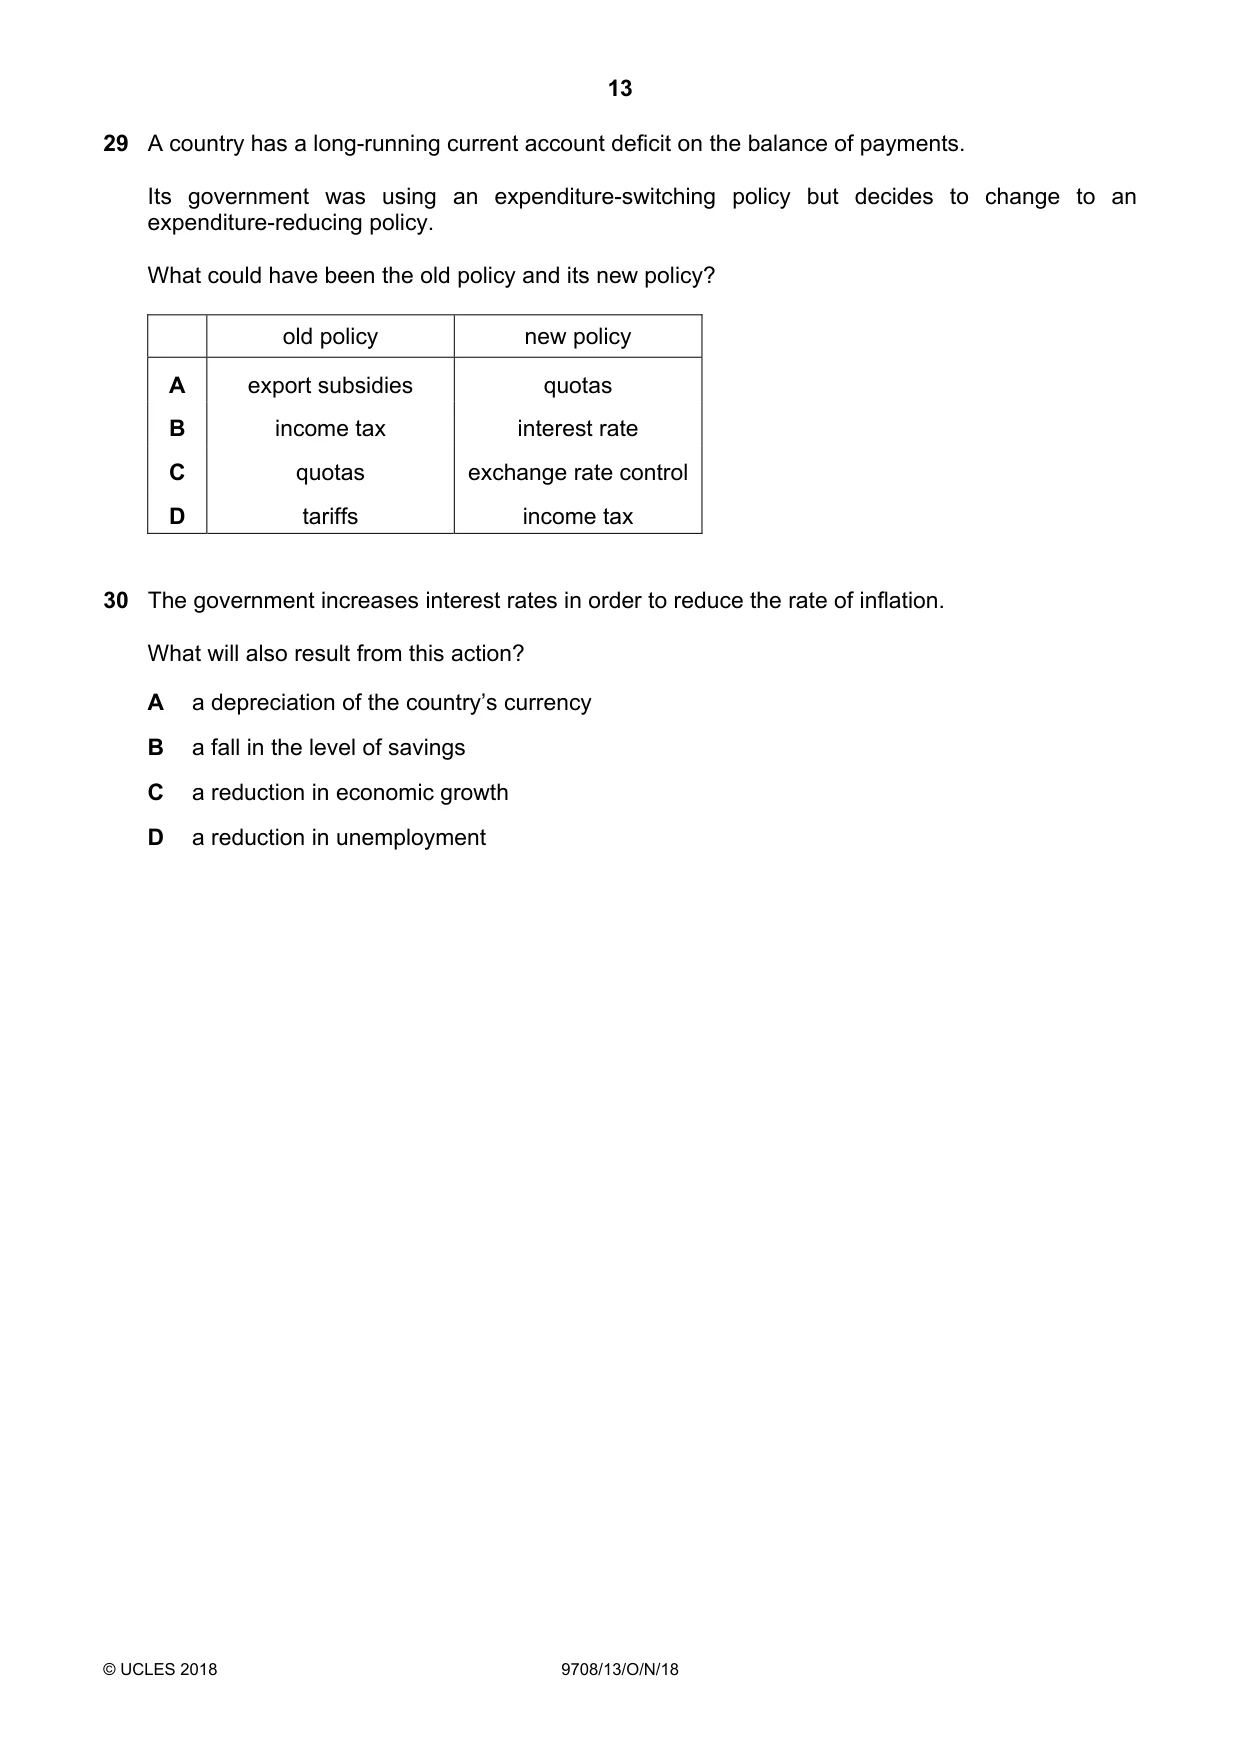
29 A country has a long-running current account deficit on the balance of payments. Its government was using an expenditure-switching policy but decides to change to an expenditure-reducing policy. What could have been the old policy and its new policy? old policy new policy A export subsidies quotas B income tax interest rate C quotas exchange rate control D tariffs income tax
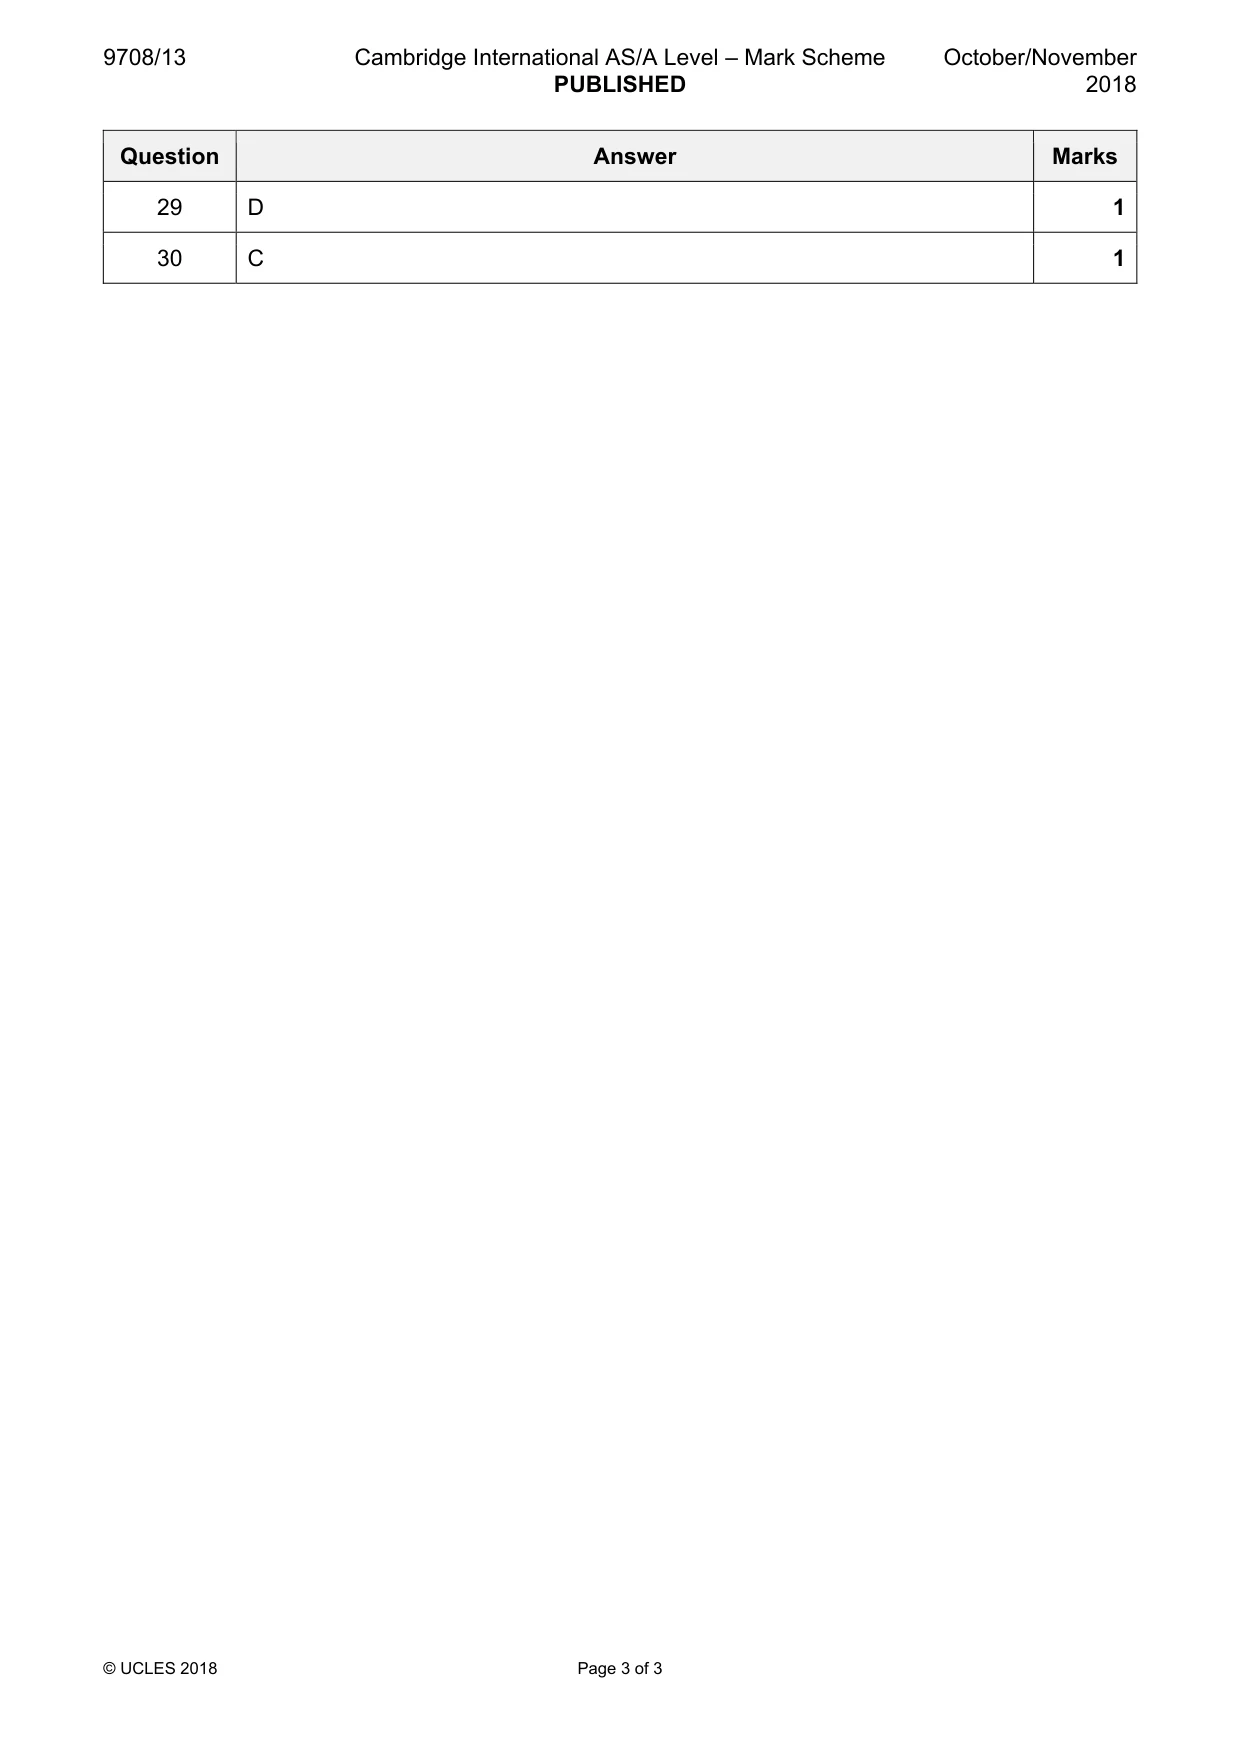
Mark scheme: D
More questions on Policies to correct imbalances in the current account of the balance of payments
Q30 · The government increases interest rates in order to reduce the rate of inflation
30 The government increases interest rates in order to reduce the rate of inflation. What will also result from this action? A a depreciation of the country’s currency B a fall in the level of savings C a reduction in economic growth D a reduction in unemployment
Mark scheme: C
What was in this paper
The subtopics covered by these 30 questions, and how many questions each got. Open one in a new tab to see every Cambridge question on it.
3Aggregate Demand and Aggregate Supply analysis2Demand and supply curves2Price elasticity of supply2Production possibility curves2Protectionism2The interaction of demand and supply2The reasons for international trade2Addressing income and wealth inequality1Classification of goods and services1Consumer and producer surplus1Current account of the balance of payments1Economic methodology1Exchange rates1Monetary policy1Policies to correct imbalances in the current account of the balance of payments1Price stability1Reasons for government intervention in markets1Resource allocation in different economic systems1Scarcity, choice and opportunity cost1Supply-side policy1What you needed in this session
Cambridge’s own grade thresholds for 2018 Oct/Nov, Paper 1 · Variant 3. A higher threshold means an easier paper — the bar moves with how the cohort did.